UNITED STATES
SECURITIES AND EXCHANGE COMMISSION
Washington, D.C. 20549
FORM 20-F
(Mark One)
| ¨ | REGISTRATION STATEMENT PURSUANT TO SECTION 12(b) OR (g) OF THE SECURITIES EXCHANGE ACT OF 1934 |
OR
| þ | ANNUAL REPORT PURSUANT TO SECTION 13 OR 15(d) OF THE SECURITIES EXCHANGE ACT OF 1934 |
For the fiscal year ended December 31, 2013
OR
| ¨ | TRANSITION REPORT PURSUANT TO SECTION 13 OR 15(d) OF THE SECURITIES EXCHANGE ACT OF 1934 |
For the transition period from to .
OR
| ¨ | SHELL COMPANY REPORT PURSUANT TO SECTION 13 OR 15(d) OF THE SECURITIES EXCHANGE ACT OF 1934 |
Commission file number: 1-15060
UBS AG
(Exact Name of Registrant as Specified in Its Charter)
Switzerland
(Jurisdiction of Incorporation or Organization)
Bahnhofstrasse 45, CH-8001 Zurich, Switzerland
and
Aeschenvorstadt 1, CH-4051 Basel, Switzerland
(Address of Principal Executive Offices)
Sarah M. Starkweather
UBS AG
677 Washington Boulevard
Stamford, CT 06901
Telephone: (203) 719-3000
(Name, Telephone, E-mail and/or Facsimile number and Address of Company Contact Person)
Securities registered or to be registered pursuant to Section 12(b) of the Act:
Please see page 3.
Securities registered or to be registered pursuant to Section 12(g) of the Act:
Please see page 4.
Securities for which there is a reporting obligation pursuant to Section 15(d) of the Act:
Please see page 4.
Indicate the number of outstanding shares of each of the issuer’s classes of capital or common stock as of
31 December 2013:
Ordinary shares, par value CHF 0.10 per share: 3,768,201,817 ordinary shares
(including 73,800,252 treasury shares)
Indicate by check mark if the registrant is a well-known seasoned issuer, as defined in Rule 405 of the Securities Act.
Yes þ No ¨
If this report is an annual or transition report, indicate by check mark if the registrant is not required to file reports pursuant to Section 13 or 15(d) of the Securities Exchange Act of 1934.
Yes ¨ No þ
Note — Checking the box above will not relieve any registrant required to file reports pursuant to
Section 13 or 15(d) of the Securities Exchange Act of 1934 from their obligations under those Sections.
Indicate by check mark whether the Registrant (1) has filed all reports required to be filed by Section 13 or 15(d) of the Securities Exchange Act of 1934 during the preceding 12 months (or for such shorter period that the Registrant was required to file such reports) and (2) has been subject to such filing requirements for the past 90 days.
Yes þ No ¨
Indicate by check mark whether the registrant has submitted electronically and posted on its corporate Web site, if any, every Interactive Data File required to be submitted and posted pursuant to Rule 205 of Regulation S-T (§ 232.405 of this chapter) during the preceding 12 months (or for such shorter period that the registrant was required to submit and post such files).
Yes þ No ¨
Indicate by check mark whether the registrant is a large accelerated filer, an accelerated filer, or a non-accelerated filer. See definition of “accelerated filer and large accelerated filer” in Rule 12b-2 of the Exchange Act. (Check One):
| | | | |
| Large accelerated filer þ | | Accelerated filer ¨ | | Non-accelerated filer ¨ |
Indicate by check mark which basis of accounting the registrant has used to prepare the financial statements included in this filing.
| | | | |
| U.S. GAAP ¨ | | International Financial Reporting Standards as issued by the International Accounting Standards Board þ | | Other ¨ |
If “Other” has been checked in response to the previous question, indicate by check mark which financial statement item the registrant has elected to follow.
Item 17 ¨ Item 18 ¨
If this is an annual report, indicate by check mark whether the registrant is a shell company (as defined in Rule 12b-2 of the Exchange Act)
Yes ¨ No þ
2
Securities registered or to be registered pursuant to Section 12(b) of the Act:
| | |
Title of each class | | Name of each exchange on which registered |
| |
| Ordinary Shares (par value of CHF 0.10 each) | | New York Stock Exchange |
| |
| $300,000,000 Floating Rate Noncumulative Trust Preferred Securities | | New York Stock Exchange |
| |
| $300,000,000 Floating Rate Noncumulative Company Preferred Securities | | New York Stock Exchange* |
| |
| $1,000,000,000 6.243% Noncumulative Trust Preferred Securities | | New York Stock Exchange |
| |
| $1,000,000,000 6.243% Noncumulative Company Preferred Securities | | New York Stock Exchange* |
| |
Subordinated Guarantee of UBS AG with respect to each of the
Noncumulative Company Preferred Securities above | | New York Stock Exchange* |
| |
| E-TRACS Linked to the UBS Bloomberg CMCI Food Total Return due April 5, 2038 | | NYSE Arca |
| |
| E-TRACS Linked to the UBS Bloomberg CMCI Agriculture Total Return due April 5, 2038 | | NYSE Arca |
| |
| E-TRACS Linked to the UBS Bloomberg CMCI Energy Total Return due April 5, 2038 | | NYSE Arca |
| |
| E-TRACS Linked to the UBS Bloomberg CMCI Total Return due April 5, 2038 | | NYSE Arca |
| |
| E-TRACS Linked to the UBS Bloomberg CMCI Gold Total Return due April 5, 2038 | | NYSE Arca |
| |
| E-TRACS Linked to the UBS Bloomberg CMCI Industrial Metals Total Return due April 5, 2038 | | NYSE Arca |
| |
| E-TRACS Linked to the UBS Bloomberg CMCI Livestock Total Return due April 5, 2038 | | NYSE Arca |
| |
| E-TRACS Linked to the UBS Bloomberg CMCI Silver Total Return due April 5, 2038 | | NYSE Arca |
| |
| E-TRACS Long Platinum Linked to the UBS Bloomberg CMCI Platinum Total Return due May 14, 2018 | | NYSE Arca |
| |
| E-TRACS Linked to the S&P 500 Gold Hedged Index due January 30, 2040 | | NYSE Arca |
| |
| E-TRACS Linked to the Dow Jones-UBS Commodity Index Total ReturnSM due October 31, 2039 | | NYSE Arca |
| |
| E-TRACS Linked to the Alerian MLP Infrastructure Index due April 2, 2040 | | NYSE Arca |
3
| | |
| |
| 1xMonthly Short E-TRACS Linked to the Alerian MLP Infrastructure Total Return Index due October 1, 2040 | | NYSE Arca |
| |
| 2xMonthly Leveraged Long E-TRACS Linked to the Alerian MLP Infrastructure Index due July 9, 2040 | | NYSE Arca |
| |
| E-TRACS Linked to the Alerian Natural Gas MLP Index due July 9, 2040 | | NYSE Arca |
| |
| E-TRACS Linked to the Wells Fargo® MLP Index due October 29, 2040 | | NYSE Arca |
| |
| E-TRACS Daily Long-Short VIX ETN due November 30, 2040 | | NYSE Arca |
| |
| E-TRACS Linked to the Wells Fargo® Business Development Company Index due April 26, 2041 | | NYSE Arca |
| |
| 2×Leveraged Long E-TRACS Linked to the Wells Fargo® Business Development Company Index due May 24, 2041 | | NYSE Arca |
| |
| E-TRACS Fisher-Gartman Risk On ETN due November 27, 2041 | | NYSE Arca |
| |
| E-TRACS Fisher-Gartman Risk Off ETN due November 27, 2041 | | NYSE Arca |
| |
| ETRACS Monthly Pay 2xLeveraged Dow Jones International Real Estate ETN due March 19, 2042 | | NYSE Arca |
| |
| ETRACS Monthly Pay 2xLeveraged Dow Jones Select Dividend Index ETN due May 22, 2042 | | NYSE Arca |
| |
| ETRACS Monthly Pay 2xLeveraged S&P Dividend ETN due May 22, 2042 | | NYSE Arca |
| |
| FI Enhanced Big Cap Growth ETN due June 13, 2022 | | NYSE Arca |
| |
| ETRACS Alerian MLP Index ETN due July 18, 2042 | | NYSE Arca |
| |
| ETRACS Monthly Pay 2xLeveraged Mortgage REIT ETN due October 16, 2042 | | NYSE Arca |
| |
| ETRACS Diversified High Income ETN due September 18, 2043 | | NYSE Arca |
| |
| ETRACS Monthly Pay 2xLeveraged Diversified High Income ETN due November 12, 2043 | | NYSE Arca |
| |
| ETRACS Monthly Pay 2xLeveraged Closed-End Fund ETN due December 10, 2043 | | NYSE Arca |
| * | Not for trading, but solely in connection with the registration of the corresponding Trust Preferred Securities. |
Securities registered or to be registered pursuant to Section 12(g) of the Act:
None
Securities for which there is a reporting obligation pursuant to Section 15(d) of the Act:
None
4
CAUTIONARY STATEMENT REGARDING FORWARD-LOOKING STATEMENTS
This report contains statements that constitute “forward-looking statements”, including but not limited to management’s outlook for UBS’s financial performance and statements relating to the anticipated effect of transactions and strategic initiatives on UBS’s business and future development. While these forward-looking statements represent UBS’s judgments and expectations concerning the matters described, a number of risks, uncertainties and other important factors could cause actual developments and results to differ materially from UBS’s expectations. These factors include, but are not limited to: (i) the degree to which UBS is successful in executing its announced strategic plans, including its efficiency initiatives and its planned further reduction in Basel III risk-weighted assets (RWA); (ii) developments in the markets in which UBS operates or to which it is exposed, including movements in securities prices or liquidity, credit spreads, currency exchange rates and interest rates and the effect of economic conditions and market developments on the financial position or creditworthiness of UBS’s clients and counterparties; (iii) changes in the availability of capital and funding, including any changes in UBS’s credit spreads and ratings, or arising from requirements for bail-in debt or loss-absorbing capital; (iv) changes in or the implementation of financial legislation and regulation in Switzerland, the US, the UK and other financial centers that may impose more stringent capital (including leverage ratio), liquidity and funding requirements, incremental tax requirements, additional levies, limitations on permitted activities, constraints on remuneration or other measures; (v) uncertainty as to when and to what degree the Swiss Financial Market Supervisory Authority (FINMA) will approve reductions to the incremental RWA resulting from the supplemental operational risk-capital analysis mutually agreed to by UBS and FINMA effective 31 December 2013, or will approve a limited reduction of capital requirements due to measures to reduce resolvability risk; (vi) possible changes to the legal entity structure or booking model of UBS Group in response to enacted, proposed or future legal and regulatory requirements, including capital requirements, the proposal to require non-US banks to establish intermediate holding companies for their US operations, resolvability requirements and the pending Swiss parliamentary proposals and proposals in other countries for mandatory structural reform of banks; (vii) changes in UBS’s competitive position, including whether differences in regulatory capital and other requirements among the major financial centers will adversely affect UBS’s ability to compete in certain lines of business; (viii) the liability to which UBS may be exposed, or possible constraints or sanctions that regulatory authorities might impose on UBS, due to litigation, contractual claims and regulatory investigations; (ix) the effects on UBS’s cross-border banking business of tax or regulatory developments and of possible changes in UBS’s policies and practices relating to this business; (x) UBS’s ability to retain and attract the employees necessary to generate revenues and to manage, support and control its businesses, which may be affected by competitive factors including differences in compensation practices; (xi) changes in accounting or tax standards or policies, and determinations or interpretations affecting the recognition of gain or loss, the valuation of goodwill, the recognition of deferred tax assets and other matters; (xii) limitations on the effectiveness of UBS’s internal processes for risk management, risk control, measurement and modeling, and of financial models generally; (xiii) whether UBS will be successful in keeping pace with competitors in updating its technology, particularly in trading businesses; (xiv) the occurrence of operational failures, such as fraud, unauthorized trading and systems failures; and (xv) the effect that these or other factors or unanticipated events may have on our reputation and the additional consequences that this may have on our business and performance. The sequence in which the factors above are presented is not indicative of their likelihood of occurrence or the potential magnitude of their consequences. Our business and financial performance could be affected by other factors identified in our past and future filings and reports, including those filed with the SEC. More detailed information about those factors is set forth in documents furnished by UBS and filings made by UBS with the SEC. UBS is not under any obligation to (and expressly disclaims any obligation to) update or alter its forward-looking statements, whether as a result of new information, future events, or otherwise.
5
PART I
| Item 1. | Identity of Directors, Senior Management and Advisors. |
Not required because this Form 20-F is filed as an annual report.
| Item 2. | Offer Statistics and Expected Timetable. |
Not required because this Form 20-F is filed as an annual report.
A – Selected Financial Data.
Please seeSelected Financial Data on pages 538 to 542 andStatement of changes in equity on pages 354 to 355 of the Annual Report 2013 of UBS AG (the “Annual Report”) which is annexed hereto and forms an integral part hereof.
The exchange rate for the Swiss franc as reported by the Federal Reserve System (H.10 Weekly) on 7 March 2014 was CHF 0.8785 per USD 1. See page 538 of the Annual Report for additional exchange rate information.
Ratio of Earnings to Fixed Charges.
Please see page 542 of the Annual Report and Exhibit 7 to this Form 20-F.
B – Capitalization and Indebtedness.
Not required because this Form 20-F is filed as an annual report.
C – Reasons for the Offer and Use of Proceeds.
Not required because this Form 20-F is filed as an annual report.
D – Risk Factors.
Please see pages 53 to 64 of the Annual Report.
| Item 4. | Information on the Company. |
A – History and Development of the Company
1 – 3 Please seeCorporate information on page 7 of the Annual Report.
4 Please seeThe making of UBS on pages 14 to 16 andOur strategy on pages 26 to 29 of the Annual Report.
5 – 7 Not applicable.
6
B – Business Overview.
1,2,5,7 Please refer to pages 8 to 9 and 33 to 49 of the Annual Report. For a breakdown of revenues by category of activity and geographic market for each of the last three financial years, please refer to Note 2a to the consolidated financial statements (the “Financial Statements”),Segment reporting, on pages 381 to 384, and Note 2b to the Financial Statements,Segment reporting by geographic location, on page 385 of the Annual Report.
3 Please refer toSeasonal characteristics on page 32 of the Annual Report.
4 Not applicable.
6 None.
8 Please seeRegulatory and legal developments andRegulation and supervision on pages 21 to 25 and 50 to 52, respectively, of the Annual Report.
Disclosure Pursuant To Section 219 of the Iran Threat Reduction And Syrian Human Rights Act
Section 219 of the U.S. Iran Threat Reduction and Syria Human Rights Act of 2012 (“ITRA”) added new Section 13(r) to the U.S. Securities Exchange Act of 1934, as amended (the “Exchange Act”) requiring each SEC reporting issuer to disclose in its annual and, if applicable, quarterly reports whether it or any of its affiliates have knowingly engaged in certain activities, transactions or dealings relating to Iran or with the Government of Iran or certain designated natural persons or entities involved in terrorism or the proliferation of weapons of mass destruction during the period covered by the report. The required disclosure includes disclosure of activities not prohibited by U.S. or other law even if conducted outside the U.S. by non-U.S. affiliates in compliance with local law. Pursuant to Section 13(r) of the Exchange Act, we note the following for the period covered by this annual report:
UBS AG has a Group Sanctions Policy which was implemented in 2006 that prohibits transactions involving sanctioned countries, including Iran, and sanctioned individuals and entities. However, UBS continues to maintain one account involving the Iranian government under the auspices of the United Nations in Geneva after agreeing with the Swiss government that it would do so only under certain conditions. These conditions include that payments involving the account must: (1) be made within Switzerland; (2) be consistent with paying rent, salaries, telephone and other expenses necessary for its operations in Geneva; and (3) not involve any Specially Designated Nationals blocked or otherwise restricted under U.S. or Swiss law. In 2013,the gross/net revenues for this UN related account were approximately USD 15,8571 which was generated by fees charged to the account; the net profit was approximately USD 10,647 after deductions were taken for UBS internal costs for maintaining the account. UBS AG intends to continue maintaining this account pursuant to the conditions it has established and consistent with its Group Sanctions Policy.
As previously reported, there were also certain outstanding trade finance arrangements that had been issued on behalf of Swiss client exporters in favor of their Iranian counterparties which involve four Iranian designated banks (WMD). At the time these trade finance arrangements were initiated in or about 2000, none of the Iran banks involved were WMD-designated. In February 2012, due to increasing risks involving Iran, UBS ceased accepting payments on these outstanding export trade finance arrangements and worked with the Swiss government who insured these contracts (Swiss Export Risk Insurance “SERV”). On December 21, 2013, UBS and the SERV entered into certain Transfer and Assignment Agreements under which SERV purchased all of UBS’s remaining receivables under or in connection with Iran-related export finance transactions. Subsequently the SERV notified the Iranian banks and requested their agreement. Such agreement is stipulated under the terms of the original contracts. To date UBS has not been informed of any confirmation. Hence from a legal perspective, the SERV is the sole beneficiary of said receivables. Contractually UBS
1 All figures in this Section 219 disclosure are stated in US dollars for convenience and consistency, although the underlying transactions are denominated in other currencies, principally Swiss francs.
7
remains creditor and thus accordingly it is not yet in the position to write off these receivables. There was no financial activity involving Iran in connection with these trade finance arrangements in 2013. In connection with these trade finance arrangements, UBS has maintained one existing account relationship with an Iranian bank that is currently WMD designated. This account was established as a correspondent banking relationship prior to the U.S. designation. In 2006, when UBS implemented its Group Sanctions Policy, the relationship was closed but the account was maintained due to the existing trade finance arrangements. In or about 2007, following the designation of the bank pursuant to sanctions issued by the U.S., UN and Switzerland, the account was blocked under Swiss law and has remained blocked since then. Client assets as of December 2013 were USD 3,553. We intend to terminate these legacy arrangements and relationships in accordance with the nature of these instruments and applicable law. As there have been no transactions involving this account in 2013 other than general account fees, there are no gross profits/net revenues to report for 2013.
In 1993, a non-Iranian individual opened a private banking relationship at a predecessor institution of UBS AG in Switzerland. In 2001, this individual was designated under Executive Order 13224 and remains so today. In 2001, the individual’s accounts at UBS AG were blocked by order of the Swiss authorities. The Swiss authorities lifted the blocking of the individual’s UBS accounts in October 2012. UBS AG does not intend to continue this activity and has been in the process of exiting this client relationship. UBS AG has frozen the client’s remaining account until it can be closed as permitted by applicable law. In 2013, the gross revenues for this client relationship were approximately USD -2,667 and the net loss was approximately USD -10,025.
C – Organizational Structure.
Please seeUBS and its businesses on pages 8 to 9 of the Annual Report and Note 30 to the Financial Statements,Interests in subsidiaries and other entities, on pages 481 to 487 of the Annual Report.
D – Property, Plant and Equipment.
Please seeProperty, plant and equipment on page 543, Note 16 to the Financial Statements,Property and equipment,on page 408, and Note 33 to the Financial Statements,Operating lease commitments, on page 489, of the Annual Report.
Information Required by Industry Guide 3
Please seeInformation required by industry guide 3 on pages 544 to 557 of the Annual Report. See alsoSelected financial data on pages 538 to 542 of the Annual Report for the return on equity attributable to UBS shareholders, return on average equity, return on average assets, dividend payout ratio and ratio of average equity to average assets.
| Item 4A. | Unresolved Staff Comments. |
None.
| Item 5. | Operating and Financial Review and Prospects. |
A – Operating Results.
Please seeUBS key figureson page 6, Measurement of performanceon pages 30 to 32, and Group performanceon pages 75 to 97 of the Annual Report. For a discussion of operating results by business division, please refer to pages 98 to 138 of the Annual Report.
8
For information regarding the impact of foreign currency fluctuations, seeCurrency management on page 225 andOur global presence subjects us to risk from currency fluctuations on page 61 of the Annual Report. For information regarding governmental policies that could affect operations, seeCurrent market climate and industry drivers on pages 18 to 20 andRegulatory and legal developments on pages 21 to 25 of the Annual Report.
B – Liquidity and Capital Resources.
We believe that our working capital is sufficient for the company’s present requirements. Liquidity and capital management is undertaken at UBS as an integrated asset and liability management function. For a detailed discussion, please seeLiquidity and funding managementon pages 216 to 224,Capital managementon pages 226 to 252 and Note 25a to the Financial Statements,Restricted financial assets, on page 449, of the Annual Report.
For a discussion of UBS’s borrowings and cash flows, please seeBalance sheeton pages 89 to 93 andCash flowson page 97 of the Annual Report.
Please see also Currency managementon page 225 of the Annual Report, Note 20 to the Financial Statements,Financial liabilities designated at fair value,on pages 413 to 414 and Note 21 to the Financial Statements,Debt issued held at amortized cost, on pages 414 to 415 of the Annual Report.
C – Research and Development, Patents and Licenses, etc.
Not applicable.
D – Trend Information.
Please seeCurrent market climate and industry driverson pages 18 to 20 of the Annual Report.
E – Off-Balance Sheet Arrangements.
Please seeOff-balance sheeton pages 94 to 96 of the Annual Report and Note 25 to the Financial Statements,Restricted and transferred financial assets, on pages 449 to 452 and Note 33 to the Financial Statements,Operating lease commitments,on page 489 of the Annual Report.
F – Tabular Disclosure of Contractual Obligations.
Please seeContractual obligationson page 95 of the Annual Report.
| Item 6. | Directors, Senior Management and Employees. |
A – Directors and Senior Management.
1,2,3 Please see pages 264 to 268 and pages 273 to 276 of the Annual Report.
4, 5 None.
B – Compensation.
1 Please see pages 305 to 339 of the Annual Report and also Note 29 to the Financial Statements,Equity participation and other compensation plans, on pages 471 to 480 and Note 34 to the Financial Statements,Related parties, on pages 490 to 492 of the Annual Report.
9
2 Please see Note 28 to the Financial Statements,Pension and other post-employment benefit plans, on pages 459 to 470 of the Annual Report.
C – Board practices.
1 Please see pages 264 to 280 of the Annual Report.
2 Please see pages 308 to 339 of the Annual Report and Note 34 to the Financial Statements,Related parties, on pages 490 to 492 of the Annual Report.
3 Please seeAudit committee andHuman Resources and Compensation Committeeon pages 269 to 270 of the Annual Report.
D—Employees.
Please seeOur employeeson pages 296 to 301 of the Annual Report.
E—Share Ownership.
Please see pages 336 to 338 in the Annual Report, Note 29 to the Financial Statements,Equity participation and other compensation plans,on pages 471 to 480 of the Annual Report and “Equity holdings” in Note 34 to the Financial Statements,Related parties,on page 490 of the Annual Report.
| Item 7. | Major Shareholders and Related Party Transactions. |
A—Major Shareholders.
Please seeGroup structure and shareholderson pages 256 to 257 andCapital structure on pages 258 to 261 of the Annual Report. The number of shares held by the respective shareholders listed in the “Shareholders registered in the UBS share register with 3% or more of shares issued” table on page 257 is as follows:
| | | | |
| Shareholder | | Number of shares held | |
| |
Chase Nominees Ltd., London | | | 450,540,638 | |
GIC Private Limited, Singapore | | | 245,517,417 | |
DTC (Cede & Co.), New York | | | 226,191,092 | |
Nortrust Nominees Ltd., London | | | 143,960,557 | |
Please see Transferability, voting rights and nominee registration on page 260 of the Annual Report for information about certain restrictions on the rights of the listed shareholders.
B—Related Party Transactions.
Please seeLoanson page 317 of the Annual Report, Note 34 to the Financial Statements,Related parties,on pages 490 to 492 of the Annual Report andLoans granted to GEB members on 31 December 2013/2012andLoans granted to BoD members on 31 December 2013/2012 on page 339 of the Annual Report.
The aforementioned loans (a) were made in the ordinary course of business, (b) were made on substantially the same terms, including interest rates and collateral, as those prevailing at the time for comparable transactions with other persons, and (c) did not involve more than the normal risk of collectability or present other unfavorable features.
10
C—Interests of Experts and Counsel.
Not applicable because this Form 20-F is filed as an annual report.
| Item 8. | Financial Information. |
A—Consolidated Statements and Other Financial Information.
1, 2, 3, 4, 5, 6 Please see Item 18 of this Form 20-F.
7 Information on material legal and regulatory proceedings is in Note 22 to the Financial Statements,Provisions and contingent liabilities, on pages 415 to 425 of the Annual Report. For developments during the year, please see also Note 17,Provisions and contingent liabilities, in the Financial Information section in our respective quarterly reports for the First Quarter 2013, filed on Form 6-K dated April 30, 2013, the Second Quarter 2013, filed on Form 6-K dated July 30, 2013 and the Third Quarter 2013, filed on Form 6-K dated October 29, 2013; as well as Note 15,Provisions and contingent liabilities, in the Financial Information section in our quarterly report for the Fourth Quarter 2013, filed on Form 6-K dated February 4, 2014. The Notes in each such Quarterly Report speak only as of their respective dates.
8 Please refer toDistributions to shareholders on page 260 of the Annual Report for a description of UBS’s dividend policy.
B—Significant Changes.
Please see Note 1 to the Financial Statements,Summary of significant accounting policies, on pages 359 to 380, Note 2a to the Financial Statements,Segment reporting, on pages 381 to 384, and Note 37 to the Financial Statements,Events after the reporting period,on page 494 of the Annual Report.
| Item 9. | The Offer and Listing. |
A – Offer and Listing Details.
1,2,3,5,6,7 Not required because this Form 20-F is filed as an annual report.
4 Please seeStock exchange prices on page 252 of the Annual Report.
B—Plan of Distribution.
Not required because this Form 20-F is filed as an annual report.
C—Markets.
UBS’s shares are listed and traded on the SIX Swiss Exchange and the New York Stock Exchange. The symbols are shown on page 251 of the Annual Report.
D—Selling Shareholders.
Not required because this Form 20-F is filed as an annual report.
E—Dilution.
Not required because this Form 20-F is filed as an annual report.
11
F—Expenses of the Issue.
Not required because this Form 20-F is filed as an annual report.
| Item 10. | Additional Information. |
A—Share Capital.
Not required because this Form 20-F is filed as an annual report.
B—Memorandum and Articles of Association.
Please see the Articles of Association of UBS AG and the Organization Regulations of UBS AG (Exhibits 1.1 and 1.2, respectively, to this Form 20-F).
Set forth below is a summary of the material provisions of our Articles of Association, which we call the “Articles” throughout this document, Organization Regulations and the Swiss Code of Obligations relating to our shares. This description does not purport to be complete and is qualified in its entirety by references to Swiss law, including Swiss company law, and to the Articles and Organization Regulations.
The shares are registered shares with a par value of CHF 0.10 per share. The shares are fully paid up.
Each share carries one vote at our shareholders’ meetings. Voting rights may be exercised only after a shareholder has been recorded in our share register as a shareholder with voting rights. Registration with voting rights is subject to certain restrictions. See “— Transfer of Shares” and “—Shareholders’ Meeting”.
The Articles provide that we may elect not to print and deliver certificates in respect of registered shares. Shareholders may, however, following registration in the share register, request at any time that we issue a written statement in respect of their shares.
For information regarding the Board of Directors, seeElections and terms of office andOrganizational principles and structure on pages 269 to 271 of the Annual Report.
Transfer of Shares
The transfer of shares is effected by corresponding entry in the books of a bank or depository institution following an assignment in writing by the selling shareholder and notification of such assignment to us by the bank or depository institution. The transfer of shares further requires that the purchaser file a share registration form in order to be registered in our share register as a shareholder. Failing such registration, the purchaser may not vote at or participate in shareholders’ meetings.
A purchaser of shares will be recorded in our share register with voting rights upon disclosure of its name, citizenship and address. However, we may decline a registration with voting rights if the shareholder does not declare that it has acquired the shares in its own name and for its own account. If the shareholder refuses to make such declaration, it will be registered as a shareholder without voting rights.
There is no limitation under Swiss law or our Articles on the right of non-Swiss residents or nationals to own or vote our shares.
12
Shareholders’ Meeting
Under Swiss law, annual ordinary shareholders’ meetings must be held within six months after the end of our financial year, which is 31 December. Shareholders’ meetings may be convened by the Board of Directors (BoD) or, if necessary, by the statutory auditors, with twenty-days’ advance notice. The BoD is further required to convene an extraordinary shareholders’ meeting if so resolved by a shareholders’ meeting or if so requested by shareholders holding in aggregate at least 10% of our nominal share capital. Shareholders holding shares with an aggregate par value of at least CHF 62,500 have the right to request that a specific proposal be put on the agenda and voted upon at the next shareholders’ meeting. A shareholders’ meeting is convened by publishing a notice in the Swiss Official Commercial Gazette (Schweizerisches Handelsamtsblatt) at least twenty days prior to such meeting.
Please refer toShareholders’ participation rights on pages 262 to 263 of the Annual Report for more information about shareholder participation in the decision-making process.
The Articles do not require a minimum number of shareholders to be present in order to hold a shareholders’ meeting.
Resolutions generally require the approval of an “absolute majority” of the votes cast at a shareholders’ meeting. Shareholders’ resolutions requiring a vote by absolute majority include:
| | • | | Amendments to the Articles; |
| | • | | Elections of directors and statutory auditors; |
| | • | | Approval of the annual report and the consolidated statements of accounts; |
| | • | | Approval of the annual financial statements and the resolution on the use of the balance sheet profit (declaration of dividend); |
| | • | | Decisions to discharge directors and management from liability for matters disclosed to the shareholders’ meeting; and |
| | • | | Passing resolutions on matters which are by law or by the Articles reserved to the shareholders’ meeting (e.g., the ordering of an independent investigation into the specific matters proposed to the shareholders’ meeting). |
Under the Articles, a resolution passed at a shareholders’ meeting with a supermajority of at least two thirds of the Shares represented at such meeting is required to:
| | • | | Change the limits on BoD size in the Articles; |
| | • | | Remove one fourth or more of the members of the BoD; or |
| | • | | Delete or modify the above supermajority requirements. |
Under Swiss corporate law, a resolution passed by at least two thirds of votes represented and an absolute majority of the par value of the shares represented must approve:
| | • | | A change in our stated purpose in the Articles; |
| | • | | The creation of shares with privileged voting rights; |
| | • | | A restriction on transferability of shares; |
| | • | | An increase in authorized or contingent capital or the creation of reserve capital in accordance with Swiss banking law; |
| | • | | An increase in capital out of equity against contribution in kind, for the purpose of acquisition and granting of special rights; |
| | • | | Changes to pre-emptive rights; |
| | • | | A change of domicile of the corporation; or |
| | • | | Dissolution of the corporation. |
13
At shareholders’ meetings, a shareholder can be represented by his or her legal representative or under a written power of attorney by another shareholder eligible to vote, by a corporate proxy, by the independent proxy or by a custodial proxy. Votes are taken electronically, by written ballot or by a show of hands. If a written ballot is requested by at least 3% of the votes present at the shareholders’ meeting or such ballot is ordered by the Chairman of the meeting, a written ballot will be conducted.
Net Profits and Dividends
Swiss law requires that at least 5% of the annual net profits of a corporation must be retained as general reserves for so long as these reserves amount to less than 20% of the corporation’s nominal share capital. Any net profits remaining are at the disposal of the shareholders’ meeting, except that, if an annual dividend exceeds 5% of the nominal share capital, then 10% of such excess must be retained as general reserves.
Under Swiss law, dividends may be paid out only if the corporation has sufficient distributable profits from previous business years or if the reserves of the corporation are sufficient to allow distribution of a dividend. In either event, dividends may be paid out only after approval by the shareholders’ meeting. The BoD may propose to the shareholders that a dividend be paid out. The auditors must confirm that the dividend proposal of the Board conforms with statutory law. In practice, the shareholders’ meeting usually approves the dividend proposal of the BoD.
Dividends are usually due and payable after the shareholders’ resolution relating to the allocation of profits has been passed. Under Swiss law, the statute of limitations in respect of dividend payments is five years.
U.S. holders of shares will receive dividend payments in U.S. dollars, unless they provide notice to our U.S. transfer agent, Computershare, that they wish to receive dividend payments in Swiss francs. The U.S. transfer agent will be responsible for paying the U.S. dollars or Swiss francs to registered holders, and for withholding any required amounts for taxes or other governmental charges. If the U.S. transfer agent determines, after consultation with us, that in its judgment any foreign currency received by it cannot be converted into U.S. dollars or transferred to U.S. holders, it may distribute the foreign currency received by it, or an appropriate document evidencing the right to receive such currency, or in its discretion hold such foreign currency for the accounts of U.S. holders.
Preemptive Rights
Under Swiss law, any share issue, whether for cash or non-cash consideration or for no consideration, is subject to the prior approval of the shareholders’ meeting. Shareholders of a Swiss corporation have certain preemptive rights to subscribe for new issues of shares in proportion to the nominal amount of shares held. The Articles or a resolution adopted at a shareholders’ meeting with a supermajority may, however, limit or suspend preemptive rights in certain limited circumstances.
Borrowing Power
Neither Swiss law nor the Articles restrict in any way our power to borrow and raise funds. No shareholders’ resolution is required.
14
Conflicts of Interests
Swiss law does not have a general provision on conflicts of interests. However, the Swiss Code of Obligations requires directors and members of senior management to safeguard the interests of the corporation and, as such, imposes a duty of care and a duty of loyalty on directors and officers. This rule is generally understood as disqualifying directors and senior officers from participating in decisions that directly affect them. Directors and officers are personally liable to the corporation for any breach of these provisions. In addition, Swiss law contains a provision under which payments made to a shareholder or a director or any person associated therewith, other than at arm’s length, must be repaid to us if the shareholder or director was acting in bad faith.
In addition, our Organization Regulations prohibit any member of the BoD from participating in discussions and decision-making regarding a matter as to which he or she has a conflict of interest.
Repurchase of Shares
Swiss law limits a corporation’s ability to hold or repurchase its own shares. We and our subsidiaries may only repurchase shares if we have sufficient free reserves to pay the purchase price and if the aggregate nominal value of the shares does not exceed 10% of our nominal share capital. Furthermore, we must create a special reserve on our balance sheet in the amount of the purchase price of the acquired shares. Such shares held by us or our subsidiaries do not carry any rights to vote at shareholders’ meetings.
Notices
Notices to shareholders are made by publication in the Swiss Official Gazette of Commerce. The BoD may designate further means of communication for publishing notices to shareholders.
Notices required under the listing rules of the SIX Swiss Exchange will be published in two Swiss newspapers in German and French. We or the SIX Swiss Exchange may also disseminate the relevant information on the online exchange information systems.
Registration and Business Purpose
We are registered as a corporation in the commercial registers of Canton Zurich and Canton Basle-City under the registration number CHE-101.329.561 and have registered offices in Zurich and Basel, Switzerland.
Our business purpose, as set forth in our Articles, is the operation of a bank, with a scope of operations extending to all types of banking, financial, advisory, trading and service activities in Switzerland and abroad.
Duration, Liquidation and Merger
Our duration is unlimited.
Under Swiss law, we may be dissolved at any time by a shareholders’ resolution which must be passed by (1) an absolute majority of the shares represented at the meeting in the event we are to be dissolved by way of liquidation, or (2) a supermajority of at least two thirds of the votes represented and an absolute majority of the par value of the shares represented at the meeting in other events (for example, in a merger where we are not the surviving entity). Dissolution by court order is possible if we become bankrupt.
Under Swiss law, any surplus arising out of a liquidation (after the settlement of all claims of all creditors) is distributed to shareholders in proportion to the paid-up nominal value of shares held.
15
Disclosure of Principal Shareholders
Under the applicable provisions of the Swiss Stock Exchange Act, shareholders and shareholders acting in concert with third parties who reach, exceed or fall below the thresholds of 3%, 5%, 10%, 15%, 20%, 25%, 33 1/3%, 50% or 66 2/3% of the voting rights of a Swiss listed corporation must notify the corporation and the SIX Swiss Exchange on which such shares are listed of such holdings, whether or not the voting rights can be exercised. Following receipt of such notification, the corporation has the obligation to inform the public. The corporation must disclose in an attachment to the balance sheet the identity of any shareholders who own in excess of 5% of its shares.
Mandatory Tender Offer
Under the Swiss Stock Exchange Act, shareholders and shareholders acting in concert with third parties who acquire more than 33 1/3% of the voting rights of a Swiss listed company will have to submit a takeover bid to all remaining shareholders. A waiver from the mandatory bid rule may be granted by our supervisory authority. If no waiver is granted, the mandatory takeover bid must be made pursuant to the procedural rules set forth in the Swiss Stock Exchange Act and implementing ordinances.
Other
Ernst & Young Ltd, Aeschengraben 9, CH-4051 Basel, Switzerland, have been appointed as statutory auditors and as auditors of the consolidated accounts of UBS. The auditors are subject to election by the shareholders at the ordinary general meeting on an annual basis.
Please seeCapital structureon pages 258 to 261,Shareholders’ participation rightson pages 262 to 263 andElections and terms of officeon page 269 of the Annual Report.
C—Material Contracts.
The Fiscal Agency Agreement related to the loss-absorbing tier 2 notes issued on 17 August 2012 is filed herewith as an exhibit. Please see the description of these notes underTier 2 capital on page 231 of the Annual Report.
The Non-Prosecution Agreement that UBS entered into with the US Department of Justice on December 18, 2012, is filed herewith as an exhibit. Please see the description of this agreement in paragraph 9 of Note 22b to the Financial Statements,Litigation, regulatory and similar matters, on pages 422 to 424 of the Annual Report
D—Exchange Controls.
There are no restrictions under UBS’s Articles of Association or Swiss law, presently in force, that limit the right of non-resident or foreign owners to hold UBS’s securities freely. There are currently no Swiss foreign exchange controls or other Swiss laws restricting the import or export of capital by UBS or its subsidiaries. In addition, there are currently no restrictions under Swiss law affecting the remittance of dividends, interest or other payments to non-resident holders of UBS securities.
16
E—Taxation.
This section outlines the material Swiss tax and U.S. federal income tax consequences of the ownership of UBS ordinary shares by a U.S. holder (as defined below) who holds UBS ordinary shares as capital assets. It is designed to explain the major interactions between Swiss and U.S. taxation for U.S. persons who hold UBS shares.
The discussion does not address the tax consequences to persons who hold UBS ordinary shares in particular circumstances, such as tax-exempt entities, banks, financial institutions, life insurance companies, broker-dealers, traders in securities that elect to use a mark-to-market method of accounting for securities holdings, holders liable for alternative minimum tax, holders that actually or constructively own 10% or more of the voting stock of UBS, holders that hold UBS ordinary shares as part of a straddle or a hedging or conversion transaction, holders that purchase or sell ordinary shares as part of a wash sale for tax purposes or holders whose functional currency for U.S. tax purposes is not the U.S. dollar. This discussion also does not apply to holders who acquired their UBS ordinary shares through a tax-qualified retirement plan, nor generally to unvested UBS ordinary shares held under deferred compensation arrangements.
If a partnership holds UBS ordinary shares, the U.S. federal income tax treatment of a partner will generally depend on the status of the partner and the tax treatment of the partnership. A partner in a partnership holding the ordinary shares should consult its tax advisor with regard to the U.S. federal income tax treatment of an investment in the ordinary shares.
The discussion is based on the tax laws of Switzerland and the United States, including the U.S. Internal Revenue Code of 1986, as amended, its legislative history, existing and proposed regulations under the Internal Revenue Code, published rulings and court decisions, as in effect on the date of this document, as well as the Convention between the United States of America and the Swiss Confederation for the Avoidance of Double Taxation with Respect to Taxes on Income, which we call the “Treaty,” all of which may be subject to change or change in interpretation, possibly with retroactive effect.
For purposes of this discussion, a “U.S. holder” is any beneficial owner of UBS ordinary shares that is for U.S. federal income tax purposes:
| | • | | A citizen or resident of the United States; |
| | • | | A domestic corporation or other entity taxable as a corporation; |
| | • | | An estate, the income of which is subject to U.S. federal income tax without regard to its source; or |
| | • | | A trust, if a court within the United States is able to exercise primary supervision over the administration of the trust and one or more U.S. persons have the authority to control all substantial decisions of the trust. |
The discussion does not generally address any aspects of Swiss taxation other than income and capital taxation or of U.S. taxation other than federal income taxation. Holders of UBS shares are urged to consult their tax advisors regarding the U.S. federal, state and local and the Swiss and other tax consequences of owning and disposing of these shares in their particular circumstances.
(a) Ownership of UBS Ordinary Shares-Swiss Taxation
Dividends and Distributions
Dividends paid by UBS to a holder of UBS ordinary shares (including dividends on liquidation proceeds and stock dividends) are in principle subject to a Swiss federal withholding tax at a rate of 35%.
Until the end of 2010, the Par Value Principle was applicable. Under the Par Value Principle any distribution, which was not a repayment of the par value of the shares, was subject to Swiss withholding tax.
17
On 1 January 2011, the Par Value Principle was replaced by the Capital Contribution Principle. Under the Capital Contribution Principle, the repayment of capital contributions, including share premiums made by the shareholders after December 31, 1996 is in principle no longer subject to Swiss withholding tax if certain requirements regarding the booking of these capital contributions are met. The Swiss Federal Tax Administration issued guidelines on how the Capital Contribution Principle has to be applied.
A U.S. holder that qualifies for Treaty benefits may apply for a refund of the withholding tax withheld in excess of the 15% Treaty rate (or for a full refund in case of qualifying retirement arrangements). The claim for refund must be filed with the Swiss Federal Tax Administration, Eigerstrasse 65, CH-3003 Berne, Switzerland no later than December 31 of the third year following the end of the calendar year in which the income subject to withholding was due. The form used for obtaining a refund is Swiss Tax Form 82 (82 C for companies; 82 E for other entities; 82 I for individuals; 82 R for regulated investment companies), which may be obtained from any Swiss Consulate General in the United States or from the Swiss Federal Tax Administration at the address above. The form must be filled out in triplicate with each copy duly completed and signed before a notary public in the United States. The form must be accompanied by evidence of the deduction of withholding tax withheld at the source.
Transfers of UBS Ordinary Shares
The purchase or sale of UBS ordinary shares, whether by Swiss resident or non-resident holders (including U.S. holders), may be subject to a Swiss securities transfer stamp duty of up to 0.15% calculated on the purchase price or sale proceeds if it occurs through or with a bank or other securities dealer as defined in the Swiss Federal Stamp Tax Act in Switzerland or the Principality of Liechtenstein. In addition to the stamp duty, the sale of UBS ordinary shares by or through a member of a recognized stock exchange may be subject to a stock exchange levy.
Capital gains realized by a U.S. holder upon the sale of UBS ordinary shares are not subject to Swiss income or gains taxes, unless such U.S. holder holds such shares as business assets of a Swiss business operation qualifying as a permanent establishment for the purposes of the Treaty. In the latter case, gains are taxed at ordinary Swiss individual or corporate income tax rates, as the case may be, and losses are deductible for purposes of Swiss income taxes.
(b) Ownership of UBS Ordinary Shares-U.S. Federal Income Taxation
Dividends and Distributions
Subject to the passive foreign investment company rules discussed below, U.S. holders will include in gross income the gross amount of any dividend paid, before reduction for Swiss withholding taxes, by UBS out of its current or accumulated earnings and profits, as determined for U.S. federal income tax purposes, as ordinary income when the dividend is actually or constructively received by the U.S. holder. Distributions in excess of current and accumulated earnings and profits, as determined for U.S. federal income tax purposes, will be treated as a return of capital to the extent of the U.S. holder’s basis in its UBS ordinary shares and thereafter as capital gain.
Dividends paid to a noncorporate U.S. holder that constitute qualified dividend income will be taxable to the holder at a maximum rate of 20%, provided that the holder has a holding period in the shares of more than 60 days during the 121-day period beginning 60 days before the ex-dividend date and meets other holding period requirements. Dividends paid by UBS with respect to the shares will generally be qualified dividend income.
18
For U.S. federal income tax purposes, a dividend will include a distribution characterized under Swiss law as a repayment of capital contributions if the distribution is made out of current or accumulated earnings and profits, as described above.
Dividends will generally be income from sources outside the United States for foreign tax credit limitation purposes, and will, depending on the holder’s circumstances, be either “passive” or “general” income for purposes of computing the foreign tax credit allowable to the holder. Special rules apply in determining the foreign tax credit limitation with respect to dividends that are subject to the maximum 20% rate. The dividend will not be eligible for the dividends-received deduction generally allowed to U.S. corporations in respect of dividends received from other U.S. corporations.
The amount of the dividend distribution included in income of a U.S. holder will be the U.S. dollar value of the Swiss franc payments made, determined at the spot Swiss franc/U.S. dollar rate on the date such dividend distribution is includible in the income of the U.S. holder, regardless of whether the payment is in fact converted into U.S. dollars. Generally, any gain or loss resulting from currency exchange fluctuations during the period from the date the dividend distribution is included in income to the date such dividend distribution is converted into U.S. dollars will be treated as ordinary income or loss and will not be eligible for the special tax rate applicable to qualified dividend income. Such gain or loss will generally be income or loss from sources within the United States for foreign tax credit limitation purposes.
Subject to U.S. foreign tax credit limitations, the nonrefundable Swiss tax withheld and paid over to Switzerland will be creditable or deductible against the U.S. holder’s U.S. federal income tax liability. To the extent a refund of the tax withheld is available to a U.S. holder under the laws of Switzerland or under the Treaty, the amount of tax withheld that is refundable will not be eligible for credit against the U.S. holder’s U.S. federal income tax liability, whether or not the refund is actually obtained. See “(a) Ownership of UBS Ordinary Shares – Swiss Taxation” above, for the procedures for obtaining a tax refund.
Transfers of UBS Ordinary Shares
Subject to the passive foreign investment company rules discussed below, a U.S. holder that sells or otherwise disposes of UBS ordinary shares generally will recognize capital gain or loss for U.S. federal income tax purposes equal to the difference between the U.S. dollar value of the amount realized and the tax basis, determined in U.S. dollars, in the UBS ordinary shares. Capital gain of a non-corporate U.S. holder is generally taxed at preferential rates if the UBS ordinary shares were held for more than one year. The gain or loss will generally be income or loss from sources within the United States for foreign tax credit limitation purposes.
Passive Foreign Investment Company Rules
UBS believes that UBS ordinary shares should not be treated as stock of a passive foreign investment company for U.S. federal income tax purposes, but this conclusion is a factual determination made annually and thus may be subject to change. In general, UBS will be a passive foreign investment company with respect to a U.S. holder if, for any taxable year in which the U.S. holder held UBS ordinary shares, either (i) at least 75% of the gross income of UBS for the taxable year is passive income or (ii) at least 50% of the value, determined on the basis of a quarterly average, of UBS’s assets is attributable to assets that produce or are held for the production of passive income (including cash). If UBS were to be treated as a passive foreign investment company, then unless a U.S. holder were to make a mark-to-market election with respect to the UBS ordinary shares, gain realized on the sale or other disposition of UBS ordinary shares would in general not be treated as capital gain. Instead, a U.S. holder would be treated as if the holder had realized such gain and certain “excess distributions” ratably over the three preceding taxable years or, if shorter, the holder’s holding period for the shares and would be taxed at the highest tax rate in effect for each such year to which the gain was allocated, together with an interest charge in respect of the tax attributable to each such
19
year. With certain exceptions, a holder’s UBS ordinary shares will be treated as stock in a passive foreign investment company if UBS was a passive foreign investment company at any time during the holder’s holding period in the UBS ordinary shares. In addition, dividends received from UBS would not be eligible for the preferential tax rate applicable to qualified dividend income if UBS were to be treated as a passive foreign investment company either in the taxable year of the distribution or the preceding taxable year, but would instead be taxable at rates applicable to ordinary income.
F—Dividends and Paying Agents.
Not required because this Form 20-F is filed as an annual report.
G—Statement by Experts.
Not required because this Form 20-F is filed as an annual report.
H—Documents on Display.
UBS files periodic reports and other information with the Securities and Exchange Commission. You may read and copy any document that we file with the SEC on the SEC’s website, www.sec.gov, or at the SEC’s public reference room at 100 F Street, N.E., Room 1580, Washington, D.C. 20549. Please call the SEC at 1-800-SEC-0330 (in the United States) or at +1 202 942 8088 (outside the United States) for further information on the operation of its public reference room. Much of this additional information may also be found on the UBS website at www.ubs.com/investors.
I—Subsidiary Information.
Not applicable.
| Item 11. | Quantitative and Qualitative Disclosures About Market Risk. |
(a) Quantitative Information About Market Risk.
Please seeMarket riskon pages 188 to 204 of the Annual Report.
(b) Qualitative Information About Market Risk.
Please seeMarket riskon pages 188 to 204 of the Annual Report.
(c) Interim Periods.
Not applicable.
| Item 12. | Description of Securities Other than Equity Securities. |
A – Debt Securities
Not required because this Form 20-F is filed as an annual report.
B – Warrants and Rights
Not required because this Form 20-F is filed as an annual report.
C – Other Securities
Not required because this Form 20-F is filed as an annual report.
D – American Depositary Shares
1,2 Not required because this Form 20-F is filed as an annual report.
3,4 Not applicable.
20
PART II
| Item 13. | Defaults, Dividend Arrearages and Delinquencies. |
There has been no material default in respect of any indebtedness of UBS or any of its significant subsidiaries or any arrearages of dividends or any other material delinquency not cured within 30 days relating to any preferred stock of UBS AG or any of its significant subsidiaries.
| Item 14. | Material Modifications to the Rights of Security Holders and Use of Proceeds. |
None.
| Item 15. | Controls and Procedures. |
(a) Disclosure Controls and Procedures
Please seeUS regulatory disclosure requirements on page 282 of the Annual Report. See also Exhibit 12 to this Form 20-F.
(b) Management’s Annual Report on Internal Control over Financial Reporting
Please seeManagement’s report on internal control over financial reporting on page 345 of the Annual Report.
(c) Attestation Report of the Registered Public Accounting Form
Please seeReport of independent registered public accounting firm on internal control over financial reporting on pages 346 to 347 of the Annual Report.
(d) Changes in Internal Control over Financial Reporting
None.
| Item 15T. | Controls and Procedures. |
Not applicable.
21
| Item 16A. | Audit Committee Financial Expert. |
Please seeAudit Committeeon pages 269 to 270 andCorporate governanceon pages 254 to 255 of the Annual Report.
There was no substantive amendment to the Code of Business Conduct and Ethics (the “Code”) in 2013. No waiver from any provision of the Code was granted to any employee in 2013.
The Code is published on our website underhttp://www.ubs.com/1/e/investors/corporategovernance/business_conduct.html.
| Item 16C. | Principal Accountant Fees and Services. |
Please seeAuditorson pages 279 to 280 of the Annual Report. None of the non-audit services disclosed in the table on page 279 were approved by the Audit Committee pursuant to paragraph (c) (7)(i)(C ) of Rule 2-01 of Regulation S-X.
| Item 16D. | Exemptions from the Listing Standards for Audit Committees. |
Not applicable.
| Item 16E. | Purchases of Equity Securities by the Issuer and Affiliated Purchasers. |
Please seeTreasury share activitieson page 250 of the Annual Report.
| Item 16F. | Changes in Registrant’s Certifying Accountant. |
Not applicable.
| Item 16G. | Corporate Governance. |
Please seeCorporate governance on pages 254 to 255 of the Annual Report.
22
PART III
| Item 17. | Financial Statements. |
Not applicable.
| Item 18. | Financial Statements. |
Please see the Financial Statements and the Notes to the Financial Statements on pages 342 to 505 of the Annual Report.
| | |
Exhibit
number | | Description |
| |
| 1.1 | | Articles of Association of UBS AG. |
| |
| 1.2 | | Organization Regulations of UBS AG. (Incorporated by reference to UBS AG’s Report of Foreign Private Issuer on Form 6-K filed January 3, 2013) |
| |
| 2(b) | | Instruments defining the rights of the holders of long-term debt issued by UBS AG and its subsidiaries. |
| |
| | We agree to furnish to the SEC upon request, copies of the instruments, including indentures, defining the rights of the holders of our long-term debt and of our subsidiaries’ long-term debt. |
| |
| 4.1 | | Fiscal Agency Agreement dated August 17, 2012 between UBS AG, acting through its Stamford Branch, and U.S. Bank, N.A. (Incorporated by reference to Exhibit 4.2 to UBS AG’s Annual Report on Form 20-F for the fiscal year ended December 31, 2012) |
| |
| 4.2 | | Terms and Conditions of Tier 2 Subordinated Notes of UBS AG due 2023, issued 22 May 2013. |
| |
| 4.3 | | Terms and Conditions of Tier 2 Subordinated Notes of UBS AG due 12 February 2026, issued 13 February 2014. |
| |
| 4.4 | | Non-Prosecution Agreement dated 18 December 2012 between UBS AG and the U.S. Department of Justice, Criminal Division, Fraud Section. (Incorporated by reference to Exhibit 4.3 to UBS AG’s Annual Report on Form 20-F for the fiscal year ended December 31, 2012) |
| |
| 7 | | Statement regarding ratio of earnings to fixed charges. |
| |
| 8 | | Significant Subsidiaries of UBS AG. |
| |
| | Please see Note 30 to the Financial Statements,Interests in subsidiaries and other entities, on pages 481 to 487 of the Annual Report. |
| |
| 12 | | The certifications required by Rule 13(a)-14(a) (17 CFR 240.13a-14(a)) |
| |
| 13 | | The certifications required by Rule 13(a)-14(b) (17 CFR 240.13a-14(b)) and Section 1350 of Chapter 63 of Title 18 of the U.S. Code (18 U.S.C. 1350). |
| |
| 15 | | Consent of Ernst & Young Ltd. |
23
SIGNATURES
The registrant hereby certifies that it meets all of the requirements for filing on Form 20-F and that it has duly caused the undersigned to sign this annual report on its behalf.
| | |
| UBS AG |
|
/s/ Sergio Ermotti |
| Name: Sergio Ermotti |
| Title: Group Chief Executive Officer |
| | |
/s/ Tom Naratil |
| Name: Tom Naratil |
| Title: Group Chief Financial Officer |
March 14, 2014
24
INDEX TO EXHIBITS
| | |
Exhibit
number | | Description |
| |
| 1.1 | | Articles of Association of UBS AG. |
| |
| 1.2 | | Organization Regulations of UBS AG. (Incorporated by reference to UBS AG’s Report of Foreign Private Issuer on Form 6-K filed January 3, 2013) |
| |
| 2(b) | | Instruments defining the rights of the holders of long-term debt issued by UBS AG and its subsidiaries. |
| |
| | We agree to furnish to the SEC upon request, copies of the instruments, including indentures, defining the rights of the holders of our long-term debt and of our subsidiaries’ long-term debt. |
| |
| 4.1 | | Fiscal Agency Agreement dated August 17, 2012 between UBS AG, acting through its Stamford Branch, and U.S. Bank, N.A. (Incorporated by reference to Exhibit 4.2 to UBS AG’s Annual Report on Form 20-F for the fiscal year ended December 31, 2012) |
| |
| 4.2 | | Terms and Conditions of Tier 2 Subordinated Notes of UBS AG due 2023, issued 22 May 2013. |
| |
| 4.3 | | Terms and Conditions of Tier 2 Subordinated Notes of UBS AG due 12 February 2026, issued 13 February 2014. |
| |
| 4.4 | | Non-Prosecution Agreement dated 18 December 2012 between UBS AG and the U.S. Department of Justice, Criminal Division, Fraud Section. (Incorporated by reference to Exhibit 4.3 to UBS AG’s Annual Report on Form 20-F for the fiscal year ended December 31, 2012) |
| |
| 7 | | Statement regarding ratio of earnings to fixed charges. |
| |
| 8 | | Significant Subsidiaries of UBS AG. |
| |
| | Please see Note 30 to the Financial StatementsInterests in subsidiaries and other entities, on pages 481 to 487 of the Annual Report. |
| |
| 12 | | The certifications required by Rule 13(a)-14(a) (17 CFR 240.13a-14(a)) |
| |
| 13 | | The certifications required by Rule 13(a)-14(b) (17 CFR 240.13a-14(b)) and Section 1350 of Chapter 63 of Title 18 of the U.S. Code (18 U.S.C. 1350). |
| |
| 15 | | Consent of Ernst & Young Ltd. |
25
| | | | |

| | | Annual Report 2013 | |

Ourperformance in 2013
Table of Contents
Annual Report 2013
Letter to shareholders
Dear shareholders,
2013 was the first full year of execution following our announcement of the accelerated implementation of our strategy. We made excellent progress thanks to the dedication of our employees, the trust and confidence of our clients, and the support of our shareholders. We accomplished our goals of further adapting our business to better serve clients, reducing risk, delivering more sustainable performance and enhancing shareholder returns. All our businesses were profitable in every quarter, demonstrating that the firm’s model has the flexibility to adapt and perform well in a variety of market conditions. This enabled us to finish a transformational year ahead of the majority of our strategic and financial targets.
The financial strength we have created as a firm is the foundation of our success as it gives us the flexibility to execute our strategy effectively in the new operating environment. Additionally, it reinforces client confidence while allowing us to address the challenges of the past and to absorb unexpected events. During the year, we increased adjusted 1 profit before tax 44% to CHF 4.1 billion. Most importantly, our progress was recognized by our clients, who again entrusted us with more of their assets and business than in the prior year, with our wealth management businesses attracting a combined CHF 54 billion of net new money in 2013 alone, 14% more than in the prior year.
We operate in an environment still characterized by increased and shifting regulation and with markets affected by the turbulence of macroeconomic, geopolitical and unresolved fiscal issues. As a Swiss bank, we are subject to some of the most stringent regulatory requirements in the world. We acted early and decisively to prepare our business for the future with a clear strategy that focused on building and maintaining our industry-leading capital position. During 2013, we enhanced this position, exceeding our own ambitious year-end capital targets. Since we announced our strategy in the second half of 2011, we have more than doubled our fully applied Basel III common equity tier 1 (CET1) ratio from around 6% to 12.8%. We achieved this improvement primarily through steady reductions in fully applied risk-weighted assets (RWA) from around CHF 400 billion to CHF 225 billion at the end of 2013, already meeting our 2015 target. We set a target of a fully applied Basel III CET1 ratio of 13% by the end of 2014, comfortably above the regulatory minimum of 10% by 2019.
We finished 2013 well ahead of our plan to manage down RWA in our Non-core and Legacy Portfolio in Corporate Center, and achieved this in a manner that protected shareholder value. Most of the decline in Group RWA resulted from disposals and other exposure reduction measures in these units. We also continued to successfully deleverage our balance sheet, reducing total assets by over CHF 400 billion since we announced our strategy. Our Basel III funding and liquidity ratios and our Swiss SRB leverage ratio remain comfortably above our regulatory requirements. We implemented firm-wide programs to enhance operational excellence and efficiency, taking gross cost savings measured against the first half of 2011 to CHF 2.2 billion.
Our success enables us to continue delivering on our stated objective of progressive capital returns to shareholders with a recommendation for a 67% increase in dividend to CHF 0.25 per share for 2013. We are confident that we will achieve our target of a fully applied Basel III CET1 ratio of 13% in 2014. After reaching this, we aim for a total payout ratio of at least 50% of our profits.
Our wealth management businesses generated CHF 3.3 billion in adjusted 1 profit before tax in 2013, 25% higher than in the prior year. As the largest and fastest growing large-scale wealth manager in the world 2, we are well positioned to gain from improving macroeconomic conditions, a gradual recovery in interest rates and any consequent improvement in client risk appetite. We were awarded “Best Global Wealth Manager” by Euromoney for the second consecutive year and Private Banker International named us “Outstanding Global Private Bank 2013.” InWealth Management, growth and profitability were led by Asia Pacific, where, in particular, the partnership between Wealth Management and the Investment Bank is a key competitive advantage for us, delivering holistic solutions and attracting new clients. Europe also recorded positive net new money despite cross-border outflows.Wealth Management Americas concluded a record year with the achievement of our ambition of USD 1 billion in adjusted 1 profit before tax for the year. With financial advisors who generate on average USD 1 million in annual revenue, our Wealth Management Americas team has built a business with USD 1 trillion in invested assets. OurRetail & Corporate business in Switzerland delivered stable adjusted 1 profit before tax despite ongoing pressure on net interest margins. The business maintained its
1 Please refer to “Group performance” in the “Financial and operating performance” section for more information on adjusted results. 2 Scorpio Partnership Global Private Banking Benchmark 2013, based on 2012 data for banks with assets under management of over USD 500 billion.
2

Axel A. Weber Chairman of the Board of Directors Sergio P. Ermotti Group Chief Executive Officer
3
Annual Report 2013
Letter to shareholders
market-leading position as average client deposits grew faster than the Swiss economy. Retail & Corporate remains an important source of new business for Wealth Management, Global Asset Management and the Investment Bank. The strong performance of our Retail & Corporate business in our home market was a key factor in Euromoney naming UBS “Best Bank in Switzerland” for the second consecutive year.Global Asset Management delivered an 8% increase in adjusted1 profit before tax and an adjusted1 return on attributed equity of 33%, despite negative net new money. We transformed ourInvestment Bank, enabling it to deliver an excellent performance while operating efficiently with reduced RWA and funded assets. In 2013, the business significantly outperformed its target of an adjusted1 pre-tax return on attributed equity of greater than 15%. We maintained strong positions globally in the key areas where we have decided to compete and serve our clients with best-in-class capabilities. In addition to being recognized as number one in cash equity globally in a leading private survey, our Investment Bank was awarded numerous accolades including Derivatives Intelligence’s “Structured Products House of the Year” and Euroweek’s “ECM Bank of the Year.” In
Corporate Center – Core Functions, we reduced total operating expenses before cost allocations despite recording net restructuring charges that were considerably higher than in 2012 as we pushed ahead with measures to reduce costs for the longer term. InCorporate Center – Non-core and Legacy Portfolio, fully applied RWA decreased by CHF 39 billion to CHF 64 billion, significantly better than our year-end 2013 target of CHF 85 billion.
Our clients increasingly want to use their wealth to drive positive change in society. For a long time, we have been helping them to invest according to sustainable and responsible criteria. Building on this capability, in 2013 we made a significant commitment to maximize these efforts through a dedicated, industry-leading platform. This will deliver comprehensive research, advisory and product capabilities in the areas of sustainable investments and philanthropy. We also initiated and co-launched the Thun Group of Banks’ discussion paper on banking and human rights based on the United Nations’ Guiding Principles on Business and Human Rights in the financial industry. In addition, UBS was named in the Dow Jones Sustainability Indices, which track leading
1 Please refer to “Group performance” in the “Financial and operating performance” section for more information on adjusted results.
4
sustainability-driven companies worldwide. As a firm, we remained focused on educational and entrepreneurship projects globally, including through our employee and community affairs programs. Our clients and employees mobilized to contribute to the Typhoon Haiyan relief efforts in the Philippines. We also maintained our support of the arts through culturally enriching programs for our clients, employees and the public. Highlights included becoming the global partner of Art Basel and the inaugural exhibition in New York of the Guggenheim UBS MAP project, which showcases art from emerging markets. In Switzerland’s capital, UBS sponsored the Bernisches Historisches Museum’s most-visited exhibition ever, featuring the well-known terracotta army of Qin, the first Chinese emperor.
The firm’s success ultimately rests on the achievements of all our employees and the trust placed in us by our clients and shareholders. We would like to thank them for their continued support. We will continue to execute our strategy in a disciplined manner in order to ensure the firm’s long-term success and deliver sustainable returns to our shareholders.
14 March 2014
Yours sincerely,
UBS

| | |
| Axel A. Weber | | Sergio P. Ermotti |
| Chairman of the | | Group Chief Executive Officer |
| Board of Directors | | |
5
Annual Report 2013
UBS key figures
| | | | | | | | | | | | |
| | As of or for the year ended | |
| CHF million, except where indicated | | 31.12.13 | | | 31.12.12 | | | 31.12.11 | |
| | | |
| Group results | | | | | | | | | | | | |
| | | | | | | | | | | | | |
| Operating income | | | 27,732 | | | | 25,423 | | | | 27,788 | |
| | | | | | | | | | | | | |
| Operating expenses | | | 24,461 | | | | 27,216 | | | | 22,482 | |
| | | | | | | | | | | | | |
| Operating profit/(loss) before tax | | | 3,272 | | | | (1,794 | ) | | | 5,307 | |
| | | | | | | | | | | | | |
| Net profit/(loss) attributable to UBS shareholders | | | 3,172 | | | | (2,480 | ) | | | 4,138 | |
| | | | | | | | | | | | | |
| Diluted earnings per share (CHF)1 | | | 0.83 | | | | (0.66 | ) | | | 1.08 | |
| | | | | | | | | | | | | |
| | | |
| Key performance indicators2, balance sheet and capital management, and additional information | | | | | | | | | | | | |
| | | | | | | | | | | | | |
| Performance | | | | | | | | | | | | |
| | | | | | | | | | | | | |
| Return on equity (RoE) (%) | | | 6.7 | | | | (5.1 | ) | | | 9.1 | |
| | | | | | | | | | | | | |
| Return on tangible equity (%)3 | | | 8.0 | | | | 1.6 | | | | 11.9 | |
| | | | | | | | | | | | | |
| Return on risk-weighted assets, gross (%)4 | | | 11.4 | | | | 12.0 | | | | 13.7 | |
| | | | | | | | | | | | | |
| Return on assets, gross (%) | | | 2.5 | | | | 1.9 | | | | 2.1 | |
| | | | | | | | | | | | | |
| Growth | | | | | | | | | | | | |
| | | | | | | | | | | | | |
| Net profit growth (%)5 | | | | | | | | | | | (44.5 | ) |
| | | | | | | | | | | | | |
| Net new money growth (%)6 | | | 1.4 | | | | 1.6 | | | | 1.9 | |
| | | | | | | | | | | | | |
| Efficiency | | | | | | | | | | | | |
| | | | | | | | | | | | | |
| Cost/income ratio (%) | | | 88.0 | | | | 106.6 | | | | 80.7 | |
| | | | | | | | | | | | | |
| Capital strength | | | | | | | | | | | | |
| | | | | | | | | | | | | |
| Common equity tier 1 capital ratio (%, phase-in)7 | | | 18.5 | | | | 15.3 | | | | | |
| | | | | | | | | | | | | |
| Common equity tier 1 capital ratio (%, fully applied)7 | | | 12.8 | | | | 9.8 | | | | | |
| | | | | | | | | | | | | |
| Swiss SRB leverage ratio (%, phase-in)8 | | | 4.7 | | | | 3.6 | | | | | |
| | | | | | | | | | | | | |
| Balance sheet and capital management | | | | | | | | | | | | |
| | | | | | | | | | | | | |
| Total assets | | | 1,009,860 | | | | 1,259,797 | | | | 1,416,962 | |
| | | | | | | | | | | | | |
| Equity attributable to UBS shareholders | | | 48,002 | | | | 45,949 | | | | 48,530 | |
| | | | | | | | | | | | | |
| Total book value per share (CHF)9 | | | 12.74 | | | | 12.26 | | | | 12.95 | |
| | | | | | | | | | | | | |
| Tangible book value per share (CHF)9 | | | 11.07 | | | | 10.54 | | | | 10.36 | |
| | | | | | | | | | | | | |
| Common equity tier 1 capital (phase-in)7 | | | 42,179 | | | | 40,032 | | | | | |
| | | | | | | | | | | | | |
| Common equity tier 1 capital (fully applied)7 | | | 28,908 | | | | 25,182 | | | | | |
| | | | | | | | | | | | | |
| Risk-weighted assets (phase-in)7 | | | 228,557 | | | | 261,800 | | | | | |
| | | | | | | | | | | | | |
| Risk-weighted assets (fully applied)7 | | | 225,153 | | | | 258,113 | | | | | |
| | | | | | | | | | | | | |
| Total capital ratio (%, phase-in)7 | | | 22.2 | | | | 18.9 | | | | | |
| | | | | | | | | | | | | |
| Total capital ratio (%, fully applied)7 | | | 15.4 | | | | 11.4 | | | | | |
| | | | | | | | | | | | | |
| | | |
| Additional information | | | | | | | | | | | | |
| | | | | | | | | | | | | |
| Invested assets (CHF billion)10 | | | 2,390 | | | | 2,230 | | | | 2,088 | |
| | | | | | | | | | | | | |
| Personnel (full-time equivalents) | | | 60,205 | | | | 62,628 | | | | 64,820 | |
| | | | | | | | | | | | | |
| Market capitalization9 | | | 65,007 | | | | 54,729 | | | | 42,843 | |
| | | | | | | | | | | | | |
1 Refer to “Note 9 Earnings per share (EPS) and shares outstanding” in the “Financial information” section of this report for more information. 2 For the definitions of our key performance indicators, refer to the “Measurement of performance” section of this report. 3 Net profit/loss attributable to UBS shareholders before amortization and impairment of goodwill and intangible assets (annualized as applicable)/average equity attributable to UBS shareholders less average goodwill and intangible assets. 4 Based on Basel III risk-weighted assets (phase-in) for 2013. Based on Basel 2.5 risk-weighted assets for 2012. Based on Basel II risk-weighted assets for 2011. 5 Not meaningful and not included if either the reporting period or the comparison period is a loss period. 6 Group net new money includes net new money for Retail & Corporate and excludes interest and dividend income. 7 Based on the Basel III framework as applicable for Swiss systemically relevant banks (SRB). Numbers for 31 December 2012 are on a pro-forma basis. Refer to the “Capital management” section of this report for more information. 8 Refer to the “Capital management” section of this report for more information. 9 Refer to “UBS shares” in the “Capital management” section of this report for more information. 10 Group invested assets includes invested assets for Retail & Corporate.
6
Corporate information
| | | | | | |
| The legal and commercial name of the company is UBS AG. The company was formed on 29 June 1998, when Union Bank of Switzerland (founded 1862) and Swiss Bank Corporation (founded 1872) merged to form UBS AG. | | | | UBS AG is incorporated and domiciled in Switzerland and operates under the Swiss Code of Obligations and Swiss Federal Banking Law as an Aktiengesellschaft, a corporation that has issued shares of common stock to investors. | | The addresses and telephone numbers of our two registered offices are: Bahnhofstrasse 45, CH-8001 Zurich, Switzerland, phone +41-44-234 11 11; and Aeschenvorstadt 1, CH-4051 Basel, Switzerland, phone +41-61-288 50 50. UBS AG shares are currently listed on the SIX Swiss Exchange and the New York Stock Exchange. |
|
Contacts |
Switchboards For all general queries. Zurich +41-44-234 1111 London +44-20-7568 0000 New York +1-212-821 3000 Hong Kong +852-2971 8888 www.ubs.com/contact Investor Relations UBS’s Investor Relations team supports institutional, professional and individual investors from our offices in Zurich and New York. UBS AG, Investor Relations, P.O. Box, CH-8098 Zurich, Switzerland investorrelations@ubs.com www.ubs.com/investors Hotline +41-44-234 4100 New York +1-212-882 5734 Fax (Zurich) +41-44-234 3415 | | | | Media Relations UBS’s Media Relations team supports global media
and journalists from offices in Zurich, London,
New York and Hong Kong. www.ubs.com/media Zurich +41-44-234 8500 mediarelations@ubs.com London +44-20-7567 4714 ubs-media-relations@ubs.com New York +1-212-882 5857 mediarelations-ny@ubs.com Hong Kong +852-2971 8200 sh-mediarelations-ap@ubs.com Office of the Company Secretary The Company Secretary receives queries on compensation and related issues addressed to members of the Board of Directors. UBS AG, Office of the Company Secretary, P.O. Box, CH-8098 Zurich, Switzerland sh-company-secretary@ubs.com Hotline +41-44-235 6652 Fax +41-44-235 8220 | | Shareholder Services UBS’s Shareholder Services team, a unit of the Company Secretary office, is responsible for the registration of the global registered shares. UBS AG, Shareholder Services, P.O. Box, CH-8098 Zurich, Switzerland sh-shareholder-services@ubs.com Hotline +41-44-235 6652 Fax +41-44-235 8220 US Transfer Agent For all global registered share-related queries in the US. Computershare, P.O. Box 43006, Providence, RI 02940-3006, USA Shareholder online inquiries: https://www-us.computershare.com/investor/ Contact Shareholder website: www.computershare.com/investor Calls from the US +1 866-541 9689 Calls from outside the US +1-201-680 6578 Fax +1-201-680 4675 |
| | | | |
| | | | |
| | | | |
| | | | |
| | | | |
| | | | |
| | | | |
| | | | |
| | | | |
| | | | |
| | | | |
| | | | |
| | | | |
| | | | |
| | | | |
| | | | |
| | | | |
| | | | |
| | | | |
| | |
| Corporate calendar | | | | Imprint |
Publication of the first quarter 2014 report Tuesday, 6 May 2014 Annual General Meeting of Shareholders Wednesday, 7 May 2014 Publication of the second quarter 2014 report Tuesday, 29 July 2014 Publication of the third quarter 2014 report Tuesday, 28 October 2014 | | | | Publisher: UBS AG, Zurich and Basel, Switzerland | www.ubs.com Language: English | SAP-No. 80531E © UBS 2014. The key symbol and UBS are among the registered and unregistered trademarks of UBS. All rights reserved. Printed in Switzerland on chlorine-free paper with mineral oil-reduced inks. Paper production from socially responsible and ecologically sound forestry practices. 
|
| | | |
| | | |
| | | |
7
Annual Report 2013
UBS and its businesses
We draw on our over 150-year heritage to serve private, institutional and corporate clients worldwide, as well as retail clients in Switzerland. Our business strategy is centered on our pre-eminent global wealth management businesses and our leading universal bank in Switzerland, complemented by our Global Asset Management business and our Investment Bank, with a focus on capital efficiency and businesses that offer a superior structural growth and profitability outlook. Headquartered in Zurich and Basel, Switzerland, we have offices in more than 50 countries, including all major financial centers, and approximately 60,000 employees. UBS AG is the parent company of the UBS Group (Group). Under Swiss company law, UBS AG is organized as an Aktiengesellschaft, a corporation that has issued shares of common stock to investors. The operational structure of the Group comprises the Corporate Center and five business divisions: Wealth Management, Wealth Management Americas, Retail & Corporate, Global Asset Management and the Investment Bank.
Wealth Management provides comprehensive financial services to wealthy private clients around the world – except those served by Wealth Management Americas. Its clients benefit from the entire spectrum of UBS resources, ranging from investment management to estate planning and corporate finance advice, in addition to specific wealth management products and services.
Wealth Management Americas provides advice-based solutions and banking services through financial advisors who deliver a fully integrated set of products and services specifically designed to address the needs of ultra high net worth and high net worth individuals
and families. It includes the domestic US business, the domestic Canadian business and international business booked in the US.
Retail & Corporate maintains a leading position across retail, corporate and institutional client segments in Switzerland and constitutes a central building block of UBS Switzerland’s pre-eminent universal bank model. It provides comprehensive financial products and services embedded in a true multi-channel experience, offering clients convenient access. It continues to enhance the range of life-cycle products and services offered to clients, while pursuing additional growth in advisory and execution services.
8
Global Asset Management is a large-scale asset manager with diversified businesses across investment capabilities, regions and distribution channels. It offers investment capabilities and styles across all major traditional and alternative asset classes including equities, fixed income, currencies, hedge funds, real estate, infrastructure and private equity that can also be combined into multi-asset strategies. The fund services unit provides professional services including fund set-up, accounting and reporting for both traditional investment funds and alternative funds.
TheInvestment Bank provides corporate, institutional and wealth management clients with expert advice, innovative financial solutions, outstanding execution and comprehensive access to the world’s capital markets. It offers financial advisory and capital markets, research, equities, foreign exchange, precious metals and tailored fixed income services in rates and credit through its two business units, Corporate Client Solutions and Investor Client Services. The Investment Bank is an active participant in capital markets flow activities, including sales, trading and market-making across a range of securities.
TheCorporate Center comprises Corporate Center – Core Functions and Corporate Center – Non-core and Legacy Portfolio. Corporate Center – Core Functions provides Group-wide control functions including finance, risk control (including compliance) and legal. In addition, it provides all logistics and support functions, including operations, information technology, human resources, corporate development, regulatory relations and strategic initiatives, communications and branding, corporate real estate and administrative services, procurement, physical security, information security, offshoring and treasury services such as funding, balance sheet and capital management. Corporate Center – Core Functions allocates most of its treasury income, operating expenses and personnel associated with the abovementioned activities to the businesses based on capital and service consumption levels. Corporate Center – Non-core and Legacy Portfolio comprises the non-core businesses and legacy positions previously part of the Investment Bank.
9
Annual Report 2013
Our Board of Directors

The Board of Directors (BoD), under the leadership of the Chairman, decides on the strategy of the UBS Group upon recommendation of the Group Chief Executive Officer (Group CEO), exercises ultimate supervision over senior management, and appoints Group Executive Board (GEB) members. The BoD also approves all financial statements for issue. Shareholders elect each member of the BoD, which in turn appoints its Chairman, Vice Chairmen, Senior Independent Director, members of BoD committees, their respective Chairpersons and the Company Secretary. In 2013, our BoD met the standards of the Organization Regulations for the percentage of directors that are considered independent.
10

1 Axel A. Weber Chairman of the Board of Directors/Chairperson of the Corporate Responsibility Committee/Chairperson of the Governance and Nominating Committee 2 William G.Parrett Chairperson of the Audit Committee/member of the Corporate Responsibility Committee 3 Reto Francioni Member of the Corporate Responsibility Committee 4 Isabelle Romy Member of the Audit Committee/member of the Governance and Nominating Committee 5 Ann F. Godbehere Chairperson of the Human Resources and Compensation Committee/member of the Audit Committee 6 Beatrice Weder di Mauro Member of the Audit Committee/member of the Risk Committee 7 Rainer-Marc Frey Member of the Human Resources and Compensation Committee/member of the Risk Committee 8 Joseph Yam Member of the Corporate Responsibility Committee/member of the Risk Committee 9 Axel P. Lehmann Member of the Risk Committee 10 Helmut Panke Member of the Human Resources and Compensation Committee/member of the Risk Committee 11 David Sidwell Senior Independent Director/Chairperson of the Risk Committee/member of the Governance and Nominating Committee 12 Michel Demaré Independent Vice Chairman/member of the Audit Committee/member of the Governance and Nominating Committee/member of the Human Resources and Compensation Committee
11
Annual Report 2013
Our Group Executive Board

The management of the business is delegated by the Board of Directors to the Group Executive Board. Under the leadership of the Group Chief Executive Officer, the Group Executive Board has executive management responsibility for the UBS Group and its businesses. It assumes overall responsibility for the development of the Group and business division strategies and the implementation of approved strategies.
12

| | è | | To read the full biographies of our Board members, visit www.ubs.com/geb or refer to “Group Executive Board” in the “Corporate governance” section of this report |
1 Sergio P. Ermotti Group Chief Executive Officer 2 Lukas Gähwiler CEO UBS Switzerland and CEO Retail & Corporate 3 Markus U. Diethelm Group General Counsel 4 Philip J. Lofts Group Chief Risk Officer 5 Tom Naratil Group CFO and Group Chief Operating Officer 6 Andrea Orcel CEO Investment Bank 7 Robert J. McCann CEO Wealth Management Americas and CEO UBS Group Americas 8 Chi-Won Yoon CEO UBS Group Asia Pacific 9 Jürg Zeltner CEO UBS Wealth Management 10 Ulrich Körner CEO Global Asset Management and CEO UBS Group Europe, Middle East and Africa
All titles presented are as of 1 January 2014.
13
Annual Report 2013
The making of UBS
UBS has played a pivotal role in the development and growth of Switzerland’s banking tradition since the firm’s origins in the mid-19th century. In 2012, the year of our 150th anniversary, we accelerated our strategic transformation of the firm to create a business model that is better adapted to the new regulatory and market circumstances and that we believe will result in more consistent and high-quality returns. In 2013, we made substantial progress in transforming our firm, further reinforcing its foundations while focusing on our traditional strengths.
The origins of the banking industry in Switzerland can be traced back to medieval times. This long history may help explain the widespread impression, reinforced in popular fiction, that Switzerland has always possessed a strong financial sector. In reality, the size and international reach of the Swiss banking sector we know today is largely a product of the second half of the 20th century, strongly influenced by two banks:
Union Bank of Switzerland and Swiss Bank Corporation (SBC), which merged to form UBS in 1998.
At the time of the merger, both banks were already well-established and successful in their own right. Union Bank of Switzerland celebrated its 100th anniversary in 1962, tracing its origins back to the Bank in Winterthur. SBC marked its centenary in 1972 with celebrations in honor of its founding forebear, the Basler Bankverein. The historical roots of PaineWebber, acquired by UBS in
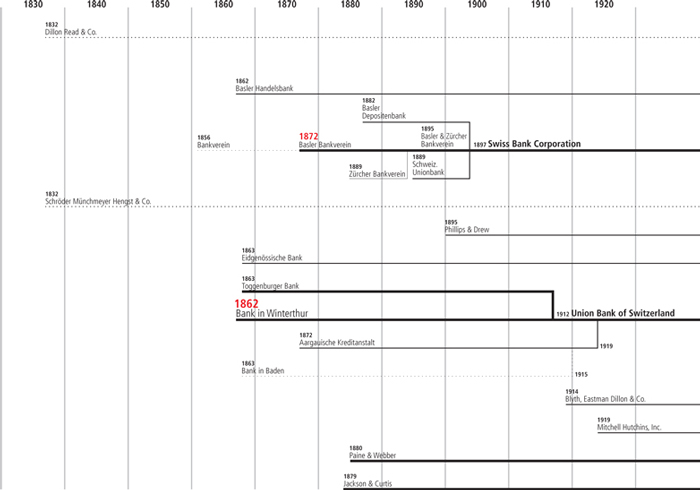
14
2000, go back to 1879, while S.G. Warburg, the central pillar upon which UBS’s Investment Bank was built, commenced operations in 1946.
In the early 1990s, SBC and Union Bank of Switzerland were both commercial banks operating mainly out of Switzerland. The banks shared a similar vision: to become a world leader in wealth management, a successful global investment bank and a top-tier global asset manager, while remaining an important commercial and retail bank in their home market of Switzerland.
Union Bank of Switzerland, the largest and best-capitalized Swiss bank of its time, pursued these goals primarily through a strategy of organic growth. In contrast, SBC, then the third-largest Swiss bank, grew through a combination of partnership and acquisition. In 1989, SBC started a joint venture with O’Connor, a leading US derivatives firm noted for its dynamic and innovative culture, its meritocracy and its team-oriented approach. O’Connor brought state-of-the-art risk management and derivatives
technology to SBC, and in 1992 SBC moved to fully acquire O’Connor. In 1994, SBC added to its capabilities when it acquired Brinson Partners, a leading US-based institutional asset management firm.
The next major milestone was in 1995, when SBC acquired S.G. Warburg, the British merchant bank. The deal helped SBC fill a strategic gap in its corporate finance, brokerage, and research capabilities and, most importantly, brought with it an institutional client franchise that remains crucial to our equities business to this day.
The 1998 merger of SBC and Union Bank of Switzerland into the firm we know today created a world-class wealth manager and the largest universal bank in Switzerland, complemented by a strong investment bank and a leading global institutional asset manager. In 2000, UBS grew further with the acquisition of PaineWebber, establishing the firm as a significant player in the US. UBS has established a strong footprint in the Asia Pacific
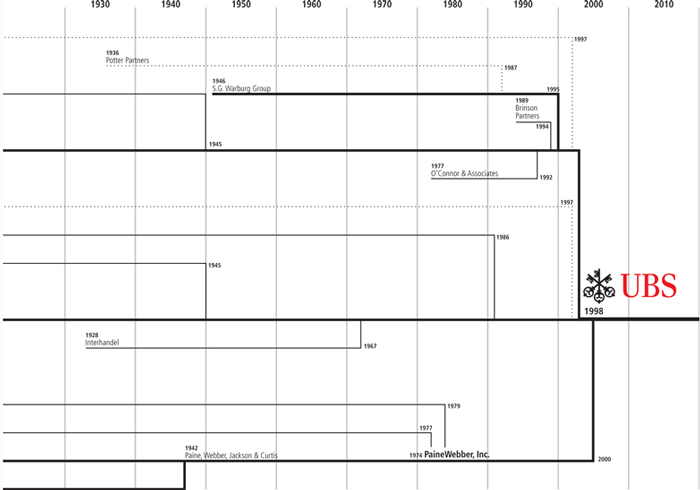
15
Annual Report 2013
region and emerging markets based on a presence in many of these countries going back decades.
In 2007, the effects of the global financial crisis started to be felt across the financial industry. This crisis had its origins in the securitized financial product business linked to the US residential real estate market. Between the third quarter of 2007 and the fourth quarter of 2009, we incurred significant losses on these assets. We responded with decisive action designed to reduce risk exposures and stabilize our businesses, including raising capital on multiple occasions.
More recently, we continued to improve the firm’s capital strength to meet new and enhanced industry-wide regulatory requirements. Our position as one of the world’s best-capitalized
banks, together with our stable funding and sound liquidity positions, provides us with a solid foundation for our success. In 2012, we announced a significant acceleration in the implementation of our strategy communicated a year earlier. In 2013, we continued to focus our activities on a set of highly synergistic, less capital- and balance sheet-intensive businesses dedicated to serving clients and well-positioned to maximize value for shareholders.
| | è | | Refer to www.ubs.com/history for more information on UBS’s more than 150 years of history |
16
Operating
environment
and strategy
Operating environment and strategy
Current market climate and industry drivers
Current market climate and industry drivers
While the overall global economic climate improved in 2013, the operating environment for the financial services industry remained difficult. Profitability was affected by continued regulatory pressure, the ongoing low interest rate environment and muted client activity levels.
Global economic and market climate
The global economic climate improved in 2013, although the pace of recovery diverged across regions. Of the major economies, recovery was most advanced in the US. Growth momentum in the euro area remained lackluster, despite the region’s exit from recession in the second quarter of 2013. In Japan, significant monetary policy stimulus and the government’s so-called “three-arrow” strategy boosted confidence in the country’s economic prospects. The gradual improvement in advanced economies was, however, counterbalanced by a slowdown in emerging economies.
Central banks in advanced countries kept monetary policy conditions highly accommodative as their economies continued to struggle with headwinds from fiscal consolidation and fragile financial sectors. However, concerns about the timing and speed of the exit by the Federal Reserve System (Fed) from its highly accommodative monetary policy led to a sharp rise in US bond yields and heightened market volatility during the summer months. Against the backdrop of strong correlations between European and US bond yields, European long-term interest rates also moved higher. Increases in long-term rates prompted the European Central Bank (ECB) and the Bank of England to announce “forward guidance” as an additional means of maintaining accommodative policy stances. Improving fundamentals in the US and expectations of the Fed “tapering” its quantitative easing led to financial outflows and currency depreciation in various emerging economies. Market concerns were further exacerbated by worries about a potential slowdown in China. Global markets subsequently stabilized after the Fed postponed its “taper” decision in September. Even so, currencies and fixed income markets in emerging countries with weak fundamentals remained under pressure.
The US economic recovery, supported by the Fed’s accommodative policy, became more broad-based, reflected by better data on the housing market, credit standards, labor markets and consumer confidence. Improved market sentiment resulted in a rebalancing of portfolios towards riskier assets. US equity market indices recorded substantial gains during the year, spreads between corporate bonds and government bonds narrowed, and corporate debt issuance reached record levels. Disruptions related to another fiscal policy impasse in the autumn were a cause of market volatility, but the bi-partisan budget agreed in December reduced fiscal uncertainty for 2014.
Based on broadly improving fundamentals, in December the Fed announced a “tapering” of quantitative easing starting in January 2014.
Euro area financial stress continued to recede during 2013 against the backdrop of the ECB’s Outright Monetary Transactions (OMT) program and the establishment of the European Stability Mechanism. Debt markets in vulnerable euro area countries continued their post-OMT improvements despite a temporary disruption during the summer. Ireland successfully exited the adjustment program of the Troika (made up of the European Commission (EC), the ECB and the International Monetary Fund) as of year-end and re-established full market access. Portugal appeared more vulnerable throughout the year, but its situation stabilized towards year-end. The economic environment in Greece, while still much more challenging than elsewhere, also showed tentative signs of improvement during the year.
Although the euro area exited recession in the second quarter of 2013, recovery remained lackluster. Unemployment levels in distressed countries remained close to record highs, albeit with lower unit labor costs leading to improvements in competitiveness. Fiscal targets became more flexible as the EC agreed to extend the deadlines for correcting excessive deficits in some countries. A subdued inflation outlook led the ECB to announce historically unprecedented “forward guidance” and to reduce key ECB interest rates to all-time lows. Housing market conditions varied significantly between countries, and prices continued to decline in some distressed economies. However, the ongoing low interest rate environment and rising disposable income provided a boost to property prices in Germany. The Swiss economy continued to outperform most European peers, but highly accommodative monetary policy caused concerns about the country’s ongoing property boom.
Growth in emerging economies disappointed throughout the year as credit-led expansions slowed and capital inflows receded or reversed. China recorded its slowest pace of growth since the turn of the millennium as authorities attempted to rein in rapid credit growth and rebalance the country’s economic growth model. A spike in interbank lending rates in June led to fears of a sharper slowdown in growth, although intervention from the People’s Bank of China ensured major financial distress was avoided. Among the other major emerging market economies, Brazil, India, Indonesia, South Africa and Turkey were all beset by currency weakness following capital outflows stemming from expectations of tighter Fed policy. The associated higher funding costs
18
|
Operating environment and strategy |
|
|
and uncertainty impeded growth in more vulnerable emerging economies.
Economic and market outlook for 2014
Our economists currently expect global economic growth to accelerate to 3.4% in 2014 from 2.5% in 2013. The pick-up in growth during 2014 is expected to be driven by acceleration in advanced economies, supported by still-accommodative monetary policy and reduced fiscal drag. The US economy is expected to grow more strongly at about 3%, while the euro area should recover at a moderate pace, with growth forecasted at 1.1%. The Swiss economy will benefit from the recovery in the euro area and is expected to grow at about 2.1%.
For emerging economies, improved global growth should support external demand, but domestic demand is expected to be restrained by the lack of fresh reforms, credit overhangs and ongoing structural rebalancing. Emerging economies with weaker fundamentals, including a heavy reliance on short-term foreign capital inflows, remain vulnerable to changing Fed policy and rising global interest rates.
Potential sources of economic or market risks include a normalization of the Fed’s monetary policy, geopolitical risks in the Ukraine, the Middle East and Far East, and a deceleration of growth in China. While sovereign financial pressures in the euro-zone have receded, a slowing of reform momentum, political opposition to euro area integration and uncertainty over the ECB’s comprehensive bank assessment remain further potential sources of risk.
Industry drivers
Despite strong stock market performance throughout the year, the operating environment for the financial services industry remained difficult, reflecting a combination of regulatory framework adjustments requiring further structural changes, and a challenging market environment putting pressure on revenues.
Regulatory developments remain a key driver of structural change in the industry
Regulators and legislators continued to exert pressure on the financial services industry to become simpler, more transparent and more resilient. In this context, regulators and legislators in Europe further advanced far-reaching reform proposals – for example, agreements were reached on the Markets in Financial Instruments Directive (MiFID) II and the Bank Recovery and Resolution Directive – while in the US the Commodity Futures Trading Commission approved cross-border guidance, defining the extraterritorial application of its swaps regulations, and the five US financial regulators approved the Volcker Rule.
The year was also characterized by regulatory authorities’ focus on reforming banks’ structures. In Germany, France, the UK
and the US, progress was made on legislation requiring, under certain conditions, a structural separation or prohibition of certain trading or wholesale activities from certain deposit-taking operations. While it is unclear how these individual measures in the European Union (EU) would ultimately interact with the recent EC proposed regulation on “Structural measures improving the resilience of EU credit institutions,” these national regulatory initiatives highlight the lack of international coordination with regard to structural developments in the banking sector.
Last but not least, reflecting their concerns about the adequacy of banks’ risk-based exposures, regulatory authorities weighed the introduction of more stringent leverage ratio requirements as a credible supplementary measure to risk-based capital requirements.
As a consequence of the evolving regulatory environment, some facets of which have been outlined above, financial institutions are expected to (i) rethink their strategies and focus even more on their core business and markets, in which they are able to leverage their competitive advantages on a sustainable basis, on both a local and to a certain extent a global level, (ii) focus even more on fee-generating businesses that require less capital and funding and (iii) reduce their “buy-and-hold” activities, leading to a further increase in assets held outside the banking system, in turn giving rise to a call to further strengthen regulatory oversight of these sectors.
Bank capital and balance sheets stay in the spotlight
In the course of 2013, the financial services industry succeeded in further improving its capital position with a view to complying with capital requirements defined by regulators and policy makers. For example, the EU-wide Transparency Exercise led by the European Banking Authority showed a continued improvement of the capital position within the EU banking sector in 2013. Similar trends were also observable in Switzerland for the largest banks, as well as in the US. Despite such positive developments, banks’ capitalization levels remained a key concern for the public as well as regulators, as evidenced by the intense debate about leverage ratios as a supplementary measure to risk-based capital requirements.
As a step to further increase trust in the European banking sector, the ECB initiated a comprehensive review of European banks’ balance sheets and risk profiles. The assessment will consist of three elements: (i) a supervisory risk assessment which reviews on a quantitative and qualitative basis key risks, including liquidity, leverage and funding, (ii) an asset quality review to enhance transparency of banks’ exposures by reviewing their asset quality, including the adequacy of asset and collateral valuation and related provisions and (iii) a stress test to examine the resilience of banks’ balance sheets to stress scenarios. In such a review, banks will be judged against a capital threshold of 8% based on Capital Requirements Directive IV definitions as of 1 January 2014. If results are unsatisfactory, corrective measures, such as recapitalization, deleveraging or improving funding resilience, may be taken.
Operating environment and strategy
Current market climate and industry drivers
Increased focus on costs to compensate for subdued revenues
2013 remained a challenging year for the financial services industry to grow its income levels. Aside from growth constraints due to stricter regulatory requirements – especially related to capital and liquidity standards – the macroeconomic environment, characterized by the ongoing low interest rate environment and a flat yield curve as well as muted client activity levels in the face of continued macroeconomic uncertainty (in particular around monetary stimulus reduction in the US), put pressure on net interest margins and revenues.
As a result of this subdued revenue environment, banks intensified their efforts to increase operational efficiency, either by enhancing targets of existing cost reduction programs or by launching new initiatives in order to realign cost structures with subdued revenue levels.
Technological innovation opening new opportunities
While new technologies have already significantly affected various sectors, pressure on the financial services industry to adapt to a new digital reality continued to increase, reflecting inter alia evolving client expectations, the need for increased efficiencies, accelerating technological innovation and the emergence of new competitors.
Changing client expectations (in particular related to personalization, convenience and transparency), based on levels of service and flexibility experienced in other sectors, presented a significant challenge to the traditional business model of the financial services industry. Although investments will be required to fully address these expectations, technology is also expected to be a key enabler in offering new, innovative banking services, satisfying new customer expectations on one hand and supporting branches and client advisors on the other. Digital capabilities are therefore expected not only to deepen individual customer relationships, but also to facilitate a reduction of operating expenses and complexity through automating systems and processes.
20
|
Operating environment and strategy |
|
|
Regulatory and legal developments
In 2013 and early 2014, several important international regulatory and legal initiatives advanced, with key developments including political agreement in the European Union on the Markets in Financial Instruments Directive (MiFID) II and the Bank Recovery and Resolution Directive, as well as the publication of final regulations implementing the Volcker Rule and enhanced prudential standards for banking organizations in the US.
Developments in Switzerland
During the fourth quarter of 2013 and January of 2014, UBS and the Swiss Financial Market Supervisory Authority (FINMA) reviewed the temporary operational risk-related risk-weighted assets (RWA) add-on that became effective on 1 October 2013. Following a review of the advanced measurement approach (AMA) model, the litigation exposures and contingent liabilities of UBS, provisioning movements and methodologies, and progress on managing other operational risks, UBS and FINMA mutually agreed that, effective on 31 December 2013, a supplemental analysis will be used to calculate the incremental operational risk capital required to be held for litigation, regulatory and similar matters and other contingent liabilities. The incremental RWA calculated based upon this supplemental analysis has replaced the temporary operational RWA add-on discussed in our report for the third quarter of 2013, and is reflected in the 31 December 2013 RWA and capital ratio information in this report. The incremental RWA calculated based upon this supplemental analysis as of 31 December 2013 was CHF 22.5 billion.
On 20 December 2013, FINMA issued a decree primarily concerning the regulatory capital requirements of UBS AG (Parent Bank) on a standalone basis. The decree makes changes effective 1 January 2014 to parent bank capital requirements designed to ensure that the capital underpinning of the parent’s investments in subsidiaries does not cause a de facto increase in the total capital requirements of UBS Group. The decree also requires certain additional disclosures concerning parent bank capital standards that will be included in our report for the first quarter of 2014.
On 22 January 2014, following a proposal by the Swiss National Bank (SNB), the Swiss Federal Council decided to increase the countercyclical capital buffer in the form of common equity tier 1 (CET1) capital from 1% to 2% of risk-weighted positions secured by residential property located in Switzerland. Banks are obliged to comply as of 30 June 2014. Other loans, in particular those provided to corporates, are not affected by this measure. The effect of the increase of the countercyclical buffer on our capital requirements is not material.
In a referendum in March 2013, the Swiss cantons and voters accepted an initiative to give shareholders of Swiss listed companies more influence over board and management compensation (Minder Initiative). In November 2013, the Swiss Federal Council issued the final transitional ordinance implementing the constitutional
amendments of this initiative, which came into force on 1 January 2014. The ordinance requires public companies to specify in their articles of association (AoA) the mechanism of a “say-on-pay” vote, setting out three requirements: (i) the vote on compensation must be held annually, (ii) the vote on compensation must be binding rather than advisory and (iii) the vote on compensation must be held separately for the board of directors and members of the executive board. In addition, shareholders will need to determine the details of the “say-on-pay” vote in the AoA, in particular the nature of the vote, timing aspects and the consequences of a “no” vote. Each company affected by the Minder Initiative must undertake a first binding vote on management compensation and remuneration of the board of directors at its 2015 annual general meeting (AGM), in accordance with the “say-on-pay” regime provided for in the AoA. In addition, the first compensation report pursuant to the ordinance must be prepared for financial year 2014 and made available to shareholders at the 2015 AGM. UBS is currently in the process of implementing these requirements.
The Federal Department of Finance took further steps towards establishing a new Financial Services Act (FIDLEG). FIDLEG’s main objectives include improving client protection, establishing a level playing field and eliminating competitive distortions between service providers. In this context, FIDLEG is expected to address a number of regulations such as information obligations, requirements regarding conduct and organization of financial service providers and the expansion of supervision, for example, to independent asset managers. In addition, FIDLEG also seeks to harmonize Swiss financial market law with the applicable international standards, such as the Markets in Financial Instruments Directive (MiFID) II, in order to facilitate European Union (EU) market access for Swiss financial institutions. The proposed financial services regulation will affect almost all financial market participants, including UBS. However, given the early stages of the discussion, a definite assessment is currently not possible.
The Financial Market Infrastructure Act, which was published for consultation in December 2013 by the Swiss Federal Government, governs the organization and operation of financial market infrastructure, including implementation of over-the-counter derivatives regulation in Switzerland and additional regulation of multilateral trading facilities and other non-regulated exchange trading venues. Another important development was the implementation of the Foreign Account Tax Compliance Act (FATCA) in Switzerland. FATCA was introduced by the US government in
Operating environment and strategy
Regulatory and legal developments
2010 in order to increase the transparency of investments by US taxpayers outside the US, and requires financial institutions worldwide to report US tax persons’ account information to the US Internal Revenue Service (IRS). Switzerland and the US signed an intergovernmental agreement in February 2013 concerning the implementation of FATCA in Switzerland. This agreement and the implementation of the corresponding FATCA law were subsequently approved by the two chambers of the Swiss Parliament in June and September 2013, respectively. Both the FATCA agreement and the implementing act are scheduled to come into force in the first half of 2014. As the FATCA legislation adopted in the US strongly affects UBS, we are closely monitoring any further refinements made by the IRS as well as developments relating to FATCA in the jurisdictions relevant to UBS and making the necessary preparations for possible implementation.
Further, in Switzerland, the political discussion continued on the structural reform of banks and leverage ratio requirements. In September 2013, the Swiss National Council approved two motions from the year 2011 asking for a mandatory structural reform of banks. After a hearing in January 2014, the Committee for Economic Affairs and Taxation of the Swiss Council of States recommended that these motions be rejected. On 12 March 2014, the Council of States rejected the two motions. Subsequently, they were automatically discarded. Also in September 2013, two new motions were put forward that not only require structural measures but also suggest increasing leverage ratio requirements in Switzerland to 6% and 10%, respectively. However, it is currently unclear if and when the two motions are to be submitted to the parliamentary committee in charge.
Swiss “too-big-to-fail” (TBTF) requirements require systemically important banks, including UBS, to put in place viable emergency plans to continue providing systemically important functions despite a failure, to the extent that such activities are not sufficiently separated in advance. The Swiss TBTF law provides for the possibility of a limited reduction of capital requirements for systemically important institutions that adopt measures to reduce resolvability risk beyond what is legally required. In view of these factors, UBS intends to establish a new banking subsidiary of UBS AG in Switzerland. The scope of this potential future subsidiary’s business is still being determined, but we would currently expect it to include our Retail & Corporate business division and likely the Swiss-booked business within our Wealth Management business division. We expect to implement this change in a phased approach starting in mid-2015. This structural change is being discussed on an ongoing basis with FINMA, and remains subject to a number of uncertainties that may affect its feasibility, scope or timing.
Finally, the Swiss-UK tax agreement, which came into effect on 1 January 2013, included a clause stipulating that, should gross tax receipts under the agreement be lower than CHF 1.3 billion, Swiss banks would cover the difference up to a maximum of CHF 500 million. Based on monitoring by the Swiss Bankers Association, it is considered unlikely that CHF 1.3 billion in tax receipts will be received. As a result, we expect to be required to pay CHF 110 million,
and have established a provision in that amount in 2013, which has been allocated predominantly to Wealth Management.
Developments in a number of key initiatives in the European Union
In the course of 2013 and early 2014, agreement was reached on a number of far-reaching regulatory reform initiatives in the EU. One of the most important developments was the agreement on the review of the Markets in Financial Instruments Directive and Regulation package (MiFID II/MiFIR). This package introduces a wide set of reforms, including in respect of third-country access to European Economic Area (EEA) markets, new rules regarding market infrastructure and a sharpened set of investor protection rules.
A further political compromise reached by the European Parliament and the Council of the EU related to the Bank Recovery and Resolution Directive (BRRD). This Directive seeks to achieve a harmonized approach to the recovery and resolution of banks in the EU and broadly covers measures relating to recovery and resolution planning, early intervention powers for authorities and resolution tools should a bank fail or be deemed likely to fail. Final approval of the BRRD is expected in the first quarter of 2014, with the majority of the Directive expected to become applicable from 1 January 2015. UBS’s EU subsidiaries will be subject to the requirements of the Directive, while EU member states have the right to apply the provisions of the Directive to UBS’s EU-based branches in certain circumstances. The overall impact is difficult to assess at this stage, as the EU resolution authorities have a material degree of discretion in setting some of the key requirements of the Directive.
In response to regulatory developments, the business and operating model of UBS Limited, our UK bank subsidiary, and its relationship with UBS AG, are currently being reviewed. Once this review has been finalized, we expect to commence implementation of a revised business and operating model, including changes to its risk profile, which will involve the subsidiary retaining credit risk, and some market risk which currently is transferred to UBS AG under the existing model.
Eleven member states of the EU committed to the implementation of the financial transaction tax via an “enhanced cooperation” procedure. In February 2013, the European Commission (EC) issued a proposal, which is currently being discussed in the EU Council of Ministers. While only the participating countries – namely France, Germany, Austria, Belgium, Greece, Portugal, Slovenia, Italy, Spain, Slovakia and Estonia – are entitled to vote on and would themselves adopt the tax, its extraterritorial scope would affect financial institutions and transactions in all 27 EU member states and beyond. Under the initial EC proposal, the tax would apply to a wide range of financial transactions and minimum rates of 0.1% (securities) and 0.01% (derivatives) would be applicable to both parties of a transaction. The final rates implemented in each of the participating countries could, however, differ. Based on the initial proposal, UBS would be affected by the
|
Operating environment and strategy |
|
|
tax when transacting with, or on behalf of, clients from participating countries or when performing transactions in financial instruments issued in such countries. The proposal requires operational implementation on a global level and could negatively affect the profitability of certain products. However, ongoing negotiations may alter the territorial application, scope and collection mechanism of the tax and it remains unclear when a political agreement can be expected.
Progress was also made in 2013 towards establishing automatic information exchange in taxation as a new standard, both at European level and internationally. Most notably, global automatic information exchange was endorsed as a global standard by the G20 Summit in September 2013. At EU level, the EC proposed in June 2013 to extend the automatic information exchange within the EU to cover all forms of financial income and account balances. Under the proposal, dividends, capital gains, all other forms of financial income and account balances would be added to the list of categories which are subject to automatic information exchange within the EU from 1 January 2015. However, member states reached no agreement in 2013 on the final text of the second piece of EU legislation on automatic information exchange, the revised EU Savings Tax Directive. In parallel, negotiations started with third countries and the EC on the revision of the existing taxation agreements (including Switzerland).
With regard to the establishment of the Banking Union, agreement was reached on the Single Supervisory Mechanism (SSM), which sets out the supervisory arrangements for affected banks and the respective responsibilities of the European Central Bank (ECB) and competent national authorities. Under the SSM, banks deemed systemically important will from November 2014 be subject to direct ECB supervision in relation to capital and liquidity, while less significant banks will continue to be supervised by their current national supervisors. A further element of the Banking Union is the Single Resolution Mechanism (SRM), which will apply the substantive provisions of the BRRD to banks within the Banking Union. Both the European Parliament and the Council of the EU have agreed their negotiating positions and discussions between them are ongoing.
Separately, additional EU-wide remuneration rules became effective at the beginning of 2014 under the Capital Requirements Directive IV (CRD IV). The rules include provisions on the amount and form of variable remuneration that can be paid to employees identified as material risk takers, as defined by the European Banking Authority. A key element of the rules is the introduction of a maximum ratio of 1:1 for variable to fixed remuneration (“bonus cap”). The cap may be increased to 2:1 with shareholders’ consent. These restrictions apply to material risk takers at all banks active in the EU, including UBS. However, as a non-EU headquartered firm, UBS need only apply these restrictions to material risk takers employed by EU subsidiaries or branches. We continue to closely assess EU developments and industry-wide best practices.
In January 2014, the EC issued a proposed regulation on “Structural measures improving the resilience of EU credit institutions,”
which is its response to the recommendations of its High-level Expert Group on reforming the structure of the EU banking sector (“Liikanen report”). The proposals include two main measures: (i) a ban on proprietary trading and investments in hedge funds and (ii) an additional potential separation of certain trading activities (including market-making, risky securitization and complex derivatives) which will not be mandatory, but rather based on supervisory discretion. The proposal will now enter the EU political process and will likely be subject to changes. Political agreement is not expected until 2015 at the earliest.
In the US, significant steps were taken in implementing the Dodd-Frank Act
Developments in US regulatory initiatives in 2013 related primarily to rulemaking stemming from the Dodd-Frank Act passed in July 2010.
In July 2013, the Commodity Futures Trading Commission (CFTC) approved final cross-border guidance that defines the extraterritorial application of its swaps regulations. This guidance may allow non-US swap dealers, such as UBS AG, “substituted compliance,” under which they may comply with home country legal requirements that are determined by the CFTC to be “comprehensive and comparable” instead of the corresponding CFTC requirements. In December 2013, the CFTC issued comparability determinations for Switzerland (and the home countries of other non-US swap dealers) that will allow UBS to comply with relevant Swiss regulations instead of CFTC requirements for many, but not all, of the CFTC regulations for which substituted compliance is available. While the CFTC deferred a comparability determination on swap data reporting requirements, as it continues to review the issue, it granted reporting no-action relief that allows UBS AG (and other non-US swap dealers) to delay reporting transactions with non-US persons for several months. In January 2014, the CFTC delayed the applicability of US regulations to swaps between non-US persons and non-US swap dealers when US personnel are involved until 15 September 2014, giving additional time for foreign swap dealers to comply with US requirements regarding transactions with non-US persons conducted from the US.
Separately, in December 2013, three financial services industry associations filed a lawsuit challenging the CFTC’s interpretive guidance and policy statement regarding compliance with certain swap regulations. Relief sought includes invalidating the cross-border guidance and preventing the CFTC from bringing an enforcement action for not complying with US rules extraterritorially. If the guidance is struck down, portions of it that call for substituted compliance and limit the application of transaction regulation to non-US swap dealers would likely also be struck down and may create more uncertainty for non-US swap dealers such as UBS.
In May 2013, the US Securities and Exchange Commission (SEC) proposed rules for the extraterritorial application of its regulation of securities-based swap dealers in the US. The SEC proposal
Operating environment and strategy
Regulatory and legal developments
contemplates application of regulations similar to the CFTC rules to non-US swap dealers, including swap transaction reporting requirements and information and inspection requirements that present potential conflicts with non-US law or necessitate privacy waivers from clients. Like the CFTC, the SEC envisions a substituted compliance regime that would allow foreign swap dealers to comply with comparable home country regulation rather than SEC rules under certain circumstances.
US regulators published final regulations implementing the Volcker Rule in December 2013 and generally extended the time to conform to this rule and regulations until July 2015. In general, the Volcker Rule prohibits any banking entity from engaging in proprietary trading and from owning an interest in hedge funds and other private fund vehicles. Our earlier strategy decision to exit our equity proprietary trading businesses, together with certain business lines, will assist us in complying with the regulatory requirements. In addition, the Volcker Rule permits UBS and other non-US banking entities to engage in certain activities that would otherwise be prohibited, to the extent that they are conducted outside the US and certain other conditions are met. We continue to evaluate the final rules and their impact on our activities. One impact will be the need to establish an extensive global compliance framework designed to ensure compliance with the Volcker Rule and the terms of the available exemptions. Moreover, the Volcker Rule could have an impact on the way in which we organize and conduct certain business lines.
In February 2014, the Federal Reserve Board issued final rules for foreign banking organizations (FBO) operating in the US (under
section 165 of the Dodd-Frank Act) that include the following: (i) a requirement for FBO with more than USD 50 billion of US non-branch assets to establish an intermediate holding company (IHC) to hold all US subsidiary operations, (ii) risk-based capital and leverage requirements for the IHC, (iii) liquidity requirements, including a 30-day onshore liquidity requirement for the IHC, (iv) risk management requirements including the establishment of a risk committee and the appointment of a US chief risk officer, (v) stress test and capital planning requirements and (vi) a debt-to-equity limit for institutions that pose “a grave threat” to US financial stability. Requirements differ based on the overall size of the foreign banking organization and the amount of its US-based assets. We expect that we will be subject to the most stringent requirements based on our current operations. We will have until 1 July 2016 to establish an IHC and meet many of the new requirements. We must submit an implementation plan by 1 January 2015 and the IHC will not need to comply with the US leverage ratio until 1 January 2018.
Basel Committee on Banking Supervision provided further Basel III guidance
Following the start of Basel III implementation on 1 January 2013, according to the Basel Committee on Banking Supervision’s (BCBS) timeline, a number of regulatory discussions over the last year focused on further enhancing and simplifying the capital framework, for example by potentially increasing the role of standardized approaches or of leverage ratios, as well as on achieving better comparability of risk-weighted assets (RWA).
24
|
Operating environment and strategy |
|
|
In July 2013, the BCBS issued a discussion paper on “The regulatory framework: balancing risk sensitivity, simplicity and comparability,” which proposed a number of reforms to the Basel framework with the objective of evaluating whether the balance between risk sensitivity, simplicity and comparability was still appropriate. The proposals, part of a longer-term discussion, covered a wide range of possibilities, including a stronger role for the standardized approach in calculating RWA, tightening the leverage ratio, and utilizing added floors and benchmarks for model-based calculations.
With regard to the leverage ratio specifically, the BCBS issued a consultation on “Revised Basel III leverage ratio framework and disclosure requirements” in June 2013, followed by final rules in January 2014. The changes to the Basel III leverage ratio framework relate mostly to the leverage ratio’s exposure measure and include the following: (i) specifications of the scope of consolidation for the inclusion of exposures, (ii) changes to the general treatment of derivatives and related collateral, (iii) specifications of the treatment of written credit derivatives and (iv) specifications of the treatment of securities financing transactions. The tier 1 capital requirement under the revised Basel III leverage ratio remains at 3% of the exposure measure. However, the BCBS will continue to monitor banks’ leverage ratio data on a semi-annual basis in order to assess whether the design and calibration of a minimum tier 1 leverage ratio of 3% is appropriate over a full credit cycle and for different types of business models. The final calibration, and any final adjustments to the definition, will be completed by 2017. Based on an initial review of the proposals, we expect a slight increase in our leverage ratio
denominator. The ratio is expected to be incorporated within Pillar 1 minimum capital requirements on 1 January 2018. According to the BCBS’s timetable, the disclosure requirements are effective 1 January 2015 subject to implementation by national regulators.
Discussions about the leverage ratio also took place in Switzerland, with a review report on the Swiss TBTF law expected to be published by the Federal Council in early 2015.
In addition, there were further developments regarding liquidity requirements under Basel III. Following the publication on 12 January 2014 by the BCBS of additional guidance on the Liquidity Coverage Ratio (LCR), on 17 January 2014, the Swiss Federal Department of Finance opened a consultation on the revision of the Liquidity Ordinance and at the same time FINMA issued the revised Circular “Liquidity Banks” in Switzerland for comment. Both consultations end on 28 March 2014. Based on an initial review of the proposals, we do not expect a material impact on our pro-forma LCR.
Also on 12 January 2014, the BCBS issued a consultative paper on the proposed revision of the Basel III framework’s Net Stable Funding Ratio (NSFR). The consultation period ends on 11 April 2014. The main changes proposed are increased deposit stability, a reduction of cliff effects within the measurement of funding stability and larger stable funding requirements for certain trading assets. Based on an initial review of the proposals, we expect a positive net effect on our pro-forma NSFR. Final NSFR rules are expected to be released by 2016, after which they will undergo a period of consultation and review by Swiss authorities, potentially leading to further changes before implementation.
25
Operating environment and strategy
Our strategy
Our strategy
We are committed to providing our clients with superior financial advice and solutions while generating attractive and sustainable returns for shareholders. Our strategy centers on our Wealth Management and Wealth Management Americas businesses and our leading universal bank in Switzerland, complemented by our Global Asset Management business and our Investment Bank. These businesses share three key characteristics: they benefit from a strong competitive position in their targeted markets, arecapital-efficient, and offer a superior structural growth and profitability outlook. Our strategy therefore builds on the strengths of all of our businesses and focuses our efforts on areas in which we excel, while seeking to capitalize on the compelling growth prospects in the businesses and regions in which we operate. Capital strength is the foundation of our success.
Successfully executing our strategic transformation
In October 2012, we announced a significant acceleration in the implementation of our strategy communicated a year earlier. This announcement underlined our commitment to focus our activities on a set of highly synergistic, less capital- and balance sheet-intensive businesses dedicated to serving clients and well-positioned to maximize value for shareholders. Since then, demonstrating the strength of our business model, we have made substantial progress in improving our already strong capital position and reducing risk-weighted assets (RWA) and costs, while simultaneously growing our business and enhancing our competitive positioning. We have also successfully transformed our Investment Bank, focusing it on its traditional strengths in advisory, research, equities, foreign exchange and precious metals.
Our fully applied common equity tier 1 (CET1) capital ratio increased 300 basis points in 2013 to 12.8%, the highest in our peer group. This increase was driven by a reduction of fully applied
RWA to CHF 225 billion, ahead of our 2013 target of CHF 250 billion and CHF 33 billion below year-end 2012 RWA. We achieved this by further active reduction of RWA, mainly through the disposal of positions or other risk reductions in our Non-core and Legacy Portfolio, and despite incremental RWA of CHF 22.5 billion resulting from the supplemental operational risk capital analysis mutually agreed with FINMA and effective 31 December 2013. Future developments in, and the ultimate elimination of, the incremental RWA attributable to the supplemental analysis will depend on provisions charged to earnings for litigation, regulatory and similar matters and other contingent liabilities and on developments in these matters. Our ability to absorb this event while simultaneously increasing our capital ratios and reducing RWA is a testament to our early decision to maintain and build on our strong capital position and to focus on sustainable, more capital-efficient business activities. We continue to target a fully applied CET1 ratio of 13% in 2014, and intend to build further Basel III-compliant capital.
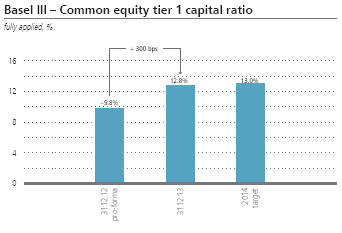
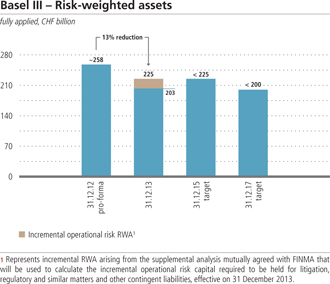
26
|
Operating environment and strategy |
|
|
As part of the transformation of the Investment Bank, we transferred certain of its businesses to the Corporate Center in the first quarter of 2013. These were primarily fixed income businesses rendered less attractive by changes in regulation and market developments. As a result, our Investment Bank retains only very focused credit and rates activities, along with structured financing capabilities, in order to support its solutions-focused businesses. Our leading equities and foreign exchange businesses remain cornerstones of our Investment Bank. We did not significantly alter our advisory and capital markets businesses, but reorganized our existing business functions to better leverage our capabilities and therefore better serve our clients. Our Investment Bank has achieved its target of an adjusted pre-tax return on attributed equity of greater than 15% throughout 2013, demonstrating its success in a variety of market conditions. Non-core assets, previously part of the Investment Bank, are reported within our Non-core and Legacy Portfolio unit in the Corporate Center, which is tasked with managing and exiting these assets in a manner that protects shareholder value. RWA associated with these positions were reduced by close to 40% in 2013 to CHF 64 billion, significantly ahead of our target.
| | è | | Refer to the “Capital management” section of this report for more information |
Maintaining cost discipline is critical to our long-term success. In 2013, we achieved our CHF 2 billion gross cost reduction plan announced in July 2011. We also made further progress in the implementation of the additional cost reduction program we announced in 2012, targeting incremental annual gross cost savings of CHF 3.4 billion, which we expect to yield tangible results through 2016. These targeted reductions include the benefits from the abovementioned transformation of our Investment Bank, reducing complexity and size, as well as improving
organizational effectiveness, primarily in our Corporate Center, and introducing lean front-to-back processes across our Group. Our investment in these initiatives is reflected in restructuring charges of CHF 0.8 billion in 2013 and expectations of further incremental charges of CHF 0.9 billion and CHF 0.8 billion in 2014 and 2015, respectively. Our efficiency programs will free up resources to make investments over the next two years to support growth across our businesses and enable us to service our clients with greater agility and effectiveness, improving quality and speed.
2014 will be another key year of transition for the Group as we continue to work through our plans to further enhance our businesses, reduce our cost base and further improve collaboration across our various businesses. For 2014, we do not expect our unadjusted return on equity to deviate significantly from 2013, primarily due to anticipated charges associated with litigation, regulatory and other matters, restructuring charges, and the impact of Non-core and Legacy Portfolio exits and capital requirements. While we continue to target an adjusted Group return on equity of greater than 15% in 2015, given elevated operational risk RWA, we may not achieve that until 2016. We continue to target an adjusted Group cost/income ratio of 60% to 70% from 2015 onwards.
Delivering attractive shareholder returns
We have a clear strategy and a solid financial foundation, which we believe prepares us well for the future. We are firmly committed to returning capital to our shareholders, and plan to continue our program of progressive returns to shareholders with a proposed 67% increase in dividend to CHF 0.25 per share for the financial year 2013. In this context, we reaffirm our commitment to a total payout ratio of at least 50%, consisting of a
27
Operating environment and strategy
Our strategy
baseline dividend and supplementary returns, after reaching our capital ratio targets of a fully applied CET1 ratio of 13% and a 10% post-stress CET1 ratio, based on our internal stress tests. We intend to set a baseline dividend at a sustainable level, taking into account normal economic fluctuations. The supplementary capital returns will be balanced with our need for investment and any buffer we choose to maintain for a more challenging economic environment or other stress scenarios. Through the further successful implementation of our strategy, we believe we can sustain and grow our business and maintain a prudent capital position.
Our annual performance targets
The table on the right provides our annual performance targets on a Group and business division level as well as for Non-core and Legacy Portfolio. These performance targets exclude, where applicable, items considered non-recurring and certain other items that management believes are not representative of the underlying performance of our businesses, such as own credit gains and losses, restructuring-related charges and gains and losses on sales of businesses and real estate. The performance targets assume constant foreign currency translation rates.
Annual performance targets
Group targets:
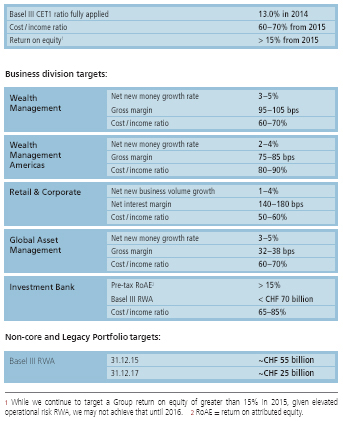
28
|
Operating environment and strategy |
|
|
UBS Switzerland
UBS is the pre-eminent universal bank in Switzerland, the only country where we operate and maintain leading positions in all five of our business areas of retail, wealth management, corporate and institutional banking, asset management and investment banking. We are fully committed to our home market as our leading position in Switzerland is crucial in terms of profit stability, sustaining our global brand and growing our global core business. Drawing on our network of around 300 branches and our 4,700 client-facing staff, complemented by modern digital banking services and customer service centers open to our clients around the clock seven days a week, we are able to reach approximately 80% of Swiss wealth and service one in three households, one in three high net worth individuals, over 40% of Swiss companies, one in three pension funds and 85% of banks domiciled in Switzerland. In July, Euromoney acknowledged our pre-eminent position in Switzerland with its prestigious “Best Bank in Switzerland” award for the second consecutive year.
Our unique universal bank model is central to our success. Our dedicated Swiss management team includes representatives from all five business areas and ensures we apply a consistent approach to the market when offering
our full range of banking products, expertise and services. Our cross-divisional management approach allows us to utilize our existing resources efficiently, promotes cross-divisional thinking and enables seamless collaboration across all business areas. As a result, we are in a unique position to serve our clients efficiently with a comprehensive range of banking products and services to fit their needs. We are able to differentiate ourselves by leveraging our strengths across all segments while ensuring stability and continuity throughout each client’s life cycle. Our universal bank model has proven itself to be highly effective in Switzerland and consistently provides a substantial part of the Group’s revenues.
Our distribution is based on a clear multi-channel strategy as we strive to offer a unique client experience, giving clients the full flexibility to choose by which channel to interact with us – be it through our branches, customer service centers or digital channels. Our continuous expansion of our electronic and mobile banking proposition is very well-regarded by our clients and translates into a steadily rising number of users and client interactions. With the launch of the new version of our mobile banking application, downloads have increased 77% year on year and client feedback has been excellent, with 88% of Apple App
Store ratings awarding the maximum five stars. Premium functionality was recognized externally, among others with the international “Best Bank Mobile Application” award at the MobileWebAwards 2013 and the national Best Swiss Apps 2013 Bronze Award. Our e-banking service currently has around 1.3 million clients, a 7% increase in each of the past two years, and now includes a market-leading personal financial management tool. Around 50 million electronic and mobile banking touch points per year provide a distinctive brand experience, helping us to strengthen client loyalty and attract new clients. We will continue to build on our long tradition as a leader and innovator in digital services to capture market share and increase efficiency.
Given the strength of the economy and the stable political environment in Switzerland, the country remains an attractive financial market. This inherent stability and growth has been the basis for UBS Switzerland’s success and its contribution to the Group’s financial performance. Thanks to our universal bank model, broad client base and seamless multi-channel offering, we are well-positioned to capture future market growth and to strengthen our leading position in our home market.
29
Operating environment and strategy
Measurement of performance
Measurement of performance
Performance measures
Key performance indicators
Our key performance indicators (KPI) framework focuses on key drivers of total shareholder return, measured by the dividend yield and price appreciation of a UBS share. Our senior management reviews the KPI framework on a regular basis by considering prevailing strategy, business conditions and the environment in which we operate. The KPI are disclosed consistently in our quarterly and annual reporting to facilitate comparison of our performance over the reporting periods.
The Group and business divisions are managed based on this KPI framework, which emphasizes risk awareness, effective risk and capital management, sustainable profitability and client focus. Both Group and business division KPI are taken into account in determining variable compensation of executives and personnel.
| | è | | Refer to the “Compensation” section of this report for more information on performance criteria for compensation |
In addition to the KPI, we disclose performance targets. These performance targets include certain of the KPI as well as additional balance sheet and capital management performance measures to track the achievement of our strategic plan.
| | è | | Refer to the “Our strategy” section of this report for more information on performance targets |
The Group and business division KPI are explained in the “Group/business division key performance indicators” table.
We made the following key changes to our KPI framework in 2013 to align it to the new Basel III requirements which became effective at the beginning of the year:
| – | | We replaced “BIS tier 1 ratio (%)” with “Swiss systemically relevant banks (SRB) Basel III common equity tier 1 capital ratio (%).” |
| – | | We replaced “FINMA leverage ratio (%)” with “Swiss SRB leverage ratio (%)” (formerly also referred to as “FINMA Basel III leverage ratio (%)”). |
We show our “Swiss SRB Basel III common equity tier 1 capital ratio (%)” on a phase-in and a fully applied basis. The information provided on a fully applied basis entirely reflects the effects of the new capital deductions and the phase-out of ineligible capital instruments. The information provided on a phase-in basis gradually reflects those effects during the transition period, which runs from 2014 to 2018 for the new capital deductions, and from 2013 to 2019 for the phase-out of ineligible capital instruments. “Swiss SRB leverage ratio (%)” considers Swiss SRB Basel III common equity tier 1 (CET1) capital and loss-absorbing capital, divided
by total adjusted exposure, which is equal to IFRS assets, based on a capital adequacy scope of consolidation, adjusted for replacement value netting and other adjustments, including off-balance sheet items. Our KPI for “Swiss SRB leverage ratio (%)” is calculated on a phase-in basis.
| | è | | Refer to the “Capital management” section of this report for more information |
In addition, we changed the definition of our Wealth Management Americas KPI “Recurring income as a percentage of total operating income (%)” to “Recurring income as a percentage of income (%)” to exclude credit loss (expense) or recovery. The change of the denominator to “income” from “total operating income” makes this KPI more consistent with the KPI “Gross margin on invested assets (bps),” “Return on assets, gross (%),” “Return on risk-weighted assets, gross (%)” and “Cost/income ratio (%)” which are already based on “income” as opposed to “operating income,” thereby also excluding credit loss (expense) or recovery. The effect on our figures of this new basis of calculation was immaterial, but prior periods were restated to reflect the change in definition. In addition, we now also include both “Recurring income” and “Recurring income as a percentage of total income (%)” in our Wealth Management disclosure. However, for Wealth Management these metrics are considered “Additional information” and not KPI.
Client/invested assets reporting
We report two distinct metrics for client funds:
| – | | The measure “client assets” encompasses all client assets managed by or deposited with us, including custody-only assets. |
| – | | The measure “invested assets” is more restrictive and includes only client assets managed by or deposited with us for investment purposes. |
Of the two, invested assets is our more central measure and includes, for example, discretionary and advisory wealth management portfolios, managed institutional assets, managed fund assets and wealth management securities or brokerage accounts. It excludes all assets held for custody-only purposes, as we only administer the assets and do not offer advice on how these assets should be invested. Non-bankable assets (for example, art collections) and deposits from third-party banks for funding or trading purposes are excluded from both measures.
Net new money in a reported period is the amount of invested assets that are entrusted to us by new or existing clients less those withdrawn by existing clients or clients who terminated their relationship with us. Negative net new money means that there are more outflows than inflows. Interest and dividend income from invested assets is not counted as net new money inflow. However, in Wealth Management Americas we also show net new money
30
|
Operating environment and strategy |
|
|
Group/business division key performance indicators
| | | | | | | | | | | | | | |
| Key performance indicators | | Definition | | Group | | Wealth
Management | | Wealth
Management
Americas | | Retail &
Corporate | | Global Asset
Management | | Investment
Bank |
| Net profit growth (%) | | Change in net profit attributable to UBS shareholders from continuing operations between current and comparison periods/net profit attributable to UBS shareholders from continuing operations of comparison period | | l | | | | | | | | | | |
| | | | | | | | | | | | | | | |
| Pre-tax profit growth (%) | | Change in business division performance before tax between current and comparison periods/business division performance before tax of comparison period | | | | l | | l | | l | | l | | l |
| | | | | | | | | | | | | | | |
| Cost/income ratio (%) | | Operating expenses/operating income before credit loss (expense) or recovery | | l | | l | | l | | l | | l | | l |
| | | | | | | | | | | | | | | |
| Return on equity (RoE) (%) | | Net profit attributable to UBS shareholders (annualized as applicable)/average equity attributable to UBS shareholders | | l | | | | | | | | | | |
| | | | | | | | | | | | | | | |
| Return on attributed equity (RoAE) (%) | | Business division performance before tax (annualized as applicable)/average attributed equity | | | | | | | | | | | | l |
| | | | | | | | | | | | | | | |
| Return on assets, gross (%) | | Operating income before credit loss (expense) or recovery (annualized as applicable)/average total assets | | l | | | | | | | | | | l |
| | | | | | | | | | | | | | | |
| Return on risk-weighted assets, gross (%) | | Operating income before credit loss (expense) or recovery (annualized as applicable)/average risk-weighted assets | | l | | | | | | | | | | |
| | | | | | | | | | | | | | | |
| Swiss SRB leverage ratio (%) (phase-in) | | Swiss SRB Basel III common equity tier 1 capital and loss-absorbing capital/total adjusted exposure (leverage ratio denominator) | | l | | | | | | | | | | |
| | | | | | | | | | | | | | | |
| Swiss SRB Basel III common equity tier 1 capital ratio (%) | | Swiss SRB Basel III common equity tier 1 capital/Swiss SRB Basel III risk-weighted assets | | l | | | | | | | | | | |
| | | | | | | | | | | | | | | |
| Net new money growth (%) | | Net new money for the period (annualized as applicable)/invested assets at the beginning of the period | | l | | l | | l | | | | l | | |
| | | | | | | | | | | | | | | |
| Gross margin on invested assets (bps) | | Operating income before credit loss (expense) or recovery (annualized as applicable)/average invested assets | | | | l | | l | | | | l | | |
| | | | | | | | | | | | | | | |
| Net new business volume growth (%) | | Net new business volume (i.e., total net inflows and outflows of client assets and loans) for the period (annualized as applicable)/business volume (i.e., total of client assets and loans) at the beginning of the period | | | | | | | | l | | | | |
| | | | | | | | | | | | | | | |
| Net interest margin (%) | | Net interest income (annualized as applicable)/average loans | | | | | | | | l | | | | |
| | | | | | | | | | | | | | | |
| Recurring income as a % of income (%) | | Total recurring fees and net interest income/income | | | | | | l | | | | | | |
| | | | | | | | | | | | | | | |
| Impaired loans portfolio as a % of total loans portfolio, gross (%) | | Impaired loans portfolio, gross/total loans portfolio, gross | | | | | | | | l | | | | |
| | | | | | | | | | | | | | | |
| Average VaR (1-day, 95% confidence, 5 years of historical data) | | Value-at-risk (VaR) expresses maximum potential loss measured to a 95% confidence level, over a one-day time horizon and based on five years of historical data | | | | | | | | | | | | l |
| | | | | | | | | | | | | | | |
31
Operating environment and strategy
Measurement of performance
including interest and dividend income in line with historical reporting practice in the US market. Market and currency movements, as well as fees, commissions and interest on loans charged, are excluded from net new money, as are the effects of any acquisition or divestment of a UBS subsidiary or business. Reclassifications between invested assets and custody-only assets as a result of a change in the service level delivered are generally treated as net new money flows. However, where such a change in service level directly results from a new, externally imposed regulation, the one-time net effect of the implementation is reported as an asset reclassification without net new money impact. The Investment Bank does not track invested assets or net new money. Accordingly, when a client is transferred from the Investment Bank to another business division, this produces net new money even though the client assets were already with UBS.
When products are managed in one business division and sold by another, they are counted in both the investment management unit and the distribution unit. This results in double-counting within our total invested assets, as both units provide an independent service to their client, add value and generate revenues. Most double-counting arises when mutual funds are managed by Global Asset Management and sold by Wealth Management and
Wealth Management Americas. The business divisions involved count these funds as invested assets. This approach is in line with both finance industry practices and our open architecture strategy, and allows us to accurately reflect the performance of each individual business. Overall, CHF 156 billion of invested assets were double-counted as of 31 December 2013 (CHF 172 billion as of 31 December 2012).
| | è | | Refer to “Note 35 Invested assets and net new money” in the “Financial information” section of this report for more information |
Seasonal characteristics
Our main businesses may show seasonal patterns. The Investment Bank’s revenues have been affected in some years by the seasonal characteristics of general financial market activity and deal flows in investment banking. Other business divisions may also be impacted by seasonal components, such as lower client activity levels related to the summer and end-of-year holiday seasons, annual income tax payments, for example, which are concentrated in the second quarter in the US, and asset withdrawals that tend to occur in the fourth quarter.
Changes to key performance indicators in 2014
From the beginning of 2014, we will make the following changes to our KPI framework to further enhance its relevance by reclassifying certain KPI to “Additional information,” or defining certain KPI to focus on our specific wealth management or retail businesses.
Changes to key performance indicators in 2014
| | | | | | | | | | | | | | |
| Existing key performance indicators | | Changes in 2014 | | Group | | | Wealth Management Americas | | | Retail &
Corporate | |
| Return on risk-weighted assets, gross (%) | | This metric will no longer be a KPI, but will instead be reported as “Additional information,” as it is considered to be less meaningful and relevant compared with the other existing KPI to measure the performance of the Group. | | l | | | | | | | | | | |
| | | | | | | | | | | | | | | |
| Swiss SRB Basel III common equity tier 1 capital ratio (%) (phase-in) | | This metric will no longer be a KPI, but will instead be reported as “Additional information.” The Swiss SRB Basel III CET1 capital ratio on a fully applied basis will continue to be a KPI. | | l | | | | | | | | | | |
| | | | | | | | | | | | | | | |
| Net new money growth (%) | | This KPI will be renamed to “Net new money growth for combined wealth management businesses (%)” and focus on net new money generated by our wealth management businesses only by excluding net new money from Global Asset Management and Retail & Corporate from this measure. | | l | | | | | | | | | | |
| | | | | | | | | | | | | | | |
| Recurring income as a % of income (%) | | This metric will no longer be a KPI, but will instead be reported as “Additional information,” to be consistent with the way this metric is reported in Wealth Management. | | | | | | l | | | | | | |
| | | | | | | | | | | | | | | |
| Net new business volume growth (%) | | This KPI will be renamed “Net new business volume growth for retail business (%)” and focus on net new business volume from our retail business only by excluding our corporate business from this measure. | | | | | | | | | | l | | |
| | | | | | | | | | | | | | | |
| Impaired loans portfolio as a % of total loans portfolio, gross (%) | | This measure will no longer be a KPI, as it is considered to be less meaningful and relevant compared with the other existing KPI to measure the performance of our Retail & Corporate business. | | | | | | | | | | l | | |
| | | | | | | | | | | | | | | |
32
|
Operating environment and strategy |
|
|
Wealth Management
Wealth Management provides wealthy private clients with investment advice and solutions tailored to their individual needs. At the end of 2013, we had a presence in over 40 countries and invested assets of more than CHF 880 billion.
Business
We provide comprehensive financial services to wealthy private clients around the world, with the exception of those served by our colleagues in Wealth Management Americas. UBS is a global firm with global capabilities, and our clients benefit from a full spectrum of resources, ranging from investment management solutions to wealth planning and corporate finance advice, as well as the specific offerings outlined below. Our guided architecture model gives clients access to a wide range of products from third-party providers that complement our own product lines.
Strategy and clients
We are one of the pre-eminent wealth managers globally and aim to provide our clients with superior investment advice and solutions.
We are building on our leading position by focusing on our clients’ individual goals. We provide them with access to the infrastructure we offer to our institutional clients: for example, direct access to the Investment Bank’s trading platforms, the offering of our Institutional Solutions Group and professional portfolio management capabilities, including strategic asset allocation and holistic portfolio monitoring to ensure clients’ portfolios remain aligned with their investment strategy. In addition, through our Global Family Office Group, clients benefit from tailored institutional coverage and global execution provided by dedicated specialist teams from both Wealth Management and the Investment Bank. We also provide solutions, products and services to financial intermediaries.
The global wealth management business has attractive long-term growth prospects and we expect its growth to outpace that of gross domestic product in all regions. From a client segment perspective, the global ultra high net worth market, including family offices, has the highest growth potential, followed by the high net worth market. Our broad client base and strong global footprint put us in an excellent position to capture the opportunities this presents.
Our integrated client service model enables us to bundle capabilities from across the Group to identify investment opportunities in all market conditions and tailor solutions to meet individual client needs. Our booking centers across the globe give us a strong local presence which allows us to book client assets in multiple locations. The strength and scope of our franchise also enable us to adapt to the changing legal and regulatory environment.
Collaboration is also crucial to our continued expansion in key onshore locations, and we continue to benefit from the established business relationships of our local Investment Bank and Global Asset Management teams.
In Asia Pacific, we are accelerating our growth with a focus on Hong Kong and Singapore, the leading financial centers in the region. We are also developing a targeted presence in major onshore markets such as Japan and Taiwan and investing in our local presence in China to help capture long-term growth opportunities.
In the emerging markets, we are focused on key growth markets such as Brazil, Mexico, Israel, Turkey, Russia and Saudi Arabia. We continually enhance our market-specific products and services
| | |
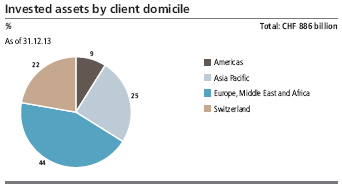
| | 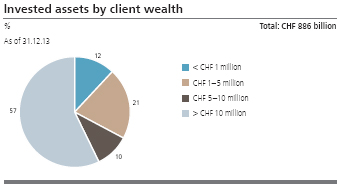
|
33
Operating environment and strategy
Wealth Management
to ensure we meet the needs of our clients. Many emerging market clients prefer to book their assets in established financial centers and, to that end, we are strengthening our coverage for such clients through our booking centers in the US, the UK and Switzerland.
In Europe, our long-established footprint in all major booking centers underpins our growth ambition. We recognized early the converging needs of clients and combined our offshore and onshore businesses. This gives clients across the region access to our extensive Swiss product offering, creates economies of scale and enables us to deal more efficiently with increased regulatory and fiscal requirements.
In Switzerland, we collaborate closely with our colleagues in retail, corporate, asset management and investment banking. This generates opportunities to expand our business and gives our clients access to our investment insight and research, advisory and portfolio management capabilities, products and capital markets, as well as execution know-how. We generate significant referrals from Swiss corporate and retail clients through UBS’s extensive branch network, which includes over 100 wealth management offices. As their wealth increases, retail clients can progress seamlessly to our wealth management operations.
Our Global Financial Intermediaries business acts as a strategic business partner for more than 2,400 financial intermediaries in all major financial centers. It offers them professional investment advisory services, a global banking infrastructure and tailored solutions, helping financial intermediaries to advise their end-clients more effectively.
Organizational structure
Headquartered in Switzerland, we have a presence in over 40 countries with approximately 200 wealth management and representative offices, half of which are outside Switzerland. As of the end of 2013, we employed approximately 16,400 people worldwide. Of these, approximately 4,100 were client advisors. We are governed by executive, operating and risk committees and are primarily organized along regional lines with our business areas being Asia Pacific, Europe, Global Emerging Markets, Switzerland and Global Ultra High Net Worth. Our business is supported by the Chief Investment Office and a global Investment Products and Services unit, as well as central functions.
Competitors
Our major global competitors include the private banking operations of Credit Suisse, Julius Bär, HSBC, Deutsche Bank, BNP Paribas, JP Morgan and Citigroup, along with leading investment managers such as PIMCO. In the European domestic markets, we primarily compete with the private banking operations of large local banks such as Barclays in the UK, Deutsche Bank in Germany and Unicredit in Italy. In Asia Pacific, the private banking franchises of HSBC, Citigroup and Credit Suisse are our main competitors.
Investment advice and solutions
As part of a global, integrated firm, we are a dynamic wealth manager with investment management capabilities at our core.
| | |
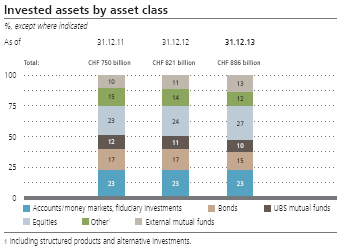
| | 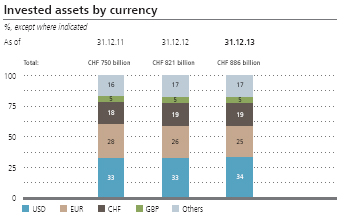
|
34
|
Operating environment and strategy |
|
|
Our client advisors are proactive in their relationships with clients, and we have a systematic process for developing a thorough understanding of our clients’ financial objectives and risk appetite. In addition, our wealth planners – part of our specialist product team – often support client advisors as they guide their clients in making financial decisions based on their life-cycle needs. With this comprehensive overview, we offer them wealth planning advice and products, and we ascertain their investment strategy, which serves as the foundation for the investment solutions we offer them. Client advisors regularly review their clients’ investor profiles to make sure they correspond to their evolving priorities and changing tolerance for risk. Our bespoke training programs and the ongoing support the firm provides to our client advisors enable them to deliver superior advice and solutions to our clients. For example, we require all of our client advisors to obtain the Wealth Management Diploma, a program accredited by Switzerland’s State Secretariat For Economic Affairs (SECO) that ensures a high level of knowledge and expertise. For our most senior client advisors, we offer extensive training through the Wealth Management Master program.
Our global Chief Investment Office synthesizes the research and expertise of our global network of economists, strategists, analysts and investment specialists from across all business divisions. These specialists are present in all major markets around the globe, closely monitoring financial developments. This allows us to deliver real-time insights and to embed local knowledge into our global investment process. Using these analyses, and in consultation with our external partner network, which includes many of the world’s most successful money managers, the Chief Investment
Office establishes a clear, concise and consistent investment view – the UBS House View. The UBS House View includes both our strategic and our tactical asset allocation across all relevant asset classes in major markets. The strategic asset allocation represents the long-term asset allocation for a defined risk level and is crucial for investment performance. Our strategic asset allocation is complemented by our tactical asset allocation, which allows us to capitalize on short-term market opportunities.
Our Investment Products and Services unit ensures our solutions are in step with market conditions by aligning our discretionary and advisory offerings with our UBS House View. Clients who opt for an investment mandate delegate the management of their assets to a team of professional portfolio managers. Those who prefer to be actively involved can choose an advisory mandate. Their entire portfolio is monitored and analyzed closely, and they receive tailored proposals to help them make informed investment decisions. They can also invest in the full range of financial instruments from single securities such as equities and bonds, to various investment funds, structured products and alternative investments. Additionally, we offer clients advice on structured lending and corporate finance.
Our products are aimed at achieving performance in various market scenarios. They are developed from a wide range of sources, including Investment Products and Services, Global Asset Management, the Investment Bank and third parties, as we operate within a guided architecture model. By aggregating private investment flows into institutional-size flows, we can offer our clients access to investments normally only available to institutional clients.
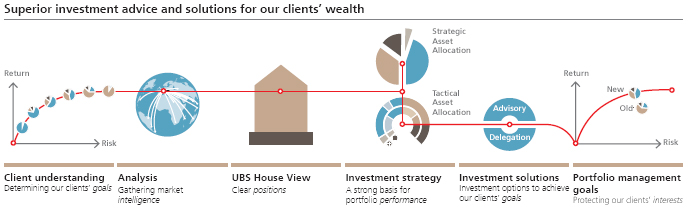
35
Operating environment and strategy
Wealth Management Americas
Wealth Management Americas
Wealth Management Americas developsadvice-based relationships through its financial advisors, who deliver a fully integrated set of wealth management solutions designed to address the needs of high net worth and ultra high net worth individuals and families.
Business
We are one of the leading wealth managers in the Americas in terms of financial advisor productivity and invested assets. Our business includes the domestic US and Canadian business as well as international business booked in the US. We have attractive growth opportunities and a clear strategy focused on serving our target client segments. As of 31 December 2013, invested assets totaled USD 970 billion.
Strategy and clients
Our goal is to be the best wealth management business in the Americas. With our client-focused, advisor-centric strategy, we deliver advice-based wealth management solutions and banking services through our financial advisors in key metropolitan markets, providing afully integrated set of products and services to
meet the needs of our target client segments, high net worth clients and ultra high net worth clients, while also serving the needs of core affluent clients. We define high net worth clients as those with investable assets of between USD 1 million and USD 10 million, and ultra high net worth clients as those with investable assets of more than USD 10 million. Core affluent clients are defined as those with investable assets of between USD 250,000 and USD 1 million. The Global Family Office – Americas, a joint venture between Wealth Management Americas and the Investment Bank, was launched in 2013 with the objective of seamlessly offering the global resources and reach of the entire firm by providing integrated, comprehensive wealth management and institutional-type services to selected Family Office clients. Our Wealth Advice Center serves emerging affluent clients with investable assets of less than USD 250,000. We are committed to providing high-quality advice to our clients across all their financial needs by employing the best professionals in the industry, delivering the
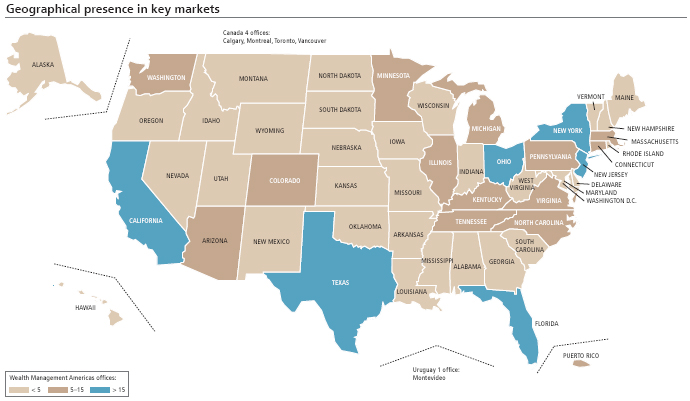
36
|
Operating environment and strategy |
|
|
highest standard of execution, and running a streamlined and efficient business.
We believe we are uniquely positioned to serve high net worth and ultra high net worth investors in the world’s largest wealth market. With a network of over 7,000 financial advisors and USD 970 billion in invested assets, we are large enough to be relevant, but focused enough to be nimble, enabling us to combine the advantages of large and boutique wealth managers. We aim to differentiate ourselves from competitors and be a trusted and leading provider of financial advice and solutions to our clients by enabling our financial advisors to leverage the full resources of UBS, including unique access to wealth management research, a global Chief Investment Office, and solutions from our asset-gathering businesses and the Investment Bank. These resources are augmented by our commitment to an open architecture platform and are supported by our partnerships with many of the world’s leading third-party institutions. Moreover, our wealth management offerings are complemented by banking, mortgage and financing solutions that enable us to provide advice on both the asset and liability sides of our clients’ financial balance sheets.
We believe the long-term growth prospects of the wealth management business are attractive in the Americas, with high net worth and ultra high net worth expected to be the fastest growing segments in terms of invested assets in the region. In 2013, our strategy and focus led to a continued improvement in financial results, retention of high-quality financial advisors and net new money growth. Building on this progress, we aim for continued growth in our business by developing our financial advisors’ focus towards advice-based solutions, leveraging the global capabilities of UBS to clients by continuing to partner with the Investment Bank and Global Asset Management, and delivering banking and lending services that complement our wealth management solutions. We also plan to continue investing in improved platforms and technology, while remaining disciplined on cost. We expect these efforts to enable us to achieve higher levels
of client satisfaction, strengthen our client relationships, and lead to greater revenue productivity among our financial advisors.
Organizational structure
Wealth Management Americas consists of branch networks in the US, Puerto Rico, Canada and Uruguay, with 7,137 financial advisors as of 31 December 2013. Most corporate and operational functions are located in the Wealth Management Americas home office in Weehawken, New Jersey.
In the US and Puerto Rico, we operate primarily through direct and indirect subsidiaries of UBS AG. Securities and operations activities are conducted primarily through two registered broker-dealers, UBS Financial Services Inc. and UBS Financial Services Incorporated of Puerto Rico. Our banking services in the US include those conducted through the UBS AG branches and UBS Bank USA, a federally regulated bank in Utah, which provides Federal Deposit Insurance Corporation (FDIC)-insured deposit accounts, collateralized lending services, mortgages and credit cards.
Canadian wealth management and banking operations are conducted through UBS Bank (Canada), and Uruguayan wealth management operations are conducted through UBS Financial Services Montevideo.
Competitors
We compete with national full-service brokerage firms, domestic and global private banks, regional broker-dealers, independent broker-dealers, registered investment advisors, trust companies and other financial services firms offering wealth management services to US and Canadian private clients, as well as foreign non-resident clients seeking wealth management services within the US. Our main competitors include the wealth management businesses of Bank of America, Morgan Stanley and Wells Fargo.
| | |
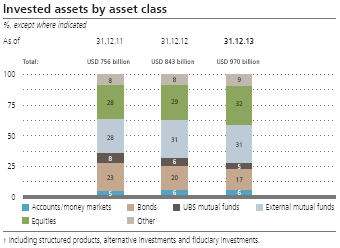 | | 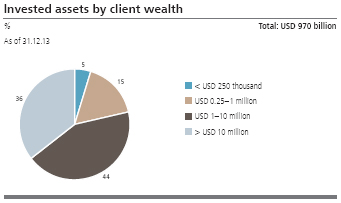 |
37
Operating environment and strategy
Wealth Management Americas
Products and services
We offer clients a full array of solutions that focus on their individual financial needs. Comprehensive planning supports clients through the various stages of their lives, including education funding, charitable giving, estate strategies, insurance, retirement and trusts and foundations, with corresponding product offerings for each stage. Our advisors work closely with internal consultants in areas such as wealth planning, portfolio strategy, retirement and annuities, alternative investments, managed accounts, structured products, banking and lending, equities and fixed income. Clients also benefit from our dedicated Wealth Management Research team, which provides research guidance to help support our clients’ investment decisions.
Our offerings are designed to meet a wide variety of investment objectives, including wealth accumulation and preservation, income generation and portfolio diversification. To address the full range of our clients’ financial needs, we also offer competitive lending and cash management services such as securities-backed lending, resource management accounts, FDIC-insured deposits, mortgages and credit cards.
Additionally, our UBS Equity Plan Advisory Services is a leading provider of equity compensation plan services and advice to more than 130 US corporations, representing one million participants worldwide. For corporate and institutional clients, we offer a robust
suite of solutions, including equity compensation, administration, investment consulting, defined benefit and contribution programs and cash management services.
Our clients can choose asset-based pricing, transaction-based pricing or a combination of both. Asset-based accounts have access to both discretionary and non-discretionary investment advisory programs. Non-discretionary advisory programs enable the client to maintain control over all account transactions, while clients with discretionary advisory programs direct investment professionals to manage a portfolio on their behalf. Depending on the type of discretionary program, the client can give investment discretion to a qualified financial advisor, a team of our investment professionals or a third-party investment manager. Separately, we also offer mutual fund advisory programs, whereby a financial advisor works with the client to create a diversified portfolio of mutual funds guided by a research-driven asset allocation framework.
For clients who favor individual securities, we offer a broad range of equity and fixed income instruments. In addition, qualified clients may take advantage of structured products and alternative investment offerings to complement their portfolio strategies.
All of these solutions are supported by a dedicated capital markets group. This group partners with the Investment Bank and Global Asset Management in order to access the resources of the entire firm, as well as third-party investment banks and asset management firms.
38
|
Operating environment and strategy |
|
|
Retail & Corporate
As the leading retail and corporate banking business in Switzerland, our goal is to deliver comprehensive financial products and services to our retail, corporate and institutional clients, provide stable and substantial profits for the Group and create revenue opportunities for other businesses within the Group.
Business
We provide comprehensive financial products and services to our retail, corporate and institutional clients in Switzerland, maintaining a leading position in these client segments and embedding our offering in a multi-channel approach. As shown in the “Business mix” chart below, our retail and corporate business generates stable profits which contribute substantially to the overall financial performance of the Group. We are among the leading players in the retail and corporate loan market in Switzerland, with a highly collateralized lending portfolio of CHF 137 billion as of 31 December 2013, as shown in the “Loans, gross” chart below. This portfolio is managed conservatively, focusing on profitability and credit quality rather than market share.
Our retail and corporate business constitutes a central building block of UBS Switzerland’s universal bank model, supporting other business divisions by referring clients to them and assisting retail clients to build their wealth to a level at which we can transfer them to our Wealth Management unit. Furthermore, we leverage the cross-selling potential of products and services provided by our asset-gathering and investment banking businesses. In addition, we manage a substantial part of UBS’s Swiss infrastructure and Swiss banking products platform, which are both leveraged across the Group.
Strategy and clients
We aspire to be the bank of choice for retail clients in Switzerland by delivering value-added services. Currently, we serve one in three Swiss households. Our distribution network comprises around 300 branches, 1,250 automated teller machines including self-service terminals, and four customer service centers as well as state-of-the-art digital banking services. Technology is fundamentally transforming the way we deliver our products and services. We are therefore continuously expanding and enhancing our multi-channel offering and will continue to build on our long tradition as a leader and innovator in digital services to deliver superior client experience, capture market share and increase efficiency. Moreover, we follow a life-cycle-based product approach to provide our clients with tailored solutions to meet their particular needs in their different stages of life. With regard to execution, we ensure a client-focused and efficient sales process.
Our size in Switzerland and the diversity of businesses we operate put us in an advantageous position to serve all our clients’ complex financial needs in an integrated and efficient way. We aim to be the main bank of corporate and institutional clients ranging from small and medium-sized enterprises to multinationals, and from pension funds and commodity traders to banks and insurers. Weserve over 40% of Swiss companies, including more
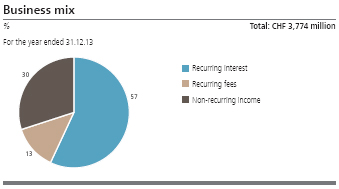
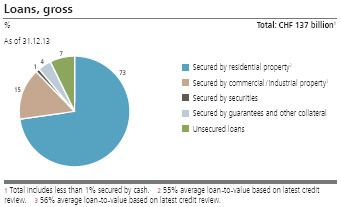
39
Operating environment and strategy
Retail & Corporate
than 85% of the 1,000 largest Swiss corporations, as well as one in three pension funds in Switzerland, including 75 of the largest 100, and 85% of banks domiciled in Switzerland. We strive to further expand and leverage our transaction banking capabilities (for example, payment and cash management services, custody solutions, trade and export finance). In addition, we plan to increase our presence and grow in the commodities trade finance business. Combining the universal bank approach with our local market expertise across all Swiss regions enables us to optimize our client service by providing access to all UBS capabilities.
As the leading retail and corporate banking business in Switzerland, we understand the importance of our role in supporting the needs of our clients. We have successfully implemented structures and processes to simplify our service commitments across the business, including streamlining our processes, reducing the administrative burden on our client advisors and enhancing their long-term productivity without compromising our risk standards.
Continuous development, particularly of our client-facing staff, is a crucial element of our strategy, as this is our key to ensuring superior client service. We are the only bank in Switzerland with a mandatory certification scheme for our client advisors acknowledged by an independent third party.
Organizational structure
We are a core element of UBS Switzerland’s universal bank delivery model, which allows us to extend the expertise of the entire bank to our Swiss retail, corporate and institutional clients. Switzerland is the only country where we operate in retail, corporate and institutional banking, wealth and asset management as well as investment banking.
To ensure consistent delivery throughout Switzerland, the Swiss network is organized into 10 geographical regions. Dedicated management teams in the regions and in the branches derived from all business areas are responsible for executing the universal
bank model, fostering cross-divisional collaboration and ensuring that the public and clients have a uniform experience based on a single corporate image and shared standards of service.
Competitors
In the Swiss retail banking business, our competitors are Raiffeisen, Credit Suisse, the cantonal banks, Postfinance, and other regional and local Swiss banks.
In the Swiss corporate and institutional business, our main competitors are Credit Suisse, the cantonal banks and foreign banks in Switzerland.
Products and services
Our retail clients have access to a comprehensive life-cycle-based offering, comprising easy-to-understand products including cash accounts, payments, savings and retirement solutions, investment fund products, residential mortgages, a loyalty program and advisory services. We provide financing solutions to our corporate clients, offering access to equity and debt capital markets, syndicated and structured credit, private placements, leasing and traditional financing. Our transaction banking offers solutions for payments and cash management services, trade and export finance, receivable finance, as well as global custody solutions to institutional clients. Close collaboration with our client-centric Investment Bank is a key building block in our universal bank strategy that enables us to offer capital market products, foreign exchange products, hedging strategies (currency, interest rates, and commodities) and trading (equities and fixed income, currencies and commodities), as well as to provide corporate finance advice in fields such as mid-market mergers and acquisitions, corporate succession planning and real estate. We also cater to the asset management needs of institutional clients by offering portfolio management mandates, strategy execution and fund distribution.
40
|
Operating environment and strategy |
|
|
Global Asset Management
Global Asset Management is alarge-scale asset manager with diversified businesses across investment capabilities, regions and distribution channels. We offer third-party institutional and wholesale clients and clients of UBS’s wealth management businesses a broad range of investment capabilities and styles across all major traditional and alternative asset classes.
Business
Our investment capabilities encompass equities, fixed income, currency, hedge funds, real estate, infrastructure and private equity. We also enable clients to invest in a combination of different asset classes through multi-asset strategies. Our fund services unit is a global fund administration business. Invested assets totaled CHF 583 billion and assets under administration were CHF 432 billion as of 31 December 2013. We are a leading fund house in Europe, the largest mutual fund manager in Switzerland and one of the leading fund of hedge funds and real estate investment managers in the world.
Strategy
We work closely with our clients in pursuit of their investment goals with long-term performance as our focus. We seek to expand our strong third-party institutional business and grow third-party wholesale distribution. We also remain committed to delivering distinctive products and solutions to clients of UBS’s wealth management businesses.
We offer a broad range of investment capabilities and styles across all major traditional – including indexed – and alternative asset classes.
Over the past few years, we have significantly developed our indexed capabilities, including exchange-traded funds (ETF), to meet growing demand for these strategies from both institutional
and individual investors. Over a quarter of our invested assets now fall into this category. During 2013, we brought together our indexing capabilities under a unified business structure – structured beta and indexing – to fulfill the beta needs of clients across all asset classes.
We also continue to expand our successful alternatives platform, building on our established positions in real estate and fund of hedge funds. During 2013, we split the management of our former alternative and quantitative investments business line into its two constituent parts: O’Connor, the single-manager hedge funds business, and A&Q hedge fund solutions (A&Q), the multi-manager hedge funds business. This split provides clear and focused leadership to accelerate growth in each business. These two businesses continue to be reported together as O’Connor and A&Q.
Overall, our diversified business model has proven resilient to challenging market conditions, has put us in a good position to benefit from shifting market dynamics and provided a solid foundation to capture industry growth opportunities.
Although the asset management industry has experienced a challenging period, the long-term outlook is positive. Three main drivers indicate asset inflows into the industry: (i) demographic shifts resulting in population aging in developed countries that will increase future savings requirements, (ii) governments are continuing to reduce support for pensions and benefits, leading to a greater need for private pension savings and (iii) emerging markets are becoming an ever more important asset pool.
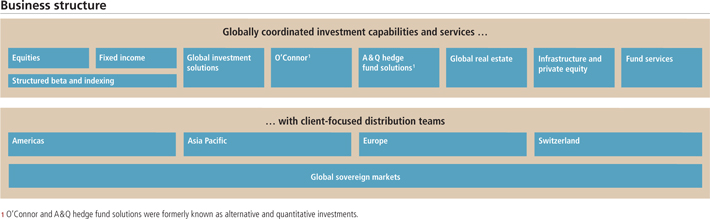
41
Operating environment and strategy
Global Asset Management
Organizational structure
We employ around 3,700 personnel in 24 countries, and have our principal offices in London, Chicago, Frankfurt, Hartford, Hong Kong, New York, Paris, Singapore, Sydney, Tokyo and Zurich. The “Business structure” chart shows our investment and distribution structure.
Significant recent acquisitions, joint ventures and business transfers
| – | | In December 2013, we announced the creation of UBS Grocon, a joint venture with Grocon, Australia’s largest private development and construction firm, to provide investment opportunities in Australian real estate. |
| – | | In December 2012, we announced the sale of our book of Canadian domestic business to Fiera Capital Corporation. The transaction was completed in January 2013. |
| – | | In January 2012, the firm’s Jersey fund services business was transferred to Global Asset Management from Wealth Management. |
| – | | In October 2011, we completed the acquisition of the ING Investment Management Limited business in Australia. This business initially operated as a subsidiary of UBS Global Asset Management (Australia) Ltd and, following the sale of parts of the business, was fully integrated during 2012. |
Competitors
Our competitors include global firms with wide-ranging capabilities and distribution channels, such as JP Morgan Asset Management, BlackRock, Goldman Sachs Asset Management, Morgan Stanley Investment Management, AllianceBernstein Investments and Schroders. Most of our other competitors are regional or local players or firms with a specific asset class focus.
Clients and markets
We serve third-party institutional and wholesale clients, and clients of UBS’s wealth management businesses. As shown in the “Invested assets by channel” chart, as of 31 December 2013 approximately 70% of invested assets originated from third-party clients. These comprised institutional clients, such as corporate and public pension plans, governments and their central banks, and wholesale clients, such as financial intermediaries and distribution partners. UBS’s wealth management businesses represented 30% of invested assets and constituted our largest client relationship.
Products and services
We offer our clients products and services in traditional investments, single- and multi-manager hedge funds, global real estate, infrastructure, private equity, and fund services. The “Investment capabilities and services” chart illustrates the distinct offerings of each investment area. These can be delivered in the form of segregated, pooled and advisory mandates, as well as a broad range of registered investment funds, ETF and other investment vehicles in a wide variety of jurisdictions and across all major asset classes.
| – | | Equities offers a wide spectrum of active investment strategies with varying risk and return objectives. These strategies are delivered by distinct investment teams, each with dedicated research and portfolio construction resources. Our teams are organized around regional capabilities and styles: global, US, Europe, Asia Pacific and emerging markets, and growth. Strategies include core, unconstrained, long/short, small cap, sector, thematic, and other specialized strategies. |
| – | | Fixed income offers a diverse range of active global, regional and local market-based investment strategies. Its capabilities include single-sector strategies such as government and corporate bond portfolios, multi-sector strategies such as core and core |
| | |
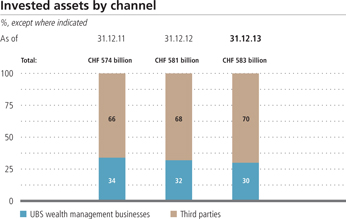
| | 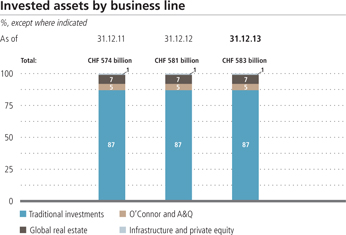
|
|
Operating environment and strategy |
|
|

plus bond, and extended sector strategies such as high yield and emerging market debt. In addition to this suite of traditional fixed income offerings, the team also manages unconstrained fixed income, currency strategies and customized solutions.
| – | | Structured beta and indexingoffers indexed, alternative beta and rules-based strategies across all major asset classes on a global and regional basis. Its capabilities include indexed equities, fixed income, commodities, real estate and alternatives with benchmarks ranging from mainstream to highly customized indices and rules-driven solutions. Products are offered in a variety of structures including ETF, pooled funds, structured funds and mandates. |
| – | | Global investment solutionsoffers active asset allocation, currency, multi-manager, structured solutions, risk advisory and strategic investment advisory services. It manages a wide array of regional and global multi-asset investment strategies across the full investment universe and risk/return spectrum, structured portfolios, convertible bonds and absolute return strategies. |
| | | Through its risk management and strategic investment advisory services, it supports clients in a wide range of investment-related functions. |
| – | | O’Connoris a global, relative value-focused, single-manager hedge fund platform. It is dedicated to providing investors with strong absolute and risk-adjusted returns, differentiated from those available from long-only investment in traditional asset classes. |
| – | | A&Q hedge fund solutions (A&Q)offers a full spectrum of multi-manager hedge fund solutions and advisory services including a wide range of strategies that provide professionally managed exposure to hedge fund investments with tailored risk and return profiles. |
| – | | Global real estateactively manages real estate investments globally and regionally within Asia Pacific, Europe and the US across the major real estate sectors. Its capabilities are focused on core and value-added strategies but also include other strategies across the risk/return spectrum. These are offered |
43
Operating environment and strategy
Global Asset Management
through open- and closed-end private funds, REITs, customized investment structures, multi-manager funds, individually managed accounts and real estate securities.
| – | | Infrastructure and private equity manages direct infrastructure investment and multi-manager infrastructure and private equity strategies for both institutional and private banking clients. Infrastructure asset management manages direct investments in core infrastructure assets globally. Alternative Funds Advisory (AFA) infrastructure and AFA private equity construct broadly diversified fund of funds portfolios across the infrastructure and private equity asset classes, respectively. |
| – | | Fund services, our global fund administration business, offers a comprehensive range of flexible solutions, including fund set-up, reporting and accounting for traditional investment funds, managed accounts, hedge funds, real estate funds, private equity funds and other alternative structures. |
Distribution
As detailed in the “Business structure” chart, our capabilities and services are distributed through our regional business structure in the Americas, Asia Pacific, Europe and Switzerland. This enables clients to access the full resources of our global investment platforms and functions, while providing them at a local level with the investment management products and services they need. In addition, our dedicated global sovereign markets group delivers an integrated approach to ensure sovereign institutions receive the focused advisory, investment and training solutions they require.
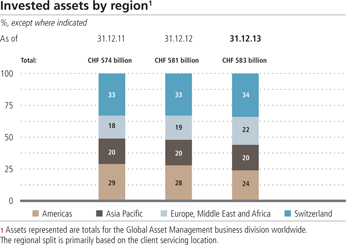
A breakdown of invested assets by client servicing location is shown in the “Invested assets by region” chart.
In Asia Pacific, we have expanded our business through strategic joint ventures. In addition to the abovementioned UBS Grocon joint venture, in Japan, Mitsubishi Corp. – UBS Realty, a real estate investment joint venture with Mitsubishi Corporation, has been in operation since 2001. In China, UBS SDIC Fund Management Co., a joint venture with SDIC Trust & Investment Co., is now in the top third of the onshore asset management market. In South Korea, UBS Hana Asset Management, a joint venture with Hana Bank, is among the top 10 domestic asset management firms.
44
|
Operating environment and strategy |
|
|
Investment Bank
The Investment Bank provides corporate, institutional and wealth management clients with expert advice, innovative solutions, outstanding execution and comprehensive access to the world’s capital markets. We offer financial advisory and capital markets, research, equities, foreign exchange, precious metals and tailored fixed income services in rates and credit through our two business units, Corporate Client Solutions and Investor Client Services.
Business
The Investment Bank is organized as two distinct but aligned business units:
Corporate Client Solutions includes all advisory and financing solutions businesses, origination, structuring and execution, including equity and debt capital markets in service of corporate, financial institution, sponsor clients and Wealth Management.
Investor Client Services includes execution, distribution and trading for institutional investors and provides support to Corporate Client Solutions and UBS’s wealth management businesses. It comprises our equities businesses, including cash, derivatives and financing services, cross-asset class research capabilities and our foreign exchange franchise, precious metals, rates and credit businesses. The Investor Client Services unit also provides distribution and risk management capabilities required to support all of our businesses.
Strategy
In the first quarter of 2013, we re-shaped our strategy and organizational model to capitalize on our traditional strengths in advisory, capital markets, equities and foreign exchange businesses, while re-focusing our rates and credit platform on areas that offer the most attractive opportunities. Following this, and consistent with our October 2012 announcement to significantly accelerate the implementation of our strategy, we exited products and services which were capital- and balance sheet-intensive, exhibited higher operational complexity and were not required for serving our wealth management or Corporate Client Solutions clients. In addition, foreign exchange, rates and credit businesses were brought under one unit within Investor Client Services to leverage their combined client base, technology, risk and operational control management, as well as expertise in different areas.
We believe the strategic transformation of our business differentiates us by capitalizing on our traditional strengths. Our clients continue to benefit from our expertise, intellectual capital and global execution. Our client-centric business model makes us an ideal partner to our wealth management businesses, Retail & Corporate and Global Asset Management, and positions us to provide our clients with an integrated, solutions-led approach, combined with deep market insight, intellectual capital and global coverage and execution.
Our Corporate Client Solutions business unit is comprised of our advisory and capital markets businesses and financing solutions, which target industries and geographies that offer the best opportunities to meet our long-term strategy. We have a presence in all major financial markets, with coverage based on a comprehensive matrix of country, sector and product banking professionals.
Within our Investor Client Services business unit, our equities business continues to leverage its global distribution platform and product expertise while seeking further operational efficiencies. Foreign exchange and precious metals businesses, underpinned by a world-class platform, continue to be a cornerstone of our services. Consistent with our strategy, our rates and credit platform is focused on client flow and solutions business. It serves our capital markets business through an intermediation model, much like in our equities and foreign exchange platforms.
To ensure the successful execution of our strategy, we will continue to invest in technology and selectively recruit talent in key areas across the business. Furthermore, we will remain focused on our ongoing cost reduction programs and on strengthening our operational risk framework. In 2013, we made a number of key strategic hires to strengthen our leadership team further and enhance our ability to execute our strategy in 2014 and beyond. We continued to optimize internal efficiencies through the implementation of a targeted technology plan, which is based on a long-term portfolio
45
Operating environment and strategy
Investment Bank
approach across businesses aimed at enhancing the effectiveness of our platform for clients. These structural changes are expected to contribute to the Group-wide effort to increase efficiency. In addition, and on a selective basis, we will continue to undertake specific initiatives to simplify our production processes, achieve leaner front-to-back processes, and operate with a reduced real-estate footprint.
To support our goal of earning attractive returns on allocated capital resources, we operate within a tightly controlled matrix of balance sheet, risk-weighted assets, leverage ratio denominator and other risk metrics (e.g., value-at-risk and liquidity adjusted stress). Consistent with this, we assess both the Investor Client Services and Corporate Client Solutions business units based on the returns they generate.
Organizational structure
As of the end of 2013, we employed approximately 11,615 personnel in over 35 countries. We operate through branches and subsidiaries of UBS AG. Securities activities in the US are conducted through UBS Securities LLC, a registered broker-dealer.
Significant recent acquisitions
In February 2013, after receiving the required regulatory approvals from the Brazilian government, UBS finalized its acquisition of Link Investimentos, a Brazilian financial services firm. UBS had entered into the agreement to acquire Link Investimentos in 2010. The acquisition demonstrates our commitment to the emerging markets and allows us to provide wealth management and investment banking services to private and institutional clients in Brazil, one of the world’s fastest growing economies.
Competitors
Our Investment Bank’s strategy and scope is unique, but other competing firms are active in many of the businesses and markets in which we still participate. For our leading equities, foreign exchange and corporate advisory businesses, our main competitors remain the major global investment banks, including Bank of America Merrill Lynch, Barclays Capital, Citigroup, Credit Suisse, Deutsche Bank, Goldman Sachs, JP Morgan Chase and Morgan Stanley.
Products and services
Corporate Client Solutions
This includes client coverage, advisory, debt and equity capital market solutions and financing solutions for corporate, financial institution and sponsor clients. Corporate Client Solutions works closely with Investor Client Services in the distribution and risk management of capital markets products and financing solutions. With a presence in all major financial markets, it is managed by region and is organized on a matrix of country, industry sector and product banking professionals. Its main business lines are as follows:
| – | | Advisory provides bespoke solutions to our clients’ most complex strategic problems. This includes mergers and acquisitions |
| | | advice and execution, as well as refinancing, spin-offs, exchange offers, leveraged buyouts, joint ventures, takeover defense, corporate broking and other advisory services. |
| – | | Equity capital markets offers equity capital-raising services, as well as related derivative products and risk management solutions. Its services include managing initial public offerings, follow-ons including rights issues and block trades, equity-linked transactions and other strategic equities solutions. |
| – | | Debt capital markets helps corporate and financial institution clients in raising debt capital including investment grade and emerging market bonds, high-yield bonds, subordinated debt and hybrid capital. It also provides leveraged capital services, which include event-driven (acquisition, leveraged buy-out) loans, bonds and mezzanine financing. All debt products are provided alongside risk management solutions, including derivatives in close collaboration with our foreign exchange, rates and credit businesses. |
| – | | Financing solutions serves corporate and investor clients across the globe by providing customized solutions across asset classes via a wide range of financing capabilities including structured financing, real estate finance and special situations. |
| – | | Risk management includes corporate lending and associated hedging activities. |
Investor Client Services
Investor Client Services, which includes our equities business and our foreign exchange, rates and credit business, provides a comprehensive distribution platform with enhanced cross-asset delivery as well as specialist skills to our corporate, institutional and wealth management clients.
Equities
We are one of the world’s largest equities houses and a leading participant in the primary and secondary markets for cash equities and equity derivatives. We provide a full front-to-back product suite globally, including financing, execution, clearing and custody services. Our franchise employs a client-centric approach to serve hedge funds, asset managers, wealth management advisors, financial institutions and sponsors, pension funds, sovereign wealth funds and corporations globally. We distribute, structure, execute, finance and clear cash equity and equity derivative products. Our research franchise provides in-depth investment analysis on companies, sectors, regions, macroeconomic trends, public policy and asset-allocation strategies. The main business lines of the equities unit are as follows:
| – | | Cash provides clients with liquidity, investment advisory, trade execution and consultancy services, together with comprehensive access to primary and secondary markets, corporate management and subject matter experts. We offer full-service trade execution for single stocks and portfolios, including capital commitment, block trading, small cap execution and commission management services. In addition, we provide clients with a full suite of advanced electronic trading products, direct market access to over 150 venues worldwide, including low-latency execution, |
46
|
Operating environment and strategy |
|
|
innovative algorithms and pre-, post- and real-time analytical tools. Our broker and intermediary services franchise offers execution and price improvement to retail wholesalers.
| – | | Derivatives provides a full range of flow and structured products, convertible bonds and strategic equity solutions with global access to primary and secondary markets. It enables clients to manage risk and meet funding requirements through a wide range of listed, over-the-counter, securitized and fund-wrapped products. We create and distribute structured products and notes for institutional and retail investors with investment returns linked to companies, sectors and indices across multiple asset classes, including commodities. |
| – | | Financing services provides a fully integrated platform for our hedge fund clients, including prime brokerage, capital introduction, clearing and custody, synthetic financing and securities lending. In addition, we execute and clear exchange-traded derivatives across equities, fixed income and commodities in more than 60 markets globally. |
Foreign exchange, rates and credit
This unit consists of our leading foreign exchange franchise and our market-leading precious metals business, as well as our repositioned rates and credit businesses. These businesses support the execution, distribution and risk management related to corporate and institutional client businesses, and also meet the needs of private wealth management clients via targeted intermediaries. The main business lines are as follows:
| – | | Foreign exchange provides a full range of G10 and emerging markets currency and precious metals services globally. We are a leading foreign exchange market-maker in the professional spot, forwards and options markets. We provide clients worldwide with first-class execution facilities (voice, electronic, algorithmic) |
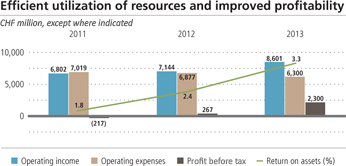
coupled with premier advisory and structuring capabilities when tailored solutions best fit our clients’ positioning, hedging or liquidity management. Our presence in physical and non-physical precious metals markets has endured for almost a century. Our award-winning teams provide quality, security and competitive pricing supported by a client-centric, one-stop-shop approach that offers trading, investing and hedging across the spectrum of gold-, silver-, platinum- and palladium-related offerings.
| – | | Rates and credit encompasses sales and trading in a selected number of credit and rates products, such as standardized rates-driven products, interest rate swaps, medium-term notes, government and corporate bonds as well as bank notes and bespoke solutions for clients. Our offering includes market-making capabilities in areas required to support our businesses in foreign exchange and equities, as well as our corporate and investor client base. |
47
Operating environment and strategy
Corporate Center
Corporate Center
The Corporate Center comprises Corporate Center – Core Functions and Corporate Center – Non-core and Legacy Portfolio. Corporate Center – Core Functions enables the firm to operate cohesively and effectively by providing and managing support and control functions to the Group and business divisions. Corporate Center – Non-core and Legacy Portfolio manages the exit and wind-down of the non-core businesses and legacy positions previously part of the Investment Bank.
Our objectives
Corporate Center – Core Functions provides our business divisions with Group-level control in the areas of finance, risk, legal, compliance and Group-wide shared services functions, comprising support and logistics functions. We strive to maintain effective corporate governance processes, including compliance with relevant regulations and ensuring an appropriate balance between risk and return. The Corporate Center also encompasses our Non-core and Legacy Portfolio unit, which comprises the non-core businesses and legacy positions previously part of the Investment Bank.
At the end of 2013, there were 24,082 employees working across all Corporate Center functions including Non-core and Legacy Portfolio. Corporate Center – Core Functions allocates the majority of its treasury income, operating expenses and personnel associated with control and shared services functions to the businesses for which the respective services are performed based on service consumption and financial resource usage.
Corporate Center – Core Functions provides Group-wide control functions, including finance, risk control (including compliance) and legal, and shared services functions. The shared services and other central functions comprise information technology, operations, human resources, corporate development, regulatory relations and strategic initiatives, communications and branding, corporate real estate and administrative services, procurement, physical security as well as information security, offshoring and treasury services such as funding, balance sheet and capital management.
To further enhance cost discipline and strengthen our efforts to reduce our underlying cost base, starting in 2014 we will refine the way that operating costs for internal services are allocated from Corporate Center – Core Functions to the business divisions and Corporate Center – Non-core and Legacy Portfolio. Under this refinement, each year, as part of the annual business planning cycle, Corporate Center – Core Functions will agree with the business divisions and Non-core and Legacy Portfolio cost allocations for services at fixed amounts or at variable amounts based on formulas, depending on capital and service consumption levels as well as the nature of the services to be performed. Corporate Center – Core Functions will be responsible for any differences between actual costs and the pre-agreed amounts.
| | è | | Refer to the “Significant accounting and financial reporting changes” section of this report for more information on this refinement to our cost allocation approach |
Corporate Center – Non-core and Legacy Portfolio comprises the non-core businesses and legacy positions previously part of the Investment Bank, and is overseen by a committee consisting of the Group Chief Executive Officer, the Group Chief Financial Officer and the Group Chief Risk Officer. Its businesses and positions are being managed and exited over time with the objective of maximizing shareholder value, in line with our strategic plan.
We established clear priorities for regions, counterparties and product lines and have developed detailed wind-down plans with the objective of achieving capital benefits at optimized cost. Corporate Center – Non-core and Legacy Portfolio works closely with sales managers and bankers in the Investment Bank as well as with trading market contacts in attempting to execute the most appropriate strategy for each situation, and has built strong management information systems to track the progress of risk-weighted assets (RWA) and leverage ratio denominator reductions and exit costs.
The wind-down and exit strategies include negotiated bilateral settlements with specific counterparties, third-party novations, including transfers to central clearing houses, agreements to net down trades with other dealer counterparties and portfolio sales. Significant simplification of books and trades also contributed to our strong progress, and dynamic risk management and hedging of positions effectively mitigated profit and loss volatility in the portfolio.
During 2013, we exercised our option to acquire the SNB StabFund’s equity, which was part of the Legacy Portfolio. This resulted in a CHF 2.1 billion increase in our common equity tier 1 capital as the capital deduction related to the fair value of the option is no longer applicable. Fully applied RWA for Corporate Center– Non-core and Legacy Portfolio of CHF 64 billion as of 31 December 2013 were significantly ahead of our target of CHF 85 billion by year-end 2013. As of 31 December 2013, a total of 1,585 personnel were employed within Corporate Center – Non-core and Legacy Portfolio including the SNB StabFund investment management team, compared with 2,304 as of 31 December 2012.
Structure of Corporate Center – Core Functions
Group Chief Financial Officer
Our Group Chief Financial Officer (Group CFO) is responsible for ensuring transparency in, and the assessment of, the financial performance of our Group and business divisions and for the
|
Operating environment and strategy |
|
|
Group’s financial reporting, forecasting, planning and controlling processes. He also provides advice on financial aspects of strategic projects and transactions. The Group CFO has management responsibility over divisional and Group financial control functions. The Group CFO is responsible for management and control of the Group’s tax affairs and for treasury and capital management, including management and control of funding and liquidity risk and UBS’s regulatory capital ratios. After consultation with the Audit Committee of the Board of Directors (BoD), our Group CFO makes proposals to the BoD regarding the standards for accounting adopted by UBS and defines the standards for financial reporting and disclosure. Together with the Group Chief Executive Officer (Group CEO), the Group CFO provides external certifications under sections 302 and 404 of the Sarbanes-Oxley Act of 2002, and, in coordination with the Group CEO, manages relations with analysts and investors. Effective January 2014, the Corporate Development function, previously within the Group Chief Operating Officer area, is part of the Group CFO area.
Group Chief Operating Officer
Our Group Chief Operating Officer (Group COO) manages the shared services functions of our Group, which in 2013 included the management and control of Group-wide operations, information technology, human resources, corporate development, Group regulatory relations and strategic initiatives, communications and branding, corporate real estate and administrative services, procurement, physical and information security, and offshoring. In addition, the Group COO supports the Group CEO in developing our strategy and addressing regulatory and strategic issues. Effective January 2014, the Group COO area consists of Group Technology, Group Operations, Group Corporate Services and the Group’s Industrialization program. Group Human Resources, Communications & Branding and Group Regulatory Relations & Strategic Initiatives report directly to the Group CEO. Corporate Development is integrated in the Group CFO area.
Group Chief Risk Officer
Our Group Chief Risk Officer (Group CRO) develops and implements principles and appropriate independent control frameworks for credit, market, country and operational risks within the Group. In particular, the Group CRO formulates and implements the frameworks for risk capacity and appetite, risk measurement, portfolio controls and risk reporting, and has management responsibility over the divisional and Group risk control functions. He implements the risk control mechanisms as determined by the BoD, the BoD Risk Committee or the Group CEO. In addition, the Group CRO approves transactions, positions, exposures, portfolio limits and certain provisions in accordance with the delegated risk control authorities, and monitors and challenges the firm’s risk-taking activities. In January 2014, the compliance and operational risk organizations were brought together to form a single function focused on the control of our regulatory, conduct and operational risks across all business divisions. This integrated unit reports to the Group CRO. Also effective January 2014, our Group Security Services function became part of the Group CRO area.
Group General Counsel
Our Group General Counsel (Group GC) is responsible for legal matters, policies and processes, and for managing the legal function of our Group. The Group GC is responsible for reporting legal risks and material litigation, and for managing litigation, internal, special and regulatory investigations. The Group GC assumes responsibility for legal oversight in respect of the Group’s key regulatory interactions and for maintaining relationships with our key regulators with respect to legal matters. Until the end of 2013, the Group GC was also responsible for compliance matters and for managing the compliance organization. Effective January 2014, the compliance organization is integrated into the Group CRO area.
49
Operating environment and strategy
Regulation and supervision
Regulation and supervision
The Swiss Financial Market Supervisory Authority (FINMA) is UBS’s home country regulator and consolidated supervisor. As a financial services provider with a global footprint, we are also regulated and supervised by the relevant authorities in each of the jurisdictions in which we conduct business. The following sections summarize the key regulatory requirements and supervision of our business in Switzerland as well as in the US and the UK, our next two largest areas of operation.
Regulation and supervision in Switzerland
The Swiss Federal Law on Banks and Savings Banks of 8 November 1934, as amended (Banking Act), and the related Swiss Federal Ordinance on Banks and Savings Banks of 17 May 1972, as amended (Banking Ordinance), provide the legal basis for banking in Switzerland. Based on the license obtained under this framework, we may engage in a full range of financial services activities, including retail banking, commercial banking, investment banking and asset management in Switzerland. The Banking Act, Banking Ordinance and the Financial Market Supervision Act of 22 June 2007, as amended, establish a framework for supervision by FINMA, empowering it to issue its own ordinances and circulars, which contribute to shaping the Swiss legal and regulatory framework for banks.
In 2010, the Swiss Federal Council and FINMA incorporated the enhancements to the Basel Capital Accord issued by the Basel Committee on Banking Supervision on 13 July 2009 (so-called Basel 2.5) into the Capital Adequacy Ordinance of 29 September 2006 (and related circulars). The enhanced capital adequacy rules became effective on 1 January 2011. In autumn 2011, the Swiss Parliament amended the legal framework for banks to address the lessons learned from the financial crisis and, in particular, the “too-big-to-fail” issue. The amended sections are applicable to the largest Swiss banks, including UBS, and contain specific capital requirements and provisions to ensure that systemically relevant functions can be maintained in case of insolvency. In addition, and in line with global requirements, we are required to produce and update recovery plans and resolution planning materials aimed at increasing the firm’s resilience further in the case of a crisis, and provide FINMA and other regulators with information on how the firm could be resolved in the event of an unsuccessful recovery. These new sections entered into force on 1 March 2012. Switzerland implemented the Basel III Accord by means of a complete review of the Capital Adequacy Ordinance and related FINMA rules. In addition, a number of other amendments have been made to the Banking Ordinance and the Capital Adequacy Ordinance, which came into effect on 1 January 2013.
| | è | | Refer to the “Capital management” section of this report for more information on capital requirements |
The Federal Act of 10 October 1997 on the Prevention of Money Laundering in the Financial Sector defines a common standard for due diligence obligations to prevent money laundering for the whole financial sector.
The legal basis for the investment funds business in Switzerland is the Swiss Federal Act on Collective Investment Schemes (Collective Investment Schemes Act) of 23 June 2006, which came into force on 1 January 2007. FINMA, as supervisory authority for investment funds in Switzerland, is responsible for the authorization and supervision of the institutions and investment funds subject to its control.
In our capacity as a securities broker and as an issuer of shares listed in Switzerland, we are governed by the Federal Act on Stock Exchanges and Securities Trading of 24 March 1995. FINMA is the competent supervisory authority with respect to securities broking.
FINMA fulfills its statutory supervisory responsibilities through licensing, regulation, monitoring and enforcement. Generally, prudential supervision in Switzerland is based on a division of tasks between FINMA and authorized audit firms. Under this two-tier supervisory system, FINMA has responsibility for overall supervision and enforcement measures while the authorized audit firms carry out official duties on behalf of FINMA. The responsibilities of external auditors encompass the audit of financial statements, the risk-based assessment of banks’ compliance with prudential requirements and on-site audits.
We are classified as a Swiss systemically relevant bank (SRB) due to our size, complexity, organization and business activities, as well as our importance to the financial system. As a Swiss SRB, we are subject to more rigorous supervision than most other banks. We are directly supervised by the FINMA group “Supervision of UBS,” which is supported by teams specifically monitoring investment banking activities, risk management and legal matters as well as solvency and capital aspects. FINMA’s supervisory tools include meetings with management at group and divisional level, reporting requirements encompassing control and business areas, on-site reviews in Switzerland and abroad, and exchanges with internal audit and host supervisors in other jurisdictions. In recent years, FINMA has implemented the recommendations issued by the Financial Stability Board and the Basel Committee on Banking Supervision, and complemented the Supervisory College with the
50
|
Operating environment and strategy |
|
|
UK Financial Services Authority (FSA) and the Federal Reserve Bank of New York (FRBNY), established in 1998 to promote supervisory cooperation and coordination, with a General Supervisory College – including more than a dozen of UBS host regulatory agencies – and a Crisis Management College, which is also attended by representatives from the Swiss National Bank (SNB) and the Bank of England.
The SNB contributes to the stability of the financial system through macro-prudential measures and monetary policy, also providing liquidity to the banking system. It does not exercise any banking supervision authority and is not responsible for enforcing banking legislation, but works together with FINMA in the following areas: (i) assessment of the soundness of Swiss SRB, (ii) regulations that have a major impact on the soundness of banks, including liquidity, capital adequacy and risk distribution provisions, where they are of relevance for financial stability and (iii) contingency planning and crisis management. FINMA and the SNB exchange information and share opinions about the soundness of the banking sector and Swiss SRB, and are authorized to exchange information and documents that are not publicly accessible if they require these in order to fulfill their tasks. With regard to Swiss SRB, the SNB may also carry out its own enquiries and request information directly from the banks. In addition, the SNB has been tasked by Parliament with the designation of Swiss SRB and their systemically relevant functions in Switzerland. Currently, UBS, Credit Suisse and, since 1 November 2013, Zürcher Kantonalbank are required to comply with specific Swiss SRB rules.
| | è | | Refer to the “Regulatory and legal developments” and “Risk factors” sections of this report for more information |
Regulation and supervision in the US
Our operations in the US are subject to a variety of regulatory regimes. UBS maintains branches and representative offices in several states, including Connecticut, Illinois, New York, California and Florida. These branches are licensed either by the Office of the Comptroller of the Currency (OCC) or the state banking authority of the state in which the branch is located. The representative offices are licensed by the OCC. Each US branch and representative office is subject to regulation and supervision, including on-site examination, and to licensing and supervision by the Board of Governors of the Federal Reserve System (FRS). We also maintain state- and federally-chartered trust companies and a Federal Deposit Insurance Corporation (FDIC)-insured depository institution (IDI) subsidiary, which are licensed and regulated by state regulators or the OCC. Only the deposits of our IDI, headquartered in the state of Utah, are insured by the FDIC. The regulation of our US branches and subsidiaries imposes activity and prudential restrictions on the business and operations of those branches and subsidiaries, including limits on extensions of credit to a single borrower and on transactions with affiliates.
The licensing authority of each state-licensed US branch of UBS may, in certain circumstances, take possession of the business and property of UBS located in the state of the UBS offices it licenses.
Such circumstances generally include violations of law, unsafe business practices and insolvency. As long as we maintain one or more federal branches licensed by the OCC, the OCC also has the authority to take possession of all the US operations of UBS under broadly similar circumstances, as well as in the event that a judgment against a federally licensed branch remains unsatisfied. This federal power may pre-empt the state insolvency regimes that would otherwise be applicable to our state-licensed branches. As a result, if the OCC exercised its authority over the US branches of UBS pursuant to federal law in the event of a UBS insolvency, all US assets of UBS would generally be applied first to satisfy creditors of these US branches as a group, and then made available for application pursuant to any Swiss insolvency proceeding.
Because we maintain branches in the US, we are subject to oversight regulation and supervision by the FRS under various laws (including the International Banking Act of 1978, the Federal Reserve Act of 1913 and the Bank Holding Company Act of 1956 (BHCA), each as amended, and related regulations). On 10 April 2000, UBS was designated a “financial holding company” under the BHCA, as amended by the Gramm-Leach-Bliley Act of 1999. Financial holding companies may engage in a broader spectrum of activities than holding companies of US banks or foreign banking organizations that are not financial holding companies. These activities include expanded authority to underwrite and deal in securities and commodities and to make merchant banking investments in commercial and real estate entities. To maintain our financial holding company status, (i) the Group, our US subsidiary federally-chartered trust company (Federal Trust Company) and our IDI are required to meet certain capital ratios, (ii) our US branches, our Federal Trust Company, and our IDI are required to maintain certain examination ratings, and (iii) our IDI is required to maintain a rating of at least “satisfactory” under the Community Reinvestment Act of 1977.
A major focus of US governmental policy relating to financial institutions in recent years has been combating money laundering and terrorist financing. Regulations applicable to UBS and our subsidiaries require the maintenance of effective policies, procedures and controls to detect, prevent and report money laundering and terrorist financing, and to verify the identity of our clients. As a result, failure to maintain and implement adequate programs to prevent money laundering and terrorist financing could result in significant legal and reputational risk.
In the US, UBS Securities LLC and UBS Financial Services Inc., as well as our other US-registered broker-dealer subsidiaries, are subject to laws and regulations that cover all aspects of the securities and futures business, including: sales and trading practices, use and safekeeping of clients’ funds and securities, capital requirements, record-keeping, financing of clients’ purchases of securities and other assets, and the conduct of directors, officers and employees.
These entities are regulated by a number of different government agencies and self-regulatory organizations, including the Securities and Exchange Commission (SEC) and the Financial Industry Regulatory Authority (FINRA). Each entity is also regulated
Operating environment and strategy
Regulation and supervision
by some or all of the following: the New York Stock Exchange (NYSE), the Municipal Securities Rulemaking Board, the US Department of the Treasury, the Commodities Futures Trading Commission (CFTC) and other exchanges of which it may be a member, depending on the specific nature of the respective broker-dealer’s business. In addition, the US states and territories have local securities commissions that regulate and monitor activities in the interest of investor protection. These regulators have a variety of sanctions available, including the authority to conduct administrative proceedings that can result in censure, fines, the issuance of cease-and-desist orders or the suspension or expulsion of the broker-dealer or its directors, officers or employees.
FINRA is dedicated to investor protection and market integrity through effective regulation and complementary compliance and technology-based services. FINRA covers a broad spectrum of securities matters, including: registering and educating industry participants, examining securities firms, writing rules, enforcing those rules and the federal securities laws, informing and educating the investing public, providing trade reporting and other industry utilities, and administering a dispute resolution forum for investors and registered firms. It also performs market regulation under contract for the NASDAQ Stock Market and the NYSE. The SEC’s mission is to protect investors, maintain fair, orderly, and efficient markets, and facilitate capital formation. The SEC oversees the key participants in the securities world, including securities exchanges, securities brokers and dealers, investment advisors, and mutual funds. UBS Global Asset Management (Americas) Inc., and our other US-registered investment adviser entities, are subject to regulations that cover all aspects of the investment advisory business and are regulated primarily by the SEC. Some of these entities are also registered as commodity trading advisers (CTA) and/or commodity pool operators (CPO) and in connection with their activities as CTA and/or CPO are regulated by the CFTC. To the extent these entities manage plan assets of employee benefit plans subject to the Employee Retirement Income Security Act of 1974, their activities are subject to regulation by the US Department of Labor.
The Dodd-Frank Wall Street Reform and Consumer Protection Act of 2010 (Dodd-Frank Act) impacts the financial services industry by addressing, among other issues, the following: (i) systemic risk oversight, (ii) bank, bank holding company, and other systemically important financial institution (SIFI) capital and prudential standards, (iii) resolution and liquidation of failing SIFIs, (iv) over-the-counter derivatives, (v) the ability of deposit-taking banks and their affiliates to engage in proprietary trading activities and invest in hedge funds and private equity (the Volcker Rule), (vi) consumer and investor protection, (vii) hedge fund registration, (viii) securitization,
(ix) investment advisors, (x) shareholder “say on pay” and (xi) the role of credit-rating agencies. Many of the provisions of the Dodd-Frank Act affect the operation of UBS’s US banking and non-banking entities and have extraterritorial reach. The details of the legislation and its impact on UBS’s operations will depend on the final regulations being adopted by various agencies and oversight boards.
| | è | | Refer to the “Regulatory and legal developments” and “Risk factors” sections of this report for more information |
Regulation and supervision in the UK
With the UK government having separated responsibility for prudential regulation and conduct of business regulation in early 2013, our operations in the UK are mainly regulated by two bodies: the Prudential Regulation Authority (PRA), newly established as an affiliated authority of the Bank of England, and the Financial Conduct Authority (FCA). The PRA’s main objective towards the banking sector is to promote the safety and soundness of UK-regulated financial firms. The FCA is responsible for securing an appropriate degree of consumer protection, protecting the integrity of the UK financial system and promoting effective competition in the interest of consumers.
The PRA and FCA operate a risk-based approach to supervision and have a wide variety of supervisory tools available to them, including regular risk assessments, on-site inspections (which may relate to an industry-wide theme or be firm-specific) and the ability to commission reports by skilled persons (who may be the firm’s auditors, information technology specialists, lawyers or other consultants as appropriate). The UK regulators also have an extremely wide set of sanctions at their disposal, which may be imposed under the Financial Services and Markets Act (FSMA).
Some of our subsidiaries and affiliates are also regulated by the London Stock Exchange and other UK securities and commodities exchanges of which they are a member. We are also subject to the requirements of the UK Panel on Takeovers and Mergers, where relevant.
Financial services regulation in the UK is conducted in accordance with EU directives which require, among other things, compliance with certain capital adequacy standards, client protection requirements and conduct of business rules (such as the Markets in Financial Instruments Directive I). These directives apply throughout the EU and are reflected in the regulatory regimes of the various member states.
| | è | | Refer to the “Regulatory and legal developments” and “Risk factors” sections of this report for more information |
52
|
Operating environment and strategy |
|
|
Risk factors
Certain risks, including those described below, may impact our ability to execute our strategy and affect our business activities, financial condition, results of operations and prospects. Because the business of a broad-based international financial services firm such as UBS is inherently exposed to risks that become apparent only with the benefit of hindsight, risks of which we are not presently aware or which we currently do not consider to be material could also impact our ability to execute our strategy and affect our business activities, financial condition, results of operations and prospects. The sequence in which the risk factors are presented below is not indicative of their likelihood of occurrence or the potential magnitude of their consequences.
Regulatory and legislative changes may adversely affect our business and ability to execute our strategic plans
Fundamental changes in the laws and regulations affecting financial institutions can have a material and adverse effect on our business. In the wake of the 2007–2009 financial crisis and the following instability in global financial markets, regulators and legislators have proposed, have adopted, or are actively considering, a wide range of changes to these laws and regulations. These measures are generally designed to address the perceived causes of the crisis and to limit the systemic risks posed by major financial institutions. They include the following:
| – | | significantly higher regulatory capital requirements; |
| – | | changes in the definition and calculation of regulatory capital; |
| – | | changes in the calculation of risk-weighted assets (RWA); |
| – | | the introduction of a more demanding leverage ratio; |
| – | | new or significantly enhanced liquidity requirements; |
| – | | requirements to maintain liquidity and capital in jurisdictions in which activities are conducted and booked; |
| – | | limitations on principal trading and other activities; |
| – | | new licensing, registration and compliance regimes; |
| – | | limitations on risk concentrations and maximum levels of risk; |
| – | | taxes and government levies that would effectively limit balance sheet growth or reduce the profitability of trading and other activities; |
| – | | cross-border market access restrictions; |
| – | | a variety of measures constraining, taxing or imposing additional requirements relating to compensation; |
| – | | adoption of new liquidation regimes intended to prioritize the preservation of systemically significant functions; |
| – | | requirements to adopt structural and other changes designed to reduce systemic risk and to make major financial institutions easier to manage, restructure, disassemble or liquidate, including ring-fencing certain activities and operations within separate legal entities; and |
| – | | requirements to adopt risk governance structures at a local jurisdiction level. |
Many of these measures have been adopted and their implementation had a material effect on our business. Others will be implemented over the next several years; some are subject to legislative action or to further rulemaking by regulatory authorities before final implementation. As a result, there remains a high level of uncertainty regarding a number of the measures referred to above, including whether (or the form in which) they will be adopted, the timing and content of implementing regulations and interpretations and/or the dates of their effectiveness. The implementation of such measures and further, more restrictive changes may materially affect our business and ability to execute our strategic plans.
Notwithstanding attempts by regulators to coordinate their efforts, the measures adopted or proposed differ significantly across the major jurisdictions, making it increasingly difficult to manage a global institution. The absence of a coordinated approach, moreover, disadvantages institutions headquartered in jurisdictions that impose relatively more stringent standards. Switzerland has adopted capital and liquidity requirements for its major international banks that are the strictest among the major financial centers. This could disadvantage Swiss banks such as UBS when they compete with peer financial institutions subject to more lenient regulation or with unregulated non-bank competitors.
Regulatory and legislative changes in Switzerland
In September 2011, the Swiss Parliament adopted the “too-big-to-fail” (TBTF) law to address the issues posed by large banks. The law became effective on 1 March 2012. Accordingly, Swiss regulatory changes have generally proceeded more quickly than those in other major jurisdictions, and the Swiss Financial Market Supervisory Authority (FINMA), the Swiss National Bank (SNB) and the Swiss Federal Council are implementing requirements that are significantly more onerous and restrictive for major Swiss banks, such as UBS, than those adopted or proposed by regulatory authorities in other major global financial centers.
Capital regulation: The provisions of the revised banking ordinance and capital adequacy ordinance implementing the Basel III capital standards and the Swiss TBTF law became effective on 1 January 2013. As a systemically relevant Swiss bank, we are subject to base capital requirements, as well as a “progressive buffer” that scales with our total exposure (a metric that is based on our balance sheet size) and market share in Switzerland. In addition, the Swiss governmental authorities have the authority to impose an additional countercyclical buffer capital requirement of up to 2.5% of RWA. This authority has been exercised to impose an additional capital charge of 1% in respect of RWA arising
53
Operating environment and strategy
Risk factors
from Swiss residential mortgage loans (increasing to 2% effective from the end of June 2014). In addition, UBS and FINMA have mutually agreed to an incremental operational capital requirement to be held against litigation, regulatory and similar matters and other contingent liabilities, which added CHF 22.5 billion to our RWA at 31 December 2013. There can be no assurance that we will not in the future be subject to increases in capital requirements either from the imposition of additional requirements or changes in the calculation of RWA or other components of the existing minimum capital requirement.
Liquidity and funding: We are required to maintain a Liquidity Coverage Ratio (LCR) of high-quality liquid assets to estimated stressed short-term funding outflows and will be required to maintain a Net Stable Funding Ratio (NSFR) intended to ensure that we are not overly reliant on short-term funding and that we have sufficient long-term funding for illiquid assets. We currently calculate these ratios under supervisory guidance from FINMA, as neither the international nor Swiss standards for the calculation of these requirements have been fully implemented. These requirements, together with liquidity requirements imposed by other jurisdictions in which we operate, will likely require us to maintain substantially higher levels of overall liquidity. Increased capital requirements and higher liquidity requirements make certain lines of business less attractive and may reduce our overall ability to generate profits. The LCR and NSFR calculations make assumptions about the relative likelihood and amount of outflows of funding and available sources of additional funding in a market or firm-specific stress situation. There can be no assurance that in an actual stress situation our funding outflows would not exceed the assumed amounts.
Resolution planning and resolvability: The revised banking act and capital adequacy ordinances provide FINMA with additional powers to intervene to prevent a failure or resolve a failing financial institution. These measures may be triggered when certain thresholds are breached and permit the exercise of considerable discretion by FINMA in determining whether, when or in what manner to exercise such powers. In case of a threatened insolvency, FINMA may impose more onerous requirements on us, including restrictions on the payment of dividends and interest. Although the actions that FINMA may take in such circumstances are not yet defined, we could be required directly or indirectly, for example, to alter our legal structure (e.g., to separate lines of business into dedicated entities, with limitations on intra-group funding and certain guarantees), or to further reduce business risk levels in some manner. The banking act also provides FINMA with the ability to extinguish or convert to common equity the liabilities of a bank in connection with its resolution.
Swiss TBTF requirements require systemically important banks, including UBS, to put in place viable emergency plans to preserve the operation of systemically important functions despite a failure of the institution, to the extent that such activities are not sufficiently separated in advance. The Swiss TBTF law provides for the possibility of a limited reduction of capital requirements for systemically important institutions that adopt measures to reduce resolvability
risk beyond what is legally required. Such actions would likely include an alteration of the legal structure of a bank group in a manner that would insulate parts of the group to exposure from risks arising from other parts of the group thereby making it easier to dispose of certain parts of the group in a recovery scenario, to liquidate or dispose of certain parts of the group in a resolution scenario or to execute a debt bail-in. In view of these factors, we intend to establish a new banking subsidiary of UBS AG in Switzerland. The scope of this potential future subsidiary’s business is still being determined, but we would currently expect it to include our Retail & Corporate business division and likely the Swiss-booked business within our Wealth Management business division. We expect to implement this change in a phased approach starting in mid-2015. This structural change is being discussed on an ongoing basis with FINMA, and remains subject to a number of uncertainties that may affect its feasibility, scope or timing. We may consider further changes to the legal structure of the Group in response to regulatory requirements in Switzerland or in other countries in which we operate, including to improve the resolvability of the UBS Group, to respond to Swiss and other capital requirements (including seeking potential reduction in the progressive buffer requirement as applied to us) and to respond to regulatory required changes in legal structure. Movement of businesses to a new subsidiary (“subsidiarization”) will require significant time and resources to implement. “Subsidiarization” in Switzerland and elsewhere may create operational, capital, funding and tax inefficiencies and increase our and counterparties’ credit risk. Refer to “Regulatory and legislative changes outside Switzerland” for a description of other regulatory and legislative developments that may affect these decisions and further discussion of these risks.
In September 2013, the Swiss National Council approved two motions for the mandatory structural reform of banks in Switzerland that would, if also adopted by the Council of States, result in the submission to Parliament of a law requiring the separation of certain investment banking activities from systemically relevant activities, such as retail and commercial banking. No date has been set for the debate. It is unclear whether, when and in what form such a law will be adopted.
Market regulation: The Swiss government is working on fundamentally reviewing the rules on market infrastructure and on the relationship between us and our clients. These laws may, if enacted, have a material impact on the market infrastructure that we use, available platforms, collateral management and the way we interact with clients. In addition, these initiatives may cause us to incur material implementation costs.
Regulatory and legislative changes outside Switzerland
Regulatory and legislative changes in other locations in which we operate may subject us to a wide range of new restrictions both in individual jurisdictions and, in some cases, globally.
Banking structure and activity limitations: Some of these regulatory and legislative changes may subject us to requirements to move activities from UBS AG branches into subsidiaries. Such “subsidiarization” can create operational, capital and tax inefficiencies,
|
Operating environment and strategy |
|
|
increase our aggregate credit exposure to counterparties as they transact with multiple UBS AG affiliates, expose our businesses to higher local capital requirements, and potentially give rise to client and counterparty concerns about the credit quality of individual subsidiaries. Such changes could also negatively impact our funding model and severely limit our booking flexibility.
For example, we have significant operations in the UK and currently use UBS AG’s London branch as a global booking center for many types of products. We are being required by the UK Prudential Regulatory Authority and by FINMA to increase very substantially the capitalization of our UK bank subsidiary, UBS Limited, and expect to be required to change our booking practices to reduce or even eliminate our utilization of UBS AG London branch as a global booking center for the ongoing business of the Investment Bank. In addition, the UK Independent Commission on Banking has recommended structural and non-structural reforms of the banking sector, most of which have been endorsed by the UK government and implemented in the Financial Services (Banking Reform) Act. Key measures proposed include the ring-fencing of retail banking activities in the UK (which we do not expect to impact us directly), additional common equity tier 1 capital requirements of up to 3% of RWA for retail banks, and the issuance by UK banks of debt subject to “bail-in” provisions. Furthermore, the European Commission’s recent proposals in light of the Liikanen report also advocate a Volcker-style prohibition on proprietary trading together with a separation of trading from banking activities. The applicability and implications of such changes to branches and subsidiaries of foreign banks are not yet entirely clear, but they could have a material effect on our businesses located or booked in the UK.
In February 2014, the Federal Reserve Board issued final rules for foreign banking organizations (FBO) operating in the US (under section 165 of the Dodd-Frank Act) that include the following: (i) a requirement for FBO with more than USD 50 billion of US non-branch assets to establish an intermediate holding company (IHC) to hold all US subsidiary operations, (ii) risk-based capital and leverage requirements for the IHC, (iii) liquidity requirements, including a 30-day onshore liquidity requirement for the IHC, (iv) risk management requirements including the establishment of a risk committee and the appointment of a US chief risk officer, (v) stress test and capital planning requirements and (vi) a debt-to-equity limit for institutions that pose “a grave threat” to US financial stability. Requirements differ based on the overall size of the foreign banking organization and the amount of its US-based assets. We expect that we will be subject to the most stringent requirements based on our current operations. We will have until 1 July 2016 to establish an IHC and meet many of the new requirements. We must submit an implementation plan by 1 January 2015 and the IHC will not need to comply with the US leverage ratio until 1 January 2018.
US regulators published final regulations implementing the Volcker Rule in December 2013 and generally extended until 2015 the time to conform to this rule and the related regulations. In general, the Volcker Rule prohibits any banking entity from engaging
in proprietary trading and from owning interests in hedge funds and other private fund vehicles. The Volcker Rule also broadly limits investments and other transactional activities between a bank and funds that the bank has sponsored or with which the bank has certain other relationships. The Volcker Rule permits us and other non-US banking entities to engage in certain activities that would otherwise be prohibited to the extent that they are conducted solely outside the US and certain other conditions are met. One impact will be the need to establish an extensive global compliance framework designed to ensure compliance with the Volcker Rule and the terms of the available exemptions. Moreover, the Volcker Rule could have an impact on the way in which we organize and conduct certain business lines. We continue to evaluate the final rule and its impact on our activities. The Volcker Rule could have a substantial impact on market liquidity and the economics of market-making activities.
OTC derivatives regulation: In 2009, the G20 countries committed to require all standardized over-the-counter (OTC) derivative contracts to be traded on exchanges or trading facilities and cleared through central counterparties by the end of 2012. This commitment is being implemented through the Dodd-Frank Act in the US and corresponding legislation in the European Union, Switzerland and other jurisdictions, and will have a significant impact on our OTC derivatives business, which is conducted primarily in the Investment Bank. For example, we expect that, as a rule, the shift of OTC derivatives trading to a central clearing model will tend to reduce profit margins in these products, although some market participants may be able to offset this effect with higher trading volumes in commoditized products. Although we are preparing for these thematic market changes, they are likely to reduce the revenue potential of certain lines of business for market participants generally, and we may be adversely affected.
UBS AG registered as a swap dealer with the Commodity Futures Trading Commission (CFTC) in the US at the end of 2012, enabling the continuation of swaps business with US persons. We also expect that UBS AG will be required to register as a securities-based swap dealer with the US Securities and Exchange Commission. Regulations issued by the CFTC impose substantial new requirements on registered swap dealers for clearing, trade execution, transaction reporting, recordkeeping, risk management and business conduct. Certain of the CFTC’s regulations, including those relating to swap data reporting, recordkeeping, compliance and supervision, are expected to apply to UBS AG globally. In July 2013, the CFTC approved final cross-border guidance that defines the extraterritorial application of its swaps regulations. This guidance may allow non-US swap dealers, such as UBS AG, to operate on the basis of “substituted compliance,” under which they may comply with home country requirements instead of the corresponding CFTC requirements if the CFTC determines the home country requirements to be “comprehensive and comparable.” In December 2013, the CFTC issued comparability determinations for Switzerland (as well as the home countries of certain other non-US swap dealers) that will allow us to comply with relevant Swiss regulations instead of CFTC requirements for many, but not
Operating environment and strategy
Risk factors
all, of the CFTC regulations for which substituted compliance is available. While the CFTC deferred a comparability determination on swap data reporting requirements as we continue to review the issue, it granted reporting no-action relief that allows UBS AG (and other non-US swap dealers) to delay reporting transactions with non-US persons for several months. The CFTC’s regulations will apply to swaps between non-US persons and non-US swap dealers when US personnel are involved, but in January 2014, the CFTC delayed the applicability of US regulations in this context until 15 September 2014, giving additional time for foreign swap dealers to comply with US requirements regarding transactions with non-US persons conducted from the US. Application of these requirements to our swaps business with non-US persons continues to present a substantial implementation burden, will likely duplicate or conflict with legal requirements applicable to us outside of the US and may place us at a competitive disadvantage to firms that are not CFTC-registered swap dealers.
Regulation of cross-border provision of financial services: In many instances, we provide services on a cross-border basis and are therefore sensitive to barriers restricting market access for third-country firms. In particular, efforts in the European Union (EU) to harmonize the regime for third-country firms to access the European market may have the effect of creating new barriers that adversely affect our ability to conduct business in these jurisdictions from Switzerland. In addition, a number of jurisdictions are increasingly regulating cross-border activities on the basis of some notion of comity (e.g., substituted compliance, equivalence determination). While the issuance of such determinations in particular jurisdictions may ensure market access for us to those jurisdictions, a negative determination in other jurisdictions may negatively influence our ability to act as a global firm. In addition, as jurisdictions tend to apply such determinations on a jurisdictional level rather than on an entity level, we will generally need to rely on jurisdictions’ willingness to collaborate.
Resolution and recovery; bail-in
We are currently required to produce recovery and resolution plans in the US, UK, Switzerland and Germany and are likely to face similar requirements for our operations in other jurisdictions, including our operations in the EU as a whole, as part of the proposed EU Bank Recovery and Resolution Directive. Resolution plans may increase the pressure on us to make structural changes, such as the creation of separate legal entities, if the resolution plan in any jurisdiction identifies impediments that are not acceptable to the relevant regulators. Such structural changes may negatively impact our ability to benefit from synergies between business units, and if they include the creation of separate legal entities, may have the other negative consequences mentioned above with respect to “subsidiarization” more generally.
In addition, a number of jurisdictions, including Switzerland, the US, the UK and the EU, have implemented or are considering implementing changes that would allow resolution authorities to write down or convert into equity unsecured debt to effectuate a so-called “bail-in.” Some jurisdictions are also considering adopting
requirements that regulated firms maintain specified amounts of unsecured debt that could increase loss-absorbing capacity. The scope of bail-in authority and the legal mechanisms that would be utilized for the purpose are subject to a great deal of development and interpretation. Depending upon the outcome, bail-in authority may have a significant effect on our funding costs.
Possible consequences of regulatory and legislative developments
The planned and potential regulatory and legislative developments in Switzerland and in other jurisdictions in which we have operations may have a material adverse effect on our ability to execute our strategic plans, on the profitability or viability of certain business lines globally or in particular locations, and in some cases on our ability to compete with other financial institutions. They are likely to be costly to implement and could also have a negative impact on our legal structure or business model, potentially generating capital inefficiencies and resulting in an impact on our profitability. Finally, the uncertainty related to or the implementation of legislative and regulatory changes may have a negative impact on our relationships with clients and our success in attracting client business.
Our capital strength is important in supporting our strategy, client franchise and competitive position
Our capital position, as measured by the fully applied common equity tier 1 and total capital ratios under Basel III requirements, is determined by: (i) RWA (credit, non-counterparty related, market and operational risk positions, measured and risk-weighted according to regulatory criteria); and (ii) eligible capital. Both RWA and eligible capital may fluctuate based on a number of factors. RWA are driven by our business activities and by changes in the risk profile of our exposures, as well as regulatory requirements. For instance, substantial market volatility, a widening of credit spreads (the major driver of our value-at-risk), adverse currency movements, increased counterparty risk, a deterioration in the economic environment, or increased operational risk could result in a rise in RWA. Eligible capital would be reduced if we experience net losses or losses through other comprehensive income, as determined for the purpose of the regulatory capital calculation, which may also render it more difficult or more costly for us to raise new capital. In addition, eligible capital can be reduced for a number of other reasons, including certain reductions in the ratings of securitization exposures, acquisitions and divestments changing the level of goodwill, adverse currency movements affecting the value of equity, prudential adjustments that may be required due to the valuation uncertainty associated with certain types of positions, and changes in the value of certain pension fund assets and liabilities recognized in other comprehensive income. Any such increase in RWA or reduction in eligible capital could materially reduce our capital ratios.
Risks captured in the operational risk component of RWA have become increasingly significant as a component of our overall
|
Operating environment and strategy |
|
|
RWA as a result of significant reductions in market and credit risk RWA, as we execute our strategy, and increased operational risk charges arising from operational risk events (including charges arising from litigation, regulatory and similar matters). We have agreed with FINMA on a supplemental analysis that will be used to calculate an incremental operational risk capital charge to be held for litigation, regulatory and similar matters and other contingent liabilities. The incremental RWA calculated based on this supplemental analysis as of 31 December 2013 was CHF 22.5 billion. Future developments in and the ultimate elimination of the incremental RWA attributable to the supplemental analysis will depend on provisions charged to earnings for litigation, regulatory and similar matters and other contingent liabilities and on developments in these matters. There can be no assurance that we will be successful in addressing these matters and reducing or eliminating the incremental operational risk RWA.
The required levels and calculation of our regulatory capital and the calculation of our RWA are also subject to changes in regulatory requirements or their interpretation, as well as the exercise of regulatory discretion. Changes in the calculation of RWA under Basel III and Swiss requirements (such as the revised treatment of certain securitization exposures under the Basel III framework) have significantly increased the level of our RWA and, therefore, have adversely affected our capital ratios. We have achieved substantial reductions in RWA, in part to mitigate the effects of increased capital requirements. However, there is a risk that we will not be successful in pursuing our plans to further reduce RWA, either because we are unable to carry out fully the actions we have planned or because other business or regulatory developments or actions to some degree counteract the benefit of our actions.
In addition to the risk-based capital requirements, we are subject to a minimum leverage ratio requirement for Swiss systemically relevant banks. The leverage ratio operates separately from the risk-based capital requirements, and, accordingly, under certain circumstances could constrain our business activities even if we are able to satisfy other risk-based capital requirements. We have achieved substantial reductions in our balance sheet size and anticipate further reductions as we wind down our Non-core and Legacy Portfolio positions. These reductions would improve our leverage ratio and contribute to our ability to comply with the more stringent leverage ratio requirements scheduled to become effective in future years. There can be no assurance that these plans will be executed successfully. There is also a risk that the minimum leverage ratio requirement will be increased significantly beyond the levels currently scheduled to come into effect, making it more difficult for us to satisfy the requirements without adversely affecting certain of our businesses.
Changes in the Swiss requirements for risk-based capital or leverage ratios, whether pertaining to the minimum levels required for large Swiss banks or to the calculation thereof, could have a material adverse effect on our business and could affect our competitive position internationally compared with institutions that are regulated under different regimes.
We may not be successful in completing our announced strategic plans or in implementing changes in our businesses to meet changing market, regulatory and other conditions
In October 2012, we announced a significant acceleration in the implementation of our strategy. The strategy included transforming our Investment Bank to focus it on its traditional strengths, very significantly reducing Basel III RWA and further strengthening our capital position, and significantly reducing costs and improving efficiency across the Group. We have made significant progress in implementing the strategy and as of the end of 2013 are ahead of the majority of our performance targets. There continues to be a risk that we will not be successful in completing the execution of our plans, or that our plans may be delayed or that the effects of our plans may differ from those intended.
Although we have substantially reduced the RWA and balance sheet usage associated with our Non-core and Legacy Portfolio positions, there can be no assurance that we will be able to exit them as quickly as our plans suggest or that we will not incur significant losses in doing so. The continued illiquidity and complexity of many of the legacy risk positions in particular could make it difficult to sell or otherwise exit these positions and reduce the RWA and the balance sheet usage associated with these exposures. At the same time, our strategy rests heavily on our ability to reduce those RWA and balance sheet usage in order to meet our future capital targets and requirements without incurring unacceptable losses.
As part of our strategy, we have underway a program to achieve significant incremental cost reductions. The success of our strategy and our ability to reach certain of the targets we have announced depends heavily on the effectiveness of the cost reduction and efficiency measures we are able to carry out. As is often the case with major cost reduction and efficiency programs, our plans involve significant risks. Included among these are the risks that restructuring costs may be higher and may be recognized sooner than we have projected and that we may not be able to identify feasible cost reduction opportunities at the level of our objective that are also consistent with our business goals. In addition, when we implement our cost reduction and efficiency programs we may experience unintended consequences such as the loss or degradation of capabilities that we need in order to maintain our competitive position and achieve our targeted returns.
We are exposed to possible outflows of client assets in our asset-gathering businesses and to changes affecting the profitability of our Wealth Management business division, and we may not be successful in implementing the business changes needed to address them. We experienced substantial net outflows of client assets in our wealth management and asset management businesses in 2008 and 2009. The net outflows resulted from a number of different factors, including our substantial losses, the damage to our reputation, the loss of client advisors, difficulty in recruiting qualified client advisors and tax, legal and regulatory developments concerning our cross-border private banking business.
Operating environment and strategy
Risk factors
Many of these factors have been successfully addressed. Our Wealth Management and Wealth Management Americas business divisions recorded substantial net new money inflows in 2013. Long-term changes affecting the cross-border private banking business model will, however, continue to affect client flows in the Wealth Management business division for an extended period of time. One of the important drivers behind the longer-term reduction in the amount of cross-border private banking assets, particularly in Europe but increasingly also in other regions, is the heightened focus of fiscal authorities on cross-border investments. Changes in local tax laws or regulations and their enforcement may affect the ability or the willingness of our clients to do business with us or the viability of our strategies and business model. In 2012 and 2013, we experienced net withdrawals in our Swiss booking center from clients domiciled elsewhere in Europe, in many cases related to the negotiation of tax treaties between Switzerland and other countries, including the treaty with Germany that was ultimately not ratified by Germany.
The net new money inflows in recent years in our Wealth Management business division have come predominantly from clients in Asia Pacific and in the ultra high net worth segment globally. Over time, inflows from these lower-margin segments and markets have been replacing outflows from higher-margin segments and markets, in particular cross-border European clients. This dynamic, combined with changes in client product preferences as a result of which low-margin products account for a larger share of our revenues than in the past, put downward pressure on our return on invested assets and adversely affect the profitability of our Wealth Management business division. We have implemented changes in our product offerings and service improvements, and will continue our efforts to adjust to client trends and market dynamics as necessary, in an effort to overcome the effects of these changes in the business mix on our profitability, but there can be no assurance that we will be able to counteract those effects. In addition, we have made changes to our business offerings and pricing practices in line with the Swiss Supreme Court case concerning “retrocessions” and other industry developments. These changes may adversely affect our margins on these products and the current offering may be less attractive to clients than the products it replaces. There can be no assurance that we will be successful in our efforts to offset the adverse impact of these trends and developments.
Global Asset Management experienced net outflows of client assets in 2012 and 2013. Further net outflows of client assets could adversely affect the results of this business division.
Material legal and regulatory risks arise in the conduct of our business
The nature of our business subjects us to significant regulatory oversight and liability risk. As a global financial services firm operating in more than 50 countries, we are subject to many different legal, tax and regulatory regimes. We are involved in a variety of claims, disputes, legal proceedings and government investigations
in jurisdictions where we are active. These proceedings expose us to substantial monetary damages and legal defense costs, injunctive relief and criminal and civil penalties, in addition to potential regulatory restrictions on our businesses. The outcome of most of these matters, and their potential effect on our future business or financial results, is extremely difficult to predict.
We are subject to a large number of claims, disputes, legal proceedings and government investigations and expect that our ongoing business activities will continue to give rise to such matters in the future. The extent of our financial exposure to these and other matters could be material and could substantially exceed the level of provisions that we have established for litigation, regulatory and similar matters.
In December 2012, we announced settlements totaling approximately CHF 1.4 billion in fines by and disgorgements to US, UK and Swiss authorities to resolve investigations by those authorities relating to LIBOR and other benchmark interest rates. UBS AG entered into a non-prosecution agreement with the US Department of Justice and UBS Securities Japan Co. Ltd. also pled guilty to one count of wire fraud relating to the manipulation of certain benchmark interest rates. The settlements do not resolve investigations by other authorities or civil claims that have been or may in the future be asserted by private and governmental claimants with respect to submissions for LIBOR or other benchmark interest rates. The extent of our financial exposure to these remaining matters is extremely difficult to estimate and could be material.
These settlements starkly illustrate the much-increased level of financial and reputational risk now associated with regulatory matters in major jurisdictions. Very large fines and disgorgement amounts were assessed against UBS, and the guilty plea of a UBS subsidiary was required, in spite of our full cooperation with the authorities in the investigations relating to LIBOR and other benchmark interest rates, and in spite of our receipt of conditional leniency or conditional immunity from antitrust authorities in a number of jurisdictions, including the US and Switzerland. We understand that, in determining the consequences to us, the authorities considered the fact that we have in the recent past been determined to have engaged in serious misconduct in several other matters. The heightened risk level was further illustrated by the European Commission (EC) announcement in December 2013 of fines against other financial institutions related to its Yen Interest Rate Derivatives (YIRD) investigation. The EC stated that UBS would have been subject to fines of approximately EUR 2.5 billion had UBS not received full immunity for disclosing to the EC the existence of infringements relating to YIRD.
Under the non-prosecution agreement we entered into in connection with the LIBOR matter, we have agreed, among other things, that, for two years from 18 December 2012 UBS will not commit any US crime, and we will advise the Department of Justice of all potentially criminal conduct by UBS or any of its employees relating to violations of US laws concerning fraud or securities and commodities markets. UBS is also obligated to continue to cooperate fully with the Department of Justice. Failure to comply
|
Operating environment and strategy |
|
|
with these obligations could result in termination of the non-prosecution agreement and potential criminal prosecution in relation to the matters covered by the non-prosecution agreement. As a result of this history and our ongoing obligations under the non-prosecution agreement, our level of risk with respect to regulatory enforcement may be greater than that of some of our peer institutions.
Considering our overall exposures and the current regulatory and political climate affecting financial institutions, we expect charges associated with legal, regulatory and similar matters to remain at elevated levels through 2014.
Ever since our losses in 2007 and 2008, we have been subject to a very high level of regulatory scrutiny and to certain regulatory measures that constrain our strategic flexibility. While we believe that we have remediated the deficiencies that led to the material losses during the 2007–2009 financial crisis, the unauthorized trading incident announced in September 2011 and the LIBOR-related settlements of 2012, the effects of these matters on our reputation and relationships with regulatory authorities have proven to be more difficult to overcome. For example, following the unauthorized trading incident FINMA informed us that we would not be permitted to undertake acquisitions in our Investment Bank unit (unless FINMA granted an exception), and that material new business initiatives in that unit would be subject to FINMA oversight. We are determined to address the issues that have arisen in the above and other matters in a thorough and constructive manner. We are in active dialogue with our regulators concerning the actions that we are taking to improve our operational risk management and control framework, but there can be no assurance that our efforts will have the effects desired. Although the special restrictions mentioned above have recently been withdrawn by FINMA, this example illustrates that difficulties associated with our relationships with regulatory authorities have the potential to adversely affect the execution of our business strategy.
| | è | | Refer to “Note 22 Provisions and contingent liabilities” in the “Financial information” section of this report for more information on litigation, regulatory and similar matters |
Operational risks may affect our business
All of our businesses are dependent on our ability to process a large number of complex transactions across multiple and diverse markets in different currencies, to comply with requirements of many different legal and regulatory regimes to which we are subject and to prevent, or promptly detect and stop, unauthorized, fictitious or fraudulent transactions. Our operational risk management and control systems and processes are designed to help ensure that the risks associated with our activities, including those arising from process error, failed execution, unauthorized trading, fraud, system failures, cyber-attacks, breaches of information security and failure of security and physical protection, are appropriately controlled.
For example, cyber-crime is a fast growing threat to large organizations that rely on technology to support their business, like us. Cyber-crime can range from internet-based attacks that interfere
with the organizations’ internet websites, to more sophisticated crimes that target the organizations, as well as their clients, and seek to gain unauthorized access to technology systems in efforts to disrupt business, steal money or obtain sensitive information.
A major focus of US governmental policy relating to financial institutions in recent years has been fighting money laundering and terrorist financing. Regulations applicable to us and our subsidiaries impose obligations to maintain effective policies, procedures and controls to detect, prevent and report money laundering and terrorist financing, and to verify the identity of their clients. Failure to maintain and implement adequate programs to combat money laundering and terrorist financing could have serious consequences, both in legal terms and in terms of our reputation.
Although we are continuously adapting our capability to detect and respond to the risks described above, if our internal controls fail or prove ineffective in identifying and remedying them we could suffer operational failures that might result in material losses, such as the loss from the unauthorized trading incident announced in September 2011.
Participation in high-volume and high-frequency trading activities, even in the execution of client-driven business, can also expose us to operational risks. Our loss in 2012 relating to the Facebook initial public offering illustrates the exposure participants in these activities have to unexpected results arising not only from their own systems and processes but also from the behavior of exchanges, clearing systems and other third parties and from the performance of third-party systems.
Certain types of operational control weaknesses and failures could also adversely affect our ability to prepare and publish accurate and timely financial reports. We identified control deficiencies following the unauthorized trading incident announced in September 2011, and management determined that we had a material weakness in our internal control over financial reporting as of the end of 2010 and 2011, although this has not affected the reliability of our financial statements for either year.
In addition, despite the contingency plans we have in place, our ability to conduct business may be adversely affected by a disruption in the infrastructure that supports our businesses and the communities in which we are located. This may include a disruption due to natural disasters, pandemics, civil unrest, war or terrorism and involve electrical, communications, transportation or other services used by us or third parties with whom we conduct business.
Our reputation is critical to the success of our business
Our reputation is critical to the success of our strategic plans. Damage to our reputation can have fundamental negative effects on our business and prospects. Reputational damage is difficult to reverse, and improvements tend to be slow and difficult to measure. This was demonstrated in recent years, as our very large losses during the financial crisis, the US cross-border matter and other events seriously damaged our reputation. Reputational damage
Operating environment and strategy
Risk factors
was an important factor in our loss of clients and client assets across our asset-gathering businesses, and contributed to our loss of and difficulty in attracting staff, in 2008 and 2009. These developments had short-term and also more lasting adverse effects on our financial performance, and we recognized that restoring our reputation would be essential to maintaining our relationships with clients, investors, regulators and the general public, as well as with our employees. More recently, the unauthorized trading incident announced in September 2011 and our involvement in the LIBOR matter also adversely affected our reputation. Any further reputational damage could have a material adverse effect on our operational results and financial condition and on our ability to achieve our strategic goals and financial targets.
Performance in the financial services industry is affected by market conditions and the macroeconomic climate
The financial services industry prospers in conditions of economic growth; stable geopolitical conditions; transparent, liquid and buoyant capital markets and positive investor sentiment. An economic downturn, continued low interest rates or weak or stagnant economic growth in our core markets, or a severe financial crisis can negatively affect our revenues and ultimately our capital base.
A market downturn and weak macroeconomic conditions can be precipitated by a number of factors, including geopolitical events, changes in monetary or fiscal policy, trade imbalances, natural disasters, pandemics, civil unrest, war or terrorism. Because financial markets are global and highly interconnected, even local and regional events can have widespread impacts well beyond the countries in which they occur. A crisis could develop, regionally or globally, as a result of disruptions in emerging markets as well as developed markets that are susceptible to macroeconomic and political developments, or as a result of the failure of a major market participant. We have material exposures to a number of these markets, both as a wealth manager and as an investment bank. Moreover, our strategic plans depend more heavily upon our ability to generate growth and revenue in emerging markets, causing us to be more exposed to the risks associated with them. The continued absence of sustained and credible improvements to unresolved issues in Europe, continued US fiscal and monetary policy issues, emerging markets fragility and the mixed outlook for global growth demonstrate that macroeconomic and political developments can have unpredictable and destabilizing effects. Adverse developments of these kinds have affected our businesses in a number of ways, and may continue to have further adverse effects on our businesses as follows:
| – | | a general reduction in business activity and market volumes, as we have recently experienced, affects fees, commissions and margins; local or regional economic factors, such as the ongoing European sovereign debt concerns, could also have an effect on us; |
| – | | a market downturn is likely to reduce the volume and valuations of assets we manage on behalf of clients, reducing our asset- and performance-based fees; |
| – | | the ongoing low interest rate environment will further erode interest margins in several of our businesses; |
| – | | reduced market liquidity or volatility limits trading and arbitrage opportunities and impedes our ability to manage risks, impacting both trading income and performance-based fees; |
| – | | deteriorating market conditions could cause a decline in the value of assets that we own and account for as investments or trading positions; |
| – | | worsening economic conditions and adverse market developments could lead to impairments and defaults on credit exposures and on trading and investment positions, and losses may be exacerbated by declines in the value of collateral we hold; and |
| – | | if individual countries impose restrictions on cross-border payments or other exchange or capital controls, or change their currency (for example, if one or more countries should leave the euro), we could suffer losses from enforced default by counterparties, be unable to access our own assets, or be impeded in – or prevented from – managing our risks. |
Because we have very substantial exposures to other major financial institutions, the failure of one or more of such institutions could have a material effect on us.
The developments mentioned above have in the past affected and could materially affect the performance of our business units and of UBS as a whole, and ultimately our financial condition. As discussed below, there is also a somewhat related risk that the carrying value of goodwill of a business unit might suffer impairments and deferred tax assets levels may need to be adjusted.
We hold legacy and other risk positions that may be adversely affected by conditions in the financial markets; legacy risk positions may be difficult to liquidate
We, like other financial market participants, were severely affected by the financial crisis that began in 2007. The deterioration of financial markets since the beginning of the crisis was extremely severe by historical standards, and we recorded substantial losses on fixed income trading positions, particularly in 2008 and 2009. Although we have very significantly reduced our risk exposures starting in 2008, and more recently as we progress our strategy and focus on complying with Basel III capital standards, we continue to hold substantial legacy risk positions, primarily in our Non-core and Legacy Portfolio. In many cases these risk positions remain illiquid, and we continue to be exposed to the risk that the remaining positions may again deteriorate in value. In the fourth quarter of 2008 and the first quarter of 2009, certain of these positions were reclassified for accounting purposes from fair value to amortized cost; these assets are subject to possible impairment due to changes in market interest rates and other factors.
Moreover, we hold positions related to real estate in various countries, and could suffer losses on these positions. These positions include a very substantial Swiss mortgage portfolio. Although management believes that this portfolio has been very prudently managed, we could nevertheless be exposed to losses if the concerns
|
Operating environment and strategy |
|
|
expressed by the Swiss National Bank and others about unsustainable price escalation in the Swiss real estate market come to fruition. Other macroeconomic developments, such as the implications on export markets of any return of crisis conditions within the eurozone and the potential implications of the recent decision in Switzerland to reinstate immigration quotas for EU/EEA countries, could also adversely affect the Swiss economy, our business in Switzerland in general and, in particular, our Swiss mortgage and corporate loan portfolios.
In addition, we are exposed to risk in our prime brokerage, reverse repo and Lombard lending activities, as the value or liquidity of the assets against which we provide financing may decline rapidly.
Our global presence subjects us to risk from currency fluctuations
We prepare our consolidated financial statements in Swiss francs. However, a substantial portion of our assets, liabilities, invested assets, revenues and expenses are denominated in other currencies, particularly the US dollar, the euro and the British pound. Accordingly, changes in foreign exchange rates, particularly between the Swiss franc and the US dollar (US dollar revenues account for the largest portion of our non-Swiss franc revenues) have an effect on our reported income and expenses, and on other reported figures such as other comprehensive income, invested assets, balance sheet assets, RWA and tier 1 capital. For example, in 2011 the strengthening of the Swiss franc, especially against the US dollar and euro, had an adverse effect on our revenues and invested assets. Because exchange rates are subject to constant change, sometimes for completely unpredictable reasons, our results are subject to risks associated with changes in the relative values of currencies.
We are dependent upon our risk management and control processes to avoid or limit potential losses in our counterparty credit and trading businesses
Controlled risk-taking is a major part of the business of a financial services firm. Credit risk is an integral part of many of our retail, corporate, wealth management and Investment Bank activities, and our non-core activities transferred to Corporate Center – Non-core and Legacy Portfolio, including lending, underwriting and derivatives activities. Changes in interest rates, credit spreads, securities’ prices, market volatility and liquidity, foreign exchange levels and other market fluctuations can adversely affect our earnings. Some losses from risk-taking activities are inevitable, but to be successful over time, we must balance the risks we take against the returns we generate. We must, therefore, diligently identify, assess, manage and control our risks, not only in normal market conditions but also as they might develop under more extreme (stressed) conditions, when concentrations of exposures can lead to severe losses.
As seen during the financial crisis of 2007–2009, we are not always able to prevent serious losses arising from extreme or sudden
market events that are not anticipated by our risk measures and systems. Value-at-risk, a statistical measure for market risk, is derived from historical market data, and thus by definition could not have anticipated the losses suffered in the stressed conditions of the financial crisis. Moreover, stress loss and concentration controls and the dimensions in which we aggregate risk to identify potentially highly correlated exposures proved to be inadequate. Notwithstanding the steps we have taken to strengthen our risk management and control framework, we could suffer further losses in the future if, for example:
| – | | we do not fully identify the risks in our portfolio, in particular risk concentrations and correlated risks; |
| – | | our assessment of the risks identified or our response to negative trends proves to be untimely, inadequate, insufficient or incorrect; |
| – | | markets move in ways that we do not expect – in terms of their speed, direction, severity or correlation – and our ability to manage risks in the resultant environment is, therefore, affected; |
| – | | third parties to whom we have credit exposure or whose securities we hold for our own account are severely affected by events not anticipated by our models, and accordingly we suffer defaults and impairments beyond the level implied by our risk assessment; or |
| – | | collateral or other security provided by our counterparties proves inadequate to cover their obligations at the time of their default. |
We also manage risk on behalf of our clients in our asset and wealth management businesses. The performance of assets we hold for our clients in these activities could be harmed by the same factors. If clients suffer losses or the performance of their assets held with us is not in line with relevant benchmarks against which clients assess investment performance, we may suffer reduced fee income and a decline in assets under management, or withdrawal of mandates.
If we decide to support a fund or another investment that we sponsor in our asset or wealth management businesses, it might, depending on the facts and circumstances, incur charges that could increase to material levels.
Investment positions, such as equity holdings made as a part of strategic initiatives and seed investments made at the inception of funds that we manage, may also be affected by market risk factors. These investments are often not liquid and generally are intended or required to be held beyond a normal trading horizon. They are subject to a distinct control framework. Deteriorations in the fair value of these positions would have a negative impact on our earnings.
| | è | | Refer to the “Risk management and control” section of this report for more information |
Operating environment and strategy
Risk factors
Valuations of certain positions rely on models; models have inherent limitations and may use inputs which have no observable source
If available, fair values of a financial instrument or non-financial asset or liability are determined using quoted prices in active markets for identical assets or liabilities. Where the market is not active, fair value is established using a valuation technique, including pricing models. Where available, valuation techniques use market observable assumptions and inputs. If such information is not available, inputs may be derived by reference to similar instruments in active markets, from recent prices for comparable transactions or from other observable market data. If market observable data is not available, we select non-market observable inputs to be used in our valuation techniques. We also use internally developed models. Such models have inherent limitations; different assumptions and inputs would generate different results, and these differences could have a significant impact on our financial results. We regularly review and update our valuation models to incorporate all factors that market participants would consider in setting a price, including factoring in current market conditions. Judgment is an important component of this process, and failure to make the changes necessary to reflect evolving market conditions could have a material adverse effect on our financial results. Moreover, evolving market practice may result in changes to valuation techniques that have a material impact on financial results. Changes in model inputs or calibration, changes in the valuation methodology incorporated in models, or failure to make the changes necessary to reflect evolving market conditions could have a material adverse effect on our financial results.
Liquidity and funding management are critical to our ongoing performance
The viability of our business depends upon the availability of funding sources, and our success depends upon our ability to obtain funding at times, in amounts, for tenors and at rates that enable us to efficiently support our asset base in all market conditions. A substantial part of our liquidity and funding requirements is met using short-term unsecured funding sources, including retail and wholesale deposits and the regular issuance of money market securities. The volume of our funding sources has generally been stable, but could change in the future due to, among other things, general market disruptions or widening credit spreads, which could also influence the cost of funding. A change in the availability of short-term funding could occur quickly.
Reductions in our credit ratings can increase our funding costs, in particular with regard to funding from wholesale unsecured sources, and can affect the availability of certain kinds of funding. In addition, as we experienced in connection with Moody’s downgrading of our long-term rating in June 2012, ratings downgrades can require us to post additional collateral or make additional cash payments under master trading agreements relating to our derivatives businesses. Our credit ratings, together with our capital
strength and reputation, also contribute to maintaining client and counterparty confidence and it is possible that ratings changes could influence the performance of some of our businesses.
More stringent Basel III capital and liquidity requirements will likely lead to increased competition for both secured funding and deposits as a stable source of funding, and to higher funding costs. The addition of loss-absorbing debt as a component of capital requirements and potential future requirements to maintain senior unsecured debt that could be written down in an insolvency or other resolution of UBS, or a subsidiary, may increase our funding costs or limit the availability of funding of the types required.
We might be unable to identify or capture revenue or competitive opportunities, or retain and attract qualified employees
The financial services industry is characterized by intense competition, continuous innovation, detailed (and sometimes fragmented) regulation and ongoing consolidation. We face competition at the level of local markets and individual business lines, and from global financial institutions that are comparable to us in their size and breadth. Barriers to entry in individual markets and pricing levels are being eroded by new technology. We expect these trends to continue and competition to increase. Our competitive strength and market position could be eroded if we are unable to identify market trends and developments, do not respond to them by devising and implementing adequate business strategies, adequately developing or updating our technology, particularly in trading businesses, or are unable to attract or retain the qualified people needed to carry them out.
The amount and structure of our employee compensation are affected not only by our business results but also by competitive factors and regulatory considerations. Constraints on the amount or structure of employee compensation, higher levels of deferral, performance conditions and other circumstances triggering the forfeiture of unvested awards may adversely affect our ability to retain and attract key employees, and may in turn negatively affect our business performance. We have made changes to the terms of compensation awards to reflect the demands of various stakeholders, including regulatory authorities and shareholders. These terms include the introduction of a deferred contingent capital plan with many of the features of the loss-absorbing capital that we have issued in the market but with a higher capital ratio write-down trigger, increased average deferral periods for stock awards, and expanded forfeiture provisions for certain awards linked to business performance. These changes, while intended to better align the interests of our staff with those of other stakeholders, increase the risk that key employees will be attracted by competitors and decide to leave us, and that we may be less successful than our competitors in attracting qualified employees. The loss of key staff and inability to attract qualified replacements, depending upon which and how many roles are affected, could seriously compromise our ability to execute our strategy and to successfully improve our operating and control environment.
|
Operating environment and strategy |
|
|
In a referendum in March 2013, the Swiss cantons and voters accepted an initiative to give shareholders of Swiss listed companies more influence over board and management compensation (the Minder Initiative). In November 2013, the Swiss Federal Council issued the final transitional ordinance implementing the constitutional amendments resulting from this initiative, which came into force on 1 January 2014. The ordinance requires public companies to specify in their articles of association (AoA) a mechanism to permit a “say-on-pay” vote, setting out three requirements: (i) the vote on compensation must be held annually, (ii) the vote on compensation must be binding rather than advisory and (iii) the vote on compensation must be held separately for the board of directors and members of the executive board. In addition, shareholders will need to determine the details of the “say-on-pay” vote in the AoA, in particular the nature of the vote, timing aspects and the consequences of a “no” vote. Each company affected by the Minder Initiative must undertake a first binding vote on management compensation and remuneration of the board of directors at its 2015 annual general meeting.
The EU has adopted legislation that caps the amount of variable compensation in proportion to the amount of fixed compensation for employees of a bank active within the EU. This legislation will apply to employees of UBS in the EU. These and other similar initiatives may require us to make further changes to our compensation structure and may increase the risks described above.
| | è | | Refer to the “Corporate governance, responsibility and compensation” section of this report for more information on our compensation awards and programs |
Our financial results may be negatively affected by changes to accounting standards
We report our results and financial position in accordance with International Financial Reporting Standards (IFRS) as issued by the International Accounting Standards Board (IASB). Changes to IFRS or interpretations thereof may cause our future reported results and financial position to differ from current expectations. Such changes may also affect our regulatory capital and ratios. We monitor potential accounting changes and when these are finalized by the IASB, we determine the potential impact and disclose significant future changes in our financial statements. Currently, there are a number of issued but not yet effective IFRS changes, as well as potential IFRS changes, some of which could be expected to impact our reported results, financial position and regulatory capital in the future.
| | è | | Refer to the “Financial information” section of this report for more information on changes in accounting requirements |
Our financial results may be negatively affected by changes to assumptions supporting the value of our goodwill
The goodwill we have recognized on the respective balance sheets of our operating segments is tested for impairment at least annually.
Our impairment test in respect of the assets recognized as of 31 December 2013 indicated that the value of our goodwill is not impaired. The impairment test is based on assumptions regarding estimated earnings, discount rates and long-term growth rates impacting the recoverable amount of each segment and on estimates of the carrying amounts of the segments to which the goodwill relates. If the estimated earnings and other assumptions in future periods deviate from the current outlook, the value of our goodwill may become impaired in the future, giving rise to losses in the income statement. In the third quarter of 2012, for example, the recognition by the Investment Bank of a full impairment of goodwill and of an impairment of other non-financial assets resulted in a charge of almost CHF 3.1 billion against our operating profit before tax.
The effect of taxes on our financial results is significantly influenced by reassessments of our deferred tax assets
The deferred tax assets we have recognized on our balance sheet as of 31 December 2013 in respect of prior years’ tax losses reflect the probable recoverable level based on future taxable profit as informed by our business plans. If the business plan earnings and assumptions in future periods substantially deviate from current forecasts, the amount of recognized deferred tax assets may need to be adjusted in the future. These adjustments may include write-downs of deferred tax assets through the income statement.
Our effective tax rate is highly sensitive both to our performance and to the accuracy of new business plan forecasts. Our results in recent periods have demonstrated that changes in the recognition of deferred tax assets can have a very significant effect on our reported results. If the Group’s performance is expected to improve, particularly in the US, UK or Switzerland, we could potentially recognize additional deferred tax assets as a result of that assessment. The effect of doing so would be to significantly reduce the Group’s effective tax rate in years in which additional deferred tax assets are recognized. Conversely, if our performance in those countries is expected to produce diminished taxable profit in future years, we may be required to write down all or a portion of the currently recognized deferred tax assets through the income statement. This would have the effect of increasing the Group’s effective tax rate in the year in which any write-downs are taken.
In 2014, notwithstanding the effects of any potential reassessment of the level of deferred tax assets, we expect our effective tax rate to be in the range of 20% to 25%. Consistent with past practice, we expect to revalue our overall level of deferred tax assets in the second half of 2014 based on a reassessment of future profitability taking into account updated business plan forecasts. The full year effective tax rate could change significantly on the basis of this reassessment. It could also change if aggregate tax expenses for locations other than Switzerland, the US and UK differ from what is expected. Our effective tax rate is also sensitive to any future reductions in statutory tax rates, particularly in the US and Switzerland. Reductions in the statutory tax rate would cause the expected future tax benefit from items such as tax loss carry-forwards in the affected locations to
Operating environment and strategy
Risk factors
diminish in value. This in turn would cause a write-down of the associated deferred tax assets.
In addition, statutory and regulatory changes, as well as changes to the way in which courts and tax authorities interpret tax laws could cause the amount of taxes ultimately paid by us to materially differ from the amount accrued.
This is a potential risk particularly as we consider reorganizations of our legal entity structures in the US, UK and Switzerland in response to regulatory changes. The tax authorities in these countries may prevent the transfer of tax losses incurred in one legal entity to newly organized or reorganized subsidiaries or affiliates that are expected to carry on businesses formerly conducted by the transferor. Were this to occur in situations where there were also limited planning opportunities to utilize the tax losses in the originating entity, the deferred tax assets associated
with such tax losses could be written down through the income statement.
In 2011, the UK government introduced a balance sheet based levy payable by banks operating or resident in the UK. A net charge of CHF 124 million was recognized in operating expenses (within operating profit before tax) in 2013. The Group’s bank levy expense for future years will depend on both the rate of the levy and the Group’s taxable UK liabilities at each year-end; changes to either factor could increase the cost. This expense will likely increase if, for example, we change our booking practices so as to book more liabilities into our UK bank subsidiary, UBS Limited. We expect that the annual bank levy charge will continue to be recognized for IFRS purposes as an expense arising in the final quarter of each financial year, rather than being accrued throughout the year, as it is charged by reference to the year-end balance sheet position.
64
Financial and
operating
performance
Financial and operating performance
Critical accounting policies
Critical accounting policies
Basis of preparation and selection of policies
We prepare our consolidated financial statements in accordance with International Financial Reporting Standards (IFRS) as issued by the International Accounting Standards Board (IASB). The application of these accounting standards requires the use of judgment, based upon estimates and assumptions that may involve significant uncertainty at the time they are made. Such judgments, including the underlying estimates and assumptions, which reflect historical experience, expectations of the future and other factors, or some combination thereof, are regularly evaluated to determine their continuing relevance under the circumstances. Using different assumptions could cause the reported results to differ. Changes in assumptions may have a significant impact on the financial statements in the periods when changes occur.
We believe that the assumptions we have made are appropriate under the circumstances, and that our financial statements therefore present fairly the financial position, financial performance and cash flows, in all material respects. Alternative outcomes and sensitivity analyses discussed or referred to in this section are included solely to assist the reader in understanding the uncertainty inherent in the estimates and assumptions used in our financial statements. They are not intended to suggest that other estimates and assumptions would be more appropriate.
This section discusses accounting policies that are deemed critical to our financial position, financial performance and cash flows, because they are material in terms of the items to which they apply, and they involve significant assumptions and estimates. A broader and more detailed description of our significant accounting policies is included in “Note 1 Summary of significant accounting policies” in the “Financial information” section of this report.
Consolidation of structured entities
We sponsor the formation of structured entities (SE) and interact with non-sponsored SE for a variety of reasons, including allowing clients to obtain or be exposed to particular risk profiles, to provide funding or to sell or purchase credit risk. An SE is an entity that has been designed so that voting or similar rights are not the dominant factor in deciding who controls the entity. Such entities generally have a narrow and well-defined objective and include those historically referred to as special purpose entities and some investment funds. In accordance with IFRS, we do not consolidate SE that we do not control.
With effect from 1 January 2013, UBS adopted IFRS 10Consolidated Financial Statements. IFRS 10 provides a cohesive consolidation framework that applies to all types of entities, both SE and non-SE. That framework is based on the principle that an entity
should consolidate all other entities that it controls, with control being defined as a function of three elements: power over the relevant activities of the entity, exposure to variable returns and an investor’s ability to use its power to affect its returns. UBS consolidates an entity when all three elements of control are present. Where UBS has an interest in an SE that absorbs variability, we consider whether UBS has power over the SE which allows it to affect the variability of its returns. Consideration is given to all facts and circumstances to determine whether the Group has power over the SE, that is, the current ability to direct the relevant activities of the SE when decisions about those activities need to be made. Determining whether we have power to direct the relevant activities requires a significant degree of judgment in light of all facts and circumstances. In making that determination, we consider a range of factors, including the purpose and design of the SE, any rights held through contractual arrangements such as call rights, put rights or liquidation rights, as well as potential decision-making rights. Where the Group has power over the relevant activities, a further assessment is made to determine whether, through that power, it has the ability to affect its own returns, that is, assessing whether power is held in a principal or agent capacity. Consideration is given to the overall relationship between UBS, the SE and other parties involved in the SE. In particular, we assess the following: (i) the scope of decision-making authority, (ii) rights held by other parties, including removal or other participating rights and (iii) exposure to variability, including remuneration, relative to the total variability of the SE, as well as whether UBS’s exposure is different from that of other investors. Appropriate weightings are applied to each of these factors on the basis of the particular facts and circumstances. If, after review of these factors, UBS concludes that it can exercise its power to affect its own returns, the SE is consolidated.
| | è | | Refer to “Note 1a) 3) Subsidiaries and structured entities” and “Note 30 Interests in subsidiaries and other entities” in the “Financial information” section of this report for more information |
Fair value of financial instruments
UBS accounts for a significant portion of its assets and liabilities at fair value. Under IFRS, the relative degree of uncertainty associated with the measurement of fair value is reflected by use of a three-level valuation hierarchy. The best evidence of fair value is a quoted price in an actively traded market (Level 1). In the event that the market for a financial instrument is not active, or where quoted prices are not otherwise available, a valuation technique is used. In these cases, fair value is estimated using observable data in respect of similar financial instruments as well as financial models. Level 2 of the hierarchy pertains to instruments for which
|
Financial and operating performance |
|
|
inputs to a valuation technique are principally based on observable market data. Level 3 applies to instruments that are measured by a valuation technique that incorporates one or more significant unobservable inputs. Valuation techniques that rely to a greater extent on unobservable inputs require a higher level of judgment to calculate a fair value than those based wholly on observable inputs. Substantially all of UBS’s financial assets and financial liabilities are based on observable prices and inputs and hence are classified in Levels 1 and 2 of the hierarchy.
Where valuation techniques, including models, are used to determine fair values, they are periodically reviewed and validated by qualified personnel independent of those who sourced them. Models are calibrated to ensure that outputs reflect actual data and comparable market prices. Also, models prioritize the use of observable inputs, when available, over unobservable inputs. Judgment is required in selecting appropriate models as well as inputs for which observable data is less readily or not available.
The valuation techniques employed may not fully reflect all the factors relevant to the positions we hold. Valuations are therefore adjusted, where appropriate, to allow for additional factors, including model risk, liquidity risk and credit risk. We use different approaches to calculate the credit risk, depending on the nature of the instrument. A credit-valuation-adjustment approach based on an expected exposure profile is used to adjust the fair value of derivative instruments to reflect counterparty credit risk. Correspondingly, a debit-valuation-adjustment approach is applied to incorporate UBS’s own credit risk, where applicable, in the fair value of derivative instruments. Own credit risk for financial liabilities designated at fair value is calculated using the funds transfer price curve.
As of 31 December 2013, financial assets and financial liabilities for which valuation techniques are used and whose significant inputs are considered observable (Level 2) amounted to CHF 289 billion and CHF 310 billion, respectively, (68% and 88% of total financial assets measured at fair value and total financial liabilities measured at fair value, respectively). Financial assets and financial liabilities whose valuations include significant unobservable inputs (Level 3) amounted to CHF 15 billion and CHF 17 billion, respectively, (4% and 5% of total financial assets measured at fair value and total financial liabilities measured at fair value, respectively). These amounts reflect the effect of offsetting, wherever such presentation is required under IFRS.
Uncertainty inherent to estimating unobservable market inputs can affect the amount of gain or loss recorded for a particular position. While the Group believes its valuation techniques are appropriate and consistent with those of other market participants, the use of different techniques or assumptions to determine the fair value of certain financial instruments could result in a different estimate of fair value at the reporting date. As of 31 December 2013, the total favorable and unfavorable effects of changing one or more of the unobservable inputs to reflect reasonably possible alternative assumptions for financial instruments classified as Level 3 were CHF 1.2 billion and CHF 1.1 billion, respectively. Further discussion of the Group’s use of valuation
techniques, the critical estimates and adjustments applied to reflect uncertainties within the fair value measurement process, and its governance over the fair value measurement process can be found in “Note 24 Fair value measurement” in the “Financial information” section of this report.
| | è | | Refer to “Note 24 Fair value measurement” in the “Financial information” section of this report for more information |
Allowances for credit losses on loans and receivables measured at amortized cost
Allowances for credit losses represent management’s best estimate of credit losses incurred in the lending portfolio at the balance sheet date due to credit deterioration of the issuer or counterparty. The loan portfolio, which is measured at amortized cost less impairment, consists of financial assets presented on the balance sheet lines,Due from banks andLoans, including reclassified securities. In addition, irrevocable loan commitments are tested for impairment as described below.
Credit loss expense is recognized if there is objective evidence that the Group will be unable to collect all amounts due (or the equivalent thereof) on a claim based on the original contractual terms due to credit deterioration of the issuer or counterparty. Allowances for credit losses are evaluated at both a counterparty-specific level and collectively. Under this incurred loss model, a financial asset or group of financial assets is impaired if there is objective evidence that a credit loss has occurred by the balance sheet date. Judgment is used in making assumptions when calculating impairment losses both on a counterparty-specific level and collectively.
The impairment loss for a loan is the excess of the carrying value of the financial asset over the estimated recoverable amount. The estimated recoverable amount is the present value, using the loan’s original effective interest rate, of expected future cash flows, including amounts that may result from restructuring or the liquidation of collateral. If a loan has a variable interest rate, the discount rate for measuring any impairment loss is the current effective interest rate. An allowance for credit losses is reported as a reduction of the carrying value of the financial asset on the balance sheet.
Our collective allowances for credit losses are calculated for our portfolios with similar credit risk characteristics, taking into account historical loss experience and current conditions. The methodology and assumptions used are reviewed regularly to reduce any differences between estimated and actual loss experience. For all of our portfolios, we also assess whether there have been any unforeseen developments which might result in impairments but which are not immediately observable. To determine whether an event-driven collective allowance for credit losses is required, we consider global economic drivers to assess the most vulnerable countries and industries. Our current event-based collective allowance for credit losses methodology considers the heightened credit risk arising from corporate clients in industries exposed to the recessionary effects in certain countries, combined with the strength of the Swiss franc.
Financial and operating performance
Critical accounting policies
Estimated cash flows associated with financial assets reclassified fromHeld for trading toLoans and receivables,as described in “Note 1a) 10) Loans and receivables” in the “Financial information” section of this report, and other similar assets acquired subsequently are revised periodically. Adverse revisions in cash flow estimates related to credit events are recognized in profit or loss as credit loss expenses. For reclassified securities, increases in estimated future cash receipts (above those originally forecast at the date of reclassification) as a result of increased recoverability are recognized as an adjustment to the effective interest rate on the loan from the date of change.
As of 31 December 2013, the gross loan portfolio was CHF 288 billion and the related allowances for credit losses amounted to CHF 0.7 billion, consisting of specific and collective allowances of CHF 669 million and CHF 20 million, respectively.
| | è | | Refer to “Note 1a) 11) Allowances and provisions for credit losses,” “Note 10 Due from banks and loans (held at amortized cost),” “Note 12 Allowances and provisions for credit losses” and “Note 27a Measurement categories of financial assets and liabilities” in the “Financial information” section of this report for more information |
| | è | | Refer to “Policies for past due, non-performing and impaired claims” in the “Risk management and control” section of this report for more information. |
Goodwill impairment test
UBS performs an impairment test annually on its goodwill assets, or when indicators of impairment exist. Our segments are each considered cash-generating units. The impairment test is performed for each segment to which goodwill is allocated and compares the recoverable amount, based on its value-in-use, to the carrying amount of the respective segment. An impairment charge is recognized if the carrying amount exceeds the recoverable amount. The impairment test is based on the assumptions described below.
The recoverable amounts are determined using a discounted cash flow model, which incorporates inputs relevant to the banking business and its regulatory environment. The recoverable amount of a segment is the sum of the discounted earnings attributable to shareholders from the first five forecasted years and the terminal value. The terminal value, reflecting all periods beyond the fifth year, is calculated on the basis of the forecast of fifth-year profit, the discount rate and the long-term growth rate and is adjusted for the effect of the capital assumed to be needed to support the perpetual growth implied by the long-term growth rate.
The carrying amount for each segment is determined by reference to the Group’s equity attribution framework. Within this framework, which is described in the “Capital management” section of this report, the Board of Directors (BoD) attributes equity to the businesses after considering their risk exposure, risk-weighted assets and leverage denominator usage, goodwill and intangible assets. The framework is used primarily for purposes of measuring the performance of the businesses and includes certain management assumptions. Attributed equity equates to the capital that a segment requires to conduct its business and is considered an appropriate starting point from which to determine the carrying value of the segments. The attributed equity methodology is aligned with the business planning process, the inputs from which are used in calculating the recoverable amounts of the respective cash-generating units.
Valuation parameters used within the Group’s impairment test model
are linked to external market information, where applicable. The model used to determine the recoverable amount is most sensitive to changes in the forecast earnings available to shareholders in years one to five, to changes in the discount rates, and to changes in the long-term growth rate. The applied long-term growth rate is based on long-term economic growth rates for different regions worldwide. Earnings available to shareholders are estimated based on forecast results, which are part of the business plan approved by the BoD. The discount rates are determined by applying a capital-asset-pricing-model-based approach, as well as considering quantitative and qualitative inputs from both internal and external analysts and the view of management.
Key assumptions used to determine the recoverable amounts of each segment are tested for sensitivity by applying a reasonably possible change to those assumptions, as follows: forecast earnings available to shareholders were changed by 10%, the discount rates were changed by 1% and the long-term growth rates were changed by 0.5%. Under all scenarios, the recoverable amounts for each segment exceeded the respective carrying amount, such that the reasonably possible changes in key assumptions would not result in impairment as of 31 December 2013.
If the estimated earnings and other assumptions in future periods deviate from the current outlook, the value of our goodwill may become impaired in the future, giving rise to losses in the income statement. Recognition of any impairment of goodwill would reduce IFRS equity attributable to UBS shareholders and net profit. It would not impact cash flows and, as goodwill is required to be deducted from capital under the Basel capital framework, no impact would be expected on the Group total capital ratios.
As of 31 December 2013, total goodwill recognized on the balance sheet was CHF 5.8 billion, of which CHF 1.3 billion, CHF 3.1 billion and CHF 1.4 billion was carried by Wealth Management, Wealth Management Americas and Global Asset Management, respectively. On the basis of the impairment testing methodology described above, UBS concluded that the year-end 2013 balances of goodwill allocated to its segments remain recoverable.
| | è | | Refer to “Note 1a) 21) Goodwill and intangible assets”, “Note 2 Segment reporting” and “Note 17 Goodwill and intangible assets” in the “Financial information” section of this report for more information |
Deferred taxes
Deferred tax assets arise from a variety of sources, the most significant being the following: (i) tax losses that can be carried forward to be utilized against profits in future years and (ii) expenses recognized in our income statement that are not deductible until the associated cash flows occur.
We record a valuation allowance to reduce our deferred tax assets to the amount which can be recognized in line with IAS 12Income Taxes. The level of deferred tax asset recognition is influenced by management’s assessment of our future profitability based on relevant business plan forecasts. Existing assessments are reviewed and, if necessary, revised to reflect changed circumstances. This review is conducted annually, in the second half of
|
Financial and operating performance |
|
|
each year, but adjustments may be made at other times, if required. In a situation where recent losses have been incurred, IAS 12 requires convincing evidence that there will be sufficient future profitability.
Swiss tax losses can be carried forward for seven years, US federal tax losses for 20 years and UK and Jersey tax losses for an unlimited period. The deferred tax assets recognized as of 31 December 2013 have been based on future profitability assumptions, adjusted to take into account the recognition criteria of IAS 12. The level of deferred tax assets recognized may, however, need to be adjusted in the future in the event of changes in those profitability assumptions. As of 31 December 2013, the deferred tax assets amounted to CHF 8.8 billion, which included CHF 6.3 billion in respect of tax losses (mainly in Switzerland and the US) that can be utilized to offset taxable income in future years.
| | è | | Refer to “Note 1a) 22) Income taxes” and “Note 8 Income taxes” in the “Financial information” section of this report for more information |
Provisions
Provisions are liabilities of uncertain timing or amount, and are recognized when UBS has a present obligation as a result of a past event, it is probable that an outflow of resources will be required to settle the obligation and a reliable estimate of the amount of the obligation can be made. Provisions are recognized for the best estimate of the consideration required to settle the present obligation at the balance sheet date.
Recognition of provisions often involves significant judgment in assessing the existence of an obligation resulting from past events and in estimating the probability, timing and amount of any outflows of resources. This is particularly the case with litigation, regulatory and similar matters which, because of their nature, are subject to many uncertainties, making their outcome difficult to predict. Such matters may involve unique fact patterns or novel legal theories, proceedings which have not yet been initiated or are at early stages of adjudication, or as to which alleged damages have not been quantified by the claimants. Determining whether an obligation exists as a result of a past event and estimating the probability, timing and amount of any potential outflows is based on a variety of assumptions, variables, and known and unknown uncertainties. The amount of any provision recognized can be very sensitive to the assumptions used and there could be a wide range of possible outcomes for any particular matter. Statistical or other quantitative analytical tools are of limited use in determining whether to establish or determine the amount of provisions in the case of litigation, regulatory or similar matters. Furthermore, information currently available to management may be incomplete or inaccurate increasing the risk of erroneous assumptions with regards to the future developments of such matters. Management regularly reviews all the available information regarding such matters, including advice from legal advisors, to assess whether the recognition criteria for provisions have been satisfied for those matters and, if not, to evaluate
whether such matters represent contingent liabilities. Legal advice is a significant consideration in determining whether it is more likely than not that an obligation exists as a result of a past event and in assessing the probability, timing and amount of any potential outflows.
As of 31 December 2013, total provisions amounted to CHF 2,971 million, of which CHF 1,622 million pertained to the litigation, regulatory and similar matters class. Since the future outflow of resources in respect of these matters cannot be determined with certainty based on currently available information, the actual outflows may ultimately prove to be substantially greater (or less) than the provisions recognized.
| | è | | Refer to “Note 1a) 27) Provisions” and “Note 22 Provisions and contingent liabilities” in the “Financial information” section of this report for more information |
Pension and otherpost-employment benefit plans
During 2012, UBS adopted revisions to IAS 19Employee Benefits (“IAS 19R”) issued by the IASB in June 2011. IAS 19R eliminated the “corridor method,” under which the recognition of actuarial gains and losses was deferred. Instead, the full defined benefit obligation, net of plan assets, is now recorded on the balance sheet, with changes resulting from remeasurements recognized immediately in other comprehensive income. The net defined benefit liability at the end of the year and the related personnel expense depend on the expected future benefits to be provided, determined using a number of economic and demographic assumptions. The most significant assumptions include life expectancy, the discount rate, expected salary increases, pension rates, and in addition, for the Swiss plan, interest credits on retirement savings account balances.
Life expectancy is determined by reference to published mortality tables. The discount rate is determined by reference to the rates of return on high-quality fixed-income investments of appropriate currency and term at the measurement date. The assumption for salary increases reflects the long-term expectations for salary growth and takes into account inflation, seniority, promotion and other relevant factors such as supply and demand in the labor market. For a sensitivity analysis of the defined benefit obligation to these significant actuarial assumptions, refer to “Note 28 Pension and other post-employment benefit plans” in the “Financial information” section of this report.
The most significant plan is the Swiss pension plan. Consistent with 2012, life expectancy for this plan has been based on the 2010 BVG generational mortality tables. The assumption for the discount rate has changed from 1.9% in the prior year to 2.3% in the current year, as a result of higher market yields on corporate bonds.
| | è | | Refer to “Note 1a) 24) Pension and other post-employment benefit plans” and “Note 28 Pension and otherpost-employment benefit plans” in the “Financial information” section of this report for more information |
Financial and operating performance
Critical accounting policies
Equity compensation
We recognize shares, performance shares, options and share-settled stock appreciation rights awarded to employees as compensation expense based on their fair value at grant date. The fair value of UBS shares issued to employees is determined by reference to quoted market prices, adjusted, when relevant, to take into account the terms and conditions inherent in the award. Options, stock appreciation rights, and certain performance shares issued by UBS to its employees have features which are not directly comparable with our shares and options traded in active markets. Accordingly, we determine the fair value using suitable valuation models. Several recognized valuation models exist. The models we apply have been selected because they are able to accommodate
the specific features included in the various instruments granted to our employees. If we were to use different models, the values produced would differ, even if the same inputs were used.
The models we use require inputs such as expected dividends, share price volatility and historical employee exercise behavior patterns. Some of the model inputs we use are not market observable and have to be estimated or derived from available data. Use of different estimates would produce different valuations, which in turn would result in recognition of higher or lower compensation expense.
| | è | | Refer to “Note 1a) 25) Equity participation and other compensation plans” and “Note 29 Equity participation and other compensation plans” in the “Financial information” section of this report for more information |
70
|
Financial and operating performance |
|
|
Significant accounting and financial reporting changes
Significant accounting changes
IFRS 7Financial Instruments: Disclosures
On 1 January 2013, UBS adopted revised IFRS 7Financial Instruments: Disclosures, requiring the disclosure of new information in respect of an entity’s use of enforceable netting arrangements. The amendments to IFRS 7 are intended to enable users of financial statements to better evaluate the effect or potential effect of netting arrangements on the entity’s financial position. The amendments require entities to disclose both gross and net amounts of recognized financial assets and financial liabilities associated with master netting agreements and similar arrangements, including the effects of financial collateral, whether or not presented net on the face of the balance sheet. The resultant disclosures are reflected in “Note 26 Offsetting financial assets and financial liabilities” of our consolidated financial statements.
IFRS 10Consolidated Financial Statements
On 1 January 2013, UBS adopted IFRS 10Consolidated Financial Statements, which introduced a new definition of control for determining when one entity should consolidate another. Upon adoption of IFRS 10, the Group has changed the consolidation status of certain entities, including entities issuing preferred securities which are no longer consolidated by the Group. As a result of deconsolidating the preferred securities entities, UBS now recognizes the preferred notes issued to these entities instead of the preferred securities which were previously presented as equity attributable to non-controlling interests. Except for one preferred note issuance of CHF 1.2 billion, which is classified as a liability, UBS presents the preferred notes as equity attributable to preferred noteholders. As of 31 December 2012, the Group’s equity attributable to non-controlling interests decreased by CHF 4.3 billion, equity attributable to preferred noteholders increased by CHF 3.1 billion and debt issued held at amortized cost increased by CHF 1.2 billion. For 2012, net profit attributable to non-controlling interests decreased by CHF 271 million and net profit attributable to preferred noteholders increased by CHF 220 million. The implementation of IFRS 10 did not have a material effect on our regulatory capital.
IFRS 12Disclosure of Interests in Other Entities
On 1 January 2013, UBS adopted IFRS 12Disclosure of Interests in Other Entities, which provides new and comprehensive annual disclosure requirements about entities with which a reporting entity is involved. IFRS 12 replaces the disclosure requirements previously included in IAS 27Consolidated andSeparateFinancial
Statements, IAS 28Investment in Associatesand IAS 31Interests in Joint Ventures. The standard requires entities to disclose information that helps users to evaluate the nature, risks and financial effects associated with a reporting entity’s interests in subsidiaries, associates, joint arrangements and, in particular, unconsolidated structured entities. The resultant disclosures are reflected in “Note 30 Interests in subsidiaries and other entities” of our consolidated financial statements.
IFRS 13Fair Value Measurement
On 1 January 2013, UBS adopted IFRS 13Fair Value Measurement, which establishes a single source of guidance for all fair value measurements under IFRS. It defines fair value as the price that would be received to sell an asset or paid to transfer a liability in an orderly transaction between market participants at the measurement date, i.e., an exit price. The standard emphasizes that fair value is a market-based measurement, not an entity-specific measurement. It clarifies that the unit of measurement is generally a particular asset or liability unless an entity manages and reports its net risk exposures on a portfolio basis, in which case it may elect to apply portfolio-level price adjustments under limited circumstances. It also introduces new disclosure requirements and enhancements to existing disclosures, which are reflected in “Note 24 Fair value measurement” of our consolidated financial statements.
As a result of implementing the unit of measurement guidance, the Group’s valuation reserves increased by approximately CHF 25 million as of 1 January 2013, decreasing operating profit before tax in 2013.
| | è | | Refer to “Note 1b Changes in accounting policies, comparability and other adjustments” in the “Financial information” section of this report for more information on the adoption of IFRS 7, IFRS 10, IFRS 12 and IFRS 13 |
Financial reporting changes
Change in the definition of funded assets
From 2013, we define funded assets as total IFRS balance sheet assets less positive replacement values (PRV) and collateral delivered against over-the-counter (OTC) derivatives. In prior reporting periods, we defined funded assets as total IFRS balance sheet assets less PRV and did not exclude the collateral delivered for OTC derivatives. Prior periods were restated to reflect the change in definition.
Funded assets exclude PRV because they are volatile but have little effect on funding requirements. As there is a direct correlation
71
Financial and operating performance
Significant accounting and financial reporting changes
between replacement values and collateral delivered for OTC derivatives, collateral delivered is also excluded to create a more consistent view of our funded assets and to better reflect how we manage our businesses.
Corporate Center – Non-core and Legacy Portfolio
In line with our strategy to focus the Investment Bank’s business on its traditional strengths, UBS is exiting many business lines which are capital- and balance sheet-intensive or are in areas with high operational complexity or long tail risks. In 2013, these non-core activities and positions formerly in the Investment Bank were transferred to and are managed and reported in the Corporate Center. Together with the Legacy Portfolio and the option to acquire the equity of the SNB StabFund, which was exercised on 7 November 2013, these non-core activities and positions are reported as a separate reportable segment within the Corporate Center called “Non-core and Legacy Portfolio.” Prior period segment information was restated for this change.
| | è | | Refer to “Note 1b Changes in accounting policies, comparability and other adjustments” in the “Financial information” section of this report for more information |
Other reporting segment changes
In 2013, the Investment Bank was reorganized into two business units, Corporate Client Solutions and Investor Client Services.
Furthermore, the repurchase agreement and short-term interest rate cash units were transferred from the Investment Bank to the Asset Liability Management unit of Group Treasury within Corporate Center – Core Functions in 2013. Following this transfer, the Asset Liability Management unit oversees all financing, portfolio,
and structural risk management activities for the Group. Revenues associated with the ongoing business activities of Asset Liability Management are allocated to the business divisions and Non-core and Legacy Portfolio, with the exception of excess funding costs.
Lastly, also in 2013, the risk management responsibility for a portfolio of financial investments available-for-sale and associated cash and balances with central banks was transferred from Wealth Management Americas to Group Treasury within Corporate Center – Core Functions. Following this transfer, net interest income associated with that portfolio is allocated back to Wealth Management Americas, whereas realized gains and losses arising from the sales and impairments of individual financial investments are retained by Group Treasury.
Prior period segment information was restated for these changes.
| | è | | Refer to “Note 1b Changes in accounting policies, comparability and other adjustments” in the “Financial information” section of this report for more information |
| | è | | Refer to “Investment Bank” in the “Operating environment and strategy” section of this report for more information on our Investment Bank’s businesses |
Changes to allocations of centralized shared services units’ personnel
As part of our ongoing efforts to improve our operational effectiveness and heighten our cost efficiency across the firm, on 1 July 2012 operations units from business divisions were centralized into our shared services units in the Corporate Center. Effective 1 January 2013, personnel allocations to our business divisions for shared services were revised to reflect the following factors: (i)
72
|
Financial and operating performance |
|
|
enhancements to the Corporate Center service-level agreement framework for Group Operations, (ii) an ongoing review of attribution keys, including for technology-related personnel and (iii) organizational changes related to the accelerated implementation of our strategy, including the transfer of certain non-core businesses and positions from the Investment Bank.
Attributed equity
With effect from 1 January 2013, attributed equity required to support remaining goodwill and intangible assets that arose from the PaineWebber acquisition was transferred from the business divisions to the Corporate Center. Net charges associated with this attributed equity are retained in Corporate Center – Core Functions.
| | è | | Refer to “Equity attribution framework” in the “Capital management” section of this report for more information |
| | è | | Refer to “Note 17 Goodwill and intangible assets” in the “Financial information” section of this report for more information |
Definition of restructuring charges
In 2013, we expanded our definition of restructuring charges to include non-recurring and other temporary costs necessary to effect our restructuring programs.
| | è | | Refer to “Note 32 Changes in organization” in the “Financial information” section of this report for more information |
Refinement to the allocation of operating costs for internal services
To further enhance cost discipline and strengthen our efforts to reduce our underlying cost base, we will refine the way that operating costs for internal services are allocated from Corporate
Center – Core Functions to the business divisions and Corporate Center – Non-core and Legacy Portfolio. Under this refinement, each year, as part of the annual business planning cycle, Corporate Center – Core Functions will agree with the business divisions and Non-core and Legacy Portfolio cost allocations for services at fixed amounts or at variable amounts based on formulas, depending on capital and service consumption levels as well as the nature of the services to be performed. These pre-agreed cost allocations will be designed with the expectation that Corporate Center – Core Functions will recover its costs, without a mark-up. Because actual costs incurred may differ from those expected, however, Corporate Center – Core Functions may recognize significant under- or over-allocations depending on various factors, including Corporate Center – Core Functions’ ability to manage the delivery of its services and achieve cost savings. Each year these cost allocations will be reset, taking account of the prior year’s experience and plans for the forthcoming period. We expect the refined approach to strengthen the effectiveness and efficiency of the services performed by Corporate Center – Core Functions, and in particular to facilitate the achievement of cost savings, by better aligning cost accountability with the management of these services. This change will become effective for 2014.
73
Financial and operating performance
Significant accounting and financial reporting changes
Enhancing our disclosure
We believe the market rewards companies that provide clear, consistent and informative disclosure about their business and we have established financial disclosure principles in support of this objective. More information on our financial disclosure principles can be found within “Information policy” in the “Corporate governance, responsibility and compensation” section of this report.
Consistent with these principles, we are a member of and endorse the work of the Enhanced Disclosure Task Force (EDTF), established by the Financial Stability Board in 2012 to facilitate discussion between users, preparers and other interested parties as to how enhanced disclosure could help in restoring investor confidence in banks. Our reports contain disclosures aligned with the recommendations issued by the EDTF on 29 October 2012 in its report “Enhancing the Risk Disclosures of Banks.” Certain disclosures
in our Annual Report 2012 were cited by the EDTF in its July 2013 “Progress Report on Implementation of Disclosure Recommendations” as “leading practice” and by Deloitte in its report, “Responding to the EDTF recommendations – A review of 2012 year end reporting,” as “good practice.”
For our Annual Report 2013, we have made significant further improvements to our disclosures in light of these recommendations, including making structural changes to the “Risk, treasury and capital management” section of this report and introducing a large number of both new and enhanced disclosures. Consistent with Recommendation 1 of the EDTF, where appropriate we now present together those related risk disclosures we consider to be most relevant to a particular component of our business, including integrating certain disclosures previously presented separately within our Pillar 3 disclosures or our financial statements.
Further information on our implementation of each of the EDTF recommendations can be found at the start of the “Risk, treasury and capital management” section of this report, in which most of the new and enhanced disclosures are presented.
Consistent with our financial reporting and disclosure principles, we regard the enhancement of disclosures as an ongoing commitment and we expect to make further refinements to our disclosures in 2014 and beyond.
| | è | | Refer to the “Risk, treasury and capital management” section of this report for more information on our implementation of the EDTF recommendations |
| | è | | Refer to the “Financial information” section of this report for an overview of our Pillar 3 related disclosures |
74
|
Financial and operating performance |
|
|
Group performance
Net profit attributable to UBS shareholders for 2013 was CHF 3,172 million compared with a loss of CHF 2,480 million in 2012. Operating profit before tax was 3,272 million compared with a loss of CHF 1,794 million in the prior year. Operating income increased by CHF 2,309 million and operating expenses decreased by CHF 2,755 million. Furthermore, we recorded a net tax benefit of CHF 110 million compared with a net tax expense of CHF 461 million in the prior year.
Income statement
| | | | | | | | | | | | | | | | |
| | For the year ended | | | % change from | |
| CHF million | | 31.12.13 | | | 31.12.12 | | | 31.12.11 | | | 31.12.12 | |
| Interest income | | | 13,137 | | | | 15,968 | | | | 17,969 | | | | (18 | ) |
| | | | | | | | | | | | | | | | | |
| Interest expense | | | (7,351 | ) | | | (9,990 | ) | | | (11,143 | ) | | | (26 | ) |
| | | | | | | | | | | | | | | | | |
| Net interest income | | | 5,786 | | | | 5,978 | | | | 6,826 | | | | (3 | ) |
| | | | | | | | | | | | | | | | | |
| Credit loss (expense)/recovery | | | (50 | ) | | | (118 | ) | | | (84 | ) | | | (58 | ) |
| | | | | | | | | | | | | | | | | |
| Net interest income after credit loss expense | | | 5,736 | | | | 5,860 | | | | 6,742 | | | | (2 | ) |
| | | | | | | | | | | | | | | | | |
| Net fee and commission income | | | 16,287 | | | | 15,396 | | | | 15,236 | | | | 6 | |
| | | | | | | | | | | | | | | | | |
| Net trading income | | | 5,130 | | | | 3,526 | | | | 4,343 | | | | 45 | |
| | | | | | | | | | | | | | | | | |
of which: net trading income excluding own credit | | | 5,413 | | | | 5,728 | | | | 2,806 | | | | (5 | ) |
| | | | | | | | | | | | | | | | | |
of which: own credit on financial liabilities designated at fair value | | | (283 | ) | | | (2,202 | ) | | | 1,537 | | | | (87 | ) |
| | | | | | | | | | | | | | | | | |
| Other income | | | 580 | | | | 641 | | | | 1,467 | | | | (10 | ) |
| | | | | | | | | | | | | | | | | |
| Total operating income | | | 27,732 | | | | 25,423 | | | | 27,788 | | | | 9 | |
| | | | | | | | | | | | | | | | | |
| Personnel expenses | | | 15,182 | | | | 14,737 | | | | 15,634 | | | | 3 | |
| | | | | | | | | | | | | | | | | |
| General and administrative expenses | | | 8,380 | | | | 8,653 | | | | 5,959 | | | | (3 | ) |
| | | | | | | | | | | | | | | | | |
| Depreciation and impairment of property and equipment | | | 816 | | | | 689 | | | | 761 | | | | 18 | |
| | | | | | | | | | | | | | | | | |
| Impairment of goodwill | | | 0 | | | | 3,030 | | | | 0 | | | | (100 | ) |
| | | | | | | | | | | | | | | | | |
| Amortization and impairment of intangible assets | | | 83 | | | | 106 | | | | 127 | | | | (22 | ) |
| | | | | | | | | | | | | | | | | |
| Total operating expenses | | | 24,461 | | | | 27,216 | | | | 22,482 | | | | (10 | ) |
| | | | | | | | | | | | | | | | | |
| Operating profit/(loss) before tax | | | 3,272 | | | | (1,794 | ) | | | 5,307 | | | | | |
| | | | | | | | | | | | | | | | | |
| Tax expense/(benefit) | | | (110 | ) | | | 461 | | | | 901 | | | | | |
| | | | | | | | | | | | | | | | | |
| Net profit/(loss) | | | 3,381 | | | | (2,255 | ) | | | 4,406 | | | | | |
| | | | | | | | | | | | | | | | | |
| Net profit/(loss) attributable to preferred noteholders1 | | | 204 | | | | 220 | | | | | | | | (7 | ) |
| | | | | | | | | | | | | | | | | |
| Net profit/(loss) attributable to non-controlling interests1 | | | 5 | | | | 5 | | | | 268 | | | | 0 | |
| | | | | | | | | | | | | | | | | |
| Net profit/(loss) attributable to UBS shareholders | | | 3,172 | | | | (2,480 | ) | | | 4,138 | | | | | |
| | | | | | | | | | | | | | | | | |
| | | | |
| Comprehensive income | | | | | | | | | | | | | | | | |
| | | | | | | | | | | | | | | | | |
| Total comprehensive income | | | 2,524 | | | | (1,767 | ) | | | 5,632 | | | | | |
| | | | | | | | | | | | | | | | | |
| Total comprehensive income attributable to preferred noteholders1 | | | 559 | | | | 179 | | | | | | | | 212 | |
| | | | | | | | | | | | | | | | | |
| Total comprehensive income attributable to non-controlling interests1 | | | 4 | | | | 20 | | | | 560 | | | | (80 | ) |
| | | | | | | | | | | | | | | | | |
| Total comprehensive income attributable to UBS shareholders | | | 1,961 | | | | (1,966 | ) | | | 5,071 | | | | | |
| | | | | | | | | | | | | | | | | |
1 Refer to “Note 1b Changes in accounting policies, comparability and other adjustments” in the “Financial information” section of this report for information on the adoption of IFRS 10.
75
Financial and operating performance
Group performance
Adjusted results1, 2
| | | | | | | | | | | | | | | | | | | | | | | | | | | | | | | | |
| | For the year ended 31.12.13 | |
| CHF million | | Wealth
Management | | | Wealth
Management
Americas | | | Retail &
Corporate | | | Global Asset
Management | | | Investment
Bank | | | CC – Core
Functions3 | | | CC – Non-core
and Legacy
Portfolio | | | UBS | |
| Operating income as reported | | | 7,563 | | | | 6,538 | | | | 3,756 | | | | 1,935 | | | | 8,601 | | | | (1,007 | ) | | | 347 | | | | 27,732 | |
| | | | | | | | | | | | | | | | | | | | | | | | | | | | | | | | | |
of which: own credit on financial liabilities designated at fair value4 | | | | | | | | | | | | | | | | | | | | | | | (283 | ) | | | | | | | (283 | ) |
| | | | | | | | | | | | | | | | | | | | | | | | | | | | | | | | | |
of which: gains on sales of real estate | | | | | | | | | | | | | | | | | | | | | | | 288 | | | | | | | | 288 | |
| | | | | | | | | | | | | | | | | | | | | | | | | | | | | | | | | |
of which: net losses related to the buyback of debt in public tender offers | | | | | | | | | | | | | | | | | | | | | | | (194 | ) | | | 27 | | | | (167 | ) |
| | | | | | | | | | | | | | | | | | | | | | | | | | | | | | | | | |
of which: gain on sale of Global AM’sCanadian domestic business | | | | | | | | | | | | | | | 34 | | | | | | | | | | | | | | | | 34 | |
| | | | | | | | | | | | | | | | | | | | | | | | | | | | | | | | | |
of which: net gain on sale of remaining proprietary trading business | | | | | | | | | | | | | | | | | | | 55 | | | | (24 | )5 | | | | | | | 31 | |
| | | | | | | | | | | | | | | | | | | | | | | | | | | | | | | | | |
| Operating income (adjusted) | | | 7,563 | | | | 6,538 | | | | 3,756 | | | | 1,901 | | | | 8,546 | | | | (794 | ) | | | 320 | | | | 27,829 | |
| | | | | | | | | | | | | | | | | | | | | | | | | | | | | | | | | |
| | | | | | | | |
| Operating expenses as reported | | | 5,316 | | | | 5,680 | | | | 2,298 | | | | 1,359 | | | | 6,300 | | | | 847 | | | | 2,660 | | | | 24,461 | |
| | | | | | | | | | | | | | | | | | | | | | | | | | | | | | | | | |
of which: personnel-related restructuring charges6 | | | 71 | | | | 14 | | | | 19 | | | | 10 | | | | 9 | | | | (2 | ) | | | 35 | | | | 156 | |
| | | | | | | | | | | | | | | | | | | | | | | | | | | | | | | | | |
of which: other restructuring charges6 | | | 107 | | | | 45 | | | | 35 | | | | 33 | | | | 201 | | | | (4 | ) | | | 200 | | | | 616 | |
| | | | | | | | | | | | | | | | | | | | | | | | | | | | | | | | | |
| Operating expenses (adjusted) | | | 5,138 | | | | 5,621 | | | | 2,244 | | | | 1,316 | | | | 6,090 | | | | 853 | | | | 2,425 | | | | 23,689 | |
| | | | | | | | | | | | | | | | | | | | | | | | | | | | | | | | | |
| | | | | | | | |
| Operating profit/(loss) before tax as reported | | | 2,247 | | | | 858 | | | | 1,458 | | | | 576 | | | | 2,300 | | | | (1,854 | ) | | | (2,312 | ) | | | 3,272 | |
| | | | | | | | | | | | | | | | | | | | | | | | | | | | | | | | | |
| Operating profit/(loss) before tax (adjusted) | | | 2,425 | | | | 917 | | | | 1,512 | | | | 585 | | | | 2,455 | | | | (1,647 | ) | | | (2,104 | ) | | | 4,141 | |
| | | | | | | | | | | | | | | | | | | | | | | | | | | | | | | | | |
| |
| |
| | For the year ended 31.12.12 | |
| CHF million | | Wealth
Management | | | Wealth
Management
Americas | | | Retail &
Corporate | | | Global Asset
Management | | | Investment
Bank | | | CC – Core
Functions3 | | | CC –
Non-core
and Legacy
Portfolio | | | UBS | |
| Operating income as reported | | | 7,041 | | | | 5,877 | | | | 3,728 | | | | 1,883 | | | | 7,144 | | | | (1,689 | ) | | | 1,439 | | | | 25,423 | |
| | | | | | | | | | | | | | | | | | | | | | | | | | | | | | | | | |
of which: own credit on financial liabilities designated at fair value4 | | | | | | | | | | | | | | | | | | | | | | | (2,202 | ) | | | | | | | (2,202 | ) |
| | | | | | | | | | | | | | | | | | | | | | | | | | | | | | | | | |
of which: gains on sales of real estate | | | | | | | | | | | | | | | | | | | | | | | 112 | | | | | | | | 112 | |
| | | | | | | | | | | | | | | | | | | | | | | | | | | | | | | | | |
| Operating income (adjusted) | | | 7,041 | | | | 5,877 | | | | 3,728 | | | | 1,883 | | | | 7,144 | | | | 401 | | | | 1,439 | | | | 27,513 | |
| | | | | | | | | | | | | | | | | | | | | | | | | | | | | | | | | |
| | | | | | | | |
| Operating expenses as reported | | | 4,634 | | | | 5,281 | | | | 1,901 | | | | 1,314 | | | | 6,877 | | | | 2,008 | | | | 5,202 | | | | 27,216 | |
| | | | | | | | | | | | | | | | | | | | | | | | | | | | | | | | | |
of which: personnel-related restructuring charges6 | | | 25 | | | | 3 | | | | 3 | | | | 20 | | | | 250 | | | | (1 | ) | | | 58 | | | | 358 | |
| | | | | | | | | | | | | | | | | | | | | | | | | | | | | | | | | |
of which: other restructuring charges6 | | | 0 | | | | (5 | ) | | | 0 | | | | 0 | | | | 24 | | | | (6 | ) | | | 0 | | | | 14 | |
| | | | | | | | | | | | | | | | | | | | | | | | | | | | | | | | | |
of which: credit related to changes to theSwiss pension plan7 | | | (357 | ) | | | | | | | (287 | ) | | | (30 | ) | | | (51 | ) | | | (3 | ) | | | (2 | ) | | | (730 | ) |
| | | | | | | | | | | | | | | | | | | | | | | | | | | | | | | | | |
of which: credit related to changes to retiree benefit plans in the US7 | | | (1 | ) | | | (2 | ) | | | | | | | (16 | ) | | | (91 | ) | | | (1 | ) | | | (7 | ) | | | (116 | ) |
| | | | | | | | | | | | | | | | | | | | | | | | | | | | | | | | | |
of which: impairment of goodwill and other non-financial assets8 | | | | | | | | | | | | | | | | | | | | | | | | | | | 3,064 | | | | 3,064 | |
| | | | | | | | | | | | | | | | | | | | | | | | | | | | | | | | | |
| Operating expenses (adjusted) | | | 4,966 | | | | 5,284 | | | | 2,185 | | | | 1,340 | | | | 6,746 | | | | 2,020 | | | | 2,089 | | | | 24,627 | |
| | | | | | | | | | | | | | | | | | | | | | | | | | | | | | | | | |
| | | | | | | | |
| Operating profit/(loss) before tax as reported | | | 2,407 | | | | 597 | | | | 1,827 | | | | 569 | | | | 267 | | | | (3,698 | ) | | | (3,764 | ) | | | (1,794 | ) |
| | | | | | | | | | | | | | | | | | | | | | | | | | | | | | | | | |
| Operating profit/(loss) before tax (adjusted) | | | 2,075 | | | | 594 | | | | 1,543 | | | | 543 | | | | 398 | | | | (1,620 | ) | | | (651 | ) | | | 2,885 | |
| | | | | | | | | | | | | | | | | | | | | | | | | | | | | | | | | |
1 Adjusted results are non-GAAP financial measures as defined by SEC regulations. 2 Comparative figures in this table may differ from those originally published in quarterly and annual reports due to adjustments following organizational changes and restatements due to retrospective adoption of new accounting standards. 3 Corporate Center – Core Functions operating expenses presented in this table are after service allocations to business divisions and Corporate Center – Non-core and Legacy Portfolio. 4 Refer to “Note 24 Fair value measurement” in the “Financial information” section of this report for more information. 5 Reflects a foreign currency translation loss. 6 Refer to “Note 32 Changes in organization” in the “Financial information” section of this report for more information. 7 Refer to “Note 28 Pension and other post-employment benefit plans” in the “Financial information” section of this report for more information. 8 Refer to “Note 17 Goodwill and intangible assets” in the “Financial information” section of this report for more information.
76
|
Financial and operating performance |
|
|
Adjusted results1, 2 (continued)
| | | | | | | | | | | | | | | | | | | | | | | | | | | | | | | | |
| | For the year ended 31.12.11 | |
| CHF million | | Wealth
Management | | | Wealth
Management
Americas | | | Retail &
Corporate | | | Global Asset
Management | | | Investment
Bank | | | CC – Core
Functions3 | | | CC – Non-core
and Legacy
Portfolio | | | UBS | |
| Operating income as reported | | | 7,645 | | | | 5,213 | | | | 4,085 | | | | 1,803 | | | | 6,802 | | | | 1,931 | | | | 309 | | | | 27,788 | |
| | | | | | | | | | | | | | | | | | | | | | | | | | | | | | | | | |
of which: own credit on financial liabilities designated at fair value4 | | | | | | | | | | | | | | | | | | | | | | | 1,537 | | | | | | | | 1,537 | |
| | | | | | | | | | | | | | | | | | | | | | | | | | | | | | | | | |
of which: gains on sales of real estate | | | | | | | | | | | | | | | | | | | | | | | 94 | | | | | | | | 94 | |
| | | | | | | | | | | | | | | | | | | | | | | | | | | | | | | | | |
of which: gain on sale of strategic investment portfolio | | | 433 | | | | | | | | 289 | | | | | | | | | | | | | | | | | | | | 722 | |
| | | | | | | | | | | | | | | | | | | | | | | | | | | | | | | | | |
| Operating income (adjusted) | | | 7,212 | | | | 5,213 | | | | 3,796 | | | | 1,803 | | | | 6,802 | | | | 300 | | | | 309 | | | | 25,435 | |
| | | | | | | | | | | | | | | | | | | | | | | | | | | | | | | | | |
| | | | | | | | |
| Operating expenses as reported | | | 5,012 | | | | 4,750 | | | | 2,201 | | | | 1,373 | | | | 7,019 | | | | 369 | | | | 1,756 | | | | 22,482 | |
| | | | | | | | | | | | | | | | | | | | | | | | | | | | | | | | | |
of which: personnel-related restructuring charges5 | | | 64 | | | | 5 | | | | 29 | | | | 19 | | | | 129 | | | | 2 | | | | 14 | | | | 261 | |
| | | | | | | | | | | | | | | | | | | | | | | | | | | | | | | | | |
of which: other restructuring charges5 | | | 18 | | | | 5 | | | | 3 | | | | 7 | | | | 73 | | | | 14 | | | | 0 | | | | 119 | |
| | | | | | | | | | | | | | | | | | | | | | | | | | | | | | | | | |
| Operating expenses (adjusted) | | | 4,930 | | | | 4,740 | | | | 2,169 | | | | 1,347 | | | | 6,817 | | | | 354 | | | | 1,742 | | | | 22,102 | |
| | | | | | | | | | | | | | | | | | | | | | | | | | | | | | | | | |
| | | | | | | | |
| Operating profit/(loss) before tax as reported | | | 2,633 | | | | 463 | | | | 1,884 | | | | 430 | | | | (217 | ) | | | 1,562 | | | | (1,448 | ) | | | 5,307 | |
| | | | | | | | | | | | | | | | | | | | | | | | | | | | | | | | | |
| Operating profit/(loss) before tax (adjusted) | | | 2,282 | | | | 473 | | | | 1,627 | | | | 456 | | | | (15 | ) | | | (54 | ) | | | (1,434 | ) | | | 3,334 | |
| | | | | | | | | | | | | | | | | | | | | | | | | | | | | | | | | |
1 Adjusted results are non-GAAP financial measures as defined by SEC regulations. 2 Comparative figures in this table may differ from those originally published in quarterly and annual reports due to adjustments following organizational changes and restatements due to retrospective adoption of new accounting standards. 3 Corporate Center – Core Functions operating expenses presented in this table are after service allocations to business divisions and Corporate Center – Non-core and Legacy Portfolio. 4 Refer to “Note 24 Fair value measurement” in the “Financial information” section of this report for more information. 5 Refer to “Note 32 Changes in organization” in the “Financial information” section of this report for more information.
2013 compared with 2012
Performance
Operating profit before tax was CHF 3,272 million in 2013 compared with a loss of CHF 1,794 million in the prior year, reflecting a CHF 2,309 million increase in operating income and a CHF 2,755 million reduction in operating expenses.
In addition to reporting our results in accordance with IFRS, we report adjusted results that exclude items considered non-recurring and certain other items that management believes are not representative of the underlying performance of our businesses. Such adjusted results are non-GAAP financial measures as defined by SEC regulations. For 2013, the items we excluded were an own credit loss of CHF 283 million, gains on sales of real estate of CHF 288 million, net losses related to the buyback of debt in public tender offers of CHF 167 million, a gain on the sale of Global Asset Management’s Canadian domestic business of CHF 34 million, a net gain on the sale of our remaining proprietary trading business of CHF 31 million and net restructuring charges of CHF 772 million. For 2012, the items we excluded were an own credit loss of CHF 2,202 million, gains on sales of real estate of CHF 112 million, net restructuring charges of CHF 371 million, a credit related to changes to our Swiss pension plan of CHF 730 million, a credit related to changes to our retiree benefit plans in the US of CHF 116 million and the impairment of goodwill and other non-financial assets of CHF 3,064 million.
On this adjusted basis, profit before tax was CHF 4,141 million in 2013 compared with CHF 2,885 million in the prior year. Adjusted
operating income increased by CHF 316 million, mainly reflecting an increase of CHF 891 million in net fee and commission income, largely in our wealth management businesses. Adjusted net interest and trading income declined by CHF 535 million, mainly as a result of reductions in Corporate Center – Non-core and Legacy Portfolio as well as Corporate Center – Core Functions, partly offset by higher revenues in the Investment Bank. Adjusted other income decreased by CHF 108 million, mainly due to lower net gains on financial investments available-for-sale.
Adjusted operating expenses decreased by CHF 938 million to CHF 23,689 million, mainly due to a decline of CHF 848 million in charges for provisions for litigation, regulatory and similar matters as well as a CHF 199 million reduction in personnel expenses, partly offset by CHF 110 million higher other non-personnel expenses.
Operating income
Total operating income was CHF 27,732 million compared with CHF 25,423 million. On an adjusted basis, total operating income increased by CHF 316 million to CHF 27,829 million from CHF 27,513 million, as we recorded an increase of CHF 891 million in net fee and commission income, largely in our wealth management businesses. This increase was largely offset by a CHF 535 million decline in adjusted net interest and trading income, mainly as a result of reductions in Non-core and Legacy Portfolio as well as Corporate Center – Core Functions, partly offset by higher revenues in the Investment Bank. Adjusted other income decreased by CHF 108 million, mainly due to lower net gains on financial investments available-for-sale.
Financial and operating performance
Group performance
Net interest and trading income
| | | | | | | | | | | | | | | | |
| | For the year ended | | | % change from | |
| CHF million | | 31.12.13 | | | 31.12.12 | | | 31.12.11 | | | 31.12.12 | |
| | | | |
| Net interest and trading income | | | | | | | | | | | | | | | | |
| | | | | | | | | | | | | | | | | |
| Net interest income | | | 5,786 | | | | 5,978 | | | | 6,826 | | | | (3 | ) |
| | | | | | | | | | | | | | | | | |
| Net trading income | | | 5,130 | | | | 3,526 | | | | 4,343 | | | | 45 | |
| | | | | | | | | | | | | | | | | |
| Total net interest and trading income | | | 10,915 | | | | 9,504 | | | | 11,169 | | | | 15 | |
| | | | | | | | | | | | | | | | | |
| Wealth Management | | | 2,868 | | | | 2,728 | | | | 2,846 | | | | 5 | |
| | | | | | | | | | | | | | | | | |
| Wealth Management Americas | | | 1,323 | | | | 1,265 | | | | 1,179 | | | | 5 | |
| | | | | | | | | | | | | | | | | |
| Retail & Corporate | | | 2,485 | | | | 2,467 | | | | 2,661 | | | | 1 | |
| | | | | | | | | | | | | | | | | |
| Global Asset Management | | | 9 | | | | 9 | | | | 8 | | | | 0 | |
| | | | | | | | | | | | | | | | | |
| Investment Bank | | | 5,015 | | | | 3,574 | | | | 2,831 | | | | 40 | |
| | | | | | | | | | | | | | | | | |
of which: Corporate Client Solutions | | | 1,035 | | | | 575 | | | | 399 | | | | 80 | |
| | | | | | | | | | | | | | | | | |
of which: Investor Client Services | | | 3,980 | | | | 2,999 | | | | 2,432 | | | | 33 | |
| | | | | | | | | | | | | | | | | |
| Corporate Center | | | (784 | ) | | | (540 | ) | | | 1,645 | | | | 45 | |
| | | | | | | | | | | | | | | | | |
of which: Core Functions | | | (1,045 | ) | | | (1,992 | ) | | | 1,765 | | | | (48 | ) |
| | | | | | | | | | | | | | | | | |
of which: own credit on financial liabilities designated at fair value | | | (283 | ) | | | (2,202 | ) | | | 1,537 | | | | (87 | ) |
| | | | | | | | | | | | | | | | | |
of which: Non-core and Legacy Portfolio | | | 261 | | | | 1,452 | | | | (121 | ) | | | (82 | ) |
| | | | | | | | | | | | | | | | | |
| Total net interest and trading income | | | 10,915 | | | | 9,504 | | | | 11,169 | | | | 15 | |
| | | | | | | | | | | | | | | | | |
Net interest and trading income
Net interest and trading income increased by CHF 1,411 million to CHF 10,915 million. 2013 included an own credit loss on financial liabilities designated at fair value of CHF 283 million, primarily due to further tightening of our funding spreads, compared with an own credit loss of CHF 2,202 million in the prior year when our funding spreads tightened significantly. Excluding the effect of own credit and a net interest and trading income gain related to the buyback of debt in a public tender offer of CHF 27 million in 2013, net interest and trading income decreased by CHF 535 million to CHF 11,171 million, mainly as a result of reductions in Non-core and Legacy Portfolio as well as Corporate Center – Core Functions, partly offset by higher revenues in the Investment Bank.
Net interest and trading income in Wealth Management increased by CHF 140 million. Net interest income increased by CHF 110 million to CHF 2,061 million, mainly due to revenues of CHF 110 million allocated from the repurchase agreement unit within Group Treasury in Corporate Center – Core Functions. Previously, such revenues were not allocated to the business divisions. The increase in net interest income was also due to lower costs related to the multi-currency portfolio of unencumbered, high-quality, short-term assets managed centrally by Group Treasury. These factors, together with higher income resulting from increased loan and client deposit volumes, more than offset the negative effect of a lower deposit margin resulting from the ongoing low interest rate environment. Net trading income increased by CHF 29 million to CHF 807 million and included higher income from foreign exchange-related products and increased treasury-related income, partly offset by lower income from precious metals.
In Wealth Management Americas, net interest and trading income increased by CHF 58 million, reflecting a CHF 144 million increase in net interest income primarily due to higher client balances
insecurities-backed lending and mortgages. Furthermore, net funding costs related to the goodwill and intangible assets that arose from the PaineWebber acquisition are retained in Corporate Center – Core Functions with effect from 1 January 2013. These increases were partly offset by lower net interest income from the available-for-sale portfolio, primarily due to lower average balances. Net trading income decreased by CHF 86 million to CHF 387 million, mainly due to trading losses related to the Puerto Rico municipal market as well as lower income from taxable fixed income and US municipal bond trading.
Net interest and trading income in Retail & Corporate increased by CHF 18 million.
Within the Investment Bank, Investor Client Services net interest and trading income increased by CHF 981 million, primarily due to higher derivatives revenues, mainly as a result of higher revenues in Asia Pacific and Europe, Middle East and Africa. Furthermore, cash revenues increased, largely as 2012 included a loss of CHF 349 million related to the Facebook initial public offering. Revenues in financing services and other equities also increased. These increases were partly offset by lower revenues in rates and credit, primarily due to weaker trading performance in the flow businesses, and by slightly lower foreign exchange revenues. Corporate Client Solutions net interest and trading income increased by CHF 460 million, largely due to higher revenues in equity capital markets, mainly as a result of a large private transaction recorded in the first half of 2013.
Corporate Center – Core Functions net interest and trading income, excluding the effect of own credit, decreased by CHF 972 million, partly due to losses of CHF 153 million related to our macro cash flow hedge models compared with gains of CHF 152 million in the prior year. The decrease in net interest and trading income was also due to a decline in revenues to CHF 22 million from CHF 245 million in the repurchase agreement unit, which was transferred
|
Financial and operating performance |
|
|
from the Investment Bank to Corporate Center – Core Functions in 2013 and for which prior period information was restated. Whereas restated results reflected no allocation of revenues from the repurchase agreement unit to the business divisions, from 2013 onwards revenues from this unit are allocated to the business divisions, mainly to Wealth Management. In addition, 2013 included losses from cross-currency basis swaps of CHF 222 million which are held as economic hedges and central funding costs retained in Group Treasury increased. Furthermore, 2013 included CHF 102 million in net funding costs related to the goodwill and intangible assets that arose from the PaineWebber acquisition which are retained in Corporate Center – Core Functions with effect from 1 January 2013.
In Non-core and Legacy Portfolio, net interest and trading income decreased by CHF 1,191 million. Non-core net interest and trading income decreased by CHF 1,146 million, largely due to lower revenues in rates and credit as we focused on risk-weighted assets (RWA) and balance sheet reduction, as well as on reducing operational complexity as part of the accelerated implementation of our strategy. In 2012, portfolios were actively traded and benefited from increased liquidity, with strong two-way client flow that resulted in higher revenues. Legacy Portfolio net interest and trading income decreased by CHF 45 million. In 2013, we exercised our option to acquire the SNB StabFund’s equity and recorded an option revaluation gain of CHF 431 million prior to the exercise compared with a gain of CHF 526 million in the prior year. Trading revenues also decreased due to an interest charge of CHF 34 million in 2013 relating to tax obligations of the SNB StabFund. Legacy Portfolio net interest and trading income, excluding the SNB StabFund option, increased by CHF 83 million, mainly as 2012 included losses on collateralized debt obligations (CDO) and related hedging swaps of CHF 171 million as we exited certain CDO positions to reduce RWA.
| | è | | Refer to “Note 3 Net interest and trading income” in the “Financial information” section of this report for more information |
| | è | | Refer to “Note 24 Fair value measurement” in the “Financial information” section of this report for more information on own credit |
Credit loss expense/recovery
We recorded net credit loss expenses of CHF 50 million compared with CHF 118 million in the prior year.
In Wealth Management, net credit loss expenses were CHF 10 million compared with net credit loss recoveries of CHF 1 million in the prior year.
In Wealth Management Americas, 2013 included net credit loss expenses of CHF 27 million compared with net credit loss expenses of CHF 14 million in the prior year. The 2013 expenses were largely due to loan loss allowances on securities-backed lending facilities collateralized by Puerto Rico municipal securities and related funds.
In Retail & Corporate, net credit loss expenses were CHF 18 million compared with net credit loss expenses of CHF 27 million in the prior year. 2013 included net specific loan loss allowances of CHF 113 million, reflecting a number of new workout cases that were individually reviewed, downgraded and impaired as well as adjustments on existing positions. This was largely offset by a net release of CHF 95 million of collective loan loss allowances based on the ongoing review of the portfolio, as well as the overall im- proved outlook for relevant industries. The prior year included net specific loan loss allowances of CHF 43 million, partly offset by a net decrease in collective loan loss allowances of CHF 16 million.
In Non-core and Legacy Portfolio, net credit loss recoveries were CHF 3 million compared with net credit loss expenses of CHF 78 million in the prior year, which mainly reflected an impairment charge related to certain student loan auction rate securities, sub- sequently sold to reduce RWA.
| | è | | Refer to the “Wealth Management Americas,” “Retail & Corporate” and “Corporate Center” sections of this report for more information |
Net fee and commission income
Net fee and commission income increased by CHF 891 million to CHF 16,287 million.
Portfolio management and advisory fees increased by CHF 730 million to CHF 6,625 million, mainly in Wealth Management Americas and in Wealth Management, largely due to higher average invested assets as well as pricing adjustments.
Net brokerage fees increased by CHF 231 million to CHF 3,196 million, mainly in the Investment Bank due to improved market activity levels, and in Wealth Management Americas due to higher client activity levels.
Credit loss (expense)/recovery
| | | | | | | | | | | | | | | | |
| | For the year ended | | | % change from | |
| CHF million | | 31.12.13 | | | 31.12.12 | | | 31.12.11 | | | 31.12.12 | |
| Wealth Management | | | (10 | ) | | | 1 | | | | 11 | | | | | |
| | | | | | | | | | | | | | | | | |
| Wealth Management Americas | | | (27 | ) | | | (14 | ) | | | (6 | ) | | | 93 | |
| | | | | | | | | | | | | | | | | |
| Retail & Corporate | | | (18 | ) | | | (27 | ) | | | (101 | ) | | | (33 | ) |
| | | | | | | | | | | | | | | | | |
| Investment Bank | | | 2 | | | | 0 | | | | (10 | ) | | | | |
| | | | | | | | | | | | | | | | | |
| Corporate Center | | | 3 | | | | (78 | ) | | | 22 | | | | | |
| | | | | | | | | | | | | | | | | |
of which: Core Functions | | | 0 | | | | 0 | | | | (1 | ) | | | | |
| | | | | | | | | | | | | | | | | |
of which: Non-core and Legacy Portfolio | | | 3 | | | | (78 | ) | | | 22 | | | | | |
| | | | | | | | | | | | | | | | | |
| Total | | | (50 | ) | | | (118 | ) | | | (84 | ) | | | (58 | ) |
| | | | | | | | | | | | | | | | | |
79
Financial and operating performance
Group performance
Investment fund fees increased by CHF 177 million to CHF 3,803 million, primarily due to higher managed account fees calculated on higher invested asset levels in Wealth Management Americas and higher client activity levels in Wealth Management.
Total underwriting fees decreased by CHF 165 million to CHF 1,374 million, reflecting a decrease of CHF 208 million in debt underwriting fees, mainly in the Investment Bank.
| | è | | Refer to “Note 4 Net fee and commission income” in the “Financial information” section of this report for more information |
Other income
Other income was CHF 580 million compared with CHF 641 million in the prior year.
Income from financial investments available-for-sale was CHF 168 million compared with CHF 308 million in the prior year.
Net gains from disposals of financial investmentsavailable-for-sale in 2013 included gains of CHF 74 million resulting from the divestment of our participation in Euroclear Plc., of which CHF 27 million was allocated to Retail & Corporate, CHF 25 million to Wealth Management and CHF 22 million to the Investment Bank. Further, net gains from disposals of financial investmentsavailable-for-sale included net gains of CHF 61 million in Corporate Center – Core Functions in 2013. 2012 included net gains of CHF 272 million in Corporate Center – Core Functions, as well as gains
of CHF 101 million in Non-core and Legacy Portfolio, mainly related to the sale of an equity investment.
Income related to associates and subsidiaries increased by CHF 79 million to CHF 160 million, mainly due to lower charges for certain provisions for litigation, regulatory and similar matters recorded within other income, partly offset by lower income related to our participation in the SIX Group. Furthermore, 2013 included a net gain on sale of our remaining proprietary trading business of CHF 31 million.
Other income excluding income from financial investments available-for-sale and income related to associates and subsidiaries was unchanged at CHF 252 million. Gains on sales of real estate were CHF 288 million compared with CHF 112 million in the prior year. Net gains on sales of loans and receivables were CHF 53 million compared with net losses of CHF 11 million in the prior year. Furthermore, 2013 included losses related to the buyback of debt in public tender offers of CHF 194 million.
| | è | | Refer to “Note 5 Other income” in the “Financial information” section of this report for more information |
Operating expenses
Total operating expenses decreased by CHF 2,755 million to CHF 24,461 million. Restructuring charges were CHF 772 million compared with CHF 371 million in the prior year, mainly related to
Operating expenses
| | | | | | | | | | | | | | | | |
| | For the year ended | | | % change from | |
| CHF million | | 31.12.13 | | | 31.12.12 | | | 31.12.11 | | | 31.12.12 | |
| Personnel expenses (adjusted)1 | | | | | | | | | | | | | | | | |
| | | | | | | | | | | | | | | | | |
| Salaries | | | 6,203 | | | | 6,750 | | | | 6,828 | | | | (8 | ) |
| | | | | | | | | | | | | | | | | |
| Total variable compensation | | | 3,201 | | | | 3,005 | | | | 3,531 | | | | 7 | |
| | | | | | | | | | | | | | | | | |
of which: relating to current year2 | | | 2,369 | | | | 1,901 | | | | 2,020 | | | | 25 | |
| | | | | | | | | | | | | | | | | |
of which: relating to prior years3 | | | 832 | | | | 1,104 | | | | 1,511 | | | | (25 | ) |
| | | | | | | | | | | | | | | | | |
| Wealth Management Americas: Financial advisor compensation4 | | | 3,140 | | | | 2,873 | | | | 2,519 | | | | 9 | |
| | | | | | | | | | | | | | | | | |
| Other personnel expenses5 | | | 2,481 | | | | 2,595 | | | | 2,494 | | | | (4 | ) |
| | | | | | | | | | | | | | | | | |
| Total personnel expenses (adjusted)1 | | | 15,026 | | | | 15,225 | | | | 15,373 | | | | (1 | ) |
| | | | | | | | | | | | | | | | | |
| Non-personnel expenses (adjusted)1 | | | | | | | | | | | | | | | | |
| | | | | | | | | | | | | | | | | |
| Provisions for litigation, regulatory and similar matters | | | 1,701 | | | | 2,549 | | | | 276 | | | | (33 | ) |
| | | | | | | | | | | | | | | | | |
| Other non-personnel expenses6 | | | 6,962 | | | | 6,852 | | | | 6,453 | | | | 2 | |
| | | | | | | | | | | | | | | | | |
| Total non-personnel expenses (adjusted)1 | | | 8,662 | | | | 9,401 | | | | 6,728 | | | | (8 | ) |
| | | | | | | | | | | | | | | | | |
| Adjusting items | | | 772 | | | | 2,589 | | | | 380 | | | | (70 | ) |
| | | | | | | | | | | | | | | | | |
of which: personnel-related restructuring charges | | | 156 | | | | 358 | | | | 261 | | | | (56 | ) |
| | | | | | | | | | | | | | | | | |
of which: other restructuring charges | | | 616 | | | | 14 | | | | 119 | | | | | |
| | | | | | | | | | | | | | | | | |
of which: credits related to changes to the Swiss pension plan and retiree benefit plans in the US7 | | | | | | | (846 | ) | | | | | | | | |
| | | | | | | | | | | | | | | | | |
of which: impairment of goodwill and other non-financial assets8 | | | | | | | 3,064 | | | | | | | | | |
| | | | | | | | | | | | | | | | | |
| Total operating expenses as reported | | | 24,461 | | | | 27,216 | | | | 22,482 | | | | (10 | ) |
| | | | | | | | | | | | | | | | | |
1 Excluding adjusting items. 2 Includes expenses relating to performance awards and other variable compensation for the respective performance year. 3 Consists of amortization of prior years’ awards relating to performance awards and other variable compensation. 4 Financial advisor compensation consists of grid-based compensation based directly on compensable revenues generated by financial advisors and supplemental compensation calculated based on financial advisor productivity, firm tenure, assets and other variables. It also includes costs related to compensation commitments with financial advisors entered into at the time of recruitment, which are subject to vesting requirements. 5 Consists of expenses related to contractors, social security, pension and other post-employment benefit plans and other personnel expenses. Refer to “Note 6 Personnel expenses” in the “Financial information” section of this report for more information. 6 Includes general and administrative expenses excluding charges for provisions for litigation, regulatory and similar matters, as well as depreciation and impairment of property and equipment and amortization and impairment of intangible assets. 7 Refer to “Note 28 Pension and other post-employment benefit plans” in the “Financial information” section of this report for more information. 8 Refer to “Note 17 Goodwill and intangible assets” in the “Financial information” section of this report for more information.
80
|
Financial and operating performance |
|
|
increased non-personnel related restructuring charges, partly offset by lower personnel-related restructuring charges.
Furthermore, 2012 included a credit related to changes to our Swiss pension plan of CHF 730 million and a credit related to changes to our retiree benefit plans in the US of CHF 116 million, as well as impairment losses on goodwill and other non-financial assets of CHF 3,064 million. On an adjusted basis, total operating expenses decreased by CHF 938 million to CHF 23,689 million, mainly due to a reduction of CHF 848 million in charges for provisions for litigation, regulatory and similar matters as well as a decrease of CHF 199 million in personnel expenses, partly offset by an increase of CHF 110 million in other non-personnel expenses.
| | è | | Refer to “Note 32 Changes in organization” in the “Financial information” section of this report for more information on restructuring charges |
Personnel expenses
Personnel expenses increased by CHF 445 million to CHF 15,182 million. 2013 included net charges of CHF 156 million in personnel-related restructuring expenses compared with CHF 358 million in the prior year. Furthermore, 2012 included a credit related to changes to our Swiss pension plan of CHF 730 million and a credit related to changes to our retiree benefit plans in the US of CHF 116 million. On an adjusted basis, personnel expenses decreased by CHF 199 million to CHF 15,026 million.
Expenses for salaries, excluding the effects of restructuring, decreased by CHF 547 million, largely due to a reduction in the number of personnel as a result of our ongoing cost reduction programs.
Excluding the effects of restructuring, total variable compensation expenses increased by CHF 196 million. Expenses for performance awards increased by CHF 116 million, due to higher expenses for current year performance awards reflecting a 28% increase in the overall performance award pool, partly offset by a lower charge for the amortization of deferred compensation awards from prior years. Including restructuring, expenses for performance awards were virtually unchanged. Other variable compensation expenses excluding restructuring increased by CHF 80 million, mainly due to increased expenses for retention payments.
Financial advisor compensation in Wealth Management Americas increased by CHF 267 million, corresponding with higher compensable revenues.
Other personnel expenses decreased by CHF 114 million on an adjusted basis, mainly due to lower expenses for pension and other post-employment benefits plans and reduced expenses for contractors.
| | è | | Refer to “Note 6 Personnel expenses” in the “Financial information” section of this report for more information |
| | è | | Refer to “Note 28 Pension and otherpost-employment benefit plans” in the “Financial information” section of this report for more information |
| | è | | Refer to “Note 29 Equity participation and other compensation plans” in the “Financial information” section of this report for more information |
| | è | | Refer to the “Compensation” section of this report for more information |
General and administrative expenses
General and administrative expenses decreased by CHF 273 million to CHF 8,380 million. On an adjusted basis, excluding net restructuring charges of CHF 548 million in 2013 compared with zero in 2012, general and administrative expenses decreased by CHF 821 million.
Net charges for provisions for litigation, regulatory and similar matters decreased by CHF 848 million to CHF 1,701 million, primarily as the prior year included charges arising from fines and disgorgement resulting from regulatory investigations concerning LIBOR and other benchmark rates. This was partly offset by higher provisions in 2013 for claims related to sales of residential mortgage-backed securities and mortgages. In view of the current regulatory and political climate affecting financial institutions, and because we continue to be exposed to a number of significant claims and regulatory matters, we expect charges associated with litigation, regulatory and similar matters to remain at elevated levels through 2014.
2013 expenses included a net charge of CHF 124 million for the UK bank levy, mainly in Non-core and Legacy Portfolio and the Investment Bank, compared with a net charge of CHF 127 million recognized in the prior year, as well as a charge of CHF 110 million related to theSwiss-UK tax agreement, allocated primarily to Wealth Management, and an impairment charge of CHF 87 million in Non-core and Legacy Portfolio related to certain disputed receivables. Furthermore, excluding the effects of restructuring, expenses decreased for outsourcing of information technology and other services, occupancy, and marketing and public relations, by CHF 76 million, CHF 66 million and CHF 50 million, respectively.
| | è | | Refer to “Note 7 General and administrative expenses” in the “Financial information” section of this report for more information |
| | è | | Refer to “Note 22 Provisions and contingent liabilities” in the “Financial information” section of this report for more information |
| | è | | Refer to the “Regulatory and legal developments” section of this report for more information on the charge in relation to the Swiss-UK tax agreement |
Depreciation, impairment and amortization
Depreciation and impairment of property and equipment was CHF 816 million compared with CHF 689 million in the prior year, partly as restructuring-related charges increased to CHF 68 million from CHF 14 million.
Impairment of goodwill was zero compared with CHF 3,030 million in the prior year.
Amortization and impairment of intangible assets was CHF 83 million compared with CHF 106 million in the prior year. We recorded impairment charges of CHF 3 million compared with CHF 17 million.
| | è | | Refer to “Note 17 Goodwill and intangible assets” in the “Financial information” section of this report for more information |
81
Financial and operating performance
Group performance
Tax
We recognized a net income tax benefit of CHF 110 million for 2013, which included a Swiss tax expense of CHF 548 million and a net foreign tax benefit of CHF 658 million.
The Swiss tax expense included a current tax expense of CHF 93 million related to taxable profits, against which no losses were available to offset, earned by Swiss subsidiaries and also from the sale of real estate. In addition, it included a deferred tax expense of CHF 455 million, mainly reflecting the amortization of deferred tax assets previously recognized in relation to tax losses carried forward used to offset taxable profits for the year.
The net foreign tax benefit included a current tax expense of CHF 342 million in respect of taxable profits earned by non-Swiss subsidiaries and branches, against which no losses were available to offset. This was more than offset by a net deferred tax benefit of CHF 1,000 million reflecting a net upward revaluation of deferred tax assets, partially offset by the amortization of deferred tax assets, as tax losses were used against taxable profits.
In 2014, notwithstanding the effects of any potential reassessment of the level of deferred tax assets, we expect the tax rate to be in the range of 20% to 25%. Consistent with past practice, we expect to revalue our overall level of deferred tax assets in the second half of 2014 based on a reassessment of future profitability taking into account updated business plan forecasts. Furthermore, based on our actual and forecasted financial performance, we may reassess the manner in which the probability of future taxable income is evaluated and include additional forecasted taxable income in our deferred tax assets assessment which may have a material effect on recognized deferred tax assets and tax expense. The full year effective tax rate could change significantly on the basis of this reassessment. It could also change if aggregate tax expenses for locations other than Switzerland, the US and UK differ from what is expected.
| | è | | Refer to “Note 8 Income taxes” in the “Financial information” section of this report for more information |
Total comprehensive income attributable to UBS shareholders
Total comprehensive income attributable to UBS shareholders includes all changes in equity (including net profit) attributed to UBS shareholders during a period, except those resulting from investments by and distributions to shareholders as well asequity-settledshare-based payments. Items included in comprehensive income, but not in net profit, are reported under other comprehensive income (OCI). These items will be reclassified to net profit when the underlying item is sold or realized, with the exception of gains and losses on defined benefit plans and certain property revaluations.
In 2013, total comprehensive income attributable to UBS shareholders was CHF 1,961 million, reflecting net profit attributable to UBS shareholders of CHF 3,172 million, partly offset by negative OCI attributable to UBS shareholders of CHF 1,211 million (net of tax).
OCI in 2013 included negative cash flow hedge OCI of CHF 1,520 million (net of tax), mainly reflecting significant increases in long-term interest rates across all major currencies.
Foreign currency translation losses amounted to CHF 471 million (net of tax), primarily related to a weakening of the US dollar, Indian rupee and Australian dollar against the Swiss franc.
OCI associated with financial investmentsavailable-for-sale was negative CHF 154 million (net of tax), mainly as previously unrealized net gains were reclassified from OCI to the income statement upon sale of investments.
These decreases in OCI were partly offset by net OCI gains on defined benefit plans of CHF 939 million (net of tax), mainly related to our Swiss pension plan which recorded a pre-tax OCI gain of CHF 1,119 million. This OCI gain on the Swiss pension plan reflected a gain of CHF 1,124 million due to a reduction of the defined benefit obligation and a gain of CHF 803 million related to an increase in the fair value of plan assets, partly offset by an OCI reduction of CHF 808 million representing the excess of the pension surplus over the estimated future economic benefit. The net pre-tax OCI gains on non-Swiss pension plans amounted to CHF 49 million.
| | è | | Refer to the “Statement of comprehensive income” in the “Financial information” section of this report for more information |
| | è | | Refer to “Note 28 Pension and otherpost-employment benefit plans” in the “Financial information” section of this report for more information on OCI related to defined benefit plans |
Net profit attributable to preferred noteholders
Net profit attributable to preferred noteholders was CHF 204 million compared with CHF 220 million in the prior year.
We expect net profit attributable to preferred noteholders to be approximately CHF 110 million in both 2014 and 2015, and approximately CHF 85 million in 2016.
Key figures
Cost/income ratio
The cost/income ratio improved to 88.0% in 2013 compared with 106.6% in the prior year. On an adjusted basis, the cost/income ratio improved to 85.0% from 89.1%.
Risk-weighted assets
Our phase-in Basel III RWA decreased by CHF 33 billion to CHF 229 billion, mainly due to a CHF 41 billion reduction in credit risk RWA and a CHF 17 billion reduction in market risk RWA, partly offset by a CHF 25 billion increase in operational risk RWA. The
|
Financial and operating performance |
|
|
CHF 41 billion decrease in credit risk RWA was mainly due to a CHF 24 billion reduction related to Other exposure segments, mainly driven by a reduction in RWA for advanced and standardized credit valuation adjustments (CVA) of CHF 18 billion, mainly due to benefits from economic CVA hedges, ratings migration, reduced exposures and market-driven reductions in the Investment Bank and Non-core and Legacy Portfolio. Furthermore, a decline of CHF 6 billion was realized due to the sale of securitization exposures in Non-core and Legacy Portfolio. Credit risk RWA for exposures to corporates decreased by CHF 10 billion, primarily due to a reduction in drawn loans, undrawn loan commitments and derivative exposures in Wealth Management Americas, the Investment Bank and Non-core and Legacy Portfolio. Credit risk RWA for exposures to banks declined by CHF 6 billion, mainly due to lower derivative exposures in the Investment Bank and Non-core and Legacy Portfolio. The CHF 17 billion decrease in market risk RWA was due to a CHF 5 billion decrease in the comprehensive risk measure, a decline of CHF 4 billion in the incremental risk charge and reductions of CHF 2 billion, CHF 3 billion and CHF 1 billion in RWA related tovalue-at-risk (VaR), stressed VaR and risks-not-in-VaR, respectively. The CHF 25 billion increase in operational risk RWA was primarily due to incremental RWA of CHF 22.5 billion resulting from the supplemental operational risk capital analysis mutually agreed to by UBS and FINMA.
| | è | | Refer to the “Investment Bank,” “Corporate Center” and “Capital management” sections of this report for more information |
| | è | | Refer to the “Regulatory and legal developments” section of this report for more information on the incremental RWA resulting from the supplemental operational risk capital analysis mutually agreed to by UBS and FINMA |
Net new money
In Wealth Management, all regions contributed to net inflows of CHF 35.9 billion in 2013, compared with CHF 26.3 billion in the prior year. The strongest net inflows were recorded in Asia Pacific followed by emerging markets, Switzerland and Europe. Net inflows in the European onshore and the Swiss-based Global Family Office business in Europe more than offset net outflows in the
European cross-border business, which was negatively affected by ongoing asset outflows in the context of fiscal and regulatory concerns. On a global basis, net new money from ultra high net worth clients was CHF 33.6 billion compared with CHF 19.9 billion in the prior year.
In Wealth Management Americas, net new money totaled CHF 17.6 billion, or USD 19.0 billion, compared with CHF 20.6 billion, or USD 22.1 billion, in the prior year, due to lower inflows from financial advisors employed with UBS for more than one year as well as lower inflows from net recruiting of financial advisors. This decrease was partly offset by higher inflows from the Global Family Office.
Excluding money market flows, Global Asset Management recorded net new money inflows from third parties of CHF 0.7 billion compared with net outflows of CHF 0.6 billion in 2012. Net inflows, notably from clients serviced from Europe, Middle East and Africa and from Switzerland, were partly offset by net outflows from clients serviced from the Americas. Net new money outflows from clients of UBS’s wealth management businesses, excluding money market flows, were CHF 5.5 billion compared with CHF 5.2 billion in the prior year. Net outflows, mainly from clients serviced from Switzerland, were partly offset by net inflows from clients serviced from the Americas. Money market net outflows from third parties were CHF 1.5 billion compared with net inflows of CHF 0.9 billion in the prior year and were mainly from clients serviced from the Americas. Money market net outflows from clients of UBS’s wealth management businesses were CHF 13.6 billion compared with CHF 8.3 billion in the prior year. In both years, net outflows were primarily due to an ongoing initiative by Wealth Management Americas to increase deposit account balances in UBS banking entities. This led to CHF 8.3 billion in outflows from money market funds managed by Global Asset Management in 2013 and CHF 6.2 billion in 2012. The corresponding increase in deposit account balances in Wealth Management Americas does not constitute net new money. Total net new money outflows were CHF 19.9 billion compared with CHF 13.3 billion in the prior year.
| | è | | Refer to the “Wealth Management,” “Wealth Management Americas” and “Global Asset Management” sections of this report for more information |
Net new money1
| | | | | | | | | | | | |
| | For the year ended | |
| CHF billion | | | 31.12.13 | | | | 31.12.12 | | | | 31.12.11 | |
| Wealth Management | | | 35.9 | | | | 26.3 | | | | 23.5 | |
| | | | | | | | | | | | | |
| Wealth Management Americas | | | 17.6 | | | | 20.6 | | | | 12.1 | |
| | | | | | | | | | | | | |
| Global Asset Management | | | (19.9 | ) | | | (13.3 | ) | | | 4.3 | |
| | | | | | | | | | | | | |
of which: non-money market flows | | | (4.8 | ) | | | (5.9 | ) | | | 9.0 | |
| | | | | | | | | | | | | |
of which: money market flows | | | (15.1 | ) | | | (7.4 | ) | | | (4.7 | ) |
| | | | | | | | | | | | | |
1 Net new money excludes interest and dividend income.
83
Financial and operating performance
Group performance
Invested assets
| | | | | | | | | | | | | | | | |
| | As of | | | % change from | |
| CHF billion | | 31.12.13 | | | 31.12.12 | | | 31.12.11 | | | 31.12.12 | |
| Wealth Management | | | 886 | | | | 821 | | | | 750 | | | | 8 | |
| Wealth Management Americas | | | 865 | | | | 772 | | | | 709 | | | | 12 | |
| Global Asset Management | | | 583 | | | | 581 | | | | 574 | | | | 0 | |
| | | | | | | | | | | | | | | | | |
Invested assets
In Wealth Management, invested assets were CHF 886 billion as of 31 December 2013, representing an increase of CHF 65 billion from 31 December 2012. Net new money inflows of CHF 36 billion and positive market performance of CHF 34 billion were slightly offset by negative currency translation effects of CHF 4 billion.
In Wealth Management Americas, invested assets were CHF 865 billion as of 31 December 2013, an increase of CHF 93 billion from 31 December 2012. In US dollar terms, invested assets increased by USD 127 billion to USD 970 billion, reflecting positive market performance of USD 108 billion and continued strong net new money inflows of USD 19 billion.
In Global Asset Management, invested assets were CHF 583 billion as of 31 December 2013 compared with CHF 581 billion as of 31 December 2012. Net new money outflows of CHF 20 billion, combined with negative currency translation effects of CHF 15 billion and a reduction of CHF 7 billion related to the aforementioned sale of the Canadian domestic business, were more than offset by positive market performance of CHF 44 billion.
| | è | | Refer to the “Wealth Management,” “Wealth Management Americas” and “Global Asset Management” sections of this report for more information |
84
|
Financial and operating performance |
|
|
2012 compared with 2011
Performance
Operating profit before tax was a loss of CHF 1,794 million in 2012 compared with a profit of CHF 5,307 million in the prior year. The 2012 loss was primarily due to impairment losses of CHF 3,064 million on goodwill and other non-financial assets and net charges for provisions for litigation, regulatory and similar matters of CHF 2,549 million, including charges for provisions arising from fines and disgorgement resulting from regulatory investigations concerning LIBOR and other benchmark rates, as well as claims related to sales of residential mortgage-backed securities. The full year 2012 result also included an own credit loss on financial liabilities designated at fair value of CHF 2,202 million and net restructuring charges of CHF 371 million.
In addition to reporting our results in accordance with IFRS, we report adjusted results that exclude items considered non-recurring and certain other items that management believes are not representative of the underlying performance of our businesses. Such adjusted results are non-GAAP financial measures as defined by SEC regulations. For 2012, the items we excluded were the abovementioned impairment losses of CHF 3,064 million, the own credit loss of CHF 2,202 million, gains on sales of real estate of CHF 112 million, a credit to personnel expenses related to changes to our Swiss pension plan of CHF 730 million, net restructuring charges of CHF 371 million and a credit to personnel expenses related to changes to our retiree benefit plans in the US of CHF 116 million. The adjustments in 2011 were an own credit gain of CHF 1,537 million, gains on sales of real estate of CHF 94 million, a gain on sale of our strategic investment portfolio of CHF 722 million and net restructuring charges of CHF 380 million.
On this adjusted basis, the 2012 profit before tax was CHF 2,885 million compared with CHF 3,334 million in 2011, mainly as net charges for provisions for litigation, regulatory and similar matters increased by CHF 2,273 million to CHF 2,549 million, while 2011 included a loss of CHF 1,849 million related to the unauthorized trading incident announced in September of that year.
Operating income
Total operating income was CHF 25,423 million in 2012 compared with CHF 27,788 million in 2011. Excluding the impacts of own credit as well as gains on sales of real estate in both years and the gain on the sale of our strategic investment portfolio in 2011, operating income increased by CHF 2,078 million to CHF 27,513 million.
Net interest and trading income
Net interest and trading income decreased by CHF 1,665 million to CHF 9,504 million. 2012 included an own credit loss on financial liabilities designated at fair value of CHF 2,202 million, primarily reflecting significant tightening of our funding spreads,
compared with an own credit gain of CHF 1,537 million in 2011. Excluding the impact of own credit, net interest and trading income increased by CHF 2,074 million.
Net interest and trading income in Wealth Management declined by CHF 118 million, mainly as the prior year included CHF 103 million of interest income stemming from the abovementioned strategic investment portfolio. Moreover, net interest income was negatively affected by increased costs of CHF 69 million related to assets managed centrally by Group Treasury. Furthermore, net trading revenues declined as a result of lower treasury-related income and lower client activity levels following reduced volatility in the foreign exchange market. These factors were partly offset by CHF 180 million higher product-related interest income, reflecting the beneficial effects of increases in client deposit and lending volumes.
In Wealth Management Americas, net interest and trading income increased by CHF 86 million, reflecting favorable currency effects and higher client balances in securities-backed lending and mortgages.
Retail & Corporate net interest and trading income declined by CHF 194 million, partly as the prior year included interest income of CHF 68 million related to our strategic investment portfolio. Net interest income was also negatively affected by increased costs related to assets managed centrally by Group Treasury and lower allocations related to investment proceeds from the firm’s equity. The loan margin was stable, but the historically low interest rate environment continued to negatively affect the deposit margin. This was partly offset by growth in average deposit and, to a lesser extent, loan volumes as well as a number of pricing adjustments. Net trading income decreased to CHF 281 million from CHF 333 million due to lower treasury-related income and lower valuation income in 2012 related to credit default swaps to hedge certain loans.
Within the Investment Bank, Corporate Client Solutions net interest and trading income increased by CHF 176 million, largely due to higher revenues in debt capital markets. Investor Client Services net interest and trading income increased by CHF 567 million, mainly as 2011 included a loss of CHF 1,849 million related to the unauthorized trading incident, partly offset by lower equities cash revenues, mainly as 2012 included a loss of CHF 349 million related to the Facebook initial public offering. In addition, equities derivatives revenues declined, as trading revenues, particularly in Asia Pacific and Europe, Middle East and Africa, were affected by lower volatility levels. Other equities revenues also decreased, primarily reflecting a reduced contribution from proprietary trading as we continued to exit the business. Furthermore, foreign exchange revenues declined, mainly within foreign exchange spot and foreign exchange options as volatility decreased from the high levels seen in 2011 resulting from eurozone uncertainty. Rates and credit revenues also declined, primarily due to increased negative debit valuation adjustments and lower revenues from flow businesses, partly offset by higher revenues from solutions businesses.
Excluding own credit, net interest and trading revenues in Corporate Center – Core Functions decreased by CHF 18 million.
Financial and operating performance
Group performance
In Non-core and Legacy Portfolio, net interest and trading income increased by CHF 1,573 million. Our option to acquire the SNB StabFund’s equity resulted in a gain of CHF 526 million in 2012, compared with a loss of CHF 133 million in 2011. Legacy Portfolio net interest and trading income excluding the SNB StabFund option increased by CHF 714 million, partly as 2011 included a loss of CHF 284 million related to credit valuation adjustments for monoline credit protection. Non-core net interest and trading revenues increased by CHF 200 million, mainly as a result of higher credit revenues.
| | è | | Refer to “Note 3 Net interest and trading income” in the “Financial information” section of this report for more information |
| | è | | Refer to “Note 24 Fair value measurement” in the “Financial information” section of this report for more information on own credit |
Credit loss expense/recovery
In 2012, we recorded net credit loss expenses of CHF 118 million compared with net credit loss expenses of CHF 84 million in 2011. In 2012, we recorded net credit loss expenses of CHF 78 million in Non-core and Legacy Portfolio, mainly related to student loan auction rate securities, and net credit loss expenses of CHF 27 million in Retail & Corporate.
| | è | | Refer to the “Wealth Management Americas,” “Retail & Corporate” and “Corporate Center” sections of this report for more information |
Net fee and commission income
Net fee and commission income increased by CHF 160 million to CHF 15,396 million.
Underwriting fees increased by CHF 359 million to CHF 1,539 million, reflecting an increase in both equity and debt underwriting fees. The increase in underwriting fees corresponded to increased market share in both equity underwriting and debt underwriting. In addition, we increased our participation in private and structured transactions.
Portfolio management and advisory fees increased by CHF 344 million to CHF 5,895 million, mainly reflecting an increase in Wealth Management Americas.
Net brokerage fees fell by CHF 271 million, primarily in the Investment Bank due to a lower level of client activity.
Merger and acquisition and corporate finance fees decreased by CHF 313 million due to a lower volume of transactions.
| | è | | Refer to “Note 4 Net fee and commission income” in the “Financial information” section of this report for more information |
Other income
Other income was CHF 641 million compared with CHF 1,467 million in the previous year.
In 2012, net revenues from financial investments available-for-sale were CHF 308 million, which included CHF 272 million in gains from Corporate Center – Core Functions, as well as a gain
of CHF 101 million in Non-core and Legacy Portfolio mainly related to the sale of an equity investment. In 2011, net revenues from financial investments available-for-sale were CHF 887 million, which included a gain of CHF 722 million from the sale of our strategic investment portfolio as well as net gains of CHF 141 million in Corporate Center – Core Functions.
Other income from associates and subsidiaries was CHF 81 million compared with CHF 44 million, mainly related to higher revenues from our participation in the SIX Group.
Other income in 2012 further included gains of CHF 112 million on sales of Swiss real estate compared with a gain of CHF 78 million on sale of a property in Switzerland in 2011. Other income in 2011 included net gains of CHF 344 million from the sale of loans and receivables.
| | è | | Refer to “Note 5 Other income” in the “Financial information” section of this report for more information |
Operating expenses
Total operating expenses increased by CHF 4,734 million to CHF 27,216 million, mainly due to impairment losses of CHF 3,064 million on goodwill and other non-financial assets and CHF 2,273 million higher net charges for provisions for litigation, regulatory and similar matters. The appreciation of the US dollar and British pound against the Swiss franc also contributed to the overall increase. These increases were partly offset by a credit to personnel expenses of CHF 730 million related to changes to our Swiss pension plan and a credit to personnel expenses of CHF 116 million related to changes to our retiree benefit plans in the US. Net restructuring charges were CHF 371 million in 2012 compared with CHF 380 million in 2011.
| | è | | Refer to “Note 32 Changes in organization” in the “Financial information” section of this report for more information on restructuring charges |
Personnel expenses
Personnel expenses decreased by CHF 897 million to CHF 14,737 million. In 2012, personnel expenses included a credit of CHF 730 million related to changes to our Swiss pension plan and a credit of CHF 116 million related to changes to our retiree benefit plans in the US. Net personnel-related restructuring charges were CHF 358 million in 2012 compared with CHF 261 million in 2011. Excluding the effects of restructuring and the credits related to the Swiss and US benefit plans, personnel expenses decreased by CHF 148 million, despite the appreciation of the US dollar and British pound against the Swiss franc.
On this adjusted basis, expenses for performance awards declined by CHF 577 million to CHF 2,885 million. Expenses relating to 2012 performance awards recognized in the performance year 2012 were CHF 1,724 million, down CHF 123 million from the prior year, reflecting a 7% decrease in the overall performance award pool for the 2012 performance year. The amortization of
86
|
Financial and operating performance |
|
|
deferred compensation awards from prior years decreased by CHF 454 million to CHF 1,161 million.
Other variable compensation excluding restructuring charges increased by CHF 51 million, reflecting increased expenses for employee retention, including costs related to a special plan award program.
Salary expenses, excluding restructuring, decreased by CHF 78 million, partly related to a one-time net credit of CHF 31 million from changes to the rules for the Swiss long-service and sabbatical awards.
Financial advisor compensation in Wealth Management Americas increased by CHF 354 million excluding restructuring reflecting higher revenue production and higher compensation commitments with recruited financial advisors.
| | è | | Refer to “Note 6 Personnel expenses” in the “Financial information” section of this report for more information |
| | è | | Refer to “Note 28 Pension and otherpost-employment benefit plans” in the “Financial information” section of this report for more information |
| | è | | Refer to “Note 29 Equity participation and other compensation plans” in the “Financial information” section of this report for more information |
| | è | | Refer to the “Compensation” section of this report for more information |
General and administrative expenses
General and administrative expenses were CHF 8,653 million in 2012 compared with CHF 5,959 million in 2011.
Net charges for provisions for litigation, regulatory and similar matters increased by CHF 2,273 million, primarily as a result of charges for provisions arising from fines and disgorgement resulting from regulatory investigations concerning LIBOR and other benchmark rates and claims related to sales of residential mortgage-backed securities.
Costs for outsourcing of information technology and other services increased by CHF 206 million due to higher business demand.
Expenses for marketing and public relations increased by CHF 135 million, partly due to expenditures related to our 150th anniversary, and professional fees increased by CHF 86 million. In 2012, no general and administrative restructuring charges were recorded compared with net charges of CHF 93 million in 2011.
| | è | | Refer to “Note 7 General and administrative expenses” in the “Financial information” section of this report for more information |
| | è | | Refer to “Note 22 Provisions and contingent liabilities” in the “Financial information” section of this report for more information |
Depreciation, impairment and amortization
Depreciation and impairment of property and equipment was CHF 689 million, a decrease of CHF 72 million from the prior year, mainly reflecting lower depreciation of information technology equipment.
Impairment of goodwill was CHF 3,030 million in 2012.
Amortization and impairment of intangible assets was CHF 106 million compared with CHF 127 million. In 2012, we recorded impairment charges of CHF 17 million. In 2011, impairment charges were CHF 37 million, mainly related to a past acquisition in the UK.
| | è | | Refer to “Note 17 Goodwill and intangible assets” in the “Financial information” section of this report for more information |
Tax
We recognized a net income tax expense in the income statement for the year of CHF 461 million. This included a Swiss current tax expense of CHF 95 million, which relates to taxable profits, against which no losses were available to offset, earned by Swiss subsidiaries and also from the sale of real estate. The net income tax expense for the year also includes a Swiss deferred tax expense of CHF 23 million, which relates to a decrease in recognized deferred tax assets due to Swiss pre-tax profits earned during the year, offset by Swiss tax relief for the impairment of goodwill. In addition, it includes a foreign net current tax expense of CHF 72 million, which relates to a tax expense in respect of taxable profits earned by non-Swiss subsidiaries and branches, against which no losses were available to offset, which were partly offset by a tax benefit from the release of provisions in respect of tax positions which were previously uncertain. Finally, the net income tax expense for the year includes a foreign deferred tax expense of CHF 271 million, which mainly reflects a tax expense for the amortization of deferred tax assets, as tax losses were used against taxable profits.
| | è | | Refer to “Note 8 Income taxes” in the “Financial information” section of this report for more information |
Total comprehensive income attributable to UBS shareholders
Total comprehensive income attributable to UBS shareholders in 2012 was negative CHF 1,966 million, reflecting the net loss attributable to UBS shareholders of CHF 2,480 million, partly offset by positive other comprehensive income attributable to UBS shareholders of CHF 514 million.
OCI in 2012 included net OCI gains on defined benefit plans of CHF 609 million (net of tax). This reflected net pre-tax OCI gains of CHF 1,023 million, which were almost entirely due to an increase in the fair value of plan assets of the Swiss pension plan, partly offset by an income tax expense of CHF 413 million. Cash flow hedge OCI was positive CHF 384 million (net of tax), mainly reflecting decreases in long-term interest rates across all major currencies, partly offset by the reclassification of net gains associated with the effective portion of changes in fair value of hedging derivatives to the income statement. Financial investments available-for-sale OCI was positive CHF 26 million (net of tax). Foreign currency translation OCI was a loss of CHF 511 million (net of tax),
Financial and operating performance
Group performance
predominantly related to the 2% weakening of the US dollar against the Swiss franc.
OCI attributable to UBS shareholders in 2011 was CHF 934 million (net of tax), mainly reflecting positive cash flow hedge OCI of CHF 1,537 million and foreign currency translation gains of CHF 722 million, partly offset by net OCI losses on defined benefit plans of CHF 1,820 million.
| | è | | Refer to the “Statement of comprehensive income” in the “Financial information” section of this report for more information |
| | è | | Refer to “Note 28 Pension and otherpost-employment benefit plans” in the “Financial information” section of this report for more information on OCI related to defined benefit plans |
Net profit attributable to preferred noteholders
Net profit attributable to preferred noteholders was CHF 220 million in 2012.
Key figures
Cost/income ratio
The cost/income ratio increased to 106.6% in 2012 compared with 80.7% in the prior year. On an adjusted basis, the cost/income ratio increased to 89.1% from 86.6%.
Net new money
In Wealth Management, net new money inflows were CHF 26.3 billion in 2012 compared with CHF 23.5 billion in 2011. The strongest net inflows were recorded in Asia Pacific and emerging markets as well as globally from ultra high net worth clients. Europe reported net outflows in the offshore business, mainly related to clients from countries neighboring Switzerland. This was partly offset by net inflows in the European onshore business.
Swiss wealth management reported increased net inflows compared with the prior year.
Wealth Management Americas recorded net new money inflows of CHF 20.6 billion or USD 22.1 billion in 2012, compared with net new money inflows of CHF 12.1 billion or USD 14.1 billion in 2011 due to stronger inflows from net recruiting of financial advisors as well as financial advisors employed with UBS for more than one year.
Excluding money market flows, Global Asset Management recorded net new money outflows of CHF 5.9 billion in 2012 compared with net inflows of CHF 9.0 billion in the prior year. Net new money from third parties was a net outflow of CHF 0.6 billion compared with a net inflow of CHF 12.2 billion. Net new money from clients of UBS’s wealth management businesses was a net outflow of CHF 5.2 billion compared with a net outflow of CHF 3.1 billion.
| | è | | Refer to the “Wealth Management,” “Wealth Management Americas” and “Global Asset Management” sections of this report for more information |
Invested assets
Invested assets in Wealth Management rose by CHF 71 billion to CHF 821 billion during the year. Positive market performance and net new money inflows were partly offset by negative currency translation effects.
In Wealth Management Americas, invested assets increased by CHF 63 billion to CHF 772 billion, reflecting positive market performance and strong net new money inflows.
Global Asset Management invested assets increased by CHF 7 billion to CHF 581 billion, mainly due to positive market performance, partly offset by net new money outflows and negative currency translation effects. The sale, as agreed prior to the acquisition, of parts of the ING Investment Management business acquired in Australia in 2011 resulted in a net divestment of CHF 14 billion of invested assets in 2012.
| | è | | Refer to the “Wealth Management,” “Wealth Management Americas” and “Global Asset Management” sections of this report for more information |
88
|
Financial and operating performance |
|
|
Balance sheet
As of 31 December 2013, our balance sheet assets stood at CHF 1,010 billion, a decrease of CHF 250 billion or 20% from 31 December 2012, primarily due to a reduction in positive replacement values (PRV) in Corporate Center – Non-core and Legacy Portfolio. Funded assets, which represent total assets excluding PRV and collateral delivered againstover-the-counter (OTC) derivatives, decreased by CHF 66 billion to CHF 739 billion, mainly due to reductions in both collateral trading and trading portfolio assets, primarily reflecting the ongoing execution of our strategy. Currency effects reduced funded assets by approximately CHF 18 billion.
Balance sheet
| | | | | | | | | | | | |
| | | | | % change from | |
| CHF million | | 31.12.13 | | | 31.12.12 | | | 31.12.12 | |
| | | |
| Assets | | | | | | | | | | | | |
| | | | | | | | | | | | | |
| Cash and balances with central banks | | | 80,879 | | | | 66,383 | | | | 22 | |
| | | | | | | | | | | | | |
| Due from banks | | | 17,170 | | | | 21,220 | | | | (19 | ) |
| | | | | | | | | | | | | |
| Cash collateral on securities borrowed | | | 27,496 | | | | 37,372 | | | | (26 | ) |
| | | | | | | | | | | | | |
| Reverse repurchase agreements | | | 91,563 | | | | 130,941 | | | | (30 | ) |
| | | | | | | | | | | | | |
| Trading portfolio assets | | | 122,848 | | | | 160,564 | | | | (23 | ) |
| | | | | | | | | | | | | |
of which: assets pledged as collateral which may be sold or repledged by counterparties | | | 42,449 | | | | 44,698 | | | | (5 | ) |
| | | | | | | | | | | | | |
| Positive replacement values | | | 245,835 | | | | 418,957 | | | | (41 | ) |
| | | | | | | | | | | | | |
| Cash collateral receivables on derivative instruments | | | 28,007 | | | | 30,413 | | | | (8 | ) |
| | | | | | | | | | | | | |
| Financial assets designated at fair value | | | 7,364 | | | | 9,106 | | | | (19 | ) |
| | | | | | | | | | | | | |
| Loans | | | 286,959 | | | | 279,901 | | | | 3 | |
| | | | | | | | | | | | | |
| Financial investments available-for-sale | | | 59,525 | | | | 66,230 | | | | (10 | ) |
| | | | | | | | | | | | | |
| Investments in associates | | | 842 | | | | 858 | | | | (2 | ) |
| | | | | | | | | | | | | |
| Property and equipment | | | 6,006 | | | | 6,004 | | | | 0 | |
| | | | | | | | | | | | | |
| Goodwill and intangible assets | | | 6,293 | | | | 6,461 | | | | (3 | ) |
| | | | | | | | | | | | | |
| Deferred tax assets | | | 8,845 | | | | 8,143 | | | | 9 | |
| | | | | | | | | | | | | |
| Other assets | | | 20,228 | | | | 17,244 | | | | 17 | |
| | | | | | | | | | | | | |
| Total assets | | | 1,009,860 | | | | 1,259,797 | | | | (20 | ) |
| | | | | | | | | | | | | |
| | | |
| Liabilities | | | | | | | | | | | | |
| | | | | | | | | | | | | |
| Due to banks | | | 12,862 | | | | 23,024 | | | | (44 | ) |
| | | | | | | | | | | | | |
| Cash collateral on securities lent | | | 9,491 | | | | 9,203 | | | | 3 | |
| | | | | | | | | | | | | |
| Repurchase agreements | | | 13,811 | | | | 38,557 | | | | (64 | ) |
| | | | | | | | | | | | | |
| Trading portfolio liabilities | | | 26,609 | | | | 34,247 | | | | (22 | ) |
| | | | | | | | | | | | | |
| Negative replacement values | | | 239,953 | | | | 395,260 | | | | (39 | ) |
| | | | | | | | | | | | | |
| Cash collateral payables on derivative instruments | | | 49,138 | | | | 71,148 | | | | (31 | ) |
| | | | | | | | | | | | | |
| Financial liabilities designated at fair value | | | 69,901 | | | | 91,901 | | | | (24 | ) |
| | | | | | | | | | | | | |
| Due to customers | | | 390,825 | | | | 373,459 | | | | 5 | |
| | | | | | | | | | | | | |
| Debt issued | | | 81,586 | | | | 104,837 | | | | (22 | ) |
| | | | | | | | | | | | | |
| Provisions | | | 2,971 | | | | 2,536 | | | | 17 | |
| | | | | | | | | | | | | |
| Other liabilities | | | 62,777 | | | | 66,523 | | | | (6 | ) |
| | | | | | | | | | | | | |
| Total liabilities | | | 959,925 | | | | 1,210,697 | | | | (21 | ) |
| | | | | | | | | | | | | |
Financial and operating performance
Balance sheet
Balance sheet (continued)
| | | | | | | | | | | | |
| | | | | % change from | |
| CHF million | | 31.12.13 | | | 31.12.12 | | | 31.12.12 | |
| | | |
| Equity | | | | | | | | | | | | |
| | | | | | | | | | | | | |
| Share capital | | | 384 | | | | 384 | | | | 0 | |
| | | | | | | | | | | | | |
| Share premium | | | 33,952 | | | | 33,898 | | | | 0 | |
| | | | | | | | | | | | | |
| Treasury shares | | | (1,031 | ) | | | (1,071 | ) | | | (4 | ) |
| | | | | | | | | | | | | |
| Equity classified as obligation to purchase own shares | | | (46 | ) | | | (37 | ) | | | 24 | |
| | | | | | | | | | | | | |
| Retained earnings | | | 24,475 | | | | 21,297 | | | | 15 | |
| | | | | | | | | | | | | |
| Cumulative net income recognized directly in equity, net of tax | | | (9,733 | ) | | | (8,522 | ) | | | 14 | |
| | | | | | | | | | | | | |
| Equity attributable to UBS shareholders | | | 48,002 | | | | 45,949 | | | | 4 | |
| | | | | | | | | | | | | |
| Equity attributable to preferred noteholders | | | 1,893 | | | | 3,109 | | | | (39 | ) |
| | | | | | | | | | | | | |
| Equity attributable to non-controlling interests | | | 41 | | | | 42 | | | | (2 | ) |
| | | | | | | | | | | | | |
| Total equity | | | 49,936 | | | | 49,100 | | | | 2 | |
| | | | | | | | | | | | | |
| Total liabilities and equity | | | 1,009,860 | | | | 1,259,797 | | | | (20 | ) |
| | | | | | | | | | | | | |
Balance sheet development
Non-core and Legacy Portfolio total assets decreased by CHF 218 billion to CHF 211 billion as of 31 December 2013, mainly reflecting a CHF 170 billion decline in positive replacement values in Non-core and Legacy Portfolio, primarily from a reduction in OTC derivative exposures by means of negotiated bilateral settlements with specific counterparties, third-party novations, including transfers to central clearing houses, agreements to net down trades with other dealer counterparties, as well as, to a lesser extent, fair value changes due to interest rate movements. Non-core
and Legacy Portfolio funded assets decreased by CHF 39 billion to CHF 22 billion, primarily due to the exit of government and other liquid bond positions, along with the sale of a portfolio of distressed assets in Non-core and sales and redemptions of student loan auction rate securities in the Legacy Portfolio. Investment Bank total assets decreased by CHF 21 billion to CHF 241 billion, and funded assets declined by CHF 23 billion to CHF 162 billion, largely due to lower collateral trading assets across businesses, as well as due to a reduction in trading portfolio assets in our foreign exchange, rates and credit business and a reduction in lending assets in Corporate Client Solutions. Corporate Center – Core
90
|
Financial and operating performance |
|
|
Total assets and funded assets
| | | | | | | | | | | | | | | | | | | | | | | | | | | | | | | | | | | | | | | | |
| | 31.12.13 | | | 31.12.12 | |
| CHF billion | | Investment
Bank | | | CC – Core
Functions | | | CC – Non-
core and
Legacy
Portfolio | | | Other
business
divisions | | | UBS | | | Investment
Bank | | | CC – Core
Functions | | | CC – Non-
core and
Legacy
Portfolio | | | Other
business
divisions | | | UBS | |
| Total IFRS assets | | | 241 | | | | 247 | | | | 211 | | | | 311 | | | | 1,010 | | | | 262 | | | | 263 | | | | 429 | | | | 307 | | | | 1,260 | |
| | | | | | | | | | | | | | | | | | | | | | | | | | | | | | | | | | | | | | | | | |
| Less: positive replacement values | | | (72 | ) | | | 0 | | | | (170 | ) | | | (3 | ) | | | (246 | ) | | | (69 | ) | | | (7 | ) | | | (340 | ) | | | (3 | ) | | | (419 | ) |
| | | | | | | | | | | | | | | | | | | | | | | | | | | | | | | | | | | | | | | | | |
| Less: collateral delivered against OTC derivatives1 | | | (6 | ) | | | 0 | | | | (19 | )2 | | | 0 | | | | (25 | ) | | | (8 | ) | | | 0 | | | | (28 | )2 | | | 0 | | | | (36 | ) |
| | | | | | | | | | | | | | | | | | | | | | | | | | | | | | | | | | | | | | | | | |
| Funded assets | | | 162 | | | | 247 | | | | 22 | | | | 307 | | | | 739 | | | | 185 | | | | 256 | | | | 61 | | | | 303 | | | | 805 | |
| | | | | | | | | | | | | | | | | | | | | | | | | | | | | | | | | | | | | | | | | |
1 Mainly consists of cash collateral receivables on derivative instruments and reverse repurchase agreements. 2 Non-core: CHF 17 billion as of 31 December 2013 (CHF 27 billion as of 31 December 2012). Legacy Portfolio: CHF 1 billion as of 31 December 2013 (CHF 2 billion as of 31 December 2012).
Functions assets decreased by CHF 16 billion to CHF 247 billion, primarily reflecting lower collateral trading assets, reduced PRV and sales of mortgage-backed securities held as financial investments available-for-sale. The overall size of our multi-currency portfolio of unencumbered, high-quality, short-term assets managed centrally by Group Treasury remained stable. Retail & Corporate total assets decreased by CHF 4 billion to CHF 141 billion, largely reflecting a reduction in cash balances. Wealth Management total assets increased by CHF 5 billion to CHF 110 billion mainly resulting from increased Lombard and mortgage lending activities. Wealth Management Americas and Global Asset Management total assets were broadly unchanged at CHF 45 billion and CHF 14 billion, respectively.
Cash and balances with central banks
Cash and balances with central banks increased by CHF 14 billion to CHF 81 billion as of 31 December 2013, mainly due to a rebalancing of our multi-currency portfolio of unencumbered, high-quality, short-term assets.
Lending
Loans increased by CHF 7 billion to CHF 287 billion, predominantly in our wealth management businesses and mainly reflecting increased Lombard and residential mortgage lending, partly offset by sales and redemptions of student loan auction rate securities in the Legacy Portfolio. Interbank lending was lower by CHF 4 billion, mainly in the Investment Bank, and financial assets designated at fair value were reduced by CHF 2 billion, primarily due to trade terminations in Non-core.
Collateral trading
Collateral trading assets (reverse repurchase agreements and cash collateral on securities borrowed) decreased by CHF 49 billion to CHF 119 billion, primarily due to the rebalancing of our multi-currency portfolio of unencumbered, high-quality, short-term assets, lower collateral trading activity in the Investment Bank and a reduction in externally sourced securities collateral by Group Treasury.
Collateral trading liabilities (repurchase agreements and cash collateral on securities lent) were reduced by CHF 24 billion, reflecting reduced funding requirements.
Trading portfolio
Trading portfolio assets were reduced by CHF 38 billion to CHF 123 billion, mainly due to a CHF 34 billion decrease in debt instruments held, primarily reflecting lower government, corporate and mortgage-backed securities debt, and a reduction of CHF 8 billion in precious metal holdings, partly offset by a CHF 4 billion client-driven increase in equity instruments. A majority of the reduction in trading portfolio assets occurred in Non-core, reflecting the ongoing execution of our strategy.
Trading portfolio liabilities were lower by CHF 8 billion, primarily reflecting reduced government debt and corporate bonds short sales.
Replacement values
Positive and negative replacement values declined on both sides of the balance sheet, decreasing by CHF 173 billion or 41% and CHF 155 billion or 39% to CHF 246 billion and CHF 240 billion,
91
Financial and operating performance
Balance sheet
respectively. Decreases in positive replacement values mainly occurred in Non-core and Legacy Portfolio, primarily from a reduction in OTC derivative exposures by means of negotiated bilateral settlements with specific counterparties, third-party novations, including transfers to central clearing houses, agreements to net down trades with other dealer counterparties, as well as, to a lesser extent, fair value changes due to interest rate movements. Similarly, decreases in negative replacement values also mainly occurred in interest rate contracts in Non-core and Legacy Portfolio.
Financial investments available-for-sale
Financial investments available-for-sale were reduced by CHF 7 billion to CHF 60 billion, mainly reflecting lower holdings of government debt as well as sales of mortgage-backed securities.
Short-term borrowings
Short-term borrowings (short-term debt issued and due to banks) decreased by CHF 15 billion to CHF 40 billion, primarily due to lower interbank precious metal accounts recognized on our balance sheet, combined with reduced funding requirements. The reduction in short-term debt issued primarily occurred in commercial paper and client customized issuances, partly offset by an increase in certificates of deposit.
| | è | | Refer to the “Treasury management” section of this report for more information |
Due to customers
Customer deposits increased by CHF 17 billion to CHF 391 billion as Wealth Management, Wealth Management Americas and Retail & Corporate all continued to attract client money into both current and deposit accounts.
| | è | | Refer to the “Treasury management” section of this report for more information |
Long-term debt
Long-term debt decreased by CHF 40 billion to CHF 124 billion, primarily resulting from a CHF 22 billion reduction in financial liabilities designated at fair value, mainly in the Investment Bank and Non-core and Legacy Portfolio. Long-term debt issued held at amortized cost was reduced by CHF 18 billion, primarily due to decreases in senior debt. As part of our reduction in wholesale funding, we successfully completed two cash tender offers during 2013 to repurchase certain subordinated and senior unsecured bonds.
| | è | | Refer to the “Treasury management” section of this report for more information |
Other assets/Other liabilities
Other assets were largely unchanged at CHF 70 billion, mainly as a CHF 3 billion increase in prime brokerage receivables was mostly offset by a CHF 2 billion reduction in cash collateral receivables on derivative instruments.
| | |
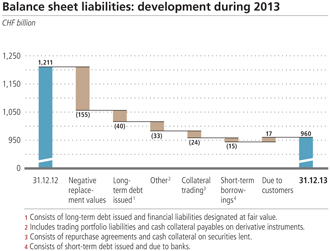 | | 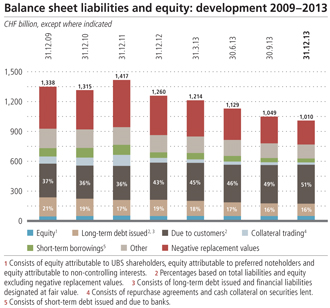 |
92
|
Financial and operating performance |
|
|
Other liabilities decreased by CHF 25 billion to CHF 115 billion, primarily due to a CHF 22 billion reduction in cash collateral payables on derivative instruments.
Equity
Equity attributable to UBS shareholders increased by CHF 2,053 million to CHF 48,002 million as of 31 December 2013 from CHF 45,949 million a year earlier. Total comprehensive income attributable to UBS shareholders was CHF 1,961 million, reflecting the net profit attributable to UBS shareholders of CHF 3,172 million, partly offset by negative other comprehensive income (OCI) attributable to UBS shareholders of CHF 1,211 million (net of tax). OCI included foreign currency translation losses of CHF 471 million as well as negative OCI movements related to cash flow hedges and financial investments available-for-sale of CHF 1,520 million and CHF 154 million, respectively, partly offset by net gains on defined benefit plans of CHF 939 million. Share premium increased
by CHF 54 million, mainly reflecting an increase of CHF 305 million related to employee share and share option plans and treasury share gains of CHF 203 million, partly offset by the payment of CHF 564 million to UBS shareholders out of the capital contribution reserve. Net treasury share activity increased equity attributable to UBS shareholders by CHF 41 million.
| | è | | Refer to the “Statement of changes in equity” in the “Financial information” section of this report for more information |
| | è | | Refer to “Total comprehensive income attributable to UBS shareholders” in the “Group performance” section of this report for more information |
Intra-period balances
Balance sheet positions disclosed in this section represent year-end positions. Intra-period balance sheet positions fluctuate in the ordinary course of business and may differ from quarter-end and year-end positions.
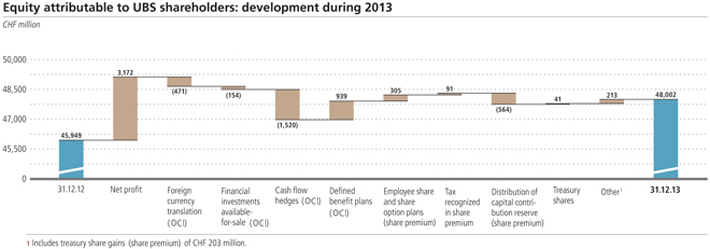
93
Financial and operating performance
Off-balance sheet
Off-balance sheet
Off-balance sheet arrangements
In the normal course of business, we enter into transactions that may not be fully recognized on the balance sheet due to the International Financial Reporting Standards (IFRS) accounting treatment adopted for the arrangement entered into. These transactions include derivative instruments, guarantees and similar arrangements, as well as purchased and retained interests in non-consolidated structured entities (SE), which are transacted for a number of reasons, including market-making and hedging activities, to meet specific needs of our clients or to offer investment opportunities to clients through entities that are not controlled by us.
When we, through these arrangements, incur an obligation or become entitled to an asset, we recognize these on the balance sheet. It should be noted that in certain instances the amount recognized on the balance sheet does not represent the full gain or loss potential inherent in such arrangements.
| | è | | Refer to “Note 1a) 3) Subsidiaries and structured entities” and “Note 1a) 5) Recognition and derecognition of financial instruments” in the “Financial information” section of this report for more information on accounting policies regarding consolidation and deconsolidation of subsidiaries, including structured entities, and recognition and derecognition of financial instruments, respectively |
| | è | | Refer to “Note 30 Interests in subsidiaries and other entities” in the “Financial information” section of this report for more information on our interests in, and maximum exposure to loss from, unconsolidated structured entities |
The following paragraphs provide more information on several distinct off-balance sheet arrangements. Additional off-balance sheet information is primarily provided in “Note 14 Derivative instruments and hedge accounting,” “Note 22 Provisions and contingent liabilities,” “Note 25 Restricted and transferred financial assets,” “Note 30 Interests in subsidiaries and other entities” and “Note 33 Operating lease commitments” in the “Financial information” section and in the “Supplemental disclosures required under Basel III Pillar 3 regulations” section of this report.
Risk disclosures, including our involvement withoff-balance sheet vehicles
Refer to the “Risk, treasury and capital management” section of this report for comprehensive liquidity, market and credit risk information related to risk positions, which includes our exposures to off-balance sheet vehicles.
Support provided to non-consolidated investment funds
In 2013, the Group did not provide material support, financial or otherwise, to unconsolidated investment funds when the Group
was not contractually obligated to do so, nor does the Group have an intention to do so.
Guarantees and similar arrangements
In the normal course of business, we issue various forms of guarantees, commitments to extend credit, standby and other letters of credit to support our clients, commitments to enter into forward starting transactions, note issuance facilities and revolving underwriting facilities. With the exception of related premiums, generally these guarantees and similar obligations are kept as off-balance sheet items unless a provision to cover probable losses is required.
As of 31 December 2013, the net exposure (gross values less sub-participations) from guarantees and similar instruments was CHF 15.8 billion, compared with CHF 17.8 billion as of 31 December 2012. Fee income from issuing guarantees was not significant to total revenues in 2013.
Guarantees represent irrevocable assurances, subject to the satisfaction of certain conditions, that we will make a payment in the event that clients fail to fulfill their obligations to third parties. We also enter into commitments to extend credit in the form of credit lines that are available to secure the liquidity needs of clients. The majority of these unutilized credit lines range in maturity from one month to five years. If customers fail to meet their obligations, our maximum exposure to credit risk is the contractual amount of these instruments. The risk is similar to the risk involved in extending loan facilities and is subject to the same risk management and control framework. For the year ended 31 December 2013, we recognized net credit loss recoveries of CHF 2 million, compared with net credit loss recoveries of CHF 16 million for the year ended 31 December 2012, related to obligations incurred for guarantees and loan commitments. Provisions recognized for guarantees and loan commitments were CHF 61 million as of 31 December 2013 and CHF 64 million as of 31 December 2012.
For certain obligations, we enter into partial sub-participations to mitigate various risks from guarantees and loan commitments. A sub-participation is an agreement by another party to take a share of the loss in the event that the obligation is not fulfilled by the obligor and, where applicable, to fund a part of the credit facility. We retain the contractual relationship with the obligor, and the sub-participant has only an indirect relationship. We will only enter into sub-participation agreements with banks to which we ascribe a credit rating equal to or better than that of the obligor.
Furthermore, we provide representations, warranties and indemnifications to third parties in the normal course of business.
Clearing house and exchange memberships
We are a member of numerous securities and derivative exchanges and clearing houses. In connection with some of those memberships, we may be required to pay a share of the financial obligations
|
Financial and operating performance |
|
|
Financial instruments not recognized on the balance sheet
The table below shows the maximum irrevocable amount of guarantees, commitments and forward starting transactions.
| | | | | | | | | | | | | | | | | | | | | | | | |
| | 31.12.13 | | | 31.12.12 | |
| CHF million | | Gross | | | Sub-
participations | | | Net | | | Gross | | | Sub-
participations | | | Net | |
| Guarantees | | | | | | | | | | | | | | | | | | | | | | | | |
| | | | | | | | | | | | | | | | | | | | | | | | | |
| Credit guarantees and similar instruments | | | 7,731 | | | | (670 | ) | | | 7,061 | | | | 8,313 | | | | (734 | ) | | | 7,579 | |
| | | | | | | | | | | | | | | | | | | | | | | | | |
| Performance guarantees and similar instruments | | | 3,423 | | | | (706 | ) | | | 2,717 | | | | 3,673 | | | | (829 | ) | | | 2,844 | |
| | | | | | | | | | | | | | | | | | | | | | | | | |
| Documentary credits | | | 7,644 | | | | (1,599 | ) | | | 6,044 | | | | 8,072 | | | | (660 | ) | | | 7,412 | |
| | | | | | | | | | | | | | | | | | | | | | | | | |
| Total guarantees | | | 18,798 | | | | (2,975 | ) | | | 15,823 | | | | 20,058 | | | | (2,223 | ) | | | 17,835 | |
| | | | | | | | | | | | | | | | | | | | | | | | | |
| Commitments | | | | | | | | | | | | | | | | | | | | | | | | |
| | | | | | | | | | | | | | | | | | | | | | | | | |
| Loan commitments | | | 54,913 | | | | (1,227 | ) | | | 53,686 | | | | 59,818 | | | | (867 | ) | | | 58,950 | |
| | | | | | | | | | | | | | | | | | | | | | | | | |
| Underwriting commitments | | | 760 | | | | (225 | ) | | | 535 | | | | 167 | | | | (167 | ) | | | 0 | |
| | | | | | | | | | | | | | | | | | | | | | | | | |
| Total commitments | | | 55,673 | | | | (1,452 | ) | | | 54,221 | | | | 59,985 | | | | (1,034 | ) | | | 58,951 | |
| | | | | | | | | | | | | | | | | | | | | | | | | |
| Forward starting transactions1 | | | | | | | | | | | | | | | | | | | | | | | | |
| | | | | | | | | | | | | | | | | | | | | | | | | |
| Reverse repurchase agreements | | | 9,376 | | | | | | | | | | | | 18,576 | | | | | | | | | |
| | | | | | | | | | | | | | | | | | | | | | | | | |
| Securities borrowing agreements | | | 46 | | | | | | | | | | | | 249 | | | | | | | | | |
| | | | | | | | | | | | | | | | | | | | | | | | | |
| Repurchase agreements | | | 8,191 | | | | | | | | | | | | 9,993 | | | | | | | | | |
| | | | | | | | | | | | | | | | | | | | | | | | | |
1 Cash to be paid in the future by either UBS or the counterparty.
of another member who defaults, or we may be otherwise exposed to additional financial obligations. While the membership rules vary, obligations generally would arise only if the exchange or clearing house had exhausted its resources. We consider the probability of a material loss due to such obligations to be remote.
Swiss deposit insurance
Swiss banking law and the deposit insurance system require Swiss banks and securities dealers to jointly guarantee an amount of up to CHF 6 billion for privileged client deposits in the event that a Swiss bank or securities dealer becomes insolvent. The Swiss Financial Market Supervisory Authority (FINMA) estimates our share in the deposit insurance system to be CHF 0.9 billion. The deposit insurance is a guarantee and exposes us to additional risk. This is not reflected in the table above due to its unique characteristics. As of 31 December 2013, we consider the probability of a material loss from our obligation to be remote.
Underwriting commitments
Gross equity underwriting commitments as of 31 December 2013 and 31 December 2012 amounted to CHF 0.8 billion and CHF 0.2
billion, respectively. Gross debt and private equity underwriting commitments as of 31 December 2013 and 31 December 2012 were not material.
Contractual obligations
The table below summarizes payments due by period under contractual obligations as of 31 December 2013.
All contracts included in this table, with the exception of purchase obligations (i.e., those in which we are committed to purchasing determined volumes of goods and services), are either recognized as liabilities on our balance sheet or, in the case of operating leases, disclosed in “Note 33 Operating lease commitments” in the “Financial information” section of this report.
Long-term debt obligations as of 31 December 2013 were CHF 136 billion and consisted of financial liabilities designated at fair value (CHF 73 billion) and long-term debt issued (CHF 64 billion) and represent both estimated future interest and principal payments on an undiscounted basis. Refer to “Note 27b Maturity analysis of financial liabilities” in the “Financial information” section of this report for more information. Approximately half of total long-term
Contractual obligations
| | | | | | | | | | | | | | | | |
| | Payment due by period | |
| CHF million | | < 1 year | | | 1-3 years | | | 3-5 years | | | > 5 years | |
| Long-term debt obligations | | | 30,448 | | | | 37,672 | | | | 27,479 | | | | 40,972 | |
| | | | | | | | | | | | | | | | | |
| Finance lease obligations | | | 39 | | | | 42 | | | | 6 | | | | 2 | |
| | | | | | | | | | | | | | | | | |
| Operating lease obligations | | | 737 | | | | 1,257 | | | | 1,021 | | | | 2,316 | |
| | | | | | | | | | | | | | | | | |
| Purchase obligations | | | 1,433 | | | | 890 | | | | 427 | | | | 240 | |
| | | | | | | | | | | | | | | | | |
| Other liabilities | | | 128 | | | | 8 | | | | 6 | | | | 2 | |
| | | | | | | | | | | | | | | | | |
| Total | | | 32,785 | | | | 39,869 | | | | 28,939 | | | | 43,532 | |
| | | | | | | | | | | | | | | | | |
95
Financial and operating performance
Off-balance sheet
debt obligations had a variable rate of interest. Amounts due on interest rate swaps used to hedge interest rate risk inherent in fixed-rate debt issued, and designated in fair value hedge accounting relationships, are not included in the table on the previous page. The notional amount of these interest rate swaps was CHF 31 billion as of 31 December 2013. Financial liabilities designated at fair value (CHF 73 billion on an undiscounted cash flow basis) mostly consist of structured notes and are generally economically hedged, but it would not be practicable to estimate the amount and/or timing of the payments on interest swaps used to hedge these instruments as interest rate risk inherent in respective liabilities is generally risk managed on a portfolio level.
Within purchase obligations, the obligation to employees under mandatory notice periods is excluded (i.e., the period in which we must pay contractually agreed salaries to employees leaving the firm).
Our obligations recognized on the balance sheet asDue to banks, Cash collateral on securities lent, Repurchase agreements, Trading portfolio liabilities, Negative replacement values, Cash collateral payables on derivative instruments, Due to customers, Provisionsand Other liabilities are excluded from the table on the previous page. Refer to the respective Notes in the “Financial information” section of this report for more information on these liabilities.
96
|
Financial and operating performance |
|
|
Cash flows
As a global financial institution, our cash flows are complex and may bear little relation to our net earnings and net assets. Consequently, we believe that traditional cash flow analysis is less meaningful in evaluating our liquidity position than the liquidity, funding and capital management polices described within the “Risk, treasury and capital management” section of this report. Cash flow analysis may, however, be helpful in highlighting certain macro trends and strategic initiatives in our businesses.
Statement of cash flows (condensed)
| | | | | | | | |
| | For the year ended | |
| CHF million | | 31.12.13 | | | 31.12.12 | |
| Net cash flow from/(used in) operating activities | | | 54,325 | | | | 67,160 | |
| | | | | | | | | |
| Net cash flow from/(used in) investing activities | | | 5,457 | | | | (14,879 | ) |
| | | | | | | | | |
| Net cash flow from/(used in) financing activities | | | (47,555 | ) | | | (38,110 | ) |
| | | | | | | | | |
| Effects of exchange rate differences on cash and cash equivalents | | | (2,702 | ) | | | (673 | ) |
| | | | | | | | | |
| Net increase/(decrease) in cash and cash equivalents | | | 9,524 | | | | 13,500 | |
| | | | | | | | | |
| Cash and cash equivalents at the end of the year | | | 108,632 | | | | 99,108 | |
| | | | | | | | | |
As of 31 December 2013, cash and cash equivalents totaled CHF 108.6 billion, an increase of CHF 9.5 billion from 31 December 2012.
Operating activities
For the year ended 31 December 2013, net cash inflow generated from operating activities was CHF 54.3 billion, primarily due to the deleveraging of our balance sheet, compared with net cash inflow from operating activities of CHF 67.2 billion in 2012. Net operating cash inflow (before changes in operating assets and liabilities and income taxes paid, net of refunds) totaled CHF 12.4 billion in 2013 compared with net operating cash inflow of CHF 11.2 billion in 2012. In 2013, net cash inflow of CHF 42.4 billion was generated by the overall decrease in operating assets and liabilities. Gross cash inflows of CHF 99.9 billion primary resulted from the reduction of cash collateral on securities borrowed and reverse repurchase agreement assets (CHF 43.8 billion), and from the reduction of trading portfolio, replacement values and financial assets designated at fair value balances (CHF 44.1 billion). Key components of the gross cash outflows of CHF 57.6 billion were the reduction of cash collateral on securities lent and repurchase agreement liabilities (CHF 23.7 billion), as well as the reduction of cash collateral on derivative instruments balances (CHF 22.4 billion).
Investing activities
Net cash inflow from investing activities was CHF 5.5 billion in 2013 compared with a net cash outflow of CHF 14.9 billion in 2012. The 2013 cash inflow was primarily due to the net divestment of financial investments available-for-sale of CHF 6.0 billion. This includes gross cash inflow from sales and maturities of CHF 7.3 billion and gross cash outflow from purchases of CHF 3.5 billion predominantly related to longer-term US asset-backed securities held as financial investments available-for-sale. The remaining net cash inflow of CHF 2.2 billion almost entirely related to our multi-currency portfolio of unencumbered, high-quality, short-term assets managed centrally by Group Treasury.
Financing activities
Net cash flow used in financing activities was CHF 47.6 billion in 2013, primarily due to the net repayment of long-term debt and financial liabilities designated at fair value of CHF 40.9 billion (issuances less redemptions). Furthermore, the net redemption of short-term debt generated cash outflows of CHF 4.3 billion, dividends paid and redemptions of preferred notes led to cash outflows of CHF 1.4 billion and dividends of CHF 0.6 billion were paid to UBS shareholders. In 2012, financing activities generated net cash outflows of CHF 38.1 billion.
| | è | | Refer to the “Statement of cash flows” in the “Financial information” section of this report for more information |
97
Financial and operating performance
Wealth Management
Wealth Management
Profit before tax was CHF 2,247 million in 2013, a decrease of CHF 160 million compared with CHF 2,407 million in 2012. Operating expenses included restructuring charges of CHF 178 million in 2013, while the prior year included a credit to personnel expenses of CHF 358 million related to changes to our pension and retiree benefit plans as well as restructuring charges of CHF 26 million. Adjusted for these items, profit before tax increased by CHF 350 million to CHF 2,425 million, reflecting CHF 522 million higher operating income, partly offset by a CHF 172 million increase in adjusted operating expenses, which included a charge in relation to the Swiss-UK tax agreement of CHF 107 million. The gross margin on invested assets declined by 1 basis point to 88 basis points. Net new money was CHF 35.9 billion compared with CHF 26.3 billion in the prior year.
Business division reporting1
| | | | | | | | | | | | | | | | |
| | As of or for the year ended | | | % change from | |
| CHF million, except where indicated | | 31.12.13 | | | 31.12.12 | | | 31.12.11 | | | 31.12.12 | |
| Net interest income | | | 2,061 | | | | 1,951 | | | | 1,968 | | | | 6 | |
| | | | | | | | | | | | | | | | | |
| Net fee and commission income | | | 4,648 | | | | 4,275 | | | | 4,363 | | | | 9 | |
| | | | | | | | | | | | | | | | | |
| Net trading income | | | 807 | | | | 778 | | | | 878 | | | | 4 | |
| | | | | | | | | | | | | | | | | |
| Other income | | | 57 | | | | 37 | | | | 425 | | | | 54 | |
| | | | | | | | | | | | | | | | | |
| Income | | | 7,573 | | | | 7,040 | | | | 7,634 | | | | 8 | |
| | | | | | | | | | | | | | | | | |
| Credit loss (expense)/recovery | | | (10 | ) | | | 1 | | | | 11 | | | | | |
| | | | | | | | | | | | | | | | | |
| Total operating income | | | 7,563 | | | | 7,041 | | | | 7,645 | | | | 7 | |
| | | | | | | | | | | | | | | | | |
| Personnel expenses | | | 3,371 | | | | 2,865 | | | | 3,300 | | | | 18 | |
| | | | | | | | | | | | | | | | | |
| General and administrative expenses | | | 1,650 | | | | 1,360 | | | | 1,192 | | | | 21 | |
| | | | | | | | | | | | | | | | | |
| Services (to)/from other business divisions | | | 97 | | | | 243 | | | | 318 | | | | (60 | ) |
| | | | | | | | | | | | | | | | | |
| Depreciation and impairment of property and equipment | | | 190 | | | | 159 | | | | 165 | | | | 19 | |
| | | | | | | | | | | | | | | | | |
| Amortization and impairment of intangible assets | | | 8 | | | | 7 | | | | 37 | | | | 14 | |
| | | | | | | | | | | | | | | | | |
| Total operating expenses2 | | | 5,316 | | | | 4,634 | | | | 5,012 | | | | 15 | |
| | | | | | | | | | | | | | | | | |
| Business division operating profit/(loss) before tax | | | 2,247 | | | | 2,407 | | | | 2,633 | | | | (7 | ) |
| | | | | | | | | | | | | | | | | |
| | | | |
| Key performance indicators3 | | | | | | | | | | | | | | | | |
| | | | | | | | | | | | | | | | | |
| Pre-tax profit growth (%) | | | (6.6 | ) | | | (8.6 | ) | | | 17.9 | | | | | |
| | | | | | | | | | | | | | | | | |
| Cost/income ratio (%) | | | 70.2 | | | | 65.8 | | | | 65.7 | | | | | |
| | | | | | | | | | | | | | | | | |
| Net new money growth (%)4 | | | 4.4 | | | | 3.5 | | | | 3.1 | | | | | |
| | | | | | | | | | | | | | | | | |
| Gross margin on invested assets (bps)5 | | | 88 | | | | 89 | | | | 101 | | | | (1 | ) |
| | | | | | | | | | | | | | | | | |
1 Comparative figures in this table may differ from those originally published in quarterly and annual reports due to adjustments following organizational changes and restatements due to retrospective adoption of new accounting standards. 2 Refer to “Note 32 Changes in organization” in the “Financial information” section of this report for information on restructuring charges. 3 For the definitions of our key performance indicators, refer to the “Measurement of performance” section of this report. 4 Net new money excludes interest and dividend income. 5 Excludes any effect on profit or loss from a property fund (2013: loss of CHF 10 million, 2012: gain of CHF 4 million, 2011: loss of CHF 22 million).
98
|
Financial and operating performance |
|
|
Business division reporting1(continued)
| | | | | | | | | | | | | | | | |
| | As of or for the year ended | | | % change from | |
| CHF million, except where indicated | | 31.12.13 | | | 31.12.12 | | | 31.12.11 | | | 31.12.12 | |
| | | | |
| Additional information | | | | | | | | | | | | | | | | |
| | | | | | | | | | | | | | | | | |
| Recurring income | | | 5,652 | | | | 5,277 | | | | 5,406 | | | | 7 | |
| | | | | | | | | | | | | | | | | |
| Recurring income as a % of income (%) | | | 74.6 | | | | 75.0 | | | | 70.8 | | | | | |
| | | | | | | | | | | | | | | | | |
| Average attributed equity (CHF billion)2 | | | 3.5 | | | | 4.0 | | | | 5.0 | | | | (13 | ) |
| | | | | | | | | | | | | | | | | |
| Return on attributed equity (RoAE) (%) | | | 64.2 | | | | 60.9 | | | | 52.7 | | | | | |
| | | | | | | | | | | | | | | | | |
| Risk-weighted assets (phase-in, CHF billion)3 | | | 21.4 | | | | 18.6 | | | | | | | �� | 15 | |
| | | | | | | | | | | | | | | | | |
| Risk-weighted assets (fully applied, CHF billion)3 | | | 20.9 | | | | 18.2 | | | | | | | | 15 | |
| | | | | | | | | | | | | | | | | |
| Return on risk-weighted assets, gross (%)4 | | | 38.7 | | | | 41.4 | | | | | | | | | |
| | | | | | | | | | | | | | | | | |
| Swiss SRB leverage ratio denominator (phase-in, CHF billion)5 | | | 122.1 | | | | | | | | | | | | | |
| | | | | | | | | | | | | | | | | |
| Goodwill and intangible assets (CHF billion) | | | 1.3 | | | | 1.4 | | | | 1.4 | | | | (7 | ) |
| | | | | | | | | | | | | | | | | |
| Net new money (CHF billion)6 | | | 35.9 | | | | 26.3 | | | | 23.5 | | | | | |
| | | | | | | | | | | | | | | | | |
| Invested assets (CHF billion) | | | 886 | | | | 821 | | | | 750 | | | | 8 | |
| | | | | | | | | | | | | | | | | |
| Client assets (CHF billion) | | | 1,023 | | | | 951 | | | | 875 | | | | 8 | |
| | | | | | | | | | | | | | | | | |
| Loans, gross (CHF billion) | | | 96.8 | | | | 86.6 | | | | 75.1 | | | | 12 | |
| | | | | | | | | | | | | | | | | |
| Due to customers (CHF billion) | | | 189.4 | | | | 180.2 | | | | 170.2 | | | | 5 | |
| | | | | | | | | | | | | | | | | |
| Personnel (full-time equivalents) | | | 16,414 | | | | 16,210 | | | | 15,904 | | | | 1 | |
| | | | | | | | | | | | | | | | | |
| Client advisors (full-time equivalents) | | | 4,164 | | | | 4,128 | | | | 4,202 | | | | 1 | |
| | | | | | | | | | | | | | | | | |
1 Comparative figures in this table may differ from those originally published in quarterly and annual reports due to adjustments following organizational changes and restatements due to retrospective adoption of new accounting standards. 2 Refer to the “Capital management” section of this report for more information on the equity attribution framework. 3 Based on the Basel III framework as applicable for Swiss systemically relevant banks (SRB). Numbers for 31 December 2012 are on a pro-forma basis. Refer to the “Capital management” section of this report for more information. 4 Based on Basel III risk-weighted assets (phase-in) for 2013. Based on Basel 2.5 risk-weighted assets for 2012. 5 The leverage ratio denominator is also referred to as “total adjusted exposure” and is calculated in accordance with Swiss SRB leverage ratio requirements. Data represent the average of the total adjusted exposure at the end of the three months preceding the end of the reporting period. Data as of 31 December 2012 are not available on a reporting segment level due to organizational changes. Refer to the “Capital management” section of this report for more information. 6 Net new money excludes interest and dividend income.
Regional breakdown of key figures1,2
| | | | | | | | | | | | | | | | | | | | | | | | |
| As of or for the year ended 31.12.13 | | Europe | | | Asia Pacific | | | Switzerland | | | Emerging
markets | | | of which:
ultra high
net worth | | | of which:
Global Family
Office3 | |
| Net new money (CHF billion)4 | | | 1.9 | | | | 18.5 | | | | 6.2 | | | | 9.4 | | | | 33.6 | | | | 8.3 | |
| | | | | | | | | | | | | | | | | | | | | | | | | |
| Net new money growth (%)4 | | | 0.6 | | | | 9.4 | | | | 4.3 | | | | 7.4 | | | | 9.3 | | | | 19.3 | |
| | | | | | | | | | | | | | | | | | | | | | | | | |
| Invested assets (CHF billion) | | | 363 | | | | 218 | | | | 160 | | | | 135 | | | | 416 | | | | 61 | |
| | | | | | | | | | | | | | | | | | | | | | | | | |
| Gross margin on invested assets (bps) | | | 88 | | | | 80 | | | | 95 | | | | 93 | | | | 54 | | | | 36 | 5 |
| | | | | | | | | | | | | | | | | | | | | | | | | |
| Client advisors (full-time equivalents) | | | 1,620 | | | | 1,032 | | | | 761 | | | | 688 | | | | 892 | 6 | | | | |
| | | | | | | | | | | | | | | | | | | | | | | | | |
1 For the definitions of our key performance indicators, refer to the “Measurement of performance” section of this report. 2 Based on the Wealth Management business area structure, and excluding minor functions with 63 client advisors, CHF 10 billion of invested assets, and CHF 0.1 billion of net new money outflows. 3 Joint venture between Wealth Management and the Investment Bank. Global Family Office is reported as a sub-segment of ultra high net worth and is included in the ultra high net worth figures. 4 Net new money excludes interest and dividend income. 5 Gross margin includes income booked in the Investment Bank. Gross margin only based on income booked in Wealth Management was 20 basis points. 6 Dedicated ultra high net worth units: 638 client advisors. Non-dedicated ultra high net worth units: 254 client advisors.
99
Financial and operating performance
Wealth Management
2013 compared with 2012
Results
Operating income
Total operating income was CHF 7,563 million compared with CHF 7,041 million in 2012, primarily due to higher net fee and commission income, as well as higher net interest income.
Net interest income increased by CHF 110 million to CHF 2,061 million, mainly due to revenues of CHF 110 million allocated from the repurchase agreement unit within Group Treasury in Corporate Center – Core Functions. Previously, such revenues were not allocated to the business divisions. The increase in net interest income was also due to lower costs related to the multi-currency portfolio of unencumbered, high-quality, short-term assets managed centrally by Group Treasury. These factors, together with higher income resulting from increased loan and client deposit volumes, more than offset the negative effect of a lower deposit margin resulting from the ongoing low interest rate environment.
Net fee and commission income increased by CHF 373 million to CHF 4,648 million, mainly due to higher recurring net fee and commission income, which primarily resulted from a 10% increase in average invested assets, pricing adjustments and sales efforts. These positive effects were partly offset by the negative effect of the migration to retrocession-free products for investment mandates during 2013, as well as lower income due to ongoing outflows of assets from cross-border clients. Non-recurring net fee and commission income increased due to higher client activity levels, particularly in Asia Pacific, in the first half of 2013.
Net trading income increased by CHF 29 million to CHF 807 million and included higher income from foreign exchange-related products and increased treasury-related income, partly offset by lower income from precious metals.
Other income increased to CHF 57 million from CHF 37 million and included higher revenues for other services, as well as a gain of CHF 25 million related to the divestment of our participation in Euroclear Plc. This was partly offset by impairments of CHF 10 million related to our global property fund compared with gains of CHF 4 million in 2012.
Operating expenses
Total operating expenses were CHF 5,316 million, an increase of CHF 682 million from the prior year. Restructuring charges were CHF 178 million compared with CHF 26 million in 2012. Adjusted for restructuring charges and the aforementioned credit related to changes to our pension and retiree benefit plans of CHF 358 million, operating expenses increased by CHF 172 million to CHF 5,138 million, mainly as 2013 included a charge in relation to the Swiss-UK tax agreement of CHF 107 million.
Personnel expenses increased to CHF 3,371 million from CHF 2,865 million. Excluding restructuring charges and the credit related to changes to our pension and retiree benefit plans,
personnel expenses increased by CHF 102 million to CHF 3,300 million. This increase included CHF 120 million higher personnel expenses due to the centralization of our operations units and higher variable compensation expenses, partly offset by lower personnel expenses related to technology and control functions. The centralization of our operations units from the business divisions in the Corporate Center in July 2012 and the subsequent reallocation of the operations units resulted in increased personnel expenses and general and administrative expenses, offset by decreased net charges from other business divisions as Retail & Corporate previously provided significant services to Wealth Management, which are now provided by the Corporate Center.
| | è | | Refer to the “Significant accounting and financial reporting structure changes” section of our Annual Report 2012 for more information on changes related to the centralization of operations units |
General and administrative expenses increased by CHF 290 million to CHF 1,650 million. This included restructuring charges of CHF 100 million compared with zero in the prior year. Excluding restructuring charges, general and administrative expenses increased by CHF 190 million, mainly due to the aforementioned CHF 107 million charge in relation to the Swiss-UK tax agreement, CHF 36 million higher expenses related to the aforementioned centralization of operations units as well as slightly higher marketing and branding expenses.
Charges for services from other business divisions decreased to CHF 97 million from CHF 243 million, mainly due to CHF 157 million lower allocations following the aforementioned centralization of operations units.
Depreciation was CHF 190 million compared with CHF 159 million, largely due to higher amortization of capitalized software, an impairment of capitalized software and restructuring charges of CHF 7 million compared with zero in the prior year. Amortization of intangible assets was CHF 8 million, a slight increase from CHF 7 million.
Cost/income ratio
The cost/income ratio was 70.2% compared with 65.8% in the prior year. Excluding restructuring charges and the effect from the credit related to changes to our pension and retiree benefit plans in 2012, the cost/income ratio improved to 67.8% from 70.5% and was within our target range of 60% to 70%.
Net new money growth
The net new money growth rate increased to 4.4% from 3.5% and was near the higher end of our target range of 3% to 5%. All regions contributed to net inflows of CHF 35.9 billion in 2013. The strongest net inflows were recorded in Asia Pacific followed by emerging markets, Switzerland and Europe. Net inflows in the European onshore and the Swiss-based Global Family Office business in Europe more than offset net outflows in the European cross-border business, which was negatively affected by ongoing asset outflows
100
|
Financial and operating performance |
|
|
in the context of fiscal and regulatory concerns. On a global basis, net new money from ultra high net worth clients was CHF 33.6 billion compared with CHF 19.9 billion in the prior year.
Invested assets
Invested assets were CHF 886 billion as of 31 December 2013, representing an increase of CHF 65 billion from 31 December 2012. Net new money inflows of CHF 36 billion and positive market performance of CHF 34 billion were slightly offset by negative currency translation effects of CHF 4 billion.
Gross margin on invested assets
The gross margin on invested assets decreased by 1 basis point to 88 basis points, as the increase in average invested assets outpaced the increase in revenues. The gross margin was below our
target range of 95 to 105 basis points. The calculation excludes any effect on profit or loss from a property fund.
Personnel
Wealth Management employed 16,414 personnel as of 31 December 2013 compared with 16,210 as of 31 December 2012, mainly reflecting an increase in non-client-facing staff.
The number of client advisors increased to 4,164 from 4,128, primarily in the key strategic growth areas of Asia Pacific and emerging markets, partly offset by reductions in Switzerland. The number of client advisors in Europe remained stable. The increase in non-client-facing staff was mainly recorded in Asia Pacific and emerging markets, in line with the increase in the number of client advisors.
101
Financial and operating performance
Wealth Management
2012 compared with 2011
Results
Profit before tax was CHF 2,407 million in 2012 compared with CHF 2,633 million in the prior year, which included a gain of CHF 433 million from the sale of our strategic investment portfolio in the third quarter of 2011. Operating expenses in 2012 included a credit to personnel expenses of CHF 358 million related to changes to our pension and retiree benefit plans. Adjusted for these two items and restructuring charges, profit before tax decreased by CHF 207 million to CHF 2,075 million, partly reflecting that the prior year benefited from CHF 103 million of accrued interest from the aforementioned strategic investment portfolio. Net new money was CHF 26.3 billion compared with CHF 23.5 billion.
Operating income
Total operating income was CHF 7,041 million in 2012 compared with CHF 7,645 million in 2011. Adjusted for the gain on the sale of our strategic investment portfolio, total operating income declined by CHF 171 million, mainly because 2011 included CHF 103 million of interest income stemming from the aforementioned strategic investment portfolio.
Net interest income decreased by CHF 17 million to CHF 1,951 million, mainly as the prior year included CHF 103 million of interest income stemming from the abovementioned strategic investment portfolio. Moreover, net interest income was negatively affected by increased costs of CHF 69 million related to the multi-currency portfolio of unencumbered, high-quality, short-term assets managed centrally by Group Treasury and CHF 22 million lower allocations related to investment proceeds from the firm’s equity. These factors were largely offset by CHF 180 million higher product-related interest income, reflecting the beneficial effects of increases in client deposit and lending volumes.
Net fee and commission income declined by CHF 88 million to CHF 4,275 million, mainly due to lower recurring fees on discretionary business, investment funds and non-asset based fees, primarily resulting from the ongoing outflows of assets from cross-border clients. This was partly offset by 2% higher transaction-based fees due to increased client activity levels in Asia Pacific throughout the year.
Net trading income decreased by CHF 100 million to CHF 778 million, primarily due to lower treasury-related income and lower client activity levels following reduced volatility in the foreign exchange market.
Other income was CHF 37 million compared with CHF 425 million in 2011, mainly as the prior year included the abovementioned gain on the sale of our strategic investment portfolio.
Operating expenses
Total operating expenses were CHF 4,634 million, a decrease of CHF 378 million from the prior year. Restructuring charges were CHF 26 million, down from CHF 82 million in the previous year. Adjusted for these restructuring charges and the aforementioned credit related to changes to our pension and retiree benefit plans, operating expenses increased by CHF 36 million to CHF 4,966 million.
Personnel expenses decreased to CHF 2,865 million from CHF 3,300 million in the prior year. Excluding the abovementioned factors, personnel expenses decreased by CHF 38 million, primarily reflecting lower variable compensation expenses as well as reduced personnel expenses related to technology and operations costs. This was partly offset by higher personnel expenses of CHF 129 million due to the aforementioned centralization of operations units in July 2012. As Retail & Corporate previously provided significant services to Wealth Management, the centralization and subsequent reallocation of operations units had the effect of reducing net charges from other business divisions and increasing personnel and non-personnel costs in 2012.
General and administrative expenses were CHF 1,360 million compared with CHF 1,192 million in the prior year. This included higher investment in marketing and branding and increased charges for provisions for litigation, regulatory and similar matters. Further, the aforementioned centralization of operations units in 2012 led to increased expenses of CHF 45 million in 2012.
Charges for services from other business divisions decreased to CHF 243 million from CHF 318 million, mainly due to the CHF 175 million lower allocations from the aforementioned centralization of operations units, partly offset by higher allocations from other business transfers.
Depreciation was CHF 159 million compared with CHF 165 million in the prior year. Amortization of intangible assets was CHF 7 million, a decrease from CHF 37 million in 2011, which included the impairment of intangible assets related to a past acquisition in the UK.
Cost/income ratio
The cost/income ratio was 65.8% in 2012. On an adjusted basis excluding restructuring charges, the effect of the credit related to changes to our pension and retiree benefit plans in 2012 and the gain from the sale of the strategic investment portfolio in 2011, the cost/income ratio increased 2.0 percentage points to 70.5% and was above our target range of 60% to 70%.
Net new money growth
The net new money growth rate increased to 3.5% from 3.1% and remained within our target range of 3% to 5%. The strongest net inflows were recorded in Asia Pacific and emerging markets,
102
|
Financial and operating performance |
|
|
as well as globally from ultra high net worth clients. Europe reported net outflows in the offshore business, mainly related to clients from countries neighboring Switzerland. This was partly offset by net inflows in the European onshore business. Swiss wealth management reported increased net inflows compared with the prior year.
Invested assets
Invested assets were CHF 821 billion as of 31 December 2012, representing an increase of CHF 71 billion from 31 December 2011. Positive market performance and net new money inflows were partly offset by negative currency translation effects, mainly resulting from a slight strengthening of the Swiss franc against the US dollar and the euro.
Gross margin on invested assets
In 2012, the gross margin on invested assets decreased 12 basis points to 89 basis points. Adjusted for the aforementioned gain on the sale of the strategic investment portfolio in the prior year,
the gross margin declined 7 basis points to 89 basis points and was below our target range of 95 to 105 basis points. The gross margin calculation excludes any effect on profit or loss from a property fund.
Personnel
Wealth Management employed 16,210 personnel as of 31 December 2012 compared with 15,904 as of 31 December 2011. The aforementioned centralization and subsequent reallocation of personnel from operations units led to an increase of personnel. Excluding this effect, the number of non-client-advisor staff and client advisors decreased, mainly reflecting measures taken as a part of our cost reduction program announced in July 2011.
The number of client advisors decreased to 4,128 from 4,202 in the prior year due to reductions in more established markets, partly offset by further increases in the strategic growth areas of Asia Pacific and emerging markets.
103
Financial and operating performance
Wealth Management Americas
Wealth Management Americas
Profit before tax was a record USD 927 million in 2013 compared with the prior record of USD 638 million in 2012. Adjusted for the effects of restructuring in both years as well as a credit in 2012 related to changes to our retiree benefit plans in the US, profit before tax increased to USD 991 million from USD 635 million. The adjusted result reflected a 12% increase in revenues due to higher recurring income and a 7% increase in operating expenses due to higher financial advisor related compensation, partly offset by lower charges for provisions for litigation, regulatory and similar matters. Net new money inflows were USD 19.0 billion compared with USD 22.1 billion in the prior year.
Business division reporting – in US dollars1
| | | | | | | | | | | | | | | | |
| | As of or for the year ended | | | % change from | |
| USD million, except where indicated | | 31.12.13 | | | 31.12.12 | | | 31.12.11 | | | 31.12.12 | |
| Net interest income | | | 1,014 | | | | 849 | | | | 828 | | | | 19 | |
| | | | | | | | | | | | | | | | | |
| Net fee and commission income | | | 5,637 | | | | 4,925 | | | | 4,559 | | | | 14 | |
| | | | | | | | | | | | | | | | | |
| Net trading income | | | 418 | | | | 507 | | | | 509 | | | | (18 | ) |
| | | | | | | | | | | | | | | | | |
| Other income | | | 36 | | | | 32 | | | | 25 | | | | 13 | |
| | | | | | | | | | | | | | | | | |
| Income | | | 7,105 | | | | 6,312 | | | | 5,921 | | | | 13 | |
| | | | | | | | | | | | | | | | | |
| Credit loss (expense)/recovery | | | (30 | ) | | | (15 | ) | | | (6 | ) | | | 100 | |
| | | | | | | | | | | | | | | | | |
| Total operating income | | | 7,075 | | | | 6,297 | | | | 5,915 | | | | 12 | |
| | | | | | | | | | | | | | | | | |
| Personnel expenses | | | 4,949 | | | | 4,556 | | | | 4,348 | | | | 9 | |
| | | | | | | | | | | | | | | | | |
Financial advisor compensation2 | | | 2,708 | | | | 2,399 | | | | 2,249 | | | | 13 | |
| | | | | | | | | | | | | | | | | |
Compensation commitments with recruited financial advisors3 | | | 690 | | | | 679 | | | | 609 | | | | 2 | |
| | | | | | | | | | | | | | | | | |
Salaries and other personnel costs | | | 1,551 | | | | 1,477 | | | | 1,490 | | | | 5 | |
| | | | | | | | | | | | | | | | | |
| General and administrative expenses | | | 1,001 | | | | 958 | | | | 887 | | | | 4 | |
| | | | | | | | | | | | | | | | | |
| Services (to)/from other business divisions | | | 14 | | | | (16 | ) | | | (11 | ) | | | | |
| | | | | | | | | | | | | | | | | |
| Depreciation and impairment of property and equipment | | | 130 | | | | 107 | | | | 112 | | | | 21 | |
| | | | | | | | | | | | | | | | | |
| Amortization and impairment of intangible assets | | | 53 | | | | 55 | | | | 54 | | | | (4 | ) |
| | | | | | | | | | | | | | | | | |
| Total operating expenses4 | | | 6,147 | | | | 5,659 | | | | 5,389 | | | | 9 | |
| | | | | | | | | | | | | | | | | |
| Business division operating profit/(loss) before tax | | | 927 | | | | 638 | | | | 526 | | | | 45 | |
| | | | | | | | | | | | | | | | | |
| | | | |
| Key performance indicators5 | | | | | | | | | | | | | | | | |
| | | | | | | | | | | | | | | | | |
| Pre-tax profit growth (%)6 | | | 45.3 | | | | 21.3 | | | | | | | | | |
| | | | | | | | | | | | | | | | | |
| Cost/income ratio (%) | | | 86.5 | | | | 89.7 | | | | 91.0 | | | | | |
| | | | | | | | | | | | | | | | | |
| Recurring income as a % of income (%) | | | 71.9 | | | | 67.6 | | | | 66.2 | | | | | |
| | | | | | | | | | | | | | | | | |
| Net new money growth (%)7 | | | 2.3 | | | | 2.9 | | | | 1.9 | | | | | |
| | | | | | | | | | | | | | | | | |
| Gross margin on invested assets (bps) | | | 79 | | | | 78 | | | | 79 | | | | 1 | |
| | | | | | | | | | | | | | | | | |
1 Comparative figures in this table may differ from those originally published in quarterly and annual reports due to adjustments following organizational changes and restatements due to retrospective adoption of new accounting standards. 2 Financial advisor compensation consists of grid-based compensation based directly on compensable revenues generated by financial advisors and supplemental compensation calculated based on financial advisor productivity, firm tenure, assets and other variables. 3 Compensation commitments with recruited financial advisors represents costs related to compensation commitments granted to financial advisors at the time of recruitment which are subject to vesting requirements. 4 Refer to “Note 32 Changes in organization” in the “Financial information” section of this report for information on restructuring charges. 5 For the definitions of our key performance indicators, refer to the “Measurement of performance” section of this report. 6 Not meaningful and not included if either the reporting period or the comparison period is a loss period. 7 Net new money excludes interest and dividend income.
104
|
Financial and operating performance |
|
|
Business division reporting – in US dollars1(continued)
| | | | | | | | | | | | | | | | |
| | As of or for the year ended | | | % change from | |
| USD million, except where indicated | | 31.12.13 | | | 31.12.12 | | | 31.12.11 | | | 31.12.12 | |
| | | | |
| Additional information | | | | | | | | | | | | | | | | |
| | | | | | | | | | | | | | | | | |
| Recurring income | | | 5,110 | | | | 4,265 | | | | 3,921 | | | | 20 | |
| | | | | | | | | | | | | | | | | |
| Average attributed equity (USD billion)2 | | | 3.0 | | | | 6.6 | | | | 9.1 | | | | (55 | ) |
| | | | | | | | | | | | | | | | | |
| Return on attributed equity (RoAE) (%) | | | 30.9 | | | | 9.6 | | | | 5.8 | | | | | |
| | | | | | | | | | | | | | | | | |
| Risk-weighted assets (phase-in, USD billion)3 | | | 27.5 | | | | 25.6 | | | | | | | | 7 | |
| | | | | | | | | | | | | | | | | |
| Risk-weighted assets (fully applied, USD billion)3 | | | 27.3 | | | | 25.3 | | | | | | | | 8 | |
| | | | | | | | | | | | | | | | | |
| Return on risk-weighted assets, gross (%)4 | | | 30.0 | | | | 24.9 | | | | | | | | | |
| | | | | | | | | | | | | | | | | |
| Swiss SRB leverage ratio denominator (phase-in, USD billion)5 | | | 64.1 | | | | | | | | | | | | | |
| | | | | | | | | | | | | | | | | |
| Goodwill and intangible assets (USD billion) | | | 3.8 | | | | 3.9 | | | | 3.9 | | | | (3 | ) |
| | | | | | | | | | | | | | | | | |
| Net new money (USD billion)6 | | | 19.0 | | | | 22.1 | | | | 14.1 | | | | | |
| | | | | | | | | | | | | | | | | |
| Net new money including interest and dividend income (USD billion)7 | | | 44.2 | | | | 44.8 | | | | 34.7 | | | | | |
| | | | | | | | | | | | | | | | | |
| Invested assets (USD billion) | | | 970 | | | | 843 | | | | 756 | | | | 15 | |
| | | | | | | | | | | | | | | | | |
| Client assets (USD billion) | | | 1,025 | | | | 885 | | | | 795 | | | | 16 | |
| | | | | | | | | | | | | | | | | |
| Loans, gross (USD billion) | | | 39.1 | | | | 34.1 | | | | 29.7 | | | | 15 | |
| | | | | | | | | | | | | | | | | |
| Due to customers (USD billion) | | | 67.3 | | | | 56.6 | | | | 41.4 | | | | 19 | |
| | | | | | | | | | | | | | | | | |
| Recruitment loans to financial advisors | | | 3,063 | | | | 3,241 | | | | 3,098 | | | | (5 | ) |
| | | | | | | | | | | | | | | | | |
| Other loans to financial advisors | | | 401 | | | | 532 | | | | 659 | | | | (25 | ) |
| | | | | | | | | | | | | | | | | |
| Personnel (full-time equivalents) | | | 16,344 | | | | 16,094 | | | | 16,207 | | | | 2 | |
| | | | | | | | | | | | | | | | | |
| Financial advisors (full-time equivalents) | | | 7,137 | | | | 7,059 | | | | 6,967 | | | | 1 | |
| | | | | | | | | | | | | | | | | |
1 Comparative figures in this table may differ from those originally published in quarterly and annual reports due to adjustments following organizational changes and restatements due to retrospective adoption of new accounting standards. 2 Refer to the “Capital management” section of this report for more information on the equity attribution framework. 3 Based on the Basel III framework as applicable for Swiss systemically relevant banks (SRB). Numbers for 31 December 2012 are on a pro-forma basis. Refer to the “Capital management” section of this report for more information. 4 Based on Basel III risk-weighted assets (phase-in) for 2013. Based on Basel 2.5 risk-weighted assets for 2012. 5 The leverage ratio denominator is also referred to as “total adjusted exposure” and is calculated in accordance with Swiss SRB leverage ratio requirements. Data represent the average of the total adjusted exposure at the end of the three months preceding the end of the reporting period. Data as of 31 December 2012 are not available on a reporting segment level due to organizational changes. Refer to the “Capital management” section of this report for more information. 6 Net new money excludes interest and dividend income. 7 Presented in line with historical reporting practice in the US market.
Business division reporting – in Swiss francs1
| | | | | | | | | | | | | | | | |
| | As of or for the year ended | | | % change from | |
| CHF million, except where indicated | | 31.12.13 | | | 31.12.12 | | | 31.12.11 | | | 31.12.12 | |
| Net interest income | | | 936 | | | | 792 | | | | 729 | | | | 18 | |
| | | | | | | | | | | | | | | | | |
| Net fee and commission income | | | 5,209 | | | | 4,597 | | | | 4,018 | | | | 13 | |
| | | | | | | | | | | | | | | | | |
| Net trading income | | | 387 | | | | 473 | | | | 450 | | | | (18 | ) |
| | | | | | | | | | | | | | | | | |
| Other income | | | 33 | | | | 30 | | | | 22 | | | | 10 | |
| | | | | | | | | | | | | | | | | |
| Income | | | 6,565 | | | | 5,891 | | | | 5,219 | | | | 11 | |
| | | | | | | | | | | | | | | | | |
| Credit loss (expense)/recovery | | | (27 | ) | | | (14 | ) | | | (6 | ) | | | 93 | |
| | | | | | | | | | | | | | | | | |
| Total operating income | | | 6,538 | | | | 5,877 | | | | 5,213 | | | | 11 | |
| | | | | | | | | | | | | | | | | |
| Personnel expenses | | | 4,574 | | | | 4,252 | | | | 3,830 | | | | 8 | |
| | | | | | | | | | | | | | | | | |
Financial advisor compensation2 | | | 2,503 | | | | 2,239 | | | | 1,982 | | | | 12 | |
| | | | | | | | | | | | | | | | | |
Compensation commitments with recruited financial advisors3 | | | 638 | | | | 634 | | | | 536 | | | | 1 | |
| | | | | | | | | | | | | | | | | |
Salaries and other personnel costs | | | 1,433 | | | | 1,379 | | | | 1,313 | | | | 4 | |
| | | | | | | | | | | | | | | | | |
| General and administrative expenses | | | 924 | | | | 893 | | | | 783 | | | | 3 | |
| | | | | | | | | | | | | | | | | |
| Services (to)/from other business divisions | | | 13 | | | | (15 | ) | | | (9 | ) | | | | |
| | | | | | | | | | | | | | | | | |
| Depreciation and impairment of property and equipment | | | 121 | | | | 100 | | | | 99 | | | | 21 | |
| | | | | | | | | | | | | | | | | |
| Amortization and impairment of intangible assets | | | 49 | | | | 51 | | | | 48 | | | | (4 | ) |
| | | | | | | | | | | | | | | | | |
| Total operating expenses4 | | | 5,680 | | | | 5,281 | | | | 4,750 | | | | 8 | |
| | | | | | | | | | | | | | | | | |
| Business division operating profit/(loss) before tax | | | 858 | | | | 597 | | | | 463 | | | | 44 | |
| | | | | | | | | | | | | | | | | |
1 Comparative figures in this table may differ from those originally published in quarterly and annual reports due to adjustments following organizational changes and restatements due to retrospective adoption of new accounting standards. 2 Financial advisor compensation consists of grid-based compensation based directly on compensable revenues generated by financial advisors and supplemental compensation calculated based on financial advisor productivity, firm tenure, assets and other variables. 3 Compensation commitments with recruited financial advisors represents costs related to compensation commitments granted to financial advisors at the time of recruitment which are subject to vesting requirements. 4 Refer to “Note 32 Changes in organization” in the “Financial information” section of this report for information on restructuring charges.
105
Financial and operating performance
Wealth Management Americas
Business division reporting – in Swiss francs1(continued)
| | | | | | | | | | | | | | | | |
| | As of or for the year ended | | | % change from | |
| CHF million, except where indicated | | 31.12.13 | | | 31.12.12 | | | 31.12.11 | | | 31.12.12 | |
| | | | |
| Key performance indicators2 | | | | | | | | | | | | | | | | |
| | | | | | | | | | | | | | | | | |
| Pre-tax profit growth (%)3 | | | 43.7 | | | | 28.9 | | | | | | | | | |
| | | | | | | | | | | | | | | | | |
| Cost/income ratio (%) | | | 86.5 | | | | 89.6 | | | | 91.0 | | | | | |
| | | | | | | | | | | | | | | | | |
| Recurring income as a % of income (%) | | | 71.9 | | | | 67.6 | | | | 66.2 | | | | | |
| | | | | | | | | | | | | | | | | |
| Net new money growth (%)4 | | | 2.3 | | | | 2.9 | | | | 1.8 | | | | | |
| | | | | | | | | | | | | | | | | |
| Gross margin on invested assets (bps) | | | 79 | | | | 78 | | | | 77 | | | | 1 | |
| | | | | | | | | | | | | | | | | |
| | | | |
| Additional information | | | | | | | | | | | | | | | | |
| | | | | | | | | | | | | | | | | |
| Recurring income | | | 4,721 | | | | 3,980 | | | | 3,454 | | | | 19 | |
| | | | | | | | | | | | | | | | | |
| Average attributed equity (CHF billion)5 | | | 2.8 | | | | 6.2 | | | | 8.0 | | | | (55 | ) |
| | | | | | | | | | | | | | | | | |
| Return on attributed equity (RoAE) (%) | | | 30.9 | | | | 9.7 | | | | 5.8 | | | | | |
| | | | | | | | | | | | | | | | | |
| Risk-weighted assets (phase-in, CHF billion)6 | | | 24.5 | | | | 23.5 | | | | | | | | 4 | |
| | | | | | | | | | | | | | | | | |
| Risk-weighted assets (fully applied, CHF billion)6 | | | 24.3 | | | | 23.2 | | | | | | | | 5 | |
| | | | | | | | | | | | | | | | | |
| Return on risk-weighted assets, gross (%)7 | | | 30.0 | | | | 25.0 | | | | | | | | | |
| | | | | | | | | | | | | | | | | |
| Swiss SRB leverage ratio denominator (phase-in, CHF billion)8 | | | 57.2 | | | | | | | | | | | | | |
| | | | | | | | | | | | | | | | | |
| Goodwill and intangible assets (CHF billion) | | | 3.4 | | | | 3.5 | | | | 3.7 | | | | (3 | ) |
| | | | | | | | | | | | | | | | | |
| Net new money (CHF billion)4 | | | 17.6 | | | | 20.6 | | | | 12.1 | | | | | |
| | | | | | | | | | | | | | | | | |
| Net new money including interest and dividend income (CHF billion)9 | | | 40.8 | | | | 41.7 | | | | 30.5 | | | | | |
| | | | | | | | | | | | | | | | | |
| Invested assets (CHF billion) | | | 865 | | | | 772 | | | | 709 | | | | 12 | |
| | | | | | | | | | | | | | | | | |
| Client assets (CHF billion) | | | 914 | | | | 810 | | | | 746 | | | | 13 | |
| | | | | | | | | | | | | | | | | |
| Loans, gross (CHF billion) | | | 34.8 | | | | 31.2 | | | | 27.9 | | | | 12 | |
| | | | | | | | | | | | | | | | | |
| Due to customers (CHF billion) | | | 60.0 | | | | 51.8 | | | | 38.9 | | | | 16 | |
| | | | | | | | | | | | | | | | | |
| Recruitment loans to financial advisors | | | 2,733 | | | | 2,967 | | | | 2,907 | | | | (8 | ) |
| | | | | | | | | | | | | | | | | |
| Other loans to financial advisors | | | 358 | | | | 487 | | | | 618 | | | | (26 | ) |
| | | | | | | | | | | | | | | | | |
| Personnel (full-time equivalents) | | | 16,344 | | | | 16,094 | | | | 16,207 | | | | 2 | |
| | | | | | | | | | | | | | | | | |
| Financial advisors (full-time equivalents) | | | 7,137 | | | | 7,059 | | | | 6,967 | | | | 1 | |
| | | | | | | | | | | | | | | | | |
1 Comparative figures in this table may differ from those originally published in quarterly and annual reports due to adjustments following organizational changes and restatements due to retrospective adoption of new accounting standards. 2 For the definitions of our key performance indicators, refer to the “Measurement of performance” section of this report. 3 Not meaningful and not included if either the reporting period or the comparison period is a loss period. 4 Net new money excludes interest and dividend income. 5 Refer to the “Capital management” section of this report for more information on the equity attribution framework. 6 Based on the Basel III framework as applicable for Swiss systemically relevant banks (SRB). Numbers for 31 December 2012 are on a pro-forma basis. Refer to the “Capital management” section of this report for more information. 7 Based on Basel III risk-weighted assets (phase-in) for 2013. Based on Basel 2.5 risk-weighted assets for 2012. 8 The leverage ratio denominator is also referred to as “total adjusted exposure” and is calculated in accordance with Swiss SRB leverage ratio requirements. Data represent the average of the total adjusted exposure at the end of the three months preceding the end of the reporting period. Data as of 31 December 2012 are not available on a reporting segment level due to organizational changes. Refer to the “Capital management” section of this report for more information. 9 Presented in line with historical reporting practice in the US market.
106
|
Financial and operating performance |
|
|
2013 compared with 2012
Results
Operating income
Total operating income increased to USD 7,075 million from USD 6,297 million in 2012.
Net fee and commission income increased by USD 712 million to USD 5,637 million, mainly due to a 20% increase in recurring fees resulting from higher managed account fees calculated on higher invested asset levels. Transaction-based revenues increased 2%, primarily due to higher income from equities and structured products, partly offset by lower income from annuity products.
Net interest income increased by USD 165 million to USD 1,014 million, primarily due to higher client balances insecurities-backed lending and mortgages. The average securities-backed lending portfolio balance increased 14% and the average mortgage portfolio balance nearly doubled from 2012. Furthermore, net funding costs related to the goodwill and intangible assets that arose from the PaineWebber acquisition are retained in Corporate Center – Core Functions with effect from 1 January 2013. These increases were partly offset by lower net interest income from the available-for-sale portfolio, primarily due to lower average balances.
Net trading income decreased by USD 89 million to USD 418 million, mainly due to trading losses related to the Puerto Rico municipal market as well as lower income from taxable fixed income and US municipal bond trading.
Other income increased by USD 4 million to USD 36 million.
Recurring income, the combination of recurring fees and net interest income, increased by USD 845 million to USD 5,110 million due to higher managed account fees as well as higher interest income. Recurring income comprised 72% of income compared with 68% in the prior year. Non-recurring income decreased by USD 53 million to USD 1,994 million, primarily due to the above-mentioned decrease in trading income.
Net credit loss expenses were USD 30 million compared with net credit loss expenses of USD 15 million in the prior year. The 2013 expenses were largely due to loan loss allowances on securities-backed lending facilities collateralized by Puerto Rico municipal securities and related funds.
| | è | | Refer to the “Risk management and control” section of this report for more information on our exposure to Puerto Rico municipal securities and related funds |
Operating expenses
Operating expenses increased by USD 488 million to USD 6,147 million from USD 5,659 million, primarily due to higher financial advisor compensation corresponding to higher compensable revenues. In 2013, we recorded restructuring charges of USD 64 million, compared with restructuring provision releases of USD 1 million in 2012.
Excluding the effects of restructuring in both years as well as a credit to personnel expenses of USD 2 million related to changes to our retiree benefit plans in the US in 2012, adjusted personnel expenses were USD 4,933 million, an increase of USD 379 million from USD 4,554 million due to a 13% increase in financial advisor compensation corresponding to higher compensable revenues, and a 2% increase in expenses for compensation commitments with recruited financial advisors. Recruitment loans to financial advisors were USD 3,063 million as of 31 December 2013, a decrease of USD 178 million from 31 December 2012. On an adjusted basis, salaries and other personnel costs increased 4% due to higher other variable compensation expenses and USD 20 million of costs related to the partial settlement of a previously discontinued US defined benefit pension plan.
Excluding restructuring charges, non-personnel expenses increased by USD 42 million to USD 1,150 million from USD 1,108 million, mainly due to higher Corporate Center shared services costs and lower net charges to the Investment Bank after the discontinuation of an interdivisional joint venture effective 1 January 2013. These increases were partly offset by USD 70 million lower charges for provisions for litigation, regulatory and similar matters.
Cost/income ratio
The cost/income ratio improved to 86.5% from 89.7% in 2012. On an adjusted basis, the cost/income ratio improved to 85.6% from 89.7% and remained within our target range of 80% to 90%.
Net new money
The net new money growth rate was 2.3% compared with 2.9% in 2012, and was within the target range of 2% to 4%. Net new money totaled USD 19.0 billion compared with USD 22.1 billion in the prior year due to lower inflows from financial advisors employed with UBS for more than one year as well as lower inflows from net recruiting of financial advisors, partly offset by higher inflows from the Global Family Office. Including interest and dividend income, net new money inflows were USD 44.2 billion compared with USD 44.8 billion in the prior year.
107
Financial and operating performance
Wealth Management Americas
Invested assets
Invested assets were USD 970 billion as of 31 December 2013, an increase of USD 127 billion from USD 843 billion as of 31 December 2012, reflecting positive market performance of USD 108 billion and continued strong net new money inflows. During 2013, managed account assets increased by USD 60 billion to USD 308 billion as of 31 December 2013, and comprised 32% of invested assets compared with 29% as of 31 December 2012.
Gross margin on invested assets
The gross margin on invested assets was 79 basis points in 2013, an increase of 1 basis point from 78 basis points in 2012, and remained within our target range of 75 to 85 basis points. This reflected a 13% increase in income compared with a 12% increase in average invested assets. The gross margin from recurring income increased by 4 basis points due to higher managed account
fees and higher net interest income, while the gross margin from non-recurring income decreased by 3 basis points, primarily due to lower trading income.
Personnel
As of 31 December 2013, Wealth Management Americas employed 16,344 personnel, an increase of 250 from 31 December 2012. Financial advisor headcount increased by 78 to 7,137, mainly reflecting the hiring of experienced financial advisors and trainees as well as continued low financial advisor attrition. The number of non-financial advisor employees increased by 172 to 9,207, mainly due to hiring of wealth strategy associates to further enhance advice-based wealth management solutions offered to target client segments.
108
|
Financial and operating performance |
|
|
2012 compared with 2011
Results
Profit before tax was USD 638 million in 2012 compared with USD 526 million in 2011. This improved performance resulted from a 6% increase in revenue due to increases in fees and commissions. Operating expenses increased 5% due to higher financial advisor related compensation and higher charges for provisions for litigation, regulatory and similar matters, partly offset by lower restructuring charges. In addition, 2012 included a pre-tax gain of USD 53 million net of compensation charges related to a change in accounting estimates for certain mutual fund and annuity fee income, compared with USD 32 million related to a change in accounting estimates for certain mutual fund fees in 2011. Net new money inflows of USD 22.1 billion were the highest full year total since 2007.
Operating income
Total operating income increased 6% to USD 6,297 million from USD 5,915 million in 2011.
Net fee and commission income increased by USD 366 million to USD 4,925 million. Recurring fees increased 10% due to higher fees on managed accounts corresponding to higher invested asset levels. In addition, recurring fees included USD 59 million related to a change to accrual-based accounting estimates from a cash basis for certain mutual fund and annuity fee income, compared with USD 48 million related to the prior year. Transaction-based revenues increased 3%, primarily due to higher income from taxable fixed income products.
Net interest income increased by USD 21 million to USD 849 million, primarily due to higher client balances in securities-backed lending and mortgages. The securities-backed lending average portfolio balance increased 12% and the mortgage average portfolio balance nearly doubled from 2011. In addition, 2012 included lower income from mortgage-backed securities in the available-for-sale portfolio due to yield adjustments arising from updated cash flow estimates compared with an upward adjustment reclassifying USD 22 million from other comprehensive income in 2011.
Net trading income decreased by USD 2 million to USD 507 million due to lower municipal securities trading, mostly offset by higher income from taxable fixed income, unit investment trusts and emerging market products.
Other income increased by USD 7 million to USD 32 million.
Recurring income, the combination of recurring fees and net interest income, increased by USD 344 million to USD 4,265 million due to higher managed account and annuity fees as well as higher interest income. Recurring income for 2012 comprised 68% of income, compared with 66% in 2011. Non-recurring income increased by USD 47 million to USD 2,047 million, primarily due to higher transaction-based activity.
Credit loss expenses were USD 15 million compared with USD 6 million in 2011, and primarily related to a loan loss allowance for a single client.
Operating expenses
Operating expenses increased by USD 270 million to USD 5,659 million from USD 5,389 million due to higher financial advisor compensation corresponding to higher revenues. In 2012, Wealth Management Americas recognized restructuring provision releases of USD 1 million, while 2011 included restructuring charges of USD 10 million.
Excluding the effects of restructuring as well as a credit related to changes to our retiree benefit plans in the US, personnel expenses were USD 4,554 million, up USD 211 million from USD 4,343 million due to a 7% increase in financial advisor compensation corresponding to higher revenue production, and an 11% increase in expenses for compensation commitments with recruited financial advisors. On an adjusted basis, salaries and other personnel costs declined 1%. Recruitment loans to financial advisors were USD 3,241 million as of 31 December 2012, an increase of USD 143 million from 31 December 2011.
Excluding restructuring charges, non-personnel expenses increased USD 70 million to USD 1,108 million from USD 1,038 million. General and administrative costs increased 9% on an adjusted basis to USD 963 million from USD 883 million in 2011 due to higher Corporate Center shared services costs and higher charges for provisions for litigation, regulatory and similar matters. This increase was partly offset by lower professional legal fees.
Cost/income ratio
The cost/income ratio improved to 89.7% from 91.0% in 2011. On an adjusted basis, the cost/income ratio was 89.7% compared with 90.8% in 2011 and moved within our target range of 80% to 90%.
Net new money growth
Net new money growth rate for 2012 improved to 2.9% from 1.9% in 2011, moving within the target range of 2% to 4%. Net new money inflows improved to USD 22.1 billion compared with USD 14.1 billion in 2011 due to stronger inflows from net recruiting of financial advisors as well as financial advisors employed with UBS for more than one year. Including interest and dividend income, Wealth Management Americas had net new money inflows of USD 44.8 billion in 2012 compared with USD 34.7 billion in 2011.
Invested assets
Invested assets were USD 843 billion as of 31 December 2012, an increase of 12% from USD 756 billion as of 31 December 2011, reflecting positive market performance and strong net new money inflows. As of 31 December 2012, managed account assets had increased by USD 40 billion to USD 248 billion, and comprised 29% of invested assets compared with 28% as of 31 December 2011.
109
Financial and operating performance
Wealth Management Americas
Gross margin on invested assets
The gross margin on invested assets was 78 basis points in 2012, a decline of 1 basis point from 79 basis points in 2011, and remained within our target range of 75 to 85 basis points. This reflected a 7% increase in income compared with an 8% increase in average invested assets. The gross margin from recurring income increased by 1 basis point as a result of higher managed account fees and higher annuities fees, while the gross margin from non-recurring income decreased by 2 basis points from 2011 mainly due to transaction-based revenue.
Personnel
As of 31 December 2012, Wealth Management Americas employed 16,094 personnel, a decrease of 113 from 31 December 2011. Financial advisor headcount of 7,059 increased by 92 from the prior year, mainly reflecting the hiring of experienced financial advisors and continued low financial advisor attrition. The number of non-financial advisor employees decreased by 205 to 9,035, reflecting staff reductions related to our cost reduction programs.
110
|
Financial and operating performance |
|
|
Retail & Corporate
Profit before tax decreased to CHF 1,458 million in 2013 from CHF 1,827 million in the prior year, mainly as 2012 included a credit to personnel expenses of CHF 287 million related to changes to our Swiss pension plan. Adjusted for this and restructuring charges of CHF 54 million in 2013 and CHF 3 million in 2012, profit before tax decreased by CHF 31 million to CHF 1,512 million, as higher operating expenses were only partly offset by higher operating income. The annualized net new business volume growth rate was 1.8% in 2013.
Business division reporting1
| | | | | | | | | | | | | | | | |
| | As of or for the year ended | | | % change from | |
| CHF million, except where indicated | | 31.12.13 | | | 31.12.12 | | | 31.12.11 | | | 31.12.12 | |
| Net interest income | | | 2,144 | | | | 2,186 | | | | 2,328 | | | | (2 | ) |
| | | | | | | | | | | | | | | | | |
| Net fee and commission income | | | 1,203 | | | | 1,198 | | | | 1,175 | | | | 0 | |
| | | | | | | | | | | | | | | | | |
| Net trading income | | | 341 | | | | 281 | | | | 333 | | | | 21 | |
| | | | | | | | | | | | | | | | | |
| Other income | | | 86 | | | | 90 | | | | 350 | | | | (4 | ) |
| | | | | | | | | | | | | | | | | |
| Income | | | 3,774 | | | | 3,756 | | | | 4,186 | | | | 0 | |
| | | | | | | | | | | | | | | | | |
| Credit loss (expense)/recovery | | | (18 | ) | | | (27 | ) | | | (101 | ) | | | (33 | ) |
| | | | | | | | | | | | | | | | | |
| Total operating income | | | 3,756 | | | | 3,728 | | | | 4,085 | | | | 1 | |
| | | | | | | | | | | | | | | | | |
| Personnel expenses | | | 1,442 | | | | 1,287 | | | | 1,702 | | | | 12 | |
| | | | | | | | | | | | | | | | | |
| General and administrative expenses | | | 875 | | | | 857 | | | | 834 | | | | 2 | |
| | | | | | | | | | | | | | | | | |
| Services (to)/from other business divisions | | | (162 | ) | | | (370 | ) | | | (470 | ) | | | (56 | ) |
| | | | | | | | | | | | | | | | | |
| Depreciation and impairment of property and equipment | | | 143 | | | | 128 | | | | 136 | | | | 12 | |
| | | | | | | | | | | | | | | | | |
| Amortization and impairment of intangible assets | | | 0 | | | | 0 | | | | 0 | | | | | |
| | | | | | | | | | | | | | | | | |
| Total operating expenses2 | | | 2,298 | | | | 1,901 | | | | 2,201 | | | | 21 | |
| | | | | | | | | | | | | | | | | |
| Business division operating profit/(loss) before tax | | | 1,458 | | | | 1,827 | | | | 1,884 | | | | (20 | ) |
| | | | | | | | | | | | | | | | | |
| | | | |
| Key performance indicators3 | | | | | | | | | | | | | | | | |
| | | | | | | | | | | | | | | | | |
| Pre-tax profit growth (%) | | | (20.2 | ) | | | (3.0 | ) | | | 10.2 | | | | | |
| | | | | | | | | | | | | | | | | |
| Cost/income ratio (%) | | | 60.9 | | | | 50.6 | | | | 52.6 | | | | | |
| | | | | | | | | | | | | | | | | |
| Net interest margin (%) | | | 1.56 | | | | 1.60 | | | | 1.71 | | | | | |
| | | | | | | | | | | | | | | | | |
| Net new business volume growth (%) | | | 1.8 | | | | 4.9 | | | | 3.5 | | | | | |
| | | | | | | | | | | | | | | | | |
| Impaired loan portfolio as a % of total loan portfolio, gross (%)4 | | | 0.7 | | | | 0.7 | | | | 0.7 | | | | | |
| | | | | | | | | | | | | | | | | |
| | | | |
| Additional information | | | | | | | | | | | | | | | | |
| | | | | | | | | | | | | | | | | |
| Average attributed equity (CHF billion)5 | | | 4.1 | | | | 4.5 | | | | 5.0 | | | | (9 | ) |
| | | | | | | | | | | | | | | | | |
| Return on attributed equity (RoAE) (%) | | | 35.6 | | | | 40.6 | | | | 37.7 | | | | | |
| | | | | | | | | | | | | | | | | |
| Risk-weighted assets (phase-in, CHF billion)6 | | | 31.4 | | | | 31.9 | | | | | | | | (2 | ) |
| | | | | | | | | | | | | | | | | |
| Risk-weighted assets (fully applied, CHF billion)6 | | | 29.7 | | | | 30.2 | | | | | | | | (2 | ) |
| | | | | | | | | | | | | | | | | |
| Return on risk-weighted assets, gross (%)7 | | | 11.7 | | | | 13.8 | | | | | | | | | |
| | | | | | | | | | | | | | | | | |
| Swiss SRB leverage ratio denominator (phase-in, CHF billion)8 | | | 164.7 | | | | | | | | | | | | | |
| | | | | | | | | | | | | | | | | |
| Goodwill and intangible assets (CHF billion) | | | 0.0 | | | | 0.0 | | | | 0.0 | | | | | |
| | | | | | | | | | | | | | | | | |
| Business volume (CHF billion) | | | 540 | | | | 518 | | | | 468 | | | | 4 | |
| | | | | | | | | | | | | | | | | |
| Client assets (CHF billion) | | | 404 | | | | 381 | | | | 333 | | | | 6 | |
| | | | | | | | | | | | | | | | | |
| Loans, gross (CHF billion) | | | 136.5 | | | | 137.3 | | | | 135.3 | | | | (1 | ) |
| | | | | | | | | | | | | | | | | |
| Due to customers (CHF billion) | | | 133.2 | | | | 131.1 | | | | 117.9 | | | | 2 | |
| | | | | | | | | | | | | | | | | |
| Secured loan portfolio as a % of total loan portfolio, gross (%) | | | 93.1 | | | | 91.7 | | | | 90.9 | | | | | |
| | | | | | | | | | | | | | | | | |
| Personnel (full-time equivalents) | | | 9,463 | | | | 10,156 | | | | 11,430 | | | | (7 | ) |
| | | | | | | | | | | | | | | | | |
1 Comparative figures in this table may differ from those originally published in quarterly and annual reports due to adjustments following organizational changes and restatements due to retrospective adoption of new accounting standards. 2 Refer to “Note 32 Changes in organization” in the “Financial information” section of this report for information on restructuring charges. 3 For the definitions of our key performance indicators, refer to the “Measurement of performance” section of this report. 4 Refer to the “Risk management and control” section of this report for more information on impairment ratios. 5 Refer to the “Capital management” section of this report for more information on the equity attribution framework. 6 Based on the Basel III framework as applicable for Swiss systemically relevant banks (SRB). Numbers for 31 December 2012 are on a pro-forma basis. Refer to the “Capital management” section of this report for more information. 7 Based on Basel III risk-weighted assets (phase-in) for 2013. Based on Basel 2.5 risk-weighted assets for 2012. 8 The leverage ratio denominator is also referred to as “total adjusted exposure” and is calculated in accordance with Swiss SRB leverage ratio requirements. Data represent the average of the total adjusted exposure at the end of the three months preceding the end of the reporting period. Data as of 31 December 2012 are not available on a reporting segment level due to organizational changes. Refer to the “Capital management” section of this report for more information.
111
Financial and operating performance
Retail & Corporate
2013 compared with 2012
Results
Operating income
Total operating income increased by CHF 28 million to CHF 3,756 million.
Net interest income was CHF 2,144 million compared with CHF 2,186 million. The ongoing low interest rate environment continued to adversely affect the deposit margin. The resulting lower interest income was partly offset by pricing adjustments and substantial growth in average deposit volumes. Interest income from loans increased, reflecting slightly higher average volume and an improved margin. Furthermore, costs related to the multi-currency portfolio of unencumbered, high-quality, short-term assets managed centrally by Group Treasury decreased.
Net fee and commission income was CHF 1,203 million, almost unchanged from CHF 1,198 million, mainly due to higher custody fee income.
Net trading income increased to CHF 341 million from CHF 281 million, reflecting higher treasury-related income as well as higher client activity levels in 2013.
Other income was CHF 86 million, broadly unchanged from CHF 90 million in the prior year, and included a CHF 27 million gain related to the divestment of our participation in Euroclear Plc., almost entirely offset by lower income related to our participation in the SIX Group.
Credit loss expenses were CHF 18 million in 2013 compared with CHF 27 million in the prior year. 2013 included net specific loan loss allowances of CHF 113 million, reflecting a number of new workout cases that were individually reviewed, downgraded and impaired as well as adjustments on existing positions. This was largely offset by a net release of CHF 95 million of collective loan loss allowances based on the ongoing review of the portfolio, as well as the overall improved outlook for relevant industries. The prior year included net specific loan loss allowances of CHF 43 million, partly offset by a net decrease in collective loan loss allowances of CHF 16 million. The remaining balance of the collective loan loss allowances amounted to CHF 15 million as of 31 December 2013.
| | è | | Refer to “Note 1a) 11) Allowances and provisions for credit losses” in the “Financial information” section of this report for more information on collective loan loss allowances |
Operating expenses
Operating expenses increased to CHF 2,298 million from CHF 1,901 million, mainly as 2012 included a credit to personnel expenses of CHF 287 million related to changes to our Swiss pension
plan. Adjusted for this and restructuring charges of CHF 54 million in 2013 and CHF 3 million in the prior year, operating expenses increased by CHF 59 million to CHF 2,244 million, mainly as a result of CHF 45 million higher charges for provisions for litigation, regulatory and similar matters.
Personnel expenses increased by CHF 155 million to CHF 1,442 million, due to the aforementioned credit in 2012 related to changes to our Swiss pension plan. Adjusted for this item and restructuring charges, personnel expenses decreased by CHF 148 million to CHF 1,423 million, mainly due to the centralization of operations units in Corporate Center in July 2012. This centralization and subsequent reallocation of the operations units had the effect of reducing personnel expenses as well as general and administrative expenses, and decreasing net charges to other business divisions. Moreover, personnel expenses decreased as 2013 included a credit from the release of accruals for untaken vacation compared with a charge in 2012 when accruals for untaken vacation were increased. These decreases were partly offset by higher variable compensation expenses.
General and administrative expenses were CHF 875 million compared with CHF 857 million in 2012. Adjusted for restructuring charges, general and administrative expenses decreased by CHF 15 million to CHF 842 million, reflecting the abovementioned centralization of operations units. This was partly offset by CHF 45 million higher net charges for provisions for litigation, regulatory and similar matters. Moreover, costs rose as a result of increased expenses related to the refurbishment of our branch network and our multi-channel offering, as well as due to higher marketing expenses.
Net charges to other business divisions were CHF 162 million, a decrease from CHF 370 million in the prior year, primarily as a result of the abovementioned centralization of operations units in 2012.
Depreciation was CHF 143 million, an increase of CHF 15 million from the prior year, reflecting higher software depreciation expenses.
Cost/income ratio
The cost/income ratio was 60.9% compared with 50.6% in the prior year. On an adjusted basis excluding the credit related to changes to our Swiss pension plan in 2012 as well as restructuring charges, the cost/income ratio was 59.5% compared with 58.2% in the prior year and was within our target range of 50% to 60%.
Net interest margin
The net interest margin decreased 4 basis points to 156 basis points, reflecting the aforementioned reduction in net interest income on a slightly higher average loan volume. The net interest margin remained within the target range of 140 to 180 basis points.
112
|
Financial and operating performance |
|
|
Net new business volume growth
The growth rate for net new business volume was 1.8% compared with 4.9% in 2012. Our retail business recorded a net new business volume growth rate of 1.9% in 2013 compared with 3.3% in the prior year. Both our retail and corporate businesses recorded positive net new client assets. Net new loan inflows were slightly positive for retail clients and slightly negative for corporate clients, reflecting our strategy to grow our business in high-quality loans moderately and selectively. Net new business volume growth was within the target range of 1% to 4%.
Personnel
Retail & Corporate employed 9,463 personnel as of 31 December 2013, a decrease of 693 compared with 10,156 as of 31 December 2012, mainly reflecting changes to allocations of centralized shared services units’ personnel, which led to a decrease of approximately 500 personnel.
113
Financial and operating performance
Retail & Corporate
2012 compared with 2011
Results
Profit before tax decreased by CHF 57 million to CHF 1,827 million from CHF 1,884 million in the prior year. In 2012, personnel expenses benefited from a CHF 287 million credit related to changes to our Swiss pension plan. In 2011, there was a gain of CHF 289 million from the sale of our strategic investment portfolio. Adjusted for these items and restructuring charges of CHF 3 million in 2012 and CHF 32 million in 2011, profit before tax decreased by CHF 84 million to CHF 1,543 million, mainly as the prior year benefited from CHF 68 million of accrued interest from the abovementioned strategic investment portfolio sold in the third quarter of 2011.
Operating income
Total operating income decreased by CHF 357 million to CHF 3,728 million, mainly due to the abovementioned gain from the sale of our strategic investment portfolio in 2011. Adjusted for this gain, operating income decreased by CHF 68 million to CHF 3,728 million from CHF 3,796 million.
Net interest income decreased by CHF 142 million to CHF 2,186 million, as the prior year included interest income of CHF 68 million related to our strategic investment portfolio. Net interest income was also negatively affected by increased costs related to the multi-currency portfolio of unencumbered, high-quality, short-term assets managed centrally by Group Treasury and lower allocations related to investment proceeds from the firm’s equity. The loan margin was stable, but the historically low interest rate environment continued to negatively affect the deposit margin. This was partly offset by growth in average deposit and, to a lesser extent, loan volumes, as well as a number of pricing adjustments.
Net fee and commission income was CHF 1,198 million, an increase of CHF 23 million from CHF 1,175 million in 2011, reflecting strong corporate finance activity related to our continued focus on our fee-based advisory offering.
Net trading income decreased to CHF 281 million from CHF 333 million due to lower treasury-related income and lower valuation income in 2012 related to credit default swaps to hedge certain loans.
Other income decreased to CHF 90 million from CHF 350 million, reflecting the abovementioned gain of CHF 289 million from the sale of our strategic investment portfolio in 2011, partly offset by higher income in 2012 related to our participation in the SIX Group.
Credit loss expenses were CHF 27 million in 2012 compared with CHF 101 million in 2011, mainly reflecting a CHF 16 million decrease in 2012 and an increase of CHF 82 million in 2011 in collective loan loss allowances.
| | è | | Refer to “Note 1a) 11) Allowances and provisions for credit losses” in the “Financial information” section of this report for more information on collective loan loss allowances |
Operating expenses
Total operating expenses were CHF 1,901 million compared with CHF 2,201 million, mainly reflecting the CHF 287 million credit related to changes to our Swiss pension plan in 2012. Excluding this credit and restructuring charges, adjusted operating expenses increased by CHF 16 million to CHF 2,185 million.
Personnel expenses decreased to CHF 1,287 million from CHF 1,702 million. Excluding the abovementioned credit and restructuring charges, adjusted personnel expenses were CHF 1,571 million, a decrease of CHF 102 million from CHF 1,673 million in 2011 due to the centralization of operations units in 2012, which decreased personnel expenses by CHF 176 million. As Retail & Corporate previously provided significant services to other business divisions, this centralization and subsequent reallocation of the operations units had the effect of reducing personnel expenses as well as general and administrative expenses, and decreasing net charges to other business divisions. This was partly offset by higher personnel expenses resulting from other business transfers.
General and administrative expenses were CHF 857 million compared with CHF 834 million in 2011, reflecting higher net charges for provisions for litigation, regulatory and similar matters as well as increased marketing expenses related to our 150th anniversary in 2012. The abovementioned centralization of operations units led to a decrease in costs, which was partly offset by the effects of other business transfers.
Net charges to other business divisions were CHF 370 million, a decrease compared with CHF 470 million in the prior year, primarily as a result of the abovementioned centralization of operations units in 2012, which reduced net charges for services provided to other business divisions. This was partly offset by the effects of other business transfers.
Depreciation was CHF 128 million compared with CHF 136 million, reflecting a change in the depreciation period of certain information technology equipment.
Cost/income ratio
The cost/income ratio improved to 50.6% from 52.6%, reflecting lower expenses partly offset by lower income. On an adjusted basis excluding the credit related to changes to our Swiss pension plan in 2012, the gain from the sale of our strategic investment
114
|
Financial and operating performance |
|
|
portfolio as well as restructuring charges, the cost/income ratio was 58.2% compared with 55.7% and was within of our target range of 50% to 60%.
Net interest margin
The net interest margin decreased 11 basis points to 160 basis points, reflecting lower interest income as detailed above and a slightly higher average loan volume. The net interest margin remained within the target range of 140 to 180 basis points.
Net new business volume growth
The growth rate for net new business volume was 4.9% compared with 3.5% in the prior year. Both our retail and corporate
businesses recorded strong net inflows, reflecting high net new client assets. Net new loan inflows were also slightly positive, in line with our strategy to grow our business selectively in high-quality loans. Net new business volume growth exceeded the target range of 1% to 4%.
Personnel
Retail & Corporate employed 10,156 personnel as of 31 December 2012 compared with 11,430 as of 31 December 2011, mainly reflecting the aforementioned centralization and subsequent reallocation of operations units personnel. We continued to adapt our cost base to the challenging business environment.
115
Financial and operating performance
Global Asset Management
Global Asset Management
Profit before tax was CHF 576 million in 2013 compared with CHF 569 million in 2012. Adjusted for a gain on the sale of our Canadian domestic business in 2013, restructuring charges in 2013 and 2012 as well as credits related to changes to pension and benefit plans in 2012, profit before tax was CHF 585 million compared with CHF 543 million in the prior year. This increase was due to higher performance fees coupled with lower operating expenses. Excluding money market flows, net new money outflows were CHF 4.8 billion compared with CHF 5.9 billion in the prior year.
Business division reporting1
| | | | | | | | | | | | | | | | |
| | As of or for the year ended | | | % change from | |
| CHF million, except where indicated | | 31.12.13 | | | 31.12.12 | | | 31.12.11 | | | 31.12.12 | |
| Net management fees2 | | | 1,739 | | | | 1,721 | | | | 1,704 | | | | 1 | |
| | | | | | | | | | | | | | | | | |
| Performance fees | | | 196 | | | | 162 | | | | 99 | | | | 21 | |
| | | | | | | | | | | | | | | | | |
| Total operating income | | | 1,935 | | | | 1,883 | | | | 1,803 | | | | 3 | |
| | | | | | | | | | | | | | | | | |
| Personnel expenses | | | 873 | | | | 885 | | | | 954 | | | | (1 | ) |
| | | | | | | | | | | | | | | | | |
| General and administrative expenses | | | 448 | | | | 395 | | | | 375 | | | | 13 | |
| | | | | | | | | | | | | | | | | |
| Services (to)/from other business divisions | | | (17 | ) | | | (10 | ) | | | (1 | ) | | | 70 | |
| | | | | | | | | | | | | | | | | |
| Depreciation and impairment of property and equipment | | | 47 | | | | 37 | | | | 38 | | | | 27 | |
| | | | | | | | | | | | | | | | | |
| Amortization and impairment of intangible assets | | | 8 | | | | 8 | | | | 8 | | | | 0 | |
| | | | | | | | | | | | | | | | | |
| Total operating expenses3 | | | 1,359 | | | | 1,314 | | | | 1,373 | | | | 3 | |
| | | | | | | | | | | | | | | | | |
| Business division operating profit/(loss) before tax | | | 576 | | | | 569 | | | | 430 | | | | 1 | |
| | | | | | | | | | | | | | | | | |
| | | | |
| Key performance indicators4 | | | | | | | | | | | | | | | | |
| | | | | | | | | | | | | | | | | |
| Pre-tax profit growth (%) | | | 1.2 | | | | 32.3 | | | | (16.5 | ) | | | | |
| | | | | | | | | | | | | | | | | |
| Cost/income ratio (%) | | | 70.2 | | | | 69.8 | | | | 76.2 | | | | | |
| | | | | | | | | | | | | | | | | |
| Net new money growth (%)5 | | | (3.4 | ) | | | (2.3 | ) | | | 0.8 | | | | | |
| | | | | | | | | | | | | | | | | |
| | | | |
| Information by business line | | | | | | | | | | | | | | | | |
| | | | | | | | | | | | | | | | | |
| | | | |
| Operating Income | | | | | | | | | | | | | | | | |
| | | | | | | | | | | | | | | | | |
| Traditional investments | | | 1,144 | | | | 1,119 | | | | 1,097 | | | | 2 | |
| | | | | | | | | | | | | | | | | |
| O’Connor and A&Q | | | 266 | | | | 268 | | | | 253 | | | | (1 | ) |
| | | | | | | | | | | | | | | | | |
| Global real estate | | | 317 | | | | 293 | | | | 263 | | | | 8 | |
| | | | | | | | | | | | | | | | | |
| Infrastructure and private equity | | | 38 | | | | 35 | | | | 24 | | | | 9 | |
| | | | | | | | | | | | | | | | | |
| Fund services | | | 171 | | | | 169 | | | | 165 | | | | 1 | |
| | | | | | | | | | | | | | | | | |
| Total operating income | | | 1,935 | | | | 1,883 | | | | 1,803 | | | | 3 | |
| | | | | | | | | | | | | | | | | |
| | | | |
| Gross margin on invested assets (bps) | | | | | | | | | | | | | | | | |
| | | | | | | | | | | | | | | | | |
| Traditional investments | | | 22 | | | | 23 | | | | 23 | | | | (4 | ) |
| | | | | | | | | | | | | | | | | |
| O’Connor and A&Q | | | 95 | | | | 91 | | | | 76 | | | | 4 | |
| | | | | | | | | | | | | | | | | |
| Global real estate | | | 76 | | | | 74 | | | | 72 | | | | 3 | |
| | | | | | | | | | | | | | | | | |
| Infrastructure and private equity | | | 48 | | | | 44 | | | | 83 | | | | 9 | |
| | | | | | | | | | | | | | | | | |
| Total gross margin | | | 33 | | | | 33 | | | | 33 | | | | 0 | |
| | | | | | | | | | | | | | | | | |
1 Comparative figures in this table may differ from those originally published in quarterly and annual reports due to adjustments following organizational changes and restatements due to retrospective adoption of new accounting standards. 2 Net management fees include transaction fees, fund administration revenues (including interest and trading income from lending business and foreign exchange hedging as part of the fund services offering), gains or losses from seed money and co-investments, funding costs and other items that are not performance fees. 3 Refer to “Note 32 Changes in organization” in the “Financial information” section of this report for information on restructuring charges. 4 For the definitions of our key performance indicators, refer to the “Measurement of performance” section of this report. 5 Net new money excludes interest and dividend income.
116
|
Financial and operating performance |
|
|
Business division reporting1 (continued)
| | | | | | | | | | | | | | | | |
| | As of or for the year ended | | | % change from | |
| CHF million, except where indicated | | 31.12.13 | | | 31.12.12 | | | 31.12.11 | | | 31.12.12 | |
| | | | |
| Net new money (CHF billion)2 | | | | | | | | | | | | | | | | |
| | | | | | | | | | | | | | | | | |
| Traditional investments | | | (18.5 | ) | | | (11.6 | ) | | | 0.0 | | | | | |
| | | | | | | | | | | | | | | | | |
| O’Connor and A&Q | | | (2.5 | ) | | | (2.7 | ) | | | (0.8 | ) | | | | |
| | | | | | | | | | | | | | | | | |
| Global real estate | | | 1.2 | | | | 1.3 | | | | 1.6 | | | | | |
| | | | | | | | | | | | | | | | | |
| Infrastructure and private equity | | | 0.0 | | | | (0.2 | ) | | | 3.5 | | | | | |
| | | | | | | | | | | | | | | | | |
| Total net new money | | | (19.9 | ) | | | (13.3 | ) | | | 4.3 | | | | | |
| | | | | | | | | | | | | | | | | |
Net new money excluding money market flows | | | (4.8 | ) | | | (5.9 | ) | | | 9.0 | | | | | |
| | | | | | | | | | | | | | | | | |
of which: from third parties | | | 0.7 | | | | (0.6 | ) | | | 12.2 | | | | | |
| | | | | | | | | | | | | | | | | |
of which: from UBS’s wealth management businesses | | | (5.5 | ) | | | (5.2 | ) | | | (3.1 | ) | | | | |
| | | | | | | | | | | | | | | | | |
Money market flows | | | (15.1 | ) | | | (7.4 | ) | | | (4.7 | ) | | | | |
| | | | | | | | | | | | | | | | | |
of which: from third parties | | | (1.5 | ) | | | 0.9 | | | | 0.2 | | | | | |
| | | | | | | | | | | | | | | | | |
of which: from UBS’s wealth management businesses | | | (13.6 | ) | | | (8.3 | ) | | | (5.0 | ) | | | | |
| | | | | | | | | | | | | | | | | |
| | | | |
| Invested assets (CHF billion) | | | | | | | | | | | | | | | | |
| | | | | | | | | | | | | | | | | |
| Traditional investments | | | 506 | | | | 504 | | | | 497 | | | | 0 | |
| | | | | | | | | | | | | | | | | |
of which: money market funds | | | 65 | | | | 83 | | | | 92 | | | | (22 | ) |
| | | | | | | | | | | | | | | | | |
| O’Connor and A&Q | | | 27 | | | | 28 | | | | 31 | | | | (4 | ) |
| | | | | | | | | | | | | | | | | |
| Global real estate | | | 42 | | | | 40 | | | | 38 | | | | 5 | |
| | | | | | | | | | | | | | | | | |
| Infrastructure and private equity | | | 8 | | | | 8 | | | | 8 | | | | 0 | |
| | | | | | | | | | | | | | | | | |
| Total invested assets | | | 583 | | | | 581 | | | | 574 | | | | 0 | |
| | | | | | | | | | | | | | | | | |
| | | | |
| Assets under administration by fund services | | | | | | | | | | | | | | | | |
| | | | | | | | | | | | | | | | | |
| Assets under administration (CHF billion)3 | | | 432 | | | | 410 | | | | 375 | | | | 5 | |
| | | | | | | | | | | | | | | | | |
| Net new assets under administration (CHF billion)4 | | | 3.8 | | | | 7.7 | | | | (5.5 | ) | | | | |
| | | | | | | | | | | | | | | | | |
| Gross margin on assets under administration (bps) | | | 4 | | | | 4 | | | | 4 | | | | 0 | |
| | | | | | | | | | | | | | | | | |
| | | | |
| Additional information | | | | | | | | | | | | | | | | |
| | | | | | | | | | | | | | | | | |
| Average attributed equity (CHF billion)5 | | | 1.8 | | | | 2.2 | | | | 2.5 | | | | (18 | ) |
| | | | | | | | | | | | | | | | | |
| Return on attributed equity (RoAE) (%) | | | 32.0 | | | | 25.9 | | | | 17.2 | | | | | |
| | | | | | | | | | | | | | | | | |
| Risk-weighted assets (phase-in, CHF billion)6 | | | 3.8 | | | | 3.7 | | | | | | | | 3 | |
| | | | | | | | | | | | | | | | | |
| Risk-weighted assets (fully applied, CHF billion)6 | | | 3.7 | | | | 3.6 | | | | | | | | 3 | |
| | | | | | | | | | | | | | | | | |
| Return on risk-weighted assets, gross (%)7 | | | 51.1 | | | | 54.4 | | | | | | | | | |
| | | | | | | | | | | | | | | | | |
| Swiss SRB leverage ratio denominator (phase-in, CHF billion)8 | | | 14.0 | | | | | | | | | | | | | |
| | | | | | | | | | | | | | | | | |
| Goodwill and intangible assets (CHF billion) | | | 1.4 | | | | 1.5 | | | | 1.5 | | | | (7 | ) |
| | | | | | | | | | | | | | | | | |
| Personnel (full-time equivalents) | | | 3,729 | | | | 3,781 | | | | 3,750 | | | | (1 | ) |
| | | | | | | | | | | | | | | | | |
1 Comparative figures in this table may differ from those originally published in quarterly and annual reports due to adjustments following organizational changes and restatements due to retrospective adoption of new accounting standards. 2 Net new money excludes interest and dividend income. 3 This includes UBS and third-party fund assets, for which the fund services unit provides professional services, including fund set-up, accounting and reporting for traditional investment funds and alternative funds. 4 Inflows of assets under administration from new and existing funds less outflows from existing funds or fund exits. 5 Refer to the “Capital management” section of this report for more information on the equity attribution framework. 6 Based on the Basel III framework as applicable for Swiss systemically relevant banks (SRB). Numbers for 31 December 2012 are on a pro-forma basis. Refer to the “Capital management” section of this report for more information. 7 Based on Basel III risk-weighted assets (phase-in) for 2013. Based on Basel 2.5 risk-weighted assets for 2012. 8 The leverage ratio denominator is also referred to as “total adjusted exposure” and is calculated in accordance with Swiss SRB leverage ratio requirements. Data represent the average of the total adjusted exposure at the end of the three months preceding the end of the reporting period. Data as of 31 December 2012 are not available on a reporting segment level due to organizational changes. Refer to the “Capital management” section of this report for more information.
117
Financial and operating performance
Global Asset Management
2013 compared with 2012
Results
Operating income
Total operating income was CHF 1,935 million compared with CHF 1,883 million in 2012. Performance fees were higher at CHF 196 million compared with CHF 162 million, mainly due to strong investment performance in O’Connor and A&Q. Net management fees included a gain of CHF 34 million on the sale of our Canadian domestic business. Excluding this gain, net management fees were CHF 16 million lower, as lower fees in O’Connor and A&Q more than offset higher fees in global real estate.
Operating expenses
Total operating expenses were CHF 1,359 million in 2013 compared with CHF 1,314 million in 2012. Adjusted for restructuring charges of CHF 43 million in 2013 and CHF 20 million in 2012, as well as credits of CHF 30 million and CHF 16 million in 2012 related to changes to our Swiss pension plan and our retiree benefit plans in the US respectively, operating expenses were lower at CHF 1,316 million compared with CHF 1,340 million.
Personnel expenses were CHF 873 million compared with CHF 885 million. Adjusted for restructuring charges and the abovementioned credits related to our Swiss pension plan and US retiree benefit plans, personnel expenses were lower at CHF 863 million compared with CHF 911 million, mainly due to lower variable compensation expenses.
General and administrative expenses were CHF 448 million in 2013 compared with CHF 395 million. Adjusted for restructuring charges of CHF 26 million in 2013, general and administrative expenses were CHF 422 million compared with CHF 395 million. This increase was mainly due to higher professional fees, higher ETF-related index licensing fees, and higher fund promotion activity. Restructuring charges in 2013 included CHF 19 million real estate-related provisions for onerous lease contracts as we rationalized our office space in some principal locations.
Depreciation and impairment of property and equipment increased to CHF 47 million from CHF 37 million in the prior year, primarily due to asset impairments related to the abovementioned office space rationalization and higher depreciation of software and information technology equipment.
Cost/income ratio
The cost/income ratio was 70.2% compared with 69.8% in the prior year. Adjusted for restructuring charges, the gain on sale of our Canadian domestic business and credits related to our Swiss pension plan and US retiree benefit plans, the cost/income ratio improved to 69.2% from 71.2% and was within our target range of 60% to 70%.
Net new money
Excluding money market flows, net new money inflows from third parties were CHF 0.7 billion compared with net outflows of CHF 0.6 billion in 2012. Net inflows, notably from clients serviced from Europe, Middle East and Africa and from Switzerland, were partly offset by net outflows from clients serviced from the Americas. Excluding money market flows, net new money outflows from clients of UBS’s wealth management businesses were CHF 5.5 billion compared with CHF 5.2 billion in the prior year. Net outflows, mainly from clients serviced from Switzerland, were partly offset by net inflows from clients serviced from the Americas.
Money market net outflows from third parties were CHF 1.5 billion compared with net inflows of CHF 0.9 billion in the prior year and were mainly from clients serviced from the Americas. Money market net outflows from clients of UBS’s wealth management businesses were CHF 13.6 billion compared with CHF 8.3 billion in the prior year. In both years, net outflows were primarily due to an ongoing initiative by Wealth Management Americas to increase deposit account balances in UBS banking entities. This led to CHF 8.3 billion in outflows from money market funds managed by Global Asset Management in 2013 and CHF 6.2 billion in 2012.
Total net new money outflows were CHF 19.9 billion compared with CHF 13.3 billion in the prior year. The net new money growth rate was negative 3.4% compared with negative 2.3%. Our target net new money growth rate range is 3% to 5%.
Invested assets
Invested assets were CHF 583 billion as of 31 December 2013 compared with CHF 581 billion as of 31 December 2012. Net new money outflows, combined with negative currency translation effects of CHF 15 billion and a reduction of CHF 7 billion related to the aforementioned sale of our Canadian domestic business, were more than offset by positive market performance of CHF 44 billion.
As of 31 December 2013, CHF 65 billion, or 11%, of invested assets were money market assets and CHF 166 billion, or 28%, were in indexed strategies. On a regional basis, 34% of invested assets related to clients serviced from Switzerland, 24% from the Americas, 22% from Europe, Middle East and Africa, and 20% from Asia Pacific.
Gross margin on invested assets
The gross margin of 33 basis points was in line with 2012 and within our target range of 32 to 38 basis points.
Results by business line
Traditional investments
Operating income was CHF 1,144 million compared with CHF 1,119 million in 2012. Excluding the abovementioned gain on sale of our Canadian domestic business, net management fees were in line with the prior year, while performance fees were lower.
118
|
Financial and operating performance |
|
|
The gross margin was 22 basis points compared with 23 basis points, reflecting lower performance fees.
Net new money outflows were CHF 18.5 billion compared with CHF 11.6 billion in the prior year. Excluding money market flows, net new money outflows were CHF 3.5 billion compared with CHF 4.3 billion. Equities net inflows, notably to indexed strategies, were CHF 2.6 billion compared with net outflows of CHF 1.3 billion. Fixed income net outflows were CHF 6.0 billion compared with net inflows of CHF 2.4 billion. Multi-asset net outflows (which included flows related to alternative investments not managed by the O’Connor and A&Q, global real estate or infrastructure and private equity investment areas) were CHF 0.1 billion compared with CHF 5.4 billion.
Invested assets were CHF 506 billion as of 31 December 2013 compared with CHF 504 billion as of 31 December 2012. By mandate type, CHF 196 billion of invested assets related to equities, CHF 135 billion to fixed income, CHF 65 billion to money markets and CHF 109 billion to multi-asset mandates (including CHF 5 billion of alternative investments not managed by the O’Connor and A&Q, global real estate or infrastructure and private equity investment areas).
O’Connor and A&Q
During 2013, the management of the former alternative and quantitative investments business line was split into its two constituent parts – O’Connor, the single-manager hedge funds business, and A&Q hedge fund solutions (A&Q), the multi-manager hedge funds business. The two businesses continue to be reported together as O’Connor and A&Q.
Operating income was CHF 266 million compared with CHF 268 million in the prior year. Higher performance fees as a result of strong investment performance, in both A&Q multi-manager funds and O’Connor single-manager funds, were offset by lower net management fees as a result of net new money outflows.
The gross margin increased to 95 basis points from 91 basis points due to higher performance fees.
Net new money outflows were CHF 2.5 billion compared with CHF 2.7 billion in the prior year.
Invested assets were CHF 27 billion as of 31 December 2013 compared with CHF 28 billion as of 31 December 2012.
Global real estate
Operating income was CHF 317 million compared with CHF 293 million, due to higher net management and performance fees. The gross margin increased to 76 basis points compared with 74 basis points in 2012, due to higher operating income. Net new money inflows were CHF 1.2 billion compared with CHF 1.3 billion in 2012. Invested assets were CHF 42 billion as of 31 December 2013 compared with CHF 40 billion as of 31 December 2012.
Infrastructure and private equity
Operating income was CHF 38 million compared with CHF 35 million, with the increase reflecting higher net management fees. The gross margin was 48 basis points compared with 44 basis points. Net new money flows were zero compared with net outflows of CHF 0.2 billion in the prior year. Invested assets were CHF 8 billion as of 31 December 2013, in line with the prior year-end.
Fund services
Operating income was CHF 171 million compared with CHF 169 million, due to higher administration fees resulting from higher average assets under administration. The gross margin on assets under administration was 4 basis points, in line with the prior year. Net new assets under administration inflows were CHF 3.8 billion compared with CHF 7.7 billion in the prior year. Total assets under administration increased to CHF 432 billion as of 31 December 2013 from CHF 410 billion as of 31 December 2012, mainly due to positive market performance and net new assets under administration inflows.
119
Financial and operating performance
Global Asset Management
Personnel
Global Asset Management employed 3,729 personnel as of 31 December 2013 compared with 3,781 as of 31 December 2012, a net decrease of 52 personnel. The decrease was primarily due to cost reduction programs in centralized support functions, and a net reduction in O’Connor and A&Q, partly offset by headcount increases in fund services and global real estate.
Investment performance
A majority of our active equities strategies performed well versus their benchmarks in 2013, as the equity market focus continued to be on company fundamentals. Across core and growth teams, the performance of global, US and other developed market single-country strategies was generally strong versus benchmarks and ahead of peer averages. Performance was similarly strong in European concentrated alpha strategies, but core European strategies underperformed benchmarks and peers due to generally cautious positioning in favor of quality stocks. Core Asian and emerging markets strategies also underperformed, largely as a result of portfolio positioning in the financial sector which was adversely affected by market reaction to the US Federal Reserve’s tapering announcements. Nevertheless, other Asian and emerging markets strategies performed well, including growth, small cap and China equity. On a longer-term basis, most active strategies were close to or ahead of benchmarks over three and five years. Indexed strategies met their objectives in 2013 by closely tracking benchmarks.
2013 was a solid year for fixed income, even in the volatile markets resulting from major political and macroeconomic developments. A majority of key traditional bond strategies, such as Australian, Asian, Global, Swiss and US, outperformed their respective benchmarks. Higher alpha strategies, such as high yield and total return, also performed well. Liquidity and money market funds continued to achieve their capital preservation objectives.
In global investment solutions, most key multi-asset strategies managed versus benchmarks were close to those benchmarks for the year, with some outperforming and some underperforming. Security selection was the main detracting factor. Key mutual funds performed strongly versus peers with many in the top quartile. Global convertible strategies maintained their long-term track record but were marginally below benchmark for the year, having not held a small number of highly equity-sensitive benchmark bonds that performed strongly mid-year.
The O’Connor core single-manager hedge funds posted positive returns and outperformed many peers on an absolute and risk-adjusted basis. For A&Q’s funds of hedge funds, it was a strongly positive year for investment performance, both in absolute terms and versus industry benchmarks. Performance was particularly strong in the broad-based diversified funds that comprise the majority of A&Q’s assets. The highest-returning funds were in equity hedged-oriented mandates.
Global real estate’s pan-European direct strategies produced mixed results in 2013, while the German core logistics fund performed positively for the year. The UK core fund produced a positive absolute return but underperformed its benchmark, while the UK value-add strategy produced double-digit absolute returns. The Swiss composite outperformed its benchmark for the year. US real estate and farmland strategies delivered strong positive absolute returns in 2013. In Japan, both J-REITs underperformed their benchmarks yet produced very strong absolute returns for the year. Multi-manager strategies had positive absolute returns for the year and the Swiss real estate securities composite’s performance was positive relative to benchmark.
In infrastructure and private equity, the direct infrastructure portfolio continued to deliver above target cash distributions, while continuing to track longer-term total return targets. From private equity portfolios, it was a year of very high distributions for both institutional and private banking clients. Infrastructure multi-manager portfolios continued to be built out, with investors benefiting from increased distributions from portfolio companies.
120
|
Financial and operating performance |
|
|
2012 compared with 2011
Results
Profit before tax was CHF 569 million in 2012 compared with CHF 430 million in 2011. Performance fees were significantly higher, mainly in O’Connor and A&Q. Net management fees were also higher. Operating expenses were lower due to lower personnel costs, which resulted from lower variable compensation expenses and from credits related to changes to pension and benefit plans.
Operating income
Total operating income was CHF 1,883 million compared with CHF 1,803 million in 2011. Performance fees were significantly higher at CHF 162 million compared with CHF 99 million, mainly due to stronger investment performance in O’Connor and A&Q as well as in traditional investments. Net management fees were also higher, notably in global real estate.
Operating expenses
Total operating expenses were CHF 1,314 million in 2012 compared with CHF 1,373 million in 2011. Lower personnel costs were partly offset by higher general and administrative expenses. Restructuring charges were CHF 20 million in 2012, mainly associated with our cost reduction programs but also including CHF 3 million related to the acquisition of the ING Investment Management business in Australia, which was completed in late 2011 and fully integrated in early 2012. The prior year’s restructuring charges were CHF 26 million, of which CHF 7 million related to the same acquisition.
After adjusting for restructuring charges in 2012 and 2011, as well as credits of CHF 30 million and CHF 16 million in 2012 related to changes to our Swiss pension plan and our retiree benefit plans in the US respectively, operating expenses were marginally lower at CHF 1,340 million in 2012 compared with CHF 1,347 million in 2011.
Personnel expenses were CHF 885 million in 2012 compared with CHF 954 million in 2011. The decrease was mainly due to lower variable compensation expenses, partly offset by higher base salaries, and the abovementioned pension and benefit-related credits.
General and administrative expenses were CHF 395 million in 2012 compared with CHF 375 million in 2011. CHF 5 million of the increase related to a charge for provisions for litigation, regulatory and similar matters, and although 2012 included a reversal of previously recognized expenses related to a past business closure of CHF 5 million, there was also a similar reversal of CHF 9 million in 2011.
Net charges to other business divisions increased to CHF 10 million in 2012 from CHF 1 million in 2011. The increase was
mainly due to the centralization of operations units from the business divisions in the Corporate Center during the year, which also had the effect of increasing personnel costs by CHF 4 million and general and administrative expenses by CHF 2 million.
Cost/income ratio
The cost/income ratio was 69.8% in 2012 compared with 76.2% in 2011. On an adjusted basis, the cost/income ratio was 71.2% compared with 74.7%. Our target cost/income ratio range is 60% to 70%.
Net new money
Excluding money market flows, net new money outflows from third parties were CHF 0.6 billion in 2012 compared with net inflows of CHF 12.2 billion in 2011. Net inflows, notably from sovereign clients, were more than offset by net outflows, particularly from clients serviced from the Americas and Asia Pacific. Excluding money market flows, net new money outflows from clients of UBS’s wealth management businesses were CHF 5.2 billion compared with CHF 3.1 billion in 2011. The net outflows in 2012 were mainly from clients serviced from Switzerland and from O’Connor and A&Q.
Money market net inflows from third parties were CHF 0.9 billion compared with CHF 0.2 billion in 2011 and were mainly from sovereign clients. Money market net outflows from clients of UBS’s wealth management businesses were CHF 8.3 billion compared with CHF 5.0 billion in 2011. Net outflows in 2012 were mainly from clients serviced from the Americas, where an initiative by Wealth Management Americas to deposit client cash in UBS banking entities led to outflows of CHF 6.2 billion from money market funds managed by Global Asset Management, and from clients serviced from Switzerland.
Total net new money outflows were CHF 13.3 billion compared with net inflows of CHF 4.3 billion in the prior year. The net new money growth rate was negative 2.3% in 2012 compared with positive 0.8% in 2011. Our target net new money growth rate range is 3% to 5%.
Invested assets
Invested assets increased to CHF 581 billion as of 31 December 2012 from CHF 574 billion as of 31 December 2011, mainly due to positive market performance, partly offset by net new money outflows and negative currency translation effects. The sale, as agreed prior to the acquisition, of parts of the ING Investment Management business acquired in Australia in 2011 resulted in a net divestment of CHF 14 billion of invested assets in 2012.
Gross margin on invested assets
The gross margin of 33 basis points in 2012 was in line with 2011 and within our target range of 32 to 38 basis points.
121
Financial and operating performance
Global Asset Management
Results by business line
Traditional investments
Operating income increased to CHF 1,119 million in 2012 from CHF 1,097 million in 2011, mainly due to higher performance fees as a result of stronger investment performance.
The gross margin of 23 basis points was in line with the prior year.
Net new money outflows were CHF 11.6 billion compared with zero net flows in the prior year. Excluding money market flows, net new money outflows were CHF 4.3 billion compared with net inflows of CHF 4.7 billion. Equities net outflows were CHF 1.3 billion compared with net inflows of CHF 4.7 billion. Fixed income net inflows were CHF 2.4 billion compared with CHF 5.7 billion. Multi-asset net outflows (which included flows related to alternative investments not managed by the O’Connor and A&Q, global real estate or infrastructure and private equity investment areas) were CHF 5.4 billion compared with CHF 5.7 billion.
Invested assets were CHF 504 billion as of 31 December 2012 compared with CHF 497 billion as of 31 December 2011. By mandate type, CHF 163 billion of invested assets related to equities, CHF 154 billion to fixed income, CHF 83 billion to money markets and CHF 103 billion to multi-asset mandates (including CHF 7 billion of alternative investments not managed by the O’Connor and A&Q, global real estate or infrastructure and private equity investment areas).
O’Connor and A&Q
Operating income was CHF 268 million compared with CHF 253 million. Higher performance fees as a result of strong investment performance, notably in O’Connor single-manager funds, were partly offset by the full year impact of the transfer of the infrastructure and private equity funds of funds businesses from A&Q to infrastructure and private equity in mid-2011.
The gross margin increased from 76 basis points to 91 basis points, primarily due to the higher performance fees.
Net new money outflows were CHF 2.7 billion compared with CHF 0.8 billion in the prior year.
Invested assets were CHF 28 billion as of 31 December 2012 compared with CHF 31 billion as of 31 December 2011, mainly due to the net new money outflows.
Global real estate
Operating income was CHF 293 million compared with CHF 263 million, mainly due to higher net management and performance
fees. The gross margin increased to 74 basis points compared with 72 basis points in 2011, primarily due to higher performance fees. Net new money inflows were CHF 1.3 billion compared with CHF 1.6 billion in 2011. Invested assets were CHF 40 billion as of 31 December 2012 compared with CHF 38 billion as of 31 December 2011. The increase was mainly due to positive market performance.
Infrastructure and private equity
Operating income was CHF 35 million compared with CHF 24 million, with the increase reflecting the full year impact of the transfer of the infrastructure and private equity funds of funds businesses from A&Q in mid-2011. The gross margin decreased to 44 basis points from 83 basis points, largely due to the aforementioned business transfer and resulting changes in the business mix. Net new money outflows were CHF 0.2 billion compared with net inflows of CHF 3.5 billion in 2011. Invested assets were CHF 8 billion as of 31 December 2012, in line with the prior year-end.
Fund services
Operating income was CHF 169 million compared with CHF 165 million, mainly due to higher administration fees resulting from higher average assets under administration. The gross margin on assets under administration was 4 basis points, in line with the prior year. Net new assets under administration inflows were CHF 7.7 billion compared with net outflows of CHF 5.5 billion in the prior year. Total assets under administration increased to CHF 410 billion as of 31 December 2012 from CHF 375 billion as of 31 December 2011, mainly due to positive market performance and net new assets under administration inflows.
Personnel
Global Asset Management employed 3,781 personnel as of 31 December 2012 compared with 3,750 as of 31 December 2011, a net increase of 31 personnel. Increases in personnel resulted from an increased allocation from the Corporate Center following the centralization of operations units (approximately 50 personnel) and the transfer of the Jersey fund services business from Wealth Management to Global Asset Management. These increases were partly offset by our cost reduction programs, mainly in the business acquired from ING Investment Management in Australia.
122
|
Financial and operating performance |
|
|
Investment Bank
Profit before tax was CHF 2,300 million in 2013 compared with CHF 267 million in 2012. Adjusted for a gain from the sale of our remaining proprietary trading business in 2013 and restructuring charges in both years as well as prior year credits related to changes to our retiree benefit plans in the US and our Swiss pension plan, profit before tax was CHF 2,455 million compared with CHF 398 million. This increase was largely due to higher revenues in Investor Client Services and lower operating expenses. Fully applied risk-weighted assets (RWA) decreased by CHF 2 billion to CHF 62 billion.
Business division reporting1
| | | | | | | | | | | | | | | | |
| | As of or for the year ended | | | % change from | |
| CHF million, except where indicated | | 31.12.13 | | | 31.12.12 | | | 31.12.11 | | | 31.12.12 | |
| Corporate Client Solutions | | | 2,979 | | | | 2,826 | | | | 2,636 | | | | 5 | |
| | | | | | | | | | | | | | | | | |
| Advisory | | | 588 | | | | 638 | | | | 964 | | | | (8 | ) |
| | | | | | | | | | | | | | | | | |
| Equity Capital Markets | | | 1,142 | | | | 777 | | | | 574 | | | | 47 | |
| | | | | | | | | | | | | | | | | |
| Debt Capital Markets | | | 888 | | | | 1,009 | | | | 791 | | | | (12 | ) |
| | | | | | | | | | | | | | | | | |
| Financing Solutions | | | 599 | | | | 685 | | | | 600 | | | | (13 | ) |
| | | | | | | | | | | | | | | | | |
| Risk Management | | | (239 | ) | | | (283 | ) | | | (294 | ) | | | (16 | ) |
| | | | | | | | | | | | | | | | | |
| Investor Client Services | | | 5,619 | | | | 4,319 | | | | 4,177 | | | | 30 | |
| | | | | | | | | | | | | | | | | |
| Equities | | | 4,030 | | | | 2,532 | | | | 2,000 | | | | 59 | |
| | | | | | | | | | | | | | | | | |
| Foreign Exchange, Rates and Credit | | | 1,590 | | | | 1,787 | | | | 2,177 | | | | (11 | ) |
| | | | | | | | | | | | | | | | | |
| Income | | | 8,599 | | | | 7,144 | | | | 6,813 | | | | 20 | |
| | | | | | | | | | | | | | | | | |
| Credit loss (expense)/recovery | | | 2 | | | | 0 | | | | (10 | ) | | | | |
| | | | | | | | | | | | | | | | | |
| Total operating income | | | 8,601 | | | | 7,144 | | | | 6,802 | | | | 20 | |
| | | | | | | | | | | | | | | | | |
| Personnel expenses | | | 3,984 | | | | 4,539 | | | | 5,026 | | | | (12 | ) |
| | | | | | | | | | | | | | | | | |
| General and administrative expenses | | | 2,040 | | | | 2,312 | | | | 2,129 | | | | (12 | ) |
| | | | | | | | | | | | | | | | | |
| Services (to)/from other business divisions | | | 3 | | | | (202 | ) | | | (358 | ) | | | | |
| | | | | | | | | | | | | | | | | |
| Depreciation and impairment of property and equipment | | | 260 | | | | 214 | | | | 208 | | | | 21 | |
| | | | | | | | | | | | | | | | | |
| Amortization and impairment of intangible assets | | | 14 | | | | 13 | | | | 15 | | | | 8 | |
| | | | | | | | | | | | | | | | | |
| Total operating expenses2 | | | 6,300 | | | | 6,877 | | | | 7,019 | | | | (8 | ) |
| | | | | | | | | | | | | | | | | |
| Business division operating profit/(loss) before tax | | | 2,300 | | | | 267 | | | | (217 | ) | | | 761 | |
| | | | | | | | | | | | | | | | | |
| | | | |
| Key performance indicators3 | | | | | | | | | | | | | | | | |
| | | | | | | | | | | | | | | | | |
| Pre-tax profit growth (%)4 | | | 761.4 | | | | | | | | | | | | | |
| | | | | | | | | | | | | | | | | |
| Cost/income ratio (%) | | | 73.3 | | | | 96.3 | | | | 103.0 | | | | | |
| | | | | | | | | | | | | | | | | |
| Return on attributed equity (RoAE) (%) | | | 28.7 | | | | 2.4 | | | | | | | | | |
| | | | | | | | | | | | | | | | | |
| Return on assets, gross (%) | | | 3.3 | | | | 2.4 | | | | 1.8 | | | | | |
| | | | | | | | | | | | | | | | | |
| Average VaR (1-day, 95% confidence, 5 years of historical data)5 | | | 13 | | | | 30 | | | | 75 | | | | (57 | ) |
| | | | | | | | | | | | | | | | | |
1 Comparative figures in this table may differ from those originally published in quarterly and annual reports due to adjustments following organizational changes, restatements due to retrospective adoption of new accounting standards or due to a change to report own credit gains and losses as part of Corporate Center – Core Functions. 2 Refer to “Note 32 Changes in organization” in the “Financial information” section of this report for information on restructuring charges. 3 For the definitions of our key performance indicators, refer to the “Measurement of performance” section of this report. 4 Not meaningful and not included if either the reporting period or the comparison period is a loss period. 5 Average VaR has not been restated for periods prior to 2013.
123
Financial and operating performance
Investment Bank
Business division reporting1(continued)
| | | | | | | | | | | | | | | | |
| | As of or for the year ended | | | % change from | |
| CHF million, except where indicated | | 31.12.13 | | | 31.12.12 | | | 31.12.11 | | | 31.12.12 | |
| | | | |
| Additional information | | | | | | | | | | | | | | | | |
| | | | | | | | | | | | | | | | | |
| Total assets (CHF billion)2 | | | 241.1 | | | | 261.5 | | | | 403.5 | | | | (8 | ) |
| | | | | | | | | | | | | | | | | |
| Average attributed equity (CHF billion)3 | | | 8.0 | | | | 10.9 | | | | | | | | (27 | ) |
| | | | | | | | | | | | | | | | | |
| Risk-weighted assets (phase-in, CHF billion)4 | | | 62.6 | | | | 64.9 | | | | | | | | (4 | ) |
| | | | | | | | | | | | | | | | | |
| Risk-weighted assets (fully applied, CHF billion)4 | | | 62.3 | | | | 64.3 | | | | | | | | (3 | ) |
| | | | | | | | | | | | | | | | | |
| Return on risk-weighted assets, gross (%)5 | | | 13.2 | | | | 12.8 | | | | | | | | | |
| | | | | | | | | | | | | | | | | |
| Swiss SRB leverage ratio denominator (phase-in, CHF billion)6 | | | 275.3 | | | | | | | | | | | | | |
| | | | | | | | | | | | | | | | | |
| Goodwill and intangible assets (CHF billion) | | | 0.1 | | | | 0.1 | | | | 0.1 | | | | 0 | |
| | | | | | | | | | | | | | | | | |
| Compensation ratio (%) | | | 46.3 | | | | 63.5 | | | | 73.8 | | | | | |
| | | | | | | | | | | | | | | | | |
| Impaired loan portfolio as a % of total loan portfolio, gross (%)7 | | | 0.2 | | | | 0.3 | | | | 1.8 | | | | | |
| | | | | | | | | | | | | | | | | |
| Personnel (full-time equivalents) | | | 11,615 | | | | 13,595 | | | | 14,685 | | | | (15 | ) |
| | | | | | | | | | | | | | | | | |
1 Comparative figures in this table may differ from those originally published in quarterly and annual reports due to adjustments following organizational changes, restatements due to retrospective adoption of new accounting standards or due to a change to report own credit gains and losses as part of Corporate Center – Core Functions. 2 Based on third-party view, i.e., without intercompany balances. Refer to “Note 2 Segment reporting” in the “Financial information” section of this report for more information. 3 Refer to the “Capital management” section of this report for more information on the equity attribution framework. 4 Based on the Basel III framework as applicable for Swiss systemically relevant banks (SRB). Numbers for 31 December 2012 are on a pro-forma basis. Refer to the “Capital management” section of this report for more information. 5 Based on Basel III risk-weighted assets (phase-in) for 2013. Based on Basel 2.5 risk-weighted assets for 2012. 6 The leverage ratio denominator is also referred to as “total adjusted exposure” and is calculated in accordance with Swiss SRB leverage ratio requirements. Data represent the average of the total adjusted exposure at the end of the three months preceding the end of the reporting period. Data as of 31 December 2012 are not available on a reporting segment level due to organizational changes. Refer to the “Capital management” section of this report for more information. 7 Refer to the “Risk management and control” section of this report for more information on impairment ratios.
124
|
Financial and operating performance |
|
|
2013 compared with 2012
Results
Operating income
Total operating income increased 20% to CHF 8,601 million from CHF 7,144 million, mainly as a result of higher equities revenues within Investor Client Services. On an adjusted basis, excluding a gain from the sale of our remaining proprietary trading business in the first half of 2013, total operating income increased 20% to CHF 8,546 million from CHF 7,144 million. In US dollar terms, adjusted operating income increased 21%.
Operating expenses
Total operating expenses decreased 8% to CHF 6,300 million compared with CHF 6,877 million. Adjusted for restructuring charges of CHF 210 million in 2013 and CHF 273 million in 2012, a credit of CHF 91 million related to changes to our retiree benefit plans in the US and a credit of CHF 51 million related to changes to our Swiss pension plan in 2012, total operating expenses decreased 10% to CHF 6,090 million compared with CHF 6,746 million. This reduction was mainly due to our ongoing cost reduction programs and CHF 241 million lower charges for provisions for litigation, regulatory and similar matters. These decreases were partly offset by higher variable compensation expenses, reflecting improved business performance. In US dollar terms, adjusted operating expenses decreased 9%.
Personnel expenses declined to CHF 3,984 million from CHF 4,539 million. Adjusted for restructuring charges of CHF 9 million in 2013 and CHF 250 million in 2012, as well as the abovementioned credits related to changes to our retiree benefit plans in the US and our Swiss pension plan in 2012, personnel expenses decreased to CHF 3,975 million from CHF 4,431 million, largely due to savings resulting from our ongoing cost reduction programs, partly offset by higher variable compensation expenses, in line with improved business performance.
General and administrative expenses decreased to CHF 2,040 million from CHF 2,312 million. Adjusted for restructuring charges of CHF 177 million in 2013 and CHF 11 million in 2012, general and administrative expenses decreased to CHF 1,863 million from CHF 2,301 million, largely due to CHF 241 million lower charges for provisions for litigation, regulatory and similar matters and lower professional fees.
Cost/income ratio
The cost/income ratio improved to 73.3% from 96.3%. On an adjusted basis, the cost/income ratio improved to 71.3% from 94.4%, within our target range of 65% to 85%.
Risk-weighted assets
Fully applied RWA decreased to CHF 62 billion as of 31 December 2013 from CHF 64 billion as of 31 December 2012, primarily due to a reduction in credit risk RWA, partly offset by the incremental RWA resulting from the supplemental operational risk capital analysis mutually agreed to by UBS and FINMA. Year-end 2013 RWA were within our target of less than CHF 70 billion.
| | è | | Refer to the “Capital management” section of this report for more information |
Funded assets
Funded assets decreased to CHF 162 billion as of 31 December 2013 from CHF 185 billion as of 31 December 2012 and were within our target of less than CHF 200 billion. This decline was largely due to lower collateral trading assets across businesses as well as due to a reduction in trading portfolio assets in our foreign exchange, rates and credit business and a reduction in lending assets in Corporate Client Solutions.
| | è | | Refer to the “Balance sheet” section of this report for more information |
Return on attributed equity
Return on attributed equity for 2013 was 28.7%, and 30.6% on an adjusted basis, consistent with our target of more than 15%.
| | è | | Refer to “Equity attribution framework” in the “Capital management” section of this report for more information |
Operating income by business area
Corporate Client Solutions
Corporate Client Solutions revenues increased 5% to CHF 2,979 million from CHF 2,826 million, largely due to higher revenues in equity capital markets. In US dollar terms, revenues increased 6%.
Advisory revenues declined 8% to CHF 588 million from CHF 638 million, mainly as the market fee pool decreased 11%.
Equity capital markets revenues increased 47% to CHF 1,142 million from CHF 777 million. This increase was mainly due to a large private transaction recorded in the first half of 2013.
Debt capital markets revenues decreased 12% to CHF 888 million from CHF 1,009 million, largely due to a decline in investment grade revenues. Leveraged finance revenues were broadly in line with the prior year.
Financing solutions revenues decreased 13% to CHF 599 million compared with CHF 685 million, mainly due to a reduction in revenues in both the structured financing and real estate finance businesses.
Risk management revenues improved to negative CHF 239 million from negative CHF 283 million, mainly due to lower mark-to-market losses.
125
Financial and operating performance
Investment Bank
Investor Client Services
Investor Client Services revenues increased 30% to CHF 5,619 million from CHF 4,319 million, due to higher revenues in the equities businesses. In US dollar terms, revenues also increased 30%.
Equities
Equities revenues increased to CHF 4,030 million from CHF 2,532 million, as a result of higher revenues across all businesses and regions.
Cash revenues increased to CHF 1,374 million compared with CHF 879 million. Revenues increased due to higher commission income and an improvement in client trading revenues. In addition, 2012 included a loss of CHF 349 million related to the Facebook initial public offering.
Derivatives revenues increased to CHF 1,350 million from CHF 660 million, mainly as a result of higher revenues in Asia Pacific and Europe, Middle East and Africa. In addition, 2012 included negative adjustments related to the refinement of our own credit calculation methodology.
In financing services, formerly called prime services, revenues increased to CHF 1,199 million from CHF 1,036 million, as a result of higher trading revenues in equity finance and increased commissions in clearing and execution.
Other equities revenues increased to CHF 107 million from negative CHF 44 million. Adjusted for a gain from the sale of our former proprietary trading business in 2013, other equities revenues
increased to CHF 52 million from negative CHF 44 million. This improvement was mainly due to both higher revenues on equity investments prior to their transfer to Corporate Center – Non-core and Legacy Portfolio, and a gain related to the divestment of our participation in Euroclear Plc.
Foreign exchange, rates and credit
Foreign exchange, rates and credit revenues decreased to CHF 1,590 million from CHF 1,787 million, mainly due to lower rates and credit revenues.
Foreign exchange revenues declined slightly, primarily due to a decrease in revenues from the emerging market short-term interest rate business, partly offset by an increase in electronic trading revenues as volumes rose.
Rates and credit revenues declined, primarily due to weaker trading performance in the flow businesses. This was partly offset by negative debit valuation adjustments of CHF 18 million in 2013 compared with negative debit valuation adjustments of CHF 115 million in the prior year.
Personnel
The Investment Bank employed 11,615 personnel as of 31 December 2013, a decrease of 1,980 compared with 13,595 as of 31 December 2012, mainly as a result of our ongoing cost reduction programs.
126
|
Financial and operating performance |
|
|
2012 compared with 2011
Results
The Investment Bank recorded a profit before tax of CHF 267 million in 2012 compared with a loss before tax of CHF 217 million in 2011. Adjusted for restructuring charges as well as credits related to our retiree benefit plans in the US and our Swiss pension plan, profit before tax was CHF 398 million in 2012 compared with a loss before tax of CHF 15 million in 2011, which included a loss of CHF 1,849 million related to the unauthorized trading incident.
Operating income
Total operating income increased 5% to CHF 7,144 million in 2012 from CHF 6,802 million in 2011. Investor Client Services revenues, excluding the unauthorized trading incident, decreased significantly, also as 2012 included a loss of CHF 349 million related to the Facebook initial public offering. This decline in Investor Client Services revenues was partly offset by higher equity capital markets and debt capital markets revenues within Corporate Client Solutions.
Operating expenses
Total operating expenses decreased 2% to CHF 6,877 million in 2012 compared with CHF 7,019 million in 2011. Adjusted for restructuring charges of CHF 273 million in 2012 and CHF 202 million in 2011, a credit of CHF 91 million related to changes to our retiree benefit plans in the US and a credit of CHF 51 million related to changes to our Swiss pension plan in 2012, total operating expenses decreased 1% to CHF 6,746 million compared with CHF 6,817 million. This reduction was mainly due to lower personnel expenses, which were almost entirely offset by higher general and
administrative expenses and lower charges for services to other business divisions.
Personnel expenses declined to CHF 4,539 million from CHF 5,026 million. Adjusted for restructuring charges of CHF 250 million in 2012 and CHF 129 million in 2011 and the aforementioned credits related to changes to our retiree benefit plans in the US and our Swiss pension plan in 2012, personnel expenses decreased to CHF 4,431 million from CHF 4,897 million, largely due to lower variable compensation expenses.
General and administrative expenses increased to CHF 2,312 million from CHF 2,129 million. Adjusted for restructuring charges of CHF 11 million in 2012 and CHF 55 million in 2011, general and administrative expenses increased to CHF 2,301 million from CHF 2,074 million, largely due to increased charges for provisions for litigation, regulatory and similar matters and higher professional fees.
Cost/income ratio
The cost/income ratio improved to 96.3% from 103.0%. On an adjusted basis, the cost/income ratio improved to 94.4% from 100.1%.
Operating income by business area
Corporate Client Solutions
Corporate Client Solutions revenues increased 7% to CHF 2,826 million from CHF 2,636 million, largely due to higher revenues in equity capital markets and debt capital markets which more than offset lower advisory revenues. In US dollar terms, revenues increased 2%.
Advisory revenues declined 34% to CHF 638 million from CHF 964 million, as our market share declined against a 7% reduction in the fee pool in US dollar terms.
127
Financial and operating performance
Investment Bank
Equity capital markets revenues increased 35% to CHF 777 million from CHF 574 million, mainly as our market share improved against a 15% decline in the fee pool in US dollar terms. In addition, we increased our participation in private and structured transactions.
Debt capital markets revenues increased 28% to CHF 1,009 million from CHF 791 million, as our market share improved in both debt and leveraged capital markets, and the global fee pool increased 6% in US dollar terms.
Financing solutions revenues increased 14% to CHF 685 million compared with CHF 600 million, as revenues in 2011 were negatively affected by mark-to-market trading losses, mainly in the second half of the year, as trading conditions were challenging due to uncertainty surrounding the eurozone and the global economic outlook.
Risk management revenues improved to negative CHF 283 million from negative CHF 294 million, primarily due to a decrease in risk management premiums.
Investor Client Services
Investor Client Services revenues increased 3% to CHF 4,319 million from CHF 4,177 million, due to higher revenues in the equities businesses. In US dollar terms, revenues decreased 2%.
Equities
Equities revenues increased by 27% to CHF 2,532 million from CHF 2,000 million, mainly as 2011 included a loss of CHF 1,849 million related to the unauthorized trading incident.
Cash revenues decreased to CHF 879 million compared with CHF 1,441 million, due to lower commission revenues resulting from lower market activity levels as well as a CHF 349 million loss related to the Facebook initial public offering.
Derivatives revenues decreased to CHF 660 million from CHF 1,060 million. During the year, client activity levels were lower
across all regions, and trading revenues, particularly in Asia Pacific and Europe, Middle East and Africa, were affected by lower volatility levels.
In financing services revenues increased to CHF 1,036 million from negative CHF 680 million, mainly as the prior year included the loss resulting from the unauthorized trading incident. This was partly offset by lower revenues in 2012, primarily in the clearing business due to lower client activity levels.
Other equities revenues decreased to negative CHF 44 million from CHF 180 million, primarily reflecting a reduced contribution from proprietary trading as we continued to exit the business.
Foreign exchange, rates and credit
Foreign exchange, rates and credit revenues decreased 18% to CHF 1,787 million from CHF 2,177 million, mainly due to lower rates and credit revenues.
Foreign exchange revenues declined, mainly within foreign exchange spot and foreign exchange options as volatility decreased from the high levels seen in 2011 resulting from eurozone uncertainty. This decrease was partly offset by higher revenues from the emerging market short-term interest rate business, and electronic trading revenues as volumes rose.
Rates and credit revenues also declined, primarily due to increased negative debit valuation adjustments and lower revenues from flow businesses, partly offset by higher revenues from solutions businesses.
Personnel
The Investment Bank employed 13,595 personnel as of 31 December 2012, a decrease of 1,090 compared with 14,685 as of 31 December 2011, mainly as a result of our ongoing cost reduction programs.
128
|
Financial and operating performance |
|
|
Corporate Center
Corporate Center reporting – Total1
| | | | | | | | | | | | | | | | |
| | As of or for the year ended | | | % change from | |
| CHF million, except where indicated | | 31.12.13 | | | 31.12.12 | | | 31.12.11 | | | 31.12.12 | |
| Income excluding own credit | | | (380 | ) | | | 2,029 | | | | 681 | | | | | |
| | | | | | | | | | | | | | | | | |
| Own credit2 | | | (283 | ) | | | (2,202 | ) | | | 1,537 | | | | (87 | ) |
| | | | | | | | | | | | | | | | | |
| Credit loss (expense)/recovery3 | | | 3 | | | | (78 | ) | | | 22 | | | | | |
| | | | | | | | | | | | | | | | | |
| Total operating income | | | (660 | ) | | | (251 | ) | | | 2,240 | | | | 163 | |
| | | | | | | | | | | | | | | | | |
| Personnel expenses | | | 939 | | | | 910 | | | | 822 | | | | 3 | |
| | | | | | | | | | | | | | | | | |
| General and administrative expenses | | | 2,443 | | | | 2,837 | | | | 647 | | | | (14 | ) |
| | | | | | | | | | | | | | | | | |
| Services (to)/from other business divisions | | | 67 | | | | 355 | | | | 521 | | | | (81 | ) |
| | | | | | | | | | | | | | | | | |
| Depreciation and impairment of property and equipment | | | 55 | | | | 51 | | | | 117 | | | | 8 | |
| | | | | | | | | | | | | | | | | |
| Impairment of goodwill | | | 0 | | | | 3,030 | | | | 0 | | | | (100 | ) |
| | | | | | | | | | | | | | | | | |
| Amortization and impairment of intangible assets | | | 3 | | | | 28 | | | | 19 | | | | (89 | ) |
| | | | | | | | | | | | | | | | | |
| Total operating expenses4 | | | 3,507 | | | | 7,210 | | | | 2,126 | | | | (51 | ) |
| | | | | | | | | | | | | | | | | |
| Operating profit/(loss) before tax | | | (4,167 | ) | | | (7,461 | ) | | | 114 | | | | (44 | ) |
| | | | | | | | | | | | | | | | | |
| | | | |
| Additional information | | | | | | | | | | | | | | | | |
| | | | | | | | | | | | | | | | | |
| Average attributed equity (CHF billion)5 | | | 23.3 | | | | 23.1 | | | | | | | | 1 | |
| | | | | | | | | | | | | | | | | |
| Total assets (CHF billion)6 | | | 457.9 | | | | 691.5 | | | | 708.6 | | | | (34 | ) |
| | | | | | | | | | | | | | | | | |
| Risk-weighted assets (phase-in, CHF billion)7 | | | 84.9 | | | | 119.3 | | | | | | | | (29 | ) |
| | | | | | | | | | | | | | | | | |
| Risk-weighted assets (fully applied, CHF billion)7 | | | 84.2 | | | | 118.7 | | | | | | | | (29 | ) |
| | | | | | | | | | | | | | | | | |
| Swiss SRB leverage ratio denominator (phase-in, CHF billion)8 | | | 394.5 | | | | | | | | | | | | | |
| | | | | | | | | | | | | | | | | |
| Personnel before allocations (full-time equivalents) | | | 24,082 | | | | 25,892 | | | | 26,974 | | | | (7 | ) |
| | | | | | | | | | | | | | | | | |
| Allocations to business divisions (full-time equivalents) | | | (21,441 | ) | | | (23,100 | ) | | | (24,130 | ) | | | (7 | ) |
| | | | | | | | | | | | | | | | | |
| Personnel after allocations (full-time equivalents) | | | 2,640 | | | | 2,792 | | | | 2,845 | | | | (5 | ) |
| | | | | | | | | | | | | | | | | |
1 Comparative figures in this table may differ from those originally published in quarterly and annual reports due to adjustments following organizational changes, restatements due to retrospective adoption of new accounting standards or due to a change to report own credit gains and losses as part of Corporate Center – Core Functions. 2 Represents own credit changes on financial liabilities designated at fair value through profit or loss. The cumulative own credit loss for such debt held as of 31 December 2013 amounted to CHF 0.6 billion. This loss has increased the fair value of financial liabilities designated at fair value recognized on our balance sheet. Refer to “Note 24 Fair value measurement” in the “Financial information” section of this report for more information. 3 Includes credit loss (expense)/recovery on reclassified and acquired securities. 4 Refer to “Note 32 Changes in organization” in the “Financial information” section of this report for information on restructuring charges. 5 Refer to the “Capital management” section of this report for more information on the equity attribution framework. 6 Based on third-party view, i.e., without intercompany balances. Refer to “Note 2 Segment reporting” in the “Financial information” section of this report for more information. 7 Based on the Basel III framework as applicable for Swiss systemically relevant banks (SRB). Numbers for 31 December 2012 are on a pro-forma basis. Refer to the “Capital management” section of this report for more information. 8 The leverage ratio denominator is also referred to as “total adjusted exposure” and is calculated in accordance with Swiss SRB leverage ratio requirements. Data represent the average of the total adjusted exposure at the end of the three months preceding the end of the reporting period. Data as of 31 December 2012 are not available on a reporting segment level due to organizational changes. Refer to the “Capital management” section of this report for more information.
129
Financial and operating performance
Corporate Center
Corporate Center – Core Functions
Corporate Center – Core Functions recorded a loss before tax of CHF 1,854 million in 2013 compared with CHF 3,698 million in the prior year. The 2013 loss was mainly due to treasury income remaining in Corporate Center – Core Functions of negative CHF 902 million, an own credit loss of CHF 283 million and operating expenses remaining in Corporate Center – Core Functions of CHF 847 million. These negative effects were partly offset by gains on sales of real estate of CHF 288 million.
Corporate Center reporting – Core Functions1
| | | | | | | | | | | | | | | | |
| | As of or for the year ended | | | % change from | |
| CHF million, except where indicated | | 31.12.13 | | | 31.12.12 | | | 31.12.11 | | | 31.12.12 | |
| Treasury income remaining in Corporate Center – Core Functions | | | (902 | ) | | | 688 | | | | 386 | | | | | |
| | | | | | | | | | | | | | | | | |
| Own credit2 | | | (283 | ) | | | (2,202 | ) | | | 1,537 | | | | (87 | ) |
| | | | | | | | | | | | | | | | | |
| Other | | | 178 | | | | (175 | ) | | | 8 | | | | | |
| | | | | | | | | | | | | | | | | |
| Total operating income | | | (1,007 | ) | | | (1,689 | ) | | | 1,931 | | | | (40 | ) |
| | | | | | | | | | | | | | | | | |
| Personnel expenses | | | 424 | | | | 282 | | | | 116 | | | | 50 | |
| | | | | | | | | | | | | | | | | |
| General and administrative expenses | | | 422 | | | | 1,696 | | | | 161 | | | | (75 | ) |
| | | | | | | | | | | | | | | | | |
| Services (to)/from other business divisions | | | 1 | | | | 21 | | | | 19 | | | | (95 | ) |
| | | | | | | | | | | | | | | | | |
| Depreciation and impairment of property and equipment | | | 0 | | | | 9 | | | | 73 | | | | (100 | ) |
| | | | | | | | | | | | | | | | | |
| Amortization and impairment of intangible assets | | | 0 | | | | 0 | | | | 0 | | | | | |
| | | | | | | | | | | | | | | | | |
| Total operating expenses3 | | | 847 | | | | 2,008 | | | | 369 | | | | (58 | ) |
| | | | | | | | | | | | | | | | | |
| Operating profit/(loss) before tax | | | (1,854 | ) | | | (3,698 | ) | | | 1,562 | | | | (50 | ) |
| | | | | | | | | | | | | | | | | |
| | | | |
| Additional information | | | | | | | | | | | | | | | | |
| | | | | | | | | | | | | | | | | |
| Average attributed equity (CHF billion)4 | | | 12.5 | | | | 6.6 | | | | | | | | 89 | |
| | | | | | | | | | | | | | | | | |
| Total assets (CHF billion)5 | | | 247.4 | | | | 262.9 | | | | 183.8 | | | | (6 | ) |
| | | | | | | | | | | | | | | | | |
| Risk-weighted assets (phase-in, CHF billion)6 | | | 21.3 | | | | 16.7 | | | | | | | | 28 | |
| | | | | | | | | | | | | | | | | |
| Risk-weighted assets (fully applied, CHF billion)6 | | | 20.7 | | | | 16.2 | | | | | | | | 28 | |
| | | | | | | | | | | | | | | | | |
| Swiss SRB leverage ratio denominator (phase-in, CHF billion)7 | | | 234.5 | | | | | | | | | | | | | |
| | | | | | | | | | | | | | | | | |
| Personnel before allocations (full-time equivalents) | | | 23,860 | | | | 25,351 | | | | 26,374 | | | | (6 | ) |
| | | | | | | | | | | | | | | | | |
| Allocations to business divisions and CC – Non-core and Legacy Portfolio (full-time equivalents) | | | (22,804 | ) | | | (24,863 | ) | | | (25,969 | ) | | | (8 | ) |
| | | | | | | | | | | | | | | | | |
| Personnel after allocations (full-time equivalents) | | | 1,055 | | | | 488 | | | | 405 | | | | 116 | |
| | | | | | | | | | | | | | | | | |
|
| Corporate Center – Core Functions – expenses before service allocation to business divisions and CC – Non-core and Legacy Portfolio | |
| | | | | | | | | | | | | | | | | |
| Personnel expenses | | | 4,199 | | | | 4,110 | | | | 4,658 | | | | 2 | |
| | | | | | | | | | | | | | | | | |
| General and administrative expenses | | | 4,327 | | | | 5,302 | | | | 3,608 | | | | (18 | ) |
| | | | | | | | | | | | | | | | | |
| Depreciation and impairment of property and equipment | | | 761 | | | | 647 | | | | 731 | | | | 18 | |
| | | | | | | | | | | | | | | | | |
| Amortization and impairment of intangible assets | | | 4 | | | | 2 | | | | 0 | | | | 100 | |
| | | | | | | | | | | | | | | | | |
| Total operating expenses before service allocation to business divisions and CC – Non-core and Legacy Portfolio3 | | | 9,291 | | | | 10,060 | | | | 8,997 | | | | (8 | ) |
| | | | | | | | | | | | | | | | | |
| Net allocations to business divisions | | | (8,444 | ) | | | (8,052 | ) | | | (8,628 | ) | | | 5 | |
| | | | | | | | | | | | | | | | | |
| Total operating expenses3 | | | 847 | | | | 2,008 | | | | 369 | | | | (58 | ) |
| | | | | | | | | | | | | | | | | |
1 Comparative figures in this table may differ from those originally published in quarterly and annual reports due to adjustments following organizational changes, restatements due to retrospective adoption of new accounting standards or due to a change to report own credit gains and losses as part of Corporate Center – Core Functions. 2 Represents own credit changes on financial liabilities designated at fair value through profit or loss. The cumulative own credit loss for such debt held as of 31 December 2013 amounted to CHF 0.6 billion. This loss has increased the fair value of financial liabilities designated at fair value recognized on our balance sheet. Refer to “Note 24 Fair value measurement” in the “Financial information” section of this report for more information. 3 Refer to “Note 32 Changes in organization” in the “Financial information” section of this report for information on restructuring charges. 4 Refer to the “Capital management” section of this report for more information on the equity attribution framework. 5 Based on third-party view, i.e., without intercompany balances. Refer to “Note 2 Segment reporting” in the “Financial information” section of this report for more information. 6 Based on the Basel III framework as applicable for Swiss systemically relevant banks (SRB). Numbers for 31 December 2012 are on a pro-forma basis. Refer to the “Capital management” section of this report for more information. 7 The leverage ratio denominator is also referred to as “total adjusted exposure” and is calculated in accordance with Swiss SRB leverage ratio requirements. Data represent the average of the total adjusted exposure at the end of the three months preceding the end of the reporting period. Data as of 31 December 2012 are not available on a reporting segment level due to organizational changes. Refer to the “Capital management” section of this report for more information.
130
|
Financial and operating performance |
|
|
2013 compared with 2012
Results
Operating income
Total operating income was negative CHF 1,007 million in 2013. Treasury income remaining in Corporate Center – Core Functions of negative CHF 902 million and an own credit loss on financial liabilities designated at fair value of CHF 283 million were partly offset by income related to other items of CHF 178 million. Total operating income in the prior year was negative CHF 1,689 million.
| | è | | Refer to “Note 24 Fair value measurement” in the “Financial information” section of this report for more information on own credit |
Treasury income remaining in Corporate Center – Core Functions, after allocations to the business divisions, was negative CHF 902 million. This was mainly due to central funding costs of CHF 510 million, which were retained in Group Treasury, losses of CHF 222 million from cross-currency basis swaps which are held as economic hedges and net losses of CHF 194 million related to the buyback of debt in public tender offers. Furthermore, we recorded losses of CHF 153 million related to our macro cash flow hedge models. These negative effects were partly offset by trading gains of CHF 47 million on derivative instruments which are used to economically hedge financial investments available-for-sale.
Compared with the prior year, treasury income remaining in Corporate Center – Core Functions decreased to negative CHF 902 million from positive CHF 688 million. The 2012 result included gains of CHF 152 million related to our macro cash flow hedge models, as opposed to the abovementioned losses in 2013, and central funding costs retained in Group Treasury of CHF 268 million compared with CHF 510 million. Furthermore, 2013 included
the aforementioned losses from cross-currency basis swaps and net losses related to the buyback of debt as well as a decline in revenues to CHF 22 million from CHF 245 million in the repurchase agreement unit, which was transferred from the Investment Bank to Corporate Center – Core Functions in 2013 and for which prior period information was restated. Whereas restated results reflected no allocation of revenues from the repurchase agreement unit to the business divisions, from 2013 onwards revenues from this unit are allocated to the business divisions, mainly to Wealth Management. 2013 also included CHF 206 million lower realized gains on sales of financial investments held in the available-for-sale portfolio which was transferred from Wealth Management Americas to Group Treasury during 2013.
| | è | | Refer to the “Treasury management” section of this report for more information on funding costs |
We recorded an own credit loss on financial liabilities designated at fair value of CHF 283 million, primarily due to tightening of our funding spreads. The prior year included an own credit loss of CHF 2,202 million when our funding spreads tightened significantly.
Operating income excluding own credit and treasury income was CHF 178 million, largely due to gains on sales of real estate of CHF 288 million, partly offset by CHF 102 million in net funding costs related to the goodwill and intangible assets that arose from the PaineWebber acquisition which are retained in Corporate Center – Core Functions with effect from 1 January 2013. In 2012, income related to other items was negative CHF 175 million, mainly due to charges related to our multi-currency portfolio of unencumbered, high-quality, short-term assets managed centrally by Group Treasury and charges for certain provisions for litigation, regulatory and similar matters which were recorded within other income, partly offset by gains on sales of real estate of CHF 112 million.
131
Financial and operating performance
Corporate Center
Operating expenses before service allocations
On a gross basis, before service allocations to the business divisions and Corporate Center – Non-core and Legacy Portfolio, total operating expenses decreased by CHF 769 million to CHF 9,291 million, including net restructuring charges of CHF 707 million compared with CHF 37 million in the prior year. The prior year included the positive effects from changes to our Swiss pension plan and our retiree benefit plans in the US of CHF 276 million and CHF 16 million, respectively. Adjusted for these items, operating expenses before allocations to the business divisions and Non-core and Legacy Portfolio were CHF 8,584 million compared with CHF 10,315 million in the prior year. This decrease of CHF 1,731 million was mainly due to CHF 1,283 million lower charges for provisions for litigation, regulatory and similar matters, our ongoing cost reduction programs and lower marketing costs.
Personnel expenses increased by CHF 89 million to CHF 4,199 million. Adjusted for net restructuring charges of CHF 129 million compared with CHF 24 million in 2012, as well as the abovementioned positive effects from changes to our Swiss pension plan and our retiree benefit plans in the US, personnel expenses were CHF 4,070 million in 2013 compared with CHF 4,378 million in the prior year. This decrease of CHF 308 million was mainly due to further headcount reductions related to our ongoing cost reduction programs.
General and administrative expenses decreased by CHF 975 million to CHF 4,327 million. On an adjusted basis, excluding net restructuring charges of CHF 513 million in 2013 and restructuring releases of CHF 1 million in 2012, general and administrative expenses decreased by CHF 1,489 million, mainly due to CHF 1,283 million lower charges for provisions for litigation, regulatory and similar matters and lower marketing costs.
Depreciation and impairment of property and equipment increased to CHF 761 million from CHF 647 million, mainly due to real estate-related restructuring charges of CHF 65 million compared with CHF 14 million as well as higher amortization and an impairment of capitalized software.
The business divisions and Non-core and Legacy Portfolio were charged CHF 8,444 million for shared services costs, an increase of CHF 392 million, mainly related to higher restructuring charges, partly offset by lower cost allocations following reduced personnel expenses incurred.
Operating expenses after service allocations
Total operating expenses remaining after allocations to the business divisions and Non-core and Legacy Portfolio decreased to CHF 847 million from CHF 2,008 million. This decrease of CHF 1,161 million was mainly due to CHF 1,283 million lower charges for provisions for litigation, regulatory and similar matters.
Operating expenses remaining in Corporate Center – Core Functions are related to Group governance functions and other corporate activities.
Risk-weighted assets
Fully applied risk-weighted assets (RWA) were CHF 21 billion as of 31 December 2013, CHF 5 billion higher than at the end of the prior year, mainly due to incremental RWA resulting from the supplemental operational risk capital analysis mutually agreed to by UBS and FINMA.
| | è | | Refer to the “Capital management” section of this report for more information |
Personnel
As of 31 December 2013, Corporate Center – Core Functions employed 23,860 personnel compared with 25,351 as of 31 December 2012. This decrease of 1,491 personnel was mainly related to our ongoing cost reduction programs. As of 31 December 2013, 22,804 personnel were allocated to the business divisions as well as Non-core and Legacy Portfolio, based on services consumed. The 1,055 personnel remaining in Corporate Center – Core Functions after allocations were related to Group governance functions and other corporate activities.
132
|
Financial and operating performance |
|
|
2012 compared with 2011
Results
Corporate Center – Core Functions recorded a loss before tax of CHF 3,698 million in 2012 compared with profit before tax of CHF 1,562 million in 2011. 2012 included charges for provisions for litigation, regulatory and similar matters of CHF 1,470 million, mainly arising from fines and disgorgement resulting from regulatory investigations concerning LIBOR and other benchmark rates, as well as an own credit loss of CHF 2,202 million. Treasury income remaining in Corporate Center – Core Functions was CHF 688 million.
Operating income
Total operating income was negative CHF 1,689 million, mainly due to an own credit loss on financial liabilities designated at fair value of CHF 2,202 million and negative income related to other items of CHF 175 million, partly offset by treasury income remaining in Corporate Center – Core Functions of CHF 688 million. Total operating income in 2011 was CHF 1,931 million.
Treasury income remaining in Corporate Center – Core Functions, after allocations to the business divisions, was CHF 688 million. 2012 included revenues of CHF 245 million in the repurchase agreement unit, which was transferred from the Investment Bank to Corporate Center – Core Functions in 2013 and for which prior period information was restated, realized gains of CHF 219 million on sales of financial investments held in the available-for-sale portfolio and gains of CHF 152 million related to our macro cash flow hedge models.
Compared with the prior year, treasury income remaining in Corporate Center – Core Functions increased to CHF 688 million
from CHF 386 million. This increase was mainly due to gains of CHF 152 million related to our macro cash flow hedge models compared with losses of CHF 52 million and increased realized gains of CHF 219 million on sales of financial investments held in the available-for-sale portfolio compared with CHF 81 million.
In 2012, we recorded an own credit loss on financial liabilities designated at fair value of CHF 2,202 million, primarily due to tightening of our funding spreads. 2011 included an own credit gain on financial liabilities of CHF 1,537 million.
Operating income excluding own credit and treasury income was negative CHF 175 million in 2012, mainly due to charges of CHF 196 million related to our multi-currency portfolio of unencumbered, high-quality, short-term assets managed centrally by Group Treasury and charges for provisions for litigation, regulatory and similar matters which were recorded as other income. These negative effects were partly offset by gains on sales of real estate of CHF 112 million. Compared with the prior year, income related to other items decreased to negative CHF 175 million from positive CHF 8 million, mainly due to the abovementioned charges related to our multi-currency portfolio of unencumbered, high-quality, short-term assets and higher charges for provisions for litigation, regulatory and similar matters.
Operating expenses before service allocations
On a gross basis, before service allocations to the business divisions and Corporate Center – Non-core and Legacy Portfolio, total operating expenses increased by CHF 1,063 million to CHF 10,060 million in 2012. Adjusted for restructuring charges of CHF 37 million in 2012 and CHF 185 million in 2011, as well as the positive effect in 2012 of the changes to our Swiss pension plan and our retiree benefit plans in the US of CHF 276 million and CHF 16 million, respectively, operating expenses before allocations to the business divisions and Non-core and Legacy Portfolio were CHF
133
Financial and operating performance
Corporate Center
10,315 million compared with CHF 8,812 million in the prior year. This increase of CHF 1,503 million was mainly due to CHF 1,417 million higher charges for provisions for litigation, regulatory and similar matters, increased business demand for information technology infrastructure services as well as higher marketing costs. These increases were partly offset by reduced personnel expenses associated with our ongoing cost reduction programs.
Personnel expenses decreased by CHF 548 million to CHF 4,110 million. On an adjusted basis, excluding restructuring charges of CHF 24 million in 2012 and CHF 66 million in 2011, as well as the positive effect in 2012 of the changes to our Swiss pension plan and our retiree benefit plans in the US of CHF 276 million and CHF 16 million, respectively, personnel expenses were CHF 4,378 million in 2012 compared with CHF 4,592 million in the prior year. This decrease of CHF 214 million was mainly due to reduced personnel expenses associated with our ongoing cost reduction programs, a one-time net credit from changes to the rules for the Swiss long-service and sabbatical awards announced in the third quarter of 2012, as well as the effect related to the capitalization of internally generated software in 2012.
General and administrative expenses increased by CHF 1,694 million to CHF 5,302 million. Adjusted for net restructuring releases of CHF 1 million in 2012 and net restructuring charges of CHF 94 million in 2011, general and administrative expenses increased by CHF 1,789 million, mainly due to CHF 1,417 million higher charges for provisions for litigation, regulatory and similar matters largely arising from fines and disgorgement resulting from regulatory investigations concerning LIBOR and other benchmark rates. Further, 2012 included higher marketing costs and increased business demand for information technology infrastructure services,
partly offset by the effect of the capitalization of internally generated software.
Depreciation and impairment of property and equipment decreased to CHF 647 million from CHF 731 million, mainly due to lower restructuring charges and amortization of software costs in 2011.
The business divisions and Non-core and Legacy Portfolio were charged CHF 8,052 million for shared services costs, a decrease of CHF 576 million, primarily reflecting the aforementioned decrease in personnel expenses.
Operating expenses after service allocations
Total operating expenses remaining after allocations to the business divisions and Non-core and Legacy Portfolio increased to CHF 2,008 million from CHF 369 million. This mainly reflects CHF 1,417 million higher charges for provisions for litigation, regulatory and similar matters as well as CHF 65 million higher marketing costs in relation to our 150th anniversary, including expenses related to the education initiative we launched to mark the occasion in 2012.
Personnel
As of 31 December 2012, Corporate Center – Core Functions employed 25,351 personnel, compared with 26,374 as of 31 December 2011. This decrease of 1,023 personnel was mainly related to our ongoing cost reduction programs. As of 31 December 2012, 24,863 personnel were allocated to the business divisions as well as Non-core and Legacy Portfolio, based on services consumed. The 488 personnel remaining in Corporate Center – Core Functions after allocations were related to Group governance functions and other corporate activities.
134
|
Financial and operating performance |
|
|
Corporate Center – Non-core and Legacy Portfolio
Corporate Center – Non-core and Legacy Portfolio recorded a loss before tax of CHF 2,312 million in 2013 compared with a loss of CHF 3,764 million in the prior year. The 2013 loss was mainly due to total operating expenses of CHF 2,660 million which included charges of CHF 1,320 million for provisions for litigation, regulatory and similar matters. Operating income was CHF 347 million, mainly due to gains from the revaluation of our option to acquire the SNB StabFund’s equity, prior to our exercise of the option. Fully appliedrisk-weighted assets (RWA) decreased by CHF 39 billion to CHF 64 billion.
Corporate Center reporting – Non-core and Legacy Portfolio1
| | | | | | | | | | | | | | | | |
| | As of or for the year ended | | | % change from | |
| CHF million, except where indicated | | 31.12.13 | | | 31.12.12 | | | 31.12.11 | | | 31.12.12 | |
| Non-core | | | (50 | ) | | | 1,135 | | | | 928 | | | | | |
| | | | | | | | | | | | | | | | | |
| Legacy Portfolio | | | 394 | | | | 381 | | | | (642 | ) | | | 3 | |
| | | | | | | | | | | | | | | | | |
of which: SNB StabFund option | | | 412 | | | | 539 | | | | (126 | ) | | | (24 | ) |
| | | | | | | | | | | | | | | | | |
| Income | | | 344 | | | | 1,516 | | | | 286 | | | | (77 | ) |
| | | | | | | | | | | | | | | | | |
| Credit loss (expense)/recovery2 | | | 3 | | | | (78 | ) | | | 22 | | | | | |
| | | | | | | | | | | | | | | | | |
| Total operating income | | | 347 | | | | 1,439 | | | | 309 | | | | (76 | ) |
| | | | | | | | | | | | | | | | | |
| Personnel expenses | | | 515 | | | | 628 | | | | 706 | | | | (18 | ) |
| | | | | | | | | | | | | | | | | |
| General and administrative expenses | | | 2,022 | | | | 1,141 | | | | 486 | | | | 77 | |
| | | | | | | | | | | | | | | | | |
| Services (to)/from other business divisions | | | 65 | | | | 335 | | | | 503 | | | | (81 | ) |
| | | | | | | | | | | | | | | | | |
| Depreciation and impairment of property and equipment | | | 55 | | | | 41 | | | | 43 | | | | 34 | |
| | | | | | | | | | | | | | | | | |
| Impairment of goodwill | | | 0 | | | | 3,030 | | | | 0 | | | | (100 | ) |
| | | | | | | | | | | | | | | | | |
| Amortization and impairment of intangible assets | | | 3 | | | | 28 | | | | 19 | | | | (89 | ) |
| | | | | | | | | | | | | | | | | |
| Total operating expenses3 | | | 2,660 | | | | 5,202 | | | | 1,756 | | | | (49 | ) |
| | | | | | | | | | | | | | | | | |
| Operating profit/(loss) before tax | | | (2,312 | ) | | | (3,764 | ) | | | (1,448 | ) | | | (39 | ) |
| | | | | | | | | | | | | | | | | |
| | | | |
| Additional information | | | | | | | | | | | | | | | | |
| | | | | | | | | | | | | | | | | |
| Average attributed equity (CHF billion)4 | | | 10.8 | | | | 16.5 | | | | | | | | (35 | ) |
| | | | | | | | | | | | | | | | | |
| Total assets (CHF billion)5 | | | 210.5 | | | | 428.6 | | | | 524.8 | | | | (51 | ) |
| | | | | | | | | | | | | | | | | |
| Risk-weighted assets (phase-in, CHF billion)6 | | | 63.5 | | | | 102.5 | | | | | | | | (38 | ) |
| | | | | | | | | | | | | | | | | |
| Risk-weighted assets (fully applied, CHF billion)6 | | | 63.5 | | | | 102.5 | | | | | | | | (38 | ) |
| | | | | | | | | | | | | | | | | |
| Swiss SRB leverage ratio denominator (phase-in, CHF billion)7 | | | 160.0 | | | | | | | | | | | | | |
| | | | | | | | | | | | | | | | | |
| Personnel after allocations (full-time equivalents) | | | 1,585 | | | | 2,304 | | | | 2,440 | | | | (31 | ) |
| | | | | | | | | | | | | | | | | |
1 Comparative figures in this table may differ from those originally published in quarterly and annual reports due to adjustments following organizational changes and restatements due to retrospective adoption of new accounting standards. 2 Includes credit loss (expense)/recovery on reclassified and acquired securities. 3 Refer to “Note 32 Changes in organization” in the “Financial information” section of this report for information on restructuring charges. 4 Refer to the “Capital management” section of this report for more information on the equity attribution framework. 5 Based on third-party view, i.e., without intercompany balances. Refer to “Note 2 Segment reporting” in the “Financial information” section of this report for more information. 6 Based on the Basel III framework as applicable for Swiss systemically relevant banks (SRB). Numbers for 31 December 2012 are on a pro-forma basis. Refer to the “Capital management” section of this report for more information. 7 The leverage ratio denominator is also referred to as “total adjusted exposure” and is calculated in accordance with Swiss SRB leverage ratio requirements. Data represent the average of the total adjusted exposure at the end of the three months preceding the end of the reporting period. Data as of 31 December 2012 are not available on a reporting segment level due to organizational changes. Refer to the “Capital management” section of this report for more information.
135
Financial and operating performance
Corporate Center
2013 compared with 2012
Operating income by business unit
Non-core
Total income was negative CHF 50 million in 2013, mainly due to a negative debit valuation adjustment of CHF 99 million, partly offset by slightly positive revenues in rates of CHF 17 million and credit of CHF 15 million. These modestly positive revenues demonstrate that significant reductions in RWA and balance sheet assets, as well as operational complexity, following the accelerated implementation of our strategy, were achieved at negligible cost.
In the prior year, Non-core revenues were positive CHF 1,135 million as, during 2012, the portfolios were actively traded and benefited from increased liquidity, with strong two-way client flow that resulted in higher revenues.
Legacy Portfolio
Total income was CHF 394 million in 2013. We exercised our option to acquire the SNB StabFund’s equity and recorded total option revaluation gains of CHF 431 million prior to the exercise, partly offset by a reduction in trading revenues due to an interest charge of CHF 34 million relating to tax obligations of the SNB StabFund.
Legacy Portfolio income excluding the SNB StabFund option was negative CHF 18 million, mainly due to mark-to-market losses of CHF 122 million in the municipal portfolios, partly offset by gains of CHF 84 million from reference-linked note portfolios.
Compared with the prior year, income in the Legacy Portfolio increased to CHF 394 million from CHF 381 million, mainly as 2012 included losses on collateralized debt obligations (CDO) and related hedging swaps of CHF 171 million as we exited certain CDO positions to reduce RWA. In 2012, we recorded gains of CHF 526 million on the revaluation of our option to acquire the SNB StabFund’s equity.
Credit loss expense/recovery
In 2013, we recorded credit loss recoveries of CHF 3 million, mainly in the Legacy Portfolio, due to sales and redemptions of student loan auction rate securities impaired in prior periods. Net credit loss expenses were CHF 78 million in 2012, which mainly reflected an impairment charge related to certain student loan auction rate securities, subsequently sold to reduce RWA.
Operating expenses
Total operating expenses decreased to CHF 2,660 million from CHF 5,202 million in the prior year.
Personnel expenses declined by CHF 113 million to CHF 515 million, mainly due to a decrease in front office personnel following the accelerated implementation of our strategy and head-count reductions related to our ongoing cost reduction programs, as well as restructuring charges of CHF 35 million in 2013 compared with CHF 58 million in the prior year.
General and administrative expenses increased by CHF 881 million to CHF 2,022 million, largely due to charges for provisions for litigation, regulatory and similar matters of CHF 1,320 million compared with CHF 634 million, restructuring charges of CHF 173 million compared with zero, as well as an impairment charge of CHF 87 million related to certain disputed receivables.
Charges for services from other business divisions decreased by CHF 270 million to CHF 65 million, mainly as a result of reduced consumption of shared services.
Depreciation and impairment of property and equipment increased to CHF 55 million from CHF 41 million, mainly due to restructuring charges of CHF 26 million compared with zero in the prior year.
An impairment of goodwill of CHF 3,030 million was recognized in 2012.
| | è | | Refer to “Note 17 Goodwill and intangible assets” in the “Financial information” section of this report for more information |
136
|
Financial and operating performance |
|
|
Risk-weighted assets
Fully applied RWA for Corporate Center – Non-core and Legacy Portfolio decreased by CHF 39 billion to CHF 64 billion, significantly below our year-end 2013 target of CHF 85 billion.
Non-core RWA decreased by CHF 32 billion to CHF 33 billion as a result of continued activity targeted at reducing the number of outstanding over-the-counter derivative transactions by means of negotiated bilateral settlements with specific counterparties, third-party novations or trade compressions. These reductions were partly offset by the effect of the supplemental operational risk capital analysis mutually agreed to by UBS and FINMA.
Legacy Portfolio RWA decreased by CHF 7 billion to CHF 31 billion, mainly due to sales and redemptions of student loan auction rate securities and sales of bonds within the reference-linked notes portfolios. These reductions were partly offset by the effect of the supplemental operational risk capital analysis referred to above.
| | è | | Refer to the “Risk management and control” and “Capital management” sections of this report for more information |
Balance sheet assets
Balance sheet assets decreased 51% to CHF 211 billion as of 31 December 2013 from CHF 429 billion as of 31 December 2012. This decrease was mainly due to a CHF 170 billion reduction in positive replacement values, largely in Non-core, primarily as a result of significant ongoing unwind, novation and compression activity during 2013. Funded assets decreased by CHF 39 billion, mainly as a result of exiting government and other liquid bond positions along with the sale of distressed assets in Non-core, as well as sales and redemptions of student loan auction rate securities in the Legacy Portfolio.
| | è | | Refer to the “Balance sheet” section of this report for more information |
| | è | | Refer to “Corporate Center – Non-core and Legacy Portfolio” in the “Risk management and control” section of this report for more information |
Personnel
As of 31 December 2013, a total of 1,585 personnel were employed within Non-core and Legacy Portfolio compared with 2,304 as of 31 December 2012. Front office personnel decreased to 222 from 541 and personnel allocated from centralized shared services units decreased by 400 to 1,363.
137
Financial and operating performance
Corporate Center
2012 compared with 2011
We do not provide a full comparison of 2012 performance versus 2011 as the restated information for both years is not representative of the way the business was managed during those years and as such is an estimate of such periods’ performance. Amounts were determined reflecting a number of assumptions and allocations in order to achieve comparability with how the business would be managed in the future.
Results
Corporate Center – Non-core and Legacy Portfolio recorded a loss before tax of CHF 3,764 million in 2012 compared with CHF 1,448 million in 2011. The 2012 loss was mainly due to total operating expenses of CHF 5,202 million, mainly related to an impairment of goodwill and other non-financial assets of CHF 3,064 million as well as charges of CHF 634 million for provisions for litigation, regulatory and similar matters. Operating income was CHF 1,439 million, mainly due to revenues of CHF 1,135 million in Non-core and gains of CHF 526 million from the revaluation of our option to acquire the SNB StabFund’s equity. Fully applied RWA were CHF 103 billion as of 31 December 2012 on a pro-forma basis.
Operating income by business unit
Non-core
Total income was CHF 1,135 million in 2012 as rates and credit portfolios, which were part of the Investment Bank prior to the accelerated implementation of our strategy, were actively traded and benefited from increased liquidity, with strong two-way client flow. Compared with 2011, income in Non-core increased to CHF 1,135 million from CHF 928 million as a result of improved performance in credit with revenues of CHF 671 million compared with CHF 308 million in the prior year.
Legacy Portfolio
Total income was CHF 381 million in 2012. The revaluation of our option to acquire the SNB StabFund’s equity resulted in a gain of CHF 526 million.
Legacy Portfolio income excluding the SNB StabFund option was negative CHF 158 million. 2012 included losses of CHF 171 million on CDO and related hedging swaps which we exited in order to reduce RWA.
Compared with the prior year, income in the Legacy Portfolio increased to CHF 381 million from negative CHF 642 million, mainly due to gains of CHF 526 million from the revaluation of our option to acquire the SNB StabFund’s equity in 2012 compared with losses of CHF 133 million in 2011. Additionally, 2011 included a loss of CHF 284 million related to credit valuation adjustments for monoline credit protection.
Credit loss expense/recovery
In 2012, we incurred credit loss expenses of CHF 78 million, mainly in the Legacy Portfolio, reflecting an impairment charge related to certain student loan auction rate securities, subsequently sold to reduce RWA.
Operating expenses
Total operating expenses increased to CHF 5,202 million from CHF 1,756 million in 2011.
Personnel expenses decreased by CHF 78 million to CHF 628 million, mainly due to a decrease in front office personnel following the accelerated implementation of our strategy and head-count reductions related to our cost reduction programs.
General and administrative expenses increased by CHF 655 million to CHF 1,141 million, largely due to CHF 607 million higher charges for provisions for litigation, regulatory and similar matters and increased professional fees.
Charges for services from other business divisions decreased by CHF 168 million to CHF 335 million, mainly as a result of reduced consumption of shared services.
An impairment of goodwill of CHF 3,030 million was recognized in 2012.
| | è | | Refer to “Note 17 Goodwill and intangible assets” in the “Financial information” section of this report for more information |
138
Risk, treasury
and capital
management
Audited information according to IFRS 7 and IAS 1
Risk and capital disclosures provided in line with the requirements of International Financial Reporting Standard 7 (IFRS 7)Financial Instruments: Disclosures,and International Accounting Standard 1 (IAS 1)Financial Statements: Presentation form part of the financial statements audited by our independent registered public accounting firm, Ernst & Young Ltd, Basel. Information that has been subject to audit is indicated by a bar stating “audited” within this section of the report and is considered part of the audited financial statements included in the “Financial information” section of this report.
Risk, treasury and capital management
Table of contents
140
|
Risk, treasury and capital management |
|
|
141
Risk, treasury and capital management
Implementation of the recommendations of the Enhanced Disclosure Task Force (EDTF)
Implementation of the recommendations of the Enhanced Disclosure Task Force (EDTF)
In light of the recommendations of the EDTF, we have made significant enhancements to disclosures in this report, including making structural changes to this section and introducing a large number of both new and improved disclosures. Consistent with Recommendation 1 of the EDTF, where appropriate, we now present together those related risk disclosures we consider to be most relevant to a particular component of our business, including integrating certain disclosures previously presented separately within our Pillar 3 disclosures or our consolidated financial statements.
Consistent with our financial reporting and disclosure principles, we regard the enhancement of disclosures as an ongoing
commitment and we expect to make further refinements to our disclosures in 2014 and beyond.
The index on the following pages summarizes our implementation of the 32 recommendations of the EDTF, including reference to related disclosures that support the objectives of each of these recommendations.
| | è | | Refer to the “Significant accounting and financial reporting changes” section of this report for more information on enhancing our disclosures |
| | è | | Refer to “Information policy” in the “Corporate governance, responsibility and compensation” section of this report for more information on our financial disclosure principles |
142
|
Risk, treasury and capital management |
|
|
General
| 1 | Presentation of related risk information |
Wherever possible, our risk information is disclosed primarily in the “Risk, treasury and capital management” section with related risk information presented together, as explained in the “Significant accounting and financial reporting changes” section. Information on the following pages summarizes where key disclosures relating to the recommendations of the EDTF can be found.
Our “Risk categories” disclosure within the “Risk management and control” section presents our definitions for all risk types, including information on our management and measurement of these risks. In addition, we provide explanations for the key parameters used in our risk measurement models in our “Credit risk” and “Market risk” disclosure in the “Risk management and control” section, as well as assumptions underlying our stress testing scenarios in our “Risk measurement” disclosure within the same section.
Our “Top and emerging risks” disclosure within the “Risk management and control” section summarizes those risks that we consider to be “top and emerging,” as contemplated by EDTF recommendations, in relation to our current business activities. Further information on each of these risks in the relevant other sections is indicated by reference. Investors should consider carefully all information set out in our “Risk factors” disclosure within the “Operating environment and strategy” section. Information on future accounting changes is included in “Note 1 Summary of significant accounting policies” in the “Financial information” section.
| 4 | Regulatory ratio developments |
We have provided extensive information on the key proposed regulatory ratios (the leverage ratio, the Liquidity Coverage Ratio (LCR) and the Net Stable Funding Ratio (NSFR)), all of which are still subject to further amendments by the Swiss authorities. These ratios are described briefly in the “Regulatory and legal developments” and “Risk factors” sections. Detailed information, including pro-forma disclosure based on current Swiss Financial Market Supervisory Authority (FINMA) guidance where appropriate, is included in our “Swiss SRB leverage ratio” disclosure within the “Capital management” section for the leverage ratio and in our “Liquidity regulatory requirements” disclosure within the “Treasury management” section for the LCR and NSFR. In addition, our leverage ratio denominator is disclosed by business division in our “Overview of risks arising from our business activities” disclosure within the “Risk management and control” section and in our “Swiss SRB leverage ratio” disclosure in the “Capital management” section, the key components of our pro-forma LCR and NSFR are summarized in our “Strategy and objectives” disclosure within the “Treasury management” section and an analysis of the liquidity asset buffer that supports our pro-forma LCR is disclosed in our “Liquidity management, contingency funding and stress testing” disclosure within the same section.
Risk governance and risk management strategies/business model
| 5 | Risk management organization |
Our “Risk governance” disclosure within the “Risk management and control” section summarizes our risk management organization and provides information on the risk management responsibilities for key roles, including the relevant responsibilities of the business divisions and the functions providing independent oversight.
Our “Risk principles and risk culture” disclosure within the “Risk management and control” section summarizes the tools we use to ensure that our desired risk culture is embedded within the organization, including our performance measurement and compensation framework, and provides information on developments during the year. Further information, including a related illustration of the determination of individual performance awards, is included in the “Corporate responsibility” and “Compensation” sections.
143
Risk, treasury and capital management
Implementation of the recommendations of the Enhanced Disclosure Task Force (EDTF)
Our “Overview of risks arising from our business activities” and subsequent disclosure in the “Risk management and control” section provides extensive information on the key risks arising from our business model, on our risk appetite framework and on our management of these risks. The “Key risks, risk measures and performance by business division and Corporate Center” disclosure in the same section provides a summary of the key risks for each business division and the Corporate Center and relates these business activities to key financial risk measures – risk-weighted assets (RWA), the leverage ratio denominator, risk-based capital, average tangible attributed equity, total assets and adjusted performance before tax. Following information on our risk governance, we disclose our five risk management and control principles and detailed information on our risk appetite objectives covering capital, solvency, earnings, leverage ratio and liquidity.
We consider the use of stress testing within an established risk governance framework to be a more relevant risk management tool within a bank than the use of standardized regulatory capital calculations. Our “Stress testing” disclosure within the “Risk management and control” section provides information on our use of stress testing within our risk governance and capital framework, including detailed information on scenarios used and agreed with the regulators and the linkage of stress testing results to our risk appetite objectives. In addition, information on our use of stress testing for credit risk, market risk and liquidity and funding risk is included within our disclosures for each of these risk categories.
Capital adequacy and risk-weighted assets
| 9 | Minimum capital requirements |
Our “Swiss SRB Basel III capital information” disclosure within the “Capital management” section includes information on our capital requirements, comparison with available capital and information on capital ratios, together with narrative explanation. We compare our capital requirements under the Swiss SRB rules with those under BIS rules in our disclosure “Differences between Swiss SRB and BIS Basel III capital” within the same section. Information on the capital surcharge for our Swiss residential mortgage business is included in our “Capital requirements” disclosure in the “Capital management” section. Separately, our “Operational risk” disclosure within the “Risk management and control” section includes information on the incremental RWA resulting from the supplemental operational risk capital analysis mutually agreed to by UBS and FINMA.
Our “Eligible capital” disclosure within the “Capital management” section includes information on our common equity tier 1, tier 1 and tier 2 capital, a reconciliation of our IFRS equity to our Swiss SRB Basel III capital showing regulatory adjustments and a summary listing of our eligible capital instruments. The “Supplemental disclosures required under Basel III Pillar 3 regulations” section includes a balance sheet reconciliation showing the scope of regulatory consolidation.
| 11 | Flow statement of capital |
Our “Eligible capital” disclosure within the “Capital management” section includes a tabular flow statement of our Swiss SRB Basel III capital movement.
| 12 | Strategic and capital planning |
The sections “Our strategy” and “Capital management” provide information on our capital planning in the context of our strategy, including our current and target capital ratios and our plans for capital returns.
| 13 | Risk-weighted assets and related business activities |
Our “Risk-weighted assets” disclosure within the “Capital management” section includes information on our RWA and related capital requirements for each risk type, presented by business division and Corporate Center. This same information is also presented together with related underlying gross and net exposures in the “Supplemental disclosures required under Basel III Pillar 3 regulations” section. More detailed information on the related business activities for market risk is presented in the linked “Market risk exposures arising from our business activities” disclosure within the “Risk management and control” section. Reflecting our focus on RWA and balance sheet reduction in Non-core and Legacy Portfolio, more detailed information on these RWA and balance sheet changes is disclosed in “Corporate Center – Non-core and Legacy Portfolio” within the same section.
144
|
Risk, treasury and capital management |
|
|
| 14 | Capital requirements for each risk type |
The “Supplemental disclosures required under Basel III Pillar 3 regulations” section includes information on our RWA and related capital requirements for each risk type, together with related underlying gross and net exposures. Similar information is also presented by business division and Corporate Center in our “Risk-weighted assets” disclosure within the “Capital management” section. Detailed information on significant risk models used is included in “Credit risk,” “Market risk” and “Operational risk” within the “Risk management and control” section.
The “Supplemental disclosures required under Basel III Pillar 3 regulations” section includes disclosure of our regulatory net credit exposure by BIS asset class (exposure segment), linking probability of default and loss given default to RWA, using internal ratings grades based on a 14 point internal scale mapped to external ratings in our “Credit risk models” disclosure.
| 16 | Flow statement of risk-weighted assets |
Our “Risk-weighted assets” disclosure within the “Capital management” section includes a flow statement presenting our movement in RWA by key driver. Reflecting our focus on RWA and balance sheet reduction in Non-core and Legacy Portfolio, more detailed information on these RWA and balance sheet changes is disclosed in “Corporate Center – Non-core and Legacy Portfolio” within the “Risk management and control” section.
| 17 | Credit risk model performance |
Our “Credit risk models” disclosure within the “Risk management and control” section includes extensive information on the composition of our credit risk models, including backtesting of probability of default, loss given default and credit conversion factors as well as expected loss analysis.
Liquidity
| 18 | Liquidity needs and reserves |
In our “Liquidity and funding management” disclosure within the “Treasury management” section, our liquidity strategy is described in “Strategy and objectives” and our liquidity management is described in “Liquidity management, contingency funding and stress testing.” This section also includes disclosure of the composition of the liquidity asset buffer that forms the basis for our pro-forma LCR disclosed in “Liquidity regulatory requirements,” as well as a summary of the key changes in this liquidity asset buffer, together with the monthly average amount for the year and information on our liquidity stress testing. Our internal funding model is described in “Internal funding and funds transfer pricing” in the same section and limitations on use of funding reserves from a Group perspective are incorporated within the narrative and quantitative “Asset encumbrance” disclosure.
145
Risk, treasury and capital management
Implementation of the recommendations of the Enhanced Disclosure Task Force (EDTF)
Funding
| 19 | Encumbered and unencumbered assets |
Our “Asset encumbrance” disclosure within the “Treasury management” section differentiates our on- and off-balance sheet assets between those available and those encumbered or otherwise not available to meet future funding and collateral needs, including the proportion of available assets by type. Further information on our sources and uses of off-balance sheet collateral is included in “Note 25 Restricted and transferred assets” in the “Financial information” section. Our “Credit ratings” disclosure within the “Treasury management” section includes information on our potential additional contractual obligations following credit rating downgrades.
| 20 | Contractual maturity analysis |
Our “Maturity analysis of assets and liabilities” disclosure within the “Treasury management” section provides an analysis of total assets, liabilities and off-balance sheet commitments by remaining contractual maturity. For risk management purposes we consider behavioral characteristics to adjust contractual maturities. The assumptions used to support these adjustments are described in the context of our stress testing in our “Liquidity management, contingency funding and stress testing” disclosure within the “Treasury management” section.
In our “Liquidity and funding management” disclosure within the “Treasury management” section, our funding strategy is described in “Strategy and objectives.” Our “Funding” disclosure within the same section has extensive information on our funding sources, including product and currency mix, as well as changes in sources of funding during the year and our management thereof. Further information on our stress testing and contingent funding sources is included in our “Liquidity management, contingency funding and stress testing” disclosure within the “Treasury management” section.
Market risk
| 22 | Market risk linkage to the balance sheet |
Our “Market risk exposures arising from our business activities” disclosure within the “Risk management and control” section shows the extent to which business activities in each of our business divisions and Corporate Center contribute to market risk. This disclosure table distinguishes balance sheet line items between market risk in the banking book and market risk in the trading book and provides a link to market risk RWA and total asset amounts disclosed in our “Overview of risks arising from our business activities” within the “Risk management and control” section. There are also linkages from this disclosure table to our disclosure of RWA for each risk type in the “Supplemental disclosures required under Basel III Pillar 3 regulations” section and to the related table by business division and Corporate Center in our “Risk-weighted assets” disclosure within the “Capital management” section. Further information on value-at-risk and related market risk measures, including the derivation of market risk RWA follows from the disclosure table “Market risk exposures arising from our business activities” within the “Risk management and control” section.
Our disclosure table “Market risk exposures arising from our business activities” within the “Risk management and control” section presents trading and non-trading market risk factors relevant to our business activities. The subsequent pages provide both quantitative and qualitative information on each of these risk factors, including the derivation of market risk RWA for each risk category, risk sensitivities for banking book exposures and “Other market risk exposures” disclosure for own credit, equity investments, debt investments, pension risk and own share exposure.
| 24 | Market risk measurement model performance |
Our “Market risk” disclosure within the “Risk management and control” section includes extensive qualitative and quantitative information on each of our market risk measurement models including information on methodology, key assumptions, model limitations and changes and backtesting.
| 25 | Other market risk management techniques |
Our “Market risk stress loss” disclosure within the “Risk management and control” section provides information on our primary measure of stress loss for market risk – our liquidity adjusted stress framework. Further information on our broader stress testing framework and how this is incorporated within our risk appetite framework is included in our “Risk measurement” disclosure within the same section. In addition, our disclosure on market risk measurement models provides both qualitative and quantitative information on stressed value-at-risk, the incremental risk charge and the comprehensive risk measure.
146
|
Risk, treasury and capital management |
|
|
Credit risk
| 26 | Analysis of credit risk exposures |
Our “Credit risk profile of the Group – IFRS view” disclosure within the “Risk management and control” section provides a summary for on and off-balance sheet maximum exposure to credit risk, as well as information on collateral, credit enhancements, ratings, impaired assets and allowances. More detailed disclosures on the composition of our loan and over-the-counter (OTC) derivative portfolios at a business division or Corporate Center level follow, including information on loan type, loan-to-value, net exposure at default and counterparty geographical region and industry sector. Further information on our largest loan portfolio, being our mortgage loan portfolio in Switzerland, is also included. Our “Credit risk models” disclosure within the “Risk management and control” section includes information on stress testing.
| 27 | Policies for impaired and non-performing loans |
Our disclosure “Policies for past due, non-performing and impaired claims” within the “Risk management and control” section provides a summary of our policies, with further detail included in “Note 1 Summary of significant accounting policies in the “Financial information” section.
| 28 | Analysis of impaired and non-performing loans |
Our disclosure “Development of individually impaired loans” within the “Risk management and control” section presents a reconciliation of impaired loans during the year. Further information on impaired and non-performing loans, as well as credit allowances, is also included in our “Credit risk profile of the Group – IFRS view” disclosure within the same section.
| 29 | Counterparty credit risk from derivative transactions |
Our disclosure on derivatives exposures is primarily in “Note 14 Derivative instruments and hedge accounting” and “Note 26 Offsetting financial assets and financial liabilities” in the “Financial information” section, with additional information, including our use of central counterparties, in our “Credit risk mitigation” disclosure within the “Risk management and control” section. The majority of our counterparty risk from OTC derivatives arises in the Investment Bank and Corporate Center – Non-core and Legacy Portfolio, on which further information is included in our “Traded products” disclosure within the “Risk management and control” section.
Our “Credit risk mitigation” disclosure within the “Risk management and control” section provides information on our use of collateral and credit hedging, including loan-to-value and other credit risk mitigation information. We also discuss in this section our approach to monitoring collateral concentrations in our lending portfolios secured by securities collateral.
Other risks
Our “Risk categories” disclosure within the “Risk management and control” section presents our definitions for risk types to which we are exposed. This disclosure also provides information on our management and measurement of these risks including which function provides independent oversight and whether the risk is specifically included in the risk appetite framework. Further information is included within the relevant sections.
| 32 | Publicly known risk events |
Our disclosure in “Note 22 Provisions and contingent liabilities” in the “Financial information” section provides extensive information on those matters management considers to be material or considers otherwise significant due to potential financial, reputational or other effects. Our “Operational risk” disclosure includes information on the remediation program following the Investment Bank’s unauthorized trading incident and our “Risk principles and risk culture” disclosure summarizes the tools we use to ensure that our desired risk culture is embedded within the organization.
147
Risk, treasury and capital management
Risk, treasury and capital management key developments
Risk, treasury and capital management key developments
In line with our strategy, we actively managed down risks within Non-core and Legacy Portfolio, maintained a low level of market risk within our Investment Bank and experienced moderate increases in lending within our wealth management businesses. As our balance sheet assets have reduced, we have generated capacity within our liquidity and funding positions, enabling us to execute tender offers to repurchase certain outstanding long-term debt in 2013, which lowers our interest expense and allows us to optimize our funding liability structure for the future. Our strong capital position provides us with a solid foundation for growing our business and enhancing our competitive positioning. At the end of 2013, our common equity tier 1 (CET1) capital ratio was 18.5% on a phase-in basis and 12.8% on a fully applied basis, a significant increase compared withyear-end 2012pro-forma ratios and the highest in our peer group. At the same time, strengthening our operational control framework remained a primary focus, with substantial progress made in remediating identified operational risk issues.
Key developments in 2013 included the following.
Non-core and Legacy Portfolio
During 2013, we actively managed down risks within Non-core and Legacy Portfolio, exceeding our year-end targets for balance sheet and risk-weighted assets (RWA) reductions. We disposed of our more liquid cash and loan positions and sold a significant portion of the distressed portfolio and student loan auction rate securities, alongside the steady run-off of the Non-core loan book. Exposures to over-the-counter derivative contracts were reduced through negotiated bilateral settlements, portfolio compressions and negotiated assignments and novations. In the fourth quarter, we exercised our option to acquire the equity of the SNB Stab-Fund from the Swiss National Bank. The fair value of the option was previously deducted from our CET1 capital and its exercise resulted in a CET1 capital increase of CHF 2.1 billion compared with our CET1 capital as of 31 December 2012. The additions to our RWA as a result of the exercise were de minimis.
| | è | | Refer to “Corporate Center – Non-core and Legacy Portfolio” in the “Risk management and control” section of this report for more information |
Market risks
In line with our strategy, we maintained a low level of market risk in our trading businesses, with the risk profile of the Investment Bank reducing and migrating towards less complex and more client-oriented businesses. Average exposure levels of our stress loss and statistical (value-at-risk) measures roughly halved over the course of the year.
| | è | | Refer to “Market risk” in the “Risk management and control” section of this report for more information |
Credit risks
Credit risk continues to account for the vast majority of Basel III RWA although our net credit loss expenses remained low, totaling CHF 50 million for the year. Our impaired loan portfolio decreased by CHF 0.4 billion to CHF 1.2 billion.
Our lending exposure arises mainly from our Swiss domestic business, which offers corporate loans and mortgage loans secured against residential properties and income-producing real estate, and is therefore tied to the health of the Swiss economy. Although these domestic lending portfolios continued to perform well and net credit loss expenses remain low, we are closely monitoring macroeconomic developments in our home market. These include signs of a deceleration in the growth in Swiss real estate prices in some regions, a rising trend in the UBS Swiss Real Estate Bubble Index, the Swiss National Bank’s increase of the countercyclical capital buffer from 1% to 2% effective 30 June 2014, along with implications of any return of crisis conditions within the eurozone on export markets, and the potential implications of the recent decision to reinstate immigration quotas for European Union/European Economic Area countries.
In our wealth management businesses outside Switzerland, we experienced moderate increases in credit exposures in line with our strategy to grow our lending businesses. Within the Investment Bank, our credit exposure is predominantly investment grade, but includes loan underwriting characterized by concentrated exposure to lower-rated credits, albeit of a temporary nature. Distribution of these loans through syndication and securitization continued to be sound.
| | è | | Refer to “Credit risk” in the “Risk management and control” section of this report for more information |
148
|
Risk, treasury and capital management |
|
|
Treasury risk control framework
Our treasury risk control framework has been further developed and extended, providing holistic risk control for all treasury activities and non-traded market risk portfolios across the Group. Key enhancements during the year were the introduction of a centralized balance sheet simulation tool and additional monitoring of the effect of rising rates scenarios on our treasury portfolios. Our exposure to fair value losses on ourFinancial investments available-for-sale (AFS) portfolios as interest rates rise is limited as the interest rate risk of our largest AFS portfolio, our global liquidity reserve, is substantially hedged.
| | è | | Refer to the “Risk management and control” section of this report for more information |
Consequential risks
Operational risk is an inevitable consequence of being in business and managing it is a core element of our business activities, implemented through our operational risk framework and an effective front-to-back control environment.
The impact of operational risk remains at elevated levels, including that arising from pending or potential litigation and regulatory risks as discussed in “Top and emerging risks” in the “Risk management and control” section of this report. Accordingly, strengthening our operational risk control framework remained a primary focus during 2013, with substantial progress made in implementing a range of measures to enhance the Group’s risk management and control processes and drive the right behaviors to protect our reputation while delivering on our strategic goals.
A program of independent management testing for key procedural controls commenced in 2013, focused on areas deemed to have the highest levels of inherent risk. Any material control deficiencies identified are recorded in a central inventory, and assigned senior management ownership, which is reflected in the respective employees’ annual performance measurement and management objectives, to ensure effective and sustainable remediation.
Significant progress was made on the remediation programs for operational risk issues, resulting in the completion of many remediation activities. In particular, the Investment Bank’s unauthorized trading incident remediation program has been completed and this has further enhanced the Group’s ability to detect or prevent such incidents. Independent third-party reviews have been completed with no material issues identified.
| | è | | Refer to “Operational risk” in the “Risk management and control” section of this report for more information |
Risk appetite framework
In 2013, we updated our risk appetite objectives to align with the Swiss systemically relevant banks (SRB) Basel III capital and liquidity requirements that came into force on 1 January 2013. In addition, we further cascaded the risk appetite objectives into the divisions by establishing stress-based risk appetite triggers at business division level. The trigger levels were set based on forecasted risk exposure levels as embedded in our strategic plan.
| | è | | Refer to the “Risk management and control” section of this report for more information |
Sources of funding
During 2013, the composition of our funding sources moved towards less reliance on wholesale funding. The implementation of our strategy has driven a reduction in secured funding needs, as well as lower issuances of short-term and structured debt and the repurchase of unsecured debt. At the same time, our Retail & Corporate and wealth management businesses continued to attract new customer deposits.
| | è | | Refer to the “Treasury management” section of this report for more information |
Liquidity management
We continued to maintain a sound liquidity position throughout the year. As of 31 December 2013, our liquidity asset buffer, that is derived from high-quality liquid assets (HQLA) and supports our estimated pro-forma regulatory LCR, was CHF 153 billion, with additional available funding of CHF 54 billion. In aggregate, these sources of available liquidity represented 28% of our funded balance sheet assets.
| | è | | Refer to the “Treasury management” section of this report for more information |
Capital management
During 2013, we managed our capital according to our capital ratio targets, making progress towards meeting the Swiss SRB Basel III fully applied capital requirements and achieving a CET1 capital ratio of 18.5% on a phase-in basis and 12.8% on a fully applied basis. We have a strong track record of RWA reduction, surpassing our 2013 Basel III RWA targets well ahead of schedule and demonstrating progress towards achieving our RWA target of less than CHF 200 billion by 2017 on a fully applied basis, despite the incremental RWA resulting from the supplemental operational risk capital analysis mutually agreed to by UBS and FINMA.
| | è | | Refer to the “Capital management” section of this report for more information |
149
Risk, treasury and capital management
Risk management and control
Risk management and control
Overview of risks arising from our business activities
Our business is constrained by the capital we have available to cover risk-weighted assets (RWA) resulting from the risks in our business, by the size of our on- and off-balance sheet assets through their contribution to leverage ratio requirements and regulatory liquidity ratios, and by our risk appetite. Together, these constraints create a close link between our strategy, the risks that our businesses take and the balance sheet and capital resources that we have available to absorb those risks.
As described in “Equity attribution framework” in the “Capital management” section of this report, our equity attribution framework reflects our objectives of maintaining a strong capital base and guiding businesses towards activities that appropriately balance profit potential, risk, balance sheet and capital usage. The framework establishes this link through the inclusion of phase-in Basel III RWA, Swiss SRB leverage ratio denominator (LRD) and risk-based capital (RBC), an internal measure of risk similar to economic capital, as three key drivers for the allocation of tangible equity to our business divisions. In addition to tangible equity, we allocate equity to support goodwill and intangible assets as well
as certain capital deduction items to arrive at equity attributed to the business divisions and Corporate Center.
The table on the next page presents the linkage for each of our business divisions and Corporate Center between their risk exposures, the constraints described above and their performance. In addition to the key risks arising in each business division and Corporate Center, it presents together the key drivers of tangible attributed equity, being RWA, LRD and RBC, as well as tangible attributed equity, total assets and adjusted operating profit before tax. We present tangible attributed equity because we consider it to be more closely correlated with the risk measures applied. This enables an understanding of how the activities in our business divisions and Corporate Center are reflected in our risk measures and the performance of the business divisions and Corporate Center in the context of these requirements.
| | è | | Refer to the “Capital management” section of this report for more information on RWA, LRD and our equity attribution framework |
| | è | | Refer to “Statistical measures” in this section for more information on RBC |
| | è | | Refer to the table “Adjusted results” in the “Group performance” section of this report for more information |
150
|
Risk, treasury and capital management |
|
|
Key risks, risk measures and performance by business division and Corporate Center
| | | | | | | | | | | | | | | | | | | | | | | | | | | | | | |
| | | Business divisions
and Corporate
Center | | Wealth
Management | | | | Wealth
Management
Americas | | | | Retail & Corporate | | | | Global Asset
Management | | | | Investment Bank | | | | CC – Core Functions | | | | CC – Non-core
and Legacy
Portfolio | | |
| | | Key risks arising from business activities | | Credit riskfrom lending against securities collateral and mortgages, and a small amount of derivatives trading activity. Minimal contribution to market risk | | | | Credit riskfrom lending against securities collateral and mortgages Market risk from municipal securities and closed-end fund secondary trading | | | | Credit riskfrom retail, mortgage, secured and unsecured corporate lending, and a small amount of derivatives trading activity | | | | Small amounts of credit and market risk | | | | Credit riskfrom lending, derivatives trading and securities financing Market risk from trading in equities, fixed income, foreign exchange (FX) and commodities | | | | Creditand market risksfrom Group Treasury’s balance sheet, capital, and profit and loss management responsibilities Liquidity, funding andstructural FX riskare managed centrally within Group Treasury | | | | Credit riskfrom remaining lending and derivatives exposures Market riskis mainly fromNon-core exposures, is materially hedged and primarily relates to liquid market factors | | |
| | | Operational riskis an inevitable consequence of being in business, as losses can result from inadequate or failed internal processes, people and systems, or from external events. It can arise as a result of our past and current business activities across all business divisions and Corporate Center | | |
| | | | | | | | | | | | | | | | | | | | | | | | | | | | |
CHF billion | | As of or for the year ended 31.12.13 | |
| | | Wealth
Management | | | Wealth
Management
Americas | | | Retail &
Corporate | | | Global Asset
Management | | | Investment
Bank | | | CC – Core
Functions | | | CC – Non-core
and Legacy
Portfolio | |
| Phase-in Basel III RWA | | | 21.4 | | | | 24.5 | | | | 31.4 | | | | 3.8 | | | | 62.6 | | | | 21.3 | | | | 63.5 | |
| | | | | | | | | | | | | | | | | | | | | | | | | | | | | |
of which: credit risk | | | 11.9 | | | | 8.1 | | | | 29.9 | | | | 2.7 | | | | 35.5 | | | | 4.8 | | | | 31.3 | |
| | | | | | | | | | | | | | | | | | | | | | | | | | | | | |
of which: market risk | | | 0.0 | | | | 1.6 | �� | | | 0.0 | | | | 0.0 | | | | 7.6 | | | | (4.9 | )1 | | | 9.4 | |
| | | | | | | | | | | | | | | | | | | | | | | | | | | | | |
of which: operational risk | | | 9.2 | | | | 14.8 | | | | 1.4 | | | | 1.1 | | | | 19.4 | | | | 9.2 | | | | 22.8 | |
| | | | | | | | | | | | | | | | | | | | | | | | | | | | | |
| Swiss SRB leverage ratio denominator2 | | | 122.1 | | | | 57.2 | | | | 164.7 | | | | 14.0 | | | | 275.3 | | | | 234.5 | | | | 160.0 | |
| | | | | | | | | | | | | | | | | | | | | | | | | | | | | |
| Risk-based capital | | | 1.7 | | | | 1.2 | | | | 3.7 | | | | 0.6 | | | | 6.5 | | | | 13.6 | | | | 4.6 | |
| | | | | | | | | | | | | | | | | | | | | | | | | | | | | |
| Average tangible attributed equity | | | 2.7 | | | | 2.2 | | | | 4.1 | | | | 0.5 | | | | 7.9 | | | | 8.7 | | | | 10.8 | |
| | | | | | | | | | | | | | | | | | | | | | | | | | | | | |
| Total assets | | | 109.8 | | | | 45.5 | | | | 141.4 | | | | 14.2 | | | | 241.1 | | | | 247.4 | | | | 210.5 | |
| | | | | | | | | | | | | | | | | | | | | | | | | | | | | |
| Operating profit/(loss) before tax (adjusted) | | | 2.4 | | | | 0.9 | | | | 1.5 | | | | 0.6 | | | | 2.5 | | | | (1.6 | ) | | | (2.1 | ) |
| | | | | | | | | | | | | | | | | | | | | | | | | | | | | |
1 Negative market risk numbers are due to the diversification effect allocated to CC–Core Functions. 2 Swiss SRB leverage ratio denominator is the average for the fourth quarter of 2013.
151
Risk, treasury and capital management
Risk management and control
| | | | | | | | | | |
| | Risk categories We categorize the risks faced by our business divisions and Corporate Center as outlined in the table below. Risk definitions |
| | | | | | | Risk managed by | | Independent
oversight by | | Captured in our risk
appetite framework |
 | | Primary risks: the risks that our businesses may take in pursuit of their business objectives |
| | Credit risk: the risk of loss resulting from the failure of a client or counterparty to meet its contractual obligations. This includes settlement risk and loan underwriting risk: Settlement risk: the risk of loss resulting from transactions involving exchange of value where we must fulfill our obligation to deliver without first being able to determine with certainty that we will receive the counter value Loan underwriting risk: the risk of loss arising during the holding period of financing transactions which are intended for further distribution | | | | Business management | | Risk Control | | 
|
| | Market risk: the risk of loss resulting from changes in general market risk factors (e.g., interest rates, equity index levels, exchange rates, commodity prices and general credit spreads) and changes in prices of debt and equity instruments which result from factors and events specific to individual companies or entities. Market risk includes issuer risk and investment risk: Issuer risk:the risk of loss from changes in fair value resulting from credit-related events affecting an issuer or group of related issuers, including sovereigns, to which we are exposed through tradable securities or derivatives referencing the issuer Investment risk: issuer risk associated with positions held as financial investments | | | | Business management | | Risk Control | | |
| | Country risk:the risk of losses resulting from country-specific events. It includes transfer risk, whereby a country’s authorities prevent or restrict the payment of an obligation, as well as systemic risk events arising from country-specific political or macroeconomic developments | | | | Business management | | Risk Control | | |
| | Consequential risks: the risks to which our businesses are exposed as a consequence of being in business |
| | Liquidity risk: the risk of being unable to generate sufficient funds from assets to meet payment obligations when they fall due, including in times of stress | | | | Group Treasury | | Risk Control | | |
| | Funding risk: the risk of higher than expected funding costs due to higher than expected UBS credit spreads when existing funding positions mature and need to be rolled over, or replaced by other more expensive funding sources. If a shortage of available funding sources is expected in a stress event, funding risk also covers potential additional losses from forced asset sales | | | | | | | | |
| | Operational risk: the risk of loss resulting from inadequate or failed internal processes, people and systems, or from external events. Operational risk includes legal risk and compliance risk: | | | | Business management | | Risk Control | | |
| | Legal risk: the risk of (i) financial loss resulting from the non-enforceability of a contract, or (ii) loss due to UBS being held responsible for a contractual or legal claim, debt or legal action based on the breach or default of a contract, commitment of a tort, violation of law, infringement of trademarks or antitrust action | | | | | | Legal | | |
| | Compliance risk: the financial or reputational risk incurred by UBS by not adhering to the applicable laws, rules and regulations, local and international best practice (including ethical standards) and UBS’s own internal standards | | | | | | Risk Control | | |
| | Structural foreign exchange risk: the risk of decreases in our capital, due to changes in foreign exchange rates with an adverse translation effect on capital held in currencies other than CHF | | | | Group Treasury | | Risk Control | | |
| | Pension risk: the risk of a negative impact on other comprehensive income as a result of deteriorating funded status from decreases in the fair value of assets held in the defined benefit pension funds and/or changes in the value of defined benefit pension obligations, due to changes in actuarial assumptions (e.g., discount rate, life expectancy, rate of pension increase) and/or changes to plan designs | | | | Human Resources | | Risk Control and Finance | | |
| | Environmental and social risk: the possibility of UBS suffering reputational or financial harm from transactions, products, services or activities that involve a party associated with environmentally or socially sensitive activities è Refer to the “Corporate responsibility” section of this report for more information | | | | Business management | | Risk Control | | |
| | Reputational risk: the risk of a decline in the reputation of UBS from the point of view of its stakeholders – customers, shareholders, staff and general public | | | | All functions | | Control functions | | |
| | Business risks: the risks arising from the commercial, strategic and economic environment in which our businesses operate |
| | Business risks: the potential negative impact on earnings from lower than expected business volumes and/or margins, to the extent not offset by a decrease in expenses | | | | Business management | | Finance | | |
152
|
Risk, treasury and capital management |
|
|
Top and emerging risks
Our approach to identifying and monitoring top and emerging risks is an ongoing part of our risk management framework. The top and emerging risks disclosed below reflect those risks that we currently consider have the potential for high impact on the Group and which could materialize within one year. Investors should also carefully consider all information set out in the “Risk factors” section of this report, where we discuss the top and emerging risks in more detail and where we also discuss other risks we currently consider material, which we are presently aware of and which may impact our ability to execute our strategy and affect our business activities, financial condition, results of operations and prospects.
Regulatory and legislative changes: We continue to be exposed to a number of regulatory and legislative changes, some of which have already been adopted and implemented, but some of which are subject to legislative action or to further rulemaking by regulatory authorities before final implementation. This results in uncertainty as to whether and in which form these regulatory and legislative changes will be adopted, the timing and content of implementing regulations and interpretations and/or the dates of their effectiveness. In addition, both adopted and proposed changes differ significantly across the major jurisdictions, making it increasingly difficult to manage a global institution and potentially putting us at a disadvantage to those peers operating in jurisdictions considered to be less stringent.
We have programs in place to address the risks arising from regulatory and legislative changes, including ongoing monitoring of proposals, providing guidance and feedback to the relevant authorities and developing internal assessment and implementation plans. During 2013, our more active programs included those relating to resolution planning and resolvability, new and revised capital-, liquidity- and funding-related ratios and the Minder Initiative. We have made good progress across all of these programs in preparing for their implementation, including announcing our intention to establish a new banking subsidiary of UBS AG in Switzerland. Our phase-in leverage ratio and pro-forma LCR and NSFR as of 31 December 2013 were 4.65%, 110%, and 109%, respectively and, based on our current understanding of the potential requirements, we expect to be in full compliance with all of these requirements when they become effective.
In addition, following discussions with FINMA, UBS has mutually agreed to an incremental operational risk capital requirement which had an unexpected significant effect on our RWA in 2013 that amounted to CHF 22.5 billion as of 31 December 2013. We continue to work closely with FINMA and other regulators to mitigate the risk of further additional capital requirements, as well as
working to reduce the level of incremental operational risk-related RWA.
| | è | | Refer to “Regulatory and legislative changes may adversely affect our business and ability to execute our strategic plans” in the “Risk factors” section of this report for more information |
| | è | | Refer to the “Treasury management” section of this report for more information on the LCR and the NSFR |
| | è | | Refer to the “Capital management” section of this report for more information on the leverage ratio |
| | è | | Refer to the “Regulatory and legal developments” section of this report for more information on the Minder Initiative |
| | è | | Refer to “Operational risk” in this section for more information on the incremental operational risk capital requirement |
Legal and regulatory risks: We are subject to a large number of claims, disputes, legal proceedings and government investigations and we anticipate that our ongoing business activities will continue to give rise to such matters in the future. We continue to work on enhancing our operational risk framework and our relationships with regulatory authorities and on resolving open matters in a manner most beneficial to our stakeholders. Information on those litigation, regulatory and similar matters currently considered by management as significant is disclosed in Note 22 of the “Financial information” section of this report. The extent of our financial exposure to these and other matters could be material and could substantially exceed the level of provisions that we have established, which was CHF 1.6 billion as of 31 December 2013. Considering our overall exposures and the current regulatory and political climate affecting financial institutions, we expect charges associated with these matters to remain at elevated levels through 2014.
| | è | | Refer to “Material legal and regulatory risks arise in the conduct of our business” in the “Risk factors” section of this report for more information |
Market conditions and the macroeconomic climate: We are exposed to a number of macroeconomic issues as well as general market conditions. These external pressures may have a significant adverse effect on our business activities and related financial results, primarily through reduced margins, asset impairments and other valuation adjustments. Developments in the eurozone are currently considered by management to be of the greatest significance to us, due to the lackluster economic outlook, potential implications of the slowing of reforms, uncertainty regarding the outcome of the European Central Bank’s comprehensive assessment and the potential disruption, in the event that one or more countries exit the euro. Our current exposures to select eurozone countries are disclosed in “Country risk.” In addition, as our strategic plans depend more heavily upon our ability to generate growth and revenue in emerging markets particularly
153
Risk, treasury and capital management
Risk management and control
in Asia, management is monitoring developments in this geographic sector very closely. These macroeconomic factors are considered in our development of stress testing scenarios for our ongoing risk management activities.
| | è | | Refer to “Performance in the financial services industry is affected by market conditions and the macroeconomic climate” in the “Risk factors” section of this report for more information |
| | è | | Refer to “Risk measurement” in this section for more information on macroeconomic considerations, including stress testing |
Execution of our strategy: In October 2012, we announced a significant acceleration in the implementation of our strategy to focus our activities on a set of highly synergistic, less capital- and balance sheet-intensive businesses dedicated to serving clients and well-positioned to maximize value for shareholders. During 2013, we made significant progress in implementing that strategy and are ahead of the majority of our performance targets, including improving our leading fully applied Basel III common equity tier 1 (CET1) ratio 300 basis points in the year to 12.8% and surpassing our fully applied RWA reduction target for the year. There continues to be a risk that we will not be successful in completing the execution of our plans, or that our plans may be delayed or that the effects of our plans may differ from those intended. This could lead to a reduction in the confidence of our stakeholders and challenges in meeting regulatory requirements in the future.
| | è | | Refer to “We may not be successful in completing our announced strategic plans or in implementing changes in our businesses to meet changing market, regulatory and other conditions” in the “Risk factors” section of this report for more information |
| | è | | Refer to “Regulatory and legislative changes may adversely affect our business and ability to execute our strategic plans” in the “Risk factors” section of this report for more information |
| | è | | Refer to “We hold legacy and other risk positions that may be adversely affected by conditions in the financial markets; legacy risk positions may be difficult to liquidate” in the “Risk factors” section of this report for more information |
| | è | | Refer to “We might be unable to identify or capture revenue or competitive opportunities, or retain and attract qualified employees” in the “Risk factors” section of this report for more information |
| | è | | Refer to the “Our strategy” section of this report for more information on our strategy |
Reputational risk: Our reputation is critical to achieving our strategic goals and financial targets and damage to our reputation can have fundamental negative effects on our business and prospects. This has been emphasized for us in recent years following events such as the LIBOR matter and the unauthorized trading incident and has triggered an enhanced focus on sustaining a strong risk culture across the Group.
| | è | | Refer to “Our reputation is critical to the success of our business” in the “Risk factors” section of this report for more information |
| | è | | Refer to “Risk culture” in this section for more information |
Other operational risks: Due to the operational complexity of all our businesses, we are continually exposed to operational risks such as process error, failed execution and fraud. We believe we have a strong operational risk management framework in place to help ensure that these risks are appropriately controlled, which has been significantly enhanced following the unauthorized trading incident in 2011. In view of the changing nature of operational risks and the environment within which we operate, we continuously review our associated control frameworks to allow us to make enhancements where necessary. In this regard, key compliance risk focus areas for 2014 will include conduct risk and other areas where we see evolving inherent risk considerations or regulatory landscape, such as suitability, conflicts of interest, anti-money laundering and corruption. Additionally, the increasingly complex threat of cyber-attacks and cyber-criminal activity facing the financial services industry is evolving and we have initiated multiple security programs to address this threat.
| | è | | Refer to “Operational risks may affect our business” in the “Risk factors” section of this report for more information |
| | è | | Refer to “Operational risk” in this section for more information on our management of operational risk |
154
|
Risk, treasury and capital management |
|
|
| | | | |
| | Our risk governance framework operates along three lines of defense: business management, who own their risk exposures, control functions, which provide independent oversight of risks, and Group Internal Audit, which evaluates the overall effectiveness of the control environment. |
These key roles and responsibilities for risk management and control are illustrated in the following chart and described below.
155
Risk, treasury and capital management
Risk management and control
| | | | | | |
| | TheBoard of Directors (BoD) is responsible for determining the Group’s risk principles, risk appetite and major portfolio limits, including their allocation to the business divisions and Corporate Center. The risk assessment and management oversight performed by the BoD considers evolving best practices and is intended to conform to statutory requirements. The BoD has a Risk Committee, which monitors and oversees the Group’s risk profile and the implementation of the risk framework as approved by the BoD, as well as assessing and approving the Group’s key risk measurement methodologies. The Risk Committee, in conjunction with the Chairman of the BoD and the Audit Committee, oversees the performance of Group Internal Audit. | | |
| | TheGroup Chief Executive Officer (Group CEO) is responsible for the results of the Group, has risk authority over transactions, positions and exposures, and also allocates portfolio limits approved by the BoD within the business divisions and Corporate Center. | | |
| | TheGroup Executive Board (GEB) implements the risk framework, controls the Group’s risk profile and approves key risk policies. | | |
| | Business management comprises divisional and regional Chief Executive Officers. Thedivisional Chief Executive Officers are accountable for the results of their business divisions. This includes actively managing their risk exposures and ensuring profit potential, risk, balance sheet and capital usage are balanced. Theregional Chief Executive Officers coordinate and implement UBS’s strategy in their region, jointly with the divisional CEOs and heads of the control and support functions. They have a veto power over decisions in respect to all business activities that may have a negative regulatory or reputational impact in their respective regions. | | |
| | TheGroup Chief Risk Officer (Group CRO) reports directly to the Group CEO and has functional and management authority over Risk Control (including compliance) throughout the Group. Risk Control provides independent oversight of all primary and certain consequential risks as outlined in “Risk categories.” This includes establishing methodologies to measure and assess risk, setting risk limits, and developing and operating an appropriate risk control infrastructure. The risk control process is supported by a framework of policies and approval authorities.Divisional and regional Chief Risk Officers have delegated authority for their respective divisions and regions. Further, authorities are delegated to risk officers according to their expertise, experience and responsibilities. | | |
| | | | |
| | TheGroup Chief Financial Officer (Group CFO) is responsible for ensuring that disclosure of our financial performance meets regulatory requirements and corporate governance standards as well as being leading practice in clarity and transparency. The Group CFO is also responsible for the management of UBS’s tax affairs, treasury and capital, including management of funding and liquidity risk and UBS’s regulatory capital ratios. Responsibility for implementation of the control framework for tax and funding risks resides with the Group CFO whereas responsibility for implementation of the control framework for treasury activities is with Risk Control. |
| | TheGroup General Counsel (Group GC) is responsible for implementing the Group’s risk management and control principles for legal matters, and for managing the legal function for the UBS Group. The Group GC is responsible for reporting legal risks and material litigation, and for managing legal, internal, special and regulatory investigations. |
| | Group Internal Audit (GIA) independently, objectively and systematically assesses the adherence to our strategy, the effectiveness of governance, risk management and control processes at Group, divisional and regional levels, including compliance with legal, regulatory and statutory requirements, as well as with internal policies and contracts. GIA has a functional reporting line to the Risk Committee and the Audit Committee. |
| | Risk appetite framework Our risk appetite framework contains both qualitative and quantitative risk appetite statements. The qualitative risk appetite statements comprise the risk management and control principles and various policies and initiatives that ensure we maintain the desired risk culture. The quantitative statements aim to ensure the Group’s resilience against the impact of potential severe adverse economic or geopolitical events, by setting objectives for the level of capital, earnings and liquidity that we seek to maintain even after experiencing severe losses over a defined time horizon. The framework is comprehensive in aggregating all material risks across the Group. The combination of the qualitative and quantitative risk appetite statements aims to protect our businesses and reputation in both normal and stressed environments. |
| | | | | | | | | | | | | | | | | | | | |
| | Risk management and control principles |
| | | | |
| | Protection of financial strength | | | | Protection of reputation | | | | Business management accountability | | | | Independent controls | | | | Risk disclosure | | |
| | Protecting the financial strength of UBS by controlling our risk exposures and avoiding potential risk concentrations at individual exposure levels, at specific portfolio levels and at an aggregate firm-wide level across all risk types | | | | Protecting our reputation through a sound risk culture characterized by a holistic and integrated view of risk, performance and reward, and through full compliance with our standards and principles, particularly our Code of Business Conduct and Ethics | | | | Ensuring management accountability, whereby business management, as opposed to Risk Control, owns all risks assumed throughout the firm and is responsible for the continuous and active management of all risk exposures to ensure that risk and return are balanced | | | | Independent control functions which monitor the effectiveness of the business’s risk management and oversee risk-taking activities | | | | Disclosure of risks to senior management, the Board of Directors, shareholders, regulators, rating agencies and other stakeholders with an appropriate level of comprehensiveness and transparency | | |
156
|
Risk, treasury and capital management |
|
|
Risk principles and risk culture
A strong and dynamic culture is a prerequisite for success in today’s highly complex operating environment. We are focused on fostering and further developing our cultural strength and ensuring it is a competitive advantage both from a risk and a performance point of view. Our efforts are underpinned by our shared belief that how we deliver results is as important as the results themselves.
In 2013, the Group Executive Board (GEB) led a global initiative to foster the strong aspects of the Group’s culture and evolve them further, building on our strategic pillars – capital strength, efficiency and effectiveness, and risk management – and our principles: excellence, client focus and sustainable performance. We began a program to raise awareness and further embed the standards of behavior we ask of our employees at every level of the Group. Each employee is accountable for ensuring these behaviors are integrated into every aspect of their daily work. To reflect the importance we attach to this, we incorporated assessment of adherence to these standards in our performance measurement and compensation framework for 2013.
Our performance measurement and management process requires that all employees have risk objectives aligned to their roles and responsibilities. Our employees know that rigorous risk management plays an essential role in our efforts to deliver the best possible client experience and achieve our business objectives. In short, everyone at UBS is responsible for anticipating, addressing and managing risks. We encourage our employees to provide candid, constructive and actionable feedback. To that end, in 2013, we enhanced our process by making such feedback anonymous. The performance measurement and management process links into the Group’s compensation framework.
Our compensation philosophy is to provide our employees with compensation that recognizes their individual contributions and clearly links their pay to performance – not simply the delivery of business targets, but also how those results were achieved. As explained in more detail in the “Compensation” section of this report, the performance of GEB members includes both quantitative and qualitative factors, with the latter contributing 35% to their overall compensation decision. Qualitative factors include reinforcing a culture of accountability and responsibility, demonstrating commitment to being a responsible corporate citizen and acting with integrity in all interactions with our stakeholders.
The “Compensation” section of this report explains how the compensation of each employee is based on the individual’s contribution (absolute and relative) and shows how the individual’s contribution to promoting our principles and standards of behaviors is factored into the compensation process. The process includes an examination of the individual’s efforts to actively manage risk, striking an appropriate balance between risk and reward, and to what extent the individual exhibited professional and ethical behavior. Forfeiture provisions enable the firm to forfeit some, or all, of any unvested deferred portion of compensation if an employee commits certain harmful acts.
In addition, we have a range of policies and initiatives in place to embed the desired risk culture within the Group, covering employees
at all levels. These policies and initiatives include the following.
Code of Business Conduct and Ethics
This Code enshrines the principles and practices that all of our employees and Board members are required to follow unreservedly, both in letter and in spirit, supported by an annual adherence certification process. Included in the Code are requirements covering laws, rules and regulations, ethical and responsible behavior, information management, the work environment, social responsibility and disciplinary measures.
Whistleblowing
Our Whistleblowing policy provides a formal framework and independent channel for employees to raise concerns about suspected breaches of the Group’s laws, regulations, policies, procedures or other matters including those covered by our Code of Business Conduct and Ethics. In recognition of the importance for a strong and successful business of enabling employees to speak up and constructively challenge others, in 2013 our Chairman and Group CEO promoted an awareness campaign of our Whistleblowing policy.
Compliance and risk training
We have a mandatory training program for all employees covering a range of compliance and risk-related topics including anti-money laundering and operational risk. In addition, more specialized training is provided for employees according to their roles and responsibilities, such as training on credit risk and market risk for those working in trading areas. During 2013, employees were required to complete over 500,000 mandatory training sessions in aggregate, an increase of approximately one-third from 2012. The training sessions need to be completed, usually together with an assessment, within a specified period of time. Since mid-2012, failure to satisfactorily complete the mandatory training sessions within 30 days of the deadline results in disciplinary action, usually in the form of a written warning, with employees still required to complete the training. In 2013, 12 employees received such a warning and ultimately our completion rate for these mandatory training sessions was 100%. If an employee fails to complete two or more training sessions within 10 days of the deadline, this is factored into the performance measurement and management process and the related promotion and compensation processes.
Principles of good supervision
The Group has developed principles of good supervision, which are applicable to every region and business division of UBS. These principles establish clear expectations of managers and employees with respect to supervisory responsibilities, specifically: to take responsibility, to organize their business, to know their employees and what they do, to know their business, to create a good compliance culture and to respond to and resolve issues. Supervisors are expected to understand and set a good example of professional behavior and to act as role models, to be open about issues, to be attentive to unusual behavior and to act on any red flags,
Risk, treasury and capital management
Risk management and control
ensuring that issues are resolved. To ensure adherence, frameworks have been established which are subject to periodic review and assessment.
Maintaining a strong culture complements our goal of being a responsible corporate citizen. As a truly global firm with a diverse workforce, we have a deep understanding and appreciation of the communities in which we operate. Our longstanding and active community affairs programs are focused on promoting education and entrepreneurship supported by the volunteering efforts of our employees across the globe. These programs continued to thrive in 2013. For instance, we launched new initiatives in the Americas and received various awards for our work in the UK. In the second quarter, the UBS Optimus Foundation announced a new and major global initiative to put nutrition at the center of the global development agenda and, later in the year, the Foundation was involved in fundraising for Typhoon Haiyan relief efforts in the Philippines. The Group matched client and employee donations on a 1:1 basis. In the third quarter, UBS was named in the Dow Jones Sustainability Indices which track the leading sustainability-driven companies worldwide. Additionally,
we co-launched the Thun Group of Banks’ discussion paper on banking and human rights. In the fourth quarter, our Global Philanthropy Forum looked at how we can work with clients to help improve women’s rights and opportunities around the world. During 2013, we also continued our support for the arts through culturally enriching programs for our clients, employees and the public, including the launch of a multi-year agreement with Art Basel and support for exhibitions in the Americas and in Switzerland.
| | è | | Refer to the “Our employees” and “Compensation” sections of this report for more information |
Quantitative risk appetite objectives
Through a set of quantitative risk appetite objectives, we aim to ensure that our aggregate risk exposure is within our desired risk capacity, based on our capital and business plans. The specific definition of risk capacity for each objective seeks to ensure that we have sufficient capital, earnings and funding liquidity to protect our business franchises and exceed minimum regulatory requirements under a severe stress event. The risk appetite objectives
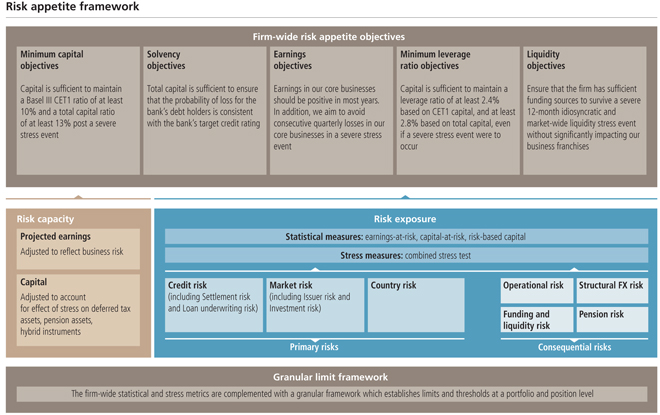
158
|
Risk, treasury and capital management |
|
|
| | |
| | are evaluated as part of the annual business planning process, and approved by the BoD. The comparison of risk exposure with risk capacity is a key consideration in management decisions on potential adjustments to the business strategy and the risk profile of the Group. |
| | We make use of both scenario-based stress tests and statistical risk measurement techniques to assess the impact of a severe stress event at a Group-wide level. These complementary frameworks capture exposures to all material primary and consequential risks across all of our business divisions and the Corporate Center. |
| | è Refer to “Risk measurement” in this section for more information on our stress test and statistical frameworks |
| |
| | In determining our risk capacity, we adjust projected earnings from the strategic plan for business risk to reflect lower expected earnings in a severe stress event, and include the impact on deferred tax assets, pension assets and hybrid capital instruments through adjustments to our capital. |
| | The chart on the previous page provides an overview of our quantitative risk appetite objectives. Our strategic plan approved by the BoD is consistent with these objectives. |
| | |
| | Risk measurement |
| | A variety of methodologies and measurements are applied to quantify the risks of our portfolios and potential risk concentrations. Risks that are not fully reflected within standard measures are subject to additional controls, which may include pre-approval of specific transactions and the application of specific restrictions. Models to quantify risk are generally developed by dedicated units within control functions, are independently verified and subjected to periodic confirmation and control by the Group CRO and the Group CFO organizations. |
| |
| | Stress testing |
| | We perform stress testing to quantify the loss that could result from extreme yet plausible macroeconomic and geopolitical stress events. This enables us to identify, better understand and manage our potential vulnerabilities and risk concentrations. Stress testing plays a key role in establishing limits at Group-wide, divisional and portfolio levels. Stress test results are regularly reported to the BoD, the Risk Committee and GEB. We also provide detailed stress loss analyses to the Swiss Financial Market Supervisory Authority (FINMA) in accordance with its requirements. As described |
159
Risk, treasury and capital management
Risk management and control
in the “Risk appetite” section above, stress testing, along with statistical loss measures, plays a central role in risk appetite and business planning processes.
Our stress testing framework incorporates three pillars: (i) combined stress tests, (ii) a comprehensive range of portfolio- and risk-type-specific stress tests and (iii) reverse stress testing.
Ourcombined stress test (CST) framework is scenario-based and aims to quantify overall Group-wide losses which could result from a number of potential global systemic events. The framework captures all primary and consequential risks, as well as business risks, as shown in the “Risk categories” section above. Scenarios are forward-looking and encompass macroeconomic and geopolitical stress events calibrated to different levels of potential severity. Each scenario is implemented through the expected evolution of market indicators and economic variables under that scenario. The resulting effect on our primary, consequential and business risks is then assessed to estimate the overall loss and capital implications were the scenario to occur. At least once a year, the Risk Committee approves the most relevant scenario, known as the binding scenario, to be used as the main scenario for regular CST reporting and for monitoring risk exposure against our minimum capital and earnings objectives in our risk appetite framework. Results are reported to, and discussed with, the Risk Committee and the GEB on a monthly basis and reported to the BoD and FINMA monthly. The results of other CST scenarios are monitored and reported quarterly to the BoD, the Risk Committee, the GEB and FINMA.
Within the overall model governance framework overseen by the Group CRO and Group CFO, the Risk Aggregation and Stress Committee (RASC) is responsible for ensuring the consistency and adequacy of methodologies and scenarios used for our Group-wide stress measures and risk aggregation. As part of these responsibilities, the RASC is charged with ensuring that the suite of stress scenarios adequately reflects current and potential developments in the macroeconomic and geopolitical environment, our current and planned business activities, and actual or potential risk concentrations and vulnerabilities in our portfolios. The RASC meets at least quarterly and is comprised of Group and divisional representatives of Risk Control and the Group Treasurer. In executing its responsibilities, the RASC considers input from the Risk “Think Tank,” a panel of senior representatives from the business divisions, Risk Control and economic research, which meets quarterly to review the current and possible future market environment, with the aim of identifying potential stress scenarios which could materially impact the Group’s profitability. This results in a range of internal stress scenarios that are developed and evolve over time, separate from the scenarios mandated by FINMA.
Each scenario captures a wide range of macroeconomic variables that are considered relevant to assessing the impact of the stress scenario on our portfolios. These include gross domestic
product (GDP), equity indices, interest rates, foreign exchange rates, unemployment and property prices. Assumed changes in these macroeconomic variables in each scenario are used to stress the key risk drivers of our portfolios. For example, lower GDP growth and rising interest rates may reduce the profitability of clients to whom we have lent money, leading to changes in the credit risk parameters for probability of default, loss given default and exposure at default, and resulting in higher predicted credit losses in the stress scenario. We also capture the business risk resulting from lower fee income, interest income and trading income. These effects are measured across all material risk types and all businesses to calculate the aggregate estimated effect of the scenario on profit and loss, other comprehensive income, RWA, Swiss SRB leverage ratio denominator (LRD) and, ultimately, our capital and leverage ratios.
For 2013, the binding scenario for CST was the internalEuro Crisis scenario.This scenario assumes a worsening economic environment in the eurozone with defaults of certain countries in the form of debt restructurings, coupled with a disorderly exit from the eurozone by one country. This triggers sell-offs in financial markets, increased market volatility and severe pressure on the euro. The European economy falls into recession and sovereign exposures on banks’ balance sheets trigger a banking crisis in Europe. The Swiss export and tourism industries are assumed to be severely affected.
As part of the CST framework, five additional stress scenarios are routinely monitored.
| – | | Recession scenario represents renewed financial market turmoil due to the failure of a major global financial institution, leading to prolonged financial deleveraging and dramatically plunging activity around the globe. |
| – | | US Crisis scenariorepresents a loss of confidence in the US, leading to international portfolio repositioning out of US dollar-denominated assets, sparking an abrupt and substantial US dollar sell-off. The US is pushed back into recession, other industrialized countries replicate this pattern and inflationary concerns lead to an overall higher interest rate level. |
| – | | China Hard Landing scenario represents an economic correction in China with resulting impact on the global economy, particularly emerging markets. |
| – | | Middle East/North Africa scenario represents a spill-over of political upheaval leading to a spike in oil prices and a recession in developed countries. |
| – | | Depression scenariorepresents a more pronounced and prolonged version of the Euro Crisis scenario. Additional peripheral countries default and exit the eurozone, and advanced economies are pulled into a prolonged period of economic stagnation. |
CST results over the year indicate a reduction in risk levels, as expected, in line with the execution of our strategy to operate a more client-focused and less capital-intensive Investment Bank.
160
|
Risk, treasury and capital management |
|
|
| | | | |
| | Portfolio-specific stress tests are measures that are tailored to the risks of specific portfolios. Our portfolio stress loss measures are informed by past events but also include forward-looking elements. For example, the stress scenarios for trading risks capture the liquidity characteristics of different markets and positions. Results of portfolio-specific stress tests may be subject to limits to explicitly control risk-taking, or may be monitored without limits to identify vulnerabilities. |
| | Reverse stress testing starts from a defined stress outcome (for example, a specified loss amount, reputational damage, a liquidity shortfall, or a breach of regulatory capital ratios) and works backwards to identify the economic or financial scenarios that could result in such an outcome. As such, reverse stress testing is intended to complement forward stress tests by assuming “what if” outcomes that could extend beyond the range normally considered, and thereby potentially challenge assumptions regarding severity and plausibility. The results of reverse stress testing are reported to relevant governance bodies according to the materiality and scope of the exercise. |
| | Additionally, the impact of increasing interest rates, and changes in the structure of yield curves, is routinely analyzed. |
| | Most major financial firms employ stress tests, but their approaches vary significantly, having been tailored to their individual business models and portfolios. Moreover, there is a lack of industry standards defining stress scenarios or the way they should be applied to a firm’s risk exposures. Consequently, comparisons of stress test results between firms can be misleading and, therefore, like many of our peers, we do not publish quantitative stress test results of our internal stress tests. |
| | è Refer to “Credit risk” and “Market risk” in this section for more information on stress loss measures |
| |
| | Statistical measures |
| | In addition to our scenario-based CST measure, we employ a statistical stress framework that allows us to calculate and aggregate risks using statistical techniques, enabling us to derive stress events at chosen confidence levels. |
| | This framework is used to derive a distribution of potential earnings based on historically observed market changes, the level of risk exposures, and business plan forecasts, considering effects on both income and expenses. From this we determine earnings-at-risk (EaR), which measures the potential shortfall in earnings (the deviation from forecasted earnings) at a 95% confidence level and which we evaluate over both three-month and one-year horizons. EaR is used for the assessment of the earnings objectives in our risk appetite framework. |
| | We extend the EaR measure by incorporating the effects of gains and losses recognized through other comprehensive income, to derive a distribution of potential effects on capital. From this distribution, we establish capital-at-risk (CaR) measures based on confidence levels from 95% to 99.9%. These measures consider the impact on Basel III common equity tier 1 (CET1) capital of stress |
| | | | |
| | events at the respective confidence levels and are used for the assessment of our capital, solvency and leverage ratio objectives. |
| | We also derive risk-based capital (RBC) from this distribution, taken at a 99.97% confidence level, to provide an estimate of the potential capital impairment in such an extreme stress event. As discussed above, RBC is a core component of our equity attribution framework. |
| | è Refer to “Credit risk,” “Market risk” and “Operational risk” in this section for more information on ourportfolio-level statistical loss measures |
| |
| | Portfolio and position limits |
| | The Group-wide stress and statistical metrics are complemented by lower-level portfolio and position limits. The combination of these measures provides for a comprehensive, granular limit framework which is applied to our business divisions and Corporate Center as relevant to the key risks arising from their business models. |
| | We apply limits to a variety of exposures at portfolio level, using statistical- and stress-based measures, such as value-at-risk, liquidity adjusted stress, notional loan underwriting limits, economic value sensitivity and portfolio default simulations for our loan books. These are complemented with a set of thresholds for net interest income sensitivity, mark-to-market losses on available-for-sale portfolios, and the impact of foreign exchange movements on capital and capital ratios. |
| | Portfolio measures are supplemented with position-level limits. Risk measures for position limits are based on market risk sensitivities and counterparty-level credit risk exposures. Market risk sensitivities include sensitivities to changes in general market risk factors such as equity indices, foreign exchange rates and interest rates, and sensitivities to issuer-specific factors such as changes in an issuer’s credit spread or default risk. We monitor a significant number of market risk limits for the Investment Bank and Corporate Center – Non-core and Legacy Portfolio on a daily basis. Counterparty measures capture the current and potential future exposure to an individual counterparty taking into account collateral and legally enforceable netting agreements. |
| |
| | Risk concentrations |
| | A risk concentration exists where (i) a position is affected by changes in a group of correlated factors, or a group of positions are affected by changes in the same risk factor or a group of correlated factors, and (ii) the exposure could, in the event of large but plausible adverse developments, result in significant losses. The categories in which risk concentrations may occur include counterparties, industries, legal entities, countries, products and businesses. |
| | The identification of risk concentrations requires judgment, as potential future developments cannot be accurately predicted and may vary from period to period. In determining whether we have a risk concentration, we consider a number of elements, both individually and collectively. These elements include the |
161
Risk, treasury and capital management
Risk management and control
| | | | |
| | shared characteristics of the positions and our counterparties, the size of the position or group of positions, the sensitivity of the position or group of positions to changes in risk factors and the volatility and correlations of those factors. Also important in our assessment is the liquidity of the markets where the positions are traded, and the availability and effectiveness of hedges or other potential risk-mitigating factors. The value of a hedge instrument may not always move in line with the position being hedged, and this mismatch is referred to as basis risk. |
| | | | |
| | Risk concentrations are subject to increased monitoring by Risk Control and are assessed to determine whether they should be reduced or mitigated depending on the available means to do so. It is possible that material losses could occur on asset classes, positions and hedges, particularly if the correlations that emerge in a stressed environment differ markedly from those envisaged by our risk models. |
| | è Refer to “Credit risk” and “Market risk” in this section for more information on the compositions of our portfolios |
162
|
Risk, treasury and capital management |
|
|
Credit risk
| | | | |
| | Key developments during the period |
| |
| | During 2013, we actively managed down risks within Non-core and Legacy Portfolio, disposing of our more liquid loan positions alongside the steady run-off of the Non-core loan book. Exposures to over-the-counter derivative contracts were reduced through negotiated bilateral settlements, portfolio compressions, negotiated assignments and novations, and commutations of monoline insurance. We experienced moderate increases in credit exposures in line with our strategy to grow our wealth management lending businesses. The delinquency ratio of our Swiss residential mortgage loans and our Swiss corporate loans remained at low levels. Loan underwriting activity within the Investment Bank remained steady, with distribution of loans through syndication and securitization continuing to be sound. Net credit loss expenses totaled CHF 50 million, taking into account releases of collective loan loss allowances of CHF 93 million. The amount of impaired loans decreased by CHF 0.4 billion to CHF 1.2 billion, mainly as a result of repayments. |
| |
| | Main sources of credit risk |
| | – | | Our lending exposure arises mainly from our Swiss domestic business, which offers corporate loans and mortgage loans secured against residential properties and income-producing real estate, and is therefore tied to the health of the Swiss economy. |
| | – | | Within the Investment Bank, our credit exposure is predominantly investment grade, but includes loan underwriting characterized by concentrated exposure to lower-rated credits, albeit of a temporary nature. |
| | – | | Our wealth management businesses conduct securities-based lending and mortgage lending. |
| | – | | Credit risk within the Legacy Portfolio has been significantly reduced and the balance largely relates to securitized positions. |
| | – | | Derivatives activities, a significant portion of which has been determined to be non-core and will therefore be run down, are predominantly transacted on a cash collateralized basis. |
| | | | |
| | Overview of measurement, monitoring and management techniques |
| | – | | Credit risk arising from transactions with individual counterparties is measured according to our estimates of probability of default, exposure at default and loss given default. Limits are established for individual counterparties and groups of counterparties covering banking and traded products as well as settlement amounts. Risk control authorities are approved by the Board of Directors and are delegated to the Group CEO, Group CRO and divisional Chief Risk Officers based on risk exposure amounts and internal credit rating. |
| | – | | Limits apply not only to the current outstanding amount, but also to contingent commitments and the potential future exposure of traded products. |
| | – | | For the Investment Bank, our monitoring, measurement and limit framework distinguishes between exposures intended to be held to maturity (take-and-hold exposures) and those which are intended to be held for a short term, pending distribution or risk transfer (temporary exposures). |
| | – | | We also use models to derive portfolio credit risk measures of expected loss, statistical loss and stress loss at the Group-wide and business division levels and establish portfolio level limits at these levels. |
| | – | | Credit risk concentrations can arise if clients are engaged in similar activities, are located in the same geographical region or have comparable economic characteristics, for example if their ability to meet contractual obligations would be similarly affected by changes in economic, political or other conditions. To avoid credit risk concentrations, we establish limits and/or operational controls that constrain risk concentrations at portfolio and sub-portfolio levels with regard to sector exposure, country risk and specific product exposures. |
163
Risk, treasury and capital management
| | | | |
| | Credit risk profile of the Group – IFRS view |
| |
| | Maximum exposure to credit risk |
| | The table below represents the IFRS view of the Group’s maximum exposure to credit risk by class of financial instrument and the respective collateral and other credit enhancements mitigating credit risk for these classes of financial instruments. The maximum exposure to credit risk includes the carrying amounts of financial instruments recognized on the balance sheet subject to credit risk and the notional amounts for off-balance sheet arrangements. |
| | Where information is available, collateral is presented at fair value. For other collateral such as real estate, a reasonable alternative |
| | | | |
| | value is used. Credit enhancements, such as credit derivative contracts and guarantees, are included at their notional amounts. Both are capped at the maximum exposure to credit risk for which they serve as security. |
| | Further on in this section, we provide complementary views of credit risk based on our internal management view, which can differ in certain respects from the requirements of IFRS. |
| | è Refer to the “Supplemental disclosures required under Basel III Pillar 3 regulations” section of this report for more information on the credit exposures used in the determination of our required regulatory capital and additional information on credit derivatives |
| | | | | | | | | | | | | | | | | | | | | | | | | | | | | | | | | | |
| | Maximum exposure to credit risk |
| | | | | | 31.12.13 |
| | | CHF billion | | | | | | | Collateral | | | | Credit enhancements |
| | | | |
| Maximum
exposure to
credit risk |
| |
| Cash
collateral
received |
| |
| Collateralized
by securities |
| |
| Secured by
real estate |
| | Other collateral1 | | | | | Netting | | |
| Credit
derivative
contracts |
| | Guarantees |
| | Financial assets measured at amortized cost on the balance sheet | | | | | | | | | | | | | | | | | | | | | | | | | | | | |
| | Balances with central banks | | | 78.9 | | | | | | | | | | | | | | | | | | | | | | | | | |
| | Due from banks2 | | | 17.2 | | | | | | | | 0.5 | | | | | | | | | | | | | | | | | 0.3 |
| | Loans3 | | | 287.0 | | | | 13.3 | | | | 73.7 | | | | 161.5 | | | 18.3 | | | | | | | 0.1 | | | 2.7 |
| | Cash collateral on securities borrowed | | | 27.5 | | | | | | | | 27.3 | | | | | | | | | | | | | | | | | |
| | Reverse repurchase agreements | | | 91.6 | | | | | | | | 88.4 | | | | | | | 2.6 | | | | | | | | | | |
| | Cash collateral receivables on derivative instruments4 | | | 28.0 | | | | | | | | | | | | | | | | | | 14.2 | | | | | | | |
| | Other assets | | | 17.6 | | | | | | | | 11.2 | | | | | | | | | | | | | | | | | |
| | Total financial assets measured at amortized cost | | | 547.7 | | | | 13.3 | | | | 201.1 | | | | 161.5 | | | 20.8 | | | 14.2 | | | | 0.1 | | | 3.0 |
| | Financial assets measured at fair value on the balance sheet | | | | | | | | | | | | | | | | | | | | | | | | | | | | |
| | Positive replacement values5 | | | 245.8 | | | | | | | | | | | | | | | | | | 212.9 | | | | | | | |
| | Trading portfolio assets – debt instruments6, 7 | | | 35.4 | | | | | | | | | | | | | | | | | | | | | | | | | |
| | Financial assets designated at fair value – debt instruments8 | | | 6.8 | | | | | | | | 5.4 | | | | | | | 0.2 | | | | | | | 0.8 | | | |
| | Financial investments available-for-sale – debt instruments8 | | | 58.6 | | | | | | | | | | | | | | | | | | | | | | | | | |
| | Total financial assets measured at fair value | | | | | 346.6 | | | | 0.0 | | | | 5.4 | | | | 0.0 | | | 0.2 | | | 212.9 | | | | 0.8 | | | 0.0 |
| | Total maximum exposure to credit risk reflected on the balance sheet | | | | | 894.3 | | | | 13.3 | | | | 206.5 | | | | 161.5 | | | 21.0 | | | 227.1 | | | | 1.0 | | | 3.0 |
| | Guarantees | | | 18.7 | | | | 1.4 | | | | 1.7 | | | | 0.3 | | | 1.9 | | | | | | | 1.1 | | | 3.3 |
| | Loan commitments | | | 54.9 | | | | 0.2 | | | | 1.6 | | | | 1.3 | | | 8.5 | | | | | | | 11.0 | | | 1.9 |
| | Forward starting transactions, reverse repurchase and securities borrowing agreements | | | | | 9.4 | | | | | | | | 9.3 | | | | | | | | | | | | | | | | | |
| | Total maximum exposure to credit risk not reflected on the balance sheet | | | | | 83.1 | | | | 1.6 | | | | 12.6 | | | | 1.6 | | | 10.4 | | | 0.0 | | | | 12.2 | | | 5.2 |
| | Total at the year-end | | | | | 977.4 | | | | 14.9 | | | | 219.1 | | | | 163.1 | | | 31.4 | | | 227.1 | | | | 13.1 | | | 8.2 |
| | 1 Includes but not limited to life insurance contracts, inventory, accounts receivable, patents, and copyrights. 2 Due from banks includes amounts held with third-party banks on behalf of clients. The credit risk associated to these balances may be borne by those clients. 3 Loans include a balance outstanding of USD 2.7 billion to the BlackRock fund. This loan is collateralized by a portfolio of US residential mortgage-backed securities included within “Other collateral.” 4 Included within cash collateral receivables on derivative instruments are margin balances due from exchanges or clearing houses. The amount shown in the netting column represents the netting with related negative replacement values in accordance with Swiss federal banking law. 5 The amount shown in the netting column represents the netting with related negative replacement values and cash collateral payables in accordance with Swiss federal banking law. For the purpose of this disclosure, securities collateral was not considered. 6 These positions are generally managed under the market risk framework and are included in VaR. For the purpose of this disclosure, collateral and credit enhancements were not considered. 7 Does not include debt instruments held for unit-linked investment contracts and investment fund units. 8 Does not include investment fund units. |
164
|
Risk, treasury and capital management |
|
|
| | | | | | | | | | | | | | | | | | | | | | | | | | | | | | | | | | |
| | Maximum exposure to credit risk (continued) | |
| | | | 31.12.12 | |
| | | | | | | Collateral | | | Credit enhancements | |
| | CHF billion | | Maximum
exposure
to credit
risk | | | Cash
collateral
received | | | Collateralized
by securities | | | Secured
by real
estate | | | Other
collateral1 | | | Netting | | | Credit
derivative
contracts | | | Guarantees | |
| | Financial assets measured at amortized cost on the balance sheet | | | | | | | | | | | | | | | | | | | | | | | | | | | | | | | | |
| | | | | | | | | | | | | | | | | | | | | | | | | | | | | | | | | | |
| | Balances with central banks | | | 64.1 | | | | | | | | | | | | | | | | | | | | | | | | | | | | | |
| | | | | | | | | | | | | | | | | | | | | | | | | | | | | | | | | | |
| | Due from banks2 | | | 21.2 | | | | | | | | 2.7 | | | | | | | | 0.4 | | | | | | | | | | | | 0.4 | |
| | | | | | | | | | | | | | | | | | | | | | | | | | | | | | | | | | |
| | Loans3 | | | 279.9 | | | | 13.1 | | | | 65.9 | | | | 155.8 | | | | 18.3 | | | | | | | | 0.9 | | | | 2.5 | |
| | | | | | | | | | | | | | | | | | | | | | | | | | | | | | | | | | |
| | Cash collateral on securities borrowed | | | 37.4 | | | | | | | | 37.2 | | | | | | | | | | | | | | | | | | | | | |
| | | |
| | Reverse repurchase agreements | | | 130.9 | | | | | | | | 130.9 | | | | | | | | | | | | | | | | | | | | | |
| | | | | | | | | | | | | | | | | | | | | | | | | | | | | | | | | | |
| | Cash collateral receivables on derivative instruments4 | | | 30.4 | | | | | | | | | | | | | | | | | | | | 17.4 | | | | | | | | | |
| | | | | | | | | | | | | | | | | | | | | | | | | | | | | | | | | | |
| | Other assets | | | 12.3 | | | | | | | | 7.9 | | | | | | | | | | | | | | | | | | | | | |
| | | | | | | | | | | | | | | | | | | | | | | | | | | | | | | | | | |
| | Total financial assets measured at amortized cost | | | 576.3 | | | | 13.2 | | | | 244.6 | | | | 155.8 | | | | 18.7 | | | | 17.4 | | | | 0.9 | | | | 2.9 | |
| | | | | | | | | | | | | | | | | | | | | | | | | | | | | | | | | | |
| | Financial assets measured at fair value on the balance sheet | | | | | | | | | | | | | | | | | | | | | | | | | | | | | | | | |
| | | | | | | | | | | | | | | | | | | | | | | | | | | | | | | | | | |
| | Positive replacement values5 | | | 419.0 | | | | | | | | | | | | | | | | | | | | 376.7 | | | | | | | | | |
| | | | | | | | | | | | | | | | | | | | | | | | | | | | | | | | | | |
| | Trading portfolio assets – debt instruments6, 7 | | | 67.3 | | | | | | | | | | | | | | | | | | | | | | | | | | | | | |
| | | | | | | | | | | | | | | | | | | | | | | | | | | | | | | | | | |
| | Financial assets designated at fair value – debt instruments8 | | | 8.5 | | | | | | | | 6.5 | | | | | | | | 0.2 | | | | | | | | 1.0 | | | | | |
| | | | | | | | | | | | | | | | | | | | | | | | | | | | | | | | | | |
| | Financial investments available-for-sale – debt instruments8 | | | 65.3 | | | | | | | | | | | | | | | | | | | | | | | | | | | | | |
| | | | | | | | | | | | | | | | | | | | | | | | | | | | | | | | | | |
| | Total financial assets measured at fair value | | | 560.0 | | | | 0.0 | | | | 6.5 | | | | 0.0 | | | | 0.2 | | | | 376.7 | | | | 1.0 | | | | 0.0 | |
| | | | | | | | | | | | | | | | | | | | | | | | | | | | | | | | | | |
| | Total maximum exposure to credit risk reflected on the balance sheet | | | 1,136.3 | | | | 13.2 | | | | 251.1 | | | | 155.8 | | | | 18.9 | | | | 394.1 | | | | 1.9 | | | | 2.9 | |
| | | | | | | | | | | | | | | | | | | | | | | | | | | | | | | | | | |
| | Guarantees | | | 20.0 | | | | 1.5 | | | | 2.0 | | | | 0.3 | | | | 2.0 | | | | | | | | 1.4 | | | | 2.5 | |
| | | | | | | | | | | | | | | | | | | | | | | | | | | | | | | | | | |
| | Loan commitments | | | 59.8 | | | | 0.2 | | | | 2.1 | | | | 1.7 | | | | 9.2 | | | | | | | | 16.9 | | | | 1.5 | |
| | | | | | | | | | | | | | | | | | | | | | | | | | | | | | | | | | |
| | Forward starting transactions, reverse repurchase and securities borrowing agreements | | | 18.8 | | | | | | | | 18.8 | | | | | | | | | | | | | | | | | | | | | |
| | | | | | | | | | | | | | | | | | | | | | | | | | | | | | | | | | |
| | Total maximum exposure to credit risk not reflected on the balance sheet | | | 98.6 | | | | 1.7 | | | | 22.9 | | | | 1.9 | | | �� | 11.2 | | | | | | | | 18.3 | | | | 4.0 | |
| | | | | | | | | | | | | | | | | | | | | | | | | | | | | | | | | | |
| | Total at the year-end | | | 1,235.0 | | | | 14.8 | | | | 274.0 | | | | 157.7 | | | | 30.1 | | | | 394.1 | | | | 20.2 | | | | 6.9 | |
| | | | | | | | | | | | | | | | | | | | | | | | | | | | | | | | | | |
| | 1 Includes but not limited to life insurance contracts, inventory, accounts receivable, patents, and copyrights. 2 Due from banks includes amounts held with third-party banks on behalf of clients. The credit risk associated to these balances may be borne by those clients. 3 Loans include a balance outstanding of USD 3.6 billion to the BlackRock fund. This loan is collateralized by a portfolio of US residential mortgage-backed securities included within “Other collateral.” 4 Included within cash collateral receivables on derivative instruments are margin balances due from exchanges or clearing houses. The amount shown in the netting column represents the netting with related negative replacement values in accordance with Swiss federal banking law. 5 The amount shown in the netting column represents the netting with related negative replacement values and cash collateral payables in accordance with Swiss federal banking law. For the purpose of this disclosure, securities collateral was not considered. 6 These positions are generally managed under the market risk framework and are included in VaR. For the purpose of this disclosure, collateral and credit enhancements were not considered. 7 Does not include debt instruments held for unit-linked investment contracts and investment fund units. 8 Does not include investment fund units. | |
165
Risk, treasury and capital management
| | | | | | | | | | | | | | | | | | | | | | | | | | | | | | |
| | Financial assets subject to credit risk by rating category | |
| | CHF billion | | 31.12.13 | |
| | Rating category1 | | | 0–1 | | | | 2–3 | | | | 4–5 | | | | 6–8 | | | | 9–13 | | | | defaulted | | | | Total | |
| | Balances with central banks | | | 41.9 | | | | 37.0 | | | | 0.0 | | | | | | | | | | | | | | | | 78.9 | |
| | | | | | | | | | | | | | | | | | | | | | | | | | | | | | |
| | Due from banks | | | 3.1 | | | | 11.4 | | | | 1.4 | | | | 1.1 | | | | 0.2 | | | | | | | | 17.2 | |
| | | | | | | | | | | | | | | | | | | | | | | | | | | | | | |
| | Loans2 | | | 25.3 | | | | 112.6 | | | | 57.1 | | | | 72.4 | | | | 18.5 | | | | 1.1 | | | | 287.0 | |
| | | | | | | | | | | | | | | | | | | | | | | | | | | | | | |
| | Cash collateral on securities borrowed and reverse repurchase agreements | | | 1.8 | | | | 86.8 | | | | 19.6 | | | | 10.3 | | | | 0.5 | | | | | | | | 119.1 | |
| | | | | | | | | | | | | | | | | | | | | | | | | | | | | | |
| | Positive replacement values | | | 12.4 | | | | 199.6 | | | | 25.7 | | | | 6.9 | | | | 0.9 | | | | 0.2 | | | | 245.8 | |
| | | | | | | | | | | | | | | | | | | | | | | | | | | | | | |
| | Cash collateral receivables on derivative instruments | | | 4.1 | | | | 19.0 | | | | 3.4 | | | | 1.5 | | | | 0.1 | | | | | | | | 28.0 | |
| | | | | | | | | | | | | | | | | | | | | | | | | | | | | | |
| | Trading portfolio assets – debt instruments3 | | | 11.0 | | | | 11.8 | | | | 7.0 | | | | 3.3 | | | | 2.2 | | | | 0.1 | | | | 35.4 | |
| | | | | | | | | | | | | | | | | | | | | | | | | | | | | | |
| | Financial investments available-for-sale – debt instruments4 | | | 43.9 | | | | 14.6 | | | | 0.1 | | | | | | | | | | | | | | | | 58.6 | |
| | | | | | | | | | | | | | | | | | | | | | | | | | | | | | |
| | Other financial instruments5 | | | 0.1 | | | | 3.0 | | | | 6.5 | | | | 14.4 | | | | 0.1 | | | | 0.2 | | | | 24.4 | |
| | | | | | | | | | | | | | | | | | | | | | | | | | | | | | |
| | Financial instruments not recognized on the balance sheet | | | | | | | | | | | | | | | | | | | | | | | | | | | | |
| | | | | | | | | | | | | | | | | | | | | | | | | | | | | | |
| | Guarantees | | | 2.5 | | | | 8.5 | | | | 3.7 | | | | 3.2 | | | | 0.9 | | | | 0.0 | | | | 18.7 | |
| | | | | | | | | | | | | | | | | | | | | | | | | | | | | | |
| | Loan commitments | | | 0.8 | | | | 30.2 | | | | 9.4 | | | | 8.5 | | | | 5.9 | | | | 0.1 | | | | 54.9 | |
| | | | | | | | | | | | | | | | | | | | | | | | | | | | | | |
| | Forward starting reverse repurchase agreements | | | | | | | 8.7 | | | | 0.6 | | | | 0.1 | | | | | | | | | | | | 9.4 | |
| | | | | | | | | | | | | | | | | | | | | | | | | | | | | | |
| | Forward starting securities borrowing agreements | | | | | | | 0.0 | | | | | | | | | | | | | | | | | | | | 0.0 | |
| | | | | | | | | | | | | | | | | | | | | | | | | | | | | | |
| | Total | | | 146.9 | | | | 543.4 | | | | 134.5 | | | | 121.6 | | | | 29.2 | | | | 1.7 | | | | 977.4 | |
| | | | | | | | | | | | | | | | | | | | | | | | | | | | | | |
| | CHF billion | | 31.12.12 | |
| | Rating category1 | | | 0–1 | | | | 2–3 | | | | 4–5 | | | | 6–8 | | | | 9–13 | | | | defaulted | | | | Total | |
| | Balances with central banks | | | 46.2 | | | | 17.9 | | | | 0.0 | | | | | | | | | | | | | | | | 64.1 | |
| | | | | | | | | | | | | | | | | | | | | | | | | | | | | | |
| | Due from banks | | | 0.9 | | | | 14.0 | | | | 4.5 | | | | 1.6 | | | | 0.1 | | | | 0.0 | | | | 21.2 | |
| | | | | | | | | | | | | | | | | | | | | | | | | | | | | | |
| | Loans2 | | | 4.6 | | | | 84.2 | | | | 121.3 | | | | 57.2 | | | | 11.5 | | | | 1.1 | | | | 279.9 | |
| | | | | | | | | | | | | | | | | | | | | | | | | | | | | | |
| | Cash collateral on securities borrowed and reverse repurchase agreements | | | 2.3 | | | | 123.3 | | | | 25.8 | | | | 14.9 | | | | 2.0 | | | | 0.0 | | | | 168.3 | |
| | | | | | | | | | | | | | | | | | | | | | | | | | | | | | |
| | Positive replacement values | | | 13.4 | | | | 348.9 | | | | 44.4 | | | | 9.9 | | | | 2.3 | | | | 0.2 | | | | 419.0 | |
| | | | | | | | | | | | | | | | | | | | | | | | | | | | | | |
| | Cash collateral receivables on derivative instruments | | | 6.3 | | | | 17.1 | | | | 4.0 | | | | 2.9 | | | | 0.1 | | | | 0.0 | | | | 30.4 | |
| | | | | | | | | | | | | | | | | | | | | | | | | | | | | | |
| | Trading portfolio assets – debt instruments3 | | | 34.2 | | | | 17.2 | | | | 7.8 | | | | 3.4 | | | | 4.7 | | | | 0.2 | | | | 67.3 | |
| | | | | | | | | | | | | | | | | | | | | | | | | | | | | | |
| | Financial investments available-for-sale – debt instruments4 | | | 57.7 | | | | 7.6 | | | | 0.0 | | | | 0.0 | | | | 0.0 | | | | | | | | 65.3 | |
| | | | | | | | | | | | | | | | | | | | | | | | | | | | | | |
| | Other financial instruments5 | | | 0.3 | | | | 3.2 | | | | 7.9 | | | | 8.8 | | | | 0.4 | | | | 0.2 | | | | 20.8 | |
| | | | | | | | | | | | | | | | | | | | | | | | | | | | | | |
| | Financial instruments not recognized on the balance sheet | | | | | | | | | | | | | | | | | | | | | | | | | | | | |
| | | | | | | | | | | | | | | | | | | | | | | | | | | | | | |
| | Guarantees | | | 2.3 | | | | 9.7 | | | | 3.7 | | | | 3.3 | | | | 0.9 | | | | 0.0 | | | | 20.0 | |
| | | | | | | | | | | | | | | | | | | | | | | | | | | | | | |
| | Loan commitments | | | 0.2 | | | | 34.6 | | | | 11.6 | | | | 6.7 | | | | 6.7 | | | | 0.1 | | | | 59.8 | |
| | | | | | | | | | | | | | | | | | | | | | | | | | | | | | |
| | Forward starting reverse repurchase agreements | | | 0.0 | | | | 17.4 | | | | 0.6 | | | | 0.5 | | | | | | | | | | | | 18.6 | |
| | | | | | | | | | | | | | | | | | | | | | | | | | | | | | |
| | Forward starting securities borrowing agreements | | | | | | | 0.2 | | | | | | | | | | | | | | | | | | | | 0.2 | |
| | | | | | | | | | | | | | | | | | | | | | | | | | | | | | |
| | Total | | | 168.2 | | | | 695.4 | | | | 231.5 | | | | 109.2 | | | | 28.8 | | | | 1.8 | | | | 1,235.0 | |
| | | | | | | | | | | | | | | | | | | | | | | | | | | | | | |
| | 1 Refer to the “Internal UBS rating scale and mapping of external ratings” table for more information on rating categories. 2 In 2013, following model recalibrations, the rating distribution of Retail & Corporate loans was amended prospectively. 3 Does not include debt instruments held for unit-linked investment contracts and investment fund units. 4 Does not include investment fund units. 5 Comprised of financial assets designated at fair value – debt instruments (excluding investment fund units) and other assets. | |
| | |
| | è Refer to “Retail & Corporate” in “Credit risk profile of the Group – Internal risk view” and to “Changes to models and model parameters during the period” in “Credit risk models” in this section for more information on model recalibration driven changes in the rating distribution of the credit portfolio |
166
|
Risk, treasury and capital management |
|
|
| | |
| | Impaired assets |
| | The following tables show impaired assets, comprising loans, guarantees, loan commitments, defaulted derivatives contracts and securities financing transactions. Gross impaired assets decreased by CHF 0.6 billion to CHF 1.9 billion as of 31 December |
| | |
| | 2013, mainly due to resolution through repayment, sale or upgrade. After deducting the estimated liquidation proceeds of collateral and specific allowances, provisions and credit valuation adjustments (CVA), net impaired assets amounted to CHF 0.6 billion as of 31 December 2013 compared with CHF 0.8 billion at the end of the prior year. |
| | | | | | | | | | | | | | | | | | | | | | | | | | | | | | | | | | |
| | Impaired assets by type of financial instrument | |
| | CHF million | | Impaired assets | | | Allowances, provisions
and CVA adjustments1, 2 | | | Estimated liquidation
proceeds of collateral | | | Net impaired exposure | |
| | | | 31.12.13 | | | 31.12.12 | | | 31.12.13 | | | 31.12.12 | | | 31.12.13 | | | 31.12.12 | | | 31.12.13 | | | 31.12.12 | |
| | Impaired loans (including due from banks) | | | 1,199 | | | | 1,606 | | | | (686 | ) | | | (728 | ) | | | (276 | ) | | | (437 | ) | | | 237 | | | | 441 | |
| | | | | | | | | | | | | | | | | | | | | | | | | | | | | | | | | | |
| | Impaired guarantees and loan commitments | | | 101 | | | | 144 | | | | (61 | ) | | | (64 | ) | | | (2 | ) | | | (6 | ) | | | 38 | | | | 73 | |
| | | | | | | | | | | | | | | | | | | | | | | | | | | | | | | | | | |
| | Defaulted derivatives contracts | | | 582 | | | | 716 | | | | (283 | ) | | | (439 | ) | | | | | | | | | | | 298 | | | | 276 | |
| | | | | | | | | | | | | | | | | | | | | | | | | | | | | | | | | | |
| | Defaulted securities financing transactions | | | 2 | | | | 2 | | | | (2 | ) | | | (2 | ) | | | | | | | | | | | | | | | | |
| | | | | | | | | | | | | | | | | | | | | | | | | | | | | | | | | | |
| | Total | | | 1,884 | | | | 2,467 | | | | (1,033 | )3 | | | (1,233 | ) | | | (279 | ) | | | (443 | ) | | | 573 | | | | 791 | |
| | | | | | | | | | | | | | | | | | | | | | | | | | | | | | | | | | |
| | 1 Includes CHF 20 million collective loan loss allowances (31 December 2012: CHF 114 million). 2 Does not include collective credit valuation adjustments of CHF 433 million (31 December 2012: CHF 736 million). They are partially reflected in the tier 1 capital calculation. 3 Does not include an allowance of CHF 83 million related to certain disputed receivables. | |
| | | | | | | | | | | | | | | | | | | | | | | | |
Impaired assets by region | |
| CHF million | | Impaired assets1 | | | Specific allowances,
provisions and
credit valuation
adjustments | | | Impaired assets
net of specific
allowances,
provisions and
credit valuation
adjustments | | | Collective
allowances and
provisions2 | | | Total allowances,
provisions and
specific credit
valuation
adjustments
31.12.132 | | | Total allowances,
provisions and
specific credit
valuation adjustments
31.12.122 | |
| Asia Pacific | | | 47 | | | | (46 | ) | | | 1 | | | | | | | | (46 | ) | | | (58 | ) |
| | | | | | | | | | | | | | | | | | | | | | | | | |
| Latin America | | | 63 | | | | (58 | ) | | | 4 | | | | | | | | (58 | ) | | | (43 | ) |
| | | | | | | | | | | | | | | | | | | | | | | | | |
| Middle East and Africa | | | 64 | | | | (24 | ) | | | 40 | | | | | | | | (24 | ) | | | (35 | ) |
| | | | | | | | | | | | | | | | | | | | | | | | | |
| North America | | | 526 | | | | (175 | ) | | | 351 | | | | (2 | ) | | | (176 | ) | | | (348 | ) |
| | | | | | | | | | | | | | | | | | | | | | | | | |
| Switzerland | | | 842 | | | | (470 | ) | | | 373 | | | | (18 | ) | | | (488 | ) | | | (539 | ) |
| | | | | | | | | | | | | | | | | | | | | | | | | |
| Rest of Europe | | | 341 | | | | (239 | ) | | | 102 | | | | | | | | (239 | ) | | | (209 | ) |
| | | | | | | | | | | | | | | | | | | | | | | | | |
| Total 31.12.13 | | | 1,884 | | | | (1,013 | ) | | | 872 | | | | (20 | ) | | | (1,033 | )3 | | | | |
| | | | | | | | | | | | | | | | | | | | | | | | | |
| Total 31.12.12 | | | 2,467 | | | | (1,119 | ) | | | 1,349 | | | | (114 | ) | | | | | | | (1,233 | ) |
| | | | | | | | | | | | | | | | | | | | | | | | | |
1 Values of defaulted derivative contracts (CHF 582 million, 31 December 2012: CHF 716 million) are based on replacement values and do not include “add-ons” used in the calculation of regulatory capital. 2 Does not include collective credit valuation adjustments of CHF 433 million (31 December 2012: CHF 736 million). They are partially reflected in the tier 1 capital calculation. 3 Does not include an allowance of CHF 83 million related to certain disputed receivables.
167
Risk, treasury and capital management
Impaired assets by exposure segment
| | | | | | | | | | | | | | | | | | | | | | | | |
| CHF million | | Impaired assets1 | | | Specific allowances,
provisions and
credit valuation
adjustments | | | Collective
allowances and
provisions2 | | | Total allowances,
provisions and
specific credit
valuation
adjustments
31.12.132 | | | Write-offs for the
year ended
31.12.13 | | | Total allowances,
provisions and
specific credit
valuation adjustments
31.12.122 | |
| Corporates | | | 1,525 | | | | (829 | ) | | | | | | | (829 | ) | | | (64 | ) | | | (937 | ) |
| | | | | | | | | | | | | | | | | | | | | | | | | |
| Sovereigns | | | 14 | | | | (10 | ) | | | | | | | (10 | ) | | | (1 | ) | | | (10 | ) |
| | | | | | | | | | | | | | | | | | | | | | | | | |
| Banks | | | 67 | | | | (19 | ) | | | | | | | (19 | ) | | | | | | | (26 | ) |
| | | | | | | | | | | | | | | | | | | | | | | | | |
| Retail | | | | | | | | | | | | | | | | | | | | | | | | |
| | | | | | | | | | | | | | | | | | | | | | | | | |
Residential mortgages | | | 145 | | | | (46 | ) | | | | | | | (46 | ) | | | | | | | (51 | ) |
| | | | | | | | | | | | | | | | | | | | | | | | | |
Lombard lending | | | 66 | | | | (67 | ) | | | (2 | ) | | | (68 | ) | | | | | | | (49 | ) |
| | | | | | | | | | | | | | | | | | | | | | | | | |
Other retail | | | 67 | | | | (42 | ) | | | | | | | (42 | ) | | | (28 | ) | | | (45 | ) |
| | | | | | | | | | | | | | | | | | | | | | | | | |
| Not allocated segment3 | | | | | | | | | | | (18 | ) | | | (18 | ) | | | | | | | (113 | ) |
| | | | | | | | | | | | | | | | | | | | | | | | | |
| Total 31.12.13 | | | 1,884 | | | | (1,013 | ) | | | (20 | ) | | | (1,033 | )4 | | | (93 | )5 | | | | |
| | | | | | | | | | | | | | | | | | | | | | | | | |
| Total 31.12.12 | | | 2,467 | | | | (1,119 | ) | | | (114 | ) | | | | | | | (162 | )5 | | | (1,233 | ) |
| | | | | | | | | | | | | | | | | | | | | | | | | |
1 Values of defaulted derivative contracts (CHF 582 million, 31 December 2012: CHF 716 million) are based on replacement values and do not include “add-ons” used in the calculation of regulatory capital. 2 Does not include collective credit valuation adjustments of CHF 433 million (31 December 2012: CHF 736 million). They are partially reflected in the tier 1 capital calculation. 3 With the exception of WMA lombard lending, collective loan loss allowances are not allocated to individual counterparties. 4 Does not include an allowance of CHF 83 million related to certain disputed receivables. 5 Does not include CHF 35 million securitization-related write-offs (31 December 2012: CHF 152 million).
The following table provides a breakdown of movements in the specific and collective allowances and provisions for impaired assets.
Changes in allowances, provisions and specific credit valuation adjustments
| | | | | | | | | | | | | | | | | | | | | | | | |
| CHF million | | Specific allowances
and provisions for banking products
and securities
financing | | | Specific credit
valuation
adjustments for
derivatives | | | Total specific
allowances,
provisions and
credit valuation
adjustments | | | Collective loan loss allowances for credit losses1 | | | For the
year ended
31.12.13 | | | For the
year ended
31.12.12 | |
| Balance at the beginning of the year | | | 680 | 3 | | | 439 | | | | 1,119 | | | | 114 | | | | 1,233 | | | | 2,395 | |
| | | | | | | | | | | | | | | | | | | | | | | | | |
| Write-offs/usage of provisions | | | (127 | ) | | | 0 | | | | (127 | ) | | | (1 | ) | | | (128 | ) | | | (313 | ) |
| | | | | | | | | | | | | | | | | | | | | | | | | |
| Recoveries (on written-off positions) | | | 45 | | | | | | | | 45 | | | | | | | | 45 | | | | 63 | |
| | | | | | | | | | | | | | | | | | | | | | | | | |
| Increase/(decrease) in allowances, provisions and specific credit valuation adjustments2 | | | 144 | | | | (138 | ) | | | 6 | | | | (93 | ) | | | (88 | ) | | | (899 | ) |
| | | | | | | | | | | | | | | | | | | | | | | | | |
| Foreign currency translations and other adjustments | | | (12 | ) | | | (15 | ) | | | (27 | ) | | | 0 | | | | (27 | ) | | | (12 | ) |
| | | | | | | | | | | | | | | | | | | | | | | | | |
| Transfers | | | 0 | | | | (4 | ) | | | (4 | ) | | | | | | | (4 | ) | | | | |
| | | | | | | | | | | | | | | | | | | | | | | | | |
| Balance at the end of the year | | | 730 | 3 | | | 283 | | | | 1,013 | | | | 20 | | | | 1,033 | 4 | | | 1,233 | |
| | | | | | | | | | | | | | | | | | | | | | | | | |
1 This table does not include collective valuation adjustments of CHF 433 million (31 December 2012: CHF 736 million). They are partially included in the tier 1 capital capital calculation. 2 Total actual credit loss (credit loss expense and changes in specific credit valuation adjustments recognized in net trading income). 3 Includes CHF 2 million allowances for securities financing (31 December 2012: CHF 2 million). 4 Does not include an allowance of CHF 83 million related to certain disputed receivables.
168
|
Risk, treasury and capital management |
|
|
| | |
| | Impaired loans |
| | The majority of our gross impaired exposure relates to loans, primarily in our Swiss domestic business. Gross impaired loans (including due from banks) decreased to CHF 1,199 million as of 31 December 2013 from CHF 1,606 million at the end of the prior year, as new impairments and increases were offset by repayments, sales and upgrades, mainly related to the run-down of the Legacy Portfolio. This decrease in impaired loan exposure, combined with the increase in gross exposure, led to a reduction in the ratio of impaired loans to total loans to 0.4% from 0.6%. |
| | Collateral held against our impaired loan exposure mainly consisted of real estate and securities as of 31 December 2013. It is our policy to dispose of foreclosed real estate as soon as practicable. The carrying amount of foreclosed property recorded in our balance sheet underOther assets at the end of 2013 and 2012 amounted to CHF 40 million and CHF 47 million, respectively. We |
| | |
| | seek to liquidate collateral held in the form of financial assets expeditiously and at prices considered fair. This may require us to purchase assets for our own account, where permitted by law, pending orderly liquidation. |
| | Specific and collective allowances and provisions for credit losses decreased by CHF 44 million to CHF 750 million as of 31 December 2013. This includes collective loan loss allowances of CHF 20 million, a reduction of CHF 94 million compared with CHF 114 million at the end of the prior year. |
| | The table “Loss history statistics” on page 172 provides a five-year history of our credit loss experience for loans (including due from banks) relative to our impaired and non-performing loans. |
| | è Refer to “Policies for past due, non-performing and impaired claims” in this section and “Note 10 Due from banks and loans (held at amortized cost)” and “Note 12 Allowances and provisions for credit losses” in the “Financial information” section of this report for more information |
169
Risk, treasury and capital management
Allowances and provisions for credit losses 1
| | | | | | | | | | | | | | | | | | | | | | | | | | | | | | | | | | | | | | | | |
| | IFRS exposure,
gross | | | Impaired exposure | | | Estimated liquidation
proceeds of collateral | | | Allowances and provisions
for credit losses2 | | | Impairment ratio (%) | |
| CHF million, except where indicated | | 31.12.13 | | | 31.12.12 | | | 31.12.13 | | | 31.12.12 | | | 31.12.13 | | | 31.12.12 | | | 31.12.13 | | | 31.12.12 | | | 31.12.13 | | | 31.12.12 | |
| | | | | | | | | | |
| Group | | | | | | | | | | | | | | | | | | | | | | | | | | | | | | | | | | | | | | | | |
| | | | | | | | | | | | | | | | | | | | | | | | | | | | | | | | | | | | | | | | | |
| Balances with central banks | | | 78,912 | | | | 64,119 | | | | | | | | | | | | | | | | | | | | | | | | | | | | | | | | | |
| | | | | | | | | | | | | | | | | | | | | | | | | | | | | | | | | | | | | | | | | |
| Due from banks | | | 17,232 | | | | 21,242 | | | | 49 | | | | 56 | | | | | | | | | | | | 15 | | | | 22 | | | | 0.3 | | | | 0.3 | |
| | | | | | | | | | | | | | | | | | | | | | | | | | | | | | | | | | | | | | | | | |
| Loans | | | 287,665 | | | | 280,606 | | | | 1,150 | | | | 1,550 | | | | 276 | | | | 437 | | | | 671 | | | | 706 | | | | 0.4 | | | | 0.6 | |
| | | | | | | | | | | | | | | | | | | | | | | | | | | | | | | | | | | | | | | | | |
| Guarantees | | | 18,798 | | | | 20,058 | | | | 77 | | | | 76 | | | | 2 | | | | 6 | | | | 61 | | | | 64 | | | | 0.4 | | | | 0.4 | |
| | | | | | | | | | | | | | | | | | | | | | | | | | | | | | | | | | | | | | | | | |
| Loan commitments | | | 54,913 | | | | 59,818 | | | | 24 | | | | 68 | | | | | | | | | | | | | | | | | | | | 0.0 | | | | 0.1 | |
| | | | | | | | | | | | | | | | | | | | | | | | | | | | | | | | | | | | | | | | | |
| Total | | | 457,520 | | | | 445,843 | | | | 1,300 | | | | 1,749 | | | | 279 | | | | 443 | | | | 747 | | | | 792 | | | | 0.3 | | | | 0.4 | |
| | | | | | | | | | | | | | | | | | | | | | | | | | | | | | | | | | | | | | | | | |
| | | | | | | | | | |
| Wealth Management | | | | | | | | | | | | | | | | | | | | | | | | | | | | | | | | | | | | | | | | |
| | | | | | | | | | | | | | | | | | | | | | | | | | | | | | | | | | | | | | | | | |
| Balances with central banks | | | 356 | | | | 413 | | | | | | | | | | | | | | | | | | | | | | | | | | | | | | | | | |
| | | | | | | | | | | | | | | | | | | | | | | | | | | | | | | | | | | | | | | | | |
| Due from banks | | | 1,243 | | | | 1,039 | | | | | | | | | | | | | | | | | | | | | | | | | | | | | | | | | |
| | | | | | | | | | | | | | | | | | | | | | | | | | | | | | | | | | | | | | | | | |
| Loans | | | 96,813 | | | | 86,581 | | | | 76 | | | | 55 | | | | 5 | | | | 20 | | | | 71 | | | | 41 | | | | 0.1 | | | | 0.1 | |
| | | | | | | | | | | | | | | | | | | | | | | | | | | | | | | | | | | | | | | | | |
| Guarantees | | | 2,277 | | | | 2,326 | | | | | | | | | | | | | | | | | | | | | | | | | | | | | | | | | |
| | | | | | | | | | | | | | | | | | | | | | | | | | | | | | | | | | | | | | | | | |
| Loan commitments | | | 1,646 | | | | 1,574 | | | | | | | | | | | | | | | | | | | | | | | | | | | | | | | | | |
| | | | | | | | | | | | | | | | | | | | | | | | | | | | | | | | | | | | | | | | | |
| Total | | | 102,335 | | | | 91,932 | | | | 76 | | | | 55 | | | | 5 | | | | 20 | | | | 71 | | | | 41 | | | | 0.1 | | | | 0.1 | |
| | | | | | | | | | | | | | | | | | | | | | | | | | | | | | | | | | | | | | | | | |
| | | | | | | | | | |
| Wealth Management Americas | | | | | | | | | | | | | | | | | | | | | | | | | | | | | | | | | | | | | | | | |
| | | | | | | | | | | | | | | | | | | | | | | | | | | | | | | | | | | | | | | | | |
| Balances with central banks | | | 0 | | | | 0 | | | | | | | | | | | | | | | | | | | | | | | | | | | | | | | | | |
| | | | | | | | | | | | | | | | | | | | | | | | | | | | | | | | | | | | | | | | | |
| Due from banks | | | 1,706 | | | | 2,195 | | | | | | | | | | | | | | | | | | | | | | | | | | | | | | | | | |
| | | | | | | | | | | | | | | | | | | | | | | | | | | | | | | | | | | | | | | | | |
| Loans | | | 34,846 | | | | 31,250 | | | | 40 | | | | 15 | | | | | | | | | | | | 41 | | | | 17 | | | | 0.1 | | | | 0.0 | |
| | | | | | | | | | | | | | | | | | | | | | | | | | | | | | | | | | | | | | | | | |
| Guarantees | | | 416 | | | | 406 | | | | | | | | | | | | | | | | | | | | | | | | | | | | | | | | | |
| | | | | | | | | | | | | | | | | | | | | | | | | | | | | | | | | | | | | | | | | |
| Loan commitments | | | 601 | | | | 1,214 | | | | | | | | | | | | | | | | | | | | | | | | | | | | | | | | | |
| | | | | | | | | | | | | | | | | | | | | | | | | | | | | | | | | | | | | | | | | |
| Total | | | 37,569 | | | | 35,065 | | | | 40 | | | | 15 | | | | 0 | | | | 0 | | | | 41 | | | | 17 | | | | 0.1 | | | | 0.0 | |
| | | | | | | | | | | | | | | | | | | | | | | | | | | | | | | | | | | | | | | | | |
| | | | | | | | | | |
| Retail & Corporate | | | | | | | | | | | | | | | | | | | | | | | | | | | | | | | | | | | | | | | | |
| | | | | | | | | | | | | | | | | | | | | | | | | | | | | | | | | | | | | | | | | |
| Balances with central banks | | | 0 | | | | 2,173 | | | | | | | | | | | | | | | | | | | | | | | | | | | | | | | | | |
| | | | | | | | | | | | | | | | | | | | | | | | | | | | | | | | | | | | | | | | | |
| Due from banks | | | 2,756 | | | | 2,713 | | | | 41 | | | | 45 | | | | | | | | | | | | 14 | | | | 20 | | | | 1.5 | | | | 1.6 | |
| | | | | | | | | | | | | | | | | | | | | | | | | | | | | | | | | | | | | | | | | |
| Loans | | | 136,499 | | | | 137,344 | | | | 932 | | | | 955 | | | | 227 | | | | 244 | | | | 528 | | | | 574 | | | | 0.7 | | | | 0.7 | |
| | | | | | | | | | | | | | | | | | | | | | | | | | | | | | | | | | | | | | | | | |
| Guarantees | | | 9,741 | | | | 10,042 | | | | 31 | | | | 27 | | | | 2 | | | | 6 | | | | 16 | | | | 16 | | | | 0.3 | | | | 0.3 | |
| | | | | | | | | | | | | | | | | | | | | | | | | | | | | | | | | | | | | | | | | |
| Loan commitments | | | 7,045 | | | | 6,787 | | | | 18 | | | | 7 | | | | 0 | | | | | | | | | | | | | | | | 0.3 | | | | 0.1 | |
| | | | | | | | | | | | | | | | | | | | | | | | | | | | | | | | | | | | | | | | | |
| Total | | | 156,042 | | | | 159,059 | | | | 1,022 | | | | 1,033 | | | | 230 | | | | 251 | | | | 558 | | | | 610 | | | | 0.7 | | | | 0.6 | |
| | | | | | | | | | | | | | | | | | | | | | | | | | | | | | | | | | | | | | | | | |
| | | | | | | | | | |
| Global Asset Management | | | | | | | | | | | | | | | | | | | | | | | | | | | | | | | | | | | | | | | | |
| | | | | | | | | | | | | | | | | | | | | | | | | | | | | | | | | | | | | | | | | |
| Balances with central banks | | | 0 | | | | 0 | | | | | | | | | | | | | | | | | | | | | | | | | | | | | | | | | |
| | | | | | | | | | | | | | | | | | | | | | | | | | | | | | | | | | | | | | | | | |
| Due from banks | | | 586 | | | | 337 | | | | | | | | | | | | | | | | | | | | | | | | | | | | | | | | | |
| | | | | | | | | | | | | | | | | | | | | | | | | | | | | | | | | | | | | | | | | |
| Loans | | | 152 | | | | 91 | | | | | | | | | | | | | | | | | | | | | | | | | | | | | | | | | |
| | | | | | | | | | | | | | | | | | | | | | | | | | | | | | | | | | | | | | | | | |
| Guarantees | | | 1 | | | | 0 | | | | | | | | | | | | | | | | | | | | | | | | | | | | | | | | | |
| | | | | | | | | | | | | | | | | | | | | | | | | | | | | | | | | | | | | | | | | |
| Loan commitments | | | 49 | | | | 0 | | | | | | | | | | | | | | | | | | | | | | | | | | | | | | | | | |
| | | | | | | | | | | | | | | | | | | | | | | | | | | | | | | | | | | | | | | | | |
| Total | | | 787 | | | | 428 | | | | 0 | | | | 0 | | | | 0 | | | | 0 | | | | 0 | | | | 0 | | | | 0.0 | | | | 0.0 | |
| | | | | | | | | | | | | | | | | | | | | | | | | | | | | | | | | | | | | | | | | |
| | | | | | | | | | |
| Investment Bank | | | | | | | | | | | | | | | | | | | | | | | | | | | | | | | | | | | | | | | | |
| | | | | | | | | | | | | | | | | | | | | | | | | | | | | | | | | | | | | | | | | |
| Balances with central banks | | | 145 | | | | 381 | | | | | | | | | | | | | | | | | | | | | | | | | | | | | | | | | |
| | | | | | | | | | | | | | | | | | | | | | | | | | | | | | | | | | | | | | | | | |
| Due from banks | | | 7,550 | | | | 12,967 | | | | | | | | | | | | | | | | | | | | | | | | | | | | | | | | | |
| | | | | | | | | | | | | | | | | | | | | | | | | | | | | | | | | | | | | | | | | |
| Loans | | | 10,589 | | | | 10,752 | | | | 19 | | | | 28 | | | | | | | | | | | | 11 | | | | 15 | | | | 0.2 | | | | 0.3 | |
| | | | | | | | | | | | | | | | | | | | | | | | | | | | | | | | | | | | | | | | | |
| Guarantees | | | 5,884 | | | | 2,978 | | | | 45 | | | | 47 | | | | | | | | | | | | 45 | | | | 48 | | | | 0.8 | | | | 1.6 | |
| | | | | | | | | | | | | | | | | | | | | | | | | | | | | | | | | | | | | | | | | |
| Loan commitments | | | 35,353 | | | | 48,447 | | | | 4 | | | | 22 | | | | | | | | | | | | | | | | | | | | | | | | | |
| | | | | | | | | | | | | | | | | | | | | | | | | | | | | | | | | | | | | | | | | |
| Total | | | 59,521 | | | | 75,526 | | | | 69 | | | | 97 | | | | 0 | | | | 0 | | | | 56 | | | | 63 | | | | 0.1 | | | | 0.1 | |
| | | | | | | | | | | | | | | | | | | | | | | | | | | | | | | | | | | | | | | | | |
1 Excludes CHF 2 million allowances for securities financing (31 December 2012: CHF 2 million). 2 Includes CHF 20 million (31 December 2012: CHF 114 million) in collective loan loss allowances for credit losses.
170
|
Risk, treasury and capital management |
|
|
Allowances and provisions for credit losses1 (continued)
| | | | | | | | | | | | | | | | | | | | | | | | | | | | | | | | | | | | | | | | |
| | IFRS exposure,
gross | | | Impaired exposure | | | Estimated liquidation
proceeds of collateral | | | Allowances and provisions
for credit losses2 | | | Impairment ratio (%) | |
| CHF million, except where indicated | | 31.12.13 | | | 31.12.12 | | | 31.12.13 | | | 31.12.12 | | | 31.12.13 | | | 31.12.12 | | | 31.12.13 | | | 31.12.12 | | | 31.12.13 | | | 31.12.12 | |
| | | | | | | | | | |
| Corporate Center – Core Functions | | | | | | | | | | | | | | | | | | | | | | | | | | | | | | | | | | | | | | | | |
| | | | | | | | | | | | | | | | | | | | | | | | | | | | | | | | | | | | | | | | | |
| Balances with central banks | | | 78,403 | | | | 61,029 | | | | | | | | | | | | | | | | | | | | | | | | | | | | | | | | | |
| | | | | | | | | | | | | | | | | | | | | | | | | | | | | | | | | | | | | | | | | |
| Due from banks | | | 2,912 | | | | 1,111 | | | | | | | | | | | | | | | | | | | | | | | | | | | | | | | | | |
| | | | | | | | | | | | | | | | | | | | | | | | | | | | | | | | | | | | | | | | | |
| Loans | | | 394 | | | | 1,246 | | | | | | | | | | | | | | | | | | | | 0 | | | | 0 | | | | | | | | | |
| | | | | | | | | | | | | | | | | | | | | | | | | | | | | | | | | | | | | | | | | |
| Guarantees | | | 12 | | | | 12 | | | | | | | | | | | | | | | | | | | | | | | | | | | | | | | | | |
| | | | | | | | | | | | | | | | | | | | | | | | | | | | | | | | | | | | | | | | | |
| Loan commitments | | | 22 | | | | 10 | | | | | | | | | | | | | | | | | | | | | | | | | | | | | | | | | |
| | | | | | | | | | | | | | | | | | | | | | | | | | | | | | | | | | | | | | | | | |
| Total | | | 81,743 | | | | 63,409 | | | | 0 | | | | 0 | | | | 0 | | | | 0 | | | | 0 | | | | 0 | | | | 0.0 | | | | 0.0 | |
| | | | | | | | | | | | | | | | | | | | | | | | | | | | | | | | | | | | | | | | | |
| | | | | | | | | | |
| CC – Non-core | | | | | | | | | | | | | | | | | | | | | | | | | | | | | | | | | | | | | | | | |
| | | | | | | | | | | | | | | | | | | | | | | | | | | | | | | | | | | | | | | | | |
| Balances with central banks | | | 7 | | | | 122 | | | | | | | | | | | | | | | | | | | | | | | | | | | | | | | | | |
| | | | | | | | | | | | | | | | | | | | | | | | | | | | | | | | | | | | | | | | | |
| Due from banks | | | 116 | | | | 682 | | | | 8 | | | | 11 | | | | | | | | | | | | 1 | | | | 2 | | | | 7.3 | | | | 1.6 | |
| | | | | | | | | | | | | | | | | | | | | | | | | | | | | | | | | | | | | | | | | |
| Loans | | | 1,001 | | | | 1,625 | | | | 23 | | | | 384 | | | | 0 | | | | 99 | | | | 9 | | | | 21 | | | | 2.3 | | | | 23.6 | |
| | | | | | | | | | | | | | | | | | | | | | | | | | | | | | | | | | | | | | | | | |
| Guarantees | | | 468 | | | | 4,293 | | | | 2 | | | | 2 | | | | | | | | | | | | | | | | | | | | 0.3 | | | | 0.0 | |
| | | | | | | | | | | | | | | | | | | | | | | | | | | | | | | | | | | | | | | | | |
| Loan commitments | | | 10,143 | | | | 1,759 | | | | 1 | | | | 39 | | | | | | | | | | | | | | | | | | | | 0.0 | | | | 2.2 | |
| | | | | | | | | | | | | | | | | | | | | | | | | | | | | | | | | | | | | | | | | |
| Total | | | 11,735 | | | | 8,480 | | | | 35 | | | | 437 | | | | 0 | | | | 99 | | | | 10 | | | | 22 | | | | 0.3 | | | | 5.2 | |
| | | | | | | | | | | | | | | | | | | | | | | | | | | | | | | | | | | | | | | | | |
| | | | | | | | | | |
| CC – Legacy Portfolio | | | | | | | | | | | | | | | | | | | | | | | | | | | | | | | | | | | | | | | | |
| | | | | | | | | | | | | | | | | | | | | | | | | | | | | | | | | | | | | | | | | |
| Balances with central banks | | | 0 | | | | 0 | | | | | | | | | | | | | | | | | | | | | | | | | | | | | | | | | |
| | | | | | | | | | | | | | | | | | | | | | | | | | | | | | | | | | | | | | | | | |
| Due from banks | | | 362 | | | | 198 | | | | | | | | | | | | | | | | | | | | | | | | | | | | | | | | | |
| | | | | | | | | | | | | | | | | | | | | | | | | | | | | | | | | | | | | | | | | |
| Loans | | | 7,372 | | | | 11,718 | | | | 60 | | | | 113 | | | | 44 | | | | 74 | | | | 11 | | | | 38 | | | | 0.8 | | | | 1.0 | |
| | | | | | | | | | | | | | | | | | | | | | | | | | | | | | | | | | | | | | | | | |
| Guarantees | | | 0 | | | | 0 | | | | | | | | | | | | | | | | | | | | | | | | | | | | | | | | | |
| | | | | | | | | | | | | | | | | | | | | | | | | | | | | | | | | | | | | | | | | |
| Loan commitments | | | 54 | | | | 27 | | | | | | | | | | | | | | | | | | | | | | | | | | | | | | | | | |
| | | | | | | | | | | | | | | | | | | | | | | | | | | | | | | | | | | | | | | | | |
| Total | | | 7,788 | | | | 11,943 | | | | 60 | | | | 113 | | | | 44 | | | | 74 | | | | 11 | | | | 38 | | | | 0.8 | | | | 0.9 | |
| | | | | | | | | | | | | | | | | | | | | | | | | | | | | | | | | | | | | | | | | |
1 Excludes CHF 2 million allowances for securities financing (31 December 2012: CHF 2 million). 2 Includes CHF 20 million (31 December 2012: CHF 114 million) in collective loan loss allowances for credit losses.
Development of individually impaired loans (including due from banks)
| | | | | | | | |
| | For the year ended | |
| CHF million | | 31.12.13 | | | 31.12.12 | |
| Balance at the beginning of the year | | | 1,606 | | | | 2,155 | |
| | | | | | | | | |
| New impaired loans | | | 544 | | | | 1,259 | |
| | | | | | | | | |
| Increase in existing impaired loans | | | 50 | | | | 50 | |
| | | | | | | | | |
| Repayments/sales/upgrades | | | (910 | ) | | | (1,688 | ) |
| | | | | | | | | |
| Write-offs | | | (93 | ) | | | (162 | ) |
| | | | | | | | | |
| Foreign currency translations and other adjustments | | | 2 | | | | (9 | ) |
| | | | | | | | | |
| Balance at the end of the year | | | 1,199 | | | | 1,606 | |
| | | | | | | | | |
171
Risk, treasury and capital management
Loss history statistics
| | | | | | | | | | | | | | | | | | | | |
| CHF million, except where indicated | | 31.12.13 | | | 31.12.12 | | | 31.12.11 | | | 31.12.10 | | | 31.12.09 | |
| Due from banks and loans (gross) | | | 304,897 | | | | 301,849 | | | | 290,664 | | | | 281,121 | | | | 285,960 | |
| | | | | | | | | | | | | | | | | | | | | |
| Impaired loans (including due from banks) | | | 1,199 | | | | 1,606 | | | | 2,155 | | | | 4,193 | | | | 6,865 | |
| | | | | | | | | | | | | | | | | | | | | |
| Non-performing loans (including due from banks) | | | 1,582 | | | | 1,516 | | | | 1,529 | | | | 1,727 | | | | 5,402 | |
| | | | | | | | | | | | | | | | | | | | | |
| Allowances and provisions for credit losses1,2 | | | 750 | | | | 794 | | | | 938 | | | | 1,287 | | | | 2,820 | |
| | | | | | | | | | | | | | | | | | | | | |
of which: allowances for due from banks and loans1 | | | 686 | | | | 728 | | | | 842 | | | | 1,111 | | | | 2,680 | |
| | | | | | | | | | | | | | | | | | | | | |
| Net write-offs3 | | | 83 | | | | 250 | | | | 450 | | | | 1,427 | | | | 1,994 | |
| | | | | | | | | | | | | | | | | | | | | |
of which: net write-offs for due from banks and loans | | | 83 | | | | 250 | | | | 413 | | | | 1,428 | | | | 1,882 | |
| | | | | | | | | | | | | | | | | | | | | |
| Credit loss (expense)/recovery4 | | | (50 | ) | | | (118 | ) | | | (84 | ) | | | (66 | ) | | | (1,832 | ) |
| | | | | | | | | | | | | | | | | | | | | |
of which: credit loss (expense)/recovery for due from banks and loans | | | (50 | ) | | | (134 | ) | | | (126 | ) | | | (24 | ) | | | (1,776 | ) |
| | | | | | | | | | | | | | | | | | | | | |
| Ratios | | | | | | | | | | | | | | | | | | | | |
| | | | | | | | | | | | | | | | | | | | | |
| Impaired loans as a percentage of due from banks and loans (gross) | | | 0.4 | | | | 0.5 | | | | 0.7 | | | | 1.5 | | | | 2.4 | |
| | | | | | | | | | | | | | | | | | | | | |
| Non-performing loans as a percentage of due from banks and loans (gross) | | | 0.5 | | | | 0.5 | | | | 0.5 | | | | 0.6 | | | | 1.9 | |
| | | | | | | | | | | | | | | | | | | | | |
| Allowances as a percentage of due from banks and loans (gross) | | | 0.2 | | | | 0.2 | | | | 0.3 | | | | 0.4 | | | | 0.9 | |
| | | | | | | | | | | | | | | | | | | | | |
| Net write-offs as a percentage of average due from banks and loans (gross) outstanding during the period | | | 0.0 | | | | 0.1 | | | | 0.1 | | | | 0.5 | | | | 0.6 | |
| | | | | | | | | | | | | | | | | | | | | |
1 Includes collective loan loss allowances. 2 Includes provisions for loan commitments and allowances for securities borrowing transactions. 3 Includes net write-offs for loan commitments and securities borrowing transactions. 4 Includes credit loss (expense)/recovery for loan commitments and securities borrowing transactions.
|
Past due but not impaired loans The table below shows a breakdown of total loan balances where payments have been missed, but which we do not consider impaired because we expect to collect all amounts due under the contractual terms of the loans or the equivalent value from liquidation of collateral. The loan balances in the table arise entirely within our Wealth Management and Retail & Corporate divisions, where delayed payments are routinely observed. We currently have no past due but not impaired loans in Wealth Management Americas, the Investment Bank and Corporate Center – Non-core and Legacy Portfolio. |
|
The increase in our past due but not impaired loan exposure resulted from a few individual corporate loans, notably a single client within the 11 – 30 days category. The amount of past due but not impaired mortgage loans was not significant compared with the overall size of the mortgage portfolio. è Refer to “Policies for past due, non-performing and impaired claims” in this section and “Note 1 Summary of significant accounting policies” in the “Financial information” section of this report for more information on our impairment policies |
| | | | | | | | | | |
| | Past due but not impaired loans | | | | | | |
| | CHF million | | 31.12.13 | | | 31.12.12 | |
| | 1–10 days | | | 119 | | | | 104 | |
| | | | | | | | | | |
| | 11–30 days | | | 146 | | | | 30 | |
| | | | | | | | | | |
| | 31–60 days | | | 28 | | | | 44 | |
| | | | | | | | | | |
| | 61–90 days | | | 8 | | | | 14 | |
| | | | | | | | | | |
| | > 90 days | | | 712 | | | | 793 | |
| | | | | | | | | | |
| | of which: mortgage loans | | | 617 | | | | 639 | |
| | | | | | | | | | |
| | Total | | | 1,013 | | | | 986 | |
| | | | | | | | | | | | | | | | |
Past due but not impaired mortgage loans | | | | | | | | | | | | |
CHF million | | 31.12.13 | | | 31.12.12 | |
| | | Total mortgage
loans | | | of which:
past due > 90 days
but not impaired | | | Total mortgage
loans | | | of which:
past due > 90 days
but not impaired | |
| Total | | | 149,661 | | | | 617 | | | | 144,667 | | | | 639 | |
| | | | | | | | | | | | | | | | | |
172
|
Risk, treasury and capital management |
|
|
Credit risk profile of the Group – Internal risk view
The exposures detailed in this section are based on our internal management view of credit risk which differs in certain respects from the measurement requirements of IFRS.
Internally, we categorize credit risk exposures into two broad categories: banking products and traded products. Banking products comprise drawn loans, undrawn guarantees and loan commitments, due from banks and balances with central banks. Traded products comprise over-the-counter (OTC) derivatives, exchange-traded derivatives (ETD) and securities financing transactions (SFT), comprised of securities lending and reverse repurchase agreements.
Banking products
The breakdowns of our banking product exposures are shown before and after allowances and provisions for credit losses and related single-name credit hedges. The effect of portfolio hedges, such as index CDS, is not reflected. Guarantees and loan commitments are shown on a notional basis, without applying credit conversion factors.
Total gross banking products exposure increased to CHF 453 billion as of 31 December 2013 compared with CHF 441 billion at the end of 2012, mainly due to increases in balances with central banks and in the loan books of Wealth Management and Wealth Management Americas, which were only partly offset by reductions in Retail & Corporate and the Legacy Portfolio.
Wealth Management
Gross banking products exposure within Wealth Management increased to CHF 102 billion as of 31 December 2013 compared with CHF 92 billion as of 31 December 2012, in line with our strategy to grow this business.
Our Wealth Management loan portfolio is mainly secured by securities, residential property and cash as outlined in the table “Wealth Management: composition of loan portfolio, gross.” The majority of loans secured by securities were of high quality, with 95% as of 31 December 2013 (91% as of 31 December 2012) rated investment grade, based on our internal ratings.
The portfolio of mortgage loans secured by properties outside Switzerland continued to grow to CHF 4.5 billion as of 31 December 2013 from CHF 3.4 billion at the end of the prior year. The overall quality of this portfolio remains high, with an average loan-to-value (LTV) ratio of 57% in Europe and 42% in Asia Pacific. There were no credit losses within the portfolio in 2013.
Wealth Management Americas
Gross banking products exposure within Wealth Management Americas increased to CHF 38 billion as of 31 December 2013 from CHF 35 billion as of 31 December 2012. This exposure largely relates to loans secured by securities and residential mortgage loans.
The majority of loans secured by marketable securities were of high quality, with 81% as of 31 December 2013 (87% as of 31 December 2012) rated investment grade, based on our internal ratings.
The mortgage loan portfolio consists primarily of residential mortgages offered in all US states. Exposure continued to grow to CHF 5.6 billion as of 31 December 2013 from CHF 3.5 billion at the end of the prior year. The overall quality of this portfolio remains high with an average LTV of 58%, and we have experienced no credit losses since the inception of the mortgage program. The five largest geographic concentrations in the portfolio are in California (32%), New York (16%), Florida (8%), Connecticut (4%) and New Jersey (4%).
The credit risk exposure arising from the credit card business was CHF 161 million as of 31 December 2013 compared with CHF 152 million at the end of the prior year.
Banking products exposure as of 31 December 2012 was restated to reflect the transfer of cash balances from Wealth Management Americas to Group Treasury during the third quarter of 2013.
There was an increase in the amount of impaired loans, to CHF 40 million as of 31 December 2013 from CHF 15 million at the end of the prior year, as a result of impairments of securities-backed loan facilities collateralized by Puerto Rico municipal securities and related funds. Securities-backed lending facilities provided by Wealth Management Americas to its customers and repurchase agreements with institutional clients are, in part, collateralized by Puerto Rico municipal securities and closed-end funds primarily invested in Puerto Rico municipal securities. This collateral is subject to lending value haircuts and daily margining. Our total lending exposure against Puerto Rico municipal securities and closed-end fund collateral as of 31 December 2013 was approximately USD 1.0 billion. This collateral had a market value of approximately USD 2.2 billion as of 31 December 2013. For a significant number of these loans, UBS has recourse to the borrower. UBS also has direct exposure to Puerto Rico municipal securities and related funds arising from its secondary market activities, which was less than USD 50 million at 31 December 2013. UBS acts as investment manager for, and is the primary liquidity provider in the market for shares of, a number of affiliated closed-end funds invested in Puerto Rico municipal securities. These funds use leverage, which is currently provided primarily through repurchase agreements between the funds and third-party institutions, through short-term secured debt obligations, and by UBS through the aforementioned repurchase agreements.
173
Risk, treasury and capital management
Banking products exposure by business division
| | | | | | | | | | | | | | | | | | | | | | | | |
| | Wealth Management | | | Wealth Management Americas | | | Retail & Corporate | |
| CHF million | | 31.12.13 | | | 31.12.12 | | | 31.12.13 | | | 31.12.12 | | | 31.12.13 | | | 31.12.12 | |
| Balances with central banks | | | 356 | | | | 413 | | | | | | | | | | | | 0 | | | | 2,173 | |
| | | | | | | | | | | | | | | | | | | | | | | | | |
| Due from banks | | | 1,243 | | | | 1,039 | | | | 1,706 | | | | 2,195 | | | | 2,756 | | | | 2,713 | |
| | | | | | | | | | | | | | | | | | | | | | | | | |
| Loans1 | | | 96,813 | | | | 86,581 | | | | 34,846 | | | | 31,250 | | | | 136,499 | | | | 137,344 | |
| | | | | | | | | | | | | | | | | | | | | | | | | |
| Guarantees | | | 2,277 | | | | 2,326 | | | | 416 | | | | 406 | | | | 9,741 | | | | 10,042 | |
| | | | | | | | | | | | | | | | | | | | | | | | | |
| Loan commitments | | | 1,646 | | | | 1,574 | | | | 601 | | | | 1,214 | | | | 7,045 | | | | 6,787 | |
| | | | | | | | | | | | | | | | | | | | | | | | | |
| Banking products2 | | | 102,335 | | | | 91,932 | | | | 37,569 | | | | 35,065 | | | | 156,042 | | | | 159,059 | |
| | | | | | | | | | | | | | | | | | | | | | | | | |
| Banking products, net3 | | | 102,264 | | | | 91,891 | | | | 37,528 | | | | 35,048 | | | | 155,484 | | | | 158,359 | |
| | | | | | | | | | | | | | | | | | | | | | | | | |
1 Does not include reclassified securities and similar acquired securities in our Legacy Portfolio.2 Excludes loans designated at fair value.3 Net of allowances, provisions and hedges.
Wealth Management: composition of loan portfolio, gross
| | | | | | | | | | | | | | | | |
| | 31.12.13 | | | 31.12.12 | |
| | | CHF million | | | % | | | CHF million | | | % | |
| Secured by residential property | | | 33,425 | | | | 34.5 | | | | 30,829 | | | | 35.6 | |
| | | | | | | | | | | | | | | | | |
| Secured by commercial/industrial property | | | 2,204 | | | | 2.3 | | | | 1,972 | | | | 2.3 | |
| | | | | | | | | | | | | | | | | |
| Secured by cash | | | 12,139 | | | | 12.5 | | | | 12,235 | | | | 14.1 | |
| | | | | | | | | | | | | | | | | |
| Secured by securities | | | 40,054 | | | | 41.4 | | | | 34,973 | | | | 40.4 | |
| | | | | | | | | | | | | | | | | |
| Secured by guarantees and other collateral | | | 8,519 | | | | 8.8 | | | | 6,265 | | | | 7.2 | |
| | | | | | | | | | | | | | | | | |
| Unsecured loans | | | 472 | | | | 0.5 | | | | 307 | | | | 0.4 | |
| | | | | | | | | | | | | | | | | |
| Total loans, gross | | | 96,813 | | | | 100.0 | | | | 86,581 | | | | 100.0 | |
| | | | | | | | | | | | | | | | | |
| Total loans, net of allowances and credit hedges | | | 96,741 | | | | | | | | 86,540 | | | | | |
| | | | | | | | | | | | | | | | | |
Wealth Management Americas: composition of loan portfolio, gross
| | | | | | | | | | | | | | | | |
| | 31.12.13 | | | 31.12.12 | |
| | | CHF million | | | % | | | CHF million | | | % | |
| Secured by residential property | | | 5,635 | | | | 16.2 | | | | 3,461 | | | | 11.1 | |
| | | | | | | | | | | | | | | | | |
| Secured by commercial/industrial property | | | | | | | | | | | | | | | | |
| | | | | | | | | | | | | | | | | |
| Secured by cash | | | 820 | | | | 2.4 | | | | 698 | | | | 2.2 | |
| | | | | | | | | | | | | | | | | |
| Secured by securities | | | 26,740 | | | | 76.7 | | | | 25,543 | | | | 81.7 | |
| | | | | | | | | | | | | | | | | |
| Secured by guarantees and other collateral | | | 1,410 | | | | 4.0 | | | | 1,319 | | | | 4.2 | |
| | | | | | | | | | | | | | | | | |
| Unsecured loans1 | | | 241 | | | | 0.7 | | | | 228 | | | | 0.7 | |
| | | | | | | | | | | | | | | | | |
| Total loans, gross | | | 34,846 | | | | 100.0 | | | | 31,250 | | | | 100.0 | |
| | | | | | | | | | | | | | | | | |
| Total loans, net of allowances and credit hedges | | | 34,805 | | | | | | | | 31,233 | | | | | |
| | | | | | | | | | | | | | | | | |
1 Includes credit cards exposures.
174
|
Risk, treasury and capital management |
|
|
| | | | | | | | | | | | | | | | | | | | | | | | | | | | | | | | | | | | | | | | |
| | Global Asset Management | | | Investment Bank | | | Corporate Center – Core Functions | | | CC – Non-core | | | CC – Legacy Portfolio | |
| | | 31.12.13 | | | 31.12.12 | | | 31.12.13 | | | 31.12.12 | | | 31.12.13 | | | 31.12.12 | | | 31.12.13 | | | 31.12.12 | | | 31.12.13 | | | 31.12.12 | |
| | | | | | | | | | | 145 | | | | 381 | | | | 78,403 | | | | 61,029 | | | | 7 | | | | 122 | | | | | | | | | |
| | | | | | | | | | | | | | | | | | | | | | | | | | | | | | | | | | | | | | | | | |
| | | 586 | | | | 337 | | | | 9,518 | | | | 15,485 | | | | 2,912 | | | | 1,111 | | | | 91 | | | | 36 | | | | 140 | | | | | |
| | | | | | | | | | | | | | | | | | | | | | | | | | | | | | | | | | | | | | | | | |
| | | 152 | | | | 91 | | | | 13,290 | | | | 14,994 | | | | 394 | | | | 1,246 | | | | 548 | | | | 1,294 | | | | 2,562 | | | | 3,443 | |
| | | | | | | | | | | | | | | | | | | | | | | | | | | | | | | | | | | | | | | | | |
| | | 1 | | | | | | | | 5,757 | | | | 2,743 | | | | 12 | | | | 12 | | | | 459 | | | | 3,331 | | | | | | | | | |
| | | | | | | | | | | | | | | | | | | | | | | | | | | | | | | | | | | | | | | | | |
| | | 49 | | | | | | | | 32,211 | | | | 45,178 | | | | 22 | | | | 10 | | | | 9,569 | | | | 3,577 | | | | 74 | | | | 29 | |
| | | | | | | | | | | | | | | | | | | | | | | | | | | | | | | | | | | | | | | | | |
| | | 787 | | | | 428 | | | | 60,921 | | | | 78,780 | | | | 81,743 | | | | 63,409 | | | | 10,674 | | | | 8,360 | | | | 2,776 | | | | 3,472 | |
| | | | | | | | | | | | | | | | | | | | | | | | | | | | | | | | | | | | | | | | | |
| | | 787 | | | | 428 | | | | 51,022 | | | | 59,177 | | | | 81,743 | | | | 63,409 | | | | 6,998 | | | | 7,259 | | | | 2,765 | | | | 3,433 | |
| | | | | | | | | | | | | | | | | | | | | | | | | | | | | | | | | | | | | | | | | |
Retail & Corporate
Gross banking products exposure within Retail & Corporate was CHF 156 billion as of 31 December 2013 compared with CHF 159 billion as of 31 December 2012.
Retail & Corporate’s gross loan portfolio decreased to CHF 136 billion from CHF 137 billion at the end of the prior year. The composition of the Retail & Corporate loan portfolio was largely unchanged over the year. At year-end 2013, 93% of this portfolio was secured by collateral, mainly residential and commercial property. Based on our internal ratings, 54% of the unsecured loan portfolio was rated investment grade. Of the total unsecured amount, 60% related to cash flow-based lending to corporate counterparties and approximately a quarter related to lending to public authorities. At the end of the year, and based on our internal ratings, approximately 64% of Retail & Corporate’s net banking products exposure was classified as investment grade compared with 69% in the prior year, with over 80% of this portion categorized in the lowest loss given default (LGD) bucket of 0% to 25%. Our Swiss mortgage portfolio, which is managed together with Swiss mortgage loans originated through our Wealth Management business, is discussed further below. Rating tools and LGD for real estate exposures were recalibrated during the year to take the Swiss real estate crisis of
the 1990s into account. As a result, the overall profile of exposures shifted towards sub-investment grade and higher LGD.
Our Swiss corporate lending portfolio consists of loans to multinational counterparties and corporates. Although this portfolio is well-diversified across industries, these Swiss counterparties are, in general, highly reliant on the domestic economy and the economies to which they export. The EUR/CHF exchange rate, for which the Swiss National Bank has maintained a target minimum rate of CHF 1.20 since September 2011, is an important risk factor for Swiss corporates engaged in exports, predominantly to the European Union (EU). We are also closely monitoring the implications of any return of crisis conditions within the eurozone on export markets, and the potential implications of the recent decision to reinstate immigration quotas for EU/EEA countries.
The delinquency ratio, being the ratio of past due but not impaired loans to total loans, was 0.9% for the corporate loan portfolio as of 31 December 2013 compared with 0.7% as of 31 December 2012.
| | è | | Refer to “Credit risk models” in this section for more information on LGD, rating grades and rating agency mappings |
| | è | | Refer to “Changes to models and model parameters during the period” in this section for more information on the recalibration of the rating tools and LGD for real estate exposures |
Retail & Corporate: composition of loan portfolio, gross
| | | | | | | | | | | | | | | | |
| | 31.12.13 | | | 31.12.12 | |
| | | CHF million | | | % | | | CHF million | | | % | |
| Secured by residential property | | | 99,155 | | | | 72.6 | | | | 98,681 | | | | 71.8 | |
| | | | | | | | | | | | | | | | | |
| Secured by commercial/industrial property | | | 20,377 | | | | 14.9 | | | | 19,861 | | | | 14.5 | |
| | | | | | | | | | | | | | | | | |
| Secured by cash | | | 247 | | | | 0.2 | | | | 173 | | | | 0.1 | |
| | | | | | | | | | | | | | | | | |
| Secured by securities | | | 1,219 | | | | 0.9 | | | | 1,414 | | | | 1.0 | |
| | | | | | | | | | | | | | | | | |
| Secured by guarantees and other collateral | | | 6,029 | | | | 4.4 | | | | 5,875 | | | | 4.3 | |
| | | | | | | | | | | | | | | | | |
| Unsecured loans | | | 9,471 | | | | 6.9 | | | | 11,340 | | | | 8.3 | |
| | | | | | | | | | | | | | | | | |
| Total loans, gross | | | 136,499 | | | | 100.0 | | | | 137,344 | | | | 100.0 | |
| | | | | | | | | | | | | | | | | |
| Total loans, net of allowances and credit hedges | | | 135,971 | | | | | | | | 136,770 | | | | | |
| | | | | | | | | | | | | | | | | |
Risk, treasury and capital management
Retail & Corporate: distribution of net banking products exposure across internal UBS ratings and loss given default (LGD) buckets
| | | | | | | | | | | | | | | | | | | | | | | | | | | | | | | | | | | | |
CHF million, except where indicated | | 31.12.13 | | | 31.12.12 | |
| | | Moody’s | | | | | | | LGD bucket | | | | | | | | | | |
| Internal UBS rating | | Investors
Service
mapping | | Standard &
Poor’s
mapping | | Exposure | | | 0–25% | | | 26–50% | | | 51–75% | | | 76–100% | | | Weighted
average
LGD (%) | | | Exposure | | | Weighted
average
LGD (%) | |
| Investment grade | | Aaa to Baa3 | | AAA to BBB– | | | 98,752 | | | | 82,204 | | | | 14,432 | | | | 2,104 | | | | 12 | | | | 14 | | | | 109,447 | | | | 10 | |
| | | | | | | | | | | | | | | | | | | | | | | | | | | | | | | | | | | | | |
| Sub-investment grade | | | | | | | 57,290 | | | | 46,825 | | | | 7,718 | | | | 1,633 | | | | 1,114 | | | | 17 | | | | 49,522 | | | | 16 | |
| | | | | | | | | | | | | | | | | | | | | | | | | | | | | | | | | | | | | |
of which: 6–9 | | Ba1 to B1 | | BB+ to B+ | | | 51,556 | | | | 42,887 | | | | 6,129 | | | | 1,426 | | | | 1,113 | | | | 17 | | | | 45,861 | | | | 16 | |
| | | | | | | | | | | | | | | | | | | | | | | | | | | | | | | | | | | | | |
of which: 10–12 | | B2 to Caa | | B to CCC | | | 4,235 | | | | 3,749 | | | | 467 | | | | 18 | | | | 2 | | | | 12 | | | | 1,921 | | | | 14 | |
| | | | | | | | | | | | | | | | | | | | | | | | | | | | | | | | | | | | | |
of which: 13 and defaulted | | Ca and lower | | CC and lower | | | 1,499 | | | | 188 | | | | 1,122 | | | | 189 | | | | 0 | | | | 37 | | | | 1,741 | | | | 24 | |
| | | | | | | | | | | | | | | | | | | | | | | | | | | | | | | | | | | | | |
| Total exposure after application of credit hedges, before deduction of allowances, provisions | | | | | | | 156,042 | | | | 129,029 | | | | 22,150 | | | | 3,737 | | | | 1,127 | | | | 15 | | | | 158,969 | | | | 12 | |
| | | | | | | | | | | | | | | | | | | | | | | | | | | | | | | | | | | | | |
| Less: allowances, provisions | | | | | | | 558 | | | | | | | | | | | | | | | | | | | | | | | | 610 | | | | | |
| | | | | | | | | | | | | | | | | | | | | | | | | | | | | | | | | | | | | |
| Net banking products exposure after application of credit hedges | | | | | | | 155,484 | | | | | | | | | | | | | | | | | | | | | | | | 158,359 | | | | | |
| | | | | | | | | | | | | | | | | | | | | | | | | | | | | | | | | | | | | |
Retail & Corporate: unsecured loans by industry sector
| | | | | | | | | | | | | | | | |
| | 31.12.13 | | | 31.12.12 | |
| | | CHF million | | | % | | | CHF million | | | % | |
| Construction | | | 101 | | | | 1.1 | | | | 108 | | | | 1.0 | |
| | | | | | | | | | | | | | | | | |
| Financial institutions | | | 696 | | | | 7.3 | | | | 1,106 | | | | 9.8 | |
| | | | | | | | | | | | | | | | | |
| Hotels and restaurants | | | 69 | | | | 0.7 | | | | 51 | | | | 0.5 | |
| | | | | | | | | | | | | | | | | |
| Manufacturing | | | 1,563 | | | | 16.5 | | | | 1,921 | | | | 16.9 | |
| | | | | | | | | | | | | | | | | |
| Private households | | | 1,358 | | | | 14.3 | | | | 1,578 | | | | 13.9 | |
| | | | | | | | | | | | | | | | | |
| Public authorities | | | 2,286 | | | | 24.1 | | | | 2,562 | | | | 22.6 | |
| | | | | | | | | | | | | | | | | |
| Real estate and rentals | | | 531 | | | | 5.6 | | | | 430 | | | | 3.8 | |
| | | | | | | | | | | | | | | | | |
| Retail and wholesale | | | 1,519 | | | | 16.0 | | | | 1,818 | | | | 16.0 | |
| | | | | | | | | | | | | | | | | |
| Services | | | 1,213 | | | | 12.8 | | | | 1,289 | | | | 11.4 | |
| | | | | | | | | | | | | | | | | |
| Other | | | 135 | | | | 1.4 | | | | 478 | | | | 4.2 | |
| | | | | | | | | | | | | | | | | |
| Total | | | 9,471 | | | | 100.0 | | | | 11,340 | | | | 100.0 | |
| | | | | | | | | | | | | | | | | |
Swiss mortgages: distribution of net exposure at default (EAD) across exposure segments andloan-to-value (LTV) buckets
| | | | | | | | | | | | | | | | | | | | | | | | | | | | | | | | | | | | | | |
CHF billion, except where indicated | | 31.12.13 | | | 31.12.12 | |
| | | | | LTV bucket | | | | | | | |
| Exposure segment | | | | £30% | | | 31–50% | | | 51–60% | | | 61–70% | | | 71–80% | | | 81–100% | | | >100% | | | Total | | | Total | |
| Residential mortgages | | Net EAD | | | 68.4 | | | | 31.5 | | | | 8.7 | | | | 4.2 | | | | 1.3 | | | | 0.2 | | | | 0.0 | | | | 114.4 | | | | 114.7 | |
| | | | | | | | | | | | | | | | | | | | | | | | | | | | | | | | | | | | | | | |
| | as a % of row total | | | 60 | | | | 28 | | | | 8 | | | | 4 | | | | 1 | | | | 0 | | | | 0 | | | | 100 | | | | | |
| | | | | | | | | | | | | | | | | | | | | | | | | | | | | | | | | | | | | | | |
| Income-producing real estate (IPRE) | | Net EAD | | | 11.0 | | | | 5.0 | | | | 1.5 | | | | 0.8 | | | | 0.3 | | | | 0.1 | | | | 0.0 | | | | 18.6 | | | | 17.1 | |
| | | | | | | | | | | | | | | | | | | | | | | | | | | | | | | | | | | | | | | |
| | as a % of row total | | | 59 | | | | 27 | | | | 8 | | | | 4 | | | | 1 | | | | 0 | | | | 0 | | | | 100 | | | | | |
| | | | | | | | | | | | | | | | | | | | | | | | | | | | | | | | | | | | | | | |
| Corporates | | Net EAD | | | 5.2 | | | | 2.3 | | | | 0.6 | | | | 0.3 | | | | 0.1 | | | | 0.1 | | | | 0.1 | | | | 8.8 | | | | 9.3 | |
| | | | | | | | | | | | | | | | | | | | | | | | | | | | | | | | | | | | | | | |
| | as a % of row total | | | 59 | | | | 26 | | | | 7 | | | | 4 | | | | 2 | | | | 1 | | | | 1 | | | | 100 | | | | | |
| | | | | | | | | | | | | | | | | | | | | | | | | | | | | | | | | | | | | | | |
| Other segments | | Net EAD | | | 0.7 | | | | 0.3 | | | | 0.1 | | | | 0.0 | | | | 0.0 | | | | 0.0 | | | | 0.0 | | | | 1.1 | | | | 1.2 | |
| | | | | | | | | | | | | | | | | | | | | | | | | | | | | | | | | | | | | | | |
| | as a % of row total | | | 66 | | | | 23 | | | | 5 | | | | 3 | | | | 2 | | | | 0 | | | | 0 | | | | 100 | | | | | |
| | | | | | | | | | | | | | | | | | | | | | | | | | | | | | | | | | | | | | | |
| Mortgage-covered exposure | | Net EAD | | | 85.4 | | | | 39.0 | | | | 10.9 | | | | 5.3 | | | | 1.7 | | | | 0.4 | | | | 0.1 | | | | 142.9 | | | | 142.3 | |
| | | | | | | | | | | | | | | | | | | | | | | | | | | | | | | | | | | | | | | |
| | as a % of total | | | 60 | | | | 27 | | | | 8 | | | | 4 | | | | 1 | | | | 0 | | | | 0 | | | | 100 | | | | | |
| | | | | | | | | | | | | | | | | | | | | | | | | | | | | | | | | | | | | | | |
| Mortgage-covered exposure 31.12.12 | | Net EAD | | | 82.3 | | | | 39.7 | | | | 11.5 | | | | 5.9 | | | | 2.1 | | | | 0.5 | | | | 0.3 | | | | 142.3 | | | | | |
| | | | | | | | | | | | | | | | | | | | | | | | | | | | | | | | | | | | | | | |
| | as a % of total | | | 58 | | | | 28 | | | | 8 | | | | 4 | | | | 1 | | | | 0 | | | | 0 | | | | 100 | | | | | |
| | | | | | | | | | | | | | | | | | | | | | | | | | | | | | | | | | | | | | | |
176
|
Risk, treasury and capital management |
|
|
Our largest loan portfolio continues to be our mortgage loan portfolio secured by residential and commercial real estate in Switzerland. These mortgage loans mainly originate from Retail & Corporate but also include mortgage loans originating from Wealth Management. The majority of these mortgage loans, CHF 124 billion, relate to residential properties that the borrower either occupies or rents out and are full recourse to the borrower. Approximately 70% of the Swiss residential mortgage loan portfolio relates to properties occupied by the borrower. The average loan-to-value (LTV) ratio of this portfolio was 53% as of 31 December 2013 compared with 55% as of 31 December 2012. The average LTV for newly originated loans in 2013 was 62% compared with 63% in 2012. The remaining 30% of the Swiss residential mortgage loan portfolio relates to properties rented out by the borrower. The average LTV of this portfolio was 57% as of 31 December 2013 compared with 58% as of 31 December 2012. The average LTV for newly originated loans in 2013 was 59% compared with 56% in 2012.
As illustrated by the table “Swiss mortgages: distribution of net exposure at default (EAD) across exposure segments and loan-to-value (LTV) buckets,” over 99% of the aggregate amount of Swiss residential mortgage loans would continue to be covered by the real estate collateral even if the value assigned to that collateral were to decrease by 20%. In this table, the amount of each mortgage loan is allocated across the LTV buckets to indicate the portion at risk at the various value levels shown. For example, a loan of 75 with an LTV ratio of 75% (collateral value of 100) would result in allocations of 30 in the less than 30% bucket, 20 in the 31 – 50% bucket, 10 in the 51 – 60% bucket, 10 in the 61 – 70% bucket and five in the 71 – 80% bucket.
The delinquency ratio for the Swiss mortgages portfolio was approximately 0.5% as of 31 December 2013, unchanged from the end of the prior year.
Global Asset Management
Gross banking products exposure within Global Asset Management was less than CHF 1 billion as of 31 December 2013.
Investment Bank
The Investment Bank’s lending activities are largely associated with corporates and non-bank financial institutions, which is broadly diversified across industry sectors, but concentrated in North America.
The gross banking products exposure of the Investment Bank decreased to CHF 61 billion as of 31 December 2013 compared with CHF 79 billion as of 31 December 2012.
The Investment Bank actively manages the credit risk of this portfolio and, as of 31 December 2013, held CHF 9.8 billion of single-name CDS hedges against its exposures to corporates and other non-banks, a decrease compared with CHF 19.5 billion at the end of 2012. In addition, the Investment Bank held CHF 396 million of loss protection from the subordinated tranches of structured credit protection which is not reflected in the table.
Net banking products exposure, excluding balances with central banks and the vast majority of due from banks and after allowances, provisions and hedges, reduced to CHF 42.3 billion as of 31 December 2013 from CHF 48.9 billion at the end of 2012. At the end of the year and based on our internal ratings, 57% of the Investment Bank’s net banking products exposure was classified as investment
Investment Bank: banking products1
| | | | | | | | |
| CHF million | | 31.12.13 | | | 31.12.12 | |
| Total exposure, before deduction of allowances, provisions and hedges2 | | | 52,186 | | | | 68,434 | |
| | | | | | | | | |
Less: allowances, provisions | | | (36 | ) | | | (42 | ) |
| | | | | | | | | |
Less: credit protection bought (credit default swaps, notional)3 | | | (9,843 | ) | | | (19,540 | ) |
| | | | | | | | | |
| Net exposure after allowances, provisions and hedges | | | 42,308 | | | | 48,851 | |
| | | | | | | | | |
1 Risk view, excludes balances with central banks, internal risk adjustments and the vast majority of due from banks exposures.2 Banking products including money market and nostro accounts amount to CHF 60,921 million (31 December 2012: CHF 78,780 million).3 The effect of portfolio hedges, such as index credit default swaps (CDS), and of loss protection from the subordinated tranches of structured credit protection have not been reflected in this table.
Investment Bank: distribution of net banking products exposure, across internal UBS ratings and loss given default (LGD) buckets
| | | | | | | | | | | | | | | | | | | | | | | | | | | | | | | | | | | | |
CHF million, except where indicated | | 31.12.13 | | | 31.12.12 | |
| | | Moody’s | | | | | | | LGD bucket | | | | | | | | | | |
| Internal UBS rating | | Investors
Service
mapping | | Standard &
Poor’s
mapping | | Exposure | | | 0–25% | | | 26–50% | | | 51–75% | | | 76–100% | | | Weighted
average
LGD (%) | | | Exposure | | | Weighted
average
LGD (%) | |
| Investment grade | | Aaa to Baa3 | | AAA to BBB– | | | 24,017 | | | | 5,547 | | | | 12,285 | | | | 1,830 | | | | 4,356 | | | | 47 | | | | 28,873 | | | | 36 | |
| | | | | | | | | | | | | | | | | | | | | | | | | | | | | | | | | | | | | |
| Sub-investment grade | | | | | | | 18,290 | | | | 10,385 | | | | 5,451 | | | | 1,760 | | | | 694 | | | | 26 | | | | 19,978 | | | | 25 | |
| | | | | | | | | | | | | | | | | | | | | | | | | | | | | | | | | | | | | |
of which: 6–9 | | Ba1 to B1 | | BB+ to B+ | | | 10,541 | | | | 6,492 | | | | 2,192 | | | | 1,622 | | | | 236 | | | | 25 | | | | 13,410 | | | | 21 | |
| | | | | | | | | | | | | | | | | | | | | | | | | | | | | | | | | | | | | |
of which: 10–12 | | B2 to Caa | | B to CCC | | | 7,625 | | | | 3,792 | | | | 3,247 | | | | 138 | | | | 448 | | | | 29 | | | | 6,397 | | | | 32 | |
| | | | | | | | | | | | | | | | | | | | | | | | | | | | | | | | | | | | | |
of which: 13 and defaulted | | Ca and lower | | CC and lower | | | 124 | | | | 102 | | | | 11 | | | | 0 | | | | 11 | | | | 17 | | | | 171 | | | | 17 | |
| | | | | | | | | | | | | | | | | | | | | | | | | | | | | | | | | | | | | |
| Net banking products exposure, after application of credit hedges | | | | | | | 42,308 | | | | 15,932 | | | | 17,735 | | | | 3,590 | | | | 5,051 | | | | 38 | | | | 48,851 | | | | 32 | |
| | | | | | | | | | | | | | | | | | | | | | | | | | | | | | | | | | | | | |
177
Risk, treasury and capital management
Investment Bank: net banking products exposure by geographical region
| | | | | | | | | | | | | | | | |
| | 31.12.13 | | | 31.12.12 | |
| | | CHF million | | | % | | | CHF million | | | % | |
| Asia Pacific | | | 2,808 | | | | 6.6 | | | | 4,084 | | | | 8.4 | |
| | | | | | | | | | | | | | | | | |
| Latin America | | | 277 | | | | 0.7 | | | | 205 | | | | 0.4 | |
| | | | | | | | | | | | | | | | | |
| Middle East and Africa | | | 80 | | | | 0.2 | | | | 238 | | | | 0.5 | |
| | | | | | | | | | | | | | | | | |
| North America | | | 31,069 | | | | 73.4 | | | | 34,723 | | | | 71.1 | |
| | | | | | | | | | | | | | | | | |
| Switzerland | | | 852 | | | | 2.0 | | | | 244 | | | | 0.5 | |
| | | | | | | | | | | | | | | | | |
| Rest of Europe | | | 7,222 | | | | 17.1 | | | | 9,357 | | | | 19.2 | |
| | | | | | | | | | | | | | | | | |
| Net exposure | | | 42,308 | | | | 100.0 | | | | 48,851 | | | | 100.0 | |
| | | | | | | | | | | | | | | | | |
Investment Bank: net banking products exposure by industry sector
| | | | | | | | | | | | | | | | |
| | 31.12.13 | | | 31.12.12 | |
| | | CHF million | | | % | | | CHF million | | | % | |
| Banks | | | 3,133 | | | | 7.4 | | | | 5,524 | | | | 11.3 | |
| | | | | | | | | | | | | | | | | |
| Chemicals | | | 1,532 | | | | 3.6 | | | | 1,304 | | | | 2.7 | |
| | | | | | | | | | | | | | | | | |
| Electricity, gas, water supply | | | 2,142 | | | | 5.1 | | | | 3,630 | | | | 7.4 | |
| | | | | | | | | | | | | | | | | |
| Financial institutions, excluding banks | | | 12,303 | | | | 29.1 | | | | 11,477 | | | | 23.5 | |
| | | | | | | | | | | | | | | | | |
| Manufacturing | | | 5,080 | | | | 12.0 | | | | 7,521 | | | | 15.4 | |
| | | | | | | | | | | | | | | | | |
| Mining | | | 6,158 | | | | 14.6 | | | | 5,488 | | | | 11.2 | |
| | | | | | | | | | | | | | | | | |
| Public authorities | | | 3,122 | | | | 7.4 | | | | 2,702 | | | | 5.5 | |
| | | | | | | | | | | | | | | | | |
| Retail and wholesale | | | 1,534 | | | | 3.6 | | | | 1,795 | | | | 3.7 | |
| | | | | | | | | | | | | | | | | |
| Transport, storage and communication | | | 3,149 | | | | 7.4 | | | | 3,389 | | | | 6.9 | |
| | | | | | | | | | | | | | | | | |
| Other | | | 4,154 | | | | 9.8 | | | | 6,021 | | | | 12.3 | |
| | | | | | | | | | | | | | | | | |
| Net exposure | | | 42,308 | | | | 100.0 | | | | 48,851 | | | | 100.0 | |
| | | | | | | | | | | | | | | | | |
grade compared with 59% at the end of the prior year. The majority of the Investment Bank’s net banking products exposure had estimated LGD of between 0% and 50%.
| | è | | Refer to “Credit risk models” in this section for more information on LGD, rating grades and rating agency mappings |
Corporate Center – Core Functions
Gross banking products exposure within Corporate Center – Core Functions increased by CHF 18 billion to CHF 82 billion. This exposure arises in connection with treasury activities and primarily consists of balances with central banks.
Corporate Center – Non-core and Legacy Portfolio
| | è | | Refer to “Corporate Center – Non-core and Legacy Portfolio” in this section for more information |
Traded products
Exposures to OTC derivatives are generally measured as net positive replacement values after the application of legally enforceable netting agreements and the deduction of cash collateral. Exchange-traded derivatives (ETD) exposures take into account initial and daily variation margins. Securities financing exposures are reported taking into account collateral received.
The majority of the credit risk arising from traded products relates to OTC derivatives, primarily within Corporate Center – Non-core and Legacy Portfolio and the Investment Bank. As counterparty risk for traded products exposure is managed at a counterparty level, no split between exposures in the Investment Bank and those in Non-core and Legacy Portfolio is provided. The tables below provide information on our OTC derivative exposures across the Investment Bank and Corporate Center – Non-core and Legacy Portfolio.
Credit risk arising from traded products, after the effects of master netting agreements but excluding credit valuation adjustments and hedges, decreased by CHF 6 billion to CHF 50 billion. This decrease reflected continued progress in managing down credit risks within Corporate Center – Non-core and Legacy Portfolio.
178
|
Risk, treasury and capital management |
|
|
Investment Bank and CC –Non-core and Legacy Portfolio: OTC derivatives exposure1
| | | | | | | | |
| CHF million | | 31.12.13 | | | 31.12.12 | |
| Total exposure, before deduction of allowances, provisions and hedges | | | 23,466 | | | | 28,154 | |
| | | | | | | | | |
Less: allowances, provisions | | | (687 | ) | | | (1,083 | ) |
| | | | | | | | | |
Less: credit protection bought (credit default swaps, notional) | | | (965 | ) | | | (2,559 | ) |
| | | | | | | | | |
| Net exposure after allowances, provisions and hedges | | | 21,814 | | | | 24,511 | |
| | | | | | | | | |
1 Net replacement value includes the impact of netting agreements (including cash collateral) in accordance with Swiss federal banking law.
Investment Bank and CC –Non-core and Legacy Portfolio: distribution of net OTC derivatives exposure, across internal UBS ratings and loss given default (LGD) buckets
| | | | | | | | | | | | | | | | | | | | | | | | | | | | | | | | | | | | |
CHF million, except where indicated | | 31.12.13 | | | 31.12.12 | |
| | | Moody’s | | | | | | | LGD bucket | | | | | | | | | | |
| Internal UBS rating | | Investors
Service
mapping | | Standard &
Poor’s
mapping | | Exposure | | | 0–25% | | | 26–50% | | | 51–75% | | | 76–100% | | | Weighted
average
LGD (%) | | | Exposure | | | Weighted
average
LGD (%) | |
| Investment grade | | Aaa to Baa3 | | AAA to BBB– | | | 20,319 | | | | 4,372 | | | | 13,881 | | | | 819 | | | | 1,247 | | | | 36 | | | | 22,938 | | | | 34 | |
| | | | | | | | | | | | | | | | | | | | | | | | | | | | | | | | | | | | | |
| Sub-investment grade | | | | | | | 1,494 | | | | 482 | | | | 533 | | | | 264 | | | | 215 | | | | 44 | | | | 1,573 | | | | 35 | |
| | | | | | | | | | | | | | | | | | | | | | | | | | | | | | | | | | | | | |
of which: 6–9 | | Ba1 to B1 | | BB+ to B+ | | | 950 | | | | 401 | | | | 252 | | | | 93 | | | | 204 | | | | 42 | | | | 1,270 | | | | 36 | |
| | | | | | | | | | | | | | | | | | | | | | | | | | | | | | | | | | | | | |
of which: 10–12 | | B2 to Caa | | B to CCC | | | 263 | | | | 73 | | | | 181 | | | | 2 | | | | 8 | | | | 32 | | | | 47 | | | | 43 | |
| | | | | | | | | | | | | | | | | | | | | | | | | | | | | | | | | | | | | |
of which: 13 and defaulted | | Ca and lower | | CC and lower | | | 281 | | | | 9 | | | | 100 | | | | 169 | | | | 3 | | | | 61 | | | | 257 | | | | 30 | |
| | | | | | | | | | | | | | | | | | | | | | | | | | | | | | | | | | | | | |
| Net OTC derivatives exposure, after application of credit hedges | | | | | | | 21,814 | | | | 4,855 | | | | 14,414 | | | | 1,082 | | | | 1,462 | | | | 37 | | | | 24,511 | | | | 34 | |
| | | | | | | | | | | | | | | | | | | | | | | | | | | | | | | | | | | | | |
Investment Bank and CC –Non-core and Legacy Portfolio: net OTC derivatives exposure by geographical region
| | | | | | | | | | | | | | | | |
| | 31.12.13 | | | 31.12.12 | |
| | | CHF million | | | % | | | CHF million | | | % | |
| Asia Pacific | | | 4,023 | | | | 18.4 | | | | 3,499 | | | | 14.3 | |
| | | | | | | | | | | | | | | | | |
| Latin America | | | 126 | | | | 0.6 | | | | 219 | | | | 0.9 | |
| | | | | | | | | | | | | | | | | |
| Middle East and Africa | | | 112 | | | | 0.5 | | | | 755 | | | | 3.1 | |
| | | | | | | | | | | | | | | | | |
| North America | | | 7,350 | | | | 33.7 | | | | 9,600 | | | | 39.2 | |
| | | | | | | | | | | | | | | | | |
| Switzerland | | | 1,004 | | | | 4.6 | | | | 864 | | | | 3.5 | |
| | | | | | | | | | | | | | | | | |
| Rest of Europe | | | 9,198 | | | | 42.2 | | | | 9,575 | | | | 39.1 | |
| | | | | | | | | | | | | | | | | |
| Net exposure | | | 21,814 | | | | 100.0 | | | | 24,511 | | | | 100.0 | |
| | | | | | | | | | | | | | | | | |
Investment Bank and CC –Non-core and Legacy Portfolio: net OTC derivatives exposure by industry sector1
| | | | | | | | | | | | | | | | |
| | 31.12.13 | | | 31.12.12 | |
| | | CHF million | | | % | | | CHF million | | | % | |
| Banks | | | 7,351 | | | | 33.7 | | | | 7,947 | | | | 32.4 | |
| | | | | | | | | | | | | | | | | |
| Chemicals | | | 98 | | | | 0.4 | | | | 224 | | | | 0.9 | |
| | | | | | | | | | | | | | | | | |
| Electricity, gas, water supply | | | 239 | | | | 1.1 | | | | 463 | | | | 1.9 | |
| | | | | | | | | | | | | | | | | |
| Financial institutions, excluding banks | | | 9,511 | | | | 43.6 | | | | 8,968 | | | | 36.6 | |
| | | | | | | | | | | | | | | | | |
| Manufacturing | | | 371 | | | | 1.7 | | | | 331 | | | | 1.4 | |
| | | | | | | | | | | | | | | | | |
| Mining | | | 125 | | | | 0.6 | | | | 114 | | | | 0.5 | |
| | | | | | | | | | | | | | | | | |
| Public authorities | | | 3,155 | | | | 14.5 | | | | 5,075 | | | | 20.7 | |
| | | | | | | | | | | | | | | | | |
| Retail and wholesale | | | 130 | | | | 0.6 | | | | 54 | | | | 0.2 | |
| | | | | | | | | | | | | | | | | |
| Transport, storage and communication | | | 463 | | | | 2.1 | | | | 601 | | | | 2.5 | |
| | | | | | | | | | | | | | | | | |
| Other | | | 372 | | | | 1.7 | | | | 736 | | | | 3.0 | |
| | | | | | | | | | | | | | | | | |
| Net exposure | | | 21,814 | | | | 100.0 | | | | 24,511 | | | | 100.0 | |
| | | | | | | | | | | | | | | | | |
179
Risk, treasury and capital management
| | |
| | Credit risk mitigation |
| | We actively manage the credit risk in our portfolios by taking collateral against exposures and by utilizing credit hedging. |
| | |
| | Lending secured by real estate |
| | We use a scoring model as part of a standardized front-to-back process to support credit decisions for the origination or modification of Swiss mortgage loans. The two key factors within this model are an affordability calculation relative to gross income and the loan-to-value (LTV) ratio. The calculation of affordability takes into account interest payments, minimum amortization requirements, potential property maintenance costs and, in the case of properties expected to be rented out, the level of rental income. Interest payments are estimated using a predefined framework, which takes into account the potential for significant increases in interest rates during the lifetime of the loan. For properties occupied by the borrower, the maximum LTV allowed within the standard approval process is 80%. This is reduced to 60% in the case of vacation properties and luxury real estate. For properties rented out by the borrower, the maximum LTV allowed within the standard approval process ranges from 60% to 80%, depending on the type of property, the age of the property and the amount of any renovation work required. |
| |
| |
| |
| |
| |
| |
| |
| |
| |
| |
| |
| |
| |
| | The value assigned by UBS to each property is based on the lowest value determined based on internally calculated valuations, the purchase price and, in some cases, an additional external valuation. We use two separate models provided by a market-leading external vendor to derive property valuations for owner-occupied residential properties (ORP) and income-producing real estate. For ORP, we estimate the current value of properties by using a regression model (hedonic model) to compare detailed characteristics for each property against a database of property transactions. In addition to the model-derived values, valuations for ORP are updated annually throughout the lifetime of the loan by using region-specific real estate price indices. The price indices are sourced from an external vendor and are subject to internal validation and bench-marking against two other external vendors. On an annual basis, we use these valuations to compute indexed LTV for all ORP and consider these together with other risk measures (e.g., rating migration and behavioral information) to identify higher-risk loans, which are then reviewed manually by client advisors and credit officers and actions are taken where considered necessary. For income-producing real estate, a capitalization model is used to determine the property valuation by discounting estimated sustainable future income using a capitalization rate based on various attributes. These attributes consider regional as well as specific property characteristics such as market and location data (e.g., vacancy rates), benchmarks (e.g., for running costs) and certain other standardized input parameters (e.g., property condition). Rental income from properties is reviewed, at a minimum, once every three years but indications of significant changes in the amount of rental income or the level of vacancy rate can trigger an interim reappraisal. |
| |
| |
| |
| |
| |
| |
| |
| |
| |
| |
| |
| |
| |
| |
| |
| |
| |
| |
| |
| |
| |
| |
| |
| |
| |
| |
| | |
| | To take market developments into account for these models, the external vendor regularly updates the parameters and/or refines the architecture for each model. Model changes and parameter updates are subject to the same validation procedures as for our internally developed models. |
| | We similarly apply underwriting guidelines for our Wealth Management Americas mortgage loan portfolio to ensure affordability of the loans and sufficiency of collateral. These include the following: maximum loan amounts, maturities and LTV limits by type of property, debt-to-income limits, required reserves as a percentage of proposed loan amounts and appropriate credit score guidelines. The maximum LTV allowed within the standard approval process ranges from 45% to 80% depending on property type and overall loan size. |
| |
| |
| |
| |
| |
| |
| | è | | Refer to “Retail & Corporate” in “Credit risk profile of the Group – Internal risk view” in this section for more information on LTV in our Swiss mortgage portfolio |
| | è | | Refer to “Wealth Management Americas” in “Credit risk profile of the Group – Internal risk view” in this section for more information on LTV in our Wealth Management Americas mortgage portfolio |
| | |
| | Exposures secured by other forms of collateral |
| | Lombard loans and other lending such as securities financing transactions are secured against the pledge of eligible marketable securities, guarantees and other forms of collateral. Eligible financial securities primarily include transferable securities (such as bonds and equities), which are liquid and actively traded, and other transferable securities such as approved structured products for which regular prices are available and for which the issuer of the security provides a market. |
| | We apply discounts (haircuts) to reflect the collateral’s risk and to derive the “lending value.” Haircuts for eligible marketable securities are calculated to cover the possible change in the market value over a given close-out period and confidence level. For less liquid instruments such as structured products and certain bonds, and for products with long redemption periods, the close-out period might be much longer than that for highly liquid instruments, resulting in a higher haircut. For cash, life insurance policies and guarantees/letters of credit, haircuts are determined on a product-/client-specific basis. Where such products are held with a third party, a further haircut is applied to cover any related operational risks and the potential cost of closing out such collateral. |
| |
| |
| |
| |
| |
| |
| |
| |
| |
| |
| | We also consider concentration risks across collateral pledged. A concentration of collateral in single securities, issuers or issuer groups, industry sectors, countries, regions or currencies may result in higher risk and reduced liquidity. In such cases, transactions are subject to a higher level of credit approval and the lending value of the collateral, margin call and close-out levels are adjusted accordingly. |
| | Exposures and collateral values are monitored on a daily basis to ensure that the credit exposure continues to be covered by sufficient collateral. A shortfall occurs when the lending value drops |
180
|
Risk, treasury and capital management |
|
|
| | | | |
| | below the exposure. If a shortfall exceeds a defined trigger level, a margin call is initiated, requiring the client to provide additional collateral, reduce the exposure or take other action to bring exposure in line with the lending value of the collateral. If the shortfall widens, or is not corrected within the required period, a close-out is initiated, through which collateral is liquidated, open derivative positions are closed and guarantees or letters of credit are called. We also conduct stress testing of collateralized exposures to simulate market events which increase the risk of collateral shortfalls and unsecured exposures by significantly reducing the value of the collateral, increasing the exposure of traded products, or both. The results are monitored against thresholds at a portfolio level and, in some cases, at an individual client level. |
| | è | | Refer to “Stress loss” in “Credit risk models” in this section for more information on our stress testing |
| | | | |
| | Our OTC derivatives trading is conducted through central counterparties (CCP) where practicable. Where CCP are not used, we have clearly defined processes for entering into netting and collateral arrangements, including the requirement to have a legal opinion on the enforceability of contracts in relevant jurisdictions in the case of insolvency. Trading is generally conducted under bilateral International Swaps and Derivatives Association (ISDA) or ISDA-equivalent master netting agreements, which allow for the close-out and netting of all transactions in the event of default. For certain major market participant counterparties, we may in addition use two-way collateral agreements under which either party can be required to provide collateral in the form of cash or marketable securities, typically limited to well-rated government debt, when the exposure exceeds specified levels. |
| | è | | Refer to “Note 14 Derivative instruments and hedge accounting” in the “Financial information” section of this report for more information on our OTC derivatives settled through CCP |
| | è | | Refer to “Note 26 Offsetting financial assets and financial liabilities” in the “Financial information” section of this report for more information on the effect of netting and collateral arrangements on our derivative exposures |
| | | | |
| | Credit hedging |
| | We utilize single-name credit default swaps CDS, credit index CDS, bespoke protection, and other instruments to actively manage credit risk in the Investment Bank and Corporate Center – Non-core and Legacy Portfolio. This is aimed at reducing concentrations of risk from specific counterparties, sectors or portfolios. We maintain high standards for taking credit hedges into account for credit risk mitigation purposes. For example, when monitoring exposures against limits, we do not usually recognize credit risk mitigants such as proxy hedges (credit protection on a correlated but different name) or credit index CDS. Buying credit protection also creates credit exposure against the protection provider. We monitor our exposures to credit protection providers and the effectiveness of credit hedges as part of our overall credit exposures to the relevant counterparties. In addition, we identify |
| | | | |
| | and monitor positions where we believe there is significant exposure and correlation between the counterparty and the hedge provider (so-called wrong-way risk). Our policy is to discourage such activity, and in any event or as market correlations may change, not to recognize hedge benefits subject to wrong-way risk within counterparty limits and credit exposure-related capital calculations. |
| | è | | Refer to “Note 14 Derivative instruments and hedge accounting” in the “Financial information” section of this report for more information |
Mitigation of settlement risk
To mitigate settlement risk, we reduce our actual settlement volumes through the use of multilateral and bilateral agreements with counterparties, including payment netting.
Our most significant source of settlement risk is foreign exchange transactions. We are a member of Continuous Linked Settlement, a foreign exchange clearing house which allows transactions to be settled on a delivery-versus-payment basis, thereby significantly reducing foreign exchange-related settlement risk relative to the volume of business. The mitigation of settlement risk through Continuous Linked Settlement membership and other means does not eliminate our credit risk in foreign exchange transactions (resulting from changes in exchange rates prior to settlement), which is managed as part of our overall credit risk management of OTC derivatives.
Credit risk models
| | | | |
| | We have developed tools and models in order to estimate future credit losses that may be implicit in our current portfolio. Exposures to individual counterparties are measured based on three generally accepted parameters: probability of default (PD), loss given default (LGD) and exposure at default (EAD). For a given credit facility, the product of these three parameters results in the 12 months’ expected loss. These parameters are the basis for the majority of our internal measures of credit risk, and are key inputs for the regulatory capital calculation under the advanced internal ratings-based approach of the Basel III framework governing international convergence of capital. We also use models to derive the portfolio credit risk measures of expected loss, statistical loss and stress loss. |
The table on the next page summarizes the key features of the models that we use to derive PD, LGD and EAD for our main portfolios and is followed by more detailed explanations of these parameters.
| | è | | Refer to the “Supplemental disclosures required under Basel III Pillar 3 regulations” section of this report for more information on the regulatory capital calculation under the advanced internal ratings-based approach |
Probability of default
The PD is an estimate of the likelihood of a counterparty defaulting on its contractual obligations over the next 12 months. PD
181
Risk, treasury and capital management
ratings are used for credit risk measurement and as an important input for determining credit risk approval authorities.
PD is assessed using rating tools tailored to the various categories of counterparties. Statistically developed score cards, based on key attributes of the obligor and any associated collateral, are used to determine PD for many of our corporate clients and for loans secured by real estate. Where available, market data may also be used to derive the PD for large corporate counterparties. For Lombard loans, Merton-type model simulations taking into account potential changes in the value of securities collateral are used in our rating approach. These categories are also calibrated to our internal credit rating scale (masterscale), which is designed
to ensure a consistent assessment of default probabilities across counterparties. Our masterscale expresses one-year default probabilities that we determine through our various rating tools by means of distinct classes, whereby each class incorporates a range of default probabilities. Counterparties migrate between rating classes as our assessment of their PD changes.
The ratings of the major credit rating agencies, and their mapping to our internal rating masterscale and internal PD bands, are shown in the table “Internal UBS rating scale and mapping of external ratings” below. The mapping is based on the long-term average of one-year default rates available from the rating agencies. For each external rating category, the average default rate is
| | | | | | | | | | |
| Key features of our main credit risk models | | | |
| | | Portfolio in scope | | Model approach | | Main drivers | | Number of
years loss data | |
| Probability of default | | Swiss owner-occupied mortgages | | Score card | | Behavioral data, affordability relative to income, property type, loan-to-value | | | 19 | |
| | Income Producing Real Estate mortgages | | Transaction rating | | Loan-to-value, debt-service-coverage | | | 19 | |
| | Lombard lending | | Merton type | | Loan-to-value, portfolio volatility | | | 5–10 | |
| | Retail & Corporate – Corporates | | Score card | | Financial data including balance sheet ratios and profit and loss, and qualitative risk factors | | | 15 | |
| | Investment Bank – Banks | | Score card | | Financial data including balance sheet ratios and profit and loss | | | 5–10 | |
| | Investment Bank – Corporates | | Score card/market
data | | Financial data including balance sheet ratios and profit and loss, and market data | | | 5–10 | |
| | | | | | | | | | | |
| Loss given default | | Swiss owner-occupied mortgages | | Actuarial model | | Historical observed loss rates, loan-to-value, property type | | | 19 | |
| | Income Producing Real Estate mortgages | | Actuarial model | | Historical observed loss rates | | | 19 | |
| | Lombard lending | | Actuarial model | | Portfolio volatility, portfolio illiquidity | | | 5–10 | |
| | Investment Bank – all counterparties | | Actuarial model | | Counterparty and facility specific, including industry segment, collateral, seniority, legal environment and bankruptcy procedures | | | 5–10 | |
| | | | | | | | | | | |
| Exposure at default | | Banking products | | Statistical model | | Exposure type (committed credit lines, revocable credit lines, contingent products) | | | > 10 | |
| | Traded products | | Statistical model | | Product specific market drivers, e.g., interest rates | | | > 10 | |
| | | | | | | | | | | |
| | | | | | | | | | | | | | | | |
| | Internal UBS rating scale and mapping of external ratings | |
| | | | | | | | | | | | | | | | |
| | Internal UBS rating | | 1-year PD range
in % | | Description | | Moody’s Investors
Service mapping | | Standard & Poor’s
mapping | | | Fitch
mapping | |
| | | | | | | | | | | | | | | | |
| | 0 and 1 | | 0.00–0.02 | | Investment grade | | Aaa | | | AAA | | | | AAA | |
| | | | | | | | | | | | | | | | |
| | 2 | | 0.02–0.05 | | | | Aa1 to Aa3 | | | AA+ to AA– | | | | AA+ to AA– | |
| | | | | | | | | | | | | | | | |
| | 3 | | 0.05–0.12 | | | | A1 to A3 | | | A+ to A– | | | | A+ to A– | |
| | | | | | | | | | | | | | | | |
| | 4 | | 0.12–0.25 | | | | Baa1 to Baa2 | | | BBB+ to BBB | | | | BBB+ to BBB | |
| | | | | | | | | | | | | | | | |
| | 5 | | 0.25–0.50 | | | | Baa3 | | | BBB– | | | | BBB– | |
| | | | | | | | | | | | | | | | |
| | 6 | | 0.50–0.80 | | Sub-investment grade | | Ba1 | | | BB+ | | | | BB+ | |
| | | | | | | | | | | | | | | | |
| | 7 | | 0.80–1.30 | | | | Ba2 | | | BB | | | | BB | |
| | | | | | | | | | | | | | | | |
| | 8 | | 1.30–2.10 | | | | Ba3 | | | BB– | | | | BB– | |
| | | | | | | | | | | | | | | | |
| | 9 | | 2.10–3.50 | | | | B1 | | | B+ | | | | B+ | |
| | | | | | | | | | | | | | | | |
| | 10 | | 3.50–6.00 | | | | B2 | | | B | | | | B | |
| | | | | | | | | | | | | | | | |
| | 11 | | 6.00–10.00 | | | | B3 | | | B– | | | | B– | |
| | | | | | | | | | | | | | | | |
| | 12 | | 10.00–17.00 | | | | Caa | | | CCC | | | | CCC | |
| | | | | | | | | | | | | | | | |
| | 13 | | >17 | | | | Ca to C | | | CC to C | | | | CC to C | |
| | | | | | | | | | | | | | | | |
| | Counterparty is in default (CDF) | | Default | | Defaulted | | | | | D | | | | D | |
182
|
Risk, treasury and capital management |
|
|
compared with our internal PD bands to derive a mapping to our internal rating scale. Our internal rating of a counterparty may, therefore, diverge from one or more of the correlated external ratings shown in the table. Observed defaults by rating agencies may vary through economic cycles, and we do not necessarily expect the actual number of defaults in our equivalent rating band to equal the rating agencies’ average in any given period. We periodically assess the long-term average default rates of credit rating agencies’ grades, and we adjust their mapping to our masterscale as necessary to reflect any material changes.
Loss given default
Loss given default (LGD) is the magnitude of the likely loss if there is a default. LGD estimates include loss of principal, interest and other amounts (such as workout costs, including the cost of carrying an impaired position during the workout process) less recovered amounts. We determine LGD based on the likely recovery rate of claims against defaulted counterparties, which depends on the type of counterparty and any credit mitigation by way of collateral or guarantees. Our estimates are supported by our internal loss data and external information where available. Where we hold collateral, such as marketable securities or a mortgage on a property, loan-to-value ratios are a key parameter in determining LGD.
Exposure at default
Exposure at default (EAD) represents the amount we expect to be owed by a counterparty at the time of a possible default. We derive EAD from our current exposure to the counterparty and the possible future development of that exposure.
The EAD of a loan is the drawn or face value of the loan. For loan commitments and guarantees, the EAD includes the amount drawn as well as potential future amounts that may be drawn, which are estimated based on historical observations.
For traded products, we derive the EAD by modeling the range of possible exposure outcomes at various points in time using scenario and statistical techniques. We assess the net amount that may be owed to us or that we may owe to others, taking into account the impact of market moves over the potential time it would take to close out our positions. For exchange-traded derivatives, our calculation of EAD takes into account initial and daily variation margins. When measuring individual counterparty exposure against credit limits, we consider the maximum likely exposure measured to a high level of confidence. However, when aggregating exposures to different counterparties for portfolio risk measurement purposes, we use the expected exposure to each counterparty at a given time period (usually one year) generated by the same model.
We assess our exposures where there is a material correlation between the factors driving the credit quality of the counterparty and those driving the potential future value of our traded product exposure (wrong-way risk), and we have established specific controls to mitigate these risks.
Expected loss
Credit losses are an inherent cost of doing business, but the occurrence and amount of credit losses can be erratic. In order to quantify future credit losses that may be implicit in our current portfolio, we use the concept of expected loss.
Expected loss is a statistical measure used to estimate the average annual costs we expect to experience from positions that become impaired. The expected loss for a given credit facility is a function of the three components described above: PD, EAD and LGD. We aggregate the expected loss for individual counterparties to derive our expected portfolio credit losses.
Expected loss is the basis for quantifying credit risk in all our portfolios. It is also the starting point for the measurement of our portfolio statistical loss and stress loss.
We use a statistical modeling approach to estimate the loss profile of each of our credit portfolios over a one-year period to a specified level of confidence. The mean value of this loss distribution is the expected loss. The loss estimates deviate from the mean value due to statistical uncertainty on the defaulting counterparties and to systematic default relationships among counterparties within and between segments. The statistical measure is sensitive to concentration risks on individual counterparties and groups of counterparties. The outcome provides an indication of the level of risk in our portfolio and the way it may develop over time.
Stress loss
We complement our statistical modeling approach with scenario-based stress loss measures. Stress tests are run on a regular basis to monitor the potential impact of extreme but nevertheless plausible events on our portfolios, under which key credit risk parameters are assumed to deteriorate substantially. Where we consider it appropriate, we apply limits on this basis.
Stress scenarios and methodologies are tailored to the nature of the portfolios, ranging from regionally focused to global systemic events, and varying in time horizon. For example, for our loan underwriting portfolio, we apply a global market event under which, simultaneously, the market for loan syndication freezes, market conditions significantly worsen, and credit quality deteriorates. Similarly, for Lombard lending, we apply a range of scenarios representing instantaneous market shocks to all collateral positions, taking into consideration their liquidity and potential concentrations. The portfolio-specific stress test for our mortgage lending in Switzerland reflects a multi-year event and the overarching stress test for global wholesale and counterparty credit risk to corporates uses a one-year global stress event and takes into account exposure concentrations to single counterparties.
| | è | | Refer to “Stress testing” in this section for more information on our stress testing framework |
Credit risk model validation
Applied models and methodologies must be approved and regularly reviewed in accordance with regulatory requirements as well
Risk, treasury and capital management
as internal policies to ensure that models perform as expected, produce results consistent with real events and values, and reflect best-in-practice approaches as well as recent academic developments. Accordingly, we assess whether the model is performing satisfactorily, additional analysis is required, or recalibration or redevelopment need to be performed. Results and conclusions are presented to the relevant governance body and, as required, to regulators.
The ongoing process of assessing model quality and performance in the production environment comprises two components: model verification, being the initial and regular assessment of the model’s conceptual soundness, performed by the internal Independent Verification Unit (IVU), and model confirmation, representing the regular process of checking the accuracy and appropriateness of the model output and its application, carried out by the model developers and reviewed by the IVU.
Our approach to model confirmation involves both quantitative methods, including monitoring compositional changes in the portfolios and the results of backtesting, and qualitative assessments,
including feedback from users on the model output as a practical indicator of the performance and reliability of the model.
Material changes in a portfolio composition may invalidate the conceptual soundness of the model. We therefore perform regular analysis of the evolution of portfolios to identify such changes in the structure and credit quality of portfolios. This includes analysis of changes in key attributes, changes in portfolio concentration measures, as well as changes in RWA.
Backtesting
We monitor the performance of our models by backtesting and benchmarking them, whereby model outcomes are compared with actual results, based on our internal experience as well as externally observed results. We take a portfolio (or sub-portfolio or rating bucket) approach to determine whether behavior observed is in line with that predicted by our models.
For PD, we use statistical modeling to derive a distribution of expected number of defaults. The observed number of defaults is then compared with this distribution, allowing us to derive a
| | | | | | | | | | | | | | | | | | | | |
| Credit models backtesting by regulatory exposure segment | |
| | | Length of time | | | Actual rates in % | | | | |
| | | series used for
the calibration
(in years) | | | Average of last
5 years1 | | | Min. of last
5 years2 | | | Max. of last
5 years2 | | | Estimated average
rates at the start
of the period in % | |
| PD | | | | | | | | | | | | | | | | | | | | |
| Corporates3 | | | > 10 | | | | 0.19 | | | | 0.07 | | | | 0.46 | | | | 0.38 | |
| | | | | | | | | | | | | | | | | | | | | |
| Sovereigns | | | > 10 | | | | 0.00 | | | | 0.00 | | | | 0.00 | | | | 0.34 | |
| | | | | | | | | | | | | | | | | | | | | |
| Banks | | | > 10 | | | | 0.18 | | | | 0.05 | | | | 0.45 | | | | 0.55 | |
| | | | | | | | | | | | | | | | | | | | | |
| Retail | | | | | | | | | | | | | | | | | | | | |
| | | | | | | | | | | | | | | | | | | | | |
Residential mortgages | | | > 15 | | | | 0.16 | | | | 0.13 | | | | 0.22 | | | | 0.19 | |
| | | | | | | | | | | | | | | | | | | | | |
Lombard lending | | | > 10 | | | | 0.02 | | | | 0.00 | | | | 0.06 | | | | 0.20 | |
| | | | | | | | | | | | | | | | | | | | | |
Other retail | | | > 10 | | | | 0.36 | | | | 0.24 | | | | 0.47 | | | | 1.05 | |
| | | | | | | | | | | | | | | | | | | | | |
| | | | | |
| LGD | | | | | | | | | | | | | | | | | | | | |
| Corporates | | | > 10 | | | | 21.39 | | | | 8.45 | | | | 24.97 | | | | 19.64 | |
| | | | | | | | | | | | | | | | | | | | | |
| Sovereigns | | | > 10 | | | | | | | | | | | | | | | | 40.43 | |
| | | | | | | | | | | | | | | | | | | | | |
| Banks | | | > 10 | | | | 30.40 | | | | 18.80 | | | | 35.67 | | | | 37.73 | |
| | | | | | | | | | | | | | | | | | | | | |
| Retail | | | | | | | | | | | | | | | | | | | | |
| | | | | | | | | | | | | | | | | | | | | |
Residential mortgages | | | > 10 | | | | 2.14 | | | | 0.00 | | | | 3.52 | | | | 6.12 | |
| | | | | | | | | | | | | | | | | | | | | |
Lombard lending4 | | | > 10 | | | | 42.64 | | | | 40.42 | | | | 40.42 | | | | 20.00 | |
| | | | | | | | | | | | | | | | | | | | | |
Other retail | | | > 10 | | | | 23.43 | | | | 6.65 | | | | 31.62 | | | | 47.64 | |
| | | | | | | | | | | | | | | | | | | | | |
| | | | | |
| CCF | | | | | | | | | | | | | | | | | | | | |
| | | | | | | | | | | | | | | | | | | | | |
| Corporates | | | > 10 | | | | 15.77 | | | | 9.75 | | | | 30.65 | | | | 38.65 | |
| | | | | | | | | | | | | | | | | | | | | |
1 Average of all observations over the last five years. 2 Minimum/maximum annual average of observations in any single year from the last five years. Yearly averages are only calculated where five or more observations occurred during that year. 3 Reported averages are low due to the impact of managed funds, which have relatively low default rates. 4 For Lombard lending, the minimum and maximum annual observations for LGD relate to 2009, being the only year in which five or more defaults were observed. Due to the low number of defaults over this period, the observed averages are not meaningful comparators to the equivalent estimated average, which is calibrated using a larger data set spanning a longer historical period.
184
|
Risk, treasury and capital management |
|
|
statistical level of confidence in the model accuracy. In addition, we derive a lower and upper bound for the average default rate. If the portfolio average PD lies outside the derived interval, the rating tool is, as a general rule, recalibrated.
We apply a similar approach to assess the predictive power of our simulations of potential future exposures for traded products such as OTC derivatives.
For LGD, we compute the difference between observed and estimated LGD for defaulted counterparties with the expectation that, for each specific LGD model, the distribution of those differences is symmetric around zero with a small dispersion. Models are recalibrated where these differences are outside expectations.
Credit conversion factors (CCF), used for the calculation of EAD for undrawn facilities with corporate counterparties, are dependent on several contractual dimensions of the credit facility. Similar to our approach for PD, we compare the predicted amount drawn with observed historical utilization of such facilities for defaulted counterparties. If any statistically significant deviation is observed, the relevant CCF are redefined.
The table on the previous page compares the current model calibration for PD, LGD and CCF with historical observed values over the last five years.
Changes to models and model parameters during the period
As part of our continuous efforts to enhance models to reflect market developments and new available data, certain models have been modified in the course of 2013. The rating and LGD models for residential mortgages have been enhanced to increase the extent to which they take into account the availability of clients’ behavioral data. A new model has been implemented for
rating large multinationals, taking into account extended market information, research and analysis to assess the creditworthiness of the counterparty. To meet Basel III requirements, developments have been made in the context of the derivatives future exposure calculations, with new models for the calculation of the future close-out risk and CVA. Where required, changes to models and model parameters are approved by FINMA prior to implementation.
Comparison of actual versus expected loss
In addition to the above comparison of estimated with observed parameter values, the table below provides a breakdown over the last five years of the one-year expected loss estimate on our credit portfolios (covering banking and traded products) and the actual IFRS credit loss amount (including CVA on derivatives) charged against our income statement, according to BIS-defined exposure segments of the advanced internal ratings-based approach.
Although such a comparison may provide some insight, comparison between expected and actual losses has certain limitations and the two measures may not be directly comparable. For example, our estimates of expected loss are calibrated on a “through-the-cycle” basis, taking into account observed losses over a prolonged historical period. In contrast, the actual loss figures presented are a “point-in-time” view of our credit loss expenses, equal to the amount charged to the income statement in a specific financial year. Furthermore, the estimated expected loss at the start of the period assumes that the portfolio will be unchanged throughout the coming year. In reality, the portfolio composition changes on an ongoing basis, affecting the actual loss experience.
| | | | | | | | | | | | | | | | | | | | | | | | | | | | | | | | | | | | | | | | |
| Total expected loss and actual credit loss | | | | | | | | | | | | | | | | | | | |
| | Expected
loss | | | Actual
loss | | | Expected
loss | | | Actual
loss | | | Expected
loss | | | Actual
loss | | | Expected
loss | | | Actual
loss | | | Expected
loss | | | Actual
loss | |
| | | | | | For the
year ended | | | | | | For the
year ended | | | | | | For the
year ended | | | | | | For the
year ended | | | | | | For the
year ended | |
| CHF million | | 31.12.12 | | | 31.12.13 | | | 31.12.11 | | | 31.12.12 | | | 31.12.10 | | | 31.12.11 | | | 31.12.09 | | | 31.12.10 | | | 31.12.08 | | | 31.12.09 | |
| Corporates1 | | | (199 | ) | | | 31 | | | | (322 | ) | | | 884 | | | | (336 | ) | | | (321 | ) | | | (359 | ) | | | 1,577 | | | | (610 | ) | | | (1,093 | ) |
| | | | | | | | | | | | | | | | | | | | | | | | | | | | | | | | | | | | | | | | | |
| Sovereigns | | | (4 | ) | | | 0 | | | | (19 | ) | | | 0 | | | | (27 | ) | | | | | | | (8 | ) | | | | | | | (13 | ) | | | 1 | |
| | | | | | | | | | | | | | | | | | | | | | | | | | | | | | | | | | | | | | | | | |
| Banks | | | (36 | ) | | | 3 | | | | (35 | ) | | | (1 | ) | | | (40 | ) | | | (1 | ) | | | (37 | ) | | | 26 | | | | (57 | ) | | | (22 | ) |
| | | | | | | | | | | | | | | | | | | | | | | | | | | | | | | | | | | | | | | | | |
| Retail | | | | | | | | | | | | | | | | | | | | | | | | | | | | | | | | | | | | | | | | |
| | | | | | | | | | | | | | | | | | | | | | | | | | | | | | | | | | | | | | | | | |
Residential mortgages | | | (96 | ) | | | (2 | ) | | | (59 | ) | | | 15 | | | | (62 | ) | | | 3 | | | | (84 | ) | | | 1 | | | | (87 | ) | | | (1 | ) |
| | | | | | | | | | | | | | | | | | | | | | | | | | | | | | | | | | | | | | | | | |
Lombard lending | | | (32 | ) | | | (36 | ) | | | (24 | ) | | | (12 | ) | | | (30 | ) | | | 12 | | | | (19 | ) | | | 5 | | | | (34 | ) | | | 52 | |
| | | | | | | | | | | | | | | | | | | | | | | | | | | | | | | | | | | | | | | | | |
Other retail | | | (18 | ) | | | (8 | ) | | | (5 | ) | | | (11 | ) | | | | | | | (5 | ) | | | (5 | ) | | | (2 | ) | | | (11 | ) | | | (30 | ) |
| | | | | | | | | | | | | | | | | | | | | | | | | | | | | | | | | | | | | | | | | |
| Not allocated segment2 | | | | | | | 99 | | | | | | | | 24 | | | | | | | | (75 | ) | | | | | | | 7 | | | | | | | | (17 | ) |
| | | | | | | | | | | | | | | | | | | | | | | | | | | | | | | | | | | | | | | | | |
| Total | | | (386 | ) | | | 88 | | | | (463 | ) | | | 899 | | | | (494 | ) | | | (387 | ) | | | (512 | ) | | | 1,615 | | | | (812 | ) | | | (1,110 | ) |
| | | | | | | | | | | | | | | | | | | | | | | | | | | | | | | | | | | | | | | | | |
1 Includes actual credit recovery in Corporate Center – Non-core and Legacy Portfolio, which amounted to CHF 3 million (31 December 2012: CHF 78 million net loss). 2 Includes changes in collective loan loss allowances and provisions.
185
Risk, treasury and capital management
| | | | |
| | Policies for past due, non-performing and impaired claims |
| | The diagram below illustrates how we categorize banking products and securities financing transactions as performing, non-performing or impaired. For products accounted for on a fair value basis, such as OTC derivatives, credit deterioration is recognized through a CVA, and these products are therefore not subject to the below impairment framework. We consider a claim to be past due when a contractual payment has not been received by its contractual due date. This includes account overdrafts where the credit limit is exceeded. Past due claims are not considered impaired where we expect to collect all amounts due under the contractual terms of the claims. A past due claim is considered non-performing when the payment of interest, principal or fees is overdue by more than 90 days. Claims are also classified as non-performing when insolvency proceedings/enforced liquidation have commenced or obligations have been restructured on preferential terms, such as preferential interest rates, extension of maturity or subordination. Non-performing claims are rated as being in counterparty default on our internal rating scale. |
| | | | |
| | Individual claims are classified as impaired if, following an individual impairment assessment, their carrying amount exceeds the recoverable amount, where the recoverable amount is defined as the present value of the expected cash flows relating to the exposures. Accordingly, both performing and non-performing loans may be classified as impaired. |
| | Restructured claims |
| | Due to low volumes of distressed claims, we do not operate a general policy for restructuring claims in order to avoid default of the counterparty. Where restructuring does take place, we assess each case individually. Typical features of terms and conditions granted through restructuring to avoid default may include the provision of special interest rates, postponement of interest or principal payments, modification of the schedule of repayments or amendment of loan maturity. If a loan is restructured with preferential conditions (i.e., new terms and conditions are agreed which do not meet the normal current market criteria for the quality of the obligor and the type of loan), the claim is still classified as non-performing and is rated as being in counterparty default. It will remain so until the loan is |
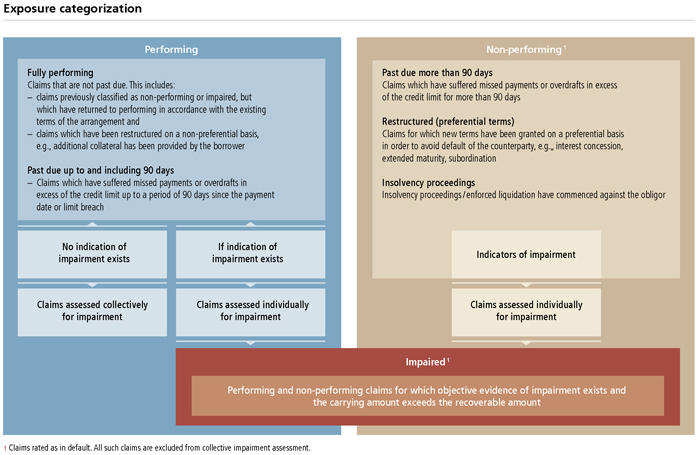
186
|
Risk, treasury and capital management |
|
|
| | | | |
| | collected, written off or non-preferential conditions are granted that supersede the preferential conditions, and will be assessed for impairment on an individual basis. If a loan is restructured with non-preferential conditions (e.g., additional collateral is provided by the client, or new terms and conditions meet the normal market criteria for the quality of the obligor and the type of loan), the loan is classified as performing, but assessed for impairment on an individual basis. Management regularly reviews all loans to ensure that all criteria according to the loan agreement continue to be met and that future payments are likely to occur. |
| | Individual and collective impairment assessments |
| | Claims are assessed individually for impairment where there are indicators that an impairment may exist. Otherwise claims are included in a collective impairment assessment. |
| | Individual impairment |
| | Non-performing status is considered an indicator that a loan may be impaired and therefore all non-performing claims are assessed individually for impairment. However, an impairment analysis would be carried out irrespective of non-performing status if other objective evidence indicates that a loan may be impaired. Any event that impacts current and future cash flows may be an indication of impairment and trigger an assessment by the risk officer. Such events may be (i) significant collateral shortfalls due to a fall in lending values (securities and real estate), (ii) increase in loan or derivative exposures, (iii) significant financial difficulties of a client and (iv) high probability of bankruptcy, debt moratorium or financial reorganization of the client. Individual claims are assessed for impairment based on the borrower’s character, overall financial condition, resources and payment record, the prospects for support from any financially responsible guarantors, and where applicable, the realizable value of any collateral. The recoverable amount is determined from all relevant cash flows and, where this is lower than the carrying amount of the claim, the claim is considered impaired. We consider a reclassified security an impaired loan if the carrying value at the balance sheet date is, on a cumulative basis, 5% or more below the carrying value at the reclassification date adjusted for redemptions. We have established processes to ensure that the carrying values of impaired claims are determined in compliance with IFRS |
| | | | |
| | requirements. Our credit controls applied to valuation and workout are the same for both amortized cost and fair-valued credit products. Our workout strategy and estimation of recoverable amounts are independently approved in accordance with our credit authorities. |
| | | Collective impairment |
| | We assess our portfolios of claims carried at amortized cost with similar credit risk characteristics for collective impairment in order to consider if these portfolios contain impaired claims that cannot yet be individually identified. To cover the time lag between the occurrence of an impairment event and its identification based on the policies above, we establish collective loan loss allowances based on the estimated loss for the portfolio over the average period between trigger events and the identification of any individual impairment. These portfolios are not considered impaired loans in the tables shown in the composition of credit risk for business divisions above. Additionally, for all of our portfolios we assess whether there have been any developments which might result in event-driven impairments that are not immediately observable. These events could be stress situations, such as a natural disaster or a country crisis, or they could result from significant changes in the legal or regulatory environment. To determine whether a collective impairment exists, we regularly use a set of global economic drivers to assess the most vulnerable countries and review the impact of any potential impairment event. |
| | | Recognition of impairment |
| | The recognition of impairment in our financial statements depends on the accounting treatment of the claim. For claims carried at amortized cost, impairment is recognized through the creation of an allowance, or in the case of off-balance sheet items such as guarantees and loan commitments through a provision, both charged to the income statement as a credit loss expense. For derivatives, which are carried at fair value, a deterioration of the credit quality is recognized through a CVA charged to the income statement through theNet trading incomeline. |
| | è | | Refer to “Note 1 Significant accounting policies” and “Note 24a Valuation principles” in the “Financial information” section of this report for more information on allowances and provisions for credit losses and credit valuation adjustments |
Risk, treasury and capital management
Risk management and control
Market risk
| | | | |
| | | Key developments during the period |
| | We maintained a low level of market risk in our trading businesses, with the risk profile of the Investment Bank reducing and moving towards less complex and more client-oriented businesses. Average exposure levels of our stress loss and statistical (value-at-risk) measures roughly halved over the course of the year. |
| | Main sources of market risk |
| | – | | Market risks arise from both our trading and non-trading business activities. |
| | – | | Trading market risks arise mainly in connection with securities and derivatives trading for market-making and client facilitation purposes within our Investment Bank, and from remaining positions within Non-core and Legacy Portfolio. |
| | – | | Trading market risk also arises from our municipal securities trading business within Wealth Management Americas. |
| | – | | Non-trading market risk arises predominantly in the form of interest rate and foreign exchange risks in connection with our retail banking and lending in our wealth management businesses, our retail and corporate banking businesses in Switzerland and the Investment Bank’s lending business, in addition to treasury activities. |
| | – | | Group Treasury assumes market risks in the process of managing interest rate and structural foreign exchange risks and the funding and liquidity profile of the Group. |
| | – | | Equity and debt investments can also give rise to market risks, as can some aspects of our employee benefits such as defined benefit pension schemes. |
| | | | |
| | | Overview of measurement, monitoring and management techniques |
| | – | | Market risk limits are set for the Group, the business divisions and Corporate Center and at granular levels within the various business lines, reflecting the nature and magnitude of the market risks. |
| | – | | Our primary portfolio measures of market risk are liquidity adjusted stress (LAS) loss and value-at-risk (VaR). Both are common to all our business divisions and subject to limits that are approved by the Board of Directors (BoD). |
| | – | | These measures are complemented by concentration and granular limits for general and specific market risk factors. Our trading businesses are subject to multiple market risk limits. These limits take into account the extent of market liquidity and volatility, available operational capacity, valuation uncertainty, and, for our single-name exposures, the credit quality of issuers. |
| | – | | Issuer risk is controlled by limits applied at business division level based on jump-to-zero measures, which estimate our maximum default exposure (the loss in the case of a default event assuming zero recovery). |
| | – | | Non-trading foreign exchange risks are managed under market risk limits, with the exception of Group Treasury’s management of consolidated capital activity discussed in the “Treasury management” section of this report. All foreign exchange risks are included in our Group-wide statistical and stress testing metrics which flow into our risk appetite framework. |
| | – | | Our Treasury Risk Control function applies a holistic risk framework which sets the appetite for treasury-related risk-taking activities across the Group. A key element of the framework is |
188
|
Risk, treasury and capital management |
|
|
| | | | |
| | | | an overarching economic value sensitivity limit, set by the BoD. This limit is linked to the level of Basel III common equity tier 1 (CET1) capital and takes into account risks arising from interest rates, foreign exchange and credit spreads. In addition, the sensitivity of net interest income to changes in interest rates is monitored against targets set by the Group Chief Executive Officer in order to analyze the outlook and volatility of net interest income based on market expected interest rates. Limits are also set by the BoD to balance the impact of foreign exchange movements on our CET1 capital and CET1 ratio. Non-trading interest rate and foreign exchange risks are included in our Group-wide statistical and stress testing metrics which flow into our risk appetite framework. Further information on interest rate risk in the banking book can be found below, and details on Group Treasury’s management of foreign exchange risks can be found in the “Treasury management” section of this report. |
| | – | | Equity and debt investments are subject to a range of risk controls including pre-approval of new investments by business management and Risk Control and regular monitoring and reporting. They are also included in our Group-wide statistical and stress testing metrics which flow into our risk appetite framework. |
| | | | è Refer to the “Capital management” section of this report for more information on the sensitivity of our CET1 capital and CET1 ratio to currency movements |
Market risk exposures arising from our business activities
The table on the next page highlights the most significant sources of our trading market risk exposures and the interest rate risk on our banking book exposures, categorized according to the business activities that primarily generate the risks and the classification of positions on the balance sheet. In practice, and particularly for positions classified in the banking book, we take account of natural risk offsets that occur between balance sheet line items, for example loans and deposits, and manage the residual exposures. The table does not show the foreign exchange risks arising from Group Treasury’s management of consolidated capital activity discussed in the “Treasury management” section of this report. Also shown in the table is the specific capital treatment for positions classified within the regulatory trading book. The amount of capital required to underpin market risk in the regulatory trading book is calculated using a variety of methods approved by FINMA. The components of market risk RWA are value-at-risk (VaR), stressed VaR, an add-on for risks which are potentially not fully modeled in VaR, the incremental risk charge, the comprehensive risk charge for the correlation portfolio and the securitization framework for securitization positions in the trading book. Further information on each of these components follows the table.
189
Risk, treasury and capital management
Risk management and control
Market risk exposures arising from our business activities
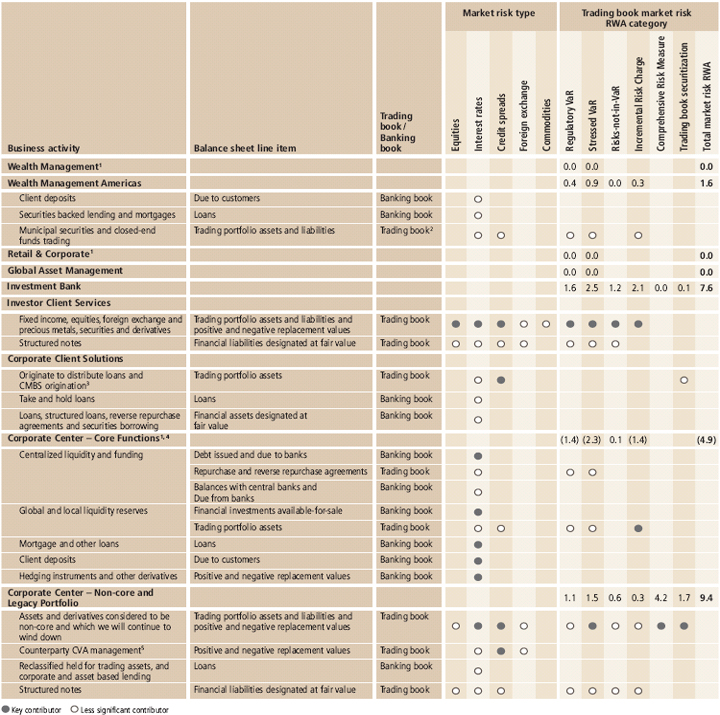
1 Interest rate risk from Wealth Management and Retail & Corporate loans and deposits is transferred to Group Treasury and reported under Corporate Center – Core Functions in this analysis.2 Although risk is controlled under the market risk framework, Puerto Rico closed-end fund positions are treated as banking book for capital underpinning purposes due to market illiquidity.3 Credit spread risk arising from loan underwriting is captured through, and reported as part of, credit risk RWA.4 Negative market risk RWA are due to diversification effects allocated to Corporate Center – Core Functions.5 Counterparty credit risk in the valuation of OTC derivative instruments, derivatives embedded in funded assets designated at fair value and derivatives embedded in traded debt instruments is captured through credit valuation adjustment RWA calculated under the advanced IRB or standardized approach and reported as part of credit risk RWA.
190
|
Risk, treasury and capital management |
|
|
| | | | |
| | Market risk stress loss |
| | We measure and manage our market risks primarily through a comprehensive framework of non-statistical measures and related limits. This includes an extensive series of stress tests and scenario analyses that undergo continuous evaluation to ensure that, if an extreme but nevertheless plausible event were to occur, the resulting losses would not exceed our risk appetite. |
| | Liquidity adjusted stress (LAS) |
| | Our primary measure of stress loss for Group-wide market risk is liquidity adjusted stress (LAS). The LAS framework is designed to capture the economic losses that could arise under specified stress scenarios. This is in part achieved by replacing the standard one-day and 10-day holding period assumptions used for management and regulatory VaR with liquidity adjusted holding periods, as explained below. Shocks are then applied to positions based on the expected market movements over the liquidity adjusted holding periods resulting from the specified scenario. |
| | The holding periods used in LAS are calibrated to reflect the amount of time it would take to flatten the risk of positions in each major risk factor in a stressed environment, assuming maximum utilization of the relevant position limits. Holding periods are also subject to minimum periods, regardless of observed liquidity levels, reflecting the fact that identification of, and reaction to, a crisis may not always be immediate. |
| | The expected market movements are derived using a combination of historical market behavior, based on an analysis of historical events, and forward-looking analysis including consideration of defined scenarios that have not occurred historically. |
| | LAS-based limits are applied at a number of levels: Group-wide, business divisions and Corporate Center, business areas and sub-portfolios. In addition, LAS forms the core market risk component of our combined stress test framework and is therefore integral to our overall risk appetite framework. |
| | è Refer to “Risk appetite” in this section for more information on our risk appetite framework |
| | è Refer to “Stress testing” in this section for more information on our stress testing framework |
| | | | |
| | Value-at-risk |
| | Method applied | | Historical simulation |
| | Data set | | Five years |
| | Holding period | | 10 days for regulatory VaR, 1 day for internal limits |
| | Confidence level | | 99% for regulatory VaR, 95% for internal limits – both based on expected tail loss |
| | Population | | Regulatory trading book for regulatory VaR, a broader population for internal limits |
| | VaR definition |
| | Value-at-risk (VaR) is a statistical measure of market risk, representing the market risk losses that could potentially be realized over a set time horizon (holding period) at an established level of confidence. The measure assumes no change in the Group’s trading positions over the set time horizon. |
| | We calculate VaR on a daily basis, based on the application of historical changes in market risk factors directly to our current positions – a method known as historical simulation. We use a single VaR model for both determining market risk regulatory capital requirements and internal management purposes, although we consider different confidence levels and time horizons. The regulatory measure of market risk used to underpin the market risk capital requirement under Basel III requires a measure equivalent to a 99% confidence level using a 10-day holding period. For internal management purposes, risk limits are established and exposures are measured using VaR at the 95% confidence level with a one- day holding period, more closely aligned to the way we consider the risks associated with our trading activities. |
| | The population of the portfolio within regulatory and management VaR is slightly different. The population within regulatory VaR meets minimum regulatory requirements for inclusion in regulatory VaR. Management VaR includes a broader population of positions. For example, the credit spread risks from the securitization portfolio are treated instead under the securitization approach for regulatory purposes. |
191
Risk, treasury and capital management
Risk management and control
| | | | |
| | VaR limitations |
| | Actual realized market risk losses may differ from those implied by our VaR for a variety of reasons. |
| | – | | The VaR measure is calibrated to a specified level of confidence and may not indicate potential losses beyond this confidence level. |
| | – | | The 10-day time horizon used in the regulatory VaR measure, or one-day in the case of VaR used for internal management purposes, may not fully capture the market risk of positions that cannot be closed out or hedged within the specified period. |
| | – | | In certain cases, VaR calculations approximate the impact of changes in risk factors on the values of positions and portfolios. This may happen because the number of risk factors included in the VaR model is necessarily limited. For example, yield curve risk factors do not exist for all future dates. |
| | – | | The effect of extreme market movements is subject to estimation errors, which may result from non-linear risk sensitivities, as well as the potential for actual volatility and correlation levels to differ from assumptions implicit in the VaR calculations. |
| | – | | The use of a five-year window means that sudden increases in market volatility will tend not to increase VaR as quickly as the use of shorter historical observation periods, but the increase will impact our VaR for a longer period of time. Similarly, following a period of increased volatility, as markets stabilize, VaR predictions will remain more conservative for a period of |
| | | | |
| | | | time influenced by the length of the historical observation period. |
| | We recognize that no single measure may encompass the entirety of risks associated with a position or portfolio. Consequently, we employ a suite of various metrics with both overlapping and complementary characteristics in order to create a holistic framework which ensures material completeness of risk identification and measurement. As a statistical aggregate risk measure, VaR supplements our comprehensive stress testing framework. |
| | Furthermore, we have an established framework to identify and quantify potential risks that are not fully captured by our VaR model. This framework is explained further on. |
| | VaR model developments in 2013 |
| | We made no significant changes to the VaR model during 2013. During the year, we improved the VaR model by integrating selected risk-not-in-VaR items into the VaR model. The impact of incorporating these items into VaR was negligible. |
| | Regulatory VaR for the period |
| | The tables on the next page show minimum, maximum, average and period-end regulatory VaR by business division and Corporate Center and general market risk factor type. The decrease in the Group’s regulatory VaR to CHF 38 million from CHF 63 million is primarily a result of risk reductions. |
192
|
Risk, treasury and capital management |
|
|
| | | | | | | | | | | | | | | | | | | | | | | | | | | | | | | | | | | | |
| Regulatory value-at-risk (10-day, 99% confidence, 5 years of historical data) by business division and Corporate Center and general market risk factor type1 | |
| | For the year ended 31.12.13 | |
| CHF million | | | | | | | | | | | | | | Equity | | | Interest
rates | | | Credit
spreads | | | Foreign
exchange | | | Commodities | |
| | | Min. | | | | | | | | | | | | 21 | | | 22 | | | 46 | | | 3 | | | 6 | |
| | | | | | | | | | | | | | | | | | | | | | | | | | | | | | | | | | | | | |
| | | | | | Max. | | | | | | | | | 78 | | | 71 | | | 131 | | | 110 | | | 38 | |
| | | | | | | | | | | | | | | | | | | | | | | | | | | | | | | | | | | | | |
| | | | | | | | | Average | | | | | | 33 | | | 35 | | | 88 | | | 35 | | | 15 | |
| | | | | | | | | | | | | | | | | | | | | | | | | | | | | | | | | | | | | |
| | | | | | | | | | | | 31.12.13 | | | 27 | | | 31 | | | 62 | | | 10 | | | 11 | |
| Total regulatory VaR, Group | | | 37 | | | | 99 | | | | 54 | | | | 38 | | | | | | | | Average (per business division and risk type) | |
| | | | | | | | | | | | | | | | | | | | | | | | | | | | | | | | | | | | | |
| Wealth Management | | | 0 | | | | 1 | | | | 0 | | | | 0 | | | | 0 | | | | 0 | | | | 0 | | | | 0 | | | | 0 | |
| | | | | | | | | | | | | | | | | | | | | | | | | | | | | | | | | | | | | |
| Wealth Management Americas | | | 9 | | | | 18 | | | | 13 | | | | 10 | | | | 0 | | | | 7 | | | | 20 | | | | 0 | | | | 0 | |
| | | | | | | | | | | | | | | | | | | | | | | | | | | | | | | | | | | | | |
| Retail & Corporate | | | 0 | | | | 0 | | | | 0 | | | | 0 | | | | 0 | | | | 0 | | | | 0 | | | | 0 | | | | 0 | |
| | | | | | | | | | | | | | | | | | | | | | | | | | | | | | | | | | | | | |
| Global Asset Management | | | 0 | | | | 1 | | | | 0 | | | | 0 | | | | 0 | | | | 0 | | | | 0 | | | | 0 | | | | 0 | |
| | | | | | | | | | | | | | | | | | | | | | | | | | | | | | | | | | | | | |
| Investment Bank | | | 32 | | | | 117 | | | | 52 | | | | 35 | | | | 31 | | | | 37 | | | | 80 | | | | 28 | | | | 15 | |
| | | | | | | | | | | | | | | | | | | | | | | | | | | | | | | | | | | | | |
| Corporate Center – Core Functions | | | 8 | | | | 33 | | | | 17 | | | | 20 | | | | 0 | | | | 12 | | | | 9 | | | | 10 | | | | 0 | |
| | | | | | | | | | | | | | | | | | | | | | | | | | | | | | | | | | | | | |
| Diversification effect2,3 | | | | | | | | | | | (30 | ) | | | (31 | ) | | | (1 | ) | | | (20 | ) | | | (12 | ) | | | (10 | ) | | | (0 | ) |
| | | | | | | | | | | | | | | | | | | | | | | | | | | | | | | | | | | | | |
| Group, excluding CC – Non-core and Legacy Portfolio | | | 32 | | | | 114 | | | | 52 | | | | 35 | | | | 31 | | | | 36 | | | | 97 | | | | 28 | | | | 15 | |
| | | | | | | | | | | | | | | | | | | | | | | | | | | | | | | | | | | | | |
| | | | | | | | | |
| CC – Non-core and Legacy Portfolio | | | 8 | | | | 80 | | | | 41 | | | | 42 | | | | 11 | | | | 19 | | | | 48 | | | | 20 | | | | 1 | |
| | | | | | | | | | | | | | | | | | | | | | | | | | | | | | | | | | | | | |
1 Statistics at individual levels may not be summed to deduce the corresponding aggregate figures. The minima and maxima for each level may well occur on different days, and likewise the VaR for each business line or risk type, being driven by the extreme loss tail of the corresponding distribution of simulated profits and losses for that business line or risk type, may well be driven by different days in the historical time-series, rendering invalid the simple summation of figures to arrive at the aggregate total. 2 Difference between the sum of the standalone VaRs for the business divisions and the “Corporate Center – Core Functions” shown and the VaR for the “Group, excluding CC – Non-core and Legacy Portfolio” as a whole. 3 As the minimum and maximum occur on different days for different business divisions, it is not meaningful to calculate a minimum and maximum portfolio diversification effect. | |
| | | | | | | | | | | | | | | | | | | | | | | | | | | | | | | | | | | | |
| | For the year ended 31.12.12 | |
| CHF million | | | | | | | | | | | | | | Equity | | | Interest
rates | | | Credit
spreads | | | Foreign
exchange | | | Commodities | |
| | | Min. | | | | | | | | | | | | 24 | | | 40 | | | 99 | | | 21 | | | 6 | |
| | | | | | | | | | | | | | | | | | | | | | | | | | | | | | | | | | | | | |
| | | | | | Max. | | | | | | | | | 713 | | | 162 | | | 296 | | | 149 | | | 75 | |
| | | | | | | | | | | | | | | | | | | | | | | | | | | | | | | | | | | | | |
| | | | | | | | | Average | | | | | | 52 | | | 79 | | | 186 | | | 51 | | | 17 | |
| | | | | | | | | | | | | | | | | | | | | | | | | | | | | | | | | | | | | |
| | | | | | | | | | | | 31.12.12 | | | 27 | | | 40 | | | 104 | | | 38 | | | 21 | |
| Total regulatory VaR, Group | | | 56 | | | | 776 | | | | 133 | | | | 63 | | | | | | | | Average (per business division and risk type) | |
| | | | | | | | | | | | | | | | | | | | | | | | | | | | | | | | | | | | | |
| Wealth Management | | | 0 | | | | 0 | | | | 0 | | | | 0 | | | | 0 | | | | 0 | | | | 0 | | | | 0 | | | | 0 | |
| | | | | | | | | | | | | | | | | | | | | | | | | | | | | | | | | | | | | |
| Wealth Management Americas | | | 14 | | | | 25 | | | | 18 | | | | 17 | | | | 1 | | | | 9 | | | | 26 | | | | 0 | | | | 0 | |
| | | | | | | | | | | | | | | | | | | | | | | | | | | | | | | | | | | | | |
| Retail & Corporate | | | 0 | | | | 1 | | | | 0 | | | | 0 | | | | 0 | | | | 0 | | | | 0 | | | | 0 | | | | 0 | |
| | | | | | | | | | | | | | | | | | | | | | | | | | | | | | | | | | | | | |
| Global Asset Management | | | 0 | | | | 1 | | | | 0 | | | | 0 | | | | 0 | | | | 0 | | | | 0 | | | | 0 | | | | 0 | |
| | | | | | | | | | | | | | | | | | | | | | | | | | | | | | | | | | | | | |
| Investment Bank4 | | | 58 | | | | 769 | | | | 131 | | | | 61 | | | | 52 | | | | 87 | | | | 147 | | | | 55 | | | | 17 | |
| | | | | | | | | | | | | | | | | | | | | | | | | | | | | | | | | | | | | |
| Corporate Center – Core Functions4 | | | 8 | | | | 55 | | | | 15 | | | | 18 | | | | 0 | | | | 8 | | | | 8 | | | | 11 | | | | 0 | |
| | | | | | | | | | | | | | | | | | | | | | | | | | | | | | | | | | | | | |
| Diversification effect2,3 | | | | | | | | | | | (31 | ) | | | (30 | ) | | | (1 | ) | | | (20 | ) | | | (16 | ) | | | (12 | ) | | | (0 | ) |
| | | | | | | | | | | | | | | | | | | | | | | | | | | | | | | | | | | | | |
| Group, excluding CC – Legacy Portfolio | | | 60 | | | | 703 | | | | 134 | | | | 66 | | | | 52 | | | | 84 | | | | 165 | | | | 54 | | | | 17 | |
| | | | | | | | | | | | | | | | | | | | | | | | | | | | | | | | | | | | | |
| | | | | | | | | |
| Legacy Portfolio4 | | | 24 | | | | 109 | | | | 37 | | | | 47 | | | | 0 | | | | 10 | | | | 50 | | | | 7 | | | | 0 | |
| | | | | | | | | | | | | | | | | | | | | | | | | | | | | | | | | | | | | |
1 Statistics at individual levels may not be summed to deduce the corresponding aggregate figures. The minima and maxima for each level may well occur on different days, and likewise the VaR for each business line or risk type, being driven by the extreme loss tail of the corresponding distribution of simulated profits and losses for that business line or risk type, may well be driven by different days in the historical time-series, rendering invalid the simple summation of figures to arrive at the aggregate total. 2 Difference between the sum of the standalone VaRs for the business divisions and the “Corporate Center – Core Functions” shown and the VaR for the “Group, excluding CC – Legacy Portfolio” as a whole. 3 As the minimum and maximum occur on different days for different business divisions, it is not meaningful to calculate a minimum and maximum portfolio diversification effect. 4 Numbers have not been restated to take into account the transfer of non-core positions from the Investment Bank to the Corporate Center. | |
193
Risk, treasury and capital management
Risk management and control
| | | | |
| | Management VaR for the period |
| | The table below shows minimum, maximum, average and period-end management VaR by business division and Corporate Center and general market risk factor type. |
| | | | | | | | | | | | | | | | | | | | | | | | | | | | | | | | | | | | | | |
| | Management value-at-risk (1-day, 95% confidence, 5 years of historical data) by business division and Corporate Center and general market risk factor type1 | |
| | | | For the year ended 31.12.13 | |
| | CHF million | | | | | | | | | | | | | | Equity | | | Interest
rates | | | Credit
spreads | | | Foreign
exchange | | | Commodities | |
| | | | Min. | | | | | | | | | | | | 6 | | | 7 | | | 10 | | | 2 | | | 1 | |
| | | | | | | | | | | | | | | | | | | | | | | | | | | | | | | | | | | | | | |
| | | | | | | Max. | | | | | | | | | 18 | | | 16 | | | 31 | | | 9 | | | 5 | |
| | | | | | | | | | | | | | | | | | | | | | | | | | | | | | | | | | | | | | |
| | | | | | | | | | Average | | | | | | 9 | | | 10 | | | 18 | | | 5 | | | 2 | |
| | | | | | | | | | | | | | | | | | | | | | | | | | | | | | | | | | | | | | |
| | | | | | | | | | | | | 31.12.13 | | | 7 | | | 8 | | | 10 | | | 3 | | | 2 | |
| | Total management VaR, Group | | | 10 | | | | 33 | | | | 16 | | | | 11 | | | | | | | | Average (per business division and risk type) | |
| | | | | | | | | | | | | | | | | | | | | | | | | | | | | | | | | | | | | | |
| | Wealth Management | | | 0 | | | | 0 | | | | 0 | | | | 0 | | | | 0 | | | | 0 | | | | 0 | | | | 0 | | | | 0 | |
| | | | | | | | | | | | | | | | | | | | | | | | | | | | | | | | | | | | | | |
| | Wealth Management Americas | | | 1 | | | | 2 | | | | 1 | | | | 2 | | | | 0 | | | | 2 | | | | 3 | | | | 0 | | | | 0 | |
| | | | | | | | | | | | | | | | | | | | | | | | | | | | | | | | | | | | | | |
| | Retail & Corporate | | | 0 | | | | 0 | | | | 0 | | | | 0 | | | | 0 | | | | 0 | | | | 0 | | | | 0 | | | | 0 | |
| | | | | | | | | | | | | | | | | | | | | | | | | | | | | | | | | | | | | | |
| | Global Asset Management | | | 0 | | | | 0 | | | | 0 | | | | 0 | | | | 0 | | | | 0 | | | | 0 | | | | 0 | | | | 0 | |
| | | | | | | | | | | | | | | | | | | | | | | | | | | | | | | | | | | | | | |
| | Investment Bank | | | 7 | | | | 28 | | | | 13 | | | | 10 | | | | 8 | | | | 9 | | | | 11 | | | | 4 | | | | 2 | |
| | | | | | | | | | | | | | | | | | | | | | | | | | | | | | | | | | | | | | |
| | Corporate Center – Core Functions | | | 3 | | | | 11 | | | | 5 | | | | 4 | | | | 0 | | | | 4 | | | | 1 | | | | 1 | | | | 0 | |
| | | | | | | | | | | | | | | | | | | | | | | | | | | | | | | | | | | | | | |
| | Diversification effect2,3 | | | | | | | | | | | (5 | ) | | | (5 | ) | | | (0 | ) | | | (5 | ) | | | (2 | ) | | | (1 | ) | | | (0 | ) |
| | | | | | | | | | | | | | | | | | | | | | | | | | | | | | | | | | | | | | |
| | Group, excluding CC – Non-core and Legacy Portfolio | | | 8 | | | | 33 | | | | 13 | | | | 10 | | | | 8 | | | | 10 | | | | 13 | | | | 4 | | | | 2 | |
| | | | | | | | | | | | | | | | | | | | | | | | | | | | | | | | | | | | | | |
| | CC – Non-core and Legacy Portfolio | | | 6 | | | | 14 | | | | 11 | | | | 11 | | | | 4 | | | | 5 | | | | 10 | | | | 2 | | | | 0 | |
| | | | | | | | | | | | | | | | | | | | | | | | | | | | | | | | | | | | | | |
| | 1 Statistics at individual levels may not be summed to deduce the corresponding aggregate figures. The minima and maxima for each level may well occur on different days, and likewise the VaR for each business line or risk type, being driven by the extreme loss tail of the corresponding distribution of simulated profits and losses for that business line or risk type, may well be driven by different days in the historical time-series, rendering invalid the simple summation of figures to arrive at the aggregate total. 2 Difference between the sum of the standalone VaRs for the business divisions and the “Corporate Center – Core Functions” shown and the VaR for the “Group, excluding CC – Non-core and Legacy Portfolio” as a whole.3 As the minimum and maximum occur on different days for different business divisions, it is not meaningful to calculate a minimum and maximum portfolio diversification effect. | |
| | | | For the year ended 31.12.12 | |
| | CHF million | | | | | | | | | | | | | | Equity | | | Interest
rates | | | Credit
spreads | | | Foreign
exchange | | | Commodities | |
| | | | | Min. | | | | | | | | | | | | | | | | 7 | | | | 11 | | | | 23 | | | | 3 | | | | 1 | |
| | | | | | | | | | | | | | | | | | | | | | | | | | | | | | | | | | | | | | |
| | | | | | | | | Max. | | | | | | | | | | | | 160 | | | | 33 | | | | 42 | | | | 13 | | | | 7 | |
| | | | | | | | | | | | | | | | | | | | | | | | | | | | | | | | | | | | | | |
| | | | | | | | | | | | | Average | | | | | | | | 12 | | | | 19 | | | | 31 | | | | 6 | | | | 3 | |
| | | | | | | | | | | | | | | | | | | | | | | | | | | | | | | | | | | | | | |
| | | | | | | | | | | | | | | | | 31.12.12 | | | | 8 | | | | 12 | | | | 26 | | | | 5 | | | | 3 | |
| | | | | | | | | | | | | | | | | | | | | | | | | | | | | | | | | | | | | | |
| | Total management VaR, Group | | | 18 | | | | 167 | | | | 33 | | | | 18 | | | | | | | | Average (per business division and risk type) | |
| | | | | | | | | | | | | | | | | | | | | | | | | | | | | | | | | | | | | | |
| | Wealth Management | | | 0 | | | | 0 | | | | 0 | | | | 0 | | | | 0 | | | | 0 | | | | 0 | | | | 0 | | | | 0 | |
| | | | | | | | | | | | | | | | | | | | | | | | | | | | | | | | | | | | | | |
| | Wealth Management Americas | | | 1 | | | | 2 | | | | 2 | | | | 2 | | | | 0 | | | | 2 | | | | 4 | | | | 0 | | | | 0 | |
| | | | | | | | | | | | | | | | | | | | | | | | | | | | | | | | | | | | | | |
| | Retail & Corporate | | | 0 | | | | 0 | | | | 0 | | | | 0 | | | | 0 | | | | 0 | | | | 0 | | | | 0 | | | | 0 | |
| | | | | | | | | | | | | | | | | | | | | | | | | | | | | | | | | | | | | | |
| | Global Asset Management | | | 0 | | | | 0 | | | | 0 | | | | 0 | | | | 0 | | | | 0 | | | | 0 | | | | 0 | | | | 0 | |
| | | | | | | | | | | | | | | | | | | | | | | | | | | | | | | | | | | | | | |
| | Investment Bank4 | | | 15 | | | | 164 | | | | 30 | | | | 15 | | | | 12 | | | | 19 | | | | 25 | | | | 5 | | | | 3 | |
| | | | | | | | | | | | | | | | | | | | | | | | | | | | | | | | | | | | | | |
| | Corporate Center – Core Functions4 | | | 3 | | | | 12 | | | | 6 | | | | 5 | | | | 0 | | | | 5 | | | | 1 | | | | 2 | | | | 0 | |
| | | | | | | | | | | | | | | | | | | | | | | | | | | | | | | | | | | | | | |
| | Diversification effect2,3 | | | | | | | | | | | (7 | ) | | | (6 | ) | | | (0 | ) | | | (7 | ) | | | (3 | ) | | | (2 | ) | | | (0 | ) |
| | | | | | | | | | | | | | | | | | | | | | | | | | | | | | | | | | | | | | |
| | Group, excluding CC – Legacy Portfolio | | | 16 | | | | 155 | | | | 31 | | | | 16 | | | | 12 | | | | 19 | | | | 27 | | | | 5 | | | | 3 | |
| | | | | | | | | | | | | | | | | | | | | | | | | | | | | | | | | | | | | | |
| | Legacy Portfolio4 | | | 7 | | | | 16 | | | | 9 | | | | 10 | | | | 0 | | | | 3 | | | | 10 | | | | 2 | | | | 0 | |
| | | | | | | | | | | | | | | | | | | | | | | | | | | | | | | | | | | | | | |
| | 1 Statistics at individual levels may not be summed to deduce the corresponding aggregate figures. The minima and maxima for each level may well occur on different days, and likewise the VaR for each business line or risk type, being driven by the extreme loss tail of the corresponding distribution of simulated profits and losses for that business line or risk type, may well be driven by different days in the historical time-series, rendering invalid the simple summation of figures to arrive at the aggregate total. 2 Difference between the sum of the standalone VaRs for the business divisions and the “Corporate Center – Core Functions” shown and the VaR for the “Group, excluding CC – Legacy Portfolio” as a whole. 3 As the minimum and maximum occur on different days for different business divisions, it is not meaningful to calculate a minimum and maximum portfolio diversification effect. 4 Numbers have not been restated to take into account the transfer of non-core positions from the Investment Bank to the Corporate Center. | |
194
|
Risk, treasury and capital management |
|
|
Derivation of regulatory VaR-based RWA
Regulatory VaR is used to derive the regulatory VaR component of the market risk Basel III RWA, shown in “Table 2: Detailed segmentation of Basel III exposures and risk-weighted assets” in the “Supplemental disclosures required under Basel III Pillar 3 regulations” section of this report. This calculation takes the maximum of the period-end regulatory VaR and the average regulatory VaR for the 60 trading days immediately preceding the period end multiplied by a scaling factor set by FINMA, currently three. This is then multiplied by a factor of 12.5 to determine the RWA. This calculation is set out in the table below.
Backtesting of VaR
For backtesting purposes, we compute backtesting VaR using a 99% confidence level and one-day holding period for the population included within regulatory VaR. The backtesting process compares backtesting VaR calculated on positions at the close of each business day with the revenues generated by those positions on the following business day. Backtesting revenues exclude non-trading revenues, such as fees and commissions and revenues from intraday trading, to ensure a like-for-like comparison. A backtesting exception occurs when backtesting revenues are negative and the absolute value of those revenues is greater than the previous day’s backtesting VaR.
Statistically, given the confidence level of 99%, two to three backtesting exceptions per year can be expected. More exceptions than this could indicate that the VaR model is not performing appropriately, as could too few exceptions over a prolonged period of time. However, as noted in the VaR limitations above, a
sudden increase or decrease in market volatility relative to the five-year window could lead to a higher or lower number of exceptions respectively. Accordingly, Group-level backtesting exceptions are investigated, as are exceptional positive backtesting revenues, with results being reported to senior business management, the Group Chief Risk Officer and the divisional Chief Risk Officers. Backtesting exceptions are also reported to internal and external auditors and to the relevant regulators. We did not have any Group backtesting exceptions in 2013.
The chart “Development of backtesting revenues against back-testing VaR” on the next page shows the 12-month development of back-test VaR against backtesting revenues of the Group for 2013. The chart shows both the negative and positive tails of the backtest VaR distribution at 99% confidence intervals representing, respectively, the losses and gains that could potentially be realized over a one-day period at that level of confidence.
The asymmetry between the negative and positive tails is due to the significant long gamma risk profile that has historically been run in the Investment Bank. This long gamma position profits from increases in volatility which therefore benefits the positive tail of the VaR simulated profit and loss distribution. This asymmetry declined towards the end of the year as the long gamma profile reduced.
The histogram “Investment Bank and Corporate Center – Non-core and Legacy Portfolio daily revenue distribution” shows the daily revenue distribution for the Investment Bank and Corporate Center – Non-core and Legacy Portfolio for 2013. This includes, in addition to backtesting revenues, revenues such as commissions and fees, revenues for intraday trading and own credit.
| | | | | | | | | | | | | | | | | | | | | | | | |
| Calculation of regulatory VaR-based RWA as of 31 December 2013 | |
| CHF million | | Period end
regulatory VaR
(A) | | | 60-day average
regulatory VaR
(B) | | | Scaling factor
(C) | | | Max (A, B x C)
(D) | | | Multiplier
(E) | | | Basel III
RWA (D x E) | |
| | | 38 | | | | 47 | | | | 3 | | | | 140 | | | | 12.5 | | | | 1,746 | |
| | | | | | | | | | | | | | | | | | | | | | | | | |
195
Risk, treasury and capital management
Risk management and control
| | | | | | | | | | | | | | | | | | | | | | | | | | | | | | | | |
| Group: regulatoryvalue-at-risk(1-day, 99% confidence, 5 years of historical data) | |
| | For the year ended 31.12.13 | | | Basel 2.5 –
for the year ended 31.12.12 | |
| CHF million | | Min. | | | Max. | | | Average | | | 31.12.13 | | | Min. | | | Max. | | | Average | | | 31.12.12 | |
| Group | | | 15 | | | | 42 | | | | 23 | | | | 17 | | | | 23 | | | | 239 | | | | 47 | | | | 25 | |
| | | | | | | | | | | | | | | | | | | | | | | | | | | | | | | | | |
Stressed VaR
| | |
Method applied | | Historical simulation |
Data set | | From 1 January 2007 to present |
Holding period | | 10 days |
Confidence level | | 99% based on expected tail loss |
Population | | Regulatory trading book |
Stressed VaR (SVaR) adopts broadly the same methodology as regulatory VaR and is calculated using the same population, holding period (10-day) and confidence level (99%). However, unlike regulatory VaR, the historical data set for SVaR is not limited to five years. SVaR uses continuous one-year data sets to derive the largest potential loss arising from a one-year period of significant financial stress relevant to the current portfolio of the Group.
SVaR is subject to the same limitations as noted for VaR above, but the use of one-year data sets avoids the smoothing effect of the five-year data set used for VaR, and the removal of the five-year window provides for a longer history of potential loss events. Therefore, although the significant period of stress during the financial crisis is dropping out of the historical period used for regulatory VaR, SVaR will continue to use this data. This approach is intended to reduce the procyclicality of the regulatory capital requirements for market risks.
Stressed VaR model developments in 2013
In 2013, the stressed VaR model was changed to implement an expanding historical data set, with a starting date anchored at 1 January 2007, instead of a rolling five-year historical data set. This change aimed to reduce procyclicality (e.g., the Lehman crisis dropping out of the five-year historical data window).
196
|
Risk, treasury and capital management |
|
|
| | | | | | | | | | | | | | | | | | | | | | | | | | | | | | | | | | | | |
| Stressed value-at-risk (10-day, 99% confidence, 5 years of historical data) by business division and Corporate Center and general market risk type1 | |
| | For the year ended 31.12.13 | |
| CHF million | | | | | | | | | | | | | | Equity | | | Interest
rates | | | Credit
spreads | | | Foreign
exchange | | | Commodities | |
| | | | | | | | | | | | | | | | | | | | | | | | | | | | | | | | | | | | | |
| | | Min. | | | | | | | | | | | | 35 | | | 21 | | | 91 | | | 6 | | | 10 | |
| | | | | | | | | | | | | | | | | | | | | | | | | | | | | | | | | | | | | |
| | | | | | Max. | | | | | | | | | 155 | | | 104 | | | 235 | | | 210 | | | 81 | |
| | | | | | | | | | | | | | | | | | | | | | | | | | | | | | | | | | | | | |
| | | | | | | | | Average | | | | | | 58 | | | 53 | | | 148 | | | 56 | | | 24 | |
| | | | | | | | | | | | | | | | | | | | | | | | | | | | | | | | | | | | | |
| | | | | | | | | | | | 31.12.13 | | | 49 | | | 66 | | | 92 | | | 23 | | | 21 | |
| Total stressed VaR, Group | | | 59 | | | | 178 | | | | 82 | | | | 63 | | | | | | | | Average (per business division and risk type) | |
| | | | | | | | | | | | | | | | | | | | | | | | | | | | | | | | | | | | | |
| Wealth Management | | | 0 | | | | 2 | | | | 0 | | | | 0 | | | | 0 | | | | 1 | | | | 0 | | | | 0 | | | | 0 | |
| | | | | | | | | | | | | | | | | | | | | | | | | | | | | | | | | | | | | |
| Wealth Management Americas | | | 13 | | | | 35 | | | | 20 | | | | 21 | | | | 1 | | | | 9 | | | | 30 | | | | 0 | | | | 0 | |
| | | | | | | | | | | | | | | | | | | | | | | | | | | | | | | | | | | | | |
| Retail & Corporate | | | 0 | | | | 0 | | | | 0 | | | | 0 | | | | 0 | | | | 0 | | | | 0 | | | | 0 | | | | 0 | |
| | | | | | | | | | | | | | | | | | | | | | | | | | | | | | | | | | | | | |
| Global Asset Management | | | 0 | | | | 2 | | | | 1 | | | | 0 | | | | 1 | | | | 0 | | | | 0 | | | | 0 | | | | 0 | |
| | | | | | | | | | | | | | | | | | | | | | | | | | | | | | | | | | | | | |
| Investment Bank | | | 45 | | | | 231 | | | | 83 | | | | 53 | | | | 54 | | | | 55 | | | | 131 | | | | 48 | | | | 24 | |
| | | | | | | | | | | | | | | | | | | | | | | | | | | | | | | | | | | | | |
| Corporate Center – Core Functions | | | 12 | | | | 53 | | | | 26 | | | | 44 | | | | 0 | | | | 26 | | | | 13 | | | | 15 | | | | 0 | |
| | | | | | | | | | | | | | | | | | | | | | | | | | | | | | | | | | | | | |
| Diversification effect2,3 | | | | | | | | | | | (48 | ) | | | (65 | ) | | | (1 | ) | | | (42 | ) | | | (16 | ) | | | (16 | ) | | | 0 | |
| | | | | | | | | | | | | | | | | | | | | | | | | | | | | | | | | | | | | |
| Group, excluding CC – Non-core and Legacy Portfolio | | | 44 | | | | 241 | | | | 82 | | | | 53 | | | | 54 | | | | 49 | | | | 158 | | | | 47 | | | | 24 | |
| | | | | | | | | | | | | | | | | | | | | | | | | | | | | | | | | | | | | |
| | | | | | | | | |
| CC – Non-core and Legacy Portfolio | | | 14 | | | | 121 | | | | 66 | | | | 64 | | | | 19 | | | | 30 | | | | 71 | | | | 30 | | | | 2 | |
| | | | | | | | | | | | | | | | | | | | | | | | | | | | | | | | | | | | | |
1 Statistics at individual levels may not be summed to deduce the corresponding aggregate figures. The minima and maxima for each level may well occur on different days, and likewise the VaR for each business line or risk type, being driven by the extreme loss tail of the corresponding distribution of simulated profits and losses for that business line or risk type, may well be driven by different days in the historical time-series, rendering invalid the simple summation of figures to arrive at the aggregate total. 2 Difference between the sum of the standalone VaRs for the business divisions and the “Corporate Center – Core Functions” shown and the VaR for the “Group, excluding CC – Non-core and Legacy Portfolio” as a whole. 3 As the minimum and maximum occur on different days for different business divisions, it is not meaningful to calculate a minimum and maximum portfolio diversification effect. | |
| | | | | | | | | | | | | | | | | | | | | | | | | | | | | | | | | | | | |
| | For the year ended 31.12.12 | |
| CHF million | | | | | | | | | | | | | | Equity | | | Interest
rates | | | Credit
spreads | | | Foreign
exchange | | | Commodities | |
| | | Min. | | | | | | | | | | | | 20 | | | 43 | | | 159 | | | 28 | | | 7 | |
| | | | | | | | | | | | | | | | | | | | | | | | | | | | | | | | | | | | | |
| | | | | | Max. | | | | | | | | | 1,015 | | | 285 | | | 528 | | | 222 | | | 110 | |
| | | | | | | | | | | | | | | | | | | | | | | | | | | | | | | | | | | | | |
| | | | | | | | | Average | | | | | | 76 | | | 93 | | | 326 | | | 83 | | | 23 | |
| | | | | | | | | | | | | | | | | | | | | | | | | | | | | | | | | | | | | |
| | | | | | | | | | | | | | | 31.12.12 | | | | 38 | | | | 43 | | | | 163 | | | | 61 | | | | 40 | |
| | | | | | | | | | | | | | | | | | | | | | | | | | | | | | | | | | | | | |
| Total stressed VaR, Group | | | 105 | | | | 1,127 | | | | 189 | | | | 125 | | | | Average (per business division and risk type) | |
| | | | | | | | | | | | | | | | | | | | | | | | | | | | | | | | | | | | | |
| Wealth Management | | | 0 | | | | 1 | | | | 0 | | | | 0 | | | | 0 | | | | 0 | | | | 0 | | | | 0 | | | | 0 | |
| | | | | | | | | | | | | | | | | | | | | | | | | | | | | | | | | | | | | |
| Wealth Management Americas | | | 18 | | | | 31 | | | | 24 | | | | 23 | | | | 1 | | | | 11 | | | | 37 | | | | 0 | | | | 0 | |
| | | | | | | | | | | | | | | | | | | | | | | | | | | | | | | | | | | | | |
| Retail & Corporate | | | 0 | | | | 0 | | | | 0 | | | | 0 | | | | 0 | | | | 0 | | | | 0 | | | | 0 | | | | 0 | |
| | | | | | | | | | | | | | | | | | | | | | | | | | | | | | | | | | | | | |
| Global Asset Management | | | 0 | | | | 1 | | | | 1 | | | | 1 | | | | 0 | | | | 0 | | | | 0 | | | | 0 | | | | 0 | |
| | | | | | | | | | | | | | | | | | | | | | | | | | | | | | | | | | | | | |
| Investment Bank4 | | | 100 | | | | 1,111 | | | | 184 | | | | 118 | | | | 76 | | | | 114 | | | | 253 | | | | 90 | | | | 23 | |
| | | | | | | | | | | | | | | | | | | | | | | | | | | | | | | | | | | | | |
| Corporate Center – Core Functions | | | 12 | | | | 86 | | | | 20 | | | | 21 | | | | 0 | | | | 12 | | | | 12 | | | | 16 | | | | 0 | |
| | | | | | | | | | | | | | | | | | | | | | | | | | | | | | | | | | | | | |
| Diversification effect2,3 | | | | | | | | | | | (41 | ) | | | (42 | ) | | | (1 | ) | | | (28 | ) | | | (21 | ) | | | (19 | ) | | | (0 | ) |
| | | | | | | | | | | | | | | | | | | | | | | | | | | | | | | | | | | | | |
| Group, excluding CC – Legacy Portfolio | | | 103 | | | | 1,131 | | | | 188 | | | | 121 | | | | 76 | | | | 110 | | | | 282 | | | | 87 | | | | 23 | |
| | | | | | | | | | | | | | | | | | | | | | | | | | | | | | | | | | | | | |
| | | | | | | | | |
| Legacy Portfolio4 | | | 43 | | | | 190 | | | | 62 | | | | 78 | | | | 0 | | | | 14 | | | | 80 | | | | 8 | | | | 0 | |
| | | | | | | | | | | | | | | | | | | | | | | | | | | | | | | | | | | | | |
1 Statistics at individual levels may not be summed to deduce the corresponding aggregate figures. The minima and maxima for each level may well occur on different days, and likewise the VaR for each business line or risk type, being driven by the extreme loss tail of the corresponding distribution of simulated profits and losses for that business line or risk type, may well be driven by different days in the historical time-series, rendering invalid the simple summation of figures to arrive at the aggregate total. 2 Difference between the sum of the standalone VaRs for the business divisions and the “Corporate Center – Core Functions” shown and the VaR for the “Group, excluding CC – Legacy Portfolio” as a whole. 3 As the minimum and maximum occur on different days for different business divisions, it is not meaningful to calculate a minimum and maximum portfolio diversification effect. 4 Numbers have not been restated to take into account the transfer of non-core positions from the Investment Bank to the Corporate Center. | |
197
Risk, treasury and capital management
Risk management and control
| | | | |
| | Calculation of SVaR-based RWA as of 31 December 2013 |
| | | | |
| | | | | | | | | | | | | | | | | | | | | | | | |
| CHF million | | Period end SVaR
(A) | | | 60 day average
SVaR (B) | | | Scaling factor
(C) | | | Max (A, B x C)
(D) | | | Multiplier
(E) | | | Basel III
RWA (D x E) | |
| | | 63 | | | | 69 | | | | 3 | | | | 208 | | | | 12.5 | | | | 2,604 | |
| | | | | | | | | | | | | | | | | | | | | | | | | |
Derivation of SVaR-based RWA
SVaR is used to derive the SVaR component of the market risk Basel III RWA shown in “Table 2: Detailed segmentation of Basel III exposures and risk-weighted assets” in the “Supplemental disclosures required under Basel III Pillar 3 regulations” section of this report. The derivation of this component is similar to that explained above for regulatory VaR, and is shown above.
Risks-not-in-VaR
Risks-not-in-VaR definition
We have an established framework to identify and quantify potential risk factors that are not fully captured by our VaR model. We refer to these risk factors as risks-not-in-VaR (RniV). This framework is used to underpin these potential risk factors with regulatory capital, calculated as a multiple of regulatory VaR and stressed VaR.
These RniV arise from approximations made by the VaR model to quantify the impact of risk factor changes on the profit and loss of positions and portfolios, as well as the use of proxies for certain market risk factors. We categorize RniV by means of items and keep track of which instrument classes are affected by each item.
When new types of instruments are included in the VaR population, we assess whether new items must be added to the inventory of RniV items.
Risks-not-in-VaR quantification
Risk officers perform a quantitative assessment for each position in the inventory of RniV items annually, as of a specific date. The assessment is made in terms of a10-day 99%-VaR measure applied to the difference between the profit and loss scenarios which would have been produced based on our best estimate given available data, and the profit and loss scenarios generated by the current model used for the regulatory VaR calculation. Whenever the available market data allows, a historical simulation approach with five years of historical data is used to estimate the
10-day 99%-VaR for an item. Other eligible methods are based on analytical considerations or stress test and worst-case assessments. Statistical methods are used to aggregate the standalone risks, yielding a Group-level 10-day 99%-VaR estimate of the entire inventory of RniV items at the specific date. The ratio of this amount to regulatory VaR is used to produce estimates for arbitrary points in time by scaling the corresponding regulatory VaR figures with that fixed ratio. An analogous approach is applied for stressed VaR.
Risks-not-in-VaR mitigation
Material RniV items are monitored and controlled by means and measures other than VaR, such as position limits and stress limits. Additionally, there are ongoing initiatives to extend the VaR model to better capture these risks.
Derivation of RWA add-on for risks-not-in-VaR
This RniV framework is used to derive the RniV-based component of the market risk Basel III RWA, using the aforementioned approach, which is approved by FINMA and subject to an annual recalibration. As the RWA from RniV are add-ons, they do not reflect any diversification benefits across risks capitalized through VaR and stressed VaR.
In September 2013, following a new calibration approved by FINMA, RniV VaR capital was set at 58% of VaR capital, and RniV stressed VaR capital was set at 32% of stressed VaR capital, compared with prior ratios of 47% and 26% respectively. In addition, FINMA requires that RniV stressed VaR capital is floored at RniV VaR capital.
Based on the regulatory VaR and stressed VaR RWA noted above, the RniV RWA add-ons as of 31 December 2013 were CHF 1.0 billion and CHF 1.0 billion, respectively, compared with CHF 1.8 billion and CHF 1.5 billion as of 31 December 2012. The decreases in these RWA add-ons are due to the decreases in VaR and stressed VaR over the period, partially offset by the increases in the RniV VaR and stressed VaR add-on multipliers noted above.
198
|
Risk, treasury and capital management |
|
|
Incremental risk charge
The incremental risk charge (IRC) represents an estimate of the default and rating migration risk of all trading book positions with issuer risk, except for equity products and securitization exposures, measured over a one-year time horizon at a 99.9% confidence level. The calculation of the measure assumes all positions in the IRC portfolio have a one-year liquidity horizon and are kept unchanged over this period.
The portfolio default and rating migration loss distribution is estimated using a Monte Carlo simulation of correlated rating migration events (defaults and rating changes) for all issuers in the IRC portfolio, based on a Merton-type model. For each position, default losses are calculated based on the maximum default exposure measure (the loss in the case of a default event assuming
zero recovery) and a random recovery concept. To account for potential basis risks between instruments, different recovery values may be generated for different instruments even if they belong to the same issuer. To calculate rating migration losses a linear (delta) approximation is used: a loss due to a rating migration event is calculated as the estimated change in credit spread due to the change in rating migration multiplied by the corresponding sensitivity of a position to changes in credit spreads.
The table below provides a breakdown of the Group’s period-end incremental risk charge by business division and Corporate Center. The reduction in the Group’s period-end IRC, and more notably in the 12-month average IRC, was mainly attributable to the de-risking of Non-core positions.
Derivation of IRC-based RWA
IRC is calculated weekly, the results of which are used to derive the IRC-based component of the market risk Basel III RWA, shown in “Table 2: Detailed segmentation of Basel III exposures and risk-weighted assets” in the “Supplemental disclosures required under Basel III Pillar 3 regulations” section of this report. The derivation is similar to that for VaR- and stressed VaR-based RWA but without a scaling factor, and is shown below.
| | | | | | | | | | | | | | | | | | | | | | | | | | | | | | | | |
| Incremental risk charge by business division and Corporate Center | |
| | For the year ended 31.12.13 | | | For the year ended 31.12.121 | |
| CHF million | | Min. | | | Max. | | | Average | | | 31.12.13 | | | Min. | | | Max. | | | Average | | | 31.12.12 | |
| Wealth Management | | | | | | | 2 | | | | 0 | | | | | | | | | | | | 2 | | | | 0 | | | | | |
| | | | | | | | | | | | | | | | | | | | | | | | | | | | | | | | | |
| Wealth Management Americas | | | 8 | | | | 27 | | | | 14 | | | | 22 | | | | 5 | | | | 32 | | | | 13 | | | | 10 | |
| | | | | | | | | | | | | | | | | | | | | | | | | | | | | | | | | |
| Retail & Corporate | | | | | | | | | | | | | | | | | | | | | | | | | | | | | | | | |
| | | | | | | | | | | | | | | | | | | | | | | | | | | | | | | | | |
| Global Asset Management | | | | | | | | | | | | | | | | | | | | | | | | | | | | | | | | |
| | | | | | | | | | | | | | | | | | | | | | | | | | | | | | | | | |
| Investment Bank | | | 128 | | | | 314 | | | | 208 | | | | 172 | | | | 109 | | | | 1,074 | | | | 706 | | | | 109 | |
| | | | | | | | | | | | | | | | | | | | | | | | | | | | | | | | | |
| Corporate Center – Core Functions | | | 108 | | | | 190 | | | | 153 | | | | 113 | | | | 143 | 2 | | | 258 | 2 | | | 196 | 2 | | | 183 | 2 |
| | | | | | | | | | | | | | | | | | | | | | | | | | | | | | | | | |
| Diversification effect3, 4 | | | | | | | | | | | | | | | (88 | ) | | | | | | | | | | | | | | | | |
| | | | | | | | | | | | | | | | | | | | | | | | | | | | | | | | | |
| Group, excluding CC – Non-core and Legacy Portfolio | | | | | | | | | | | | | | | 219 | | | | | | | | | | | | | | | | | |
| | | | | | | | | | | | | | | | | | | | | | | | | | | | | | | | | |
| CC – Non-core and Legacy Portfolio | | | 50 | | | | 207 | | | | 118 | | | | 65 | | | | | | | | | | | | | | | | | |
| | | | | | | | | | | | | | | | | | | | | | | | | | | | | | | | | |
| Diversification effect4, 5 | | | | | | | | | | | | | | | (174 | ) | | | | | | | | | | | (212 | ) | | | (168 | ) |
| | | | | | | | | | | | | | | | | | | | | | | | | | | | | | | | | |
| Total incremental risk charge, Group | | | 60 | | | | 356 | | | | 183 | | | | 110 | | | | 131 | | | | 1,045 | | | | 703 | | | | 135 | |
| | | | | | | | | | | | | | | | | | | | | | | | | | | | | | | | | |
1 Numbers have not been restated to take into account the transfer of non-core positions from the Investment Bank to the Corporate Center for the period prior to this event.2 Includes positions in the Legacy Portfolio.3 Difference between the sum of the standalone IRC for the business divisions and the “Corporate Center – Core Functions” shown and the IRC for the “Group, excluding CC – Non-core and Legacy Portfolio” as a whole.4 As the minimum and maximum occur on different days for different business divisions, it is not meaningful to calculate a minimum, maximum and average portfolio diversification effect.5 Difference between the sum of the two standalone IRC for “Group, excluding CC – Non-core and Legacy Portfolio” and the “CC – Non-core and Legacy Portfolio” and the IRC for the Group as a whole.
| | | | | | | | | | | | | | | | | | | | |
| Calculation of IRC-based RWA as of 31 December 2013 | |
| CHF million | | Period end
IRC (A) | | | Average of last 12 weeks
IRC (B) | | | Max (A, B) (C) | | | Multiplier (D) | | | Basel III RWA
(C x D) | |
| | | 110 | | | | 96 | | | | 110 | | | | 12.5 | | | | 1,377 | |
| | | | | | | | | | | | | | | | | | | | | |
199
Risk, treasury and capital management
Risk management and control
Comprehensive risk measure
The comprehensive risk measure (CRM) represents an estimate of the default and complex price risk, including the convexity and cross-convexity of the correlation trading portfolio across credit spread, correlation and recovery, measured over a one-year time horizon at a 99.9% confidence level. The calculation of the measure assumes that all positions in the CRM portfolio have a one-year liquidity horizon and are kept unchanged over this time period. The model scope covers collateralized debt obligation (CDO) swaps and credit-linked notes (CLN), first and nth to default swaps and CLN and hedges for these positions, including credit default swaps (CDS), CLN and index CDS.
The CRM profit and loss distribution is estimated using a Monte Carlo simulation of defaults over the next 12 months, and calculates resulting cash flows in the CRM portfolio. The portfolio is then revalued on the one-year horizon date, with inputs such as credit spreads and index basis being migrated from spot to horizon date. The 99.9% negative quantile of the resulting profit and loss distribution
is then taken to be the CRM result. Our CRM methodology is subject to minimum qualitative standards as well as stress testing.
The table below shows the period-end comprehensive risk charge for the Group. CRM reduction was primarily due to negotiated bilateral settlements of over-the-counter derivative contracts.
Derivation of CRM-based RWA
CRM is calculated weekly, the results of which are used to derive the CRM-based component of the market risk Basel III RWA, shown in “Table 2: Detailed segmentation of Basel III exposures and risk-weighted assets” in the “Supplemental disclosures required under Basel III Pillar 3 regulations” section of this report. The calculation is subject to a floor calculation equal to 8% of the equivalent capital charge under the specific risk measure for the correlation trading portfolio. The calculation is shown below.
Securitization positions in the trading book
Our exposure to securitization positions in the trading book is limited and relates primarily to positions in Non-core and Legacy Portfolio which we will continue to wind down. A small amount of exposure also arises from secondary trading in commercial mortgage-backed securities (CMBS) in the Investment Bank. Refer to “Table 2: Detailed segmentation of Basel III exposures and risk-weighted assets” in the “Supplemental disclosures required under Basel III Pillar 3 regulations” section of this report for more information.
| | | | | | | | | | | | | | | | | | | | | | | | | | | | | | | | |
| Group: Comprehensive risk charge | |
| | For the year ended 31.12.13 | | | For the year ended 31.12.12 | |
| CHF million | | Min. | | | Max. | | | Average | | | 31.12.13 | | | Min. | | | Max. | | | Average | | | 31.12.12 | |
| Total comprehensive risk charge, Group | | | 308 | | | | 618 | | | | 457 | | | | 308 | | | | 594 | | | | 770 | | | | 675 | | | | 604 | |
| | | | | | | | | | | | | | | | | | | | | | | | | | | | | | | | | |
| | | | | | | | | | | | | | | | | | | | |
| Calculation of CRM-based RWA as of 31 December 2013 | |
| CHF million | | Period end
CRM (A) | | | Average of last 12 weeks
CRM1 (B) | | | Max (A, B)
(C) | | | Multiplier
(D) | | | Basel III RWA
(D x E) | |
| | | 308 | | | | 334 | | | | 334 | | | | 12.5 | | | | 4,176 | |
| | | | | | | | | | | | | | | | | | | | | |
1 CRM = Max (CRM model result, 8% of equivalent charge under the SRM).
200
|
Risk, treasury and capital management |
|
|
| | | | |
| | Interest rate risk in the banking book |
| | Sources of interest rate risk in the banking book Interest rate risk in the banking book arises fromAvailable-for-sale instruments, Loans and receivables, Debt issued and client deposits, certainInstruments designated at fair value through profit or loss,derivatives measured at fair value through profit or loss and derivatives employed for cash flow hedge accounting purposes, as well as related funding transactions. These positions may impactOther comprehensive income or profit or loss, depending on accounting treatment. Our largest banking book interest rate exposures arise from client deposits and lending products in both our wealth management businesses and Retail & Corporate. For Wealth Management and Retail & Corporate, the inherent interest rate risks are transferred either by means of back-to-back transactions or, in the case of products with no contractual maturity date or direct market-linked rate, by replicating portfolios from the originating business into Group Treasury, which manages the risks on an integrated basis allowing for netting interest rate risks across different sources. Any residual interest rate risks in Wealth Management and Retail & Corporate locations that are not transferred to Group Treasury are managed locally and are subject to independent monitoring and control both in the locations by local risk control units as well as centrally by Treasury Risk Control. To manage the interest rate risk centrally, Group Treasury utilizes derivative instruments, some of which are in designated hedge accounting relationships. A significant amount of interest rate risk also arises from Group Treasury financing and investing activities, for example the financing of non-monetary corporate balance sheet items that have indefinite maturities, such as equity and goodwill. For these items senior management has defined specific target durations based on which we fund and invest as applicable. These targets are defined by replication portfolios, which establish rolling benchmarks to execute against. Group Treasury also maintains a portfolio of available-for-sale debt investments to meet the Group’s liquidity needs. Interest rate risk within Wealth Management Americas arises from the business division’s portfolio of available-for-sale investments in addition to its lending and deposit products offered to clients. This interest rate risk is closely measured, monitored and |
| | | | |
| | managed within approved risk limits and controls, taking into account Wealth Management Americas’ balance sheet items that mutually offset interest rate risk. The Corporate Center – Legacy Portfolio assets that were reclassified toLoans and receivables fromHeld for trading in the fourth quarter of 2008 and the first quarter of 2009, and certain other debt securities held asLoans and receivables, also give rise to non-trading interest rate risk. |
| | Effect of interest rate changes on shareholders’ equity and Basel III CET1 capital The table “Accounting and capital effect of changes in interest rates” below illustrates the accounting and Basel III CET1 capital treatment of gains and losses resulting from changes in interest rates. For instruments held at fair value, a change in interest rates results in an immediate fair value gain or loss recognized either in the income statement or through other comprehensive income (OCI), whereas changes in interest income and expense on interest-bearing assets and liabilities held at amortized cost will be realized over time. Typically, increases in interest rates would lead to an immediate reduction in the value of our longer-term assets held at fair value, but we would expect this to be offset over time through higher net interest income on our core banking products. |
| | | | è Refer to “Differences between Swiss SRB and BIS Basel III capital” in the “Capital management” section of this report for more information |
| | | | |
| | In addition to the differing accounting treatments, our banking book positions have different sensitivities to different points on the yield curves. For example, our portfolios of available-for-sale debt securities and interest rate swaps designated as cash flow hedges, on the whole, are more sensitive to changes in longer-duration interest rates, whereas our deposits and a significant portion of our loans contributing to net interest income are more sensitive to short-term rates. These factors are important as yield curves may not shift on a parallel basis and could, for example, exhibit an initial steepening, followed by a subsequent flattening over time. |
| | By virtue of the accounting treatment and yield curve sensitivities outlined above, in a steepening yield curve scenario we would expect to recognize an initial reduction in shareholders’ |
| | | | | | | | | | | | | | |
| Accounting and capital effect of changes in interest rates1 |
| | | Recognition | | Shareholders’ equity | | Basel III CET1 capital |
| | | Timing | | | Location | | Gains | | Losses | | Gains | | Losses |
| Available-for-sale debt portfolios | | | Immediate | | | OCI | | l | | l | | | | l |
| | | | | | | | | | | | | | | |
| Economic hedges classified as held for trading | | | Immediate | | | Income statement | | l | | l | | l | | l |
| | | | | | | | | | | | | | | |
| Designated cash flow hedges | | | Immediate | | | OCI2 | | l | | l | | | | |
| | | | | | | | | | | | | | | |
| Loans and deposits at amortized cost | | | Gradual | | | Income statement | | l | | l | | l | | l |
| | | | | | | | | | | | | | | |
1 Refer to the table “Differences between Swiss SRB and BIS Basel III capital information” in the “Capital management” section of this report for more information on the differences between shareholders’ equity and Basel III CET1 capital.2 Excluding hedge ineffectiveness which is recognized in the income statement in accordance with our accounting policies.
201
Risk, treasury and capital management
Risk management and control
| | |
| | equity as a result of fair value losses. This would be compensated over time by increased net interest income once increases in interest rates affect in particular the shorter end of the yield curve. The effect would be similar on Basel III CET1 capital, albeit less pronounced as gains and losses on interest rate swaps designated as cash flow hedges are not recognized or reversed for regulatory capital purposes. |
| | We apply scenario analyses to monitor the effect of rising interest rates and changes in the yield curve on our interest rate sensitive banking book exposures. |
| | Interest rate risk sensitivity to parallel shifts in yield curves |
| | Interest rate risk in the banking book is not underpinned for capital purposes, but is subject to a regulatory threshold. The impact of an adverse parallel shift in interest rates of 200 basis points on our banking book interest rate risk exposures is significantly below the threshold of 20% of eligible capital recommended by regulators. |
| | The interest rate risk sensitivity figures presented in the table “Interest rate sensitivity – banking book” below represent the impacts of +1, ±100 and ±200-basis-point parallel moves in yield |
| | |
| | curves on present values of future cash flows, irrespective of accounting treatment. For some portfolios, the +1-basis-point sensitivity has been estimated by dividing the +100-basis-point sensitivity by 100. Due to the low level of interest rates, downward moves by 100 / 200 basis points are floored to ensure that the resulting interest rates are not negative. This effect results in nonlinear behavior of the sensitivity, in particular in US dollar when combined with prepayment risk on US mortgages and related products. |
| | The sensitivity of the banking book to rising rates decreased year on year by CHF 1.2 million per basis point mainly due to reductions in Wealth Management Americas and Corporate Center – Core Functions, partly offset by a slight increase in the Investment Bank’s banking book sensitivity. Wealth Management Americas’ sensitivity declined by CHF 0.9 million as the steeper USD yield curve with higher longer-term USD rates led to a shorter effective duration of client deposits, which represent the majority of Wealth Management Americas’ liabilities. This effect was partly offset by a shortening of the duration in Wealth Management Americas’ investment portfolio. Corporate Center – Core Functions’ sensitivity is chiefly driven by Group Treasury, which was the main contributor to the reported change of CHF 0.6 million. |
| | | | | | | | | | | | | | | | | | | | | | |
| | Interest rate sensitivity – banking book1,2 | | | | |
| | | | 31.12.13 | |
| | CHF million | | –200 bps | | | –100 bps | | | +1 bp | | | +100 bps | | | +200 bps | |
| | CHF | | | (9.6 | ) | | | 13.7 | | | | 0.1 | | | | 14.5 | | | | 32.0 | |
| | | | | | | | | | | | | | | | | | | | | | |
| | EUR | | | 73.9 | | | | 47.3 | | | | (0.6 | ) | | | (55.4 | ) | | | (105.9 | ) |
| | | | | | | | | | | | | | | | | | | | | | |
| | GBP | | | 21.5 | | | | 14.2 | | | | (0.3 | ) | | | (25.8 | ) | | | (51.0 | ) |
| | | | | | | | | | | | | | | | | | | | | | |
| | USD | | | 100.1 | | | | (40.6 | ) | | | 3.0 | | | | 301.0 | | | | 610.0 | |
| | | | | | | | | | | | | | | | | | | | | | |
| | Other | | | (6.2 | ) | | | (5.6 | ) | | | 0.1 | | | | 5.6 | | | | 11.6 | |
| | | | | | | | | | | | | | | | | | | | | | |
| | Total impact on interest rate-sensitive banking book positions | | | 179.7 | | | | 29.0 | | | | 2.4 | | | | 239.8 | | | | 496.7 | |
| | | | | | | | | | | | | | | | | | | | | | |
| | of which: Wealth Management Americas | | | 172.4 | | | | 18.3 | | | | 3.0 | | | | 297.7 | | | | 597.0 | |
| | | | | | | | | | | | | | | | | | | | | | |
| | of which: Investment Bank | | | 29.1 | | | | 16.8 | | | | (0.2 | ) | | | (20.4 | ) | | | (40.3 | ) |
| | | | | | | | | | | | | | | | | | | | | | |
| | of which: Corporate Center – Core Functions | | | (27.0) | | | | (11.7) | | | | (0.3 | ) | | | (23.1 | ) | | | (30.8 | ) |
| | | | | | | | | | | | | | | | | | | | | | |
| | of which: CC – Non-core and Legacy Portfolio | | | 4.3 | | | | 5.1 | | | | (0.1 | ) | | | (11.6 | ) | | | (23.5 | ) |
| | | | | | | | | | | | | | | | | | | | | | |
| | | | 31.12.12 | |
| | CHF million | | –200 bps | | | –100 bps | | | +1 bp | | | +100 bps | | | +200 bps | |
| | CHF | | | (22.5 | ) | | | (13.5 | ) | | | (0.2 | ) | | | (13.7 | ) | | | (23.5) | |
| | | | | | | | | | | | | | | | | | | | | | |
| | EUR | | | 19.8 | | | | 12.1 | | | | (0.4 | ) | | | (42.5 | ) | | | (82.1) | |
| | | | | | | | | | | | | | | | | | | | | | |
| | GBP | | | (5.5 | ) | | | (2.8 | ) | | | (0.0 | ) | | | (4.6 | ) | | | (10.0) | |
| | | | | | | | | | | | | | | | | | | | | | |
| | USD | | | (198.3 | ) | | | (139.3 | ) | | | 4.1 | | | | 415.8 | | | | 800.0 | |
| | | | | | | | | | | | | | | | | | | | | | |
| | Other | | | 2.5 | | | | (6.0 | ) | | | 0.2 | | | | 19.4 | | | | 38.7 | |
| | | | | | | | | | | | | | | | | | | | | | |
| | Total impact on interest rate-sensitive banking book positions | | | (203.9 | ) | | | (149.5 | ) | | | 3.6 | | | | 374.3 | | | | 723.1 | |
| | | | | | | | | | | | | | | | | | | | | | |
| | of which: Wealth Management Americas | | | (168.3 | ) | | | (111.3 | ) | | | 3.9 | | | | 391.7 | | | | 745.9 | |
| | | | | | | | | | | | | | | | | | | | | | |
| | of which: Investment Bank | | | 15.5 | | | | 9.7 | | | | (0.3 | ) | | | (35.0 | ) | | | (70.0 | ) |
| | | | | | | | | | | | | | | | | | | | | | |
| | of which: Corporate Center – Core Functions | | | (54.5 | ) | | | (51.0 | ) | | | 0.3 | | | | 35.9 | | | | 83.8 | |
| | | | | | | | | | | | | | | | | | | | | | |
| | of which: CC – Legacy Portfolio | | | 2.9 | | | | 2.7 | | | | (0.1 | ) | | | (14.6 | ) | | | (29.3 | ) |
| | | | | | | | | | | | | | | | | | | | | | |
| | 1 Does not include interest rate sensitivities for credit valuation adjustments on monoline credit protection, US and non-US reference-linked notes and the option to acquire equity of the SNB StabFund. Also not included are the interest rate sensitivities of our inventory of student loan auction rate securities, as from an economic perspective these exposures are not materially affected by parallel shifts in US dollar interest rates, holding other factors constant.2 In the fourth quarter of 2013, we removed the sensitivity of the debit valuation adjustment to interest rate movements from this table, as this sensitivity is not considered to be part of the banking book for regulatory capital purposes. Prior periods have been restated. The net effect of this exclusion for the –200, –100, +1, +100 and +200 basis point shocks for 31 December 2012 was CHF 3.5, (2.8), 0.3, 31.8 and 63.7 million respectively. | |
202
|
Risk, treasury and capital management |
|
|
| | | | |
| | The sensitivity of the banking book to rising rates includes the interest rate sensitivities arising from debt investments classified asFinancial investments available-for-sale and their associated hedges. The sensitivity of these positions (excluding hedges and excluding investments in funds accounted for as available-for-sale) to a 1-basis-point parallel increase in the yields of the respective instruments is approximately negative CHF 8 million, which would be recorded inOther comprehensive income if such change occurred. The sensitivity of the banking book to rising rates also includes interest rate sensitivities arising from interest rate swaps designated in cash flow hedges. Fair value gains or losses associated with the effective portion of these swaps are recognized initially inEquity. When the hedged forecast cash flows affect profit or loss, the associated gains or losses on the hedging derivatives are reclassified fromEquity to profit or loss. These swaps are denominated in US dollar, euro, British pound and Swiss franc. As of 31 December 2013, the fair value of these interest rate swaps amounted to CHF 4.8 billion (positive replacement values) and CHF 2.3 billion (negative replacement values). The impact of a 1-basis-point increase of underlying LIBOR curves would have decreased equity by approximately CHF 22.3 million, ignoring adjustments for tax. |
| | | | è Refer to “Note 15 Financial investments available-for-sale” in the “Financial information” section of this report for more information |
| |
| | Other market risk exposures |
| | Own credit |
| | We are exposed to changes in UBS’s own credit which are reflected in the valuation of those financial liabilities designated at fair value, for which UBS’s own credit risk would be considered by market participants. We also estimate debit valuation adjustments (DVA) to incorporate own credit in the valuation of derivatives. Changes in fair value due to changes in own credit are recognized in the income statement and therefore affect shareholders’ equity and CET1 capital. |
| | | | è Refer to “Note 24 Fair value measurement” in the
“Financial information” section of this report for more information on own credit |
| | | | |
| | Structural foreign exchange risk |
| | On consolidation, assets and liabilities held in foreign operations are translated into Swiss francs at the closing foreign exchange rate on the balance sheet date, and items of income and expense are translated into Swiss francs at the average rate for the period. The resulting foreign exchange differences are recognized inOther comprehensive income and therefore affect shareholders’ equity and Basel III CET1 capital. |
| | Group Treasury employs strategies to manage this foreign currency exposure, including matched funding of assets and liabilities and net investment hedging. |
| | | | è Refer to the “Treasury management” section of this report for more information on our exposure to and management of structural foreign exchange risk |
| | Equity investments |
| | Under IFRS, equity investments not in the trading book may be classified asFinancial investments available-for-sale, Financial assets designated at fair value or Investments in associates. |
| | We make direct investments in a variety of entities and buy equity holdings in both listed and unlisted companies for a variety of purposes. This includes investments such as exchange and clearing house memberships that are held to support our business activities. We may also make investments in funds that we manage, in order to fund or “seed” them at inception, or to demonstrate that our interests concur with those of investors. We also buy, and are sometimes required by agreement to buy, securities and units from funds that we have sold to clients. |
| | The fair value of equity investments tends to be dominated by factors specific to the individual investments. Equity investments are generally intended to be held for the medium or long term and may be subject to lockup agreements. For these reasons, we generally do not control these exposures using the market risk measures applied to trading activities. Such equity investments are, however, subject to a different range of controls, including pre-approval of new investments by business management and Risk Control, portfolio and concentration limits, and regular monitoring and reporting to senior management. They are also included in our Group-wide statistical and stress testing metrics which flow into our risk appetite framework. |
203
Risk, treasury and capital management
Risk management and control
| | | | |
| | As of 31 December 2013, we held equity investments totaling CHF 1.5 billion, of which CHF 0.6 billion were classified asFinancial investments available-for-sale, and CHF 0.8 billion asInvestments in associates. This was broadly unchanged from the prior year. |
| | | | è Refer to “Note 15 Financial investments available-for-sale” and “Note 30 Interests in other entities” in the “Financial information” section of this report for more information |
| | Debt investments |
| | Debt investments classified asFinancial investments available-for-sale are measured at fair value with changes in fair value recorded throughEquity, and can broadly be categorized as money market instruments and debt securities primarily held for statutory, regulatory or liquidity reasons. The risk control framework applied to debt instruments classified asFinancial investments available-for-sale depends on the nature of the instruments and the purpose for which we hold them. Our exposures may be included in market risk limits or be subject to specific monitoring such as interest rate sensitivity analysis. They are also included in our Group-wide statistical and stress testing metrics which flow into our risk appetite framework. Debt instruments classified asFinancial investments available-for-sale had a fair value of CHF 58.9 billion as of 31 December 2013 compared with CHF 65.7 billion as of 31 December 2012. |
| | | | è Refer to “Note 15 Financial investments available-for-sale” in the “Financial information” section of this report for more information |
| | | | è Refer to “Interest rate risk sensitivity to parallel shifts in yield curves” in this section for more information |
| | | | è Refer to the “Treasury management” section of this report for more information |
| | Pension risk |
| | We maintain a number of defined benefit pension plans for past and current employees. The ability of each plan to meet the projected pension payments is maintained principally through investments. Pension risk arises because the fair value of these plan assets might decline, their investment returns might decrease or the estimated value of the defined benefit obligation might increase. |
| | | | |
| | If plan assets are insufficient to meet the projected pension payments, UBS may be required, or might choose, to make extra contributions to the pension plans. |
| | Under IFRS, remeasurements of the defined benefit obligation and the fair values of the plan assets are recognized throughOther comprehensive income and therefore affect shareholders’ equity. An increase in the overall net defined benefit liability of a pension plan (where the defined benefit obligation exceeds the fair value of plan assets) will reduce our equity. Where the defined benefit obligation is less than the fair value of the plan assets, the pension plan is in a surplus position. Such surplus can only be recognized on the balance sheet to the extent that it does not exceed the estimated future economic benefit. Where the amount of surplus recognized has been capped, any reduction in the estimated future economic benefit will reduce equity. Changes in the surplus, due to changes in the defined benefit obligation or fair value of plan assets, will not affect equity until the surplus falls below any cap. |
| | Remeasurements of the defined benefit obligations and plan assets similarly affect our Basel III CET1 capital on a fully applied basis, albeit pension surpluses are not recognized. |
| | Investment policies and strategies are in place for our defined benefit pension plans which take account of the maturity profile of plan liabilities and ensure diversified portfolios of assets are maintained. These strategies are managed by responsible governance bodies in each jurisdiction according to local laws and regulations. |
| | Pension risk is included in our Group-wide statistical and stress testing metrics which flow into our risk appetite framework. |
| | | | è Refer to “Note 28 Pension and otherpost-employment benefit plans” in the “Financial information” section of this report for more information |
| | UBS own share exposure |
| | We hold our own shares primarily to hedge employee share and option participation plans. A smaller number are held by the Investment Bank which relate to market-making and hedging activities. |
| | | | è Refer to “Holding of UBS shares” in the “Capital management” section of this report for more information |
204
|
Risk, treasury and capital management |
|
|
Country risk
Country risk framework
Country risk includes all country-specific events that occur within a sovereign’s jurisdiction and may lead to an impairment of UBS’s exposures. Country risk can take the form of sovereign risk, which refers to the ability and willingness of a government to honor its financial commitments, transfer risk, which would arise if an issuer or counterparty could not acquire foreign currencies following a moratorium of a central bank on foreign exchange transfers, or “other” country risk that may manifest itself through increased and multiple counterparty and issuer default risk (systemic risk) on the one hand, and by events that may affect the standing of a country (e.g., political stability, institutional and legal framework) on the other hand. We have a well-established risk control framework through which we assess the risk profile of all countries where we have exposure.
We attribute to each country a sovereign rating, which expresses the probability of the sovereign defaulting on its own financial obligations in foreign currency. Our ratings are expressed by statistically derived default probabilities as described in the “Probability of default” section above. Based on this internal analysis we also define the probability of a transfer event occurring and establish rules as to how the aspects of “other” country risk should be incorporated into the analysis of the counterparty rating of incorporated entities that are domiciled in the respective country.
We ensure that our exposure to all countries is commensurate with the credit ratings we assign to them, and that it is not disproportionate to the respective country risk profile. For all countries rated 3 and below we set country risk ceilings, which are approved either by the Board of Directors or under delegated authority by the Group Chief Executive Officer or Group Chief Risk Officer, depending on the size of the limit and the country rating. A country risk ceiling applies to all our exposures to counterparties or issuers of securities and financial investments in the respective country. We may limit the extension of credit, transactions in traded products or positions in securities based on a country ceiling, even if our exposure to a counterparty is otherwise acceptable.
For internal measurement and control of country risk, we also consider the financial impact of market disruptions arising prior to, during and following a country crisis. These may take the form of a severe deterioration in a country’s debt, equity or other asset markets or of a sharp depreciation of the currency. We use stress testing to assess the potential financial impact of a severe country
and/or sovereign crisis. This involves the development of plausible stress scenarios for combined stress testing and the identification of countries that may potentially be subject to a crisis event, determining potential losses and making assumptions about recovery rates depending on the types of credit transactions involved and their economic importance to the affected countries.
Our exposures to market risks are also subject to regular stress tests that cover major global scenarios, which are used for combined stress testing as well, whereby we apply market shock factors to equity indices, interest and currency rates in all relevant countries and consider the potential liquidity of the instruments.
In light of the ongoing European sovereign debt crisis, we maintain increased monitoring of, and focus on, the quality of collateral we hold.
Country risk exposure
Country risk exposure measure
The presentation of country risk follows our internal risk view, whereby the basis for measurement of exposures depends on the product category into which we have classified our exposures. In addition to the classification of exposures into banking products and traded products as defined in “Credit risk profile of the Group – Internal risk view,” we classify within trading inventory issuer risk on securities such as bonds and equities, as well as the risk relating to the underlying reference assets for derivative positions, including those linked to credit protection we buy or sell and loan or security underwriting commitments pending distribution.
As we manage the trading inventory on a net basis, we net the value of long positions against short positions with the same underlying issuer. Net exposures are, however, floored at zero per issuer in the figures presented. We therefore do not recognize the potentially offsetting benefit of certain hedges and short positions across issuers.
We do not recognize any expected recovery values when reporting country exposures asExposure before hedgesexcept for the risk-reducing effects of master netting agreements and collateral held in the form of either cash or portfolios of diversified marketable securities, which we deduct from the basic positive exposure values. Within banking products and traded products, the risk-reducing effect of any credit protection is taken into account on a notional basis when determining theNet of hedges exposures.
205
Risk, treasury and capital management
Risk management and control
Country risk exposure allocation
In general, exposures are shown against the country of domicile of the contractual counterparty or the issuer of the security. For some counterparties whose economic substance in terms of assets or source of revenues is primarily located in a different country, the exposure is allocated to the risk domicile of that different country.
This is the case, for example, with legal entities incorporated in financial offshore centers, which have their main assets and revenue streams outside the country of domicile. The same principle applies to exposures for which we hold third-party guarantees or collateral, where we report the exposure against the country of domicile of either the guarantor or the issuer of the underlying security, or against the country where pledged physical assets are located.
We apply a specific approach to banking products exposures to branches of financial institutions which are located in a country other than that of the domicile of the legal entity. In such cases, exposures are recorded in full against the country of domicile of the counterparty and additionally in full against the country in which the branch is located.
In the case of derivatives, we show the counterparty risk associated with the positive replacement value against the country of domicile of the counterparty (presented within traded products). In addition, the risk associated with the instantaneous fall in value of the underlying reference asset to zero (assuming no recovery) is shown against the country of domicile of the issuer of the reference asset (presented within trading inventory). This approach ensures that we capture both the counterparty and, where applicable, issuer elements of risk arising from derivatives and applies comprehensively for all derivatives, including single-name CDS and other credit derivatives.
As a basic example: if a CDS protection for a notional value of 100 bought from a counterparty domiciled in country X referencing debt of an issuer domiciled in country Y has a positive replacement value of 20, we record (i) the fair value of the CDS (20) against country X (within traded products) and (ii) the hedge benefit (notional minus fair value) of the CDS (100 – 20 = 80) against country Y (within trading inventory). In the example of protection bought, the 80 hedge benefit would offset against any exposure arising from securities held and issued by the same entity as the reference asset, floored at zero per issuer. In the case of protection sold, this would be reflected as a risk exposure of 80 in addition to any exposure arising from securities held and issued by the same entity as the reference asset. In the case of derivatives referencing a basket of assets, the issuer risk against each reference entity is calculated as the expected change in fair value of the derivative given an instantaneous fall in value to zero of the corresponding reference asset (or assets) issued by that entity. Expo-
sures are then aggregated by country across issuers, floored at zero per issuer.
Exposures to selected eurozone countries
We continue to monitor and manage closely our exposures to peripheral European countries. Our direct exposures to Greece, Italy, Ireland, Portugal and Spain remain limited, but we nevertheless remain vigilant regarding the potential broader implications of adverse developments in the eurozone. As noted in the “Stress testing” section, the Euro Crisis scenario was our binding scenario for Combined Stress Test purposes during 2013, making it central to the regular monitoring of risk exposure against the minimum capital and earnings objectives in our risk appetite framework.
The table “Exposures to selected eurozone countries” on the next page provides an overview of our exposures to eurozone countries rated lower than AAA/Aaa by at least one of the major rating agencies as of 31 December 2013. Following the downgrade of its credit rating by Standard & Poor’s from AAA to AA+ in November 2013, the Netherlands has been added to this disclosure. The table shows an internal risk view of gross and net exposures split by sovereign, agencies and central banks, local governments, banks and other counterparties (including corporates, insurance companies and funds). Exposures to Andorra, Cyprus, Estonia, Malta, Monaco, Montenegro, San Marino, Slovakia and Slovenia are grouped in Other.
CDS are primarily bought and sold in relation to our trading businesses, but are also used to hedge parts of our risk exposure, including that related to selected eurozone countries. As of 31 December 2013, and not taking into account the risk-reducing effect of master netting agreements, we had purchased approximately CHF 60 billion gross notional of single name CDS protection on issuers domiciled in Greece, Italy, Ireland, Portugal or Spain (GIIPS) and had sold CHF 57 billion gross notional of single-name CDS protection. On a net basis, taking into account the risk reducing effect of master netting agreements, this equates to approximately CHF 14 billion notional purchased and CHF 11 billion notional sold. More than 99% of gross protection purchased was from investment grade counterparties (based on our internal ratings) and on a collateralized basis. The vast majority of this was from financial institutions domiciled outside the eurozone. Approximately CHF 0.7 billion of the gross protection purchased was from counterparties domiciled in a GIIPS country and less than CHF 0.3 billion was with counterparties domiciled in the same country as the reference entity.
Holding CDS for credit default protection does not necessarily protect the buyer of protection against losses, as the contracts will only pay out under certain scenarios. The effectiveness of our CDS protection as a hedge of default risk is influenced by a number of factors, including the contractual terms under which the CDS was
206
|
Risk, treasury and capital management |
|
|
Exposures to selected eurozone countries
| | | | | | | | | | | | | | | | | | | | | | | | | | | | | | | | |
CHF million | | Total | | | Banking products
(loans, guarantees, loan commitments) | | | Traded products
(counterparty risk from
derivatives and securities financing)
after master netting
agreements and net of
collateral | | | Trading inventory
(securities and potential
benefits / remaining
exposure from derivatives) | |
| 31.12.13 | | | | | |
| Net of
hedges |
1 | |
| Exposure
before hedges |
| |
| Net of
hedges |
1 | |
| of which:
unfunded |
| |
| Exposure
before hedges |
| |
| Net of
hedges |
| | | Net long per issuer | |
| France | | | 10,291 | | | | 9,469 | | | | 1,955 | | | | 1,257 | | | | 751 | | | | 2,406 | | | | 2,283 | | | | 5,930 | |
| | | | | | | | | | | | | | | | | | | | | | | | | | | | | | | | | |
| Sovereign, agencies and central bank | | | 5,653 | | | | 5,530 | | | | 56 | | | | 56 | | | | | | | | 260 | | | | 137 | | | | 5,337 | |
| | | | | | | | | | | | | | | | | | | | | | | | | | | | | | | | | |
| Local governments | | | 15 | | | | 15 | | | | 6 | | | | 6 | | | | | | | | 3 | | | | 3 | | | | 6 | |
| | | | | | | | | | | | | | | | | | | | | | | | | | | | | | | | | |
| Banks | | | 1,438 | | | | 1,438 | | | | 219 | | | | 219 | | | | | | | | 1,016 | | | | 1,016 | | | | 203 | |
| | | | | | | | | | | | | | | | | | | | | | | | | | | | | | | | | |
| Other2 | | | 3,185 | | | | 2,486 | | | | 1,674 | | | | 975 | | | | | | | | 1,127 | | | | 1,127 | | | | 384 | |
| | | | | | | | | | | | | | | | | | | | | | | | | | | | | | | | | |
| Netherlands | | | 7,616 | | | | 6,878 | | | | 2,080 | | | | 1,408 | | | | 326 | | | | 734 | | | | 667 | | | | 4,803 | |
| | | | | | | | | | | | | | | | | | | | | | | | | | | | | | | | | |
| Sovereign, agencies and central bank | | | 3,166 | | | | 3,166 | | | | 1 | | | | 1 | | | | | | | | 62 | | | | 62 | | | | 3,103 | |
| | | | | | | | | | | | | | | | | | | | | | | | | | | | | | | | | |
| Local governments | | | 0 | | | | 0 | | | | | | | | | | | | | | | | 0 | | | | 0 | | | | | |
| | | | | | | | | | | | | | | | | | | | | | | | | | | | | | | | | |
| Banks | | | 1,117 | | | | 1,117 | | | | 643 | | | | 643 | | | | | | | | 449 | | | | 449 | | | | 25 | |
| | | | | | | | | | | | | | | | | | | | | | | | | | | | | | | | | |
| Other2 | | | 3,334 | | | | 2,595 | | | | 1,436 | | | | 764 | | | | | | | | 223 | | | | 156 | | | | 1,675 | |
| | | | | | | | | | | | | | | | | | | | | | | | | | | | | | | | | |
| Italy | | | 3,982 | | | | 3,273 | | | | 1,775 | | | | 1,070 | | | | 888 | | | | 633 | | | | 629 | | | | 1,574 | |
| | | | | | | | | | | | | | | | | | | | | | | | | | | | | | | | | |
| Sovereign, agencies and central bank | | | 881 | | | | 881 | | | | 37 | | | | 37 | | | | | | | | 67 | | | | 67 | | | | 776 | |
| | | | | | | | | | | | | | | | | | | | | | | | | | | | | | | | | |
| Local governments | | | 138 | | | | 138 | | | | | | | | | | | | | | | | 92 | | | | 92 | | | | 46 | |
| | | | | | | | | | | | | | | | | | | | | | | | | | | | | | | | | |
| Banks | | | 1,048 | | | | 1,048 | | | | 366 | | | | 366 | | | | | | | | 120 | | | | 120 | | | | 562 | |
| | | | | | | | | | | | | | | | �� | | | | | | | | | | | | | | | | | |
| Other2 | | | 1,916 | | | | 1,207 | | | | 1,373 | | | | 667 | | | | | | | | 354 | | | | 350 | | | | 189 | |
| | | | | | | | | | | | | | | | | | | | | | | | | | | | | | | | | |
| Spain | | | 2,341 | | | | 1,579 | | | | 810 | | | | 198 | | | | 133 | | | | 396 | | | | 246 | | | | 1,135 | |
| | | | | | | | | | | | | | | | | | | | | | | | | | | | | | | | | |
| Sovereign, agencies and central bank | | | 222 | | | | 222 | | | | 20 | | | | 20 | | | | | | | | | | | | | | | | 201 | |
| | | | | | | | | | | | | | | | | | | | | | | | | | | | | | | | | |
| Local governments | | | 13 | | | | 13 | | | | | | | | | | | | | | | | 7 | | | | 7 | | | | 5 | |
| | | | | | | | | | | | | | | | | | | | | | | | | | | | | | | | | |
| Banks | | | 255 | | | | 255 | | | | 59 | | | | 59 | | | | | | | | 176 | | | | 176 | | | | 21 | |
| | | | | | | | | | | | | | | | | | | | | | | | | | | | | | | | | |
| Other2 | | | 1,851 | | | | 1,089 | | | | 731 | | | | 119 | | | | | | | | 213 | | | | 63 | | | | 908 | |
| | | | | | | | | | | | | | | | | | | | | | | | | | | | | | | | | |
| Austria | | | 1,581 | | | | 1,360 | | | | 53 | | | | 53 | | | | 16 | | | | 709 | | | | 487 | | | | 820 | |
| | | | | | | | | | | | | | | | | | | | | | | | | | | | | | | | | |
| Sovereign, agencies and central bank | | | 1,198 | | | | 977 | | | | 12 | | | | 12 | | | | | | | | 585 | | | | 364 | | | | 601 | |
| | | | | | | | | | | | | | | | | | | | | | | | | | | | | | | | | |
| Local governments | | | 1 | | | | 1 | | | | | | | | | | | | | | | | 1 | | | | 1 | | | | 1 | |
| | | | | | | | | | | | | | | | | | | | | | | | | | | | | | | | | |
| Banks | | | 342 | | | | 342 | | | | 20 | | | | 20 | | | | | | | | 120 | | | | 120 | | | | 202 | |
| | | | | | | | | | | | | | | | | | | | | | | | | | | | | | | | | |
| Other2 | | | 40 | | | | 40 | | | | 21 | | | | 21 | | | | | | | | 3 | | | | 3 | | | | 16 | |
| | | | | | | | | | | | | | | | | | | | | | | | | | | | | | | | | |
| Ireland3 | | | 1,051 | | | | 1,051 | | | | 136 | | | | 136 | | | | 1 | | | | 614 | | | | 614 | | | | 301 | |
| | | | | | | | | | | | | | | | | | | | | | | | | | | | | | | | | |
| Sovereign, agencies and central bank | | | 38 | | | | 38 | | | | | | | | | | | | | | | | 0 | | | | 0 | | | | 38 | |
| | | | | | | | | | | | | | | | | | | | | | | | | | | | | | | | | |
| Local governments | | | | | | | | | | | | | | | | | | | | | | | | | | | | | | | | |
| | | | | | | | | | | | | | | | | | | | | | | | | | | | | | | | | |
| Banks | | | 243 | | | | 243 | | | | 108 | | | | 108 | | | | | | | | 31 | | | | 31 | | | | 104 | |
| | | | | | | | | | | | | | | | | | | | | | | | | | | | | | | | | |
| Other2 | | | 770 | | | | 770 | | | | 29 | | | | 29 | | | | | | | | 583 | | | | 583 | | | | 158 | |
| | | | | | | | | | | | | | | | | | | | | | | | | | | | | | | | | |
| Belgium | | | 642 | | | | 642 | | | | 169 | | | | 169 | | | | 41 | | | | 129 | | | | 129 | | | | 344 | |
| | | | | | | | | | | | | | | | | | | | | | | | | | | | | | | | | |
| Sovereign, agencies and central bank | | | 252 | | | | 252 | | | | 4 | | | | 4 | | | | | | | | 71 | | | | 71 | | | | 176 | |
| | | | | | | | | | | | | | | | | | | | | | | | | | | | | | | | | |
| Local governments | | | | | | | | | | | | | | | | | | | | | | | | | | | | | | | | |
| | | | | | | | | | | | | | | | | | | | | | | | | | | | | | | | | |
| Banks | | | 142 | | | | 142 | | | | 87 | | | | 87 | | | | | | | | 30 | | | | 30 | | | | 24 | |
| | | | | | | | | | | | | | | | | | | | | | | | | | | | | | | | | |
| Other2 | | | 249 | | | | 249 | | | | 78 | | | | 78 | | | | | | | | 28 | | | | 28 | | | | 143 | |
| | | | | | | | | | | | | | | | | | | | | | | | | | | | | | | | | |
| Portugal | | | 180 | | | | 57 | | | | 125 | | | | 3 | | | | 2 | | | | 13 | | | | 13 | | | | 42 | |
| | | | | | | | | | | | | | | | | | | | | | | | | | | | | | | | | |
| Sovereign, agencies and central bank | | | | | | | | | | | | | | | | | | | | | | | | | | | | | | | | |
| | | | | | | | | | | | | | | | | | | | | | | | | | | | | | | | | |
| Local governments | | | | | | | | | | | | | | | | | | | | | | | | | | | | | | | | |
| | | | | | | | | | | | | | | | | | | | | | | | | | | | | | | | | |
| Banks | | | 20 | | | | 20 | | | | 2 | | | | 2 | | | | | | | | 13 | | | | 13 | | | | 4 | |
| | | | | | | | | | | | | | | | | | | | | | | | | | | | | | | | | |
| Other2 | | | 160 | | | | 37 | | | | 123 | | | | 0 | | | | | | | | 0 | | | | 0 | | | | 37 | |
| | | | | | | | | | | | | | | | | | | | | | | | | | | | | | | | | |
| Greece | | | 50 | | | | 50 | | | | 5 | | | | 5 | | | | 5 | | | | 4 | | | | 4 | | | | 41 | |
| | | | | | | | | | | | | | | | | | | | | | | | | | | | | | | | | |
| Sovereign, agencies and central bank | | | 23 | | | | 23 | | | | | | | | | | | | | | | | | | | | | | | | 23 | |
| | | | | | | | | | | | | | | | | | | | | | | | | | | | | | | | | |
| Local governments | | | | | | | | | | | | | | | | | | | | | | | | | | | | | | | | |
| | | | | | | | | | | | | | | | | | | | | | | | | | | | | | | | | |
| Banks | | | 9 | | | | 9 | | | | 5 | | | | 5 | | | | | | | | 4 | | | | 4 | | | | 0 | |
| | | | | | | | | | | | | | | | | | | | | | | | | | | | | | | | | |
| Other2 | | | 19 | | | | 19 | | | | 0 | | | | 0 | | | | | | | | 0 | | | | 0 | | | | 18 | |
| | | | | | | | | | | | | | | | | | | | | | | | | | | | | | | | | |
| Other | | | 195 | | | | 195 | | | | 120 | | | | 120 | | | | 32 | | | | 71 | | | | 71 | | | | 5 | |
| | | | | | | | | | | | | | | | | | | | | | | | | | | | | | | | | |
1 Not deducted from the “Net of hedges” exposures are total allowances and provisions for credit losses of CHF 35 million (of which: Malta CHF 13 million, Austria CHF 9 million and France CHF 5 million). 2 Includes corporates, insurance companies and funds. 3 The majority of the Ireland exposure relates to funds and foreign bank subsidiaries.
207
Risk, treasury and capital management
Risk management and control
Exposure from single-name credit default swaps referencing Greece, Italy, Ireland, Portugal or Spain
| | | | | | | | | | | | | | | | | | | | | | | | | | | | | | | | | | | | | | | | | | | | | | | | |
| | Protection bought | | | Protection sold | | | Net position
(after application of counterparty
master netting agreements) | |
CHF million | | | | | of which: counterparty
domiciled in GIIPS country | | | of which: counterparty
domicile is the same as the
reference entity domicile | | | | | | | |
31.12.13 | | Notional | | | RV | | | Notional | | | RV | | | Notional | | | RV | | | Notional | | | RV | | | Buy
notional | | | Sell
notional | | | PRV | | | NRV | |
Greece | | | 751 | | | | (16 | ) | | | 0 | | | | 0 | | | | 0 | | | | 0 | | | | (728 | ) | | | 19 | | | | 240 | | | | (217 | ) | | | 14 | | | | (11 | ) |
| | | | | | | | | | | | | | | | | | | | | | | | | | | | | | | | | | | | | | | | | | | | | | | | | |
Italy | | | 35,539 | | | | 238 | | | | 272 | | | | 0 | | | | 158 | | | | (1 | ) | | | (33,954 | ) | | | (436 | ) | | | 6,491 | | | | (4,907 | ) | | | 172 | | | | (370 | ) |
| | | | | | | | | | | | | | | | | | | | | | | | | | | | | | | | | | | | | | | | | | | | | | | | | |
Ireland | | | 4,216 | | | | (32 | ) | | | 13 | | | | 0 | | | | 0 | | | | 0 | | | | (4,067 | ) | | | 58 | | | | 1,409 | | | | (1,259 | ) | | | 57 | | | | (31 | ) |
| | | | | | | | | | | | | | | | | | | | | | | | | | | | | | | | | | | | | | | | | | | | | | | | | |
Portugal | | | 4,485 | | | | 128 | | | | 138 | | | | 5 | | | | 0 | | | | 0 | | | | (4,319 | ) | | | (135 | ) | | | 1,273 | | | | (1,107 | ) | | | 66 | | | | (73 | ) |
| | | | | | | | | | | | | | | | | | | | | | | | | | | | | | | | | | | | | | | | | | | | | | | | | |
Spain | | | 15,099 | | | | (133 | ) | | | 286 | | | | 43 | | | | 100 | | | | 40 | | | | (14,364 | ) | | | 109 | | | | 4,470 | | | | (3,736 | ) | | | 136 | | | | (160 | ) |
| | | | | | | | | | | | | | | | | | | | | | | | | | | | | | | | | | | | | | | | | | | | | | | | | |
Total | | | 60,090 | | | | 185 | | | | 709 | | | | 47 | | | | 258 | | | | 40 | | | | (57,433 | ) | | | (385 | ) | | | 13,884 | | | | (11,226 | ) | | | 445 | | | | (645 | ) |
| | | | | | | | | | | | | | | | | | | | | | | | | | | | | | | | | | | | | | | | | | | | | | | | | |
written. Generally, only the occurrence of a credit event as defined by the CDS terms (which may include among other events, failure to pay, restructuring or bankruptcy) results in a payment under the purchased credit protection contracts. For CDS contracts on sovereign obligations, repudiation can also be deemed as a default event. The determination as to whether a credit event has occurred is made by the relevant International Swaps and Derivatives Association (ISDA) determination committees (comprised of various ISDA member firms) based on the terms of the CDS and the facts and circumstances surrounding the event.
Exposure to emerging market countries
The table “Emerging markets net exposure by major geographical region” on the following page shows the five largest emerging market country exposures in each major geographical area by product type as of 31 December 2013 compared with 31 December 2012. Based on the main country rating categories, as of 31 December 2013, 93% of our emerging market country exposure was rated investment grade compared with 92% as of 31 December 2012.
Emerging markets net exposure1 by internal UBS country rating category
| | | | | | | | |
| CHF million | | 31.12.13 | | | 31.12.12 | |
| Investment grade | | | 14,880 | | | | 16,953 | |
| | | | | | | | | |
| Sub-investment grade | | | 1,126 | | | | 1,428 | |
| | | | | | | | | |
| Total | | | 16,007 | | | | 18,381 | |
| | | | | | | | | |
1 Net of credit hedges (for banking products and for traded products), net long per issuer (for trading inventory). Total allowances and provisions of CHF 65 million are not deducted (31 December 2012: CHF 73 million).
208
|
Risk, treasury and capital management |
|
|
Emerging markets net exposure by major geographical region
| | | | | | | | | | | | | | | | | | | | | | | | | | | | | | | | |
CHF million | | Total | | | Banking products
(loans, guarantees,
loan commitments) | | | Traded products
(counterparty risk from derivatives
and securities financing)
after master netting agreements
and net of collateral | | | Trading inventory
(securities and potential
benefits /remaining exposure
from derivatives) | |
| | Net of hedges1 | | | Net of hedges1 | | | Net of hedges | | | Net long per issuer | |
| | | 31.12.13 | | | 31.12.12 | | | 31.12.13 | | | 31.12.12 | | | 31.12.13 | | | 31.12.12 | | | 31.12.13 | | | 31.12.12 | |
| Emerging America | | | 2,223 | | | | 2,498 | | | | 789 | | | | 707 | | | | 626 | | | | 489 | | | | 807 | | | | 1,302 | |
| | | | | | | | | | | | | | | | | | | | | | | | | | | | | | | | | |
Brazil | | | 1,335 | | | | 1,353 | | | | 387 | | | | 185 | | | | 521 | | | | 305 | | | | 427 | | | | 863 | |
| | | | | | | | | | | | | | | | | | | | | | | | | | | | | | | | | |
Mexico | | | 331 | | | | 214 | | | | 93 | | | | 97 | | | | 49 | | | | 75 | | | | 190 | | | | 43 | |
| | | | | | | | | | | | | | | | | | | | | | | | | | | | | | | | | |
Colombia | | | 192 | | | | 192 | | | | 139 | | | | 124 | | | | 12 | | | | 23 | | | | 42 | | | | 44 | |
| | | | | | | | | | | | | | | | | | | | | | | | | | | | | | | | | |
Chile | | | 152 | | | | 322 | | | | 81 | | | | 200 | | | | 44 | | | | 82 | | | | 26 | | | | 40 | |
| | | | | | | | | | | | | | | | | | | | | | | | | | | | | | | | | |
Argentina | | | 57 | | | | 59 | | | | 37 | | | | 34 | | | | | | | | | | | | 20 | | | | 25 | |
| | | | | | | | | | | | | | | | | | | | | | | | | | | | | | | | | |
Other | | | 156 | | | | 357 | | | | 53 | | | | 67 | | | | 1 | | | | 4 | | | | 103 | | | | 286 | |
| | | | | | | | | | | | | | | | | | | | | | | | | | | | | | | | | |
| Emerging Asia | | | 9,720 | | | | 11,184 | | | | 3,722 | | | | 4,341 | | | | 1,783 | | | | 1,846 | | | | 4,216 | | | | 4,998 | |
| | | | | | | | | | | | | | | | | | | | | | | | | | | | | | | | | |
China | | | 3,528 | | | | 3,163 | | | | 1,160 | | | | 838 | | | | 263 | | | | 245 | | | | 2,105 | | | | 2,080 | |
| | | | | | | | | | | | | | | | | | | | | | | | | | | | | | | | | |
Hong Kong | | | 1,436 | | | | 1,557 | | | | 588 | | | | 674 | | | | 541 | | | | 510 | | | | 307 | | | | 374 | |
| | | | | | | | | | | | | | | | | | | | | | | | | | | | | | | | | |
India | | | 1,335 | | | | 2,155 | | | | 735 | | | | 1,156 | | | | 190 | | | | 254 | | | | 410 | | | | 744 | |
| | | | | | | | | | | | | | | | | | | | | | | | | | | | | | | | | |
South Korea | | | 1,158 | | | | 1,532 | | | | 273 | | | | 447 | | | | 472 | | | | 462 | | | | 413 | | | | 623 | |
| | | | | | | | | | | | | | | | | | | | | | | | | | | | | | | | | |
Taiwan | | | 921 | | | | 1,072 | | | | 309 | | | | 299 | | | | 193 | | | | 247 | | | | 420 | | | | 526 | |
| | | | | | | | | | | | | | | | | | | | | | | | | | | | | | | | | |
Other | | | 1,342 | | | | 1,704 | | | | 657 | | | | 926 | | | | 124 | | | | 127 | | | | 561 | | | | 651 | |
| | | | | | | | | | | | | | | | | | | | | | | | | | | | | | | | | |
| Emerging Europe | | | 1,591 | | | | 1,833 | | | | 978 | | | | 864 | | | | 89 | | | | 247 | | | | 525 | | | | 722 | |
| | | | | | | | | | | | | | | | | | | | | | | | | | | | | | | | | |
Russia | | | 835 | | | | 1,061 | | | | 509 | | | | 489 | | | | 24 | | | | 174 | | | | 302 | | | | 398 | |
| | | | | | | | | | | | | | | | | | | | | | | | | | | | | | | | | |
Turkey | | | 324 | | | | 264 | | | | 248 | | | | 204 | | | | 25 | | | | 23 | | | | 51 | | | | 38 | |
| | | | | | | | | | | | | | | | | | | | | | | | | | | | | | | | | |
Bulgaria | | | 76 | | | | 38 | | | | 40 | | | | 38 | | | | | | | | 0 | | | | 36 | | | | 0 | |
| | | | | | | | | | | | | | | | | | | | | | | | | | | | | | | | | |
Croatia | | | 60 | | | | 49 | | | | 12 | | | | 4 | | | | 1 | | | | 0 | | | | 47 | | | | 45 | |
| | | | | | | | | | | | | | | | | | | | | | | | | | | | | | | | | |
Ukraine | | | 49 | | | | 121 | | | | 27 | | | | 37 | | | | 0 | | | | 0 | | | | 23 | | | | 84 | |
| | | | | | | | | | | | | | | | | | | | | | | | | | | | | | | | | |
Other | | | 247 | | | | 300 | | | | 141 | | | | 92 | | | | 39 | | | | 50 | | | | 67 | | | | 158 | |
| | | | | | | | | | | | | | | | | | | | | | | | | | | | | | | | | |
| Middle East and Africa | | | 2,473 | | | | 2,867 | | | | 890 | | | | 1,006 | | | | 1,005 | | | | 1,105 | | | | 578 | | | | 756 | |
| | | | | | | | | | | | | | | | | | | | | | | | | | | | | | | | | |
Saudi Arabia | | | 673 | | | | 599 | | | | 149 | | | | 107 | | | | 503 | | | | 473 | | | | 20 | | | | 19 | |
| | | | | | | | | | | | | | | | | | | | | | | | | | | | | | | | | |
South Africa | | | 438 | | | | 559 | | | | 154 | | | | 114 | | | | 43 | | | | 31 | | | | 241 | | | | 414 | |
| | | | | | | | | | | | | | | | | | | | | | | | | | | | | | | | | |
Kuwait | | | 357 | | | | 309 | | | | 9 | | | | 16 | | | | 348 | | | | 293 | | | | 1 | | | | 0 | |
| | | | | | | | | | | | | | | | | | | | | | | | | | | | | | | | | |
United Arab Emirates | | | 281 | | | | 525 | | | | 141 | | | | 196 | | | | 67 | | | | 217 | | | | 72 | | | | 112 | |
| | | | | | | | | | | | | | | | | | | | | | | | | | | | | | | | | |
Israel | | | 154 | | | | 299 | | | | 38 | | | | 190 | | | | 13 | | | | 4 | | | | 103 | | | | 105 | |
| | | | | | | | | | | | | | | | | | | | | | | | | | | | | | | | | |
Other | | | 570 | | | | 575 | | | | 399 | | | | 383 | | | | 30 | | | | 86 | | | | 140 | | | | 107 | |
| | | | | | | | | | | | | | | | | | | | | | | | | | | | | | | | | |
| Total | | | 16,007 | | | | 18,381 | | | | 6,379 | | | | 6,918 | | | | 3,502 | | | | 3,686 | | | | 6,126 | | | | 7,777 | |
| | | | | | | | | | | | | | | | | | | | | | | | | | | | | | | | | |
1 Not deducted are total allowances and provisions of CHF 65 million (31 December 2012: CHF 73 million).
209
Risk, treasury and capital management
Risk management and control
Operational risk
Key developments during the period
Reporting of significant risk issues and operational effectiveness was further extended and strengthened through 2013. Where a particular operational risk issue is considered of strategic concern to the Group, it is categorized as a “Group Significant Operational Risk Issue.” Remediation programs related to these issues are led by members of the Group Executive Board and are subject to independent quality assurance. Completion is assessed against clearly defined success criteria to confirm that an adequate and sustainable standard of control has been achieved. The Group Executive Board members have confirmed their personal and collective commitment to the timely and sustainable remediation of Group Significant Operational Risk Issues. In 2013, we made significant progress on these remediation programs resulting in the completion of many remediation activities.
The Investment Bank’s unauthorized trading incident remediation program has been completed and this has further enhanced the Group’s ability to detect or prevent such incidents. Independent third-party reviews have been completed with no material issues identified.
In the past year we have entered into a number of settlements, the largest of which relates to Federal Housing Finance Agency.
Multiple security programs have been initiated in 2013 to address the evolving and increasingly complex threat of cyber-attacks and cyber-criminal activity facing the financial services industry and the increased use of mobile devices, social networking, and the growing sophistication of cyber-attacks have been identified as an area of increasing operational risk.
Operational risk is an inevitable consequence of being in business, as losses can result from inadequate or failed internal processes, people and systems, or from external events. The impact of operational risk remains at elevated levels, and can arise as a result of past and current business activities across all business divisions and Corporate Center. In acknowledgement of the dynamic industry and the environment in which we operate, we will continue to refine our framework to ensure it is adaptive to organizational changes, is responsive to regulatory requirements and supports forward-looking risk identification.
As of 1 January 2014, our Operational Risk Control unit merged with the compliance function to manage the Group’s compliance, conduct and operational risks in a more integrated and effective way. The new function will continue to report to the Group Chief Risk Officer and will continue to manage, implement and enhance the operational risk framework.
Sources of operational risk
Operational risk is an inevitable consequence of being in business and managing it is a core element of our business activities. Our aim is to provide a framework that supports the identification and assessment of material operational risks and their potential concentrations, in order to achieve an appropriate balance between risk and reward.
Operational risk framework
The business division Chief Executive Officers and Corporate Center function heads are ultimately accountable for the effectiveness of operational risk management and for the implementation of our operational risk framework. The business division Chief Executive Officers are responsible for establishing and maintaining an effective front-to-back control environment, notwithstanding the delegation of those responsibilities to the business division Chief Operating Officers. Management in all functions (business, logistics and control functions) are responsible for establishing an appropriate operational risk management environment, including the establishment and maintenance of robust internal controls, effective supervision and a strong risk culture. Controls must be regularly assessed for design and operating effectiveness and supported by positive demonstrable evidence.
Operational Risk Control provides an independent and objective view of the adequacy of operational risk management across the Group. It is governed by the Operational Risk Management Committee, which is chaired by the Global Head of Operational Risk Control, who reports to the Group Chief Risk Officer and is a member of the Risk Executive Committee. The Operational Risk Management Committee oversees operational risk activities and work streams, provides oversight of the implementation and refinement of the operational risk framework and ensures an effective and independent assessment of the operational risk profile.
The operational risk framework describes general requirements for managing and controlling operational risk at UBS. The refinement of the operational risk framework was the key focus during 2013, building on the main elements previously established. The framework is built on four main pillars:
| 1. | classification of inherent risks through the operational risk taxonomy; |
| 2. | assessment of the design and operating effectiveness of controls through the internal control assessment process; |
| 3. | assessment of residual risk through the operational risk assessment process and |
| 4. | remediation to address identified deficiencies which are outside accepted levels of residual risk. |
210
|
Risk, treasury and capital management |
|
|
The operational risk taxonomy provides a clear and logical classification of our inherent operational risks, across all business divisions. The operational risk framework requires that each category of the operational risk taxonomy is supported by clearly defined core controls. Core controls are the high-level critical controls that, if designed and operating effectively, will materially ensure that our operational risk profile stays within acceptable levels. The completeness of core controls is tested using scenarios through which the inherent risk, including stress and tail risk, may materialize. To support the core controls, functions are required to identify key procedural controls relevant to their activities. Full implementation and integration of scenarios, core and key procedural controls is key to ensuring a comprehensive view of residual risk in the organization. A review of these elements is achieved through a quarterly internal control assessment process that requires functions to assess and evidence operating and design effectiveness of their key procedural controls. This also forms the basis for the assessment and testing of the controls which oversee financial reporting as required by the Sarbanes-Oxley Act, section 404 (SOX 404). The enhanced framework facilitates the identification of SOX 404 relevant controls for independent testing, functional assessments, gathering of evidence, management affirmation and remediation tracking.
To further enhance and strengthen the operational risk framework, a program of independent management testing for key procedural controls commenced in 2013. The program is testing all key procedural controls in the areas with the highest levels of inherent risk in addition to those relevant for SOX 404, with full front-to-back business engagement.
Significant control deficiencies that surface during the internal control and operational risk assessment processes must be reported in the operational risk inventory and sustainable remediation must be instigated. All significant issues are assigned to owners at senior management level and must be reflected in the respective employees’ annual performance measurement and management objectives to ensure effective, sustainable remediation.
The aggregated impact of control deficiencies and the adequacy of remediation efforts are assessed by Operational Risk Control for all relevant operational risk taxonomy categories as part of the operational risk assessment process. This front-to-back process, complemented by internal subject matter expertise, provides a transparent assessment of the current operational risk exposure against agreed risk appetite statements and measures.
Risk appetite measures indicate a breach of operational risk appetite limits, which requires management to adapt their business activities or adjust the internal control environment accordingly. Risk appetite can be expressed through the establishment of quantitative constraints such as operating limits or qualitative statements in the form of policies. To assist with prioritization of all known operational risk issues, irrespective of origin, a common rating methodology is adopted by all internal control functions and both internal and external audit. Assessment of all known issues irrespective of source against the same rating scale sup-
ports clear prioritization and appropriate management focus on the key issues. Group Internal Audit applies an enhanced assurance process to issue closure to promote stronger management discipline for identifying, mitigating and sustainably remediating operational risk issues. As described in the “Risk principles and risk culture” section, we have policies and initiatives in place to embed the desired risk culture within the Group and have taken steps in 2013 to strengthen our culture further, re-emphasizing the importance of a strong control culture and individual responsibility across all levels of the Group.
Advanced measurement approach model
The operational risk framework is aligned to and underpins the calculation of capital, representing a major step forward in our approach in quantifying operational risk and setting effective management incentives. The processes detailed above are integral to the quantification of operational risk, which reinforces integration and alignment of the operational risk framework and the calculation of capital.
We measure operational risk exposure and calculate operational risk regulatory capital by utilizing the advanced measurement approach (AMA) in accordance with FINMA requirements. For regulated subsidiaries, the basic indicator or standardized approaches are adopted as agreed with local regulators. Regulatory requirements are currently leading to the implementation of AMA models in UBS locations.
The AMA model consists of a backward-looking historical component and a forward-looking scenario component. The historical component is a retrospective view based on our history of
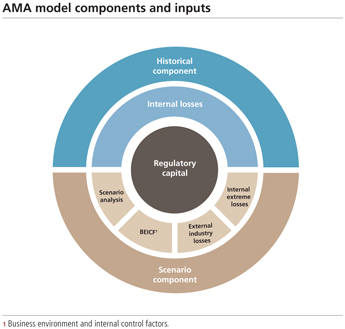
211
Risk, treasury and capital management
Risk management and control
operational risk losses since January 2002, excluding extreme internal losses, which are captured through the scenario component. The key assumption within the historical component is that past events form a reasonable proxy for future events. A distribution of aggregated losses over one year is derived by modeling severities and frequencies separately and then combining them. This is referred to as a loss distribution approach and is used to project future total losses based on historical experience and determine the expected loss portion of our capital requirement.
The scenario component is a forward-looking view of potential operational losses that may occur taking into account the operational risk issues facing the Group. The aim is to reach a reasonable estimate of unexpected or tail loss exposure (corresponding to a low frequency / high severity event). We use 20 AMA taxonomy categories which are aligned to the operational risk taxonomy. For each of these categories three frequency / severity pairs are defined, representing the base, stress and worst case. Calibration is based on internal extreme losses, loss data from peer banks, business environment and internal control factors, as well as extensive annual verification by internal subject matter experts. Qualitative adjustments to the parameters of the scenario component utilize the assessments of operational risk exposure resulting from the operational risk assessment process as well as control deficiencies, scenarios and core controls. The chart on the previous page provides a high-level overview of the model components and their respective inputs into the calculation.
The AMA model adds the sampled losses from the historical and the scenario component to derive the regulatory capital figure which equals the 99.9% quantile of the overall loss distribution. Currently, we do not reflect mitigation through insurance or any other risk transfer mechanism in our AMA model.
In 2013, there were no methodological changes to our AMA model. Developments focused on enhancing the benchmarking framework and analysis to support the plausibility of AMA model results and establishing granular reporting of operational risk ex-
posure by event type (i.e., AMA taxonomy) and business lines. Further progress has been made in the adaptation of the Group’s AMA model to support local and regional entity-specific regulatory requirements and ensuring a consistent approach for the measurement of operational risk globally.
Operational risk regulatory capital continued to be allocated to the business divisions based on historical operational risk-related losses. In 2013, we concentrated on developing and improving the current capital allocation methodology to strengthen the linkage between the quality of operational risk management and the resulting capital allocation to promote and incentivize excellence in risk management behavior. This enhanced capital allocation methodology is planned to be introduced in early 2014.
At the end of the third quarter, we received an order from FINMA announcing the imposition, with effect from 1 October 2013, of a temporary 50% add-on to our AMA based operational risk-related RWA in relation to known or unknown litigation, compliance and other operational risk matters. During the fourth quarter of 2013 and in January of 2014, UBS and FINMA reviewed this temporary operational risk-related RWA add-on and mutually agreed that, effective on 31 December 2013, a supplemental analysis would be used to calculate the incremental operational risk capital required to be held for litigation, regulatory and similar matters and other contingent liabilities. The incremental RWA calculated based upon this supplemental analysis replaced the temporary operational risk-related RWA add-on, and is reflected in the 31 December 2013 RWA and capital ratio information in this report. The incremental RWA calculated based upon this supplemental analysis as of 31 December 2013 was CHF 22.5 billion, approximately CHF 5 billion less than the incremental RWA determined as of 1 October 2013 under the previously disclosed 50% operational risk add-on.
| | è | | Refer to the “Capital management” section of this report for more information on the development of risk-weighted assets for operational risk |
212
|
Risk, treasury and capital management |
|
|
Corporate Center – Non-core and Legacy Portfolio
During 2013, Non-core and Legacy Portfolio balance sheet assets declined by CHF 218 billion to CHF 211 billion, a 51% reduction, mainly due to a CHF 170 billion reduction in positive replacement values (PRV) and, to a lesser extent, a CHF 39 billion reduction in funded assets along with a CHF 9 billion reduction in collateral delivered against over-the-counter (OTC) derivatives.
Risk-weighted assets (RWA) for Non-core and Legacy Portfolio declined by CHF 39 billion to CHF 64 billion from CHF 103 billion, significantly below our target of CHF 85 billion for year-end 2013 despite increased operational risk RWA mainly resulting from the supplemental operational risk capital analysis mutually agreed to by UBS and FINMA.
Non-core
Beginning in the first quarter of 2013, the non-core businesses formerly in the Investment Bank were transferred to Corporate Center – Non-core, and they are now managed and reported in that unit. These positions are capital- and balance sheet-intensive or are in areas with high operational complexity and long tail risks. Non-core consists of a large number of positions previously originated mainly within the Investment Bank’s rates and credit businesses. The majority of Non-core positions consist of OTC derivatives reported as replacement values on UBS’s balance sheet. In contrast to the Legacy Portfolio, credit risk from counterparty exposures in Non-core is well-diversified by both currency and geography, and single-name exposures are limited. Over 95% of gross PRV was collateralized as of 31 December 2013. Overall market risk is hedged and primarily relates to liquid market parameters such as interest rates and foreign currencies.
Non-core balance sheet assets decreased by CHF 204 billion to CHF 185 billion as of 31 December 2013, mainly due to lower PRV which declined by CHF 161 billion. This decrease came primarily from a reduction in OTC derivative exposures by means of negotiated bilateral settlements with specific counterparties, (i.e., unwinds), third-party novations, including transfers to central clearing houses, (i.e., trade migrations), agreements to net down trades with other dealer counterparties, (i.e., trade compressions), as well as, to a lesser extent, fair value changes due to interest
rate movements. Funded assets decreased by CHF 33 billion, primarily from the exit of government and other liquid bond positions along with the sale of a portfolio of distressed assets. Remaining funded asset positions are largely corporate loans and bonds held to hedge OTC positions. Lastly, collateral delivered against OTC derivatives declined by CHF 9 billion. Funded assets and PRV classified as Level 3 in the fair value hierarchy totaled CHF 3 billion, or 2%, of total Non-core balance sheet assets as of 31 December 2013.
Non-core RWA totaled CHF 33 billion as of 31 December 2013, a decrease of CHF 32 billion compared with 31 December 2012, due to ongoing RWA reduction activity resulting in a CHF 21 billion decrease in credit risk and a CHF 10 billion decrease in market risk RWA.
Legacy Portfolio
The Legacy Portfolio was created in the fourth quarter of 2011 and comprises positions previously originated in the Investment Bank. It also included our option to acquire the equity of the SNB StabFund, which we exercised during the fourth quarter of 2013. The majority of Legacy Portfolio positions are relatively concentrated and illiquid.
Legacy Portfolio balance sheet assets decreased by CHF 14 billion to CHF 25 billion during 2013. PRV decreased by CHF 8 billion, which included the impact of the exercise of our option to acquire the equity of the SNB StabFund. Funded assets decreased by CHF 6 billion, which included sales and redemptions of student loan auction rate securities. Funded assets and PRV classified as Level 3 in the fair value hierarchy totaled CHF 4 billion, or 16%, of total Legacy Portfolio balance sheet assets as of 31 December 2013.
Legacy Portfolio RWA totaled CHF 31 billion as of 31 December 2013, a decrease of CHF 7 billion compared with 31 December 2012 due to a CHF 17 billion combined reduction in credit risk and market risk RWA, which was partly offset by a CHF 10 billion increase in operational risk RWA, mainly resulting from the aforementioned supplemental operational risk capital analysis mutually agreed to by UBS and FINMA.
213
Risk, treasury and capital management
Risk management and control
An overview of the composition of Non-core and Legacy Portfolio is presented below and on the following page, including position and RWA information for the current and prior year. The groupings of positions by exposure category and the order in which these are listed are not necessarily representative of the magnitude of the risks associated with them, nor do the metrics shown in the tables necessarily represent the risk measures used to manage and control these positions. For example, OTC derivatives trading is largely conducted on a collateralized basis and under
bilateral International Swaps and Derivatives Association (ISDA) or ISDA-equivalent master netting agreements, which allow for the close-out and netting of PRV with negative replacement values in the event of default. The funded assets and PRV measures presented are intended to provide additional transparency regarding progress in the execution of our strategy to exit these positions. All positions, primarily PRV, are affected by market factors outside the control of UBS, for example, by interest rate movements.
Composition of Non-core
CHF billion
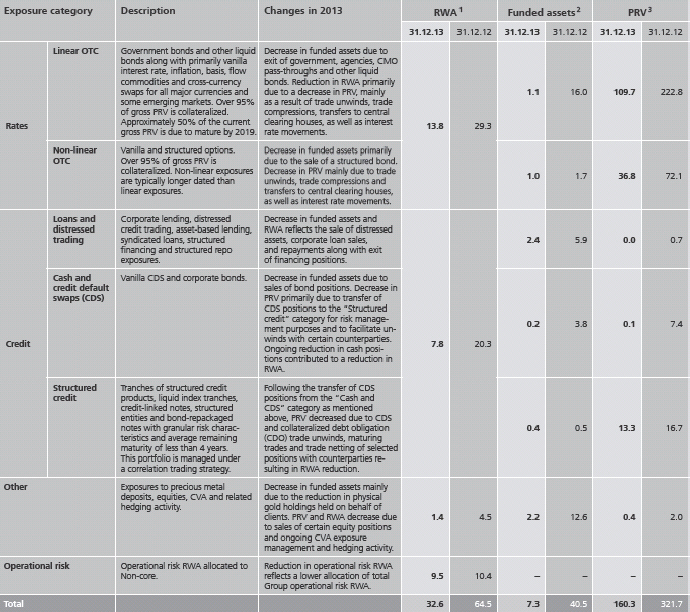
1 Phase-in and fully applied Basel III RWA. 2 Funded assets are defined as total IFRS balance sheet assets less positive replacement values (PRV) and collateral delivered against over-the-counter (OTC) derivatives (CHF 17.4 billion as of 31.12.13 and CHF 26.5 billion as of 31.12.12). 3 Positive replacement values (gross exposure excluding the impact of any counterparty netting).
214
|
Risk, treasury and capital management |
|
|
Composition of Legacy Portfolio
CHF billion
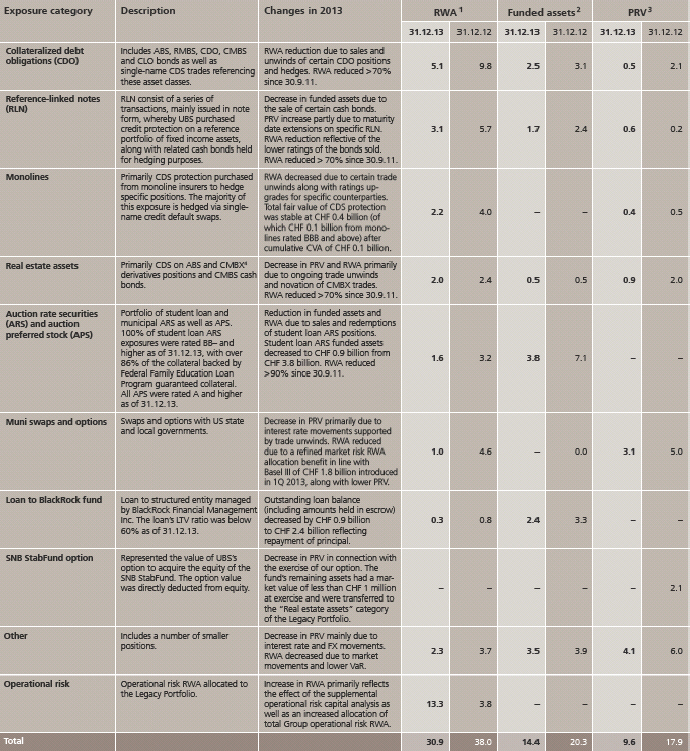
1 Phase-in and fully applied Basel III RWA. 2 Funded assets are defined as total IFRS balance sheet assets less positive replacement values (PRV) and collateral delivered against over-the-counter (OTC) derivatives (CHF 1.5 billion as of 31.12.13 and CHF 1.7 billion as of 31.12.12). 3 Positive replacement values (gross exposure excluding the impact of any counterparty netting). 4 Index of CMBS.
215
Risk, treasury and capital management
Treasury management
Treasury management
Liquidity and funding management
| | | | |
| | Strategy and objectives As described more fully in the “Our strategy” section of this report, we are continuing in our commitment to focus our activities on a set of highly synergistic, less capital- and balance sheet-intensive businesses dedicated to serving clients and well-positioned to maximize value for shareholders. This is reflected in the substantial progress we have made in further improving our leading capital position and in reducing risk-weighted assets (RWA). |
| | We manage our liquidity and funding risk with the overall objective of optimizing the value of our business franchise across a broad range of temporal market conditions and in consideration of current and future regulatory constraints. In line with the implementation of our strategy, as our balance sheet assets are reduced we generate capacity within our liquidity and funding positions. This reduction in our funding needs has enabled us to execute tender offers to repurchase certain outstanding long-term debt in 2013, which lowers our interest expense and allows us to optimize our funding liability structure for the future. Our liquidity risk management aims to maintain a sound liquidity position to meet all our liabilities when due and to provide adequate time and financial flexibility to respond to a firm-specific liquidity crisis in a generally stressed market environment, without incurring unacceptable losses or risking sustained damage to our various businesses. Complementing this, our funding risk management aims for the optimal asset and liability structure to finance our businesses reliably and cost-efficiently. We employ a number of measures to monitor our liquidity and funding positions under normal and stressed conditions. Our primary tool for cash management is an operational cash ladder, which is used to monitor our funding requirements on a daily basis, within limits set by the Group Asset and Liability Management Committee (Group ALCO), the Group Chief Financial Officer (Group CFO) and the Group Treasurer. This cumulative cash ladder shows the projected net cumulative funding requirement for a specific day, from the current day to three months forward. We then use stress scenarios to apply behavioral adjustments and calibrate the results with external measures, primarily the evolving regulatory requirements for the Liquidity Coverage Ratio (LCR) and the Net Stable Funding Ratio (NSFR). |
| | As of 31 December 2013, our estimated pro-forma regulatory Basel III LCR based on current supervisory guidance from FINMA |
| | | | |
| | was 110% and our management LCR, which includes additional available funding not eligible under the Basel III LCR framework, was 148%. Based on current regulatory guidance, our estimated pro-forma NSFR was 109% as of 31 December 2013. The Basel Committee on Banking Supervision issued a Consultative Document on the NSFR in January 2014. è Refer to the “Regulatory and legal developments” section of this report for more information We continued to maintain a sound liquidity position throughout the year. As of 31 December 2013, our liquidity asset buffer, that is derived from high-quality liquid assets (HQLA) and supports our estimated pro-forma regulatory LCR, was CHF 153 billion, with additional available funding of CHF 54 billion. In aggregate, these sources of available liquidity represented 28% of our funded balance sheet assets. The remainder of this section provides more detailed information on our liquidity and funding management including our sources of funding and liquidity, our contingency planning and stress testing, current and potential future regulatory requirements and our governance structure. Funding |
| | Our business activities generate asset and liability portfolios that are highly diversified with respect to market, product, tenor and currency. This reduces our exposure to individual funding sources and provides a broad range of investment opportunities, reducing liquidity risk. |
| | Our wealth management businesses and Retail & Corporate provide significant, cost-efficient and reliable sources of funding. These include core deposits and pledging a portion of our portfolio of Swiss residential mortgages as collateral to generate long-term funding through Swiss Pfandbriefe and our own covered bond program. In addition, we have a number of short-, medium- and long-term funding programs under which we issue senior unsecured and structured notes, as well as short-term secured debt – generally for the highest-quality assets. These programs allow institutional and private investors in Europe, the US and Asia Pacific to customize their investments in UBS’s debt. Collectively, these broad product offerings and funding sources, together with the global scope of our business activities, support our funding stability. |
216
|
Risk, treasury and capital management |
|
|
UBS: funding by product and currency
| | | | | | | | | | | | | | | | | | | | | | | | | | | | | | | | | | | | | | | | | | | | | | | | |
| | In CHF billion | | | | | | | |
| | All currencies | | | All currencies1 | | | CHF1 | | | EUR1 | | | USD1 | | | Others1 | |
| | | | 31.12.13 | | | | 31.12.12 | | | | 31.12.13 | | | | 31.12.12 | | | | 31.12.13 | | | | 31.12.12 | | | | 31.12.13 | | | | 31.12.12 | | | | 31.12.13 | | | | 31.12.12 | | | | 31.12.13 | | | | 31.12.12 | |
| Securities lending | | | 9.5 | | | | 9.2 | | | | 1.4 | | | | 1.2 | | | | 0.3 | | | | 0.4 | | | | 0.3 | | | | 0.2 | | | | 0.6 | | | | 0.5 | | | | 0.2 | | | | 0.2 | |
| Repurchase agreements | | | 13.8 | | | | 38.6 | | | | 2.1 | | | | 5.2 | | | | 0.0 | | | | 0.1 | | | | 0.5 | | | | 1.1 | | | | 1.3 | | | | 3.3 | | | | 0.3 | | | | 0.6 | |
| Due to banks | | | 12.9 | | | | 23.0 | | | | 1.9 | | | | 3.1 | | | | 0.5 | | | | 0.5 | | | | 0.2 | | | | 0.2 | | | | 0.7 | | | | 0.7 | | | | 0.6 | | | | 1.6 | |
| Short-term debt issued2 | | | 27.6 | | | | 32.5 | | | | 4.2 | | | | 4.3 | | | | 0.3 | | | | 0.3 | | | | 0.2 | | | | 0.8 | | | | 3.2 | | | | 2.7 | | | | 0.5 | | | | 0.6 | |
| Retail savings / deposits | | | 143.1 | | | | 134.3 | | | | 21.7 | | | | 18.0 | | | | 13.6 | | | | 11.8 | | | | 1.0 | | | | 0.8 | | | | 7.1 | | | | 5.4 | | | | 0.0 | | | | 0.0 | |
| Demand deposits | | | 179.0 | | | | 163.0 | | | | 27.1 | | | | 21.8 | | | | 8.9 | | | | 8.0 | | | | 5.4 | | | | 4.1 | | | | 8.9 | | | | 6.4 | | | | 3.9 | | | | 3.2 | |
| Fiduciary deposits | | | 21.5 | | | | 25.0 | | | | 3.3 | | | | 3.3 | | | | 0.1 | | | | 0.1 | | | | 0.6 | | | | 0.8 | | | | 2.2 | | | | 2.0 | | | | 0.4 | | | | 0.5 | |
| Time deposits | | | 47.3 | | | | 51.3 | | | | 7.2 | | | | 6.9 | | | | 0.4 | | | | 0.2 | | | | 0.3 | | | | 0.5 | | | | 4.0 | | | | 3.7 | | | | 2.5 | | | | 2.5 | |
| Long-term debt issued3 | | | 123.9 | | | | 164.2 | | | | 18.8 | | | | 22.0 | | | | 3.0 | | | | 2.7 | | | | 5.6 | | | | 7.3 | | | | 7.9 | | | | 9.0 | | | | 2.2 | | | | 2.9 | |
| Cash collateral payables on derivative instruments | | | 49.1 | | | | 71.1 | | | | 7.4 | | | | 9.5 | | | | 0.3 | | | | 0.3 | | | | 3.4 | | | | 5.0 | | | | 2.8 | | | | 3.2 | | | | 0.9 | | | | 0.9 | |
| Prime brokerage payables | | | 32.5 | | | | 35.6 | | | | 4.9 | | | | 4.8 | | | | 0.0 | | | | 0.1 | | | | 0.7 | | | | 0.5 | | | | 3.3 | | | | 3.3 | | | | 0.8 | | | | 0.8 | |
| Total | | | 660.2 | | | | 747.7 | | | | 100.0 | | | | 100.0 | | | | 27.3 | | | | 24.6 | | | | 18.3 | | | | 21.4 | | | | 42.0 | | | | 40.1 | | | | 12.4 | | | | 13.9 | |
| | | | | | | | | | | | | | | | | | | | | | | | | | | | | | | | | | | | | | | | | | | | | | | | | |
1 As a percent of total funding sources. 2 Short-term debt issued is comprised of deposit, commercial paper, acceptances and promissory notes, and other money market papers. 3 Long-term debt issued also includes debt with a remaining time to maturity of less than one year.
| | | | |
| | Funding management |
| | Group Treasury regularly monitors our funding status, including concentration risks, to ensure we maintain a well-balanced and diversified liability structure. Our funding activities are planned by analyzing the overall liquidity and funding profile of our balance sheet, taking into account the amount of stable funding that would be needed to support ongoing business activities through periods of difficult market conditions. |
217
Risk, treasury and capital management
Treasury management
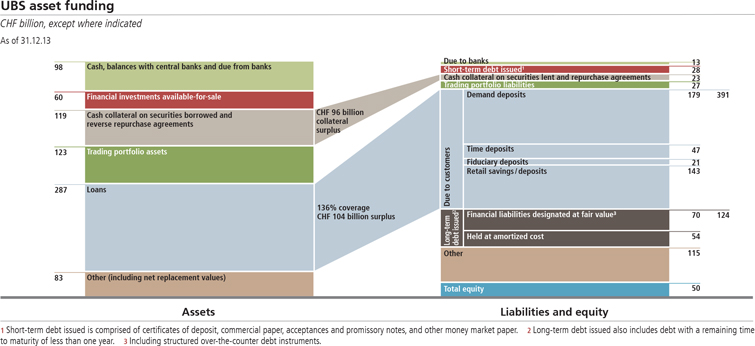
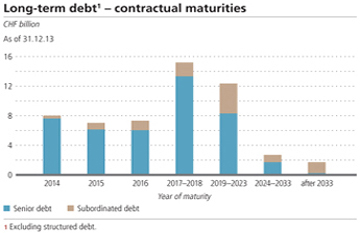
Changes in sources of funding during the reporting period
During 2013, the composition of our funding sources moved towards less reliance on wholesale funding. The implementation of our strategy has driven a reduction in secured funding needs, as well as lower issuances of short-term and structured debt and the repurchase of unsecured debt. At the same time, our Retail & Corporate and wealth management businesses continued to attract new customer deposits. In 2013, total customer deposits increased to CHF 391 billion from CHF 374 billion, or 59% of our total funding sources compared with 50% as of 31 December 2012. Our ratio of customer deposits to outstanding loan bal-
ances was 136%, compared with 133% as of 31 December 2012.
In contrast, our outstanding long-term debt, including structured debt reported as financial liabilities at fair value, decreased by CHF 40 billion to CHF 124 billion as of 31 December 2013, representing 19% of our funding sources compared with 22% as of 31 December 2012. Excluding structured debt, long-term debt – which comprises senior debt and subordinated debt and is presented withinDebt issued on the balance sheet – decreased to CHF 54.0 billion as of 31 December 2013 from CHF 72.3 billion as of 31 December 2012, primarily due to decreases in senior debt to CHF 43.0 billion from CHF 61.0 billion. Senior debt comprises both publicly and privately placed notes and bonds, as well as covered bonds. As shown on the long-term debt contractual maturity chart, CHF 8.0 billion will mature within one year, representing 15% of outstanding long-term debt excluding structured debt, compared with CHF 13.9 billion, or 19%, in the prior year. In addition, CHF 0.5 billion of subordinated debt has an early call date in 2014.
As part of our reduction in wholesale funding, we successfully completed two cash tender offers during 2013 to repurchase certain subordinated and senior unsecured bonds. In February 2013, we executed a cash tender offer to repurchase 14 senior unsecured note issuances denominated in US dollar, euro and Italian lira, with remaining maturities ranging between June 2013 and January 2027, for a total repurchase amount equivalent to CHF 5.1 billion. In December 2013, we executed a cash tender offer to repurchase certain subordinated and senior unsecured bonds denominated in Swiss franc, euro, British pound and Italian lira, with an aggregate principal repurchase amount equivalent to CHF 1.9 billion.
218
|
Risk, treasury and capital management |
|
|
| | | | |
| | During the year, we continued to raise medium- and long-term funds through medium-term notes and private placements and through Swiss Pfandbriefe issuances with a principal amount of CHF 1.5 billion, as well as a USD 1.25 billion three-year covered bond. We also contributed to our targeted loss-absorbing capital by executing a USD 1.5 billion issuance of loss-absorbing Basel III-compliant tier 2 subordinated notes. These 10-year notes with an optional call at year five will pay a non-deferrable coupon at an initial rate of 4.75%. In February 2014, we issued further loss-absorbing Basel III-compliant tier 2 subordinated notes: EUR 2 billion notional with 12-year duration and an optional call in year seven and which will pay a non-deferrable coupon at an initial rate of 4.75%. Our short-term interbank deposits (presented asDue to bankson the balance sheet), together with our outstanding short-term debt, represented 6.1% of total funding sources compared with 7.4% as of 31 December 2012. Secured financing, in the form of repurchase agreements and securities lent against cash collateral received, represented 3.5% of our funding sources as of 31 December 2013 compared with 6.4% as of 31 December 2012. As of 31 December 2013, we were borrowing CHF 87 billion less cash on a collateralized basis than we were lending, significantly lower than the difference of CHF 121 billion as of 31 December 2012. Liquidity management, contingency funding and stress testing |
| | Our Group contingency funding plan is an integral part of our global crisis management concept, which covers various types of crisis events. This contingency funding plan contains an assessment of contingent funding sources in a stressed environment, liquidity status indicators and metrics and contingency procedures. Our funding diversification and global scope help protect our liquidity position in the event of a crisis. We regularly assess and test all material, known and expected cash flows, as well as the level and availability of high-grade collateral that could be used to raise additional funding if required. Our contingent funding sources include a large, multi-currency portfolio of unencumbered, high-quality, short-term assets managed centrally by Group Treasury, available and unutilized liquidity facilities at several major central banks, and contingent reductions of liquid trading portfolio assets. |
| | | | |
| | The table below shows a breakdown of our liquidity asset buffer derived from high-quality liquid assets (HQLA) that support our regulatory LCR pro-forma calculation, analyzed by asset type, balance sheet carrying value and LCR eligible amount. In accordance with the Basel Committee on Banking Supervision’s guidance issued in January 2013, HQLA comprise unencumbered cash or assets that can be converted into cash at little or no loss of value in private markets to meet liquidity needs for a 30-calendar-day liquidity stress scenario. HQLA are eligible for inclusion as our liquidity asset buffer component of the LCR after applying certain haircuts and caps, dependent on whether the assets are categorized as Level 1 (fair values based on quoted prices in actively traded markets) or Level 2 (fair values based on valuation techniques for which all significant inputs are, or are based on, observable market data) in accordance with the aforementioned Basel guidance. As of 31 December 2013, our HQLA were CHF 157 billion and our liquidity asset buffer was CHF 153 billion. Our liquidity asset buffer was also CHF 153 billion as of 31 December 2012. The monthly average for 2013 was CHF 151 billion. In addition to the liquidity asset buffer component of the regulatory LCR, for our management LCR we include additional high-quality and unencumbered contingent funding sources not eligible under the regulatory Basel III liquidity framework, primarily local funding reserves and unutilized funding capacity. è Refer to “Liquidity regulatory requirements” in this section for more information |
| | We perform stress testing to determine the optimum asset and liability structure that allows us to maintain an appropriately balanced liquidity and funding position under various scenarios. Liquidity crisis scenario analysis and contingency funding planning support the liquidity management process, which ensures that immediate corrective measures to absorb potential sudden liquidity shortfalls can be put into effect. |
| | We model our liquidity exposures under two main potential scenarios that encompass stressed and acute market conditions, including considering the possible impact on our access to markets from stress events affecting all parts of our business. The acute scenario represents an extreme stress event that combines a firm-specific crisis with market disruption. This scenario assumes large drawdowns on otherwise stable client deposits mainly due on demand, inability to renew or replace maturing |
Composition of liquidity asset buffer component of our regulatory Liquidity Coverage Ratio
| | | | | | | | | | | | | | | | |
As of 31.12.13 | | | | | of which Basel III LCR eligible: | | | Liquidity asset
buffer | |
| CHF billion | | High-quality
liquid assets | | | Level 1 | | | Level 2 | | | Total | |
| Cash and deposits with central banks | | | 80.1 | | | | 80.1 | | | | 0.0 | | | | 80.1 | |
| Central bank pledges | | | 28.3 | | | | 16.2 | | | | 10.3 | | | | 26.5 | |
| Government bills / bonds | | | 31.9 | | | | 31.9 | | | | 0.0 | | | | 31.9 | |
| Corporate bonds, including covered bonds issued by financial institutions | | | 15.0 | | | | 0.6 | | | | 12.3 | | | | 12.9 | |
| Reverse repurchase agreements | | | 1.8 | | | | 0.0 | | | | 1.6 | | | | 1.6 | |
| | | | | | | | | | | | | | | | | |
| Total | | | 157.1 | | | | 128.7 | | | | 24.1 | | | | 152.8 | |
| | | | | | | | | | | | | | | | | |
219
Risk, treasury and capital management
Treasury management
unsecured wholesale funding, unusually large drawdowns on loan commitments, reduced capacity to generate liquidity from trading assets, liquidity outflows corresponding to a three-notch downgrade triggering contractual obligations to unwind derivative positions or to deliver additional collateral and additional collateral needs due to adverse movements in the market values of derivatives. It is run both daily and monthly, with the former used to project potential cash outflows over a one-month time horizon for day-to-day risk management, while the latter involves a more detailed assessment of asset and liability cash flows.
Since a liquidity crisis could have a myriad of causes, the stressed scenario encompasses potential stress effects across all markets, currencies and products but it is not typically firm-specific and focuses on a time horizon of up to one year. As well as the loss of ability to replace maturing wholesale funding, it assumes a gradual drawdown of otherwise stable client deposits and liquidity outflows corresponding to a two-notch downgrade.
We also use a cash capital model which measures the amount of long-term funding available to fund illiquid assets. The illiquid portion of assets is the difference (the haircut) between the carrying value of an asset on the balance sheet and its effective cash value when used as collateral in a secured funding transaction. Long-term funding used as cash capital to support illiquid assets comprises unsecured funding with a remaining time to maturity of at least one year, shareholders’ equity and core deposits (the portion of our customer deposits that are deemed to have a behavioral maturity of at least one year).
All these models and their assumptions are reviewed regularly to incorporate the latest business and market developments. We continuously refine the assumptions used in our crisis scenario and maintain a robust, actionable and tested contingency plan.
Asset encumbrance
Part of our future funding and collateral needs are supported by assets currently available and unrestricted. The table on the next page presents both total IFRS on-balance sheet assets and off-balance sheet assets received as collateral, allocating those amounts between those assets that are available and those assets that are encumbered or otherwise not available to support future funding and collateral needs.
Assets are presented asEncumbered if they have been pledged as collateral against an existing liability or if they are otherwise restricted in their use to secure funding. Included within the latter category are assets protected under client asset segregation rules, assets held by the Group’s insurance entities to back related liabilities to the policy holders, assets held in certain jurisdictions to comply with explicit minimum local asset maintenance requirements and assets held in consolidated bankruptcy remote entities, such as certain investment funds and other structured entities.
| | è | | Refer to “Note 25 Restricted and transferred financial assets” in the “Financial information” section of this report for more information |
Assets which cannot be pledged as collateral represents those assets which are not encumbered but which, by their nature, are not considered available to secure funding or to meet collateral needs. These mainly include secured financing receivables, positive replacement values for derivatives, goodwill and intangible assets.
All other assets are presented asUnencumbered. Shown separately are those assets that are considered to be readily available to secure funding or to meet collateral needs, consisting of cash and securities readily realizable in the normal course of business. These include cash and deposits with central banks, our multi-currency portfolio of unencumbered, high-quality, short-term assets managed centrally by Group Treasury and unencumbered positions in our trading portfolio. The majority of unencumbered assets not considered readily available are loans. This category also includes assets held by certain subsidiaries that are available to meet funding and collateral needs in certain jurisdictions which are not readily available for use by the Group as a whole.
Credit ratings
Credit ratings can affect the cost and availability of funding, especially funding from wholesale unsecured sources. Our credit ratings can also influence the performance of some of our businesses and levels of client and counterparty confidence. Rating agencies take into account a range of factors when assessing creditworthiness and setting credit ratings. These include the company’s strategy, its business position and franchise value, stability and quality of earnings, capital adequacy, risk profile and management, liquidity management, diversification of funding sources, asset quality and corporate governance. Credit ratings reflect the opinions of the rating agencies and can change at any time.
In evaluating our liquidity requirements, we consider the potential impact of a reduction in UBS’s long-term credit ratings and a corresponding reduction in short-term ratings. If our credit ratings were to be downgraded, “rating trigger” clauses, especially in derivative transactions, could result in an immediate cash outflow due to the unwinding of derivative positions, the need to deliver additional collateral or other ratings-based requirements. Based on UBS’s credit ratings as of 31 December 2013, contractual liquidity outflows of approximately CHF 3.3 billion, CHF 5.0 billion and CHF 5.1 billion would have been required in the event of a one-notch, two-notch and three-notch reduction, respectively. Of these outflows, the portion related to derivative transactions is approximately CHF 1.4 billion, CHF 3.0 billion and CHF 3.2 billion, respectively.
Liquidity regulatory requirements
In December 2010, the Basel Committee on Banking Supervision (BCBS) published its “International framework for liquidity risk measurement, standards and monitoring” (Basel III Liquidity). The framework includes two liquidity ratios: the Liquidity Coverage Ratio (LCR) and the Net Stable Funding Ratio (NSFR). In January 2014, the BCBS published its final LCR requirements and issued a
|
Risk, treasury and capital management |
|
|
Asset encumbrance
| | | | | | | | | | | | | | | | | | | | | | | | | | | | |
| | | | | | Encumbered | | | Unencumbered | | | Assets which | | | Percentage | |
| CHF million | | Total Group
assets (IFRS) | | | Assets pledged
as collateral | | | Assets otherwise
restricted to use to
secure funding | | | Cash and
securities
available to
secure funding | | | Other
realizable
assets | | | cannot be pledged as
collateral | | | of cash and securities
available to
secure funding | |
| Balance sheet as of 31 December 2013 | | | | | | | | | | | | | | | | | | | | | | | | | | | | |
| Cash and balances with central banks | | | 80,879 | | | | 0 | | | | 2 | | | | 71,984 | | | | 8,893 | | | | 0 | | | | 32% | |
Due from banks | | | 17,170 | | | | 0 | | | | 6,570 | | | | 0 | | | | 10,192 | | | | 407 | | | | 0% | |
| | | | | | | | | | | | | | | | | | | | | | | | | | | | | |
Financial assets designated at fair value | | | 7,364 | | | | 0 | | | | 581 | | | | 0 | | | | 1,743 | | | | 5,041 | | | | 0% | |
| | | | | | | | | | | | | | | | | | | | | | | | | | | | | |
Loans | | | 286,959 | | | | 33,632 | | | | 0 | | | | 931 | | | | 251,734 | | | | 661 | | | | 0% | |
| | | | | | | | | | | | | | | | | | | | | | | | | | | | | |
of which: mortgage loans | | | 160,050 | | | | 33,632 | | | | 0 | | | | 0 | | | | 126,418 | | | | 0 | | | | 0% | |
| Lending | | | 311,492 | | | | 33,632 | | | | 7,150 | | | | 931 | | | | 263,669 | | | | 6,109 | | | | 0% | |
Cash collateral on securities borrowed | | | 27,496 | | | | 0 | | | | 0 | | | | 0 | | | | 0 | | | | 27,496 | | | | 0% | |
| | | | | | | | | | | | | | | | | | | | | | | | | | | | | |
Reverse repurchase agreement | | | 91,563 | | | | 0 | | | | 1,989 | | | | 0 | | | | 0 | | | | 89,574 | | | | 0% | |
| Collateral trading | | | 119,060 | | | | 0 | | | | 1,990 | | | | 0 | | | | 0 | | | | 117,070 | | | | 0% | |
| Trading portfolio assets excluding financial assets for unit-linked investment contracts | | | 106,999 | | | | 48,368 | 1 | | | 8,403 | | | | 43,600 | | | | 6,629 | | | | 0 | | | | 20% | |
of which: government bills / bonds | | | 13,061 | | | | 6,039 | | | | 1,976 | | | | 4,757 | | | | 288 | | | | 0 | | | | 2% | |
| | | | | | | | | | | | | | | | | | | | | | | | | | | | | |
of which: corporate bonds, municipal bonds, including bonds issued by financial institutions | | | 16,008 | | | | 3,924 | | | | 3,237 | | | | 7,288 | | | | 1,559 | | | | 0 | | | | 3% | |
| | | | | | | | | | | | | | | | | | | | | | | | | | | | | |
of which: loans | | | 3,033 | | | | 26 | | | | 94 | | | | 0 | | | | 2,913 | | | | 0 | | | | 0% | |
| | | | | | | | | | | | | | | | | | | | | | | | | | | | | |
of which: investment fund units | | | 11,137 | | | | 3,977 | | | | 2,243 | | | | 4,744 | | | | 173 | | | | 0 | | | | 2% | |
| | | | | | | | | | | | | | | | | | | | | | | | | | | | | |
of which: asset-backed securities | | | 3,280 | | | | 222 | | | | 0 | | | | 1,794 | | | | 1,265 | | | | 0 | | | | 1% | |
| | | | | | | | | | | | | | | | | | | | | | | | | | | | | |
of which: mortgage-backed securities | | | 1,973 | | | | 181 | | | | 0 | | | | 955 | | | | 836 | | | | 0 | | | | 0% | |
| | | | | | | | | | | | | | | | | | | | | | | | | | | | | |
of which: equity instruments | | | 51,881 | | | | 34,180 | | | | 852 | | | | 16,418 | | | | 431 | | | | 0 | | | | 7% | |
| | | | | | | | | | | | | | | | | | | | | | | | | | | | | |
of which: precious metals and other physical commodities | | | 8,599 | | | | 0 | | | | 0 | | | | 8,599 | | | | 0 | | | | 0 | | | | 4% | |
| Financial assets for unit-linked investment contracts | | | 15,849 | | | | 0 | | | | 15,849 | | | | 0 | | | | 0 | | | | 0 | | | | 0% | |
| Positive replacement values | | | 245,835 | | | | 0 | | | | 1 | | | | 0 | | | | 0 | | | | 245,834 | | | | 0% | |
| Financial investments available-for-sale | | | 59,525 | | | | 0 | | | | 44 | | | | 50,380 | | | | 9,102 | | | | 0 | | | | 23% | |
Cash collateral receivables on derivative instruments | | | 28,007 | | | | 0 | | | | 7,939 | | | | 0 | | | | 0 | | | | 20,068 | | | | 0% | |
| | | | | | | | | | | | | | | | | | | | | | | | | | | | | |
Investments in associates | | | 842 | | | | 0 | | | | 0 | | | | 0 | | | | 842 | | | | 0 | | | | 0% | |
| | | | | | | | | | | | | | | | | | | | | | | | | | | | | |
Property and equipment | | | 6,006 | | | | 0 | | | | 0 | | | | 0 | | | | 5,917 | | | | 89 | | | | 0% | |
| | | | | | | | | | | | | | | | | | | | | | | | | | | | | |
Goodwill and intangible assets | | | 6,293 | | | | 0 | | | | 0 | | | | 0 | | | | 0 | | | | 6,293 | | | | 0% | |
| | | | | | | | | | | | | | | | | | | | | | | | | | | | | |
Deferred tax assets | | | 8,845 | | | | 0 | | | | 0 | | | | 0 | | | | 0 | | | | 8,845 | | | | 0% | |
| | | | | | | | | | | | | | | | | | | | | | | | | | | | | |
Other assets | | | 20,228 | | | | 0 | | | | 167 | | | | 0 | | | | 0 | | | | 20,062 | | | | 0% | |
| Other | | | 70,221 | | | | 0 | | | | 8,106 | | | | 0 | | | | 6,759 | | | | 55,356 | | | | 0% | |
| | | | | | | | | | | | | | | | | | | | | | | | | | | | | |
| Total assets | | | 1,009,860 | | | | 82,000 | | | | 41,544 | | | | 166,895 | | | | 295,052 | | | | 424,370 | | | | 75% | |
| | | | | | | | | | | | | | | | | | | | | | | | | | | | | |
| | | | | | | | | | | | | | | | | | | | | | | | | | | | |
| | | | | | Encumbered | | | Unencumbered | | | | | | | |
| CHF million | | Fair value
of assets
received which
can be sold or
repledged | | | Fair value
of assets
received that
have been sold
or repledged
as collateral | | | Fair value
of assets received
otherwise restricted
to use to secure
funding | | | Fair value
of assets
available to
secure funding | | | Fair value
of other
realizable
assets | | | | | | | |
| Off-balance sheet as of 31 December 2013 | | | | | | | | | | | | | | | | | | | | | | | | | | | | |
| Fair value of assets received as collateral which can be sold or repledged | | | 351,712 | | | | 240,176 | | | | 28,074 | | | | 54,990 | | | | 28,471 | | | | | | | | 25 | % |
| | | | | | | | | | | | | | | | | | | | | | | | | | | | | |
| Total off-balance sheet | | | 351,712 | | | | 240,176 | | | | 28,074 | | | | 54,990 | | | | 28,471 | | | | | | | | 25 | % |
| | | | | | | | | | | | | | | | | | | | | | | | | | | | | |
| | | | | | | | | | | | | | | | | | | | | | | | | | | | |
| | | | | | | | | | | | | | | | | | | | | | | | | | | | | |
| Total balance sheet and off-balance sheet | | | | | | | 322,176 | | | | 69,618 | | | | 221,885 | | | | 323,523 | | | | 424,370 | | | | 100 | % |
| | | | | | | | | | | | | | | | | | | | | | | | | | | | | |
1 Includes CHF 42,449 million assets pledged as collateral which may be sold or repledged by counterparties.
221
Risk, treasury and capital management
Treasury management
Liquidity Coverage Ratio (LCR)
| | | | |
| CHF billion, except where indicated | | 31.12.13 | |
| Cash outflows | | | 236 | |
| | | | | |
| Cash inflows | | | 97 | |
| Net cash outflows | | | 139 | |
| | | | | |
| Liquidity asset buffer | | | 153 | |
| | | | | |
| Regulatory LCR (%) | | | 110 | |
| | | | | |
| Additional contingent funding sources1 | | | 54 | |
| | | | | |
| Management LCR (%) | | | 148 | |
| | | | | |
1 Additional contingent funding sources including dedicated local liquidity reserves and additional unutilized borrowing capacity.
Net Stable Funding Ratio (NSFR)
| | | | |
| CHF billion, except where indicated | | 31.12.13 | |
| Available stable funding | | | 346 | |
| | | | | |
| Required stable funding | | | 318 | |
| | | | | |
| NSFR (%) | | | 109 | |
| | | | | |
| | | | |
| | further Consultative Document on the NSFR. Local regulators, including the Swiss authorities, are considering how to incorporate the final LCR requirements into local regulatory guidance. Consequently, banks currently employ a wide range of interpretations to calculate LCR and NSFR. We were in compliance with FINMA’s current liquidity requirements throughout 2013. The LCR provides a measure that illustrates the extent to which a bank holds enough highly liquid assets to survive short-term (30-day) severe general market and firm-specific stress. The NSFR assigns a required stable funding factor to assets (representing the illiquid part of assets) and assigns all liabilities an available stable funding factor (representing the stability of a liability) to illustrate the extent to which a bank is not overly reliant on short-term funding and has sufficient long-term funding for illiquid assets. Based on current regulatory guidance, the future minimum regulatory requirement is 100% for both the LCR (as of 2019) and NSFR (as of 2018), with minimum quantitative requirements for Switzerland expected to be effective as of January 2015. |
| |
| | The tables above show our pro-forma Basel III liquidity ratios based on current supervisory guidance from FINMA. These calculations include estimates of the impact of the rules and their interpretation and will be refined as regulatory interpretations evolve and as new models and the associated systems are enhanced. For the LCR, cash out- and inflows are estimated for up to a 30-day period under severe general market and firm-specific stress scenarios. The liquidity asset buffer includes our dedicated Group liquidity reserve, excess cash at major central banks and unencumbered collateral pledged to central banks. A more detailed breakdown of the liquidity asset buffer and the HQLA from which it is derived is shown in the table “Composition of liquidity asset buffer component of our regulatory Liquidity Coverage Ratio” on page 219. Available stable funding for our NSFR consists mainly of |
| | | | |
| | client deposits from our wealth management businesses, long-term debt issued and capital. This source of stable funding is used primarily to support residential mortgages as well as other loans. |
| | | | |
| | Our liquidity and funding strategy is proposed by Group Treasury, approved by the Group Asset and Liability Management Committee (Group ALCO) and overseen by the Risk Committee. |
| | Group Treasury monitors and oversees the implementation and execution of our liquidity and funding strategy, and ensures adherence to our liquidity and funding policies including limits and targets, reporting the Group’s overall liquidity and funding position, including funding status and concentration risks, at least monthly to the Group ALCO and the Risk Committee. This enables close control of both our cash and collateral, including our stock of high-quality liquid securities, and ensures that the Group’s general access to wholesale cash markets is centralized in Group Treasury. In addition, should a crisis require contingency funding measures to be invoked, Group Treasury is responsible for coordinating liquidity generation with representatives of the relevant business areas. |
| | Liquidity and funding limits and targets are set at a Group and business division level, and are reviewed and reconfirmed at least once a year by the Board of Directors, the Group ALCO, the Group CFO, the Group Treasurer and the business divisions taking into consideration current and projected business strategy and risk tolerance. The principles underlying our limit and target framework aim to maximize and sustain the value of our business franchise and maintain an appropriate balance in the asset and liability structure. Structural limits and targets focus on the structure and composition of the balance sheet, while supplementary limits and |
222
|
Risk, treasury and capital management |
|
|
| | | | |
| | targets are designed to drive the utilization, diversification and allocation of funding resources. Together the limits and targets focus on liquidity and funding risk for periods out to one year, including stress testing. To complement and support this framework, Group Treasury monitors the markets with a dashboard of early warning indicators reflecting the current liquidity situation. The liquidity status indicators are used at a Group level to assess both the overall global and regional situations for potential threats. |
| | è Refer to the “Corporate governance” section of this report for more information |
| | | | |
| | Internal funding and funds transfer pricing |
| | | | |
| | We employ an integrated liquidity and funding framework to govern the liquidity management of all our branches and subsidiaries and our major sources of liquidity are channeled through entities that are fully consolidated. Group Treasury meets internal demands for funding by channeling funds from units generating surplus cash to those in need of financing. Funding costs and benefits are allocated to our business divisions and Non-core and Legacy Portfolio according to our liquidity and funding risk management framework. Our internal funds transfer pricing system is designed to provide the proper liability structure to support the assets and planned activities of each business division while minimizing cross-divisional subsidies. The funds transfer pricing mechanism aims to allocate funding and liquidity costs to the activities generating the liquidity and funding risks and deals with the movement of funds from those businesses in surplus to those that have a shortfall. Funding is internally transferred or allocated among businesses at rates and tenors that reflect each business’s asset composition, liquidity and reliable external funding. We continue to review and enhance our internal funds transfer pricing system. |
| |
| | | | |
| | Maturity analysis of assets and liabilities |
| | | | |
| | The table on the next page provides an analysis of consolidated total assets, liabilities and off-balance sheet commitments by residual contractual maturity at the balance sheet date. The contractual maturity of liabilities is based on the earliest date on which we could be required to pay and the contractual maturity of assets is based on the latest date the asset will mature. This basis of presentation differs from “Note 27b Maturity analysis of financial liabilities” in the “Financial information” section of this report, which is presented on an undiscounted basis, and the funding analysis above, for which long-term debt is presented based on original, rather than contractual maturity. |
| | Derivative replacement values and trading portfolio assets and liabilities are assigned to the columnDue less than 1 month, although the respective contractual maturities may extend over significantly longer periods. Financial assets and liabilities with no contractual maturity (such as equity securities) are included in thePerpetual/not applicable time bucket. Undated or perpetual instruments are classified based on the contractual notice period which the counter-party of the instrument is entitled to give. Where there is no contractual notice period, undated or perpetual contracts are included in thePerpetual/not applicable time bucket. |
| |
| | Non-financial assets and liabilities with no contractual maturity (such as property, plant and equipment, goodwill and intangible assets, current and deferred tax assets and liabilities and retirement benefit liabilities) are generally included in thePerpetual time bucket. |
| | Loan commitments are classified on the basis of the earliest date they can be drawn down. |
223
Risk, treasury and capital management
Treasury management
Maturity analysis of assets and liabilities
| | | | | | | | | | | | | | | | | | | | | | | | | | | | | | | | | | | | | | | | |
| CHF billion | | Due less
than
1 month | | | Due
between
1 and 3
months | | | Due
between
3 and 6
months | | | Due
between
6 and 9
months | | | Due
between
9 and 12
months | | | Due
between
1 and 2
years | | | Due
between
2 and 5
years | | | Due over
5 years | | | Perpetual /
not
applicable | | | Total | |
| Assets | | | | | | | | | | | | | | | | | | | | | | | | | | | | | | | | | | | | | | | | |
| | | | | | | | | | | | | | | | | | | | | | | | | | | | | | | | | | | | | | | | | |
| Cash and balances with central banks | | | 80.9 | | | | | | | | | | | | | | | | | | | | | | | | | | | | | | | | | | | | 80.9 | |
| Due from banks | | | 13.6 | | | | 1.1 | | | | 0.6 | | | | 1.0 | | | | 0.4 | | | | 0.0 | | | | 0.1 | | | | 0.3 | | | | | | | | 17.2 | |
| Cash collateral on securities borrowed | | | 27.5 | | | | 0.0 | | | | 0.0 | | | | | | | | 0.0 | | | | | | | | | | | | | | | | | | | | 27.5 | |
| Reverse repurchase agreements | | | 60.3 | | | | 22.3 | | | | 4.4 | | | | 2.2 | | | | 2.2 | | | | 0.1 | | | | 0.1 | | | | | | | | | | | | 91.6 | |
| Trading portfolio assets | | | 122.8 | | | | | | | | | | | | | | | | | | | | | | | | | | | | | | | | | | | | 122.8 | |
of which: assets pledged as collateral which may be sold or repledged by counterparties | | | 42.4 | | | | | | | | | | | | | | | | | | | | | | | | | | | | | | | | | | | | 42.4 | |
| Positive replacement values | | | 245.8 | | | | | | | | | | | | | | | | | | | | | | | | | | | | | | | | | | | | 245.8 | |
| Cash collateral receivables on derivative instruments | | | 28.0 | | | | | | | | | | | | | | | | | | | | | | | | | | | | | | | | | | | | 28.0 | |
| Financial assets designated at fair value | | | 1.0 | | | | 0.3 | | | | 0.2 | | | | 0.2 | | | | 0.2 | | | | 1.3 | | | | 3.1 | | | | 0.6 | | | | 0.6 | | | | 7.4 | |
| Loans | | | 99.0 | | | | 46.6 | | | | 13.1 | | | | 5.9 | | | | 6.6 | | | | 19.9 | | | | 49.4 | | | | 46.4 | | | | | | | | 287.0 | |
of which: residential mortgages | | | 15.6 | | | | 28.7 | | | | 6.7 | | | | 3.0 | | | | 3.0 | | | | 12.9 | | | | 31.5 | | | | 35.9 | | | | | | | | 137.3 | |
of which: commercial mortgages | | | 4.3 | | | | 6.2 | | | | 1.7 | | | | 0.6 | | | | 0.6 | | | | 1.8 | | | | 4.3 | | | | 3.3 | | | | | | | | 22.7 | |
of which: Lombard loans | | | 66.2 | | | | 9.1 | | | | 3.5 | | | | 1.5 | | | | 2.2 | | | | 1.7 | | | | 2.2 | | | | 0.4 | | | | | | | | 86.8 | |
of which: other loans | | | 12.9 | | | | 2.6 | | | | 1.2 | | | | 0.8 | | | | 0.9 | | | | 3.5 | | | | 11.2 | | | | 2.1 | | | | | | | | 35.3 | |
of which: securities | | | | | | | | | | | | | | | | | | | | | | | | | | | 0.2 | | | | 4.6 | | | | | | | | 4.8 | |
| Financial investments available-for-sale | | | 4.0 | | | | 5.8 | | | | 9.3 | | | | 4.5 | | | | 3.5 | | | | 18.7 | | | | 8.5 | | | | 4.3 | | | | 1.0 | | | | 59.5 | |
| Investments in associates | | | | | | | | | | | | | | | | | | | | | | | | | | | | | | | | | | | 0.8 | | | | 0.8 | |
| Property and equipment | | | | | | | | | | | | | | | | | | | | | | | | | | | | | | | | | | | 6.0 | | | | 6.0 | |
| Goodwill and intangible assets | | | | | | | | | | | | | | | | | | | | | | | | | | | | | | | | | | | 6.3 | | | | 6.3 | |
| Deferred tax assets | | | | | | | | | | | | | | | | | | | | | | | | | | | | | | | | | | | 8.8 | | | | 8.8 | |
| Other assets | | | 16.1 | | | | 0.1 | | | | | | | | | | | | | | | | | | | | 1.7 | | | | 2.3 | | | | | | | | 20.2 | |
| | | | | | | | | | | | | | | | | | | | | | | | | | | | | | | | | | | | | | | | | |
| Total assets 31.12.13 | | | 699.1 | | | | 76.2 | | | | 27.6 | | | | 13.8 | | | | 12.9 | | | | 40.0 | | | | 63.0 | | | | 53.9 | | | | 23.5 | | | | 1,009.9 | |
| | | | | | | | | | | | | | | | | | | | | | | | | | | | | | | | | | | | | | | | | |
| Liabilities | | | | | | | | | | | | | | | | | | | | | | | | | | | | | | | | | | | | | | | | |
| | | | | | | | | | | | | | | | | | | | | | | | | | | | | | | | | | | | | | | | | |
| Due to banks | | | 9.5 | | | | 1.3 | | | | 1.5 | | | | 0.1 | | | | 0.1 | | | | 0.0 | | | | 0.3 | | | | 0.0 | | | | | | | | 12.9 | |
| Cash collateral on securities lent | | | 8.3 | | | | 0.7 | | | | 0.6 | | | | | | | | | | | | | | | | | | | | | | | | | | | | 9.5 | |
| Repurchase agreements | | | 12.1 | | | | 1.1 | | | | 0.1 | | | | 0.0 | | | | 0.1 | | | | | | | | 0.3 | | | | 0.1 | | | | | | | | 13.8 | |
| Trading portfolio liabilities | | | 26.6 | | | | | | | | | | | | | | | | | | | | | | | | | | | | | | | | | | | | 26.6 | |
| Negative replacement values | | | 240.0 | | | | | | | | | | | | | | | | | | | | | | | | | | | | | | | | | | | | 240.0 | |
| Cash collateral payables on derivative instruments | | | 49.1 | | | | | | | | | | | | | | | | | | | | | | | | | | | | | | | | | | | | 49.1 | |
| Financial liabilities designated at fair value | | | 3.5 | | | | 4.0 | | | | 3.9 | | | | 5.2 | | | | 3.4 | | | | 11.7 | | | | 19.2 | | | | 17.9 | | | | 1.2 | | | | 69.9 | |
| Due to customers | | | 378.1 | | | | 6.8 | | | | 2.9 | | | | 1.5 | | | | 1.1 | | | | 0.1 | | | | 0.1 | | | | 0.1 | | | | | | | | 390.8 | |
| Debt issued | | | 6.3 | | | | 8.6 | | | | 14.7 | | | | 2.4 | | | | 3.6 | | | | 7.1 | | | | 21.5 | | | | 16.4 | | | | 1.2 | | | | 81.6 | |
| Provisions | | | 3.0 | | | | | | | | | | | | | | | | | | | | | | | | | | | | | | | | | | | | 3.0 | |
| Other liabilities | | | 59.2 | | | | 2.9 | | | | 0.1 | | | | | | | | | | | | 0.1 | | | | 0.2 | | | | 0.2 | | | | | | | | 62.8 | |
| | | | | | | | | | | | | | | | | | | | | | | | | | | | | | | | | | | | | | | | | |
| Total liabilities 31.12.13 | | | 795.7 | | | | 25.4 | | | | 23.6 | | | | 9.2 | | | | 8.3 | | | | 18.9 | | | | 41.5 | | | | 34.7 | | | | 2.4 | | | | 959.9 | |
| | | | | | | | | | | | | | | | | | | | | | | | | | | | | | | | | | | | | | | | | |
| Financial liabilities not recognized on balance sheet | | | | | | | | | | | | | | | | | | | | | | | | | | | | | | | | | | | | | | | | |
| | | | | | | | | | | | | | | | | | | | | | | | | | | | | | | | | | | | | | | | | |
| Loan commitments | | | 54.5 | | | | 0.3 | | | | 0.1 | | | | 0.0 | | | | 0.0 | | | | 0.0 | | | | 0.0 | | | | | | | | | | | | 54.9 | |
| Underwriting commitments | | | 0.8 | | | | | | | | | | | | | | | | | | | | | | | | | | | | | | | | | | | | 0.8 | |
| | | | | | | | | | | | | | | | | | | | | | | | | | | | | | | | | | | | | | | | | |
| Total commitments | | | 55.2 | | | | 0.3 | | | | 0.1 | | | | 0.0 | | | | 0.0 | | | | 0.0 | | | | 0.0 | | | | 0.0 | | | | | | | | 55.7 | |
| | | | | | | | | | | | | | | | | | | | | | | | | | | | | | | | | | | | | | | | | |
| Guarantees | | | 18.3 | | | | 0.0 | | | | 0.0 | | | | 0.0 | | | | 0.0 | | | | 0.1 | | | | 0.1 | | | | 0.0 | | | | | | | | 18.8 | |
| | | | | | | | | | | | | | | | | | | | | | | | | | | | | | | | | | | | | | | | | |
| Reverse repurchase agreements | | | 9.4 | | | | | | | | | | | | | | | | | | | | | | | | | | | | | | | | | | | | 9.4 | |
| Securities borrowing agreements | | | 0.0 | | | | | | | | | | | | | | | | | | | | | | | | | | | | | | | | | | | | 0.0 | |
| | | | | | | | | | | | | | | | | | | | | | | | | | | | | | | | | | | | | | | | | |
| Total 31.12.13 | | | 83.0 | | | | 0.3 | | | | 0.1 | | | | 0.1 | | | | 0.0 | | | | 0.1 | | | | 0.1 | | | | 0.0 | | | | | | | | 83.9 | |
| | | | | | | | | | | | | | | | | | | | | | | | | | | | | | | | | | | | | | | | | |
224
|
Risk, treasury and capital management |
|
|
Currency management
Our Group currency management activities are designed to reduce adverse currency effects on our reported financial results in Swiss francs, within limits set by the Board of Directors. Group Treasury focuses on three principal areas of currency risk management: currency-matched funding of investments in non-Swiss franc assets and liabilities, sell-down of non-Swiss franc profits and losses and selective hedging of anticipated non-Swiss franc profits and losses. Non-trading foreign exchange risks are managed under market risk limits, with the exception of Group Treasury management of consolidated capital activity.
Currency-matched funding and investment of
non-Swiss franc assets and liabilities
For monetary balance sheet items and non-core investments, as far as it is practical and efficient we follow the principle of matching the currencies of our assets and liabilities for funding purposes. This avoids profits and losses arising from the retranslation of non-Swiss franc assets and liabilities.
Net investment hedge accounting is applied to non-Swiss franc core investments to balance the effect of foreign exchange movements on both the common equity tier 1 (CET1) capital ratio and CET1 capital on a fully applied basis.
| | è | | Refer to “Note 1a Significant accounting policies” and “Note 14 Derivative instruments and hedge accounting” in the “Financial information” section of this report for more information |
Sell-down of reported profits and losses
Reported profit and losses are translated each month from their original transaction currencies into Swiss francs using the relevant month-end rate. Monthly income statement items of foreign subsidiaries and branches with a functional currency other than the Swiss franc are translated into Swiss francs using the relevant month-end rate. Weighted average rates for a year represent an average of 12 month-end rates, weighted according to the income and expense volumes of all foreign subsidiaries and branches with the same functional currency for each month. To reduce earnings volatility on the retranslation of previously recognized earnings in foreign currencies, Group Treasury centralizes the profits and losses arising in the Parent Bank and its branches and sells or buys the profit or loss for Swiss francs. Our operating entities follow a similar monthly sell-down process into their own reporting currencies. Retained earnings in operating entities with a reporting currency other than the Swiss franc are integrated and managed as part of net investment hedge accounting.
Hedging of anticipated future reported profits and losses
At any time, the Group ALCO may instruct Group Treasury to execute hedges to protect anticipated future profit and losses in foreign currencies against possible adverse trends of foreign exchange rates. Although intended to hedge future earnings, these transactions are accounted for as open currency positions and are subject to internal market risk VaR and stress loss limits.
225
Risk, treasury and capital management
Capital management
Capital management
Our strong capital position provides us with a solid foundation for growing our business and enhancing our competitive positioning. At the end of 2013, our common equity tier 1 (CET1) capital ratio 1 was 18.5% on a phase-in basis and 12.8% on a fully applied basis, a significant increase compared withyear-end 2012pro-forma ratios, and the highest fully applied ratio in our peer group.
| | |
| | Capital management objectives |
| | Adequate capital is a prerequisite to support our business activities, in accordance with both our own internal assessment and regulatory requirements. We aim to maintain a strong capital position and sound capital ratios at all times and therefore consider not only the current situation but also projected business and regulatory developments. We are committed to continuing to improve these ratios, mainly through a combination of retained earnings, the issuance of additional loss-absorbing capital (LAC) and efforts to reduce risk-weighted assets (RWA). |
| | Ongoing compliance with regulatory capital requirements and target capital ratios is central to our capital adequacy management. We are targeting a fully applied CET1 ratio of 13% in 2014. By achieving our targets, we will exceed the Swiss Financial Market Supervisory Authority’s (FINMA) requirements for Swiss systemically relevant banks (SRB), which are stricter than Basel Committee on Banking Supervision (BCBS) requirements. We believe this will provide even greater comfort to our stakeholders, further increase confidence in our firm and contribute to strong external credit ratings. |
| | è Refer to the “Our strategy” section of this report for more information on our targets |
| | è Refer to the “Swiss SRB and BIS Basel III capital requirements” chart in this section for more information on differences in capital requirements |
| | Annual strategic and ongoing capital planning process |
| | The annual strategic planning process incorporates a capital planning component and is key in defining mid- and longer-term capital targets. It is based on an attribution of Group RWA and leverage ratio denominator (LRD) limits to the business divisions. These resource allocations in turn impact business plans and earnings projections, which are then reflected in our capital plans. |
| | |
| | Capital limits and targets are established at both Group and business division levels, and submitted to the Board of Directors for approval or for information on at least an annual basis. Group Treasury monitors and plans for consolidated RWA, LRD and capital developments. Monitoring activities may form the basis of adjustments to RWA and / or LRD limits, actions related to the issuance or redemption of capital instruments and other business-related decisions. In the event of limits being breached, an action plan is triggered, which defines remediating actions required to return the exposures to a limit-compliant level. Monitoring activities also consider developments in capital regulations. |
| | Consideration of stress scenarios |
| | Through a set of quantitative risk appetite objectives, we aim to ensure that aggregate risk exposure is within our desired risk capacity, based on our capital and business plans. We use both scenario-based stress tests and statistical frameworks to assess the impact of a severe stress event at an aggregate, Group-wide level. We have set an objective that our CET1 capital ratio remains at 10% or above if a severe stress event were to occur, and we are firmly committed to return capital to shareholders with a payout ratio of at least 50%, conditional on our achievement of both a fully applied CET1 ratio of a minimum of 13% and a post-stress CET1 ratio of a minimum of 10%. |
| | è Refer to the “Risk management and control” section of this report for more information on our risk appetite framework |
| | Capital adequacy management |
| | During 2013, we managed our capital according to our capital ratio targets. In the target-setting process, we take into account the current and future capital requirements set by regulators as well as actual and potential future capital requirements including capital buffer requirements. We also consider our aggregate risk |
1 Unless otherwise indicated, all information in this section is based on the Basel III framework as applicable for Swiss systemically relevant banks (SRB).
226
|
Risk, treasury and capital management |
|
|
| | | | |
| | exposure in terms of capital-at-risk, the views of rating agencies, comparisons with peer institutions and the impact of expected accounting policy changes. Our progress towards meeting the Swiss SRB Basel III fully applied capital requirements was evidenced by a series of capital transactions, including the following: |
| | – | | the redemption of CHF 1.0 billion of two tier 2 capital instruments and the repurchase of CHF 1.0 billion of certain other tier 2 capital instruments in a public tender offer, as these capital instruments are not eligible for full recognition under Basel III and are being phased out by 2019; |
| | – | | an increase in our Deferred Contingent Capital Plan (DCCP) of CHF 0.5 billion to a total of CHF 1.0 billion, under which deferred compensation balances will forfeit if a 7% Basel III CET1 ratio level (or 10% with respect to awards granted to Group Executive Board members) is breached or if a viability event occurs during the five-year period after the award date and |
| | – | | our issuances of Basel III-compliant tier 2 loss-absorbing notes with a nominal amount of USD 1.5 billion in May 2013 and EUR 2.0 billion in February 2014, respectively, which both qualify as tier 2 capital and progressive buffer capital in compliance with Swiss SRB Basel III rules. |
| | | | |
| | Active management of RWA |
| | We have a strong track record of RWA reduction, surpassing our 2013 Basel III RWA targets well ahead of schedule and demonstrating progress towards achieving our RWA target of less than CHF 200 billion by 2017 on a fully applied basis, despite the incremental RWA resulting from the supplemental operational risk capital analysis mutually agreed to by UBS and FINMA. |
| | Having fully adapted its business to Basel III, our Investment Bank has operated with fully applied RWA of less than CHF 70 billion. In line with our strategy to deploy capital efficiently, RWA are expected to increase both in our wealth management businesses and in Retail & Corporate, as we deliver attractive lending and mortgage opportunities to our clients. |
| | With the transfer of non-core assets from our Investment Bank to our Non-core and Legacy Portfolio unit, Corporate Center was tasked with managing these diversified assets in a manner that protects shareholder value and within the same robust oversight structure that successfully supported our RWA reduction in our Legacy Portfolio. While we managed approximately CHF 102.5 billion of RWA in our Non-core and Legacy Portfolio unit at the beginning of 2013, we reduced these to CHF 64 billion as of |
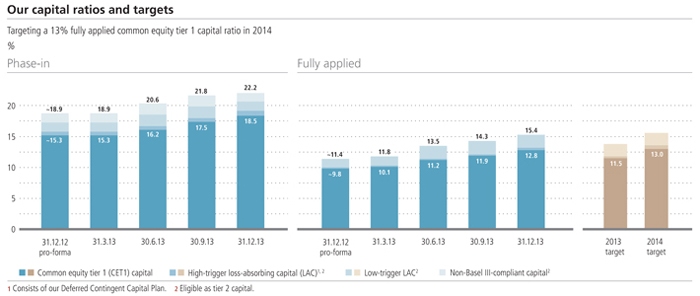
227
Risk, treasury and capital management
Capital management
31 December 2013 and therefore significantly exceeded our target of CHF 85 billion for that unit by the end of 2013. We aim to further reduce RWA in our Non-core and Legacy Portfolio to CHF 55 billion by the end of 2015 and CHF 25 billion by the end of 2017.
Active management of sensitivity to currency movements
The majority of our capital and a significant portion of our RWA are denominated in Swiss francs, but we also hold RWA and some eligible capital in other currencies, primarily US dollars, euros and British pounds. A significant depreciation of the Swiss franc against these currencies can adversely affect our key ratios, and Group Treasury is mandated with the task of minimizing such effects. If the Swiss franc depreciates against other currencies, consolidated RWA increase relative to our capital, and vice versa. The Group Asset and Liability Management Committee, a committee of the UBS Group Executive Board, can adjust the currency mix in capital, within limits set by the Board of Directors, to balance the effect of foreign exchange movements on the fully applied CET1 capital and capital ratio. Limits are in place for the sensitivity of both CET1 capital and capital ratio to a ±10% change in the value of the Swiss franc against other currencies. As of 31 December 2013, we estimate that a 10% depreciation of the Swiss franc against other currencies would increase CET1 capital by CHF 1,075 million (31 December 2012: CHF 845 million) and would decrease the CET1 capital ratio by 15 basis points (31 December 2012: 30 basis points). Conversely, we estimate that a 10% appreciation of the Swiss franc against other currencies would decrease CET1 capital by CHF 973 million (31 December 2012: CHF 764 million) and would increase the CET1 capital ratio by 15 basis points (31 December 2012: 30 basis points).
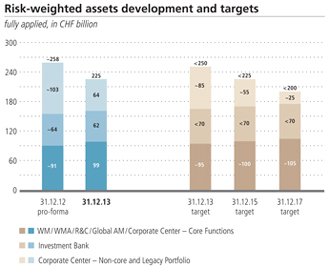
228
|
Risk, treasury and capital management |
|
|
Swiss SRB Basel III capital information
As we are required to comply with regulations based on the Basel III framework as applicable for Swiss systemically relevant banks (SRB), our capital disclosures focus on Swiss SRB Basel III capital information. Differences between the Swiss SRB and BIS Basel III capital regimes are outlined in the subsection “Differences between Swiss SRB and BIS Basel III capital.”
Regulatory framework
The Basel III framework came into effect in Switzerland on 1 January 2013 and includes prudential filters for the calculation of capital. These prudential filters consist mainly of capital deductions for deferred tax assets recognized for tax loss carry-forwards and the inclusion of the effects of IAS 19 (revised) relating to post-employment benefits. As these filters are being phased in between 2014 and 2018, their effects are gradually factored into our calculations of capital, RWA and capital ratios on a phase-in
basis and are entirely reflected in our capital and capital ratios on a fully applied basis.
Furthermore, based on the most recent Swiss Financial Market Supervisory Authority (FINMA) regulation, capital instruments which were treated as hybrid tier 1 capital and as tier 2 capital under the Basel 2.5 framework are being phased out under Basel III between 2013 and 2019. On a phase-in basis, our capital and capital ratios include the applicable portion of these capital instruments not yet phased out. Our capital and capital ratios on a fully applied basis do not include these capital instruments.
All Basel III numbers for 31 December 2012 provided in this report are on a pro-forma basis. The pro-forma numbers were either disclosed in our report for the fourth quarter of 2012 and / or our Annual Report 2012 or were introduced as comparatives during 2013. Some of the models applied when calculating 31 December 2012 pro-forma information required regulatory approval and included estimates (as discussed with our primary regulator) of the effect of these new capital charges.
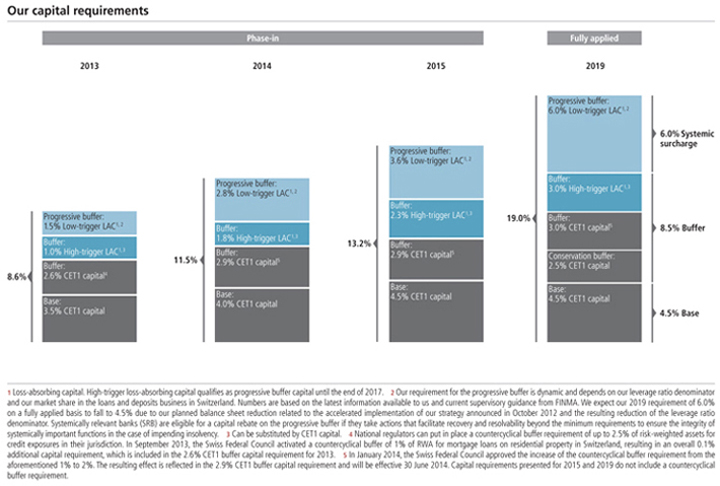
229
Risk, treasury and capital management
Capital management
| | |
| | Capital requirements In Switzerland, all banks must comply with the Basel III capital framework, as required by the Swiss Capital Ordinance and regulations issued by FINMA. In addition, UBS, Credit Suisse and, since 1 November 2013, Zürcher Kantonalbank are required to comply with specific Swiss SRB rules. As of 31 December 2013, our total capital requirement was Audited 8.6% of our RWA. This requirement consisted of: (i) base capital of 3.5%, (ii) buffer capital of 3.6% (including a countercyclical buffer capital requirement that increased our effective capital requirement by 0.1%) and (iii) progressive buffer capital of |
| | |
| | 1.5%.As of 31 December 2013, we satisfied the base and buffer (including the countercyclical buffer) capital requirements through our CET1 capital. High- and low-trigger loss-absorbing capital significantly exceeded the progressive buffer capital requirement. Capital ratios As of 31 December 2013, our phase-in CET1 capital ratio was 18.5%, an increase of 3.2 percentage points compared with 15.3% as of 31 December 2012. On a fully applied basis, our CET1 capital ratio increased 3.0 percentage points to 12.8% during the year, exceeding our target ratio of 11.5% for 2013. The significant improvement in our CET1 capital ratio was mainly due to a CHF 33.2 billion reduction in RWA, despite incremental RWA |
Swiss SRB Basel III available capital versus capital requirements
| | | | | | | | | | | | | | | | | | | | | | | | | | | | |
CHF million, except where indicated | | | | | | | | | |
| | | | | Phase-in | | | | |
| | Requirements | | | Actual information | |
| | Required
ratio (%) | | | Swiss SRB
Basel III capital
requirements | | | Available Swiss SRB Basel III capital | | | Actual ratio (%) | | | Capital type | |
| | | | | | | 31.12.13 | | | | 31.12.13 | | |
| Pro-forma
31.12.12 |
| | | 31.12.13 | | |
| Pro-forma
31.12.12 |
| | | | |
| | | | | | | | | | | | | | | | | | | | | | | | | | | | | |
| Base capital | | | 3.5 | | | | 8,000 | | | | 8,000 | | | | 9,163 | | | | 3.5 | | | | 3.5 | | | | CET1 | |
| | | | | | | | | | | | | | | | | | | | | | | | | | | | | |
| Buffer capital | | | 3.6 | | | | 8,149 | | | | 34,180 | 1 | | | 30,869 | 1 | | | 15.0 | | | | 11.8 | | | | CET1 | |
| | | | | | | | | | | | | | | | | | | | | | | | | | | | | |
of which: effect of countercyclical buffer | | | 0.1 | | | | 149 | | | | | | | | | | | | | | | | | | | | | |
| | | | | | | | | | | | | | | | | | | | | | | | | | | | | |
| Progressive buffer | | | 1.5 | | | | 3,428 | | | | 5,665 | 2 | | | 4,160 | 2 | | | 2.5 | | | | 1.6 | | | | LAC | |
| | | | | | | | | | | | | | | | | | | | | | | | | | | | | |
| Phase-out capital | | | | | | | | | | | 2,971 | | | | 5,384 | | | | 1.3 | | | | 2.1 | | | | | |
| | | | | | | | | | | | | | | | | | | | | | | | | | | | | |
| Total | | | 8.6 | | | | 19,577 | | | | 50,815 | | | | 49,576 | | | | 22.2 | | | | 18.9 | | | | | |
| | | | | | | | | | | | | | | | | | | | | | | | | | | | | |
1 Swiss SRB Basel III CET1 capital exceeding the base capital requirement is allocated to the buffer capital.2 During the transition period until end of 2017, high-trigger loss-absorbing capital (LAC) can be included in the progressive buffer.
Swiss SRB Basel III capital information
| | | | | | | | | | | | | | | | |
CHF million, except where indicated | | Phase-in | | | Fully applied | |
| | | 31.12.13 | | |
| Pro-forma
31.12.12 |
| | | 31.12.13 | | |
| Pro-forma
31.12.12 |
|
| | | | | | | | | | | | | | | | | |
| Swiss SRB Basel III tier 1 capital | | | 42,179 | 1 | | | 40,032 | 1 | | | 28,908 | | | | 25,182 | |
| | | | | | | | | | | | | | | | | |
of which: common equity tier 1 capital | | | 42,179 | | | | 40,032 | | | | 28,908 | | | | 25,182 | |
| | | | | | | | | | | | | | | | | |
| Swiss SRB Basel III tier 2 capital | | | 8,636 | | | | 9,544 | | | | 5,665 | | | | 4,160 | |
| | | | | | | | | | | | | | | | | |
of which: high-trigger loss-absorbing capital | | | 955 | | | | 504 | | | | 955 | | | | 504 | |
| | | | | | | | | | | | | | | | | |
of which: low-trigger loss-absorbing capital | | | 4,710 | | | | 3,656 | | | | 4,710 | | | | 3,656 | |
| | | | | | | | | | | | | | | | | |
of which: phase-out capital | | | 2,971 | | | | 5,384 | | | | | | | | | |
| | | | | | | | | | | | | | | | | |
| Swiss SRB Basel III total capital | | | 50,815 | | | | 49,576 | | | | 34,573 | | | | 29,342 | |
| | | | | | | | | | | | | | | | | |
| Swiss SRB Basel III common equity tier 1 capital ratio (%) | | | 18.5 | | | | 15.3 | | | | 12.8 | | | | 9.8 | |
| | | | | | | | | | | | | | | | | |
| Swiss SRB Basel III tier 1 capital ratio (%) | | | 18.5 | | | | 15.3 | | | | 12.8 | | | | 9.8 | |
| | | | | | | | | | | | | | | | | |
| Swiss SRB Basel III total capital ratio (%) | | | 22.2 | | | | 18.9 | | | | 15.4 | | | | 11.4 | |
| | | | | | | | | | | | | | | | | |
| Swiss SRB Basel III risk-weighted assets | | | 228,557 | | | | 261,800 | | | | 225,153 | | | | 258,113 | |
| | | | | | | | | | | | | | | | | |
1 Includes additional tier 1 capital in the form of hybrid instruments, which was entirely offset by the required deductions for goodwill.
230
|
Risk, treasury and capital management |
|
|
| | | | |
| | of CHF 22.5 billion resulting from the supplemental operational risk capital analysis mutually agreed to by UBS and FINMA. A CHF 2.1 billion increase in our CET1 capital, consistent with our strategy of high-quality capital accretion, also contributed to the increase in our CET1 capital ratio. Our phase-in total capital ratio stood at 22.2% as of 31 December 2013 compared with 18.9% as of 31 December 2012. This improvement was primarily due to the aforementioned reduction in RWA and the increase in our CET1 capital. Our fully applied total capital ratio increased 4.0 percentage points to 15.4%. |
| | | | è Refer to the “Regulatory and legal developments” section of this report for more information on the incremental RWA resulting from the supplemental operational risk capital analysis mutually agreed to by UBS and FINMA |
| | |
| | 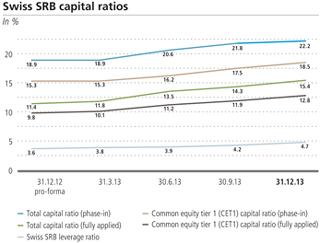
|
| | Eligible capital Common equity tier 1 (CET1) and tier 1 capital |
| | Our CET1 capital mainly comprises share capital, share premium, which primarily consists of additional paid-in capital related to shares issued, and retained earnings. A detailed reconciliation of IFRS equity to CET1 capital is provided in the table “Reconciliation IFRS equity to Swiss SRB Basel III capital.” Our phase-in tier 1 capital is equal to our phase-in CET1 capital, as additional tier 1 capital in the form of hybrid capital instruments is entirely offset by required deductions for goodwill. These hybrid tier 1 capital instruments are not eligible as capital under Basel III and are therefore not included in our fully applied tier 1 capital. |
| | | | |
| | During 2013, phase-in CET1 capital increased by CHF 2.1 billion to CHF 42.2 billion. This increase was mainly due to the full year net profit attributable to UBS shareholders of CHF 3.2 billion and the exercise of our option to acquire the SNB StabFund’s equity, which resulted in a CHF 2.1 billion increase in capital. These increases were partly offset by an increased deduction for goodwill as a result of a reduction in hybrid capital against which this goodwill was previously offset, adverse foreign currency translation effects and a number of other required adjustments to regulatory capital. On a fully applied basis, CET1 capital increased by CHF 3.7 billion to CHF 28.9 billion, largely due to the same factors that contributed to the increase in phase-in CET1 capital with the main exception being the effect of the goodwill deduction on phase-in CET1 capital, which is not relevant for the fully applied CET1 capital calculation. A more granular analysis of our 2013 CET1 capital movement on both a phase-in and fully applied basis is shown in the table “Swiss SRB Basel III capital movement.” |
| | Tier 2 capital |
| | Low-trigger loss-absorbing capital accounted for CHF 4.7 billion of tier 2 capital as of 31 December 2013 and consisted of three US dollar-denominated subordinated notes with a write-down threshold set at a 5% phase-in CET1 ratio (after giving effect to the write-down of any high-trigger loss-absorbing capital). Furthermore, our tier 2 capital included high-trigger loss-absorbing capital of CHF 1.0 billion, in the form of our DCCP, with a write-down threshold set at a 7% phase-in CET1 ratio or 10% with respect to awards granted to Group Executive Board members for the performance year 2013. Additionally, our loss-absorbing capital instruments would be written down if FINMA determines that a write-down is necessary to ensure UBS’s viability, or if UBS receives a commitment of governmental support that FINMA determines to be necessary to ensure UBS’s viability. The remainder of tier 2 capital consisted of outstanding tier 2 instruments which will be phased out by 2019, based on the most recent FINMA regulation. |
| | During 2013, our phase-in tier 2 capital decreased by CHF 0.9 billion to CHF 8.6 billion. This decrease was primarily due to the redemption and amortization of tier 2 capital instruments of CHF 1.3 billion, the repurchase of certain other tier 2 capital instruments of CHF 1.0 billion in a public tender offer and adverse foreign currency translation effects, partly offset by an increase of CHF 1.2 billion in low-trigger loss-absorbing capital and CHF 0.5 billion in high-trigger loss-absorbing capital in the form of our DCCP. Fully applied tier 2 capital increased by CHF 1.5 billion to CHF 5.7 billion, almost entirely due to the issuance of loss-absorbing capital. A more detailed overview of our tier 2 capital instruments eligible as capital on a phase-in basis under Basel III as of 31 December 2013 is provided in the tables later on in this section. |
231
Risk, treasury and capital management
Capital management
Swiss SRB Basel III capital movement
| | | | | | | | |
| CHF billion | | Phase-in | | | Fully applied | |
| Common equity tier 1 capital as of 31.12.12 | | | 40.0 | | | | 25.2 | |
| | | | | | | | | |
| Movements during 2013: | | | | | | | | |
| | | | | | | | | |
Net profit attributable to UBS shareholders | | | 3.2 | | | | 3.2 | |
| | | | | | | | | |
Exercise of the SNB StabFund option | | | 2.1 | | | | 2.1 | |
| | | | | | | | | |
Own credit related to financial liabilities designated at fair value and replacement values, net of tax | | | 0.4 | | | | 0.4 | |
| | | | | | | | | |
Foreign currency translation effects | | | (0.3 | ) | | | (0.3 | ) |
| | | | | | | | | |
Deferred tax assets recognized for tax loss carry-forwards, less deferred tax liabilities, as applicable | | | | | | | (0.1 | ) |
| | | | | | | | | |
Compensation and own shares related capital components (including share premium) | | | (0.5 | ) | | | (0.5 | ) |
| | | | | | | | | |
Goodwill net of tax, less hybrid capital, as applicable (including goodwill relating to significant investments in financial institutions) | | | (1.2 | ) | | | | |
| | | | | | | | | |
Defined benefit pension plans | | | (0.5 | ) | | | 0.0 | |
| | | | | | | | | |
Expected losses on advanced internal ratings-based portfolio less general provisions | | | (0.3 | ) | | | (0.3 | ) |
| | | | | | | | | |
Other | | | (0.9 | ) | | | (0.9 | ) |
| | | | | | | | | |
| Total movement | | | 2.1 | | | | 3.7 | |
| | | | | | | | | |
| Common equity tier 1 capital as of 31.12.13 | | | 42.2 | | | | 28.9 | |
| | | | | | | | | |
| Tier 2 capital as of 31.12.12 | | | 9.5 | | | | 4.2 | |
| | | | | | | | | |
| Movements during 2013: | | | | | | | | |
| | | | | | | | | |
Redemption and amortization of phase-out capital instruments | | | (1.3 | ) | | | | |
| | | | | | | | | |
Buyback of phase-out capital instruments | | | (1.0 | ) | | | | |
| | | | | | | | | |
Increase in loss-absorbing capital | | | 1.7 | | | | 1.7 | |
| | | | | | | | | |
Foreign currency translation effects | | | (0.3 | ) | | | (0.1 | ) |
| | | | | | | | | |
| Total movement | | | (0.9 | ) | | | 1.5 | |
| | | | | | | | | |
| Tier 2 capital as of 31.12.13 | | | 8.6 | | | | 5.7 | |
| | | | | | | | | |
| Total capital as of 31.12.13 | | | 50.8 | | | | 34.6 | |
| | | | | | | | | |
| Total capital as of 31.12.12 | | | 49.6 | | | | 29.3 | |
| | | | | | | | | |
232
|
Risk, treasury and capital management |
|
|
Reconciliation IFRS equity to Swiss SRB Basel III capital
| | | | | | | | | | | | | | | | |
| | Phase-in | | | Fully applied | |
| | | Audited | | | | | | | | Audited | | | | | |
| CHF million | | | 31.12.13 | | |
| Pro-forma
31.12.12 |
| | | 31.12.13 | | |
| Pro-forma
31.12.12 |
|
| | | | | | | | | | | | | | | | | |
| Equity attributable to UBS shareholders | | | 48,002 | | | | 45,949 | | | | 48,002 | | | | 45,949 | |
| | | | | | | | | | | | | | | | | |
| Equity attributable to preferred noteholders and non-controlling interests | | | 1,935 | | | | 3,152 | | | | 1,935 | | | | 3,152 | |
| | | | | | | | | | | | | | | | | |
| Total IFRS equity | | | 49,936 | | | | 49,100 | | | | 49,936 | | | | 49,100 | |
| | | | | | | | | | | | | | | | | |
| Reversal of the effect of the adoption of IAS 19R, net of tax | | | 2,540 | | | | 3,948 | | | | | | | | | |
| | | | | | | | | | | | | | | | | |
| Own credit related to financial liabilities designated at fair value and replacement values, net of tax | | | 304 | | | | (142 | ) | | | 304 | | | | (142 | ) |
| | | | | | | | | | | | | | | | | |
| Equity attributable to preferred noteholders and non-controlling interests | | | (1,935 | ) | | | (3,152 | ) | | | (1,935 | ) | | | (3,152 | ) |
| | | | | | | | | | | | | | | | | |
| Goodwill net of tax, less hybrid capital, as applicable (including goodwill relating tosignificant investments in financial institutions) | | | (3,044 | ) | | | (1,949 | ) | | | (6,157 | ) | | | (6,265 | ) |
| | | | | | | | | | | | | | | | | |
| Intangible assets, net of tax | | | (435 | ) | | | (501 | ) | | | (435 | ) | | | (501 | ) |
| | | | | | | | | | | | | | | | | |
| Fair value of the call option to acquire SNB StabFund’s equity, pre-tax | | | | | | | (2,103 | ) | | | | | | | (2,103 | ) |
| | | | | | | | | | | | | | | | | |
| Unrealized (gains) / losses from cash flow hedges, net of tax | | | (1,463 | ) | | | (2,983 | ) | | | (1,463 | ) | | | (2,983 | ) |
| | | | | | | | | | | | | | | | | |
| Deferred tax assets recognized for tax loss carry-forwards, less deferred tax liabilities, as applicable | | | | | | | | | | | (6,665 | ) | | | (6,586 | ) |
| | | | | | | | | | | | | | | | | |
| Compensation and own shares related capital components (not recognized in net profit) | | | (1,430 | ) | | | (495 | ) | | | (1,430 | ) | | | (495 | ) |
| | | | | | | | | | | | | | | | | |
| Net defined benefit pension and post-employment assets (IAS 19R), pre-tax | | | | | | | | | | | (952 | ) | | | 0 | |
| | | | | | | | | | | | | | | | | |
| Unrealized gains related to financial investments available-for-sale, net of tax | | | (325 | ) | | | (183 | ) | | | (325 | ) | | | (183 | ) |
| | | | | | | | | | | | | | | | | |
| Expected losses on advanced internal ratings-based portfolio less general provisions | | | (304 | ) | | | (43 | ) | | | (304 | ) | | | (43 | ) |
| | | | | | | | | | �� | | | | | | | |
| Prudential valuation adjustments | | | (107 | ) | | | (136 | ) | | | (107 | ) | | | (136 | ) |
| | | | | | | | | | | | | | | | | |
| Consolidation scope | | | (55 | ) | | | (65 | ) | | | (55 | ) | | | (65 | ) |
| | | | | | | | | | | | | | | | | |
| National specific regulatory adjustments and other1 | | | (1,502 | ) | | | (1,264 | ) | | | (1,502 | ) | | | (1,264 | ) |
| | | | | | | | | | | | | | | | | |
| Swiss SRB Basel III common equity tier 1 capital | | | 42,179 | | | | 40,032 | | | | 28,908 | | | | 25,182 | |
| | | | | | | | | | | | | | | | | |
| Hybrid capital | | | 3,113 | | | | 4,316 | | | | | | | | | |
| | | | | | | | | | | | | | | | | |
| Goodwill net of tax, less hybrid capital, as applicable (including goodwill relating to significant investments in financial institutions) | | | (3,113 | ) | | | (4,316 | ) | | | | | | | | |
| | | | | | | | | | | | | | | | | |
| Swiss SRB Basel III additional tier 1 capital | | | 0 | | | | 0 | | | | | | | | | |
| | | | | | | | | | | | | | | | | |
| Swiss SRB Basel III tier 1 capital | | | 42,179 | | | | 40,032 | | | | 28,908 | | | | 25,182 | |
| | | | | | | | | | | | | | | | | |
| Swiss SRB Basel III tier 2 capital | | | 8,636 | | | | 9,544 | | | | 5,665 | | | | 4,160 | |
| | | | | | | | | | | | | | | | | |
| Swiss SRB Basel III total capital | | | 50,815 | | | | 49,576 | | | | 34,573 | | | | 29,342 | |
| | | | | | | | | | | | | | | | | |
1 Includes an accrual for the proposed distribution of capital contribution reserves, a charge for the increase in high-trigger loss-absorbing capital and other items.
233
Risk, treasury and capital management
Capital management
High-trigger loss-absorbing capital
| | | | | | | | | | | | | | | | | | |
| million, except where indicated | | |
| | | | | | | | | | | | | | | | | | | |
| No. | | Issuer | | | Date | | |
| Outstanding
amount as of
31.12.13 |
| |
| Amount
recognized in
regulatory
capital as of
31.12.2013 |
| | Coupon rate and frequency of payment | | |
| | | | | | | | | | | | | | | | | | | |
| 1 | | UBS AG | | | 31.12.2012 | | | | CHF 458 | | | | CHF 458 | | | Issues in CHF: 5.40%, issues in USD: 6.25%, annually | | |
| | | | | | | | | | | | | | | | | | | |
| 2 | | UBS AG | | | 31.12.2013 | | | | CHF 497 | | | | CHF 497 | | | Issues in CHF: 3.50%, issues in USD: 5.125%, annually. | | |
| | | | | | | | | | | | | | | | | | | |
| Total high-trigger loss-absorbing capital | | | | | | | | CHF 955 | | | | | |
| | | | | | | | | | | | | | | | | | | |
|
| Low-trigger loss-absorbing capital |
| million, except where indicated |
| | | | | | | | | | | | | | | | | | | |
| No. | | Issuer | | | Issue date | | |
| Outstanding
amount as of
31.12.13 |
| |
| Amount
recognized in
regulatory
capital as of
31.12.2013 |
| | Coupon rate and frequency of payment | | Optional
call date |
| | | | | | | | | | | | | | | | | | | |
| 1 | | UBS AG, Jersey branch | | | 22.02.2012 | | | | USD 2,000 | | | | CHF 1,783 | | | 7.25% / 6.061% + Mid Market Swap Rate from 22 February 2017, annually | | 22.02.2017 |
| | | | | | | | | | | | | | | | | | | |
| 2 | | UBS AG, Stamford branch | | | 17.08.2012 | | | | USD 2,000 | | | | CHF 1,629 | | | 7.625%, semi-annually | | |
| | | | | | | | | | | | | | | | | | | |
| 3 | | UBS AG | | | 22.05.2013 | | | | USD 1,500 | | | | CHF 1,298 | | | 4.75% / 3.765% + Mid Market Swap Rate from 22 May 2018, annually | | 22.05.2018 |
| | | | | | | | | | | | | | | | | | | |
| Total low-trigger loss-absorbing capital | | | | | | | | CHF 4,710 | | | | | |
| | | | | | | | | | | | | | |
|
| Phase-out capital |
| million, except where indicated |
| | | | | | | | | | | | | | | | | | | |
| No. | | Issuer | | | Issue date | | |
| Outstanding
amount as of
31.12.13 |
| |
| Amount
recognized in
regulatory
capital as of
31.12.2013 |
| | Coupon rate and frequency of payment | | Optional call date |
| | | | | | | | | | | | | | | | | | | |
| 1 | | UBS AG, NY branch | | | 21.07.1995 | | | | USD 350 | | | | CHF 315 | | | 7.5%, semi-annually | | |
| | | | | | | | | | | | | | | | | | | |
| 2 | | UBS AG, NY branch | | | 21.07.1995 | | | | USD 150 | | | | CHF 27 | | | 7.375%, semi-annually | | |
| | | | | | | | | | | | | | | | | | | |
| 3 | | UBS AG, NY branch | | | 24.10.1995 | | | | USD 300 | | | | CHF 54 | | | 7%, semi-annually | | |
| | | | | | | | | | | | | | | | | | | |
| 4 | | UBS AG, NY branch | | | 03.09.1996 | | | | USD 300 | | | | CHF 271 | | | 7.75%, semi-annually | | |
| | | | | | | | | | | | | | | | | | | |
| 5 | | UBS AG, NY branch | | | 20.06.1997 | | | | USD 300 | | | | CHF 161 | | | 7.375%, semi-annually | | |
| | | | | | | | | | | | | | | | | | | |
| 6 | | UBS AG, Jersey branch | | | 18.12.1995 | | | | GBP 150 | | | | CHF 221 | | | 8.75%, annually | | |
| | | | | | | | | | | | | | | | | | | |
| 7 | | UBS AG, Jersey branch | | | 16.09.2004 | | | | EUR 381 | | | | CHF 468 | | | 4.5% / 3-month EURIBOR + 1.26%, annually / quarterly | | 16.09.2014 |
| | | | | | | | | | | | | | | | | | | |
| 8 | | UBS AG, Jersey branch | | | 30.06.2005 | | | | CHF 488 | | | | CHF 97 | | | 2.375%, annually | | |
| | | | | | | | | | | | | | | | | | | |
| 9 | | UBS AG, Jersey branch | | | 21.06 2006 | | | | GBP 163 | | | | CHF 236 | | | 5.25% / 3-month Sterling LIBOR + 1.29%, annually / quarterly | | 21.06.2016 |
| | | | | | | | | | | | | | | | | | | |
| 10 | | UBS AG, Jersey branch | | | 19.11.2007 | | | | GBP 250 | | | | CHF 369 | | | 6.375% / 3-month Sterling LIBOR + 2.10%, annually / quarterly | | 19.11.2019 |
| | | | | | | | | | | | | | | | | | | |
| 11 | | UBS AG, Stamford branch | | | 26.07.2006 | | | | USD 1,000 | | | | CHF 348 | | | 5.875%, semi-annually | | |
| | | | | | | | | | | | | | | | | | | |
| 12 | | UBS AG | | | 30.06.2004 | | | | CHF 400 | | | | CHF 0 | | | 3.125%, annually | | |
| | | | | | | | | | | | | | | | | | | |
| 13 | | UBS AG | | | 28.06.2006 | | | | CHF 434 | | | | CHF 174 | | | 3.125%, annually | | |
| | | | | | | | | | | | | | | | | | | |
| 14 | | UBS AG | | | 27.12.2007 | | | | CHF 385 | | | | CHF 231 | | | 4.125%, annually | | |
| | | | | | | | | | | | | | | | | | | |
| Total phase-out capital | | | | | | | | CHF 2,971 | | | | | |
| | | | | | | | | | | | | | | | | | | |
234
|
Risk, treasury and capital management |
|
|
Additional capital information
In order to improve the consistency and comparability of regulatory capital instruments disclosures across market participants, BIS and FINMA Basel III Pillar 3 rules require banks to disclose the main features of eligible capital instruments and their terms and conditions. This information is available in the “Bondholder information” section of our Investor Relations website.
| | è | | Refer to “Bondholder information” at www.ubs.com/investors for more information on the capital instruments of UBS Group and UBS AG (Parent Bank) |
In order to fulfill BIS and FINMA Basel III Pillar 3 composition of capital disclosure requirements, a full reconciliation of all regulatory capital elements to the published IFRS balance sheet is disclosed in the “Supplemental disclosures required under Basel III Pillar 3 regulations” section of this report.
| | è | | Refer to the “Supplemental disclosures required under Basel III Pillar 3 regulations” section of this report for more information |
BIS and Swiss SRB Basel III rules require banks to disclose differences between the accounting scope of consolidation and the regulatory scope of consolidation.
The scope of consolidation for the purpose of calculating Group regulatory capital is generally the same as the scope under IFRS and includes subsidiaries directly or indirectly controlled by UBS AG that are active in the banking and finance sector. However, subsidiaries consolidated under IFRS that are active in sectors other than banking and finance are excluded from the regulatory scope of consolidation. More information on the IFRS scope of consolidation as well as the list of significant subsidiaries included in this scope as of 31 December 2013 are available in the “Financial information” section of this report. Details on entities which are treated differently under the regulatory scope of consolidation are available in the “Supplemental disclosures required under Basel III Pillar 3 regulations” section of this report.
| | è | | Refer to “Note 1 Summary of significant accounting policies,” “Note 30 Interests in subsidiaries and other entities” and “Supplemental disclosures required under Basel III Pillar 3 regulations” in the “Financial information” section of this report for more information on the IFRS scope of consolidation |
We have estimated the loss in capital that we could incur as a result of the risks associated with the matters described in “Note 22 Provisions and contingent liabilities” to our consolidated financial statements. We have utilized for this purpose the advanced measurement approach (AMA) methodology that we use when determining the capital requirements associated with operational risks, based on a 99.9% confidence level over a 12-month horizon. The methodology takes into consideration UBS and industry experience for the AMA operational risk categories to which those matters correspond in isolation from other areas. On this standalone basis, we estimate the loss in capital that we could incur over a 12-month period as a result of our risks associated with these operational risk categories at CHF 2.7 billion as of 31 December 2013. Because this estimate is based upon historical data for the relevant risk categories, it does not constitute a subjective assessment of UBS’s actual exposures in those matters and does not take into account any provisions recognized for those matters. For this reason, and because some of these matters are not expected to be resolved within the next 12 months, any possible losses that we may incur with respect to these matters may be materially more or materially less than this estimated amount.
| | è | | Refer to “Note 22 Provisions and contingent liabilities” in the “Financial information” section of this report for more information |
Differences between Swiss SRB and BIS Basel III capital
Our Swiss SRB Basel III and BIS Basel III capital have the same basis of calculation, on both a phase-in and fully applied basis, except for two specific items. Firstly, our DCCP instruments, representing high-trigger loss-absorbing capital, are amortized over five years under BIS Basel III, but are not amortized under Swiss SRB regulations, resulting in Swiss SRB Basel III tier 2 capital being higher by CHF 92 million as of 31 December 2013. Secondly, a portion of unrealized gains on financial investments available-for-sale, totaling CHF 30 million as of 31 December 2013, is recognized as tier 2 capital under BIS Basel III, but not under Swiss SRB regulations.
235
Risk, treasury and capital management
Capital management
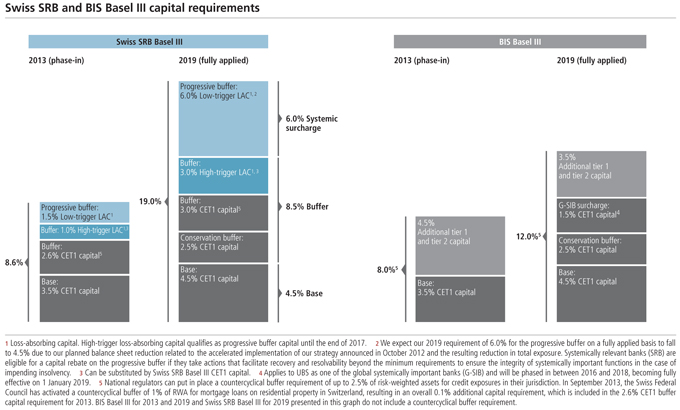
Differences between Swiss SRB and BIS Basel III capital information
| | | | | | | | | | | | | | | | | | | | | | | | |
| | Phase-in | | | Fully applied | |
| | Swiss SRB | | | BIS | | | Differences Swiss
SRB versus BIS | | | Swiss SRB | | | BIS | | | Differences Swiss
SRB versus BIS | |
| CHF million, except where indicated | | | | | | | 31.12.13 | | | | | | | | | | | | 31.12.13 | | | | | |
| | | | | | | | | | | | | | | | | | | | | | | | | |
| Tier 1 capital | | | 42,179 | | | | 42,179 | | | | 0 | | | | 28,908 | | | | 28,908 | | | | 0 | |
| | | | | | | | | | | | | | | | | | | | | | | | | |
of which: common equity tier 1 capital | | | 42,179 | | | | 42,179 | | | | 0 | | | | 28,908 | | | | 28,908 | | | | 0 | |
| | | | | | | | | | | | | | | | | | | | | | | | | |
| Tier 2 capital | | | 8,636 | | | | 8,575 | | | | 61 | | | | 5,665 | | | | 5,604 | | | | 61 | |
| | | | | | | | | | | | | | | | | | | | | | | | | |
of which: high-trigger loss-absorbing capital | | | 955 | | | | 863 | | | | 92 | | | | 955 | | | | 863 | | | | 92 | |
| | | | | | | | | | | | | | | | | | | | | | | | | |
of which: low-trigger loss-absorbing capital | | | 4,710 | | | | 4,710 | | | | 0 | | | | 4,710 | | | | 4,710 | | | | 0 | |
| | | | | | | | | | | | | | | | | | | | | | | | | |
of which: phase-out capital and other tier 2 capital | | | 2,971 | | | | 3,001 | | | | (30 | ) | | | | | | | 30 | | | | (30 | ) |
| | | | | | | | | | | | | | | | | | | | | | | | | |
| Total capital | | | 50,815 | | | | 50,754 | | | | 61 | | | | 34,573 | | | | 34,512 | | | | 61 | |
| | | | | | | | | | | | | | | | | | | | | | | | | |
| Common equity tier 1 capital ratio (%) | | | 18.5 | | | | 18.5 | | | | 0.0 | | | | 12.8 | | | | 12.8 | | | | 0.0 | |
| | | | | | | | | | | | | | | | | | | | | | | | | |
| Tier 1 capital ratio (%) | | | 18.5 | | | | 18.5 | | | | 0.0 | | | | 12.8 | | | | 12.8 | | | | 0.0 | |
| | | | | | | | | | | | | | | | | | | | | | | | | |
| Total capital ratio (%) | | | 22.2 | | | | 22.2 | | | | 0.0 | | | | 15.4 | | | | 15.3 | | | | 0.0 | |
| | | | | | | | | | | | | | | | | | | | | | | | | |
| Basel III risk-weighted assets | | | 228,557 | | | | 228,557 | | | | 0 | | | | 225,153 | | | | 225,153 | | | | 0 | |
| | | | | | | | | | | | | | | | | | | | | | | | | |
236
|
Risk, treasury and capital management |
|
|
Risk-weighted assets
Our risk-weighted assets (RWA) under BIS Basel III are the same as under Swiss SRB Basel III. RWA on a fully applied basis are the same as on a phase-in basis, except for differences related to the adoption of IAS 19 (revised) Employee Benefits, which are phased in between 2014 and 2018. On a fully applied basis, net defined benefit assets / liabilities are determined in accordance with IAS 19 (revised), and any net defined benefit asset that is recognized is deducted from common equity tier 1 capital rather than being risk-weighted. On a phase-in basis, defined benefit-related assets / liabilities are determined in accordance with the previous IAS 19 requirements (“corridor method”), and any defined benefit-related asset that is recognized is risk-weighted at 100%. As a result, our phase-in RWA as of 31 December 2013 were CHF 3.4 billion higher than our fully applied RWA.
Phase-in RWA decreased by CHF 33.2 billion to CHF 228.6 billion in 2013 and fully applied RWA by CHF 32.9 billion to CHF 225.2 billion. These decreases were both mainly due to a CHF 41 billion reduction in credit risk RWA and a CHF 17 billion reduction in market risk RWA, partly offset by a CHF 25 billion increase in operational risk RWA, primarily due to the aforementioned supplemental operational risk capital analysis.
In accordance with our strategy to focus on sustainable, less capital-intensive business activities and due to our active portfolio management and risk-mitigation activities, RWA both in the Investment Bank and in Corporate Center – Non-core and Legacy Portfolio were substantially reduced during 2013.
The tables “Basel III RWA by risk type, exposure and reporting segment” and “Basel III RWA movement by key driver, risk type and reporting segment” on the following pages provide more granular disclosures of RWA movements by reporting segment.
| | è | | Refer to “Investment Bank” and “Corporate Center” in the “Financial and operating performance” section and to the “Risk management and control” section of this report for more information on RWA developments |
| | è | | Refer to “Table 2: Detailed segmentation of Basel III exposures and risk-weighted assets” in the “Supplemental disclosures required under Basel III Pillar 3 regulations” section of this report for more information on gross and net exposure at default by exposure segment |
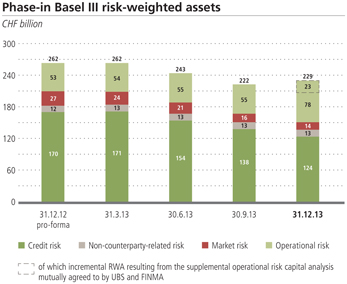
The following changes in our RWA calculations are expected to add approximately CHF 3 billion to our RWA in the first quarter of 2014: (i) a further reduction of the difference in the RWA calculation for Swiss residential mortgages between the advanced internal ratings-based (IRB) and the standardized approaches as a result of the FINMA requirement to apply a bank-specific multiplier for banks using the internal ratings-based approach (this difference will be reduced annually until 2019) and (ii) net long and net short securitization positions in the trading book requiring separate underpinning, (rather than the higher of net long or net short positions underpinned during the transitional phase until 31 December 2013).
237
Risk, treasury and capital management
Capital management
Basel III RWA by risk type, exposure and reporting segment
| | | | | | | | | | | | | | | | | | | | | | | | | | | | | | | | | | | | | | |
| | | | | 31.12.13 | |
| CHF billion | | | | Wealth
Management | | | Wealth
Management
Americas | | | Retail &
Corporate | | | Global Asset
Management | | | Investment
Bank | | | CC –
Core
Functions | | | CC – Non-core
and
Legacy
Portfolio | | | Total
RWA | | | Total capital
requirement1 | |
Credit risk | | | | | 12 | | | | 8 | | | | 30 | | | | 3 | | | | 36 | | | | 5 | | | | 31 | | | | 124 | 2 | | | 11 | |
Advanced IRB approach | | | | | 8 | | | | 2 | | | | 27 | | | | 1 | | | | 29 | | | | 4 | | | | 25 | | | | 97 | | | | 8 | |
Sovereigns | | | | | 0 | | | | 0 | | | | 0 | | | | 0 | | | | 0 | | | | 0 | | | | 0 | | | | 1 | | | | 0 | |
Banks | | | | | 0 | | | | 0 | | | | 1 | | | | 0 | | | | 7 | | | | 1 | | | | 2 | | | | 12 | | | | 1 | |
Corporates3 | | | | | 0 | | | | 0 | | | | 14 | | | | 0 | | | | 18 | | | | 2 | | | | 6 | | | | 41 | | | | 3 | |
Retail | | | | | 7 | | | | 2 | | | | 10 | | | | 0 | | | | 0 | | | | 0 | | | | 0 | | | | 20 | | | | 2 | |
Other4 | | | | | 1 | | | | 0 | | | | 1 | | | | 1 | | | | 3 | | | | 0 | | | | 17 | | | | 24 | | | | 2 | |
| | | | | | | | | | | | | | | | | | | | | | | | | | | | | | | | | | | | | | | |
Standardized approach | | | | | 4 | | | | 6 | | | | 3 | | | | 1 | | | | 7 | | | | 1 | | | | 6 | | | | 27 | | | | 2 | |
Sovereigns | | | | | 0 | | | | 0 | | | | 0 | | | | 0 | | | | 0 | | | | 0 | | | | 0 | | | | 0 | | | | 0 | |
Banks | | | | | 0 | | | | 1 | | | | 0 | | | | 0 | | | | 0 | | | | 0 | | | | 0 | | | | 2 | | | | 0 | |
Corporates | | | | | 2 | | | | 3 | | | | 2 | | | | 1 | | | | 2 | | | | 2 | | | | 2 | | | | 14 | | | | 1 | |
Central counterparties | | | | | 0 | | | | 0 | | | | 0 | | | | 0 | | | | 1 | | | | 1 | | | | 0 | | | | 2 | | | | 0 | |
Retail | | | | | 2 | | | | 2 | | | | 0 | | | | 0 | | | | 0 | | | | 0 | | | | 0 | | | | 3 | | | | 0 | |
Other4 | | | | | 0 | | | | 0 | | | | 0 | | | | 0 | | | | 4 | | | | (2 | ) | | | 4 | | | | 6 | | | | 0 | |
| | | | | | | | | | | | | | | | | | | | | | | | | | | | | | | | | | | | | | | |
Non-counterparty-related risk | | | | | 0 | | | | 0 | | | | 0 | | | | 0 | | | | 0 | | | | 12 | | | | 0 | | | | 13 | | | | 1 | |
| | | | | | | | | | | | | | | | | | | | | | | | | | | | | | | | | | | | | | | |
Market risk | | | | | 0 | | | | 2 | | | | 0 | | | | 0 | | | | 8 | | | | (5 | )5 | | | 9 | | | | 14 | 2 | | | 1 | |
Value-at-risk (VaR) | | | | | 0 | | | | 0 | | | | 0 | | | | 0 | | | | 2 | | | | (1 | ) | | | 1 | | | | 2 | | | | 0 | |
Stressed value-at-risk (SVaR) | | | | | 0 | | | | 1 | | | | 0 | | | | 0 | | | | 3 | | | | (2 | ) | | | 2 | | | | 3 | | | | 0 | |
Add-on for risks-not-in-VaR | | | | | 0 | | | | 0 | | | | 0 | | | | 0 | | | | 1 | | | | 0 | | | | 1 | | | | 2 | | | | 0 | |
Incremental risk charge (IRC) | | | | | 0 | | | | 0 | | | | 0 | | | | 0 | | | | 2 | | | | (1 | ) | | | 0 | | | | 1 | | | | 0 | |
Comprehensive risk measure (CRM) | | | | | 0 | | | | 0 | | | | 0 | | | | 0 | | | | 0 | | | | 0 | | | | 4 | | | | 4 | | | | 0 | |
Securitization / re-securitization in the trading book | | | | | 0 | | | | 0 | | | | 0 | | | | 0 | | | | 0 | | | | 0 | | | | 2 | | | | 2 | | | | 0 | |
| | | | | | | | | | | | | | | | | | | | | | | | | | | | | | | | | | | | | | | |
Operational risk | | | | | 9 | | | | 15 | | | | 1 | | | | 1 | | | | 19 | | | | 9 | | | | 23 | | | | 78 | | | | 7 | |
of which: incremental RWA6 | | | | | 3 | | | | 4 | | | | 0 | | | | 0 | | | | 6 | | | | 3 | | | | 7 | | | | 23 | | | | 2 | |
| | | | | | | | | | | | | | | | | | | | | | | | | | | | | | | | | | | | | | | |
Total Basel III RWA phase-in | | | | | 21 | | | | 24 | | | | 31 | | | | 4 | | | | 63 | | | | 21 | | | | 64 | | | | 229 | | | | 20 | |
| | | | | | | | | | | | | | | | | | | | | | | | | | | | | | | | | | | | | | | |
Phase-out items | | | | | 0 | | | | 0 | | | | 2 | | | | 0 | | | | 0 | | | | 1 | | | | 0 | | | | 3 | | | | | |
| | | | | �� | | | | | | | | | | �� | | | | | | | | | | | | | | | | | | | | | | | | |
Total Basel III RWA fully applied | | | | | 21 | | | | 24 | | | | 30 | | | | 4 | | | | 62 | | | | 21 | | | | 64 | | | | 225 | | | | | |
| | | | | | | | | | | | | | | | | | | | | | | | | | | | | | | | | | | | | | | |
1 Calculated based on our Swiss SRB Basel III total capital requirement of 8.6% of RWA.2 In line with Basel III Pillar 1 requirements, RWA related to securitization / re-securitization in the trading book are newly presented as market risk RWA. Previously, these RWA were presented as credit risk RWA. Prior periods were restated for this change in presentation.3 Includes stressed expected positive exposures across all exposure classes.4 Includes securitization / re-securitization exposures in the banking book, equity exposures in the banking book according to the simple risk weight method, credit valuation adjustments, settlement risk and business transfers.5 Corporate Center – Core Functions market risk RWA were negative as this included the effect of portfolio diversification across businesses.6 Reflects the effect of the supplemental operational risk capital analysis mutually agreed to by UBS and FINMA.
RWA movement by risk type, exposure and reporting segment
Credit risk
Phase-in credit risk RWA amounted to CHF 124 billion as of 31 December 2013 compared with CHF 166 billion as of 31 December 2012.
This decrease was mainly due to a CHF 24 billion reduction related to Other exposure segments. This was primarily driven by a reduction in RWA for advanced and standardized credit valuation adjustments (CVA) of CHF 18 billion, mainly due to benefits from economic CVA hedges, ratings migration, reduced exposures and market-driven reductions in Corporate Center – Non
core and Legacy Portfolio and to a lesser extent in the Investment Bank. Furthermore, a decline of CHF 6 billion was realized due to the sale of securitization exposures in Corporate Center – Legacy Portfolio.
Credit risk RWA for exposures to corporates decreased by CHF 10 billion, primarily due to a reduction in drawn loans, undrawn loan commitments and derivative exposures in Wealth Management Americas, Investment Bank and Corporate Center – Non-core and Legacy Portfolio.
Credit risk RWA for exposures to banks declined by CHF 6 billion, mainly due to lower derivative exposures in the Investment Bank and Corporate Center – Non-core and Legacy Portfolio.
238
|
Risk, treasury and capital management |
|
|
Basel III RWA by risk type, exposure and reporting segment (continued)
| | | | | | | | | | | | | | | | | | | | | | | | | | | | | | | | | | | | | | |
| | | | | 31.12.12 (pro-forma) | |
| CHF billion | | | | Wealth
Management | | | Wealth
Management
Americas | | | Retail &
Corporate | | | Global Asset
Management | | | Investment
Bank | | | CC – Core
Functions | | | CC –Non-
core and
Legacy
Portfolio | | | Total
RWA | | | Total capital
requirement1 | |
Credit risk | | | | | 11 | | | | 9 | | | | 31 | | | | 3 | | | | 42 | | | | 6 | | | | 64 | | | | 166 | 2 | | | 13 | |
Advanced IRB approach | | | | | 8 | | | | 2 | | | | 28 | | | | 2 | | | | 36 | | | | 4 | | | | 54 | | | | 133 | | | | 11 | |
Sovereigns | | | | | 0 | | | | 0 | | | | 0 | | | | 0 | | | | 0 | | | | 0 | | | | 1 | | | | 2 | | | | 0 | |
Banks | | | | | 1 | | | | 0 | | | | 1 | | | | 0 | | | | 10 | | | | 1 | | | | 5 | | | | 18 | | | | 1 | |
Corporates3 | | | | | 0 | | | | 0 | | | | 15 | | | | 0 | | | | 21 | | | | 2 | | | | 11 | | | | 50 | | | | 4 | |
Retail | | | | | 6 | | | | 2 | | | | 11 | | | | 0 | | | | 0 | | | | 0 | | | | 0 | | | | 19 | | | | 2 | |
Other4 | | | | | 1 | | | | 0 | | | | 1 | | | | 2 | | | | 5 | | | | 1 | | | | 36 | | | | 44 | | | | 4 | |
| | | | | | | | | | | | | | | | | | | | | | | | | | | | | | | | | | | | | | | |
Standardized approach | | | | | 3 | | | | 7 | | | | 2 | | | | 1 | | | | 6 | | | | 2 | | | | 10 | | | | 33 | | | | 3 | |
Sovereigns | | | | | 0 | | | | 0 | | | | 0 | | | | 0 | | | | 0 | | | | 0 | | | | 0 | | | | 0 | | | | 0 | |
Banks | | | | | 0 | | | | 1 | | | | 0 | | | | 0 | | | | 0 | | | | 0 | | | | 0 | | | | 2 | | | | 0 | |
Corporates | | | | | 2 | | | | 4 | | | | 2 | | | | 1 | | | | 1 | | | | 1 | | | | 4 | | | | 15 | | | | 1 | |
Central counterparties | | | | | 0 | | | | 0 | | | | 0 | | | | 0 | | | | 1 | | | | 1 | | | | 1 | | | | 2 | | | | 0 | |
Retail | | | | | 1 | | | | 2 | | | | 0 | | | | 0 | | | | 0 | | | | 0 | | | | 0 | | | | 3 | | | | 0 | |
Other4 | | | | | 0 | | | | 0 | | | | 0 | | | | 0 | | | | 4 | | | | 0 | | | | 5 | | | | 10 | | | | 1 | |
| | | | | | | | | | | | | | | | | | | | | | | | | | | | | | | | | | | | | | | |
Non-counterparty-related risk | | | | | 0 | | | | 0 | | | | 0 | | | | 0 | | | | 0 | | | | 12 | | | | 0 | | | | 12 | | | | 1 | |
| | | | | | | | | | | | | | | | | | | | | | | | | | | | | | | | | | | | | | | |
Market risk | | | | | 0 | | | | 2 | | | | 0 | | | | 0 | | | | 7 | | | | (2 | )5 | | | 25 | | | | 31 | 2 | | | 2 | |
Value-at-risk (VaR) | | | | | 0 | | | | 1 | | | | 0 | | | | 0 | | | | 1 | | | | (2 | ) | | | 3 | | | | 4 | | | | 0 | |
Stressed value-at-risk (SVaR) | | | | | 0 | | | | 1 | | | | 0 | | | | 0 | | | | 2 | | | | (3 | ) | | | 5 | | | | 6 | | | | 0 | |
Add-on for risks-not-in-VaR6 | | | | | 0 | | | | 0 | | | | 0 | | | | 0 | | | | 2 | | | | 0 | | | | 2 | | | | 3 | | | | 0 | |
Incremental risk charge (IRC) | | | | | 0 | | | | 0 | | | | 0 | | | | 0 | | | | 1 | | | | 2 | | | | 2 | | | | 5 | | | | 0 | |
Comprehensive risk measure (CRM) | | | | | 0 | | | | 0 | | | | 0 | | | | 0 | | | | 0 | | | | 0 | | | | 9 | | | | 9 | | | | 1 | |
Securitization/re-securitization in the trading book | | | | | 0 | | | | 0 | | | | 0 | | | | 0 | | | | 0 | | | | 0 | | | | 4 | | | | 4 | 2 | | | 0 | |
| | | | | | | | | | | | | | | | | | | | | | | | | | | | | | | | | | | | | | | |
Operational risk | | | | | 7 | | | | 13 | | | | 1 | | | | 1 | | | | 16 | | | | 1 | | | | 14 | | | | 53 | | | | 4 | |
| | | | | | | | | | | | | | | | | | | | | | | | | | | | | | | | | | | | | | | |
Total Basel III RWA phase-in | | | | | 19 | | | | 24 | | | | 32 | | | | 4 | | | | 65 | | | | 17 | | | | 103 | | | | 262 | | | | 21 | |
| | | | | | | | | | | | | | | | | | | | | | | | | | | | | | | | | | | | | | | |
Phase-out items | | | | | 0 | | | | 0 | | | | 2 | | | | 0 | | | | 1 | | | | 1 | | | | 0 | | | | 4 | | | | | |
| | | | | | | | | | | | | | | | | | | | | | | | | | | | | | | | | | | | | | | |
Total Basel III RWA fully applied | | | | | 18 | | | | 23 | | | | 30 | | | | 4 | | | | 64 | | | | 16 | | | | 103 | | | | 258 | | | | | |
| | | | | | | | | | | | | | | | | | | | | | | | | | | | | | | | | | | | | | | |
1 Calculated based on our Swiss SRB Basel III total capital requirement of 8.0% of RWA.2 In line with Basel III Pillar 1 requirements, RWA related to securitization / re-securitization in the trading book are newly presented as market risk RWA. Previously, these RWA were presented as credit risk RWA. Prior periods were restated for this change in presentation.3 Includes stressed expected positive exposures across all exposure classes.4 Includes securitization / re-securitization exposures in the banking book, equity exposures in the banking book according to the simple risk weight method, credit valuation adjustments, settlement risk and business transfers.5 Corporate Center – Core Functions market risk RWA were negative as this included the effect of portfolio diversification across businesses.6 RWA related to risks-not-in-VaR are presented on a Basel 2.5 basis.
Non-counterparty-related risk
Phase-in non-counterparty-related risk RWA amounted to CHF 13 billion as of 31 December 2013 compared with CHF 12 billion as of 31 December 2012.
Market risk
Phase-in market risk RWA amounted to CHF 14 billion as of 31 December 2013 compared with CHF 31 billion as of 31 December 2012. This decline was due to a CHF 5 billion decrease in the comprehensive risk measure, a decline of CHF 4 billion in the incremental risk charge and reductions of CHF 2 billion, CHF 3 billion and CHF 1 billion in RWA related to value-at-risk (VaR),
stressed VaR and risks-not-in-VaR, respectively. From a reporting segment perspective, the aforementioned decrease in market risk RWA was almost entirely recorded in Corporate Center – Non-core and Legacy Portfolio.
239
Risk, treasury and capital management
Capital management
Basel III RWA by risk type, exposure and reporting segment (continued)
| | | | | | | | | | | | | | | | | | | | | | | | | | | | | | | | | | | | |
| | 31.12.13 vs 31.12.12 (pro-forma) | |
| CHF billion | | Wealth
Management | | | Wealth
Management
Americas | | | Retail &
Corporate | | | Global Asset
Management | | | Investment
Bank | | | CC – Core
Functions | | | CC –Non-
core and
Legacy
Portfolio | | | Total
RWA | | | Total
capital
requirement | |
| | | | | | | | | | | | | | | | | | | | | | | | | | | | | | | | | | | | | |
| Credit risk | | | 1 | | | | (1 | ) | | | (1 | ) | | | 0 | | | | (7 | ) | | | (1 | ) | | | (32 | ) | | | (41 | ) | | | (3 | ) |
| | | | | | | | | | | | | | | | | | | | | | | | | | | | | | | | | | | | | |
| Advanced IRB approach | | | 1 | | | | 1 | | | | (1 | ) | | | 0 | | | | (7 | ) | | | 0 | | | | (28 | ) | | | (35 | ) | | | (2 | ) |
| | | | | | | | | | | | | | | | | | | | | | | | | | | | | | | | | | | | | |
Sovereigns | | | 0 | | | | 0 | | | | 0 | | | | 0 | | | | 0 | | | | 0 | | | | (1 | ) | | | (1 | ) | | | 0 | |
| | | | | | | | | | | | | | | | | | | | | | | | | | | | | | | | | | | | | |
Banks | | | 0 | | | | 0 | | | | 0 | | | | 0 | | | | (3 | ) | | | 0 | | | | (4 | ) | | | (6 | ) | | | 0 | |
| | | | | | | | | | | | | | | | | | | | | | | | | | | | | | | | | | | | | |
Corporates | | | 0 | | | | 0 | | | | 0 | | | | 0 | | | | (4 | ) | | | 0 | | | | (5 | ) | | | (9 | ) | | | 0 | |
| | | | | | | | | | | | | | | | | | | | | | | | | | | | | | | | | | | | | |
Retail | | | 1 | | | | 1 | | | | 0 | | | | 0 | | | | 0 | | | | 0 | | | | 0 | | | | 1 | | | | 0 | |
| | | | | | | | | | | | | | | | | | | | | | | | | | | | | | | | | | | | | |
Other | | | 0 | | | | 0 | | | | 0 | | | | 0 | | | | (1 | ) | | | 0 | | | | (18 | ) | | | (20 | ) | | | (1 | ) |
| | | | | | | | | | | | | | | | | | | | | | | | | | | | | | | | | | | | | |
| Standardized approach | | | 1 | | | | (2 | ) | | | 0 | | | | 0 | | | | 0 | | | | (1 | ) | | | (4 | ) | | | (6 | ) | | | 0 | |
| | | | | | | | | | | | | | | | | | | | | | | | | | | | | | | | | | | | | |
Sovereigns | | | 0 | | | | 0 | | | | 0 | | | | 0 | | | | 0 | | | | 0 | | | | 0 | | | | 0 | | | | 0 | |
| | | | | | | | | | | | | | | | | | | | | | | | | | | | | | | | | | | | | |
Banks | | | 0 | | | | 0 | | | | 0 | | | | 0 | | | | 0 | | | | 0 | | | | 0 | | | | 0 | | | | 0 | |
| | | | | | | | | | | | | | | | | | | | | | | | | | | | | | | | | | | | | |
Corporates | | | 0 | | | | (1 | ) | | | 0 | | | | 0 | | | | 1 | | | | 1 | | | | (2 | ) | | | (1 | ) | | | 0 | |
| | | | | | | | | | | | | | | | | | | | | | | | | | | | | | | | | | | | | |
Central counterparties | | | 0 | | | | 0 | | | | 0 | | | | 0 | | | | 0 | | | | 0 | | | | (1 | ) | | | 0 | | | | 0 | |
| | | | | | | | | | | | | | | | | | | | | | | | | | | | | | | | | | | | | |
Retail | | | 0 | | | | 0 | | | | 0 | | | | 0 | | | | 0 | | | | 0 | | | | 0 | | | | 0 | | | | 0 | |
| | | | | | | | | | | | | | | | | | | | | | | | | | | | | | | | | | | | | |
Other | | | 0 | | | | 0 | | | | 0 | | | | 0 | | | | (1 | ) | | | (2 | ) | | | (2 | ) | | | (4 | ) | | | 0 | |
| | | | | | | | | | | | | | | | | | | | | | | | | | | | | | | | | | | | | |
| Non-counterparty-related risk | | | 0 | | | | 0 | | | | 0 | | | | 0 | | | | 0 | | | | 1 | | | | 0 | | | | 0 | | | | 0 | |
| | | | | | | | | | | | | | | | | | | | | | | | | | | | | | | | | | | | | |
| Market risk | | | 0 | | | | 0 | | | | 0 | | | | 0 | | | | 1 | | | | (3 | ) | | | (15 | ) | | | (17 | ) | | | (1 | ) |
| | | | | | | | | | | | | | | | | | | | | | | | | | | | | | | | | | | | | |
Value-at-risk (VaR) | | | 0 | | | | 0 | | | | 0 | | | | 0 | | | | 0 | | | | 0 | | | | (2 | ) | | | (2 | ) | | | 0 | |
| | | | | | | | | | | | | | | | | | | | | | | | | | | | | | | | | | | | | |
Stressed value-at-risk (SVaR) | | | 0 | | | | 0 | | | | 0 | | | | 0 | | | | 0 | | | | 1 | | | | (4 | ) | | | (3 | ) | | | 0 | |
| | | | | | | | | | | | | | | | | | | | | | | | | | | | | | | | | | | | | |
Add-on for risks-not-in-VaR | | | 0 | | | | 0 | | | | 0 | | | | 0 | | | | 0 | | | | 0 | | | | (1 | ) | | | (1 | ) | | | 0 | |
| | | | | | | | | | | | | | | | | | | | | | | | | | | | | | | | | | | | | |
Incremental risk charge (IRC) | | | 0 | | | | 0 | | | | 0 | | | | 0 | | | | 1 | | | | (4 | ) | | | (2 | ) | | | (4 | ) | | | 0 | |
| | | | | | | | | | | | | | | | | | | | | | | | | | | | | | | | | | | | | |
Comprehensive risk measure (CRM) | | | 0 | | | | 0 | | | | 0 | | | | 0 | | | | 0 | | | | 0 | | | | (5 | ) | | | (5 | ) | | | 0 | |
| | | | | | | | | | | | | | | | | | | | | | | | | | | | | | | | | | | | | |
Securitization/re-securitization in the trading book | | | 0 | | | | 0 | | | | 0 | | | | 0 | | | | 0 | | | | 0 | | | | (2 | ) | | | (2 | ) | | | 0 | |
| | | | | | | | | | | | | | | | | | | | | | | | | | | | | | | | | | | | | |
| Operational risk | | | 2 | | | | 2 | | | | 0 | | | | 0 | | | | 4 | | | | 8 | | | | 9 | | | | 25 | | | | 2 | |
| | | | | | | | | | | | | | | | | | | | | | | | | | | | | | | | | | | | | |
| Total Basel III RWA phase-in | | | 3 | | | | 1 | | | | 0 | | | | 0 | | | | (2 | ) | | | 5 | | | | (39 | ) | | | (33 | ) | | | (1 | ) |
| | | | | | | | | | | | | | | | | | | | | | | | | | | | | | | | | | | | | |
| Phase-out items | | | 0 | | | | 0 | | | | 0 | | | | 0 | | | | 0 | | | | 0 | | | | 0 | | | | 0 | | | | | |
| | | | | | | | | | | | | | | | | | | | | | | | | | | | | | | | | | | | | |
| Total Basel III RWA fully applied | | | 3 | | | | 1 | | | | 0 | | | | 0 | | | | (2 | ) | | | 5 | | | | (39 | ) | | | (33 | ) | | | | |
| | | | | | | | | | | | | | | | | | | | | | | | | | | | | | | | | | | | | |
Operational risk
Phase-in operational risk RWA amounted to CHF 78 billion as of 31 December 2013, an increase of CHF 25 billion compared with 31 December 2012, primarily due to incremental RWA of CHF 22.5 billion resulting from the supplemental operational risk capital analysis mutually agreed to by UBS and FINMA.
During the fourth quarter of 2013 and January of 2014, UBS and FINMA reviewed the temporary operational risk-related RWA add-on that became effective on 1 October 2013. Following a review of the advanced measurement approach (AMA) model, the litigation exposures and contingent liabilities of UBS, provisioning movements and methodologies, and progress on managing other operational risks, UBS and FINMA mutually agreed that, effective on 31 December 2013, a supplemental analysis will be used to calculate the incre-
mental operational risk capital required to be held for litigation, regulatory and similar matters and other contingent liabilities. The incremental CHF 22.5 billion operational risk-related RWA was allocated to the business divisions and Corporate Center proportionally to the amount of allocated operational risk-related RWA excluding the incremental RWA as of 31 December 2013. The allocation methodology for operational risk-related RWA excluding the incremental RWA is based on the cumulative operational risk-related loss history of the business divisions and Corporate Center – Non-core and Legacy Portfolio.
| | è | | Refer to the “Regulatory and legal developments” section of this report for more information on the incremental RWA resulting from the supplemental operational risk capital analysis mutually agreed to by UBS and FINMA |
|
Risk, treasury and capital management |
|
|
Basel III RWA movement by key driver, risk type and reporting segment
| | | | | | | | | | | | | | | | | | | | | | | | | | | | | | | | |
| CHF billion | | Wealth Management | | | Wealth Management Americas | | | Retail & Corporate | | | Global Asset Management | | | Investment Bank | | | CC–Core Functions | | | CC – Non- core and Legacy Portfolio | | | Group | |
| Total RWA balance as of 31.12.12 (pro-forma) | | | 19 | | | | 24 | | | | 32 | | | | 4 | | | | 65 | | | | 17 | | | | 103 | | | | 262 | |
| | | | | | | | | | | | | | | | | | | | | | | | | | | | | | | | | |
| Credit risk RWA movement during 2013: | | | 1 | | | | (1 | ) | | | (1 | ) | | | 0 | | | | (7 | ) | | | (1 | ) | | | (32 | ) | | | (41 | ) |
| | | | | | | | | | | | | | | | | | | | | | | | | | | | | | | | | |
Methodology changes and model parameter updates | | | 1 | | | | 0 | | | | 0 | | | | 0 | | | | (3 | ) | | | (1 | ) | | | (3 | ) | | | (6 | ) |
| | | | | | | | | | | | | | | | | | | | | | | | | | | | | | | | | |
Acquisitions and disposals of business operations | | | 0 | | | | 0 | | | | 0 | | | | 0 | | | | 0 | | | | 0 | | | | 0 | | | | 0 | |
| | | | | | | | | | | | | | | | | | | | | | | | | | | | | | | | | |
Book quality | | | 0 | | | | 0 | | | | 0 | | | | 0 | | | | 1 | | | | 0 | | | | (4 | ) | | | (3 | ) |
| | | | | | | | | | | | | | | | | | | | | | | | | | | | | | | | | |
Book size | | | 1 | | | | (1 | ) | | | (1 | ) | | | 0 | | | | (4 | ) | | | 0 | | | | (24 | ) | | | (29 | ) |
| | | | | | | | | | | | | | | | | | | | | | | | | | | | | | | | | |
Foreign currency translation effects | | | 0 | | | | 0 | | | | 0 | | | | 0 | | | | (1 | ) | | | 0 | | | | (2 | ) | | | (4 | ) |
| | | | | | | | | | | | | | | | | | | | | | | | | | | | | | | | | |
| Non-counterparty-related risk RWA movement during the year 2013: | | | 0 | | | | 0 | | | | 0 | | | | 0 | | | | 0 | | | | 1 | | | | 0 | | | | 0 | |
| | | | | | | | | | | | | | | | | | | | | | | | | | | | | | | | | |
Exposure movements | | | 0 | | | | 0 | | | | 0 | | | | 0 | | | | 0 | | | | 1 | | | | 0 | | | | 0 | |
| | | | | | | | | | | | | | | | | | | | | | | | | | | | | | | | | |
Foreign currency translation effects | | | 0 | | | | 0 | | | | 0 | | | | 0 | | | | 0 | | | | 0 | | | | 0 | | | | 0 | |
| | | | | | | | | | | | | | | | | | | | | | | | | | | | | | | | | |
| Market risk RWA movement during 2013: | | | 0 | | | | 0 | | | | 0 | | | | 0 | | | | 1 | | | | (3 | ) | | | (15 | ) | | | (17 | ) |
| | | | | | | | | | | | | | | | | | | | | | | | | | | | | | | | | |
Methodology changes | | | 0 | | | | 0 | | | | 0 | | | | 0 | | | | 0 | | | | 0 | | | | (1 | ) | | | (1 | ) |
| | | | | | | | | | | | | | | | | | | | | | | | | | | | | | | | | |
Model parameter updates | | | 0 | | | | 0 | | | | 0 | | | | 0 | | | | 0 | | | | 0 | | | | 0 | | | | 0 | |
| | | | | | | | | | | | | | | | | | | | | | | | | | | | | | | | | |
Regulatory add-ons | | | 0 | | | | 0 | | | | 0 | | | | 0 | | | | 0 | | | | 0 | | | | 1 | | | | 1 | |
| | | | | | | | | | | | | | | | | | | | | | | | | | | | | | | | | |
Movement in risk levels | | | 0 | | | | 0 | | | | 0 | | | | 0 | | | | 1 | | | | (3 | ) | | | (15 | ) | | | (17 | ) |
| | | | | | | | | | | | | | | | | | | | | | | | | | | | | | | | | |
| Operational risk RWA movement during 2013: | | | 2 | | | | 2 | | | | 0 | | | | 0 | | | | 4 | | | | 8 | | | | 9 | | | | 25 | |
| | | | | | | | | | | | | | | | | | | | | | | | | | | | | | | | | |
Incremental RWA | | | 3 | | | | 4 | | | | 1 | | | | 0 | | | | 6 | | | | 3 | | | | 7 | | | | 23 | |
| | | | | | | | | | | | | | | | | | | | | | | | | | | | | | | | | |
Other model parameter updates | | | (1 | ) | | | (2 | ) | | | 0 | | | | 0 | | | | (2 | ) | | | 5 | | | | 2 | | | | 2 | |
| | | | | | | | | | | | | | | | | | | | | | | | | | | | | | | | | |
| Total movement | | | 3 | | | | 1 | | | | 0 | | | | 0 | | | | (2 | ) | | | 5 | | | | (39 | ) | | | (33 | ) |
| Total RWA balance as of 31.12.13 (phase-in) | | | 21 | | | | 24 | | | | 31 | | | | 4 | | | | 63 | | | | 21 | | | | 64 | | | | 229 | |
| | |
| | RWA movement by key driver, risk type and reporting segment The following pages include information about the definitions of key driver categories and underlying judgments and assumptions. Credit risk The decrease of CHF 41 billion in credit risk RWA was mainly driven by reductions in book size in both Corporate Center – Non-core and Legacy Portfolio and the Investment Bank, primarily due to the aforementioned sale of securitization exposures, trade compressions and reduced derivative exposures, and a net improvement in book quality, primarily driven by economic CVA hedges in Corporate Center – Non-core and Legacy Portfolio. |
| | |
| | Market risk Substantially all of the decrease of CHF 17 billion in market risk RWA was the result of reduced market risk exposures. Only a small amount resulted from changes in methodology or routine model parameter updates. è Refer to “Corporate Center – Non-core and Legacy Portfolio” in the “Risk management and control” section of this report for more information on RWA by portfolio composition and exposure category |
241
Risk, treasury and capital management
Capital management
Key drivers of RWA movement by risk type
We employ a range of analyses in our RWA monitoring framework to identify the key drivers of movements in the positions. This includes a top-down identification approach for several sub-components of the RWA movement, leveraging information available from our monthly detailed calculation, substantiation and control processes. Particular attention is paid to identifying and segmenting items within the day-to-day control of the business and those items that are driven by changes in risk models or regulatory methodology. We transitioned to Basel III in the first quarter of 2013. As RWA as of 31 December 2012 represent Basel III pro-forma information, certain 2013 movements were allocated to the various movement types on a best efforts basis only.
Credit risk RWA movements
Methodology changes and model parameter updates
|
Represents RWA movements arising from the implementation of new models and from parameter changes to existing models. This movement type also includes regulatory methodology changes, reviews of modeling assumptions and refinements to our Basel III (pro-forma) calculations applied until January 2013. The RWA impact of model and methodology changes is estimated based on the portfolio at the time of the implementation of the change. Methodology changes and model parameter updates were not segregated due to a combination of the aforementioned complexity associated with the transition from Basel III (pro-forma) to Basel III, inherent complexity related to some components of credit risk and materiality aspects. |
Acquisitions and disposals of business operations
|
Represents the movement in RWA as a result of the disposal or acquisition of business operations, quantified based on the credit risk exposures as at the end of the month preceding a disposal or following an acquisition. Acquisition and disposal of exposures in the ordinary course of business are reflected under book size. |
Book quality
|
Represents RWA movements resulting from changes in the underlying credit quality of counterparties. These are caused by changes to risk parameters which arise from actions such as, but not limited to, model recalibration, change in counterparty external rating or new credit hedges. |
Book size
|
Represents RWA movements arising in the normal course of business, such as growth in credit exposures or reduction in book size from sales and write-offs. The amounts reported for each business division and Corporate Center may also include the effect of transfers and allocations of exposures between business divisions reflected in the period. Currently, the movement in book size is estimated based on amounts derived from the other four drivers. We will continue to refine our underlying RWA reporting and intend to provide more granular information in the future. |
Foreign currency translation effects
|
Represents RWA movements as a result of changes in exchange rates of the transaction currencies versus the Swiss franc. |
242
|
Risk, treasury and capital management |
|
|
Non-counterparty-related risk RWA movements
Exposure movements
| | |
RepresentsRWA movements arising in the normal course of business, such as purchase or sale of relevant underlying exposures. |
| Foreign currency translation effects |
Represents foreign currency translation effects on RWA movements as a result of changes in exchange rates of the transaction currencies versus the Swiss franc. |
| | |
| Market risk RWA movements |
| Methodology changes |
Represents methodology changes to the calculation driven by regulatory and internal policy decisions. In some cases, the effects of methodology changes have been assessed at the time of implementation, and may not reflect the effects for the entire year 2013. Further, methodology changes may, on occasion, be implemented at the same time as parameter updates and changes in regulatory add-ons, the effects of which cannot be fully disaggregated. |
| Model parameter updates |
Includes routine updates to model parameters such as the roll-forward of the five-year historical data used for VaR. The effect of each parameter update, assessed at the point of implementation, has been used to approximate the combined effect over the year. |
| Regulatory add-ons |
Represents entirely the “Risks-not-in-VaR (RniV)” add-on described in the “Risk management and control” section of this report. The effect of the annual recalibration has been calculated by applying the old and new multiplication factors to the year-end VaR- and SVaR-based RWA. |
| Movement in risk levels |
Represents changes as a result of movements in risk levels that are derived after accounting for the movements in the above three specific drivers. This includes changes in positions, effects of market moves on risk levels and currency translation effects. The amounts reported for each business division and Corporate Center may also include the effect of transfers and allocations of exposures between business divisions reflected in the period. |
| | |
| Operational risk RWA movements |
| Incremental RWA |
Represents RWA movements relating to changes in the incremental RWA resulting from the supplemental operational risk capital analysis mutually agreed to by UBS and FINMA. |
| Other model parameter updates |
Represents RWA movements arising from the regular update of our advanced measurement approach (AMA) model. |
243
Risk, treasury and capital management
Capital management
Swiss SRB leverage ratio
Requirements
The Swiss SRB leverage ratio is calculated by dividing the relevant capital amount by the three-month average total IFRS on-balance sheet assets and off-balance sheet items, based on the regulatory scope of consolidation and adjusted for netting of securities financing transactions and derivatives and other items. The capital considered in the calculation of the phase-in leverage ratio includes CET1 capital and loss-absorbing capital, but excludes tier 2 phase-out capital.
The table “Swiss SRB leverage ratio requirements” shows our total leverage ratio requirement, as well as the requirements by capital components, and our actual leverage ratio information. As of 31 December 2013, our CET1 capital covered the leverage ratio requirements for the base and buffer capital components, while our high- and low-trigger loss-absorbing capital satisfied our leverage ratio requirement for the progressive buffer component.
The Swiss SRB leverage ratio requirement is equal to 24% of the total capital ratio requirement. As of 31 December 2013, the effective total leverage ratio requirement was 2.06%, resulting from multiplying the total capital ratio requirement of 8.6% by 24%.
The Basel Committee on Banking Supervision (BCBS) issued a consultation on “Revised Basel III leverage ratio framework and disclosure requirements” in June 2013, followed by final rules in January 2014. The final calibration, and any final adjustments to the definition, will be completed by 2017. The ratio is expected to be incorporated within Pillar 1 capital requirements on 1 January
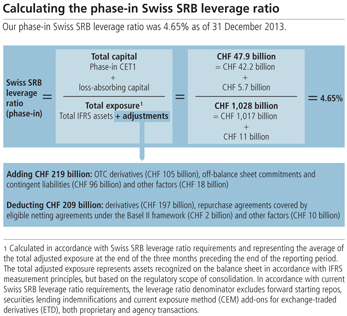
2018. According to the BCBS’s timetable, the disclosure requirements are to become effective as of 1 January 2015 subject to implementation by national regulators.
| | è | | Refer to the “Regulatory and legal developments” section of this report for more information on the new BIS Basel III leverage ratio framework published in January 2014 |
Swiss SRB leverage ratio requirements
| | | | | | | | | | | | | | | | | | | | | | | | | | | | |
| | | Phase-in | |
| | Requirements | | | Actual information | |
| | Required
Swiss SRB
leverage
ratio (%)1 | | | Swiss SRB
leverage
ratio capital
requirement | | | Available Swiss SRB Basel III capital | | | Actual Swiss SRB leverage ratio (%) | | | Capital type | |
| CHF million, except where indicated | | | | | | | 31.12.13 | | | | 31.12.13 | | | | 31.12.12 | | | | 31.12.13 | | | | 31.12.12 | | | | | |
| | | | | | | | | | | | | | | | | | | | | | | | | | | | | |
| Base capital | | | 0.84 | | | | 8,634 | | | | 8,634 | | | | 10,219 | | | | 0.84 | | | | 0.84 | | | | CET1 | |
| | | | | | | | | | | | | | | | | | | | | | | | | | | | | |
| Buffer capital | | | 0.86 | 2 | | | 8,795 | | | | 33,545 | 3 | | | 29,813 | 3 | | | 3.26 | | | | 2.45 | | | | CET1 | |
| | | | | | | | | | | | | | | | | | | | | | | | | | | | | |
| Progressive buffer | | | 0.36 | | | | 3,700 | | | | 5,665 | 4 | | | 4,160 | 4 | | | 0.55 | | | | 0.34 | | | | LAC | |
| | | | | | | | | | | | | | | | | | | | | | | | | | | | | |
| Total | | | 2.06 | | | | 21,130 | | | | 47,844 | | | | 44,192 | | | | 4.65 | | | | 3.63 | | | | | |
| | | | | | | | | | | | | | | | | | | | | | | | | | | | | |
1 Requirements for base capital (24% of 3.5%), buffer capital (24% of 3.6%) and progressive buffer capital (24% of 1.5%).2 This includes the effect of the countercyclical buffer requirement.3 Swiss SRB Basel III CET1 exceeding the base capital requirements is allocated to the buffer capital.4 During the transition period until end of 2017, high-trigger loss-absorbing capital (LAC) can be included in the progressive buffer.
244
|
Risk, treasury and capital management |
|
|
Developments during 2013
Our phase-in total Swiss SRB leverage ratio increased 102 basis points to 4.65% as of 31 December 2013 from 3.63% as of 31 December 2012. This increase was mainly due to a CHF 189 billion decrease in the total adjusted exposure, also known as the leverage ratio denominator, resulting in an improvement of 70 basis points to the leverage ratio. In addition, the aforementioned increases in CET1 and loss-absorbing capital contributed 32 basis points to the improvement in the leverage ratio on a phase-in basis.
The exposure reduction of CHF 189 billion mainly reflected a CHF 253 billion reduction in average on-balance sheet assets,
resulting from reductions in average positive replacement values and financial investments available-for-sale, partly offset by an increase of CHF 75 billion from the combined net effect of reduced derivative and securities financing exposure netting and a lower current exposure add-on for derivative exposures. Furthermore, the adjusted exposure for off-balance sheet items and assets of entities consolidated under IFRS but not under the regulatory scope of consolidation decreased by CHF 5 billion and CHF 7 billion, respectively.
On a fully applied basis, our Swiss SRB leverage ratio increased 96 basis points to 3.39% as of 31 December 2013 from 2.43% as of 31 December 2012.
Swiss SRB leverage ratio
| | | | | | | | |
| CHF million, except where indicated | | Average 4Q13 | | | Pro-forma
Average 4Q12 | |
| Total on-balance sheet assets1 | | | 1,017,335 | | | | 1,270,627 | |
| Netting of securities financing transactions | | | (1,537 | ) | | | (20,508 | ) |
| | | | | | | | | |
| Netting of derivative exposures | | | (196,992 | ) | | | (332,076 | ) |
| | | | | | | | | |
| Current exposure method (CEM add-on) for derivative exposures | | | 105,352 | | | | 184,180 | |
| | | | | | | | | |
| Off-balance sheet items | | | 96,256 | | | | 101,708 | |
| | | | | | | | | |
of which: commitments and guarantees – unconditionally cancellable (10%) | | | 21,538 | | | | 20,168 | |
| | | | | | | | | |
of which: commitments and guarantees – other than unconditionally cancellable (100%) | | | 74,719 | | | | 81,540 | |
| | | | | | | | | |
| Assets of entities consolidated under IFRS but not in regulatory scope of consolidation | | | 17,878 | | | | 24,630 | |
| | | | | | | | | |
| Items deducted from Swiss SRB Basel III tier 1 capital, phase-in (at period-end) | | | (10,428 | ) | | | (12,000 | ) |
| Total adjusted exposure (“leverage ratio denominator”)2 | | | 1,027,864 | | | | 1,216,561 | |
| |
| | | As of | |
| | | | 31.12.13 | | | | 31.12.12 | |
| Swiss SRB Basel III common equity tier 1 capital (phase-in) | | | 42,179 | | | | 40,032 | |
| | | | | | | | | |
| Swiss SRB Basel III loss-absorbing capital | | | 5,665 | | | | 4,160 | |
| | | | | | | | | |
| Swiss SRB Basel III common equity tier 1 capital including loss-absorbing capital | | | 47,844 | | | | 44,192 | |
| Swiss SRB leverage ratio phase-in (formerly referred to as “FINMA Basel III leverage ratio”) (%) | | | 4.65 | | | | 3.63 | |
1 Represent assets recognized on the balance sheet in accordance with IFRS measurement principles, but based on the regulatory scope of consolidation. Refer to the “Supplemental disclosures required under Basel III Pillar 3 regulations” section of this report for more information on the regulatory scope of consolidation.2 In accordance with current Swiss SRB leverage ratio requirements, the leverage ratio denominator excludes forward starting repos, securities lending indemnifications and CEM add-ons for exchange-traded derivatives (ETD), both proprietary and agency transactions.
245
Risk, treasury and capital management
Capital management
Swiss SRB leverage ratio denominator
We implemented the disclosure of the Swiss SRB leverage ratio on a Group level in 2013, with comparative 2012 information provided on a pro-forma basis only. The table below provides Swiss SRB leverage ratio denominator information by reporting segment for 31 December 2013
which represents the average of the fourth quarter 2013. It is the first time such segment disclosure is made. No comparative information is provided in this table due to organizational changes.
Swiss SRB leverage ratio denominator by reporting segment
| | | | | | | | | | | | | | | | | | | | | | | | | | | | | | | | |
| | | Average 4Q13 | |
| CHF billion | | Wealth
Management | | | Wealth
Management
Americas | | | Retail &
Corporate | | | Global Asset
Management | | | Investment
Bank | | | CC –
Core
Functions | | | CC –
Non-core
and Legacy
Portfolio | | | Total LRD | |
Total on-balance sheet assets1 | | | 104.9 | | | | 45.3 | | | | 142.8 | | | | 4.0 | | | | 245.9 | | | | 245.1 | | | | 229.4 | | | | 1,017.3 | |
Netting of securities financing transactions | | | 0.0 | | | | (0.0 | ) | | | 0.0 | | | | 0.0 | | | | (1.1 | ) | | | (0.4 | ) | | | 0.0 | | | | (1.5 | ) |
Netting of derivative expsoures | | | (0.1 | ) | | | (0.0 | ) | | | (0.3 | ) | | | 0.0 | | | | (49.0 | ) | | | 0.0 | | | | (147.6 | ) | | | (197.0 | ) |
Current exposure method (CEM add-on) for derivative exposures | | | 1.2 | | | | 0.0 | | | | 1.1 | | | | 0.0 | | | | 34.4 | | | | 0.0 | | | | 68.6 | | | | 105.4 | |
Off-balance sheet items | | | 9.6 | | | | 11.7 | | | | 21.1 | | | | 0.0 | | | | 44.2 | | | | 0.0 | | | | 9.6 | | | | 96.3 | |
of which: commitments and guarantees – unconditionally cancellable (10%) | | | 5.9 | | | | 11.0 | | | | 4.2 | | | | 0.0 | | | | 0.4 | | | | 0.0 | | | | 0.0 | | | | 21.5 | |
of which: commitments and guarantees – other than unconditionally cancellable (100%) | | | 3.7 | | | | 0.6 | | | | 16.9 | | | | 0.0 | | | | 43.9 | | | | 0.0 | | | | 9.6 | | | | 74.7 | |
Assets of entities consolidated under IFRS but not in regulatory scope of consolidation | | | 6.6 | | | | 0.2 | | | | 0.0 | | | | 10.0 | | | | 0.9 | | | | 0.2 | | | | (0.0 | ) | | | 17.9 | |
Items deducted from Swiss SRB Basel III tier 1 capital, phase-in (at period-end) | | | | | | | | | | | | | | | | | | | | | | | (10.4 | ) | | | | | | | (10.4 | ) |
Total adjusted exposure (“leverage ratio denominator”)2 | | | 122.1 | | | | 57.2 | | | | 164.7 | | | | 14.0 | | | | 275.3 | | | | 234.5 | | | | 160.0 | | | | 1,027.9 | |
| | | | | | | | | | | | | | | | | | | | | | | | | | | | | | | | | |
1 Represent assets recognized on the balance sheet in accordance with IFRS measurement principles, but based on the regulatory scope of consolidation. Refer to the “Supplemental disclosures required under Basel III Pillar 3 regulations” section of this report for more information on the regulatory scope of consolidation.2 In accordance with current Swiss SRB leverage ratio requirements, the leverage ratio denominator excludes forward starting repos, securities lending indemnifications and CEM add-ons for exchange-traded derivatives (ETD), both proprietary and agency transactions.
246
|
Risk, treasury and capital management |
|
|
Equity attribution framework
The equity attribution framework reflects our objectives of maintaining a strong capital base and managing performance, by guiding each business towards activities that appropriately balance profit potential, risk and capital usage. This framework, which includes some forward-looking elements, enables us to integrate Group-wide capital management activities with those at a business division level and to calculate and assess return on attributed equity (RoAE) in each of our business divisions.
Tangible equity is attributed to our business divisions by applying a weighted-driver approach that combines phase-in Basel III capital requirements with internal models to determine the amount of capital required to cover each business division’s risk. RWA and leverage ratio denominator usage are converted to their common equity tier 1 (CET1) equivalents based on capital ratios
as targeted by industry peers. Risk-based capital (RBC) is converted to its CET1 equivalent based on a conversion factor that considers the amount of RBC exposure covered by loss-absorbing capital. In addition to tangible equity, we allocate equity to support goodwill and intangible assets as well as certain capital deduction items. The amount of equity attributed to all business divisions and Corporate Center corresponds to the amount we believe is required to maintain a strong capital base and to support our businesses adequately, and can differ from the Group’s actual equity during a given period.
Average total equity attributed to the business divisions and Corporate Center was CHF 43.5 billion in 2013, a decrease from CHF 50.8 billion for 2012. This reduction was due to decreases in RWA, the leverage ratio denominator and RBC as a result of the
Average attributed equity
| | | | | | | | |
| | | For the year ended | |
| CHF billion | | 31.12.13 | | | 31.12.12 | |
| Wealth Management | | | 3.5 | | | | 4.0 | |
| | | | | | | | | |
| Wealth Management Americas | | | 2.8 | | | | 6.2 | |
| | | | | | | | | |
| Retail & Corporate | | | 4.1 | | | | 4.5 | |
| | | | | | | | | |
| Global Asset Management | | | 1.8 | | | | 2.2 | |
| | | | | | | | | |
| Investment Bank | | | 8.0 | | | | 10.9 | |
| | | | | | | | | |
| Corporate Center | | | 23.3 | | | | 23.1 | |
| | | | | | | | | |
of which: Core Functions | | | 12.5 | | | | 6.6 | |
| | | | | | | | | |
of which: Group items1 | | | 8.6 | | | | 3.6 | |
| | | | | | | | | |
of which: Non-core and Legacy Portfolio | | | 10.8 | | | | 16.5 | |
| Average equity attributed to the business divisions and Corporate Center | | | 43.5 | | | | 50.8 | |
| Difference | | | 3.7 | | | | (2.1 | ) |
| Average equity attributable to UBS shareholders | | | 47.2 | | | | 48.7 | |
1 Group items within the Corporate Center carries common equity not allocated to the business divisions, reflecting equity that we have targeted above a 10% common equity tier 1 ratio. Additionally, this includes attributed equity for PaineWebber goodwill and intangible assets as well as attributed equity for centrally held risk-based capital items.
Return on attributed equity (RoAE) and return on equity (RoE)1
| | | | | | | | |
| | | For the year ended | |
| % | | 31.12.13 | | | 31.12.12 | |
| Wealth Management | | | 64.2 | | | | 60.9 | |
| | | | | | | | | |
| Wealth Management Americas | | | 30.9 | | | | 9.7 | |
| | | | | | | | | |
| Retail & Corporate | | | 35.6 | | | | 40.6 | |
| | | | | | | | | |
| Global Asset Management | | | 32.0 | | | | 25.9 | |
| | | | | | | | | |
| Investment Bank | | | 28.7 | | | | 2.4 | |
| | | | | | | | | |
| Corporate Center – Core Functions | | | (14.8 | ) | | | (56.2 | ) |
| | | | | | | | | |
| Corporate Center – Non-core and Legacy Portfolio | | | (21.4 | ) | | | (22.8 | ) |
| UBS Group | | | 6.7 | | | | (5.1 | ) |
1 Return on attributed equity shown for the business divisions and Corporate Center and return on equity shown for UBS Group.
247
Risk, treasury and capital management
Capital management
accelerated implementation of our strategy announced in October 2012. Average attributed equity also decreased for all business divisions as a result of methodology refinements. From 1 January 2013, equity associated with goodwill and intangible assets that arose from the PaineWebber acquisition is attributed to the Corporate Center. Furthermore, attributed equity for the business divisions decreased because a number of centrally managed risks that are included in RBC have been moved from the business divisions to the Corporate Center. This change took effect in the third quarter of 2013, together with the implementation of the above-mentioned RBC conversion to a CET1-equivalent measure. These changes contributed to an overall increase in average attributed equity for Corporate Center – Core Functions in 2013. Furthermore, as of 1 January 2014, equity required to underpin certain Basel III capital deduction items that are relevant from 2014 will be allocated to Group items within Corporate Center – Core Functions.
| | | | |
è Refer to the “Risk management and control” sections of this report for more information on risk-based capital |
Average equity attributable to UBS shareholders decreased to CHF 47.2 billion in 2013 from CHF 48.7 billion in 2012. The difference between average equity attributable to UBS shareholders and average equity attributed to the business divisions and Corporate Center increased to positive CHF 3.7 billion in 2013 from negative CHF 2.1 billion in 2012, with the 2013 difference mainly resulting from holding higher levels of equity than required under the Basel III phase-in rules.
Annualized return on attributed equity (RoAE) is a pre-tax profitability measure that is an indicator of efficiency in the usage of the firm’s financial resources.
The return on equity (RoE) for the Group increased to positive 6.7% in 2013 from negative 5.1% in the prior year due to an increase in net profit attributable to UBS shareholders, coupled with a decrease in average equity attributable to UBS shareholders. For 2013, the RoE of the Group was lower than the average of the RoAE of the business divisions because of the negative RoAE of the Corporate Center and due to the fact that more equity was attributable to UBS shareholders than the total equity attributed to the business divisions and Corporate Center.
248
|
Risk, treasury and capital management |
|
|
UBS shares
The majority of our common equity tier 1 capital comprises share capital, share premium and retained earnings attributable to UBS shareholders. As of 31 December 2013, total IFRS equity attributable to UBS shareholders amounted to CHF 48,002 million and was represented by a total of 3,842,002,069 shares issued.
| | | | |

| | In 2013, shares issued increased by a total of 6,751,836 shares Audited due to exercises of employee options. Each share has a par value of CHF 0.10 and entitles the holder to one vote at the shareholders’ meeting, if entered into the share register as having the right to vote, as well as a proportionate share of distributed dividends. As the Articles of Association of UBS AG indicate, there are no other classes of shares and no preferential rights for shareholders. |
| | è | | Refer to “Capital structure” and “Shareholders’ participation rights” in the “Corporate governance” section of this report for more information |
Holding of UBS shares
We hold our own shares primarily to hedge employee share and option participation plans.
In addition, the Investment Bank holds a limited number of own
shares in its capacity as a liquidity provider to the equity index futures market and as a market-maker in UBS shares and derivatives on UBS shares. Furthermore, to meet client demand, UBS has issued structured debt instruments linked to UBS shares, which are economically hedged by cash-settled derivatives and, to a limited extent, own shares held by the Investment Bank.
As of 31 December 2013, we held 73,800,252 treasury shares, or 1.9% of shares issued, compared with 87,879,601, or 2.3%, as of 31 December 2012.
As of 31 December 2013, total future share delivery obligations in relation to employee share-based compensation awards were 109 million shares, taking into account the UBS share price at year-end 2013 as well as performance conditions. Share delivery obligations related to unvested and vested notional share awards, performance share awards, options and stock appreciation rights.
As of 31 December 2013, we held 73 million treasury shares (31 December 2012: 74 million shares) which were available to satisfy delivery obligations related to notional share awards, performance share awards and options and stock appreciation rights. An additional 139 million unissued shares (31 December
UBS shares
| | | | | | | | | | | | |
| | As of | | | Change from | |
| | | 31.12.13 | | | 31.12.12 | | | 31.12.12 | |
| | | |
| Shares outstanding | | | | | | | | | | | | |
| | | | | | | | | | | | | |
| Shares issued | | | 3,842,002,069 | | | | 3,835,250,233 | | | | 6,751,836 | |
| | | | | | | | | | | | | |
of which: issuance of shares related to employee option plans for the year ended | | | 6,751,836 | | | | 3,128,334 | | | | 3,623,502 | |
| | | | | | | | | | | | | |
| Treasury shares | | | 73,800,252 | | | | 87,879,601 | | | | (14,079,349 | ) |
| | | | | | | | | | | | | |
| Shares outstanding | | | 3,768,201,817 | | | | 3,747,370,632 | | | | 20,831,185 | |
| | | | | | | | | | | | | |
| | |
| | As of or for the year ended | | | % change from | |
| | | 31.12.13 | | | 31.12.12 | | | 31.12.12 | |
| | | |
| Earnings per share (CHF)1 | | | | | | | | | | | | |
| | | | | | | | | | | | | |
| Basic | | | 0.84 | | | | (0.66 | ) | | | | |
| | | | | | | | | | | | | |
| Diluted | | | 0.83 | | | | (0.66 | ) | | | | |
| | | | | | | | | | | | | |
| | | |
| Shareholders’ equity (CHF million) | | | | | | | | | | | | |
| | | | | | | | | | | | | |
| Equity attributable to UBS shareholders | | | 48,002 | | | | 45,949 | | | | 4 | |
| | | | | | | | | | | | | |
| Less: goodwill and intangible assets | | | 6,293 | | | | 6,461 | | | | (3 | ) |
| | | | | | | | | | | | | |
| Tangible shareholders’ equity | | | 41,709 | | | | 39,488 | | | | 6 | |
| | | | | | | | | | | | | |
| | | |
| Book value per share (CHF) | | | | | | | | | | | | |
| | | | | | | | | | | | | |
| Total book value per share | | | 12.74 | | | | 12.26 | | | | 4 | |
| | | | | | | | | | | | | |
| Tangible book value per share | | | 11.07 | | | | 10.54 | | | | 5 | |
| | | | | | | | | | | | | |
| | | |
| Market capitalization and share price | | | | | | | | | | | | |
| Share price (CHF) | | | 16.92 | | | | 14.27 | | | | 19 | |
| | | | | | | | | | | | | |
| Market capitalization (CHF million)2 | | | 65,007 | | | | 54,729 | | | | 19 | |
| | | | | | | | | | | | | |
1 Refer to “Note 9 Earnings per share (EPS) and shares outstanding” in the “Financial information” section of this report for more information.2 Market capitalization is calculated based on the total UBS shares issued multiplied by the UBS share price at period end.
249
Risk, treasury and capital management
Capital management
2012: 145 million shares) in conditional share capital (out of 150 million approved in 2006) were available to satisfy the delivery obligation related to options and stock appreciation rights. Treasury shares held or newly issued shares are delivered to employees at exercise or vesting.
The table below outlines the market purchases of UBS shares by Group Treasury and does not include the activities of the Investment Bank.
Treasury share activities
| | | | | | | | | | | | | | | | |
| | Treasury shares purchased for employee share and
option participation plans and acquisitions1 | | | Total number of shares | |
| Month of purchase | | Number of shares | | | Average price in CHF | | | Number of shares (Cumulative) | | | Average price in CHF | |
January 2013 | | | 0 | | | | 0.00 | | | | 0 | | | | 0.00 | |
February 2013 | | | 0 | | | | 0.00 | | | | 0 | | | | 0.00 | |
March 2013 | | | 14,000,000 | | | | 14.85 | | | | 14,000,000 | | | | 14.85 | |
April 2013 | | | 0 | | | | 0.00 | | | | 14,000,000 | | | | 14.85 | |
May 2013 | | | 0 | | | | 0.00 | | | | 14,000,000 | | | | 14.85 | |
June 2013 | | | 0 | | | | 0.00 | | | | 14,000,000 | | | | 14.85 | |
July 2013 | | | 0 | | | | 0.00 | | | | 14,000,000 | | | | 14.85 | |
August 2013 | | | 0 | | | | 0.00 | | | | 14,000,000 | | | | 14.85 | |
September 2013 | | | 0 | | | | 0.00 | | | | 14,000,000 | | | | 14.85 | |
October 2013 | | | 0 | | | | 0.00 | | | | 14,000,000 | | | | 14.85 | |
November 2013 | | | 0 | | | | 0.00 | | | | 14,000,000 | | | | 14.85 | |
December 2013 | | | 0 | | | | 0.00 | | | | 14,000,000 | | | | 14.85 | |
| | | | | | | | | | | | | | | | | |
1 This table excludes purchases by UBS for the purpose of hedging derivatives linked to UBS shares and for market making in UBS shares. The table also excludes UBS shares purchased by investment funds managed by UBS for clients in accordance with specified investment strategies that are established by each fund manager acting independently of UBS and also excludes UBS shares purchased by pension and retirement benefit funds for UBS employees, which are managed by a board of UBS management and employee representatives in accordance with Swiss law guidelines. UBS’s pension and other post-employment benefit funds purchased 1,459,076 UBS shares during the year and held 18,090,651 UBS shares as of 31 December 2013.
Trading volumes
| | | | | | | | | | | | | | |
| | | | | | | | | | | | | | | |
| | | | | For the year ended | |
1,000 shares | | | | | 31.12.13 | | | | 31.12.12 | | | | 31.12.11 | |
| | | | | | | | | | | | | | | |
SIX Swiss Exchange total | | | | | 2,763,179 | | | | 3,046,539 | | | | 3,974,639 | |
SIX Swiss Exchange daily average | | | | | 11,053 | | | | 12,186 | | | | 15,648 | |
NYSE total | | | | | 98,382 | | | | 156,152 | | | | 239,713 | |
NYSE daily average | | | | | 390 | | | | 625 | | | | 951 | |
| | | | | | | | | | | | | | | |
Source: Reuters
Listing of UBS shares
UBS shares are listed on the SIX Swiss Exchange (SIX) and the New York Stock Exchange (NYSE). During 2013, the average daily volume of UBS shares traded on the SIX was 11.1 million shares and 0.4 million shares on the NYSE. The SIX is expected to remain the main venue for determining the movement in our share price due to the high volume traded on this exchange.
During the hours in which both the SIX and NYSE are simultaneously open for trading (generally 3:30 p.m. to 5:30 p.m.
Central European Time), price differences between these exchanges are likely to be arbitraged away by professional market-makers. Accordingly, the share price will typically be similar between the two exchanges when considering the prevailing US dollar/Swiss franc exchange rate. When the SIX is closed for trading, globally traded volumes will typically be lower. However, the specialist firm making a market in UBS shares on the NYSE is required to facilitate sufficient liquidity and maintain an orderly market in UBS shares throughout normal NYSE trading hours.
250
|
Risk, treasury and capital management |
|
|
UBS share price chart vs DJ Banks Titans Index
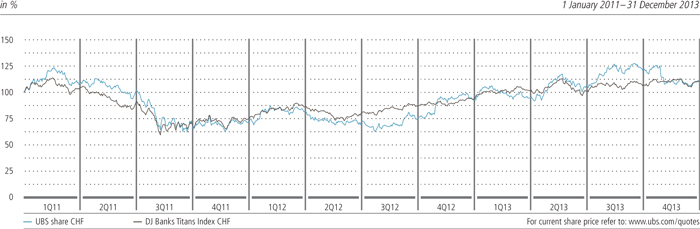
Ticker symbols
| | | | |
| Trading exchange | | Bloomberg | | Reuters |
| SIX Swiss Exchange | | UBSN VX | | UBSN.VX |
| | | | | |
| New York Stock Exchange | | UBS UN | | UBS.N |
| | | | | |
| |
| Security identification codes | | |
| | | | | |
| ISIN | | | | CH0024899483 |
| | | | | |
| Valoren | | | | 2 489 948 |
| | | | | |
| Cusip | | | | CINS H89231 33 8 |
| | | | | |
251
Risk, treasury and capital management
Capital management
Stock exchange prices
| | | | | | | | | | | | | | | | | | | | | | | | |
| | SIX Swiss Exchange | | | New York Stock Exchange | |
| | High (CHF) | | | Low (CHF) | | | Period end (CHF) | | | High (USD) | | | Low (USD) | | | Period end (USD) | |
| | | | | | |
| 2013 | | | 19.60 | | | | 14.09 | | | | 16.92 | | | | 21.61 | | | | 15.09 | | | | 19.25 | |
| | | | | | | | | | | | | | | | | | | | | | | | | |
| Fourth quarter 2013 | | | 19.30 | | | | 16.12 | | | | 16.92 | | | | 21.61 | | | | 17.94 | | | | 19.25 | |
| | | | | | | | | | | | | | | | | | | | | | | | | |
| December | | | 17.41 | | | | 16.12 | | | | 16.92 | | | | 19.34 | | | | 18.21 | | | | 19.25 | |
| | | | | | | | | | | | | | | | | | | | | | | | | |
| November | | | 17.69 | | | | 16.34 | | | | 17.28 | | | | 19.29 | | | | 17.94 | | | | 19.00 | |
| | | | | | | | | | | | | | | | | | | | | | | | | |
| October | | | 19.30 | | | | 17.34 | | | | 17.56 | | | | 21.61 | | | | 19.30 | | | | 19.36 | |
| | | | | | | | | | | | | | | | | | | | | | | | | |
| Third quarter 2013 | | | 19.60 | | | | 15.62 | | | | 18.50 | | | | 21.48 | | | | 16.54 | | | | 20.52 | |
| | | | | | | | | | | | | | | | | | | | | | | | | |
| September | | | 19.60 | | | | 18.16 | | | | 18.50 | | | | 21.48 | | | | 19.60 | | | | 20.52 | |
| | | | | | | | | | | | | | | | | | | | | | | | | |
| August | | | 19.47 | | | | 17.77 | | | | 18.02 | | | | 20.87 | | | | 19.25 | | | | 19.30 | |
| | | | | | | | | | | | | | | | | | | | | | | | | |
| July | | | 18.35 | | | | 15.62 | | | | 18.23 | | | | 19.84 | | | | 16.54 | | | | 19.67 | |
| | | | | | | | | | | | | | | | | | | | | | | | | |
| Second quarter 2013 | | | 18.02 | | | | 14.09 | | | | 16.08 | | | | 18.70 | | | | 15.09 | | | | 16.95 | |
| | | | | | | | | | | | | | | | | | | | | | | | | |
| June | | | 17.15 | | | | 15.43 | | | | 16.08 | | | | 18.21 | | | | 16.49 | | | | 16.95 | |
| | | | | | | | | | | | | | | | | | | | | | | | | |
| May | | | 18.02 | | | | 16.35 | | | | 17.01 | | | | 18.70 | | | | 17.52 | | | | 17.53 | |
| | | | | | | | | | | | | | | | | | | | | | | | | |
| April | | | 16.90 | | | | 14.09 | | | | 16.60 | | | | 18.00 | | | | 15.09 | | | | 17.79 | |
| | | | | | | | | | | | | | | | | | | | | | | | | |
| First quarter 2013 | | | 16.39 | | | | 14.23 | | | | 14.55 | | | | 17.65 | | | | 15.11 | | | | 15.39 | |
| | | | | | | | | | | | | | | | | | | | | | | | | |
| March | | | 15.50 | | | | 14.23 | | | | 14.55 | | | | 16.49 | | | | 15.11 | | | | 15.39 | |
| | | | | | | | | | | | | | | | | | | | | | | | | |
| February | | | 16.10 | | | | 14.35 | | | | 14.83 | | | | 17.65 | | | | 15.40 | | | | 15.81 | |
| | | | | | | | | | | | | | | | | | | | | | | | | |
| January | | | 16.39 | | | | 14.59 | | | | 15.78 | | | | 17.62 | | | | 15.80 | | | | 17.37 | |
| | | | | | | | | | | | | | | | | | | | | | | | | |
| | | | | | |
| 2012 | | | 15.62 | | | | 9.69 | | | | 14.27 | | | | 16.99 | | | | 9.78 | | | | 15.74 | |
| | | | | | | | | | | | | | | | | | | | | | | | | |
| Fourth quarter 2012 | | | 15.62 | | | | 11.39 | | | | 14.27 | | | | 16.99 | | | | 12.32 | | | | 15.74 | |
| | | | | | | | | | | | | | | | | | | | | | | | | |
| Third quarter 2012 | | | 12.60 | | | | 9.69 | | | | 11.45 | | | | 13.57 | | | | 9.78 | | | | 12.18 | |
| | | | | | | | | | | | | | | | | | | | | | | | | |
| Second quarter 2012 | | | 12.79 | | | | 10.55 | | | | 11.05 | | | | 14.15 | | | | 10.96 | | | | 11.71 | |
| | | | | | | | | | | | | | | | | | | | | | | | | |
| First quarter 2012 | | | 13.60 | | | | 10.64 | | | | 12.65 | | | | 14.77 | | | | 11.17 | | | | 14.02 | |
| | | | | | | | | | | | | | | | | | | | | | | | | |
| | | | | | |
| 2011 | | | 19.13 | | | | 9.34 | | | | 11.18 | | | | 20.08 | | | | 10.42 | | | | 11.83 | |
| | | | | | | | | | | | | | | | | | | | | | | | | |
| Fourth quarter 2011 | | | 12.23 | | | | 9.80 | | | | 11.18 | | | | 14.21 | | | | 10.47 | | | | 11.83 | |
| | | | | | | | | | | | | | | | | | | | | | | | | |
| Third quarter 2011 | | | 15.75 | | | | 9.34 | | | | 10.54 | | | | 18.63 | | | | 10.42 | | | | 11.43 | |
| | | | | | | | | | | | | | | | | | | | | | | | | |
| Second quarter 2011 | | | 17.60 | | | | 14.37 | | | | 15.33 | | | | 20.03 | | | | 17.20 | | | | 18.26 | |
| | | | | | | | | | | | | | | | | | | | | | | | | |
| First quarter 2011 | | | 19.13 | | | | 15.43 | | | | 16.48 | | | | 20.08 | | | | 16.11 | | | | 18.05 | |
| | | | | | | | | | | | | | | | | | | | | | | | | |
| | | | | | |
| 2010 | | | 18.60 | | | | 13.31 | | | | 15.35 | | | | 18.48 | | | | 12.26 | | | | 16.47 | |
| | | | | | | | | | | | | | | | | | | | | | | | | |
| Fourth quarter 2010 | | | 17.83 | | | | 14.92 | | | | 15.35 | | | | 18.48 | | | | 14.99 | | | | 16.47 | |
| | | | | | | | | | | | | | | | | | | | | | | | | |
| Third quarter 2010 | | | 18.53 | | | | 13.94 | | | | 16.68 | | | | 18.47 | | | | 13.04 | | | | 17.03 | |
| | | | | | | | | | | | | | | | | | | | | | | | | |
| Second quarter 2010 | | | 18.60 | | | | 14.15 | | | | 14.46 | | | | 17.75 | | | | 12.26 | | | | 13.22 | |
| | | | | | | | | | | | | | | | | | | | | | | | | |
| First quarter 2010 | | | 17.50 | | | | 13.31 | | | | 17.14 | | | | 16.84 | | | | 12.40 | | | | 16.28 | |
| | | | | | | | | | | | | | | | | | | | | | | | | |
| | | | | | |
| 2009 | | | 19.65 | | | | 8.20 | | | | 16.05 | | | | 19.31 | | | | 7.06 | | | | 15.51 | |
| | | | | | | | | | | | | | | | | | | | | | | | | |
| Fourth quarter 2009 | | | 19.34 | | | | 14.76 | | | | 16.05 | | | | 19.18 | | | | 15.03 | | | | 15.51 | |
| | | | | | | | | | | | | | | | | | | | | | | | | |
| Third quarter 2009 | | | 19.65 | | | | 12.50 | | | | 18.97 | | | | 19.31 | | | | 11.25 | | | | 18.31 | |
| | | | | | | | | | | | | | | | | | | | | | | | | |
| Second quarter 2009 | | | 17.51 | | | | 10.56 | | | | 13.29 | | | | 15.82 | | | | 9.40 | | | | 12.21 | |
| | | | | | | | | | | | | | | | | | | | | | | | | |
| First quarter 2009 | | | 17.00 | | | | 8.20 | | | | 10.70 | | | | 15.31 | | | | 7.06 | | | | 9.43 | |
| | | | | | | | | | | | | | | | | | | | | | | | | |
252
Corporate
governance,
responsibility and
compensation
Audited information according to the Swiss Code of Obligations and applicable regulatory requirements and guidance
Disclosures provided in line with the requirements of articles 663bbis, 663c para. 1 and 663c para. 3 of the Swiss Code of Obligations (supplementary disclosures for companies whose shares are listed on a stock exchange: compensation and participations) are also included in the audited financial statements of UBS AG (Parent Bank) in the “Financial information” section of this report. Information that has been subject to audit is indicated by a bar stating “audited” within this section of the report.
Information assured according to the Global Reporting Initiative (GRI)
Content of the sections “Corporate responsibility” and “Our employees” has been reviewed by Ernst & Young Ltd (EY) against the GRI Sustainability Reporting Guidelines. This content has been prepared in accordance with the comprehensive option of GRI G4 as evidenced in the EY assurance report atwww.ubs.com/global/en/about_ubs/corporate_responsibility/commitment_strategy/reporting_assurance.html. The assurance by EY also covered other relevant text and data in the Annual Report 2013 and on the website of UBS which is referenced in the GRI Content Index (www.ubs.com/gri).
Corporate governance, responsibility and compensation
Corporate governance
Corporate governance
Our corporate governance principles are designed to support our objective of sustainable profitability, as well as to create value and protect the interests of our shareholders and other stakeholders. We use the term “corporate governance” when referring to the organizational structure of UBS and operational practices of our management.
We are subject to, and act in compliance with, all relevant Swiss legal and regulatory requirements regarding corporate governance, including the SIX Swiss Exchange’s (SIX) Directive on Information Relating to Corporate Governance, as well as the standards established in the Swiss Code of Best Practice for Corporate Governance, including the appendix on executive compensation.
In addition, as a foreign company with shares listed on the New York Stock Exchange (NYSE), we are in compliance with all relevant corporate governance standards applicable to foreign listed companies.
Based on article 716b of the Swiss Code of Obligations and articles 24 and 26 of the Articles of Association of UBS AG (Articles of Association), the Board of Directors (BoD) adopted the Organization Regulations of UBS AG (Organization Regulations), which constitute our primary corporate governance guidelines. The currently applicable Organization Regulations date from 1 January 2013. The BoD also adopted the currently applicable UBS Code of Business Conduct and Ethics (Code) in September 2012.
| | è | | Refer to the Articles of Association, the Organization Regulations and the Code at www.ubs.com/governance for more information |
In a referendum in March 2013, the Swiss cantons and voters accepted an initiative to give shareholders of Swiss listed companies
more influence over board and management compensation (Minder Initiative). In November 2013, the Swiss Federal Council issued the final transitional ordinance implementing the constitutional amendments of this initiative, which came into force on 1 January 2014. UBS is currently in the process of implementing these requirements. The BoD intends to propose amended Articles of Association to be voted upon by shareholders at the Annual General Meeting of Shareholders (AGM) on 7 May 2014.
| | è | | Refer to the “Regulatory and legal developments” section of this report for more information |
Differences from corporate governance standards relevant to US-listed companies
According to the NYSE listing standards on corporate governance, foreign private issuers are required to disclose any significant ways in which their corporate governance practices differ from those to be followed by domestic companies.
Responsibility of the Audit Committee for appointment, compensation, retention and oversight of the independent auditors
The Audit Committee has been assigned all the abovementioned responsibilities, except for appointment of the independent auditors, who are elected by the shareholders as per Swiss
254
|
Corporate governance, responsibility |
and compensation |
company law. The Audit Committee assesses the performance and qualification of the external auditors and submits its proposal for appointment, reappointment or removal to the full BoD, which brings its proposal to the shareholders for vote at the AGM.
Discussion of risk assessment and risk management policies by the Risk Committee
In accordance with our Organization Regulations, the Risk Committee has the authority to define our risk principles and risk capacity. The Risk Committee is responsible for monitoring our adherence to those risk principles and for monitoring whether business divisions and control units maintain appropriate systems for risk management and control.
Supervision of the internal audit function
The Chairman of the BoD (Chairman), the Risk Committee and the Audit Committee share responsibility for and authority to supervise the internal audit function.
Responsibility of the Human Resources and Compensation Committee for performance evaluations of senior management
Performance evaluations of our senior management, comprising the Group Chief Executive Officer (Group CEO) and the other Group Executive Board members, are completed by the Chairman and the Human Resources and Compensation Committee, and are reported to the full BoD.
Responsibility of the Governance and Nominating Committee for the evaluation of the Board of Directors
The BoD has direct responsibility and authority to evaluate its own performance, with preparation by the Governance and Nominating Committee. All BoD committees perform a self-assessment of their activities and report back to the full BoD.
Proxy statement reports of the Audit Committee and Human Resources and Compensation Committee
NYSE listing standards would require the abovementioned committees to directly submit their reports to shareholders. Under Swiss company law, all reports addressed to shareholders by UBS, including those from the abovementioned committees, are provided and signed by the full BoD, which has ultimate responsibility vis-à-vis shareholders.
Shareholders’ votes on equity compensation plans
Swiss company law authorizes the BoD to approve compensation plans. Though Swiss law does not allocate such authority to shareholders, it requires that Swiss companies determine the nature and components of capital in their articles of association, and each increase in capital is required to be submitted for shareholder approval. This means that, if equity-based compensation plans result in a need for an increase in capital, shareholder approval is mandatory. If, however, shares for such plans are purchased in the market, shareholders do not have approval authority.
| | è | | Refer to “Board of Directors” in this section for more information on the Board of Directors’ committees |
| | è | | Refer to “Capital structure” in this section for more information on capital |
Corporate governance, responsibility and compensation
Corporate governance
Group structure and shareholders
UBS Group legal entity structure
Under Swiss company law, UBS AG is organized as an Aktiengesellschaft (AG), a corporation that has issued shares of common stock to investors. UBS AG is the parent bank (Parent Bank or UBS) of the UBS Group (Group).
Our legal entity structure is designed to support our businesses with an efficient legal, tax and funding framework considering regulatory restrictions in the countries where we operate. Neither our business divisions nor the Corporate Center are separate legal entities. They primarily operate out of the Parent Bank, through its branches worldwide. This structure is designed to capitalize on the increased business opportunities and cost efficiencies offered by the use of a single legal platform, and to enable the flexible and efficient use of capital. Where it is neither possible nor efficient to operate out of the Parent Bank, businesses operate through local subsidiaries. This can be the case when required for legal, tax or regulatory purposes, or when legal entities join the Group through acquisition.
As previously announced, we continue to assess the need for and feasibility of changes to our legal entity structure in light of regulatory trends and requirements. Among these are regulatory requirements addressing the “too-big-to-fail” issue, which will cause financial institutions to modify their legal entity structures to facilitate resolution in the event of a failure. In view of these factors, we intend to establish a new banking subsidiary of UBS AG in Switzerland. The scope of this potential future subsidiary’s business is still being determined, but we would currently expect it to
include the Retail & Corporate business division and likely the Swiss-booked business within our Wealth Management business division. We expect to implement this change in a phased approach starting in mid-2015. This structural change is being discussed on an ongoing basis with FINMA, and remains subject to a number of uncertainties that may affect its feasibility, scope or timing.
In February 2014, the US Federal Reserve Board issued final rules for foreign banking organizations (FBO) operating in the US that include a requirement for FBO with more than USD 50 billion of US non-branch assets to establish an intermediate holding company (IHC) to hold all US subsidiary operations. The IHC will be subject to US capital and other regulatory requirements. We will have until 1 July 2016 to establish an IHC and meet many of the new requirements. We must submit an implementation plan by 1 January 2015 and the IHC will not need to comply with the US leverage ratio until 1 January 2018.
Operational Group structure
On 31 December 2013, the operational structure of the Group comprised five business divisions: Wealth Management, Wealth Management Americas, Retail & Corporate, Global Asset Management and the Investment Bank, as well as the Corporate Center with its components, Core Functions and Non-core and Legacy Portfolio.
| | è | | Refer to the “Financial and operating performance” section and “Note 2 Segment reporting” in the “Financial information” section of this report for more information |
256
|
Corporate governance, responsibility |
and compensation |
Listed and non-listed companies belonging to the Group
The Group includes a number of consolidated entities, none of which, however, has shares listed on any stock exchange, other than UBS AG.
| | è | | Refer to “Note 30a Interests in subsidiaries” in the “Financial information” section of this report for more information on the significant subsidiaries of the Group |
Significant shareholders
Under the Federal Act on Stock Exchanges and Securities Trading of 24 March 1995 as amended, (the Swiss Stock Exchange Act), anyone holding shares in a company listed in Switzerland, or holding derivative rights related to shares of such a company, must notify the company and the SIX Swiss Exchange (SIX) if the holding attains, falls below or exceeds one of the following threshold percentages: 3, 5, 10, 15, 20, 25, 33 1/3, 50, or 66 2/3% of voting rights, whether or not such rights may be exercised. The detailed disclosure requirements and the methodology for calculating the thresholds are defined in the Swiss Financial Market Supervisory Authority (FINMA) Ordinance on Stock Exchanges and Securities Trading (SESTO-FINMA). In particular, the SESTO-FINMA sets forth that all future potential share obligations irrespective of their possible contingent nature must be taken into account, and prohibits the netting of acquisition positions (in particular shares, conversion rights and acquisition rights or obligations) with disposal positions (i.e., rights or obligations to sell). It also requires that each such position be calculated separately and reported as soon as it reaches one of the abovementioned thresholds. Nominee companies which cannot autonomously decide how voting rights are exercised are not obligated to notify UBS and SIX if they reach, exceed or fall below the threshold percentages.
In addition, pursuant to the Swiss Code of Obligations, UBS must disclose in the notes to its financial statements the identity of any shareholder with a holding of more than 5% of the total share capital of UBS AG.
According to disclosure notifications filed with UBS AG and the SIX under the Swiss Stock Exchange Act, on 18 September 2013, Government of Singapore Investment Corp., Singapore, disclosed the change of its corporate name to GIC Private Limited, effective from 22 July 2013, with a holding of 6.40% of the total share capital of UBS AG. The beneficial owner of this holding is the Government of Singapore. On 30 September 2011, Norges Bank, Oslo, the Central Bank of Norway, disclosed a holding of 3.04%. On 17 December 2009, BlackRock Inc., New York, disclosed a holding of 3.45%. In accordance with the Swiss Stock Exchange Act, the percentages indicated above were calculated in relation to the total UBS share capital reflected in the Articles of Association at the time of the respective disclosure notification. Information on disclosures under the Swiss Stock Exchange Act can be found on the following website of the SIX:www.six-exchange-regulation.com/
obligations/disclosure/major_shareholders_en.html.
According to our share register, the shareholders (acting in their own name or in their capacity as nominees for other investors or beneficial owners) listed in the table below were registered with 3% or more of the total share capital as of 31 December 2013, 2012 and 2011.
Cross-shareholdings
We have no cross-shareholdings in excess of a reciprocal 5% of capital or voting rights with any other company.
| | | | | | | | | | | | | | | | |
| | | | Shareholders registered in the UBS share register with 3% or more of total share capital | |
| | | | | % of share capital | | 31.12.13 | | | 31.12.12 | | | 31.12.11 | |
| | | | Chase Nominees Ltd., London | | | 11.73 | | | | 11.94 | | | | 10.95 | |
| | | | | | | | | | | | | | | | |
| | | | GIC Private Limited, Singapore | | | 6.39 | | | | 6.40 | | | | 6.41 | |
| | | | | | | | | | | | | | | | |
| | | | DTC (Cede & Co.), New York1 | | | 5.89 | | | | 5.28 | | | | 7.07 | |
| | | | | | | | | | | | | | | | |
| | | | Nortrust Nominees Ltd., London | | | 3.75 | | | | 3.84 | | | | 4.20 | |
| | | | 1 DTC (Cede & Co.),NewYork,“The DepositoryTrust Company,“is a US securities clearing organization. | | | | | | | | | | | | |
Corporate governance, responsibility and compensation
Corporate governance
Capital structure
Issued share capital
Under Swiss company law, shareholders must approve, in a shareholders’ meeting, any increase in the total number of shares, which may arise from an ordinary share capital increase or the creation of conditional or authorized capital. During 2013, no such increase was approved by UBS AG shareholders.
At year-end 2013, 3,842,002,069 shares were issued with a par value of CHF 0.10 each, leading to a share capital of CHF 384,200,206.90.
Changes of shareholders’ equity and shares
According to International Financial Reporting Standards (IFRS), Group equity attributable to UBS shareholders amounted to CHF 48.0 billion as of 31 December 2013 (2012: CHF 45.9 billion, 2011: CHF 48.5 billion). UBS Group shareholders’ equity was represented by 3,842,002,069 issued shares as of 31 December 2013 (2012: 3,835,250,233 shares, 2011: 3,832,121,899 shares).
| | è | | Refer to the “Statement of changes in equity” in the “Financial information” section of this report for more information on changes in shareholders’ equity over the last three years |
| | | | | | | | | | | | |
Issued share capital | |
| | | Share capital in CHF | | | Number of shares | | | Par value
in CHF | |
| As of 31 December 2011 | | | 383,212,190 | | | | 3,832,121,899 | | | | 0.10 | |
| | | | | | | | | | | | | |
| Issue of shares out of conditional capital due to employee options exercised in 2012 | | | 312,833 | | | | 3,128,334 | | | | 0.10 | |
| | | | | | | | | | | | | |
| As of 31 December 2012 | | | 383,525,023 | | | | 3,835,250,233 | | | | 0.10 | |
| | | | | | | | | | | | | |
| Issue of shares out of conditional capital due to employee options exercised in 2013 | | | 675,184 | | | | 6,751,836 | | | | 0.10 | |
| | | | | | | | | | | | | |
| As of 31 December 2013 | | | 384,200,207 | | | | 3,842,002,069 | | | | 0.10 | |
| | | | | | | | | | | | | |
| | | | | | | | | | | | | | | | |
| Distribution of UBS shares | |
As of 31 December 2013 | | Shareholders registered | | | Shares registered | |
| Number of shares registered | | Number | | | % | | | Number | | | % of shares issued | |
| 1-100 | | | 34,367 | | | | 11.6 | | | | 1,967,157 | | | | 0.1 | |
| | | | | | | | | | | | | | | | | |
| 101-1,000 | | | 162,176 | | | | 54.5 | | | | 75,191,894 | | | | 2.0 | |
| | | | | | | | | | | | | | | | | |
| 1,001-10,000 | | | 91,263 | | | | 30.7 | | | | 254,540,908 | | | | 6.6 | |
| | | | | | | | | | | | | | |
| 10,001-100,000 | | | 9,043 | | | | 3.0 | | | | 220,165,057 | | | | 5.7 | |
| | | | | | | | | | | | | | | | | |
| 100,001-1,000,000 | | | 690 | | | | 0.2 | | | | 185,036,289 | | | | 4.8 | |
| | | | | | | | | | | | | | | | | |
| 1,000,001-5,000,000 | | | 95 | | | | 0.0 | | | | 211,905,582 | | | | 5.5 | |
| | | | | | | | | | | | | | | | | |
| 5,000,001-38,420,020(1%) | | | 25 | | | | 0.0 | | | | 251,431,040 | | | | 6.5 | |
| | | | | | | | | | | | | | | | | |
| 1-2% | | | 1 | | | | 0.0 | | | | 41,946,308 | | | | 1.1 | |
| | | | | | | | | | | | | | | | | |
| 2-3% | | | 2 | | | | 0.0 | | | | 164,602,980 | | | | 4.3 | |
| | | | | | | | | | | | | | | | | |
| 3-4% | | | 1 | | | | 0.0 | | | | 143,960,557 | | | | 3.8 | |
| | | | | | | | | | | | | | | | | |
| 4-5% | | | 0 | | | | 0.0 | | | | 0 | | | | 0.0 | |
| | | | | | | | | | | | | | | | | |
| Over 5% | | | 3 | 1 | | | 0.0 | | | | 922,249,147 | | | | 24.0 | |
| | | | | | | | | | | | | | | | | |
| Total registered | | | 297,666 | | | | 100.0 | | | | 2,472,996,919 | 2 | | | 64.4 | |
| | | | | | | | | | | | | | | | | |
| Unregistered3 | | | | | | | | | | | 1,369,005,150 | | | | 35.6 | |
| | | | | | | | | | | | | | | | | |
| Total shares issued | | | | | | | | | | | 3,842,002,069 | | | | 100.00 | |
| | | | | | | | | | | | | | | | | |
1 As of 31 December 2013, Chase Nominees Ltd., London, entered as a trustee/nominee, was registered with 11.73% of all UBS shares issued. However, according to the provisions of UBS, voting rights of trustees/nominees are limited to a maximum of 5% of all UBS shares issued. The US securities clearing organization DTC (Cede & Co.), New York, was registered with 5.89% of all UBS shares issued and is not subject to this 5% voting limit as securities clearing organization. The same applies to the GIC Private Limited, Singapore, which was registered as beneficial owner with 6.39% of all UBS shares issued. 2 Of the total shares registered, 409,992,696 shares did not carry voting rights. 3 Shares not entered in the share register as of 31 December 2013. | |
|
Corporate governance, responsibility |
and compensation |
Ownership
Ownership of UBS shares is widely spread. The tables in this section provide information about the distribution of our shareholders by category and geographical location. This information relates only to registered shareholders and cannot be assumed to be representative of our entire investor base nor the actual beneficial ownership. Only shareholders registered in the share register as “shareholders with voting rights” are entitled to exercise voting rights.
| | è | | Refer to “Shareholders’ participation rights” in this section for more information |
As of 31 December 2013, 2,063,004,223 shares carried voting rights, 409,992,696 shares were entered in the share register without voting rights and 1,369,005,150 shares were not registered. All shares were fully paid up and eligible for dividends. There are no preferential rights for shareholders, and no other classes of shares are issued by the Parent Bank.
At year-end 2013, we owned 73,800,252 UBS registered shares corresponding to 1.9% of the total share capital of UBS AG. At the same time, we had disposal positions relating to 284,975,843 voting rights of UBS AG, corresponding to 7.4% of the total voting rights of UBS AG. 7.0% of this consisted of voting rights on shares deliverable in respect of employee awards. The calculation methodology for the disposal position is based on the SESTO-FINMA, which sets forth that all future potential share delivery obligations irrespective of the contingent nature of the delivery must be taken into account.
Conditional share capital
At year-end 2013, the following conditional share capital was available to the Board of Directors (BoD):
| – | | At the Annual General Meeting of Shareholders (AGM) held in 2006, the shareholders approved the creation of conditional capital in the maximum amount of 150,000,000 fully paid |
| | | registered shares, with a nominal value of CHF 0.10 each, to be used for employee option grants. Options are exercisable at any time between their vesting and expiration dates. Shareholders have no pre-emptive rights. In 2013, options on 6,751,836 shares were exercised under the option plans with a total of 138,759,156 conditional capital shares being available at the end of 2013 to satisfy further exercises of options. |
| – | | At the AGM held in 2010, the shareholders approved the creation of conditional capital in the amount of up to 380,000,000 fully paid registered shares, with a nominal value of CHF 0.10 each, for the exercise of conversion rights and/or warrants granted in connection with the issuance of bonds or similar financial instruments by UBS or one of its group companies. Shareholders have no pre-emptive rights. The owners of conversion rights and/or warrants would be entitled to subscribe to the new shares. At year-end 2013, the BoD had not made use of the allowance to issue bonds or warrants with conversion rights covered by conditional share capital. |
In 2013, the Articles of Association were amended and the allowance to issue 100,000,000 fully paid registered shares to the Swiss National Bank (SNB), which had been approved by the AGM held in 2009, was removed. These shares could have been issued in the event of the exercise of warrants granted to the SNB in connection with the loan that the SNB provided to the SNB StabFund, to which UBS transferred certain illiquid securities and other positions in 2008 and 2009. As the loan was paid back in full in 2013, the warrants were terminated and the BoD approved the reduction of the conditional capital in the amount of CHF 10,000,000.
Authorized share capital
The BoD had no authorized share capital available as of 31 December 2013, 2012 and 2011.
Conditional capital
| | | | | | | | | | | | |
| | | Maximum number of
shares to be issued | | | Year approved by
shareholder general
meeting | | | % of shares issued | |
| | | 31.12.13 | | | | | | 31.12.13 | |
| Employee equity participation plans of UBS AG | | | 138,759,156 | | | | 2006 | | | | 3.61 | % |
| | | | | | | | | | | | | |
| Conversion rights/warrants granted in connection with bonds | | | 380,000,000 | | | | 2010 | | | | 9.89 | % |
| | | | | | | | | | | | | |
| Total | | | 518,759,156 | | | | | | | | 13.50 | % |
| | | | | | | | | | | | | |
Corporate governance, responsibility and compensation
Corporate governance
| | | | | | | | | | | | | | | | | | | | | | | | | | | | | | | | |
| Shareholders, legal entities and nominees: type and geographical distribution | |
| | | Shareholders registered | |
| As of 31 December 2013 | | | | | | | | | | | | | | | | | | | | Number | | | % | |
| Individual shareholders | | | | | | | | | | | | | | | | | | | | | | | | | | | 291,066 | | | | 97.8 | |
| | | | | | | | | | | | | | | | | | | | | | | | | | | | | | | | | |
| Legal entities | | | | | | | | | | | | | | | | | | | | | | | | | | | 6,191 | | | | 2.1 | |
| | | | | | | | | | | | | | | | | | | | | | | | | | | | | | | | | |
| Nominees, fiduciaries | | | | | | | | | | | | | | | | | | | | | | | | | | | 409 | | | | 0.1 | |
| | | | | | | | | | | | | | | | | | | | | | | | | | | | | | | | | |
| Total registered shares | | | | | | | | | | | | | | | | | | | | | | | | | | | | | | | | |
| | |
| Unregistered shares | | | | | | | | | | | | | | | | | | | | | | | | | | | | | | | | |
| | | | | | | | | | | | | | | | | | | | | | | | | | | | | | | | | |
| Total | | | | | | | | | | | | | | | | | | | | | | | | | | | 297,666 | | | | 100.0 | |
| | | | | | | | | | | | | | | | | | | | | | | | | | | | | | | | | |
| | Individual shareholders | | | Legal entities | | | Nominees | | | Total | |
| | | Number | | | % | | | Number | | | % | | | Number | | | % | | | Number | | | % | |
| Americas | | | 9,129 | | | | 3.1 | | | | 248 | | | | 0.1 | | | | 221 | | | | 0.1 | | | | 9,598 | | | | 3.2 | |
| | |
of which: USA | | | 8,120 | | | | 2.7 | | | | 92 | | | | 0.0 | | | | 201 | | | | 0.1 | | | | 8,413 | | | | 2.8 | |
| | |
| Asia Pacific | | | 6,390 | | | | 2.2 | | | | 126 | | | | 0.0 | | | | 24 | | | | 0.0 | | | | 6,540 | | | | 2.2 | |
| | |
| Europe, Middle East and Africa | | | 15,871 | | | | 5.3 | | | | 361 | | | | 0.1 | | | | 91 | | | | 0.0 | | | | 16,323 | | | | 5.5 | |
| | |
of which: Germany | | | 5,063 | | | | 1.7 | | | | 34 | | | | 0.0 | | | | 8 | | | | 0.0 | | | | 5,105 | | | | 1.7 | |
| | |
of which: UK | | | 5,637 | | | | 1.9 | | | | 20 | | | | 0.0 | | | | 11 | | | | 0.0 | | | | 5,668 | | | | 1.9 | |
| | |
of which: Rest of Europe | | | 4,877 | | | | 1.6 | | | | 283 | | | | 0.1 | | | | 71 | | | | 0.0 | | | | 5,231 | | | | 1.8 | |
| | |
of which: Middle East and Africa | | | 294 | | | | 0.1 | | | | 24 | | | | 0.0 | | | | 1 | | | | 0.0 | | | | 319 | | | | 0.1 | |
| | |
| Switzerland | | | 259,676 | | | | 87.2 | | | | 5,456 | | | | 1.9 | | | | 73 | | | | 0.0 | | | | 265,205 | | | | 89.1 | |
| | | | | | | | | | | | | | | | | | | | | | | | | | | | | | | | | |
| Total registered shares | | | | | | | | | | | | | | | | | | | | | | | | | | | | | | | | |
| | | | | | | | | | | | | | | | | | | | | | | | | | | | | | | | | |
| Unregistered shares | | | | | | | | | | | | | | | | | | | | | | | | | | | | | | | | |
| | | | | | | | | | | | | | | | | | | | | | | | | | | | | | | | | |
| Total | | | 291,066 | | | | 97.8 | | | | 6,191 | | | | 2.1 | | | | 409 | | | | 0.1 | | | | 297,666 | | | | 100.0 | |
| | | | | | | | | | | | | | | | | | | | | | | | | | | | | | | | | |
Shares and participation certificates
We have only one unified class of shares issued. Our shares are issued in registered form, and are traded and settled as global registered shares. Each registered share has a par value of CHF 0.10 and carries one vote subject to the restrictions set out under “Transferability, voting rights and nominee registration.” Global registered shares provide direct and equal ownership for all shareholders, irrespective of the country and stock exchange on which they are traded. We have no participation certificates outstanding.
| | è | | Refer to “UBS shares” in the “Capital management” section of this report for more information |
Distributions to shareholders
The decision whether to pay a dividend, and the amount of the dividend, are dependent on our profits and cash flow generation and on our progress towards achieving our targeted capital ratios. For financial year 2013, the BoD intends to propose a dividend
payment of CHF 0.25 per share against reserves from capital contribution to be voted upon by shareholders at the AGM on 7 May 2014. This is a 67% increase from last year.
Transferability, voting rights and nominee registration
We do not apply any restrictions or limitations on the transferability of shares. Voting rights may be exercised without any restrictions by shareholders entered into the share register, if they expressly render a declaration of beneficial ownership according to the provisions of the Articles of Association.
We have special provisions for the registration of fiduciaries and nominees. Fiduciaries and nominees are entered in the share register with voting rights up to a total of 5% of all issued UBS shares if they agree to disclose, upon our request, beneficial owners holding 0.3% or more of all issued UBS shares. An exception to the 5% voting limit rule exists for securities clearing organizations, such as The Depository Trust Company in New York.
| | è | | Refer to “Shareholders’ participation rights” in this section for more information |
|
Corporate governance, responsibility |
and compensation |
| | | | | | | | | | | | | | | | | | | | | | | | | | | | | | | | |
| | | | | | | | | | | | | | | | | | | | | | | | | | | | | | | | | |
| | | | | | | | | | | | | | | | | | | | | Shares registered | |
| | | | | | | | | | | | | | | | | | | | | Number | | | % | |
| | | | | | | | | | | | | | | | | | | | | | | | | | | 570,304,936 | | | | 14.9 | |
| | | | | | | | | | | | | | | | | | | | | | | | | | | | | | | | | |
| | | | | | | | | | | | | | | | | | | | | | | | | | | 756,640,328 | | | | 19.7 | |
| | | | | | | | | | | | | | | | | | | | | | | | | | | | | | | | | |
| | | | | | | | | | | | | | | | | | | | | | | | | | | 1,146,051,655 | | | | 29.8 | |
| | | | | | | | | | | | | | | | | | | | | | | | | | | | | | | | | |
| | | | | | | | | | | | | | | | | | | | | | | | | | | 2,472,996,919 | | | | 64.4 | |
| | | | | | | | | | | | | | | | | | | | | | | | | | | | | | | | | |
| | | | | | | | | | | | | | | | | | | | | | | | | | | 1,369,005,150 | | | | 35.6 | |
| | | | | | | | | | | | | | | | | | | | | | | | | | | | | | | | | |
| | | | | | | | | | | | | | | | | | | | | | | | | | | 3,842,002,069 | | | | 100.0 | |
| | | | | | | | | | | | | | | | | | | | | | | | | | | | | | | | | |
| | Individual shareholders | | | Legal entities | | | Nominees | | | Total | |
| | | Number of shares | | | % | | | Number of shares | | | % | | | Number of shares | | | % | | | Number of shares | | | % | |
| | | 54,451,944 | | | | 1.4 | | | | 48,726,206 | | | | 1.3 | | | | 317,367,853 | | | | 8.3 | | | | 420,546,003 | | | | 10.9 | |
| | | | | | | | | | | | | | | | | | | | | | | | | | | | | | | | | |
| | | 52,106,225 | | | | 1.4 | | | | 45,854,289 | | | | 1.2 | | | | 316,933,276 | | | | 8.2 | | | | 414,893,790 | | | | 10.8 | |
| | | | | | | | | | | | | | | | | | | | | | | | | | | | | | | | | |
| | | 45,535,758 | | | | 1.2 | | | | 319,831,829 | | | | 8.3 | | | | 11,933,493 | | | | 0.3 | | | | 377,301,080 | | | | 9.9 | |
| | | | | | | | | | | | | | | | | | | | | | | | | | | | | | | | | |
| | | 73,625,900 | | | | 1.9 | | | | 52,128,052 | | | | 1.4 | | | | 800,539,237 | | | | 20.8 | | | | 926,293,189 | | | | 24.1 | |
| | | | | | | | | | | | | | | | | | | | | | | | | | | | | | | | | |
| | | 14,587,032 | | | | 0.4 | | | | 5,725,348 | | | | 0.1 | | | | 9,001,954 | | | | 0.2 | | | | 29,314,334 | | | | 0.8 | |
| | | | | | | | | | | | | | | | | | | | | | | | | | | | | | | | | |
| | | 46,191,178 | | | | 1.2 | | | | 2,266,556 | | | | 0.1 | | | | 667,026,546 | | | | 17.4 | | | | 715,484,280 | | | | 18.6 | |
| | | | | | | | | | | | | | | | | | | | | | | | | | | | | | | | | |
| | | 12,071,095 | | | | 0.3 | | | | 43,597,770 | | | | 1.2 | | | | 124,505,737 | | | | 3.2 | | | | 180,174,602 | | | | 4.7 | |
| | | | | | | | | | | | | | | | | | | | | | | | | | | | | | | | | |
| | | 776,595 | | | | 0.0 | | | | 538,378 | | | | 0.0 | | | | 5,000 | | | | 0.0 | | | | 1,319,973 | | | | 0.0 | |
| | | | | | | | | | | | | | | | | | | | | | | | | | | | | | | | | |
| | | 396,691,334 | | | | 10.4 | | | | 335,954,241 | | | | 8.7 | | | | 16,211,072 | | | | 0.4 | | | | 748,856,647 | | | | 19.5 | |
| | | | | | | | | | | | | | | | | | | | | | | | | | | | | | | | | |
| | | 570,304,936 | | | | 14.9 | | | | 756,640,328 | | | | 19.7 | | | | 1,146,051,655 | | | | 29.8 | | | | 2,472,996,919 | | | | 64.4 | |
| | | | | | | | | | | | | | | | | | | | | | | | | | | | | | | | | |
| | | 0 | | | | | | | | 0 | | | | | | | | 0 | | | | | | | | 1,369,005,150 | | | | 35.6 | |
| | | | | | | | | | | | | | | | | | | | | | | | | | | | | | | | | |
| | | 570,304,936 | | | | 14.9 | | | | 756,640,328 | | | | 19.7 | | | | 1,146,051,655 | | | | 29.8 | | | | 3,842,002,069 | | | | 100.0 | |
| | | | | | | | | | | | | | | | | | | | | | | | | | | | | | | | | |
Convertible bonds and options
As of 31 December 2013, there were no contingent capital securities or convertible bonds outstanding requiring the issuance of new shares.
| | è | | Refer to the “Capital management” section of this report for more information on our outstanding capital instruments |
As of 31 December 2013, there were 154,636,901 employee options outstanding, including stock appreciation rights. Options and stock appreciation rights equivalent to 37,019,120 shares were in-the-money and exercisable. We source our option-based compensation plans either by purchasing UBS shares in the market, or through the issuance of new shares out of conditional capital. As mentioned above, as of 31 December 2013, 138,759,156 unissued shares in conditional share capital were available for this purpose.
Corporate governance, responsibility and compensation
Corporate governance
Shareholders’ participation rights
We are committed to shareholder participation in our decision-making process. Around 300,000 shareholders are directly registered, some 110,000 US shareholders via nominee companies. Shareholders are regularly informed about our activities and performance, as well as being personally invited to the general meetings of shareholders.
| | è | | Refer to “Information policy” in this section for more information |
Since March 2013, our shareholder portal(www.ubs.com/ shareholderportal) has allowed our registered shareholders to access personalized services and important information year-round regarding share register entries and our shareholder meetings. The shareholder portal enables registered shareholders to enter their voting instructions electronically ahead of our shareholder meetings. Shareholders can verify their voting instructions before and after the general meetings using an encryption method (cryptography). This method of encryption ensures that the voting instructions remain secret throughout the entire voting process. In addition, shareholders can order admission cards and register changes to their address details. It also enables them to manage their subscriptions to shareholder-related publications and to communicate directly with UBS Shareholder Services via a secure channel. The shareholder portal is fully integrated into our internet platform.
Relationships with shareholders
We fully subscribe to the principle of equal treatment of all shareholders, who range from large institutions to individual investors, and regularly inform them about Group developments.
The AGM offers shareholders the opportunity to raise any questions to the Board of Directors (BoD) and Group Executive Board (GEB), as well as our internal and external auditors.
Voting rights, restrictions and representation
We place no restrictions on share ownership and voting rights. However, nominee companies and trustees, who normally represent a large number of individual shareholders and may hold an unlimited number of shares, have voting rights limited to a maximum of 5% of all issued UBS shares in order to avoid the risk of unknown shareholders with large stakes being entered in the share register. Securities clearing organizations, such as The Depository Trust Company in New York, are not subject to this 5% voting limit.
In order to be recorded in the share register with voting rights, shareholders must confirm that they acquired UBS shares in their own name and for their own account. Nominee companies and trustees are required to sign an agreement confirming their willingness
to disclose, upon our request, individual beneficial owners holding more than 0.3% of all issued UBS shares.
All shareholders registered with voting rights are entitled to participate in shareholder meetings. If they do not wish to attend in person, they can issue instructions to accept, reject or abstain on each individual item on the meeting agenda, either by giving instructions to an independent proxy designated by UBS or by appointing another bank or another registered shareholder of their choice to vote on their behalf. Alternatively, registered shareholders can electronically issue their voting instructions to the independent proxy using our shareholder portal. Nominee companies normally submit the proxy material to the beneficial owners and transmit the collected votes to the independent proxy.
Statutory quorums
Motions, including the election and re-election of BoD members and the appointment of the auditors, are decided at a general meeting of shareholders by an absolute majority of the votes cast, excluding blank and invalid ballots. Swiss company law requires that, for certain specific issues, a majority of two-thirds of the votes represented at a general meeting of shareholders, and the absolute majority of the par value of shares represented at the meeting, must vote in favor of the motion for it to be approved. These issues include the creation of shares with privileged voting rights, the introduction of restrictions on the transferability of registered shares, conditional and authorized capital increases, and restrictions or exclusions of shareholders’pre-emptive rights.
The Articles of Association also require a two-thirds majority of votes represented for approval of any change to their provisions regarding the number of BoD members, and any decision to remove a quarter or more of the BoD members.
Votes and elections are normally conducted electronically to ascertain the exact number of votes cast. Voting by a show of hands remains possible if a clear majority is predictable. Shareholders representing at least 3% of the votes represented may request that a vote or election takes place electronically or by written ballot. In order to allow shareholders to clearly express their views on all individual topics, each item on the agenda is put to a vote separately and BoD elections are made on a person-by-person basis.
Convocation of general meetings of shareholders
The AGM must occur within six months of the close of the financial year and normally takes place in late April or early May. A personal invitation including a detailed agenda and explanation of each motion is sent to every registered shareholder at least
|
Corporate governance, responsibility |
and compensation |
20 days ahead of the scheduled AGM. The meeting agenda is also published in the Swiss Official Gazette of Commerce and in selected Swiss newspapers, as well as on the internet atwww.ubs.com/agm.
Extraordinary General Meetings may be convened whenever the BoD or the auditors consider it necessary. Shareholders individually or jointly representing at least 10% of the share capital may at any time ask in writing for an Extraordinary General Meeting to be convened to address a specific issue put forward by them. Such a request may also be brought forward during the AGM.
Placing of items on the agenda
Pursuant to our Articles of Association, shareholders individually or jointly representing shares with an aggregate par value of CHF 62,500 may submit proposals for matters to be placed on the agenda for consideration at the next shareholders’ meeting.
We publish the deadline for submitting such proposals in the Swiss Official Gazette of Commerce and on our website atwww.ubs.com/agm. Requests for items to be placed on the agenda must include the actual motions to be put forward, together with a short explanation, if necessary. The BoD formulates opinions on the proposals, which are published together with the motions.
Registrations in the share register
The general rules for entry with voting rights into our Swiss share register also apply before shareholder meetings. The same rules apply for our US transfer agent that operates the US share register for all UBS shares in a custodian account in the US. There is no closing of the share register in the days before the shareholder meeting. Registrations, including the transfer of voting rights, are processed for as long as technically possible, normally until two days before the shareholder meeting.
Corporate governance, responsibility and compensation
Corporate governance
Board of Directors
The Board of Directors (BoD), under the leadership of the Chairman, decides on the strategy of the Group upon recommendation of the Group Chief Executive Officer (Group CEO), exercises ultimate supervision over senior management, and appoints all Group Executive Board (GEB) members. The BoD also approves all financial statements for issue. Shareholders elect each member of the BoD, which in turn appoints its Chairman, Vice Chairmen, Senior Independent Director, members of BoD committees, their respective Chairpersons and the Company Secretary.
Members of the Board of Directors
On 12 March 2013, the BoD announced that Reto Francioni, CEO of Deutsche Börse AG since 2005, would be nominated for election to the BoD at the 2013 AGM, and Wolfgang Mayrhuber would not stand for re-election on that date. At the AGM held on 2 May 2013, Axel A. Weber, Michel Demaré, David Sidwell, Rainer-Marc Frey, Ann F. Godbehere, Axel P. Lehmann, Helmut Panke, William G. Parrett, Isabelle Romy, Beatrice Weder di Mauro and Joseph Yam were re-elected as their terms of office expired. Reto Francioni was elected to his first term of office. Following their election, the BoD appointed Axel A. Weber as Chairman, Michel Demaré as Vice Chairman and David Sidwell as Senior Independent Director.
The following biographies provide information on the BoD members and the Company Secretary.
| | | | | | |
| | | 
Axel A. Weber German, born 8 March 1957 UBS AG, Bahnhofstrasse 45, CH-8001 Zurich Functions in UBS Chairman of the Board of Directors/Chairperson of the Corporate Responsibility Committee/Chairperson of the Governance and Nominating Committee Year of initial appointment: 2012 | | Professional history and education Axel A. Weber was elected to the Board of Directors (BoD) at the 2012 AGM and was thereafter appointed Chairman of the BoD. He has chaired the Governance and Nominating Committee since 2012 and became Chairperson of the Corporate Responsibility Committee in 2013. Mr. Weber was president of the German Bundesbank between 2004 and 2011, during which time he also served as a member of the Governing Council of the European Central Bank, a member of the Board of Directors of the Bank for International Settlements, German governor of the International Monetary Fund, and as a member of the G7 and G20 Ministers and Governors. He was a member of the steering committees of the European Systemic Risk Board in 2011 and the Financial Stability Board from 2010 to 2011. On leave from the University of Cologne from 2004 to 2012, he was a visiting professor at the University of Chicago Booth School of Business from 2011 to 2012. From 2002 to 2004, Mr. Weber served as a member of the German Council of Economic Experts. He was a professor of international economics and Director of the Center for Financial Research at the University of Cologne from 2001 to 2004, and a professor of monetary economics and Director of the Center for Financial Studies at the Goethe University in Frankfurt/Main from 1998 to 2001. From 1994 to 1998, he was a professor of economic theory at the University of Bonn. Mr. Weber holds a PhD in economics from the University of Siegen, where he also received his habilitation. He graduated with a master’s degree in economics at the University of Constance and holds honorary doctorates from the universities of Duisburg-Essen and Constance. Other activities and functions Mandates on boards of corporations, organizations and foundations or interest groups include: Mr. Weber is a board member of the Institute of International Finance and the International Monetary Conference. He is a member of the European Banking Group, the European Financial Services Roundtable and the Group of Thirty, Washington, DC. He is a research fellow at the Center for Economic Policy Research in London and at the Center for Financial Research in Cologne. He is a senior research fellow at the Center for Financial Studies in Frankfurt/Main and a member of the Monetary Economics and International Economics Councils of the leading association of German-speaking economists, the Verein für Socialpolitik. He is a member of the Advisory Board of the German Market Economy Foundation and a member of the Advisory Board of the Department of Economics at the University of Zurich. He is also a member of the IMD Foundation Board in Lausanne and a member of the International Advisory Panel of the Monetary Authority of Singapore. | | |
|
Corporate governance, responsibility |
and compensation |
| | | | | | |
| | | 
Michel Demaré Belgian, born 31 August 1956 Syngenta International AG, Schwarzwaldallee 215, CH-4058 Basel Functions in UBS Independent Vice Chairman/member of the Audit Committee/member of the Governance and Nominating Committee/member of the Human Resources and Compensation Committee Year of initial appointment: 2009 | | Professional history and education Michel Demaré was elected to the BoD at the 2009 AGM, and in April 2010, was appointed independent Vice Chairman. He has been a member of the Audit Committee since 2009 and the Governance and Nominating Committee since 2010. He became a member of the Human Resources and Compensation Committee in 2013. Mr. Demaré joined ABB in 2005 as Chief Financial Officer (CFO) and as a member of the Group Executive Committee. He stepped down from his function in ABB in January 2013. Between February and August 2008, he acted as the interim CEO of ABB. From September 2008 to March 2011, he combined his role as CFO with that of President of Global Markets. Mr. Demaré joined ABB from Baxter International Inc., where he was CFO Europe from 2002 to 2005. Prior to this, he spent 18 years at the Dow Chemical Company, holding various treasury and risk management positions in Belgium, France, the US and Switzerland. Between 1997 and 2002, Mr. Demaré was CFO of the Global Polyolefins and Elastomers division. He began his career as an officer in the multinational banking division of Continental Illinois National Bank of Chicago, and was based in Antwerp. Mr. Demaré graduated with an MBA from the Katholieke Universiteit Leuven, Belgium, and holds a degree in applied economics from the Université Catholique de Louvain, Belgium. Other activities and functions Mandates on boards of corporations, organizations and foundations or interest groups include: Mr. Demaré is Chairman of the Board of Syngenta. He is a member of the IMD Supervisory Board in Lausanne and Chairman of SwissHoldings in Berne. He is Chairman of the Syngenta Foundation for Sustainable Agriculture and a member of the Advisory Board of the Department of Banking and Finance at the University of Zurich. | | |
| | | 
David Sidwell American (US) and British, born 28 March 1953 UBS AG, Bahnhofstrasse 45, CH-8001 Zurich Functions in UBS Senior Independent Director/Chairperson of the Risk Committee/member of the Governance and Nominating Committee Year of initial appointment: 2008 | | Professional history and education David Sidwell was elected to the BoD at the 2008 AGM. In April 2010, he was appointed Senior Independent Director. He has chaired the Risk Committee since 2008 and has been a member of the Governance and Nominating Committee since 2011. Mr. Sidwell was Executive Vice President and CFO of Morgan Stanley between 2004 and 2007. Before joining Morgan Stanley he worked for JPMorgan Chase & Co., where, in his 20 years of service, he held a number of different positions, including controller and, from 2000 to 2004, CFO of the Investment Bank. Prior to this, he was with Price Waterhouse in both London and New York. Mr. Sidwell graduated from Cambridge University and qualified as a chartered accountant with the Institute of Chartered Accountants in England and Wales. Other activities and functions Mandates on boards of corporations, organizations and foundations or interest groups include: Mr. Sidwell is a director and Chairperson of the Risk Policy and Capital Committee of Fannie Mae, Washington, DC, and is a senior advisor at Oliver Wyman, New York. He is Chairman of the Board of Village Care, New York, and is a director of the National Council on Aging, Washington, DC. | | |
| | | 
Reto Francioni Swiss, born 18 August 1955 Deutsche Börse AG, D-60485 Frankfurt am Main Function in UBS Member of the Corporate Responsibility Committee Year of initial appointment: 2013 | | Professional history and education Reto Francioni was elected to the BoD at the 2013 AGM and became a member of the Corporate Responsibility Committee. He has been CEO of Deutsche Börse AG since 2005. Since 2006, he has been a professor of applied capital markets theory at the University of Basel. From 2002 to 2005, he was Chairman of the Supervisory Board and President of the SWX Group, Zurich. Mr. Francioni was co-CEO and Spokesman for the Board of Directors of Consors AG, Nuremberg, from 2000 to 2002. Between 1993 and 2000, he held various management positions at Deutsche Börse AG, including that of Deputy CEO from 1999 to 2000. From 1992 to 1993, he served in the corporate finance division of Hoffmann-La Roche, Basel. Prior to this, he worked for several years for Association Tripartite Bourses and, from 1985 to 1988, for the former Credit Suisse, holding positions in the equity sales and legal departments. He started his professional career in 1981 in the commerce division of Union Bank of Switzerland. Mr. Francioni completed his studies in law in 1981 and his PhD in 1987 at the University of Zurich. Other activities and functions Mandates on boards of corporations, organizations and foundations or interest groups include: Mr. Francioni is a member of the Shanghai International Financial Advisory Committee and of the Advisory Board of Moscow International Financial Center. He also serves as a member of the International Advisory Board of the Instituto de Empresa and of the Board of Trustees of Goethe Business School. Mr. Francioni is a member of the Steering Committee of the Project “Role of Financial Services in Society,” World Economic Forum, and a member of the Franco-German Roundtable. He is a member of the Strategic Advisory Group of VHV Insurance. Mr. Francioni holds various mandates on the boards of Deutsche Börse Group subsidiaries. | | |
Corporate governance, responsibility and compensation
Corporate governance
| | | | | | |
| | | 
Rainer-Marc Frey Swiss, born 10 January 1963 Office of Rainer-Marc Frey, Seeweg 39, CH-8807 Freienbach Functions in UBS Member of the Human Resources and Compensation Committee/member of the Risk Committee Year of initial appointment: 2008 | | Professional history and education Rainer-Marc Frey was elected to the BoD at the October 2008 Extraordinary General Meeting and has been a member of the Human Resources and Compensation Committee since 2012 and of the Risk Committee since 2008. Mr. Frey is the founder of the investment management company Horizon21 AG. He is Chairman of Horizon21 AG as well as its holding company and related entities and subsidiaries. In 2013, he led the buy-out of Lonrho plc on the London Stock Exchange and became the majority shareholder of this now privately held company. In 1992, he founded and was appointed CEO of RMF Investment Group. RMF was acquired by Man Group plc in 2002. Between 2002 and 2004, he held a number of senior roles within Man Group. From 1989 to 1992, Mr. Frey served as a director at Salomon Brothers in Zurich, Frankfurt and London, where he was primarily involved with equity derivatives. Between 1987 and 1989, he worked for Merrill Lynch covering equity, fixed income and swaps markets. Mr. Frey holds a degree in economics from the University of St. Gallen. Other activities and functions Mandates on boards of corporations, organizations and foundations or interest groups include: Mr. Frey is a member of the board of DKSH Group, Zurich, as well as of the Frey Charitable Foundation, Freienbach. He is Chairman of Lonrho Holdings Ltd. and Vice Chairman of its operating company. | | |
| | | 
Ann F. Godbehere Canadian and British, born 14 April 1955 UBS AG, Bahnhofstrasse 45, CH-8001 Zurich Functions in UBS Chairperson of the Human Resources and Compensation Committee/member of the Audit Committee Year of initial appointment: 2009 | | Professional history and education Ann F. Godbehere was elected to the BoD at the 2009 AGM. She has chaired the Human Resources and Compensation Committee since 2011 and has been a member of the Audit Committee since 2009. Ms. Godbehere was appointed CFO and Executive Director of Northern Rock in February 2008, serving in these roles during the initial phase of the business’s public ownership until the end of January 2009. Prior to this role, she served as CFO of Swiss Re Group from 2003 to 2007. Ms. Godbehere was CFO of its Property & Casualty division in Zurich for two years. Prior to this, she served as CFO of the Life & Health division in London for three years. From 1997 to 1998, she was CEO of Swiss Re Life & Health in Canada. Between 1996 and 1997, she was CFO of Swiss Re Life & Health North America. Ms. Godbehere is a certified general accountant and, in 2003, was made a fellow of the Certified General Accountants Association of Canada. Other activities and functions Mandates on boards of corporations, organizations and foundations or interest groups include: Ms. Godbehere is a board member and Chairperson of the audit committees of Prudential plc, Rio Tinto plc and Rio Tinto Limited in London. She is on the board of Atrium Underwriters Ltd. and Atrium Underwriting Group Ltd., London, and chairs the audit committee. She is also a member of the boards of Arden Holdings Ltd., Bermuda, and of British American Tobacco plc. | | |
| | | 
Axel P. Lehmann Swiss, born 23 March 1959 Zurich Insurance Group, Mythenquai 2, CH-8002 Zurich Function in UBS Member of the Risk Committee Year of initial appointment: 2009 | | Professional history and education Axel P. Lehmann was elected to the BoD at the 2009 AGM and has been a member of the Risk Committee since 2009. He is a member of the Group Executive Committee of Zurich Insurance Group (Zurich) and has been Group Chief Risk Officer since January 2008 and Regional Chairman Europe since October 2011. In July 2011, he was appointed Chairman of the Board of Farmers Group, Inc., and was responsible for Group IT from 2008 to 2010. In September 2004, Mr. Lehmann was appointed CEO of Zurich American Insurance Company and the North America Commercial business division in Schaumburg, Illinois. He became a member of Zurich’s Group Executive Committee and CEO of its Continental Europe business division in 2002 and, in 2004, was responsible for integrating it with UK, Ireland and South Africa. In 2001, he took over responsibility for Northern, Central and Eastern Europe and was appointed CEO of Zurich Group Germany. In 2000, Mr. Lehmann became a member of the Group Management Board with responsibility for group-wide business development functions. Mr. Lehmann holds a PhD and a master’s degree in business administration and economics from the University of St. Gallen. He is also a graduate of the Wharton Advanced Management Program and an honorary professor of business administration and service management at the University of St. Gallen. Other activities and functions Mandates on boards of corporations, organizations and foundations or interest groups include: Mr. Lehmann is Chairman of the Board of the Institute of Insurance Economics at the University of St. Gallen, and is a former Chairman and member of the Chief Risk Officer Forum and a board member of Economiesuisse. | | |
|
Corporate governance, responsibility |
and compensation |
| | | | | | |
| | | 
Helmut Panke German, born 31 August 1946 UBS AG, Bahnhofstrasse 45, CH-8001 Zurich Functions in UBS Member of the Human Resources and Compensation Committee/member of the Risk Committee Year of initial appointment: 2004 | | Professional history and education Helmut Panke was elected to the BoD at the 2004 AGM. He has been a member of the Human Resources and Compensation Committee and the Risk Committee since 2008. Between 2002 and 2006, Mr. Panke was Chairman of the Board of Management of BMW Group after becoming a member of BMW’s Board of Management in 1996. Between 1993 and 1996, he was Chairman and CEO of BMW Holding Corporation in the US. Subsequent to joining BMW as Head of Planning and Controlling, Research and Development in 1982, he assumed management functions in corporate planning, organization and corporate strategy. Prior to this, he worked as a consultant at McKinsey & Company in both Düsseldorf and Munich. Mr. Panke graduated from the University of Munich with a PhD in physics, and undertook research work at both the University of Munich and the Swiss Institute for Nuclear Research. Other activities and functions Mandates on boards of corporations, organizations and foundations or interest groups include:
Mr. Panke is a member of the boards of Microsoft Corporation (Chairperson of the Regulatory and Public Policy Committee) and Singapore Airlines Ltd. (Chairperson of the Safety & Risk Committee). He is a member of the supervisory board of Bayer AG. | | |
| | | 
William G. Parrett American (US), born 4 June 1945 UBS AG, Bahnhofstrasse 45, CH-8001 Zurich Functions in UBS Chairperson of the Audit Committee/member of the Corporate Responsibility Committee Year of initial appointment: 2008 | | Professional history and education William G. Parrett was elected to the BoD at the October 2008 Extraordinary General Meeting. He has chaired the Audit Committee since 2009 and has been a member of the Corporate Responsibility Committee since 2012. Mr. Parrett served his entire career with Deloitte Touche Tohmatsu. He was CEO from 2003 until his retirement in 2007. Between 1999 and 2003, he was a Managing Partner of Deloitte & Touche USA LLP and served on Deloitte’s Global Executive Committee between 1999 and 2007. Mr. Parrett founded Deloitte’s US National Financial Services Industry Group in 1995 and its Global Financial Services Industry Group in 1997, both of which he led as Chairman. In his 40 years of experience in professional services, Mr. Parrett served public, private, governmental, and state-owned clients worldwide. Mr. Parrett has a bachelor’s degree in accounting from St. Francis College, New York, and is a certified public accountant. Other activities and functions Mandates on boards of corporations, organizations and foundations or interest groups include:
Mr. Parrett is on the boards of the Eastman Kodak Company, the Blackstone Group LP, and Thermo Fisher Scientific Inc., and chairs each company’s audit committee. He is also on the board of iGATE. He is Past Chairman of the Board of the United States Council for International Business and United Way Worldwide, and a Carnegie Hall Board of Trustees member. | | |
| | | 
Isabelle Romy Swiss, born 4 January 1965 Froriep, Bellerivestrasse 201, CH-8034 Zurich Functions in UBS Member of the Audit Committee/member of the Governance and Nominating Committee Year of initial appointment: 2012 | | Professional history and education Isabelle Romy was elected to the BoD at the 2012 AGM. She has been a member of the Audit Committee and the Governance and Nominating Committee since 2012. Ms. Romy is a partner at Froriep, a large Swiss business law firm. From 1995 to 2012, she worked for another major Swiss law firm based in Zurich, where she was a partner from 2003 to 2012. Her legal practice includes litigation and arbitration in cross-border cases. Ms. Romy has been an associate professor at the University of Fribourg and at the Federal Institute of Technology in Lausanne (EPFL) since 1996. Between 2003 and 2008, she served as a deputy judge at the Swiss Federal Supreme Court. From 1999 to 2006, she was a member of the Ethics Commission at the EPFL. Ms. Romy completed her PhD (Dr. iur.) at the University of Lausanne in 1990 and has been a qualified attorney-at-law admitted to the bar since 1991. From 1992 to 1994, she was a visiting scholar at Boalt Hall School of Law, University of California, Berkeley, and completed her professorial thesis at the University of Fribourg in 1996. Other activities and functions Mandates on boards of corporations, organizations and foundations or interest groups include:
Ms. Romy has been a member of the sanction commission of SIX Swiss Exchange since 2002, serving as Vice Chairman since 2008. | | |
Corporate governance, responsibility and compensation
Corporate governance
| | | | | | |
| | | 
Beatrice Weder di Mauro Italian and Swiss, born 3 August 1965 Johannes Gutenberg University Mainz, Jakob Welder-Weg 4, D-55099 Mainz Functions in UBS Member of the Audit Committee/member of the Risk Committee Year of initial appointment: 2012 | | Professional history and education Beatrice Weder di Mauro was elected to the BoD at the 2012 AGM. She has been a member of the Audit Committee since 2012 and became a member of the Risk Committee in 2013. She has been a professor of economics, economic policy and international macroeconomics at the Johannes Gutenberg University of Mainz since 2001. Ms. Weder di Mauro was a member of the German Council of Economic Experts from 2004 to 2012. In 2010, she was a resident scholar at the International Monetary Fund (IMF) in Washington, DC, and, in 2006, a visiting scholar at the National Bureau of Economic Research, Cambridge, MA. Since 2003, Ms. Weder di Mauro has been a research fellow of the Center for Economic Policy Research in London. She was an associate professor of economics at the University of Basel between 1998 and 2001 and a research fellow at the United Nations University in Tokyo from 1997 to 1998. Prior to this, she worked as an economist for the World Bank and the IMF in Washington, DC. Ms. Weder di Mauro completed her PhD in economics at the University of Basel in 1993 and received her habilitation there in 1999. Other activities and functions Mandates on boards of corporations, organizations and foundations or interest groups include:
Ms. Weder di Mauro is on the boards of Roche Holding Ltd., Basel, and Robert Bosch GmbH, Stuttgart. She is a member of the Corporate Governance Commission of the German Government and the Expert Group of European Commission on Debt Redemption Fund and Eurobills. | | |
| | | 
Joseph Yam Chinese and Hong Kong citizen, born 9 September 1948 UBS AG, Bahnhofstrasse 45, CH-8001 Zurich Functions in UBS Member of the Corporate Responsibility Committee/member of the Risk Committee Year of initial appointment: 2011 | | Professional history and education Joseph Yam was elected to the BoD at the 2011 AGM. He has been a member of the Corporate Responsibility Committee and the Risk Committee since 2011. He is Executive Vice President of the China Society for Finance and Banking and in that capacity has served as an advisor to the People’s Bank of China since 2009. Mr. Yam was instrumental in the establishment of the Hong Kong Monetary Authority and served as Chief Executive from 1993 until his retirement in 2009. He began his career in Hong Kong as a statistician in 1971 and served the public for over 38 years. During his service, he occupied several positions such as Director of the Office of the Exchange Fund from 1991, Deputy Secretary for Monetary Affairs from 1985 and Principal Assistant Secretary for Monetary Affairs from 1982. Mr. Yam graduated from the University of Hong Kong in 1970 with first class honors in social sciences. He holds honorary doctorate degrees and professorships from a number of universities in Hong Kong and overseas. Mr. Yam is a Distinguished Research Fellow of the Institute of Global Economics and Finance at the Chinese University of Hong Kong. Other activities and functions Mandates on boards of corporations, organizations and foundations or interest groups include:
Mr. Yam sits on the international advisory councils of a number of government and academic institutions. He is on the boards of Johnson Electric Holdings Limited and UnionPay International Co., Ltd. | | |
Company Secretary
| | | | | | |
| | | 
Luzius Cameron Australian and Swiss, born 11 September 1955 UBS AG, Bahnhofstrasse 45, CH-8001 Zurich Function in UBS Company Secretary since 2005 | | Professional history and education Luzius Cameron was appointed Company Secretary by the BoD for the first time in 2005. He is a Group Managing Director and was appointed to the former Group Managing Board in 2002. From 2002 to 2005, Mr. Cameron was the Director of Strategic Planning and New Business Development, Wealth Management USA. Prior to this role, he was Head of Group Strategic Analysis, and before that, Head of Corporate Business Analysis. Mr. Cameron joined Swiss Bank Corporation in 1989, where he started out in Corporate Controlling before assuming a number of senior roles at Warburg Dillon Read, including Chief of Staff to the Chief Operating Officer in London and Business Manager of the Global Rates Business in Zurich. From 1984 to 1989, he was a lecturer in astrophysics at the University of Basel. Between 1980 and 1989, he was a research analyst at the Institute of Astronomy at the University of Basel and European Southern Observatory. Mr. Cameron holds a PhD in astrophysics from the University of Basel. | | |
|
Corporate governance, responsibility |
and compensation |
Elections and terms of office
In accordance with article 19 para. 1 of the Articles of Association, all BoD members are to be elected on an individual basis for a one-year term of office. As a result, shareholders must confirm the entire membership of the BoD on a yearly basis at the AGM, which will next take place on 7 May 2014.
BoD members are normally expected to serve for a minimum of three years. No BoD member can serve for more than 10 consecutive terms of office or continue to serve beyond the AGM held in the calendar year following their 70th birthday. In exceptional circumstances the BoD can extend both these limits.
Organizational principles and structure
Following each AGM, the BoD meets to appoint its Chairman, Vice Chairmen, Senior Independent Director, BoD committee members and their respective Chairpersons. At the same meeting, the BoD appoints a Company Secretary, who acts as secretary to the BoD and its committees.
According to the Articles of Association, the BoD meets as often as business requires, but must meet at least six times a year. In 2013, a total of 22 meetings were held, eight times with the presence of GEB members and 14 times for meetings and calls without GEB participation. On average, 95% of BoD members were present at BoD meetings without GEB participation, and 97% at meetings with GEB participation. The average duration of these meetings and calls was 165 minutes. In addition, the BoD met for a one-day seminar.
At every BoD meeting, each committee chairperson provides the BoD with updates on current activities of his or her committee as well as important committee issues.
At least once per year, the BoD reviews its own performance as well as the performance of each of its committees. This review is based on an assessment of the BoD under the auspices of the Governance and Nominating Committee, as well as a self-assessment of the BoD committees, and seeks to determine whether the BoD and its committees are functioning effectively and efficiently. The last BoD committees’ assessment was conducted by a third party and was completed in spring 2013. It concluded that the BoD is operating effectively. The next assessment will be conducted again as a self-assessment and will be completed in spring 2014.
The committees listed below assist the BoD in the performance of its responsibilities. These committees and their charters are described in the Organization Regulations, published atwww.ubs.com/governance.
Audit Committee
The Audit Committee is comprised of five BoD members, with all members having been determined by the BoD to be fully independent and financially literate. On 31 December 2013, William G. Parrett chaired the Audit Committee with Michel Demaré, Ann F. Godbehere, Isabelle Romy and Beatrice Weder di Mauro as additional
members. All members have accounting or related financial management expertise and the majority qualify as a “financial expert” under the rules established pursuant to the US Sarbanes-Oxley Act of 2002.
The Audit Committee itself does not perform audits, but monitors the work of the external auditors, Ernst & Young Ltd (EY), who in turn are responsible for auditing UBS AG’s and UBS Group’s annual financial statements and for reviewing the quarterly financial statements.
The function of the Audit Committee is to serve as an independent and objective body with oversight of the following: (i) UBS AG’s and UBS Group’s accounting policies, financial reporting and disclosure controls and procedures, (ii) the quality, adequacy and scope of external audit, (iii) UBS AG’s and UBS Group’s compliance with financial reporting requirements, (iv) the senior management’s approach to internal controls with respect to the production and integrity of the financial statements and disclosure of the financial performance and (v) the performance of Group Internal Audit in conjunction with the Chairman and the Risk Committee. For these purposes, the Audit Committee has the authority to meet with regulators and external bodies in consultation with the Group CEO. Senior management is responsible for the preparation, presentation and integrity of the financial statements.
The Audit Committee reviews the annual and quarterly financial statements of UBS AG and UBS Group, as proposed by management, with the external auditors and Group Internal Audit in order to recommend their approval (including any adjustments the Audit Committee considers appropriate) to the BoD.
Periodically, and at least annually, the Audit Committee assesses the qualifications, expertise, effectiveness, independence and performance of the external auditors and their lead audit partner, in order to support the BoD in reaching a decision in relation to the appointment or dismissal of the external auditors and the rotation of the lead audit partner. The BoD then submits these proposals for approval at the AGM.
During 2013, the Audit Committee held a total of eight meetings and 10 telephone conferences. The meetings had an average duration of four hours and the telephone conferences lasted approximately one hour each. Participation was 97%. Also present at the meetings were the Chairman, the Group CEO, the Group Chief Financial Officer (Group CFO), the Head of Group Internal Audit, the Group Finance Chief Operating Officer, the Group Controller as well as EY (for the agenda items appropriate to them). The conference calls were conducted in the presence of the Audit Committee members, the Group CFO and selected management members. In 2013, eight joint Audit Committee/Risk Committee sessions were held. The Audit Committee held a session with FINMA in early 2014.
The Audit Committee reports to the BoD about its discussions with our external auditors. Once per year, the lead representatives of our external auditors present their long-form report to the BoD, as required by FINMA.
The NYSE listing standards on corporate governance set more stringent independence requirements for members of audit
Corporate governance, responsibility and compensation
Corporate governance
committees than for the other members of the BoD. Each of the five members of our Audit Committee is an external BoD member who, in addition to satisfying our independence criteria, does not receive, directly or indirectly, any consulting, advisory or other compensatory fees from UBS other than in his or her capacity as a BoD member, does not hold, directly or indirectly, UBS shares in excess of 5% of the outstanding capital and (except as noted below) does not serve on the audit committees of more than two other public companies. The NYSE listing standards on corporate governance allow for an exemption for audit committee members to serve on more than three audit committees of public companies, provided that all BoD members determine that the candidate has the time and the availability to fulfill his or her obligations. Considering the credentials of William G. Parrett and Ann F. God-behere, the BoD has granted this exemption in their cases.
Corporate Responsibility Committee
The Corporate Responsibility Committee supports the BoD in fulfilling its duty to safeguard and advance the Group’s reputation for responsible corporate conduct. It reviews and assesses stakeholder concerns and expectations for responsible corporate conduct and their possible consequences for UBS, and recommends appropriate actions to the BoD. The majority of the Corporate Responsibility Committee’s members must be independent. On 31 December 2013, the Corporate Responsibility Committee was chaired by Axel A. Weber, with independent BoD members Reto Francioni, William G. Parrett and Joseph Yam as additional members. The Corporate Responsibility Committee is advised and supported by a number of senior business representatives. It met three times for 75 minutes on average in 2013, and 100% of the Corporate Responsibility Committee members were present.
| | è | | Refer to the “Corporate responsibility” section of this report for more information |
Governance and Nominating Committee
The Governance and Nominating Committee supports the BoD in fulfilling its duty to establish best practices in corporate governance across the Group, to conduct a BoD annual self-assessment, to establish and maintain a process for appointing new BoD and GEB members (in the latter case, upon proposal by the Group CEO), and to manage the succession planning of all GEB members. The Governance and Nominating Committee comprises three independent BoD members and, on 31 December 2013, was chaired by Axel A. Weber, with Michel Demaré, Isabelle Romy and David Sidwell as additional members. In 2013, eight meetings and one telephone conference were held, with a 100% participation rate and a duration averaging one hour. One meeting was held with external advisors.
Human Resources and Compensation Committee
The Human Resources and Compensation Committee is responsible for the following functions: (i) supporting the BoD in its duties to set guidelines on compensation and benefits, (ii) approving the total compensation for the Chairman and the non-
independent BoD members, (iii) evaluating, in consultation with the Chairman, the performance of the Group CEO and other GEB members in meeting agreed goals and objectives as well as informing the Governance and Nominating Committee of the outcome of the performance evaluation of the Group CEO, (iv) proposing, together with the Chairman, total individual compensation for the independent BoD members and Group CEO for approval by the BoD and (v) proposing to the BoD for approval, upon recommendation of the Group CEO, the total individual compensation for GEB members. The Human Resources and Compensation Committee also reviews the compensation disclosure included in this report.
The Human Resources and Compensation Committee comprises four independent BoD members and, on 31 December 2013, Ann F. Godbehere chaired it with Michel Demaré, Rainer-Marc Frey and Helmut Panke as additional members. In 2013, seven meetings and five telephone conferences were held with an average duration of 100 minutes and a participation rate of 94%. All meetings were conducted with the presence of external advisors, the Chairman and Group CEO.
| | è | | Refer to “Our Total Reward Principles and compensation governance” in the “Compensation” section of this report for more information on the Human Resources and Compensation Committee’s decision-making procedures |
Risk Committee
The Risk Committee is responsible for overseeing and supporting the BoD in fulfilling its duty to supervise and set appropriate risk management and control principles in the following areas: (i) risk management and control, including credit, market, country, legal and operational risks, (ii) treasury and capital management, including funding, liquidity and equity attribution and (iii) balance sheet management. The Risk Committee considers the potential effects of the aforementioned risks on the Group’s reputation. For these purposes, the Risk Committee receives all relevant information from the GEB and has the authority to meet with regulators and external bodies in consultation with the Group CEO. On 31 December 2013, the Risk Committee comprised six independent BoD members. David Sidwell chaired the Risk Committee with Rainer-Marc Frey, Axel P. Lehmann, Helmut Panke, Beatrice Weder di Mauro and Joseph Yam as additional members. During 2013, the Risk Committee held a total of eight meetings and three calls, with an average member participation rate of 95%. The average meeting duration was six hours and the calls lasted approximately two hours on average.
The Audit Committee Chairperson regularly attended part or all of the Risk Committee meetings. In 2013, the Chairman, the Group CEO, the Group CFO, the Group Chief Risk Officer, the Group General Counsel, the CEO of the Investment Bank, the Group Treasurer, the Head Group Internal Audit and EY were also regularly present. In addition, the Risk Committee and Human Resources and Compensation Committee met to jointly discuss topics on which they have shared responsibility. Annually, one session is held with the Governing Board of the SNB and one
|
Corporate governance, responsibility |
and compensation |
with FINMA. One meeting was held with the Federal Reserve Bank of New York and the Connecticut Department of Banking. In addition, the Risk Committee Chairperson meets at least once a year with the UK Prudential Regulation Authority and Financial Conduct Authority.
Ad-hoc Strategy Committee
In 2013, the ad-hoc committee on strategy (the Strategy Committee) focused on the agreed upon UBS strategy and the ongoing resolution and recovery program. On 31 December 2013, the Strategy Committee comprised five BoD members. Axel A. Weber chaired the Strategy Committee with Michel Demaré, Reto Francioni, Rainer-Marc Frey and David Sidwell as additional members. One telephone conference and two meetings were held with an average duration of 40 minutes and a participation rate of 100%. All these events were attended by the Group CEO and Group CFO.
Ad-hoc Special Committee
In 2013, the BoD created an ad-hoc Special Committee, composed of three independent BoD members, focusing on certain specific litigation and regulatory matters. On 31 December 2013, David Sidwell chaired the Special Committee with Isabelle Romy and Joseph Yam as additional members. The Special Committee held two meetings and five telephone conferences in 2013, which were attended by all the Special Committee members. The meetings and calls lasted on average 100 minutes.
Roles and responsibilities of the Chairman of the Board of Directors
Axel A. Weber, the Chairman of the BoD, has entered into a full-time employment contract with UBS in connection with his service on the BoD.
The Chairman coordinates tasks within the BoD, calls BoD meetings and sets their agendas. Under the leadership of the Chairman, the BoD decides on the strategy of the Group upon the recommendation of the Group CEO, exercises ultimate supervision over management and appoints all GEB members.
The Chairman presides over all general meetings of shareholders, and works with the committee chairpersons to coordinate the work of all BoD committees. Together with the Group CEO, the Chairman is responsible for ensuring effective communication with shareholders and other stakeholders, including government officials, regulators and public organizations. This is in addition to establishing and maintaining a close working relationship with the Group CEO and other GEB members, and providing advice and support when appropriate.
Roles and responsibilities of the Vice Chairmen and the Senior Independent Director
The BoD appoints one or more Vice Chairmen and a Senior Independent Director. If the BoD appoints more than one Vice Chairman,
one of them must be independent. Michel Demaré has been appointed as Vice Chairman and David Sidwell has been appointed as Senior Independent Director. A Vice Chairman is required to lead the BoD in the absence of the Chairman and to provide support and advice to the Chairman. At least twice a year, the Senior Independent Director organizes and leads a meeting of the independent BoD members in the absence of the Chairman. In 2013, two independent BoD meetings were held with an average duration of 75 minutes. The Senior Independent Director relays any issues or concerns of independent BoD members to the Chairman and acts as a contact point for shareholders and stakeholders wishing to engage in discussions with an independent BoD member.
Important business connections of independent members of the Board of Directors with UBS
As a global financial services provider and a major bank in Switzerland, we have business relationships with many large companies, including those in which our BoD members assume management or independent board responsibilities. The Governance and Nominating Committee determines whether the nature of the relationships between us and the companies whose chair, chief executive or other officer is a member of our BoD compromises or not his or her capacity for independent judgment.
Our Organization Regulations require three-quarters of the BoD members to be independent. As a general rule, for a BoD member to be considered independent, he or she may not have a material relationship with UBS or one of its subsidiaries, either directly or as a partner, controlling shareholder or executive officer of a company that has a relationship with us. In addition, in order to be considered independent, our BoD members have to fulfill the additional criteria our BoD has established based on the requirements set forth in the NYSE listing standards on corporate governance, the FINMA Circular 08/24 on the supervision and internal controls at banks, and the standards established in the Swiss Code of Best Practice for Corporate Governance. These criteria, together with a definition of what constitutes a material relationship, are published on our website atwww.ubs.com/governance.
In 2013, our BoD met the standards of the Organization Regulations for the percentage of directors that are considered independent under the criteria described above. Due to our Chairman’s full-time employment by UBS AG, he is not considered independent.
All relationships and transactions with UBS’s independent BoD members are conducted in the ordinary course of business, and are on the same terms as those prevailing at the time for comparable transactions with non-affiliated persons. All relationships and transactions with BoD members’ associated companies are conducted at arm’s length.
| | è | | Refer to “Note 34 Related parties” in the “Financial information” section of this report for more information |
Corporate governance, responsibility and compensation
Corporate governance
Checks and balances: Board of Directors and Group Executive Board
We operate under a strict dual board structure, as mandated by Swiss banking law. The separation of responsibilities between the BoD and the GEB is clearly defined in the Organization Regulations. The BoD decides on the strategy of the Group upon the recommendation of the Group CEO, and supervises and monitors the business, whereas the GEB, headed by the Group CEO, has executive management responsibility. The functions of Chairman of the BoD and Group CEO are assigned to two different people, ensuring a separation of power. This structure establishes checks and balances and preserves the institutional independence of the BoD from the day-to-day management of the Group, for which responsibility is delegated to the GEB under the leadership of the Group CEO. No member of one board may be a member of the other.
Supervision and control of the GEB remains with the BoD. The authorities and responsibilities of the two bodies are governed by the Articles of Association and the Organization Regulations, including the latter document’s “Annex B – Responsibilities and authorities.”
| | è | | Refer to www.ubs.com/governance for more information on checks and balances for the Board of Directors and Group Executive Board |
Information and control instruments vis-à-vis the Group Executive Board
The BoD is kept informed of the activities of the GEB in various ways, including minutes of GEB meetings being made available to the BoD. The Group CEO and other GEB members also regularly update the BoD on important issues at BoD meetings.
At BoD meetings, BoD members may request from BoD or GEB members any information about matters concerning UBS that they require to fulfill their duties. Outside meetings, BoD members may request information from other BoD and GEB members, in which case such requests must be approved by the Chairman.
Group Internal Audit independently, objectively and systematically assesses the adherence to our strategy, the effectiveness of governance, risk management and control processes at Group, divisional and regional levels, and monitors compliance with legal, regulatory and statutory requirements, as well as with internal policies and contracts. This internal audit organization has a functional reporting line to the Risk Committee and the Audit Committee in line with their responsibilities as set forth in our Organization Regulations. The Risk Committee and the Audit Committee together approve the appropriateness of Group Internal Audit’s annual audit plan and annual audit objectives and must be in regular contact with the Head Group Internal Audit. Both committees and the Chairman are provided with written reports from Group Internal Audit including an annual report summarizing the function’s activities and significant audit results.
Our compliance function provided an annual compliance report to the BoD in March 2013. This report is required by section 112 of the FINMA Circular 08/24 on the supervision and internal controls at banks.
| | è | | Refer to the “Risk management and control” section of this report for more information |
|
Corporate governance, responsibility |
and compensation |
Group Executive Board
UBS operates under a strict dual board structure, as required by Swiss banking law. The management of the business is delegated by the BoD to the Group Executive Board (GEB).
Members of the Group Executive Board and changes in 2013
In spring 2013, the GEB decided that the role of the Corporate Center Chief Executive Officer would be eliminated and all responsibilities and authorities pertaining to that role would be assumed by the Group Chief
Operating Officer (Group COO). On 5 December 2013, changes to the GEB and Corporate Center structure were announced. John Fraser, Chairman and CEO Global Asset Management since 2001, retired from his CEO role on 31 December 2013. Ulrich Körner assumed the role of CEO Global Asset Management and Tom Naratil, currently Group Chief Financial Officer (CFO), was also appointed Group COO, effective on 1 January 2014.
The following biographies provide information on the GEB members.
| | | | | | |
| | | 
Sergio P. Ermotti Swiss, born 11 May 1960 UBS AG, Bahnhofstrasse 45, CH-8001 Zurich Function in UBS Group Chief Executive Officer Year of initial appointment: 2011 | | Professional history and education Sergio P. Ermotti was appointed Group Chief Executive Officer in November 2011, having held the position of Group Chief Executive Officer on an interim basis since September 2011. Mr. Ermotti became a member of the GEB in April 2011 and was Chairman and CEO of UBS Group Europe, Middle East and Africa from April to November 2011. From 2007 to 2010, he was Group Deputy Chief Executive Officer at UniCredit, Milan, and was responsible for the strategic business areas of Corporate and Investment Banking, and Private Banking. He joined UniCredit in 2005 as Head of Markets & Investment Banking Division. Between 2001 and 2003, he worked at Merrill Lynch, serving as co-Head of Global Equity Markets and as a member of the Executive Management Committee for Global Markets & Investment Banking. He began his career with Merrill Lynch in 1987, and held various positions within equity derivatives and capital markets. Mr. Ermotti is a Swiss-certified banking expert and is a graduate of the Advanced Management Program at Oxford University. | | |
| | | 
Markus U. Diethelm Swiss, born 22 October 1957 UBS AG, Bahnhofstrasse 45,CH-8001 Zurich Function in UBS Group General Counsel Year of initial appointment: 2008 | | Professional history and education Markus U. Diethelm was appointed Group General Counsel of UBS and became a member of the GEB in September 2008. From 1998 to 2008, he served as Group Chief Legal Officer at Swiss Re, and was appointed to its Group Executive Board in 2007. Prior to this, he was at the Los Angeles-based law firm Gibson, Dunn & Crutcher, and focused on corporate matters, securities transactions, litigation and regulatory investigations while working out of the firm’s Brussels and Paris offices. From 1989 to 1992, he practiced at Shearman & Sterling in New York, specializing in mergers and acquisitions. In 1988, he worked at Paul, Weiss, Rifkind, Wharton & Garrison in New York, after starting his career in 1983 with Bär & Karrer. Mr. Diethelm holds a law degree from the University of Zurich and a master’s degree and PhD from Stanford Law School. Mr. Diethelm is a qualified attorney-at-law admitted to the bar in Zurich and in New York State. Other activities and functions Mandates on boards of corporations, organizations and foundations or interest groups include: Mr. Diethelm is Chairman of the Swiss-American Chamber of Commerce’s legal committee. He is a member of the Committee on Capital Markets Regulation, the Swiss Advisory Council of the American Swiss Foundation, the UBS Foundation of Economics in Society and the Conseil de Fondation du Musée International de la Croix-Rouge et du Croissant-Rouge. | | |
Corporate governance, responsibility and compensation
Corporate governance
| | | | | | |
| | | 
John A. Fraser Australian and British, born 8 August 1951 UBS AG, 21 Lombard Street, London EC3V 9AH, UK Functions in UBS Chairman and CEO Global Asset Management until 31 December 2013, retiring from CEO role and GEB on that date. Year of initial appointment: 2002 | | Professional history and education John A. Fraser was appointed Chairman and CEO of Global Asset Management in December 2001, and was a member of the GEB from 2002 to 2013. He retired from his CEO role on 31 December 2013 and is currently Chairman of UBS Global Asset Management. Since 2008, he has been Chairman of UBS Saudi Arabia. From 1998 to 2001, he was President and Chief Operating Officer of UBS Asset Management and Head of Asia Pacific. From 1994 to 1998, he was the Executive Chairman and CEO of the Australia funds management business. Before joining UBS, Mr. Fraser spent over 20 years in various positions at the Australian Treasury, including two international postings in Washington, DC, first, at the International Monetary Fund and, subsequently, as the Economic Minister at the Australian Embassy in Washington, DC. He was the Deputy Secretary (Economic) of the Australian Treasury from 1990 to 1993. Mr. Fraser graduated from Monash University, Melbourne, in 1972 with a first-class honors degree in economics and, in 2013, was awarded an honorary Doctorate of Laws by this same University. Other activities and functions Mandates on boards of corporations, organizations and foundations or interest groups include: Mr. Fraser is Chairman of the Victorian Funds Management Corporation in Melbourne, a member of the Advisory Council of AccountAbility and a member of the MSCI Advisory Board. | | |
| | | 
Lukas Gähwiler Swiss, born 4 May 1965 UBS AG, Bahnhofstrasse 45, CH-8001 Zurich Functions in UBS CEO UBS Switzerland and CEO Retail & Corporate Year of initial appointment: 2010 | | Professional history and education Lukas Gähwiler became a member of the GEB and was appointed CEO of UBS Switzerland in April 2010. In his role as CEO of UBS Switzerland, he is responsible for all businesses – retail, wealth management, corporate and institutional, investment banking and asset management – in UBS’s home market. Since January 2012, he has also been CEO of Retail & Corporate. Between April 2010 and January 2012, he combined the position of CEO of UBS Switzerland with the role of co-CEO of UBS Wealth Management & Swiss Bank. From 2003 to 2010, he was Chief Credit Officer at Credit Suisse and was accountable for the worldwide credit business of Private Banking, including Commercial Banking in Switzerland. In 1998, Mr. Gähwiler was appointed Chief of Staff to the CEO of Credit Suisse’s Private and Corporate business unit and, prior to this, held various front-office positions in Switzerland and North America. He earned a bachelor’s degree in business administration from the University of Applied Sciences in St. Gallen. Mr. Gähwiler completed an MBA program in corporate finance at the International Bankers School in New York, as well as the Advanced Management Program at Harvard Business School. Other activities and functions Mandates on boards of corporations, organizations and foundations or interest groups include: Mr. Gähwiler is a member of the boards of the Zürcher Volkswirtschaftliche Gesellschaft, Opernhaus Zürich AG and Economiesuisse. He is Vice Chairman of the Zurich Chamber of Commerce and of the Swiss Finance Institute, as well as a member of the Foundation Board of the UBS pension fund and of the UBS Foundation of Economics in Society. | | |
| | | 
Ulrich Körner German and Swiss, born 25 October 1962 UBS AG, Bahnhofstrasse 45, CH-8001 Zurich Functions in UBS CEO Global Asset Management since 1 January 2014 and CEO UBS Group Europe, Middle East and Africa Group Chief Operating Officer until 31 December 2013 Year of initial appointment: 2009 | | Professional history and education Ulrich Körner became CEO Global Asset Management in January 2014. Additionally, he has been CEO of UBS Group Europe, Middle East and Africa since December 2011. He became a member of the GEB in April 2009 and was Group Chief Operating Officer from 2009 to 2013. In 1998, Mr. Körner joined Credit Suisse. He served as a member of the Credit Suisse Group Executive Board from 2003 to 2008, holding various management positions, including CFO and Chief Operating Officer. From 2006 to 2008, he was responsible for the entire Swiss client business as CEO Credit Suisse Switzerland. Mr. Körner received a PhD in business administration from the University of St. Gallen, and for several years was an auditor at Price Waterhouse and a management consultant at McKinsey & Company. Other activities and functions Mandates on boards of corporations, organizations and foundations or interest groups include: Mr. Körner is Vice Chairman of the Committee of the Governing Board of the Swiss Bankers Association, Chairman of the Widder Hotel in Zurich and Vice President of the Board of Lyceum Alpinum Zuoz. He is Deputy Chairman of the Supervisory Board of UBS Deutschland AG, Chairman of the Foundation Board of the UBS pension fund, a member of the Financial Service Chapter Board of the Swiss-American Chamber of Commerce, a member of the Advisory Board of the Department of Banking and Finance at the University of Zurich and a member of the business advisory council of the Laureus Foundation Switzerland. | | |
|
Corporate governance, responsibility |
and compensation |
| | | | | | |
| | | 
Philip J. Lofts British, born 9 April 1962 UBS AG, 677 Washington Boulevard, Stamford, CT 06901 USA Function in UBS Group Chief Risk Officer Year of initial appointment: 2008 | | Professional history and education Philip J. Lofts became a GEB member in 2008, and was re-appointed as Group Chief Risk Officer in December 2011 after serving in the same role from 2008 to 2010. He was CEO of UBS Group Americas from January to November 2011. Mr. Lofts, who began his career with UBS over 25 years ago, became Group Risk Chief Operating Officer in 2008 after three years serving as Group Chief Credit Officer. Prior to this, Mr. Lofts worked for the Investment Bank in a number of business and risk control positions in Europe, Asia Pacific and the US. Mr. Lofts joined Union Bank of Switzerland in 1984 as a credit analyst and was appointed Head of Structured Finance in Japan in 1998. Mr. Lofts successfully completed his A-levels at Cranbrook School. From 1981 to 1984, he was a trainee at Charterhouse Japhet plc, a merchant bank, which was acquired by the Royal Bank of Scotland in 1985. | | |
| | | 
Robert J. McCann American (US) and Irish, born 15 March 1958 UBS AG, 1200 Harbor Boulevard, Weehawken, NJ 07086 USA Functions in UBS CEO Wealth Management Americas and CEO UBS Group Americas Year of initial appointment: 2009 | | Professional history and education Robert J. McCann was appointed CEO of Wealth Management Americas and became a member of the GEB in October 2009. In addition, he has been CEO of UBS Group Americas since December 2011. From 2003 to 2009, he worked for Merrill Lynch as Vice Chairman and President of the Global Wealth Management Group. In 2003, he served as Vice Chairman of Distribution and Marketing for AXA Financial. He began his career with Merrill Lynch in 1982, working in various positions in capital markets and research. From 2001 to 2003, he was Head of Global Securities Research and Economics. In 2000, he was appointed Chief Operating Officer of Global Markets and Investment Banking. From 1998 to 2000, he was Global Head of Global Institutional Debt and Equity Sales. Mr. McCann graduated with a bachelor’s degree in economics from Bethany College, West Virginia, and holds an MBA from Texas Christian University. Other activities and functions Mandates on boards of corporations, organizations and foundations or interest groups include: Mr. McCann is a board member of the American Ireland Fund, and is Vice Chairman of the Bethany College Board of Trustees. He is a member of the Clearing House Advisory Board, a member of the Presidents Circle of No Greater Sacrifice in Washington, DC, a member of the Committee Encouraging Corporate Philanthropy and a member of the board of the Catholic Charities of the Archdiocese of New York. | | |
| | | 
Tom Naratil American (US), born 1 December 1961 UBS AG, Bahnhofstrasse 45, CH-8001 Zurich Functions in UBS Group CFO and, since 1 January 2014, Group Chief Operating Officer Year of initial appointment: 2011 | | Professional history and education Tom Naratil was appointed Group CFO and became a member of the GEB in June 2011. In addition to this role, he was appointed Group Chief Operating Officer in January 2014. He served as CFO and Chief Risk Officer of Wealth Management Americas from 2009 until his appointment as Group CFO. Before 2009, he held various senior management positions within UBS, including heading the Auction Rate Securities Solutions Group during the financial crisis in 2008. He was named Global Head of Marketing, Segment & Client Development in 2007, Global Head of Market Strategy & Development in 2005, and Director of Banking and Transactional Solutions, Wealth Management USA, in 2002. During this time, he was a member of the Group Managing Board. He joined Paine Webber Incorporated in 1983, and after the merger with UBS became Director of the Investment Products Group. Mr. Naratil holds an MBA in economics from New York University and a bachelor of arts degree in history from Yale University. | | |
Corporate governance, responsibility and compensation
Corporate governance
| | | | | | |
| | | 
Andrea Orcel Italian, born 14 May 1963 UBS AG, Bahnhofstrasse 45, CH-8001 Zurich Function in UBS CEO Investment Bank Year of initial appointment: 2012 | | Professional history and education Andrea Orcel was appointed CEO of the Investment Bank in November 2012. He had been appointed co-CEO of the Investment Bank and a member of the GEB in July 2012. He joined UBS from Bank of America Merrill Lynch, where he had been Executive Chairman since 2009, President of Emerging Markets (ex Asia) since 2010 and CEO of European Card Services since 2011. Prior to Merrill Lynch’s acquisition by Bank of America, Mr. Orcel was a member of Merrill Lynch’s global management committee and Head of Global Origination, which combined Investment Banking and Capital Markets. He held a number of other leadership positions, including President of Global Markets & Investment Banking for Europe, Middle East and Africa (EMEA) and Head of EMEA Origination beginning in 2004. Between 2003 and 2007, he led the Global Financial Institutions Group, of which he had been part since joining Merrill Lynch in 1992. Prior to this, he worked at Goldman Sachs and the Boston Consulting Group. Mr. Orcel holds an MBA from INSEAD and a degree in economics and commerce, summa cum laude, from the University of Rome. | | |
| | | 
Chi-Won Yoon Korean, born 2 June 1959 UBS AG, 2 International Finance Centre 52/F, 8 Finance Street, Central, Hong Kong Function in UBS CEO UBS Group Asia Pacific Year of initial appointment: 2009 | | Professional history and education Chi-Won Yoon was appointed CEO of UBS Group Asia Pacific in April 2012 and has been a member of the GEB since June 2009. He held the position of co-Chairman and co-CEO of UBS Group Asia Pacific from November 2010 to March 2012. From June 2009 to November 2010, he served as sole Chairman and CEO of UBS AG, Asia Pacific. Prior to his current role, Mr. Yoon served as Head of UBS’s securities business in Asia Pacific: Asia Equities, which he oversaw from 2004, and Asia Pacific Fixed Income, Currencies and Commodities, which he led from 2009. When he first joined the firm in 1997, he served as Head of Equity Derivatives. Mr. Yoon began his career in financial services in 1986, working first at Merrill Lynch in New York and then at Lehman Brothers in New York and Hong Kong. Before embarking on a Wall Street career, he worked as an electrical engineer in satellite communications. In 1982, Mr. Yoon earned a bachelor’s degree in electrical engineering from MIT, and in 1986, a master’s degree in management from MIT’s Sloan School of Management. Other activities and functions Mandates on boards of corporations, organizations and foundations or interest groups include: Mr. Yoon is on the board of UBS Securities Co. Ltd. and a member of the Asian Executive Board of MIT’s Sloan School of Management. | | |
| | | 
Jürg Zeltner Swiss, born 4 May 1967 UBS AG, Bahnhofstrasse 45, CH-8001 Zurich Function in UBS CEO UBS Wealth Management Year of initial appointment: 2009 | | Professional history and education Jürg Zeltner became a member of the GEB in February 2009 and is CEO of UBS Wealth Management. Between February 2009 and January 2012, he served as co-CEO of UBS Wealth Management & Swiss Bank. In November 2007, he was appointed as Head of Wealth Management North, East & Central Europe. From 2005 to 2007, he was CEO of UBS Deutschland, Frankfurt, and, prior to this, he held various management positions in the former Wealth Management division of UBS. Between 1987 and 1998, he was with Swiss Bank Corporation in various roles within the Private and Corporate Client division in Berne, New York and Zurich. Mr. Zeltner holds a diploma in business administration from the College of Higher Vocational Education in Berne and is a graduate of the Advanced Management Program at Harvard Business School. Other activities and functions Mandates on boards of corporations, organizations and foundations or interest groups include: Mr. Zeltner is a board member of the German-Swiss Chamber of Commerce and Chairman of the UBS Optimus Foundation Board. | | |
|
Corporate governance, responsibility |
and compensation |
Responsibilities, authorities and organizational principles of the Group Executive Board
Under the leadership of the Group Chief Executive Officer (Group CEO), the GEB has executive management responsibility for the Group and its business. It assumes overall responsibility for the development of the Group and business division strategies and the implementation of approved strategies. The GEB constitutes itself as the risk council of the Group. In this function, the GEB has overall responsibility for the following: establishing and supervising the implementation of risk management and control principles, approving major risk policies as proposed primarily by the Group Chief Risk Officer and controlling the risk profile of the Group as a whole, as determined by the BoD and the Risk Committee. In 2013, the GEB held a total of 20 meetings, not including two GEB offsite meetings and seven ad-hoc conference calls.
| | è | | Refer to the Organization Regulations at www.ubs.com/governance for more information on the authorities of the Group Executive Board |
Responsibilities and authorities of the Group Asset and Liability Management Committee
The Group Asset and Liability Management Committee (Group ALCO), established by the GEB, is responsible for setting strategies to maximize the financial performance of the Group, and is subject to the guidelines, constraints and risk tolerances set by the BoD. The Group ALCO is also responsible for managing the balance sheet of the business divisions through allocation and monitoring of limits, as well as managing capital, liquidity and funding and promoting a one-firm financial management culture. The Organization Regulations additionally specify which powers of the GEB are delegated to the Group ALCO. In 2013, the Group ALCO held 10 meetings.
Management contracts
We have not entered into management contracts with any third parties.
Corporate governance, responsibility and compensation
Change of control and defense measures
We refrain from restrictions regarding change of control and defense measures that would hinder developments initiated in, or supported by, the financial markets. We also do not have any specific defenses in place to prevent hostile takeovers.
Duty to make an offer
An investor who acquired more than 33 1/3% of all voting rights of UBS AG, (directly, indirectly or in concert with third parties), whether they are exercisable or not, would be required to submit a takeover offer for all shares outstanding, according to the Swiss Stock Exchange Act. We have not elected to change or opt out of this rule.
Clauses on change of control
Neither the employment agreement with the Chairman of the BoD, nor the employment contracts with the Group Executive Board (GEB) members and employees holding key functions within the company (Group Managing Directors), contain change of control clauses.
All employment contracts with GEB members contain a notice period of six months, except for one which contains a 12-month notice period. During the notice period, GEB members are entitled to their salary and the continuation of existing employment benefits.
In case of a change of control, UBS may, at its discretion, accelerate the vesting of and/or relax applicable forfeiture provisions of employees’ awards, and defer lapse date of options or stock appreciation rights.
|
Corporate governance, responsibility |
and compensation |
Auditors
Audit is an integral part of corporate governance. While safeguarding their independence, the external auditors closely coordinate their work with Group Internal Audit. The Audit Committee, and ultimately the Board of Directors (BoD), supervises the effectiveness of audit work.
| | è | | Refer to “Board of Directors” in this section for more information on the Audit Committee |
External independent auditors
At the 2013 Annual General Meeting of Shareholders (AGM), Ernst & Young Ltd (EY) were re-elected as auditors for the Group for a further one-year term of office. EY assume virtually all auditing functions according to laws, regulatory requests and the Articles of Association. The EY lead partner in charge of the UBS financial audit has been Jonathan Bourne since 2010 and his incumbency is limited to five years. The co-signing partner for the financial statement audit is Troy J. Butner, who has been on the audit since 2011. His incumbency is limited to seven years. The Lead Auditor to FINMA is Rolf Walker. He has been in charge of auditing UBS since 2013 and his incumbency is limited to two years due to prior audit service to UBS in another role. The co-signing partner for the FINMA audit has been Marc Ryser since 2012, with an incumbency of seven years.
Special auditor for capital increase
At the 2012 AGM, BDO AG was appointed as special auditor for a three-year term of office. The special auditors provide audit
opinions independently from the auditors in connection with capital increases.
Fees paid to external independent auditors
The fees (including expenses) paid to our auditors EY are set forth in the table below. In addition, EY received CHF 34,445,000 in 2013 (CHF 33,327,000 in 2012) for services performed on behalf of our investment funds, many of which have independent fund boards or trustees.
Audit work includes all services necessary to perform the audit in accordance with applicable laws and generally accepted auditing standards, as well as other assurance services that conventionally only the auditor can provide. These include statutory and regulatory audits, attest services, and the review of documents to be filed with regulatory bodies. The additional services classified as audit in 2013 included several engagements for which EY were mandated at the request of FINMA to review new or remediated processes, whether in response to regulatory changes, such as Basel III, or as a result of control deficiency remediation, for example, in connection with the 2011 unauthorized trading incident.
Audit-related work comprises assurance and related services that traditionally are performed by the auditor, such as attest services related to financial reporting, internal control reviews, performance standard reviews, and consultation concerning financial accounting and reporting standards.
Tax work involves services performed by professional staff in EY’s tax division, and includes tax compliance and tax consultation with respect to our own affairs.
| | | | | | | | |
| Fees paid to external independent auditors | | | | | | | | |
UBS paid the following fees (including expenses) to its external independent auditors. | | | | | | | | |
| CHF thousand | | 31.12.13 | | | 31.12.12 | |
| | |
Audit | | | | | | | | |
| | | | | | | | | |
| Global audit fees | | | 49,522 | | | | 53,900 | |
| | | | | | | | | |
| Additional services classified as audit (services required by law or statute, including work of a non-recurring nature mandated by regulators) | | | 17,604 | | | | 23,648 | |
| | | | | | | | | |
| Total audit | | | 67,126 | | | | 77,548 | |
| | | | | | | | | |
| | |
Non-audit | | | | | | | | |
| | | | | | | | | |
| Audit-related fees | | | 11,708 | | | | 8,401 | |
| | | | | | | | | |
of which: assurance and attest services | | | 6,922 | | | | 3,427 | |
| | | | | | | | | |
of which: control and performance reports | | | 4,386 | | | | 4,134 | |
| | | | | | | | | |
of which: consultation concerning financial accounting and reporting standards | | | 400 | | | | 840 | |
| | | | | | | | | |
| Tax services | | | 950 | | | | 817 | |
| | | | | | | | | |
| Other | | | 1,601 | | | | 1,990 | |
| Total non-audit | | | 14,258 | | | | 11,208 | |
Corporate governance, responsibility and compensation
“Other” services are permitted services which include on-call advisory services and assessments of regulatory and internal control frameworks. In addition, 2013 and 2012 included non-recurring expenses.
Pre-approval procedures
To ensure EY’s independence, all services provided by them have to be pre-approved by the Audit Committee. A pre-approval may be granted either for a specific mandate, or in the form of a blanket pre-approval authorizing a limited and well-defined type and amount of services.
The Audit Committee has delegated pre-approval authority to its Chairperson, and the Group Chief Financial Officer (Group CFO) submits all proposals for services by EY to the Chairperson of the Audit Committee for approval, unless there is a blanket pre-approval in place. At each quarterly meeting, the Audit Committee is informed of the approvals granted by its Chairperson and of services authorized under blanket pre-approvals.
Group Internal Audit
With 352 personnel worldwide as of 31 December 2013, Group Internal Audit (GIA) performs the internal auditing function for the entire Group. It is an independent and objective function that supports both the Group, in achieving its defined strategic, operational, financial and compliance objectives, and the BoD, supported by its committees, in discharging their governance responsibilities. GIA provides assurance by assessing the reliability of financial and operational information, as well as compliance
with legal, regulatory and statutory requirements. All reports with key issues are provided to the Group CEO, GEB members responsible for the business divisions and other responsible management. In addition, the Chairman, the Risk Committee and the Audit Committee are regularly informed about important issues. GIA further assures the closure and successful remediation of issues, irrespective of the function which identified them, including those which are self-identified by management (first line of defense) or are raised by control functions (second line of defense), GIA (third line of defense), external auditors and regulators. GIA closely cooperates with internal and external legal advisors and risk control units on investigations into major control issues.
To maximize its independence from management, the Head of GIA, James P. Oates, reports directly to the Chairman of the BoD as well as to the Risk Committee and the Audit Committee. In their assessment, GIA is quantitatively and qualitatively well resourced, with 390 personnel budgeted worldwide to perform its function. The role, position, responsibilities and accountability of GIA are set out in our Organization Regulations, published atwww.ubs.com/governance. GIA has unrestricted access to all accounts, books, records, systems, property and personnel, and must be provided with all information and data needed to fulfill its auditing duties. The Risk Committee and the Audit Committee may order special audits to be conducted. Other BoD members, committees or the Group CEO may request such audits with the approval of the Audit Committee or the Risk Committee.
Coordination and close cooperation with the external auditors enhance the efficiency of GIA’s work.
|
Corporate governance, responsibility |
and compensation |
Information policy
We provide regular information to our shareholders and to the financial community.
Financial reports will be published as follows
| | |
| First quarter 2014 | | 6 May 2014 |
| | | |
| Second quarter 2014 | | 29 July 2014 |
| | | |
| Third quarter 2014 | | 28 October 2014 |
| | | |
The Annual General Meeting of Shareholders will take place as follows
| | |
| 2014 | | 7 May 2014 |
| | | |
| 2015 | | 7 May 2015 |
| | | |
| | è | | Refer to the corporate calendar at www.ubs.com/investors for future financial report publication and other key dates |
We meet with institutional investors worldwide throughout the year and regularly hold results presentations, attend and present at investor conferences and, from time to time, host investor days. Investor meetings always include members of our Investor Relations team and, where possible, senior management. We make use of diverse technologies such as webcasting, audio links and cross-location video-conferencing to widen our audience and maintain contact with shareholders around the world.
Registered shareholders may opt to receive our annual report or review booklet, which reflects on specific 2013 initiatives and achievements of the Group and provides an overview of our activities during the year as well as some key financial information. Each quarter, shareholders have the option to receive a brief mailed update on our quarterly financial performance. Shareholders can also request our complete financial reports, produced on a quarterly and annual basis.
We make our publications available to all shareholders simultaneously to ensure they have equal access to our financial information.
Shareholders can help us to achieve our environmental ambitions by opting to read our financial publications electronically through our Investor Relations website instead of taking delivery of printed copies. We have reviewed and shortened our distribution lists to internal and external stakeholders and reduced stocks, yielding significant annual savings. In addition, shareholders can change their subscription preferences at any time using our shareholder portal (www.ubs.com/shareholderportal).
| | è | | Refer to www.ubs.com/investors for a complete set of published reporting documents and a selection of senior management industry conference presentations |
| | è | | Refer to the “Information sources” section of this report for more information |
Financial disclosure principles
We fully support the notion of transparency and consistent and informative disclosure. We aim to communicate our strategy and results in a manner that allows stakeholders to gain a good understanding of how our Group works, what our growth prospects are and what risks our businesses and our strategy entail. We continually assess feedback from analysts and investors and, where appropriate, reflect this in our disclosures. To continue achieving these goals, we apply the following principles in our financial reporting and disclosure:
| – | | Transparency that enhances understanding of the economic drivers and builds trust and credibility |
| – | | Consistency within each reporting period and between reporting periods |
| – | | Simplicity that allows readers to gain a good understanding of the performance of our businesses |
| – | | Relevance that prevents information overload by focusing on what is required by regulation or statute and what is relevant to our stakeholders |
| – | | Best practicethat leads to improved standards |
We endorse the work of the Enhanced Disclosure Task Force (EDTF) and our financial reports contain disclosures aligned with the recommendations issued by the EDTF on 29 October 2012 in its report “Enhancing the Risk Disclosures of Banks.” Certain disclosures in our Annual Report 2012 were cited by the EDTF in its July 2013 “Progress Report on Implementation of Disclosure Recommendations” as “leading practice” and by Deloitte in its report, “Responding to the EDTF recommendations – A review of 2012 year end reporting,” as “good practice.” For our Annual Report 2013, we have made significant further enhancements to our disclosures in light of these recommendations. Further information on our implementation of each of the EDTF recommendations can be found at the start of the “Risk, treasury and capital management” section of this report, in which most of the new and enhanced disclosures are presented. Consistent with our financial reporting and disclosure principles, we regard the enhancement of disclosures as an ongoing commitment and we expect to make further refinements to our disclosures in 2014 and beyond.
| | è | | Refer to the “Significant accounting and financial reporting changes” section of this report for more information on enhancing our disclosures |
| | è | | Refer to the “Risk, treasury and capital management” section of this report for more information on our implementation of the EDTF recommendations |
Corporate governance, responsibility and compensation
Financial reporting policies
We report our results after the end of every quarter, including a breakdown of results by business division and disclosures relating to risk management and control, capital, liquidity and funding management.
Our consolidated financial statements are prepared according to International Financial Reporting Standards (IFRS) as issued by the International Accounting Standards Board.
| | è | | Refer to “Note 1 Summary of significant accounting policies” in the “Financial information” section of this report for more information on the basis of UBS’s accounting |
We are committed to maintaining the transparency of our reported results and to ensuring that analysts and investors can make meaningful comparisons with prior periods. If there is a major reorganization of our business divisions, or if changes to accounting standards or interpretations lead to a material change in the Group’s reported results, our results are restated for previous periods, when required by applicable accounting standards. These restatements show how results would have been reported according to the new basis and provide clear explanations of all relevant changes.
US regulatory disclosure requirements
As a “foreign private issuer,” we must file reports and other information, including certain financial reports, with the US Securities and Exchange Commission (SEC) under the US federal securities laws. We file an annual report on Form 20-F, and submit our quarterly financial reports and other material information under cover of Form 6-K to the SEC. These reports are all available atwww.ubs.com/investors and also on the SEC’s website atwww.sec.gov.
An evaluation was carried out under the supervision of management, including the Group CEO and Group CFO, of the effectiveness of our disclosure controls and procedures (as defined in Rule 13a-15e) under the US Securities Exchange Act of 1934. Based upon that evaluation, the Group CEO and Group CFO concluded that our disclosure controls and procedures were effective as of 31 December 2013. No significant changes have been made to our internal controls or to other factors that could significantly affect these controls subsequent to the date of their evaluation.
In accordance with section 404 of the US Sarbanes-Oxley Act of 2002, our management is responsible for establishing and maintaining adequate internal control over financial reporting. The “Financial information” section of this report contains management’s assessment of the effectiveness of internal control over financial reporting as of 31 December 2013. The external auditors’ report on this assessment is also included in this report.
| | è | | Refer to the “Financial information” section of this report for more information |
|
Corporate governance, responsibility |
and compensation |
Corporate responsibility
At UBS, corporate responsibility means “doing the right thing” – both now and in the future. Our commitment to this is incorporated in the principles and standards set out in our Code of Business Conduct and Ethics (Code). These apply to all aspects of our business and the ways in which we engage with our stakeholders, from the products and services we offer our clients, our management of environmental and social risks, to the way we protect the well-being of our employees. Corporate responsibility is embedded at every level of the firm, helping us to adopt a responsible and sustainable approach to doing business while underlining our desire to contribute to the communities in which we operate.
The successful delivery of our corporate responsibility commitments and activities relies on the firm conviction that, above all, we must conduct our business in a sustainable way. We have made good on this belief over the course of our over 150-year history and have demonstrated resilience in the face of the many political, economic and regulatory changes and challenges that have come to pass during this period.
We understand that to be taken seriously as a responsible corporate citizen takes time, and that a solid and proven track record counts for more than a series of quick wins. We have such a track record, as described in the following section. The guiding principles
and standards set out in the Code shape our business activities and all our dealings with our stakeholders including clients, colleagues, shareholders, regulators and business partners. Proper implementation of the Code contributes to the wider societal goal of sustainable development. Policies and guidelines, as well as associated objectives related to this aspiration, are guided and supervised at the highest level of the firm. We demonstrate accountability for our corporate responsibility commitments and activities at both Board of Directors (BoD) and Group Executive Board (GEB) levels.
| | è | | Refer to www.ubs.com/responsibility for more information |
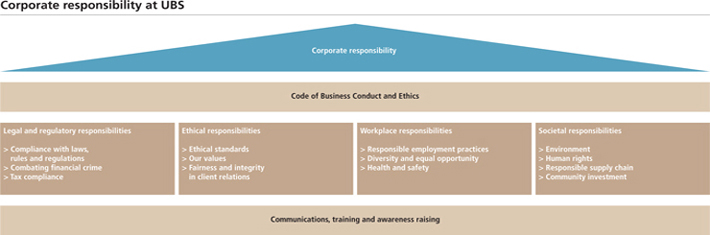
Corporate governance, responsibility and compensation
Corporate responsibility
Working with our clients towards a better society
Our clients care deeply about societal issues and want to use their resources for the benefit and advancement of individuals, communities and societies around the globe. They are increasingly focused on issues such as the maintenance of functioning infrastructures, the impact of climate change, the strains imposed by demographic shifts, the growth in inequalities, and the provision of education, jobs and healthcare for all.
As a global firm, and the world’s largest wealth manager, we are in a unique position to help our clients address their societal concerns. As their trusted financial advisor, we recognize this responsibility and take it seriously. For a long time, we have been helping them to invest according to sustainable and responsible criteria. Building on this capability, in 2013 we made a significant commitment to maximize these efforts through a dedicated, industry-leading platform. This will deliver comprehensive research, advisory and product capabilities in sustainable investments and philanthropy, and is currently under development. While we have always provided such offerings, it is our objective to do this holistically, channeling a growing percentage of assets, through innovative financial mechanisms, to address societal challenges and make societal performance part of every client conversation.
To date, 24% of our assets are already invested according to sustainable and socially responsible investment criteria, as illustrated in the “SRI invested assets” table in “Investment products” in this section. We want this to increase,
in particular through developing innovative solutions. In 2013, a key example included our ground-breaking Impact Investing Private Equity fund for small and medium-sized enterprises (SMEs) in emerging and frontier markets. This provides our clients with yet more opportunities to direct their investments and address social and environmental challenges. Client focus is also a crucial component of our climate change strategy. In 2013, we made progress in several areas, including through the environmental optimization of our Global Real Estate investment portfolios, by offering the “Energy check-up for SMEs” to Swiss SMEs, and through our innovative UBS Clean Energy Infrastructure Switzerland fund for our institutional clients, enabling them to invest in renewable energy infrastructures.
We also continue to provide thought leadership in this area through our leading research capabilities and our active involvement in discussions on key societal topics. In 2013, an important example was the collaboration of environmental, social and governance (ESG) research experts in Wealth Management, Global Asset Management and the Investment Bank on one of our flagship publications, the “UBS Research Focus.” Recognizing growing client interest in sustainable investing, this publication explored sustainability issues and demonstrated how a well-considered sustainability approach can add real value to a client’s portfolio. As a second major example, we co-launched the Thun Group of Banks’ discussion paper on banking and human rights, which examines the ways in which our industry
can effectively implement the UN’s Guiding Principles on Business and Human Rights.
Our own efforts towards the sustainable development of societies and communities, including our community investment and employee volunteering activities focused on education and entrepreneurship, complement our client-focused platform. Our response to the devastation in the Philippines caused by Typhoon Haiyan demonstrates our unique and integrated approach. UBS Community Affairs and the UBS Optimus Foundation joined forces, including both clients and employees in our firm’s matched-giving schemes. This resulted in a combined (client and UBS) commitment of more than CHF 3 million in financial contributions. While the UBS Optimus Foundation established a Rapid Response Emergency Fund to provide immediate essential supplies to children and families in the hardest hit and most remote areas, contributions will also be used for the longer-term reconstruction and development efforts that must follow.
We aim to work with, and for, our clients towards a better society. The spirit and ambition of our client-focused approach is aimed at helping our clients express their values and achieve both financial and societal benefits. We will continue to expand our capabilities in order to provide our clients with an industry-leading and integrated range of sustainability and impact investment products and services, which will enable them to continue to invest with societal goals in mind.
|
Corporate governance, responsibility |
and compensation |
Our approach
Corporate responsibility governance
The BoD is responsible for setting our firm’s values and standards and ensuring that we meet our obligations to our stakeholders. Both the Chairman of the BoD and the Group Chief Executive Officer (Group CEO) play a key role in safeguarding our reputation and ensuring that we communicate effectively with all our stakeholders.
All BoD committees are focused on achieving our goal of creating sustainable value. Of the BoD committees, the Corporate Responsibility Committee shoulders the main undertaking for corporate responsibility. As set out in the committee’s charter, it actively reviews and assesses how we meet the existing and evolving corporate responsibility expectations of our stakeholders. It also monitors and reviews our corporate responsibility policies and regulations, the implementation of our activities and commitments, as well as regularly reviewing the Code.
| | è | | Refer to the UBS Code of Business Conduct and Ethics at www.ubs.com/code for more information |
| | è | | Refer to the Organization Regulations of UBS at www.ubs.com/governance for the charter of the Corporate Responsibility Committee |
In 2013, Wolfgang Mayrhuber, Chairman of the Corporate Responsibility Committee, announced his intention to leave the BoD at the 2013 Annual General Meeting of Shareholders. The Committee is newly chaired by Axel A. Weber, Chairman of the BoD, has three additional members and is advised by a panel of GEB members, consisting of the Group CEO and all regional chief executive officers.
The GEB is responsible for the development and implementation of our Group and business division strategies, including those pertaining to corporate responsibility. At or directly below GEB level, there are various committees and boards responsible for tasks and activities relating to particular aspects of corporate responsibility, including the Global Environmental & Social Risk Committee, chaired by the Group Chief Risk Officer, which shapes UBS’s position on controversial activities and related policies. Additionally, our Environmental & Human Rights Committee oversees the operational execution of UBS’s Environmental and Human Rights Policy, which was revised in 2014 to incorporate recent commitments made in the areas of climate change and human rights.
| | è | | Refer to www.ubs.com/environment for more information on our environmental and human rights governance |
The GEB monitors our efforts to combat money laundering, corruption and terrorist financing. These efforts are led by the Head of Global Anti-Money Laundering (AML) Compliance and supported by a network of compliance experts. The GEB also monitors the implementation of our diversity and inclusion-related strategies and plans for each business division. Our global diversity and inclusion team supports senior management and human resources business partners in developing these plans.
| | è | | Refer to the “Our employees” section of this report for more information on labor standards and diversity programs |
The Global Community Affairs Steering Committee is chaired by the Group CEO and composed of several members of our senior management. This GEB-level committee sets the overall strategic direction and goals of our community affairs. In addition, it
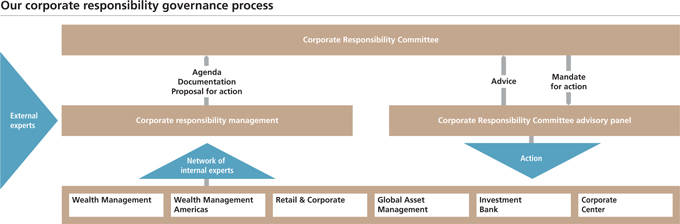
Corporate governance, responsibility and compensation
Corporate responsibility
is ultimately responsible for determining our response to worldwide disasters. In 2014, this committee will be integrated in the Corporate Responsibility Committee, and its advisory panel, to ensure further alignment.
| | è | | Refer to “Our communities” in this section for more information on our charitable and related activities |
Our commitment to responsible banking requires us to undertake regular and critical assessments of our policies and practices. This, in turn, requires the careful consideration and assessment of societal issues of potential relevance to UBS. With committees focused on corporate responsibility topics and issues at both BoD and GEB level, we demonstrate that we have firmly established responsibility for, and supervision of, this important and complex task at the highest levels of the firm.
External commitments and initiatives
We are committed to engaging in external corporate responsibility initiatives. These support us in our efforts to advance in areas that are already mandated by government and regulators, as well as in areas that, while still largely voluntary, are nonetheless of significance in strengthening our corporate responsibility agenda.
In October 2013, we co-launched the Thun Group of Banks’ discussion paper on banking and human rights. The Thun Group is an informal group of representatives from seven banks, with the name derived from the location (the UBS conference center in the Swiss city of Thun) where the group met to share experiences and ideas regarding the implementation of the UN’s Guiding Principles on Business and Human Rights. The paper is the result of these discussions. It aims to support banks in mapping and analyzing their potentially adverse impacts on human rights, and also looks at related risks, including reputational, legal, operational and financial risks. The work of the Thun Group is reflected in our environmental and human rights policy framework.
External ratings, assurance and awards
Our performance and success in the area of sustainability is reflected in the key external ratings and rankings we have achieved. In 2013, we re-entered the Dow Jones Sustainability Indices (DJSI) from which we had been removed in 2012, as our score was just below the raised benchmark. This followed continuous inclusion in the DJSI since their launch in 1999. At the time, the DJSI were the first global indices to track the financial performance of the leading sustainability-driven companies worldwide. The DJSI follow a best-in-class approach and include companies from across all industries that outperform their peers in numerous sustainability metrics.
We have been a member of the FTSE4Good index series since its inception, and have also been awarded corporate responsibility prime status by oekom research, one of the world’s leading sustainability rating agencies. According to oekom’s corporate rating system, prime status is awarded to companies that are among the leaders in their industry and that meet industry-specific minimum requirements. We were also ranked among the top 20 financial institutions in the CDP Global 500 Climate Change Report 2013.
We received several honors in the 11th annual Thomson Re-uters Extel/UKSIF Socially Responsible Investing (SRI) & Sustainability Survey of over 500 investment professionals from 27 countries. The UBS Investment Bank ESG & Sustainability Team was ranked third overall for ESG and SRI, including second for Corporate Governance and for Renewable Energy, fourth for Climate Change and for Thematic Research, and fifth for SRI Research.
Stakeholder dialogue
We regularly engage with our stakeholders on a wide range of topics which gives us important information about their expectations and concerns. This leads to a more in-depth understanding of issues relevant to our firm and their management. Our relationship with stakeholders is multi-faceted and includes interactions with large groups, regular communications with representatives from a particular group, as well as meetings with individuals (for example, clients and investors). In 2013, we also undertook an analysis of the issues deemed relevant to our stakeholders. The results of this analysis are reflected in a materiality matrix as defined by the Global Reporting Initiative (GRI). The matrix distils the views of the stakeholders with which our firm interacts and covers 20 topics including financial stability, risk behavior and culture, operational efficiency and resilience, environmental protection and climate change, and society and community.
In 2013, we engaged with experts and stakeholders on a range of topics. These included discussions with clients on values-based investing, including those taking place at the 2013 UBS Global Philanthropy Forum. Over 100 clients from around the world spent two days discussing how they can help to narrow the gender gap and ensure equal educational and employment opportunities for girls and women.
Discussions with employees covered various sustainability topics, including energy. A key annual campaign, the UBS Environmental Month in April, again raised awareness among employees and external stakeholders about our efforts towards reducing the environmental impact of our operations and banking activities. Working together with investors and rating agencies, we also considered key environmental, social and governance topics such as climate change. Discussions with non-governmental organizations focused on the subjects of reputational risks, controversial weapons, food “speculation” as well as climate change, particularly in relation to coal. In addition, we sought input from our employees regarding our corporate responsibility strategy and associated activities. An internal, cross-divisional and cross-regional network of experts continues to play an important role, with its members providing critical input on stakeholder expectations and concerns. These contributions are relayed back to the Corporate Responsibility Committee and provide a very valuable addition to information gathered through other monitoring channels.
We believe it is crucial that we keep our stakeholders informed about our sustainability commitments and activities. To this end, we include sections in our Annual Report 2013 that are dedicated to “Corporate responsibility” and “Our employees. “ The content
|
Corporate governance, responsibility |
and compensation |
of these sections, other relevant annual report text and data and information on our website are reviewed by EY, according to the Global Reporting Initiative’s Sustainability Reporting Guidelines.
| | è | | Refer to www.ubs.com/gri for more information |
| | è | | Refer to www.ubs.com/materiality for the GRI materiality matrix |
Training and raising awareness
We actively engage in internal and external education and awareness-raising training on corporate responsibility topics and issues. Through induction, education and broader awareness-raising activities, we ensure that our employees understand their responsibilities in complying with our policies and the importance of our societal commitments. General information is published on our intranet and on our corporate responsibility website. In 2013, training and awareness-raising activities for employees continued to embrace the Code, notably through induction events for all new employees. Employees were also made aware of the firm’s corporate responsibility strategy and activities through other training and awareness-raising activities. Some 9,271 employees received training on environmental issues, of which 7,136 received general training on our environmental policy and programs and 2,135 participated in specialist training targeted within their area of expertise and influence. Employee speaker sessions, exhibitions and lunchtime training sessions were delivered in all regions alongside specific technical training for the regional environmental teams. Community Affairs engagement forms part of our key internal leadership programs, while skills-based employee volunteering further contributes towards staff development. Employees are also required to undergo regular refresher training sessions in AML-related issues. This includes online training, awareness campaigns and seminars.
| | è | | Refer to “Education and development” in the “Our employees” section of this report for more information |
Our clients
We are focused on gaining and retaining the trust of our stakeholders, as well as achieving our goal of generating sustainable earnings and creating long-term shareholder value. In addition, we are constantly striving to ensure that our products and services are suited to the needs and requirements of our clients. Through our corporate responsibility efforts, we demonstrate that we are not only listening to our stakeholders, but also aiming to be in an industry-leading position and meet their expectations.
Combating financial crime
We continue to further strengthen our efforts to prevent and combat financial crime. Our commitment to assisting in the fight against money laundering, corruption and terrorist financing is illustrated by the way we take responsibility in our own operations, aiming to help preserve the integrity of the financial system. We employ a rigorous risk-based approach to ensure our policies and procedures are able to detect risks and effectively manage those risks, including, for example, managing relationships which are
classified as higher risk with increased scrutiny. We adhere to strict know-your-client regulations without undermining our clients’ legitimate right to privacy. Ongoing due diligence and monitoring, including the use of advanced technology to help identify transaction patterns or unusual dealings, assists in the identification of suspicious activities. If suspicious activities are discovered, they are promptly escalated to management or control functions and externally, as required.
During 2013, Global AML Compliance worked closely with the Environmental and Social Risk group to further develop effective ways of screening potential business partners, vendors and clients with regards to potential issues relating to environmental and social risk, building on the work already carried out during previous years.
In 2011, all business divisions were required to perform a legal and compliance risk assessment. This comprehensive process, which included an assessment of corruption, sanction and AML risks, was forward-looking and included follow-up actions to highlight the priorities and objectives for each business division. This risk assessment did not identify any significant incidents of non-compliance with our AML, sanctions or anti-corruption policies. Additional risk assessments that have taken place since then have confirmed this view. Nonetheless, a number of initiatives we have in place continue to strengthen our defenses against UBS being used for criminal purposes. In addition, over the course of 2014 we will continue to revise our risk assessment framework in a manner that further focuses on key risks and controls.
As part of our extensive and ongoing efforts to prevent money laundering, corruption and terrorist financing, our internal global AML policies were reviewed in 2011 and enhancements to address more specific risks in relation to corruption, sanctions and money laundering were implemented globally. In 2012, we also reviewed and amended our approach to controversial weapons in order to comply with the Swiss law that came into effect on 1 February 2013. This law implements the international bans on the use, stockpiling, production and transfer of cluster munitions and anti-personnel mines.
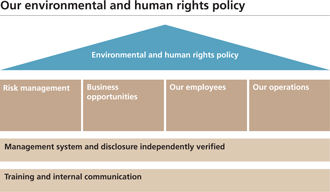
Corporate governance, responsibility and compensation
Corporate responsibility
We are a founding member of the Wolfsberg Group, an association of 11 global banks established in 2000, which aims to develop financial services industry standards and related products for know-your-client, AML and counter-terrorist financing policies. Alongside the other members of this group, we continue to work closely with the Financial Action Task Force, an intergovernmental body that develops and promotes national and international policies to combat money laundering and terrorist financing through consultation within the private sector.
We will act decisively to prevent potentially irresponsible or harmful actions by individuals. First and foremost, this means that our employees must uphold the law, adhere to relevant regulations, and behave in a responsible and principled manner. To this effect, our business processes and control mechanisms are constantly under review in order to enhance our prevention capabilities.
Managing environmental and social risks
We apply a risk framework to all of our transactions, products, services and activities in order to identify and manage potential adverse impacts to the environment and to human rights, as well as the associated environmental and social risks to which our clients’ and our own assets are exposed. Environmental and social (including human rights) risks are broadly defined as the possibility of UBS suffering reputational or financial harm from transactions, products, services or activities such as lending, capital raising, advisory services or investments that involve a party associated with environmentally or socially sensitive activities. For products, services and activities identified as potentially posing significant environmental and social risks, procedures and tools for the identification, assessment, escalation and monitoring of such risks are applied and integrated into standard risk, compliance and operations processes:
| – | | Client on-boarding or conflict clearance: new corporate clients are assessed for environmental and social risks associated with their business activities. |
| – | | Transaction due diligence: before proceeding with a transaction, environmental and social risks are identified and analyzed as part of standard transaction due diligence processes. |
| – | | Product development: new financial products and services are reviewed before their launch in order to assess their compatibility and consistency with UBS’s environmental and human rights principles. |
| – | | Supply chain management: prior to any new or renewed contract being awarded, standardized checks are completed to assess supplier- and commodity-specific environmental, labor and human rights risks. |
| – | | Own operations: our operational activities and employees, or contractors working on UBS premises, are assessed for compliance with relevant environmental, health and safety and labor rights regulations. |
Business or control functions are responsible for identifying and assessing environmental and social risks as part of the client, supplier or transaction due diligence processes. Where these functions determine the existence of potential material risks, they refer the client, supplier or transaction to a specialized environmental and social risk unit for enhanced due diligence. To support the consistent identification and assessment of such risks, our internal industry sector guidelines provide an overview of key environmental and human rights issues that arise in the various life cycles of the sector, and summarize industry standards in dealing with them. These guidelines currently cover six sectors: chemicals, forestry products and biofuels, infrastructure, metals and mining, oil and gas, and utilities. If identified risks are believed to pose potentially significant environmental or social risks, they are escalated for approval to senior management, at divisional, regional, or group level, depending on their significance. We have defined controversial activities in which we will not engage, such as providing financial services to extractive industries, heavy infrastructure,
| | | | | | | | | | | | | | | | | | | | |
| Environmental and social risk assessments | |
| | | | | For the year ended | | | % change from | |
| | | GRI1 | | | 31.12.13 | | | 31.12.12 | | | 31.12.11 | | | 31.12.12 | |
| Cases referred for assessment2 | | | FS2 | | | | 1,716 | | | | 1,039 | | | | 416 | | | | 65 | |
| | | | | | | | | | | | | | | | | | | | | |
| by region | | | | | | | | | | | | | | | | | | | | |
| | | | | | | | | | | | | | | | | | | | | |
Americas | | | FS2 | | | | 367 | | | | 288 | | | | 111 | | | | 27 | |
| | | | | | | | | | | | | | | | | | | | | |
Asia Pacific | | | FS2 | | | | 296 | | | | 222 | | | | 136 | | | | 33 | |
| | | | | | | | | | | | | | | | | | | | | |
Europe, Middle East and Africa | | | FS2 | | | | 373 | | | | 225 | | | | 119 | | | | 66 | |
| | | | | | | | | | | | | | | | | | | | | |
Switzerland | | | FS2 | | | | 680 | | | | 304 | | | | 50 | | | | 124 | |
| | | | | | | | | | | | | | | | | | | | | |
| by business division | | | | | | | | | | | | | | | | | | | | |
| | | | | | | | | | | | | | | | | | | | | |
Wealth Management | | | FS2 | | | | 298 | | | | 157 | | | | 59 | | | | 90 | |
| | | | | | | | | | | | | | | | | | | | | |
Wealth Management Americas | | | FS2 | | | | 46 | | | | 5 | | | | 5 | | | | 820 | |
| | | | | | | | | | | | | | | | | | | | | |
Retail & Corporate | | | FS2 | | | | 598 | | | | 223 | | | | 22 | | | | 168 | |
| | | | | | | | | | | | | | | | | | | | | |
Global Asset Management | | | FS2 | | | | 14 | | | | 12 | | | | | | | | 17 | |
| | | | | | | | | | | | | | | | | | | | | |
Investment Bank | | | FS2 | | | | 657 | | | | 533 | | | | 330 | | | | 23 | |
| | | | | | | | | | | | | | | | | | | | | |
Corporate Center3 | | | FS2 | | | | 103 | | | | 109 | | | | | | | | (6 | ) |
| | | | | | | | | | | | | | | | | | | | | |
1 Global Reporting Initiative (see also www.globalreporting.org). FS stands for the Performance Indicators defined in the GRI Financial Services Sector Supplement. 2 Transactions and onboarding requests referred to and assessed by environmental and social risk functions. 3 Relates to procurement/sourcing of products and services.
|
Corporate governance, responsibility |
and compensation |
forestry and plantation operations that risk severe environmental damage to endangered species, high-conservation value forests and world heritage sites. They also include all commercial activities that engage in child or forced labor, or threaten indigenous peoples’ rights.
An enhanced due diligence and approval process is triggered for areas in which we will only provide financial services under stringent, pre-established guidelines. Such areas include palm oil production, mountaintop removal as a coal extraction method, hydraulic fracturing as an exploration or extraction method for oil and gas, and exploration and development of oil sands. Enhanced due diligence includes an assessment of the company’s regulatory compliance, past and present environmental performance records, as well as concerns from stakeholder groups.
| | è | | Refer to www.ubs.com/responsibility for the complete “UBS position on relationships with clients and suppliers associated with controversial activities” |
Clients, transactions or suppliers potentially in breach of UBS’s position, or otherwise subject to significant environmental and human rights controversies, are identified as part of UBS’s know-your-client compliance processes. Advanced data analytics on companies associated with such risks are integrated into the web-based compliance tool used by our staff before they enter into a client or supplier relationship, or a transaction. The systematic nature of this tool significantly enhances our ability to identify potential reputational risk as is evidenced by the high number of cases referred for assessment to our environmental and social risk units since 2012.
| | è | | Refer to the table “Environmental and social risk assessments” in this section for more information |
Sustainable products and services
By integrating environmental and social considerations into our advisory, research, investment, finance and ownership processes across all of our businesses, we provide financial products and services which help our clients benefit from environmentally and socially related business opportunities. This is particularly the case in relation to climate change, where our activities focus on our client-centric activities of risk management, investment, financing and research.
| | è | | Refer to “Our climate change commitment” in this section for more information on related business initiatives |
Investment advisory
We offer investment advisory services for wealth management and institutional clients, helping them to consider the potential social and environmental impacts, as well as the potential financial returns, of their investments. Our philanthropy and sustainable investing teams have continued to develop the holistic service offered within our wealth management businesses. These teams provide thought leadership, advice, products and solutions to existing and prospective private clients who wish to make investments in accordance with their own personal values. These services also extend to aiding philanthropic or investment decisions
intended to drive positive change. Our services also include sustainable portfolio management, such as mandate solutions and separately managed accounts for private clients and institutions with a strong focus on sustainability across all asset classes. In the US, we also offer managed accounts with environmental, social and governance criteria (sourced from third-party data provider MSCI) embedded into private clients’ fundamental investment process, enabling them to identify and exclude securities based on issue-oriented screens.
For institutional clients, Global Asset Management offers customized portfolios in the form of segregated mandates and institutional accounts that allow clients to define and exclude certain controversial stocks or sectors due to their perceived social or environmental impact.
Research
We produce award-winning research on the impact of environmental, social and governance issues on various sectors and companies. Our specialized teams have regularly published research on topics that will shape our future, including climate change, energy efficiency, resource scarcity and demographics. Our experience and sector knowledge help us to determine what is material by raising questions about the effect environmental, social and governance issues are having on the competitive landscape for the global sectors we cover, as well as about how companies are affected in relative terms. Increasing client demand for integrating sustainability issues into fundamental investment analysis is reflected in our publications and client conferences:
| – | | In 2013, one of the flagship publications of UBS Wealth Management, “UBS Research Focus, “was produced in collaboration with research teams in Global Asset Management and the Investment Bank. Entitled “Sustainable investing,” it discussed how sustainability considerations are increasingly incorporated into investment decisions. |
| – | | Our UBS Q-Series® reports focus on thought-provoking discussions on pivotal investment questions, and on making clear investment conclusions, leading to a Group-wide drive for more thoughtful, proprietary and valuable research. Examples of Q-Series® reports published in 2013 include “Human capital – Corporate culture: Relevant to investors?” and “Global energy markets: How much oil in the US transport sector can be displaced by cheap US natural gas?” Other publications focused on nutrition (“Nutrition: Access and traceability”) and on sustainable innovation (“Integration – global sustainability and cultural change”). |
| – | | Our newly established publication, “ESG Keys,” addresses the what, how and why of ESG issues and sustainability investment styles. Reports in 2013 addressed corporate governance, human capital, and energy and climate change. |
| – | | The UBS European Conference hosted a number of panels on sustainability issues, featuring experts and UBS research analysts, such as “The great sustainability debate,” “Human capital – driving returns” and “Energy: prospects and challenges for fracking.” |
Corporate governance, responsibility and compensation
Corporate responsibility
| – | | Our outreach and dialogue programs included a three-year partnership with the Smith School of Enterprise and the Environment at the University of Oxford, with which UBS hosted a series of events between 2011 and 2013, open to both UBS clients and employees, and featuring thought leaders from around the globe. |
Investment products
Global Asset Management is committed to environmental, social and governance integration and has been a signatory to the United Nations-supported Principles for Responsible Investment (PRI) since 2009. These provide a voluntary framework according to which all investors can take into account environmental, social and governance issues in their decision-making and ownership practices and align their objectives with the broader objectives of society.
Global Asset Management offers a range of sustainable investment funds that integrate material sustainability factors with a rigorous fundamental investment process. We apply the concept of shared value, according to which companies that pursue sustainability practices (for example, conserving resources, maintaining a
high-quality workforce and a strong supply chain) not only create value for the shareholder but also for a wider range of stakeholders. Our investment themes include energy efficiency, environment, social and healthcare, and demographics. We also manage four exchange traded funds which track MSCI’s Socially Responsible Indices and are listed on the Deutsche Börse (Xetra), the SIX Swiss Exchange and the London and Milan Stock Exchanges.
Through our open architecture, we also offer our wealth management clients the opportunity to invest in socially responsible investment bonds, equity and microfinance products from leading third-party providers. As of 31 December 2013, invested assets held in socially responsible investments (SRI) totaled CHF 576 billion, representing 24% of our total invested assets. Throughout 2013, invested assets in all of our SRI classes increased. In particular assets that are subject to UBS’s policy pertaining to controversial weapons increased substantially, largely due to the global expansion of the policy.
| | è | | Refer to the table “Socially responsible investments invested assets” in this section for more information |
Our climate change commitment
Climate change is one of the most significant challenges of our time. The world’s key environmental and social challenges – such as population growth, energy security, loss of biodiversity and access to drinking water and food – are all closely intertwined with climate change. This makes the transition to a low-carbon economy vital.
We recognize that financial institutions are increasingly expected to play a key role in the transition to a low-carbon economy, and we are determined to support our clients in preparing for success in an increasingly carbon-constrained world. We are one of the leading wealth management firms worldwide, and the leading universal bank in Switzerland, backed by a top asset management business and a client-centered investment bank. Therefore, our climate change strategy focuses on the areas of risk management, investments, financing, research and in-house operations. It is in these areas that we believe we can make the greatest contribution to the transition towards a low-carbon economy. Our contribution to these areas in 2013 included:
Risk management: seeking to protect our clients’, and our own, assets from climate change risks, within our sphere of influence.
We committed to participating in international efforts led by the Greenhouse Gas Protocol and the United Nations (UN) Environment Programme Finance Initiative to develop a greenhouse gas accounting and reporting guidance for financial intermediaries.
We helped our clients manage their exposure to the emissions markets and offered execution and full service clearing for contracts on, for example, EU Emissions Trading System allowances and UN Certified Emissions Reductions in Europe and North America.
Investments: helping to mobilize private and institutional capital towards investments facilitating climate change mitigation and adaptation.
We launched an Impact Investing Private Equity fund for SMEs in emerging and frontier markets. With a volume slightly in excess of CHF 50 million at closure, it is
one of the largest impact funds in the sector funded by clients and private capital. The fund represents a unique investment opportunity for wealthy clients and is expected to generate significant social and environmental impact.
Our UBS Portfolio Screening Services helped Wealth Management clients align their portfolios to their values by assessing portfolios using specific sustainability criteria (including environmental topics). Based on increased interest among our clients, we screened CHF 4.2 billion of client assets in 2013.
The UBS Clean Energy Infrastructure Switzerland offers institutional investors unprecedented access to a diversified portfolio of Swiss infrastructure facilities and companies in the field of renewable energies and energy efficiency. Capital commitments had reached approximately CHF 350 million on 31 December 2013.
Six of Global Asset Management’s real estate funds, with CHF 20 billion gross assets under management, obtained the top ranking (“green star”), and two of
|
Corporate governance, responsibility |
and compensation |
| | | | | | | | | | | | | | | | | | | | | | | | |
Socially responsible investments invested assets1 | | | | Socially responsible investments (SRI) are products that
consider environmental, social or ethical criteria
alongside financial returns. SRI can take various forms,
including positive screening, exclusion or engagement. Positive criteria apply to the active selection of
companies, focusing on how a company’s strategies,
processes and products impact its financial success, the
environment and society. This includes best-in-class or
thematic investments. Exclusion criteria whereby one or several sectors are
excluded based on environmental, social or ethical
criteria, for example, companies involved in weapons,
tobacco, gambling, or companies with high negative
environmental impacts. This also includes faith-based
investing consistent with principles and values of a
particular religion. | | |
| | | | | For the year ended | | | % change
from | | | | |
| CHF billion, except where indicated | | GRI2 | | | 31.12.13 | | | 31.12.12 | | | 31.12.11 | | | 31.12.12 | | | | |
| UBS total invested assets | | | | | | | 2,390 | | | | 2,230 | | | | 2,167 | | | 7 | | | | |
| UBS SRI products and mandates | | | | | | | | | | | | | | | | | | | | | | |
positive criteria | | | FS11 | | | | 2.18 | | | | 1.60 | | | | 1.84 | | | 37 | | | | |
positive criteria/RPI3 | | | FS11 | | | | 39.00 | | | | 32.15 | | | | 28.19 | | | 21 | | | | |
exclusion criteria4 | | | FS11 | | | | 56.09 | | | | 35.68 | | | | 27.46 | | | 57 | | | | |
policy based restrictions5 | | | FS11 | | | | 475.14 | | | | 181.64 | | | | 180.85 | | | 162 | | | | |
| Third-party6 | | | FS11 | | | | 3.70 | | | | 2.66 | | | | 2.58 | | | 39 | | | | |
| Total SRI invested assets | | | FS11 | | | | 576.12 | | | | 253.73 | | | | 240.92 | | | 127 | | | | |
| Proportion of total invested assets (%)7 | | | | | | | 24.11 | % | | | 11.38 | % | | | 11.12 | % | | | | | | |
1 All figures are based on the level of knowledge as of January 2014.2 FS stands for the Performance Indicators defined in the Global Reporting Initiative Financial Services Sector Supplement.3 UBS Global Asset Management Responsible Property Investment strategy.4 Includes customized screening services (single or multiple exclusion criteria).5 Assets subject to restrictions under UBS policy on the prohibition of investments in companies related to anti-personnel mines and cluster munitions (includes all invested assets held in Global Asset Management actively managed discretionary segregated mandates and all actively managed funds (retail and institutional) held by Global Asset Management, Wealth Management and Retail & Corporate. In 2013, the scope of this policy became global.6 SRI products from third-party providers apply either positive and exclusion criteria or a combination thereof.7 Total SRI/UBS’s invested assets. | | | | | |
them were awarded “sector leader” status, by the 2013 Global Real Estate Sustainability Benchmark, thus recognizing our efforts in defining and implementing a sustainable and responsible property investment strategy (RPI). All six funds rank within the first and second quartiles of their respective peer set (among more than 540 real estate portfolios).
Financing: supporting this transition as corporate advisor, and/or with our lending capacity.
We supported Swiss SMEs in saving energy, as promoted by the Swiss Energy Agency’s SMEs Model. Clients benefited from the agency’s “energy check-up for SMEs” at reduced costs and were granted cash premiums for committing to an energy reduction plan within this scheme. By the end of 2013, 116 companies signed up.
By supporting Swiss private clients when renovating their private homes sustainably, we redistributed CHF 2.9 million in cash benefit, funded by proceeds from the Swiss CO2 levy refund. Swiss private clients could also benefit from the UBS “eco” mortgage when building energy-efficient homes.
Expressing our commitment to being a financial partner in the energy transition in Switzerland, we are sponsors of the Swiss Energy and Climate Summit 2013 and 2014 as a Premium Partner.
In 2013, the Investment Bank supported 190 clients that provide a positive contribution to climate change mitigation and adaptation, either in equity or debt capital market transactions (total deal value CHF 28.5 billion) or as financial advisor (total deal value CHF 49.4 billion).
Research: offering world-class research capacity to our clients on climate change issues.
We continued to provide clients with award-winning research on climate change related topics. Examples include “ESG Outcomes for a ‘New Global Economy,’” “Postcards from the US … on energy & climate,” “Global utilities: Can utilities survive in their current form?” and “China integrated natural gas: Will a coal-to-gas boom eventually go bust?” Our thought leadership in this area was recognized by the annual Thomson Reuters Extel / UKSIF Socially Responsible Investing (SRI) &
Sustainability Survey where UBS ranked fourth for Climate Change and second for Renewable Energy.
Our Chief Investment Office (CIO) Wealth Management research provided regular research updates on renewables, agribusiness, energy efficiency and water. The latter was the sustainable investment theme promoted in the 2013 UBS CIO House View.
In-house operations: reducing our own greenhouse gas emissions.
We further reduced our emissions 15% year on year, achieving a 49% reduction from baseline year 2004. This brings us very close to reaching our target of a 50% reduction by 2016. We continued to invest in sustainable real estate and efficient information technology, and reduced our energy consumption 3% year on year. We are on track to reach our target of a 10% reduction compared with 2012 levels by 2016.
| | è | | Refer to www.ubs.com/climate for our complete climate change commitment |
Corporate governance, responsibility and compensation
Corporate responsibility
Corporate and private clients financing and advisory
UBS globally provides capital raising and strategic advisory services to companies offering products that provide a positive contribution to climate change mitigation and adaptation, including those in the solar, wind, hydro, energy efficiency, waste and bio-fuels, and transport sectors. In 2013, we supported transactions that included a USD 50 million equity capital raising for Cool Planet, a US-based renewable energy company which has developed a patented process to convert non-food biomass into gasoline, a USD 300 million three-year bond offering for the China Longyuan Power Group, the largest wind power generation company in Asia, and a CHF 400 million dual-tranche bond for Sika AG, a Swiss specialty chemicals company providing products to the construction and transportation industries that enhance durability and promote the efficient use of energy, water and other resources. In addition, we helped our clients manage their exposure to the emissions markets, while in Switzerland, we helped SMEs to save energy and support retail clients when undertaking energy-efficient renovations.
Voting rights
We believe that voting rights have economic value and should be treated accordingly. Where Global Asset Management has been given the discretion to vote on behalf of our clients, we will exercise our delegated fiduciary responsibility by voting in the manner we believe will be most favorable to the value of their investments. In 2013, we voted on more than 69,000 separate resolutions at 7,075 company meetings. Our approach to corporate governance is an active one and is integral to our investment process. We are an active member of a number of collaborative shareholder bodies.
Since 2010, Global Asset Management in Switzerland has been offering UBS Voice, a free service enabling holders of Swiss institutional funds to express voting preferences ahead of shareholder meetings of major Swiss corporations. This provides additional
shareholder input into the voting decisions of the funds’ management company. More than 40% of invested assets for which UBS Voice is offered participate in this service.
Our operations
Continuously reducing our greenhouse gas footprint
In 2013, we reduced our greenhouse gas footprint again by decreasing our emissions 15% year on year, achieving a 49% reduction from baseline year 2004. This brings us very close to reaching our target of a 50% reduction by 2016. We also reduced our footprint per full-time employee 12% year on year. Our strong performance is a result of adopting energy efficiency measures to reduce the energy consumption of the buildings we occupy, and of critical facilities such as the data centers we use, while increasing the proportion of renewable energy. Emissions that cannot be reduced by other means (for example, business air travel) are offset.
UBS’s Environmental Program was introduced in the 1970s, and since 1999, we have managed the program through an Environmental Management System in accordance with ISO 14001. At the time, we were the first bank to obtain ISO 14001 certification for our Group-wide environmental management system. In addition, our greenhouse gas emissions data is externally verified according to ISO 14064 standards.
Reducing energy consumption and improving energy efficiency
In 2013, we reduced energy consumption 3%, contributing to our target of reducing energy consumption 10% by 2016 compared with 2012 levels. Between 2009 and 2012, we over-achieved on our previous targets and reduced our energy consumption 21%. We will continue to invest in energy-efficient infrastructure and implement established energy reduction measures, such as ensuring that heating, air-conditioning and lighting controls of the buildings we occupy are optimized. In addition, we
| | | | | | | | | | | | | | | | | | | | | | | | | | | | | | |
| Environmental targets and performance in our operations1 | |
| | | GRI2 | | | 2013 | | | Target 2016 | | | Baseline | | | % change
from baseline | | | Progress/
Achievement6 | | 2012 | | | 2011 | |
| Total net greenhouse gas emissions (GHG footprint) in t CO2e3 | | | EN15–17 | | | | 183,011 | | | | –50 | % | | | 360,501 | 4 | | | –49.2 | | |  | | | 215,279 | | | | 220,593 | |
| | | | | | | | | | | | | | | | | | | | | | | | | | | | | | | |
| Energy consumption in GWh | | | EN3 | | | | 737 | | | | –10 | % | | | 761 | 5 | | | –3.2 | | | | | | 761 | | | | 827 | |
| | | | | | | | | | | | | | | | | | | | | | | | | | | | | | | |
| Share of renewable energy | | | EN3 | | | | 48.8 | % | | | increase | | | | 23.9 | %4 | | | 104.2 | | | | | | 41.6 | % | | | 44.9 | % |
| | | | | | | | | | | | | | | | | | | | | | | | | | | | | | | |
| GHG offsetting (business air travel) in t CO2e | | | EN18 | | | | 72,612 | | | | 100 | % | | | 0 | 4 | | | 100 | | | | | | 73,024 | | | | 88,867 | |
| | | | | | | | | | | | | | | | | | | | | | | | | | | | | | | |
| Paper consumption in kg per FTE7 | | | EN1 | | | | 121 | | | | –5 | % | | | 122 | 5 | | | –1.1 | | | | | | 122 | | | | 122 | |
| | | | | | | | | | | | | | | | | | | | | | | | | | | | | | | |
| Share of recycled and FSC paper | | | EN2 | | | | 57.6 | % | | | 60 | % | | | 55.8 | %5 | | | 3.1 | | | | | | 55.8 | % | | | 44.3 | % |
| | | | | | | | | | | | | | | | | | | | | | | | | | | | | | | |
| Waste in kg per FTE7 | | | EN23 | | | | 213 | | | | –5 | % | | | 230 | 5 | | | –7.8 | | | | | | 230 | | | | 242 | |
| | | | | | | | | | | | | | | | | | | | | | | | | | | | | | | |
| Waste recycling ratio | | | EN23 | | | | 55.6 | % | | | 60 | % | | | 54.2 | %5 | | | 2.5 | | |  | | | 54.2 | % | | | 54.2 | % |
| | | | | | | | | | | | | | | | | | | | | | | | | | | | | | | |
| Water consumption in m m3 | | | EN8 | | | | 1.77 | | | | –5 | % | | | 1.95 | 5 | | | –9.1 | | | | | | 1.95 | | | | 2.00 | |
| | | | | | | | | | | | | | | | | | | | | | | | | | | | | | | |
Legend:CO2e = CO equivalents, FTE = full-time employee, GWh = gigawatt hour, kWh = kilowatt hour, km = kilometer, kg = kilogram, m m3= million cubic meter, t = tonne
1 Detailed environmental indicators are available on the internet www.ubs.com/environment. Reporting period 2013 (1 July 2012 to 30 June 2013).2 Related to Global Reporting Initiative (see also www.globalreporting.org). EN stands for the environmental performance indicators as defined in the GRI.3 GHG footprint equals gross GHG emissions minus GHG reductions from renewable energy and GHG offsets (Gross GHG emissions include: direct GHG emissions by UBS, indirect GHG emissions associated with the generation of imported/purchased electricity (grid average emission factor), heat or steam and other indirect GHG emissions associated with business travel, paper consumption and waste disposal).4 Baseline year 2004.5 Baseline year 2012.6Green: on track/amber: behind schedule.7 FTEs are calculated on an average basis including contractors.
|
Corporate governance, responsibility |
and compensation |
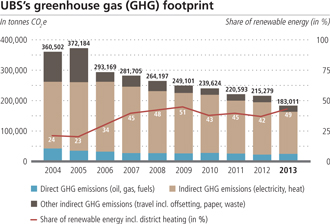
apply externally verified standards to validate building performance.
Information technology consumes up to half of the electricity used by the Group worldwide, and consolidation, virtualization and the Desktop Transformation Program (designed to reduce the number of personal computers whilst ensuring that new computers and monitors are more energy-efficient than the equipment they replace) have contributed to significant energy savings in recent years. In 2013, we reduced the electricity consumption of our data centers more than 6% year on year.
Increasing share of renewable energy
We are reducing our use of carbon-intensive energy by replacing fossil-fuelled heating infrastructure where feasible and by purchasing renewable energy for a high proportion of the energy we use (49% in 2013).
Business travel and offsetting CO2 emissions
We continuously try to minimize our CO2 emissions in business travel by encouraging our employees to choose alternatives to air travel, such as high-speed rail, recording a 7% reduction in the number of flights taken, and a 2% increase in employee rail travel in Switzerland in 2013. Our investments in video-conferencing solutions also contributed to the reduction in air travel. Globally, over 400 rooms with video facilities are available and more than 80,000 room bookings were processed in 2013. The marketing and events teams adhere to environmental guidelines for client conferences and consider the impact of delegate travel, hotels, venue facilities and catering as part of their logistics and planning.
We continue to offset all CO2 emissions resulting from agency-booked business air travel and client events and conferences, thereby supporting renewable energy and other projects reducing CO2 emissions. Projects we selected meet the requirements of the Gold Standard for voluntary emissions reductions and also provide positive community benefits. Schemes selected include a wind power project in
Turkey and community biofuel projects in China and India.
Reducing paper consumption, waste generation and water usage
We are committed to further reducing our environmental footprint and are on track to reach our 2016 targets, which use 2012 performance as the baseline:
– The amount of paper used per employee decreased 1% compared with baseline year 2012. Double-sided printing and copying, now the default setting for printers used by the majority of our employees, combined with an ongoing shift towards the distribution of electronic documents, will enable us to reach our target of reducing paper usage 5%. We increased the percentage of office paper from Forest Stewardship Council (FSC), or recycled sources, to 58% in 2013, contributing towards reaching our 60% target.
– The continued implementation of bin-less offices in many larger locations has reduced the waste per employee 8% since 2012, outperforming our 5% reduction target by 2016. Our waste recycling ratio improved from 54% in 2012 to 56%, a step in the right direction towards reaching our target of 60% by 2016.
– Our water consumption decreased 9% compared with 2012 levels, exceeding our target of 5% by 2016.
| | è | | Refer to the table “Environmental targets and performance in our operations” in this section for more information |
Engaging our employees
By educating, increasing awareness among and offering incentives to our employees on environmental matters, we hope to help them behave in a sustainable way both at work and at home. As part of our commitment to reducing CO2 emissions, we continued to support Earth Hour in March 2013, switching off lights in UBS offices in 73 cities around the world for one hour. This also marked the start of our annual internal and external environmental awareness campaign. The theme in 2013 was “Protecting our future” and focused on our renewed climate change commitment, with activities including environmental fairs, an online environmental quiz, as well as articles and interviews with senior management posted on our internal and external websites.
Responsible supply chain management
Responsible supply chain management (RSCM) principles serve to embed our ethics and values when interacting with our suppliers, contractors and service partners. As part of this commitment, we have implemented an RSCM framework to identify, assess and monitor supplier practices in the areas of human and labor rights, the environment, health and safety and anti-corruption. In 2013, we further strengthened our existing RSCM framework by focusing on suppliers that either have a potentially high environmental or social impact, or suppliers that are active in high-risk countries. We screened relevant suppliers and identified around 40 suppliers for which remediation measures have been defined in order to be in line with UBS’s RSCM standards. Due diligence is performed by our experienced procurement and sourcing specialists, and is supported by a centralized team of experts.
Corporate governance, responsibility and compensation
Corporate responsibility
Our communities
Within our community investment program, we aim to overcome disadvantage in our local communities by supporting education and entrepreneurship through a combination of targeted funding and the commitment and skills of our employees. Coordinated globally, our initiatives are implemented regionally. Proximity to our partners allows us to better understand the needs and requirements of our communities. Based on this, we can generate a long-term, sustainable and measurable impact on our local communities while offering volunteering opportunities for our employees. As well as direct cash donations and the commitment of our employees, our community investment program also includes matched-giving schemes and disaster relief efforts.
Community Affairs
We actively engage with the communities around the globe of which we are a part. In 2013, UBS and our affiliated foundations
made direct cash donations totaling CHF 28.3 million to carefully selected non-profit partner organizations and charities. These donations were primarily aimed at our Community Affairs key themes of education and entrepreneurship. Additionally, spending on the UBS Anniversary Education Initiative amounted to CHF 14.0 million. Our contributions, combined with other significant activities, notably the volunteering activities of employees, have continued to provide substantial benefits to projects and people around the world, as demonstrated by the regional examples provided below.
Contributions were also made to other causes, in particular disaster relief, including a commitment of more than CHF 1.9 million in total financial contributions to both short-term relief and long-term rebuilding efforts in response to the devastation caused by Typhoon Haiyan in the Philippines. Community Affairs and the Optimus Foundation, UBS’s independent grant-making foundation, joined forces to offer a unique and integrated approach including both clients’ and employees’ donations in its matched
Key examples of UBS’s community investment activities across the globe
Switzerland
Developing Switzerland’s next generation of business leaders was a priority for us in 2013. One of the projects we supported was the annual company event organized by Young Enterprise Switzerland (YES). As part of this program, which we have been supporting since 2007, students from all over the country establish and manage a real company, thus learning how the business world works. For 12 months, they receive support from business mentors, their teachers and YES. At the end of the year, representatives of the 25 best-performing companies are invited to the grand final in Zurich, where the winner is crowned.
As part of the UBS education initiative, in 2013 we also supported one of the annual awards made by the Social Entrepreneurship Initiative & Foundation (seif). Each year, seif recognizes innovative business ideas that foster responses to social or environmental challenges.
In Switzerland, our community investment efforts are also advanced by the UBS Culture Foundation, the UBS Foundation
for Social Issues and Education, and the A Helping Hand from UBS Employees association. In 2013, these organizations made valuable contributions to important social causes, including fostering the humanities and the creative arts, supporting communities in need, and helping disabled and disadvantaged people.
Americas
In 2013, Community Affairs & Corporate Responsibility Americas undertook a strategic re-launch of our programming to help deploy the firm’s financial and human capital more effectively. This included a complete overhaul of our employee giving portal, which supports all of our engagement programs across the Americas. Within UBS’s global focus areas of education and entrepreneurship, we are providing under-resourced, high-potential individuals with advice and resources to help develop more enterprising communities.
In our first major initiative following the re-launch, we coordinated UBS’s second annual Season of Service, a community impact initiative open to all business
divisions in the Americas. Over the course of two months, employees completed 92 different volunteer activities and logged more than 2,500 volunteer hours.
Within our flagship Elevating Entrepreneurs program, we continued to expand our lending offerings in Chicago and Los Angeles. In coordination with our partners in the UBS Bank USA Community Development Group and the Valley Economic Development Center, we committed USD 35 million in capital to qualified small businesses in Chicago, Los Angeles, New York, New Jersey, Connecticut, Salt Lake City and Las Vegas. During 2013, 29 small businesses received loans ranging from USD 50,000 to USD 250,000 totaling USD 6.4 million. Combined, these companies have created 451 new jobs.
Asia Pacific
In 2013, the UBS Finance Academy program in Sydney marked its 11th anniversary, and over the years has provided more than 550 public school students with first-hand insight into the world of finance and exposure to UBS. Over the course of the program, students
|
Corporate governance, responsibility |
and compensation |
giving programs. This combined (client and UBS) commitment raised the total financial contributions to the rebuilding efforts in the Philippines to more than CHF 3 million.
Across all business regions, our employees continue to play a very active role in our community investment efforts, in particular through their volunteering activities. In 2013, 10,648 employees spent 91,370 hours volunteering. We support their commitment by offering up to two working days a year for volunteering efforts. For the second year in a row, employees who have demonstrated outstanding volunteering commitment were rewarded with the UBS Global Employee Volunteer Awards.
Furthermore, we strengthened the measurement of the impact of our Community Affairs activities. We measure the impact of projects across all regions using the London Benchmarking Group model. Understanding where we make an impact provides vital data that helps us evaluate and focus our program. Therefore, we plan to further expand measurements of our strategic programs across all regions in 2014.
Client foundation
The UBS Optimus Foundation is an expert grant-making foundation established by UBS in 1999. The Foundation works to break down barriers that prevent children from reaching their full potential by funding leading organizations to improve the health, education and protection of children. The UBS Optimus Foundation supports programs in places where children face adversity. Since its establishment, the Foundation has received more than 25,000 donations totaling over CHF 195 million. By the end of 2013, the Foundation supported 107 projects in 48 countries amounting to a total value of CHF 69.8 million. As UBS bears all administrative costs related to the UBS Optimus Foundation, 100% of every donation goes directly towards the projects funded.
were provided with the opportunity to listen to, and interact with, key industry figures. Students also gained practical knowledge of financial markets through “day in the life” presentations, merger and acquisition case studies and a field trip to both UBS’s live trading floor and CNBC’s filming studio.
Across the region, UBS employees continue to volunteer in a diverse variety of both skill-based and grassroots programs. Clients and family members are also often invited to join in where appropriate. In 2013, during the Regional Volunteer Experience, volunteers from across Asia Pacific traveled to Japan and joined local volunteers to work together on the Team Tohoku program in the remote northeastern community of Kamaishi City, aimed at helping the community get back on its feet following the 2011 tsunami. Led by senior management, including UBS Asia Pacific’s Chief Executive Officer, Chi-Won Yoon, these volunteers focused on various projects relating to job and economic regeneration, temporary and long-term recovery housing, strengthening the skills and
knowledge needed by local civil societies for further development, as well as risk reduction and future disaster preparedness.
In its second year, Singapore’s Diversity in Abilities arts program, targeted at bringing visual and performing arts to children in special education, was awarded Singapore’s National Arts Council Patron of the Arts Award 2013. More than 140 children were trained by renowned local and regional artists and the program culminated in a stage production that featured Singapore’s Minister of Education in an acting role.
Europe, Middle East and Africa
In Europe, the Middle East and Africa, Community Affairs activities focus on sharing the workplace skills of our employees in order to help people in disadvantaged communities reach their full potential. Last year, in the UK alone, we helped 6,366 students develop employability and entrepreneurial skills through UBS work-related learning programs, which range from employability skills workshops and interview practice to work experience. In the UK, UBS was
recognized with a Business in the Community 2013 Responsible Business Award for its volunteering program.
In Turkey, over 1,000 students took part in the BKD-Science Heroes Association challenge, which helps develop their technology, math and entrepreneurial skills. Hakan Habip of UBS Turkey, who co-manages our partnership with BKD, was named one of Turkey’s top 100 “Changemakers” by the highly regarded Sabanci Foundation for his involvement in BKD activities. In Italy, a team of UBS managers worked with a group of students from underprivileged backgrounds to raise their aspirations and achievements, and helped them secure places at a prestigious university. In Israel, the successful partnership with Ashoka continues, supporting young social entrepreneurs to develop their projects.
Across Europe, the Middle East and Africa, employees are getting involved in their local communities and sharing their workplace and entrepreneurial skills.
| | è | | Refer to www.ubs.com/community for more information |
Corporate governance, responsibility and compensation
Our employees
Our employees
Our employees’ drive, skill, insight and experience are key to meeting our clients’ needs and growing our businesses. We are committed to investing in our employees and furthering our reputation as a leading employer. We promote a performance- and development-oriented culture that values integrity and encourages collaboration across the entire firm. Our principles of client focus, excellence and sustainable performance serve as the basis for all of our endeavors, helping us focus on every opportunity to create value for our stakeholders.
Our workforce
In the past two years, we have concentrated on building our capital strength, improving efficiency and effectiveness, and reinforcing risk management. These three pillars underpin our strategy and are the foundation of everything we do. A key part of this effort has been to build a strong corporate culture while ensuring that we hire, develop and retain a global workforce that not only meets today’s business challenges, but also enables us to build strength as we plan for our leadership needs in the future.
We made some changes to our workforce in 2013. This was primarily due to our ongoing cost reduction programs that reduced staff numbers across the firm, particularly within the Investment
Bank and the Corporate Center. These changes also reflected measures designed to improve our long-term efficiency. For example, in August 2013, we announced the creation of the UBS Nashville Business Solutions Center in the US. The Nashville location is part of our strategy to create regional centers of excellence for our support functions and allows us to increase collaboration and operational effectiveness. It also complements our existing service center in Poland and our other outsourcing and offshoring relationships elsewhere in the world.
As of 31 December 2013, we employed 60,205 people (on a full-time equivalent basis), 2,423 fewer than a year earlier. In 2013, our employees worked in 56 countries, with approximately 36% of our staff employed in Switzerland, 35% in the
Personnel by region
| | | | | | | | | | | | | | | | | | | | |
| | | | | | | | As of | | | | | | | | % change from | |
| Full-time equivalents | | | | 31.12.13 | | | 31.12.12 | | | 31.12.11 | | | | | 31.12.12 | |
| Americas | | | | | 21,317 | | | | 21,995 | | | | 22,924 | | | | | | (3 | ) |
| | | | | | | | | | | | | | | | | | | | | |
of which: USA | | | | | 20,037 | | | | 20,833 | | | | 21,746 | | | | | | (4 | ) |
| | | | | | | | | | | | | | | | | | | | | |
| Asia Pacific | | | | | 7,116 | | | | 7,426 | | | | 7,690 | | | | | | (4 | ) |
| | | | | | | | | | | | | | | | | | | | | |
| Europe, Middle East and Africa | | | | | 10,052 | | | | 10,829 | | | | 11,019 | | | | | | (7 | ) |
| | | | | | | | | | | | | | | | | | | | | |
of which: UK | | | | | 5,595 | | | | 6,459 | | | | 6,674 | | | | | | (13 | ) |
| | | | | | | | | | | | | | | | | | | | | |
of which: rest of Europe | | | | | 4,303 | | | | 4,202 | | | | 4,182 | | | | | | 2 | |
| | | | | | | | | | | | | | | | | | | | | |
of which: Middle East and Africa | | | | | 153 | | | | 167 | | | | 162 | | | | | | (8 | ) |
| | | | | | | | | | | | | | | | | | | | | |
| Switzerland | | | | | 21,720 | | | | 22,378 | | | | 23,188 | | | | | | (3 | ) |
| | | | | | | | | | | | | | | | | | | | | |
| Total | | | | | 60,205 | | | | 62,628 | | | | 64,820 | | | | | | (4 | ) |
| | | | | | | | | | | | | | | | | | | | | |
Personnel by business divisions and Corporate Center
| | | | | | | | | | | | | | | | | | | | |
| | | | | | | | As of | | | | | | | | % change from | |
| Full-time equivalents | | | | 31.12.13 | | | 31.12.12 | | | 31.12.11 | | | | | 31.12.12 | |
| Wealth Management | | | | | 16,414 | | | | 16,210 | | | | 15,904 | | | | | | 1 | |
| | | | | | | | | | | | | | | | | | | | | |
| Wealth Management Americas | | | | | 16,344 | | | | 16,094 | | | | 16,207 | | | | | | 2 | |
| | | | | | | | | | | | | | | | | | | | | |
| Retail & Corporate | | | | | 9,463 | | | | 10,156 | | | | 11,430 | | | | | | (7 | ) |
| | | | | | | | | | | | | | | | | | | | | |
| Global Asset Management | | | | | 3,729 | | | | 3,781 | | | | 3,750 | | | | | | (1 | ) |
| | | | | | | | | | | | | | | | | | | | | |
| Investment Bank | | | | | 11,615 | | | | 13,595 | | | | 14,685 | | | | | | (15 | ) |
| | | | | | | | | | | | | | | | | | | | | |
| Corporate Center | | | | | 2,640 | | | | 2,792 | | | | 2,845 | | | | | | (5 | ) |
| | | | | | | | | | | | | | | | | | | | | |
of which: Core Functions | | | | | 1,055 | | | | 488 | | | | 405 | | | | | | 116 | |
| | | | | | | | | | | | | | | | | | | | | |
of which: Non-core and Legacy Portfolio | | | | | 1,585 | | | | 2,304 | | | | 2,440 | | | | | | (31 | ) |
| | | | | | | | | | | | | | | | | | | | | |
| Total | | | | | 60,205 | | | | 62,628 | | | | 64,820 | | | | | | (4 | ) |
| | | | | | | | | | | | | | | | | | | | | |
of which: Corporate Center personnel (before allocations)1 | | | | | 24,082 | | | | 25,892 | | | | 26,974 | | | | | | (7 | ) |
| | | | | | | | | | | | | | | | | | | | | |
1 Comparative figures in this table may differ from those originally published in quarterly and annual reports (for example due to adjustments following organizational changes).
|
Corporate governance, responsibility |
and compensation |
Americas, 17% in Europe, Middle East and Africa and 12% in Asia Pacific.
A mobile workforce enables employees to develop relationships across business divisions, regions and cultures, increases trust and helps us to better leverage our employees’ skills. It also helps ensure that we have the right people in the right roles in order to meet our clients’ needs. As part of our commitment to business growth and career development, we transferred 1,105 employees between business divisions in 2013, in addition to transferring 405 employees to roles in a different region. Globally, employee turnover, as a percentage of average overall headcount, was 15% in 2013 compared with 12.9% in 2012. Employee-initiated turnover was 8.7%, an increase of 2% from 2012.
Attracting and retaining talent
We strive for excellence in everything we do, and this begins with our employees. It is fundamental to our success to recruit the most talented individuals, help them develop, and effectively leverage their skills to meet our clients’ evolving needs. We try to be as forward-looking as possible when planning our talent needs and comparing them with our existing workforce. Regular talent reviews enable us to understand our employees’ capabilities, potential and ambition in order to fill any gaps by developing or further recruiting talent at all levels. Our integrated approach to managing talent across the entire employee lifecycle allows us to link our recruitment, diversity, learning, mobility, performance management, talent review, compensation and succession practices in the most meaningful way.
Recruiting new employees
People join UBS from a diverse range of backgrounds. We are committed to building the skills of our existing employees while hiring the best available talent, as required, to sustain and grow our core businesses.
In 2013, we reviewed our comprehensive hiring standards and processes, especially those focused on recruiting at senior levels, to help ensure that we continue to hire people who are demonstrably qualified for their roles and are a good fit for the firm’s culture. We recruited highly effective financial and client advisors in 2013 and invested in our future by hiring graduates and interns globally, as well as strengthening our commitment to apprentices in Switzer-land. In total, 6,548 external hires were made across the firm in 2013, with Wealth Management recruiting 374 client advisors and Wealth Management Americas hiring 480 financial advisors.
Our own employees helped refer talent to the organization. As a result, 15% of externally sourced roles in 2013 were filled through employee referrals. Employees also expect to be considered for open roles within the firm. Therefore, in 2013, we instituted further measures to support transparent and objective internal hiring processes so that current employees have the same access to available jobs at UBS as external candidates.
Throughout 2013, we ensured a continuous and visible presence at our target universities, with UBS leaders and employees
actively supporting our campus recruiting efforts. Global initiatives launched in 2013 included the Emerging Talent Program, a special internship within UBS’s Education Initiative that targets students early in their academic careers. The UBS Explore career-consideration program helped increase the number of potential recruits, and our graduate trainees benefited from educational opportunities and business-specific training. In 2013, 476 university graduates were hired into one of UBS’s undergraduate or MBA graduate training programs. An additional 876 interns were hired globally.
Our apprenticeship program in Switzerland continued to perform strongly in 2013, hiring 266 business and 39 information technology apprentices. This was the first year that UBS recruited an increased number of apprentices in conjunction with the UBS Education Initiative (an additional 150 apprentices over a five-year period). We also recruited 185 trainees into our All-round Trainee-ship Program for Swiss high school graduates.
In 2013, we continued to be seen as an attractive employer and were notably ranked in the global top 50 in Universum’s 2013 World’s Most Attractive Employers list. In Switzerland, UBS ranked third among business students in Universum’s 2013 Ideal Employer survey.
| | è | | Refer to www.ubs.com/awards for more information on UBS’s rankings as an employer |
Strengthening our diverse workforce and inclusive work environment
Our workforce is truly global. We have 890 offices in 56 countries, and our employees, who together speak more than 137 languages, are citizens of 144 countries. In 2013, the average age of our employees was 41 years and the average length of employment within the firm was 9.2 years. In Switzerland, more than 49% of employees have worked at UBS for more than 10 years. This experience enables our employees to have stronger skills, better understanding and more institutional knowledge about our clients’ needs and how to meet them.
We believe that companies with diverse workforces and inclusive work environments excel in understanding and serving clients. In all our businesses, we seek to hire and retain a broad range of talent with diversity in race, gender, business experience, perspective, ethnicity, nationality, religion, age, abilities, education and sexual orientation. As part of this goal, we seek to strengthen and sustain an inclusive work environment that encourages all employees’ development and enhances client relationships. We are globally committed to offering equal employment opportunities and believe that having the right people, in the right roles, at the right time is a key factor in delivering excellence and building capability for the future.
Within our continuing effort to strengthen all aspects of diversity, increasing gender diversity remained a key priority in 2013. We again called for divisional diversity planning that includes targeted, forward-looking actions over the next several years that aim to increase the number of women working at UBS, particularly in senior roles.
Corporate governance, responsibility and compensation
Our employees
A wide range of regional initiatives complemented our global efforts. For example, we launched an 18-month sponsorship program for high-performing female Directors and Executive Directors in the US. Combining mentoring and advocacy, this program strengthens leadership skills, provides increased access to the firm’s senior executives and fosters a “pay-it-forward” culture among women across the organization. We also worked with groups such as the Council of Urban Professionals and the Financial Women’s Association to significantly increase the number of diverse recruitment candidates presented to managers. Numerous events for staff in the US, the UK and Asia Pacific strengthened employees’ understanding and promoted a sense of personal responsibility towards issues related to culture, gender, sexual orientation and working relationships.
In Switzerland, we worked to enhance skills and representation among several employee groups in 2013. For example, a suite of practical training programs to promote life-long learning was offered to mid-life employees, focusing on career planning and skills development in technology, new media and languages. A mentoring program for 150 mid-career women combined career advice with increased visibility and access to the firm’s senior management. Also in 2013, we established a partnership with Advance, an association of Switzerland-based companies that focuses on increasing the percentage of women in Swiss industries through development opportunities, role modeling and targeted events. In Asia Pacific, we sponsored workshops and events during 2013 to help our businesses better leverage their multi-generational workforces. Understanding and appreciating differences in age, behavior, attitude, motivation and working styles builds stronger teams that are better able to serve our clients.
In 2013, over 14,500 employees across UBS were members of more than 20 employee networks. These networks, representing affinities such as gender, culture, life stage and sexual orientation, help build cross-business relationships and an open workplace. Our global network guidelines enable employees to set up or join employee networks in all our operating regions. Additionally, our human resource policies and processes have global coverage and outline our commitment to a non-discriminating, harassment-free workplace,
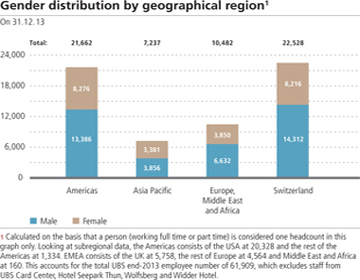
offering equal opportunities. This foundation encourages active and growing participation in our many employee networks.
Managing performance
As a results-driven firm, personal accountability, effective performance management and sound compensation practices are critical for our success. Our performance management framework features regular employee-manager dialogue, consistent assessment processes and clear links between performance, behavior, achievements and compensation. We provide the tools and support employees need to set clear goals, be effective in their jobs and advance their careers.
We further strengthened our year-end evaluation processes in 2013 to more closely align individual performance with the firm’s strategy and culture. More than ever, we want to evaluate not only each employee’s achievements, but how those results were
Gender distribution by employee category1
| | | | | | | | | | | | | | | | | | | | | | | | | | | | | | | | |
| | Officers
(Director and above) | | | Officers
(other officers) | | | Non-officers | | | Total | |
| As of 31.12.13 | | Number | | | % | | | Number | | | % | | | Number | | | % | | | Number | | | % | |
| Male | | | 17,995 | | | | 78.3 | | | | 12,463 | | | | 61.4 | | | | 7,728 | | | | 41.5 | | | | 38,186 | | | | 61.7 | |
| | | | | | | | | | | | | | | | | | | | | | | | | | | | | | | | | |
| Female | | | 4,996 | | | | 21.7 | | | | 7,844 | | | | 38.6 | | | | 10,883 | | | | 58.5 | | | | 23,723 | | | | 38.3 | |
| | | | | | | | | | | | | | | | | | | | | | | | | | | | | | | | | |
| Total | | | 22,991 | | | | 100.0 | | | | 20,307 | | | | 100.0 | | | | 18,611 | | | | 100.0 | | | | 61,909 | | | | 100.0 | |
| | | | | | | | | | | | | | | | | | | | | | | | | | | | | | | | | |
1 Calculated on the basis that a person (working full time or part time) is considered one headcount (in this table only). This accounts for the total UBS end-2013 employee number of 61,909, which excludes staff from UBS Card Center, Hotel Seepark Thun, Wolfsberg and Hotel Widder.
|
Corporate governance, responsibility |
and compensation |
The building blocks of effective people management

achieved. As part of this, specific corporate behaviors were integrated into our performance management processes starting with 2013 year-end evaluations. Employees and managers are expected to use concrete examples to illustrate how these behaviors were exhibited in 2013 and provide feedback on areas for future focus. We also assess employees’ competencies and development needs as part of our overall performance management approach.
Appropriate awareness and management of all types of risk continues to be a focus for our businesses. As part of this, measurable and relevant risk objectives were again required for all employees in 2013 and considered in performance and reward decisions.
Performance management for our executives is especially rigorous. Senior leaders, including all Group Executive Board members, are evaluated on key achievements, business performance, risk management, leadership skills and meeting specific financial targets, in addition to acting as role models for our corporate culture. Comprehensive feedback from peers, direct reports and internal clients forms part of this assessment.
Our “key risk takers” also receive additional input and feedback in their performance reviews. These individuals may work in front office, logistics or control functions and, due to their role, are able to materially commit, use or control the firm’s resources and exert significant influence over our risk profile. For this reason, in addition to self, manager and other relevant 360-degree reviewers, at least one person in
a control function, such as finance or compliance, must attest to the person’s attitudes and actions towards managing risk.
Our people management processes are global. In 2013, 99% of the employees eligible to participate in the firm’s performance assessment processes received a performance review. We have Group-wide ranks and country-specific salary ranges that are applicable to all employees. We also have a standardized role classification model which is used across the firm. Many human resource processes are based on these global role profiles, and this supports more clearly defined career paths and development plans for all employees.
Education and development
Our Group-wide learning and development course offerings encompass senior leadership development, business education and practical training measures for employees at all levels. Our goal is to provide our employees and leaders with what they need to excel in their roles, progress in their careers and ultimately create value for our stakeholders.
In 2013, we made our education function more agile and flexible. Continuously evolving business and regulatory environments call for specialized training to be delivered to teams more quickly than traditional learning initiatives were in the past. Striking a better balance between highly customized learning activities and external training support has been key to delivering timely, topical training to front office employees in particular.
A primary aim for 2013 was to continue to offer training that helped our businesses achieve their goals. In Wealth Management Americas, for example, our financial advisor education aimed to deepen our advisors’ ability to deliver holistic advice that considers clients’ planning, borrowing, saving and giving needs, in addition to investing. A new, four-module Wealth Advisor program gives established financial advisors the advanced skills and knowledge to deliver comprehensive counsel to their clients. In November 2013, a national learning forum gathered hundreds of financial advisors, field and home office leaders, and external partners to discuss client trends, wealth management solutions and best practices. Additionally, select new candidates for financial advisor roles are regularly hired into a two-year, salaried Wealth Planning
UBS Wealth Management Master
Launched in late 2012 and aimed at senior client advisors across Wealth Management, the UBS Wealth Management Master is the highest internal certification available to top-performing client-facing staff in Wealth Management. The two-year program combines structured
training with on-the-job development, enabling senior professionals to acquire in-depth expertise in client book management, client investment and relationship management. Since inception, 90 client advisors have entered the program.
Corporate governance, responsibility and compensation
Our employees
Analyst program, which enables them to obtain relevant licensing, training and practical experience in a US branch office before joining an existing team as a qualified financial advisor.
We offer client education opportunities through our Financial Markets Education team. Numerous classes and educational events are available to clients in all of our operating regions. These initiatives cover a wide range of financial topics including equities and equity derivatives, fixed income basics, credit risk and commodities.
Role-driven business education is offered through specific learning pathways. These pathways, covering topics such as risk, compliance, sales, advisory and financial markets, help ensure consistent training across similar job roles. For example, Wealth Management expects a high and consistent level of expertise within client advisor roles. In addition to the Wealth Management Diploma and Wealth Management Master Certificate programs that are already available, in 2013 we developed specialized training for client advisors to help them strengthen client relationships, investment strategies and business focus.
All employees can access a broad range of development and training as part of their daily job and through various programs. Our eLearning portfolio consists of more than 5,100 courses on topics such as communication skills, management and leadership, financial markets and information technology. Specialized learning modules on risk, finance and compliance topics help employees develop the skills they need to work effectively in their roles and within evolving business and regulatory environments. Overall, in 2013, our employees participated in about 776,000 development activities, including approximately 512,000 mandatory training sessions focusing on compliance and regulatory topics. This equated to an average of 12.5 training experiences per employee or an average of 2.5 training days.
Compensation
We strive to offer our employees a competitive salary and performance award while maintaining our obligations to our shareholders and regulators. Our approach recognizes the need to compensate individuals for their performance within the context of market conditions, risk considerations, a fast-changing commercial environment and evolving regulatory supervision. Our foremost priority is to encourage and reward behavior that contributes to sustainable profitability and the firm’s long-term success.
Our compensation structure is designed to be appropriately balanced between fixed and variable elements. We emphasize the variable component as an incentive to excel and to foster a performance-driven culture, while supporting appropriate and controlled risk-taking. Employee compensation is viewed within a total reward framework that takes into account base salary, discretionary performance awards and benefits.
Our Total Reward Principles are the foundation of our compensation framework, particularly for integrating risk control and managing performance, as well as specifying how we structure our compensation and performance award pool funding. They reflect our long-standing
focus on pay for performance, sustained profitability, risk awareness and sound governance.
| | è | | Refer to “Our deferred variable compensation plans” in the “Compensation” section of this report for more information |
Employee share ownership
We believe personal accountability for business actions and decisions can be encouraged through equity-based awards. Our employee share purchase plan, Equity Plus, is a voluntary equity-based program whereby eligible employees can purchase UBS shares at market price and receive one matching share for free for every three shares purchased. These matching shares vest in three years, subject to continued employment at UBS and retention of the purchased shares. We also use UBS shares as a significant component in our performance award deferral programs. As of 31 December 2013, current employees held an estimated 7% of UBS shares outstanding (including approximately 5% in unvested/blocked actual and notional shares from our compensation programs), based on all known shareholdings from employee participation plans, personal holdings and individual retirement plans. At the end of 2013, an estimated 48% of all employees held UBS shares.
| | è | | Refer to the “Compensation” section of this report for more information |
Our identity and our commitment to being a responsible employer
We have a clear vision. We want to be the world’s leading wealth manager and the top universal bank in Switzerland. We want to have an investment bank and an asset management business that are leaders in their chosen areas of focus and that add value to the overall franchise. We have made excellent progress in the past 18 months in implementing our strategy and in resolving legacy issues, and we are one of the world’s best-capitalized banks. Our continued success depends largely on hard work and on building a strong corporate culture.
Relationships based on respect, trust and mutual understanding are the foundation for all of our business activities. The firm’s guiding principles characterize the way we work together and the commitments we make to our clients. Unrivaled client focus is at the heart of our business model and we strive for excellence in everything we do, from the people we employ to the products and services we offer to our clients. We aim to deliver sustainable performance by strengthening our reputation and by delivering consistent returns to our shareholders. These concepts are integrated into our corporate decision-making and people management processes, and they are intended to shape the daily actions of our employees.
We are committed to making our unique culture a winning one. Our principles are brought to life in the actions and personal conduct that each of our employees exhibits in daily interactions with
|
Corporate governance, responsibility |
and compensation |
clients and colleagues. In 2012, we developed some basic expectations for employee behavior with input from over 500 employees throughout all regions and businesses. They were discussed with the firm’s 2,500 most senior managers in mid-2013 and then with more than 10,000 staff to ensure that our employees understand and act according to the values and principles that define who we are and what we stand for as an organization. In late 2013, we integrated these expectations into our promotion and performance evaluation processes to ensure that the way we achieve our goals is as important as achieving the goals themselves. We are developing a concrete plan to embed them in everything we do, from leadership skills building and business process simplification to employee engagement and the way we recruit people.
Listening to the voice of our employees
We request feedback from employees throughout the year. In 2012, we instituted a regular “Ask the CEO” event to allow employees to pose questions to our Group Chief Executive Officer Sergio P. Ermotti live in Zurich or via an interactive news and feedback channel called UBS Connections. A broad range of topics are discussed at these sessions, for example strategic direction, corporate restructurings and concepts such as collaboration and integrity.
Since 2008, we have utilized a targeted feedback tool to gauge the efficacy of our strategic communication initiatives, as well as the engagement levels of employees across the firm. This survey is sent several times a year to a representative sample of employees across all regions and business divisions. It assesses employees’ familiarity with our senior management, the firm’s principles and behaviors, specific measures of employee engagement, and their conviction regarding our strategic direction. We use the results to shape our communication strategies and to develop targeted initiatives that address areas of perceived weakness.
Benefits and well-being
We invest in all of our employees by offering a comprehensive suite of benefits such as insurance, pension, retirement and both paid and unpaid time off. We also offer our employees benefits beyond those required by local law or market practice. These benefits are designed to enhance employees’ work experience and help them manage their professional and personal interests.
For example, we support flexible work arrangements in our major locations. In Switzerland, employees can request “Time Flex” options such as teleworking, part-time or job-sharing, or begin partial retirement starting at 58 years old. The UK and US have policies that outline part-time, flexible, job-sharing and home-working opportunities that may be appropriate for employees whose roles are amenable to flexible working conditions.
We also provide employee assistance programs in a number of locations, including the UK, US, Switzerland, Hong Kong, Singapore and Japan. These programs offer specialist support and counseling to help
employees resolve issues related to stress, illness, personal conflict, finances, bereavement, mental health, performance, adult care and other work-life challenges. In addition, employees in the UK can utilize an on-site general practitioner, physiotherapist and dentist, as well as occupational health services. Employees in Switzerland have access to a child-care referral service, and employees in Stamford have access to on-site childcare.
We have a longstanding commitment to support the overall health and safety of all our employees, as noted in our Code of Business Conduct and Ethics. Our health and safety guidelines emphasize the importance of providing a good physical infrastructure and a work environment that promotes the health and safety of our employees and contractors. As part of this mandate, we track accident and illness rates. In 2013, 48,389 work days were lost to accident and 319,868 to illness. This amounts to six work days per employee.
Our commitment to being a responsible employer is present in every component of our people management process. This is especially important when necessary actions significantly impact certain employee groups in workforce-reduction exercises such as downsizings or organizational restructurings. Redeployment and outplacement initiatives in every region provide transitional support to affected employees. For example, eligible employees in the US receive career transition support, in addition to severance pay and health benefits. In Switzerland, our COACH program helps affected employees find new roles within UBS, or outside the firm, in the event of a restructuring. Employees below the level of Director participate in a social plan that sets out the terms and conditions for redundancies as well as internal hiring, job transfers and severance.
| | è | | Refer to www.ubs.com/health-safety for our health and safety statement |
Employee representation
As part of our commitment to being a responsible employer, we work with all of our employee representation groups to maintain an active dialogue between employees and management.
The UBS Employee Forum for Europe was established in 2002 and includes representatives from 18 countries across Europe. It facilitates open dialogue on pan-European issues that may affect our regional performance, prospects or operations. Other local forums address topics such as health and safety, changes to workplace conditions, pensions, collective redundancies and business transfers. In Switzerland, for example, the elected members of the Employee Representation Committee partner with senior management for annual salary negotiations and represent employee interests on specific topics. The UK Employee Forum, with elected representatives from our UK businesses and appointed management representatives, focuses on economic, financial and social activities concerning UK employees. Collectively, the UBS Employee Forum, including the Employee Representation Committee and UK Employee Forum, represents approximately 50% of our global workforce.
Corporate governance, responsibility and compensation
Compensation
Compensation
2013 compensation highlights and key changes
Performance achievements and performance award pool
A year ago, we committed to continue adapting our business to better serve clients, reduce risk, deliver more sustainable performance and enhance shareholder returns. In 2013, we made good progress in achieving all these goals and finished the year ahead of the majority of our performance targets.
Our business divisions posted strong results for 2013. Our adjusted Group profit before tax increased 44% year on year to CHF 4.1 billion. Our industry-leading fully applied Basel III common equity tier 1 (CET1) capital ratio increased by 300 bps to 12.8%, surpassing our 2013 target. Fully applied Basel III risk-weighted assets were reduced to CHF 225 billion, mainly due to disposals and other risk reduction in our Non-core and Legacy Portfolio, exceeding our 2013 year-end target and in line with our target for 2015. We significantly deleveraged our balance sheet, reducing total assets by CHF 250 billion. Maintaining cost discipline is critical to our long-term success. In 2013, we achieved our CHF 2 billion gross cost reduction target announced in July 2011.
A year ago, our 2012 performance award pool was significantly affected by the LIBOR matter, negatively impacting awards in the Investment Bank, in some areas of the Corporate Center, as well as the awards to the Group CEO and the other Group Executive Board (GEB) members. Based on the strong performance in 2013, we normalized our performance award levels for those areas most negatively affected last year and reduced gaps to market pay levels, leading to a performance award pool for 2013 of CHF 3.2 billion, which is 28% higher than for 2012. However, reflecting the reduced awards and longer deferrals in recent years which have resulted in decreased charges in 2013 for prior-year deferrals, the cost of performance awards was flat year on year on an accounting basis (IFRS).
While stability and predictability in our compensation framework are important, we have made some refinements to our framework in 2013 in response to the competitive environment and feedback from our shareholders.
Refinements to the GEB compensation framework
We introduced individual caps on performance awards of a maximum of five times the base salary for the Group CEO and a maximum of seven times the base salary for other GEB members. These caps are in addition to the overall GEB pool cap of 2.5% of adjusted Group profit before tax that we introduced last year.
We changed the GEB’s performance award deferral mix by increasing the weighting of the equity portion under the Equity Ownership Plan (EOP) to at least 62.5% from 50% of the deferred amount and by decreasing the Deferred Contingent Capital Plan (DCCP) portion to 37.5% from 50%.
We increased the DCCP’s phase-in CET1 capital ratio trigger to 10% from 7% for all GEB members including the Group CEO so that, if this capital ratio falls below 10%, the affected deferred performance awards would be written down to zero.
We based all GEB performance awards, including for the Group CEO, on financial and qualitative measures that were clearly defined and quantified in terms of relative weightings.
Refinements to the compensation framework for employees below GEB level
We changed the performance award deferral mix by increasing the weighting of the EOP portion to 60% of the deferred amount from 50% and reducing the DCCP portion to 40% from 50%.
Reflecting market dynamics, we raised the threshold of compensation levels subject to deferrals. We introduced deferral rates ranging from 40% to 75% compared with the previously flat rate of 60%, and better aligned performance award conditions to the firm’s targets. In general, this means employees at the lower end of the compensation scale benefited from lower levels of deferral than in previous years, while those at the higher end of the compensation scale were subject to higher levels of deferral.
The combined effect of the changes to deferral rates and threshold for all employees below the GEB level resulted in additional compensation expenses of CHF 0.2 billion for 2013.
Key regulatory developments
The “Ordinance against excessive pay in stock exchange listed companies,” issued by the Swiss Federal Council in November 2013 and effective from 1 January 2014, requires Swiss listed companies to submit the compensation of the GEB and Board of Directors (BoD) to shareholders for a binding vote annually. The Human Resources and Compensation Committee and BoD are being provided with regular updates on the impact and proposed implementation of the Ordinance. The first vote on BoD and GEB compensation will be held at the 2015 Annual General Meeting of Shareholders (AGM).
Another key regulatory development is the impact of the European Union’s Capital Requirements Directive IV on affected employees and the related implementation of the performance award cap for 2014 for this population. As a result of these requirements, we will submit for approval at the 2014 AGM a proposal concerning the award cap for variable compensation for affected employees.
Details regarding both of these measures will be provided as part of the agenda for the AGM.
| | è | | Refer to the “Regulatory and legal developments” section of our Annual Report 2013 for more information |
|
Corporate governance, responsibility |
and compensation |
Dear shareholders,
We are on track with the implementation of our ambitious strategy. To ensure this continues, we further anchored our strategy and a culture of accountability into our compensation framework during 2013.
We have built on the important strides we took in 2012 with the adoption of a revised compensation model founded on incentivizing disciplined capital management and with performance awards based on risk-adjusted profitability. In 2013, the Human Resources and Compensation Committee reviewed the firm’s compensation model to ensure it continues to reinforce our employees’ focus on medium-and longer-term performance, and in response to the competitive environment and feedback from our shareholders. Consequently, we made two key refinements to our plans during 2013. Firstly, we increased the weighting of the Equity Ownership Plan (EOP) to sharpen employees’ focus on future shareholder value creation. The increased weighting of the EOP underlines our commitment to deliver attractive returns to our shareholders and employees alike. Secondly, we raised the forfeiture trigger level of the Deferred Contingent Capital Plan (DCCP) for the Group Executive Board (GEB), thereby significantly
increasing the sensitivity of their compensation to a possible common equity tier 1 (CET1) capital ratio reduction.
We aim to foster a true culture of accountability at all levels of the firm. We strive to embed this core value into our daily actions including integrating safeguards on pay with appropriate governance oversight. To this end we made the following amendments to our compensation policies: we introduced a cap on the proportion of fixed to variable compensation for GEB members in addition to the cap of 2.5% of adjusted Group profit before tax for the GEB performance pool implemented a year ago. We now disclose in more detail the parameters we considered and how they were weighted in this year’s GEB performance award assessment process.
Below GEB level, we established greater differentiation in the deferral rates of the performance awards at the individual level based on total compensation. While deferral rates have been reduced for some, improving market competitiveness, the marginal deferral rate at the higher end of the scale has been increased, placing more compensation at risk. Furthermore, we continue to take a strong
stance on long-term accountability with our performance award plans. The lengths of our vesting periods are demanding compared with the industry, with plan durations of three to five years for the GEB and two to five years for employees below GEB level. These lengthy deferral periods are designed to ensure appropriate risk-taking.
In 2013, we increased profits and shareholder returns. Our business divisions posted strong results and were profitable in every quarter, demonstrating that our business model has the flexibility to deliver in a variety of market conditions. Our employees met the continued challenges affecting our industry with energy, determination and commitment, enabling us to deliver for both our clients and shareholders. While the performance of our businesses improved significantly during 2013 and we finished the year ahead of many of our targets, we remain fully committed to moderation in performance-related pay.
In 2013, adjusted Group profit before tax increased 44%. Reflecting the firm’s strong performance, the Board of Directors (BoD) is recommending a 67% increase in the dividend for shareholders. By way of comparison, we took the decision to increase the overall perfor-
Corporate governance, responsibility and compensation
Compensation
mance award pool 28% to CHF 3.2 billion. The increase compared with 2012 also reflects the fact that a year ago we addressed issues of the past that weighed on our performance. This resulted in pay that was understandably at the lower end of the scale compared with the industry. While the performance award pool increased 28%, the actual recognized performance award expenses remained flat compared to 2012, reflecting the lower awards in recent years and the strong deferral component in our compensation plans.
Looking ahead, we will continue to assess and refine our compensation framework to promote sustainable performance, risk alignment and competitive pay positioning against the backdrop of increasing regulation and a changing business environment. We intend to strike and maintain a balance whereby we reward employees effectively and responsibly. To ensure our continued success, we need to attract and retain the best people to deliver sustainable performance for our shareholders. As part of our endeavors, we will remain responsive to our shareholders and seek out opportunities to engage with them on compensation matters.
As a result of the implementation of the Ordinance against excessive pay issued by the Swiss Federal Council, from 2015 onwards we will not only have an advisory vote on the
compensation report, but will also seek shareholder approval on the compensation for the GEB and BoD. Revised Articles of Association, outlining the framework for the binding approval, will be presented at the upcoming Annual General Meeting (AGM). Furthermore, in accordance with the EU Capital Requirements Directive 2013, the BoD will propose, via a shareholder advisory vote, a cap of 2:1 for variable versus fixed compensation for UK-based employees whose professional activities could have a material impact on the firm’s risk profile in the UK.
The BoD and I would like to offer our sincere thanks to our shareholders for the time they took to meet with us and share their views on compensation. Over the following pages you will find details of UBS’s compensation programs and decisions for 2013, for which we will seek your support at our AGM in May 2014.

Ann F. Godbehere
Chair of the Human Resources
and Compensation Committee of
the Board of Directors
| | |

| | Ann F. Godbehere Chair of the Human Resources and Compensation Committee of the Board of Directors |
|
Corporate governance, responsibility |
and compensation |
2013 performance and compensation funding
Our performance in 2013 demonstrated both the strength of our business model, which is designed to provide sustainable and attractive results with a much lower capital and risk profile, and the focused and disciplined manner in which we continue to implement our strategy. As a result, the performance award pool for 2013 was increased to CHF 3.2 billion, 28% higher than in 2012.
Our performance in 2013
Overall for 2013, we reported an adjusted 1 Group profit before tax of CHF 4.1 billion, a net profit attributable to UBS shareholders of CHF 3.2 billion and diluted earnings per share of CHF 0.83.
In 2013, we further enhanced our position as one of the world’s best-capitalized banks, exceeding our year-end capital target. On a fully applied basis our Basel III common equity tier 1 (CET1) capital ratio increased 300 bps to 12.8%, ahead of our 2013 target of 11.5%. We achieved this improvement primarily through reductions in fully applied risk-weighted assets (RWA) of CHF 33 billion to CHF 225 billion at year-end. Our capital strength gives us the flexibility to execute our strategy effectively. Additionally, it reinforces client confidence while allowing us to address the challenges of the past and to absorb unexpected events. We also continued to successfully deleverage our balance sheet, reducing total assets by CHF 250 billion. Our funding, liquidity and leverage ratios remain comfortably above our regulator’s current requirements. In line with one of our strategic objectives to improve efficiency, during the year we surpassed our CHF 2 billion gross cost savings target announced in the second half of 2011, although substantial work remains to be done to achieve the gross cost savings targets we announced in 2012. As a result of our improved performance, the Board of Directors (BoD) is recommending a 67% increase in the dividend for shareholders for 2013 to CHF 0.25 per share. This is consistent with our commitment to progressive capital returns to our shareholders.
Summary of financial performance for 2013 and 2012
| | | | | | | | |
| CHF billion | | 2013 | | | 2012 | |
| Operating profit/(loss) before tax as reported | | | 3.3 | | | | (1.8 | ) |
| | | | | | | | | |
| Impairment of goodwill and other non-financial assets | | | 0.0 | | | | 3.1 | |
| | | | | | | | | |
| Own credit | | | 0.3 | | | | 2.2 | |
| | | | | | | | | |
| Net restructuring charges | | | 0.8 | | | | 0.4 | |
| | | | | | | | | |
| Other | | | (0.2 | ) | | | (1.0 | ) |
| | | | | | | | | |
| Operating profit/(loss) before tax (adjusted)1 | | | 4.1 | | | | 2.9 | |
| | | | | | | | | |
Operating profit/(loss) before tax (adjusted)1 for the Group and business divisions
CHF billion
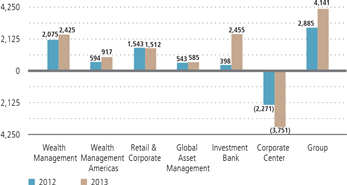
1 For 2013, adjusted operating profit/loss before tax excludes each of the following items, to the extent applicable, on a Group and business division level: an own credit loss of CHF 283 million, gains on sales of real estate of CHF 288 million, net losses of CHF 167 million related to the buyback of debt in public tender offers, net restructuring charges of CHF 772 million, a gain on sale of Global Asset Management’s Canadian domestic business of CHF 34 million and a net gain on sale of remaining proprietary trading business of CHF 31 million. For 2012, the items we excluded were an own credit loss of CHF 2,202 million, gains on sales of real estate of CHF 112 million, net restructuring charges of CHF 371 million, a credit related to changes to the Swiss pension plan of CHF 730 million, a credit related to changes to our retiree benefit plans in the US of CHF 116 million and an impairment of goodwill and other non-financial assets of CHF 3,064 million. Refer to the “Group performance” section in our Annual Report 2013 for more information on adjusted results.
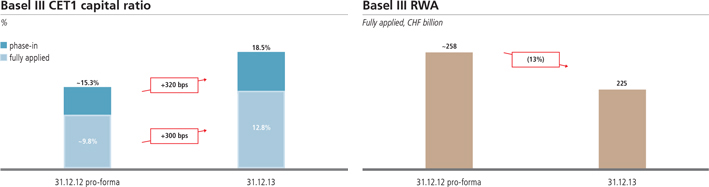
Corporate governance, responsibility and compensation
Compensation
Our business divisions posted strong results for the year, demonstrating that our model has the flexibility to adapt and perform well in a variety of market conditions. Our success has given our clients even greater confidence in the firm. Net new money inflows into our wealth management businesses totaled CHF 54 billion for the year, an increase of 14% year on year. We were recognized as the largest and fastest growing large-scale wealth manager in the world1. Wealth Management Americas achieved new records with invested assets of USD 1 trillion2, adjusted3 profit before tax of USD 1 billion4, and with revenue per financial advisor at over USD 1 million. Our Retail & Corporate business showed sustained profitability despite considerable pressure on net interest margins, and average client deposit volumes increased year on year. Global Asset Management recorded a stable performance in challenging markets with an 8% increase in adjusted3 profit before tax, although it did experience net new money outflows, excluding money market flows, of almost CHF 5 billion. The Investment Bank delivered significantly higher adjusted3 profit before tax of CHF 2.5 billion, achieving an adjusted3 return on attributed equity of 31%, significantly above its target of greater than 15%. This was achieved while operating well within strict RWA and balance sheet targets. All business divisions operated within their cost/income ratio targets and focused on using resources efficiently. In the Corporate Center, profit before tax was negatively affected by continuing elevated charges for provisions for litigation, regulatory and similar matters primarily in Non-core and Legacy Portfolio, by negative treasury income and by restructuring charges. However, reduction of RWA in Non-core and Legacy Portfolio was ahead of our targets and was executed in a manner that protected shareholder value, allowing the Group to exceed its capital ratio target.
Performance award pool funding
Business performance is the basis of our compensation funding framework. We measure our performance in a variety of ways, including profitability, quality of earnings, contribution before performance award and economic contribution before performance award, which is a risk adjusted measure of performance. In addition to the key performance metric of risk-adjusted profitability, we use a number of criteria to assess the performance of each of our business divisions and Corporate Center. Examples include the following:
| – | | In our wealth management businesses, we use criteria such as the level of net new money generated, cost/income ratio and gross margins. |
| – | | In Retail & Corporate, we consider factors such as net new business volume growth, net interest margin and cost/income ratio. |
1 Scorpio Partnership Private Banking Benchmark 2013, based on 2012 data for banks with assets under management of over USD 500 billion.2 Invested assets of USD 970 billion.3 Refer to the chart “Operating profit/(loss) before tax (adjusted) for the Group and business divisions” on the previous page for details on adjusted results.4 Full year adjusted profit before tax of USD 991 million.
| – | | In Global Asset Management we use criteria such as net new money growth rate, gross margin and cost/income ratio. |
| – | | In the Investment Bank, we consider factors such as pre-tax return on attributed equity, cost/income ratio and capital utilization. |
| – | | For Corporate Center – Core Functions, we look at factors such as risk and capital management and cost reduction. |
| – | | For Corporate Center – Non-core and Legacy Portfolio, we consider RWA reductions and exit costs. |
Certain risk-related objectives are common across all business divisions and Corporate Center, while others may vary. Risk-related objectives include, for example, adherence to risk investment guidelines, Group risk policies and value-at-risk limits, and the avoidance of significant operational risk events.
Each business division’s performance award pool is accrued as a percentage of the pre-performance award pool profit. This figure is then risk adjusted by factoring in a risk capital charge as well as further considerations of relevant risk metrics. The percentage is further affected by items such as changes in performance during the year, quality of earnings, affordability and market positioning. The percentage increases or decreases as performance declines or improves. If a business division’s profits increase, the proportion of profits we allocate to pay performance awards is generally reduced. In good years, this helps to prevent excessive compensation and allows us to return more capital to shareholders. In lean years, it provides us with the flexibility to make adequate provisions to retain key employees. For the purposes of performance award pool funding, business division performance is adjusted for items which do not reflect their underlying performance, such as gains related to divestments or sales of real estate, restructuring charges and gains or losses on own credit.
We assess the performance of the Group using criteria such as risk-adjusted profits, performance relative to the industry and general market competitiveness. We also consider progress against our strategic initiatives, including risk-weighted asset reduction, balance sheet reduction, delivery of cost efficiencies and capital accretion. We look at the firm’s risk profile and culture, including the extent to which operational risks and audit issues are identified and resolved and the quality and success of the firm’s risk reduction initiatives.
In determining performance award funding at all levels we take the following key risks into account, as applicable: credit, market, liquidity, funding, operational, including legal and compliance, and reputational risk. We consider as well the number of operational risks and audit recommendations that are effectively resolved.
The Human Resources and Compensation Committee (HRCC) monitors the forecasted full-year performance award pool on a regular basis. This includes a regular review of year-to-date accruals to ensure alignment to the overall performance of the firm and taking account of the competitive environment.
At the end of each year, the Group CEO, after consultation with the business division CEOs, develops the final performance award pool recommendation for the year. If the Group CEO believes that a business division’s performance award pool does not properly re-
|
Corporate governance, responsibility |
and compensation |
flect its achievements, the Group CEO can recommend a change to the size of the pool. The proposal is then submitted to the HRCC for consideration.
The HRCC considers all recommendations in the context of the firm’s overall performance, capital strength and risk profile, market positioning and trends of the businesses and geographies in which we operate. The HRCC ensures recommendations are in line with our strategy and the philosophy and objectives embodied in our Total Reward Principles to create sustainable shareholder value. The HRCC can either accept the Group CEO’s proposal, or adjust it either downwards or upwards before submitting it to the BoD for final approval.
2013 performance award pool and expenses
The performance award pool for 2013 was CHF 3.2 billion, an increase of CHF 0.7 billion, or 28%, compared with 2012. The pool reflects our overall increased profitability, the quality of earnings, and our progress towards achieving our strategic objectives. Our 2012 performance award
pool was significantly affected by the LIBOR matter, negatively impacting awards in the Investment Bank, some areas of the Corporate Center as well as the awards to the GEB including the Group CEO. In 2013, we finished the year ahead of many of our strategic and financial targets. We normalized performance award levels in areas negatively affected last year and reduced gaps to market pay levels in light of our absolute and relative achievements. Our achievements in 2013 and the proposed increase in distributions to our shareholders illustrate the continuing shift in the relationship between compensation, capital and dividends. The performance award pool includes all discretionary, performance-based variable awards for 2013.
The “Performance award expenses” chart below compares the performance award pool with the performance award expenses for the financial year 2013. Performance award expenses remained flat at CHF 3.0 billion and included expenses related to 2013 compensation awards and amortized expenses related to awards made in prior years. The 2013 expenses reflected increases for current year performance awards, offset by decreased amortized expenses from prior years’ awards.
Performance award expenses
CHF billion
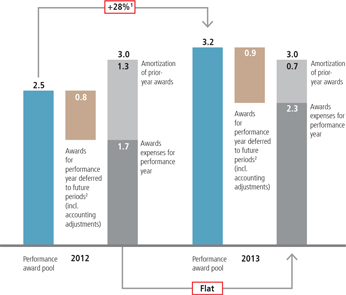
1Excluding add-ons such as social security.2 Estimate. The actual amount to be expensed in future periods may vary for example due to forfeitures.
Corporate governance, responsibility and compensation
Compensation
2013 compensation for the Group CEO and the other Group Executive Board members
Group Executive Board (GEB) awards are made at the discretion of the Board of Directors (BoD). The BoD takes into account the overall performance of the Group and the available performance award pool funding. For GEB members in office for 2013, performance awards were up 20% year on year, whereas the overall performance award pool for all employees increased 28%.
Key features of our 2013 compensation framework for the Group Chief Executive Officer (Group CEO) and the other members of the GEB
| | |
| Pay for performance | | Safeguards |
The Human Resources and Compensation Committee (HRCC) reviews the performance of our Group CEO and other GEB members against the Group’s performance targets. The GEB’s performance awards are based on financial and non-financial performance measures and consider performance of the individual and the Group overall. – In 2013, the Group CEO/GEB performance scorecard was introduced. This is based on a set of financial and qualitative measures, and provides a framework for a balanced assess-ment. Group level, business division, regional, functional and qualitative performance measures are included in combination, depending on the individual GEB member’s remit – Compensation plan forfeiture provisions enable the firm to reduce the unvested deferred portion if the compensation plans’ relevant performance conditions are not achieved. This means – the vesting of EOP awards depends on both Group and divisional performance – DCCP awards only vest in full if the firm delivers an adjusted profit before tax and ourphase-in common equity tier 1 (CET1) capital ratio does not fall below 10%. This is a higher threshold than the 7% CET1 capital ratio trigger applicable in 2012. Like last year, annual interest is only paid if UBS achieves an adjusted profit before tax duringthe vesting period | | Our compensation framework contains a number of features designed to ensure that risk is appropriately managed with safeguards to limit inappropriate risk-taking. Our framework has – a balanced mix of shorter-term and longer-term performance awards with a focus on deferral – a cap on the total GEB performance award pool of up to 2.5% of adjusted Group profit before tax – individual caps on the proportion of fixed to variable pay for the Group CEO and other GEB members – a share ownership policy under which each GEB member must build up and hold a minimum of 350,000 shares. The Group CEO must build up and hold a minimum of 500,000 shares – an evaluation of the risk control effectiveness and adherence of each GEB member as part of their individual qualitative assessment – employment contracts that generally include a six-month notice period – provisions that enable the firm to trigger forfeiture of some, or all, of the unvested de-ferred performance award if an employee commits certain harmful acts or employment is terminated for cause. Generally, we regard the following as harmful acts: – contributing substantially to a significant downward restatement of the Group’s or a business division’s results, or to the Group incurring significant financial losses – engaging in conduct and/or failing to discharge supervisory or managerial responsibilities that results in detriment to UBS, including reputational harm – engaging in conduct that materially violates legal and regulatory requirements or internal policies and procedures – improperly disclosing confidential or proprietary information – soliciting UBS employees or clients |
|
Corporate governance, responsibility |
and compensation |
2013 compensation framework for GEB members
Of the annual performance award up to 20% is paid in the form of immediate cash, and 80% is paid as a longer-term performance award, with 50% paid in deferred equity and the remaining 30% in deferred notional bonds.
Illustrative example
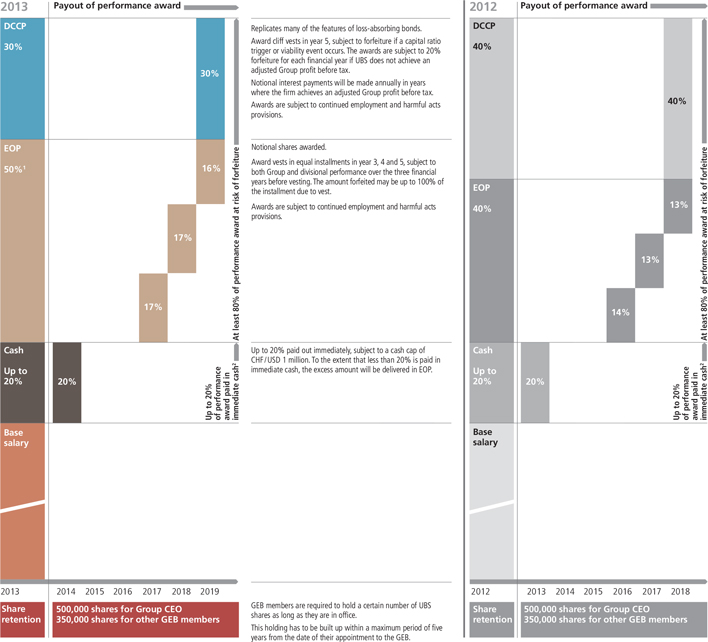
1 At least 50% of the performance award is granted under EOP.2 UK Code Staff receive 50% in the form of blocked shares.
Corporate governance, responsibility and compensation
Compensation
Base salary
Each GEB member receives a fixed base salary, which is reviewed annually by the HRCC. GEB salaries, excluding the Group CEO, were unchanged from CHF 1.5 million (or currency equivalent), which was set by the BoD in early 2011. Since his appointment, the Group CEO’s base salary was set at CHF 2.5 million.
Pensions and benefits
Pensions contributions and benefits for GEB members are in line with local practices for other employees.
| | è | | Refer to “Note 28 Pension and otherpost-employment benefit plans” in the “Financial information” section of our Annual Report 2013 for details on the various majorpost-employment benefit plans established in Switzerland and other countries |
How we set variable compensation levels for our Group CEO and other GEB members – performance scorecard assessment
The Group CEO and other GEB members are eligible to receive an annual performance award at the full discretion of the BoD. In 2013, we enhanced our performance assessment approach based on a balanced scorecard. We assess an individual’s performance against a number of financial and qualitative key performance indicators (KPI).
The financial factors determining the Group CEO’s annual discretionary performance award are based on Group performance. For other GEB members, the financial criteria are split between Group performance and that of their relevant business division (BD) and/or region. Those who lead Group control functions, or who are solely regional CEOs, are assessed based on the performance
Overview of the quantitative and qualitative measures on which the performance scorecard is based
| | |
| Quantitative measures (65% weighting) | | Qualitative measures (35% weighting) |
The quantitative factors are aligned with the Group’s strategic plan. They are mainly based on the Group measures, supplemented with business division, regional or functional KPI for business division, regional or Corporate Center GEB members, and include the following: – Group return on equity (as reported) – adjusted Group profit before tax – fully applied common equity tier 1 (CET1) capital ratio – business division and/or regional KPI (if applicable) – functional KPI (for Corporate Center GEB members) Both regional and functional KPI may consist of some qualitative measures. | | The qualitative factors assess how effective the Group CEO/GEB member is in respect of the following: – clients – evaluates how effective the individual is in increasing client satisfaction and maintaining high levels of satisfaction over the long term. This includes promoting cross-business division collaboration and fostering the delivery of the whole bank to our clients – people and culture – assesses the extent to which the individual actively develops successors for the most senior positions, facilitates talent mobility within the firm and promotes a diverse and inclusive workforce. Furthermore, this measure evaluates the individual’s ability to reinforce a culture of accountability and responsibility, demonstrating our commitment to being a responsible corporate citizen and acting with integrity in all our interactions with our stakeholders – risk control – evaluates how effective the individual is in ensuring risk management and control principles are fully implemented and adhered to through an effective risk management and control framework. It also captures the degree to which risks are self-identified – regulatory compliance – focuses on the individual’s success in ensuring regulatory compliance with the various regulatory frameworks in which we operate. It also evaluates how well the individual helps shape the firm’s relationships with regulators through ongoing dialogue – execution effectiveness – assesses how the individual contributes to the development and execution of our strategy. The measure also looks to ensure there is success across all business lines, functions and regions, as applicable, through specific objectives, initiatives, time-frames, and metrics – brand and reputation – assesses the individual’s protection of our reputation and full compliance with our standards and principles, particularly our Code of Business Conduct and Ethics |
|
Corporate governance, responsibility |
and compensation |
Weightings of financial and qualitative measures
| | | | | | | | | | | | |
| in % | | Group CEO | | | BD/Regional CEO | | | Functional heads | |
| Key performance indicators (KPI) | | | | | | | Weighting | | | | | |
| | | | | | | | | | | | | |
| Group RoE, adjusted Group profit before tax and Basel III CET1 ratio (fully applied) | | | 65 | | | | 35 | | | | 45 | |
| | | | | | | | | | | | | |
| Business division/regional KPI | | | | | | | 30 | | | | | |
| | | | | | | | | | | | | |
| Functional KPI | | | | | | | | | | | 20 | |
| | | | | | | | | | | | | |
| Financial | | | 65 | | | | 65 | | | | 65 | |
| | | | | | | | | | | | | |
| Qualitative | | | 35 | | | | 35 | | | | 35 | |
| | | | | | | | | | | | | |
| Total | | | 100 | | | | 100 | | | | 100 | |
| | | | | | | | | | | | | |
of the Group and of the functions or of the regions they may oversee. Quantitative factors, such as business division financial, regional and functional measures, account for 65% and qualitative factors for 35% of the assessment. The qualitative factors considered are the same for the Group CEO and other GEB members.
The table above provides an overview of the quantitative and qualitative KPI on which the scorecard is based.
The weighting of the quantitative factors between Group, business division, regional and functional KPI varies depending on the GEB member’s role, with a significant weighting on Group KPI for all GEB members.
The degree of achievement of these financial measures, coupled with the assessment of performance against the qualitative measures, gives an overall score that determines the starting point for a GEB member’s annual performance award. Target total compensation is reviewed against the market value of the respective role. Scoring at target would generally result in a total compensation around the median of the industry peer group. Where the performance is below target, the score is reduced (and can be 0%), which then results in a total compensation below market median. If the performance exceeds the target, the score increases, resulting in a total compensation that can be above market median. While this method represents a more formulaic approach than in the past, it is not intended to be mechanical. The HRCC does not abdicate its responsibility to exercise sound judgment and applies an appropriate level of discretion that may result in the outcome of the above scorecard or compensation level being adjusted upwards or downwards by up to 20%. The HRCC’s final compensation recommendations for GEB members are based on the scorecards, the assessment against each individual’s market value for the role and the CEO’s overall recommendation, excluding his own performance award. The HRCC’s recommendations are then reviewed, and must be approved by the BoD, which retains full discretion in determining the variable compensation levels for GEB members and may decide not to grant any performance awards. The HRCC and BoD go through a similar process in setting the compensation for the Group CEO.
Caps
The total potential GEB performance award pool is capped at 2.5% of the firm’s adjusted Group profit before tax, thereby linking overall GEB compensation to the firm’s profitability. As the Group’s adjusted profit before tax for 2013 was CHF 4.141 billion, the GEB 2013 performance award pool was capped at CHF 104 million.
The actual total performance award pool for 2013 was CHF 63 million, representing 1.5% (in 2012: CHF 52 million or 1.8%) of the Group’s adjusted profit before tax. Furthermore, 100% of a GEB member’s deferred compensation is subject to performance conditions.
For 2013, we also introduced individual compensation caps on the proportion of fixed pay to variable pay. The Group CEO’s performance award is capped at five times base salary. Performance awards of other GEB members are capped at seven times base salary.
For 2013, GEB member and Group CEO performance awards were, on average, 3.7 times the base salary (2012: 3.2 times).
Benchmarking against peers
The HRCC reviews GEB compensation and benefits levels against those of a peer group of companies selected based on the comparability of their size, business mix, geographic mix, and the extent to which they are our competitors for talent. The HRCC also considers the practices of these peers that may influence their pay strategies and pay levels and their respective regulatory environments.
Year-on-year consistency of the peer group is considered an important element by the HRCC. In 2013, it reviewed our peer group and determined it remained appropriate. The group consists of the following 12 companies: Bank of America, Barclays, BNP Paribas, Citigroup, Credit Suisse, Deutsche Bank, Goldman Sachs, HSBC, JP Morgan Chase, Julius Baer, Morgan Stanley and Nomura.
Overall, total compensation of GEB members is targeted at the median of the industry peer group, adjusted for individual and Group performance.
Corporate governance, responsibility and compensation
Compensation
Comparability assessment against main peers
Benchmarking ensures that our executive compensation is appropriate relative to our industry peer group. The key benchmarking criteria are summarized in the following table.
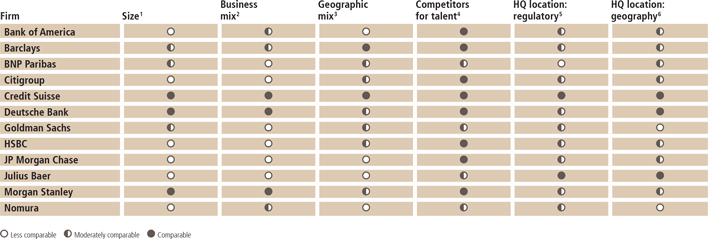
1 Size: evaluated in terms of revenue, profitability, assets and employee size. This would potentially impact management complexity outside of the impact of product mix and geography. 2 Business mix: in terms of type and size of major businesses. This would impact pay strategy, pay levels and approach and, importantly, risk profile. 3 Geographic mix: evaluated not only in terms of mix, but also from a European Headquarters (HQ) perspective. This impacts executive role definition and management complexity. 4 Competitors for talent: firms from which UBS recruits and/or firms which recruit from UBS. 5 HQ location/regulatory: impact of the regulatory environment based on home regulator. 6 HQ location/geography: culture and practice that impacts pay strategy, levels.
2013 deferral of performance awards
In line with our focus on generating sustainable performance, at least 80% of a GEB member’s performance award is deferred. In 2012, in light of the firm’s overall results for the year, and, based on a recommendation from the Group CEO, 100% of the GEB’s 2012 performance award was deferred.
For 2013, a minimum of 50% of the overall performance award is awarded under the Equity Ownership Plan (EOP), a longer-term performance award. EOP awards vest in three equal installments from years three to five, subject to performance conditions being met.
Thirty percent of the overall performance award is awarded under the Deferred Contingent Capital Plan (DCCP), another longer-term performance award which vests only in year five. Notional interest is paid for each year provided the firm achieves an adjusted Group profit before tax for that year. In addition to a phase-in CET1 capital ratio trigger of 10%, DCCP awards are subject to an additional performance condition. If UBS does not achieve an adjusted Group profit before tax for any year during the vesting period, GEB members forfeit 20% of the award for each loss-making year. This means 100% of the award is subject to an additional risk of forfeiture in addition to the capital ratio trigger.
For each GEB member a maximum of 20% of the overall performance award can be paid out in the form of immediate cash, subject to a cap of CHF/USD 1 million (or currency equivalent). Any amount above this is paid in notional shares under the EOP. In addition, for GEB members considered “UK Code Staff” for the year 2013, 50% of any immediate cash must be delivered in vested shares which are blocked until 1 September 2014, and each EOP installment vesting on 1 March will be blocked for a further six months.
The average deferral period for deferred awards for GEB members in 2013 was 4.4 years. Our compensation plans have no upward leverage, such as multiplier factors, and therefore do not encourage excessive risk-taking.
| | è | | Refer to the “Our deferred variable compensation plans” section of this report for more information |
| | è | | Refer to the “Our compensation model for employees other than GEB members” section of this report for more information on UK Code Staff |
Share ownership requirements
We aim to align GEB members’ interests with those of our shareholders. To ensure GEB members remain focused on the longer-term success of the firm, we require the Group CEO to hold a
|
Corporate governance, responsibility |
and compensation |
Overview of compensation process for the Group CEO and the other GEB members
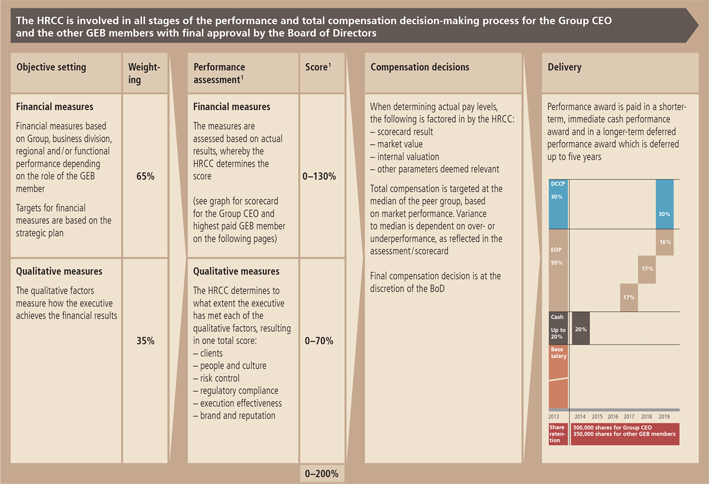
1 The HRCC has the discretion to adjust the scoring/compensation level up-or downward by a maximum of 20%. Use of this discretion is still bounded by the defined total compensation caps.
minimum of 500,000 UBS shares and the other GEB members to hold a minimum of 350,000 UBS shares. These shareholdings must be built up within five years from the date a GEB member is appointed and must be retained for as long as they remain in office. The number of UBS shares held by each GEB member is determined by adding any vested or unvested shares to privately held shares. GEB members are not permitted to sell their UBS shares until the abovementioned thresholds have been reached. As of the end of 2013, all GEB members who have been in office for at least five years achieved their required share ownership levels.
Overview of GEB compensation determination process
The illustration above provides an overview of how GEB compensation is determined under the governance and oversight of the HRCC and the BoD.
2013 compensation
The performance awards of the Group CEO and each other member of the GEB are based on the achievement of both financial targets and qualitative performance objectives, as described earlier in this section.
As part of Mr. Ermotti’s performance assessment, a 65% weighting was accorded to Group financial performance, and 35% was accorded to his performance against the qualitative criteria. In the case of Mr. Orcel (the highest paid GEB member for 2013), a 35% weighting was accorded to Group financial performance, 30% to Investment Bank performance and 35% to qualitative criteria.
A “Target score achievement” on the overall balanced scorecard supports market median level compensation.
Corporate governance, responsibility and compensation
Compensation
2013 compensation for the group chief executive officer
The table below summarizes the factors on which Mr. Ermotti’s performance was assessed as Group CEO for 2013 by the HRCC in consultation with the Chairman.
The BoD recognized that under Mr. Ermotti’s leadership, Group financial performance for 2013 was strong and was driven by progress towards the successful implementation of the firm’s ambitious strategy – a strategy focused on sustainable performance, best-in-class capital ratios, and vigilance on operational risk and on effectiveness and efficiency. In terms of the Group financial targets, the firm delivered significantly increased adjusted Group profit before tax, up 44% compared with the prior year. The Group also achieved an increased return on equity, up significantly on 2012. The firm’s share price development in 2013 also reflected investor confidence in the firm’s progress and future success.
Additionally, UBS further enhanced its position as one of the world’s best-capitalized banks, exceeding its year-end capital ratio targets. The firm surpassed its Basel III risk-weighted assets reduction target for the year and also continued to successfully deleverage its balance sheet. The firm’s Basel III funding, liquidity and leverage ratios remained comfortably above regulatory requirements in 2013.
UBS’s business divisions posted strong results for the year and were profitable in every quarter. The firm’s success continued to give clients great confidence in UBS’s strategy. This was demonstrated by net new money inflows into the firm’s wealth management businesses, which increased by 14% year on year to CHF 54 billion.
Against the qualitative criteria, the BoD considered Mr. Ermotti’s successes in promoting a Group-wide initiative to embed the firm’s principles of client focus, excellence and sustainable performance further into the fabric of the firm. This effort will be key to ensuring the right behaviors and culture which will be essential to supporting UBS’s success going forward. The assessment also recognized his consistent focus on protecting and improving the firm’s reputation, and the clear improvement in the firm’s standing with its key regulators.
In addition to the strategic, financial and qualitative accomplishments noted above, the BoD also recognized the positive impact that Mr. Ermotti had in effectively addressing operational risk remediation requirements and also resolving a number of key legal matters from the past.
Reflecting his achievements and strong performance in 2013, the BoD approved the proposal from the HRCC to grant Mr. Ermotti a performance award of CHF 7.9 million, bringing his total compensation (excluding benefits in kind and contributions to retirement benefit plan) for the year to CHF 10.4 million. Based on the compensation framework, he received 13% of his performance award in cash (CHF 1.0 million). The remaining 87% of his performance award was deferred under EOP (57% of his performance award) and under DCCP (30% of his performance award). The future actual pay-outs under EOP and DCCP are dependent upon the firm’s forthcoming performance, as described earlier in this section.
Scorecard for the Group CEO
| | | | | | | | | | | | | | | | |
Financial factors1 | | 2013 Result | | Weighting | | | Outcomes relative to plan |
| | | | | Threshold | | | Target | | Stretch | | |
Group (65%) | | Group RoE | | 6.7%
| | 20% | | | | | | | | l | | |
| | Adjusted Group profit before tax | | 4.1 billion | | 25% | | | | | | | | l | | |
| | Basel III CET1 ratio (fully applied) | | 12.8% | | 20% | | | | | | | | l | | |
| | | | | | | | | | | | | | | | |
Qualitative factors | | Weighting | | | Achievement |
| | | | Threshold | | | Target | | Stretch | | |
Clients, people and culture, risk control, regulatory compliance, execution effectiveness, brand and reputation | | 35% | | | | | | | | l | | |
1 Financial factors and target levels were based on internal performance objectives in our 2013 Operating Plan. These financial targets and ranges do not necessarily correspond to UBS’s Group targets announced in October 2012, most of which are applicable from 2015.
|
Corporate governance, responsibility |
and compensation |
2013 compensation for the highest paid GEB member
Andrea Orcel, the CEO of the Investment Bank, was the highest-paid GEB member for performance year 2013. The financial performance results and qualitative achievement assessment of Mr. Orcel as determined by the Group CEO are summarized in the table below. The HRCC and the BoD supported the overall assessment.
During his first full year as CEO of the Investment Bank, Mr. Orcel proved himself an effective leader and drove positive performance throughout a very successful year for the business. Mr. Orcel executed a fundamental turnaround in the Investment Bank’s performance in 2013. He guided the business and its employees through a period of intense and sometimes challenging transformation following the announcement of the acceleration of the implementation of the firm’s strategy in late 2012. In 2013, a more client-focused, less complex, and less risky Investment Bank delivered significantly higher profitability and outperformed on all its targets. The business achieved an adjusted profit before tax of CHF 2.5 billion for the year. It delivered an adjusted return on attributed equity of 30.6%, significantly above its 2013 target. It operated successfully below its relatively restrictive risk-weighted asset and funded asset targets. The Investment Bank remained highly focused on using its resources effectively and efficiently and achieved its cost/ income ratio target for the year.
The Investment Bank reinforced its position among the global market leaders in its core businesses of advisory, research, equities, foreign exchange and precious metals. Further, Rates and Credit has
transformed into a successful client-centric and capital-light business with a strong focus on improved IT effectiveness which has also led to best-in-class execution. The Investment Bank’s turnaround performance was recognized with numerous industry awards, and most importantly, was applauded by clients. In line with the firm’s strategy, the Investment Bank continued to work in close collaboration with all the firm’s other businesses, in particular its wealth management businesses, to deliver the best of UBS to clients and drive sustainable returns for the benefit of UBS’s shareholders.
In judging his achievements in relation to qualitative factors, the Group CEO considered that Mr. Orcel displayed a strong focus on ensuring the business delivered on the firm’s principles of excellence, client focus and sustainable performance, and his consistent promotion of the highest standards of employee conduct and behavior whilst at the same time addressing issues from the past.
Reflecting his significant achievements and strong performance in 2013, the BoD approved the proposal from the Group CEO and the HRCC to grant Mr. Orcel a performance award of CHF 9.0 million, bringing his total compensation (excluding benefits in kind and contributions to retirement benefit plan) for the year to CHF 10.5 million. 89% of his performance award was deferred, with 59% under EOP and 30% under DCCP.
| | è | | Refer to the “2013 performance and compensation funding” section of this report for information on financial performance achievements in 2013 |
Scorecard for the highest paid GEB member
| | | | | | | | | | | | | | | | |
Financial factors1 | | 2013 Results | | Weighting | | | Outcomes relative to plan |
| | | | | Threshold | | | Target | | Stretch | | |
Group (35%) | | Group RoE | | 6.7% | | 10% | | | | | | | | l | | |
| | Adjusted Group profit before tax | | 4.1 billion | | 20% | | | | | | | | l | | |
| | Basel III CET1 ratio (fully applied) | | 12.8% | | 5% | | | | | | | | l | | |
Divisional (30%) | | RoAE (adjusted) | | 31% | | 10% | | | | | | | | | | l |
| | Cost/income ratio | | 73% | | 10% | | | | | | | | l | | |
| | Basel III RWA (fully applied) | | 62 billion | | 10% | | | | | | | | l | | |
Qualitative factors | | Weighting | | | Achievement |
| | | | Threshold | | | Target | | Stretch | | |
Clients, people and culture, risk control, regulatory compliance, execution effectiveness, brand and reputation | | 35% | | | | | | | | l | | |
1 Financial factors and target levels were based on internal performance objectives in our 2013 Operating Plan. These financial targets and ranges do not necessarily correspond to UBS’s Group targets announced in October 2012, most of which are applicable from 2015.
Corporate governance, responsibility and compensation
Compensation
Total compensation for GEB members for the performance years 2013 and 2012
The table below shows the total compensation for GEB members for the performance years 2013 and 2012.
| | è | | Refer to the “Supplemental information” section of this report and “Note 34 Related parties” in the “Financial information” section of our Annual Report 2013 for information on vested and unvested shares and options for GEB members. |
Employment contracts
Employment contracts for GEB members do not provide for “golden parachutes,” that is, special severance terms, including supplementary contributions to pension plans. All employment contracts for GEB members contain a notice period of six months, except for one which contains a 12-month notice period. If a GEB member leaves the firm before the end of a performance year they may be considered for a discretionary performance award based on their contribution during the time worked in that performance year following the principles outlined above. Such awards are at the full discretion of the BoD, which may decide not to grant any awards.
| | | | | | | | | | | | | | | | | | | | | | | | | | | | | | | | | | |
| | Total compensation for GEB members for the performance years 2013 and 2012 | |
| | | CHF, except where indicated1 | |
| | | Name, function | | For the year | | | Base salary | | | Immediate
cash2 | | | Annual
performance
award under
EOP3 | | | Annual
performance
award under
DCCP4 | | | Benefits5 | | | Contributions
to retirement
benefit
plans6 | | | Total | |
| | Sergio P. Ermotti, Group CEO | | | 2013 | | | | 2,500,000 | | | | 1,000,000 | | | | 4,530,000 | | | | 2,370,000 | | | | 127,300 | | | | 202,822 | | | | 10,730,122 | |
| | | | | | | | | | | | | | | | | | | | | | | | | | | | | | | | | | |
| | Sergio P. Ermotti, Group CEO (highest-paid) | | | 2012 | | | | 2,500,000 | | | | 0 | | | | 3,660,000 | | | | 2,440,000 | | | | 69,500 | | | | 201,088 | | | | 8,870,588 | |
| | | | | | | | | | | | | | | | | | | | | | | | | | | | | | | | | | |
| | Andrea Orcel (highest-paid) | | | 2013 | | | | 1,500,000 | | | | 1,000,000 | | | | 5,300,000 | | | | 2,700,000 | | | | 727,048 | | | | 202,822 | | | | 11,429,870 | |
| | | | | | | | | | | | | | | | | | | | | | | | | | | | | | | | | | |
| | Aggregate of all GEB members who were in office at | | | 2013 | | | | 16,873,360 | | | | 9,949,062 | | | | 33,894,646 | | | | 18,790,161 | | | | 1,548,784 | | | | 1,347,784 | | | | 82,403,796 | |
| | | | | | | | | | | | | | | | | | | | | | | | | | | | | | | | | | |
| | the end of the year7 | | | 2012 | | | | 16,273,460 | | | | 0 | | | | 31,355,592 | | | | 20,903,728 | | | | 640,683 | | | | 1,233,719 | | | | 70,407,181 | |
| | | | | | | | | | | | | | | | | | | | | | | | | | | | | | | | | | |
| | Aggregate of all GEB members who stepped down | | | 2013 | | | | 0 | | | | 0 | | | | 0 | | | | 0 | | | | 0 | | | | 0 | | | | 0 | |
| | | | | | | | | | | | | | | | | | | | | | | | | | | | | | | | | | |
| | during the year8 | | | 2012 | | | | 1,593,288 | | | | 0 | | | | 0 | | | | 0 | | | | 105,865 | | | | 14,799 | | | | 1,713,952 | |
| | | | | | | | | | | | | | | | | | | | | | | | | | | | | | | | | | |
| | 1 Local currencies are converted into CHF using the exchange rates as detailed in “Note 36 Currency translation rates” in the “Financial information” section of our Annual Report 2013. 2 Under the 2013 compensation framework, 20% is paid out in immediate cash, subject to a cash cap of CHF/USD 1 million. Due to applicable UK Prudential Regulation Authority regulations, the immediate cash includes blocked shares for Andrea Orcel. For the performance year 2012, no immediate cash was paid. 3 For EOP awards for the performance years 2013 and 2012, the number of shares allocated at grant has been determined by dividing the amount communicated by CHF 18.60 and USD 20.88 (for notional shares) for 2013, and by CHF 15.014 and USD 15.868 (for actual shares) and by CHF 13.97 and USD 14.77 (for notional shares) for 2012, based on the average price of UBS shares over the ten trading days prior to and including the grant date (28 February 2014 and 15 March 2013 respectively). For notional shares granted under EOP 2012 the number of notional shares has been adjusted for the estimated value of dividends paid on UBS shares over the vesting period. 4 DCCP awards vest after the five-year vesting period. The amount reflects the amount of the notional bond excluding future notional interest. For DCCP awards for the performance year 2013, the notional interest rate is set at 5.125% for awards denominated in USD and 3.500% for awards denominated in CHF. For DCCP awards for the performance year 2012, the notional interest rate is set at 6.25% for awards denominated in USD and 5.40% for awards denominated in CHF. 5 Benefits are all valued at market price. 6 This figure excludes the mandatory employer’s social security contributions, but includes the portion related to the employer’s contribution to the statutory pension scheme. The employee contribution is included in the base salary and annual incentive award components. 7 11 GEB members were in office on 31 December 2013 and on 31 December 2012 respectively. 8 2012 includes three months in office as a GEB member for Alexander Wilmot-Sitwell and 10 months in office as a GEB member for Carsten Kengeter. | |
Fixed and variable compensation for GEB members1
| | | | | | | | | | | | | | | | | | | | | | | | | | | | |
| | | Total for the year
ended 2013 | | | Not deferred | | | Deferred2 | | | Total for the year
ended 20123 | |
| CHF million, except where indicated | | Amount | | | % | | | Amount | | | % | | | Amount | | | % | | | Amount | |
| Total compensation | | | | | | | | | | | | | | | | | | | | | | | | | | | | |
| | | | | | | | | | | | | | | | | | | | | | | | | | | | | |
| Amount | | | 80 | | | | 100 | | | | 27 | | | | 34 | | | | 53 | | | | 66 | | | | 70 | |
| | | | | | | | | | | | | | | | | | | | | | | | | | | | | |
| Number of beneficiaries | | | 11 | | | | | | | | | | | | | | | | | | | | | | | | 13 | |
| | | | | | | | | | | | | | | | | | | | | | | | | | | | | |
| Fixed compensation | | | | | | | | | | | | | | | | | | | | | | | | | | | | |
| | | | | | | | | | | | | | | | | | | | | | | | | | | | | |
| Base salary | | | 17 | | | | 21 | | | | 17 | | | | 100 | | | | 0 | | | | 0 | | | | 18 | |
| | | | | | | | | | | | | | | | | | | | | | | | | | | | | |
| Variable compensation | | | 63 | | | | 79 | | | | 10 | | | | 16 | | | | 53 | | | | 84 | | | | 52 | |
| | | | | | | | | | | | | | | | | | | | | | | | | | | | | |
| Immediate cash | | | 10 | | | | | | | | 10 | | | | 100 | | | | 0 | | | | 0 | | | | 0 | |
| | | | | | | | | | | | | | | | | | | | | | | | | | | | | |
| Equity Ownership Plan (EOP) | | | 34 | | | | | | | | 0 | | | | 0 | | | | 34 | | | | 100 | | | | 31 | |
| | | | | | | | | | | | | | | | | | | | | | | | | | | | | |
| Deferred Contingent Capital Plan (DCCP) | | | 19 | | | | | | | | 0 | | | | 0 | | | | 19 | | | | 100 | | | | 21 | |
| | | | | | | | | | | | | | | | | | | | | | | | | | | | | |
1 The figures refer to all GEB members in office in 2013. 2 This is based on the specific plan vesting and reflects the total award value at grant which may differ from the accounting expenses. 3 Year 2012 as reported in Annual Report 2012. | |
|
Corporate governance, responsibility |
and compensation |
Loans
GEB members may be granted loans, fixed advances and mortgages. Such loans are made in the ordinary course of business on substantially the same terms as those granted to other employees, including interest rates and collateral, and do not involve more than the normal risk of collectability or contain other unfavorable features.
| | è | | Refer to the “Supplemental information” section and “Note 34 Related parties” in the “Financial information” section of our Annual Report 2013 for information on loans granted to current and former GEB members |
| | | | | | | | | | | | | | | | | | | | | | | | | | | | | | |
| | Share and option ownership/entitlements of GEB members on 31 December 2013/20121 | |
| | Name, function | | on
31 December | | | Number of
unvested
shares/
at risk2 | | | Number of vested shares | | | Total number of shares | | | Potentially
conferred voting
rights in % | | | Number of
options3 | | | Potentially
conferred voting
rights in %4 | |
| | Sergio P. Ermotti, | | | 2013 | | | | 453,460 | | | | 69,900 | | | | 523,360 | | | | 0.025 | | | | 0 | | | | 0.000 | |
| | Group Chief Executive Officer | | | 2012 | | | | 220,928 | | | | 41,960 | | | | 262,888 | | | | 0.013 | | | | 0 | | | | 0.000 | |
| | | | | | | | | | | | | | | | | | | | | | | | | | | | | | |
| | Markus U. Diethelm, | | | 2013 | | | | 542,417 | | | | 108,007 | | | | 650,424 | | | | 0.032 | | | | 0 | | | | 0.000 | |
| | Group General Counsel | | | 2012 | | | | 506,132 | | | | 126,098 | | | | 632,230 | | | | 0.030 | | | | 0 | | | | 0.000 | |
| | | | | | | | | | | | | | | | | | | | | | | | | | | | | | |
| | John A. Fraser, | | | 2013 | | | | 645,324 | | | | 268,945 | | | | 914,269 | | | | 0.044 | | | | 756,647 | | | | 0.037 | |
| | Chairman and CEO Global Asset Management | | | 2012 | | | | 617,529 | | | | 315,270 | | | | 932,799 | | | | 0.045 | | | | 884,531 | | | | 0.042 | |
| | | | | | | | | | | | | | | | | | | | | | | | | | | | | | |
| | Lukas Gähwiler, | | | 2013 | | | | 504,800 | | | | 22,727 | | | | 527,527 | | | | 0.026 | | | | 0 | | | | 0.000 | |
| | CEO UBS Switzerland and CEO Retail & Corporate | | | 2012 | | | | 412,199 | | | | 95,537 | | | | 507,736 | | | | 0.024 | | | | 0 | | | | 0.000 | |
| | | | | | | | | | | | | | | | | | | | | | | | | | | | | | |
| | Ulrich Körner, | | | 2013 | | | | 688,923 | | | | 208,887 | | | | 897,810 | | | | 0.044 | | | | 0 | | | | 0.000 | |
| | Group Chief Operating Officer and CEO UBS Group EMEA | | | 2012 | | | | 605,284 | | | | 121,837 | | | | 727,121 | | | | 0.035 | | | | 0 | | | | 0.000 | |
| | | | | | | | | | | | | | | | | | | | | | | | | | | | | | |
| | Philip J. Lofts, | | | 2013 | | | | 601,553 | | | | 157,447 | | | | 759,000 | | | | 0.037 | | | | 500,741 | | | | 0.024 | |
| | Group Chief Risk Officer | | | 2012 | | | | 542,402 | | | | 169,789 | | | | 712,191 | | | | 0.034 | | | | 536,173 | | | | 0.026 | |
| | | | | | | | | | | | | | | | | | | | | | | | | | | | | | |
| | Robert J. McCann, | | | 2013 | | | | 892,872 | | | | 65,971 | | | | 958,843 | | | | 0.046 | | | | 0 | | | | 0.000 | |
| | CEO Wealth Management Americas and CEO UBS Group Americas | | | 2012 | | | | 658,470 | | | | 18,112 | | | | 676,582 | | | | 0.032 | | | | 0 | | | | 0.000 | |
| | | | | | | | | | | | | | | | | | | | | | | | | | | | | | |
| | Tom Naratil, | | | 2013 | | | | 422,516 | | | | 263,027 | | | | 685,543 | | | | 0.033 | | | | 867,087 | | | | 0.042 | |
| | Group Chief Financial Officer | | | 2012 | | | | 340,757 | | | | 233,603 | | | | 574,360 | | | | 0.027 | | | | 935,291 | | | | 0.045 | |
| | | | | | | | | | | | | | | | | | | | | | | | | | | | | | |
| | Andrea Orcel, | | | 2013 | | | | 1,209,775 | | | | 0 | | | | 1,209,775 | | | | 0.059 | | | | 0 | | | | 0.000 | |
| | CEO Investment Bank | | | 2012 | | | | 1,755,691 | | | | 0 | | | | 1,755,691 | | | | 0.084 | | | | 0 | | | | 0.000 | |
| | | | | | | | | | | | | | | | | | | | | | | | | | | | | | |
| | Chi-Won Yoon, | | | 2013 | | | | 502,762 | | | | 441,143 | | | | 943,905 | | | | 0.046 | | | | 538,035 | | | | 0.026 | |
| | CEO UBS Group Asia Pacific | | | 2012 | | | | 478,986 | | | | 370,760 | | | | 849,746 | | | | 0.041 | | | | 578,338 | | | | 0.028 | |
| | | | | | | | | | | | | | | | | | | | | | | | | | | | | | |
| | Jürg Zeltner, | | | 2013 | | | | 624,415 | | | | 13,920 | | | | 638,335 | | | | 0.031 | | | | 203,093 | | | | 0.010 | |
| | CEO UBS Wealth Management | | | 2012 | | | | 522,500 | | | | 38,329 | | | | 560,829 | | | | 0.027 | | | | 203,093 | | | | 0.010 | |
| | | | | | | | | | | | | | | | | | | | | | | | | | | | | | |
| | | | | 2013 | | | | 7,088,817 | | | | 1,619,974 | | | | 8,708,791 | | | | 0.422 | | | | 2,865,603 | | | | 0.139 | |
| | Total | | | 2012 | | | | 6,660,878 | | | | 1,531,295 | | | | 8,192,173 | | | | 0.391 | | | | 3,137,426 | | | | 0.150 | |
| | | | | | | | | | | | | | | | | | | | | | | | | | | | | | |
| | 1 This table includes all vested and unvested shares and options of GEB members, including related parties. 2 Includes shares granted under variable compensation plans with forfeiture provisions. The actual number of shares vesting in the future will be calculated under the terms of the plans. Refer to the “Deferred variable compensation plans” section in this report for more information on the plans. 3 Refer to “Note 29 Equity participation and other compensation plans” in the “Financial information” section of our Annual Report 2013 for more information. 4 No conversion rights are outstanding. | |
Corporate governance, responsibility and compensation
Compensation
2013 compensation for the Board of Directors
Members of the Board of Directors (BoD) receive fixed fees for their services, of which 50% is paid in blocked UBS shares unless they elect to receive 100% in blocked UBS shares. The BoD members do not receive variable compensation. This reinforces their focus on long-term strategy, supervision and governance. It also helps them to remain independent of the firm’s senior management. The Chairman, as anon-independent BoD member, receives an annual base salary, UBS blocked shares and benefits in kind.
Chairman of the BoD
Our compensation framework provides for the Chairman of the BoD, Axel A. Weber, to receive an annual base salary of CHF 2 million and 200,000 UBS shares, blocked from distribution for four years, as well as benefits. The shares are not designed or intended as variable compensation. The value of the 200,000 UBS shares awarded for 2013 was CHF 3,720,000. Accordingly, his total compensation, including benefits and pension fund contributions for his services as Chairman from January to December 2013 was CHF 6,069,516.
This share component ensures that the Chairman’s pay is aligned with the longer-term performance of the firm. The Chairman’s employment agreement does not provide for special severance terms, including supplementary contributions to pension plans. Benefits for the Chairman are in line with local practices for other employees. Determining the Chairman’s compensation is the responsibility of the Human Resources and Compensation Committee (HRCC), which conducts an annual assessment and takes into consideration fee and/or compensation levels for comparable roles outside of UBS.
Given the continued improvements in our share price since the inception of our compensation framework for the chairman role in 2009, the HRCC has, in agreement with the Chairman, revisited the framework for 2014 and decided to limit the upside and cap the Chairman’s total compensation at the current level of CHF 5.7 million. Following market practice for company chairmen, we have implemented a pay mix shift where a larger part of the Chairman’s compensation will be paid in cash (currently foreseen to be approximately 60%). The balance of the overall compensation will be delivered in UBS shares which will continue to be blocked from distribution for four years.
Independent BoD members
With the exception of the Chairman, all BoD members are deemed to be independent directors and receive fixed base fees for their services, with 50% of their fees in cash and the other 50% in blocked UBS shares that are restricted from sale for four years. Alternatively, they may choose to have 100% of their remuneration paid in blocked UBS shares. In all
cases, the number of shares that independent directors are entitled to receive is calculated using a discount of 15% below the prevailing market price at the time of issuance. In addition to the base fee, independent BoD members receive fees known as committee retainers that reflect their workload in serving on the firm’s various board committees. The Senior Independent Director and the Vice Chairman of the BoD each receive an additional payment of CHF 250,000. In accordance with their role, independent BoD members do not receive performance awards, severance payments or benefits. Base fees, committee retainers and any other payments received by independent BoD members are subject to an annual review: a proposal is submitted by the Chairman of the BoD to the HRCC, which then submits a recommendation to the BoD for final approval.
The “Remuneration details and additional information for independent BoD members” table on the following page shows the remuneration received by independent BoD members between the 2013 and 2014 Annual General Meetings of Shareholders (AGM). Fees have remained unchanged during this period, and have been kept largely at the same level since 1998. Remuneration levels for BoD members, other than the Chairman, ranged from CHF 375,000 to CHF 1,075,000. Total remuneration for the independent BoD members for the period between the 2013 and 2014 AGMs was CHF 7.6 million, which was flat compared with the prior period.
In accordance with normal practice, two BoD members chose to receive 100% of their fees, less applicable deductions, in UBS shares.
Loans
Loans to independent members are made in the ordinary course of business at general market conditions. Loans to non-independent members are made in the ordinary course of business on substantially the same terms as those granted to other employees, including interest rates and collateral, and do not involve more than the normal risk of collectability or contain other unfavorable features.
| | è | | Refer to the “Supplemental information” section of this report and “Note 34 Related parties” in the “Financial information” section of our Annual Report 2013 for information on loans granted to current and former BoD members |
| | | | | | | | | | |
| | Total payments to BoD members | |
| | CHF, except where indicated1 | | For the year | | | Total | |
| | Aggregate of all BoD members | | | 2013 | | | | 13,694,516 | |
| | | | | | | | | | |
| | | | | 2012 | | | | 11,802,434 | |
| | 1 Local currencies are converted into CHF using the exchange rates as detailed in “Note 36 Currency translation rates” in the “Financial information” section of our Annual Report 2013. | |
|
Corporate governance, responsibility |
and compensation |
| | | | | | | | | | | | | | | | | | | | | | | | | | |
| | Compensation details and additional information for non-independent BoD members | |
| | CHF, except where indicated1 | | | | | | | | | | | | | | | | | | | | | | | | |
| | Name, function2 | | For the year | | | Base salary | | | Annual
share award | | | Benefits3 | | | Contributions
to retirement
benefit
plans4 | | | Total | |
| | Axel A. Weber, Chairman | | | 2013 | | | | 2,000,000 | | | | 3,720,000 | | | | 89,446 | | | | 260,070 | | | | 6,069,516 | |
| | | | | | | | | | | | | | | | | | | | | | | | | | |
| | | | | 2012 | | | | 1,322,581 | | | | 2,003,995 | 5 | | | 69,867 | | | | 171,898 | | | | 3,568,341 | |
| | | | | | | | | | | | | | | | | | | | | | | | | | |
| | Kaspar Villiger, former Chairman | | | 2013 | | | | – | | | | – | | | | – | | | | – | | | | – | |
| | | | | | | | | | | | | | | | | | | | | | | | | | |
| | | | | 2012 | | | | 354,167 | | | | 200,000 | 5 | | | 54,926 | | | | – | | | | 609,093 | |
| | | | | | | | | | | | | | | | | | | | | | | | | | |
| | 1 Local currencies are converted into CHF using the exchange rates as detailed in “Note 36 Currency translation rates” in the “Financial information” section of our Annual Report 2013. 2 Axel A. Weber was the only non-independent member in office on 31 December 2013 and on 31 December 2012 respectively. Kaspar Villiger did not stand for re-election at the AGM on 3 May 2012.3 Benefits in kind are all valued at market price. 4 This figure excludes the mandatory employer’s social security contributions, but includes the portion related to the employer’s contribution to the statutory pension scheme. The employee contribution is included in the base salary and annual incentive award components. 5 These shares are blocked for four years. | |
| | | | | | | | | | | | | | | | | | | | | | | | | | | | | | | | | | | | | | | | | | | | | | | | | | | | |
| | Remuneration details and additional information for independent BoD members |
| | CHF, except where indicated1 | | | | | | | | | | | | | | | | | | | | | | | | | | | | | | | | | | | | | | |
| | Name, function2 | | Audit
Committee | | | Human
Resources &
Compensation
Committee | | | Governance
& Nominating
Committee | | | Corporate
Responsibility
Committee | | | Risk
Committee | | | For the period
AGM to AGM | | | Base fee | | | Committee
retainer(s) | | | Additional
payments | | | Total | | | Share
percentage2 | | | Number
of
shares3,4 | | | |
| | Michel Demaré, | | | M | | | | M | | | | M | | | | | | | | | | | | 2013/2014 | | | | 325,000 | | | | 400,000 | | | | 250,000 | 6 | | | 975,000 | | | | 50 | | | | 30,834 | | | |
| | | | | | | | | | | | | | | | | | | | | | | | | | | | | | | | | | | | | | | | | | | | | | | | | | | | |
| | Vice Chairman | | | M | | | | | | | | M | | | | | | | | | | | | 2012/2013 | | | | 325,000 | | | | 300,000 | | | | 250,000 | 6 | | | 875,000 | | | | 50 | | | | 34,233 | | | |
| | | | | | | | | | | | | | | | | | | | | | | | | | | | | | | | | | | | | | | | | | | | | | | | | | | | |
| | David Sidwell, | | | | | | | | | | | M | | | | | | | | C | | | | 2013/2014 | | | | 325,000 | | | | 500,000 | | | | 250,000 | 6 | | | 1,075,000 | | | | 50 | | | | 33,997 | | | |
| | | | | | | | | | | | | | | | | | | | | | | | | | | | | | | | | | | | | | | | | | | | | | | | | | | | |
| | Senior Independent Director | | | | | | | | | | | M | | | | | | | | C | | | | 2012/2013 | | | | 325,000 | | | | 500,000 | | | | 250,000 | 6 | | | 1,075,000 | | | | 50 | | | | 42,057 | | | |
| | | | | | | | | | | | | | | | | | | | | | | | | | | | | | | | | | | | | | | | | | | | | | | | | | | | |
| | Reto Francioni, | | | | | | | | | | | | | | | M | | | | | | | | 2013/2014 | | | | 325,000 | | | | 50,000 | | | | | | | | 375,000 | | | | 50 | | | | 11,859 | | | |
| | | | | | | | | | | | | | | | | | | | | | | | | | | | | | | | | | | | | | | | | | | | | | | | | | | | |
| | member | | | | | | | | | | | | | | | | | | | | | | | 2012/2013 | | | | – | | | | – | | | | | | | | – | | | | – | | | | – | | | |
| | | | | | | | | | | | | | | | | | | | | | | | | | | | | | | | | | | | | | | | | | | | | | | | | | | | |
| | Rainer-Marc Frey, | | | | | | | M | | | | | | | | | | | | M | | | | 2013/2014 | | | | 325,000 | | | | 300,000 | | | | | | | | 625,000 | | | | 100 | | | | 37,394 | | | |
| | | | | | | | | | | | | | | | | | | | | | | | | | | | | | | | | | | | | | | | | | | | | | | | | | | | |
| | member | | | | | | | M | | | | | | | | | | | | M | | | | 2012/2013 | | | | 325,000 | | | | 300,000 | | | | | | | | 625,000 | | | | 100 | | | | 46,367 | | | |
| | | | | | | | | | | | | | | | | | | | | | | | | | | | | | | | | | | | | | | | | | | | | | | | | | | | |
| | Ann F. Godbehere, | | | M | | | | C | | | | | | | | | | | | | | | | 2013/2014 | | | | 325,000 | | | | 500,000 | | | | | | | | 825,000 | | | | 50 | | | | 26,091 | | | |
| | | | | | | | | | | | | | | | | | | | | | | | | | | | | | | | | | | | | | | | | | | | | | | | | | | | |
| | member | | | M | | | | C | | | | | | | | | | | | | | | | 2012/2013 | | | | 325,000 | | | | 500,000 | | | | | | | | 825,000 | | | | 50 | | | | 32,276 | | | |
| | | | | | | | | | | | | | | | | | | | | | | | | | | | | | | | | | | | | | | | | | | | | | | | | | | | |
| | Axel P. Lehmann, | | | | | | | | | | | | | | | | | | | M | | | | 2013/2014 | | | | 325,000 | | | | 200,000 | | | | | | | | 525,000 | | | | 100 | | | | 31,403 | | | |
| | | | | | | | | | | | | | | | | | | | | | | | | | | | | | | | | | | | | | | | | | | | | | | | | | | | |
| | member | | | | | | | | | | | M | | | | | | | | M | | | | 2012/2013 | | | | 325,000 | | | | 300,000 | | | | | | | | 625,000 | | | | 100 | | | | 46,367 | | | |
| | | | | | | | | | | | | | | | | | | | | | | | | | | | | | | | | | | | | | | | | | | | | | | | | | | | |
| | Wolfgang Mayrhuber, | | | | | | | | | | | | | | | | | | | | | | | 2013/2014 | | | | – | | | | – | | | | | | | | – | | | | – | | | | – | | | |
| | | | | | | | | | | | | | | | | | | | | | | | | | | | | | | | | | | | | | | | | | | | | | | | | | | | |
| | former member | | | | | | | M | | | | | | | | C | | | | | | | | 2012/2013 | | | | 325,000 | | | | 200,000 | | | | | | | | 525,000 | | | | 50 | | | | 20,539 | | | |
| | | | | | | | | | | | | | | | | | | | | | | | | | | | | | | | | | | | | | | | | | | | | | | | | | | | |
| | Helmut Panke, | | | | | | | M | | | | | | | | | | | | M | | | | 2013/2014 | | | | 325,000 | | | | 300,000 | | | | | | | | 625,000 | | | | 50 | | | | 19,765 | | | |
| | | | | | | | | | | | | | | | | | | | | | | | | | | | | | | | | | | | | | | | | | | | | | | | | | | | |
| | member | | | | | | | M | | | | | | | | | | | | M | | | | 2012/2013 | | | | 325,000 | | | | 300,000 | | | | | | | | 625,000 | | | | 50 | | | | 24,452 | | | |
| | | | | | | | | | | | | | | | | | | | | | | | | | | | | | | | | | | | | | | | | | | | | | | | | | | | |
| | William G. Parrett, | | | C | | | | | | | | | | | | M | | | | | | | | 2013/2014 | | | | 325,000 | | | | 350,000 | | | | | | | | 675,000 | | | | 50 | | | | 21,347 | | | |
| | | | | | | | | | | | | | | | | | | | | | | | | | | | | | | | | | | | | | | | | | | | | | | | | | | | |
| | member | | | C | | | | | | | | | | | | M | | | | | | | | 2012/2013 | | | | 325,000 | | | | 350,000 | | | | | | | | 675,000 | | | | 50 | | | | 26,408 | | | |
| | | | | | | | | | | | | | | | | | | | | | | | | | | | | | | | | | | | | | | | | | | | | | | | | | | | |
| | Isabelle Romy, | | | M | | | | | | | | M | | | | | | | | | | | | 2013/2014 | | | | 325,000 | | | | 300,000 | | | | | | | | 625,000 | | | | 50 | | | | 19,765 | | | |
| | | | | | | | | | | | | | | | | | | | | | | | | | | | | | | | | | | | | | | | | | | | | | | | | | | | |
| | member | | | M | | | | | | | | M | | | | | | | | | | | | 2012/2013 | | | | 325,000 | | | | 300,000 | | | | | | | | 625,000 | | | | 50 | | | | 24,452 | | | |
| | | | | | | | | | | | | | | | | | | | | | | | | | | | | | | | | | | | | | | | | | | | | | | | | | | | |
| | Beatrice Weder di Mauro, | | | M | | | | | | | | | | | | | | | | M | | | | 2013/2014 | | | | 325,000 | | | | 400,000 | | | | | | | | 725,000 | | | | 50 | | | | 22,928 | | | |
| | | | | | | | | | | | | | | | | | | | | | | | | | | | | | | | | | | | | | | | | | | | | | | | | | | | |
| | member | | | M | | | | | | | | | | | | M | | | | | | | | 2012/2013 | | | | 325,000 | | | | 250,000 | | | | | | | | 575,000 | | | | 50 | | | | 22,496 | | | |
| | | | | | | | | | | | | | | | | | | | | | | | | | | | | | | | | | | | | | | | | | | | | | | | | | | | |
| | Joseph Yam, | | | | | | | | | | | | | | | M | | | | M | | | | 2013/2014 | | | | 325,000 | | | | 250,000 | | | | | | | | 575,000 | | | | 50 | | | | 18,184 | | | |
| | | | | | | | | | | | | | | | | | | | | | | | | | | | | | | | | | | | | | | | | | | | | | | | | | | | |
| | member | | | | | | | | | | | | | | | M | | | | M | | | | 2012/2013 | | | | 325,000 | | | | 250,000 | | | | | | | | 575,000 | | | | 50 | | | | 22,496 | | | |
| | | | | | | | | | | | | | | | | | | | | | | | | | | | | | | | | | | | | | | | | | | | | | | | | | | | |
| | Total 2013 | | | | | | | | | | | | | | | | | | | | | | | | | | | | | | | | | | | | | | | 7,625,000 | | | | | | | | | | | |
| | | | | | | | | | | | | | | | | | | | | | | | | | | | | | | | | | | | | | | | | | | | | | | | | | | | |
| | Total 2012 | | | | | | | | | | | | | | | | | | | | | | | | | | | | | | | | | | | | | | | 7,625,000 | | | | | | | | | | | |
| | | | | | | | | | | | | | | | | | | | | | | | | | | | | | | | | | | | | | | | | | | | | | | | | | | | |
| | Legend:C = Chairperson of the respective Committee, M = Member of the respective Committee | | | | | | | | | | | | | | | | | | | |
| | 1 Local currencies are converted into CHF using the exchange rates as detailed in “Note 36 Currency translation rates” in the “Financial information” section of our Annual Report 2013. 2 There were 11 independent BoD members in office on 31 December 2013. Reto Francioni was appointed at the AGM on 2 May 2013 and Wolfgang Mayrhuber did not stand for re-election at the AGM on 2 May 2013. There were 11 independent BoD members in office on 31 December 2012. Isabelle Romy and Beatrice Weder di Mauro were appointed at the AGM on 3 May 2012 and Bruno Gehrig did not stand for re-election at the AGM on 3 May 2012. 3 Fees are paid 50% in cash and 50% in blocked UBS shares. However, independent BoD members can elect to have 100% of their remuneration paid in blocked UBS shares. 4 For 2013, shares valued at CHF 18.60 (average price of UBS shares at SIX Swiss Exchange over the last 10 trading days of February 2014), and were granted with a price discount of 15% for a new value of CHF 15.81. These shares are blocked for four years. For 2012, shares valued at CHF 15.03 (average price of UBS shares at SIX Swiss Exchange over the last 10 trading days of February 2013), and were granted with a price discount of 15% for a new value of CHF 12.78. These shares are blocked for four years. 5 Number of shares is reduced in case of the 100% election to deduct social security contributions. All remuneration payments are subject to social security contributions/withholding tax. 6 This payment is associated with the Vice Chairman or the Senior Independent Director function, respectively. |
Corporate governance, responsibility and compensation
Compensation
Our compensation model for employees other than GEB members
The elements that make up total compensation consist of a base salary and a performance award. The performance award may comprise a shorter-term immediate cash performance award as well as a longer-term performance award which is deferred into UBS notional shares and UBS notional bonds. Furthermore, pension contributions and benefits are paid in line with local practices.
Base salary
The base salary reflects the skills, role and experience of an employee as well as local market practices. It is fixed and usually paid monthly or semi-monthly. Between 2011 and 2013 we made only limited salary increases. We have determined to bring salaries in line with the market, although this will vary greatly between functions and locations. With effect from March 2014, base salaries were increased by a total of CHF 157 million, an increase of 2.5%. This return to healthy increases, reflective of competitive trends, supports our position in the market on salaries. Nonetheless, increases will continue to be focused on those who were promoted, are considered to be high contributors, or who delivered a very strong performance or took on increased responsibilities. This practice is broadly in line with developments in the industry as a whole. As a firm, we focus on total compensation. For example, 2014 performance award pools will consider salary increases granted earlier in the year. We will continue to review salaries and performance awards in light of market developments, performance, affordability and our commitment to deliver sustainable returns to our shareholders.
Pensions, benefits and employee share purchase program
We offer certain benefits such as health insurance and retirement benefits. These benefits vary depending on the location, but are competitive within each of the markets in which we operate.
While pension contributions and pension plans vary across locations and countries in accordance with local requirements and market practice, pension plan rules in any one location are generally the same for all employees in that location, including management.
Our employee share purchase program, the Equity Plus Plan, allows employees to contribute up to 30% of their base salary and/or up to
35% of their performance award toward the purchase of UBS shares. All employees below the rank of Managing Director are eligible to participate. Employees can purchase UBS shares at market price and they receive one matching share for free for every three purchased through the program. Shares purchased under the Equity Plus Plan are generally restricted from disposal for a maximum of three years from the time of purchase. The matching shares vest after three years, with vesting being subject to continued employment with the firm.
| | è | | Refer to “Note 28 Pension and otherpost-employment benefit plans” in the “Financial information” section of our Annual Report 2013 for more information on the various majorpost-employment benefit plans established in Switzerland and other countries |
Performance award
Most of our regular employees are considered for an annual discretionary performance award. The level of performance award depends on the firm’s overall performance, the performance of the employee’s business division, and the individual’s performance, and is at the complete discretion of the firm.
For 2013, reflecting the improved performance of the firm, the performance award for employees across the Group was on average approximately 52% of the base salary (2012: 37%).
Benchmarking
Given the diversity of our businesses, the companies we use as benchmarks vary with, and are dependent on, the relevant business divisions and locations, as well as the nature of the positions involved. For certain businesses or positions, we may take into account other major international banks, additional large Swiss private banks, private equity firms, hedge funds and non-financial firms. Furthermore, we also benchmark employee compensation internally for comparable roles within and across business divisions and locations.
Compensation elements
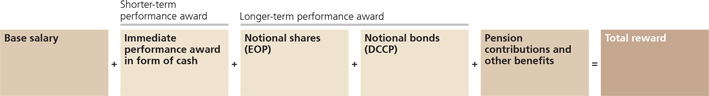
|
Corporate governance, responsibility |
and compensation |
Deferral of performance awards
To help ensure our employees are focused on the longer-term profitability of the firm, we require that a significant part of their performance award be deferred for up to five years if their total compensation exceeds CHF/USD 300,000, an increase from CHF/USD 250,000 in 2012. This increase, together with the introduction of graduated deferral rates, aligns our deferral levels closer to the market. For participants in our deferral schemes at the highest levels of compensation, the effective deferral rate has been increased, while for others at lower levels of compensation it has been decreased. The deferral increases at higher marginal rates in line with the value of the performance award, with the lowest deferral rate set at 40% of the performance award and the highest rate at 75%, compared to the previously flat rate of 60%. In addition, the portion paid out in immediate cash is capped at CHF/USD 1 million. Any immediate cash award in excess of the CHF/USD 1 million cap is deferred as notional shares under the Equity Ownership Plan (EOP). The effective deferral rate therefore depends on the value of the performance award and the value of the total compensation.
Of the deferred annual performance award, 60% is deferred in UBS notional shares under the EOP and the remaining 40% is deferred in notional bonds under the Deferred Contingent Capital Plan (DCCP). Global Asset Management employees receive 75% of their deferred performance awards in notional funds under the EOP and the remaining 25% under the DCCP. The average deferral period of the deferred awards for employees below GEB level for 2013 was 3.5 years.
| | è | | Refer to the “Our deferred variable compensation plans” section of this report for more information about the terms of our deferred variable compensation plans, including the forfeiture provisions to which they are subject, and the terms applicable to Global Asset Management employees |
| | è | | Refer to “Note 29 Equity participation and other compensation plans” in the “Financial information” section of our Annual Report 2013 for more information on specific local plans with deferral provisions that differ from those described here |
The illustration below provides an overview of how we determine an individual performance award and the governance and oversight processes conducted by senior management and the HRCC as part of that process.
Determination of individual performance award
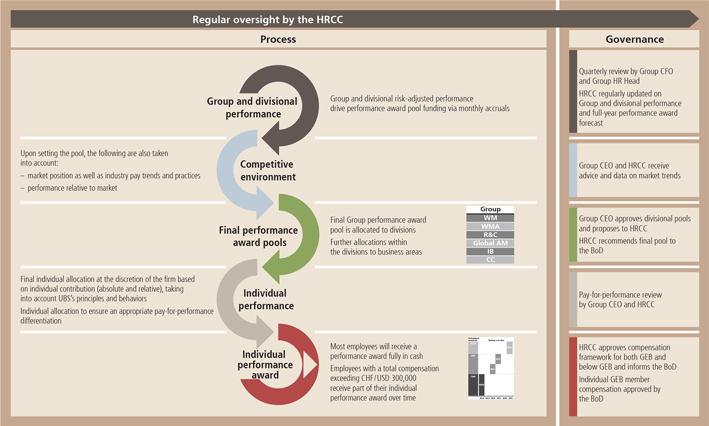
Corporate governance, responsibility and compensation
Compensation
Other variable compensation components
To support hiring or retention, particularly at senior levels, we may offer certain incentives separate from the annual performance awards. These include the following:
| – | | Replacement payments to compensate employees for deferred awards forfeited as a result of joining UBS. Such payments are prevailing industry practice and are often necessary to attract senior candidates who generally have a significant portion of their awards deferred at their current employer and where continued employment is required to avoid forfeiture. |
| – | | Retention payments made to key employees to induce them to stay, particularly during critical periods for the firm. |
| – | | On a very limited basis, guarantees may be required to attract individuals with certain skills and experience. These awards, which are fixed incentives to which our standard deferral applies, are paid regardless of future events, but are limited to the first performance year. |
| – | | Sign-on payments that may be offered to employees hired late in the year to replace performance awards that they would have earned at their current employer but have forfeited by joining UBS. In addition, in very limited circumstances, certain candidates may be offered sign-on payments to increase the chances of their accepting an offer. |
| – | | Severance payments made to employees in redundancy cases when asked to leave as part of a reduction in the workforce. These are governed by location-specific severance policies. At a minimum, we offer severance terms which comply with the applicable local laws (“legally obligated severance”). In certain locations, we may provide severance packages that are negotiated with our local social partners |
| | that go beyond these minimum legal requirements (“standard severance”). In addition, we may make severance payments that exceed legally obligated or standard severance payments (“supplemental severance”) where we believe that they are aligned with market practice and appropriate under the circumstances. |
Compensation for financial advisors in Wealth Management Americas
In line with market practice for US brokerage businesses, the compensation system for financial advisors in Wealth Management Americas is based on production payout and awards. Production payout, paid monthly, is primarily based on revenue generated. Advisors may also qualify for year-end awards, most of which are deferred for between six and 10 years. The awards are based on strategic performance measures which may include production, length of service, net new money brought in, and/or production related to advisory fees and financial planning. Production payout rates and awards may be reduced if financial advisors make repeated or significant transaction errors and/or demonstrate negligence or carelessness or otherwise fail to comply with the firm’s rules, standards, practices and policies and/or applicable law.
Key Risk Takers
Identifying Key Risk Takers is important to ensure we incentivize only appropriate risk-taking. Key Risk Takers are defined as those employees who can materially set, commit or control significant amounts of the firm’s resources and/or exert significant influence over its risk profile. This includes employees who work in front office roles, logistics and control functions. We currently have 543
| | | | | | | | | | | | | | | | | | | | | | | | | | | | | | |
| | Fixed and variable compensation for Key Risk Takers1 | | | | | | | | | | | | | | | | | | | | | | | | | |
| | | | | Total for the year
ended 2013 | | | Not deferred | | | Deferred2 | | | Total for the year
ended 20123 | |
| | CHF million, except where indicated | | Amount | | | % | | | Amount | | | % | | | Amount | | | % | | | Amount | |
| | Total compensation | | | | | | | | | | | | | | | | | | | | | | | | | | | | |
| | Amount | | | 1,041 | | | | 100 | | | | 449 | | | | 43 | | | | 591 | | | | 57 | | | | 790 | |
| | Number of beneficiaries | | | 543 | | | | | | | | | | | | | | | | | | | | | | | | 501 | |
| | Fixed compensation | | | | | | | | | | | | | | | | | | | | | | | | | | | | |
| | Base salary | | | 235 | | | | 23 | | | | 235 | | | | 100 | | | | 0 | | | | 0 | | | | 218 | |
| | Variable compensation | | | 806 | | | | 77 | | | | 214 | | | | 27 | | | | 591 | | | | 73 | | | | 572 | |
1 Includes employees with a performance award exceeding CHF/USD 2 million (Highly Paid Employees). 2 This is based on the specific plan vesting and reflects the total award value at grant which may differ from the accounting expenses.3 Year 2012 as reported in our Annual Report 2012.
|
Corporate governance, responsibility |
and compensation |
individuals classified as Key Risk Takers. We also include employees with a performance award exceeding CHF/USD 2 million (Highly Paid Employees) in this category if they have not already been identified as Key Risk Takers. All 11 GEB members are Key Risk Takers, and their compensation is disclosed separately in this report.
Key Risk Takers identified at the beginning of the performance year are subject to a performance evaluation by the control functions. Since the performance year 2010, the vesting of their deferred awards has been contingent on meeting Group and/or divisional performance conditions. Like all other employees, Key Risk Takers also are subject to forfeiture or reduction of the deferred portion of their compensation if they commit harmful acts.
The same compensation measures apply to all Group Managing Directors (GMDs), regardless of whether they are classified as Key Risk Takers or not. GMDs receive part of their annual performance award under the EOP and the DCCP, with the vesting of their deferred EOP awards contingent on the same performance conditions to which Key Risk Takers are subject.
Although most Key Risk Takers are subject to higher marginal deferral rates under the new graduated deferral scheme, all Key Risk Takers are subject to the mandatory deferral of at least 50% of their performance award which applies regardless of whether or not the UBS deferral threshold has been met, in order to comply with regulatory requirements.
We believe that we comply fully with the relevant Swiss Financial Market Supervisory Authority (FINMA) requirements regarding risk takers, and we also consult with our other key regulators on the topic.
UK Code Staff
In accordance with guidance from the UK Prudential Regulation Authority (PRA) and Financial Conduct Authority (FCA), we have identified 156 employees, consisting of senior management and employees whose professional activities could have a material impact on the firm’s risk profile in the UK, as so-called “UK Code Staff.” Compensation measures that apply to UK Code Staff are generally similar to those applied to Key Risk Takers. However, due to specific UK PRA/FCA requirements, 50% of UK Code Staff performance awards that are paid out immediately are delivered in UBS shares, which are blocked for six months. In addition, any notional shares granted to UK Code Staff under the EOP for their performance in 2013 will be subject to an additional six-month blocking period upon vesting.
Control functions and Group Internal Audit
To monitor risk effectively, our control functions, Risk Control (including Compliance), Finance and Legal, must be independent. To support this, their compensation is determined independently from the revenue producers that they oversee, supervise or support. Their performance award pool is not based on the performance of these businesses, but instead reflects the performance of the firm as a whole. In addition, we consider other factors such as how well the function has performed, together with our market positioning. Decisions regarding individual compensation for the senior managers of the control functions are made by the function heads and approved by the Group CEO. Decisions regarding individual compensation within Group Internal Audit (GIA) are made by the Head of GIA and approved by the Chairman. The compensation for the Head of GIA is approved by the HRCC.
| | | | | | | | | | | | | | | | | | | | | | | | | | |
| | | Sign-on payments, replacement payments, severance payments and guarantees | |
| | | | Total
2013 | | | Of which expenses
recognized in 20133 | | | Of which expenses to be recognized in
2014 and later | | | Total
20124 | | | Number of beneficiaries | |
| | CHF million, except where indicated | | | | | | 2013 | | | 20124 | |
| | Total sign-on payments | | | 18 | | | | 9 | | | | 8 | | | | 17 | | | | 165 | | | | 182 | |
| | | |
| | of which GEB members | | | 0 | | | | 0 | | | | 0 | | | | 0 | | | | 0 | | | | 0 | |
| | | |
| | of which Key Risk Takers1 | | | 9 | | | | 3 | | | | 6 | | | | 4 | | | | 7 | | | | 5 | |
| | | |
| | Total replacement payments | | | 67 | | | | 3 | | | | 63 | | | | 96 | | | | 209 | | | | 203 | |
| | | |
| | of which GEB members | | | 0 | | | | 0 | | | | 0 | | | | 25 | | | | 0 | | | | 1 | |
| | | |
| | of which Key Risk Takers1 | | | 30 | | | | 1 | | | | 29 | | | | 32 | | | | 15 | | | | 16 | |
| | | | | | | | | | | | | | | | | | | | | | | | | | |
| | Total guarantees | | | 34 | | | | 14 | | | | 21 | | | | 40 | | | | 52 | | | | 68 | |
| | | | | | | | | | | | | | | | | | | | | | | | | | |
| | of which GEB members | | | 0 | | | | 0 | | | | 0 | | | | 0 | | | | 0 | | | | 0 | |
| | | | | | | | | | | | | | | | | | | | | | | | | | |
| | of which Key Risk Takers1 | | | 15 | | | | 5 | | | | 10 | | | | 20 | | | | 7 | | | | 10 | |
| | | | | | | | | | | | | | | | | | | | | | | | | | |
| | Total severance payments2 | | | 138 | | | | 129 | | | | 9 | | | | 319 | | | | 2,291 | | | | 2,321 | |
| | | | | | | | | | | | | | | | | | | | | | | | | | |
| | of which GEB members | | | 0 | | | | 0 | | | | 0 | | | | 0 | | | | 0 | | | | 0 | |
| | | | | | | | | | | | | | | | | | | | | | | | | | |
| | of which Key Risk Takers1 | | | 2 | | | | 1 | | | | 1 | | | | 0.2 | | | | 2 | | | | 1 | |
| | 1 Expenses for Key Risk Takers is the full-year amount for individuals in office on 31 December 2013. Key Risk Takers include employees with a performance award exceeding CHF/USD 2 million or more (Highly Paid Employees). 2 Severance payments include legally obligated and standard severance, as well as supplemental severance payments of CHF 24 million. 3 Expenses before post vesting transfer restrictions. 4 Year 2012 as reported in Annual Report 2012. | |
Corporate governance, responsibility and compensation
Compensation
Our deferred variable compensation plans for 2013
To ensure our employees’ and stakeholders’ interests are aligned, we grant part of our performance awards in UBS notional shares and UBS notional bonds. To help ensure our employees are focused on the medium-andlonger-term profitability of the firm, all variable compensation plans require a significant part of an employee’s performance award above a total compensation threshold to be deferred for up to five years and include forfeiture provisions. Compensation is closely linked to longer-term sustainable performance. All our variable compensation plans feature performance conditions.
Equity Ownership Plan (EOP)
The EOP is a mandatory deferral plan for all employees with total compensation greater than CHF/USD 300,000. These employees receive at least 60% of their deferred performance award under the EOP in notional shares and are eligible to receive reinvested dividend equivalents. EOP awards granted to Global Asset Management employees have a different vesting schedule and deferral mix, as shown in the table below, and are granted as cash-settled notional funds. For 2013, approximately 5,300 employees received EOP awards. EOP awards are granted annually.
The plan includes provisions that enable the firm to trigger forfeiture of some, or all, of the unvested deferred portion if an employee commits certain harmful acts or in most cases of terminated employment.
The vesting of an EOP award granted to GEB members, GMDs and Key Risk Takers (including Highly Paid Employees) depends on both Group and divisional performance. Group performance is measured by the average adjusted Group return on tangible equity (RoTE). Divisional performance is measured by the average adjusted divisional return on attributed equity (RoAE). For Corporate Center employees, it is measured by the
Overview of our deferred compensation plans
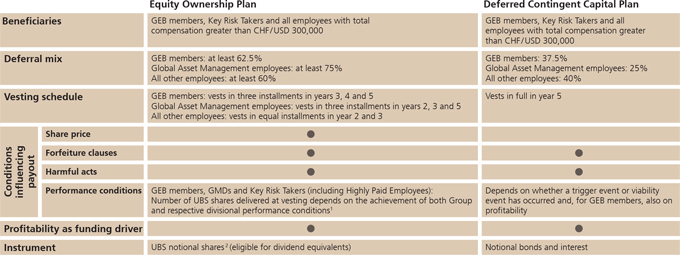
1 Includes Global Asset Management employees who are GMDs, Key Risk Takers (including Highly Paid Employees).2 Notional funds for Global Asset Management employees.
|
Corporate governance, responsibility |
and compensation |
average of the RoAE for all business divisions excluding the Corporate Center (“Continuing Businesses RoAE”). By linking the vesting of EOP awards with a return on equity over a two-to five-year time horizon, we focus our employees on developing and managing the business in a way that delivers sustainable returns. We believe that Group RoTE provides a more consistent basis to measure performance than the Group’s return on shareholders’ equity (RoE), which also includes goodwill and intangibles.
The Group’s published RoE targets can be converted into RoTE targets by deducting the current balance of goodwill and intangibles from the Group’s total equity base, resulting in an adjusted RoTE approximately 1 to 2 percentage points higher than our adjusted RoE of 8.3%. Our 2015 RoE target of 15% or greater is the equivalent of RoTE of 17% or greater, calculated based on our estimated tangible equity. However, given elevated operational risk RWA, we may not achieve this target until 2016. The threshold for the Group RoTE has been increased for the 2014 performance year to 8% from 6%, and takes into consideration the continued financial effects of restructuring.
Return on tangible equity – comparison with EOP performance thresholds
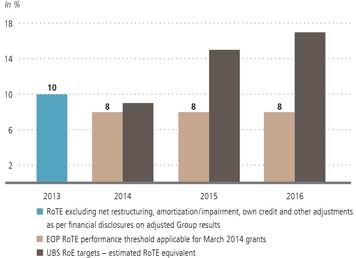
Corporate governance, responsibility and compensation
Compensation
If the average adjusted Group RoTE achieved is equal to or above the 8% threshold, the EOP award will vest in full, subject to the relevant business divisional threshold also being met. If the Group RoTE is 0% or negative, the installment will be fully forfeited for the entire firm regardless of any division’s particular performance. If the average adjusted Group RoTE falls between 0% and 8%, the award will vest on a linear basis between 0% and 100%, again subject to the relevant business divisional threshold being met.
The purpose of the business divisional threshold is to reduce the amount of the EOP award that vests for any business division that does not meet its performance target. Therefore, if the business divisional
return on attributable equity (RoAE) threshold (see table below) is met, no adjustment is made to the EOP award. If, however, the RoAE falls below the threshold but is above 0% for any business division, the award will be partially forfeited. The extent of the forfeiture depends on how much the actual RoAE falls below the threshold for that business division, and can be up to 40%. If the actual RoAE for a business division is 0% or negative, the installment will be fully forfeited for that business division. The HRCC assesses the achievement of the performance conditions.
The example below shows how we determine the percentage vesting.
Performance conditions for EOP awards granted in February 2014
| | | | | | | | |
| | | Installment vesting after | | | Applicable performance period | |
| GEB | | | 3 years | | | | 2014, 2015 and 2016 | |
| | | 4 years | | | | 2015, 2016 and 2017 | |
| | | 5 years | | | | 2016, 2017 and 2018 | |
| | | | | | | | | |
| GMDs and Key Risk Takers (including Highly Paid Employees) | | | 2 years | | | | 2014 and 2015 | |
| | | 3 years | | | | 2014, 2015 and 2016 | |
| | | | | | | | | |
Group RoTE threshold | | | | | | | | |
| Group RoTE threshold | | | | | | | ³ 8 | % |
| | | | | | | | | |
Business divisional RoAE thresholds (or, for Corporate Center employees, Continuing Businesses RoAE threshold)
| | | | |
| Wealth Management | | ³ | 50 | % |
| Wealth Management Americas | | ³ | 22.5 | % |
| Retail & Corporate | | ³ | 17.5 | % |
| Global Asset Management | | ³ | 25 | % |
| Investment Bank | | ³ | 15 | % |
| Corporate Center | | ³ | 20 | % |
| | | | | |
EOP performance conditions for GEB members, GMDs and Key Risk Takers (including Highly Paid Employees)
|
Corporate governance, responsibility |
and compensation |
Deferred Contingent Capital Plan (DCCP)
The DCCP is a mandatory deferral plan for all employees with total compensation greater than CHF/USD 300,000. Such employees receive 40% of their deferred performance award under the DCCP, with the exception of Global Asset Management employees, who receive 25% of their deferred performance awards under the plan. For 2013, approximately 5,300 employees received DCCP awards. DCCP awards are granted annually.
Employees are awarded notional bonds with annual interest payments. UBS will only pay interest for the performance years in which the firm generates an adjusted Group profit before tax. For years in which UBS does not achieve an adjusted Group profit before tax, no notional interest will be paid. The notional interest rate is 5.125% for awards denominated in US dollars and 3.500% for awards denominated in Swiss francs. These interest rates are based on the most recent issuance of our low-trigger loss-absorbing capital (February 2014 denominated in euros with a coupon of 4.75%) adjusted for differences in currency and tenor.
Awards vest in full after five years subject to there being no trigger event. Awards granted under the DCCP forfeit if our phase-in common
equity tier 1 (CET1) capital ratio falls below 10% for GEB members and 7% for all other employees. This writedown threshold is higher than the 5% for public holders of our low-trigger loss-absorbing capital notes. In addition, awards are also forfeited if a viability event occurs, that is, if FINMA provides a written notice to UBS that the DCCP must be written down to prevent the insolvency, bankruptcy or failure of UBS, or if UBS receives a commitment of extraordinary support from the public sector that is necessary to prevent such an event. For GEB members, an additional performance condition applies. If UBS does not achieve an adjusted profit before tax for any year during the vesting period, GEB members forfeit 20% of their award for each loss-making year.
The plan includes provisions that enable the firm to trigger forfeiture of some, or all, of the unvested deferred portion if an employee commits certain harmful acts or in most cases of terminated employment.
| | è | | Refer to “Performance awards granted for the 2013 performance year,” “ Performance award expenses in the 2013 performance year” and “ Total personnel expenses for 2013” in the “Supplemental information” section of this report for more information |
| | è | | Refer to “Vesting of outstanding awards granted in prior years impacted by performance conditions” and “Discontinued plans” section of this report for more information on past awards |
Corporate governance, responsibility and compensation
Compensation
Our Total Reward Principles and compensation governance
The Human Resources and Compensation Committee (HRCC) takes into account the philosophy and objectives embodied in our Total Reward Principles. These influence how we structure compensation and provide funding for our performance award pool. They reflect our focus on pay for performance, sustainable profitability, sound governance and risk awareness, and support the firm’s strategy by promoting and rewarding behavior that enhances the firm’s position and reputation. Compensation should help foster a sense of engagement among employees and serve to align their long-term interests with those of clients and shareholders. Our Total Reward Principles were reviewed most recently by the HRCC on 30 August 2013.
We must clearly link pay with performance. To maintain this link, the key performance indicators we use to measure our progress in executing our strategy are taken into account when determining the size of each divisional performance award pool and are used as a basis for setting the performance conditions of our compensation plans. A balanced mix of fixed and variable compensation ensures appropriate risk-taking and behavior that produces sustainable business results.
Overview of HRCC’s governance
Ensuring we have strong governance and oversight of our compensation process is the responsibility of the HRCC. The HRCC is a committee of the Board of Directors (BoD) and consists of four independent BoD members. On 31 December 2013, the HRCC members were Ann F. Godbehere, who chairs the committee, Michel Demaré, Rainer-Marc Frey and Helmut Panke.
Among its other responsibilities, the HRCC, on behalf of the BoD
| – | | reviews our Total Reward Principles |
| – | | reviews and approves annually the design of the total compensation framework, including compensation programs and plans |
| – | | reviews performance award funding throughout the year and proposes the final performance award pool to the BoD for approval |
| – | | together with the Group CEO, proposes base salaries and annual performance awards for other GEB members to the BoD, which approves the total compensation of the GEB |
| – | | together with the Chairman of the BoD, proposes the compensation for the Group CEO |
| – | | approves the total compensation for the Chairman of the BoD |
| – | | together with the Chairman, proposes the total individual compensation for independent BoD members for approval by the BoD |
Total Reward Principles
The four Total Reward Principles establish a framework for managing performance and integrating risk control. They also specify how we structure compensation and provide necessary funding for our performance award pool. These principles apply to all employees, but may vary in certain locations due to local laws and regulations.

|
Corporate governance, responsibility |
and compensation |
The Group CEO and the Chairman of the BoD may not attend any parts of committee meetings when specific decisions are made about their own individual compensation. These decisions are at the discretion of the HRCC and the BoD. Base fees and committee retainers received by independent BoD members are subject to an annual review. A proposal is submitted by the Chairman of the BoD to the HRCC, which then submits a recommendation to the BoD. The BoD has the ultimate responsibility for approving the compensation strategy proposed by the HRCC.
The HRCC held seven meetings and five calls in 2013 with an average attendance of 94%. The HRCC reappointed Hostettler, Kramarsch & Partner to provide impartial external advice on compensation-related matters. The company has no other mandates with UBS. Compensation consulting firm Towers Watson, appointed by Group Human Resources, continued to provide the HRCC with data on market trends and benchmarks, including in relation to GEB and BoD compensation. Various subsidiaries of Towers Watson provide similar data to Group Human Resources in relation to compensation at lower levels of the organization. Towers Watson has no other compensation-related mandates with UBS.
The Risk Committee’s role in compensation
We are engaged in a risk management business and our success depends on prudent risk-taking. We will not tolerate inappropriate behavior that can harm the firm, its reputation or the interests of our many stakeholders. The Risk Committee, another BoD committee, works closely with the HRCC to ensure our approach to compensation reflects risk management and control. The Risk Committee supervises and sets appropriate risk management and control principles and receives regular briefings on how risk is factored into the compensation process. It also monitors Risk Control’s involvement in compensation and reviews risk-related aspects of the compensation process.
| | è | | Refer to our corporate governance website at www.ubs.com/corporate-governance for more information |
Compensation authorities
The BoD has the ultimate responsibility for approving the compensation strategy proposed by the HRCC, a BoD committee that determines the appropriate level of resources for compensation matters.
| | | | | | |
| Recipients | | Compensation recommendations developed by | | Approved by | | Communicated by |
Chairman of the BoD | | Chairperson of the HRCC | | HRCC | | HRCC |
Independent BoD members (remuneration system and fees) | | Chairman of the BoD and HRCC | | BoD | | Chairman of the BoD |
| | | | | | |
Group CEO | | Chairman of the BoD and HRCC | | BoD | | Chairman of the BoD |
| | | | | | | |
Other GEB members | | HRCC and Group CEO | | BoD | | Group CEO |
| | | | | | | |
| | | | | | |
| Key Risk Takers | | Responsible GEB member together with functional management team | | Divisional pools: HRCC
Overall pool: BoD | | Line manager |
| | | | | | |
| Recipients | | Variable compensation recommendations developed by | | Approved by | | Communicated by |
| Employees | | Responsible GEB member together with functional management team | | Divisional pools: HRCC Overall pool: BoD | | Line manager |
Corporate governance, responsibility and compensation
Compensation
Supplemental information
This section provides an overview and further context regarding our compensation strategy and framework. It also provides further information required to comply with statutory disclosure requirements.
Performance awards granted for the 2013 performance year
The “Total variable compensation” table shows the amount of variable compensation awarded to employees for the performance year 2013, together with the number of beneficiaries for each type of award granted. We define variable compensation as the discretionary, performance-based award pool for the given year. In the case of deferred awards, the final amount paid to an employee is dependent on performance conditions to which parts of these awards are subject and consideration of relevant forfeiture provisions. The deferred share award amount is based on the fair value of these awards on the date of grant.
The “Deferred compensation” table on the following page shows the current intrinsic value of unvested outstanding deferred variable compensation awards subject to ex-post adjustments. For share-based plans, the intrinsic value is determined based on the closing share price on 30 December 2013. For notional funds, it is determined using the latest available market price for the underlying funds at year-end 2013, and for deferred cash plans, it is determined based on the outstanding
amount of cash owed to award recipients. All awards made under our deferred variable compensation plans listed in the “Deferred compensation” table are subject to ex-post adjustments, whether implicitly, through exposure to share price movements, or explicitly, for example, through forfeitures instigated by the firm. Accordingly, their value can change over time. The amounts shown in the column “Relating to awards for prior years” already take into account ex-post implicit adjustments that have occurred as a result of share price movements between the respective dates on which these awards were granted and 30 December 2013.
| | è | | Refer to “Note 29 Equity participation and other compensation plans” in the “Financial information” section of our Annual Report 2013 for more information |
Performance award expenses in the 2013 performance year
The performance award expenses includes all immediate expenses related to 2013 compensation awards and expenses deferred
Total variable compensation1
| | | | | | | | | | | | | | | | | | | | | | | | | | | | | | | | | | | | | | | | | | |
| | | | | Expenses | | | Expenses
deferred to
future periods | | | Adjustments2 | | | Total | | | Number of
beneficiaries | |
| | CHF million, except where indicated | | 2013 | | | 2012 | | | 2013 | | | 2012 | | | 2013 | | | 2012 | | | 2013 | | | 2012 | | | 2013 | | | 2012 | |
| | Cash performance awards | | | 1,942 | | | | 1,411 | | | | 0 | | | | 0 | | | | (24 | ) | | | 0 | | | | 1,918 | | | | 1,411 | | | | 46,593 | | | | 46,709 | |
| | | | | | | | | | | | | | | | | | | | | | | | | | | | | | | | | | | | | | | | | | |
| | Deferred Contingent Capital Plan | | | 152 | | | | 145 | | | | 348 | | | | 361 | | | | 0 | | | | 0 | | | | 500 | | | | 506 | | | | 5,286 | | | | 6,317 | |
| | | | | | | | | | | | | | | | | | | | | | | | | | | | | | | | | | | | | | | | | | |
| | Deferred cash plans3 | | | 2 | | | | 5 | | | | 7 | | | | 10 | | | | 0 | | | | 0 | | | | 9 | | | | 15 | | | | 23 | | | | 58 | |
| | | | | | | | | | | | | | | | | | | | | | | | | | | | | | | | | | | | | | | | | | |
| | UBS share plans | | | 190 | | | | 135 | | | | 520 | | | | 383 | | | | 41 | | | | 24 | | | | 751 | | | | 542 | | | | 4,931 | | | | 5,866 | |
| | | | | | | | | | | | | | | | | | | | | | | | | | | | | | | | | | | | | | | | | | |
| | Equity Ownership Plan – notional funds | | | 19 | | | | 28 | | | | 37 | | | | 20 | | | | 0 | | | | 0 | | | | 56 | | | | 48 | | | | 370 | | | | 506 | |
| | | | | | | | | | | | | | | | | | | | | | | | | | | | | | | | | | | | | | | | | | |
| | Total performance award pool | | | 2,305 | | | | 1,724 | | | | 912 | | | | 774 | | | | 17 | | | | 24 | | | | 3,234 | | | | 2,522 | | | | 46,620 | | | | 46,732 | |
| | | | | | | | | | | | | | | | | | | | | | | | | | | | | | | | | | | | | | | | | | |
| | | | Expenses | | | Expenses
deferred to
future periods | | | Adjustments | | | Total | | | | |
| | CHF million, except where indicated | | | 2013 | | | | 2012 | | | | 2013 | | | | 2012 | | | | 2013 | | | | 2012 | | | | 2013 | | | | 2012 | | | | | | | | | |
| | | | | | | | | | | | | | | | | | | | | | | | | | | | | | | | | | | | | | | | | | |
| | Total variable compensation – other4 | | | 152 | | | | 424 | | | | 340 | | | | 494 | | | | (101 | )5 | | | (137 | )5 | | | 391 | | | | 781 | | | | | | | | | |
| | | | | | | | | | | | | | | | | | | | | | | | | | | | | | | | | | | | | | | | | | |
| | | | Expenses | | | Expenses
deferred to
future periods | | | Adjustments | | | Total | | | Number of
beneficiaries | |
| | CHF million, except where indicated | | | 2013 | | | | 2012 | | | | 2013 | | | | 2012 | | | | 2013 | | | | 2012 | | | | 2013 | | | | 2012 | | | | 2013 | | | | 2012 | |
| | | | | | | | | | | | | | | | | | | | | | | | | | | | | | | | | | | | | | | | | | |
| | Total WMA financial advisor compensation6 | | | 2,334 | | | | 2,087 | | | | 592 | | | | 706 | | | | 0 | | | | 0 | | | | 2,926 | | | | 2,793 | | | | 7,137 | | | | 7,059 | |
| | | | | | | | | | | | | | | | | | | | | | | | | | | | | | | | | | | | | | | | | | | |
| | 1 The total “performance award” paid to employees for the performance years 2013 (CHF 3,234 million) and 2012 (CHF 2,522 million). Expenses under “Total variable compensation – other” and “Total WMA financial advisor compensation” are not part of UBS’s performance award pool.2 Adjustments relating to post-vesting transfer restrictions and other adjustments3 Deferred cash plans include specific regional deferred cash plan which is not part of the Group’s compensation delivery framework.4 Replacement payments and retention plan payments including the 2012 Special Plan Award Program.5 Included in expenses deferred to future periods is an amount of CHF 101 million (prior year CHF 137 million) relating to future interest on the DCCP. As the amount recognized as performance award represents the present value of the award at the date granted to the employee, this interest amount is adjusted out in the analysis.6 Financial advisor compensation consists of grid-based compensation based directly on compensable revenues generated by financial advisors and supplemental compensation calculated based on financial advisor productivity, firm tenure and other variables. It also includes costs related to compensation commitments with financial advisors entered into at the time of recruitment, which are subject to vesting requirements. | |
|
Corporate governance, responsibility |
and compensation |
to 2013 related to awards made in prior years. The chart shows the amount at the end of 2013 of unrecognized awards to be amortized in subsequent years. This was CHF 1.6 billion for 2013, compared with CHF 1.7 billion at the end of 2012.
The table below shows the value of actual ex-post explicit and implicit adjustments to outstanding deferred compensation in the financial year 2013. Ex-post adjustments occur after an award has been granted. Ex-post explicit adjustments occur when we adjust compensation by forfeiting deferred awards. Ex-post implicit adjustments are unrelated to any action taken by the firm and occur as a result of share price movements that impact the value of an award. The total value of ex-post explicit adjustments made to UBS shares in 2013, based on the approximately 14 million shares forfeited during 2013, is a reduction of CHF 234 million. This includes partial forfeiture of the vesting installment of Performance Equity Plan 2010 of 48% due to performance conditions not fully achieved. The total value of ex-post explicit adjustments made to UBS options and share-settled stock appreciation rights (SARs) in 2013, based on the approximately 0.1 million options/SARs forfeited during 2013, is a reduction in value of CHF 1 million. The size of implicit adjustments is mainly due to an increase in the share price. However, the share price as of year-end means that many of the options previously granted remain out of the money. Hence, the majority of outstanding option awards had no intrinsic value as of the end of 2013.
Amortization of deferred compensation
CHF billion
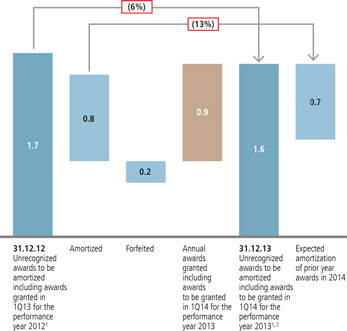
1 Related to performance awards and including special plan awards.
2 Estimate. The actual amount to be expensed in future periods may vary, for example due to forfeitures.
Deferred compensation1,2
| | | | | | | | | | | | | | | | | | | | |
| CHF million, except where indicated | | Relating to awards
for 2013 | | | Relating to awards
for prior years3 | | | Total | | | of which exposed to
ex-post adjustments | | | Total deferred compen-
sation at year-end 2012 | |
| Deferred Contingent Capital Plan | | | 500 | | | | 465 | | | | 965 | | | | 100 | % | | | 506 | |
| | | | | | | | | | | | | | | | | | | | | |
| Equity Ownership Plan | | | 751 | | | | 3,044 | | | | 3,795 | | | | 100 | % | | | 3,925 | |
| | | | | | | | | | | | | | | | | | | | | |
| Equity Ownership Plan – notional funds | | | 56 | | | | 447 | | | | 503 | | | | 100 | % | | | 582 | |
| | | | | | | | | | | | | | | | | | | | | |
| Discontinued deferred compensation plans4 | | | 0 | | | | 336 | | | | 336 | | | | 100 | % | | | 420 | |
| | | | | | | | | | | | | | | | | | | | | |
| Total | | | 1,307 | | | | 4,292 | | | | 5,599 | | | | | | | | 5,433 | |
| | | | | | | | | | | | | | | | | | | | | |
1 This is based on specific plan vesting and reflects the economic value of the outstanding awards, which may differ from the accounting expenses. 2 Refer to “Note 29 Equity participation and other compensation plans in the “Financial information” section of our Annual Report 2013 for more information. 3 This takes into account the ex-post implicit adjustments, given the share price movements since grant. 4 Cash Balance Plan (CBP), Senior Executive Equity Ownership Plan (SEEOP), Performance Equity Plan (PEP), Incentive Performance Plan (IPP) and Deferred Cash Plan (DCP). | |
Ex-post explicit and implicit adjustments to deferred compensation in 20131
| | | | | | | | | | | | | | | | |
| | | Ex-post explicit
adjustments4 | | | Ex-post implicit adjustments to
unvested awards5 | |
| CHF million | | 2013 | | | 2012 | | | 2013 | | | 2012 | |
| | | | 31.12.13 | | | | 31.12.12 | | | | 31.12.13 | | | | 31.12.12 | |
| UBS notional bonds (DCCP) | | | (27 | ) | | | | | | | | | | | | |
| | | | | | | | | | | | | | | | | |
| | | | | | | | | | | | | | | | |
| UBS shares (EOP, IPP, PEP, SEEOP)2 | | | (234 | ) | | | (211 | ) | | | 368 | | | | (178 | ) |
| | | | | | | | | | | | | | | | | |
| | | | | | | | | | | | | | | | | |
| UBS options (KESOP) and SARs (KESAP)2 | | | (1 | ) | | | (16 | ) | | | | | | | | |
| | | | | | | | | | | | | | | | | |
| UBS notional funds (EOP)3 | | | (20 | ) | | | (8 | ) | | | 51 | | | | 52 | |
| | | | | | | | | | | | | | | | | |
1 Compensation (performance awards and other variable compensation) relating to awards for previous performance years. 2 IPP, PEP, SEEOP, Key Employee Stock Appreciation Rights Plan (KESAP) and Key Employee Stock Option Plan (KESOP) are discontinued deferred compensation plans.3 Awards granted under this plan are cash-settled and 100% susceptible to ex-post implicit adjustments.4 Ex-post explicit adjustments are calculated as units forfeited during the year, valued at the share price on 30 December 2013 (CHF 16.92) and on 28 December 2012 (CHF 14.27) for UBS shares and valued with the fair value at grant for UBS options. For the notional funds awarded to Global Asset Management employees under the EOP, this represents the forfeiture credits recognized in 2013 and 2012. For DCCP the fair value at grant of the forfeited awards during the year is reflected.5 Ex-post implicit adjustments for UBS shares are calculated based on the difference between the weighted average grant date fair value and the share price at year-end. The amount for notional funds is calculated using the mark-to-market change during 2013 and 2012. | |
Corporate governance, responsibility and compensation
Compensation
Personnel expenses
| | | | | | | | | | | | | | | | | | | | |
| | | | | |
| | Expenses | |
CHF million | | Relating to
awards for
2013 | | | Relating to
awards for
prior years | | | Total 2013 | | | 2012 | | | 2011 | |
| Salaries | | | 6,268 | | | | 0 | | | | 6,268 | | | | 6,814 | | | | 6,859 | |
| Cash performance awards | | | 1,942 | | | | (30 | ) | | | 1,912 | | | | 1,373 | | | | 1,466 | |
| | | | | | | | | | | | | | | | | | | | | |
| Deferred Contingent Capital Plan | | | 152 | | | | 96 | | | | 248 | | | | 145 | | | | 0 | |
| | | | | | | | | | | | | | | | | | | | | |
| Deferred cash plans | | | 2 | | | | 53 | | | | 55 | | | | 154 | | | | 343 | |
| | | | | | | | | | | | | | | | | | | | | |
| UBS share plans | | | 190 | | | | 502 | | | | 692 | | | | 1,202 | | | | 1,490 | |
| | | | | | | | | | | | | | | | | | | | | |
| UBS share option plans | | | 0 | | | | 0 | | | | 0 | | | | 14 | | | | 100 | |
| | | | | | | | | | | | | | | | | | | | | |
| Equity Ownership Plan – notional funds | | | 19 | | | | 60 | | | | 79 | | | | 112 | | | | 118 | |
| | | | | | | | | | | | | | | | | | | | | |
| Total variable compensation – performance award1 | | | 2,305 | | | | 681 | | | | 2,986 | | | | 3,000 | | | | 3,516 | |
of which: guarantees for new hires | | | 14 | | | | 62 | | | | 76 | | | | 134 | | | | 173 | |
| | | | | | | | | | | | | | | | | | | | | |
| Variable compensation – other1 | | | 152 | | | | 136 | | | | 288 | | | | 367 | | | | 191 | |
| | | | | | | | | | | | | | | | | | | | | |
| of which: | | | | | | | | | | | | | | | | | | | | |
replacement payments2 | | | 6 | | | | 72 | | | | 78 | | | | 109 | | | | 121 | |
forfeiture credits | | | 0 | | | | (146 | ) | | | (146 | ) | | | (174 | ) | | | (215 | ) |
severance payments3 | | | 114 | | | | 0 | | | | 114 | | | | 303 | | | | 239 | |
retention plan and other payments | | | 32 | | | | 210 | | | | 242 | | | | 128 | | | | 46 | |
| Contractors | | | 190 | | | | 0 | | | | 190 | | | | 214 | | | | 217 | |
| Social security | | | 732 | | | | 60 | | | | 792 | | | | 768 | | | | 743 | |
| Pension and other post-employment benefit plans4 | | | 887 | | | | 0 | | | | 887 | | | | 18 | | | | 831 | |
| Wealth Management Americas: Financial advisor compensation1,5 | | | 2,334 | | | | 806 | | | | 3,140 | | | | 2,873 | | | | 2,518 | |
| Other personnel expenses | | | 609 | | | | 22 | | | | 631 | | | | 682 | | | | 758 | |
| Total personnel expenses6 | | | 13,477 | | | | 1,705 | | | | 15,182 | | | | 14,737 | | | | 15,634 | |
1 Refer to “Note 29 Equity participation and other compensation plans” in the “Financial information” section of our Annual Report 2013 for more information. 2 Replacement payments are payments made to compensate employees for deferred awards forfeited as a result of joining UBS. This table includes the expenses recognized in the financial year (mainly the amortization of the award). 3 Includes legally obligated and standard severance payments. 4 2012 included a credit of CHF 730 million related changes to our Swiss pension plan and a credit of CHF 116 million related changes to retiree benefit plans in the US. Refer to “Note 28 Pension and other post-employment benefit plans” of the “Financial information” section of our Annual Report 2013 for more information. 5 Financial advisor compensation consists of grid-based compensation based directly on compensable revenues generated by financial advisors and supplemental compensation calculated based on financial advisor productivity, firm tenure, assets and other variables. It also includes costs related to compensation commitments with financial advisors entered into at the time of recruitment, which are subject to vesting requirements. 6 Includes restructuring charges of CHF 156 million for the year ended 31 December 2013 and CHF 358 million for the year ended 31 December 2012. Refer to “Note 32 Changes in organization” in the “Financial information” section of our Annual Report 2013 for more information. | |
Total personnel expenses for 2013
The table “Personnel expenses” shows our total personnel expenses in 2013 for our 60,205 employees. It includes salaries, pension contributions and other personnel costs, social security contributions and variable compensation. Variable compensation includes discretionary cash performance awards paid in 2014 for the 2013 performance year, the amortization of unvested deferred awards granted in previous years and the cost of deferred awards granted to employees who are eligible for retirement in the context of the compensation framework at the date of grant.
The performance award pool reflects the value of discretionary performance awards granted relating to the 2013 performance year, including awards that are paid out immediately and those that are deferred. To determine our variable compensation expenses, the
following adjustments are required in order to reconcile the performance award pool to the accounting expenses recognized in the Group’s financial statements prepared under IFRS:
| – | | reduction for the unrecognized future amortization (including accounting adjustments) of unvested deferred awards granted in 2014 for the performance year 2013 |
| – | | addition for the 2013 amortization of unvested deferred awards granted in prior years |
As a large part of compensation consists of deferred awards, the amortization of unvested deferred awards granted in prior years forms a significant part of the IFRS accounting expenses in both 2012 and 2013.
| | è | | Refer to “Note 29 Equity participation and other compensation plans” in the “Financial information” section of our Annual Report 2013 for more information |
|
Corporate governance, responsibility |
and compensation |
Vesting of outstanding awards granted in prior years impacted by performance conditions
The tables below show the extent to which the performance conditions of awards granted in prior years have been met and the percentage of the award which vested on 1 March 2014.
Vesting of awards with performance conditions
| | | | |
| Performance Equity Plan 2011 | | | | |
| | | | |
| Performance conditions | | Performance achieved | | % of installment vesting |
| Cumulative economic profit and relative shareholder return for the period 2011 – 2013. The percentage applied to determine the number of UBS shares to be delivered at vesting is calculated by multiplying the economic profit multiplier (“EP multiplier”) with the total shareholder return multiplier (“TSR multiplier”), rounded to a full percentage | | For the period from 2011 to the end of 2013 the HRCC determined that the EP multiplier is 50% and the TSR multiplier is 80%, which results in a multiplier of 40% | | 40% |
| | | | |
| Performance conditions | | Performance achieved | | % of installment vesting |
| The award is adjusted based on Group RoE. If Group RoE is below 0%, the actual Group RoE determines the extent of the downward adjustment. If Group RoE is between 0% and 6%, no adjustment will be made. If Group RoE exceeds 6%, the award is adjusted upwards in line with the actual Group RoE, up to a maximum of 20% | | The last installment was adjusted upward by 1.3% based on the compound actual Group RoE over 2012 and 2013 | | 101.3% |
| | | | |
| Equity Ownership Plan 2010/2011 and 2011/2012 and Senior Executive Equity Ownership Plan 2010/2011 and 2011/2012 |
| | | | |
| Performance conditions | | Performance achieved | | % of installment vesting |
| Adjusted operating profit before tax for the business division or, for Corporate Center, adjusted Group operating profit before tax | | As the Group and the business divisions reported an operating profit for 2013, the profitability performance condition has been met and the third installment of the EOP awards and SEEOP 2010/2011 awards and second installment of EOP and SEEOP 2011/2012 awards will vest in full | | 100% |
Corporate governance, responsibility and compensation
Compensation
Discontinued deferred compensation plans
The table lists discontinued compensation plans. UBS has not granted any options since 2009. The strike price for stock options awarded under prior compensation plans has not been reset.
| | è | | Refer to “Note 29 Equity participation and other compensation plans” in the “Financial information” section of our Annual Report 2013 for more information |
| | | | | | | | | | | | | | | | |
| Plan | | Cash Balance Plan (CBP) | | Performance Equity Plan (PEP) | | Senior Executive Equity Ownership Plan (SEEOP) | | Special Plan Award Program (SPAP) | | Deferred Cash Plan (DCP) | | Incentive Performance Plan (IPP) | | Key Employee Stock Appreciation Rights Plan (KESAP) and Key Employee Stock Option Plan (KESOP) | | Senior Executive Stock Appreciation Rights Plan (SESAP) and Senior Executive Stock Option Plan (SESOP) |
| Years granted | | 2010-2012 | | 2010-2012 | | 2010-2012 | | 2012 only | | 2011 only | | 2010 only | | 2002-2009 | | 2002-2009 |
| Eligible employees | | GEB members | | GEB members | | GEB members and GMDs | | Selected Managing Directors and GMDs in the Investment Bank | | Investment Bank employees whose total compensation exceeded CHF 1 million | | GEB members and other senior employees (approximately 900 employees) | | Selected employees (approximately 17,000 employees between 2002 and 2009) | | GEB members and Group Managing Board |
| Instrument | | Cash | | Performance shares | | Shares | | Shares | | Cash | | Performance shares | | Share-settled stock appreciation rights (SAR) or stock options with a strike price not less than the fair market value of a UBS share on the date of grant | | Share-settled stock appreciation rights (SAR) or stock options with a strike price not less than the fair market value of a UBS share on the date of grant |
| Performance conditions | | CBP 2011: dependent on the return on equity CBP 2010: dependent on UBS being profitable | | The number of UBS shares delivered can be between zero and two times the number of performance shares granted, depending on whether performance targets relating to economic profit (EP) and relative total shareholder return (TSR) have been achieved | | Dependent on whether the business division makes a loss (the amount forfeited depends on the extent of the loss and generally ranges from 10% to 50% of the award portion due to vest) | | Dependent on the level of reduction in risk-weighted assets achieved and the average published return on risk-weighted assets in the Investment Bank in 2012, 2013 and 2014 | | None | | Dependent on share price at the end of the five-year period | | None | | None |
| Restrictions / other conditions | | Subject to continued employment and harmful act provisions | | Subject to continued employment and harmful act provisions | | Subject to continued employment and harmful act provisions | | Subject to continued employment and harmful act provisions | | Subject to continued employment and harmful act provisions | | Subject to continued employment and harmful act provisions | | Subject to continued employment, non-solicitation of clients and employees and non-disclosure of proprietary information | | Subject to continued employment, non-solicitation of clients and employees and non-disclosure of proprietary information |
| Vesting period | | Vests in equal installments over a two-year period | | Vests in full three years after grant | | Vests in equal installments over a five-year period | | Vests in full three years after grant | | Vests in one-third installments over a three-year period | | Vests in full at the end of five years. Number of shares that vest can be between one and three times the number of performance shares initially granted | | Vests in full three years after grant. SAR and options expire 10 years from the date of grant | | Vests in full three years after grant. SAR and options expire 10 years from the date of grant |
|
Corporate governance, responsibility |
and compensation |
List of tables
Corporate governance, responsibility and compensation
Compensation
| | | | | | | | | | | | | | | | | | | | | | | | | | | | | | |
| | Total of all vested and unvested shares of GEB members1,2 | |
| | | | Total | | | of which
vested | | | of which vesting | |
| | | | | | | | | | 2014 | | | 2015 | | | 2016 | | | 2017 | | | 2018 | |
| | Shares on 31 December 2013 | | | 8,708,791 | | | | 1,619,974 | | | | 1,652,867 | | | | 2,373,539 | | | | 1,263,412 | | | | 1,052,595 | | | | 746,404 | |
| | | | | | | | | | | | | | | | | | | | | | | | | | | | | | |
| | | | | | | | | | 2013 | | | 2014 | | | 2015 | | | 2016 | | | 2017 | |
| | Shares on 31 December 2012 | | | 8,192,173 | | | | 1,531,295 | | | | 1,811,280 | | | | 1,652,867 | | | | 2,373,539 | | | | 517,001 | | | | 306,191 | |
| | | | | | | | | | | | | | | | | | | | | | | | | | | | | | |
| | 1 Includes related parties. 2 Includes shares granted under variable compensation plans with forfeiture provisions. The actual number of shares vesting in the future will be calculated under the terms of the plans. Refer to the “Deferred variable compensation plans” section in this report for more information on the plans. | |
| | | | | | | | | | | | | | |
| | Number of shares of BoD members on 31 December 2013/20121 | |
| | Name, function | | on 31 December | | | Number of shares held | | | Voting rights in % | |
| | Axel A. Weber, Chairman2 | | | 2013 | | | | 233,333 | | | | 0.011 | |
| | | | | | | | | | | | | | |
| | | | | 2012 | | | | 200,000 | | | | 0.010 | |
| | | | | | | | | | | | | | |
| | Michel Demaré, Vice Chairman | | | 2013 | | | | 150,412 | | | | 0.007 | |
| | | | | | | | | | | | | | |
| | | | | 2012 | | | | 116,179 | | | | 0.006 | |
| | | | | | | | | | | | | | |
| | David Sidwell, Senior Independent Director | | | 2013 | | | | 151,184 | | | | 0.007 | |
| | | | | | | | | | | | | | |
| | | | | 2012 | | | | 149,199 | | | | 0.007 | |
| | | | | | | | | | | | | | |
| | Reto Francioni, member2 | | | 2013 | | | | 0 | | | | 0.000 | |
| | | | | | | | | | | | | | |
| | | | | 2012 | | | | – | | | | 0.000 | |
| | | | | | | | | | | | | | |
| | Rainer-Marc Frey, member | | | 2013 | | | | 209,044 | | | | 0.010 | |
| | | | | | | | | | | | | | |
| | | | | 2012 | | | | 162,677 | | | | 0.008 | |
| | | | | | | | | | | | | | |
| | Ann F. Godbehere, member | | | 2013 | | | | 113,562 | | | | 0.006 | |
| | | | | | | | | | | | | | |
| | | | | 2012 | | | | 81,286 | | | | 0.004 | |
| | | | | | | | | | | | | | |
| | Axel P. Lehmann, member | | | 2013 | | | | 185,970 | | | | 0.009 | |
| | | | | | | | | | | | | | |
| | | | | 2012 | | | | 139,603 | | | | 0.007 | |
| | | | | | | | | | | | | | |
| | Wolfgang Mayrhuber, former member3 | | | 2013 | | | | – | | | | 0.000 | |
| | | | | | | | | | | | | | |
| | | | | 2012 | | | | 38,957 | | | | 0.002 | |
| | | | | | | | | | | | | | |
| | Helmut Panke, member | | | 2013 | | | | 162,244 | | | | 0.008 | |
| | | | | | | | | | | | | | |
| | | | | 2012 | | | | 137,792 | | | | 0.007 | |
| | | | | | | | | | | | | | |
| | William G. Parrett, member | | | 2013 | | | | 99,914 | | | | 0.005 | |
| | | | | | | | | | | | | | |
| | | | | 2012 | | | | 91,078 | | | | 0.004 | |
| | | | | | | | | | | | | | |
| | Isabelle Romy, member2 | | | 2013 | | | | 24,452 | | | | 0.001 | |
| | | | | | | | | | | | | | |
| | | | | 2012 | | | | 0 | | | | 0.000 | |
| | | | | | | | | | | | | | |
| | Beatrice Weder di Mauro, member2 | | | 2013 | | | | 22,496 | | | | 0.001 | |
| | | | | | | | | | | | | | |
| | | | | 2012 | | | | 0 | | | | 0.000 | |
| | | | | | | | | | | | | | |
| | Joseph Yam, member | | | 2013 | | | | 48,679 | | | | 0.002 | |
| | | | | | | | | | | | | | |
| | | | | 2012 | | | | 26,183 | | | | 0.001 | |
| | | | | | | | | | | | | | |
| | Total | | | 2013 | | | | 1,401,290 | | | | 0.068 | |
| | | | | | | | | | | | | | |
| | | | | 2012 | | | | 1,142,954 | | | | 0.055 | |
| | | | | | | | | | | | | | |
| | 1 This table includes blocked and unblocked shares held by BoD members, including related parties. No options were granted in 2013 and 2012. 2 Reto Francioni was appointed at the AGM on 2 May 2013. Axel A. We-ber, Isabelle Romy and Beatrice Weder di Mauro were appointed at the AGM on 3 May 2012. 3 Wolfgang Mayrhuber did not stand for re-election at the AGM on 2 May 2013. | |
| | | | | | | | | | | | | | | | | | | | | | | | | | |
| | Total of all blocked and unblocked shares of BoD members1 | |
| | | | Total | | | of which
unblocked | | | of which blocked until | |
| | | | | | | | | | 2014 | | | 2015 | | | 2016 | | | 2017 | |
| | Shares on 31 December 2013 | | | 1,401,290 | | | | 201,098 | | | | 204,792 | | | | 216,451 | | | | 324,012 | | | | 454,937 | |
| | | | | | | | | | | | | | | | | | | | | | | | | | |
| | | | | | | | | | 2013 | | | 2014 | | | 2015 | | | 2016 | |
| | Shares on 31 December 2012 | | | 1,142,954 | | | | 56,624 | | | | 302,118 | | | | 204,792 | | | | 231,501 | | | | 347,919 | |
| | | | | | | | | | | | | | | | | | | | | | | | | | |
| | 1 Includes related parties. | |
|
Corporate governance, responsibility |
and compensation |
| | | | | | | | | | | | | | | | | | | | | | | | | | | | | | | | | | | | | | | | | | | | | | | | | | | | | | |
| | Vested and unvested options of GEB members on 31 December 2013/20121 | |
| | on 31 December | |
| Total
number of
options2 |
| |
| Number of
options3 |
| |
| Year of
grant |
| |
| Vesting
date |
| |
| Expiry
date |
| |
| Strike
price |
| | | | on 31 December | |
| Total
number of
options2 |
| |
| Number of
options3 |
| |
| Year of
grant |
| |
| Vesting
date |
| |
| Expiry
date |
| |
| Strike
price |
|
| | | | | | | | | | | | | | | | | | | | | | | | | | | | | | | | | | | | | | | | | | | | | | | | | | | | | | |
| | | | | | | | | | | | | | | | | | | | | | | | | | | | | | | | | | | | | | | | | | | | | | | | | | | | | | |
| | Sergio P. Ermotti, Group Chief Executive Officer | | | | | Robert J. McCann, CEO Wealth Management Americas and CEO UBS Group Americas | |
| | 2013 | | | 0 | | | | | | | | | | | | | | | | | | | | | | | | | 2013 | | | 0 | | | | | | | | | | | | | | | | | | | | | |
| | 2012 | | | 0 | | | | | | | | | | | | | | | | | | | | | | | | | 2012 | | | 0 | | | | | | | | | | | | | | | | | | | | | |
| | | | | | | | | | | | | | | | | | | | | | | | | | | | | | | | | | | | | | | | | | | | | | | | | | | | | | |
| | Markus U. Diethelm, Group General Counsel | | | | | Tom Naratil, Group Chief Financial Officer | | | | | | | | | | | | | |
| | 2013 | | | 0 | | | | | | | | | | | | | | | | | | | | | | | | | 2013 | | | 867,087 | | | | 145,962 | | | | 2004 | | | | 01.03.2007 | | | | 27.02.2014 | | | | USD 38.13 | |
| | 2012 | | | 0 | | | | | | | | | | | | | | | | | | | | | | | | | | | | | | | | 166,010 | | | | 2005 | | | | 01.03.2008 | | | | 28.02.2015 | | | | USD 44.81 | |
| | | | | | | | | | | | | | | | | | | | | | | | | | | | | | | | | | | | | 142,198 | | | | 2006 | | | | 01.03.2009 | | | | 28.02.2016 | | | | CHF 72.57 | |
| | John A. Fraser, Chairman and CEO Global Asset Management | | | | | | | | | | | | 131,277 | | | | 2007 | | | | 01.03.2010 | | | | 28.02.2017 | | | | CHF 73.67 | |
| | 2013 | | | 756,647 | | | | 170,512 | | | | 2004 | | | | 01.03.2007 | | | | 27.02.2014 | | | | USD 38.13 | | | | | | | | | | | | 181,640 | | | | 2008 | | | | 01.03.2011 | | | | 28.02.2018 | | | | CHF 35.66 | |
| | | | | | | | | 202,483 | | | | 2005 | | | | 01.03.2008 | | | | 28.02.2015 | | | | USD 44.81 | | | | | | | | | | | | 100,000 | | | | 2009 | | | | 01.03.2012 | | | | 27.02.2019 | | | | CHF 11.35 | |
| | | | | | | | | 213,140 | | | | 2006 | | | | 01.03.2009 | | | | 28.02.2016 | | | | CHF 72.57 | | | | | 2012 | | | 935,291 | | | | 63,942 | | | | 2003 | | | | 31.01.2006 | | | | 31.01.2013 | | | | USD 22.53 | |
| | | | | | | | | 170,512 | | | | 2007 | | | | 01.03.2010 | | | | 28.02.2017 | | | | CHF 73.67 | | | | | | | | | | | | 4,262 | | | | 2003 | | | | 28.02.2005 | | | | 28.02.2013 | | | | USD 19.53 | |
| | 2012 | | | 884,531 | | | | 127,884 | | | | 2003 | | | | 31.01.2006 | | | | 31.01.2013 | | | | USD 22.53 | | | | | | | | | | | | 145,962 | | | | 2004 | | | | 01.03.2007 | | | | 27.02.2014 | | | | USD 38.13 | |
| | | | | | | | | 170,512 | | | | 2004 | | | | 01.03.2007 | | | | 27.02.2014 | | | | USD 38.13 | | | | | | | | | | | | 166,010 | | | | 2005 | | | | 01.03.2008 | | | | 28.02.2015 | | | | USD 44.81 | |
| | | | | | | | | 202,483 | | | | 2005 | | | | 01.03.2008 | | | | 28.02.2015 | | | | USD 44.81 | | | | | | | | | | | | 142,198 | | | | 2006 | | | | 01.03.2009 | | | | 28.02.2016 | | | | CHF 72.57 | |
| | | | | | | | | 213,140 | | | | 2006 | | | | 01.03.2009 | | | | 28.02.2016 | | | | CHF 72.57 | | | | | | | | | | | | 131,277 | | | | 2007 | | | | 01.03.2010 | | | | 28.02.2017 | | | | CHF 73.67 | |
| | | | | | | | | 170,512 | | | | 2007 | | | | 01.03.2010 | | | | 28.02.2017 | | | | CHF 73.67 | | | | | | | | | | | | 181,640 | | | | 2008 | | | | 01.03.2011 | | | | 28.02.2018 | | | | CHF 35.66 | |
| | | | | | | | | | | | | | | | | | | | | | | | | | | | | | | | | | | | | 100,000 | | | | 2009 | | | | 01.03.2012 | | | | 27.02.2019 | | | | CHF 11.35 | |
| | | | | | | | | | | | | | | | | | | | | | | | | | | | | | | | | | | | | | | | | | | | | | | | | | | | | | |
| | Lukas Gähwiler, CEO UBS Switzerland and CEO Retail & Corporate | | | | | Andrea Orcel, CEO Investment Bank | | | | | | | | | | | | | | | | | |
| | | | | | | | | | | | | | | | | | | | | | | | | | | | | | | | | | | | | | | | | | | | | | | | | | | | | | |
| | 2013 | | | 0 | | | | | | | | | | | | | | | | | | | | | | | | | 2013 | | | 0 | | | | | | | | | | | | | | | | | | | | | |
| | | | | | | | | | | | | | | | | | | | | | | | | | | | | | | | | | | | | | | | | | | | | | | | | | | | | | |
| | 2012 | | | 0 | | | | | | | | | | | | | | | | | | | | | | | | | 2012 | | | 0 | | | | | | | | | | | | | | | | | | | | | |
| | | | | | | | | | | | | | | | | | | | | | | | | | | | | | | | | | | | | | | | | | | | | | | | | | | | | | |
| | | | | | | | | | | | | | | | | | | | | | | | | | | | | | | | | | | | | | | | | | | | | | | | | | | | | | |
| | | | | | | | | | | | | | | | | | | | | | | | | | | | | | | | | | | | | | | | | | | |
| | Ulrich Körner, Group Chief Operating Officer and CEO UBS Group EMEA | | | | | Chi-Won Yoon, CEO UBS Group Asia Pacific | | | | | | | | | | | | | |
| | 2013 | | | 0 | | | | | | | | | | | | | | | | | | | | | | | | | 2013 | | | 538,035 | | | | 6,200 | | | | 2004 | | | | 01.03.2005 | | | | 27.02.2014 | | | | CHF 44.32 | |
| | | | | | | | | | | | | | | | | | | | | | | | | | | | | | | | | | | | | | | | | | | | | | | | | | | | | | |
| | 2012 | | | 0 | | | | | | | | | | | | | | | | | | | | | | | | | | | | | | | | 4,262 | | | | 2004 | | | | 27.02.2006 | | | | 27.02.2014 | | | | CHF 44.32 | |
| | | | | | | | | | | | | | | | | | | | | | | | | | | | | | | | | | | | | | | | | | | | | | | | | | | | | | |
| | | | | | | | | | | | | | | | | | | | | | | | | | | | | | | | | | | | | 6,198 | | | | 2004 | | | | 01.03.2006 | | | | 27.02.2014 | | | | CHF 44.32 | |
| | | | | | | | | | | | | | | | | | | | | | | | | | | | | | | | | | | | | | | | | | | | | | | | | | | | | | |
| | Philip J. Lofts, Group Chief Risk Officer | | | | | | | | | | | | | | | | 6,195 | | | | 2004 | | | | 01.03.2007 | | | | 27.02.2014 | | | | CHF 44.32 | |
| | | | | | | | | | | | | | | | | | | | | | | | | | | | | | | | | | | | | | | | | | | | | | | | | | | | | | |
| | 2013 | | | 500,741 | | | | 35,524 | | | | 2004 | | | | 01.03.2005 | | | | 27.02.2014 | | | | CHF 44.32 | | | | | | | | | | | | 10,659 | | | | 2005 | | | | 01.03.2006 | | | | 28.02.2015 | | | | CHF 47.58 | |
| | | | | | | | | | | | | | | | | | | | | | | | | | | | | | | | | | | | | | | | | | | | | | | | | | | | | | |
| | | | | | | | | 35,524 | | | | 2004 | | | | 01.03.2006 | | | | 27.02.2014 | | | | CHF 44.32 | | | | | | | | | | | | 10,657 | | | | 2005 | | | | 01.03.2007 | | | | 28.02.2015 | | | | CHF 47.58 | |
| | | | | | | | | | | | | | | | | | | | | | | | | | | | | | | | | | | | | | | | | | | | | | | | | | | | | | |
| | | | | | | | | 35,521 | | | | 2004 | | | | 01.03.2007 | | | | 27.02.2014 | | | | CHF 44.32 | | | | | | | | | | | | 10,654 | | | | 2005 | | | | 01.03.2008 | | | | 28.02.2015 | | | | CHF 47.58 | |
| | | | | | | | | | | | | | | | | | | | | | | | | | | | | | | | | | | | | | | | | | | | | | | | | | | | | | |
| | | | | | | | | 117,090 | | | | 2005 | | | | 01.03.2008 | | | | 28.02.2015 | | | | CHF 52.32 | | | | | | | | | | | | 21,316 | | | | 2006 | | | | 01.03.2007 | | | | 28.02.2016 | | | | CHF 65.97 | |
| | | | | | | | | | | | | | | | | | | | | | | | | | | | | | | | | | | | | | | | | | | | | | | | | | | | | | |
| | | | | | | | | 117,227 | | | | 2006 | | | | 01.03.2009 | | | | 28.02.2016 | | | | CHF 72.57 | | | | | | | | | | | | 21,314 | | | | 2006 | | | | 01.03.2008 | | | | 28.02.2016 | | | | CHF 65.97 | |
| | | | | | | | | | | | | | | | | | | | | | | | | | | | | | | | | | | | | | | | | | | | | | | | | | | | | | |
| | | | | | | | | 85,256 | | | | 2007 | | | | 01.03.2010 | | | | 28.02.2017 | | | | CHF 73.67 | | | | | | | | | | | | 21,311 | | | | 2006 | | | | 01.03.2009 | | | | 28.02.2016 | | | | CHF 65.97 | |
| | | | | | | | | | | | | | | | | | | | | | | | | | | | | | | | | | | | | | | | | | | | | | | | | | | | | | |
| | | | | | | | | 74,599 | | | | 2008 | | | | 01.03.2011 | | | | 28.02.2018 | | | | CHF 35.66 | | | | | | | | | | | | 8,881 | | | | 2007 | | | | 01.03.2008 | | | | 28.02.2017 | | | | CHF 67.00 | |
| | | | | | | | | | | | | | | | | | | | | | | | | | | | | | | | | | | | | | | | | | | | | | | | | | | | | | |
| | 2012 | | | 536,173 | | | | 9,985 | | | | 2003 | | | | 01.03.2004 | | | | 31.01.2013 | | | | CHF 27.81 | | | | | | | | | | | | 8,880 | | | | 2007 | | | | 01.03.2009 | | | | 28.02.2017 | | | | CHF 67.00 | |
| | | | | | | | | | | | | | | | | | | | | | | | | | | | | | | | | | | | | | | | | | | | | | | | | | | | | | |
| | | | | | | | | 9,980 | | | | 2003 | | | | 01.03.2005 | | | | 31.01.2013 | | | | CHF 27.81 | | | | | | | | | | | | 8,880 | | | | 2007 | | | | 01.03.2010 | | | | 28.02.2017 | | | | CHF 67.00 | |
| | | | | | | | | | | | | | | | | | | | | | | | | | | | | | | | | | | | | | | | | | | | | | | | | | | | | | |
| | | | | | | | | 9,974 | | | | 2003 | | | | 01.03.2006 | | | | 31.01.2013 | | | | CHF 27.81 | | | | | | | | | | | | 42,628 | | | | 2008 | | | | 01.03.2011 | | | | 28.02.2018 | | | | CHF 32.45 | |
| | | | | | | | | | | | | | | | | | | | | | | | | | | | | | | | | | | | | | | | | | | | | | | | | | | | | | |
| | | | | | | | | 1,833 | | | | 2003 | | | | 01.03.2004 | | | | 28.02.2013 | | | | CHF 26.39 | | | | | | | | | | | | 350,000 | | | | 2009 | | | | 01.03.2012 | | | | 27.02.2019 | | | | CHF 11.35 | |
| | | | | | | | | | | | | | | | | | | | | | | | | | | | | | | | | | | | | | | | | | | | | | | | | | | | | | |
| | | | | | | | | 1,830 | | | | 2003 | | | | 01.03.2005 | | | | 28.02.2013 | | | | CHF 26.39 | | | | | 2012 | | | 578,338 | | | | 8,648 | | | | 2003 | | | | 01.03.2004 | | | | 31.01.2013 | | | | USD 20.49 | |
| | | | | | | | | | | | | | | | | | | | | | | | | | | | | | | | | | | | | | | | | | | | | | | | | | | | | | |
| | | | | | | | | 1,830 | | | | 2003 | | | | 01.03.2006 | | | | 28.02.2013 | | | | CHF 26.39 | | | | | | | | | | | | 8,642 | | | | 2003 | | | | 01.03.2005 | | | | 31.01.2013 | | | | USD 20.49 | |
| | | | | | | | | | | | | | | | | | | | | | | | | | | | | | | | | | | | | | | | | | | | | | | | | | | | | | |
| | | | | | | | | 35,524 | | | | 2004 | | | | 01.03.2005 | | | | 27.02.2014 | | | | CHF 44.32 | | | | | | | | | | | | 8,635 | | | | 2003 | | | | 01.03.2006 | | | | 31.01.2013 | | | | USD 20.49 | |
| | | | | | | | | | | | | | | | | | | | | | | | | | | | | | | | | | | | | | | | | | | | | | | | | | | | | | |
| | | | | | | | | 35,524 | | | | 2004 | | | | 01.03.2006 | | | | 27.02.2014 | | | | CHF 44.32 | | | | | | | | | | | | 4,262 | | | | 2003 | | | | 28.02.2005 | | | | 28.02.2013 | | | | USD 19.53 | |
| | | | | | | | | | | | | | | | | | | | | | | | | | | | | | | | | | | | | | | | | | | | | | | | | | | | | | |
| | | | | | | | | 35,521 | | | | 2004 | | | | 01.03.2007 | | | | 27.02.2014 | | | | CHF 44.32 | | | | | | | | | | | | 3,374 | | | | 2003 | | | | 01.03.2004 | | | | 28.02.2013 | | | | USD 19.53 | |
| | | | | | | | | | | | | | | | | | | | | | | | | | | | | | | | | | | | | | | | | | | | | | | | | | | | | | |
| | | | | | | | | 117,090 | | | | 2005 | | | | 01.03.2008 | | | | 28.02.2015 | | | | CHF 52.32 | | | | | | | | | | | | 3,371 | | | | 2003 | | | | 01.03.2005 | | | | 28.02.2013 | | | | USD 19.53 | |
| | | | | | | | | | | | | | | | | | | | | | | | | | | | | | | | | | | | | | | | | | | | | | | | | | | | | | |
| | | | | | | | | 117,227 | | | | 2006 | | | | 01.03.2009 | | | | 28.02.2016 | | | | CHF 72.57 | | | | | | | | | | | | 3,371 | | | | 2003 | | | | 01.03.2006 | | | | 28.02.2013 | | | | USD 19.53 | |
| | | | | | | | | | | | | | | | | | | | | | | | | | | | | | | | | | | | | | | | | | | | | | | | | | | | | | |
| | | | | | | | | 85,256 | | | | 2007 | | | | 01.03.2010 | | | | 28.02.2017 | | | | CHF 73.67 | | | | | | | | | | | | | | | | | | | | | | | | | | | | | |
| | | | | | | | | | | | | | | | | | | | | | | | | | | | | | | | | | | | | | | | | | | | | | | | | | | | | | |
| | | | | | | | | 74,599 | | | | 2008 | | | | 01.03.2011 | | | | 28.02.2018 | | | | CHF 35.66 | | | | | | | | | | | | | | | | | | | | | | | | | | | | | |
| | 1 This table includes all options of GEB members, including related parties. section of the Annual Report 2013 for more information. 2 No conversion rights are outstanding. 3 Refer to “Note 29 Equity participation and other compensation plans” in the “Financial information” section of our Annual Report 2013 for more information. | |
Corporate governance, responsibility and compensation
Compensation
Vested and unvested options of GEB members on 31 December 2013/20121 (continued)
| | | | | | | | | | | | | | | | | | | | | | | | | | | | | | | | | | | | | | | | | | | | | | | | | | | | | | | | |
| | on 31December | |
| Total
number
of
options2 |
| |
| Number
of
options3 |
| |
| Year
of
grant |
| |
| Vesting
date |
| |
| Expiry
date |
| |
| Strike
price |
| | | |
| on
31 December |
| |
| Total
number
of
options |
2 | |
| Number
of
options3 |
| |
| Year
of
grant |
| |
| Vesting
date |
| |
| Expiry
date |
| |
| Strike
price |
|
| | | | | | | | | |
| | Chi-Won Yoon, CEO UBS Group Asia Pacific (continued) | | | | | | Jürg Zeltner, CEO UBS Wealth Management (continued) | |
| | 2012 | | | | | | | 6,200 | | | | 2004 | | | | 01.03.2005 | | | | 27.02.2014 | | | | CHF 44.32 | | | | | | | | | | | | | | 230 | | | | 2006 | | | | 08.09.2008 | | | | 08.09.2016 | | | | CHF 65.76 | |
| | | | | | | | | 4,262 | | | | 2004 | | | | 27.02.2006 | | | | 27.02.2014 | | | | CHF 44.32 | | | | | | | | | | | | | | 221 | | | | 2006 | | | | 08.12.2008 | | | | 08.12.2016 | | | | CHF 67.63 | |
| | | | | | | | | 6,198 | | | | 2004 | | | | 01.03.2006 | | | | 27.02.2014 | | | | CHF 44.32 | | | | | | | | | | | | | | 7,105 | | | | 2007 | | | | 01.03.2008 | | | | 28.02.2017 | | | | CHF 67.00 | |
| | | | | | | | | 6,195 | | | | 2004 | | | | 01.03.2007 | | | | 27.02.2014 | | | | CHF 44.32 | | | | | | | | | | | | | | 7,105 | | | | 2007 | | | | 01.03.2009 | | | | 28.02.2017 | | | | CHF 67.00 | |
| | | | | | | | | 10,659 | | | | 2005 | | | | 01.03.2006 | | | | 28.02.2015 | | | | CHF 47.58 | | | | | | | | | | | | | | 7,103 | | | | 2007 | | | | 01.03.2010 | | | | 28.02.2017 | | | | CHF 67.00 | |
| | | | | | | | | 10,657 | | | | 2005 | | | | 01.03.2007 | | | | 28.02.2015 | | | | CHF 47.58 | | | | | | | | | | | | | | 223 | | | | 2007 | | | | 02.03.2009 | | | | 02.03.2017 | | | | CHF 67.08 | |
| | | | | | | | | 10,654 | | | | 2005 | | | | 01.03.2008 | | | | 28.02.2015 | | | | CHF 47.58 | | | | | | | | | | | | | | 42,628 | | | | 2008 | | | | 01.03.2011 | | | | 28.02.2018 | | | | CHF 35.66 | |
| | | | | | | | | 21,316 | | | | 2006 | | | | 01.03.2007 | | | | 28.02.2016 | | | | CHF 65.97 | | | | | | | | | | | | | | 90,000 | | | | 2009 | | | | 01.03.2012 | | | | 27.02.2019 | | | | CHF 11.35 | |
| | | | | | | | | 21,314 | | | | 2006 | | | | 01.03.2008 | | | | 28.02.2016 | | | | CHF 65.97 | | | | | | 2012 | | | | 203,093 | | | | 4,972 | | | | 2004 | | | | 01.03.2007 | | | | 27.02.2014 | | | | CHF 44.32 | |
| | | | | | | | | 21,311 | | | | 2006 | | | | 01.03.2009 | | | | 28.02.2016 | | | | CHF 65.97 | | | | | | | | | | | | | | 7,106 | | | | 2005 | | | | 01.03.2006 | | | | 28.02.2015 | | | | CHF 47.58 | |
| | | | | | | | | 8,881 | | | | 2007 | | | | 01.03.2008 | | | | 28.02.2017 | | | | CHF 67.00 | | | | | | | | | | | | | | 7,103 | | | | 2005 | | | | 01.03.2007 | | | | 28.02.2015 | | | | CHF 47.58 | |
| | | | | | | | | 8,880 | | | | 2007 | | | | 01.03.2009 | | | | 28.02.2017 | | | | CHF 67.00 | | | | | | | | | | | | | | 7,103 | | | | 2005 | | | | 01.03.2008 | | | | 28.02.2015 | | | | CHF 47.58 | |
| | | | | | | | | 8,880 | | | | 2007 | | | | 01.03.2010 | | | | 28.02.2017 | | | | CHF 67.00 | | | | | | | | | | | | | | 93 | | | | 2005 | | | | 04.03.2007 | | | | 04.03.2015 | | | | CHF 47.89 | |
| | | | | | | | | 42,628 | | | | 2008 | | | | 01.03.2011 | | | | 28.02.2018 | | | | CHF 32.45 | | | | | | | | | | | | | | 161 | | | | 2005 | | | | 06.06.2007 | | | | 06.06.2015 | | | | CHF 45.97 | |
| | | | | | | | | 350,000 | | | | 2009 | | | | 01.03.2012 | | | | 27.02.2019 | | | | CHF 11.35 | | | | | | | | | | | | | | 149 | | | | 2005 | | | | 09.09.2007 | | | | 09.09.2015 | | | | CHF 50.47 | |
| | Jürg Zeltner, CEO UBS Wealth Management | | | | | | | | | | | | | | 127 | | | | 2005 | | | | 05.12.2007 | | | | 05.12.2015 | | | | CHF 59.03 | |
| | 2013 | | | 203,093 | | | | 4,972 | | | | 2004 | | | | 01.03.2007 | | | | 27.02.2014 | | | | CHF 44.32 | | | | | | | | | | | | | | 7,106 | | | | 2006 | | | | 01.03.2007 | | | | 28.02.2016 | | | | CHF 65.97 | |
| | | | | | | | | 7,106 | | | | 2005 | | | | 01.03.2006 | | | | 28.02.2015 | | | | CHF 47.58 | | | | | | | | | | | | | | 7,103 | | | | 2006 | | | | 01.03.2008 | | | | 28.02.2016 | | | | CHF 65.97 | |
| | | | | | | | | 7,103 | | | | 2005 | | | | 01.03.2007 | | | | 28.02.2015 | | | | CHF 47.58 | | | | | | | | | | | | | | 7,103 | | | | 2006 | | | | 01.03.2009 | | | | 28.02.2016 | | | | CHF 65.97 | |
| | | | | | | | | 7,103 | | | | 2005 | | | | 01.03.2008 | | | | 28.02.2015 | | | | CHF 47.58 | | | | | | | | | | | | | | 110 | | | | 2006 | | | | 03.03.2008 | | | | 03.03.2016 | | | | CHF 65.91 | |
| | | | | | | | | 93 | | | | 2005 | | | | 04.03.2007 | | | | 04.03.2015 | | | | CHF 47.89 | | | | | | | | | | | | | | 242 | | | | 2006 | | | | 09.06.2008 | | | | 09.06.2016 | | | | CHF 61.84 | |
| | | | | | | | | 161 | | | | 2005 | | | | 06.06.2007 | | | | 06.06.2015 | | | | CHF 45.97 | | | | | | | | | | | | | | 230 | | | | 2006 | | | | 08.09.2008 | | | | 08.09.2016 | | | | CHF 65.76 | |
| | | | | | | | | 149 | | | | 2005 | | | | 09.09.2007 | | | | 09.09.2015 | | | | CHF 50.47 | | | | | | | | | | | | | | 221 | | | | 2006 | | | | 08.12.2008 | | | | 08.12.2016 | | | | CHF 67.63 | |
| | | | | | | | | 127 | | | | 2005 | | | | 05.12.2007 | | | | 05.12.2015 | | | | CHF 59.03 | | | | | | | | | | | | | | 7,105 | | | | 2007 | | | | 01.03.2008 | | | | 28.02.2017 | | | | CHF 67.00 | |
| | | | | | | | | 7,106 | | | | 2006 | | | | 01.03.2007 | | | | 28.02.2016 | | | | CHF 65.97 | | | | | | | | | | | | | | 7,105 | | | | 2007 | | | | 01.03.2009 | | | | 28.02.2017 | | | | CHF 67.00 | |
| | | | | | | | | 7,103 | | | | 2006 | | | | 01.03.2008 | | | | 28.02.2016 | | | | CHF 65.97 | | | | | | | | | | | | | | 7,103 | | | | 2007 | | | | 01.03.2010 | | | | 28.02.2017 | | | | CHF 67.00 | |
| | | | | | | | | 7,103 | | | | 2006 | | | | 01.03.2009 | | | | 28.02.2016 | | | | CHF 65.97 | | | | | | | | | | | | | | 223 | | | | 2007 | | | | 02.03.2009 | | | | 02.03.2017 | | | | CHF 67.08 | |
| | | | | | | | | 110 | | | | 2006 | | | | 03.03.2008 | | | | 03.03.2016 | | | | CHF 65.91 | | | | | | | | | | | | | | 42,628 | | | | 2008 | | | | 01.03.2011 | | | | 28.02.2018 | | | | CHF 35.66 | |
| | | | | | | | | 242 | | | | 2006 | | | | 09.06.2008 | | | | 09.06.2016 | | | | CHF 61.84 | | | | | | | | | | | | | | 90,000 | | | | 2009 | | | | 01.03.2012 | | | | 27.02.2019 | | | | CHF 11.35 | |
| | | | | | | | | | | | | | | | | | | | | | | | | | | | | | | | | | | | | | | | | | | | | | | | | | | | | | | | |
| | | | | | | | | | | | | | | | | | | | | | | | | | | | | | | | | | | | | | | | | | | | | | | | | | | | | | | | |
| | 1 This table includes all options of GEB members, including related parties. 2 No conversion rights are outstanding. 3 Refer to “Note 29 Equity participation and other compensation plans” in the “Financial information” section of our Annual Report 2013 for more information. | |
|
Corporate governance, responsibility |
and compensation |
| | | | | | | | | | |
| | Loans granted to GEB members on 31 December 2013/20121 | |
| | CHF, except where indicated2 | | | | | | |
| | Name, function | | on 31 December | | | Loans3 | |
| | Ulrich Körner, Group Chief Operating Officer and CEO UBS Group EMEA (highest loan in 2013) | | | 2013 | | | | 5,181,976 | |
| | | | | | | | | | |
| | Markus U. Diethelm, Group General Counsel (highest loan in 2012) | | | 2012 | | | | 5,564,012 | |
| | Aggregate of all GEB members | | | 2013 | | | | 18,763,976 | |
| | | | | | | | | | |
| | | | | 2012 | | | | 18,862,820 | |
| | | | | | | | | | |
| | 1 No loans have been granted to related parties of the GEB members at conditions not customary in the market. 2 Local currencies are converted into CHF using the exchange rates as detailed in “Note 36 Currency translation rates” in the “Financial information” section in our Annual Report 2013. 3 All loans granted are secured loans, except for CHF 311,308 in 2012. | |
| | | | | | | | | | |
| | Loans granted to BoD members on 31 December 2013/ 20121 | |
| | CHF, except where indicated2 | | | | | | |
| | | | on 31 December | | | Loans3,4 | |
| | Aggregate of all BoD members | | | 2013 | | | | 1,520,000 | |
| | | | | | | | | | |
| | | | | 2012 | | | | 500,000 | |
| | 1 No loans have been granted to related parties of the BoD members at conditions not customary in the market. 2 Local currencies are converted into CHF using the exchange rates as detailed in “Note 36 Currency translation rates” in the “Financial information” section in our Annual Report 2013. 3 All loans granted are secured loans. 4 CHF 1,520,000 for Reto Francioni in 2013. CHF 500,000 for Michel Demaré in 2012. | |
| | | | | | | | | | | | | | | | | | |
| | Compensation paid to former BoD and GEB members1 | | | | | | | |
| | CHF, except where indicated2 | | | | | | | | | | | | |
| | | | For the year | | | Compensation | | | Benefits | | | Total | |
| | Former BoD members | | | 2013 | | | | 0 | | | | 0 | | | | 0 | |
| | | | | | | | | | | | | | | | | | |
| | | | | 2012 | | | | 0 | | | | 0 | | | | 0 | |
| | | | | | | | | | | | | | | | | | |
| | Aggregate of all former GEB members3 | | | 2013 | | | | 0 | | | | 27,809 | | | | 27,809 | |
| | | | | | | | | | | | | | | | | | |
| | | | | 2012 | | | | 0 | | | | 25,465 | | | | 25,465 | |
| | | | | | | | | | | | | | | | | | |
| | Aggregate of all former BoD and GEB members | | | 2013 | | | | 0 | | | | 27,809 | | | | 27,809 | |
| | | | | | | | | | | | | | | | | | |
| | | | | 2012 | | | | 0 | | | | 25,465 | | | | 25,465 | |
| | 1 Compensation or remuneration that is connected with the former member’s activity on the BoD or GEB or that is not at market conditions. 2 Local currencies are converted into CHF using the exchange rates as detailed in “Note 36 Currency translation rates” in the “Financial information” section in the Annual Report 2013. 3 Includes one former GEB member in 2013 and 2012. | |
Financial information
Table of contents
342
343
Financial information
Introduction and accounting principles
The financial information section of UBS’s Annual Report 2013 consists of: a) the audited consolidated financial statements of UBS Group for 2013 prepared in accordance with International Financial Reporting Standards (IFRS) as issued by the International Accounting Standards Board (IASB), b) the UBS AG (Parent Bank) review and audited financial statements for 2013, prepared in order to meet Swiss regulatory requirements and in compliance with Swiss GAAP, c) supplemental disclosures required under US Securities and Exchange Commission (SEC) regulations and d) supplemental disclosures required under Basel III Pillar 3 regulations.
The significant accounting policies applied in the preparation of UBS’s Group financial statements are described in Note 1 to the financial statements. Except where otherwise explicitly stated in these financial statements, all financial information is in Swiss francs (CHF) and presented on a consolidated basis under IFRS, and all references to “UBS” refer to the UBS Group and not to the Parent Bank. UBS AG (Parent Bank) is incorporated in Switzerland, has branches worldwide and owns all subsidiaries, directly or indirectly. All references to 2013, 2012 and 2011 refer to the fiscal years ended 31 December 2013, 2012 and 2011, respectively. The financial statements for the UBS Group and the Parent Bank have been audited by Ernst & Young Ltd.
344
Consolidated financial statements
Management’s report on internal control over financial reporting
Management’s responsibility for internal control over financial reporting
The Board of Directors and management of UBS AG (UBS) are responsible for establishing and maintaining adequate internal control over financial reporting. UBS’s internal control over financial reporting is designed to provide reasonable assurance regarding the preparation and fair presentation of published financial statements in accordance with International Financial Reporting Standards (IFRS) as issued by the International Accounting Standards Board.
UBS’s internal control over financial reporting includes those policies and procedures that:
| – | | pertain to the maintenance of records that, in reasonable detail, accurately and fairly reflect transactions and dispositions of assets; |
| – | | provide reasonable assurance that transactions are recorded as necessary to permit preparation and fair presentation of financial statements, and that receipts and expenditures of the company are being made only in accordance with authorizations of UBS management and |
| – | | provide reasonable assurance regarding prevention or timely detection of unauthorized acquisition, use or disposition of the company’s assets that could have a material effect on the financial statements. |
Because of its inherent limitations, internal control over financial reporting may not prevent or detect misstatements. Also, projections of any evaluation of effectiveness to future periods are subject to the risk that controls may become inadequate because of changes in conditions, or that the degree of compliance with the policies or procedures may deteriorate.
Management’s assessment of internal control over financial reporting as of 31 December 2013
UBS management has assessed the effectiveness of UBS’s internal control over financial reporting as of 31 December 2013 based on the criteria set forth by the Committee of Sponsoring Organizations of the Treadway Commission (COSO) in Internal Control Integrated Framework (1992 Framework). Based on this assessment, management believes that, as of 31 December 2013, UBS’s internal control over financial reporting was effective.
The effectiveness of UBS’s internal control over financial reporting as of 31 December 2013 has been audited by Ernst & Young Ltd, UBS’s independent registered public accounting firm, as stated in their report appearing on pages 346 to 347, which expressed an unqualified opinion on the effectiveness of UBS’s internal control over financial reporting as of 31 December 2013.
345
Financial information
Consolidated financial statements
| | | | |

| | Ernst & Young Ltd |
| | Aeschengraben 9 |
| | P.O. Box |
| | CH-4002 Basel |
| | | | |
| | Phone | | +41 58 286 86 86 |
| | Fax | | +41 58 286 86 00 |
| | www.ey.com/ch |
To the General Meetingof
UBS AG, Zurich and Basel
Basel, 6 March 2014
Report of independent registered public accounting firm on internal control over financial reporting
We have audited the internal controloverfinancial reporting of UBS AG and its subsidiaries as of 31 December 2013, based on criteria established in Internal Control-Integrated Framework issued by the Committee of Sponsoring Organizations of the Treadway Commission (1992 Framework) (the COSO criteria). UBS AG’s management is responsible for maintaining effective internal control over financial reporting, and for its assessment of the effectiveness of internal control over financial reporting included in Management’s Report on Internal Control Over Financial Reporting on page 345.
Our responsibility is to express an opinion on the Company’s internal controloverfinancial reporting based on our audit.
We conducted our audit in accordance with the standards of the Public Company Accounting Oversight Board (United States). Those standards require thatweplan and perform the audit to obtain reasonable assurance about whether effectiveinternal control over financial reporting was maintained in all material respects. Our audit included obtaining an understanding of internal control over financial reporting, assessing the risk that a material weakness exists, testing and evaluating the design and operating effectiveness of internal control based on the assessed risk, and performing such other procedures as weconsidered necessary in the circumstances. We believe that our audit provides a reasonable basis for our opinion.
A company’s internal control overfinancial reporting is a process designed to provide reasonable assurance regarding the reliability of financial reporting and the preparation of financial statements for external purposes in accordance with generally accepted accounting principles. A company’s internal control over financial reporting includes those policies and procedures that (1) pertain to the maintenance of records that, in reasonable detail, accurately and fairly reflect the transactions and dispositions of the assets of the company; (2) provide reasonable assurance that transactions are recorded as necessarytopermit preparation of financial statements in accordance with generally accepted accounting principles, and that receipts and expenditures of the company are being made only In accordance with authorizations of management and directors of thecompany; and (3) provide reasonable assurance regarding prevention or timely detection of unauthorized acquisition, use, or disposition of the company’s assets that could have a material effect on the financial statements.
Because of its inherent limitations, internal control over financial reporting may not prevent or detect misstatements. Also, projections of any evaluation of effectiveness to future periods are subject to the risk that controls may become inadequate because of changes in conditions, or that the degree of compliance with the policies or procedures may deteriorate.
346
In our opinion, UBS AG and its subsidiaries maintained, in all material respects, effective internal control over financial reporting as of 31 December 2013, based on the COSO criteria.
We also have audited, in accordance with Swiss law, Swiss Auditing Standards, International Standards on Auditing and the standards of the Public Company Accounting Oversight Board (United States), the consolidated balance sheets of UBS AG and its subsidiaries as of 31 December 2013 and 2012, and the related consolidated income statements and consolidated statements of comprehensive income, changes in equity and cash flows and notes thereto for each of the three years in the period ended 31 December 2013, of UBS AG and our report dated 6 March 2014 expresses an unqualified opinion thereon.
| | |
Ernst & Young Ltd | | |

| | 
|
Jonathan Bourne | | Troy J. Butner |
Licensed Audit Expert | | Certified Public Accountant (U.S.) |
| (Auditor in Charge) | | |
347
Financial information
Consolidated financial statements
| | | | |
| | Ernst & Young Ltd |
| | Aeschengraben 9 |
| | P.O. Box |
| | CH-4002 Basel |
| | | | |
| | Phone | | +41 58 286 86 86 |
| | Fax | | +41 58 286 86 00 |
| | www.ey.com/ch |
To the General Meeting of
UBS AG, Zurich and Basel
Basel, 6 March 2014
Report of the statutory auditor and the independent registered public accounting firm on the consolidated financial statements
As statutory auditor, we have audited the consolidated financial statements of UBS AG and its subsidiaries which are comprised of the consolidated balance sheets as of 31 December 2013 and 2012, and the related consolidated income statements and consolidated statements of comprehensive income, changes in equity and cash flows, and notes thereto, for each of the three years in the period ended 31 December 2013 on pages 350 to 505.
Board of Directors’ responsibility
The Board of Directors is responsible for the preparation and fair presentation of the consolidated financial statements in accordance with International Financial Reporting Standards (IFRS), as issued by the International Accounting Standards Board, and the requirements of Swiss law. This responsibility includes designing, implementing and maintaining an internal control system relevant to the preparation and fair presentation of consolidated financial statements that are free from material misstatement, whether due to fraud or error. The Board of Directors is further responsible for selecting and applying appropriate accounting policies and making accounting estimates that are reasonable in the circumstances.
Auditor’s responsibility
Our responsibility is to express an opinion on these consolidated financial statements based on our audit. We conducted our audit in accordance with Swiss law, Swiss Auditing Standards, International Standards on Auditing and the standards of the Public Company Accounting Oversight Board (United States). Those standards require that we plan andperform the audit to obtain reasonable assurance whether the consolidated financial statementsarefree from material misstatement.
An audit involves performing procedures to obtain audit evidence about the amounts and disclosures in the consolidated financial statements. The procedures selected depend on the auditor’s judgment, including the assessment of the risks of material misstatement of the consolidated financial statements. whether due to fraudorerror. In making those risk assessments, the auditor considers the internal control system relevant to the entity’s preparation and fair presentation of the consolidated financial statements in order to design audit procedures that areappropriate in the circumstances. An audit also includes evaluating the appropriateness of the accounting policies used and the reasonableness of accounting estimates made, as well as evaluating the overall presentation of the consolidated financial statements.
348
We believe that the audit evidence we have obtained is sufficient and appropriate to provide a basis for our audit opinion.
Opinion
In our opinion, the consolidated financial statements referred to above present fairly, in all material respects, the financial position of UBS AG and its subsidiaries at 31 December 2013 and 2012, and the consolidated results of operations and the cash flows for each of the three years in the period ended 31 December 2013 in accordance with IFRS, as issued by the International Accounting Standards Board, and comply with Swiss law.
Report on other legal and regulatory requirements
We confirm that we meet the Swiss legal requirements on licensing according to the Auditor Oversight Act (AOA) and independence (article 728 Code of Obligations (CO) and article 11 AOA) and that there are no circumstances incompatible with our independence.
In accordance with article 728a paragraph 1 item 3 CO and Swiss Auditing Standard 890, we confirm that an internal control system exists, which has been designed for the preparation of consolidated financial statements in accordance with the instructions of the Board of Directors.
In accordance with Swiss law, we recommend that the consolidated financial statements submitted to you be approved.
We also have audited, in accordance with the standards of the Public Company Accounting Oversight Board (United States), the internal control over financial reporting of UBS AG and its subsidiaries as of 31 December 2013, based on criteria established inInternal Control – integrated Framework issued by the Committee of Sponsoring Organizations of the Treadway Commission (1992 Framework), and our report dated 6 March 2014 expresses an unqualified opinion on the effectiveness of the Group’s internal control over financial reporting.
| | |
| Ernst & Young Ltd | | |
| |
|
Jonathan Bourne | | Troy J. Butner |
Licensed Audit Expert | | Certified Public Accountant (U.S.) |
(Auditor in Charge) | | |
349
Financial statements
Consolidated financial statements
Income statement
| | | | | | | | | | | | | | | | | | | | |
| | | | | For the year ended | | | % change from | |
| CHF million, except per share data | | Note | | | 31.12.13 | | | 31.12.12 | | | 31.12.11 | | | 31.12.12 | |
| Interest income | | | 3 | | | | 13,137 | | | | 15,968 | | | | 17,969 | | | | (18 | ) |
| | | | | | | | | | | | | | | | | | | | | |
| Interest expense | | | 3 | | | | (7,351 | ) | | | (9,990 | ) | | | (11,143 | ) | | | (26 | ) |
| | | | | | | | | | | | | | | | | | | | | |
| Net interest income | | | 3 | | | | 5,786 | | | | 5,978 | | | | 6,826 | | | | (3 | ) |
| | | | | | | | | | | | | | | | | | | | | |
| Credit loss (expense)/recovery | | | 12 | | | | (50 | ) | | | (118 | ) | | | (84 | ) | | | (58 | ) |
| | | | | | | | | | | | | | | | | | | | | |
| Net interest income after credit loss expense | | | | | | | 5,736 | | | | 5,860 | | | | 6,742 | | | | (2 | ) |
| | | | | | | | | | | | | | | | | | | | | |
| Net fee and commission income | | | 4 | | | | 16,287 | | | | 15,396 | | | | 15,236 | | | | 6 | |
| | | | | | | | | | | | | | | | | | | | | |
| Net trading income | | | 3 | | | | 5,130 | | | | 3,526 | | | | 4,343 | | | | 45 | |
| | | | | | | | | | | | | | | | | | | | | |
| Other income | | | 5 | | | | 580 | | | | 641 | | | | 1,467 | | | | (10 | ) |
| | | | | | | | | | | | | | | | | | | | | |
| Total operating income | | | | | | | 27,732 | | | | 25,423 | | | | 27,788 | | | | 9 | |
| | | | | | | | | | | | | | | | | | | | | |
| Personnel expenses | | | 6 | | | | 15,182 | | | | 14,737 | | | | 15,634 | | | | 3 | |
| | | | | | | | | | | | | | | | | | | | | |
| General and administrative expenses | | | 7 | | | | 8,380 | | | | 8,653 | | | | 5,959 | | | | (3 | ) |
| | | | | | | | | | | | | | | | | | | | | |
| Depreciation and impairment of property and equipment | | | 16 | | | | 816 | | | | 689 | | | | 761 | | | | 18 | |
| | | | | | | | | | | | | | | | | | | | | |
| Impairment of goodwill | | | 17 | | | | 0 | | | | 3,030 | | | | 0 | | | | (100 | ) |
| | | | | | | | | | | | | | | | | | | | | |
| Amortization and impairment of intangible assets | | | 17 | | | | 83 | | | | 106 | | | | 127 | | | | (22 | ) |
| | | | | | | | | | | | | | | | | | | | | |
| Total operating expenses | | | | | | | 24,461 | | | | 27,216 | | | | 22,482 | | | | (10 | ) |
| | | | | | | | | | | | | | | | | | | | | |
| Operating profit/(loss) before tax | | | | | | | 3,272 | | | | (1,794 | ) | | | 5,307 | | | | | |
| | | | | | | | | | | | | | | | | | | | | |
| Tax expense/(benefit) | | | 8 | | | | (110 | ) | | | 461 | | | | 901 | | | | | |
| | | | | | | | | | | | | | | | | | | | | |
| Net profit/(loss) | | | | | | | 3,381 | | | | (2,255 | ) | | | 4,406 | | | | | |
| | | | | | | | | | | | | | | | | | | | | |
| Net profit/(loss) attributable to preferred noteholders1 | | | | | | | 204 | | | | 220 | | | | | | | | (7 | ) |
| | | | | | | | | | | | | | | | | | | | | |
| Net profit/(loss) attributable to non-controlling interests1 | | | | | | | 5 | | | | 5 | | | | 268 | | | | 0 | |
| | | | | | | | | | | | | | | | | | | | | |
| Net profit/(loss) attributable to UBS shareholders | | | | | | | 3,172 | | | | (2,480 | ) | | | 4,138 | | | | | |
| | | | | | | | | | | | | | | | | | | | | |
| | | | | |
| Earnings per share (CHF) | | | | | | | | | | | | | | | | | | | | |
| | | | | | | | | | | | | | | | | | | | | |
| Basic | | | 9 | | | | 0.84 | | | | (0.66 | ) | | | 1.10 | | | | | |
| | | | | | | | | | | | | | | | | | | | | |
| Diluted | | | 9 | | | | 0.83 | | | | (0.66 | ) | | | 1.08 | | | | | |
| | | | | | | | | | | | | | | | | | | | | |
1 Refer to “Note 1b Changes in accounting policies, comparability and other adjustments” for information on the adoption of IFRS 10.
350
Statement of comprehensive income
| | | | | | | | | | | | |
| | For the year ended | |
CHF million | | 31.12.13 | | | 31.12.12 | | | 31.12.11 | |
| | | |
| Comprehensive income attributable to UBS shareholders | | | | | | | | | |
| Net profit/(loss) | | | 3,172 | | | | (2,480 | ) | | | 4,138 | |
| | | | | | | | | | | | | |
| | | |
| Other comprehensive income | | | | | | | | | | | | |
| | | | | | | | | | | | | |
| Other comprehensive income that may be reclassified to the income statement1 | | | | | | | | | | | | |
| | | | | | | | | | | | | |
| Foreign currency translation | | | | | | | | | | | | |
| | | | | | | | | | | | | |
| Foreign currency translation movements, before tax | | | (440 | ) | | | (362 | ) | | | 693 | |
| | | | | | | | | | | | | |
| Foreign exchange amounts reclassified to the income statement from equity | | | (36 | ) | | | (58 | ) | | | 8 | |
| | | | | | | | | | | | | |
| Income tax relating to foreign currency translation movements | | | 5 | | | | (91 | ) | | | 20 | |
| | | | | | | | | | | | | |
| Subtotal foreign currency translation, net of tax | | | (471 | ) | | | (511 | ) | | | 722 | |
| | | | | | | | | | | | | |
| Financial investments available-for-sale | | | | | | | | | | | | |
| | | | | | | | | | | | | |
| Net unrealized gains/(losses) on financial investments available-for-sale, before tax | | | (57 | ) | | | 335 | | | | 1,458 | |
| | | | | | | | | | | | | |
| Impairment charges reclassified to the income statement from equity | | | 41 | | | | 85 | | | | 39 | |
| | | | | | | | | | | | | |
| Realized gains reclassified to the income statement from equity | | | (265 | ) | | | (433 | ) | | | (950 | ) |
| | | | | | | | | | | | | |
| Realized losses reclassified to the income statement from equity | | | 56 | | | | 19 | | | | 24 | |
| | | | | | | | | | | | | |
| Income tax relating to net unrealized gains/(losses) on financial investments available-for-sale | | | 71 | | | | 20 | | | | (76 | ) |
| | | | | | | | | | | | | |
| Subtotal financial investments available-for-sale, net of tax | | | (154 | ) | | | 26 | | | | 495 | |
| | | | | | | | | | | | | |
| Cash flow hedges | | | | | | | | | | | | |
| | | | | | | | | | | | | |
| Effective portion of changes in fair value of derivative instruments designated as cash flow hedges, before tax | | | (652 | ) | | | 1,714 | | | | 3,093 | |
| | | | | | | | | | | | | |
| Net realized (gains)/losses reclassified to the income statement from equity | | | (1,261 | ) | | | (1,235 | ) | | | (1,140 | ) |
| | | | | | | | | | | | | |
| Income tax relating to cash flow hedges | | | 393 | | | | (95 | ) | | | (417 | ) |
| | | | | | | | | | | | | |
| Subtotal cash flow hedges, net of tax | | | (1,520 | ) | | | 384 | | | | 1,537 | |
| | | | | | | | | | | | | |
| Total other comprehensive income that may be reclassified to the income statement, net of tax | | | (2,145 | ) | | | (102 | ) | | | 2,753 | |
| | | | | | | | | | | | | |
| Other comprehensive income that will not be reclassified to the income statement1 | | | | | | | | | | | | |
| | | | | | | | | | | | | |
| Defined benefit plans | | | | | | | | | | | | |
| | | | | | | | | | | | | |
| Gains/(losses) on defined benefit plans, before tax | | | 1,178 | | | | 1,023 | | | | (2,141 | ) |
| | | | | | | | | | | | | |
| Income tax relating to defined benefit plans | | | (239 | ) | | | (413 | ) | | | 321 | |
| | | | | | | | | | | | | |
| Subtotal defined benefit plans, net of tax | | | 939 | | | | 609 | | | | (1,820 | ) |
| | | | | | | | | | | | | |
| Property revaluation surplus | | | | | | | | | | | | |
| | | | | | | | | | | | | |
| Gains on property revaluation, before tax | | | 0 | | | | 8 | | | | 0 | |
| | | | | | | | | | | | | |
| Net (gains)/losses reclassified to retained earnings | | | (6 | ) | | | 0 | | | | 0 | |
| | | | | | | | | | | | | |
| Income tax relating to gains on property revaluation | | | 0 | | | | (2 | ) | | | 0 | |
| | | | | | | | | | | | | |
| Subtotal changes in property revaluation surplus, net of tax | | | (6 | ) | | | 6 | | | | 0 | |
| | | | | | | | | | | | | |
| Total other comprehensive income that will not be reclassified to the income statement, net of tax | | | 933 | | | | 615 | | | | (1,820 | ) |
| | | | | | | | | | | | | |
| Total other comprehensive income | | | (1,211 | ) | | | 514 | | | | 934 | |
| | | | | | | | | | | | | |
| Total comprehensive income attributable to UBS shareholders | | | 1,961 | | | | (1,966 | ) | | | 5,071 | |
| | | | | | | | | | | | | |
1 Refer to “Note 1b Changes in accounting policies, comparability and other adjustments” for information on the adoption of the revisions to IAS 1.
Table continues on the next page.
351
Financial information
Consolidated financial statements
Statement of comprehensive income (continued)
Table continued from previous page.
| | | | | | | | | | | | |
| | For the year ended | |
CHF million | | 31.12.13 | | | 31.12.12 | | | 31.12.11 | |
| | | |
| Comprehensive income attributable to preferred noteholders1 | | | | | | | | | | | | |
| | | | | | | | | | | | | |
| Net profit/(loss) | | | 204 | | | | 220 | | | | | |
| | | | | | | | | | | | | |
| | | |
| Other comprehensive income | | | | | | | | | | | | |
| | | | | | | | | | | | | |
| Other comprehensive income that will not be reclassified to the income statement2 | | | | | | | | | | | | |
| | | | | | | | | | | | | |
| Foreign currency translation movements, before tax | | | 355 | | | | (41 | ) | | | | |
| | | | | | | | | | | | | |
| Income tax relating to foreign currency translation movements | | | 0 | | | | 0 | | | | | |
| | | | | | | | | | | | | |
| Subtotal foreign currency translation, net of tax | | | 355 | | | | (41 | ) | | | | |
| | | | | | | | | | | | | |
| Total other comprehensive income that will not be reclassified to the income statement, net of tax | | | 355 | | | | (41 | ) | | | | |
| | | | | | | | | | | | | |
| Total comprehensive income attributable to preferred noteholders | | | 559 | | | | 179 | | | | | |
| | | | | | | | | | | | | |
| | | |
| Comprehensive income attributable to non-controlling interests1 | | | | | | | | | | | | |
| | | | | | | | | | | | | |
| Net profit/(loss) | | | 5 | | | | 5 | | | | 268 | |
| | | | | | | | | | | | | |
| | | |
| Other comprehensive income | | | | | | | | | | | | |
| | | | | | | | | | | | | |
| Other comprehensive income that will not be reclassified to the income statement2 | | | | | | | | | | | | |
| | | | | | | | | | | | | |
| Foreign currency translation movements, before tax | | | (1 | ) | | | 15 | | | | 292 | |
| | | | | | | | | | | | | |
| Income tax relating to foreign currency translation movements | | | 0 | | | | 0 | | | | 0 | |
| | | | | | | | | | | | | |
| Subtotal foreign currency translation, net of tax | | | (1 | ) | | | 15 | | | | 292 | |
| | | | | | | | | | | | | |
| Total other comprehensive income that will not be reclassified to the income statement, net of tax | | | (1 | ) | | | 15 | | | | 292 | |
| | | | | | | | | | | | | |
| Total comprehensive income attributable to non-controlling interests | | | 4 | | | | 20 | | | | 560 | |
| | | | | | | | | | | | | |
| | | |
| Total comprehensive income | | | | | | | | | | | | |
| | | | | | | | | | | | | |
| Net profit/(loss) | | | 3,381 | | | | (2,255 | ) | | | 4,406 | |
| | | | | | | | | | | | | |
| Other comprehensive income | | | (857 | ) | | | 487 | | | | 1,226 | |
| | | | | | | | | | | | | |
of which: other comprehensive income that may be reclassified to the income statement | | | (2,145 | ) | | | (102 | ) | | | 2,753 | |
| | | | | | | | | | | | | |
of which: other comprehensive income that will not be reclassified to the income statement | | | 1,288 | | | | 589 | | | | (1,528 | ) |
| | | | | | | | | | | | | |
| Total comprehensive income | | | 2,524 | | | | (1,767 | ) | | | 5,632 | |
| | | | | | | | | | | | | |
1 Refer to “Note 1b Changes in accounting policies, comparability and other adjustments” for information on the adoption of IFRS 10. 2 Refer to “Note 1b Changes in accounting policies, comparability and other adjust- ments” for information on the adoption of the revisions to IAS 1.
352
Balance sheet
| | | | | | | | | | | | | | | | |
| | | | | | | | % change from | |
| CHF million | | Note | | | 31.12.13 | | | 31.12.12 | | | 31.12.12 | |
|
| Assets | |
| | | | | | | | | | | | | | | | | |
| Cash and balances with central banks | | | | | | | 80,879 | | | | 66,383 | | | | 22 | |
| | | | | | | | | | | | | | | | | |
| Due from banks | | | 10 | | | | 17,170 | | | | 21,220 | | | | (19 | ) |
| | | | | | | | | | | | | | | | | |
| Cash collateral on securities borrowed | | | 11 | | | | 27,496 | | | | 37,372 | | | | (26 | ) |
| | | | | | | | | | | | | | | | | |
| Reverse repurchase agreements | | | 11 | | | | 91,563 | | | | 130,941 | | | | (30 | ) |
| | | | | | | | | | | | | | | | | |
| Trading portfolio assets | | | 13 | | | | 122,848 | | | | 160,564 | | | | (23 | ) |
| | | | | | | | | | | | | | | | | |
of which: assets pledged as collateral which may be sold or repledged by counterparties | | | 25 | | | | 42,449 | | | | 44,698 | | | | (5 | ) |
| | | | | | | | | | | | | | | | | |
| Positive replacement values | | | 14 | | | | 245,835 | | | | 418,957 | | | | (41 | ) |
| | | | | | | | | | | | | | | | | |
| Cash collateral receivables on derivative instruments | | | 11 | | | | 28,007 | | | | 30,413 | | | | (8 | ) |
| | | | | | | | | | | | | | | | | |
| Financial assets designated at fair value | | | 27 | | | | 7,364 | | | | 9,106 | | | | (19 | ) |
| | | | | | | | | | | | | | | | | |
| Loans | | | 10 | | | | 286,959 | | | | 279,901 | | | | 3 | |
| | | | | | | | | | | | | | | | | |
| Financial investments available-for-sale | | | 15 | | | | 59,525 | | | | 66,230 | | | | (10 | ) |
| | | | | | | | | | | | | | | | | |
| Investments in associates | | | 30 | | | | 842 | | | | 858 | | | | (2 | ) |
| | | | | | | | | | | | | | | | | |
| Property and equipment | | | 16 | | | | 6,006 | | | | 6,004 | | | | 0 | |
| | | | | | | | | | | | | | | | | |
| Goodwill and intangible assets | | | 17 | | | | 6,293 | | | | 6,461 | | | | (3 | ) |
| | | | | | | | | | | | | | | | | |
| Deferred tax assets | | | 8 | | | | 8,845 | | | | 8,143 | | | | 9 | |
| | | | | | | | | | | | | | | | | |
| Other assets | | | 18 | | | | 20,228 | | | | 17,244 | | | | 17 | |
| | | | | | | | | | | | | | | | | |
| Total assets | | | | | | | 1,009,860 | | | | 1,259,797 | | | | (20 | ) |
| | | | | | | | | | | | | | | | | |
|
| Liabilities | |
| | | | | | | | | | | | | | | | | |
| Due to banks | | | 19 | | | | 12,862 | | | | 23,024 | | | | (44 | ) |
| | | | | | | | | | | | | | | | | |
| Cash collateral on securities lent | | | 11 | | | | 9,491 | | | | 9,203 | | | | 3 | |
| | | | | | | | | | | | | | | | | |
| Repurchase agreements | | | 11 | | | | 13,811 | | | | 38,557 | | | | (64 | ) |
| | | | | | | | | | | | | | | | | |
| Trading portfolio liabilities | | | 13 | | | | 26,609 | | | | 34,247 | | | | (22 | ) |
| | | | | | | | | | | | | | | | | |
| Negative replacement values | | | 14 | | | | 239,953 | | | | 395,260 | | | | (39 | ) |
| | | | | | | | | | | | | | | | | |
| Cash collateral payables on derivative instruments | | | 11 | | | | 49,138 | | | | 71,148 | | | | (31 | ) |
| | | | | | | | | | | | | | | | | |
| Financial liabilities designated at fair value | | | 20 | | | | 69,901 | | | | 91,901 | | | | (24 | ) |
| | | | | | | | | | | | | | | | | |
| Due to customers | | | 19 | | | | 390,825 | | | | 373,459 | | | | 5 | |
| | | | | | | | | | | | | | | | | |
| Debt issued | | | 21 | | | | 81,586 | | | | 104,837 | | | | (22 | ) |
| | | | | | | | | | | | | | | | | |
| Provisions | | | 22 | | | | 2,971 | | | | 2,536 | | | | 17 | |
| | | | | | | | | | | | | | | | | |
| Other liabilities | | | 8,23 | | | | 62,777 | | | | 66,523 | | | | (6 | ) |
| | | | | | | | | | | | | | | | | |
| Total liabilities | | | | | | | 959,925 | | | | 1,210,697 | | | | (21 | ) |
| | | | | | | | | | | | | | | | | |
| | | | |
| Equity | | | | | | | | | | | | | | | | |
| | | | | | | | | | | | | | | | | |
| Share capital | | | | | | | 384 | | | | 384 | | | | 0 | |
| | | | | | | | | | | | | | | | | |
| Share premium | | | | | | | 33,952 | | | | 33,898 | | | | 0 | |
| | | | | | | | | | | | | | | | | |
| Treasury shares | | | | | | | (1,031 | ) | | | (1,071 | ) | | | (4 | ) |
| | | | | | | | | | | | | | | | | |
| Equity classified as obligation to purchase own shares | | | | | | | (46 | ) | | | (37 | ) | | | 24 | |
| | | | | | | | | | | | | | | | | |
| Retained earnings | | | | | | | 24,475 | | | | 21,297 | | | | 15 | |
| | | | | | | | | | | | | | | | | |
| Cumulative net income recognized directly in equity, net of tax | | | | | | | (9,733 | ) | | | (8,522 | ) | | | 14 | |
| | | | | | | | | | | | | | | | | |
| Equity attributable to UBS shareholders | | | | | | | 48,002 | | | | 45,949 | | | | 4 | |
| | | | | | | | | | | | | | | | | |
| Equity attributable to preferred noteholders | | | | | | | 1,893 | | | | 3,109 | | | | (39 | ) |
| | | | | | | | | | | | | | | | | |
| Equity attributable to non-controlling interests | | | | | | | 41 | | | | 42 | | | | (2 | ) |
| | | | | | | | | | | | | | | | | |
| Total equity | | | | | | | 49,936 | | | | 49,100 | | | | 2 | |
| | | | | | | | | | | | | | | | | |
| Total liabilities and equity | | | | | | | 1,009,860 | | | | 1,259,797 | | | | (20 | ) |
| | | | | | | | | | | | | | | | | |
353
Financial information
Consolidated financial statements
Statement of changes in equity
| | | | | | | | | | | | | | | | | | | | | | | | |
| CHF million | | Share
capital | | | Share
premium | | | Treasury shares | | | Equity classified as
obligation to
purchase own shares | | | Retained
earnings | | | Cumulative net income
recognized directly in equity, net of tax | |
| Balance as of 1 January 2011 | | | 383 | | | | 34,393 | | | | (654 | ) | | | (54 | ) | | | 19,604 | | | | (9,945 | ) |
| | | | | | | | | | | | | | | | | | | | | | | | | |
| Issuance of share capital | | | | | | | | | | | | | | | | | | | | | | | | |
| | | | | | | | | | | | | | | | | | | | | | | | | |
| Acquisition of treasury shares | | | | | | | | | | | (2,455 | ) | | | | | | | | | | | | |
| | | | | | | | | | | | | | | | | | | | | | | | | |
| Disposition of treasury shares | | | | | | | | | | | 1,949 | 2 | | | | | | | | | | | | |
| | | | | | | | | | | | | | | | | | | | | | | | | |
| Treasury share gains/(losses) and net premium/(discount)on own equity derivative activity | | | | | | | (83 | ) | | | | | | | | | | | | | | | | |
| | | | | | | | | | | | | | | | | | | | | | | | | |
| Premium on shares issued and warrants exercised | | | | | | | 10 | | | | | | | | | | | | | | | | | |
| | | | | | | | | | | | | | | | | | | | | | | | | |
| Employee share and share option plans | | | | | | | 19 | | | | | | | | | | | | | | | | | |
| | | | | | | | | | | | | | | | | | | | | | | | | |
| Tax (expense)/benefit recognized in share premium | | | | | | | 280 | | | | | | | | | | | | | | | | | |
| | | | | | | | | | | | | | | | | | | | | | | | | |
| Dividends | | | | | | | | | | | | | | | | | | | | | | | | |
| | | | | | | | | | | | | | | | | | | | | | | | | |
| Equity classified as obligation to purchase own shares – movements | | | | | | | | | | | | | | | 15 | | | | | | | | | |
| | | | | | | | | | | | | | | | | | | | | | | | | |
| Preferred notes | | | | | | | | | | | | | | | | | | | | | | | | |
| | | | | | | | | | | | | | | | | | | | | | | | | |
| New consolidations and other increases/(decreases) | | | | | | | (5 | ) | | | | | | | | | | | | | | | | |
| | | | | | | | | | | | | | | | | | | | | | | | | |
| Deconsolidations and other decreases | | | | | | | | | | | | | | | | | | | | | | | | |
| | | | | | | | | | | | | | | | | | | | | | | | | |
| Total comprehensive income for the year recognized in equity | | | | | | | | | | | | | | | | | | | 4,138 | | | | 934 | |
| | | | | | | | | | | | | | | | | | | | | | | | | |
| Balance as of 31 December 2011 | | | 383 | | | | 34,614 | | | | (1,160 | ) | | | (39 | ) | | | 23,742 | | | | (9,011 | ) |
| | | | | | | | | | | | | | | | | | | | | | | | | |
| Effect of adoption of IFRS 101 | | | | | | | | | | | | | | | | | | | 35 | | | | (24 | ) |
| | | | | | | | | | | | | | | | | | | | | | | | | |
| Balance as of 1 January 2012 after adoption of IFRS 10 | | | 383 | | | | 34,614 | | | | (1,160 | ) | | | (39 | ) | | | 23,777 | | | | (9,035 | ) |
| | | | | | | | | | | | | | | | | | | | | | | | | |
| Issuance of share capital | | | 0 | | | | | | | | | | | | | | | | | | | | | |
| | | | | | | | | | | | | | | | | | | | | | | | | |
| Acquisition of treasury shares | | | | | | | | | | | (1,398 | )2 | | | | | | | | | | | | |
| | | | | | | | | | | | | | | | | | | | | | | | | |
| Disposition of treasury shares | | | | | | | | | | | 1,486 | | | | | | | | | | | | | |
| | | | | | | | | | | | | | | | | | | | | | | | | |
| Treasury share gains/(losses) and net premium/(discount)on own equity derivative activity | | | | | | | (9 | ) | | | | | | | | | | | | | | | | |
| | | | | | | | | | | | | | | | | | | | | | | | | |
| Premium on shares issued and warrants exercised | | | | | | | 4 | | | | | | | | | | | | | | | | | |
| | | | | | | | | | | | | | | | | | | | | | | | | |
| Employee share and share option plans | | | | | | | 126 | | | | | | | | | | | | | | | | | |
| | | | | | | | | | | | | | | | | | | | | | | | | |
| Tax (expense)/benefit recognized in share premium | | | | | | | (457 | ) | | | | | | | | | | | | | | | | |
| | | | | | | | | | | | | | | | | | | | | | | | | |
| Dividends | | | | | | | (379 | )3 | | | | | | | | | | | | | | | | |
| | | | | | | | | | | | | | | | | | | | | | | | | |
| Equity classified as obligation to purchase own shares – movements | | | | | | | | | | | | | | | 2 | | | | | | | | | |
| | | | | | | | | | | | | | | | | | | | | | | | | |
| Preferred notes | | | | | | | | | | | | | | | | | | | | | | | | |
| | | | | | | | | | | | | | | | | | | | | | | | | |
| New consolidations and other increases/(decreases) | | | | | | | (1 | ) | | | | | | | | | | | | | | | | |
| | | | | | | | | | | | | | | | | | | | | | | | | |
| Deconsolidations and other decreases | | | | | | | | | | | | | | | | | | | | | | | | |
| | | | | | | | | | | | | | | | | | | | | | | | | |
| Total comprehensive income for the year recognized in equity | | | | | | | | | | | | | | | | | | | (2,480 | ) | | | 514 | |
| | | | | | | | | | | | | | | | | | | | | | | | | |
| Balance as of 31 December 2012 | | | 384 | | | | 33,898 | | | | (1,071 | ) | | | (37 | ) | | | 21,297 | | | | (8,522 | ) |
| | | | | | | | | | | | | | | | | | | | | | | | | |
| Issuance of share capital | | | 1 | | | | | | | | | | | | | | | | | | | | | |
| | | | | | | | | | | | | | | | | | | | | | | | | |
| Acquisition of treasury shares | | | | | | | | | | | (846 | ) | | | | | | | | | | | | |
| | | | | | | | | | | | | | | | | | | | | | | | | |
| Disposition of treasury shares | | | | | | | | | | | 8872 | | | | | | | | | | | | | |
| | | | | | | | | | | | | | | | | | | | | | | | | |
| Treasury share gains/(losses) and net premium/(discount)on own equity derivative activity | | | | | | | 203 | | | | | | | | | | | | | | | | | |
| | | | | | | | | | | | | | | | | | | | | | | | | |
| Premium on shares issued and warrants exercised | | | | | | | 30 | | | | | | | | | | | | | | | | | |
| | | | | | | | | | | | | | | | | | | | | | | | | |
| Employee share and share option plans | | | | | | | 305 | | | | | | | | | | | | | | | | | |
| | | | | | | | | | | | | | | | | | | | | | | | | |
| Tax (expense)/benefit recognized in share premium | | | | | | | 91 | | | | | | | | | | | | | | | | | |
| | | | | | | | | | | | | | | | | | | | | | | | | |
| Dividends | | | | | | | (564 | )3 | | | | | | | | | | | | | | | | |
| | | | | | | | | | | | | | | | | | | | | | | | | |
| Equity classified as obligation to purchase own shares – movements | | | | | | | | | | | | | | | (9 | ) | | | | | | | | |
| | | | | | | | | | | | | | | | | | | | | | | | | |
| Preferred notes | | | | | | | | | | | | | | | | | | | | | | | | |
| | | | | | | | | | | | | | | | | | | | | | | | | |
| New consolidations and other increases/(decreases) | | | | | | | | | | | | | | | | | | | 6 | | | | | |
| | | | | | | | | | | | | | | | | | | | | | | | | |
| Deconsolidations and other decreases | | | | | | | (11 | ) | | | | | | | | | | | | | | | | |
| | | | | | | | | | | | | | | | | | | | | | | | | |
| Total comprehensive income for the year recognized in equity | | | | | | | | | | | | | | | | | | | 3,172 | | | | (1,211 | ) |
| | | | | | | | | | | | | | | | | | | | | | | | | |
| Balance as of 31 December 2013 | | | 384 | | | | 33,952 | | | | (1,031 | ) | | | (46 | ) | | | 24,475 | | | | (9,733 | ) |
| | | | | | | | | | | | | | | | | | | | | | | | | |
1 Refer to “Note 1b Changes in accounting policies, comparability and other adjustments” for information on the adoption of IFRS 10. 2 For the year 2013, the net disposal of 12 million treasury shares (CHF 170 mil lion) which related to market-making and hedging activities of the Investment Bank are presented as dispositions. For the year 2012, the net acquisition of 5 million treasury shares (CHF 92 million) are presented as acquisitions. For the year 2011, the net disposal of 5 million treasury shares (CHF 122 million) are presented as dispositions. 3 Reflects the payment of CHF 0.15 (2012: CHF 0.10) per share of CHF 0.10 par value out of the capital contribution reserve of UBS AG (Parent Bank).
354
| | | | | | | | | | | | | | | | | | | | | | | | | | | | | | | | |
of which: Foreign currency translation | | of which: Financial
investments avail-
able-for-sale | | | of which: Cash
flow hedges | | | of which:
Defined benefit
pension plans | | | of which: Property
revaluation
surplus | | | Total equity
attributable to
UBS shareholders | | | Preferred
noteholders | | | Non-controlling
interests | | | Total
equity | |
| (7,169) | | | (243 | ) | | | 1,063 | | | | (3,596 | ) | | | 0 | | | | 43,728 | | | | | | | | 5,043 | | | | 48,770 | |
| | | | | | | | | | | | | | | | | | | | | | | | | | | | | | | | | |
| | | | | | | | | | | | | | | | | | | 0 | | | | | | | | | | | | 0 | |
| | | | | | | | | | | | | | | | | | | | | | | | | | | | | | | | | |
| | | | | | | | | | | | | | | | | | | (2,455 | ) | | | | | | | | | | | (2,455 | ) |
| | | | | | | | | | | | | | | | | | | | | | | | | | | | | | | | | |
| | | | | | | | | | | | | | | | | | | 1,949 | | | | | | | | | | | | 1,949 | |
| | | | | | | | | | | | | | | | | | | | | | | | | | | | | | | | | |
| | | | | | | | | | | | | | | | | | | (83 | ) | | | | | | | | | | | (83 | ) |
| | | | | | | | | | | | | | | | | | | | | | | | | | | | | | | | | |
| | | | | | | | | | | | | | | | | | | 10 | | | | | | | | | | | | 10 | |
| | | | | | | | | | | | | | | | | | | | | | | | | | | | | | | | | |
| | | | | | | | | | | | | | | | | | | 19 | | | | | | | | | | | | 19 | |
| | | | | | | | | | | | | | | | | | | | | | | | | | | | | | | | | |
| | | | | | | | | | | | | | | | | | | 280 | | | | | | | | | | | | 280 | |
| | | | | | | | | | | | | | | | | | | | | | | | | | | | | | | | | |
| | | | | | | | | | | | | | | | | | | 0 | | | | | | | | (269 | ) | | | (269 | ) |
| | | | | | | | | | | | | | | | | | | | | | | | | | | | | | | | | |
| | | | | | | | | | | | | | | | | | | 15 | | | | | | | | | | | | 15 | |
| | | | | | | | | | | | | | | | | | | | | | | | | | | | | | | | | |
| | | | | | | | | | | | | | | | | | | 0 | | | | | | | | (882 | ) | | | (882 | ) |
| | | | | | | | | | | | | | | | | | | | | | | | | | | | | | | | | |
| | | | | | | | | | | | | | | | | | | (5 | ) | | | | | | | 1 | | | | (4 | ) |
| | | | | | | | | | | | | | | | | | | | | | | | | | | | | | | | | |
| | | | | | | | | | | | | | | | | | | 0 | | | | | | | | (47 | ) | | | (47 | ) |
| | | | | | | | | | | | | | | | | | | | | | | | | | | | | | | | | |
| 722 | | | 495 | | | | 1,537 | | | | (1,820 | ) | | | 0 | | | | 5,071 | | | | | | | | 560 | | | | 5,632 | |
| | | | | | | | | | | | | | | | | | | | | | | | | | | | | | | | | |
| (6,447) | | | 252 | | | | 2,600 | | | | (5,415 | ) | | | 0 | | | | 48,530 | | | | | | | | 4,406 | | | | 52,935 | |
| | | | | | | | | | | | | | | | | | | | | | | | | | | | | | | | | |
| 5 | | | (29 | ) | | | | | | | | | | | | | | | 11 | | | | 3,150 | | | | (4,359 | ) | | | (1,198 | ) |
| | | | | | | | | | | | | | | | | | | | | | | | | | | | | | | | | |
| (6,443) | | | 223 | | | | 2,600 | | | | (5,415 | ) | | | 0 | | | | 48,540 | | | | 3,150 | | | | 46 | | | | 51,737 | |
| | | | | | | | | | | | | | | | | | | | | | | | | | | | | | | | | |
| | | | | | | | | | | | | | | | | | | 0 | | | | | | | | | | | | 0 | |
| | | | | | | | | | | | | | | | | | | | | | | | | | | | | | | | | |
| | | | | | | | | | | | | | | | | | | (1,398 | ) | | | | | | | | | | | (1,398 | ) |
| | | | | | | | | | | | | | | | | | | | | | | | | | | | | | | | | |
| | | | | | | | | | | | | | | | | | | 1,486 | | | | | | | | | | | | 1,486 | |
| | | | | | | | | | | | | | | | | | | | | | | | | | | | | | | | | |
| | | | | | | | | | | | | | | | | | | (9 | ) | | | | | | | | | | | (9 | ) |
| | | | | | | | | | | | | | | | | | | | | | | | | | | | | | | | | |
| | | | | | | | | | | | | | | | | | | 4 | | | | | | | | | | | | 4 | |
| | | | | | | | | | | | | | | | | | | | | | | | | | | | | | | | | |
| | | | | | | | | | | | | | | | | | | 126 | | | | | | | | | | | | 126 | |
| | | | | | | | | | | | | | | | | | | | | | | | | | | | | | | | | |
| | | | | | | | | | | | | | | | | | | (457 | ) | | | | | | | | | | | (457 | ) |
| | | | | | | | | | | | | | | | | | | | | | | | | | | | | | | | | |
| | | | | | | | | | | | | | | | | | | (379 | ) | | | (220 | ) | | | (6 | ) | | | (605 | ) |
| | | | | | | | | | | | | | | | | | | | | | | | | | | | | | | | | |
| | | | | | | | | | | | | | | | | | | 2 | | | | | | | | | | | | 2 | |
| | | | | | | | | | | | | | | | | | | | | | | | | | | | | | | | | |
| | | | | | | | | | | | | | | | | | | 0 | | | | | | | | | | | | 0 | |
| | | | | | | | | | | | | | | | | | | | | | | | | | | | | | | | | |
| | | | | | | | | | | | | | | | | | | (1 | ) | | | | | | | (10 | ) | | | (11 | ) |
| | | | | | | | | | | | | | | | | | | | | | | | | | | | | | | | | |
| | | | | | | | | | | | | | | | | | | 0 | | | | | | | | (9 | ) | | | (9 | ) |
| | | | | | | | | | | | | | | | | | | | | | | | | | | | | | | | | |
| (511) | | | 26 | | | | 384 | | | | 609 | | | | 6 | | | | (1,966 | ) | | | 179 | | | | 20 | | | | (1,767 | ) |
| | | | | | | | | | | | | | | | | | | | | | | | | | | | | | | | | |
| (6,954) | | | 249 | | | | 2,983 | | | | (4,806 | ) | | | 6 | | | | 45,949 | | | | 3,109 | | | | 42 | | | | 49,100 | |
| | | | | | | | | | | | | | | | | | | | | | | | | | | | | | | | | |
| | | | | | | | | | | | | | | | | | | 1 | | | | | | | | | | | | 1 | |
| | | | | | | | | | | | | | | | | | | | | | | | | | | | | | | | | |
| | | | | | | | | | | | | | | | | | | (846 | ) | | | | | | | | | | | (846 | ) |
| | | | | | | | | | | | | | | | | | | | | | | | | | | | | | | | | |
| | | | | | | | | | | | | | | | | | | 887 | | | | | | | | | | | | 887 | |
| | | | | | | | | | | | | | | | | | | | | | | | | | | | | | | | | |
| | | | | | | | | | | | | | | | | | | 203 | | | | | | | | | | | | 203 | |
| | | | | | | | | | | | | | | | | | | | | | | | | | | | | | | | | |
| | | | | | | | | | | | | | | | | | | 30 | | | | | | | | | | | | 30 | |
| | | | | | | | | | | | | | | | | | | | | | | | | | | | | | | | | |
| | | | | | | | | | | | | | | | | | | 305 | | | | | | | | | | | | 305 | |
| | | | | | | | | | | | | | | | | | | | | | | | | | | | | | | | | |
| | | | | | | | | | | | | | | | | | | 91 | | | | | | | | | | | | 91 | |
| | | | | | | | | | | | | | | | | | | | | | | | | | | | | | | | | |
| | | | | | | | | | | | | | | | | | | (564 | ) | | | (204 | ) | | | (6 | ) | | | (773 | ) |
| | | | | | | | | | | | | | | | | | | | | | | | | | | | | | | | | |
| | | | | | | | | | | | | | | | | | | (9 | ) | | | | | | | | | | | (9 | ) |
| | | | | | | | | | | | | | | | | | | | | | | | | | | | | | | | | |
| | | | | | | | | | | | | | | | | | | 0 | | | | (1,572 | ) | | | | | | | (1,572 | ) |
| | | | | | | | | | | | | | | | | | | | | | | | | | | | | | | | | |
| | | | | | | | | | | | | | | | | | | 6 | | | | | | | | | | | | 6 | |
| | | | | | | | | | | | | | | | | | | | | | | | | | | | | | | | | |
| | | | | | | | | | | | | | | | | | | (11 | ) | | | 0 | | | | | | | | (11 | ) |
| | | | | | | | | | | | | | | | | | | | | | | | | | | | | | | | | |
| (471) | | | (154 | ) | | | (1,520 | ) | | | 939 | | | | (6 | ) | | | 1,961 | | | | 559 | | | | 4 | | | | 2,524 | |
| | | | | | | | | | | | | | | | | | | | | | | | | | | | | | | | | |
| (7,425) | | | 95 | | | | 1,463 | | | | (3,867 | ) | | | 0 | | | | 48,002 | | | | 1,893 | | | | 41 | | | | 49,936 | |
| | | | | | | | | | | | | | | | | | | | | | | | | | | | | | | | | |
355
Financial information
Consolidated financial statements
Shares issued and treasury shares held
| | | | | | | | | | | | | | | | |
| | For the year ended | | | % change from | |
| Number of shares | | 31.12.13 | | | 31.12.12 | | | 31.12.11 | | | 31.12.12 | |
| | | | |
| Shares issued | | | | | | | | | | | | | | | | |
| | | | | | | | | | | | | | | | | |
| Balance at the beginning of the year | | | 3,835,250,233 | | | | 3,832,121,899 | | | | 3,830,840,513 | | | | 0 | |
| | | | | | | | | | | | | | | | | |
| Issuance of shares | | | 6,751,836 | | | | 3,128,334 | | | | 1,281,386 | | | | 116 | |
| | | | | | | | | | | | | | | | | |
| Balance at the end of the year | | | 3,842,002,069 | | | | 3,835,250,233 | | | | 3,832,121,899 | | | | 0 | |
| | | | | | | | | | | | | | | | | |
| | | | |
| Treasury shares | | | | | | | | | | | | | | | | |
| | | | | | | | | | | | | | | | | |
| Balance at the beginning of the year | | | 87,879,601 | | | | 84,955,551 | | | | 38,892,031 | | | | 3 | |
| | | | | | | | | | | | | | | | | |
| Acquisitions | | | 55,346,016 | | | | 114,292,481 | | | | 155,636,639 | | | | (52 | ) |
| | | | | | | | | | | | | | | | | |
| Dispositions | | | (69,425,365 | ) | | | (111,368,431 | ) | | | (109,573,119 | ) | | | (38 | ) |
| | | | | | | | | | | | | | | | | |
| Balance at the end of the year | | | 73,800,252 | | | | 87,879,601 | | | | 84,955,551 | | | | (16 | ) |
| | | | | | | | | | | | | | | | | |
Conditional share capital
As of 31 December 2013, 138,759,156 additional shares (31 December 2012: 145,510,992 shares) could have been issued to fund UBS’s employee share option programs.
On 14 April 2010, the Annual General Meeting of UBS AG shareholders approved the creation of conditional capital to a maximum number of 380,000,000 shares for conversion rights/warrants granted in connection with the issuance of bonds or similar financial instruments.
In 2013, the conditional capital of up to 100,000,000 shares, which was available in connection with an arrangement with the Swiss National
Bank (SNB), was removed. The SNB provided a loan to the SNB StabFund, to which UBS transferred certain illiquid securities and other positions in 2008 and 2009. As part of this arrangement, UBS granted warrants on shares to the SNB, which would have been exercisable if the SNB had incurred a loss on the loan. In 2013, the loan was paid back in full, the warrants were terminated and the relevant conditional capital was removed.
Total conditional share capital outstanding as of 31 December 2013 is also disclosed in “Note 10 Share capital and significant shareholders” of the UBS AG (Parent Bank) financial statements.
356
Statement of cash flows
| | | | | | | | | | | | |
| | For the year ended | |
| CHF million | | 31.12.13 | | | 31.12.12 | | | 31.12.11 | |
| | | |
| Cash flow from/(used in) operating activities | | | | | | | | | | | | |
| | | | | | | | | | | | | |
| Net profit/(loss) | | | 3,381 | | | | (2,255 | ) | | | 4,406 | |
| | | | | | | | | | | | | |
| Adjustments to reconcile net profit to cash flow from/(used in) operating activities | | | | | | | | | | | | |
| | | | | | | | | | | | | |
| Non-cash items included in net profit and other adjustments: | | | | | | | | | | | | |
| | | | | | | | | | | | | |
| Depreciation and impairment of property and equipment | | | 816 | | | | 689 | | | | 761 | |
| | | | | | | | | | | | | |
| Impairment of goodwill | | | 0 | | | | 3,030 | | | | 0 | |
| | | | | | | | | | | | | |
| Amortization and impairment of intangible assets | | | 83 | | | | 106 | | | | 127 | |
| | | | | | | | | | | | | |
| Credit loss expense/(recovery) | | | 50 | | | | 118 | | | | 84 | |
| | | | | | | | | | | | | |
| Share of net profits of associates | | | (49 | ) | | | (88 | ) | | | (42 | ) |
| | | | | | | | | | | | | |
| Deferred tax expense/(benefit) | | | (545 | ) | | | 294 | | | | 795 | |
| | | | | | | | | | | | | |
| Net loss/(gain) from investing activities | | | (522 | ) | | | (486 | ) | | | (996 | ) |
| | | | | | | | | | | | | |
| Net loss/(gain) from financing activities | | | 3,988 | | | | 3,717 | | | | (5,856 | ) |
| | | | | | | | | | | | | |
| Other net adjustments | | | 5,148 | | | | 6,088 | | | | 3,703 | |
| | | | | | | | | | | | | |
| Net (increase)/decrease in operating assets and liabilities: | | | | | | | | | | | | |
| | | | | | | | | | | | | |
| Due from/to banks | | | (7,551 | ) | | | (7,686 | ) | | | (14,569 | ) |
| | | | | | | | | | | | | |
| Cash collateral on securities borrowed and reverse repurchase agreements | | | 43,754 | | | | 102,436 | | | | (67,262 | ) |
| | | | | | | | | | | | | |
| Cash collateral on securities lent and repurchase agreements | | | (23,659 | ) | | | (66,407 | ) | | | 27,116 | |
| | | | | | | | | | | | | |
| Trading portfolio, replacement values and financial assets designated at fair value | | | 44,068 | | | | 9,369 | | | | 17,225 | |
| | | | | | | | | | | | | |
| Cash collateral on derivative instruments | | | (22,407 | ) | | | 4,399 | | | | 6,330 | |
| | | | | | | | | | | | | |
| Loans/due to customers | | | 12,087 | | | | 15,869 | | | | 6,068 | |
| | | | | | | | | | | | | |
| Other assets, provisions and other liabilities | | | (3,935 | ) | | | (1,771 | ) | | | 8,218 | |
| | | | | | | | | | | | | |
| Income taxes paid, net of refunds | | | (382 | ) | | | (261 | ) | | | (349 | ) |
| | | | | | | | | | | | | |
| Net cash flow from/(used in) operating activities | | | 54,325 | | | | 67,160 | | | | (14,241 | ) |
| | | | | | | | | | | | | |
| | | |
| Cash flow from/(used in) investing activities | | | | | | | | | | | | |
| | | | | | | | | | | | | |
| Purchase of subsidiaries, associates and intangible assets | | | (49 | ) | | | (11 | ) | | | (58 | ) |
| | | | | | | | | | | | | |
| Disposal of subsidiaries, associates and intangible assets1 | | | 136 | | | | 41 | | | | 50 | |
| | | | | | | | | | | | | |
| Purchase of property and equipment | | | (1,236 | ) | | | (1,118 | ) | | | (1,129 | ) |
| | | | | | | | | | | | | |
| Disposal of property and equipment | | | 639 | | | | 202 | | | | 233 | |
| | | | | | | | | | | | | |
| Net (investment in)/divestment of financial investments available-for-sale2 | | | 5,966 | | | | (13,994 | ) | | | 20,281 | |
| | | | | | | | | | | | | |
| Net cash flow from/(used in) investing activities | | | 5,457 | | | | (14,879 | ) | | | 19,377 | |
| | | | | | | | | | | | | |
1 Includes dividends received from associates. 2 Includes gross cash inflows from sales and maturities (CHF 7,258 million for the year ended 31 December 2013, CHF 8,796 million for the year ended 31 December 2012) and gross cash outflows from purchases (CHF 3,521 million for the year ended 31 December 2013, CHF 7,422 million for the year ended 31 December 2012) predominantly related to longer-term US asset-backed securities held as financial investments available-for-sale which were transferred from Wealth Management Americas to Corporate Center – Core Functions in 2013. Other net cash flows (CHF 2,229 million inflows for the year ended 31 December 2013, CHF 15,368 million outflows for the year ended 31 December 2012) almost entirely related to our multi-currency portfolio of unencumbered, high-quality, short-term assets managed centrally by Group Treasury.
Table continues on the next page.
357
Financial information
Consolidated financial statements
Statement of cash flows (continued)
Table continued from previous page.
| | | | | | | | | | | | |
| | | For the year ended | |
| CHF million | | 31.12.13 | | | 31.12.12 | | | 31.12.11 | |
| | | |
| Cash flow from/(used in) financing activities | | | | | | | | | | | | |
| | | | | | | | | | | | | |
| Net short-term debt issued/(repaid) | | | (4,290 | ) | | | (37,967 | ) | | | 15,338 | |
| | | | | | | | | | | | | |
| Net movements in treasury shares and own equity derivative activity | | | (341 | ) | | | (1,159 | ) | | | (1,885 | ) |
| | | | | | | | | | | | | |
| Increase in share capital | | | 1 | | | | 0 | | | | 0 | |
| | | | | | | | | | | | | |
| Dividends paid on UBS shares | | | (564 | ) | | | (379 | ) | | | 0 | |
| | | | | | | | | | | | | |
| Issuance of long-term debt, including financial liabilities designated at fair value | | | 28,014 | | | | 55,890 | | | | 52,590 | |
| | | | | | | | | | | | | |
| Repayment of long-term debt, including financial liabilities designated at fair value | | | (68,954 | ) | | | (54,259 | ) | | | (62,626 | ) |
| | | | | | | | | | | | | |
| Dividends paid and repayments of preferred notes | | | (1,415 | ) | | | (221 | ) | | | 0 | |
| | | | | | | | | | | | | |
| Net changes of non-controlling interests | | | (6 | ) | | | (16 | ) | | | (748 | ) |
| | | | | | | | | | | | | |
| Net cash flow from/(used in) financing activities | | | (47,555 | ) | | | (38,110 | ) | | | 2,670 | |
| | | | | | | | | | | | | |
| | | |
| Effects of exchange rate differences on cash and cash equivalents | | | (2,702 | ) | | | (673 | ) | | | (2,129 | ) |
| | | | | | | | | | | | | |
| Net increase/(decrease) in cash and cash equivalents | | | 9,524 | | | | 13,500 | | | | 5,678 | |
| | | | | | | | | | | | | |
| Cash and cash equivalents at the beginning of the year | | | 99,108 | | | | 85,609 | | | | 79,934 | |
| | | | | | | | | | | | | |
| Cash and cash equivalents at the end of the year1 | | | 108,632 | | | | 99,108 | | | | 85,612 | |
| | | | | | | | | | | | | |
| | | |
| Cash and cash equivalents comprise: | | | | | | | | | | | | |
| | | | | | | | | | | | | |
| Cash and balances with central banks | | | 80,879 | | | | 66,383 | | | | 40,638 | |
| | | | | | | | | | | | | |
| Money market paper2 | | | 4,288 | | | | 4,381 | | | | 3,900 | |
| | | | | | | | | | | | | |
| Due from banks3 | | | 23,465 | | | | 28,344 | | | | 41,074 | |
| | | | | | | | | | | | | |
| Total4 | | | 108,632 | | | | 99,108 | | | | 85,612 | |
| | | | | | | | | | | | | |
| | | |
| Additional information | | | | | | | | | | | | |
| | | | | | | | | | | | | |
| Net cash flow from/(used in) operating activities include: | | | | | | | | | | | | |
| | | | | | | | | | | | | |
| Cash received as interest | | | 12,148 | | | | 14,551 | | | | 16,667 | |
| | | | | | | | | | | | | |
| Cash paid as interest | | | 7,176 | | | | 9,166 | | | | 9,812 | |
| | | | | | | | | | | | | |
| Cash received as dividends on equity investments, investment funds and associates5 | | | 1,421 | | | | 1,430 | | | | 1,343 | |
| | | | | | | | | | | | | |
1 Prior period data for cash and cash equivalents was restated upon adoption of IFRS 10 as follows: from CHF 85,612 million to CHF 85,609 million for the opening balance of 2012 and from CHF 99,118 million to CHF 99,108 million for the closing balance of 2012. 2 Money market paper is included on the balance sheet under Trading portfolio assets (31 December 2013: CHF 1,716 million, 31 December 2012: CHF 2,192 million, 31 December 2011: CHF 1,783 million) and Financial investments available-for-sale (31 December 2013: CHF 2,571 million, 31 December 2012: CHF 2,190 million, 31 December 2011: CHF 2,117 million). 3 Includes positions recognized in the balance sheet under Due from banks (31 December 2013: CHF 14,413 million, 31 December 2012: CHF 15,951 million, 31 December 2011: 18,733 million) and Cash collateral receivables on derivative instruments with bank counterparties (31 December 2013: CHF 9,052 million, 31 December 2012: CHF 12,393 million, 31 December 2011: CHF 22,341 million). 4 CHF 8,333 million and CHF 10,109 million of cash and cash equivalents were restricted as of 31 December 2013 and 31 December 2012, respectively. Refer to “Note 25 Restricted and transferred financial assets” for more information. 5 Includes dividends received from associates (2013: CHF 69 million, 2012: CHF 37 million, 2011: CHF 28 million) reported within cash flow from/(used in) investing activities.
358
Notes to the consolidated financial statements
Note 1 Summary of significant accounting policies
a) Significant accounting policies
The significant accounting policies applied in the preparation of the consolidated financial statements (the “Financial Statements”) of UBS AG and its subsidiaries (“UBS” or the “Group”) are described in this note. These policies have been applied consistently in all years presented unless otherwise stated.
1) Basis of accounting
UBS provides a broad range of financial services including: advisory services, underwriting, financing, market-making, asset management and brokerage on a global level, and retail banking in Switzerland. The Group was formed on 29 June 1998 when Swiss Bank Corporation and Union Bank of Switzerland merged.
The Financial Statements are prepared in accordance with International Financial Reporting Standards (IFRS), as issued by the International Accounting Standards Board (IASB), and are presented in Swiss francs (CHF), the currency of Switzerland where UBS AG is incorporated. On 6 March 2014, the Financial Statements were authorized for issue by the Board of Directors. The Financial Statements are prepared using uniform accounting policies for similar transactions and other events. Intercompany transactions and balances have been eliminated.
Disclosures incorporated in the “Risk, treasury and capital management” section of this report, which form part of these Financial Statements, are marked as audited. These disclosures relate to requirements under IFRS 7Financial Instruments: Disclosures and IAS 1Presentation of Financial Statements and are not repeated in the “Financial information – consolidated financial statements” section.
2) Use of estimates
Preparation of the Financial Statements requires management to make estimates and assumptions that affect reported income, expenses, assets, liabilities and the disclosure of contingent assets and liabilities. Actual results in the future could differ from such estimates and assumptions, and such differences may be material to the Financial Statements. Estimates and their underlying assumptions are reviewed on an ongoing basis. Revisions to estimates resulting from these reviews are recognized in the period in which they occur.
The following notes to the Financial Statements contain information about those areas of estimation uncertainty considered to require critical judgment and have the most significant effect on the amounts recognized in the Financial Statements: Note 8Income taxes, Note 12Allowances and provisions for credit losses, Note 17Goodwill and
intangible assets, Note 22Provisionsand contingent liabilities, Note 24Fair value measurement, Note 28Pension and other post-employment benefit plans and Note 29Equityparticipation and other compensation plans.
3) Subsidiaries and structured entities
The Financial Statements comprise those of the parent company (UBS AG) and its subsidiaries, including controlled structured entities (SE), presented as a single economic entity.Equity attributable to non-controlling interests is presented on the consolidated balance sheet withinEquity, separately fromEquity attributable to UBS shareholders.
As detailed in Note 1b, UBS adopted IFRS 10Consolidated Financial Statements on 1 January 2013 on a limited retrospective basis. Under IFRS 10, UBS controls an entity when it has power over the relevant activities of the entity, exposure to variable returns and the ability to use its power to affect its returns. Where an entity is governed by voting rights, control is generally indicated by a direct shareholding of more than one-half of the voting rights.
In other cases, the assessment of control is more complex and requires greater use of judgment. Where UBS has an interest in an entity that absorbs variability, we consider whether UBS has power over the entity which allows it to affect the variability of its returns. Consideration is given to all facts and circumstances to determine whether the Group has power over another entity, that is, the current ability to direct the relevant activities of an entity when decisions about those activities need to be made. Factors such as the purpose and design of the entity, rights held through contractual arrangements such as call rights, put rights or liquidation rights, as well as potential decision-making rights are all considered in this assessment. Where the Group has power over the relevant activities, a further assessment is made to determine whether, through that power, it has the ability to affect its own returns, that is, assessing whether power is held in a principal or agent capacity. Consideration is given to (i) the scope of decision-making authority, (ii) rights held by other parties, including removal or other participating rights, (iii) exposure to variability, including remuneration, relative to total variability of the entity as well as whether that exposure is different from other investors. If, after review of these factors, UBS concludes that it can exercise its power to affect its own returns, the entity is consolidated.
Subsidiaries, including SE, are consolidated from the date control is obtained and are deconsolidated from the date control ceases. Control, or the lack thereof, is reassessed if facts and
359
Financial information
Notes to the consolidated financial statements
Note 1 Summary of significant accounting policies (continued)
circumstances indicate that there is a change to one or more of the elements needed to establish that control is present.
Refer to Note 30 for more information on subsidiaries and structured entities.
Structured entities (SE)
SE are entities that have been designed so that voting or similar rights are not the dominant factor in deciding who controls the entity, such as when any voting rights relate only to administrative tasks and the relevant activities are directed by means of contractual arrangements. Such entities generally have a narrow and well-defined objective and include those historically referred to as special purpose entities (SPE) and some investment funds. We assess whether an entity is an SE by considering the nature of the activities of the entity as well as the substance of voting or similar rights afforded to other parties, including investors and independent boards or directors. We consider rights such as the ability to liquidate the entity or remove the decision maker to be similar to voting rights when the holder has the substantive ability to exercise such rights without cause. In the absence of such rights or in cases where the existence of such rights cannot be fully established, the entity is considered to be an SE.
The Group sponsors the formation of SE and interacts with non-sponsored SE for a variety of reasons including allowing clients to obtain or be exposed to particular risk profiles, to provide funding or to sell or purchase credit risk. Many SE are established as bankruptcy remote, meaning that only the assets in the SE are available for the benefit of the SE’s investors and such investors have no other recourse to UBS. UBS is deemed to be the sponsor of an SE when it is involved in its creation, establishment and promotion and facilitates its ongoing success through the transfer of assets or the provision of explicit or implicit financial, operational or other support. Where the Group acts purely as an advisor, administrator or placement agent for an SE created by a third-party entity, it is not considered to be sponsored by UBS.
UBS will consolidate an SE in line with the consolidation principles described above. When UBS does not consolidate an SE but has an interest in an SE or has sponsored an SE, additional disclosures are provided in Note 30 on the nature of these interests and sponsorship activities.
UBS is involved with a number of SE types:
| – | | Securitization structured entities are established to issue securities to investors which are backed by assets held by the SE and whereby (i) significant credit risk associated with the securitized exposures has been transferred to third parties and (ii) there is more than one risk position or tranche issued by the securitization vehicle in line with the Basel III securitization definition. All securitization entities are classified as SE. |
| – | | Client investment structured entities are established predominantly for clients to invest in specific assets or risk exposures through purchasing notes issued by the SE, predominantly on a fixed term |
| | basis. The SE may source assets via a transfer from UBS or through an external market transaction. In some cases, UBS may enter into derivatives with the SE to either align the cash flows of the entity with the investor’s intended investment objective or to introduce other desired risk exposures. In certain cases, UBS may have interests in a third-party sponsored SE to hedge specific risks or participate in asset-backed financing. |
| – | | Investment fund structured entities have a collective investment objective, are managed by an investment manager and are either passively managed, such that any decision-making does not have a substantive effect on variability, or are actively managed and investors or their governing bodies do not have substantive voting or similar rights. UBS creates and sponsors a large number of funds for which it may have an interest through the receipt of variable management fees and/or a direct investment. In addition, UBS has interests in a number of funds created and sponsored by third parties, including exchange-traded funds and hedge funds, to hedge issued structured products. |
Business combinations
Business combinations are accounted for using the acquisition method. As of the acquisition date, UBS recognizes the identifiable assets acquired and the liabilities assumed at their acquisition-date fair values. For each business combination, UBS measures the non-controlling interests in the acquiree (being present ownership interests providing entitlement to a proportionate share of the net assets of the acquiree in the event of liquidation) either at fair value or at their proportionate share of the acquiree’s identifiable net assets.
The cost of an acquisition is the aggregate of the assets transferred, the liabilities incurred to former owners of the acquiree and the equity instruments issued, measured at acquisition-date fair values. Acquisition-related costs are expensed as incurred. Any contingent consideration that may be transferred by UBS is recognized at fair value at the acquisition date. If the contingent consideration is classified as an asset or liability, subsequent changes in the fair value of the contingent consideration are recognized in the income statement. If the contingent consideration is classified as equity, it is not remeasured and its subsequent settlement is accounted for withinEquity.
Any excess of the aggregate of the consideration transferred and the amount recognized for non-controlling interests over the net identifiable assets acquired and liabilities assumed is considered goodwill and is recognized as a separate asset on the balance sheet, initially measured at cost. If the fair value of the net assets of the subsidiary acquired exceeds the aggregate of the consideration transferred and the amount recognized for non-controlling interests, the difference is recognized in the income statement on the acquisition date.
Refer to Note 31 for more information on business combinations completed during 2013.
360
Note 1 Summary of significant accounting policies (continued)
4) Associates and joint ventures
Investments in entities in which UBS has significant influence, but not control, over the financial and operating policies of the entity are classified as investments in associates and accounted for under the equity method of accounting. Normally, significant influence is indicated when UBS owns between 20% and 50% of a company’s voting rights. Investments in associates are initially recorded at cost, and the carrying amount is increased or decreased after the date of acquisition to recognize the Group’s share of the investee’s net profit or loss (including net profit or loss recognized directly in equity). Interests in joint ventures are also accounted for under the equity method of accounting. A joint venture is subject to a contractual agreement between UBS and one or more third parties, which establishes joint control over the relevant activities and provides rights to the net assets of the entity. Interests in joint ventures are classified as investments in associates.
If the reporting date of an associate or joint venture is different to UBS’s reporting date, the most recently available financial statements of the associate or joint venture are used to apply the equity method. Adjustments are made for effects of significant transactions or events that may occur between that date and the UBS reporting date.
Investments in associates and interests in joint ventures are classified as “held for sale” if their carrying amount will be recovered principally through a sale transaction rather than through continuing use. Refer to item 29) for more information.
Refer to Note 30 for more information on associates and joint ventures.
5) Recognition and derecognition of financial instruments
UBS recognizes financial instruments on its balance sheet when the Group becomes a party to the contractual provisions of the instruments. UBS also acts in a trustee or other fiduciary capacity, which results in the holding or placing of assets on behalf of individuals, trusts, retirement benefit plans and other institutions. Unless the recognition criteria are satisfied, these assets and the related income are excluded from UBS’s Financial Statements, as they are not assets of UBS.
Financial assets
UBS enters into certain transactions where it transfers financial assets recognized on its balance sheet but retains either all or a portion of the risks and rewards of the transferred financial assets. If all or substantially all of the risks and rewards are retained, the transferred financial assets are not derecognized from the balance sheet. Transactions where transfers of financial assets result in UBS retaining all or substantially all risks and rewards include securities lending and repurchase transactions described under items 13) and 14). They also include transactions where financial assets are sold to a third party together with a total return swap that results in UBS retaining all or sub-
stantially all risks and rewards of the transferred assets. These types of transactions are accounted for as secured financing transactions.
In transactions where substantially all of the risks and rewards of ownership of a financial asset are neither retained nor transferred, UBS derecognizes the financial asset if control over the asset is surrendered. The rights and obligations retained in the transfer are recognized separately as assets and liabilities, respectively. In transfers where control over the financial asset is retained, the Group continues to recognize the asset to the extent of its continuing involvement, determined by the extent to which it is exposed to changes in the value of the transferred asset. Examples of such transactions include written put options, acquired call options, or other instruments linked to the performance of the transferred asset.
For the purposes of the Group’s disclosures of transferred financial assets, a financial asset is typically considered to have been transferred when the Group a) transfers the contractual rights to receive the cash flows of the financial asset or b) retains the contractual rights to receive the cash flows of that asset, but assumes a contractual obligation to pay the cash flows to one or more entities.
Where financial assets have been pledged as collateral or in similar arrangements, they are considered to have been transferred if the counterparty has received the contractual right to the cash flows of the pledged assets, as may be evidenced, for example, by the counterparty’s right to sell or repledge the assets. Where the counterparty to the pledged financial assets has not received the contractual right to the cash flows, the assets are considered pledged, but not transferred.
Refer to Note 25b and 25c for more information on transferred financial assets.
Financial liabilities
UBS derecognizes a financial liability from its balance sheet when it is extinguished, i.e., when the obligation specified in the contract is discharged, cancelled or expired. When an existing financial liability is exchanged for a new one from the same lender on substantially different terms, or the terms of an existing liability are substantially modified, such an exchange or modification is treated as the derecognition of the original liability and the recognition of a new liability with any difference in the respective carrying amounts being recognized in the income statement.
6) Determination of fair value
Fair value is the price that would be received to sell an asset or paid to transfer a liability in an orderly transaction between market participants at the measurement date. Determination of fair value is considered a critical accounting policy for the Group.
Refer to Note 24 for more information.
Financial information
Notes to the consolidated financial statements
Note 1 Summary of significant accounting policies (continued)
7) Trading portfolio assets and liabilities
Non-derivative financial assets and liabilities are classified at acquisition as held for trading and presented in the trading portfolio if they are a) acquired or incurred principally for the purpose of selling or repurchasing in the near term, or b) part of a portfolio of identified financial instruments that are managed together and for which there is evidence of a recent actual pattern of short-term profit-taking.
The trading portfolio includes non-derivative financial instruments (including those with embedded derivatives) and commodities. Financial instruments that are considered derivatives in their entirety generally are presented on the balance sheet asPositive replacement values orNegative replacement values. Refer to item 15) for more information. The trading portfolio includes recognized assets and liabilities relating to proprietary-, hedging- and client-related business.
Trading portfolio assets include debt instruments (including those in the form of securities, money market paper and traded corporate and bank loans), equity instruments, assets held under unit-linked contracts and precious metals and other commodities owned by the Group (“long” positions). Trading portfolio liabilities include obligations to deliver financial instruments such as debt and equity instruments which the Group has sold to third parties but does not own (“short” positions).
Assets and liabilities in the trading portfolio are measured at fair value. Gains and losses realized on disposal or redemption of these assets and liabilities and unrealized gains and losses from changes in the fair value of these assets and liabilities are reported asNet trading income. Interest and dividend income and expense on these assets and liabilities are included inInterest and dividend income orInterest and dividend expense.
The Group uses settlement date accounting when recognizing assets and liabilities in the trading portfolio. From the date a purchase transaction is entered into (trade date) until settlement date, UBS recognizes any unrealized profits and losses arising from remeasuring the transaction to fair value inNet trading income. The corresponding receivable or payable is presented on the balance sheet as aPositive replacement value orNegative replacement value, respectively. On settlement date, the resulting financial asset is recognized on the balance sheet at the fair value of the consideration given or received, plus or minus the change in fair value of the contract since the trade date. From the trade date of a sales transaction, unrealized profits and losses are no longer recognized and, on settlement date, the asset is derecognized.
Trading portfolio assets transferred to external parties that do not qualify for derecognition (refer to item 5) for more information) and where the transferee has obtained the right to sell or repledge the assets continue to be classified on the UBS balance sheet asTrading portfolio assets but are identified asAssets pledged as collateral which may be sold or repledged by counterparties. Such assets continue to be measured at fair value.
Refer to Note 13 for more information on trading portfolio assets and liabilities.
8) Financial assets and financial liabilities designated at fair value through profit or loss, (“fair value option”)
A financial instrument may only be designated at fair value through profit or loss upon initial recognition and this designation cannot be changed subsequently. Financial assets and financial liabilities designated at fair value are presented on separate lines on the face of the balance sheet. The fair value option can be applied only if one of the following criteria is met:
| – | | the financial instrument is a hybrid instrument which includes a substantive embedded derivative; |
| – | | the financial instrument is part of a portfolio which is risk managed on a fair value basis and reported to senior management on that basis or |
| – | | the application of the fair value option eliminates or significantly reduces an accounting mismatch that would otherwise arise. |
UBS has used the fair value option to designate most of its issued hybrid debt instruments as financial liabilities designated at fair value through profit or loss, on the basis that such financial instruments include embedded derivatives and/or are managed on a fair value basis. Such hybrid debt instruments predominantly include the following:
| – | | Credit-linked bonds or notes: linked to the performance (coupon and/or redemption amount) of single names (such as a company or a country) or a basket of reference entities; |
| – | | Equity-linked bonds or notes: linked to a single stock, a basket of stocks or an equity index and |
| – | | Rates-linked bonds or notes: linked to a reference interest rate, interest rate spread or formula. |
The fair value option is applied to certain loans and loan commitments, otherwise accounted for at amortized cost, which are hedged predominantly with credit derivatives. The application of the fair value option to the loans and loan commitments reduces an accounting mismatch, as the credit derivatives are accounted for as derivative instruments at fair value through profit or loss.
In order to reduce an accounting mismatch, UBS has also applied the fair value option to certain structured loans and reverse repurchase and securities borrowing agreements which are part of portfolios managed on a fair value basis.
Similarly, the fair value option is applied to assets held to hedge deferred cash-settled employee compensation awards, in order to reduce an accounting mismatch that would arise due to the liability being measured on a fair value basis.
Fair value changes related to financial instruments designated at fair value through profit or loss are recognized inNet trading income. Interest income and interest expense on financial assets
Note 1 Summary of significant accounting policies (continued)
and liabilities designated at fair value through profit or loss are recognized inInterest income on financial assets designated at fair valueorInterest expense on financial liabilities designated at fair value, respectively.
UBS applies the same recognition and derecognition principles to financial instruments designated at fair value as to financial instruments in the trading portfolio. Refer to items 5) and 7) for more information.
Refer to Notes 3, 20, 24e and 27d for more information on financial assets and liabilities designated at fair value.
9) Financial investments available-for-sale
Financial investments available-for-sale are non-derivative financial assets that are not classified as held for trading, designated at fair value through profit or loss, or loans and receivables. They are recognized on a settlement date basis.
Financial investments available-for-sale include debt securities held as part of the multi-currency portfolio of unencumbered, high-quality, short-term assets managed centrally by Group Treasury, strategic equity investments, certain investments in real estate funds, certain equity instruments including private equity investments, and debt instruments and non-performing loans acquired in the secondary market.
Financial investments available-for-sale are recognized initially at fair value less transaction costs and are measured subsequently at fair value. Unrealized gains and losses are reported inEquity, net of applicable income taxes, until such investments are sold, collected or otherwise disposed of, or until any such investment is determined to be impaired. Unrealized gains before tax are presented separately from unrealized losses before tax in Note 15.
For monetary instruments (such as debt securities), foreign exchange translation gains and losses determined by reference to the instrument’s amortized cost basis are recognized inNet trading income. Foreign exchange translation gains and losses related to other changes in fair value are recognized inOther comprehensive income. Foreign exchange translation gains and losses associated with non-monetary instruments (such as equity securities) are part of the overall fair value change of the instruments and are recognized directly inOther comprehensive income.
Interest and dividend income on financial investments available-for-sale are included in Interest and dividend income from financial investments available-for-sale. Interestincome is determined by reference to the instrument’s amortized cost basis using the effective interest rate (EIR).
On disposal of an investment, any related accumulated unrealized gains or losses included inEquity are transferred to the Income statement and reported inOther income. Gainsor losses on disposal are determined using the average cost method.
At each balance sheet date, UBS assesses whether indicators of impairment are present for an available-for-sale investment. An available-for-sale investment is impaired when there is objective evidence that, as a result of one or more events that occurred after the
initial recognition of the investment, the estimated future cash flows from the investment have decreased. A significant or prolonged decline in the fair value of an available-for-sale equity instrument below its original cost is considered objective evidence of an impairment. In the event of a significant decline in fair value below its original cost (20%) or a prolonged decline (six months), an impairment is recorded unless facts and circumstances clearly indicate that this information, on its own, is not evidence of an impairment.
For debt investments, objective evidence of impairment includes significant financial difficulty for the issuer or counterparty, default or delinquency in interest or principal payments, or it becoming probable that the borrower will enter bankruptcy or financial reorganization. If a financial investment available-for-sale is determined to be impaired, the related cumulative net unrealized loss previously recognized inEquity is included in the income statement withinOther income. For equity instruments, any further loss is recognized directly in the income statement, whereas for debt instruments, any further loss is recognized in the income statement only if there is additional objective evidence of impairment. After the recognition of an impairment on a financial investment available-for-sale, increases in the fair value of equity instruments are reported inEquity and increases in the fair value of debt instruments up to amortized cost in original currency are recognized inOther income, provided that the fair value increase is related to an event occurring after the impairment loss was recorded.
UBS applies the same recognition and derecognition principles to financial assets available-for-sale as to financial instruments in the trading portfolio (refer to items 5) and 7) for more information), except that unrealized gains and losses between trade date and settlement date are recognized inEquity rather than in the income statement.
Refer to Note 15 for more information on financial investments available-for-sale.
10) Loans and receivables
Loans and receivables are non-derivative financial assets with fixed or determinable payments that are not quoted in an active market, not classified as held-for-trading, not designated as at fair value through profit and loss or available-for-sale, and are not assets for which the Group may not recover substantially all of its initial net investment, other than because of a credit deterioration. Financial assets classified as loans and receivables include:
| – | | originated loans where funding is provided directly to the borrower; |
| – | | participation in a loan from another lender and purchased loans; |
| – | | securities which are classified as loans and receivables at acquisition date, such as auction rate securities; |
| – | | securities previously in the trading portfolio and reclassified to loans and receivables (refer to Note 27c for more information) and |
| – | | loans such as leverage finance loans previously in the trading portfolio and reclassified to loans and receivables (refer to Note 27c for more information). |
363
Financial information
Notes to the consolidated financial statements
Note 1 Summary of significant accounting policies (continued)
Loans and receivables are recognized when UBS becomes a party to the contractual provisions of the instrument, which is when funding is advanced to borrowers. They are recorded initially at fair value, based on the amount provided to originate or purchase the loan or receivable, together with any transaction costs directly attributable to the acquisition. Subsequently, they are measured at amortized cost using the EIR method, less allowances for credit losses. Refer to item 11) for information on allowances for credit losses and to Note 27a for an overview of the financial assets classified as loans and receivables.
Interest on loans and receivables is included inInterest earned on loans and advances and is recognized on an accrual basis. Upfront fees and direct costs relating to loan origination, re-financing or restructuring as well as to loan commitments are generally deferred and amortized toInterest earned on loans and advances over the life of the loan using the EIR method. Where no loan is expected to be advanced, any fees are recognized as follows:
| – | | for loan commitments that are not expected to result in a loan being advanced, the fees are recognized inCommission incomeover the commitment period and |
| – | | for loan syndication fees where UBS does not retain a portion of the syndicated loan, or where UBS does retain a portion of the syndicated loan at the same effective yield for comparable risk as other participants, fees are credited toCommission incomewhen the services have been provided. |
Presentation of receivables from central banks
Deposits with central banks which are available on demand are presented on the balance sheet asCash and balances with central banks. All longer-dated receivables with central banks are presented underDue from banks.
Financial assets reclassified to loans and receivables
When a financial asset is reclassified from held for trading to loans and receivables, the financial asset is reclassified at its fair value on the date of reclassification. Any gain or loss recognized in the income statement before reclassification is not reversed. The fair value of a financial asset on the date of reclassification becomes its cost basis going forward. In 2008 and 2009, UBS determined that certain financial assets classified as held for trading were no longer held for the purpose of selling or repurchasing in the near term and that the Group had the intention and ability to hold these assets for the foreseeable future, considered to be a period of approximately twelve months from the reclassification. Therefore, these assets were reclassified from held for trading to loans and receivables (refer to Note 27c for more information).
Renegotiated loans
A renegotiated or restructured loan is a loan for which the terms have been modified or for which additional collateral has been requested that was not contemplated in the original contract.
Typical key features of terms and conditions granted through renegotiation to avoid default include the provision of special interest rates, postponement of interest or amortization payments, modification of the schedule of repayments or amendment of loan maturity. There is no change in the EIR following a renegotiation.
If a loan is renegotiated with concessionary conditions (i.e., new terms and conditions are agreed which do not meet the normal market criteria for the quality of the obligor and the type of loan,) the position is still classified as non-performing and is rated as being in counterparty default. It will remain so until the loan is collected or written off and will be assessed for impairment on an individual basis.
If a loan is renegotiated on a non-concessionary basis (e.g., additional collateral is provided by the client, or new terms and conditions are agreed which meet the normal market criteria, for the quality of the obligor and the type of loan,) the loan will be re-rated using the Group’s regular rating scale. In these circumstances, the loan is removed from impaired status and therefore included in our collective assessment of loan loss allowances. For the purposes of measuring credit losses, within the collective loan loss assessment these loans are not segregated from other loans which have not been renegotiated. Management regularly reviews all loans to ensure that all criteria according to the loan agreement continue to be met and that future payments are likely to occur.
A restructuring of a loan could lead to a fundamental change in the terms and conditions of a loan, resulting in the original loan being derecognized and a new loan being recognized. A change is considered fundamental if the present value of the contractual cash flows (as a proportion of notional) has been changed by 10% or more, or there has been a significant change in the risk profile of the loan.
If a loan is derecognized in these circumstances, the new loan is measured at fair value at initial recognition. Any allowance taken to date against the original loan is eliminated and is not attributed to the new loan. Consequently, the new loan is not considered impaired and is included within the general collective loan assessment for the purpose of measuring credit losses.
11) Allowances and provisions for credit losses
An allowance or provision for credit losses is established if there is objective evidence that the Group will be unable to collect all amounts due (or the equivalent thereof) on a claim based on the original contractual terms due to credit deterioration of the issuer or counterparty. A “claim” means a loan or receivable carried at amortized cost, or a commitment such as a letter of credit, a guarantee, or another similar instrument. Objective evidence of impairment includes significant financial difficulty for the issuer or counterparty, default or delinquency in interest or principal payments, or it becoming probable that the borrower will enter bankruptcy or financial reorganization.
Note 1 Summary of significant accounting policies (continued)
An allowance for credit losses is reported as a reduction of the carrying value of a claim on the balance sheet. For an off-balance-sheet item, such as a commitment, a provision for credit loss is reported inProvisions. Changes to allowances and provisions for credit losses are recognized asCredit loss expense.
Allowances and provisions for credit losses are evaluated at both a counterparty-specific level and collectively based on the following principles:
Counterparty-specific: A loan is considered impaired when management determines that it is probable that the Group will not be able to collect all amounts due (or the equivalent value thereof) based on the original contractual terms. Individual credit exposures are evaluated based on the borrower’s character, overall financial condition and capacity, resources and payment record, the prospects for support from any financially responsible guarantors and, where applicable, the realizable value of any collateral. The estimated recoverable amount is the present value, using the claim’s original EIR, of expected future cash flows including amounts that may result from restructuring or the liquidation of collateral. If a loan has a variable interest rate, the discount rate for measuring any impairment loss is the current EIR. Impairment is measured and allowances for credit losses are established based on the difference between the carrying amount and the estimated recoverable amount. Upon impairment, the accrual of interest income based on the original terms of the loan is discontinued. The increase of the present value of the impaired loan due to the passage of time is reported asInterest income.
All impaired loans are reviewed and analyzed at least annually. Any subsequent changes to the amounts and timing of the expected future cash flows compared with prior estimates result in a change in the allowance for credit losses and are charged or credited toCredit loss expense/recovery. An allowance for impairment is reversed only when the credit quality has improved to such an extent that there is reasonable assurance of timely collection of principal and interest in accordance with the original contractual terms of the claim, or the equivalent value thereof. A write-off is made when all or part of a claim is deemed uncollectible or forgiven. Write-offs reduce the principal amount of a claim and are charged against previously established allowances for credit losses or, if no allowance has been established previously, directly toCredit loss expense/recovery. Recoveries, in part or in full, of amounts previously written off are credited toCredit loss expense/recovery.
A loan is classified as non-performing when the payment of interest, principal or fees is overdue by more than 90 days, when insolvency proceedings have commenced, or when obligations have been restructured on concessionary terms. Loans are evaluated individually for impairment when amounts have been overdue by more than 90 days, or sooner if other objective evidence indicates that a loan may be impaired.
Collectively: All loans for which no impairment is identified at a counterparty-specific level are grouped on the basis of the Group’s
internal credit grading system that considers credit risk characteristics such as asset type, industry, geographical location, collateral type, past-due status and other relevant factors, to collectively assess whether impairment exists within a portfolio. Future cash flows for a group of financial assets that are collectively evaluated for impairment are estimated on the basis of historical loss experience for assets with credit risk characteristics similar to those in the group. Historical loss experience is adjusted on the basis of current observable data to reflect the effects of current conditions of the group of financial assets on which the historical loss experience is based and to remove the effects of conditions in the historical period that do not exist currently in the portfolio. Estimates of changes in future cash flows for the group of financial assets reflect, and are directionally consistent with, changes in related observable data from year to year. The methodology and assumptions used for estimating future cash flows for the group of financial assets are reviewed regularly to reduce any differences between loss estimated and actual loss experience. Allowances from collective assessment of impairment are recognized asCredit loss expense/recovery and result in an offset to the aggregated loan position. As the allowance cannot be allocated to individual loans, the loans are not considered to be impaired and interest is accrued on each loan according to its contractual terms. If objective evidence becomes available that indicates that an individual financial asset is impaired, it is removed from the group of financial assets assessed for impairment on a collective basis and is assessed separately as a counterparty-specific claim.
Reclassified securities and acquired securities carried at amortized cost: Estimated cash flows associated with financial assets reclassified from the held for trading category to loans and receivables in accordance with the requirements in item 10) and other similar assets acquired subsequently are revised periodically. Adverse revisions in cash flow estimates related to credit events are recognized in the income statement asCredit loss expense. For reclassified securities, increases in estimated future cash receipts, as a result of increased recoverability over those expected at the time of reclassification, are recognized as an adjustment to the EIR on the loan from the date of change (refer to Note 27c for more information).
Refer to Note 12 for more information on allowances and provisions for credit loss.
12) Securitization structures set up by UBS
UBS securitizes certain financial assets, generally sellingTrading portfolio assets to SE which issue securities to investors. UBS applies the policies set out in item 3) in determining whether the respective SE must be consolidated and those set out in item 5) in determining whether derecognition of transferred financial assets is appropriate. The following statements mainly apply to transfers of financial assets which qualify for derecognition.
Gains or losses related to the sale ofTrading portfolio assets involving a securitization are generally recognized when the derecognition criteria are satisfied with the gain or loss being classified in Net trading income.
Financial information
Notes to the consolidated financial statements
Note 1 Summary of significant accounting policies (continued)
Interests in the securitized financial assets may be retained in the form of senior or subordinated tranches, interest-only strips or other residual interests (“retained interests”). Retained interests are primarily recorded inTrading portfolio assets and are carried at fair value. Synthetic securitization structures typically involve derivative financial instruments for which the principles set out in item 15) apply.
UBS acts as structurer and placement agent in various mortgage-backed securities (MBS) and other asset-backed securities (ABS) securitizations. In such capacity, UBS may purchase collateral on its own behalf or on behalf of clients during the period prior to securitization. UBS then typically sells the collateral into designated trusts upon closing of the securitization. In other securitizations, UBS may only provide financing to a designated trust in order to fund the purchase of collateral by the trust prior to securitization. UBS underwrites the offerings to investors, earning fees for its placement and structuring services. Consistent with the valuation of similar inventory, fair value of retained tranches is initially and subsequently determined using market price quotations where available or internal pricing models that utilize variables such as yield curves, prepayment speeds, default rates, loss severity, interest rate volatilities and spreads. Where possible, assumptions based on observable transactions are used to determine the fair value of retained interests, but for some interests substantially no observable information is available.
Refer to Note 30c for more information on the Group’s involvement with securitization entities.
13) Securities borrowing and lending
Securities borrowing and securities lending transactions are generally entered into on a collateralized basis. In such transactions, UBS typically borrows or lends equity and debt securities in exchange for securities or cash collateral. Additionally, UBS borrows securities from its clients’ custody accounts in exchange for a fee. The transactions are normally conducted under standard agreements employed by financial market participants and are undertaken with counterparties subject to UBS’s normal credit risk control processes. UBS monitors on a daily basis the market value of the securities received or delivered and requests or provides additional collateral or returns or recalls surplus collateral in accordance with the underlying agreements.
Cash collateral received is recognized with a corresponding obligation to return it(Cash collateral on securities lent) and cash collateral delivered is derecognized and a corresponding receivable reflecting UBS’s right to receive it back is recorded(Cash collateral on securities borrowed). The securities which have been transferred are not recognized on, or derecognized from, the balance sheet unless the risks and rewards of ownership are also transferred. Refer to item 5) for more information. UBS-owned securities transferred to a borrower that is
granted the right to sell or repledge those transferred securities are presented on the balance sheet asTrading portfolio assets, of which: assets pledged as collateral. Securities received in a borrowing transaction are disclosed as off-balance-sheet items if UBS has the right to resell or repledge them, with additional disclosure provided for securities that UBS has actually resold or repledged. The sale of securities which is settled by delivering securities received in a borrowing or lending transaction generally triggers the recognition of a trading liability (short sale). Where securities are either received or paid in lieu of cash (“securities for securities” transactions), neither the securities received (paid) nor the obligation to return (right to receive) the securities are recognized on the balance sheet, as the derecognition criteria are not met. Refer to item 5) for more information.
Interest receivable or payable for financing transactions is recognized in the income statement on an accrual basis and is recorded asInterest income orInterest expense.
Refer to Notes 11, 25 and 26 for more information on securities borrowing and lending.
14) Repurchase and reverse repurchase transactions
Securities purchased under agreements to resell(Reverse repurchase agreements) and securities sold under agreements to repurchase(Repurchase agreements) are treated as collateralized financing transactions. Nearly all reverse repurchase and repurchase agreements involve debt instruments, such as bonds, notes or money market paper. The transactions are normally conducted under standard agreements employed by financial market participants and are undertaken with counterparties subject to UBS’s normal credit risk control processes. UBS monitors on a daily basis the market value of the securities received or delivered and requests or provides additional collateral or returns or recalls surplus collateral in accordance with the underlying agreements.
In a reverse repurchase agreement, the cash delivered is derecognized and a corresponding receivable, including accrued interest, is recorded in the balance sheet lineReverse repurchase agreements, recognizing UBS’s right to receive the cash back. In a repurchase agreement, the cash received is recognized and a corresponding obligation, including accrued interest, is recorded in the balance sheet lineRepurchase agreements. Securities received under reverse repurchase agreements and securities delivered under repurchase agreements are not recognized on or derecognized from the balance sheet, unless the risks and rewards of ownership are transferred. UBS-owned securities transferred to a recipient that is granted the right to resell or repledge them are presented on the balance sheet asTrading portfolio assets, of which: assets pledged as collateral. Securities received in reverse repurchase agreements are disclosed as off-balance-sheet items if UBS has the right to resell or repledge them, with additional disclosure provided for securities that UBS has actually resold or repledged (refer to Note 25 for more information). Additionally, the sale of securities which is settled by delivering securities received in
Note 1 Summary of significant accounting policies (continued)
reverse repurchase transactions generally triggers the recognition of a trading liability (short sale).
Interest earned on reverse repurchase agreements and interest incurred on repurchase agreements is recognized as interest income or interest expense over the life of each agreement.
The Group generally offsets reverse repurchase agreements and repurchase agreements with the same counterparty, maturity, currency and Central Securities Depository (CSD) in accordance with the relevant accounting requirements. Refer to item 35) for more information.
Refer to Notes 11, 25 and 26 for more information on repurchase and reverse repurchase transactions.
15) Derivative instruments and hedge accounting
Derivatives are initially recognized at fair value on the date the derivative contract is entered into and are remeasured subsequently to fair value. The method of recognizing fair value gains or losses depends on whether derivatives are held for trading or are designated and effective as hedging instruments. If designated as hedging instruments, the method of recognizing gains or losses depends on the nature of the risk being hedged as described within this item.
Derivative instruments are generally reported on the balance sheet asPositive replacement values orNegative replacement values. Derivative instruments that trade on an exchange or through a clearing house are generally classified asCash collateral receivables on derivative instrumentsorCash collateral payables on derivative instruments. They are not classified within replacement values because the change in fair value of these instruments is settled each day, either in fact or in substance, through the cash payment of variation margin. Products that receive this treatment are futures contracts, 100% daily margined exchange-traded options, interest rate swaps transacted with the London Clearing House and certain credit derivative contracts. Changes in the fair values of derivatives are recorded inNet trading income, unless the derivatives are designated and effective as hedging instruments in certain types of hedge accounting relationships.
Refer to Note 14 for more information on derivative instruments and hedge accounting.
Hedge accounting
The Group uses derivative instruments as part of its risk management activities to manage exposures particularly to interest rate and foreign currency risks, including exposures arising from forecast transactions. If derivative and non-derivative instruments meet certain criteria specified below, they may be designated as hedging instruments in hedges of the change in fair value of recognized assets or liabilities (“fair value hedges”), hedges of the variability in future cash flows attributable to a recognized asset or liability or highly probable forecast transactions (“cash flow hedges”) or hedges of a net investment in a foreign operation (“net investment hedges”).
At the time a financial instrument is designated in a hedge relationship, the Group formally documents the relationship between the hedging instrument(s) and hedged item(s), including the risk management objectives and strategy in undertaking the hedge transaction and the methods that will be used to assess the effectiveness of the hedging relationship. Accordingly, the Group assesses, both at the inception of the hedge and on an ongoing basis, whether the hedging instruments, primarily derivatives, have been “highly effective” in offsetting changes in the fair value or cash flows associated with the designated risk of the hedged items. A hedge is considered highly effective if the following criteria are met: a) at inception of the hedge and throughout its life, the hedge is expected to be highly effective in achieving offsetting changes in fair value or cash flows attributable to the hedged risk and b) actual results of the hedge are within a range of 80% to 125%. In the case of hedging forecast transactions, the transaction must have a high probability of occurring and must present an exposure to variations in cash flows that could ultimately affect the reported net profit or loss. The Group discontinues hedge accounting voluntarily, or when the Group determines that a hedging instrument is not, or has ceased to be, highly effective as a hedge, when the derivative expires or is sold, terminated or exercised, when the hedged item matures, is sold or repaid or when forecast transactions are no longer deemed highly probable.
Hedge ineffectiveness represents the amount by which the changes in the fair value of the hedging instrument differ from changes in the fair value of the hedged item attributable to the hedged risk, or the amount by which changes in the present value of future cash flows of the hedging instrument exceed changes in the present value of (expected) future cash flows of the hedged item. Such ineffectiveness is recorded in current period earnings inNet trading income. Interest income and expense on derivatives designated as hedging instruments in effective hedge relationships is included inNet interest income.
Fair value hedges
For qualifying fair value hedges, the change in the fair value of the hedging instrument is recognized in the income statement along with the change in the fair value of the hedged item that is attributable to the hedged risk. In fair value hedges of interest rate risk, the fair value change of the hedged item attributable to the hedged risk is reflected in the carrying value of the hedged item. If the hedge accounting relationship is terminated for reasons other than the derecognition of the hedged item, the difference between the carrying value of the hedged item at that point and the value at which it would have been carried had the hedge never existed (the “unamortized fair value adjustment”) is amortized to the income statement over the remaining term to maturity of the hedged item.
For a portfolio hedge of interest rate risk, the equivalent change in fair value is reflected withinOther assets orOther liabilities. If the hedge relationship is terminated for reasons other than the derecognition of the hedged item, the amount included in Other assets or Otherliabilities is
Financial information
Notes to the consolidated financial statements
Note 1 Summary of significant accounting policies (continued)
amortized to the income statement over the remaining term to maturity of the hedged items.
Cash flow hedges
Fair value gains or losses associated with the effective portion of derivatives designated as cash flow hedges for cash flow repricing risk are recognized initially inEquity. When the hedged forecast cash flows affect profit or loss, the associated gains or losses on the hedging derivatives are reclassified fromEquity to profit or loss.
If a cash flow hedge for forecasted transactions is deemed to be no longer effective, or if the hedge relationship is terminated, the cumulative gains or losses on the hedging derivatives previously reported inEquity remain there until the committed or forecasted transactions occur and affect profit or loss. If the forecasted transactions are no longer expected to occur, the deferred gains or losses are reclassified immediately to profit or loss.
Hedges of net investments in foreign operations
Hedges of net investments in foreign operations are accounted for similarly to cash flow hedges. Gains or losses on the hedging instrument relating to the effective portion of the hedge are recognized directly inEquity (and presented in the statement of changes in equity and statement of comprehensive income underForeign currency translation), while any gains or losses relating to the ineffective and/or undesignated portion (for example, the interest element of a forward contract) are recognized in the income statement. Upon loss of control of the foreign operation or its liquidation, the cumulative value of any such gains or losses associated with the entity, and recognized directly inEquity, is reclassified to the income statement.
Economic hedges that do not qualify for hedge accounting
Derivative instruments that are transacted as economic hedges but do not qualify for hedge accounting are treated in the same way as derivative instruments used for trading purposes (i.e., realized and unrealized gains and losses are recognized inNet trading income), except for the forward points on certain short duration foreign exchange contracts, which are reported inNet interest income. Refer to Note 14 for more information on economic hedges.
Embedded derivatives
Derivatives may be embedded in other financial instruments (“host contracts”), for example, they could be represented by the conversion feature embedded in a convertible bond. Such combinations are known as hybrid instruments and arise predominantly from the issuance of certain structured debt instruments. An embedded derivative is generally required to be separated from the host contract and accounted for as a standalone derivative instrument at fair value through profit or loss if:
(i) the host contract is not carried at fair value with changes in fair value reported in the income statement, (ii) the economic characteristics and risks of the embedded derivative are not closely related to the economic characteristics and risks of the host contract and (iii) the terms of the embedded derivative would meet the definition of a standalone derivative were they contained in a separate contract. Bifurcated embedded derivatives are presented on the same balance sheet line as the host contract, and are shown in Note 27a in the “Held for trading” category, reflecting the measurement and recognition principles applied.
Typically, UBS applies the fair value option to hybrid instruments (refer to item 8) for more information), in which case bifurcation of an embedded derivative component is not required.
16) Loan commitments
Loan commitments are defined amounts (unutilized credit lines or undrawn portions of credit lines) against which clients can borrow money under defined terms and conditions.
Loan commitments that can be cancelled by UBS at any time (without giving a reason) according to their general terms and conditions, are not recognized on the balance sheet and are not included in the off-balance-sheet disclosures. Upon a loan draw-down by the counterparty, the amount of the loan is accounted for in accordance withLoans and receivables. Refer to item 10) for more information.
Irrevocable loan commitments (where UBS has no right to withdraw the loan commitment once communicated to the beneficiary, or which are revocable only due to automatic cancellation upon deterioration in a borrower’s creditworthiness) are classified into the following categories:
| – | | derivative loan commitments, being loan commitments that can be settled net in cash or by delivering or issuing another financial instrument, or loan commitments for which there is evidence of selling loans resulting from similar loan commitments before or shortly after origination; |
| – | | loan commitments designated at fair value through profit and loss (refer to item 8) for more information) and |
| – | | all other loan commitments. These are not recorded in the balance sheet, but a provision is recognized if it is probable that a loss has been incurred and a reliable estimate of the amount of the obligation can be made. Other loan commitments include irrevocable forward starting reverse repurchase and irrevocable securities borrowing agreements. Any change in the liability relating to these other loan commitments is recorded in the income statement inCredit loss expense/recovery. Refer to items 11) and 27) for more information. | |
17) Financial guarantee contracts
Financial guarantee contracts are contracts that require the issuer to make specified payments to reimburse the holder for an incurred loss because a specified debtor fails to make payments
368
Note 1 Summary of significant accounting policies (continued)
when due in accordance with the terms of a specified debt instrument. UBS issues such financial guarantees to banks, financial institutions and other parties on behalf of clients to secure loans, overdrafts and other banking facilities.
Certain written financial guarantees that are managed on a fair value basis are designated at fair value through profit or loss. Refer to item 8) for more information. Financial guarantees that are not managed on a fair value basis are initially recognized in the financial statements at fair value. Subsequent to initial recognition, these financial guarantees are measured at the higher of the amount initially recognized less cumulative amortization, and to the extent a payment under the guarantee has become probable, the present value of the expected payment. Any change in the liability relating to probable expected payments resulting from guarantees is recorded in the income statement inCredit loss expense/recovery.
18) Cash and cash equivalents
For the purposes of the statement of cash flows, cash and cash equivalents comprise balances with an original maturity of three months or less including cash, money market paper and balances with central and other banks.
19) Physical commodities
Physical commodities (precious metals, base metals and other commodities) held by UBS as a result of its broker-trader activities are accounted for at fair value less costs to sell and recognized withinTrading portfolio assets. Changes in fair value less costs to sell are recorded inNet trading income.
20) Property and equipment
Property and equipment includes own-used properties, investment properties, leasehold improvements, information technology hardware, externally purchased and internally developed software and communication and other similar equipment. With the exception of investment properties,Property and equipment is carried at cost (which includes capitalized interest from associated borrowings, where applicable), less accumulated depreciation and impairment losses, and is reviewed periodically for impairment.
Refer to Note 16 for more information on property and equipment.
Classification of own-used property
Own-used property is defined as property held by the Group for use in the supply of services or for administrative purposes, whereas investment property is defined as property held to earn rental income and/or for capital appreciation. Where a property of the Group includes an own-used portion and an investment portion which can be sold separately, they are separately accounted for as own-used property and investment property. If the portions cannot be sold separately, the whole property is
classified as own-used unless the portion used by the Group is minor. The classification of property is reviewed on a regular basis. When the use of a property changes from own-used to investment property, the property is remeasured to fair value and reclassified as investment property. Any gain arising on remeasurement is recognized in profit or loss to the extent that it reverses a previous impairment loss on the specific property, with any remaining gain recognized inOther comprehensive income and presented in the revaluation reserve in equity. Any loss is recognized immediately in profit or loss. When an investment property is reclassified as own-used property, its fair value at the date of reclassification becomes its cost basis for subsequent measurement purposes.
Investment property
Investment property is carried at fair value with changes in fair value recognized in the income statement inOther income in the period of change.
Leasehold improvements
Leasehold improvements are investments made to customize buildings and offices occupied under operating lease contracts to make them suitable for their intended purpose. The present value of estimated reinstatement costs required to bring a leased property back into its original condition at the end of the lease is capitalized as part of total leasehold improvements with a corresponding liability recognized to reflect the obligation incurred. Reinstatement costs are recognized in profit and loss through depreciation of the capitalized leasehold improvements over their estimated useful lives and the liability is relieved as cash payments are applied.
Property held for sale
Where UBS has decided to sell non-current assets such as property or equipment and the sale of these assets is highly probable to occur within 12 months, these assets are classified as non-current assets held for sale and are reclassified toOther assets. Upon classification as held for sale, they are no longer depreciated and are carried at the lower of book value or fair value less cost to sell.
Software
Software development costs are recognized only when the costs can be measured reliably and it is probable that future economic benefits will arise. Internally generated software that meets these criteria is classified in property and equipment, together with purchased software.
Estimated useful life of property and equipment
Property and equipment is depreciated on a straight-line basis over its estimated useful life as follows.
369
Financial information
Notes to the consolidated financial statements
Note 1 Summary of significant accounting policies (continued)
| | |
| | | |
| Properties, excluding land | | Not exceeding 67 years |
| | | |
| Leasehold improvements | | Residual lease term |
| | | |
| Other machines and equipment | | Not exceeding 10 years |
| | | |
| IT hardware and communication equipment | | Not exceeding 5 years |
| | | |
| Software | | Not exceeding 5 years |
| | | |
21) Goodwill and intangible assets
Goodwill represents the excess of the cost of an acquisition over the fair value of the Group’s share of net identifiable assets of the acquired entity at the date of acquisition. Goodwill is not amortized. It is tested annually for impairment and, additionally, when an indication of impairment exists at the end of each reporting period. For goodwill impairment testing purposes, UBS considers the segments reported in Note 2a as separate cash-generating units, since this is the level at which the performance of investments is reviewed and assessed by management. The recoverable amount of a segment is determined on the basis of its value-in-use.
Intangible assets comprise separately identifiable intangible items arising from business combinations and certain purchased trademarks and similar items. Intangible assets are recognized at cost. The cost of an intangible asset acquired in a business combination is its fair value at the date of acquisition. Intangible assets with a definite useful life are amortized using the straight-line method over their estimated useful economic life, generally not exceeding 20 years. Intangible assets with an indefinite useful life are not amortized. In nearly all cases, identified intangible assets have a definite useful life. At each balance sheet date, intangible assets are reviewed for indications of impairment. If such indications exist, the intangible assets are analyzed to assess whether their carrying amount is fully recoverable. An impairment loss is recognized if the carrying amount exceeds the recoverable amount.
Intangible assets are classified into two categories: (i) infrastructure and (ii) customer relationships, contractual rights and other. Infrastructure consists of a branch network intangible asset recognized in connection with the acquisition of PaineWebber Group, Inc. Client relationships, contractual rights and other includes mainly intangible assets for client relationships, non-compete agreements, favorable contracts, trademarks and trade names acquired in business combinations.
Refer to Note 17 for more information on goodwill and intangible assets.
22) Income taxes
Income tax payable on profits is recognized as an expense based on the applicable tax laws in each jurisdiction in the period in which profits arise. The tax effects of income tax losses available for carry forward are recognized as a deferred tax asset if it is probable that future taxable profit (based on profit forecast assumptions) will be available against which those losses can be utilized.
Deferred tax assets are recognized for temporary differences that will result in deductible amounts in future periods, but only to the extent that it is probable that sufficient taxable profits will be available against which these differences can be utilized. Deferred tax liabilities are recognized for temporary differences between the carrying amounts of assets and liabilities in the balance sheet and their amounts as measured for tax purposes, which will result in taxable amounts in future periods. Deferred tax assets and liabilities are measured at the tax rates that are expected to apply in the period in which the asset will be realized or the liability will be settled based on enacted rates.
Tax assets and liabilities of the same type (current or deferred) are offset when they arise from the same tax reporting group, they relate to the same tax authority, the legal right to offset exists, and they are intended to be settled net or realized simultaneously.
Current and deferred taxes are recognized as income tax benefit or expense in the income statement except for current and deferred taxes recognized (i) upon the acquisition of a subsidiary, (ii) for unrealized gains or losses on financial investments available-for-sale, for changes in fair value of derivative instruments designated as cash flow hedges, for remeasurements of defined benefit plans, and for certain foreign currency translations of foreign operations, (iii) for certain tax benefits on deferred compensation awards, and (iv) for gains and losses on the sale of treasury shares. Deferred taxes recognized in a business combination (point (i)) are considered when determining goodwill. Amounts relating to points (ii), (iii) and (iv) are recognized directly in equity asOther comprehensiveincome.
Refer to Note 8 for more information on income taxes.
23) Debt issued
Debt issued is carried at amortized cost. In cases where, as part of the Group’s risk management management activity, fair value hedge accounting is applied to fixed-rate debt instruments carried at amortized cost, their carrying amount is adjusted for changes in fair value related to the hedged exposure. Refer to item 15) for more information on hedge accounting. In most cases, structured notes issued are designated at fair value through profit or loss using the fair value option, on the basis that they are managed on a fair value basis, that the structured notes contain an embedded derivative, or both. Refer to item 8) for more information on the fair value option. The fair value option is not applied to certain structured notes that contain embedded derivatives that reference foreign exchange rates and/or precious metal prices. For these instruments, the embedded derivative component is measured on a fair value basis and the related underlying debt host component is measured on an amortized cost basis, with both components presented together withinDebt issued.
Debt issued and subsequently repurchased in relation to market-making or other activities is treated as redeemed. A gain or loss on redemption is recorded inOther income depending on
Note 1 Summary of significant accounting policies (continued)
whether the repurchase price of the bond is lower or higher than its carrying value. A subsequent sale of own bonds in the market is treated as a reissuance of debt. Interest expense on debt instruments measured at amortized cost is included inInterest on debt issued.
Refer to Note 21 for more information on debt issued.
24) Pension and other post-employment benefit plans
UBS sponsors a number of post-employment benefit plans for its employees worldwide, which include defined benefit and defined contribution pension plans, and other post-employment benefits such as medical and life insurance benefits that are payable after the completion of employment.
Refer to Note 28 for more information on pension and other post-employment benefit plans.
Defined benefit pension plans
Defined benefit pension plans specify an amount of benefit that an employee will receive, which is usually dependent on one or more factors such as age, years of service and compensation. The defined benefit liability recognized in the balance sheet is the present value of the defined benefit obligation less the fair value of the plan assets at the balance sheet date. If the fair value of the plan assets is higher than the present value of the defined benefit obligation, the measurement of the resulting defined benefit asset is limited to the present value of economic benefits available in the form of refunds from the plan or reductions in future contributions to the plan. UBS applies the projected unit credit method to determine the present value of its defined benefit obligations, the related current service cost and, where applicable, past service cost. These amounts, which take into account the specific features of each plan, including risk sharing between the employee and employer, are calculated periodically by independent qualified actuaries.
Defined contribution plans
A defined contribution plan is a pension plan under which UBS pays fixed contributions into a separate entity from which post-employment and other benefits are paid. UBS has no legal or constructive obligation to pay further contributions if the plan does not hold sufficient assets to pay employees the benefits relating to employee service in the current and prior periods. UBS’s contributions are expensed when the employees have rendered services in exchange for such contributions. This is generally in the year of contribution. Prepaid contributions are recognized as an asset to the extent that a cash refund or a reduction in future payments is available.
Other post-retirement benefits
UBS also provides post-retirement medical and life insurance benefits to certain retirees in the US and the UK. The expected costs of these benefits are recognized over the period of employment using the same accounting methodology used for defined benefit pension plans.
25) Equity participation and other compensation plans
Equity participation plans
UBS has established several equity participation plans in the form of share plans, option plans and share-settled stock appreciation right (SAR) plans. UBS’s equity participation plans include mandatory, discretionary and voluntary plans. UBS recognizes the fair value of share, option and SAR awards, determined at the date of grant, as compensation expense over the period that the employee is required to provide services in order to earn the award.
Awards that do not require the employee to provide future service to become entitled to the award, such as those granted to retirement eligible employees, including those employees who meet full career retirement criteria, are considered vested at the grant date. Compensation expense is fully recognized on the grant date, or in a period prior to the grant date if it is attributable to past service, and the amount of the award can be reasonably and reliably estimated. Such awards remain forfeitable until the legal vesting date if certain conditions are not met. Where no future service is required, forfeiture events occurring after the grant date do not result in a reversal of compensation expense because the related services have been received.
Plans requiring future service have either a tiered vesting structure, which vest in increments over a specified period, or a cliff vesting structure, which vest at the end of a specified period. Compensation expense is recognized over the service period on a tiered basis for awards that have a tiered vesting structure and on a straight-line basis for awards with a cliff vesting structure. Plans may contain provisions that shorten the required service period due to achievement of retirement eligibility or upon termination due to redundancy. In such instances, compensation expense is recognized over the period from grant date to the retirement eligibility or redundancy date. Forfeiture of these awards that occurs during the service period results in a reversal of compensation expense.
Awards settled in UBS shares or options are classified as equity instruments. The fair value of an equity-settled award is determined at the date of grant and is not subsequently remeasured, unless its terms are modified such that the fair value immediately after modification exceeds the fair value immediately prior to modification. Any increase in fair value resulting from a modification is recognized as compensation expense, either over the remaining service period or, for vested awards, immediately.
Cash-settled awards are classified as liabilities and are remeasured to fair value at each balance sheet date as long as the award is outstanding. Changes in fair value are reflected in compensation expense and, on a cumulative basis, no compensation expense is recognized for awards that expire worthless or remain unexercised.
Refer to Note 29 for more information on the determination of fair value of equity participation plans.
Financial information
Notes to the consolidated financial statements
Note 1 Summary of significant accounting policies (continued)
Other compensation plans
UBS has established other fixed and variable deferred compensation plans, the values of which are not linked to UBS’s own equity. Deferred cash compensation plans are either mandatory or discretionary plans and include awards based on a notional cash amount, where ultimate payout is fixed or may vary based on achievement of performance conditions. Compensation expense is recognized over the period that the employee is required to provide services in order to earn the award. If the employee is not required to provide future services, such as for awards granted to employees who are retirement eligible, including those employees who meet full career retirement criteria, compensation expense is recognized on or prior to the grant date. The amount recognized during the service period is based on an estimate of the amount expected to be paid out under the plan, such that cumulative expense recognized ultimately equals the cash distributed to employees. For awards in the form of alternative investment vehicles or similar structures, which provide employees with a payout based on the value of specified underlying assets, the initial value is based on the fair value on the grant date of the underlying assets (e.g., money market funds, UBS and non-UBS mutual funds and other UBS-sponsored funds). This initial value is recognized over the period that the employee provides service to become entitled to the award. These awards are remeasured to fair value at each reporting date until the award is distributed. Changes in fair value, including increases and decreases in value, are recognized proportionately to the elapsed service period. Forfeiture of these awards results in the reversal of compensation expense.
Refer to Note 29 for more information on other compensation plans.
26) Amounts due under unit-linked investment contracts
Financial liabilities from unit-linked investment contracts are presented asOther liabilities on the balance sheet. These contracts allow investors to invest in a pool of assets through issued investment units. The unit holders receive all rewards and bear all risks associated with the reference asset pool. The financial liability represents the amounts due to unit holders and is equal to the fair value of the reference asset pool. Assets held under unit-linked investment contracts are presented asTrading portfolio assets.
Refer to Notes 13 and 23 for more information on unit-linked investment contracts.
27) Provisions
Provisions are liabilities of uncertain timing or amount, and are recognized when UBS has a present obligation as a result of a past event, it is probable that an outflow of resources will be required to settle the obligation, and a reliable estimate of the amount of the obligation can be made.
The majority of UBS’s provisions relate to litigation, regulatory and similar matters, restructuring, employee benefits, real estate and loan commitments and guarantees. Provisions that are similar in nature are aggregated to form a class, while the remaining pro-visions, including
those of less significant amounts, are presented underOther provisions. Provisions are presented separately on the balance sheet and, when they are no longer considered uncertain in timing or amount, are reclassified toOther liabilities – Other.
The Group recognizes provisions for litigation, regulatory and similar matters when, in the opinion of management after seeking legal advice, it is more likely than not that the Group has a present legal or constructive obligation as a result of past events, it is probable that an outflow of resources will be required, and the amount can be reliably estimated.
Restructuring provisions are recognized when a detailed and formal restructuring plan has been approved and a valid expectation has been raised that the restructuring will be carried out, either through commencement of the plan or announcements to affected employees.
Provisions are recognized for lease contracts if the unavoidable costs of a contract exceed the benefits expected to be received under it (onerous lease contracts). For example, this may occur when a significant portion of leased property is expected to be vacant for an extended period.
Provisions for employee benefits are recognized mainly in respect of service anniversaries and sabbatical leave.
Provisions are recognized at the best estimate of the consideration required to settle the present obligation at the balance sheet date. Such estimates are based on all available information and are revised over time as more information becomes available. If the effect of the time value of money is material, provisions are discounted and measured at the present value of the expenditure expected to settle or discharge the obligation, using a rate that reflects the current market assessments of the time value of money and the risks specific to the obligation.
A provision is not recognized when UBS has a present obligation that has arisen from past events but it is not probable that an outflow of resources will be required to settle it, or a sufficiently reliable estimate of the amount of the obligation cannot be made. Instead, a contingent liability is disclosed. Contingent liabilities are also disclosed for possible obligations that arise from past events whose existence will be confirmed only by uncertain future events not wholly within the control of UBS.
Refer to Note 22 for more information on provisions.
28) Equity, treasury shares and contracts on UBS AG shares
Transaction costs related to share issuances
Incremental transaction costs directly attributable to the issue of new shares or contracts with mandatory gross physical settlement classified as equity instruments are recognized in and deducted fromEquity asTransaction costs related to share issuances, net of tax.
Non-controlling interests and preferred noteholders
Net profit andEquity are presented including non-controlling interests and preferred noteholders.Net profit is split intoNet
Note 1 Summary of significant accounting policies (continued)
profit attributable to UBS shareholders, Net profit attributable to non-controlling interests andNet profit attributable to preferred noteholders. Equity is split intoEquity attributable to UBS shareholders, Equity attributable to non-controlling interests andEquity attributable to preferred noteholders.
UBS AG shares held (“treasury shares”)
UBS AG shares held by the Group are presented inEquity as Treasury shares at their acquisition cost which includes transaction costs. Treasury shares are deducted fromEquity until they are cancelled or reissued. The difference between the proceeds from sales of treasury shares and their weighted average cost (net of tax, if any) is reported asShare premium.
Net cash settlement contracts
Contracts on UBS AG shares that require net cash settlement, or provide the counterparty or UBS with a settlement option which includes a choice of settling net in cash, are classified as held for trading, with changes in fair value reported in the income statement asNet trading income.
Contracts with mandatory gross physical settlement
UBS issues contracts with mandatory gross physical settlement in UBS AG shares where a fixed amount of shares is exchanged against a fixed amount of cash or another financial asset.
Written put options and forward share purchase contracts with gross physical settlement, including contracts where gross physical settlement is a settlement alternative, result in the recognition of a financial liability booked againstEquity. The financial liability is subsequently accreted, using the EIR method, over the life of the contract to the nominal purchase obligation with the amount recognized inInterest expense. Upon settlement of the contract, the liability is derecognized against the consideration paid, and the amount of equity originally recognized as a liability is reclassified withinEquity toTreasury shares. The premium received for writing such put options is recognized directly inShare premium.
All other contracts with mandatory gross physical settlement in UBS AG shares are presented inEquity asShare premium and accounted for at cost, which is added to or deducted fromEquity as appropriate. Upon settlement of such contracts, the difference between the proceeds received and their cost (net of tax, if any) is reported asShare premium.
Preferred notes issued to non-consolidated preferred securities entities
On 1 January 2013, UBS deconsolidated certain entities that issued preferred securities which resulted in UBS recognizing the subordinated notes (that is, the preferred notes) issued to these entities rather than the preferred securities issued by them. Except for one preferred note, which is presented as a liability, these are presented asEquity attributable to preferred noteholders. UBS AG has fully and unconditionally guaranteed all contractual payments
on the preferred securities. UBS’s obligations under these guarantees are subordinated to the full prior payment of the deposit liabilities of UBS and all other liabilities of UBS. Depending on whether the preferred notes include a contractual obligation to deliver cash, the preferred notes represent equity instruments or liabilities which are held by third parties. For instruments classified as equity, once a coupon payment becomes mandatory, that is, when it is triggered by a contractually defined event, the full dividend payment obligation on these preferred notes is reclassified from Equity to a corresponding liability. In the income statement the full dividend payment is reclassified fromNet profit attributable to UBS shareholders to Net profit attributable to preferred noteholders at that time. For instruments classified as liabilities, interest is accrued through the income statement and presented withinNet interest income.
29) Non-current assets held for sale
UBS classifies individual non-current assets and disposal groups as held for sale if such assets or disposal groups are available for immediate sale in their present condition subject to terms that are usual and customary for sales of such assets or disposal groups and their sale is considered highly probable. For a sale to be highly probable, management must be committed to a plan to sell such assets and must be actively looking for a buyer. Furthermore, the assets must be actively marketed at a reasonable sales price in relation to their fair value and the sale must be expected to be completed within one year. The assets held for sale and disposal groups are measured at the lower of their carrying amount and fair value less costs to sell and are presented inOther assets andOther liabilities. Non-current assets and liabilities of subsidiaries are classified as held for sale if their carrying amount will be recovered principally through a sale transaction rather than through continuing use.
Refer to Note 18 for more information on non-current assets held for sale.
30) Leasing
UBS enters into lease contracts, or contracts that include lease components, predominantly of premises and equipment, primarily as lessee. Leases that transfer substantially all the risks and rewards incidental to the ownership of assets, but not necessarily legal title, are classified as finance leases. All other leases are classified as operating leases.
Assets leased pursuant to finance leases are recognized on the balance sheet inProperty and equipment and are amortized over the lesser of the useful life of the asset or the lease term, with corresponding amounts payable included inDue to banks/customers. Finance charges payable are recognized inNet interest income over the period of the lease based on the interest rate implicit in the lease on the basis of a constant yield.
Lease contracts classified as operating leases where UBS is the lessee are disclosed in Note 33. These contracts include non-cancellable long-term leases of office buildings in most UBS locations.
Financial information
Notes to the consolidated financial statements
Note 1 Summary of significant accounting policies (continued)
Operating lease rentals payable are recognized as an expense on a straight-line basis over the lease term, which commences with control of the physical use of the property. Lease incentives are treated as a reduction of rental expense and are recognized on a consistent basis over the lease term.
Certain arrangements do not take the legal form of a lease but convey a right to use an asset in return for a payment or series of payments. For such arrangements, UBS determines at the inception of the arrangement whether the fulfillment of the arrangement is dependent on the use of a specific asset or assets and, if so, the arrangement is accounted for as a lease.
31) Fee income
UBS earns fee income from a diverse range of services it provides to its clients. Fee income can be divided into two broad categories: fees earned from services that are provided over a certain period of time (for example, investment fund fees, portfolio management and advisory fees) and fees earned from providing transaction-type services (for example, underwriting fees, corporate finance fees and brokerage fees). Fees earned from services that are provided over a certain period of time are recognized ratably over the service period, with the exception of performance-linked fees or fee components with specific performance criteria. Such fees are recognized when the performance criteria are fulfilled and when collectability is reasonably assured. Fees earned from providing transaction-type services are recognized when the service has been completed. Generally, fees are presented in the income statement in line with the balance sheet classification of the underlying instruments.
Loan commitment fees on lending arrangements, where there is an initial expectation that the facility will be drawn down, are deferred until the loan is drawn down and are then recognized as an adjustment to the effective yield over the life of the loan. If the commitment expires and the loan is not drawn down, the fees are recognized as revenue when the commitment expires. Where the initial expectation that the facility will be drawn down is remote, the loan commitment fees are recognized on a straight-line basis over the commitment period. If, subsequently, the commitment is actually exercised, the unamortized component of the loan commitment fees are amortized as an adjustment to the effective yield over the life of the loan.
Refer to Note 4 for more information on net fee and commission income.
32) Foreign currency translation
Transactions denominated in foreign currency are translated into the functional currency of the reporting unit at the spot exchange rate on the date of the transaction. At the balance sheet date, all monetary assets and liabilities denominated in foreign currency are translated to the functional currency using the closing exchange rate. Non-monetary items measured at historical cost are translated at the exchange rate on
the date of the transaction. Foreign exchange differences on financial investments available-for-sale are recorded directly inEquity until the asset is sold or becomes impaired, with the exception of translation differences on the amortized cost of monetary financial investments available-for-sale which are reported inNet trading income, along with all other foreign exchange differences on monetary assets and liabilities.
Upon consolidation, assets and liabilities of foreign operations are translated into Swiss francs (CHF) – UBS’s presentation currency – at the closing exchange rate on the balance sheet date, and income and expense items are translated at the average rate for the period. The resulting foreign exchange differences are recognized directly inForeign currency translation withinEquity.
When a foreign operation is disposed of such that control, significant influence or joint control is lost, or the operation is liquidated, the cumulative amount inForeign currency translation withinEquity related to that foreign operation is reclassified to profit or loss as part of the gain or loss on disposal. When UBS disposes of a portion of its interest in a subsidiary that includes a foreign operation but retains control, the related portion of the cumulative currency translation balance is reclassified toNon-controlling interests. When UBS disposes of a portion of its investment in an associate or joint venture that includes a foreign operation while retaining significant influence or joint control, the related portion of the cumulative currency translation balance is reclassified to profit or loss.
Refer to Note 36 for more information on currency translation rates.
33) Earnings per share (EPS)
Basic earnings per share are calculated by dividing the net profit or loss for the period attributable to ordinary shareholders by the weighted average number of ordinary shares outstanding during the period.
Diluted earnings per share are calculated using the same method as for basic EPS and adjusting the net profit or loss for the period attributable to ordinary shareholders and the weighted average number of ordinary shares outstanding to reflect the potential dilution that could occur if options, warrants, convertible debt securities or other contracts to issue ordinary shares were converted or exercised into ordinary shares.
Refer to Note 9 for more information on earnings per share.
34) Segment reporting
UBS‘s businesses are organized globally into five business divisions: Wealth Management, Wealth Management Americas, Retail & Corporate, Global Asset Management and the Investment Bank, supported by the Corporate Center. The five business divisions qualify as reportable segments for the purpose of segment reporting and, together with the Corporate Center and its components, reflect the management structure of the Group. Additionally, the non-core activities and positions formerly in the Investment Bank are managed and reported in the Corporate
Note 1 Summary of significant accounting policies (continued)
Center. Together with the Legacy Portfolio and the option to acquire the equity of the SNB StabFund, which was exercised on 7 November 2013, these non-core activities and positions are reported as a separate reportable segment within the Corporate Center called “Non-core and Legacy Portfolio.” Financial information about the five business divisions and the Corporate Center (with its components) is presented separately in internal management reports to the Group Executive Board, which is considered the “chief operating decision maker” within the context of IFRS 8Operating Segments.
The operating expenses of Corporate Center – Core Functions are allocated, based on internally determined allocation bases, to the reportable segments and presented under the appropriate line items, that is,Personnel expenses, General and administrative expenses, Depreciation and impairment of property and equipment andAmortization and impairment of intangible assets. These allocations are adjusted on a periodic basis and differences may arise between actual costs incurred and amounts recharged. These differences, together with own credit gains and losses on financial liabilities designated at fair value which are excluded from the measurement of performance of the business divisions, are considered reconciling differences to UBS Group results and are reported collectively under Corporate Center – Core Functions. UBS’s internal accounting policies, which include management accounting policies and service level agreements, determine the revenues and expenses directly attributable to each reportable segment. Internal charges and transfer pricing adjustments are reflected in operating results of the reportable segments. Transactions between the reportable segments are carried out at internally agreed rates or at arm’s length and are also reflected in the operating results of the reportable segments.
Revenue-sharing agreements are used to allocate external client revenues to reportable segments where several reportable segments are involved in the value-creation chain. Commissions are credited to the reportable segments based on the corresponding client relationship.
Net interest income is generally allocated to the reportable segments based on their balance sheet positions. Assets and liabilities of the reportable segments are funded through and invested with Group Treasury, and the net interest margin is reflected in the results of each reportable segment. Interest income earned from managing UBS’s consolidated equity is allocated to the reportable segments based on average attributed equity.
In line with internal management reporting, segment assets are reported without intercompany balances on a third-party view basis. For the purpose of segment reporting under IFRS 8, the non-current assets consist of investments in associates and joint ventures, goodwill, other intangible assets and property and equipment.
Refer to Note 2 for more information on segment reporting.
35) Netting
UBS nets financial assets and liabilities on its balance sheet if it has a currently enforceable legal right to set off the recognized amounts and intends either to settle on a net basis, or to realize the asset and settle the liability simultaneously. Netted positions include, for example, over-the-counter interest rate swaps transacted with the London Clearing House, netted by currency and across maturity dates, repurchase and reverse repurchase transactions entered into with both the London Clearing House and the Fixed Income Clearing Corporation, netted by counterparty, currency, central securities depository and maturity, as well as transactions with various other counterparties, exchanges and clearing houses.
Refer to Note 26 for more information on offsetting financial assets and financial liabilities.
b) Changes in accounting policies, comparability and other adjustments
Effective in 2013
IFRS 7 Financial Instruments: Disclosures
In December 2011, the IASB issued revised IFRS 7Financial Instruments: Disclosures, requiring the disclosure of new information in respect of an entity’s use of enforceable netting arrangements. The amendments to IFRS 7 are intended to enable users of financial statements to better evaluate the effect or potential effect of netting arrangements on the entity’s financial position. The amendments require entities to disclose both gross and net amounts of recognized financial assets and liabilities associated with master netting agreements and similar arrangements, including the effects of financial collateral, whether or not presented net on the face of the balance sheet.
UBS adopted the revisions to IFRS 7 as of 1 January 2013 in accordance with the transitional provisions set out in the standard and the resultant disclosures are reflected in Note 26.
IFRS 10 Consolidated Financial Statements
In May 2011, the IASB issued IFRS 10Consolidated Financial Statements. In October 2012, the IASB issuedInvestment Entities (Amendments to IFRS 10, IFRS 12 and IAS 27) which provide an exception to consolidation for certain “investment entities.” IFRS 10 establishes a single control-based model for assessing whether one entity should consolidate another, applying to all types of entities and replacing SIC 12Consolidation – Special Purpose Enti-
375
Financial information
Notes to the consolidated financial statements
Note 1 Summary of significant accounting policies (continued)
| | | | | | | | | | | | | | | | | | | | | | | | | | | | | | | | | | | | | | | | | | | | | | | | |
IFRS 10: Effect on Total comprehensive income | |
| | Effect on net profit | | | Effect on other comprehensive income | | | | |
| CHF million | | Net
interest
income | | | Net fee and com-
mission
income | | | Net
trading
income | | | Other
income | | | Net
profit | | | Net profit
attribut-
able to
preferred
note
holders | | | Net
profit
attribut- able to
non-con- trolling
interests | | | Net
profit
attribut- able to UBS
share- holders | | | Unrealized
gains/
(losses) on
financial
investments available-for
-sale,
net of tax | | | Foreign
currency
tran slation
movement,
net of tax | | | Other
comprehensive
income | | | Total
comprehensive
income | |
| As previously reported for the year ended 31 December 2012 | | | 5,994 | | | | 15,405 | | | | 3,480 | | | | 682 | | | | (2,235 | ) | | | 0 | | | | 276 | | | | (2,511 | ) | | | 14 | | | | (544 | ) | | | 469 | | | | (1,766 | ) |
| | | | | | | | | | | | | | | | | | | | | | | | | | | | | | | | | | | | | | | | | | | | | | | | | |
| Changes in reported figures for the year | | | (16 | ) | | | (8 | ) | | | 46 | | | | (41 | ) | | | (20 | ) | | | 220 | | | | (271 | ) | | | 31 | | | | 12 | | | | 7 | | | | 18 | | | | (2 | ) |
| | | | | | | | | | | | | | | | | | | | | | | | | | | | | | | | | | | | | | | | | | | | | | | | | |
| Restated amount for the year ended 31 December 2012 | | | 5,978 | | | | 15,396 | | | | 3,526 | | | | 641 | | | | (2,255 | ) | | | 2205 | | | | 5 | | | | (2,480 | ) | | | 26 | | | | (537 | )1 | | | 487 | | | | (1,767 | ) |
| | | | | | | | | | | | | | | | | | | | | | | | | | | | | | | | | | | | | | | | | | | | | | | | | |
1 Of which CHF (511) million was attributable to UBS shareholders, CHF (41) million attributable to preferred noteholders and CHF 15 million attributable to non-controlling interests.
ties, and the consolidation principles within IAS 27Consolidated and Separate Financial Statements, which has been renamed IAS 27Separate financial Statements. Refer to Note 1a) 3) for further information.
On 1 January 2013, UBS adopted IFRS 10, resulting in a change in the consolidation status of certain entities. The Group consolidated certain investment funds where UBS’s exposure to variability indicates that its power as fund manager is in a principal capacity. In addition, UBS deconsolidated certain entities that were previously consolidated due to UBS’s exposure to a majority of risk and rewards, but where UBS does not have the ability to direct the relevant activities. UBS also deconsolidated certain entities where UBS’s involvement does not expose it to variable returns from the entity. This includes entities that issue preferred securities, the de-consolidation of which results in UBS recognizing the preferred notes issued to these entities instead of the preferred securities which were presented as equity attributable to non-controlling interests. Except for one preferred note issuance of CHF 1.2
billion which is classified as a liability, UBS presents the preferred notes as equity attributable to preferred noteholders.
UBS adopted IFRS 10 on a limited retrospective basis. The comparative 31 December 2012 balance sheet and other primary statements for the period ending 2012 have been restated to reflect the effects of adopting IFRS 10. The transition effects on the opening equity balance as of 1 January 2012 are presented in theStatement of changes in equity. No balance sheet as of the beginning of 2012 has been presented under IFRS 10 as adoption was not deemed to have a material impact on the Financial Statements. In addition, periods prior to 2012 are not required to be restated and are therefore presented on the basis of IAS 27 and SIC 12. Where a change in consolidation status was warranted, the financial results in 2012 have been restated to reflect the appropriate consolidation status as of the date that UBS obtained or lost control of the respective entity. No adjustments have been made for entities where, at the date of initial application, the consolidation status is unchanged from that under IAS 27 or SIC 12.
| | | | | | | | | | | | |
IFRS 10: Effect on the balance sheet | |
| CHF million | | Balance as of
31 December 2012
previously reported | | | Change in
reported figures | | | Restated balance
as of
31 December 2012 | |
| Total assets | | | 1,259,232 | | | | 565 | | | | 1,259,797 | |
| | | | | | | | | | | | | |
of which: Positive replacement values | | | 418,029 | | | | 928 | | | | 418,957 | |
| | | | | | | | | | | | | |
| Total liabilities | | | 1,208,983 | | | | 1,714 | | | | 1,210,697 | |
| | | | | | | | | | | | | |
of which: Due to customers | | | 371,892 | | | | 1,567 | | | | 373,459 | |
| | | | | | | | | | | | | |
of which: Repurchase agreements | | | 37,639 | | | | 918 | | | | 38,557 | |
| | | | | | | | | | | | | |
of which: Financial liabilities designated at fair value | | | 92,878 | | | | (977 | ) | | | 91,901 | |
| | | | | | | | | | | | | |
| Total equity | | | 50,249 | | | | (1,149 | ) | | | 49,100 | |
| | | | | | | | | | | | | |
of which: equity attributable to UBS shareholders | | | 45,895 | | | | 54 | | | | 45,949 | |
| | | | | | | | | | | | | |
of which: equity attributable to preferred noteholders | | | 0 | | | | 3,109 | | | | 3,109 | |
| | | | | | | | | | | | | |
of which: equity attributable to non-controlling interests | | | 4,353 | | | | (4,311 | ) | | | 42 | |
| | | | | | | | | | | | | |
| Total liabilities and equity | | | 1,259,232 | | | | 565 | | | | 1,259,797 | |
| | | | | | | | | | | | | |
376
Note 1 Summary of significant accounting policies (continued)
The effect of adoption is shown in the tables on the previous page. There was no material impact on earnings per share.
The October 2012 amendments for investment entities had no impact on the Financial Statements as UBS Group does not itself meet the definition of an investment entity.
IFRS 11 Joint Arrangements
In May 2011, the IASB issued IFRS 11Joint arrangements, which supersedes IAS 31Interests in Joint Ventures, and SIC 13Jointly Controlled Entities – Non-monetary Contributions by Venturers. The standard provides guidance on how to account for joint operations and joint ventures, considering the rights, obligations and legal form of the arrangement, with both defined as types of joint arrangements. The standard also addresses inconsistencies in the reporting of joint ventures by eliminating the proportionate consolidation approach and requiring that an investment be accounted for under the equity method under IAS 28. UBS adopted IFRS 11 on its mandatory effective date of 1 January 2013. As UBS already applies the equity method to account for its interests in joint ventures, the new standard had no impact on the Financial Statements.
IFRS 12 Disclosure of Interests in Other Entities
In May 2011, the IASB issued IFRS 12Disclosure of Interests in Other Entities, which provides new and comprehensive annual disclosure requirements about entities with which a reporting entity is involved. IFRS 12 replaces the disclosure requirements previously included in IAS 27Consolidated and Separate Financial Statements, IAS 28Investment in Associatesand IAS 31Interests in Joint Ventures. The standard requires entities to disclose information that helps users to evaluate the nature, risks and financial effects associated with a reporting entity’s interests in subsidiaries, associates, joint arrangements and, in particular, unconsolidated SE. UBS adopted the revised standard on its mandatory effective date of 1 January 2013 in accordance with the transitional provisions of the standard and the resultant disclosures are reflected in Note 30.
IAS 27 Separate Financial Statements
In May 2011, the IASB issued IAS 27Separate Financial Statements, which amended and renamed IAS 27Consolidated and Separate Financial Statements. The amendments resulted from the issuance of IFRS 10Consolidated Financial Statements as stated above. As a result, IAS 27 now contains requirements relating to separate financial statements only. UBS adopted the IAS 27 amendments on their mandatory effective date of 1 January 2013 and the new standard had no impact on the Financial Statements.
IAS 28 Investments in Associates and Joint Ventures
In May 2011, the IASB issued IAS 28Investments in Associates and Joint Ventures, which amended and renamed IAS 28Investments in Associates by incorporating the accounting for joint ventures. UBS adopted the IAS 28 amendments on the mandatory effective date of 1 January 2013 and the new standard had no impact on the Financial Statements.
IFRS 13 Fair Value Measurement
In May 2011, the IASB issued IFRS 13Fair Value Measurement,which establishes a single source of guidance for all fair value measurements under IFRS. It defines fair value as the price that would be received to sell an asset or paid to transfer a liability in an orderly transaction between market participants at the measurement date, i.e., an exit price. The standard emphasizes that fair value is a market-based measurement, not an entity-specific measurement. It clarifies that the unit of measurement is generally a particular asset or liability unless an entity manages and reports its net risk exposures on a portfolio basis, in which case it may elect to apply portfolio-level price adjustments under limited circumstances. It also introduces new disclosure requirements and enhancements to existing disclosures, which are reflected in Note 24.
IFRS 13 became effective for the Group on 1 January 2013 and has been applied prospectively from that date. As a result of implementing the unit of measurement guidance of the standard, the Group’s valuation reserves increased by approximately CHF 25 million as of 1 January 2013, decreasing operating profit before tax in 2013. In conjunction with the implementation of IFRS 13, the Group has refined its methodologies for estimating the sensitivity of fair value measurements to changes in unobservable valuation input assumptions. As a result, the 31 December 2012 comparative figures in Note 24i have been restated from CHF 1.2 billion to CHF 1.8 billion for favorable changes and from CHF 1.2 billion to CHF 1.4 billion for unfavorable changes.
IAS 1 Presentation of Financial Statements
In June 2011, the IASB issued the revised IAS 1Presentation of Financial Statements. The revised standard requires the grouping together for presentation purposes of items within other comprehensive income (OCI) into those that may be reclassified to profit or loss in subsequent periods and those that may not be. The revised standard reaffirms existing requirements that items in OCI and profit or loss should be presented as either a single statement or two consecutive statements. UBS adopted the revised standard on its mandatory effective date of 1 January 2013 and continues to provide two consecutive statements. The presentation in the statement of comprehensive income was revised in line with the new requirements.
IAS 36 Recoverable Amount Disclosures for Non-Financial Assets (Amendment to IAS 36 Impairment of Assets)
In May 2013, the IASB publishedRecoverable Amount Disclosures for Non-Financial Assets (Amendments to IAS 36, Impairment of Assets)requiring disclosure, for a non-financial asset or a cash generating unit for which an impairment loss was recognized or reversed, of its recoverable amount and, if this was determined based on fair value less costs of disposal, additional fair value
Financial information
Notes to the consolidated financial statements
Note 1 Summary of significant accounting policies (continued)
information. UBS early adopted the narrow-scope amendments as of 31 December 2013, ahead of their mandatory effective date of 1 January 2014, in accordance with the transitional provisions of the amendments, with no material impact on the Financial Statements. Refer to Notes 16 and 17 for more information.
Annual Improvements to IFRSs 2009 – 2011
In May 2012, the IASB issued six amendments to five IFRSs as part of its annual improvements project. Of these amendments, UBS adopted the amendment to IAS 1 in 2012, ahead of its mandatory effective date of 1 January 2013 in accordance with the transitional provisions of the standard. UBS adopted the remaining amendments as of 1 January 2013 with no material impact on the Financial Statements.
IAS 1 Comparative Information
In line with the IAS 1 comparative period requirements which UBS adopted in 2012, UBS will no longer present a second comparative balance sheet unless it is required to do so as a consequence of a retrospective restatement or reclassification. For the year ended 31 December 2013, the Group is not required to present an additional balance sheet and therefore only one comparative balance sheet is disclosed as of 31 December 2012.
Corporate Center – Non-core and Legacy Portfolio
In line with our strategy to focus the Investment Bank’s business on its traditional strengths, UBS is exiting many business lines which are capital- and balance sheet-intensive or are in areas with high operational complexity or long tail risks. In 2013, these non-core activities and positions formerly in the Investment Bank were transferred to and are now managed and reported in the Corporate Center. Together with the Legacy Portfolio and the option to acquire the equity of the SNB StabFund, which was exercised on 7 November 2013, these non-core activities and positions are reported as a separate reportable segment within the Corporate Center called “Non-core and Legacy Portfolio.” Prior period segment information was restated for this change. As a result, total assets of the Investment Bank as of 31 December 2012 decreased by CHF 390 billion, full year 2012 operating income decreased by CHF 1,147 million and full year 2012 operating expenses decreased by CHF 4,341 million, resulting in an overall increase in full year 2012 operating profit before tax of CHF 3,194 million, with corresponding movements in Corporate Center – Non-core and Legacy Portfolio. This restated information is not representative of the way the business was managed during those prior periods and as such is an estimate of such periods’ performance. Amounts were determined reflecting a number of assumptions and allocations in order to achieve comparability with how the business would be managed in the future.
Other transfers between reporting segments
The repurchase agreement and short-term interest rate cash units were transferred from the Investment Bank to the Asset Liability Management unit of Group Treasury within Corporate Center – Core Functions in 2013. Following this transfer, the Asset Liability Management unit oversees all financing, portfolio, and structural risk management activities for the Group. Revenues associated with the ongoing business activities of Asset Liability Management are allocated to the business divisions and Non-core and Legacy Portfolio, with the exception of excess funding costs. Prior period segment information was restated for this change. As a result, total assets of the Investment Bank as of 31 December 2012 decreased by CHF 20 billion, full year 2012 operating income decreased by CHF 314 million and full year operating expenses decreased by CHF 113 million, resulting in an overall decrease in full year operating profit before tax of CHF 201 million, with corresponding increases in Corporate Center – Core Functions. This restated information is only an estimate of such periods’ performance.
In 2013, the risk management responsibility for a portfolio of financial investments available-for-sale and associated cash and balances with central banks was transferred from Wealth Management Americas to Group Treasury within Corporate Center – Core Functions. Following this transfer, net interest income associated with that portfolio has been allocated back to Wealth Management Americas, whereas realized gains and losses arising from the sales and impairments of individual financial investments are retained by Group Treasury. Prior period segment information was restated for this change. As a result, total assets of Wealth Management Americas as of 31 December 2012 decreased by CHF 20 billion and full year 2012 non-interest income decreased by CHF 220 million, with corresponding increases in Corporate Center – Core Functions.
Definition of restructuring charges
In 2013, UBS expanded its definition of restructuring charges to include non-recurring and other temporary costs necessary to effect its restructuring programs. Refer to Note 32 for more information.
Accrued income and prepaid expenses, accrued expenses and deferred income
Starting with the fourth quarter of 2013,Accrued income and prepaid expenses as well asAccrued expenses and deferred income are no longer presented as separate line items in the balance sheet but underOther assets andOther liabilities, respectively. Comparative information was adjusted accordingly. Refer to Notes 18 and 23 for more information. This change in presentation did not impact net profit, total assets or total liabilities.
378
Note 1 Summary of significant accounting policies (continued)
c) International Financial Reporting Standards and Interpretations to be adopted in 2014 and later and other adjustments
IFRS 9 Financial Instruments
In November 2009, the IASB issued IFRS 9Financial Instruments, which includes revised guidance on the classification and measurement of financial assets. In October 2010, the IASB updated IFRS 9 to include guidance on financial liabilities and derecognition of financial instruments. The publication of IFRS 9 represented the completion of the first part of a multi-stage project to replace IAS 39Financial Instruments: Recognition and Measurement.
The standard requires all financial assets, except equity instruments, to be classified at fair value through profit or loss or amortized cost on the basis of the entity’s business model for managing the financial assets and the contractual cash flow characteristics of the financial asset. If a financial asset meets the criteria to be measured at amortized cost, it can be designated at fair value through profit or loss under the fair value option if doing so would significantly reduce or eliminate an accounting mismatch. Equity instruments that are not held for trading may be accounted for at fair value through other comprehensive income (OCI).
The accounting guidance for financial liabilities is unchanged with one exception: any gain or loss arising on a financial liability designated at fair value through profit or loss that is attributable to changes in the credit risk of that liability (own credit) is presented in OCI and not recognized in profit or loss. There is no subsequent recycling of realized gains or losses from OCI to profit or loss.
In November 2013, the IASB issued IFRS 9Financial Instruments (Hedge accounting and amendments to IFRS 9, IFRS 7 and IAS 39). This standard contains guidance on hedge accounting that will replace the existing requirements of IAS 39, introducing substantial changes to hedge effectiveness and eligibility requirements as well as new disclosures. The amendments also remove the previous mandatory effective date of 1 January 2015 for all of the IFRS 9 requirements, with a final effective date to be decided upon when the project is closer to completion. Subsequently, the IASB has tentatively decided that the mandatory effective date will be for annual periods beginning on or after 1 January 2018. The standard further amends IFRS 9 to permit entities to early adopt the own credit presentation changes without having to apply any of the other requirements of IFRS 9.
UBS is currently assessing the impact of the new requirements on the Financial Statements.
Offsetting Financial Assets and Financial Liabilities (Amendments to IAS 32)
In December 2011, the IASB issuedOffsetting Financial Assets and Financial Liabilities (Amendments to IAS 32, Financial Instruments: Presentation). The amendments to IAS 32 restrict offsetting on the balance sheet to only those arrangements in which an offsetting right exists that is unconditional and legally enforceable, both in the normal course of business and in the event of default, bankruptcy or insolvency of the entity and all of the coun-terparties. The amendments also provide incremental guidance for determining when
gross settlement systems result in the functional equivalent of net settlement.
Upon adoption as of 1 January 2014, UBS expects, based on current assumptions, that certain derivative arrangements will no longer qualify for offset. Consequently, had the amendments been effective as of 31 December 2013, total assets and liabilities would increase by approximately CHF 10 billion, with no impact on total equity or net profit. UBS’s Basel III capital, capital ratios and Swiss SRB leverage ratio are not expected to be significantly impacted. Some application issues are in the process of being resolved, hence, the actual impact may be different from that currently estimated.
Novation of Derivatives and Continuation of Hedge Accounting (Amendments to IAS 39)
In June 2013, the IASB issuedNovation of Derivatives and Continuation of Hedge Accounting (Amendments to IAS 39, Financial Instruments: Recognition and Measurement) to provide relief from discontinuing hedge accounting when a derivative designated as a hedging instrument is novated to effect clearing with a central counterparty as a result of laws and regulations, provided certain criteria are met. The amendment is applicable retrospectively and is effective on 1 January 2014. Adoption of the amendment will not have a material impact on the Financial Statements.
IFRIC Interpretation 21, Levies
In May 2013, the IASB issued IFRICInterpretation 21, Levies. IFRIC 21 sets out the accounting for an obligation to pay a government levy that is not within the scope of IAS 12,Income Taxes. The interpretation specifies that liabilities for levies should not be recognized prior to the occurrence of a specified triggering event, regardless of whether an entity has no realistic ability to avoid the triggering event. The interpretation is applicable retrospectively and is effective on 1 January 2014. Adoption of the interpretation will not have a material impact on the Financial Statements.
Narrow-scope amendments to IAS 19 Employee Benefits
In December 2013, the IASB issuedDefined Benefit Plans: Employee Contributions (Amendments to IAS 19, Employee Benefits).The amendments offer an alternative, simplified treatment for considering contributions from employees or third parties in the calculation of the defined benefit obligation if the amount of employee or third-party contributions is independent of the number of years of service. Under the alternative treatment, an entity may recognize such contributions as a reduction in service cost in the period in which the related service is rendered, instead of attributing the contributions to the periods of service. This is applicable for the Swiss pension plan, whereby UBS currently attributes employee contributions to the periods of service in accordance with the plan’s benefit formula. The amendments to IAS 19 are applicable retrospectively, for UBS on 1 January 2015, with earlier adoption permitted. UBS does not expect to apply the alternative treatment introduced by this amendment to IAS 19.
Financial information
Notes to the consolidated financial statements
Note 1 Summary of significant accounting policies (continued)
Annual Improvements to IFRSs 2010 – 2012 Cycle and Annual Improvements to IFRSs 2011 – 2013 Cycle
In December 2013, the IASB issuedAnnual Improvements to IFRSs 2010 – 2012 Cycle andAnnual Improvements to IFRSs 2011 –2013 Cycle that resulted in 12 amendments to nine IFRSs. Generally, the amendments are effective for UBS on 1 January 2015, with early adoption permitted. UBS is currently assessing the impact of the amendments on the Financial Statements.
Fair value measurements – funding valuation adjustments
UBS and, more broadly, other major dealers in derivatives, are currently analyzing how the costs and benefits of funding associated with uncollateralized derivative receivables and payables can be incorporated
into their valuation techniques. Those costs and benefits (referred to as “funding valuation adjustments”) differ from credit valuation adjustments (CVA) and debit valuation adjustments (DVA) (refer to “Note 24 Fair value measurement’’), and theoretically represent a spread over LIBOR to compensate for the inherent cost of funding those uncollateralized derivative positions. Currently, there are diverse views within the industry as to how such inputs should be quantified and applied. We expect to incorporate funding valuation adjustments into our fair value measurements, prospectively, as a change in accounting estimate, possibly during 2014, when our analysis is completed and the related financial effects can be validated. Notably, our exposure to uncollateralized derivatives continues to reduce in line with the accelerated implementation of our strategy to exit many of the businesses with which they are associated.
380
Note 2a Segment reporting
UBS AG is the parent company of the UBS Group (Group). The operational structure of the Group comprises the Corporate Center and five business divisions: Wealth Management, Wealth Management Americas, Retail & Corporate, Global Asset Management and the Investment Bank.
Wealth Management
Wealth Management provides comprehensive financial services to wealthy private clients around the world – except those served by Wealth Management Americas. Its clients benefit from the entire spectrum of UBS resources, ranging from investment management to estate planning and corporate finance advice, in addition to specific wealth management products and services.
Wealth Management Americas
Wealth Management Americas provides advice-based solutions and banking services through financial advisors who deliver a fully integrated set of products and services specifically designed to address the needs of ultra high net worth and high net worth individuals and families. It includes the domestic US business, the domestic Canadian business and international business booked in the US.
Retail & Corporate
Retail & Corporate maintains a leading position across retail, corporate and institutional client segments in Switzerland and constitutes a central building block of UBS Switzerland’s pre-eminent universal bank model. It provides comprehensive financial products and services embedded in a true multi-channel experience, offering clients convenient access. It continues to enhance the range of life-cycle products and services offered to clients, while pursuing additional growth in advisory and execution services.
Global Asset Management
Global Asset Management is a large-scale asset manager with diversified businesses across investment capabilities, regions and distribution
channels. It offers investment capabilities and styles across all major traditional and alternative asset classes including equities, fixed income, currencies, hedge funds, real estate, infrastructure and private equity that can also be combined into multi-asset strategies. The fund services unit provides professional services including fund set-up, accounting and reporting for both traditional investment funds and alternative funds.
Investment Bank
The Investment Bank provides corporate, institutional and wealth management clients with expert advice, innovative financial solutions, outstanding execution and comprehensive access to the world’s capital markets. It offers financial advisory and capital markets, research, equities, foreign exchange, precious metals and tailored fixed income services in rates and credit through its two business units, Corporate Client Solutions and Investor Client Services. The Investment Bank is an active participant in capital markets flow activities, including sales, trading and market-making across a range of securities.
Corporate Center
The Corporate Center comprises Corporate Center – Core Functions and Corporate Center – Non-core and Legacy Portfolio. Corporate Center – Core Functions provides Group-wide control functions including finance, risk control (including compliance) and legal. In addition, it provides all logistics and support functions, including operations, information technology, human resources, corporate development, regulatory relations and strategic initiatives, communications and branding, corporate real estate and administrative services, procurement, physical security, information security, offshoring and treasury services such as funding, balance sheet and capital management. Corporate Center – Core Functions allocates most of its treasury income, operating expenses and personnel associated with the above-mentioned activities to the businesses based on capital and service consumption levels. Corporate Center – Non-core and Legacy Portfolio comprises the non-core businesses and legacy positions previously part of the Investment Bank.
381
Financial information
Notes to the consolidated financial statements
Note 2a Segment reporting1 (continued)
| | | | | | | | | | | | | | | | | | | | | | | | | | | | | | | | |
| | Wealth
Management | | | Wealth
Management
Americas | | | Retail &
Corporate | | | Global Asset
Management | | | Investment
Bank | | | Corporate Center | | | UBS | |
| CHF million | | | | | | | | | | | | | | | | | Core
Functions2 | | | Non-core
and Legacy
Portfolio | | | | |
| | | | | | | | |
| For the year ended 31 December 2013 | | | | | | | | | | | | | | | | | | | | | | | | | | | | | | | | |
| | | | | | | | | | | | | | | | | | | | | | | | | | | | | | | | | |
| Net interest income | | | 2,061 | | | | 936 | | | | 2,144 | | | | (20 | ) | | | 886 | | | | (31 | ) | | | (191 | ) | | | 5,786 | |
| | | | | | | | | | | | | | | | | | | | | | | | | | | | | | | | | |
| Non-interest income | | | 5,512 | | | | 5,629 | | | | 1,630 | | | | 1,954 | | | | 7,712 | | | | (976 | ) | | | 535 | | | | 21,997 | |
| | | | | | | | | | | | | | | | | | | | | | | | | | | | | | | | | |
| Income3,4,5 | | | 7,573 | | | | 6,565 | | | | 3,774 | | | | 1,935 | | | | 8,599 | | | | (1,007 | ) | | | 344 | | | | 27,782 | |
| | | | | | | | | | | | | | | | | | | | | | | | | | | | | | | | | |
| Credit loss (expense)/recovery | | | (10 | ) | | | (27 | ) | | | (18 | ) | | | 0 | | | | 2 | | | | 0 | | | | 3 | | | | (50 | ) |
| | | | | | | | | | | | | | | | | | | | | | | | | | | | | | | | | |
| Total operating income | | | 7,563 | | | | 6,538 | | | | 3,756 | | | | 1,935 | | | | 8,601 | | | | (1,007 | ) | | | 347 | | | | 27,732 | |
| | | | | | | | | | | | | | | | | | | | | | | | | | | | | | | | | |
| Personnel expenses | | | 3,371 | | | | 4,574 | | | | 1,442 | | | | 873 | | | | 3,984 | | | | 424 | | | | 515 | | | | 15,182 | |
| | | | | | | | | | | | | | | | | | | | | | | | | | | | | | | | | |
| General and administrative expenses | | | 1,650 | | | | 924 | | | | 875 | | | | 448 | | | | 2,040 | | | | 422 | | | | 2,022 | | | | 8,380 | |
| | | | | | | | | | | | | | | | | | | | | | | | | | | | | | | | | |
| Services (to)/from other business divisions | | | 97 | | | | 13 | | | | (162 | ) | | | (17 | ) | | | 3 | | | | 1 | | | | 65 | | | | 0 | |
| | | | | | | | | | | | | | | | | | | | | | | | | | | | | | | | | |
| Depreciation and impairment of property and equipment | | | 190 | | | | 121 | | | | 143 | | | | 47 | | | | 260 | | | | 0 | | | | 55 | | | | 816 | |
| | | | | | | | | | | | | | | | | | | | | | | | | | | | | | | | | |
| Amortization and impairment of intangible assets6 | | | 8 | | | | 49 | | | | 0 | | | | 8 | | | | 14 | | | | 0 | | | | 3 | | | | 83 | |
| | | | | | | | | | | | | | | | | | | | | | | | | | | | | | | | | |
| Total operating expenses7 | | | 5,316 | | | | 5,680 | | | | 2,298 | | | | 1,359 | | | | 6,300 | | | | 847 | | | | 2,660 | | | | 24,461 | |
| | | | | | | | | | | | | | | | | | | | | | | | | | | | | | | | | |
| Operating profit/(loss) before tax | | | 2,247 | | | | 858 | | | | 1,458 | | | | 576 | | | | 2,300 | | | | (1,854 | ) | | | (2,312 | ) | | | 3,272 | |
| | | | | | | | | | | | | | | | | | | | | | | | | | | | | | | | | |
| Tax expense/(benefit) | | | | | | | | | | | | | | | | | | | | | | | | | | | | | | | (110 | ) |
| | | | | | | | | | | | | | | | | | | | | | | | | | | | | | | | | |
| Net profit/(loss) | | | | | | | | | | | | | | | | | | | | | | | | | | | | | | | 3,381 | |
| | | | | | | | | | | | | | | | | | | | | | | | | | | | | | | | | |
| Additional Information | | | | | | | | | | | | | | | | | | | | | | | | | | | | | | | | |
| | | | | | | | | | | | | | | | | | | | | | | | | | | | | | | | | |
| Total assets8 | | | 109,758 | | | | 45,491 | | | | 141,369 | | | | 14,223 | | | | 241,103 | | | | 247,407 | | | | 210,508 | | | | 1,009,860 | |
| | | | | | | | | | | | | | | | | | | | | | | | | | | | | | | | | |
| Additions to non-current assets | | | 5 | | | | 1 | | | | 17 | | | | 1 | | | | 81 | | | | 1,236 | | | | 0 | | | | 1,341 | |
| | | | | | | | | | | | | | | | | | | | | | | | | | | | | | | | | |
1 Refer to “Note 1b Changes in accounting policies, comparability and other adjustments” for information on changes to reporting segments. 2 Certain cost allocations to the business divisions and Corporate Center – Non-core and Legacy Portfolio are based on periodically agreed standard rates. This could lead to a difference between costs actually incurred by Corporate Center – Core Functions and charges to the business divisions and Corporate Center – Non-core and Legacy Portfolio. 3 Impairments of financial investments available-for-sale for the year ended 31 December 2013 were as follows: Wealth Management CHF 10 million, Global Asset Management CHF 3 million, Investment Bank CHF 20 million, Corporate Center – Non-core and Legacy Portfolio CHF 8 million. 4 The total inter-segment revenues for the Group are immaterial as the majority of the revenues are allocated across the segments by means of revenue-sharing agreements. 5 Refer to “Note 24 Fair value measurement” for more information on own credit in Corporate Center – Core Functions. 6 Refer to “Note 17 Goodwill and intangible assets” for more information on goodwill and other intangible assets by segment. 7 Refer to “Note 32 Changes in organization” for information on restructuring charges. 8 The segment assets are based on a third-party view and this basis is in line with the internal reporting to management, i.e., the amounts do not include intercompany balances. Certain assets managed centrally by Corporate Center – Core Functions (including property and equipment and certain financial assets) are allocated to the segments on a basis different to which the corresponding costs and/or revenues are allocated. Specifically, certain assets are reported in Corporate Center – Core Functions, whereas the corresponding costs and/or revenues are entirely or partially allocated to the segments based on various internally determined allocations. Similarly, certain assets are reported in the business divisions, whereas the corresponding costs and/or revenues are entirely or partially allocated to Corporate Center – Core Functions.
382
Note 2a Segment reporting1 (continued)
| | | | | | | | | | | | | | | | | | | | | | | | | | | | | | | | |
| | Wealth
Management | | | Wealth
Management
Americas | | | Retail &
Corporate | | | Global Asset
Management | | | Investment
Bank | | | Corporate Center | | | UBS | |
| CHF million | | | | | | | | | | | | | | | | | Core
Functions2 | | | Non-core
and Legacy
Portfolio | | | | |
| | | | | | | | |
| For the year ended 31 December 2012 | | | | | | | | | | | | | | | | | | | | | | | | | | | | | | | | |
| | | | | | | | | | | | | | | | | | | | | | | | | | | | | | | | | |
| Net interest income | | | 1,951 | | | | 792 | | | | 2,186 | | | | (21 | ) | | | 834 | | | | 47 | | | | 189 | | | | 5,978 | |
| | | | | | | | | | | | | | | | | | | | | | | | | | | | | | | | | |
| Non-interest income | | | 5,089 | | | | 5,099 | | | | 1,569 | | | | 1,904 | | | | 6,310 | | | | (1,737 | ) | | | 1,327 | | | | 19,563 | |
| | | | | | | | | | | | | | | | | | | | | | | | | | | | | | | | | |
| Income3,4,5 | | | 7,040 | | | | 5,891 | | | | 3,756 | | | | 1,883 | | | | 7,144 | | | | (1,689 | ) | | | 1,516 | | | | 25,541 | |
| | | | | | | | | | | | | | | | | | | | | | | | | | | | | | | | | |
| Credit loss (expense)/recovery | | | 1 | | | | (14 | ) | | | (27 | ) | | | 0 | | | | 0 | | | | 0 | | | | (78 | ) | | | (118 | ) |
| | | | | | | | | | | | | | | | | | | | | | | | | | | | | | | | | |
| Total operating income | | | 7,041 | | | | 5,877 | | | | 3,728 | | | | 1,883 | | | | 7,144 | | | | (1,689 | ) | | | 1,439 | | | | 25,423 | |
| | | | | | | | | | | | | | | | | | | | | | | | | | | | | | | | | |
| Personnel expenses | | | 2,865 | | | | 4,252 | | | | 1,287 | | | | 885 | | | | 4,539 | | | | 282 | | | | 628 | | | | 14,737 | |
| | | | | | | | | | | | | | | | | | | | | | | | | | | | | | | | | |
| General and administrative expenses | | | 1,360 | | | | 893 | | | | 857 | | | | 395 | | | | 2,312 | | | | 1,696 | 6 | | | 1,141 | | | | 8,653 | |
| | | | | | | | | | | | | | | | | | | | | | | | | | | | | | | | | |
| Services (to)/from other business divisions | | | 243 | | | | (15 | ) | | | (370 | ) | | | (10 | ) | | | (202 | ) | | | 21 | | | | 335 | | | | 0 | |
| | | | | | | | | | | | | | | | | | | | | | | | | | | | | | | | | |
| Depreciation and impairment of property and equipment | | | 159 | | | | 100 | | | | 128 | | | | 37 | | | | 214 | | | | 9 | | | | 41 | | | | 689 | |
| | | | | | | | | | | | | | | | | | | | | | | | | | | | | | | | | |
| Impairment of goodwill7 | | | 0 | | | | 0 | | | | 0 | | | | 0 | | | | 0 | | | | 0 | | | | 3,030 | | | | 3,030 | |
| | | | | | | | | | | | | | | | | | | | | | | | | | | | | | | | | |
| Amortization and impairment of intangible assets7 | | | 7 | | | | 51 | | | | 0 | | | | 8 | | | | 13 | | | | 0 | | | | 28 | | | | 106 | |
| | | | | | | | | | | | | | | | | | | | | | | | | | | | | | | | | |
| Total operating expenses8 | | | 4,634 | | | | 5,281 | | | | 1,901 | | | | 1,314 | | | | 6,877 | | | | 2,008 | | | | 5,202 | | | | 27,216 | |
| | | | | | | | | | | | | | | | | | | | | | | | | | | | | | | | | |
| Operating profit/(loss) before tax | | | 2,407 | | | | 597 | | | | 1,827 | | | | 569 | | | | 267 | | | | (3,698 | ) | | | (3,764 | ) | | | (1,794 | ) |
| | | | | | | | | | | | | | | | | | | | | | | | | | | | | | | | | |
| Tax expense/(benefit) | | | | | | | | | | | | | | | | | | | | | | | | | | | | | | | 461 | |
| | | | | | | | | | | | | | | | | | | | | | | | | | | | | | | | | |
| Net profit/(loss) | | | | | | | | | | | | | | | | | | | | | | | | | | | | | | | (2,255 | ) |
| | | | | | | | | | | | | | | | | | | | | | | | | | | | | | | | | |
| Additional Information | | | | | | | | | | | | | | | | | | | | | | | | | | | | | | | | |
| | | | | | | | | | | | | | | | | | | | | | | | | | | | | | | | | |
| Total assets9 | | | 104,620 | | | | 43,948 | | | | 145,320 | | | | 12,916 | | | | 261,511 | | | | 262,857 | | | | 428,625 | | | | 1,259,797 | |
| | | | | | | | | | | | | | | | | | | | | | | | | | | | | | | | | |
| Additions to non-current assets | | | 4 | | | | 1 | | | | 45 | | | | 12 | | | | 62 | | | | 1,032 | | | | 0 | | | | 1,158 | |
| | | | | | | | | | | | | | | | | | | | | | | | | | | | | | | | | |
1 Refer to “Note 1b Changes in accounting policies, comparability and other adjustments” for information on the adoption of IFRS 10 and changes to reporting segments. 2 Certain cost allocations to the business divisions and Corporate Center – Non-core and Legacy Portfolio are based on periodically agreed standard rates. This could lead to a difference between costs actually incurred by Corporate Center – Core Functions and charges to the business divisions and Corporate Center – Non-core and Legacy Portfolio. 3 Impairments of financial investments available-for-sale for the year ended 31 December 2012 were as follows: Global Asset Management CHF 4 million, Investment Bank CHF 12 million, Corporate Center – Core Functions CHF 2 million, Corporate Center – Non-core and Legacy Portfolio CHF 67 million. 4 The total inter-segment revenues for the Group are immaterial as the majority of the revenues are allocated across the segments by means of revenue-sharing agreements. 5 Refer to “Note 24 Fair value measurement” for more information on own credit in Corporate Center – Core Functions. 6 Includes charges of approximately CHF 1.4 billion arising from fines and disgorgement resulting from regulatory investigations concerning LIBOR and other benchmark rates. Refer to “Note 22 Provisions and contingent liabilities” for more information. 7 Refer to “Note 17 Goodwill and intangible assets” for more information. 8 Refer to “Note 32 Changes in organization” for information on restructuring charges. 9 The segment assets are based on a third-party view and this basis is in line with the internal reporting to management, i.e., the amounts do not include intercompany balances. Certain assets managed centrally by Corporate Center – Core Functions (including property and equipment and certain financial assets) are allocated to the segments on a basis different to which the corresponding costs and/or revenues are allocated. Specifically, certain assets are reported in Corporate Center – Core Functions, whereas the corresponding costs and/or revenues are entirely or partially allocated to the segments based on various internally determined allocations.
Financial information
Notes to the consolidated financial statements
Note 2a Segment reporting1(continued)
| | | | | | | | | | | | | | | | | | | | | | | | | | | | | | | | |
| | Wealth
Management | | | Wealth
Management
Americas | | | Retail &
Corporate | | | Global Asset
Management | | | Investment
Bank | | | Corporate Center | | | UBS | |
| CHF million | | | | | | | | | | | | | | | | | Core
Functions2 | | | Non-core and Legacy
Portfolio | | | | |
| | | | | | | | |
| For the year ended 31 December 2011 | | | | | | | | | | | | | | | | | | | | | | | | | | | | | | | | |
| | | | | | | | | | | | | | | | | | | | | | | | | | | | | | | | | |
| Net interest income | | | 1,968 | | | | 729 | | | | 2,328 | | | | (15 | ) | | | 974 | | | | 208 | | | | 634 | | | | 6,826 | |
| | | | | | | | | | | | | | | | | | | | | | | | | | | | | | | | | |
| Non-interest income | | | 5,666 | | | | 4,490 | | | | 1,858 | | | | 1,817 | | | | 5,838 | | | | 1,724 | | | | (347 | ) | | | 21,046 | |
| | | | | | | | | | | | | | | | | | | | | | | | | | | | | | | | | |
| Income3,4,5 | | | 7,634 | | | | 5,219 | | | | 4,186 | | | | 1,803 | | | | 6,813 | | | | 1,932 | | | | 286 | | | | 27,872 | |
| | | | | | | | | | | | | | | | | | | | | | | | | | | | | | | | | |
| Credit loss (expense)/recovery | | | 11 | | | | (6 | ) | | | (101 | ) | | | 0 | | | | (10 | ) | | | (1 | ) | | | 22 | | | | (84 | ) |
| | | | | | | | | | | | | | | | | | | | | | | | | | | | | | | | | |
| Total operating income | | | 7,645 | | | | 5,213 | | | | 4,085 | | | | 1,803 | | | | 6,802 | | | | 1,931 | | | | 309 | | | | 27,788 | |
| | | | | | | | | | | | | | | | | | | | | | | | | | | | | | | | | |
| Personnel expenses | | | 3,300 | | | | 3,830 | | | | 1,702 | | | | 954 | | | | 5,026 | | | | 116 | | | | 706 | | | | 15,634 | |
| | | | | | | | | | | | | | | | | | | | | | | | | | | | | | | | | |
| General and administrative expenses | | | 1,192 | | | | 783 | | | | 834 | | | | 375 | | | | 2,129 | | | | 161 | | | | 486 | | | | 5,959 | |
| | | | | | | | | | | | | | | | | | | | | | | | | | | | | | | | | |
| Services (to)/from other business divisions | | | 318 | | | | (9 | ) | | | (470 | ) | | | (1 | ) | | | (358 | ) | | | 19 | | | | 503 | | | | 0 | |
| | | | | | | | | | | | | | | | | | | | | | | | | | | | | | | | | |
| Depreciation and impairment of property and equipment | | | 165 | | | | 99 | | | | 136 | | | | 38 | | | | 208 | | | | 73 | | | | 43 | | | | 761 | |
| | | | | | | | | | | | | | | | | | | | | | | | | | | | | | | | | |
| Amortization and impairment of intangible assets6 | | | 37 | | | | 48 | | | | 0 | | | | 8 | | | | 15 | | | | 0 | | | | 19 | | | | 127 | |
| | | | | | | | | | | | | | | | | | | | | | | | | | | | | | | | | |
| Total operating expenses7 | | | 5,012 | | | | 4,750 | | | | 2,201 | | | | 1,373 | | | | 7,019 | | | | 369 | | | | 1,756 | | | | 22,482 | |
| | | | | | | | | | | | | | | | | | | | | | | | | | | | | | | | | |
| Operating profit/(loss) before tax | | | 2,633 | | | | 463 | | | | 1,884 | | | | 430 | | | | (217 | ) | | | 1,562 | | | | (1,448 | ) | | | 5,307 | |
| | | | | | | | | | | | | | | | | | | | | | | | | | | | | | | | | |
| Tax expense/(benefit) | | | | | | | | | | | | | | | | | | | | | | | | | | | | | | | 901 | |
| | | | | | | | | | | | | | | | | | | | | | | | | | | | | | | | | |
| Net profit/(loss) | | | | | | | | | | | | | | | | | | | | | | | | | | | | | | | 4,406 | |
| | | | | | | | | | | | | | | | | | | | | | | | | | | | | | | | | |
| Additional Information | | | | | | | | | | | | | | | | | | | | | | | | | | | | | | | | |
| | | | | | | | | | | | | | | | | | | | | | | | | | | | | | | | | |
| Total assets8 | | | 100,352 | | | | 42,159 | | | | 147,117 | | | | 15,239 | | | | 403,512 | | | | 183,761 | | | | 524,823 | | | | 1,416,962 | |
| | | | | | | | | | | | | | | | | | | | | | | | | | | | | | | | | |
| \Additions to non-current assets | | | 5 | | | | 25 | | | | 22 | | | | 18 | | | | 90 | | | | 1,013 | | | | 19 | | | | 1,192 | |
| | | | | | | | | | | | | | | | | | | | | | | | | | | | | | | | | |
1 Refer to “Note 1b Changes in accounting policies, comparability and other adjustments” for information on changes to reporting segments. 2 Certain cost allocations to the business divisions and Corporate Center Non-core and Legacy Portfolio are based on periodically agreed standard rates. This could lead to a difference between costs actually incurred by Corporate Center – Core Functions and charges to the business divisions and Corporate Center – Non-core and Legacy Portfolio. 3 Impairments of financial investments available-for-sale for the year ended 31 December 2011 were as follows: Wealth Management CHF 28 million, Corporate Center – Non-core and Legacy Portfolio CHF 12 million. 4 The total inter-segment revenues for the Group are immaterial as the majority of the revenues are allocated across the segments by means of revenue-sharing agreements. 5 Refer to “Note 24 Fair value measurement” for more information on own credit in Corporate Center – Core Functions. 6 Refer to “Note 17 Goodwill and intangible assets” for more information on goodwill and other intangible assets by segment. 7 Refer to “Note 32 Changes in organization” for information on restructuring charges. 8 The segment assets are based on a third-party view and this basis is in line with the internal reporting to management, i.e., the amounts do not include intercompany balances. Certain assets managed centrally by Corporate Center – Core Functions (including property and equipment and certain financial assets) are allocated to the segments on a basis different to which the corresponding costs and/or revenues are allocated. Specifically, certain assets are reported in Corporate Center – Core Functions, whereas the corresponding costs and/or revenues are entirely or partially allocated to the segments based on various internally determined allocations.
384
Note 2b Segment reporting by geographic location
The geographic analysis of operating income and non-current assets is based on the location of the entity in which the transactions and assets are recorded. This geographical information does not reflect the way the Group is managed. The segments of the Group are managed globally with a focus on cross-divisional collaboration and the interest of our clients to yield the maximum possible profitability by product line for the Group. The geographic analysis of operating income and non-current assets is provided in order to comply with IFRS.
| | | | | | | | | | | | | | | | |
| For the year ended 31 December 2013 | |
| | Total operating income | | | Total non-current assets | |
| | | CHF million | | | Share % | | | CHF million | | | Share % | |
| Americas | | | 9,319 | | | | 34 | | | | 6,072 | | | | 46 | |
| | | | | | | | | | | | | | | | | |
of which: USA | | | 9,002 | | | | 32 | | | | 5,637 | | | | 43 | |
| | | | | | | | | | | | | | | | | |
| Asia Pacific | | | 4,313 | | | | 16 | | | | 353 | | | | 3 | |
| | | | | | | | | | | | | | | | | |
| Europe, Middle East and Africa | | | 3,373 | | | | 12 | | | | 1,455 | | | | 11 | |
| | | | | | | | | | | | | | | | | |
of which: United Kingdom | | | 2,189 | | | | 8 | | | | 628 | | | | 5 | |
| | | | | | | | | | | | | | | | | |
of which: Rest of Europe | | | 1,121 | | | | 4 | | | | 821 | | | | 6 | |
| | | | | | | | | | | | | | | | | |
of which: Middle East and Africa | | | 63 | | | | 0 | | | | 6 | | | | 0 | |
| | | | | | | | | | | | | | | | | |
| Switzerland | | | 10,728 | | | | 39 | | | | 5,261 | | | | 40 | |
| | | | | | | | | | | | | | | | | |
| Total | | | 27,732 | | | | 100 | | | | 13,141 | | | | 100 | |
| | | | | | | | | | | | | | | | | |
| | | | |
| For the year ended 31 December 2012 | | | | | | | | | | | | |
| | Total operating income | | | Total non-current assets | |
| | | CHF million | | | Share % | | | CHF million | | | Share % | |
| Americas | | | 9,678 | | | | 38 | | | | 6,171 | | | | 46 | |
| | | | | | | | | | | | | | | | | |
of which: USA | | | 9,214 | | | | 36 | | | | 5,752 | | | | 43 | |
| | | | | | | | | | | | | | | | | |
| Asia Pacific | | | 3,094 | | | | 12 | | | | 367 | | | | 3 | |
| | | | | | | | | | | | | | | | | |
| Europe, Middle East and Africa | | | 1,609 | | | | 6 | | | | 1,494 | | | | 11 | |
| | | | | | | | | | | | | | | | | |
of which: United Kingdom | | | 118 | | | | 0 | | | | 647 | | | | 5 | |
| | | | | | | | | | | | | | | | | |
of which: Rest of Europe | | | 1,426 | | | | 6 | | | | 840 | | | | 6 | |
| | | | | | | | | | | | | | | | | |
of which: Middle East and Africa | | | 66 | | | | 0 | | | | 7 | | | | 0 | |
| | | | | | | | | | | | | | | | | |
| Switzerland | | | 11,041 | | | | 43 | | | | 5,292 | | | | 40 | |
| | | | | | | | | | | | | | | | | |
| Total | | | 25,423 | | | | 100 | | | | 13,324 | | | | 100 | |
| | | | | | | | | | | | | | | | | |
| | | | |
| For the year ended 31 December 2011 | | | | | | | | | | | | |
| | Total operating income | | | Total non-current assets | |
| | | CHF million | | | Share % | | | CHF million | | | Share % | |
| Americas | | | 9,491 | | | | 34 | | | | 9,038 | | | | 56 | |
| | | | | | | | | | | | | | | | | |
of which: USA | | | 9,324 | | | | 34 | | | | 8,617 | | | | 53 | |
| | | | | | | | | | | | | | | | | |
| Asia Pacific | | | 3,689 | | | | 13 | | | | 407 | | | | 3 | |
| | | | | | | | | | | | | | | | | |
| Europe, Middle East and Africa | | | 3,115 | | | | 11 | | | | 1,687 | | | | 10 | |
| | | | | | | | | | | | | | | | | |
of which: United Kingdom | | | 1,385 | | | | 5 | | | | 653 | | | | 4 | |
| | | | | | | | | | | | | | | | | |
of which: Rest of Europe | | | 1,638 | | | | 6 | | | | 1,026 | | | | 6 | |
| | | | | | | | | | | | | | | | | |
of which: Middle East and Africa | | | 92 | | | | 0 | | | | 8 | | | | 0 | |
| | | | | | | | | | | | | | | | | |
| Switzerland | | | 11,494 | | | | 41 | | | | 5,045 | | | | 31 | |
| | | | | | | | | | | | | | | | | |
| Total | | | 27,788 | | | | 100 | | | | 16,177 | | | | 100 | |
| | | | | | | | | | | | | | | | | |
385
Financial information
Notes to the consolidated financial statements
Income statement notes
Note 3 Net interest and trading income
| | | | | | | | | | | | | | | | |
| | For the year ended | | | % change from | |
| CHF million | | 31.12.13 | | | 31.12.12 | | | 31.12.11 | | | 31.12.12 | |
| | | | |
| Net interest and trading income | | | | | | | | | | | | | | | | |
| | | | | | | | | | | | | | | | | |
| Net interest income | | | 5,786 | | | | 5,978 | | | | 6,826 | | | | (3 | ) |
| | | | | | | | | | | | | | | | | |
| Net trading income | | | 5,130 | | | | 3,526 | | | | 4,343 | | | | 45 | |
| | | | | | | | | | | | | | | | | |
| Total net interest and trading income | | | 10,915 | | | | 9,504 | | | | 11,169 | | | | 15 | |
| | | | | | | | | | | | | | | | | |
| Wealth Management | | | 2,868 | | | | 2,728 | | | | 2,846 | | | | 5 | |
| | | | | | | | | | | | | | | | | |
| Wealth Management Americas | | | 1,323 | | | | 1,265 | | | | 1,179 | | | | 5 | |
| | | | | | | | | | | | | | | | | |
| Retail & Corporate | | | 2,485 | | | | 2,467 | | | | 2,661 | | | | 1 | |
| | | | | | | | | | | | | | | | | |
| Global Asset Management | | | 9 | | | | 9 | | | | 8 | | | | 0 | |
| | | | | | | | | | | | | | | | | |
| Investment Bank | | | 5,015 | | | | 3,574 | | | | 2,831 | | | | 40 | |
| | | | | | | | | | | | | | | | | |
of which: Corporate Client Solutions | | | 1,035 | | | | 575 | | | | 399 | | | | 80 | |
| | | | | | | | | | | | | | | | | |
of which: Investor Client Services | | | 3,980 | | | | 2,999 | | | | 2,432 | | | | 33 | |
| | | | | | | | | | | | | | | | | |
| Corporate Center | | | (784 | ) | | | (540 | ) | | | 1,645 | | | | 45 | |
| | | | | | | | | | | | | | | | | |
of which: Core Functions | | | (1,045 | ) | | | (1,992 | ) | | | 1,765 | | | | (48 | ) |
| | | | | | | | | | | | | | | | | |
of which: own credit on financial liabilities designated at fair value1 | | | (283 | ) | | | (2,202 | ) | | | 1,537 | | | | (87 | ) |
| | | | | | | | | | | | | | | | | |
of which: Non-core and Legacy Portfolio | | | 261 | | | | 1,452 | | | | (121 | ) | | | (82 | ) |
| | | | | | | | | | | | | | | | | |
| Total net interest and trading income | | | 10,915 | | | | 9,504 | | | | 11,169 | | | | 15 | |
| | | | | | | | | | | | | | | | | |
| | | | |
| Net interest income | | | | | | | | | | | | | | | | |
| | | | | | | | | | | | | | | | | |
| Interest income | | | | | | | | | | | | | | | | |
| | | | | | | | | | | | | | | | | |
| Interest earned on loans and advances2 | | | 8,686 | | | | 9,323 | | | | 9,925 | | | | (7 | ) |
| | | | | | | | | | | | | | | | | |
| Interest earned on securities borrowed and reverse repurchase agreements | | | 852 | | | | 1,413 | | | | 1,716 | | | | (40 | ) |
| | | | | | | | | | | | | | | | | |
| Interest and dividend income from trading portfolio | | | 2,913 | | | | 4,482 | | | | 5,466 | | | | (35 | ) |
| | | | | | | | | | | | | | | | | |
| Interest income on financial assets designated at fair value | | | 364 | | | | 369 | | | | 248 | | | | (1 | ) |
| | | | | | | | | | | | | | | | | |
| Interest and dividend income from financial investments available-for-sale | | | 322 | | | | 381 | | | | 615 | | | | (15 | ) |
| | | | | | | | | | | | | | | | | |
| Total | | | 13,137 | | | | 15,968 | | | | 17,969 | | | | (18 | ) |
| | | | | | | | | | | | | | | | | |
| Interest expense | | | | | | | | | | | | | | | | |
| | | | | | | | | | | | | | | | | |
| Interest on amounts due to banks and customers | | | 893 | | | | 1,433 | | | | 2,040 | | | | (38 | ) |
| | | | | | | | | | | | | | | | | |
| Interest on securities lent and repurchase agreements | | | 829 | | | | 1,208 | | | | 1,352 | | | | (31 | ) |
| | | | | | | | | | | | | | | | | |
| Interest expense from trading portfolio3 | | | 1,846 | | | | 2,442 | | | | 2,851 | | | | (24 | ) |
| | | | | | | | | | | | | | | | | |
| Interest on financial liabilities designated at fair value | | | 1,197 | | | | 1,744 | | | | 1,993 | | | | (31 | ) |
| | | | | | | | | | | | | | | | | |
| Interest on debt issued | | | 2,586 | | | | 3,163 | | | | 2,907 | | | | (18 | ) |
| | | | | | | | | | | | | | | | | |
| Total | | | 7,351 | | | | 9,990 | | | | 11,143 | | | | (26 | ) |
| | | | | | | | | | | | | | | | | |
| Net interest income | | | 5,786 | | | | 5,978 | | | | 6,826 | | | | (3 | ) |
| | | | | | | | | | | | | | | | | |
1 Refer to “Note 24 Fair value measurement” for more information on own credit. 2 Includes interest income on impaired loans and advances of CHF 15 million for 2013, CHF 16 million for 2012 and CHF 20 million for 2011. 3 Includes expense related to dividend payment obligations on trading liabilities.
386
Note 3 Net interest and trading income (continued)
| | | | | | | | | | | | | | | | |
| | For the year ended | | | % change from | |
| CHF million | | 31.12.13 | | | 31.12.12 | | | 31.12.11 | | | 31.12.12 | |
| | | | |
| Net trading income | | | | | | | | | | | | | | | | |
| | | | | | | | | | | | | | | | | |
| Investment Bank Corporate Client Solutions | | | 545 | | | | 389 | | | | 355 | | | | 40 | |
| | | | | | | | | | | | | | | | | |
| Investment Bank Investor Client Services | | | 3,584 | | | | 2,351 | | | | 1,502 | | | | 52 | |
| | | | | | | | | | | | | | | | | |
| Other business divisions and Corporate Center | | | 1,002 | | | | 786 | | | | 2,487 | | | | 27 | |
| | | | | | | | | | | | | | | | | |
| Net trading income | | | 5,130 | | | | 3,526 | | | | 4,343 | | | | 45 | |
| | | | | | | | | | | | | | | | | |
of which: net gains/(losses) from financial assets designated at fair value | | | 99 | | | | 420 | | | | 419 | | | | (76 | ) |
| | | | | | | | | | | | | | | | | |
of which: net gains/(losses) from financial liabilities designated at fair value1,2 | | | (2,056 | ) | | | (6,493 | ) | | | 7,437 | | | | (68 | ) |
| | | | | | | | | | | | | | | | | |
1 Refer to “Note 24 Fair value measurement” for more information on own credit. 2 Fair value changes of hedges related to financial liabilities designated at fair value are also reported in Net trading income.
Net trading income in 2013 included a gain of CHF 431 million from the valuation of the option to acquire the SNB StabFund’s equity, reflected in the lineOther business divisions and Corporate Center, compared with a gain of CHF 526 million in 2012 and a CHF 133 million loss in 2011.
Net trading income in 2011 included a loss of CHF 1,849 million due to the unauthorized trading incident, reflected in the lineInvestment Bank Investor Client Services.
Note 4 Net fee and commission income
| | | | | | | | | | | | | | | | |
| | For the year ended | | | % change from | |
| CHF million | | 31.12.13 | | | 31.12.12 | | | 31.12.11 | | | 31.12.12 | |
| Equity underwriting fees | | | 850 | | | | 807 | | | | 626 | | | | 5 | |
| | | | | | | | | | | | | | | | | |
| Debt underwriting fees | | | 524 | | | | 732 | | | | 554 | | | | (28 | ) |
| | | | | | | | | | | | | | | | | |
| Total underwriting fees | | | 1,374 | | | | 1,539 | | | | 1,180 | | | | (11 | ) |
| | | | | | | | | | | | | | | | | |
| M&A and corporate finance fees | | | 613 | | | | 679 | | | | 992 | | | | (10 | ) |
| | | | | | | | | | | | | | | | | |
| Brokerage fees | | | 4,035 | | | | 3,836 | | | | 4,169 | | | | 5 | |
| | | | | | | | | | | | | | | | | |
| Investment fund fees | | | 3,803 | | | | 3,626 | | | | 3,577 | | | | 5 | |
| | | | | | | | | | | | | | | | | |
| Portfolio management and advisory fees | | | 6,625 | | | | 5,895 | | | | 5,551 | | | | 12 | |
| | | | | | | | | | | | | | | | | |
| Insurance-related and other fees | | | 485 | | | | 451 | | | | 368 | | | | 8 | |
| | | | | | | | | | | | | | | | | |
| Total securities trading and investment activity fees | | | 16,935 | | | | 16,026 | | | | 15,837 | | | | 6 | |
| | | | | | | | | | | | | | | | | |
| Credit-related fees and commissions | | | 367 | | | | 414 | | | | 438 | | | | (11 | ) |
| | | | | | | | | | | | | | | | | |
| Commission income from other services | | | 873 | | | | 833 | | | | 827 | | | | 5 | |
| | | | | | | | | | | | | | | | | |
| Total fee and commission income | | | 18,176 | | | | 17,273 | | | | 17,102 | | | | 5 | |
| | | | | | | | | | | | | | | | | |
| Brokerage fees paid | | | 839 | | | | 871 | | | | 933 | | | | (4 | ) |
| | | | | | | | | | | | | | | | | |
| Other | | | 1,050 | | | | 1,006 | | | | 933 | | | | 4 | |
| | | | | | | | | | | | | | | | | |
| Total fee and commission expense | | | 1,889 | | | | 1,876 | | | | 1,866 | | | | 1 | |
| | | | | | | | | | | | | | | | | |
| Net fee and commission income | | | 16,287 | | | | 15,396 | | | | 15,236 | | | | 6 | |
| | | | | | | | | | | | | | | | | |
of which: net brokerage fees | | | 3,196 | | | | 2,965 | | | | 3,236 | | | | 8 | |
| | | | | | | | | | | | | | | | | |
387
Financial information
Notes to the consolidated financial statements
Note 5 Other income
| | | | | | | | | | | | | | | | |
| | For the year ended | | | % change from | |
| CHF million | | 31.12.13 | | | 31.12.12 | | | 31.12.11 | | | 31.12.12 | |
| Associates and subsidiaries | | | | | | | | | | | | | | | | |
| | | | | | | | | | | | | | | | | |
| Net gains/(losses) from disposals of subsidiaries1 | | | 111 | | | | (7 | ) | | | (18 | ) | | | | |
| | | | | | | | | | | | | | | | | |
| Net gains/(losses) from disposals of investments in associates | | | 0 | | | | 0 | | | | 20 | | | | | |
| | | | | | | | | | | | | | | | | |
| Share of net profits of associates | | | 49 | | | | 88 | | | | 42 | | | | (44 | ) |
| | | | | | | | | | | | | | | | | |
| Total | | | 160 | | | | 81 | | | | 44 | | | | 98 | |
| | | | | | | | | | | | | | | | | |
| Financial investments available-for-sale | | | | | | | | | | | | | | | | |
| | | | | | | | | | | | | | | | | |
| Net gains/(losses) from disposals | | | 209 | | | | 393 | | | | 926 | | | | (47 | ) |
| | | | | | | | | | | | | | | | | |
| Impairment charges | | | (41 | ) | | | (85 | ) | | | (39 | ) | | | (52 | ) |
| | | | | | | | | | | | | | | | | |
| Total | | | 168 | | | | 308 | | | | 887 | | | | (45 | ) |
| | | | | | | | | | | | | | | | | |
| Net income from properties2 | | | 35 | | | | 35 | | | | 38 | | | | 0 | |
| | | | | | | | | | | | | | | | | |
| Net gains/(losses) from investment properties3 | | | (16 | ) | | | 4 | | | | 9 | | | | | |
| | | | | | | | | | | | | | | | | |
| Other | | | 233 | | | | 213 | | | | 490 | | | | 9 | |
| | | | | | | | | | | | | | | | | |
| Total other income | | | 580 | | | | 641 | | | | 1,467 | | | | (10 | ) |
| | | | | | | | | | | | | | | | | |
1 Includes foreign exchange gains/losses reclassified from other comprehensive income related to disposed or dormant subsidiaries. 2 Includes net rent received from third parties and net operating expenses. 3 Includes unrealized and realized gains/losses from investment properties at fair value and foreclosed assets.
Net gains from disposals of financial investments available-for-sale in 2013 included a gain of CHF 74 million resulting from the divestment of the Group’s participation in Euroclear Plc., of which CHF 27 million was allocated to Retail & Corporate, CHF 25 million to Wealth Management and CHF 22 million to the Investment Bank. Further, it included net gains of CHF 61 million in Corporate Center – Core Functions. 2012 included net gains of CHF 272 million in Corporate Center – Core Functions, as well as gains of CHF 101 million in Corporate Center – Non-core and Legacy Portfolio, mainly related to the sale of an equity investment. 2011 included a gain of CHF 722 million from the sale of
the strategic investment portfolio, of which CHF 433 million was allocated to Wealth Management and CHF 289 million to Retail & Corporate, as well as net gains of CHF 141 million in Corporate Center – Core Functions.
The lineOther included net gains of CHF 53 million on sales of loans and receivables in 2013, compared with net losses of CHF 11 million in 2012 and net gains of CHF 344 million in 2011. Additionally, it included gains on sales of real estate of CHF 288 million in 2013, CHF 112 million in 2012 and CHF 78 million in 2011. 2013 further included losses of CHF 194 million related to the buyback of debt in public tender offers.
388
Note 6 Personnel expenses
| | | | | | | | | | | | | | | | |
| | For the year ended | | | % change from | |
| CHF million | | 31.12.13 | | | 31.12.12 | | | 31.12.11 | | | 31.12.12 | |
| Salaries | | | 6,268 | | | | 6,814 | | | | 6,859 | | | | (8 | ) |
| | | | | | | | | | | | | | | | | |
| Variable compensation – performance awards1 | | | 2,986 | | | | 3,000 | | | | 3,516 | | | | 0 | |
| | | | | | | | | | | | | | | | | |
of which: guarantees for new hires | | | 76 | | | | 134 | | | | 173 | | | | (43 | ) |
| | | | | | | | | | | | | | | | | |
| Variable compensation – other1 | | | 288 | | | | 367 | | | | 191 | | | | (22 | ) |
| | | | | | | | | | | | | | | | | |
of which: replacement payments2 | | | 78 | | | | 109 | | | | 121 | | | | (28 | ) |
| | | | | | | | | | | | | | | | | |
of which: forfeiture credits | | | (146 | ) | | | (174 | ) | | | (215 | ) | | | (16 | ) |
| | | | | | | | | | | | | | | | | |
of which: severance payments3 | | | 114 | | | | 303 | | | | 239 | | | | (62 | ) |
| | | | | | | | | | | | | | | | | |
of which: retention plan and other payments | | | 242 | | | | 128 | | | | 46 | | | | 89 | |
| | | | | | | | | | | | | | | | | |
| Contractors | | | 190 | | | | 214 | | | | 217 | | | | (11 | ) |
| | | | | | | | | | | | | | | | | |
| Social security | | | 792 | | | | 768 | | | | 743 | | | | 3 | |
| | | | | | | | | | | | | | | | | |
| Pension and other post-employment benefit plans4 | | | 887 | | | | 18 | | | | 831 | | | | | |
| | | | | | | | | | | | | | | | | |
| Wealth Management Americas: Financial advisor compensation1,5 | | | 3,140 | | | | 2,873 | | | | 2,518 | | | | 9 | |
| | | | | | | | | | | | | | | | | |
| Other personnel expenses | | | 631 | | | | 682 | | | | 758 | | | | (7 | ) |
| | | | | | | | | | | | | | | | | |
| Total personnel expenses6 | | | 15,182 | | | | 14,737 | | | | 15,634 | | | | 3 | |
| | | | | | | | | | | | | | | | | |
1 Refer to “Note 29 Equity participation and other compensation plans” for more information. 2 Replacement payments are payments made to compensate employees for deferred awards forfeited as a result of joining UBS. 3 Includes legally obligated and standard severance payments. 4 2012 included a credit of CHF 730 million related to changes to the Swiss pension plan and a credit of CHF 116 million related to changes to retiree medical and life insurance benefit plans in the US. Refer to “Note 28 Pension and other post-employment benefit plans” for more information. 5 Financial advisor compensation consists of grid-based compensation based directly on compensable revenues generated by financial advisors and supplemental compensation calculated based on financial advisor productivity, firm tenure, assets and other variables. It also includes costs related to compensation commitments with financial advisors entered into at the time of recruitment, which are subject to vesting requirements. 6 Included net restructuring charges of CHF 156 million, CHF 358 million and CHF 261 million for the years ended 31 December 2013, 31 December 2012 and 31 December 2011, respectively. Refer to “Note 32 Changes in organization” for more information.
Note 7 General and administrative expenses
| | | | | | | | | | | | | | | | |
| | For the year ended | | | % change from | |
| CHF million | | 31.12.13 | | | 31.12.12 | | | 31.12.11 | | | 31.12.12 | |
| Occupancy | | | 1,044 | | | | 1,074 | | | | 1,059 | | | | (3 | ) |
| | | | | | | | | | | | | | | | | |
| Rent and maintenance of IT and other equipment | | | 458 | | | | 473 | | | | 429 | | | | (3 | ) |
| | | | | | | | | | | | | | | | | |
| Communication and market data services | | | 609 | | | | 632 | | | | 616 | | | | (4 | ) |
| | | | | | | | | | | | | | | | | |
| Administration | | | 638 | | | | 636 | | | | 621 | | | | 0 | |
| | | | | | | | | | | | | | | | | |
| Marketing and public relations | | | 478 | | | | 528 | | | | 393 | | | | (9 | ) |
| | | | | | | | | | | | | | | | | |
| Travel and entertainment | | | 451 | | | | 450 | | | | 470 | | | | 0 | |
| | | | | | | | | | | | | | | | | |
| Professional fees | | | 1,032 | | | | 908 | | | | 822 | | | | 14 | |
| | | | | | | | | | | | | | | | | |
| Outsourcing of IT and other services | | | 1,340 | | | | 1,357 | | | | 1,151 | | | | (1 | ) |
| | | | | | | | | | | | | | | | | |
| Provisions for litigation, regulatory and similar matters1,2 | | | 1,701 | | | | 2,549 | | | | 276 | | | | (33 | ) |
| | | | | | | | | | | | | | | | | |
| Other3 | | | 628 | | | | 47 | | | | 122 | | | | | |
| | | | | | | | | | | | | | | | | |
| Total general and administrative expenses4 | | | 8,380 | | | | 8,653 | | | | 5,959 | | | | (3 | ) |
| | | | | | | | | | | | | | | | | |
1 Reflects the net increase/release of provisions for litigation, regulatory and similar matters recognized in the income statement. In addition, it includes recoveries from third parties of CHF 15 million, CHF 12 million and CHF 33 million for the years ended 31 December 2013, 31 December 2012 and 31 December 2011, respectively. A portion (CHF 21 million release) of the net increase/release recognized in the income statement for provisions for certain litigation, regulatory and similar matters for 2013 as presented in “Note 22a Provisions” was recorded as other income rather than as general and administrative expenses. 2 Refer to “Note 22 Provisions and contingent liabilities” for more information. 3 2013 included a charge of CHF 110 million related to the Swiss-UK tax agreement and an impairment charge of CHF 87 million related to certain disputed receivables. 4 Included net restructuring charges of CHF 548 million, CHF 0 million and CHF 93 million for the years ended 31 December 2013, 31 December 2012 and 31 December 2011, respectively. Refer to “Note 32 Changes in organization” for more information.
389
Financial information
Notes to the consolidated financial statements
Note 8 Income taxes
| | | | | | | | | | | | |
| | For the year ended | |
| CHF million | | 31.12.13 | | | 31.12.12 | | | 31.12.11 | |
| | | |
| Tax expense/(benefit) | | | | | | | | | | | | |
| Swiss | | | | | | | | | | | | |
Current | | | 93 | | | | 95 | | | | 23 | |
Deferred | | | 455 | | | | 23 | | | | 1,041 | |
| Foreign | | | | | | | | | | | | |
Current | | | 342 | | | | 72 | | | | 83 | |
Deferred | | | (1,000 | ) | | | 271 | | | | (246 | ) |
| | | | | | | | | | | | | |
| Total income tax expense/(benefit) | | | (110 | ) | | | 461 | | | | 901 | |
| | | | | | | | | | | | | |
The Swiss current tax expense of CHF 93 million related to taxable profits, against which no losses were available to offset, earned by Swiss subsidiaries and also from the sale of real estate. The Swiss deferred tax expense of CHF 455 million mainly reflected the amortization of deferred tax assets previously recognized in relation to tax losses carried forward used to offset taxable profits for the year.
The foreign current tax expense of CHF 342 million related to a tax expense in respect of taxable profits earned by non-Swiss subsidiaries and branches, against which no losses were available to offset. The
foreign net deferred tax benefit of CHF 1,000 million reflected a net upward revaluation of deferred tax assets based on a reassessment of future profitability taking into account updated business plan forecasts. This was partially offset by the amortization of deferred tax assets, as tax losses were used against taxable profits.
The components of operating profit before tax, and the differences between income tax expense reflected in the financial statements and the amounts calculated at the Swiss tax rate, are shown in the table below.
| | | | | | | | | | | | |
| | For the year ended | |
| CHF million | | 31.12.13 | | | 31.12.12 | | | 31.12.11 | |
| Operating profit/(loss) before tax | | | 3,272 | | | | (1,794 | ) | | | 5,307 | |
of which: Swiss | | | 3,323 | | | | 4,040 | | | | 4,652 | |
of which: Foreign | | | (51 | ) | | | (5,834 | ) | | | 654 | |
| | | | | | | | | | | | | |
| Income tax at Swiss tax rate of 21% for both 2013 and 2012, and 21.5% for 2011 | | | 687 | | | | (377 | ) | | | 1,141 | |
| | | | | | | | | | | | | |
| Increase/(decrease) resulting from: | | | | | | | | | | | | |
| Foreign tax rates differing from Swiss tax rate | | | (305 | ) | | | (680 | ) | | | 98 | |
| Tax effects of losses not recognized | | | 58 | | | | 184 | | | | 939 | |
| Previously unrecognized tax losses now utilized | | | (419 | ) | | | (1,342 | ) | | | (8 | ) |
| Non-taxable and lower taxed income | | | (624 | ) | | | (417 | ) | | | (1,189 | ) |
| Non-deductible expenses and additional taxable income | | | 1,245 | | | | 2,205 | | | | 674 | |
| Adjustments related to prior years – current tax | | | (32 | ) | | | (216 | ) | | | (171 | ) |
| Adjustments related to prior years – deferred tax | | | 6 | | | | 1 | | | | 17 | |
| Change in deferred tax valuation allowances | | | (859 | ) | | | 1,071 | | | | (680 | ) |
| Adjustments to deferred tax balances arising from changes in tax rates | | | 107 | | | | 7 | | | | 42 | |
| Other items | | | 28 | | | | 25 | | | | 39 | |
| | | | | | | | | | | | | |
| Income tax expense/(benefit) | | | (110 | ) | | | 461 | | | | 901 | |
| | | | | | | | | | | | | |
The following is an explanation of the items included as differences between group operating profit before tax at the Swiss tax rate and the actual income tax expense.
Foreign tax rates differing from Swiss tax rate
To the extent that Group profits or losses arise outside Switzerland, the applicable local tax rate may differ from the Swiss tax rate. This item reflects, for such profits or losses, an adjustment from the tax expense/ benefit that would arise at the Swiss tax rate and the tax expense/
benefit that would arise at the applicable local tax rate. A tax benefit arises in the year in relation to entities which have losses and also local tax rates in excess of the Swiss tax rate.
Tax effects of losses not recognized
This item relates to tax losses of entities arising in the year, which are not recognized as deferred tax assets. Consequently, no tax benefit arises in relation to those losses. Therefore, the tax benefit calculated by applying the local tax rate to those losses as described above is reversed.
390
Note 8 Income taxes (continued)
Previously unrecorded tax losses now utilized
This item relates to taxable profits for the year, which are offset by tax losses from previous years, for which no deferred tax assets were previously recorded. Consequently, no current tax or deferred tax expense arises in relation to those taxable profits. Therefore, the tax expense calculated by applying the local rate on those profits is reversed.
Non-taxable and lower taxed income
This item relates to profits for the year, which are either permanently not taxable or are taxable, but at a lower rate of tax than the local tax rate. It also includes any permanent deductions made for tax purposes, which are not reflected in the accounts thereby effectively ensuring that profits covered by the deduction are not taxable.
Non-deductible expenses and additional taxable income
This item mainly relates to income for the year, which is imputed for tax purposes for an entity, but is not included in its operating profit. In addition, it includes expenses for the year, which are permanently non-deductible.
Adjustments related to prior years – current tax
This item relates to adjustments to current tax expenses for prior years, for example, if the tax payable for a year agreed with the tax authorities is expected to differ from the amount previously reflected in the accounts.
Adjustments related to prior years – deferred tax
This item relates to adjustments to deferred tax recognized in prior years, for example, if a tax loss for a year is fully recognized and the
amount of the tax loss agreed with the tax authorities is expected to differ from the amount previously recognized as deferred tax assets in the accounts.
Change in deferred tax valuation allowances
This item includes revaluations of deferred tax assets previously recognized resulting from reassessments of expected future profits. It also includes changes in temporary differences in the year, for which deferred tax is not recognized. The amount in the year mainly relates to the upward revaluation of deferred tax assets referred to above.
Adjustments to deferred tax balances arising from changes in tax rates
This item relates to remeasurement of deferred tax assets and liabilities recognized due to changes in tax rates. These have the effect of changing the future tax savings that are expected from tax losses or deductible tax differences and therefore the amount of deferred tax assets recognized or, alternatively, changing the tax cost of additional taxable income from taxable temporary differences and therefore the deferred tax liability.
Other items
Other items include other differences between profit or losses at the local tax rate and the actual local tax expense or benefit, including increases in provisions for uncertain positions in relation to the current year, interest accruals for such provisions in relation to prior years and other items.
| | | | | | | | | | | | | | | | | | | | | | | | |
CHF million | | 31.12.13 | | | 31.12.12 | |
| Deferred tax assets | | Gross | | | Valuation
allowance | | | Recognized | | | Gross | | | Valuation allowance | | | Recognized | |
| Compensation and benefits | | | 1,290 | | | | (415 | ) | | | 875 | | | | 1,698 | | | | (1,047 | ) | | | 651 | |
| | | | | | | | | | | | | | | | | | | | | | | | | |
| Tax loss carry-forwards | | | 28,801 | | | | (22,534 | ) | | | 6,267 | | | | 29,022 | | | | (23,276 | ) | | | 5,746 | |
| | | | | | | | | | | | | | | | | | | | | | | | | |
| Trading assets | | | 831 | | | | (84 | ) | | | 747 | | | | 1,067 | | | | (131 | ) | | | 936 | |
| | | | | | | | | | | | | | | | | | | | | | | | | |
| Other | | | 1,729 | | | | (773 | ) | | | 956 | | | | 1,235 | | | | (425 | ) | | | 809 | |
| | | | | | | | | | | | | | | | | | | | | | | | | |
| Total deferred tax assets | | | 32,651 | | | | (23,807 | ) | | | 8,845 | | | | 33,021 | | | | (24,879 | ) | | | 8,143 | |
| | | | | | | | | | | | | | | | | | | | | | | | | |
| | | | | | |
| Deferred tax liabilities | | | | | | | | | | | | | | | | | | |
| Goodwill and intangible assets | | | | | | | | | | | 37 | | | | | | | | | | | | 17 | |
| | | | | | | | | | | | | | | | | | | | | | | | | |
| Financial investments | | | | | | | | | | | 0 | | | | | | | | | | | | 2 | |
| | | | | | | | | | | | | | | | | | | | | | | | | |
| Investments in associates and other | | | | | | | | | | | 21 | | | | | | | | | | | | 33 | |
| | | | | | | | | | | | | | | | | | | | | | | | | |
| Total deferred tax liabilities | | | | | | | | | | | 59 | | | | | | | | | | | | 52 | |
| | | | | | | | | | | | | | | | | | | | | | | | | |
391
Financial information
Notes to the consolidated financial statements
Note 8 Income taxes (continued)
Certain deferred tax asset and liability movements are recognized directly in equity. In 2013, these include tax benefits of CHF 230 million recognized inOther comprehensive income (2012: charges of CHF 581 million), which mainly relate to the reduction in temporary difference deferred tax liabilities. In addition, they include tax benefits of CHF 91 million recognized inShare premium (2012: charges of CHF 457 million), which mainly relate to an increase in deferred tax assets for net Swiss tax losses arising in previous periods.
In addition, there were net foreign currency translation losses related to the effects of exchange rate movements on tax assets and liabilities denominated in currencies other than Swiss francs. In the table on the previous page, the valuation allowance represents amounts that are not expected to provide a future tax benefit due to insufficient projected future taxable profits. UBS AG Switzerland and certain overseas branches and subsidiaries of the Group have deferred tax assets related
to tax loss carry-forwards and other items as shown in the table on the previous page. For entities that incurred losses in either the current or preceding year, deferred tax assets of CHF 4,484 million were recognized as of 31 December 2013 (CHF 3,487 million as of 31 December 2012).
The deferred tax assets recognized as of 31 December 2013 in respect of tax loss carry-forwards were based on expected profitability using business plan assumptions, as adjusted to take into account the recognition criteria of IAS 12,Income Taxes. If the business plan earnings and assumptions in future periods substantially deviate from the current assumptions, the amount of deferred tax assets may need to be adjusted in the future.
As of 31 December 2013, tax loss carry-forwards totaling CHF 69,962 million, which were not recognized as deferred tax assets, were available to be offset against future taxable profits. These tax losses expire as follows:
| | | | | | | | |
| CHF million | | 31.12.13 | | | 31.12.12 | |
| Within 1 year | | | 0 | | | | 0 | |
| | | | | | | | | |
| From 2 to 5 years | | | 10,683 | | | | 7,912 | |
| | | | | | | | | |
| From 6 to 10 years | | | 189 | | | | 461 | |
| | | | | | | | | |
| From 11 to 20 years | | | 40,579 | | | | 43,866 | |
| | | | | | | | | |
| No expiry | | | 18,512 | | | | 15,886 | |
| | | | | | | | | |
| Total | | | 69,962 | | | | 68,125 | |
| | | | | | | | | |
In general, Swiss tax losses can be carried forward for seven years, US federal tax losses for 20 years and UK and Jersey tax losses for an unlimited period. The Group provides for deferred income tax on
undistributed earnings of subsidiaries except to the extent that those earnings are indefinitely invested. As of 31 December 2013, no such earnings were considered indefinitely invested.
Note 9 Earnings per share (EPS) and shares outstanding
| | | | | | | | | | | | | | | | |
| | As of or for the year ended | | | % change from | |
| | | 31.12.13 | | | 31.12.12 | | | 31.12.11 | | | 31.12.12 | |
| | | | |
| Basic earnings (CHF million) | | | | | | | | | | | | | | | | |
| | | | | | | | | | | | | | | | | |
| Net profit/(loss) attributable to UBS shareholders | | | 3,172 | | | | (2,480 | ) | | | 4,138 | | | | | |
| | | | | | | | | | | | | | | | | |
| | | | |
| Diluted earnings (CHF million) | | | | | | | | | | | | | | | | |
| | | | | | | | | | | | | | | | | |
| Net profit/(loss) attributable to UBS shareholders | | | 3,172 | | | | (2,480 | ) | | | 4,138 | | | | | |
| | | | | | | | | | | | | | | | | |
| Less: (profit)/loss on UBS equity derivative contracts | | | 0 | | | | (1 | ) | | | (3 | ) | | | (100 | ) |
| | | | | | | | | | | | | | | | | |
| Net profit/(loss) attributable to UBS shareholders for diluted EPS | | | 3,172 | | | | (2,481 | ) | | | 4,135 | | | | | |
| | | | | | | | | | | | | | | | | |
| | | | |
| Weighted average shares outstanding | | | | | | | | | | | | | | | | |
| | | | | | | | | | | | | | | | | |
| Weighted average shares outstanding for basic EPS | | | 3,763,076,788 | | | | 3,754,112,403 | | | | 3,774,036,437 | | | | 0 | |
| | | | | | | | | | | | | | | | | |
Effect of dilutive potential shares resulting from notional shares,in-the-money
options and warrants outstanding | | | 81,111,217 | | | | 126,261 | | | | 61,259,378 | | | | | |
| | | | | | | | | | | | | | | | | |
| Weighted average shares outstanding for diluted EPS | | | 3,844,188,005 | | | | 3,754,238,664 | | | | 3,835,295,815 | | | | 2 | |
| | | | | | | | | | | | | | | | | |
| | | | |
| Earnings per share (CHF) | | | | | | | | | | | | | | | | |
| | | | | | | | | | | | | | | | | |
| Basic | | | 0.84 | | | | (0.66 | ) | | | 1.10 | | | | | |
| | | | | | | | | | | | | | | | | |
| Diluted | | | 0.83 | | | | (0.66 | ) | | | 1.08 | | | | | |
| | | | | | | | | | | | | | | | | |
| | | | |
| Shares outstanding | | | | | | | | | | | | | | | | |
| | | | | | | | | | | | | | | | | |
| Shares issued | | | 3,842,002,069 | | | | 3,835,250,233 | | | | 3,832,121,899 | | | | 0 | |
| | | | | | | | | | | | | | | | | |
| Treasury shares | | | 73,800,252 | | | | 87,879,601 | | | | 84,955,551 | | | | (16 | ) |
| | | | | | | | | | | | | | | | | |
| Shares outstanding | | | 3,768,201,817 | | | | 3,747,370,632 | | | | 3,747,166,348 | | | | 1 | |
| | | | | | | | | | | | | | | | | |
| Exchangeable shares | | | 246,042 | | | | 418,526 | | | | 509,243 | | | | (41 | ) |
| | | | | | | | | | | | | | | | | |
| Shares outstanding for EPS | | | 3,768,447,859 | | | | 3,747,789,158 | | | | 3,747,675,591 | | | | 1 | |
| | | | | | | | | | | | | | | | | |
The table below outlines the potential shares which could dilute basic earnings per share in the future, but were not dilutive for the periods presented.
| | | | | | | | | | | | | | | | |
| | | | | | | | | | | | % change from | |
| | | | | | | | | | | | | | | | | |
| Number of shares | | 31.12.13 | | | 31.12.12 | | | 31.12.11 | | | 31.12.12 | |
| | | | |
| Potentially dilutive instruments | | | | | | | | | | | | | | | | |
| | | | | | | | | | | | | | | | | |
| Employee share-based compensation awards | | | 117,623,624 | | | | 233,256,208 | | | | 219,744,203 | | | | (50 | ) |
| | | | | | | | | | | | | | | | | |
| Other equity derivative contracts | | | 16,517,384 | | | | 15,386,605 | | | | 24,407,443 | | | | 7 | |
| | | | | | | | | | | | | | | | | |
| SNB warrants1 | | | 0 | | | | 100,000,000 | | | | 100,000,000 | | | | (100 | ) |
| | | | | | | | | | | | | | | | | |
| Total | | | 134,141,008 | | | | 348,642,813 | | | | 344,151,646 | | | | (62 | ) |
| | | | | | | | | | | | | | | | | |
1 These warrants related to the SNB transaction. The SNB provided a loan to a fund owned and controlled by the SNB (the SNB StabFund), to which UBS transferred certain illiquid securities and other positions in 2008 and 2009. As part of this arrangement, UBS granted warrants on shares to the SNB, which would have been exercisable if the SNB incurred a loss on its loan to the SNB StabFund. In 2013, these warrants were terminated following the full repayment of the loan in the third quarter of 2013.
393
Financial information
Notes to the consolidated financial statements
Balance sheet notes: assets
Note 10 Due from banks and loans (held at amortized cost)
| | | | | | | | |
| CHF million | | 31.12.13 | | | 31.12.12 | |
| | |
| By type of exposure | | | | | | | | |
| | | | | | | | | |
| Due from banks, gross | | | 17,232 | | | | 21,242 | |
| | | | | | | | | |
of which: due from central banks | | | 2,407 | | | | 638 | |
| | | | | | | | | |
| Allowance for credit losses | | | (15 | ) | | | (22 | ) |
| | | | | | | | | |
| Other allowances | | | (47 | ) | | | 0 | |
| | | | | | | | | |
| Due from banks, net | | | 17,170 | | | | 21,220 | |
| | | | | | | | | |
| Loans, gross | | | | | | | | |
| | | | | | | | | |
Residential mortgages | | | 137,370 | | | | 132,033 | |
| | | | | | | | | |
Commercial mortgages | | | 22,716 | | | | 22,421 | |
| | | | | | | | | |
Lombard loans | | | 86,820 | | | | 77,579 | |
| | | | | | | | | |
Other loans1,2 | | | 35,945 | | | | 40,407 | |
| | | | | | | | | |
Securities3 | | | 4,813 | | | | 8,166 | |
| | | | | | | | | |
| Subtotal | | | 287,665 | | | | 280,606 | |
| | | | | | | | | |
| Allowance for credit losses | | | (671 | ) | | | (706 | ) |
| | | | | | | | | |
| Other allowances | | | (35 | ) | | | 0 | |
| | | | | | | | | |
| Loans, net | | | 286,959 | | | | 279,901 | |
| | | | | | | | | |
| Total due from banks and loans, net4 | | | 304,128 | | | | 301,121 | |
| | | | | | | | | |
1 Includes corporate loans.2 Includes leveraged finance loans reclassified from held-for-trading. Refer to Note 1a) 10) and “Note 27c Reclassification of financial assets” for more information.3 Includes securities reclassified from held-for-trading. Refer to Note 1a) 10) and “Note 27c Reclassification of financial assets” for more information.4 Refer to “Maximum exposure to credit risk” in the “Risk management and control” section of this report for information on collateral and other credit enhancements.
394
Note 11 Cash collateral on securities borrowed and lent, reverse repurchase and repurchase agreements, and derivative instruments
The Group enters into collateralized reverse repurchase and repurchase agreements, securities borrowing and securities lending transactions and derivative transactions that may result in credit exposure in the event that the counterparty to the transaction is unable to fulfill its contractual obligations. The Group manages
credit risk associated with these activities by monitoring counterparty credit exposure and collateral values on a daily basis and requiring additional collateral to be deposited with or returned to the Group when deemed necessary.
Balance sheet assets
| | | | | | | | | | | | | | | | | | | | | | | | |
| CHF million | | Cash collateral
on securities
borrowed
31.12.13 | | | Reverse
repurchase
agreements
31.12.13 | | | Cash collateral
receivables
on derivative
instruments
31.12.13 | | | Cash collateral on
securities borrowed
31.12.12 | | | Reverse
repurchase
agreements
31.12.12 | | | Cash collateral
receivables
on derivative
instruments
31.12.12 | |
| By counterparty | | | | | | | | | | | | | | | | | | | | | | | | |
| | | | | | | | | | | | | | | | | | | | | | | | | |
| Banks | | | 10,495 | | | | 34,729 | | | | 9,052 | | | | 15,977 | | | | 56,775 | | | | 12,393 | |
| | | | | | | | | | | | | | | | | | | | | | | | | |
| Customers | | | 17,001 | | | | 56,834 | | | | 18,955 | | | | 21,396 | | | | 74,165 | | | | 18,021 | |
| | | | | | | | | | | | | | | | | | | | | | | | | |
| Total | | | 27,496 | | | | 91,563 | | | | 28,007 | | | | 37,372 | | | | 130,941 | | | | 30,413 | |
| | | | | | | | | | | | | | | | | | | | | | | | | |
| | | | | | |
| Balance sheet liabilities | | | | | | | | | | | | | | | | | | | | | | | | |
| | | | | | | | | | | | | | | | | | | | | | | | | |
| CHF million | | Cash collateral
on securities lent 31.12.13 | | | Repurchase
agreements
31.12.13 | | | Cash collateral
payables
on derivative
instruments
31.12.13 | | | Cash collateral on
securities lent
31.12.12 | | | Repurchase
agreements
31.12.12 | | | Cash collateral
payables
on derivative
instruments
31.12.12 | |
| By counterparty | | | | | | | | | | | | | | | | | | | | | | | | |
| | | | | | | | | | | | | | | | | | | | | | | | | |
| Banks | | | 8,805 | | | | 3,953 | | | | 27,236 | | | | 8,572 | | | | 13,727 | | | | 46,101 | |
| | | | | | | | | | | | | | | | | | | | | | | | | |
| Customers | | | 686 | | | | 9,858 | | | | 21,902 | | | | 630 | | | | 24,830 | | | | 25,047 | |
| | | | | | | | | | | | | | | | | | | | | | | | | |
| Total | | | 9,491 | | | | 13,811 | | | | 49,138 | | | | 9,203 | | | | 38,557 | | | | 71,148 | |
| | | | | | | | | | | | | | | | | | | | | | | | | |
395
Financial information
Notes to the consolidated financial statements
Note 12 Allowances and provisions for credit losses
| | | | | | | | | | | | | | | | | | | | | | | | |
| CHF million | | | | | | | | | | | | | | | | | | |
| By movement | |
| Specific
allowances |
| |
| Collective
allowances |
| |
| Total
allowances |
| | | Provisions1 | | | | Total 31.12.13 | | | | Total 31.12.12 | |
| | | | | | | | | | | | | | | | | | | | | | | | | |
| Balance at the beginning of the year | | | 616 | | | | 114 | | | | 730 | | | | 64 | | | | 794 | | | | 938 | |
| | | | | | | | | | | | | | | | | | | | | | | | | |
| Write-offs/usage of provisions | | | (127 | ) | | | (1 | ) | | | (128 | ) | | | 0 | | | | (128 | ) | | | (313 | ) |
| | | | | | | | | | | | | | | | | | | | | | | | | |
| Recoveries | | | 45 | | | | 0 | | | | 45 | | | | 0 | | | | 45 | | | | 63 | |
| | | | | | | | | | | | | | | | | | | | | | | | | |
| Increase/(decrease) recognized in the income statement2 | | | 145 | | | | (93 | ) | | | 52 | | | | (2 | ) | | | 50 | | | | 118 | |
| | | | | | | | | | | | | | | | | | | | | | | | | |
| Reclassifications | | | 1 | | | | 0 | | | | 1 | | | | (1 | ) | | | 0 | | | | 0 | |
| | | | | | | | | | | | | | | | | | | | | | | | | |
| Foreign currency translation | | | (8 | ) | | | 0 | | | | (8 | ) | | | 0 | | | | (9 | ) | | | (8 | ) |
| | | | | | | | | | | | | | | | | | | | | | | | | |
| Other | | | (3 | ) | | | 0 | | | | (3 | ) | | | 0 | | | | (3 | ) | | | (3 | ) |
| | | | | | | | | | | | | | | | | | | | | | | | | |
| Balance at the end of the year | | | 669 | | | | 20 | | | | 688 | | | | 61 | | | | 750 | | | | 794 | |
| | | | | | | | | | | | | | | | | | | | | | | | | |
1 Represents provisions for loan commitments and guarantees. Refer to “Note 22 Provisions and contingent liabilities” for more information. Refer to “Off-balance sheet” in the “Financial and operating performance” section of this report for the maximum irrevocable amount of loan commitments and guarantees 2 Does not include an impairment charge of CHF 87 million related to certain disputed receivables. Including this, total impairment charges related to financial instruments were CHF 137 million in 2013.
| | | | | | | | | | | | | | | | | | | | | | | | |
| By balance sheet line | |
| Specific
allowances |
| |
| Collective
allowances |
| |
| Total
allowances |
| | | Provisions | | | | Total 31.12.13 | | | | Total 31.12.12 | |
| | | | | | | | | | | | | | | | | | | | | | | | | |
| Due from banks | | | 15 | | | | 0 | | | | 15 | | | | | | | | 15 | | | | 22 | |
| | | | | | | | | | | | | | | | | | | | | | | | | |
| Loans | | | 651 | | | | 20 | | | | 671 | | | | | | | | 671 | | | | 706 | |
| | | | | | | | | | | | | | | | | | | | | | | | | |
| Cash collateral on securities borrowed | | | 2 | | | | 0 | | | | 2 | | | | | | | | 2 | | | | 2 | |
| | | | | | | | | | | | | | | | | | | | | | | | | |
| Provisions1 | | | | | | | | | | | | | | | 61 | | | | 61 | | | | 64 | |
| | | | | | | | | | | | | | | | | | | | | | | | | |
| Balance at the end of the year | | | 669 | | | | 20 | | | | 688 | | | | 61 | | �� | | 750 | | | | 794 | |
| | | | | | | | | | | | | | | | | | | | | | | | | |
1Represents provisions for loan commitments and guarantees.
396
Note 13 Trading portfolio
| | | | | | | | |
| CHF million | | 31.12.13 | | | 31.12.12 | |
| | |
| Trading portfolio assets by issuer type | | | | | | | | |
| | | | | | | | | |
| Debt instruments | | | | | | | | |
| | | | | | | | | |
| Government and government agencies | | | 16,073 | | | | 37,594 | |
| | | | | | | | | |
of which: Switzerland | | | 352 | | | | 492 | |
| | | | | | | | | |
of which: USA | | | 3,657 | | | | 16,377 | |
| | | | | | | | | |
of which: Singapore | | | 1,631 | | | | 1,222 | |
| | | | | | | | | |
of which: Italy | | | 1,603 | | | | 1,430 | |
| | | | | | | | | |
of which: South Korea | | | 1,482 | | | | 1,701 | |
| | | | | | | | | |
of which: Australia | | | 1,312 | | | | 2,249 | |
| | | | | | | | | |
of which: Germany | | | 1,192 | | | | 1,930 | |
| | | | | | | | | |
| Banks | | | 5,039 | | | | 8,547 | |
| | | | | | | | | |
| Corporates and other | | | 25,407 | | | | 34,064 | |
| | | | | | | | | |
| Total debt instruments | | | 46,519 | | | | 80,205 | |
| | | | | | | | | |
| Equity instruments | | | 51,881 | | | | 48,035 | |
| | | | | | | | | |
| Financial assets for unit-linked investment contracts | | | 15,849 | | | | 15,230 | |
| | | | | | | | | |
| Financial assets held for trading | | | 114,249 | | | | 143,471 | |
| | | | | | | | | |
| Precious metals and other physical commodities | | | 8,599 | | | | 17,093 | |
| | | | | | | | | |
| Total trading portfolio assets | | | 122,848 | | | | 160,564 | |
| | | | | | | | | |
| | |
| Trading portfolio liabilities by issuer type | | | | | | | | |
| | | | | | | | | |
| Debt instruments | | | | | | | | |
| | | | | | | | | |
| Government and government agencies | | | 8,222 | | | | 16,115 | |
| | | | | | | | | |
of which: Switzerland | | | 173 | | | | 280 | |
| | | | | | | | | |
of which: USA | | | 2,508 | | | | 7,387 | |
| | | | | | | | | |
of which: Singapore | | | 1 | | | | 1 | |
| | | | | | | | | |
of which: Italy | | | 1,140 | | | | 527 | |
| | | | | | | | | |
of which: South Korea | | | 15 | | | | 8 | |
| | | | | | | | | |
of which: Australia | | | 573 | | | | 568 | |
| | | | | | | | | |
of which: Germany | | | 308 | | | | 1,610 | |
| | | | | | | | | |
| Banks | | | 823 | | | | 1,475 | |
| | | | | | | | | |
| Corporates and other | | | 2,453 | | | | 3,036 | |
| | | | | | | | | |
| Total debt instruments | | | 11,498 | | | | 20,626 | |
| | | | | | | | | |
| Equity instruments | | | 15,111 | | | | 13,621 | |
| | | | | | | | | |
| Total trading portfolio liabilities | | | 26,609 | | | | 34,247 | |
| | | | | | | | | |
397
Financial information
Notes to the consolidated financial statements
Note 13 Trading portfolio (continued)
| | | | | | | | |
| CHF million | | 31.12.13 | | | 31.12.12 | |
| Trading portfolio assets by product type1 | | | | | | |
| Debt instruments | | | | | | | | |
| | | | | | | | | |
| Government bills/bonds | | | 13,061 | | | | 28,737 | |
| | | | | | | | | |
| Corporate bonds and municipal bonds, including bonds issued by financial institutions | | | 16,008 | | | | 23,887 | |
| | | | | | | | | |
| Loans | | | 3,033 | | | | 6,129 | |
| | | | | | | | | |
| Investment fund units | | | 11,137 | | | | 12,895 | |
| | | | | | | | | |
| Asset-backed securities | | | 3,280 | | | | 8,556 | |
| | | | | | | | | |
of which: mortgage-backed securities | | | 1,973 | | | | 6,760 | |
| | | | | | | | | |
| Total debt instruments | | | 46,519 | | | | 80,205 | |
| | | | | | | | | |
| Equity instruments | | | 51,881 | | | | 48,035 | |
| | | | | | | | | |
| Financial assets for unit-linked investment contracts | | | 15,849 | | | | 15,230 | |
| | | | | | | | | |
| Financial assets held for trading | | | 114,249 | | | | 143,471 | |
| | | | | | | | | |
| Precious metals and other physical commodities | | | 8,599 | | | | 17,093 | |
| | | | | | | | | |
| Total trading portfolio assets | | | 122,848 | | | | 160,564 | |
| | | | | | | | | |
| | |
| Trading portfolio liabilities by product type1 | | | | | | | | |
| | | | | | | | | |
| Debt instruments | | | | | | | | |
| | | | | | | | | |
| Government bills/bonds | | | 7,327 | | | | 14,741 | |
| | | | | | | | | |
| Corporate bonds and municipal bonds, including bonds issued by financial institutions | | | 3,635 | | | | 5,479 | |
| | | | | | | | | |
| Investment fund units | | | 533 | | | | 383 | |
| | | | | | | | | |
| Asset-backed securities | | | 3 | | | | 22 | |
| | | | | | | | | |
of which: mortgage-backed securities | | | 3 | | | | 22 | |
| | | | | | | | | |
| Total debt instruments | | | 11,498 | | | | 20,626 | |
| | | | | | | | | |
| Equity instruments | | | 15,111 | | | | 13,621 | |
| | | | | | | | | |
| Total trading portfolio liabilities | | | 26,609 | | | | 34,247 | |
| | | | | | | | | |
1 Refer to “Note 24 Fair value measurement” for more information on the fair value hierarchy categorization.
398
Note 14 Derivative instruments and hedge accounting
Derivatives: overview
A derivative is a financial instrument, the value of which is derived from the value of one or more variables (“underlyings”). Underlyings may be indices, exchanges or interest rates, or the value of shares, commodities, bonds or other financial instruments. A derivative commonly requires little or no initial net investment by either counterparty to the trade.
The majority of derivative contracts are negotiated with respect to notional amounts, tenor, price and settlement mechanisms, as is customary with other financial instruments.
Over-the-counter (OTC) contracts are usually traded under a standardized International Swaps and Derivatives Association (ISDA) master trading agreement (MTA) between UBS and its counterparties. Terms are negotiated directly with counterparties and the contracts will have industry-standard settlement mechanisms prescribed by ISDA. The industry continues to promote the use of central counterparties (CCP) to clear OTC trades. The trend toward CCP clearing and settlement will generally facilitate the reduction of systemic credit exposures. Other derivative contracts are standardized in terms of their amounts and settlement dates, and are bought and sold on organized exchanges. These are commonly referred to as exchange-traded derivatives (ETD) contracts. Exchanges offer the benefits of pricing transparency, standardized daily settlement of changes in value, and consequently reduced credit risk.
Derivative instruments are measured at fair value and generally classified asPositive replacement values andNegative replacement values on the face of the balance sheet. However, derivative instruments that trade on an exchange or through a clearing house are generally classified asCash collateral receivable or payable on derivative instruments. For presentation purposes, the Group is subject to the IFRS netting provisions for derivative contracts. Changes in the replacement values of derivatives are recorded in net trading income, unless the derivatives are designated and effective as hedging instruments in certain types of hedge accounting relationships. Refer to Note 1a) 15) for more information.
Valuation principles and techniques applied in the measurement of derivative instruments are discussed in “Note 24 Fair value measurement.”Positive replacement values represent the estimated amount the Group would receive if the derivative contract were sold on the balance sheet date.Negative replacement values indicate the value the Group would pay to transfer its obligations in respect of the underlying contract, were it required or entitled to do so on the balance sheet date.
Derivatives embedded in other financial instruments are not included in the table “Derivative instruments” within this Note. Bifurcated embedded derivatives are presented on the same balance sheet line as the host contract. In cases where UBS applies the fair value option to hybrid instruments, bifurcation of an embedded derivative component is not required and as such, also not included in the table “Derivative instruments.” Refer
to “Note 20 Financial liabilities designated at fair value” and “Note 24 Fair value measurement” for more information.
Types of derivative instruments
The Group uses the following derivative financial instruments for both trading and hedging purposes. Through the use of the products listed below, the Group is engaged in extensive high-volume market-making and client facilitation trading referred to as the flow business. Measurement techniques applied to determine the fair value of each product type are described in “Note 24 Fair value measurement.”
| | The main types of derivative instruments used by the Group are: |
| – | | Swaps: Swaps are transactions in which two parties exchange cash flows on a specified notional amount for a predetermined period. |
| – | | Cross-currency swaps: Cross-currency swaps involve the exchange of interest payments based on two different currency principal balances and reference interest rates and generally also entail exchange of principal amounts at the start or end of the contract. Most cross-currency swaps are traded in the OTC market. |
| – | | Forwards and futures: Forwards and futures are contractual obligations to buy or sell financial instruments or commodities on a future date at a specified price. Forward contracts are tailor-made agreements that are transacted between counter-parties in the OTC market, whereas futures are standardized contracts transacted on regulated exchanges. |
| – | | Options and warrants: options and warrants are contractual agreements under which, typically, the seller (writer) grants the purchaser the right, but not the obligation, either to buy (call option), or to sell (put option) at, or before, a set date, a specified quantity of a financial instrument or commodity at a predetermined price. The purchaser pays a premium to the seller for this right. Options involving more complex payment structures are also transacted. Options may be traded in the OTC market, or on a regulated exchange, and may be traded in the form of a security (warrant). |
| | The main products and underlyings used by the Group are: |
| – | | Interest rate contracts: Interest rate products include interest rate swaps, forward rate agreements, swaptions and caps and floors. |
| – | | Credit derivative contracts: credit default swaps (CDS) are the most common form of a credit derivative, under which the party buying protection makes one or more payments to the party selling protection in exchange for an undertaking by the seller to make a payment to the buyer following the occurrence of a contractually defined credit event with respect to a specified third-party credit entity. Settlement following a credit event may be a net cash amount, or cash in return for physical delivery of one or more obligations of the credit entity, and is made regardless of whether the protection buyer has actually suffered |
399
Financial information
Notes to the consolidated financial statements
Note 14 Derivative instruments and hedge accounting (continued)
| | | a loss. After a credit event and settlement, the contract is generally terminated. More information on credit derivatives is included in a separate section below. Total return swaps (TRS) are structured with one party making payments based on a set rate, either fixed or variable, plus any negative changes in fair value of an underlying asset, and the other party making payments based on the return of the asset, which includes both income it generates and any positive changes in its fair value. |
| – | | Foreign exchange contracts: Foreign exchange contracts include spot, forward and cross-currency swaps and options and warrants. Forward purchase and sale currency contracts are typically executed to meet client needs and for trading and hedging purposes. |
| – | | Equity/index contracts: The Group uses equity derivatives linked to single names, indices and baskets of single names and indices. The indices used may be based on a standard market index, or may be defined by UBS. The product types traded include vanilla listed derivatives, both options and futures, total return swaps, forwards and exotic OTC contracts. |
| – | | Commodities contracts: The Group has an established commodity derivatives trading business, which includes the commodity index, the structured business and the flow business. The index and structured business are client facilitation businesses trading exchange-traded funds, OTC swaps and options on commodity indices. The underlying indices cover third-party and UBS defined indices such as the UBS Bloomberg Constant Maturity Commodity Index and the Dow Jones UBS Commodity indices. The flow business is client-centric and incorporates both ETD and vanilla OTC products, for which the underlying covers the agriculture, base metals and energy sectors. All of the flow trading is cash-settled with no physical delivery of the underlying.The Group also has an established precious metals ability in both flow and non-vanilla OTC products incorporating both physical and non-physical trading. The flow business is investor led and products include ETD, vanilla OTC and certain non-vanilla OTC. The vanilla OTC are in forwards, swaps and options. |
Risks of derivative instruments
Derivative instruments are transacted in many trading portfolios, which generally include several types of instruments, not just derivatives. The market risk of derivatives is predominantly managed and controlled as an integral part of the market risk of these portfolios. The Group’s approach to market risk is described in the audited portions of “Market risk” in the “Risk management and control” section of this report.
Derivative instruments are transacted with many different counterparties, most of whom are also counterparties for other types of business. The credit risk of derivatives is managed and controlled in the context of the Group’s overall credit exposure to each counterparty. The Group’s approach to credit risk is described in the audited portions of “Credit risk” in the “Risk management and control” section of this report. It should be noted that, although the positive replacement values shown on the balance sheet can be an important component of the Group’s credit exposure, the positive replacement values for a counterparty are rarely an adequate reflection of the Group’s credit exposure in its derivatives business with that counterparty. This is, for example, because on one hand, replacement values can increase over time (“potential future exposure”), while on the other hand, exposure may be mitigated by entering into master netting agreements and bilateral collateral arrangements with other counterparties. Both the exposure measures used internally by the Group to control credit risk and the capital requirements imposed by regulators reflect these additional factors.
The replacement values presented on UBS’s balance sheet include netting in accordance with IFRS requirements (refer to Note 1a) 35)), which is generally more restrictive than netting in accordance with Swiss federal banking law. Swiss federal banking law netting is generally based on close-out netting arrangements that are enforceable in case of insolvency. The positive and negative replacement values based on netting in accordance with Swiss federal banking law (factoring in cash collateral) are presented on the bottom of the table on the next pages.
The notional amount of a derivative is generally the quantity of the underlying instrument on which the derivative contract is based and is the reference against which changes in the value of the derivative are measured. Notional values, in themselves, are generally not a direct indication of the values which are exchanged between parties, and are therefore not a direct measure of risk or financial exposure, but are viewed as an indication of the scale of the different types of derivatives entered into by the Group.
400
Note 14 Derivative instruments and hedge accounting (continued)
Derivative instruments1
| | | | | | | | | | | | | | | | | | | | | | | | | | | | | | | | | | | | | | | | |
| | 31.12.13 | | | 31.12.12 | |
| CHF billion | | Total
PRV2 | | | Notional
values
related to PRVs3 | | | Total
NRV4 | | | Notional
values
related to NRVs3 | | | Other
notional
values3,5 | | | Total
PRV2 | | | Notional
values
Related to PRVs3 | | | Total
NRV4 | | | Notional
values
related to NRVs3 | | | Other
notional
values3,5 | |
| Interest rate contracts | | | | | | | | | | | | | | | | | | | | | | | | | | | | | | | | | | | | | | | | |
| | | | | | | | | | | | | | | | | | | | | | | | | | | | | | | | | | | | | | | | | |
| Over-the-counter (OTC) contracts | | | | | | | | | | | | | | | | | | | | | | | | | | | | | | | | | | | | | | | | |
| | | | | | | | | | | | | | | | | | | | | | | | | | | | | | | | | | | | | | | | | |
Forward contracts6 | | | 0.2 | �� | | | 123.7 | | | | 0.2 | | | | 107.1 | | | | 1,944.2 | | | | 0.8 | | | | 481.0 | | | | 0.8 | | | | 443.8 | | | | 1,329.6 | |
| | | | | | | | | | | | | | | | | | | | | | | | | | | | | | | | | | | | | | | | | |
Swaps | | | 104.3 | | | | 2,243.5 | | | | 91.7 | | | | 2,098.5 | | | | 14,162.8 | | | | 223.3 | | | | 3,933.5 | | | | 196.1 | | | | 3,789.2 | | | | 14,276.3 | |
| | | | | | | | | | | | | | | | | | | | | | | | | | | | | | | | | | | | | | | | | |
Options7 | | | 25.2 | | | | 928.8 | | | | 25.3 | | | | 900.3 | | | | 0.0 | | | | 41.8 | | | | 1,193.7 | | | | 42.2 | | | | 1,181.5 | | | | 0.0 | |
| | | | | | | | | | | | | | | | | | | | | | | | | | | | | | | | | | | | | | | | | |
| Exchange-traded contracts | | | | | | | | | | | | | | | | | | | | | | | | | | | | | | | | | | | | | | | | |
| | | | | | | | | | | | | | | | | | | | | | | | | | | | | | | | | | | | | | | | | |
Futures | | | | | | | | | | | | | | | | | | | 492.0 | | | | | | | | | | | | | | | | | | | | 759.0 | |
| | | | | | | | | | | | | | | | | | | | | | | | | | | | | | | | | | | | | | | | | |
Options | | | 0.0 | | | | 0.2 | | | | 0.1 | | | | 1.8 | | | | 287.5 | | | | 0.0 | | | | 3.0 | | | | 0.0 | | | | 0.0 | | | | 725.5 | |
| | | | | | | | | | | | | | | | | | | | | | | | | | | | | | | | | | | | | | | | | |
Agency transactions8 | | | 0.1 | | | | | | | | 0.0 | | | | | | | | | | | | 0.0 | | | | | | | | 0.0 | | | | | | | | | |
| | | | | | | | | | | | | | | | | | | | | | | | | | | | | | | | | | | | | | | | | |
| Total | | | 129.8 | | | | 3,296.2 | | | | 117.2 | | | | 3,107.7 | | | | 16,886.5 | | | | 266.0 | | | | 5,611.3 | | | | 239.1 | | | | 5,414.5 | | | | 17,090.4 | |
| | | | | | | | | | | | | | | | | | | | | | | | | | | | | | | | | | | | | | | | | |
| Credit derivative contracts | | | | | | | | | | | | | | | | | | | | | | | | | | | | | | | | | | | | | | | | |
| | | | | | | | | | | | | | | | | | | | | | | | | | | | | | | | | | | | | | | | | |
| Over-the-counter (OTC) contracts | | | | | | | | | | | | | | | | | | | | | | | | | | | | | | | | | | | | | | | | |
| | | | | | | | | | | | | | | | | | | | | | | | | | | | | | | | | | | | | | | | | |
Credit default swaps | | | 18.1 | | | | 541.7 | | | | 16.9 | | | | 527.0 | | | | 203.3 | | | | 36.5 | | | | 1,092.0 | | | | 34.0 | | | | 1,043.3 | | | | 238.9 | |
| | | | | | | | | | | | | | | | | | | | | | | | | | | | | | | | | | | | | | | | | |
Total return swaps | | | 0.2 | | | | 3.1 | | | | 0.2 | | | | 3.1 | | | | 0.0 | | | | 0.4 | | | | 2.4 | | | | 0.4 | | | | 3.3 | | | | 0.0 | |
| | | | | | | | | | | | | | | | | | | | | | | | | | | | | | | | | | | | | | | | | |
Options and warrants | | | 0.0 | | | | 3.6 | | | | 0.0 | | | | 0.1 | | | | 0.0 | | | | 0.0 | | | | 3.1 | | | | 0.0 | | | | 0.5 | | | | 0.0 | |
| | | | | | | | | | | | | | | | | | | | | | | | | | | | | | | | | | | | | | | | | |
| Total | | | 18.3 | | | | 548.4 | | | | 17.0 | | | | 530.1 | | | | 203.3 | | | | 36.9 | | | | 1,097.6 | | | | 34.4 | | | | 1,047.1 | | | | 238.9 | |
| | | | | | | | | | | | | | | | | | | | | | | | | | | | | | | | | | | | | | | | | |
| Foreign exchange contracts | | | | | | | | | | | | | | | | | | | | | | | | | | | | | | | | | | | | | | | | |
| | | | | | | | | | | | | | | | | | | | | | | | | | | | | | | | | | | | | | | | | |
| Over-the-counter (OTC) contracts | | | | | | | | | | | | | | | | | | | | | | | | | | | | | | | | | | | | | | | | |
| | | | | | | | | | | | | | | | | | | | | | | | | | | | | | | | | | | | | | | | | |
Forward contracts | | | 12.4 | | | | 661.2 | | | | 13.4 | | | | 667.9 | | | | 0.0 | | | | 12.3 | | | | 690.8 | | | | 12.5 | | | | 689.6 | | | | 0.0 | |
| | | | | | | | | | | | | | | | | | | | | | | | | | | | | | | | | | | | | | | | | |
Interest and currency swaps | | | 54.2 | | | | 1,924.0 | | | | 57.4 | | | | 1,858.1 | | | | 0.0 | | | | 76.9 | | | | 2,382.0 | | | | 80.9 | | | | 2,193.2 | | | | 0.0 | |
| | | | | | | | | | | | | | | | | | | | | | | | | | | | | | | | | | | | | | | | | |
Options7 | | | 9.3 | | | | 494.0 | | | | 9.4 | | | | 455.5 | | | | 0.0 | | | | 6.8 | | | | 411.8 | | | | 7.6 | | | | 348.0 | | | | 0.0 | |
| | | | | | | | | | | | | | | | | | | | | | | | | | | | | | | | | | | | | | | | | |
| Exchange-traded contracts | | | | | | | | | | | | | | | | | | | | | | | | | | | | | | | | | | | | | | | | |
| | | | | | | | | | | | | | | | | | | | | | | | | | | | | | | | | | | | | | | | | |
Futures | | | | | | | | | | | | | | | | | | | 7.2 | | | | | | | | | | | | | | | | | | | | 13.8 | |
| | | | | | | | | | | | | | | | | | | | | | | | | | | | | | | | | | | | | | | | | |
Options | | | 0.0 | | | | 5.4 | | | | 0.0 | | | | 6.1 | | | | 0.0 | | | | 0.0 | | | | 0.6 | | | | 0.0 | | | | 0.6 | | | | 0.0 | |
| | | | | | | | | | | | | | | | | | | | | | | | | | | | | | | | | | | | | | | | | |
Agency transactions8 | | | 0.1 | | | | | | | | 0.1 | | | | | | | | | | | | 0.0 | | | | | | | | 0.0 | | | | | | | | | |
| | | | | | | | | | | | | | | | | | | | | | | | | | | | | | | | | | | | | | | | | |
| Total | | | 76.0 | | | | 3,084.4 | | | | 80.3 | | | | 2,987.6 | | | | 7.2 | | | | 96.0 | | | | 3,485.1 | | | | 101.0 | | | | 3,231.4 | | | | 13.8 | |
| | | | | | | | | | | | | | | | | | | | | | | | | | | | | | | | | | | | | | | | | |
| Equity/index contracts | | | | | | | | | | | | | | | | | | | | | | | | | | | | | | | | | | | | | | | | |
| | | | | | | | | | | | | | | | | | | | | | | | | | | | | | | | | | | | | | | | | |
| Over-the-counter (OTC) contracts | | | | | | | | | | | | | | | | | | | | | | | | | | | | | | | | | | | | | | | | |
| | | | | | | | | | | | | | | | | | | | | | | | | | | | | | | | | | | | | | | | | |
Forward contracts | | | 3.2 | | | | 45.9 | | | | 4.6 | | | | 59.2 | | | | 0.0 | | | | 2.7 | | | | 41.7 | | | | 3.3 | | | | 47.0 | | | | 0.0 | |
| | | | | | | | | | | | | | | | | | | | | | | | | | | | | | | | | | | | | | | | | |
Options | | | 7.7 | | | | 74.7 | | | | 9.3 | | | | 103.1 | | | | 0.0 | | | | 8.4 | | | | 84.8 | | | | 7.4 | | | | 98.3 | | | | 0.0 | |
| | | | | | | | | | | | | | | | | | | | | | | | | | | | | | | | | | | | | | | | | |
| Exchange-traded contracts | | | | | | | | | | | | | | | | | | | | | | | | | | | | | | | | | | | | | | | | |
| | | | | | | | | | | | | | | | | | | | | | | | | | | | | | | | | | | | | | | | | |
Futures | | | | | | | | | | | | | | | | | | | 25.7 | | | | | | | | | | | | | | | | | | | | 16.6 | |
| | | | | | | | | | | | | | | | | | | | | | | | | | | | | | | | | | | | | | | | | |
Options | | | 3.1 | | | | 110.8 | | | | 4.0 | | | | 112.4 | | | | 7.2 | | | | 2.4 | | | | 94.9 | | | | 3.3 | | | | 106.8 | | | | 17.7 | |
| | | | | | | | | | | | | | | | | | | | | | | | | | | | | | | | | | | | | | | | | |
Agency transactions8 | | | 4.0 | | | | | | | | 4.0 | | | | | | | | | | | | 2.4 | | | | | | | | 2.4 | | | | | | | | | |
| | | | | | | | | | | | | | | | | | | | | | | | | | | | | | | | | | | | | | | | | |
| Total | | | 18.1 | | | | 231.4 | | | | 21.9 | | | | 274.7 | | | | 32.9 | | | | 15.9 | | | | 221.4 | | | | 16.4 | | | | 252.1 | | | | 34.3 | |
| | | | | | | | | | | | | | | | | | | | | | | | | | | | | | | | | | | | | | | | | |
Table continues on the next page.
401
Financial information
Notes to the consolidated financial statements
Note 14 Derivative instruments (continued)
Derivative instruments1 (continued)
Table continued from previous page.
| | | | | | | | | | | | | | | | | | | | | | | | | | | | | | | | | | | | | | | | |
| | 31.12.13 | | | 31.12.12 | |
| CHF billion | | Total
PRV2 | | | Notional
values
related
to PRVs3 | | | Total
NRV4 | | | Notional
values
related
to NRVs3 | | | Other
notional
values3,5 | | | Total
PRV2 | | | Notional
values
related to PRVs3 | | | Total
NRV4 | | | Notional
values
related to NRVs3 | | | Other
notional
values3,5 | |
| Commodities contracts | | | | | | | | | | | | | | | | | | | | | | | | | | | | | | | | | | | | | | | | |
| | | | | | | | | | | | | | | | | | | | | | | | | | | | | | | | | | | | | | | | | |
| Over-the-counter (OTC) contracts | | | | | | | | | | | | | | | | | | | | | | | | | | | | | | | | | | | | | | | | |
| | | | | | | | | | | | | | | | | | | | | | | | | | | | | | | | | | | | | | | | | |
Forward contracts | | | 1.5 | | | | 19.5 | | | | 1.3 | | | | 14.7 | | | | 0.0 | | | | 1.4 | | | | 22.9 | | | | 1.4 | | | | 21.8 | | | | 0.0 | |
| | | | | | | | | | | | | | | | | | | | | | | | | | | | | | | | | | | | | | | | | |
Options7 | | | 1.0 | | | | 12.9 | | | | 0.9 | | | | 9.4 | | | | 0.0 | | | | 1.0 | | | | 25.2 | | | | 1.2 | | | | 21.7 | | | | 0.0 | |
| | | | | | | | | | | | | | | | | | | | | | | | | | | | | | | | | | | | | | | | | |
| Exchange-traded contracts | | | | | | | | | | | | | | | | | | | | | | | | | | | | | | | | | | | | | | | | |
| | | | | | | | | | | | | | | | | | | | | | | | | | | | | | | | | | | | | | | | | |
Futures | | | | | | | | | | | | | | | | | | | 11.1 | | | | | | | | | | | | | | | | | | | | 14.4 | |
| | | | | | | | | | | | | | | | | | | | | | | | | | | | | | | | | | | | | | | | | |
Forward contracts | | | 0.0 | | | | 9.7 | | | | 0.1 | | | | 8.2 | | | | 0.0 | | | | 0.4 | | | | 23.3 | | | | 0.4 | | | | 21.2 | | | | 0.0 | |
| | | | | | | | | | | | | | | | | | | | | | | | | | | | | | | | | | | | | | | | | |
Options | | | 0.0 | | | | 0.6 | | | | 0.1 | | | | 2.3 | | | | 0.2 | | | | 0.1 | | | | 6.4 | | | | 0.1 | | | | 7.0 | | | | 1.2 | |
| | | | | | | | | | | | | | | | | | | | | | | | | | | | | | | | | | | | | | | | | |
Agency transactions8 | | | 0.9 | | | | | | | | 0.9 | | | | | | | | | | | | 0.9 | | | | | | | | 0.9 | | | | | | | | | |
| | | | | | | | | | | | | | | | | | | | | | | | | | | | | | | | | | | | | | | | | |
| Total | | | 3.5 | | | | 42.7 | | | | 3.2 | | | | 34.6 | | | | 11.3 | | | | 3.8 | | | | 77.9 | | | | 4.0 | | | | 71.7 | | | | 15.6 | |
| | | | | | | | | | | | | | | | | | | | | | | | | | | | | | | | | | | | | | | | | |
| Unsettled purchases of non-derivative financial assets9 | | | 0.1 | | | | 19.6 | | | | 0.1 | | | | 8.9 | | | | 0.0 | | | | 0.2 | | | | 20.4 | | | | 0.1 | | | | 8.7 | | | | 0.0 | |
| | | | | | | | | | | | | | | | | | | | | | | | | | | | | | | | | | | | | | | | | |
| Unsettled sales of non-derivative financial assets9 | | | 0.1 | | | | 12.7 | | | | 0.2 | | | | 15.2 | | | | 0.0 | | | | 0.1 | | | | 8.9 | | | | 0.2 | | | | 19.0 | | | | 0.0 | |
| | | | | | | | | | | | | | | | | | | | | | | | | | | | | | | | | | | | | | | | | |
| Total derivative instruments, based on IFRS netting | | | 245.8 | | | | 7,235.5 | | | | 240.0 | | | | 6,958.7 | | | | 17,141.2 | | | | 419.0 | | | | 10,522.6 | | | | 395.3 | | | | 10,044.4 | | | | 17,392.9 | |
| | | | | | | | | | | | | | | | | | | | | | | | | | | | | | | | | | | | | | | | | |
| Replacement value netting, based on capital adequacy rules | | | (185.0 | ) | | | | | | | (185.0 | ) | | | | | | | | | | | (327.3 | ) | | | | | | | (327.3 | ) | | | | | | | | |
| | | | | | | | | | | | | | | | | | | | | | | | | | | | | | | | | | | | | | | | | |
| Cash collateral netting, based on capital adequacy rules | | | (27.9 | ) | | | | | | | (14.2 | ) | | | | | | | | | | | (49.4 | ) | | | | | | | (17.4 | ) | | | | | | | | |
| | | | | | | | | | | | | | | | | | | | | | | | | | | | | | | | | | | | | | | | | |
| Total derivative instruments,based on capital adequacy netting10 | | | 32.9 | | | | | | | | 40.7 | | | | | | | | | | | | 42.3 | | | | | | | | 50.5 | | | | | | | | | |
| | | | | | | | | | | | | | | | | | | | | | | | | | | | | | | | | | | | | | | | | |
1 Bifurcated embedded derivatives are presented on the same balance sheet line as their host contracts and are excluded from this table. As of 31 December 2013, these derivatives amounted to a PRV of CHF 0.2 billion (related notional values of CHF 6.7 billion) and an NRV of CHF 0.4 billion (related notional values of CHF 12.8 billion). In 2013, comparative period figures were corrected. On a corrected basis, as of 31 December 2012, these derivatives amounted to a PRV of CHF 0.2 billion (related notional values of CHF 6.5 billion) and an NRV of CHF 0.3 billion (related notional values of CHF 13.2 billion). 2 PRV: Positive replacement value. 3 In cases where replacement values are presented on a net basis on the balance sheet, the respective notional values of the netted replacement values are still presented on a gross basis. 4 NRV: Negative replacement value. 5 Other notional values relate to derivatives which are cleared through either a central clearing counterparty or an exchange. The fair value of these derivatives is presented on the balance sheet net of the corresponding cash margin under Cash collateral receivables on derivative instruments and Cash collateral payables on derivatives instruments, totaling as of 31 December CHF 0.8 billion (31 December 2012: CHF 0.9 billion) and CHF 0.0 billion (31 December 2012: CHF 0.0 billion), respectively. 6 Negative replacement values as of 31 December 2013 include CHF 0.0 billion related to derivative loan commitments (31 December 2012: CHF 0.1 billion). No notional amounts related to these replacement values are included the table. The maximum irrevocable amount related to these commitments was CHF 7.1 billion as of 31 December 2013 (31 December 2012: CHF 6.3 billion). 7 In 2013, the classification of certain PRV and NRV between OTC interest rate options and OTC foreign exchange options was corrected for 31 December 2012. As a result, for OTC interest rate options, PRV were reduced by CHF 1.8 billion (associated notional values: reduced by CHF 16.7 billion) and NRV were reduced by CHF 2.4 billion (associated notional values: reduced by CHF 18.7 billion) with corresponding increases made to OTC foreign exchange options. In addition, corrections were made to 31 December 2012 notional values for OTC commodities options. Respective notional values related to PRV were reduced by CHF 10.0 billion and notional values related to NRV were reduced by CHF 20.0 billion. 8 Notional values of exchange-traded agency transactions are not disclosed due to their significantly different risk profile. 9 Changes in the fair value of purchased and sold non-derivative financial assets between trade date and settlement date are recognized as replacement values. 10 Includes the impact of netting agreements (including cash collateral) in accordance with Swiss federal banking law.
The maturity profile of OTC interest rate contracts held as of 31 December 2013, based on notional values, was as follows: approximately 38% (31 December 2012: 37%) mature within one year, 38% (31 December 2012: 38%) within one to five years and 24% (31 December 2012: 25%) after five years. Notional values of interest rate contracts cleared with a clearing house are presented under “other notional values” and are categorized into maturity buckets on the basis of contractual maturities of the cleared underlying derivative contracts.
Derivatives transacted for trading purposes
Most of the Group’s derivative transactions relate to sales and trading activities. Sales activities include the structuring and marketing of derivative products to customers to enable them to take, transfer, modify, or reduce, current or expected risks. Trading activities
include market making to directly support the facilitation and execution of client activity. Market-making involves quoting bid and offer prices to other market participants with the intention of generating revenues based on spread and volume.
Credit derivatives
UBS is an active dealer in the fixed income market, including CDS and related products, with respect to a large number of issuers’ securities. The primary purpose of these activities is for the benefit of UBS’s clients through market-making activities and for the ongoing hedging of trading book exposures.
Market-making activity, which is done within the Investment Bank, consists of buying and selling single-name CDS, index CDS, loan CDS and related referenced cash instruments to facilitate client trading activity. UBS also actively utilizes CDS to economically hedge specific counterparty credit risks in its accrual loan portfolio
402
Note 14 Derivative instruments and hedge accounting (continued)
and off-balance sheet loan portfolio (including loan commitments) with the aim of reducing concentrations in individual names, sectors or specific portfolios.
In addition, UBS actively utilizes CDS to economically hedge specific counterparty credit risks in its OTC derivative portfolios including financial instruments which are designated at fair value through profit or loss.
During 2012, UBS announced an Investment Bank strategy change which resulted in a focus on certain types of client facilitation business and resulted in reduced market-making activity. As a result, CDS were increasingly used for economic hedging purposes. In 2013, large portfolios of credit derivatives including structured credit products were transferred to and are now managed and reported in Corporate
Center – Non Core. These positions are being actively unwound and CDS is used to continue to manage the underlying risk exposures.
The tables below provide further details on credit protection bought and sold, including replacement and notional value information by instrument type and counterparty type. The value of protection bought and sold is not, in isolation, a measure of UBS’s credit risk. Counterparty relationships are viewed in terms of the total outstanding credit risk, which relates to other instruments in addition to CDS, and in connection with collateral arrangements in place. On a notional value basis, credit protection bought and sold as of 31 December 2013 matures in a range of approximately 22% (2012: 22%) within one year, approximately 72% (2012: 69%) within one to five years and approximately 6% (2012: 8%) after five years.
| | | | | | | | | | | | | | | | | | | | | | | | |
Credit derivatives – by type of instrument | |
| | Protection bought | | | Protection sold | |
| CHF billion | | Fair value:
PRV | | | Fair value:
NRV | | | Notional
values | | | Fair value:
PRV | | | Fair value:
NRV | | | Notional
values | |
| Single-name credit default swaps | | | 5.1 | | | | 9.2 | | | | 488.2 | | | | 8.7 | | | | 4.1 | | | | 450.3 | |
| | | | | | | | | | | | | | | | | | | | | | | | | |
| Multi-name index linked credit default swaps | | | 1.0 | | | | 1.9 | | | | 146.8 | | | | 2.9 | | | | 1.1 | | | | 171.9 | |
| | | | | | | | | | | | | | | | | | | | | | | | | |
| Multi-name other credit default swaps | | | 0.4 | | | | 0.4 | | | | 9.4 | | | | 0.1 | | | | 0.2 | | | | 5.3 | |
| | | | | | | | | | | | | | | | | | | | | | | | | |
| Total rate of return swaps | | | 0.2 | | | | 0.1 | | | | 5.4 | | | | 0.0 | | | | 0.1 | | | | 0.8 | |
| | | | | | | | | | | | | | | | | | | | | | | | | |
| Options and warrants | | | 0.0 | | | | 0.0 | | | | 3.6 | | | | 0.0 | | | | 0.0 | | | | 0.1 | |
| | | | | | | | | | | | | | | | | | | | | | | | | |
| Total 31 December 2013 | | | 6.6 | | | | 11.6 | | | | 653.4 | | | | 11.7 | | | | 5.5 | | | | 628.4 | |
| | | | | | | | | | | | | | | | | | | | | | | | | |
of which: credit derivatives related to economic hedges | | | 6.4 | | | | 11.2 | | | | 639.5 | | | | 11.2 | | | | 5.2 | | | | 613.7 | |
| | | | | | | | | | | | | | | | | | | | | | | | | |
of which: credit derivatives related to market-making | | | 0.3 | | | | 0.4 | | | | 13.9 | | | | 0.4 | | | | 0.3 | | | | 14.8 | |
| | | | | | | | | | | | | | | | | | | | | | | | | |
| | | | | | | | | | | | | | | | | | | | | | | | |
| | | | Protection bought | | | | Protection sold | |
| CHF billion | | Fair value:
PRV | | | Fair value: NRV | | | Notional
values | | | Fair value:
PRV | | | Fair value:
NRV | | | Notional
values | |
| Single-name credit default swaps | | | 14.9 | | | | 11.1 | | | | 815.0 | | | | 11.1 | | | | 13.1 | | | | 781.7 | |
| | | | | | | | | | | | | | | | | | | | | | | | | |
| Multi-name index linked credit default swaps | | | 6.1 | | | | 1.5 | | | | 376.7 | | | | 2.7 | | | | 6.0 | | | | 369.4 | |
| | | | | | | | | | | | | | | | | | | | | | | | | |
| Multi-name other credit default swaps | | | 0.8 | | | | 1.2 | | | | 17.7 | | | | 1.0 | | | | 1.2 | | | | 13.7 | |
| | | | | | | | | | | | | | | | | | | | | | | | | |
| Total rate of return swaps | | | 0.4 | | | | 0.3 | | | | 4.2 | | | | 0.0 | | | | 0.1 | | | | 1.5 | |
| | | | | | | | | | | | | | | | | | | | | | | | | |
| Options and warrants | | | 0.0 | | | | 0.0 | | | | 3.1 | | | | 0.0 | | | | 0.0 | | | | 0.5 | |
| | | | | | | | | | | | | | | | | | | | | | | | | |
| Total 31 December 2012 | | | 22.1 | | | | 14.0 | | | | 1,216.8 | | | | 14.8 | | | | 20.4 | | | | 1,166.7 | |
| | | | | | | | | | | | | | | | | | | | | | | | | |
of which: credit derivatives related to economic hedges | | | 22.0 | | | | 13.5 | | | | 1,167.9 | | | | 14.3 | | | | 20.3 | | | | 1,117.3 | |
| | | | | | | | | | | | | | | | | | | | | | | | | |
of which: credit derivatives related to market-making | | | 0.1 | | | | 0.5 | | | | 48.9 | | | | 0.5 | | | | 0.1 | | | | 49.4 | |
| | | | | | | | | | | | | | | | | | | | | | | | | |
Financial information
Notes to the consolidated financial statements
Note 14 Derivative instruments and hedge accounting (continued)
| | | | | | | | | | | | | | | | | | | | | | | | |
Credit derivatives by counterparty | |
| | Protection bought | | | Protection sold | |
| CHF billion | | Fair value:
PRV | | | Fair value:
NRV | | | Notional
values | | | Fair value:
PRV | | | Fair value:
NRV | | | Notional
values | |
| Broker-dealers | | | 1.6 | | | | 2.9 | | | | 146.9 | | | | 3.0 | | | | 1.5 | | | | 138.0 | |
| | | | | | | | | | | | | | | | | | | | | | | | | |
| Banks | | | 3.7 | | | | 8.0 | | | | 377.0 | | | | 8.1 | | | | 3.7 | | | | 370.7 | |
| | | | | | | | | | | | | | | | | | | | | | | | | |
| Central clearing counterparties | | | 0.0 | | | | 0.0 | | | | 101.5 | | | | 0.0 | | | | 0.0 | | | | 101.8 | |
| | | | | | | | | | | | | | | | | | | | | | | | | |
| Other | | | 1.4 | | | | 0.7 | | | | 27.9 | | | | 0.6 | | | | 0.3 | | | | 17.8 | |
| | | | | | | | | | | | | | | | | | | | | | | | | |
| Total 31 December 2013 | | | 6.6 | | | | 11.6 | | | | 653.4 | | | | 11.7 | | | | 5.5 | | | | 628.4 | |
| | | | | | | | | | | | | | | | | | | | | | | | | |
| | |
| | Protection bought | | | Protection sold | |
| CHF billion | | Fair value:
PRV | | | Fair value:
NRV | | | Notional
values | | | Fair value:
PRV | | | Fair value:
NRV | | | Notional
values | |
| Broker-dealers | | | 5.1 | | | | 3.0 | | | | 255.4 | | | | 3.1 | | | | 5.5 | | | | 254.7 | |
| | | | | | | | | | | | | | | | | | | | | | | | | |
| Banks | | | 12.8 | | | | 10.1 | | | | 752.3 | | | | 10.8 | | | | 13.8 | | | | 741.3 | |
| | | | | | | | | | | | | | | | | | | | | | | | | |
| Central clearing counterparties | | | 0.0 | | | | 0.0 | | | | 132.6 | | | | 0.0 | | | | 0.0 | | | | 106.3 | |
| | | | | | | | | | | | | | | | | | | | | | | | | |
| Other | | | 4.2 | | | | 1.0 | | | | 76.4 | | | | 0.8 | | | | 1.1 | | | | 64.5 | |
| | | | | | | | | | | | | | | | | | | | | | | | | |
| Total 31 December 2012 | | | 22.1 | | | | 14.0 | | | | 1,216.8 | | | | 14.8 | | | | 20.4 | | | | 1,166.7 | |
| | | | | | | | | | | | | | | | | | | | | | | | | |
UBS’s credit derivatives are usually traded as OTC contracts. Since 2009, in line with the broader derivatives industry, a number of initiatives have been launched in both the US and Europe to establish CCP solutions for OTC CDS contracts with the aim of reducing counterparty risk. UBS, along with other dealer members, has continued to participate in these initiatives during 2013.
UBS’s CDS trades are documented using industry standard forms of documentation published by ISDA or equivalent terms documented in a bespoke (i.e., tailored) agreement. Those forms and agreements use standardized terms that form the basis for market conventions related to the types of credit events that would trigger performance (i.e., payment default, bankruptcy, etc. – see below) under a CDS. Those agreements and forms do not contain recourse provisions that would enable UBS to recover from third parties any amounts paid out by UBS (i.e., this is the case where a credit event occurs and UBS is required to make payment under a CDS).
The types of credit events that would require UBS to perform under a CDS contract are subject to agreement between the parties at the time of the transaction. However, nearly all transactions are traded using credit events that are applicable under certain market conventions based on the type of reference entity to which the transaction relates. Applicable credit events by market conventions include bankruptcy, failure to pay, restructuring, obligation acceleration and repudiation / moratorium.
Contingent collateral features of derivative liabilities
Certain derivative payables contain contingent collateral or termination features triggered upon a downgrade of the published credit rating of the Group in the normal course of business. Based on UBS’s credit ratings as of 31 December 2013, additional collateral or termination payments pursuant to bilateral agreements
with certain counterparties of approximately CHF 3.3 billion, CHF 5.0 billion and CHF 5.1 billion would have been required in the event of a one-notch, two-notch and three-notch reduction, respectively, in UBS’s long-term credit ratings, and a corresponding reduction in short-term ratings. In evaluating UBS’s liquidity requirements, UBS considers additional collateral or termination payments that would be required in the event of a reduction in UBS’s long-term credit ratings, and a corresponding reduction in short-term ratings.
Derivatives transacted for hedging purposes
Derivatives used for structural hedging
The Group enters into derivative transactions for the purposes of hedging risks inherent in assets, liabilities and forecast transactions. The accounting treatment of hedge transactions varies according to the nature of the instrument hedged and whether the hedge qualifies as such for accounting purposes.
Derivative transactions that qualify and are designated as hedges for accounting purposes are described under the corresponding headings in this note (fair value hedges, cash flow hedges and hedges of net investments in foreign operations). The Group’s accounting policies for derivatives designated and accounted for as hedging instruments are explained in Note 1a) 15), under which terms used in the following sections are explained.
The Group has also entered into various hedging strategies utilizing derivatives for which hedge accounting has not been applied. These include interest rate swaps and other interest rate derivatives (e.g., futures) for day-to-day economic interest rate risk management purposes. In addition, the Group has used equity futures, options and, to a lesser extent, swaps for economic hedging in a variety of equity trading strategies to offset underlying
404
Note 14 Derivative instruments and hedge accounting (continued)
equity and equity volatility exposure. The Group has also entered into CDS that provide economic hedges for credit risk exposures (refer to the credit derivatives section). Fair value changes of derivatives that are part of economic relationships, but do not qualify for hedge accounting treatment, are reported inNet trading income, except for the forward points on certain short duration foreign exchange contracts which are reported inNet interest income.
Fair value hedges: interest rate risk related to debt issued
The Group’s fair value hedges principally consist of interest rate swaps that are used to protect against changes in the fair value of fixed-rate instruments (e.g., non-structured fixed-rate bonds, covered bonds and subordinated debt) due to movements in market interest rates. The fair values of outstanding interest rate derivatives designated as fair value hedges were assets of CHF 1,588 million and liabilities of CHF 140 million as of 31 December 2013 and assets of CHF 3,028 million as of 31 December 2012.
Fair value hedges of interest rate risk
| | | | | | | | | | | | |
| | For the year ended | |
| CHF million | | 31.12.13 | | | 31.12.12 | | | 31.12.11 | |
| Gains/(losses) on hedging instruments | | | (1,123 | ) | | | 537 | | | | 1,203 | |
| | | | | | | | | | | | | |
| Gains/(losses) on hedged items attributable to the hedged risk | | | 1,116 | | | | (581 | ) | | | (1,172 | ) |
| | | | | | | | | | | | | |
| Net gains/(losses) representing ineffective portions of fair value hedges | | | (7 | ) | | | (44 | ) | | | 31 | |
| | | | | | | | | | | | | |
Fair value hedges: portfolio interest rate risk related to loans
The Group also applies fair value hedge accounting to mortgage loan portfolio interest rate risk. The change in fair value of the hedged items is recorded separately from the hedged item and is included withinOther assets on the balance sheet. The fair values of outstanding interest
rate derivatives designated for these hedges as of 31 December 2013 were assets of CHF 176 million and liabilities of CHF 716 million (31 December 2012: assets of CHF 1 million and liabilities of CHF 1,208 million).
| | | | | | | | | | | | |
| Fair value hedge of portfolio of interest rate risk | | | | | | | | | | | | |
| | | | | | | | | | | | | |
| | For the year ended | |
| CHF million | | 31.12.13 | | | 31.12.12 | | | 31.12.11 | |
| Gains/(losses) on hedging instruments | | | 636 | | | | 139 | | | | (461 | ) |
| | | | | | | | | | | | | |
| Gains/(losses) on hedged items attributable to the hedged risk | | | (625 | ) | | | (159 | ) | | | 452 | |
| | | | | | | | | | | | | |
| Net gains/(losses) representing ineffective portions of fair value hedges | | | 11 | | | | (20 | ) | | | (9 | ) |
| | | | | | | | | | | | | |
Cash flow hedges of forecasted transactions
The Group is exposed to variability in future interest cash flows on non-trading financial assets, and liabilities that bear interest at variable rates or are expected to be refinanced or reinvested in the future. The amounts and timing of future cash flows, representing both principal and interest flows, are projected for each portfolio of financial assets and liabilities, based on contractual terms and other relevant factors including estimates of prepayments and defaults. The aggregate principal balances and interest cash flows across all portfolios over time form the basis for identifying the non-trading interest rate risk of the Group, which is hedged with interest rate swaps, the maximum maturity of which is 14 years. The table below shows forecasted principal balances on which expected interest cash flows arise as of 31 December 2013. Amounts shown in the table below represent, by time bucket, average assets and liabilities subject to forecasted cash flows designated as hedged items in cash flow hedge accounting relationships.
As of 31 December 2013, the fair values of outstanding derivatives designated as cash flow hedges of forecasted transactions were CHF 4,770 million assets and CHF 2,275 million liabilities and as of 31 December 2012 the amounts were CHF 7,764 million assets and CHF 3,046 million liabilities. In 2013, a loss of CHF 80 million was recognized inNet trading income due to hedge ineffectiveness, compared with a gain of CHF 158 million in 2012 and a loss of CHF 38 million in 2011.
At the end of 2013 and 2012, losses of CHF 18 million and gains of CHF 3 million associated with terminated interest rate swaps were deferred in OCI, respectively. They will be removed from OCI when the previously hedged forecasted cash flows affect net profit or loss, or when the forecasted cash flows are no longer expected to occur. Amounts reclassified from OCI toNet interest income relating to de-designated swaps were a CHF 1 million net gain in 2013, a CHF 4 million net gain in 2012 and a net gain of CHF 11 million in 2011.
Financial information
Notes to the consolidated financial statements
Note 14 Derivative instruments and hedge accounting (continued)
| | | | | | | | | | | | | | | | | | | | |
| Principal balances subject to cash flow forecasts | | | | | | | | | | | | | | | | | | | | |
| | | | | | | | | | | | | | | | | | | | | |
| CHF billion | | < 1 year | | | 1–3 years | | | 3–5 years | | | 5–10 years | | | over 10 years | |
| Assets | | | 66 | | | | 129 | | | | 37 | | | | 27 | | | | 1 | |
| | | | | | | | | | | | | | | | | | | | | |
| Liabilities | | | 7 | | | | 21 | | | | 3 | | | | 2 | | | | 0 | |
| | | | | | | | | | | | | | | | | | | | | |
| Net balance | | | 59 | | | | 108 | | | | 34 | | | | 26 | | | | 1 | |
| | | | | | | | | | | | | | | | | | | | | |
Hedges of net investments in foreign operations
The Group applies hedge accounting for certain net investments in foreign operations. As of 31 December 2013, the positive replacement values and negative replacement values of FX derivatives (mainly FX swaps) designated as hedging instruments in net investment hedge accounting relationships were CHF 104 million and CHF 102 million, respectively (31 December 2012: positive replacement values of CHF 103 million and negative replacement values of CHF 45 million). As of 31 December 2013, the underlying hedged structural exposures in several currencies amounted to CHF 7.2 billion (31 December 2012: CHF 4.8 billion). Hedges of structural FX exposures in currencies other than the US dollar may be comprised of two jointly designated derivatives as the foreign currency risk may be hedged against the US dollar first and then converted into Swiss francs, the presentation currency of the Group, as part of a separate FX derivative transaction. The aggregated notional amount of designated hedging derivatives as of 31 December 2013 was CHF 13.8 billion in total (31 December 2012: CHF 9.2 billion) including CHF 7.2 billion notional values related to USD versus CHF swaps and CHF 6.7 billion notional values related to derivatives hedging foreign currencies (other than the US dollar) versus the US dollar. The effective portion of gains and losses of these FX swaps is transferred directly to OCI to offset foreign currency translation (FCT) gains and losses on the net investments in foreign branches and subsidiaries. As such, these FX swaps hedge the structural FX exposure resulting in the accumulation of FCT on the level of individual foreign branches and subsidiaries and hence on the total FCT OCI of the Group.
UBS designates certain non-derivative foreign currency financial assets and liabilities of foreign branches or subsidiaries as hedging instruments in net investment hedge accounting arrangements. The FX translation difference recorded in FCT OCI of the non-derivative hedging instrument of one foreign entity offsets the structural FX exposure of another foreign entity. Therefore, the aggregated FCT OCI of the Group is unchanged from this hedge designation. As of 31 December 2013, the nominal amount of non-derivative financial assets and liabilities designated as hedging instruments in such net investment hedges was CHF 15.5 billion and CHF 15.5 billion, respectively (31 December 2012: CHF 16.1 billion non-derivative financial assets and CHF 16.1 billion non-derivative financial liabilities). No material ineffectiveness of hedges of net investments in foreign operations was recognized in the income statement in 2013, 2012 and 2011.
Undiscounted cash flows
The table below provides undiscounted cash flows of all derivative instruments designated in hedge accounting relationships. Interest rate swap cash flows include cash inflows and cash outflows of all interest rate swaps designated in hedge accounting relationships, which are either assets or liabilities of UBS as of 31 December 2013. The table includes derivatives traded on an exchange or through a clearing house where the change in fair value is settled each day, either in fact or in substance, through cash payment of variation margin.
| | | | | | | | | | | | | | | | | | | | | | | | | | | | |
| Derivatives designated in hedge accounting relationships (undiscounted cash flows) | |
| | | | | | | | | | | �� | | | | | | | | | | | | | | | | | | |
| CHF billion | | On demand | | | Due within
1 month | | | Due between
1 and 3 months | | | Due between
3 and 12 months | | | Due between
1 and 5 years | | | Due after
5 years | | | Total | |
| Interest rate swaps1 | | | | | | | | | | | | | | | | | | | | | | | | | | | | |
| | | | | | | | | | | | | | | | | | | | | | | | | | | | | |
Cash inflows | | | | | | | 0 | | | | 0 | | | | 3 | | | | 10 | | | | 3 | | | | 16 | |
| | | | | | | | | | | | | | | | | | | | | | | | | | | | | |
Cash outflows | | | | | | | 0 | | | | 0 | | | | 1 | | | | 7 | | | | 3 | | | | 13 | |
| | | | | | | | | | | | | | | | | | | | | | | | | | | | | |
| FX swaps/forwards | | | | | | | | | | | | | | | | | | | | | | | | | | | | |
| | | | | | | | | | | | | | | | | | | | | | | | | | | | | |
Cash inflows | | | | | | | 14 | | | | | | | | | | | | | | | | | | | | 14 | |
| | | | | | | | | | | | | | | | | | | | | | | | | | | | | |
Cash outflows | | | | | | | 14 | | | | | | | | | | | | | | | | | | | | 14 | |
| | | | | | | | | | | | | | | | | | | | | | | | | | | | | |
| Net cash flows | | | 0 | | | | 0 | | | | 0 | | | | 1 | | | | 2 | | | | 0 | | | | 3 | |
| | | | | | | | | | | | | | | | | | | | | | | | | | | | | |
1 The table includes gross cash inflows and cash outflows of all interest rate swaps designated in hedge accounting relationships, which are either assets or liabilities of UBS as of 31 December 2013.
406
Note 15 Financial investments available-for-sale
| | | | | | | | |
| CHF million | | 31.12.13 | | | 31.12.12 | |
| | |
| Financial investments available-for-sale by issuer type | | | | | | | | |
| | | | | | | | | |
| Debt instruments | | | | | | | | |
| | | | | | | | | |
| Government and government agencies | | | 50,761 | | | | 58,973 | |
| | | | | | | | | |
of which: Switzerland | | | 44 | | | | 156 | |
| | | | | | | | | |
of which: USA | | | 17,876 | | | | 31,740 | |
| | | | | | | | | |
of which: United Kingdom | | | 8,089 | | | | 5,042 | |
| | | | | | | | | |
of which: Germany | | | 6,733 | | | | 6,669 | |
| | | | | | | | | |
of which: France | | | 5,601 | | | | 3,593 | |
| | | | | | | | | |
of which: Japan | | | 4,865 | | | | 4,221 | |
| | | | | | | | | |
| Banks | | | 4,983 | | | | 4,200 | |
| | | | | | | | | |
| Corporates and other | | | 3,132 | | | | 2,486 | |
| | | | | | | | | |
| Total debt instruments | | | 58,876 | | | | 65,659 | |
| | | | | | | | | |
| Equity instruments | | | 649 | | | | 572 | |
| | | | | | | | | |
| Total financial investments available-for-sale | | | 59,525 | | | | 66,230 | |
| | | | | | | | | |
| Unrealized gains – before tax | | | 372 | | | | 421 | |
| | | | | | | | | |
| Unrealized (losses) – before tax | | | (196 | ) | | | (17 | ) |
| | | | | | | | | |
| Net unrealized gains/(losses) – before tax | | | 175 | | | | 404 | |
| | | | | | | | | |
| Net unrealized gains/(losses) – after tax | | | 95 | | | | 252 | |
| | | | | | | | | |
| | | |
| CHF million | | 31.12.13 | | | 31.12.12 | |
| | |
| Financial investments available-for-sale by product type1 | | | | | | | | |
| | | | | | | | | |
| Debt instruments | | | | | | | | |
| | | | | | | | | |
| Government bills/bonds | | | 39,233 | | | | 47,031 | |
| | | | | | | | | |
| Corporate bonds and municipal bonds, including bonds issued by financial institutions | | | 15,324 | | | | 10,940 | |
| | | | | | | | | |
| Investment fund units | | | 301 | | | | 375 | |
| | | | | | | | | |
| Asset-backed securities | | | 4,017 | | | | 7,313 | |
| | | | | | | | | |
of which: mortgage-backed securities | | | 4,017 | | | | 7,313 | |
| | | | | | | | | |
| Total debt instruments | | | 58,876 | | | | 65,659 | |
| | | | | | | | | |
| Equity instruments | | | | | | | | |
| | | | | | | | | |
| Shares | | | 637 | | | | 547 | |
| | | | | | | | | |
| Private equity investments | | | 12 | | | | 24 | |
| | | | | | | | | |
| Total equity instruments | | | 649 | | | | 572 | |
| | | | | | | | | |
| Total financial investments available-for-sale | | | 59,525 | | | | 66,230 | |
| | | | | | | | | |
1 Refer to “Note 24 Fair value measurement” for more information on the fair value hierarchy categorization.
407
Financial information
Notes to the consolidated financial statements
Note 16 Property and equipment
| | | | | | | | | | | | | | | | | | | | | | | | | | | | | | | | |
|
At historical cost less accumulated depreciation | |
| CHF million | | Own-used properties | | | Leasehold
improvements | | | IT hardware
and
communication | | | Software | | | Other machines
and equipment | | | Projects in
progress | | | 31.12.13 | | | 31.12.12 | |
| Historical cost | | | | | | | | | | | | | | | | | | | | |
| | | | | | | | | | | | | | | | | | | | | | | | | | | | | | | | | |
| Balance at the beginning of the year | | | 8,307 | | | | 2,677 | | | | 2,422 | | | | 1,411 | | | | 792 | | | | 819 | | | | 16,428 | | | | 16,683 | |
| | | | | | | | | | | | | | | | | | | | | | | | | | | | | | | | | |
| Additions | | | 51 | | | | 69 | | | | 208 | | | | 53 | | | | 41 | | | | 821 | | | | 1,244 | | | | 1,111 | |
| | | | | | | | | | | | | | | | | | | | | | | | | | | | | | | | | |
| Disposals/write-offs1 | | | (154 | ) | | | (209 | ) | | | (382 | ) | | | (47 | ) | | | (77 | ) | | | (1 | ) | | | (871 | ) | | | (859 | ) |
| | | | | | | | | | | | | | | | | | | | | | | | | | | | | | | | | |
| Reclassifications | | | (225 | ) | | | 215 | | | | 4 | | | | 310 | | | | 27 | | | | (818 | ) | | | (488 | )5 | | | (420 | ) |
| | | | | | | | | | | | | | | | | | | | | | | | | | | | | | | | | |
| Foreign currency translation | | | (10 | ) | | | (76 | ) | | | (46 | ) | | | (8 | ) | | | (15 | ) | | | (23 | ) | | | (178 | ) | | | (88 | ) |
| | | | | | | | | | | | | | | | | | | | | | | | | | | | | | | | | |
| Balance at the end of the year | | | 7,970 | | | | 2,677 | | | | 2,205 | | | | 1,718 | | | | 769 | | | | 799 | | | | 16,136 | | | | 16,428 | |
| | | | | | | | | | | | | | | | | | | | | | | | | | | | | | | | | |
| Accumulated depreciation | | | | | | | | | | | | | | | | | | | | |
| | | | | | | | | | | | | | | | | | | | | | | | | | | | | | | | | |
| Balance at the beginning of the year | | | 4,660 | | | | 1,912 | | | | 2,071 | | | | 1,306 | | | | 574 | | | | 0 | | | | 10,524 | | | | 11,005 | |
| | | | | | | | | | | | | | | | | | | | | | | | | | | | | | | | | |
| Depreciation | | | 202 | | | | 178 | | | | 191 | | | | 108 | | | | 55 | | | | 0 | | | | 734 | | | | 653 | |
| | | | | | | | | | | | | | | | | | | | | | | | | | | | | | | | | |
| Impairment2 | | | 0 | | | | 59 | | | | 0 | | | | 15 | | | | 7 | | | | 0 | | | | 81 | | | | 36 | |
| | | | | | | | | | | | | | | | | | | | | | | | | | | | | | | | | |
| Disposals/write-offs1 | | | (51 | ) | | | (201 | ) | | | (381 | ) | | | (47 | ) | | | (77 | ) | | | 0 | | | | (756 | ) | | | (850 | ) |
| | | | | | | | | | | | | | | | | | | | | | | | | | | | | | | | | |
| Reclassifications | | | (323 | ) | | | 4 | | | | 0 | | | | 0 | | | | 0 | | | | 0 | | | | (319 | )5 | | | (255 | ) |
| | | | | | | | | | | | | | | | | | | | | | | | | | | | | | | | | |
| Foreign currency translation | | | (4 | ) | | | (59 | ) | | | (40 | ) | | | (9 | ) | | | (12 | ) | | | 0 | | | | (124 | ) | | | (65 | ) |
| | | | | | | | | | | | | | | | | | | | | | | | | | | | | | | | | |
| Balance at the end of the year | | | 4,485 | | | | 1,894 | | | | 1,841 | | | | 1,374 | | | | 547 | | | | 0 | | | | 10,140 | | | | 10,524 | |
| | | | | | | | | | | | | | | | | | | | | | | | | | | | | | | | | |
| Net book value at the end of the year3, 4 | | | 3,485 | | | | 783 | | | | 364 | | | | 344 | | | | 222 | | | | 799 | | | | 5,996 | | | | 5,905 | |
| | | | | | | | | | | | | | | | | | | | | | | | | | | | | | | | | |
1 Includes write-offs of fully depreciated assets.2 Impairment charges recorded in 2013 relate to assets for which the recoverable amount was determined based on value-in-use (recoverable amount of the impaired assets: CHF 36 million Leasehold improvements, CHF 0 million Software, CHF 1 million Other machines and equipment).3 The fire insurance value of property and equipment was CHF 12,331 million as of 31 December 2013 (as of 31 December 2012: CHF 12,865 million), predominantly related to real estate.4 As of 31 December 2013, contractual commitments to purchase property in the future amounted to approximately CHF 0.4 billion.5 Reflects reclassifications to Properties held for sale (CHF 169 million on a net basis) reported within Other assets.
| | | | | | | | |
| Investment properties at fair value | | | | | | | | |
| | | | | | | | | |
| | |
| CHF million | | 31.12.13 | | | 31.12.12 | |
| Balance at the beginning of the year | | | 99 | | | | 10 | |
| | | | | | | | | |
| Additions | | | 7 | | | | 6 | |
| | | | | | | | | |
| Sales | | | 0 | | | | 0 | |
| | | | | | | | | |
| Revaluations | | | (16 | ) | | | 9 | |
| | | | | | | | | |
| Reclassifications | | | (81 | ) | | | 75 | |
| | | | | | | | | |
| Foreign currency translation | | | 0 | | | | 0 | |
| | | | | | | | | |
| Balance at the end of the year | | | 10 | | | | 99 | |
| | | | | | | | | |
408
Note 17 Goodwill and intangible assets
Introduction
UBS performs an impairment test on its goodwill assets on an annual basis, or when indicators of impairment exist. UBS considers the segments, as reported in “Note 2 Segment reporting,” as separate cash-generating units (CGU). The impairment test is performed for each segment to which goodwill is allocated by comparing the recoverable amount, based on its value-in-use, to the carrying amount of the respective segment. An impairment charge is recognized if the carrying amount exceeds the recoverable amount. As of 31 December 2013, total goodwill recognized on the balance sheet was CHF 5.8 billion, of which CHF 1.3 billion, CHF 3.1 billion and CHF 1.4 billion was carried by Wealth Management, Wealth Management Americas and Global Asset Management, respectively. Based on the impairment testing methodology described below, UBS concluded that the goodwill balances as of 31 December 2013 allocated to these segments remain recoverable.
Methodology for goodwill impairment testing
The recoverable amounts are determined using a discounted cash flow model, which has been adapted to use inputs that consider features of the banking business and its regulatory environment. The recoverable amount of a segment is the sum of the discounted earnings attributable to shareholders from the first five forecasted years and the terminal value. The terminal value, which covers all periods beyond the fifth year, is calculated on the basis of the forecast of fifth-year profit, the discount rate and the long-term growth rate and is adjusted for the effect of the capital assumed to be needed to support the perpetual growth implied by the long-term growth rate. The carrying amount for each segment is determined by reference to the Group’s equity attribution framework. Within this framework, which is described in the “Capital management” section of this report, the Board of Directors (BoD) attributes equity to the businesses after considering their risk exposure, risk-weighted assets and leverage ratio denominator usage, goodwill and
intangible assets. The total amount of equity attributed to the business divisions can differ from the Group’s actual equity during a given period. The framework is primarily used for purposes of measuring the performance of the businesses and includes certain management assumptions. Attributed equity equals the capital that a segment requires to conduct its business and is considered an appropriate starting point from which to determine the carrying value of the segments. From 1 January 2013, attributed equity underpinning goodwill and intangible assets that arose from the PaineWebber acquisition is reported in Corporate Center – Core Functions. For the purpose of the impairment test, the amount of goodwill and intangible assets related to this acquisition is allocated back to the respective business divisions when calculating the carrying amounts, such that the treatment is consistent with previous years. The attributed equity methodology is aligned with the business planning process, the inputs from which are used in calculating the recoverable amounts of the respective CGU.
| | è | | Refer to the “Capital management” section of this report for more information on the equity attribution framework |
Assumptions
Valuation parameters used within the Group’s impairment test model are linked to external market information, where applicable. The model used to determine the recoverable amount is most sensitive to changes in the forecast earnings available to shareholders in years one to five, to changes in the discount rates, and to changes in the long-term growth rate. The applied long-term growth rate is based on long-term economic growth rates for different regions worldwide. Earnings available to shareholders are estimated based on forecast results, which are part of the business plan approved by the BoD.
The discount rates are determined by applying a capital-asset-pricing-model-based approach, as well as considering quantitative and qualitative inputs from both internal and external analysts and the view of management. Based on this approach, discount rates for all CGU have decreased by 1% compared with last year.
409
Financial information
Notes to the consolidated financial statements
Note 17 Goodwill and intangible assets (continued)
Key assumptions used to determine the recoverable amounts of each segment are tested for sensitivity by applying a reasonably possible change to those assumptions. Forecast earnings available to shareholders were changed by 10%, the discount rates were changed by 1% and the long-term growth rates were changed by 0.5%. Under all scenarios, the recoverable amounts for each segment exceeded the respective carrying amount, such that the reasonably possible changes in key assumptions would not result in impairment.
If the estimated earnings and other assumptions in future periods deviate from the current outlook, the value of our goodwill may become impaired in the future, giving rise to losses in the income statement. Recognition of any impairment of goodwill would reduce IFRS equity attributable to UBS shareholders and net profit. It would not impact cash flows and, as goodwill is required to be deducted from capital under the Basel capital framework, no impact would be expected on the Group total capital ratios.
In 2012, an impairment test was performed as of 30 September 2012 with respect to the Investment Bank because indicators of impairment were present for that cash-generating unit. These indicators included negative variances from planned performance, preliminary
discussions regarding changes in strategy for the Investment Bank and revised business plan information taking into account changes in market conditions and the global economic outlook. The impairment test was based on the business plan approved by the Board of Directors on 29 October 2012. As a result of this impairment test, losses were recognized in the income statement relating to a full impairment of CHF 3,030 million for goodwill in 2012. Additional assets were examined to determine whether their carrying values exceeded their recoverable amounts. Impairment losses of CHF 15 million were recognized in the income statement for other intangible assets and CHF 19 million for property and equipment, both in 2012. These impairment losses were recognized in the Investment Bank’s 2012 operating results as Impairment of goodwill, Amortization and impairment of intangible assets, and Depreciation and impairment of property and equipment. In 2013, these impairment losses were retrospectively allocated to Corporate Center – Non-core and Legacy Portfolio.
| | è | | Refer to “Note 1b Changes in accounting policies, comparability and other adjustments” for more information on the creation of Corporate Center – Non-core and Legacy Portfolio |
Discount and growth rates
| | | | | | | | | | | | | | | | |
| | | | | | | | | | | | | | | | | |
| | Discount rates | | | Growth rates | |
| In % | | 31.12.13 | | | 31.12.12 | | | 31.12.13 | | | 31.12.12 | |
| Wealth Management | | | 9.0 | | | | 10.0 | | | | 1.7 | | | | 1.7 | |
| | | | | | | | | | | | | | | | | |
| Wealth Management Americas | | | 9.0 | | | | 10.0 | | | | 2.4 | | | | 2.4 | |
| | | | | | | | | | | | | | | | | |
| Global Asset Management | | | 9.0 | | | | 10.0 | | | | 2.4 | | | | 2.4 | |
| | | | | | | | | | | | | | | | | |
| Investment Bank | | | 12.0 | | | | 13.0 | | | | 2.4 | | | | 2.4 | |
| | | | | | | | | | | | | | | | | |
| | | | | | | | | | | | | | | | | | | | | | | | |
| | Goodwill | | | Intangible assets | | | | |
| CHF million | | Total | | | Infrastructure | | | Customer
relationships,
contractual
rights and other | | | Total | | | 31.12.13 | | | 31.12.12 | |
| Historical cost | | | | | | | | | | | | | | | | | | | | | | | | |
| | | | | | | | | | | | | | | | | | | | | | | | | |
| Balance at the beginning of the year | | | 5,949 | | | | 696 | | | | 773 | | | | 1,469 | | | | 7,417 | | | | 10,641 | |
| | | | | | | | | | | | | | | | | | | | | | | | | |
| Additions/adjustments1 | | | 41 | | | | | | | | 38 | | | | 38 | | | | 79 | | | | 11 | |
| | | | | | | | | | | | | | | | | | | | | | | | | |
| Disposals | | | (6 | ) | | | | | | | (28 | ) | | | (28 | ) | | | (35 | ) | | | (1 | ) |
| | | | | | | | | | | | | | | | | | | | | | | | | |
| Write-offs | | | | | | | | | | | | | | | | | | | 0 | | | | (3,110 | ) |
| | | | | | | | | | | | | | | | | | | | | | | | | |
| Foreign currency translation | | | (141 | ) | | | (18 | ) | | | (20 | ) | | | (38 | ) | | | (179 | ) | | | (124 | ) |
| | | | | | | | | | | | | | | | | | | | | | | | | |
| Balance at the end of the year | | | 5,842 | | | | 678 | | | | 763 | | | | 1,441 | | | | 7,283 | | | | 7,417 | |
| | | | | | | | | | | | | | | | | | | | | | | | | |
| Accumulated amortization and impairment | | | | | | | | | | | | | | | | | | | | | | | | |
| | | | | | | | | | | | | | | | | | | | | | | | | |
| Balance at the beginning of the year | | | | | | | 424 | | | | 532 | | | | 956 | | | | 956 | | | | 946 | |
| | | | | | | | | | | | | | | | | | | | | | | | | |
| Amortization | | | | | | | 35 | | | | 44 | | | | 79 | | | | 79 | | | | 89 | |
| | | | | | | | | | | | | | | | | | | | | | | | | |
| Impairment2 | | | | | | | | | | | 3 | | | | 3 | | | | 3 | | | | 3,047 | |
| | | | | | | | | | | | | | | | | | | | | | | | | |
| Disposals | | | | | | | | | | | (28 | ) | | | (28 | ) | | | (28 | ) | | | 0 | |
| | | | | | | | | | | | | | | | | | | | | | | | | |
| Write-offs | | | | | | | | | | | | | | | | | | | 0 | | | | (3,110 | ) |
| | | | | | | | | | | | | | | | | | | | | | | | | |
| Foreign currency translation | | | | | | | (12 | ) | | | (9 | ) | | | (21 | ) | | | (21 | ) | | | (17 | ) |
| | | | | | | | | | | | | | | | | | | | | | | | | |
| Balance at the end of the year | | | 0 | | | | 447 | | | | 543 | | | | 990 | | | | 990 | | | | 956 | |
| | | | | | | | | | | | | | | | | | | | | | | | | |
| Net book value at the end of the year | | | 5,842 | | | | 231 | | | | 220 | | | | 451 | | | | 6,293 | | | | 6,461 | |
| | | | | | | | | | | | | | | | | | | | | | | | | |
1 Mainly related to the acquisition of Link Investimentos, which was completed in 2013. Refer to “Note 31 Business combinations” for more information.2 Impairment charges recorded in 2013 relate to assets for which the recoverable amount was determined based on value-in-use (recoverable amount of the impaired assets: CHF 5 million).
410
Note 17 Goodwill and intangible assets (continued)
The following table presents the disclosure of goodwill and intangible assets by segment for the year ended 31 December 2013.
| | | | | | | | | | | | | | | | | | | | | | | | | | | | |
| | Wealth
Management | | | Wealth
Management
Americas | | | Investment
Bank | | | Global Asset
Management | | | Corporate Center | | | UBS | |
| CHF million | | | | | | | | | | | | | | Core
Functions | | | Non-core and
Legacy Portfolio | | | | |
| Goodwill | | | | | | | | | | | | | | | | | | | | | | | | | | | | |
| | | | | | | | | | | | | | | | | | | | | | | | | | | | | |
| Balance at the beginning of the year | | | 1,304 | | | | 3,213 | | | | | | | | 1,432 | | | | | | | | | | | | 5,949 | |
| | | | | | | | | | | | | | | | | | | | | | | | | | | | | |
| Additions / adjustments | | | (11 | )1 | | | | | | | 52 | 2 | | | | | | | | | | | | | | | 41 | |
| | | | | | | | | | | | | | | | | | | | | | | | | | | | | |
| Disposals | | | | | | | | | | | | | | | (6 | ) | | | | | | | | | | | (6 | ) |
| | | | | | | | | | | | | | | | | | | | | | | | | | | | | |
| Impairment | | | | | | | | | | | | | | | | | | | | | | | | | | | 0 | |
| | | | | | | | | | | | | | | | | | | | | | | | | | | | | |
| Foreign currency translation | | | (12 | ) | | | (82 | ) | | | (8 | ) | | | (39 | ) | | | | | | | | | | | (141 | ) |
| | | | | | | | | | | | | | | | | | | | | | | | | | | | | |
| Balance at the end of the year | | | 1,281 | | | | 3,131 | | | | 44 | | | | 1,386 | | | | | | | | | | | | 5,842 | |
| | | | | | | | | | | | | | | | | | | | | | | | | | | | | |
| Intangible assets | | | | | | | | | | | | | | | | | | | | | | | | | | | | |
| | | | | | | | | | | | | | | | | | | | | | | | | | | | | |
| Balance at the beginning of the year | | | 55 | | | | 323 | | | | 90 | | | | 34 | | | | 6 | | | | 4 | | | | 513 | |
| | | | | | | | | | | | | | | | | | | | | | | | | | | | | |
| Additions | | | 2 | | | | | | | | 23 | | | | | | | | 13 | | | | | | | | 38 | |
| | | | | | | | | | | | | | | | | | | | | | | | | | | | | |
| Disposals | | | | | | | | | | | (1 | ) | | | | | | | | | | | | | | | (1 | ) |
| | | | | | | | | | | | | | | | | | | | | | | | | | | | | |
| Amortization | | | (4 | ) | | | (49 | ) | | | (13 | ) | | | (8 | ) | | | (4 | ) | | | (2 | ) | | | (79 | ) |
| | | | | | | | | | | | | | | | | | | | | | | | | | | | | |
| Impairment | | | (3 | ) | | | | | | | | | | | | | | | | | | | | | | | (3 | ) |
| | | | | | | | | | | | | | | | | | | | | | | | | | | | | |
| Foreign currency translation | | | 1 | | | | (6 | ) | | | (9 | ) | | | (1 | ) | | | | | | | 0 | | | | (16 | ) |
| | | | | | | | | | | | | | | | | | | | | | | | | | | | | |
| Balance at the end of the year | | | 50 | | | | 267 | | | | 90 | | | | 25 | | | | 15 | | | | 3 | | | | 451 | |
| | | | | | | | | | | | | | | | | | | | | | | | | | | | | |
1 Goodwill for an acquisition made prior to adoption of IFRS 3 (revised 2009) was subsequently adjusted due to a change in the amount of contingent consideration. 2 Related to the acquisition of Link Investimentos, which was completed in 2013. Refer to “Note 31 Business combinations” for more information.
The estimated, aggregated amortization expenses for intangible assets are as follows.
| | | | |
| CHF million | | Intangible assets | |
| Estimated, aggregated amortization expenses for: | | | | |
| 2014 | | | 79 | |
| | | | | |
| 2015 | | | 78 | |
| | | | | |
| 2016 | | | 68 | |
| | | | | |
| 2017 | | | 57 | |
| | | | | |
| 2018 | | | 50 | |
| | | | | |
| 2019 and thereafter | | | 101 | |
| | | | | |
| Not amortized due to indefinite useful life | | | 19 | |
| | | | | |
| Total | | | 451 | |
| | | | | |
411
Financial information
Notes to the consolidated financial statements
Note 18 Other assets1
| | | | | | | | |
| | | | | | | | | |
CHF million | | 31.12.13 | | | 31.12.12 | |
| Prime brokerage receivables2 | | | 11,175 | | | | 8,072 | |
| | | | | | | | | |
| Recruitment loans to financial advisors | | | 2,733 | | | | 2,967 | |
| | | | | | | | | |
| Other loans to financial advisors | | | 358 | | | | 487 | |
| | | | | | | | | |
| Accrued interest income | | | 433 | | | | 753 | |
| | | | | | | | | |
| Accrued income – other | | | 931 | | | | 761 | |
| | | | | | | | | |
| Prepaid expenses | | | 985 | | | | 1,170 | |
| | | | | | | | | |
| Net defined benefit pension and post-employment assets3 | | | 952 | | | | 0 | |
| | | | | | | | | |
| Settlement and clearing accounts | | | 466 | | | | 589 | |
| | | | | | | | | |
| VAT and other tax receivables | | | 410 | | | | 214 | |
| | | | | | | | | |
| Properties and other non-current assets held for sale | | | 119 | | | | 137 | |
| | | | | | | | | |
| Other | | | 1,665 | | | | 2,094 | |
| | | | | | | | | |
| Total other assets | | | 20,228 | | | | 17,244 | |
| | | | | | | | | |
1 In 2013, changes in the presentation of this Note were made. Accrued income and prepaid expenses are no longer presented as a separate line item on the balance sheet but under Other assets. Recruitment loans to financial advisors, Other loans to financial advisors, Accrued interest income, Accrued income – other and Prepaid expenses, which were previously disclosed under Accrued income and prepaid expenses, are now presented separately in this Note in order to enhance transparency. Prior periods have been restated. As a result, Other assets as of 31 December 2012 increased by CHF 6,138 million. Refer to “Note 1b Changes in accounting policies, comparability and other adjustments” for more information.2 Prime brokerage services include clearance, settlement, custody, financing and portfolio reporting services for corporate clients trading across multiple asset classes. The balance is mainly comprised of margin lending receivables.3 Refer to “Note 28 Pension and other post-employment benefit plans” for more information.
412
Balance sheet notes: liabilities
Note 19 Due to banks and customers
| | | | | | | | |
| CHF million | | 31.12.13 | | | 31.12.12 | |
| Due to banks | | | 12,862 | | | | 23,024 | |
| | | | | | | | | |
| Due to customers: demand deposits | | | 178,972 | | | | 162,954 | |
| | | | | | | | | |
| Due to customers: time deposits | | | 47,326 | | | | 51,266 | |
| | | | | | | | | |
| Due to customers: fiduciary deposits | | | 21,459 | | | | 24,984 | |
| | | | | | | | | |
| Due to customers: retail savings/deposits | | | 143,068 | | | | 134,255 | |
| | | | | | | | | |
| Total due to customers | | | 390,825 | | | | 373,459 | |
| | | | | | | | | |
| Total due to banks and customers | | | 403,686 | | | | 396,483 | |
| | | | | | | | | |
|
Note 20 Financial liabilities designated at fair value | |
| CHF million | | | 31.12.13 | | | | 31.12.12 | |
| | | | | | | | | |
| Non-structured fixed-rate bonds | | | 3,664 | | | | 4,845 | |
| | | | | | | | | |
| Structured debt instruments issued: | | | | | | | | |
| | | | | | | | | |
Equity-linked | | | 32,835 | | | | 35,259 | |
| | | | | | | | | |
Credit-linked | | | 6,279 | | | | 9,382 | |
| | | | | | | | | |
Rates-linked1 | | | 14,488 | | | | 18,599 | |
| | | | | | | | | |
Other | | | 2,698 | | | | 4,241 | |
| | | | | | | | | |
| Structured over-the-counter debt instruments: | | | | | | | | |
| | | | | | | | | |
Equity-linked | | | 3,478 | | | | 7,959 | |
| | | | | | | | | |
Other | | | 4,839 | | | | 9,784 | |
| | | | | | | | | |
| Repurchase agreements | | | 1,572 | | | | 1,672 | |
| | | | | | | | | |
| Loan commitments2 | | | 49 | | | | 161 | |
| | | | | | | | | |
| Total | | | 69,901 | | | | 91,901 | |
| | | | | | | | | |
of which: own credit on financial liabilities designated at fair value | | | 577 | | | | 292 | |
| | | | | | | | | |
1 Also includes non-structured rates-linked debt instruments issued. 2 Loan commitments recognized as “Financial liabilities designated at fair value” until drawn and recognized as loans. See Note 1a) 8) for additional information.
As of 31 December 2013, the contractual redemption amount at maturity ofFinancial liabilities designated at fair value through profit or loss was CHF 0.3 billion higher than the carrying value. As of 31 December 2012, the contractual redemption amount at maturity of such liabilities was CHF 0.2 billion higher than the carrying value.
As of 31 December 2013 and 31 December 2012, the Group had CHF 69,901 million and CHF 91,901 million, respectively, of financial liabilities designated at fair value, comprised of both Swiss franc and non-Swiss franc-denominated fixed-rate and floating-rate debt.
The table on the following page shows the contractual maturity of the carrying value of financial liabilities designated at fair value, split between fixed-rate and floating-rate based on the contractual terms and ignoring any early redemption features. Interest rate ranges for future interest payments related to these financial liabilities designated at fair value have not been included in the table below as a majority of these liabilities are structured products, and therefore the future interest payments are highly dependent upon the embedded derivative and prevailing market conditions at the time each interest payment is made.
| | è | | Refer to “Note 27b Maturity analysis of financial liabilities” for maturity information on an undiscounted cash flow basis |
413
Financial information
Notes to the consolidated financial statements
Note 20 Financial liabilities designated at fair value (continued)
| | | | | | | | | | | | | | | | | | | | | | | | | | | | | | | | | | | | |
| Contractual maturity of carrying value | | | | | | | | | | | | | | | | | | | | | | | | | | | |
| | | | | | | | | | | | | | | | | | | | | | | | | | | | | | | | | | | | |
| CHF million, except where indicated | | 2014 | | | 2015 | | | 2016 | | | 2017 | | | 2018 | | | 2019–2023 | | | Thereafter | | | Total
31.12.13 | | | Total
31.12.12 | |
| UBS AG (Parent Bank) | | | | | | | | | | | | | | | | | | | | | | | | | | | | | | | | | | | | |
| | | | | | | | | | | | | | | | | | | | | | | | | | | | | | | | | | | | | |
| Non-subordinated debt | | | | | | | | | | | | | | | | | | | | | | | | | | | | | | | | | | | | |
| | | | | | | | | | | | | | | | | | | | | | | | | | | | | | | | | | | | | |
Fixed-rate | | | 3,556 | | | | 1,881 | | | | 1,361 | | | | 2,637 | | | | 933 | | | | 2,275 | | | | 2,788 | | | | 15,431 | | | | 22,344 | |
| | | | | | | | | | | | | | | | | | | | | | | | | | | | | | | | | | | | | |
Floating-rate | | | 14,057 | | | | 9,244 | | | | 6,522 | | | | 3,412 | | | | 3,293 | | | | 5,105 | | | | 8,126 | | | | 49,760 | | | | 62,551 | |
| | | | | | | | | | | | | | | | | | | | | | | | | | | | | | | | | | | | | |
| Subtotal | | | 17,612 | | | | 11,126 | | | | 7,882 | | | | 6,049 | | | | 4,227 | | | | 7,380 | | | | 10,915 | | | | 65,191 | | | | 84,894 | |
| | | | | | | | | | | | | | | | | | | | | | | | | | | | | | | | | | | | | |
| Subsidiaries | | | | | | | | | | | | | | | | | | | | | | | | | | | | | | | | | | | | |
| | | | | | | | | | | | | | | | | | | | | | | | | | | | | | | | | | | | | |
| Non-subordinated debt | | | | | | | | | | | | | | | | | | | | | | | | | | | | | | | | | | | | |
| | | | | | | | | | | | | | | | | | | | | | | | | | | | | | | | | | | | | |
Fixed-rate | | | 4 | | | | 125 | | | | 55 | | | | 79 | | | | 242 | | | | 175 | | | | 788 | | | | 1,468 | | | | 1,733 | |
| | | | | | | | | | | | | | | | | | | | | | | | | | | | | | | | | | | | | |
Floating-rate | | | 779 | | | | 511 | | | | 211 | | | | 656 | | | | 264 | | | | 557 | | | | 264 | | | | 3,242 | | | | 5,273 | |
| | | | | | | | | | | | | | | | | | | | | | | | | | | | | | | | | | | | | |
| Subtotal | | | 783 | | | | 636 | | | | 267 | | | | 735 | | | | 506 | | | | 732 | | | | 1,052 | | | | 4,710 | | | | 7,006 | |
| | | | | | | | | | | | | | | | | | | | | | | | | | | | | | | | | | | | | |
| Total | | | 18,395 | | | | 11,762 | | | | 8,149 | | | | 6,784 | | | | 4,733 | | | | 8,112 | | | | 11,966 | | | | 69,901 | | | | 91,901 | |
| | | | | | | | | | | | | | | | | | | | | | | | | | | | | | | | | | | | | |
| | | | | | | | |
Note 21 Debt issued held at amortized cost | |
| CHF million | | 31.12.13 | | | 31.12.12 | |
| Certificates of deposit | | | 15,811 | | | | 11,153 | |
| | | | | | | | | |
| Commercial paper | | | 2,961 | | | | 7,792 | |
| | | | | | | | | |
| Other short-term debt | | | 8,862 | | | | 13,548 | |
| | | | | | | | | |
| Short-term debt | | | 27,633 | | | | 32,493 | |
| | | | | | | | | |
| Non-structured fixed-rate bonds | | | 17,417 | | | | 31,341 | |
| | | | | | | | | |
| Covered bonds | | | 14,341 | | | | 15,116 | |
| | | | | | | | | |
| Subordinated debt | | | 11,040 | | | | 11,848 | |
| | | | | | | | | |
of which: Swiss SRB Basel III low-trigger loss absorbing capital | | | 4,710 | | | | 3,656 | |
| | | | | | | | | |
| Debt issued through the central bond institutions of the Swiss regional or cantonal banks | | | 8,293 | | | | 7,585 | |
| | | | | | | | | |
| Medium-term notes | | | 779 | | | | 1,341 | |
| | | | | | | | | |
| Other long-term debt | | | 2,083 | | | | 5,113 | |
| | | | | | | | | |
| Long-term debt | | | 53,953 | | | | 72,344 | |
| | | | | | | | | |
| Total debt issued held at amortized cost1 | | | 81,586 | | | | 104,837 | |
| | | | | | | | | |
1 Net of bifurcated embedded derivatives with a net negative fair value of CHF 160 million as of 31 December 2013. In 2013, the comparative period figure was corrected. On a corrected basis, as of 31 December 2012, these derivatives had a net negative fair value of CHF 118 million.
The Group uses interest rate and foreign exchange derivatives to manage the risks inherent in certain debt instruments held at amortized cost. In certain cases, the Group applies hedge accounting for interest rate risk as discussed in Note 1a) 15) and “Note 14 Derivative instruments and hedge accounting.” As a result of applying hedge accounting, the carrying value of debt issued increased by CHF 1,119 million and by CHF 2,608 million as of 31 December 2013 and 31 December 2012, respectively, reflecting changes in fair value due to interest rate movements.
Subordinated debt are unsecured obligations of the Group that are subordinated in right of payment to all other present and future indebtedness and also to certain other obligations of the Group. As of 31 December 2013 and 31 December 2012, the Group had CHF 11,040 million and CHF 11,848 million, respectively, of subordinated
debt, which included CHF 4,710 million and CHF 3,656 million of Swiss SRB Basel III low-trigger loss absorbing capital as of 31 December 2013 and 31 December 2012, respectively. The majority of the subordinated debt outstanding as of 31 December 2013 were fixed-rate issuances, with the remainder paying floating-rate interest based on three-month or six-month London Interbank Offered Rate (LIBOR). Both the fixed- and floating-rate instruments provide for a single principal payment upon maturity.
As of 31 December 2013 and 31 December 2012, the Group had CHF 70,546 million and CHF 92,989 million, respectively, of non-subordinated debt issued held at amortized cost, comprised of both Swiss franc- and non-Swiss franc-denominated fixed-rate and floating-rate debt.
414
Note 21 Debt issued held at amortized cost (continued)
The following table shows the contractual maturity of the carrying value of debt issued, split between fixed-rate and floating-rate based on the contractual terms and ignoring any early redemption features. The Group uses interest rate swaps to hedge the majority of fixed-rate debt
issued, which changes their repricing characteristics into those similar to floating-rate debt.
| | è | | Refer to “Note 27b Maturity analysis of financial liabilities” for maturity information on an undiscounted cash flow basis |
| | | | | | | | | | | | | | | | | | | | | | | | | | | | | | | | | | | | |
|
Contractual maturity dates of carrying value | |
| CHF million, except where indicated | | 2014 | | | 2015 | | | 2016 | | | 2017 | | | 2018 | | | 2019–2023 | | | Thereafter | | | Total
31.12.13 | | | Total
31.12.12 | |
| UBS AG (Parent Bank) | | | | | | | | | | | | | | | | | | | | | | | | | | | | | | | | | | | | |
| | | | | | | | | | | | | | | | | | | | | | | | | | | | | | | | | | | | | |
| Non-subordinated debt | | | | | | | | | | | | | | | | | | | | | | | | | | | | | | | | | | | | |
| | | | | | | | | | | | | | | | | | | | | | | | | | | | | | | | | | | | | |
Fixed-rate | | | 25,023 | | | | 6,154 | | | | 5,332 | | | | 7,484 | | | | 5,753 | | | | 8,250 | | | | 1,384 | | | | 59,381 | | | | 77,511 | |
| | | | | | | | | | | | | | | | | | | | | | | | | | | | | | | | | | | | | |
Interest rates (range in %) | | | 0–6.6 | | | | 0.3–3.9 | | | | 0–6.4 | | | | 0–5.9 | | | | 0.4–6.6 | | | | 0–4.9 | | | | 0–2.8 | | | | | | | | | |
| | | | | | | | | | | | | | | | | | | | | | | | | | | �� | | | | | | | | | | |
Floating-rate | | | 5,661 | | | | 6 | | | | 131 | | | | | | | | | | | | | | | | 2,190 | | | | 7,988 | | | | 9,198 | |
| | | | | | | | | | | | | | | | | | | | | | | | | | | | | | | | | | | | | |
| Subordinated debt | | | | | | | | | | | | | | | | | | | | | | | | | | | | | | | | | | | | |
| | | | | | | | | | | | | | | | | | | | | | | | | | | | | | | | | | | | | |
Fixed-rate | | | 383 | | | | 889 | | | | 1,305 | | | | 653 | | | | 0 | | | | 5,207 | | | | 2,368 | | | | 10,805 | | | | 11,157 | |
| | | | | | | | | | | | | | | | | | | | | | | | | | | | | | | | | | | | | |
Interest rates (range in %) | | | 3.1 | | | | 2.4–7.4 | | | | 3.1–5.9 | | | | 4.1–7.4 | | | | 0 | | | | 4.5–7.6 | | | | 4.3–8.8 | | | | | | | | | |
| | | | | | | | | | | | | | | | | | | | | | | | | | | | | | | | | | | | | |
Floating-rate | | | | | | | | | | | | | | | | | | | | | | | 235 | | | | | | | | 235 | | | | 692 | |
| | | | | | | | | | | | | | | | | | | | | | | | | | | | | | | | | | | | | |
| Subtotal | | | 31,067 | | | | 7,049 | | | | 6,769 | | | | 8,137 | | | | 5,753 | | | | 13,693 | | | | 5,943 | | | | 78,409 | | | | 98,557 | |
| | | | | | | | | | | | | | | | | | | | | | | | | | | | | | | | | | | | | |
| Subsidiaries | | | | | | | | | | | | | | | | | | | | | | | | | | | | | | | | | | | | |
| | | | | | | | | | | | | | | | | | | | | | | | | | | | | | | | | | | | | |
| Non-subordinated debt | | | | | | | | | | | | | | | | | | | | | | | | | | | | | | | | | | | | |
| | | | | | | | | | | | | | | | | | | | | | | | | | | | | | | | | | | | | |
Fixed-rate | | | 2,469 | | | | 2 | | | | 540 | | | | 141 | | | | 3 | | | | 20 | | | | 1 | | | | 3,175 | | | | 6,150 | |
| | | | | | | | | | | | | | | | | | | | | | | | | | | | | | | | | | | | | |
Interest rates (range in %) | | | 0–8.0 | | | | 0 | | | | 0–8.3 | | | | 0–8.0 | | | | 0 | | | | 0 | | | | 0 | | | | | | | | | |
| | | | | | | | | | | | | | | | | | | | | | | | | | | | | | | | | | | | | |
Floating-rate | | | | | | | | | | | | | | | | | | | 1 | | | | | | | | | | | | 1 | | | | 129 | |
| | | | | | | | | | | | | | | | | | | | | | | | | | | | | | | | | | | | | |
| Subtotal | | | 2,469 | | | | 2 | | | | 540 | | | | 141 | | | | 4 | | | | 20 | | | | 1 | | | | 3,177 | | | | 6,280 | |
| | | | | | | | | | | | | | | | | | | | | | | | | | | | | | | | | | | | | |
| Total | | | 33,536 | | | | 7,050 | | | | 7,309 | | | | 8,277 | | | | 5,757 | | | | 13,713 | | | | 5,944 | | | | 81,586 | | | | 104,837 | |
| | | | | | | | | | | | | | | | | | | | | | | | | | | | | | | | | | | | | |
Note 22 Provisions and contingent liabilities
a) Provisions
| | | | | | | | | | | | | | | | | | | | | | | | | | | | | | | | | | | | |
| CHF million | | Operational
risks1 | | | Litigation,
regulatory
and similar
matters2 | | | Restructuring | | | Loan
commitments
and
guarantees | | | Real
estate | | | Employee
benefits | | | Other | | | Total
31.12.13 | | | Total
31.12.12 | |
| Balance at the beginning of the year | | | 53 | | | | 1,432 | | | | 511 | | | | 64 | | | | 178 | | | | 244 | | | | 53 | | | | 2,536 | | | | 1,626 | |
| | | | | | | | | | | | | | | | | | | | | | | | | | | | | | | | | | | | | |
| Additions from acquired companies | | | 0 | | | | 8 | 3 | | | 0 | | | | 0 | | | | 0 | | | | 0 | | | | 0 | | | | 8 | | | | 0 | |
| | | | | | | | | | | | | | | | | | | | | | | | | | | | | | | | | | | | | |
Increase in provisions recognized in the income statement | | | 34 | | | | 1,788 | | | | 601 | | | | 4 | | | | 9 | | | | 29 | | | | 134 | 4 | | | 2,599 | | | | 3,350 | |
| | | | | | | | | | | | | | | | | | | | | | | | | | | | | | | | | | | | | |
Release of provisions recognized in the income statement | | | (10 | ) | | | (93 | ) | | | (95 | ) | | | (6 | ) | | | (2 | ) | | | (27 | ) | | | (6 | ) | | | (238 | ) | | | (273 | ) |
| | | | | | | | | | | | | | | | | | | | | | | | | | | | | | | | | | | | | |
Provisions used in conformity with designated purpose | | | (31 | ) | | | (1,417 | ) | | | (349 | ) | | | 0 | | | | (32 | ) | | | (22 | ) | | | (4 | ) | | | (1,855 | ) | | | (2,102 | ) |
| | | | | | | | | | | | | | | | | | | | | | | | | | | | | | | | | | | | | |
| Capitalized reinstatement costs | | | 0 | | | | 0 | | | | 0 | | | | 0 | | | | 5 | | | | 0 | | | | 0 | | | | 5 | | | | (4 | ) |
| | | | | | | | | | | | | | | | | | | | | | | | | | | | | | | | | | | | | |
| Reclassifications | | | 0 | | | | (6 | ) | | | 0 | | | | (1 | ) | | | 0 | | | | 0 | | | | 28 | | | | 21 | | | | (47 | ) |
| | | | | | | | | | | | | | | | | | | | | | | | | | | | | | | | | | | | | |
Foreign currency translation/ unwind of discount | | | (1 | ) | | | (89 | ) | | | (9 | ) | | | 0 | | | | (2 | ) | | | (2 | ) | | | (1 | ) | | | (104 | ) | | | (14 | ) |
| | | | | | | | | | | | | | | | | | | | | | | | | | | | | | | | | | | | | |
| Balance at the end of the year | | | 45 | | | | 1,622 | | | | 658 | 5 | | | 61 | | | | 157 | 6 | | | 222 | 7 | | | 205 | | | | 2,971 | | | | 2,536 | |
| | | | | | | | | | | | | | | | | | | | | | | | | | | | | | | | | | | | | |
1 Comprises provisions for losses resulting from security risks and transaction processing risks.2 Comprises provisions for losses resulting from legal, liability and compliance risks.3 Related to the acquisition of Link Investimentos. Refer to “Note 31 Business combinations” for more information.4 Included a charge of CHF 110 million related to the Swiss-UK tax agreement.5 Includes personnel-related restructuring provisions of CHF 104 million as of 31 December 2013 (31 December 2012: CHF 243 million) and provisions for onerous lease contracts of CHF 554 million as of 31 December 2013 (31 December 2012: CHF 267 million).6 Includes reinstatement costs for leasehold improvements of CHF 95 million as of 31 December 2013 (31 December 2012: CHF 97 million) and provisions for onerous lease contracts of CHF 62 million as of 31 December 2013 (31 December 2012: CHF 81 million).7 Includes provisions for sabbatical and anniversary awards as well as provisions for severance which are not part of restructuring provisions.
Financial information
Notes to the consolidated financial statements
Restructuring provisions primarily relate to onerous lease contracts and severance amounts. The utilization of onerous lease provisions is driven by the maturities of the underlying lease contracts, which cover a period of up to 11 years. Severance related provisions are utilized within a short time period, usually within six months, but potential changes in amount may be triggered when natural staff attrition reduces the number of people affected by a restructuring and therefore the estimated costs.
Information on provisions and contingent liabilities in respect of Litigation, regulatory and similar matters, as a class, is included in Note 22b. Further information on the nominal principal amount of Loan commitments and guarantees, representing our maximum exposure to credit risk, is disclosed in the “Credit risk” section of this report. There are no material contingent liabilities associated with the other classes of provisions.
b) Litigation, regulatory and similar matters
The Group operates in a legal and regulatory environment that exposes it to significant litigation and similar risks arising from disputes and regulatory proceedings. As a result, UBS (which for purposes of this note may refer to UBS AG and/or one or more of its subsidiaries, as applicable) is involved in various disputes and legal proceedings, including litigation, arbitration, and regulatory and criminal investigations.
Such matters are subject to many uncertainties and the outcome is often difficult to predict, particularly in the earlier stages of a case. There are also situations where the Group may enter into a settlement agreement. This may occur in order to avoid the expense, management distraction or reputational implications of continuing to contest liability, even for those matters for which the Group believes it should be exonerated. The uncertainties inherent in all such matters affect the amount and timing of any potential outflows for both matters with respect to which provisions have been established and other contingent liabilities. The Group makes provisions for such matters brought against it when, in the opinion of management after seeking legal advice, it is more likely than not that the Group has a present legal or constructive obligation as a result of past events, it is probable that an outflow of resources will be required, and the amount can be reliably estimated. If any of those conditions is not met, such matters result in contingent liabilities.
Specific litigation, regulatory and other matters are described below, including all such matters that management considers to be material and others that management believes to be of significance due to potential financial, reputational and other effects. The amount of damages claimed, the size of a transaction or other information is provided where available and appropriate in order to assist users in considering the magnitude of potential exposures.
In the case of certain matters below, we state that we have established a provision, and for the other matters we make no such statement. When we make this statement and we expect disclosure of the amount of a provision to prejudice seriously our position with other parties in the matter, because it would reveal what UBS believes to be
the probable and reliably estimable outflow, we do not disclose that amount. In some cases we are subject to confidentiality obligations that preclude such disclosure. With respect to the matters for which we do not state whether we have established a provision, either (a) we have not established a provision, in which case the matter is treated as a contingent liability under the applicable accounting standard or (b) we have established a provision but expect disclosure of that fact to prejudice seriously our position with other parties in the matter because it would reveal the fact that UBS believes an outflow of resources to be probable and reliably estimable.
With respect to certain litigation, regulatory and similar matters as to which we have established provisions, we are able to estimate the expected timing of outflows. However, the aggregate amount of the expected outflows for those matters for which we are able to estimate expected timing is immaterial relative to our current and expected levels of liquidity over the relevant time periods.
The aggregate amount provisioned for litigation, regulatory and similar matters as a class is disclosed in Note 22a above. It is not practicable to provide an aggregate estimate of liability for our litigation, regulatory and similar matters as a class of contingent liabilities. Doing so would require us to provide speculative legal assessments as to claims and proceedings that involve unique fact patterns or novel legal theories, which have not yet been initiated or are at early stages of adjudication, or as to which alleged damages have not been quantified by the claimants. Although we therefore cannot provide a numerical estimate of the future losses that could arise from the class of litigation, regulatory and similar matters, we can confirm that we believe that the aggregate amount of possible future losses from this class that are more than remote substantially exceeds the level of current provisions.
The risk of loss associated with litigation, regulatory and similar matters is a component of operational risk for purposes of determining our capital requirements. Information concerning our capital requirements and the calculation of operational risk for this purpose is included in the “Capital management” and “Risk management and control” sections of this report.
416
Note 22 Provisions and contingent liabilities (continued)
| | | | | | | | | | | | | | | | | | | | | | | | | | | | | | | | | | | | |
|
| Provisions for litigation, regulatory and similar matters by segment1 | |
| | | | | | | | | | | | | | | | | | | | | | | | | | | | | | | | | | | | | |
| CHF million | | Wealth
Management | | | Wealth
Management
Americas | | | Retail &
Corporate | | | Global Asset
Management | | | Investment
Bank | | | Corporate
Center –
Core
Functions | | | Corporate
Center –
Non-core
and Legacy
Portfolio | | | Total
31.12.2013 | | | Total
31.12.2012 | |
| Balance at the beginning of the year | | | 130 | | | | 170 | | | | 29 | | | | 7 | | | | 28 | | | | 338 | | | | 732 | | | | 1,432 | | | | 482 | |
| Additions from acquired companies | | | | | | | | | | | | | | | | | | | 8 | 2 | | | | | | | | | | | 8 | | | | | |
| Increase in provisions recognized in the income statement | | | 114 | | | | 65 | | | | 55 | | | | 1 | | | | 16 | | | | 203 | | | | 1,334 | | | | 1,788 | | | | 2,686 | |
| Release of provisions recognized in the income statement | | | (18 | ) | | | (25 | ) | | | (2 | ) | | | | | | | (7 | ) | | | (34 | ) | | | (7 | ) | | | (93 | ) | | | (81 | ) |
| Provisions used in conformity with designated purpose | | | (53 | ) | | | (149 | ) | | | (7 | ) | | | (5 | ) | | | (16 | ) | | | (4 | ) | | | (1,184 | ) | | | (1,417 | ) | | | (1,685 | ) |
| Reclassifications | | | (7 | ) | | | | | | | 7 | | | | | | | | (6 | ) | | | 0 | | | | | | | | (6 | ) | | | 43 | |
| Foreign currency translation/unwind of discount | | | (1 | ) | | | (5 | ) | | | | | | | | | | | (2 | ) | | | (14 | ) | | | (67 | ) | | | (89 | ) | | | (13 | ) |
| | | | | | | | | | | | | | | | | | | | | | | | | | | | | | | | | | | | | |
| Balance at the end of the year | | | 165 | | | | 56 | | | | 82 | | | | 3 | | | | 22 | | | | 488 | | | | 808 | | | | 1,622 | | | | 1,432 | |
| | | | | | | | | | | | | | | | | | | | | | | | | | | | | | | | | | | | | |
1 Provisions, if any, for the matters described in (a) item 5 of this Note 22b are recorded in Wealth Management, (b) items 2 and 8 of this Note 22b are recorded in Wealth Management Americas, (c) item 12 of this Note 22b are recorded in the Investment Bank, (d) items 4, 9 and 11 of this Note 22b are recorded in Corporate Center – Core Functions and (e) items 3 and 7 of this Note 22b are recorded in Corporate Center – Non-core and Legacy Portfolio. Provisions for the matters described in items 1 and 10 of this Note 22b are allocated between Wealth Management and Retail & Corporate, and provisions for the matter described in item 6 of this Note 22b are allocated between the Investment Bank and Corporate Center – Non-core and Legacy Portfolio. 2 Related to the acquisition of Link Investimentos. Refer to “Note 31 Business combinations” for more information.
1. Inquiries regarding cross-border wealth management businesses
Following the disclosure and the settlement of the US cross-border matter, tax and regulatory authorities in a number of countries have made inquiries and served requests for information located in their respective jurisdictions relating to the cross-border wealth management services provided by UBS and other financial institutions. As a result of investigations in France, in May and June 2013, respectively, UBS (France) S.A. and UBS AG were put under formal examination(“mise en examen”) for complicity in having illicitly solicited clients on French territory, and were declared witness with legal assistance(“témoin assisté”) regarding the laundering of proceeds of tax fraud and of banking and financial solicitation by unauthorized persons. In June 2013, the French banking supervisory authority’s disciplinary commission reprimanded UBS (France) S.A. for having had insufficiencies in its control and compliance framework around its cross-border activities and “know your customer” obligations. It imposed a penalty of EUR 10 million, and a provision in that amount is reflected on our balance sheet at 31 December 2013. In Germany, several authorities have been conducting investigations against UBS Deutschland AG, UBS AG, and against certain employees of these entities concerning certain matters relating to our cross-border business. UBS is cooperating with these authorities within the limits of financial privacy obligations under Swiss and other applicable laws. Settlement discussions have commenced with respect to the German investigations.
2. Lehman principal protection notes
From March 2007 through September 2008, UBS Financial Services Inc. (UBSFS) sold approximately USD 1 billion face amount of structured notes issued by Lehman Brothers Holdings Inc. (Lehman), a majority of which were referred to as “principal protection notes,” reflecting the fact that while the notes’ return was in some manner linked to market indices or other
measures, some or all of the investor’s principal was an unconditional obligation of Lehman as issuer of the notes. Based on its role as an underwriter of Lehman structured notes, UBSFS was named as a defendant in a putative class action asserting violations of disclosure provisions of the federal securities laws. In August 2013, UBSFS agreed to a proposed USD 120 million settlement of the case, which was approved by the Court in December 2013. Previously, certain of the other underwriter defendants and the former officers and directors of Lehman reached separate settlements regarding the same case. UBSFS also has been named in numerous individual civil suits and customer arbitrations, a small number of which were pending as of 31 December 2013. The individual customer claims, some of which have resulted in awards payable by UBSFS, relate primarily to whether UBSFS adequately disclosed the risks of these notes to its customers.
Our balance sheet at 31 December 2013 reflected a provision with respect to pending arbitration matters described in this item 2 in an amount that UBS believes to be appropriate under the applicable accounting standard. As in the case of other matters for which we have established provisions, the future outflow of resources in respect of this matter cannot be determined with certainty based on currently available information, and accordingly may ultimately prove to be substantially greater (or may be less) than the provision that we have recognized.
3. Claims related to sales of residential mortgage-backed securities and mortgages
From 2002 through 2007, prior to the crisis in the US residential loan market, UBS was a substantial issuer and underwriter of US residential mortgage-backed securities (RMBS) and was a purchaser and seller of US residential mortgages. A subsidiary of UBS, UBS Real Estate Securities Inc. (UBS RESI), acquired pools of residential mortgage loans from originators and (through an affiliate) deposited them into securitization trusts. In this manner, from 2004 through 2007, UBS RESI sponsored approximately USD
Financial information
Notes to the consolidated financial statements
Note 22 Provisions and contingent liabilities (continued)
80 billion in RMBS, based on the original principal balances of the securities issued.
UBS RESI also sold pools of loans acquired from originators to third-party purchasers. These whole loan sales during the period 2004 through 2007 totaled approximately USD 19 billion in original principal balance.
We were not a significant originator of US residential loans. A subsidiary of UBS originated approximately USD 1.5 billion in US residential mortgage loans during the period in which it was active from 2006 to 2008, and securitized less than half of these loans.
Securities lawsuits concerning disclosures in RMBS offering documents: UBS is named as a defendant relating to its role as underwriter and issuer of RMBS in a large number of lawsuits related to approximately USD 13 billion in original face amount of RMBS underwritten or issued by UBS. Some of the lawsuits are in their early stages and have not advanced beyond the motion to dismiss phase; others are in varying stages of discovery. Of the USD 13 billion in original face amount of RMBS that remains at issue in these cases, approximately USD 3 billion was issued in offerings in which a UBS subsidiary transferred underlying loans (the majority of which were purchased from third-party originators) into a securitization trust and made representations and warranties about those loans (UBS-sponsored RMBS). The remaining USD 10 billion of RMBS to which these cases relate was issued by third parties in securitizations in which UBS acted as underwriter (third-party RMBS).
In connection with certain of these lawsuits, UBS has indemnification rights against surviving third-party issuers or originators for losses or liabilities incurred by UBS, but UBS cannot predict the extent to which it will succeed in enforcing those rights. A class action settlement announced in April 2013 by a third-party issuer received final approval by the district court in December 2013. The settlement, which is subject to appeal, reduced the original face amount of RMBS at issue in these
cases from USD 37 billion to USD 13 billion, and the original face amount of RMBS at issue in cases involving third-party issuers from USD 34 billion to USD 10 billion, as noted above. The third-party issuer will fund the settlement at no cost to UBS. In January 2014, certain objectors to the settlement filed a notice of appeal from the district court’s approval of the settlement.
In 2012, a federal court in New Jersey dismissed with prejudice on statute of limitations grounds a putative class action lawsuit that asserted violations of the federal securities laws against various UBS entities, among others, in connection with USD 2.6 billion in original face amount of UBS-sponsored RMBS. In September 2013, the US Court of Appeals for the Third Circuit affirmed the district court’s dismissal with prejudice, and in October 2013 the Court of Appeals denied plaintiffs’ petition for en banc review.
Loan repurchase demands related to sales of mortgages and RMBS:When UBS acted as an RMBS sponsor or mortgage seller, we generally made certain representations relating to the characteristics of the underlying loans. In the event of a material breach of these representations, we were in certain circumstances contractually obligated to repurchase the loans to which they related or to indemnify certain parties against losses. UBS has received demands to repurchase US residential mortgage loans as to which UBS made certain representations at the time the loans were transferred to the securitization trust. We have been notified by certain institutional purchasers and insurers of mortgage loans and RMBS of their contention that possible breaches of representations may entitle the purchasers to require that UBS repurchase the loans or to other relief. The table below summarizes repurchase demands received by UBS and UBS’s repurchase activity from 2006 through 5 March 2014. In the table, repurchase demands characterized as Demands resolved in litigation and Demands rescinded by counter-party are considered to be finally resolved. Repurchase demands in all other categories are not finally resolved.
| | | | | | | | | | | | | | | | | | | | | | | | | | | | | | | | |
Loan repurchase demands by year received – original principal balance of loans1 | |
| | | | | | | | | | | | | | | | | | | | | | | | | | | | | | | | | |
| USD million | | 2006–2008 | | | 2009 | | | 2010 | | | 2011 | | | 2012 | | | 2013 | | | 2014, through
5 March | | | Total | |
| Resolved demands | | | | | | | | | | | | | | | | | | | | | | | | | | | | | | | | |
| | | | | | | | | | | | | | | | | | | | | | | | | | | | | | | | | |
| Actual or agreed loan repurchases/make whole payments by UBS | | | 12 | | | | 1 | | | | | | | | | | | | | | | | | | | | | | | | 13 | |
| | | | | | | | | | | | | | | | | | | | | | | | | | | | | | | | | |
| Demands rescinded by counterparty | | | 110 | | | | 104 | | | | 19 | | | | 304 | | | | 237 | | | | | | | | | | | | 774 | |
| | | | | | | | | | | | | | | | | | | | | | | | | | | | | | | | | |
| Demands resolved in litigation | | | 1 | | | | 21 | | | | | | | | | | | | | | | | | | | | | | | | 21 | |
| | | | | | | | | | | | | | | | | | | | | | | | | | | | | | | | | |
| Demands expected to be resolved by third parties | | | | | | | | | | | | | | | | | | | | | | | | | | | | | | | | |
| | | | | | | | | | | | | | | | | | | | | | | | | | | | | | | | | |
| Demands resolved or expected to be resolved through enforcement of indemnification rights against third-party originators | | | | | | | 77 | | | | 2 | | | | 45 | | | | 128 | | | | 99 | | | | | | | | 351 | |
| | | | | | | | | | | | | | | | | | | | | | | | | | | | | | | | | |
| Demands in dispute | | | | | | | | | | | | | | | | | | | | | | | | | | | | | | | | |
| | | | | | | | | | | | | | | | | | | | | | | | | | | | | | | | | |
| Demands in litigation | | | | | | | | | | | 346 | | | | 732 | | | | 1,041 | | | | | | | | | | | | 2,118 | |
| | | | | | | | | | | | | | | | | | | | | | | | | | | | | | | | | |
| Demands in review by UBS | | | | | | | | | | | | | | | 2 | | | | 2 | | | | 3 | | | | | | | | 8 | |
| | | | | | | | | | | | | | | | | | | | | | | | | | | | | | | | | |
| Demands rebutted by UBS but not yet rescinded by counterparty | | | | | | | 1 | | | | 2 | | | | 1 | | | | 17 | | | | 515 | | | | 3 | | | | 540 | |
| | | | | | | | | | | | | | | | | | | | | | | | | | | | | | | | | |
| Total | | | 122 | | | | 205 | | | | 368 | | | | 1,084 | | | | 1,424 | | | | 618 | | | | 3 | | | | 3,825 | |
| | | | | | | | | | | | | | | | | | | | | | | | | | | | | | | | | |
1 Loans submitted by multiple counterparties are counted only once.
418
Note 22 Provisions and contingent liabilities (continued)
Payments that UBS has made or agreed to make to date to resolve repurchase demands equate to approximately 62% of the original principal balance of the related loans. Most of the payments that UBS has made or agreed to make to date have related to so-called “Option ARM” loans; severity rates may vary for other types of loans or for Option ARMs with different characteristics. Actual losses upon repurchase will reflect the estimated value of the loans in question at the time of repurchase as well as, in some cases, partial repayment by the borrowers or advances by servicers prior to repurchase. It is not possible to predict future losses upon repurchase for reasons including timing and market uncertainties.
In most instances in which we would be required to repurchase loans due to misrepresentations, we would be able to assert demands against third-party loan originators who provided representations when selling the related loans to UBS. However, many of these third parties are insolvent or no longer exist. We estimate that, of the total original principal balance of loans sold or securitized by UBS from 2004 through 2007, less than 50% was purchased from surviving third-party originators. In connection with approximately 60% of the loans (by original principal balance) for which UBS has made payment or agreed to make payment in response to demands received in 2010, UBS has asserted indemnity or repurchase demands against originators. Since 2011, UBS has advised certain surviving originators of repurchase demands made against UBS for which UBS would be entitled to indemnity, and has asserted that such demands should be resolved directly by the originator and the party making the demand.
We cannot reliably estimate the level of future repurchase demands, and do not know whether our rebuttals of such demands will be a good predictor of future rates of rebuttal. We also cannot reliably estimate the timing of any such demands.
Lawsuits related to contractual representations and warranties concerning mortgages and RMBS: In 2012, certain RMBS trusts filed an action in the Southern District of New York (Trustee Suit) seeking to enforce UBS RESI’s obligation to repurchase loans with an original principal balance of approximately USD 2 billion for which Assured Guaranty Municipal Corp. (Assured Guaranty), a financial guaranty insurance company, had previously demanded repurchase. The case is in discovery. Related litigation brought by Assured Guaranty was resolved in May 2013. With respect to the loans subject to the Trustee Suit that were originated by institutions still in existence, UBS intends to enforce its indemnity rights against those institutions. At this time, UBS does not expect that it will be required to make payment for the majority of loan repurchase demands at issue in the Trustee Suit for at least the following reasons: (1) we reviewed the origination file and/or servicing records for the loan and concluded that the allegations of breach of representations and warranties are unfounded, or (2) a surviving originator is contractually liable for any breaches of representations
and warranties with respect to loans that it originated. UBS has indemnification rights in connection with approximately half of the USD 2 billion in original principal balance of loans at issue in this suit (reflected in the “Demands in litigation” category in the table above).
In 2012, the FHFA, on behalf of Freddie Mac, filed a notice and summons in New York Supreme Court initiating suit against UBS RESI for breach of contract and declaratory relief arising from alleged breaches of representations and warranties in connection with certain mortgage loans and UBS RESI’s alleged failure to repurchase such mortgage loans. The complaint for this suit was filed in September 2012. The lawsuit seeks, among other relief, specific performance of UBS RESI’s alleged loan repurchase obligations for at least USD 94 million in original principal balance of loans for which Freddie Mac had previously demanded repurchase; no damages are specified. In June 2013, the Court dismissed the complaint for lack of standing, on the basis that only the RMBS trustee could assert the claims in the complaint, and the complaint was unclear as to whether the trustee was the plaintiff and had proper authority to bring suit. The trustee filed an amended complaint in June 2013, which UBS moved to dismiss in July 2013. The motion remains pending.
In December 2013, Residential Funding Company LLC (RFC) filed a complaint in New York Supreme Court against UBS RESI asserting claims for breach of contract and indemnification in connection with loans purchased from UBS RESI with an original principal balance of USD 460 million that were securitized by an RFC affiliate. This is the first case filed against UBS seeking damages allegedly arising from the securitization of whole loans purchased from UBS. Damages are unspecified.
We also have tolling agreements with certain institutional purchasers of RMBS concerning their potential claims related to substantial purchases of UBS-sponsored or third-party RMBS.
As reflected in the table below, our balance sheet at 31 December 2013 reflected a provision of USD 807 million with respect to matters described in this item 3. As in the case of other matters for which we have established provisions, the future outflow of resources in respect of this matter cannot be determined with certainty based on currently available information, and accordingly may ultimately prove to be substantially greater (or may be less) than the provision that we have recognized.
UBS has received requests from both the Special Inspector General for the Troubled Asset Relief Program (SIGTARP) (who is working in conjunction with the US Attorney’s Office for Connecticut and the US Department of Justice, Criminal Division, Fraud Section) and the SEC for information relating to its practices in connection with purchases and sales of mortgage-backed securities. We are cooperating with the authorities in these matters, which are in an early stage. Numerous other banks reportedly have received similar requests.
Financial information
Notes to the consolidated financial statements
Note 22 Provisions and contingent liabilities (continued)
| | | | | | | | |
|
| Provision for claims related to sales of residential mortgage-backed securities and mortgages | |
| | |
| USD million | | | 31.12.13 | | | | 31.12.12 | |
| Balance at the beginning of the year | | | 658 | | | | 104 | |
| | | | | | | | | |
| Increase in provision recognized in the income statement | | | 1,359 | | | | 554 | |
| | | | | | | | | |
| Release of provision recognized in the income statement | | | (1 | ) | | | 0 | |
| | | | | | | | | |
| Provision used in conformity with designated purpose | | | (1,208 | ) | | | 0 | |
| | | | | | | | | |
| Balance at the end of the year | | | 807 | | | | 658 | |
| | | | | | | | | |
4. Claims related to UBS disclosure
A putative consolidated class action has been filed in the United States District Court for the Southern District of New York against UBS, a number of current and former directors and senior officers and certain banks that underwrote UBS’s May 2008 Rights Offering (including UBS Securities LLC) alleging violation of the US securities laws in connection with UBS’s disclosures relating to UBS’s positions and losses in mortgage-related securities, UBS’s positions and losses in auction rate securities, and UBS’s US cross-border business. In 2011, the court dismissed all claims based on purchases or sales of UBS ordinary shares made outside the US, and, in 2012, the court dismissed with prejudice the remaining claims based on purchases or sales of UBS ordinary shares made in the US for failure to state a claim. Plaintiffs have appealed the court’s decision. UBS, a number of senior officers and employees and various UBS committees have also been sued in a putative consolidated class action for breach of fiduciary duties brought on behalf of current and former participants in two UBS Employee Retirement Income Security Act (ERISA) retirement plans in which there were purchases of UBS stock. In 2011, the court dismissed the ERISA complaint. In 2012, the court denied plaintiffs’ motion for leave to file an amended complaint. On appeal, the Second Circuit upheld the dismissal of all counts relating to one of the retirement plans. With respect to the second retirement plan, the Court upheld the dismissal of some of the counts, and vacated and remanded for further proceedings with regard to the counts alleging that defendants had violated their fiduciary duty to prudently manage the plan’s investment options, as well as the claims derivative of that duty.
In 2012, a consolidated complaint was filed in a putative securities fraud class action pending in federal court in Manhattan against UBS AG and certain of its current and former officers relating to the unauthorized trading incident that occurred in the Investment Bank and was announced in September 2011. The lawsuit was filed on behalf of parties who purchased publicly traded UBS securities on any US exchange, or where title passed within the US, during the period 17 November 2009 through 15 September 2011. In December 2013, the district court granted UBS’s motion to dismiss the complaint in its entirety. Plaintiffs have filed a notice of appeal.
5. Madoff
In relation to the Bernard L. Madoff Investment Securities LLC (BMIS) investment fraud, UBS AG, UBS (Luxembourg) SA and certain other UBS subsidiaries have been subject to inquiries by a number of regulators, including the Swiss Financial Market Supervisory Authority (FINMA) and the Luxembourg Commission de Surveillance du Secteur Financier (CSSF). Those inquiries concerned two third-party funds established under Luxembourg law, substantially all assets of which were with BMIS, as well as certain funds established in offshore jurisdictions with either direct or indirect exposure to BMIS. These funds now face severe losses, and the Luxembourg funds are in liquidation. The last reported net asset value of the two Luxembourg funds before revelation of the Madoff scheme was approximately USD 1.7 billion in the aggregate, although that figure likely includes fictitious profit reported by BMIS. The documentation establishing both funds identifies UBS entities in various roles including custodian, administrator, manager, distributor and promoter, and indicates that UBS employees serve as board members. UBS (Luxembourg) SA and certain other UBS subsidiaries are responding to inquiries by Luxembourg investigating authorities, without however being named as parties in those investigations. In 2009 and 2010, the liquidators of the two Luxembourg funds filed claims on behalf of the funds against UBS entities, non-UBS entities and certain individuals including current and former UBS employees. The amounts claimed are approximately EUR 890 million and EUR 305 million, respectively. The liquidators have filed supplementary claims for amounts that the funds may possibly be held liable to pay the BMIS Trustee. These amounts claimed by the liquidator are approximately EUR 564 million and EUR 370 million, respectively. In addition, a large number of alleged beneficiaries have filed claims against UBS entities (and non-UBS entities) for purported losses relating to the Madoff scheme. The majority of these cases are pending in Luxembourg, where appeals have been filed by the claimants against the 2010 decisions of the court in which the claims in a number of test cases were held to be inadmissible. In the US, the BMIS Trustee has filed claims against UBS entities, among others, in relation to the two Luxembourg funds and one of the offshore funds. A claim was filed in 2010 against 23 defendants, including UBS entities, the Luxembourg and offshore funds concerned and
420
Note 22 Provisions and contingent liabilities (continued)
various individuals, including current and former UBS employees. The total amount claimed against all defendants in this action was not less than USD 2 billion. A second claim was filed in 2010 against 16 defendants including UBS entities and the Luxembourg fund concerned. The total amount claimed against all defendants was not less than USD 555 million. Following a motion by UBS, in 2011, the District Court dismissed all of the BMIS Trustee’s claims other than claims for recovery of fraudulent conveyances and preference payments that were allegedly transferred to UBS on the ground that the BMIS Trustee lacks standing to bring such claims. In June 2013, the Second Circuit Court of Appeals rejected the BMIS Trustee’s appeal against that ruling and upheld the District Court’s decision. The BMIS Trustee has sought leave to appeal to the US Supreme Court, which has invited the Solicitor General of the United States to file a brief expressing the views of the United States as to whether review should be granted. In Germany, certain clients of UBS are exposed to Madoff-managed positions through third-party funds and funds administered by UBS entities in Germany. A small number of claims have been filed with respect to such funds.
6. Transactions with Italian public sector entities
A number of transactions that UBS Limited and UBS AG respectively entered into with public sector entity counterparties in Italy have been called into question or become the subject of legal proceedings and claims for damages and other awards. In Milan, in 2012, civil claims brought by the City of Milan against UBS Limited, UBS Italia SIM Spa and three other international banks in relation to a 2005 bond issue and associated derivatives transactions entered into with Milan between 2005 and 2007 were settled without admission of liability. In 2012, the criminal court in Milan issued a judgment convicting two current UBS employees and one former employee, together with employees from the three other banks, of fraud against a public entity in relation to the same bond issue and the execution, and subsequent restructuring, of the related derivative transactions. In the same proceedings, the Milan criminal court also found UBS Limited and three other banks liable for the administrative offense of failing to have in place a business organizational model capable of preventing the criminal offenses of which its employees were convicted. The sanctions against UBS Limited, which are not effective until appeals are exhausted, are confiscation of the alleged level of profit flowing from the criminal findings (EUR 16.6 million), a fine in respect of the finding of the administrative offense (EUR 1 million) and payment of legal fees. UBS has previously provided for this potential exposure in the amount of EUR 18.5 million. UBS Limited and the individuals appealed that judgment, and in March 2014, the Milan Court of Appeal handed down its judgment in short form. It overturned all findings of liability against UBS Limited and convictions of the UBS individuals and acquitted them, stating that the conduct did not occur. The court indicated that it would issue a full judgment within 90 days.
Derivative transactions with the Regions of Calabria, Tuscany, Lombardy, Lazio and Campania, and the City of Florence have also been called into question or become the subject of legal proceedings and claims for damages and other awards. In 2012, UBS AG and UBS Limited settled all civil disputes with the Regions of Tuscany, Lombardy and Lazio without any admission of
liability. In August 2013, a settlement of all civil and administrative disputes was reached with the City of Florence. Provisions were booked in respect of these settlements.
7. Kommunale Wasserwerke Leipzig GmbH (KWL)
In 2006 and 2007, KWL entered into a series of Credit Default Swap (CDS) transactions with bank swap counterparties, including UBS. UBS entered into back-to-back CDS transactions with the other counterparties, Depfa Bank plc (Depfa) and Landesbank BadenWürttemberg (LBBW), in relation to their respective swaps with KWL. As a result of the KWL CDS transactions and the back-to-back CDS transactions with Depfa and LBBW, UBS and UBS Limited are owed a total amount of approximately USD 319.8 million, plus interest, which remains unpaid. Specifically, under the CDS contracts between KWL and UBS, the last of which were terminated by UBS in 2010, a net sum of approximately USD 137.6 million, plus interest, has fallen due from KWL but not been paid. Earlier in 2010, UBS issued proceedings in the English High Court against KWL seeking various declarations from the English court, in order to establish that the swap transaction between KWL and UBS is valid, binding and enforceable as against KWL. The English court ruled in 2010 that it has jurisdiction and will hear the proceedings and UBS issued a further claim seeking declarations concerning the validity of its early termination of the remaining CDS transactions with KWL. KWL withdrew its appeal from that decision and the civil dispute is now proceeding before the English court. UBS has added its monetary claim to the proceedings. KWL is defending against UBS’s claims and has served a counterclaim which also joins UBS Limited and Depfa to the proceedings. As part of its assertions, KWL claims damages of at least USD 68 million in respect of UBS’s termination of some of the CDS contracts, whilst disputing that any monies are owed to UBS pursuant to another CDS contract. UBS, UBS Limited and Depfa are defending against KWL’s counterclaims, and Depfa has asserted additional claims against UBS and UBS Limited. Both KWL and Depfa make mutually exclusive claims for payment of USD 32.6 million which has previously been paid by Depfa to UBS Limited. The trial is due to start in April 2014.
In 2010, KWL issued proceedings in Leipzig, Germany against UBS, Depfa and LBBW, claiming that the swap transactions are void and not binding on the basis of KWL’s allegation that KWL did not have the capacity or the necessary internal authorization to enter into the transactions and that the banks knew this. Upon and as a consequence of KWL withdrawing its appeal on jurisdiction in England, KWL also withdrew its civil claims against UBS and Depfa in the German courts, and no civil claim will proceed against either of them in Germany. The proceedings brought by KWL against LBBW have continued in Leipzig, and in June 2013, the court in Leipzig ruled in LBBW’s favor. KWL has filed an appeal against that ruling. A hearing is fixed for late March 2014. The Leipzig court has also ruled that it is for the London court and not the Leipzig court to determine the validity and effect of a third party notice served by LBBW on UBS in the Leipzig proceedings.
Financial information
Notes to the consolidated financial statements
Note 22 Provisions and contingent liabilities (continued)
The back-to-back CDS transactions were terminated in 2010. In 2010, UBS and UBS Limited issued separate proceedings in the English High Court against Depfa and LBBW seeking declarations as to the parties’ obligations under the back-to-back CDS transactions and monetary claims. UBS Limited contends that it is owed USD 83.3 million, plus interest, by Depfa. UBS contends that it is owed EUR 75.5 million, plus interest, by LBBW. Depfa and LBBW are defending against the claims and have also issued counterclaims. Additionally Depfa added a claim against KWL to the proceedings against it and KWL served a defense.
In 2011, the former managing director of KWL and two financial advisers were convicted on criminal charges related to certain KWL transactions, including swap transactions with UBS and other banks. Following further criminal proceedings brought against them in Dresden relating to the same transactions, they were each convicted of embezzlement in December 2013 and given longer sentences. They have indicated that they will appeal.
Since 2011, the SEC has been conducting an investigation focused on, among other things, the suitability of the KWL transactions, and information provided by UBS to KWL. UBS has provided documents and testimony to the SEC and is continuing to cooperate with the SEC.
8. Puerto Rico
In 2011, a purported derivative action was filed on behalf of the Employee Retirement System of the Commonwealth of Puerto Rico (System) against over 40 defendants, including UBS Financial Services Inc. of Puerto Rico (UBS PR) and other consultants and underwriters, trustees of the System, and the President and Board of the Government Development Bank of Puerto Rico. The plaintiffs alleged that defendants violated their purported fiduciary duties and contractual obligations in connection with the issuance and underwriting of approximately USD 3 billion of bonds by the System in 2008 and sought damages of over USD 800 million. UBS is named in connection with its underwriting and consulting services. In March 2013, the case was dismissed by the Puerto Rico Court of First Instance on the grounds that plaintiffs did not have standing to bring the claim. That dismissal was overturned by the Puerto Rico Court of Appeals in September 2013. In February 2014, UBS’s petition for appeal was denied by the Supreme Court of Puerto Rico, and UBS is filing motions for reconsideration. Also, in October 2013, an SEC Administrative Law Judge dismissed a case brought by the SEC against two UBS executives following a hearing that took place in late 2012, finding no violations. The charges had stemmed from the SEC’s investigation of UBS’s sale of closed-end funds in 2008 and 2009, which UBS settled in May 2012. Additionally, declines in Puerto Rico municipal bond and closed-end fund prices since August 2013 have led to multiple regulatory inquiries, customer complaints and arbitrations filed by clients in Puerto Rico who own those securities. A shareholder derivative action also was filed in February 2014 against various UBS entities and current and certain former directors of the closed-end funds, alleging hundreds of millions in losses in the
funds. An internal review also disclosed that certain clients, many of whom acted at the recommendation of one financial advisor, invested proceeds of non-purpose loans in closed-end fund securities in contravention of their loan agreements.
Our balance sheet at 31 December 2013 reflected a provision with respect to the matters described in this item 8 in an amount that UBS believes to be appropriate under the applicable accounting standards. As in the case of other matters for which we have established provisions, the future outflow of resources in respect of such matters cannot be determined with certainty based on currently available information, and accordingly may prove to be substantially greater (or may be less) than the provision that we have recognized.
9. LIBOR, foreign exchange, and benchmark rates
LIBOR and other benchmark-related regulatory matters: Numerous government agencies, including the SEC, the US Commodity Futures Trading Commission (CFTC), the US Department of Justice (DOJ), the UK Financial Conduct Authority (FCA) (to which certain responsibilities of the UK Financial Services Authority (FSA) have passed), the UK Serious Fraud Office (SFO), the Monetary Authority of Singapore (MAS), the Hong Kong Monetary Authority (HKMA), FINMA, the various state attorneys general in the US, and competition authorities in various jurisdictions have conducted or are continuing to conduct investigations regarding submissions with respect to British Bankers’ Association LIBOR (London Interbank Offered Rate) and other benchmark rates, including HIBOR (Hong Kong Interbank Offered Rate) and ISDAFIX. These investigations focus on whether there were improper attempts by UBS (among others), either acting on our own or together with others, to manipulate LIBOR and other benchmark rates at certain times.
In 2012, UBS reached settlements with the FSA, the CFTC and the Criminal Division of the DOJ in connection with their investigations of benchmark interest rates. At the same time FINMA issued an order concluding its formal proceedings with respect to UBS relating to benchmark interest rates. UBS has paid a total of approximately CHF 1.4 billion in fines and disgorgement – including GBP 160 million in fines to the FSA, USD 700 million in fines to the CFTC, and CHF 59 million in disgorgement to FINMA. Under a non-prosecution agreement (NPA) that UBS entered into with the DOJ, UBS agreed to pay a fine of USD 500 million. Pursuant to a separate plea agreement between the DOJ and UBS Securities Japan Co. Ltd. (UBSSJ), UBSSJ entered a plea to one count of wire fraud relating to the manipulation of certain benchmark interest rates, including Yen LIBOR. The NPA required UBS to pay the USD 500 million fine to DOJ after the sentencing of UBSSJ, and provides that any criminal penalties imposed on UBSSJ at sentencing be deducted from the USD 500 million fine. At the sentencing hearing held in September 2013, the court approved the proposed plea agreement and imposed a USD 100 million fine against UBSSJ, as agreed to by the DOJ and UBSSJ under the plea agreement. Since the sentencing, UBS has paid a fine of USD 400 million to the DOJ, and UBSSJ has paid the USD 100 million fine imposed by the sentencing court. The conduct
422
Note 22 Provisions and contingent liabilities (continued)
described in the various settlements and the FINMA order includes certain UBS personnel: engaging in efforts to manipulate submissions for certain benchmark rates to benefit trading positions; colluding with employees at other banks and cash brokers to influence certain benchmark rates to benefit their trading positions; and giving inappropriate directions to UBS submitters that were in part motivated by a desire to avoid unfair and negative market and media perceptions during the financial crisis. The benchmark interest rates encompassed by one or more of these resolutions include Yen LIBOR, GBP LIBOR, CHF LIBOR, Euro LIBOR, USD LIBOR, EURIBOR (Euro Interbank Offered Rate) and Euroyen TIBOR (Tokyo Interbank Offered Rate). We have ongoing obligations to cooperate with authorities with which we have reached resolutions and to undertake certain remediation with respect to benchmark interest rate submissions. Investigations by the CFTC and other government authorities remain ongoing notwithstanding these resolutions.
UBS has been granted conditional leniency or conditional immunity from authorities in certain jurisdictions, including the Antitrust Division of the DOJ, and the Swiss Competition Commission (WEKO), in connection with potential antitrust or competition law violations related to submissions for Yen LIBOR and Euroyen TIBOR. WEKO has also granted UBS conditional immunity in connection with potential competition law violations related to submissions for Swiss franc LIBOR and certain transactions related to Swiss franc LIBOR. The Canadian Competition Bureau (Bureau) had granted UBS conditional immunity in connection with potential competition law violations related to submissions for Yen LIBOR, but in January 2014, the Bureau announced the discontinuation of its investigation into Yen LIBOR for lack of sufficient evidence to justify prosecution under applicable laws. As a result of these conditional grants, we will not be subject to prosecutions, fines or other sanctions for antitrust or competition law violations in the jurisdictions where we have conditional immunity or leniency in connection with the matters covered by the conditional grants, subject to our continuing cooperation. However, the conditional leniency and conditional immunity grants we have received do not bar government agencies from asserting other claims and imposing sanctions against us, as evidenced by the settlements and ongoing investigations referred to above. In addition, as a result of the conditional leniency agreement with the DOJ, we are eligible for a limit on liability to actual rather than treble damages were damages to be awarded in any civil antitrust action under US law based on conduct covered by the agreement and for relief from potential joint and several liability in connection with such civil antitrust action, subject to our satisfying the DOJ and the court presiding over the civil litigation of our cooperation. The conditional leniency and conditional immunity grants do not otherwise affect the ability of private parties to assert civil claims against us.
In December 2013, the European Commission (EC) announced a decision adopted in the Commission’s Yen Interest Rate Derivatives (YIRD) investigation, under which UBS has received full immunity from fines for disclosing to the Commission the existence of infringements relating to YIRD.
In June 2013, the MAS announced the results of its investigation of benchmark submissions by 20 banks, including UBS. The investigation related to various benchmark submissions, including the Singapore Interbank Offered Rates and the Swap Offered Rates, and covered the period from 2007 to 2011. The MAS found deficiencies in the governance, risk management, internal controls and surveillance systems for the banks’ benchmark submission processes and directed the banks to correct the deficiencies and set aside additional statutory reserves with MAS at zero interest for one year. The MAS also announced proposed changes to its regulatory framework for financial benchmarks that are designed to enhance the integrity of the process for setting benchmarks.
In December 2013, UBS entered into an enforceable undertaking in relation to an investigation by the Australian Securities and Investments Commission (ASIC) into conduct relating to Australian Bank Bill Swap Rate (BBSW) submissions. An independent expert engaged by UBS at ASIC’s request concluded that, to the extent there may have been any impact of such conduct on the market as a whole, it would have been insignificant. The enforceable undertaking requires UBS to ensure that its participation in relation to the setting of Australian interest rate benchmarks upholds the integrity and reliability of those benchmarks and is in accordance with its obligations under the CFTC order. UBS also agreed to make a voluntary contribution of AUD 1 million to fund independent financial literacy projects in Australia. ASIC has the power to investigate, conduct further surveillance or pursue criminal prosecution of UBS or its representatives in relation to any contravention. ASIC acknowledged UBS’s cooperation and the fact that it was the first bank to report this conduct to it. ASIC’s inquiries in relation to the BBSW rate set are ongoing.
In 2011, the Japan Financial Services Agency (JFSA) commenced administrative actions and issued orders against UBS Securities Japan Ltd (UBS Securities Japan) and UBS AG, Tokyo Branch in connection with their investigation of Yen LIBOR and Euroyen TIBOR. These actions were based on findings by the Japan Securities and Exchange Surveillance Commission (SESC), and, in the case of UBS AG, Tokyo Branch, the JFSA, that a former UBS Securities Japan trader engaged in inappropriate conduct relating to Euroyen TIBOR and Yen LIBOR, including approaching UBS AG, Tokyo Branch, and other banks to ask them to submit TIBOR rates taking into account requests from the trader for the purpose of benefiting trading positions.
LIBOR and other benchmark-related civil litigation: A number of putative class actions and other actions are pending in the federal courts in New York against UBS and numerous other banks on behalf of parties who transacted in certain interest rate benchmark-based derivatives linked directly or indirectly to US dollar LIBOR, Yen LIBOR, Euroyen TIBOR and EURIBOR. Also pending are actions asserting losses related to various products whose interest rate was linked to US dollar LIBOR, including adjustable rate mortgages, preferred and debt securities, bonds pledged as collateral, loans, depository accounts, investments and other interest bearing instruments. All of the complaints allege
Financial information
Notes to the consolidated financial statements
Note 22 Provisions and contingent liabilities (continued)
manipulation, through various means, of various benchmark interest rates, including LIBOR, Euroyen TIBOR or EURIBOR rates and seek unspecified compensatory and other damages, including treble and punitive damages, under varying legal theories that include violations of the US Commodity Exchange Act, the federal racketeering statute, federal and state antitrust and securities laws and other state laws. In March 2013, a federal court in New York dismissed the federal antitrust and racketeering claims of certain US dollar LIBOR plaintiffs and a portion of their claims brought under the Commodity Exchange Act (CEA) and state common law. In August 2013, the same court denied the parties’ requests for reconsideration and plaintiffs’ motion for interlocutory appeal and to amend the complaints to include additional antitrust and Commodity Exchange Act allegations. It granted certain plaintiffs permission to assert claims for unjust enrichment and breach of contract. Motions to dismiss these unjust enrichment and breach of contract claims are pending, as is a renewed motion to dismiss by UBS and other defendants that seeks dismissal of further CEA claims. Certain plaintiffs have also appealed the dismissal of their antitrust claims, but in October 2013 the appellate court denied these appeals as premature, without prejudice to bringing the appeals again after final disposition of the LIBOR actions. UBS and other defendants in other lawsuits including the one related to Euroyen TIBOR have filed motions to dismiss.
With respect to additional matters and jurisdictions not encompassed by the settlements and order referred to above, our balance sheet at 31 December 2013 reflected a provision of an amount that UBS believes to be appropriate under the applicable accounting standard. As in the case of other matters for which we have established provisions, the future outflow of resources in respect of such matters cannot be determined with certainty based on currently available information, and accordingly may ultimately prove to be substantially greater (or may be less) than the provision that we have recognized.
Foreign exchange-related regulatory matters: Following an initial media report in June 2013 of widespread irregularities in the foreign exchange markets, UBS immediately commenced an internal review of its foreign exchange business, which includes our precious metals business. Since then, various authorities reportedly have commenced investigations concerning possible manipulation of foreign exchange markets, including FINMA, WEKO, the DOJ, the CFTC, and the FCA. UBS and other financial institutions have received requests from various authorities relating to their foreign exchange businesses, and UBS is cooperating with the authorities. A number of authorities also are reportedly investigating potential manipulation of precious metal prices. UBS has taken and will take appropriate action with respect to certain personnel as a result of its ongoing review.
Foreign exchange-related civil litigation: Several putative class actions have been filed since November 2013 in US federal court against UBS and other banks. These actions are on behalf of putative classes of persons who engaged in foreign currency transactions with the defendants. They allege collusion by the defendants and assert claims under the antitrust laws
and for unjust enrichment. The defendants (including UBS) have not yet filed responsive pleadings.
10. Swiss retrocessions
The Swiss Supreme Court ruled in 2012, in a test case against UBS, that distribution fees paid to a bank for distributing third party and intra-group investment funds and structured products must be disclosed and surrendered to clients who have entered into a discretionary mandate agreement with the bank, absent a valid waiver.
FINMA has issued a supervisory note to all Swiss banks in response to the Supreme Court decision. The note sets forth the measures Swiss banks are to adopt, which include informing all affected clients about the Supreme Court decision and directing them to an internal bank contact for further details. UBS has met the FINMA requirements and has notified all potentially affected clients.
It is expected that the Supreme Court decision will result in a significant number of client requests for UBS to disclose and potentially surrender retrocessions. Client requests are being assessed on a case-by-case basis. Considerations to be taken into account when assessing these cases include, among others, the existence of a discretionary mandate and whether or not the client documentation contained a valid waiver with respect to distribution fees.
Our balance sheet at 31 December 2013 reflected a provision with respect to matters described in this item 10 in an amount that UBS believes to be appropriate under the applicable accounting standard. The ultimate exposure will depend on client requests and the resolution thereof, factors that are difficult to predict and assess. Hence as in the case of other matters for which we have established provisions, the future outflow of resources in respect of such matters cannot be determined with certainty based on currently available information, and accordingly may ultimately prove to be substantially greater (or may be less) than the provision that we have recognized.
11. Banco UBS Pactual tax indemnity
Pursuant to the 2009 sale of Banco UBS Pactual S.A. (Pactual) by UBS to BTG Investments, LP (BTG), BTG has submitted contractual indemnification claims that UBS estimates amount to approximately BRL 2.5 billion, including interest and penalties, which is net of liabilities retained by BTG. The claims pertain principally to several tax assessments issued by the Brazilian tax authorities against Pactual relating to the period from December 2006 through March 2009, when UBS owned Pactual. These assessments are being or will be challenged in administrative proceedings. BTG has also provided notice to UBS of several additional Pactual-related inquiries by the Brazilian tax authorities that relate to the period of UBS’s ownership of Pactual, but involving substantially smaller amounts. In November and December 2013,
Note 22 Provisions and contingent liabilities (continued)
approximately BRL 128 million in tax claims relating to the period for which UBS has indemnification obligations were submitted for settlement through amnesty programs announced by the Brazilian government in October 2013.
Our balance sheet at 31 December 2013 reflected a provision with respect to matters described in this item 11 in an amount that UBS believes to be appropriate under the applicable accounting standard. As in the case of other matters for which we have established provisions, the future outflow of resources in respect of this matter cannot be determined with certainty based on currently available information, and accordingly may ultimately prove to be substantially greater (or may be less) than the provision that we have recognized.
12. Matters relating to the CDS market
In July 2013 the EC issued a Statement of Objections against thirteen credit default swap (CDS) dealers including UBS, as well as data service provider Markit and the International Swaps and Derivatives Association (ISDA). The Statement of Objections broadly alleges that the dealers infringed EU antitrust rules by colluding
to prevent exchanges from entering the credit derivatives market between 2006 and 2009. We have submitted our response to the Statement of Objections. Since mid-2009, the Antitrust Division of the DOJ has also been investigating whether multiple dealers, including UBS, conspired with each other and with Markit to restrain competition in the markets for CDS trading, clearing and other services. Between May 2013 and November 2013, several putative class action complaints were filed against twelve dealers, including UBS, as well as Markit and ISDA, alleging violations of the US Sherman Antitrust Act. In January 2014, after the cases were consolidated for pretrial purposes in the Southern District of New York, plaintiffs filed a consolidated amended complaint. Plaintiffs allege that the defendants, Markit and ISDA unlawfully conspired to restrain competition in and/or monopolize the market for CDS trading in the US in order to protect the dealers’ profits from trading CDS in the over-the-counter market. Plaintiffs assert claims under the Sherman Act and common law on behalf of all purchasers and sellers of CDS that transacted directly with any of the dealer defendants since January 1, 2008, and seek unspecified trebled compensatory damages and other relief.
Note 23 Other liabilities1
| | | | | | | | |
| | | | | | | | | |
| CHF million | | 31.12.13 | | | 31.12.12 | |
| Prime brokerage payables2 | | | 32,543 | | | | 35,620 | |
| | | | | | | | | |
| Amounts due under unit-linked investment contracts | | | 16,155 | | | | 15,299 | |
| | | | | | | | | |
| Accrued expenses – compensation related | | | 2,631 | | | | 2,043 | |
| | | | | | | | | |
| Accrued expenses – interest expense | | | 1,199 | | | | 1,955 | |
| | | | | | | | | |
| Accrued expenses – other | | | 2,465 | | | | 2,628 | |
| | | | | | | | | |
| Deferred compensation plans | | | 1,919 | | | | 1,541 | |
| | | | | | | | | |
| Net defined benefit pension and post-employment liabilities3 | | | 1,048 | | | | 1,284 | |
| | | | | | | | | |
| Third-party interest in consolidated investment funds | | | 953 | | | | 965 | |
| | | | | | | | | |
| Settlement and clearing accounts | | | 946 | | | | 991 | |
| | | | | | | | | |
| Current and deferred tax liabilities4 | | | 667 | | | | 586 | |
| | | | | | | | | |
| VAT and other tax payables | | | 570 | | | | 606 | |
| | | | | | | | | |
| Deferred income | | | 264 | | | | 291 | |
| | | | | | | | | |
| Other | | | 1,417 | | | | 2,713 | |
| | | | | | | | | |
| Total other liabilities | | | 62,777 | | | | 66,523 | |
| | | | | | | | | |
1 In 2013, changes in the presentation of this Note were made. Accrued expenses and deferred income are no longer presented as a separate line item on the balance sheet but under Other liabilities. Accrued expenses – compensation related, Accrued expenses – interest expense, Accrued expenses – other and Deferred income, which were previously disclosed under Accrued expenses and deferred income, are now presented separately in this Note in order to enhance transparency. Prior periods have been restated. As a result, Other liabilities as of 31 December 2012 increased by CHF 6,917 million. Refer to “Note 1b Changes in accounting policies, comparability and other adjustments” for more information. 2 Prime brokerage services include clearance, settlement, custody, financing and portfolio reporting services for corporate clients trading across multiple asset classes. The balance is mainly comprised of client securities financing and deposit liabilities. 3 Refer to “Note 28 Pension and other post-employment benefit plans” for more information. 4 Deferred tax liabilities were CHF 59 million and CHF 52 million for 31 December 2013 and 31 December 2012, respectively. Refer to “Note 8 Income taxes” for more information.
Financial information
Notes to the consolidated financial statements
Additional information
Note 24 Fair value measurement
This note provides fair value measurement information for both financial and non-financial instruments and is structured as follows:
| e) | Fair value measurements and classification within the fair value hierarchy |
| f) | Transfers between Level 1 and Level 2 in the fair value hierarchy |
| g) | Movements of Level 3 instruments |
| h) | Valuation of assets and liabilities classified as Level 3 |
| i) | Sensitivity of fair value measurements to changes in unobservable input assumptions |
| j) | Deferred day-1 profit or loss |
| k) | Financial instruments not measured at fair value |
a) Valuation principles
Fair value is defined as the price that would be received for the sale of an asset or paid to transfer a liability in an orderly transaction between market participants in the principal or most advantageous market as of the measurement date. In measuring fair value, the Group utilizes various valuation approaches and applies a hierarchy for prices and inputs that maximizes the use of observable market data, if available.
All financial and non-financial assets and liabilities measured or disclosed at fair value are categorized into one of three fair value hierarchy levels. In certain cases, the inputs used to measure fair value may fall within different levels of the fair value hierarchy. For disclosure purposes, the level in the hierarchy within which the instrument is classified in its entirety is based on the lowest level input that is significant to the position’s fair value measurement:
| – | | Level 1 – quoted prices (unadjusted) in active markets for identical assets and liabilities; |
| – | | Level 2 – valuation techniques for which all significant inputs are, or are based on, observable market data or |
| – | | Level 3 – valuation techniques for which significant inputs are not based on observable market data |
If available, fair values are determined using quoted prices in active markets for identical assets or liabilities. An active market is one in which transactions for the asset or liability take place with sufficient frequency and volume to provide pricing data on an ongoing basis. Assets and liabilities that are quoted and traded in an active market are valued at the currently quoted price multiplied by the number of units of the instrument held.
Where the market for a financial instrument or non-financial asset or liability is not active, fair value is established using a valuation technique, including pricing models. Valuation techniques involve the use of estimates, the extent of which depends on the complexity
of the instrument and the availability of market-based data. Valuation adjustments may be made to allow for additional factors including model, liquidity and credit risks, which are not explicitly captured within the valuation technique, but which would nevertheless be considered by market participants when forming a price. The limitations inherent in a particular valuation technique are considered in the determination of an asset or liability’s classification within the fair value hierarchy.
Many cash instruments and over-the-counter (OTC) derivative contracts have bid and offer prices that can be observed in the marketplace. Bid prices reflect the highest price that a party is willing to pay for an asset. Offer prices represent the lowest price that a party is willing to accept for an asset. In general, long positions are measured at a bid price and short positions at an offer price, reflecting the prices at which the instruments could be transferred under normal market conditions. Offsetting positions in the same financial instrument are marked at the mid-price within the bid-offer spread.
Generally, the unit of account for a financial instrument is the individual instrument, and UBS applies valuation adjustments at an individual instrument level, consistent with that unit of account. However, if certain conditions are met, UBS may estimate the fair value of a portfolio of financial assets and liabilities with substantially similar and offsetting risk exposures on the basis of the net open risks.
For transactions where the valuation technique used to measure fair value requires significant inputs that are not based on observable market data, the financial instrument is initially recognized at the transaction price. This initial recognition amount may differ from the fair value obtained using the valuation technique. Any such difference is deferred and not recognized in the income statement and referred to as deferred day-1 profit or loss. Refer to “Note 24j Deferred day-1 profit or loss” for more information.
426
Note 24 Fair value measurement (continued)
b) Valuation governance
UBS’s fair value measurement and model governance framework includes numerous controls and other procedural safeguards that are intended to maximize the quality of fair value measurements reported in the financial statements. New products and valuation techniques must be reviewed and approved by key stakeholders from risk and finance control functions. Responsibility for the ongoing measurement of financial and non-financial instruments at fair value resides with the business divisions, but is validated by risk and finance control functions, which are independent of the business divisions. In carrying out their valuation responsibilities, the businesses are required to consider the availability and quality of external market data and to provide justification and rationale for their fair value estimates.
Independent price verification is performed by the finance function to evaluate the business divisions’ pricing input assumptions and modeling approaches. By benchmarking the business’s fair value estimates with
observable market prices and other independent sources, the degree of valuation uncertainty embedded in these measurements is assessed and managed as required in the governance framework. Fair value measurement models are assessed for their ability to value specific products in the principal market of the product itself, as well as the principal market for the main valuation input parameters to the model.
An independent model review group evaluates UBS’s valuation models on a regular basis, or when established triggers occur, and approves them for valuation of specific products. As a result of the valuation controls employed, valuation adjustments may be made to the business’s estimate of fair value to align with independent market data and accounting standards (refer to “Note 24d Valuation adjustments” for more information).
c) Valuation techniques
Valuation techniques are used to value positions for which a market price is not available from market sources. This includes certain less liquid debt and equity instruments and all derivatives transacted in the OTC market. UBS uses widely recognized valuation techniques for determining the fair value of financial and non-financial instruments that are not actively traded and quoted. The most frequently applied valuation techniques include discounted value of expected cash flows, relative value and option pricing methodologies.
Discounted value of expected cash flows is a valuation technique that measures fair value using estimated expected future cash flows from assets or liabilities and then discounts these cash flows using a discount rate or discount margin that reflects the credit and/or funding spreads required by the market for instruments with similar risk and liquidity profiles to produce a present value. When using such valuation techniques, expected future cash flows are estimated using an observed or implied market price for the future cash flows or by using industry standard cash flow projection models. The discount factors within the calculation are generated using industry standard yield curve modeling techniques and models.
Relative value models measure fair value based on the market prices of equivalent or comparable assets or liabilities, making adjustments for differences between the characteristics of the observed instrument and the instrument being valued.
Option pricing models incorporate assumptions regarding the behavior of future price movements of an underlying referenced asset or assets to generate a probability-weighted future expected payoff for the option. The resulting probability-weighted expected payoff is then discounted using discount factors generated from industry standard yield curve modeling techniques and models.
The option pricing model may be implemented using a closed-form analytical formula or other mathematical techniques (e.g., binomial tree or Monte Carlo simulation).
Where available, valuation techniques use market-observable assumptions and inputs. If such data is not available, inputs may be derived by reference to similar assets in active markets, from recent prices for comparable transactions or from other observable market data. When measuring fair value, UBS selects the non-market-observable inputs to be used in its valuation techniques, based on a combination of historical experience, derivation of input levels based on similar products with observable price levels and knowledge of current market conditions and valuation approaches.
For more complex instruments and instruments not traded in an active market, fair values may be estimated using a combination of observed transaction prices, consensus pricing services and relevant quotes. Consideration is given to the nature of the quotes (e.g., indicative or firm) and the relationship of recently evidenced market activity to the prices provided by consensus pricing services. UBS also uses internally developed models, which are typically based on valuation methods and techniques recognized as standard within the industry.
Assumptions and inputs used in valuation techniques include benchmark interest rate curves, credit and funding spreads used in estimating discount rates, bond and equity prices, equity index prices, foreign exchange rates, levels of market volatility and correlation (refer to “Note 24h Valuation of assets and liabilities classified as Level 3”). The discount curves used by the Group incorporate the funding and credit characteristics of the instruments to which they are applied.
Financial information
Notes to the consolidated financial statements
Note 24 Fair value measurement (continued)
d) Valuation adjustments
The output of a valuation technique is always an estimate or approximation of a fair value that cannot be measured with complete certainty. As a result, valuations are adjusted, where appropriate, to reflect close-out costs, credit exposure, model-driven-valuation uncertainty, trading restrictions and other factors, when such factors would be considered by market participants in measuring fair value. Valuation adjustments are an important component of fair value for assets and liabilities that are measured using valuation techniques. Such adjustments are applied to reflect uncertainties within the fair value measurement process, to adjust for an identified model simplification or to incorporate an aspect of fair value that requires an overall portfolio assessment rather than an evaluation based on an individual instrument level characteristic.
The major classes of valuation adjustments are discussed in further detail below.
Reflection of market bid-offer levels
Instruments that are measured as part of a portfolio of combined long and short positions are valued at mid-market levels to ensure consistent valuation of the long and short component risks. A valuation adjustment is then made to the overall net long or short exposure to move the fair value to bid or offer as appropriate, reflecting current levels of market liquidity. The bid-offer spreads used in the calculation of the valuation adjustment are obtained from market transactions and other relevant sources and are updated periodically.
Reflection of model uncertainty
Uncertainties associated with the use of model-based valuations are incorporated into the measurement of fair value through the use of model reserves. These reserves reflect the amounts that the Group estimates should be deducted from valuations produced directly by models to incorporate uncertainties in the relevant modeling assumptions, in the model and market inputs used, or in the calibration of the model output to adjust for known model deficiencies. In arriving at these estimates, the Group considers a range of market practices, including how it believes market participants would assess these
uncertainties. Model reserves are reassessed periodically in light of data from market transactions, consensus pricing services and other relevant sources.
Day-1 reserves
Day-1 profit or loss reserves are reflected, where appropriate, as valuation adjustments. Refer to “Note 24j Deferred day-1 profit or loss” for more information.
Counterparty credit risk in the valuation of derivatives
In order to measure fair value, credit valuation adjustments (CVA) are necessary to reflect the credit risk of the counterparty inherent in OTC derivative instruments. This amount represents the estimated fair value of protection required to hedge the counterparty credit risk of such instruments. The CVA is determined for each counterparty considering all exposures to that counterparty and is dependent on the expected future value of exposures, default probabilities and recovery rates, applicable collateral or netting arrangements, break clauses and other contractual factors.
Own credit risk in the valuations of OTC derivative instruments
The Group estimates debit valuation adjustments (DVA) to incorporate own credit in the valuation of derivatives, effectively consistent with the CVA methodology. DVA represents the theoretical cost to counterparties of hedging, or the credit risk reserve that a counterparty could reasonably be expected to hold, against their credit risk exposure to UBS. DVA is determined for each counterparty considering all exposures with that counterparty and taking into account collateral netting agreements, expected future mark-to-market movements and UBS’s credit default spreads.
| | | | | | | | |
CVA and DVA for derivative financial instruments | |
| CHF billion | | 31.12.13 | | | 31.12.12 | |
| DVA | | | | | | | | |
| | | | | | | | | |
| Gain/(loss) for the year ended | | | (0.1 | ) | | | (0.4 | ) |
| | | | | | | | | |
| Life-to-date gain/(loss) | | | 0.3 | | | | 0.4 | |
| | | | | | | | | |
| CVA1 | | | | | | | | |
| | | | | | | | | |
| Gain/(loss) for the year ended2 | | | 0.4 | | | | 1.1 | |
| | | | | | | | | |
of which: Monoline credit protection | | | 0.2 | | | | 0.3 | |
| | | | | | | | | |
of which: Other instruments | | | 0.2 | | | | 0.8 | |
| | | | | | | | | |
| Life-to-date gain/(loss) | | | (0.5 | ) | | | (0.9 | ) |
| | | | | | | | | |
of which: Monoline credit protection | | | (0.1 | ) | | | (0.4 | ) |
| | | | | | | | | |
of which: Other instruments | | | (0.4 | ) | | | (0.6 | ) |
| | | | | | | | | |
1 Amounts do not include reserves against defaulted counterparties.2 Amounts do not include commutations.
428
Note 24 Fair value measurement (continued)
UBS’s own credit risk in the valuations of financial liabilities designated at fair value
In addition to considering the valuation of the derivative risk component, the valuation of fair value option liabilities also requires consideration of the funded component and specifically the own credit component of fair value. Own credit risk is reflected if this component would be considered for valuation purposes by market participants. Consequently, own credit risk is not reflected for those contracts that are fully collateralized and for other contracts for which it is established market practice not to include an own credit component. The own credit component is estimated using a funds transfer price (FTP) curve to derive a single, market-based level of discounting for uncollateralized funded instruments. UBS senior debt curve spreads are discounted in order to arrive at the FTP curve, with the discount primarily reflecting the differences between the spreads in the senior unsecured debt market for UBS
debt and the levels at which UBS MTN are currently issued. The FTP curve is generally a Level 2 pricing input. However, certain long-dated exposures that are beyond the tenors that are actively traded are classified as Level 3.
The effects of own credit adjustments related to financial liabilities designated at fair value (predominantly issued structured products) as of 31 December 2013 and 2012, respectively, are summarized in the table below.
Year-to-date amounts represent the change during the year, and life-to-date amounts reflect the cumulative change since initial recognition. The change in own credit for the period consists of changes in fair value that are attributable to the change in UBS’s credit spreads as well as the effect of changes in fair values attributable to factors other than credit spreads, such as redemptions, effects from time decay and changes in interest and other market rates.
Own credit on financial liabilities designated at fair value
| | | | | | | | | | | | |
| | As of or for the year ended | |
| CHF million | | 31.12.13 | | | 31.12.12 | | | 31.12.11 | |
| Gain/(loss) for the year ended | | | (283 | ) | | | (2,202 | ) | | | 1,537 | |
| | | | | | | | | | | | | |
| Life-to-date gain/(loss) | | | (577 | ) | | | (292 | ) | | | 1,934 | |
| | | | | | | | | | | | | |
Financial information
Notes to the consolidated financial statements
Note 24 Fair value measurement (continued)
e) Fair value measurements and classification within the fair value hierarchy
The classification in the fair value hierarchy of the Group’s financial and non-financial assets and liabilities measured at fair value is summarized in the table below. The narrative that follows describes the significant valuation inputs and assumptions for each
class of assets and liabilities measured at fair value, the valuation techniques, where applicable, used in measuring their fair value, and the factors determining their classification within the fair value hierarchy.
Determination of fair values from quoted market prices or valuation techniques1
| | | | | | | | | | | | | | | | | | | | | | | | | | | | | | | | |
| | 31.12.13 | | | 31.12.12 | |
| CHF billion | | Level 1 | | | Level 2 | | | Level 3 | | | Total | | | Level 1 | | | Level 2 | | | Level 3 | | | Total | |
| Assets measured at fair value on a recurring basis | | | | | | | | | | | | | | | | | | | | | | | | | | | | | | | | |
| | | | | | | | | | | | | | | | | | | | | | | | | | | | | | | | | |
| Financial assets held for trading2 | | | 79.9 | | | | 30.1 | | | | 4.3 | | | | 114.2 | | | | 91.4 | | | | 46.4 | | | | 5.7 | | | | 143.5 | |
| | | | | | | | | | | | | | | | | | | | | | | | | | | | | | | | | |
of which: | | | | | | | | | | | | | | | | | | | | | | | | | | | | | | | | |
| | | | | | | | | | | | | | | | | | | | | | | | | | | | | | | | | |
Government bills/bonds | | | 7.9 | | | | 5.1 | | | | 0.0 | | | | 13.1 | | | | 22.2 | | | | 6.4 | | | | 0.1 | | | | 28.7 | |
| | | | | | | | | | | | | | | | | | | | | | | | | | | | | | | | | |
Corporate bonds and municipal bonds, including bonds issued by financial institutions | | | 1.1 | | | | 13.3 | | | | 1.7 | | | | 16.0 | | | | 0.8 | | | | 21.4 | | | | 1.6 | | | | 23.9 | |
| | | | | | | | | | | | | | | | | | | | | | | | | | | | | | | | | |
Loans | | | 0.0 | | | | 2.0 | | | | 1.0 | | | | 3.0 | | | | 0.0 | | | | 4.1 | | | | 2.0 | | | | 6.1 | |
| | | | | | | | | | | | | | | | | | | | | | | | | | | | | | | | | |
Investment fund units | | | 4.8 | | | | 6.0 | | | | 0.3 | | | | 11.1 | | | | 2.6 | | | | 10.2 | | | | 0.1 | | | | 12.9 | |
| | | | | | | | | | | | | | | | | | | | | | | | | | | | | | | | | |
Asset-backed securities | | | 0.0 | | | | 2.3 | | | | 1.0 | | | | 3.3 | | | | 3.6 | | | | 3.4 | | | | 1.5 | | | | 8.6 | |
| | | | | | | | | | | | | | | | | | | | | | | | | | | | | | | | | |
Equity instruments | | | 50.7 | | | | 1.0 | | | | 0.2 | | | | 51.9 | | | | 47.6 | | | | 0.3 | | | | 0.1 | | | | 48.0 | |
| | | | | | | | | | | | | | | | | | | | | | | | | | | | | | | | | |
Financial assets for unit-linked investment contracts | | | 15.4 | | | | 0.4 | | | | 0.1 | | | | 15.8 | | | | 14.5 | | | | 0.4 | | | | 0.3 | | | | 15.2 | |
| | | | | | | | | | | | | | | | | | | | | | | | | | | | | | | | | |
| Positive replacement values | | | 3.0 | | | | 237.4 | | | | 5.5 | | | | 245.8 | | | | 2.9 | | | | 408.0 | | | | 8.1 | | | | 419.0 | |
| | | | | | | | | | | | | | | | | | | | | | | | | | | | | | | | | |
of which: | | | | | | | | | | | | | | | | | | | | | | | | | | | | | | | | |
| | | | | | | | | | | | | | | | | | | | | | | | | | | | | | | | | |
Interest rate contracts | | | 0.0 | | | | 129.4 | | | | 0.3 | | | | 129.8 | | | | 0.0 | | | | 265.6 | | | | 0.4 | | | | 266.0 | |
| | | | | | | | | | | | | | | | | | | | | | | | | | | | | | | | | |
Credit derivative contracts | | | 0.0 | | | | 15.3 | | | | 3.0 | | | | 18.3 | | | | 0.0 | | | | 33.2 | | | | 3.6 | | | | 36.9 | |
| | | | | | | | | | | | | | | | | | | | | | | | | | | | | | | | | |
Foreign exchange contracts | | | 0.5 | | | | 74.6 | | | | 0.9 | | | | 76.0 | | | | 0.3 | | | | 94.5 | | | | 1.2 | | | | 96.0 | |
| | | | | | | | | | | | | | | | | | | | | | | | | | | | | | | | | |
Equity/index contracts | | | 2.2 | | | | 14.6 | | | | 1.2 | | | | 18.1 | | | | 2.2 | | | | 10.9 | | | | 2.9 | | | | 15.9 | |
| | | | | | | | | | | | | | | | | | | | | | | | | | | | | | | | | |
Commodities contracts | | | 0.0 | | | | 3.5 | | | | 0.0 | | | | 3.5 | | | | 0.1 | | | | 3.8 | | | | 0.0 | | | | 3.8 | |
| | | | | | | | | | | | | | | | | | | | | | | | | | | | | | | | | |
| Financial assets designated at fair value | | | 0.1 | | | | 2.9 | | | | 4.4 | | | | 7.4 | | | | 0.1 | | | | 4.1 | | | | 4.9 | | | | 9.1 | |
| | | | | | | | | | | | | | | | | | | | | | | | | | | | | | | | | |
of which: | | | | | | | | | | | | | | | | | | | | | | | | | | | | | | | | |
| | | | | | | | | | | | | | | | | | | | | | | | | | | | | | | | | |
Loans (including structured loans) | | | 0.0 | | | | 1.4 | | | | 1.1 | | | | 2.5 | | | | 0.0 | | | | 1.4 | | | | 1.4 | | | | 2.8 | |
| | | | | | | | | | | | | | | | | | | | | | | | | | | | | | | | | |
Structured reverse repurchase and securities borrowing agreements | | | 0.0 | | | | 1.1 | | | | 3.1 | | | | 4.2 | | | | 0.0 | | | | 2.2 | | | | 3.3 | | | | 5.5 | |
| | | | | | | | | | | | | | | | | | | | | | | | | | | | | | | | | |
Other | | | 0.1 | | | | 0.5 | | | | 0.2 | | | | 0.7 | | | | 0.1 | | | | 0.5 | | | | 0.2 | | | | 0.8 | |
| | | | | | | | | | | | | | | | | | | | | | | | | | | | | | | | | |
| Financial investments available-for-sale | | | 39.7 | | | | 19.0 | | | | 0.8 | | | | 59.5 | | | | 48.5 | | | | 16.9 | | | | 0.7 | | | | 66.2 | |
| | | | | | | | | | | | | | | | | | | | | | | | | | | | | | | | | |
of which: | | | | | | | | | | | | | | | | | | | | | | | | | | | | | | | | |
| | | | | | | | | | | | | | | | | | | | | | | | | | | | | | | | | |
Government bills/bonds | | | 38.0 | | | | 1.2 | | | | 0.0 | | | | 39.2 | | | | 46.4 | | | | 0.6 | | | | 0.0 | | | | 47.0 | |
| | | | | | | | | | | | | | | | | | | | | | | | | | | | | | | | | |
Corporate bonds and municipal bonds, including bonds issued by financial institutions | | | 1.6 | | | | 13.6 | | | | 0.1 | | | | 15.3 | | | | 2.1 | | | | 8.8 | | | | 0.1 | | | | 10.9 | |
| | | | | | | | | | | | | | | | | | | | | | | | | | | | | | | | | |
Investment fund units | | | 0.0 | | | | 0.0 | | | | 0.2 | | | | 0.3 | | | | 0.0 | | | | 0.1 | | | | 0.2 | | | | 0.4 | |
| | | | | | | | | | | | | | | | | | | | | | | | | | | | | | | | | |
Asset-backed securities | | | 0.0 | | | | 4.0 | | | | 0.0 | | | | 4.0 | | | | 0.0 | | | | 7.3 | | | | 0.0 | | | | 7.3 | |
| | | | | | | | | | | | | | | | | | | | | | | | | | | | | | | | | |
Equity instruments | | | 0.1 | | | | 0.1 | | | | 0.4 | | | | 0.6 | | | | 0.1 | | | | 0.0 | | | | 0.4 | | | | 0.6 | |
| | | | | | | | | | | | | | | | | | | | | | | | | | | | | | | | | |
| Non-financial assets | | | | | | | | | | | | | | | | | | | | | | | | | | | | | | | | |
| | | | | | | | | | | | | | | | | | | | | | | | | | | | | | | | | |
| Investment properties at fair value | | | 0.0 | | | | 0.0 | | | | 0.0 | | | | 0.0 | | | | 0.0 | | | | 0.0 | | | | 0.1 | | | | 0.1 | |
| | | | | | | | | | | | | | | | | | | | | | | | | | | | | | | | | |
| Precious metals and other physical commodities | | | 8.6 | | | | 0.0 | | | | 0.0 | | | | 8.6 | | | | 17.1 | | | | 0.0 | | | | 0.0 | | | | 17.1 | |
| | | | | | | | | | | | | | | | | | | | | | | | | | | | | | | | | |
| Assets measured at fair value on a non-recurring basis | | | | | | | | | | | | | | | | | | | | | | | | | | | | | | | | |
| | | | | | | | | | | | | | | | | | | | | | | | | | | | | | | | | |
| Other assets3 | | | 0.0 | | | | 0.1 | | | | 0.1 | | | | 0.1 | | | | 0.0 | | | | 0.0 | | | | 0.1 | | | | 0.1 | |
| | | | | | | | | | | | | | | | | | | | | | | | | | | | | | | | | |
| Total assets measured at fair value | | | 131.3 | | | | 289.4 | | | | 15.0 | | | | 435.7 | | | | 160.0 | | | | 475.4 | | | | 19.6 | | | | 655.1 | |
| | | | | | | | | | | | | | | | | | | | | | | | | | | | | | | | | |
Note 24 Fair value measurement (continued)
Determination of fair values from quoted market prices or valuation techniques1 (continued)
| | | | | | | | | | | | | | | | | | | | | | | | | | | | | | | | |
| | 31.12.13 | | | 31.12.12 | |
| CHF billion | | Level 1 | | | Level 2 | | | Level 3 | | | Total | | | Level 1 | | | Level 2 | | | Level 3 | | | Total | |
| Liabilities measured at fair value on a recurring basis | | | | | | | | | | | | | | | | | | | | | | | | | | | | | | | | |
| | | | | | | | | | | | | | | | | | | | | | | | | | | | | | | | | |
| Trading portfolio liabilities | | | 22.5 | | | | 3.9 | | | | 0.2 | | | | 26.6 | | | | 28.6 | | | | 5.4 | | | | 0.2 | | | | 34.2 | |
| | | | | | | | | | | | | | | | | | | | | | | | | | | | | | | | | |
of which: | | | | | | | | | | | | | | | | | | | | | | | | | | | | | | | | |
| | | | | | | | | | | | | | | | | | | | | | | | | | | | | | | | | |
Government bills/bonds | | | 6.9 | | | | 0.5 | | | | 0.0 | | | | 7.3 | | | | 14.1 | | | | 0.6 | | | | 0.0 | | | | 14.7 | |
| | | | | | | | | | | | | | | | | | | | | | | | | | | | | | | | | |
Corporate bonds and municipal bonds, including bonds issued by financial institutions | | | 0.3 | | | | 3.2 | | | | 0.2 | | | | 3.6 | | | | 0.9 | | | | 4.5 | | | | 0.1 | | | | 5.5 | |
| | | | | | | | | | | | | | | | | | | | | | | | | | | | | | | | | |
Investment fund units | | | 0.4 | | | | 0.1 | | | | 0.0 | | | | 0.5 | | | | 0.1 | | | | 0.2 | | | | 0.0 | | | | 0.4 | |
| | | | | | | | | | | | | | | | | | | | | | | | | | | | | | | | | |
Asset-backed securities | | | 0.0 | | | | 0.0 | | | | 0.0 | | | | 0.0 | | | | 0.0 | | | | 0.0 | | | | 0.0 | | | | 0.0 | |
| | | | | | | | | | | | | | | | | | | | | | | | | | | | | | | | | |
Equity instruments | | | 15.0 | | | | 0.2 | | | | 0.0 | | | | 15.1 | | | | 13.5 | | | | 0.1 | | | | 0.0 | | | | 13.6 | |
| | | | | | | | | | | | | | | | | | | | | | | | | | | | | | | | | |
| Negative replacement values4 | | | 3.0 | | | | 232.5 | | | | 4.4 | | | | 240.0 | | | | 2.9 | | | | 385.9 | | | | 6.5 | | | | 395.3 | |
| | | | | | | | | | | | | | | | | | | | | | | | | | | | | | | | | |
of which: | | | | | | | | | | | | | | | | | | | | | | | | | | | | | | | | |
| | | | | | | | | | | | | | | | | | | | | | | | | | | | | | | | | |
Interest rate contracts | | | 0.0 | | | | 116.8 | | | | 0.4 | | | | 117.2 | | | | 0.0 | | | | 238.7 | | | | 0.4 | | | | 239.1 | |
| | | | | | | | | | | | | | | | | | | | | | | | | | | | | | | | | |
Credit derivative contracts | | | 0.0 | | | | 15.1 | | | | 2.0 | | | | 17.0 | | | | 0.0 | | | | 31.1 | | | | 3.3 | | | | 34.4 | |
| | | | | | | | | | | | | | | | | | | | | | | | | | | | | | | | | |
Foreign exchange contracts | | | 0.5 | | | | 79.3 | | | | 0.5 | | | | 80.3 | | | | 0.3 | | | | 99.2 | | | | 1.5 | | | | 101.0 | |
| | | | | | | | | | | | | | | | | | | | | | | | | | | | | | | | | |
Equity/index contracts | | | 2.3 | | | | 18.1 | | | | 1.5 | | | | 21.9 | | | | 2.2 | | | | 12.9 | | | | 1.3 | | | | 16.4 | |
| | | | | | | | | | | | | | | | | | | | | | | | | | | | | | | | | |
Commodities contracts | | | 0.0 | | | | 3.2 | | | | 0.0 | | | | 3.2 | | | | 0.1 | | | | 3.9 | | | | 0.0 | | | | 4.0 | |
| | | | | | | | | | | | | | | | | | | | | | | | | | | | | | | | | |
| Financial liabilities designated at fair value | | | 0.0 | | | | 57.8 | | | | 12.1 | | | | 69.9 | | | | 0.0 | | | | 77.2 | | | | 14.7 | | | | 91.9 | |
| | | | | | | | | | | | | | | | | | | | | | | | | | | | | | | | | |
of which: | | | | | | | | | | | | | | | | | | | | | | | | | | | | | | | | |
| | | | | | | | | | | | | | | | | | | | | | | | | | | | | | | | | |
Non-structured fixed-rate bonds | | | 0.0 | | | | 2.4 | | | | 1.2 | | | | 3.7 | | | | 0.0 | | | | 4.2 | | | | 0.8 | | | | 5.0 | |
| | | | | | | | | | | | | | | | | | | | | | | | | | | | | | | | | |
Structured debt instruments issued | | | 0.0 | | | | 48.4 | | | | 7.9 | | | | 56.3 | | | | 0.0 | | | | 57.4 | | | | 10.0 | | | | 67.4 | |
| | | | | | | | | | | | | | | | | | | | | | | | | | | | | | | | | |
Structured over-the-counter debt instruments | | | 0.0 | | | | 6.5 | | | | 1.8 | | | | 8.3 | | | | 0.0 | | | | 15.5 | | | | 2.2 | | | | 17.7 | |
| | | | | | | | | | | | | | | | | | | | | | | | | | | | | | | | | |
Structured repurchase agreements | | | 0.0 | | | | 0.4 | | | | 1.2 | | | | 1.6 | | | | 0.0 | | | | 0.0 | | | | 1.7 | | | | 1.7 | |
| | | | | | | | | | | | | | | | | | | | | | | | | | | | | | | | | |
Loan commitments | | | 0.0 | | | | 0.0 | | | | 0.0 | | | | 0.0 | | | | 0.0 | | | | 0.2 | | | | 0.0 | | | | 0.2 | |
| | | | | | | | | | | | | | | | | | | | | | | | | | | | | | | | | |
| Other liabilities – amounts due under unit-linked investment contracts | | | 0.0 | | | | 16.2 | | | | 0.0 | | | | 16.2 | | | | 0.0 | | | | 15.3 | | | | 0.0 | | | | 15.3 | |
| | | | | | | | | | | | | | | | | | | | | | | | | | | | | | | | | |
| Total liabilities measured at fair value | | | 25.5 | | | | 310.3 | | | | 16.8 | | | | 352.6 | | | | 31.5 | | | | 483.8 | | | | 21.4 | | | | 536.7 | |
| | | | | | | | | | | | | | | | | | | | | | | | | | | | | | | | | |
1 Bifurcated embedded derivatives are presented on the same balance sheet lines as their host contracts and are excluded from this table. As of 31 December 2013, net bifurcated embedded derivative liabilities held at fair value, totaling CHF 0.2 billion (of which CHF 0.2 billion were net Level 2 assets and CHF 0.4 billion net Level 2 liabilities) were recognized on the balance sheet within Debt issued. In 2013, comparative period figures were corrected. On a corrected basis, as of 31 December 2012, net bifurcated embedded derivative liabilities held at fair value, totaling CHF 0.1 billion (of which CHF 0.2 billion were net Level 2 assets and CHF 0.3 billion net Level 2 liabilities) were recognized on the balance sheet within Debt issued. 2 Financial assets held for trading do not include precious metals and commodities. 3 Other assets primarily consist of assets held for sale, which are measured at the lower of their net carrying amount or fair value less costs to sell. 4 Includes a life-to-date debit valuation adjustment gain on derivatives of CHF 256 million as of 31 December 2013 (31 December 2012: CHF 384 million).
Financial assets and liabilities held for trading, financial assets designated at fair value and financial investments available-for-sale
Government bills and bonds
Government bills and bonds include fixed-rate, floating-rate and inflation-linked bills and bonds issued by sovereign governments, as well as interest and principal strips based on these bonds. Such instruments are generally traded in active markets and prices can be obtained directly from these markets, resulting in classification as Level 1, while the majority of the remaining positions are classified as Level 2. Instruments that cannot be priced directly using active market data are valued using discounted cash flow valuation techniques that incorporate market data for similar government
instruments converted into yield curves. These yield curves are used to project future index levels, and to discount expected future cash flows. The main inputs to valuation techniques for these instruments are bond prices and inputs to estimate the future index levels for floating or inflation index-linked instruments. Instruments classified as Level 3 are limited and are generally classified as such due to the requirement to extrapolate yield curve inputs outside the range of active market trading.
Corporate and municipal bonds
Corporate bonds include senior, junior and subordinated debt issued by corporate entities. Municipal bonds are issued by state and local governments. While most instruments are standard fixed or floating-rate securities, some may have more complex
Financial information
Notes to the consolidated financial statements
Note 24 Fair value measurement (continued)
coupon or embedded option features. Corporate and municipal bonds are generally valued using prices obtained directly from the market. In cases where no directly comparable price is available, instruments may be valued using yields derived from other securities by the same issuer or benchmarked against similar securities, adjusted for seniority, maturity and liquidity. Instruments that cannot be priced directly using active market data are valued using discounted cash flow valuation techniques incorporating the credit spread of the issuer, which may be derived from other issuances or CDS data for the issuer, estimated with reference to other equivalent issuer price observations or from credit modeling techniques. Corporate bonds are typically classified as Level 2 because, although market data is readily available, there is often insufficient third-party trading transaction data to justify an active market and corresponding Level 1 classification. Municipal bonds are generally classified as Level 1 or Level 2 depending on the depth of trading activity behind price sources. Level 3 instruments have no suitable price available for the security held or by reference to other securities issued by the same issuer. Therefore, these instruments are measured based on price levels for similar issuers adjusted for relative tenor and issuer quality.
Convertible bonds are generally valued using prices obtained directly from market sources. In cases where no directly comparable price is available, issuances may be priced using a convertible bond model, which values the embedded equity option and debt components and discounts these amounts using a curve that incorporates the credit spread of the issuer. Although market data is readily available, convertible bonds are typically classified as Level 2 because there is insufficient third-party trading transaction data to justify a Level 1 classification.
Traded loans and loans designated at fair value
Traded loans and loans designated at fair value are valued directly using market prices that reflect recent transactions or quoted dealer prices where available. For illiquid loans where no market price data is available, alternative valuation techniques are used, which include relative value benchmarking using pricing derived from debt instruments in comparable entities or different products in the same entity. The corporate lending portfolio is valued using either directly observed market prices typically from consensus providers or by using a credit default swap valuation technique, which requires inputs for credit spreads, credit recovery rates and interest rates. The market for these instruments is not actively traded and even though price data is available it may not be directly observable, and therefore corporate loans typically do not meet Level 1 classification. Instruments with suitably deep and liquid price data available will be classified as Level 2, while any positions requiring the use of valuation techniques or for which the price sources have insufficient trading depth are classified as Level 3. Recently originated commercial real estate loans which are classified as Level 3 are measured using a securitization approach based on rating agency guidelines. Future profit and loss from the securitization is not recognized, but overall spread moves are captured in the loan valuation.
Included within loans are various contingent lending transactions, for which valuations are dependent on actuarial mortality levels and actuarial life insurance policy lapse rates. Mortality and lapse rate assumptions are based on external actuarial estimations for large homogeneous pools, and contingencies are derived from a range relative to the actuarially expected amount. In addition, the pricing technique uses volatility of mortality as an input.
Investment fund units
Investment fund units are predominantly exchange traded, with quoted prices in liquid markets readily available. Where market prices are not available, fair value may be measured using net asset values (NAV), taking into account any restrictions imposed upon redemption. Listed units are classified as Level 1, provided there is sufficient trading to justify active market classification, while other positions are classified as Level 2. Positions where NAV is not available or which are not redeemable at the measurement date or in the near future are classified as Level 3.
Asset-backed securities
Residential mortgage-backed securities (RMBS), commercial mortgage-backed securities (CMBS), other asset-backed securities (ABS) and collateralized debt obligations (CDO)
RMBS, CMBS, ABS and CDO are instruments generally issued through the process of securitization of underlying interest bearing assets. The underlying collateral for RMBS is residential mortgages, for CMBS, commercial mortgages, for ABS, other assets such as credit card, car or student loans and leases and for CDO, other securitized positions of RMBS, CMBS or ABS. The market for these securities is not active, and therefore a variety of valuation techniques are used to measure fair value. For more liquid securities, trade or quote data may be obtained periodically for the instrument held, and the valuation process will use this trade price data, updated for movements in market levels between the time of trading and the time of valuation. Less liquid instruments are measured using discounted expected cash flows incorporating price data for instruments or indices with similar risk profiles. Expected cash flow estimation involves the modeling of the expected collateral cash flows using input assumptions derived from proprietary models, fundamental analysis and/or market research based on management’s quantitative and qualitative assessment of current and future economic conditions. The expected collateral cash flows thus estimated are then converted into the securities’ projected performance under such conditions based on the credit enhancement and subordination terms of the securitization. Expected cash flow schedules are discounted using a rate or discount margin that reflects the discount levels required by the market for instruments with similar risk and liquidity profiles. Inputs to discounted expected cash flow techniques include asset prepayment rates, discount
Note 24 Fair value measurement (continued)
margin or discount yields, asset default rates and asset loss on default severity, which may in turn be estimated using more fundamental loan and economic drivers such as, but not limited to, loan-to-value data, house price appreciation, foreclosure costs, rental income levels, void periods and employment rates. RMBS, CMBS and ABS are generally classified as Level 2. However, if significant inputs are unobservable, or if market or fundamental data is not available for instruments or collateral with a sufficiently similar risk profile to the positions held, they are classified as Level 3.
Equity instruments
The majority of equity securities are actively traded on public stock exchanges where quoted prices are readily and regularly available, resulting in their classification as Level 1. Units held in hedge funds are also classified as equity instruments. Fair value for these units is measured based on their published NAV, taking into account any restrictions imposed upon the redemption. These units are classified as Level 2, except for positions where published NAV is not available or which are not redeemable at the measurement date or in the near future, which are classified as Level 3.
Unlisted equity holdings, including private equity positions, are initially marked at their transaction price and are periodically revalued to the extent reliable evidence of price movements becomes available or the position is deemed to be impaired.
Financial assets underlying unit-linked investments
Unit-linked investment contracts allow investors to invest in a pool of assets through issued investment units. The unit holders receive all rewards and bear all risks associated with the reference asset pool. Assets held under unit-linked investment contracts are presented as Trading portfolio assets. The majority of assets are listed on exchanges and are classified as Level 1 if actively traded, or Level 2 if trading is not active. However, instruments for which prices are not readily available are classified as Level 3.
Structured repurchase agreements and structured reverse repurchase agreements
Structured repurchase agreements and structured reverse repurchase agreements designated at fair value are measured using discounted expected cash flow techniques. The discount rate applied is based on funding curves that are specific to the collateral eligibility terms for the contract in question. Collateral terms for these positions are not standard and therefore funding spread levels used for valuation cannot be observed in the market. As a result, these positions are mostly classified as Level 3.
Replacement values
Collateralized and uncollateralized instruments
The curves used for discounting expected cash flows in the valuation of collateralized derivatives reflect the funding terms associated with the relevant collateral arrangement for the instrument
being valued. These collateral arrangements differ across counterparties with respect to the eligible currency and interest terms of the collateral. The majority of collateralized derivatives are measured using a discount curve that is based on funding rates derived from overnight interest in the cheapest eligible currency for the respective counterparty collateral agreement.
Uncollateralized derivatives are discounted using the LIBOR (or equivalent) curve for the currency of the instrument. As described in “Note 24d Valuation adjustments,” the fair value of uncollateralized derivatives is adjusted using CVA or DVA processes to reflect an estimation of the impact of counterparty credit and UBS own credit risk on the fair value of assets and liabilities.
Interest rate contracts
Interest rate swap contracts include interest rate swaps, basis swaps, cross-currency swaps, inflation swaps and interest rate forwards, often referred to as forward rate agreements (FRA). These products are valued by estimating future interest cash flows and discounting those cash flows using a rate that reflects the appropriate funding rate for the position being measured. The yield curves used to estimate future index levels and discount rates are generated using market standard yield curve models using interest rates associated with current market activity. The key inputs to the models are interest rate swap rates, FRA rates, short-term interest rate futures prices, basis swap spreads and inflation swap rates. In most cases, the standard market contracts that form the inputs for yield curve models are traded in active and observable markets, resulting in the majority of these financial instruments being classified as Level 2.
Interest rate option contracts include caps and floors, swap-tions, swaps with complex payoff profiles and other more complex interest rate options. These contracts are valued using various market standard option models, using inputs that include interest rate yield curves, inflation curves, volatilities and correlations. The volatility and correlation inputs within the models are implied from market data based on market observed prices for standard option instruments trading within the market. Option models used to value more exotic products have a number of model parameter inputs that require calibration to enable the exotic model to price standard option instruments to the price levels observed in the market. Although these inputs cannot be directly observed, they are generally treated as Level 2, as the calibration process enables the model output to be validated to active market levels. Models calibrated in this way are then used to revalue the portfolio of both standard options as well as more exotic products. In most cases, there are active and observable markets for the standard market instruments that form the inputs for yield curve models as well as the financial instruments from which volatility and correlation inputs are derived, resulting in the majority of these products being classified as Level 2. Within interest rate option contracts, exotic options for which appropriate volatility or correlation input levels cannot be implied from observable market data are classified as Level 3. These options are valued using volatility and correlation levels derived from non-market sources.
Financial information
Notes to the consolidated financial statements
Note 24 Fair value measurement (continued)
Interest rate swap and option contracts are classified as Level 3 when the maturity of the contract exceeds the term for which standard market quotes are observable for a significant input parameter. Such positions are valued by extrapolation from the last observable point using standard assumptions or by reference to another observable comparable input parameter to represent a suitable proxy for that portion of the term.
Balance guaranteed swaps (BGS) are interest rate or currency swaps that have a notional schedule based on a securitization vehicle, requiring the valuation to incorporate an adjustment for the unknown future variability of the notional schedule. Inputs to value BGS are those used to value the standard market risk on the swap and those used to estimate the notional schedule of the underlying securitization pool (i.e., prepayment, default and interest rates). BGS are classified as Level 3, as the correlation between unscheduled notional changes and the underlying market risk of the BGS does not have an active market and cannot be observed.
Credit derivative contracts
Credit derivative contracts based on a single credit name include credit default swaps (CDS) based on corporate and sovereign single names, CDS on loans and certain total return swaps (TRS). These contracts are valued by estimating future default probabilities using industry standard models based on market credit spreads, upfront pricing points and implied recovery rates. These default and recovery assumptions are used to generate future expected cash flows that are then discounted using market standard discounted cash flow models and a discount rate that reflects the appropriate funding rate for that portion of the portfolio. TRS and certain single-name CDS contracts for which a derivative-based credit spread is not directly available are valued using a credit spread derived from the price of the cash bond that is referenced in the credit derivative, adjusted for any funding differences between the cash and synthetic product. Loan CDS for which a credit spread cannot be observed directly may be valued, where possible, using the corporate debt curve for the entity, adjusted for differences between loan and debt default definitions and recovery rate assumptions. Inputs to the valuation models used to value single-name and loan CDS include single-name credit spreads and upfront pricing points, recovery rates and funding curves. In addition, corporate bond prices are used as inputs to the valuation model for TRS and certain single-name or loan CDS as described. Many single-name credit default swaps are classified as Level 2 because the credit spreads and recovery rates used to value these contracts are actively traded and observable market data is available. Where the underlying reference name is not actively traded, these contracts are classified as Level 3.
Credit derivative contracts based on a portfolio of credit names include credit default swaps on a credit index, credit default swaps based on a bespoke portfolio or first to default swaps (FTD). The
valuation of these contracts is similar to that described above for single-name CDS and includes an estimation of future default probabilities using industry standard models based on market credit spreads, upfront pricing points and implied recovery rates. These default and recovery assumptions are used to generate future expected cash flows that are then discounted using market standard discounted cash flow models based on an estimation of the funding rate for that portion of the portfolio. Tranche products and FTD are valued using industry standard models that, in addition to default and recovery assumptions as above, incorporate implied correlations to be applied to the credits within the portfolio in order to apportion the expected credit loss at a portfolio level across the different tranches or names within the overall structure. These correlation assumptions are derived from prices of actively traded index tranches or other FTD baskets. Inputs to the valuation models used for all portfolio credit default swaps include single-name or index credit spreads and upfront pricing points, recovery rates and funding curves. In addition, models used for tranche and FTD products have implied credit correlations as inputs. Credit derivative contracts based on a portfolio of credit names are classified as Level 2 when credit spreads and recovery rates are determined from actively traded observable market data, and when the correlation data used to value bespoke and index tranches is based on actively traded index tranche instruments. This correlation data undergoes a mapping process that takes into account both the relative tranche attachment/detachment points in the overall capital structure of the portfolio and portfolio composition. Where the mapping process requires extrapolation beyond the range of available and active market data, the position is classified as Level 3. This relates to a small number of index and all bespoke tranche contracts. FTD are classified as Level 3, as the correlations between specific names in the FTD portfolio are not actively traded. Also classified as Level 3 are several older credit index positions, referred to as “off the run” indices, due to the lack of any active market for the index credit spread.
Credit derivative contracts on securitized products have an underlying reference asset that is a securitized product (RMBS, CMBS, ABS or CDO) and include credit default swaps and certain TRS. These credit default swaps (typically referred to as “pay-as-you-go” or “PAYG CDS”) and TRS are valued using a similar valuation technique to the underlying security (by reference to equivalent securities trading in the market, or through cash flow estimation and discounted cash flow techniques as described in the Asset-backed securities section above), with an adjustment made to reflect the funding differences between cash and synthetic form. Inputs to the PAYG CDS and TRS are those used to value the underlying security (prepayment rates, default rates, loss severity, discount margin/rate and other inputs) and those used to capture the funding basis differential between cash and synthetic form. The classification of PAYG CDS and these TRS follow the characteristics of the underlying security and are therefore distributed across Level 2 and Level 3.
Note 24 Fair value measurement (continued)
Foreign exchange (FX) contracts
Open spot FX contracts are valued using the FX spot rate observed in the market. Forward FX contracts are valued using the FX spot rate adjusted for forward pricing points observed from standard market-based sources. As the markets for both FX spot and FX forward pricing points are both actively traded and observable, FX contracts are generally classified as Level 2.
OTC FX option contracts include standard call and put options, options with multiple exercise dates, path-dependent options, options with averaging features, options with discontinuous pay-off characteristics and options on a number of underlying FX rates. OTC FX option contracts are valued using market standard option valuation models. The models used for shorter-dated options (i.e., maturities of five years or less) tend to be different than those used for longer-dated options because the models needed for longer-dated OTC FX contracts require additional consideration of interest rate and FX rate interdependency. Inputs to the option valuation models include spot FX rates, FX forward points, FX volatilities, interest rate yield curves, interest rate volatilities and correlations. The inputs for volatility and correlation are implied through the calibration of observed prices for standard option contracts trading within the market.
As inputs are derived mostly from standard market contracts traded in active and observable markets, a significant proportion of OTC FX option contracts are classified as Level 2. OTC FX option contracts classified as Level 3 include long-dated FX exotic option contracts for which there is no active market from which to derive volatility or correlation inputs. The inputs used to value these OTC FX option contracts are calculated using consensus pricing services without an underlying principal market, historical asset prices or by extrapolation.
Cross currency balance guaranteed swaps (BGS) are classified as foreign exchange contracts. Details of the fair value classification can be found under interest rate contracts above.
Equity/index contracts
Equity/index contracts include equity forward contracts and equity option contracts. Equity forward contracts have a single stock or index underlying and are valued using market standard models. The key inputs to the models are stock prices, estimated dividend rates and equity funding rates (which are implied from prices of forward contracts observed in the market). Estimated cash flows are then discounted using market standard discounted cash flow models using a rate that reflects the appropriate funding rate for that portion of the portfolio. As inputs are derived mostly from standard market contracts traded in active and observable markets, a significant proportion of equity forward contracts are classified as Level 2. Positions classified as Level 3 have no market data available for the instrument maturity and are valued by some form of extrapolation of available data, use of historical dividend data, or use of data for a related equity.
Equity option contracts include market standard single or basket stock or index call and put options as well as equity option contracts with more complex features including option contracts with multiple or continuous exercise dates, option contracts for which the payoff is based on the relative or average performance of components of a basket, option contracts with discontinuous payoff profiles, path-dependent options and option contracts with a payoff calculated directly upon equity features other than price (i.e., dividend rates, volatility or correlation). Equity option contracts are valued using market standard models that estimate the equity forward level as described above for equity forward contracts and incorporate inputs for stock volatility and for correlation between stocks within a basket. The probability-weighted expected option payoff generated is then discounted using market standard discounted cash flow models using a rate that reflects the appropriate funding rate for that portion of the portfolio. Positions for which inputs are derived from standard market contracts traded in active and observable markets are classified as Level 2. Level 3 positions are those for which volatility, forward or correlation inputs are not observable and are therefore valued using extrapolation of available data, historical dividend, correlation or volatility data, or the equivalent data for a related equity.
Commodity derivative contracts
Commodity derivative contracts include forward, swap and option contracts on individual commodities and on commodity indices. Commodity forward and swap contracts are measured using market standard models that use market forward levels on standard instruments. Commodity option contracts are measured us-ing market standard option models that estimate the commodity forward level as described above for commodity forward and swap contracts, incorporating inputs for the volatility of the underlying index or commodity. The option model produces a probability-weighted expected option payoff that is then discounted using market standard discounted cash flow models using a rate that reflects the appropriate funding rate for that portion of the portfolio. For commodity options on baskets of commodities or bespoke commodity indices, the valuation technique also incorporates inputs for the correlation between different commodities or commodity indices. Individual commodity contracts are typically classified as Level 2 because active forward and volatility market data is available.
Financial liabilities designated at fair value
Structured and OTC debt instruments issued
Structured debt instruments issued are comprised of medium-term notes (MTN), which are held at fair value under the fair value option. These MTN are tailored specifically to the holder’s risk or investment appetite with structured coupons or payoffs.
Financial information
Notes to the consolidated financial statements
Note 24 Fair value measurement (continued)
The risk management and the valuation approaches for these MTN are closely aligned to the equivalent derivatives business and the underlying risk, and the valuation techniques used for this component are the same as the relevant valuation techniques described above. For example, equity-linked notes should be referenced to equity/index contracts in the replacement value section and credit-linked notes should be referenced to credit derivative contacts.
Other liabilities – amounts due under unit-linked contracts
Unit-linked investment contracts allow investors to invest in a pool of assets through issued investment units. The unit holders receive all rewards and bear all risks associated with the reference asset pool. The financial liability represents the amounts due to unit holders and is equal to the fair value of the reference asset pool. The fair values of investment contract liabilities are determined by reference to the fair value of the corresponding assets. The liabilities themselves are not actively traded, but are mainly referenced to instruments which are and are therefore classified as Level 2.
f) Transfers between Level 1 and Level 2 in the fair value hierarchy
With the adoption of IFRS 13, UBS refined its methodology regarding disclosure of transfers between Level 1 and Level 2 in the fair value hierarchy. The amounts disclosed reflect transfers between Level 1 and Level 2 for instruments which were held for the entire reporting period.
Assets totaling approximately CHF 0.8 billion, which were mainly comprised of financial assets held for trading, and liabilities totaling approximately CHF 0.1 billion were transferred from Level 2 to Level 1 during 2013, generally due to increased levels of trading activity observed within the market.
Assets totaling approximately CHF 1.0 billion, which were mainly comprised of financial assets held for trading and positive replacement values, and liabilities totaling approximately CHF 0.3 billion, which were primarily comprised of negative replacement values, were transferred from Level 1 to Level 2 during 2013, generally due to diminished levels of trading activity observed within the market.
g) Movements of Level 3 instruments
Significant changes in Level 3 instruments
The table on the following pages presents additional information about Level 3 assets and liabilities measured at fair value on a recurring basis. Level 3 assets and liabilities may be hedged with instruments classified as Level 1 or Level 2 in the fair value hierarchy and, as a result, realized and unrealized gains and losses included in the table may not include the effect of related hedging activity. Further, the realized and unrealized gains and losses presented within the table are not limited solely to those arising from Level 3 inputs, as valuations are generally derived from both observable and unobservable parameters.
With the adoption of IFRS 13, the Group refined its methodology for determining transfers and movements of Level 3 instruments, resulting in increased disclosure granularity and alignment with industry best practices. Assets and liabilities transferred into
or out of Level 3 are now presented as if those assets or liabilities had been transferred at the beginning of the annual reporting period. Prior to adopting IFRS 13, the Group presented transfers into or out of Level 3 on a quarterly basis, with the quarters then aggregated for the annual result. Comparative data has not been restated.
As of 31 December 2013, financial instruments measured with valuation techniques using significant non-market-observable inputs (Level 3) mainly comprised the following:
| – | | structured debt instruments issued (equity- and credit-linked); |
| – | | structured reverse repurchase and securities borrowing agreements; |
| – | | credit derivative contracts and |
| – | | structured over-the-counter debt instruments. |
Note 24 Fair value measurement (continued)
Significant movements in Level 3 instruments during the year ended 31 December 2013 were as follows.
Financial assets held for trading
Financial assets held for trading decreased from CHF 5.7 billion to CHF 4.3 billion during the year. Issuances of CHF 5.0 billion, comprised of traded loans, and purchases of CHF 2.1 billion, mainly comprised of corporate bonds and traded loans, were mostly offset by sales of CHF 6.8 billion, which were primarily comprised of traded loans. Transfers into Level 3 during the period amounted to CHF 2.2 billion and were mainly comprised of traded loans, mortgage-backed securities and corporate bonds due to decreased observability of credit spread inputs. Transfers out of Level 3 amounted to CHF 1.2 billion and were primarily comprised of asset-backed securities, traded loans and corporate bonds.
Financial assets designated at fair value
Financial assets designated at fair value decreased from CHF 4.9 billion to CHF 4.4 billion during the year. Settlements of CHF 3.3 billion, primarily comprised of structured reverse repurchase and securities borrowing agreements, were partly offset by issuances of CHF 2.6 billion, which were mainly comprised of structured reverse repurchase and securities borrowing agreements and structured loans.
Financial investments available-for-sale
Financial investments available-for-sale increased from CHF 0.7 billion to CHF 0.8 billion during the year. Sales of CHF 0.2 billion were more than offset by net gains of CHF 0.1 billion included in comprehensive income, purchases of CHF 0.1 billion and transfers into Level 3 of CHF 0.1 billion.
Positive replacement values
Positive replacement values decreased from CHF 8.1 billion to CHF 5.5 billion during the year. Settlements and issuances amounted to CHF 4.7 billion and CHF 2.2 billion, respectively, and were primarily comprised of credit derivative contracts. Transfers into Level 3 amounted to CHF 3.8 billion and were primarily comprised of credit derivative contracts and foreign exchange derivative contracts. These transfers resulted from both changes in the availability of observable inputs for credit spread and changes in correlation between the portfolio held and the representative
market portfolio used to independently verify market data. Transfers out of Level 3 totaling CHF 2.7 billion included UBS’s option to acquire the equity of the SNB StabFund, which was transferred from Level 3 to Level 2 during the third quarter of 2013 and exercised subsequently.
Negative replacement values
Negative replacement values decreased from CHF 6.5 billion to CHF 4.4 billion during the year. Settlements and issuances amounted to CHF 4.6 billion and CHF 1.4 billion, respectively. Settlements were primarily comprised of credit derivative contracts, and issuances were mainly comprised of equity/index contracts and credit derivative contracts. Transfers into and out of Level 3 amounted to CHF 3.0 billion and CHF 1.0 billion, respectively, and were primarily comprised of credit derivative contracts and equity/index contracts resulting from changes in the availability of observable inputs for credit spread and changes in correlation between the portfolio held and the representative market portfolio used to independently verify market data.
Financial liabilities designated at fair value
Financial liabilities designated at fair value decreased from CHF 14.7 billion to CHF 12.1 billion during the year. Settlements of CHF 9.4 billion, mainly comprised of equity- and credit-linked structured debt instruments issued and structured over-the-counter debt instruments, were partly offset by issuances of CHF 6.4 billion, which were primarily comprised of equity-linked structured debt instruments issued, non-structured fixed-rate bonds, structured repurchase agreements and structured over-the-counter debt instruments. Financial liabilities designated at fair value transferred into and out of Level 3 amounted to CHF 2.9 billion and CHF 1.7 billion, respectively. Transfers into Level 3 were primarily comprised of rates- and equity-linked structured debt instruments issued as well as structured over-the-counter debt instruments, as a reduction in observable equity volatility inputs and credit correlation affected the embedded options in these structures. Transfers out of Level 3 were mainly comprised of equity-, credit- and rates-linked structured debt instruments issued, due to volatility inputs becoming observable for credit spread, equity volatility inputs and rates correlation used to determine the fair value of the embedded options in these structures.
Financial information
Notes to the consolidated financial statements
Note 24 Fair value measurement (continued)
Movements of Level 3 instruments
| | | | | | | | | | | | | | | | | | | | | | | | | | | | | | | | | | | | | | | | | | | | | | | | | | | | |
| | | | | | Total gains/losses included in comprehensive income | | | | | | | | | | | | | | | | | | | | | | |
| CHF billion | | Balance as of
31 December
2011 | | | Net
trading
income | | | of which:
related to
Level 3
instruments
held at the end of
the
reporting
period | | | Net
interest
income
and other
income | | | of which:
related to
Level 3 instruments
held at the end of the
reporting
period | | | Other
comprehensive income | | | Purchases | | | Sales | | | Issuances | | | Settlements | | | Transfers
into
Level 3 | | | Transfers
out of
Level 3 | | | Foreign
currency
translation | |
| Financial assets held for trading1 | | | 7.8 | | | | (1.1 | ) | | | (0.3 | ) | | | 0.0 | | | | 0.0 | | | | 0.0 | | | | 1.0 | | | | (7.2 | ) | | | 6.1 | | | | 0.0 | | | | 2.4 | | | | (3.0 | ) | | | (0.3 | ) |
| | | | | | | | | | | | | | | | | | | | | | | | | | | | | | | | | | | | | | | | | | | | | | | | | | | | | |
of which: | | | | | | | | | | | | | | | | | | | | | | | | | | | | | | | | | | | | | | | | | | | | | | | | | | | | |
| | | | | | | | | | | | | | | | | | | | | | | | | | | | | | | | | | | | | | | | | | | | | | | | | | | | | |
Corporate bonds and municipal bonds, including bonds issued by financial institutions | | | 2.4 | | | | | | | | | | | | | | | | | | | | | | | | | | | | | | | | | | | | | | | | | | | | | | | | | |
| | | | | | | | | | | | | | | | | | | | | | | | | | | | | | | | | | | | | | | | | | | | | | | | | | | | | |
Loans | | | 1.4 | | | | | | | | | | | | | | | | | | | | | | | | | | | | | | | | | | | | | | | | | | | | | | | | | |
| | | | | | | | | | | | | | | | | | | | | | | | | | | | | | | | | | | | | | | | | | | | | | | | | | | | | |
Asset-backed securities | | | 3.7 | | | | | | | | | | | | | | | | | | | | | | | | | | | | | | | | | | | | | | | | | | | | | | | | | |
| | | | | | | | | | | | | | | | | | | | | | | | | | | | | | | | | | | | | | | | | | | | | | | | | | | | | |
Other | | | 0.3 | | | | | | | | | | | | | | | | | | | | | | | | | | | | | | | | | | | | | | | | | | | | | | | | | |
| | | | | | | | | | | | | | | | | | | | | | | | | | | | | | | | | | | | | | | | | | | | | | | | | | | | | |
| Financial assets designated atfair value | | | 2.7 | | | | 0.1 | | | | 0.0 | | | | 0.0 | | | | 0.0 | | | | 0.0 | | | | 0.0 | | | | 0.0 | | | | 2.7 | | | | (1.0 | ) | | | 0.6 | | | | 0.0 | | | | (0.3 | ) |
| | | | | | | | | | | | | | | | | | | | | | | | | | | | | | | | | | | | | | | | | | | | | | | | | | | | | |
of which: | | | | | | | | | | | | | | | | | | | | | | | | | | | | | | | | | | | | | | | | | | | | | | | | | | | | |
| | | | | | | | | | | | | | | | | | | | | | | | | | | | | | | | | | | | | | | | | | | | | | | | | | | | | |
Loans (including structured loans) | | | 0.8 | | | | | | | | | | | | | | | | | | | | | | | | | | | | | | | | | | | | | | | | | | | | | | | | | |
| | | | | | | | | | | | | | | | | | | | | | | | | | | | | | | | | | | | | | | | | | | | | | | | | | | | | |
Structured reverse repurchase and securities borrowing agreements | | | 1.7 | | | | | | | | | | | | | | | | | | | | | | | | | | | | | | | | | | | | | | | | | | | | | | | | | |
| | | | | | | | | | | | | | | | | | | | | | | | | | | | | | | | | | | | | | | | | | | | | | | | | | | | | |
Other | | | 0.2 | | | | | | | | | | | | | | | | | | | | | | | | | | | | | | | | | | | | | | | | | | | | | | | | | |
| | | | | | | | | | | | | | | | | | | | | | | | | | | | | | | | | | | | | | | | | | | | | | | | | | | | | |
Financial investments available-for-sale | | | 0.6 | | | | 0.1 | | | | (0.1 | ) | | | 0.0 | | | | 0.0 | | | | 0.0 | | | | 0.1 | | | | (0.2 | ) | | | 0.1 | | | | (0.1 | ) | | | 0.2 | | | | (0.1 | ) | | | 0.0 | |
| | | | | | | | | | | | | | | | | | | | | | | | | | | | | | | | | | | | | | | | | | | | | | | | | | | | | |
| Positive replacement values | | | 13.9 | | | | (2.9 | ) | | | (1.2 | ) | | | 0.0 | | | | 0.0 | | | | 0.0 | | | | 0.0 | | | | 0.0 | | | | 1.2 | | | | (3.4 | ) | | | 2.1 | | | | (2.3 | ) | | | (0.5 | ) |
| | | | | | | | | | | | | | | | | | | | | | | | | | | | | | | | | | | | | | | | | | | | | | | | | | | | | |
of which: | | | | | | | | | | | | | | | | | | | | | | | | | | | | | | | | | | | | | | | | | | | | | | | | | | | | |
| | | | | | | | | | | | | | | | | | | | | | | | | | | | | | | | | | | | | | | | | | | | | | | | | | | | | |
Credit derivative contracts | | | 8.8 | | | | | | | | | | | | | | | | | | | | | | | | | | | | | | | | | | | | | | | | | | | | | | | | | |
| | | | | | | | | | | | | | | | | | | | | | | | | | | | | | | | | | | | | | | | | | | | | | | | | | | | | |
Foreign exchange contracts | | | 2.0 | | | | | | | | | | | | | | | | | | | | | | | | | | | | | | | | | | | | | | | | | | | | | | | | | |
| | | | | | | | | | | | | | | | | | | | | | | | | | | | | | | | | | | | | | | | | | | | | | | | | | | | | |
Equity/index contracts | | | 2.2 | | | | | | | | | | | | | | | | | | | | | | | | | | | | | | | | | | | | | | | | | | | | | | | | | |
| | | | | | | | | | | | | | | | | | | | | | | | | | | | | | | | | | | | | | | | | | | | | | | | | | | | | |
Other | | | 0.9 | | | | | | | | | | | | | | | | | | | | | | | | | | | | | | | | | | | | | | | | | | | | | | | | | |
| | | | | | | | | | | | | | | | | | | | | | | | | | | | | | | | | | | | | | | | | | | | | | | | | | | | | |
| Negative replacement values | | | 10.8 | | | | (1.3 | ) | | | (0.3 | ) | | | 0.0 | | | | 0.0 | | | | 0.0 | | | | 0.0 | | | | 0.0 | | | | 1.1 | | | | (3.9 | ) | | | 2.7 | | | | (2.3 | ) | | | (0.5 | ) |
| | | | | | | | | | | | | | | | | | | | | | | | | | | | | | | | | | | | | | | | | | | | | | | | | | | | | |
of which: | | | | | | | | | | | | | | | | | | | | | | | | | | | | | | | | | | | | | | | | | | | | | | | | | | | | |
| | | | | | | | | | | | | | | | | | | | | | | | | | | | | | | | | | | | | | | | | | | | | | | | | | | | | |
Credit derivative contracts | | | 7.1 | | | | | | | | | | | | | | | | | | | | | | | | | | | | | | | | | | | | | | | | | | | | | | | | | |
| | | | | | | | | | | | | | | | | | | | | | | | | | | | | | | | | | | | | | | | | | | | | | | | | | | | | |
Foreign exchange contracts | | | 2.3 | | | | | | | | | | | | | | | | | | | | | | | | | | | | | | | | | | | | | | | | | | | | | | | | | |
| | | | | | | | | | | | | | | | | | | | | | | | | | | | | | | | | | | | | | | | | | | | | | | | | | | | | |
Equity/index contracts | | | 0.9 | | | | | | | | | | | | | | | | | | | | | | | | | | | | | | | | | | | | | | | | | | | | | | | | | |
| | | | | | | | | | | | | | | | | | | | | | | | | | | | | | | | | | | | | | | | | | | | | | | | | | | | | |
Other | | | 0.4 | | | | | | | | | | | | | | | | | | | | | | | | | | | | | | | | | | | | | | | | | | | | | | | | | |
| | | | | | | | | | | | | | | | | | | | | | | | | | | | | | | | | | | | | | | | | | | | | | | | | | | | | |
| Financial liabilities designated at fair value | | | 12.1 | | | | 1.9 | | | | 1.1 | | | | (0.4 | ) | �� | | 0.0 | | | | 0.0 | | | | 0.0 | | | | 0.0 | | | | 5.9 | | | | (6.0 | ) | | | 5.9 | | | | (5.3 | ) | | | 0.6 | |
| | | | | | | | | | | | | | | | | | | | | | | | | | | | | | | | | | | | | | | | | | | | | | | | | | | | | |
of which: | | | | | | | | | | | | | | | | | | | | | | | | | | | | | | | | | | | | | | | | | | | | | | | | | | | | |
| | | | | | | | | | | | | | | | | | | | | | | | | | | | | | | | | | | | | | | | | | | | | | | | | | | | | |
Non-structured fixed-rate bonds | | | 0.1 | | | | | | | | | | | | | | | | | | | | | | | | | | | | | | | | | | | | | | | | | | | | | | | | | |
| | | | | | | | | | | | | | | | | | | | | | | | | | | | | | | | | | | | | | | | | | | | | | | | | | | | | |
Structured debt instruments issued | | | 8.9 | | | | | | | | | | | | | | | | | | | | | | | | | | | | | | | | | | | | | | | | | | | | | | | | | |
| | | | | | | | | | | | | | | | | | | | | | | | | | | | | | | | | | | | | | | | | | | | | | | | | | | | | |
Structured over-the-counter debt instruments | | | 2.7 | | | | | | | | | | | | | | | | | | | | | | | | | | | | | | | | | | | | | | | | | | | | | | | | | |
| | | | | | | | | | | | | | | | | | | | | | | | | | | | | | | | | | | | | | | | | | | | | | | | | | | | | |
Structured repurchase agreements | | | 0.4 | | | | | | | | | | | | | | | | | | | | | | | | | | | | | | | | | | | | | | | | | | | | | | | | | |
| | | | | | | | | | | | | | | | | | | | | | | | | | | | | | | | | | | | | | | | | | | | | | | | | | | | | |
1 Includes assets pledged as collateral which may be sold or repledged by counterparties.2 Total Level 3 assets as of 31 December 2013 were CHF 15.0 billion (31 December 2012: CHF 19.6 billion). Total Level 3 liabilities as of 31 December 2013 were CHF 16.8 billion (31 December 2012: CHF 21.4 billion).
| | | | | | | | | | | | | | | | | | | | | | | | | | | | | | | | | | | | | | | | | | | | | | | | | | | | |
| | | Total gains/losses included in comprehensive income | | | | | | | | | | | | | | | | | | | | | | | | | |
Balance as of 31 December 2012 | | Net
trading
income | | | of which:
related to
Level 3
instruments
held at
the end of
the
reporting
period | | | Net
interest
income
and other
income | | | of which:
related to
Level 3
instruments
held at
the end of
the
reporting
period | | | Other
comprehensive
income | | | Purchases | | | Sales | | | Issuances | | | Settlements | | | Transfers
into
Level 3 | | | Transfers
out of
Level 3 | | | Foreign
currency
translation | | | Balance as
of
31 December
20132 | |
5.7 | | | (2.4 | ) | | | (1.3 | ) | | | 0.0 | | | | 0.0 | | | | 0.0 | | | | 2.1 | | | | (6.8 | ) | | | 5.0 | | | | 0.0 | | | | 2.2 | | | | (1.2 | ) | | | (0.2 | ) | | | 4.3 | |
| | | | | | | | | | | | | | | | | | | | | | | | | | | | | | | | | | | | | | | | | | | | | | | | | | | | | |
1.6 | | | 0.0 | | | | 0.0 | | | | 0.0 | | | | 0.0 | | | | 0.0 | | | | 0.9 | | | | (0.8 | ) | | | 0.0 | | | | 0.0 | | | | 0.3 | | | | (0.2 | ) | | | 0.0 | | | | 1.7 | |
| | | | | | | | | | | | | | | | | | | | | | | | | | | | | | | | | | | | | | | | | | | | | | | | | | | | | |
2.0 | | | (2.1 | ) | | | (1.2 | ) | | | 0.0 | | | | 0.0 | | | | 0.0 | | | | 0.7 | | | | (4.9 | ) | | | 5.0 | | | | 0.0 | | | | 0.6 | | | | (0.2 | ) | | | 0.0 | | | | 1.0 | |
| | | | | | | | | | | | | | | | | | | | | | | | | | | | | | | | | | | | | | | | | | | | | | | | | | | | | |
1.5 | | | (0.1 | ) | | | (0.1 | ) | | | 0.0 | | | | 0.0 | | | | 0.0 | | | | 0.2 | | | | (0.7 | ) | | | 0.0 | | | | 0.0 | | | | 0.6 | | | | (0.5 | ) | | | (0.2 | ) | | | 1.0 | |
| | | | | | | | | | | | | | | | | | | | | | | | | | | | | | | | | | | | | | | | | | | | | | | | | | | | | |
0.6 | | | (0.2 | ) | | | 0.0 | | | | 0.0 | | | | 0.0 | | | | 0.0 | | | | 0.3 | | | | (0.4 | ) | | | 0.0 | | | | 0.0 | | | | 0.6 | | | | (0.2 | ) | | | 0.0 | | | | 0.6 | |
| | | | | | | | | | | | | | | | | | | | | | | | | | | | | | | | | | | | | | | | | | | | | | | | | | | | | |
4.9 | | | 0.2 | | | | 1.5 | | | | 0.0 | | | | 0.0 | | | | 0.0 | | | | 0.0 | | | | 0.0 | | | | 2.6 | | | | (3.3 | ) | | | 0.2 | | | | (0.2 | ) | | | (0.1 | ) | | | 4.4 | |
| | | | | | | | | | | | | | | | | | | | | | | | | | | | | | | | | | | | | | | | | | | | | | | | | | | | | |
1.4 | | | (0.6 | ) | | | (0.6 | ) | | | 0.0 | | | | 0.0 | | | | 0.0 | | | | 0.0 | | | | 0.0 | | | | 1.2 | | | | (0.8 | ) | | | 0.1 | | | | (0.2 | ) | | | 0.0 | | | | 1.1 | |
| | | | | | | | | | | | | | | | | | | | | | | | | | | | | | | | | | | | | | | | | | | | | | | | | | | | | |
3.3 | | | 0.8 | | | | 2.1 | | | | 0.0 | | | | 0.0 | | | | 0.0 | | | | 0.0 | | | | 0.0 | | | | 1.3 | | | | (2.4 | ) | | | 0.2 | | | | 0.0 | | | | (0.1 | ) | | | 3.1 | |
| | | | | | | | | | | | | | | | | | | | | | | | | | | | | | | | | | | | | | | | | | | | | | | | | | | | | |
0.2 | | | 0.0 | | | | 0.0 | | | | 0.0 | | | | 0.0 | | | | 0.0 | | | | 0.0 | | | | 0.0 | | | | 0.0 | | | | (0.1 | ) | | | 0.0 | | | | 0.0 | | | | 0.0 | | | | 0.2 | |
| | | | | | | | | | | | | | | | | | | | | | | | | | | | | | | | | | | | | | | | | | | | | | | | | | | | | |
0.7 | | | 0.0 | | | | 0.0 | | | | 0.0 | | | | 0.0 | | | | 0.1 | | | | 0.1 | | | | (0.2 | ) | | | 0.0 | | | | 0.0 | | | | 0.1 | | | | (0.1 | ) | | | 0.0 | | | | 0.8 | |
| | | | | | | | | | | | | | | | | | | | | | | | | | | | | | | | | | | | | | | | | | | | | | | | | | | | | |
8.1 | | | (0.8 | ) | | | (0.5 | ) | | | 0.0 | | | | 0.0 | | | | 0.0 | | | | 0.0 | | | | (0.1 | ) | | | 2.2 | | | | (4.7 | ) | | | 3.8 | | | | (2.7 | ) | | | (0.3 | ) | | | 5.5 | |
| | | | | | | | | | | | | | | | | | | | | | | | | | | | | | | | | | | | | | | | | | | | | | | | | | | | | |
3.6 | | | (0.8 | ) | | | (0.6 | ) | | | 0.0 | | | | 0.0 | | | | 0.0 | | | | 0.0 | | | | 0.0 | | | | 1.9 | | | | (3.8 | ) | | | 2.4 | | | | (0.2 | ) | | | (0.1 | ) | | | 3.0 | |
| | | | | | | | | | | | | | | | | | | | | | | | | | | | | | | | | | | | | | | | | | | | | | | | | | | | | |
1.2 | | | (0.2 | ) | | | 0.0 | | | | 0.0 | | | | 0.0 | | | | 0.0 | | | | 0.0 | | | | 0.0 | | | | 0.0 | | | | (0.4 | ) | | | 0.6 | | | | (0.1 | ) | | | (0.2 | ) | | | 0.9 | |
| | | | | | | | | | | | | | | | | | | | | | | | | | | | | | | | | | | | | | | | | | | | | | | | | | | | | |
2.9 | | | 0.4 | | | | 0.4 | | | | 0.0 | | | | 0.0 | | | | 0.0 | | | | 0.0 | | | | (0.1 | ) | | | 0.0 | | | | (0.1 | ) | | | 0.4 | | | | (2.3 | ) | | | 0.0 | | | | 1.2 | |
| | | | | | | | | | | | | | | | | | | | | | | | | | | | | | | | | | | | | | | | | | | | | | | | | | | | | |
0.4 | | | (0.2 | ) | | | (0.3 | ) | | | 0.0 | | | | 0.0 | | | | 0.0 | | | | 0.0 | | | | 0.0 | | | | 0.3 | | | | (0.4 | ) | | | 0.4 | | | | (0.1 | ) | | | 0.0 | | | | 0.3 | |
| | | | | | | | | | | | | | | | | | | | | | | | | | | | | | | | | | | | | | | | | | | | | | | | | | | | | |
6.5 | | | (0.5 | ) | | | (0.1 | ) | | | 0.0 | | | | 0.0 | | | | 0.0 | | | | 0.0 | | | | 0.0 | | | | 1.4 | | | | (4.6 | ) | | | 3.0 | | | | (1.0 | ) | | | (0.4 | ) | | | 4.4 | |
| | | | | | | | | | | | | | | | | | | | | | | | | | | | | | | | | | | | | | | | | | | | | | | | | | | | | |
3.3 | | | (0.8 | ) | | | (0.3 | ) | | | 0.0 | | | | 0.0 | | | | 0.0 | | | | 0.0 | | | | 0.0 | | | | 0.4 | | | | (3.3 | ) | | | 2.7 | | | | (0.3 | ) | | | 0.0 | | | | 2.0 | |
| | | | | | | | | | | | | | | | | | | | | | | | | | | | | | | | | | | | | | | | | | | | | | | | | | | | | |
1.5 | | | (0.1 | ) | | | (0.1 | ) | | | 0.0 | | | | 0.0 | | | | 0.0 | | | | 0.0 | | | | 0.0 | | | | 0.0 | | | | (0.5 | ) | | | 0.0 | | | | 0.0 | | | | (0.3 | ) | | | 0.5 | |
| | | | | | | | | | | | | | | | | | | | | | | | | | | | | | | | | | | | | | | | | | | | | | | | | | | | | |
1.3 | | | 0.5 | | | | 0.4 | | | | 0.0 | | | | 0.0 | | | | 0.0 | | | | 0.0 | | | | 0.0 | | | | 0.7 | | | | (0.7 | ) | | | 0.1 | | | | (0.5 | ) | | | 0.0 | | | | 1.5 | |
| | | | | | | | | | | | | | | | | | | | | | | | | | | | | | | | | | | | | | | | | | | | | | | | | | | | | |
0.4 | | | (0.1 | ) | | | (0.1 | ) | | | 0.0 | | | | 0.0 | | | | 0.0 | | | | 0.0 | | | | 0.0 | | | | 0.3 | | | | (0.1 | ) | | | 0.2 | | | | (0.2 | ) | | | (0.1 | ) | | | 0.5 | |
| | | | | | | | | | | | | | | | | | | | | | | | | | | | | | | | | | | | | | | | | | | | | | | | | | | | | |
14.7 | | | (0.4 | ) | | | 1.0 | | | | 0.0 | | | | 0.0 | | | | 0.0 | | | | 0.0 | | | | 0.0 | | | | 6.4 | | | | (9.4 | ) | | | 2.9 | | | | (1.7 | ) | | | (0.2 | ) | | | 12.1 | |
| | | | | | | | | | | | | | | | | | | | | | | | | | | | | | | | | | | | | | | | | | | | | | | | | | | | | |
0.8 | | | (0.1 | ) | | | (0.1 | ) | | | 0.0 | | | | 0.0 | | | | 0.0 | | | | 0.0 | | | | 0.0 | | | | 1.1 | | | | (0.8 | ) | | | 0.5 | | | | (0.1 | ) | | | 0.0 | | | | 1.2 | |
| | | | | | | | | | | | | | | | | | | | | | | | | | | | | | | | | | | | | | | | | | | | | | | | | | | | | |
10.0 | | | 1.2 | | | | 0.6 | | | | 0.0 | | | | 0.0 | | | | 0.0 | | | | 0.0 | | | | 0.0 | | | | 3.2 | | | | (6.7 | ) | | | 1.9 | | | | (1.4 | ) | | | (0.1 | ) | | | 7.9 | |
| | | | | | | | | | | | | | | | | | | | | | | | | | | | | | | | | | | | | | | | | | | | | | | | | | | | | |
2.2 | | | (0.4 | ) | | | (0.3 | ) | | | 0.0 | | | | 0.0 | | | | 0.0 | | | | 0.0 | | | | 0.0 | | | | 1.0 | | | | (1.3 | ) | | | 0.5 | | | | (0.1 | ) | | | (0.1 | ) | | | 1.8 | |
| | | | | | | | | | | | | | | | | | | | | | | | | | | | | | | | | | | | | | | | | | | | | | | | | | | | | |
1.7 | | | (1.0 | ) | | | 0.8 | | | | 0.0 | | | | 0.0 | | | | 0.0 | | | | 0.0 | | | | 0.0 | | | | 1.1 | | | | (0.6 | ) | | | 0.0 | | | | 0.0 | | | | 0.0 | | | | 1.2 | |
| | | | | | | | | | | | | | | | | | | | | | | | | | | | | | | | | | | | | | | | | | | | | | | | | | | | | |
Financial information
Notes to the consolidated financial statements
Note 24 Fair value measurement (continued)
h) Valuation of assets and liabilities classified as Level 3
The table on the following pages presents the Group’s assets and liabilities recognized at fair value and classified as Level 3, together with the valuation techniques used to measure fair value, the significant inputs used in the valuation technique that are considered unobservable and a range of values for those unobservable inputs.
The range of values represents the highest and lowest level input used in the valuation techniques. Therefore, the range does
not reflect the level of uncertainty regarding a particular input, but rather the different underlying characteristics of the relevant assets and liabilities. The ranges will therefore vary from period to period and parameter to parameter based on characteristics of the instruments held at each balance sheet date. Further, the ranges of unobservable inputs may differ across other financial institutions due to the diversity of the products in each firm’s inventory.
Valuation techniques and inputs used in the fair value measurement of Level 3 assets and liabilities
| | | | | | | | | | | | | | | | | | | | | | | | | | | | |
| | | Fair value as of 31.12.13 | | | | | | | | | Range of inputs | |
| CHF billion | | Assets | | | Liabilities | | | Valuation technique(s) | | | Significant unobservable input(s)1 | | | low | | | high | | | unit1 | |
| Financial assets held for trading/Trading portfolio liabilities, Financial assets/liabilities designated at fair value and Financial investments available-for-sale | | | | | | | | | | | | | | | | | | | | | | | | | | | | |
| | | | | | | | | | | | | | | | | | | | | | | | | | | | | |
| Corporate bonds and municipal bonds,including bonds issued by financial institutions | | | 1.8 | | | | 0.2 | | | | Relative value to market comparable | | | | Bond price equivalent | | | | 0 | | | | 127 | | | | points | |
| | | | | | | | | | | | | | | | | | | | | | | | | | | | | |
| Traded loans, loans designated at fair value and loan commitments | | | 2.2 | | | | 0.0 | | | | Relative value to market comparable | | | | Loan price equivalent | | | | 0 | | | | 102 | | | | points | |
| | | | | | | | | | | | | | | | | | | | | | | | | | | | | |
| | | | | | | | | | | Discounted expected cash flows | | | | Credit spread | | | | 65 | | | | 125 | | | | basis points | |
| | | | | | | | | | | | | | | | | | | | | | | | | | | | | |
| | | | | | | | | |
| Market comparable and
securitization model |
| | | Discount margin/spread | | | | 1 | | | | 15 | | | | | % |
| | | | | | | | | | | | | | | | | | | | | | | | | | | | | |
| | | | | | | | | | | Mortality dependent cash flow | | | | Volatility of mortality | | | | 21 | | | | 128 | | | | | % |
| | | | | | | | | | | | | | | | | | | | | | | | | | | | | |
| Investment fund units2 | | | 0.6 | | | | 0.0 | | | | Relative value to market comparable | | | | Net asset value | | | | | | | | | | | | | |
| | | | | | | | | | | | | | | | | | | | | | | | | | | | | |
| Asset-backed securities | | | 1.0 | | | | 0.0 | | | | Discounted cash flow projection | | |
| Constant prepayment
rate |
| | | 0 | | | | 18 | | | | | % |
| | | | | | | | | | | | | | | | | | | | | | | | | | | | | |
| | | | | | | | | | | | | | | Constant default rate | | | | 0 | | | | 10 | | | | | % |
| | | | | | | | | | | | | | | | | | | | | | | | | | | | | |
| | | | | | | | | | | | | | | Loss severity | | | | 0 | | | | 100 | | | | | % |
| | | | | | | | | | | | | | | | | | | | | | | | | | | | | |
| | | | | | | | | | | | | | | Discount margin/spread | | | | 1 | | | | 39 | | | | | % |
| | | | | | | | | | | | | | | | | | | | | | | | | | | | | |
| | | | | | | | | | | Relative value to market comparable | | | | Bond price equivalent | | | | 0 | | | | 102 | | | | points | |
| | | | | | | | | | | | | | | | | | | | | | | | | | | | | |
| Equity instruments2 | | | 0.6 | | | | 0.0 | | | | Relative value to market comparable | | | | Price | | | | | | | | | | | | | |
| | | | | | | | | | | | | | | | | | | | | | | | | | | | | |
| Structured (reverse) repurchase agreements | | | 3.1 | | | | 1.2 | | | | Discounted expected cash flows | | | | Funding spread | | | | 10 | | | | 163 | | | | basis points | |
| | | | | | | | | | | | | | | | | | | | | | | | | | | | | |
| Financial assets for unit-linked investment contracts2 | | | 0.1 | | | | | | | | Relative value to market comparable | | | | Price | | | | | | | | | | | | | |
| | | | | | | | | | | | | | | | | | | | | | | | | | | | | |
| Structured debt instruments and non-structured fixed-rate bonds3 | | | | | | | 11.0 | | | | | | | | | | | | | | | | | | | | | |
| | | | | | | | | | | | | | | | | | | | | | | | | | | | | |
Note 24 Fair value measurement (continued)
Valuation techniques and inputs used in the fair value measurement of Level 3 assets and liabilities (continued)
| | | | | | | | | | | | | | | | | | | | | | | | | | | | |
| | | Fair value as of 31.12.13 | | | | | | | | | Range of inputs | |
| CHF billion | | Assets | | | Liabilities | | | Valuation technique(s) | | | Significant unobservable
input(s)1 | | | low | | | high | | | unit1 | |
| Replacement values | | | | | | | | | | | | | | | | | | | | | | | | | | | | |
| | | | | | | | | | | | | | | | | | | | | | | | | | | | | |
| Interest rate contracts | | | 0.3 | | | | 0.4 | | | | Option model | | | | Volatility of interest rates | | | | 13 | | | | 73 | | | | | % |
| | | | | | | | | | | | | | | | | | | | | | | | | | | | | |
| | | | | | | | | | | | | | | Rate to rate correlation | | | | 84 | | | | 94 | | | | | % |
| | | | | | | | | | | | | | | | | | | | | | | | | | | | | |
| | | | | | | | | | | | | | | Intra-curve correlation | | | | 50 | | | | 84 | | | | | % |
| | | | | | | | | | | | | | | | | | | | | | | | | | | | | |
| | | | | | | | | | | Discounted expected cash flows | | | | Constant prepayment rate | | | | 0 | | | | 3 | | | | | % |
| | | | | | | | | | | | | | | | | | | | | | | | | | | | | |
| | | | | | | | | | | Discounted expected | | | | | | | | | | | | | | | | | |
| | | | | | | | | | | cash flow based on modeled | | | | | | | | | | | | | | | | | |
| Credit derivative contracts | | | 3.0 | | | | 2.0 | | | | defaults and recoveries | | | | Credit spreads | | | | 2 | | | | 1,407 | | | | basis points | |
| | | | | | | | | | | | | | | | | | | | | | | | | | | | | |
| | | | | | | | | | | | | | | Upfront price points | | | | (12 | ) | | | 68 | | | | | % |
| | | | | | | | | | | | | | | | | | | | | | | | | | | | | |
| | | | | | | | | | | | | | | Recovery rates | | | | 0 | | | | 95 | | | | | % |
| | | | | | | | | | | | | | | | | | | | | | | | | | | | | |
| | | | | | | | | | | | | | | Credit index correlation | | | | 10 | | | | 90 | | | | | % |
| | | | | | | | | | | | | | | | | | | | | | | | | | | | | |
| | | | | | | | | | | | | | | Discount margin/spread | | | | 0 | | | | 39 | | | | | % |
| | | | | | | | | | | | | | | | | | | | | | | | | | | | | |
| | | | | | | | | | | | | | | Credit pair correlation | | | | 42 | | | | 92 | | | | | % |
| | | | | | | | | | | | | | | | | | | | | | | | | | | | | |
| | | | | | | | | | | Discounted cash flow projection | | | | | | | | | | | | | | | | | |
| | | | | | | | | | | on underlying bond | | | | Constant prepayment rate | | | | 0 | | | | 15 | | | | | % |
| | | | | | | | | | | | | | | | | | | | | | | | | | | | | |
| | | | | | | | | | | | | | | Constant default rate | | | | 0 | | | | 12 | | | | | % |
| | | | | | | | | | | | | | | | | | | | | | | | | | | | | |
| | | | | | | | | | | | | | | Loss severity | | | | 0 | | | | 100 | | | | | % |
| | | | | | | | | | | | | | | | | | | | | | | | | | | | | |
| | | | | | | | | | | | | | | Discount margin/spread | | | | 0 | | | | 38 | | | | | % |
| | | | | | | | | | | | | | | | | | | | | | | | | | | | | |
| | | | | | | | | | | | | | | Bond price equivalent | | | | 0 | | | | 100 | | | | points | |
| | | | | | | | | | | | | | | | | | | | | | | | | | | | | |
| | | | | | | | | | | | | | | Volatility of foreign | | | | | | | | | | | | | |
| Foreign exchange contracts | | | 0.9 | | | | 0.5 | | | | Option model | | | | exchange | | | | 7 | | | | 20 | | | | | % |
| | | | | | | | | | | | | | | | | | | | | | | | | | | | | |
| | | | | | | | | | | | | | | Rate to FX correlation | | | | (71 | ) | | | 60 | | | | | % |
| | | | | | | | | | | | | | | | | | | | | | | | | | | | | |
| | | | | | | | | | | | | | | FX to FX correlation | | | | (83 | ) | | | 80 | | | | | % |
| | | | | | | | | | | | | | | | | | | | | | | | | | | | | |
| | | | | | | | | | | Discounted expected cash flows | | | | Constant prepayment rate | | | | 0 | | | | 13 | | | | | % |
| | | | | | | | | | | | | | | | | | | | | | | | | | | | | |
| Equity/index contracts | | | 1.2 | | | | 1.5 | | | | Option model | | | | Equity dividend yields | | | | 0 | | | | 10 | | | | | % |
| | | | | | | | | | | | | | | | | | | | | | | | | | | | | |
| | | | | | | | | | | | | | | Volatility of equity stocks, | | | | | | | | | | | | | |
| | | | | | | | | | | | | | | equity and other indices | | | | 1 | | | | 88 | | | | | % |
| | | | | | | | | | | | | | | | | | | | | | | | | | | | | |
| | | | | | | | | | | | | | | Equity – FX correlation | | | | (52 | ) | | | 77 | | | | | % |
| | | | | | | | | | | | | | | | | | | | | | | | | | | | | |
| | | | | | | | | | | | | |
| Equity to equity
correlation |
| | | 17 | | | | 99 | | | | | % |
| | | | | | | | | | | | | | | | | | | | | | | | | | | | | |
| Non-financial assets2,4 | | | 0.1 | | | | | | |
| Relative value to market
comparable |
| | | Price | | | | | | | | | | | | | |
| | | | | | | | | | | | | | | | | | | | | | | | | | | | | |
| | | | | | | | | | | | | | | Projection of cost and | | | | | | | | | | | | | |
| | | | | | | | | | | | | | | income related to the | | | | | | | | | | | | | |
| | | | | | | | | | | Discounted cash flow projection | | | | particular property | | | | | | | | | | | | | |
| | | | | | | | | | | | | | | | | | | | | | | | | | | | | |
| | | | | | | | | | | | | | | Discount rate | | | | | | | | | | | | | |
| | | | | | | | | | | | | | | | | | | | | | | | | | | | | |
| | | | | | | | | | | | | |
| Assessment of the
particular property’s
condition |
| | | | | | | | | | | | |
| | | | | | | | | | | | | | | | | | | | | | | | | | | | | |
1 The ranges of significant unobservable inputs are represented in points, percentages and basis points. Points are a percentage of par. For example, 100 points would be 100% of par. 2 The range of inputs is not disclosed due to the dispersion of possible values given the diverse nature of the investments. 3 Valuation techniques, significant unobservable inputs and the respective input ranges for structured debt instruments and non-structured fixed-rate bonds are the same as the equivalent derivative or structured financing instruments presented elsewhere in this table. 4 Non-financial assets include investment properties at fair value and other assets which primarily consist of assets held for sale.
Financial information
Notes to the consolidated financial statements
Note 24 Fair value measurement (continued)
Significant unobservable inputs in Level 3 positions
This section discusses the significant unobservable inputs identified in the table above and assesses the potential effect that a change in each unobservable input in isolation may have on a fair value measurement, including information to facilitate an understanding of factors that give rise to the input ranges shown. Relationships between observable and unobservable inputs have not been included in the summary below.
Bond price equivalent: Where market prices are not available for a bond, fair value is measured by comparison with observable pricing data from similar instruments. Factors considered when selecting comparable instruments include credit quality, maturity and industry of the issuer. Fair value may be measured either by a direct price comparison or by conversion of an instrument price into a yield (either as an outright yield or as a spread to LIBOR). Bond prices are expressed as points of the nominal, where 100 represents a fair value equal to the nominal value (i.e., par).
For corporate and municipal bonds, the range of 0–127 represents the range of prices from reference issuances used in determining fair value. Bonds priced at 0 are distressed to the point that no recovery is expected, while prices significantly in excess of 100 or “par” relate to inflation-linked or structured issuances that pay a coupon in excess of the market benchmark as of the measurement date. The weighted average price is approximately 87 points, with a majority of positions concentrated around this price.
For asset-backed securities, the bond price range of 0–102 points represents the range of prices for reference securities used in determining fair value. An instrument priced at 0 is not expected to pay any principal or interest, while an instrument priced close to 100 points is expected to be repaid in full as well as pay a yield close to the market yield. More than 75% of the portfolio is priced at 80 points or higher, and the weighted average price for Level 3 assets within this portion of the Level 3 portfolio is 84 points.
For credit derivatives, the bond price range of 0–100 points disclosed within credit derivatives represents the range of prices used for reference instruments that are typically converted to an equivalent yield or credit spread as part of the valuation process. The range is comparable to that for corporate and asset-backed issuances described above.
Loan price equivalent: Where market prices are not available for a traded loan, fair value is measured by comparison with observable pricing data for similar instruments. Factors considered when selecting comparable instruments include industry segment, collateral quality, maturity and issuer-specific covenants. Fair value may be measured either by a direct price comparison or by conversion of an instrument price into a yield. The range of 0–102 points represents the range of prices derived from reference issuances of a similar credit quality used in measuring fair value for loans classified as Level 3. Loans priced at 0 are distressed to the point that
no recovery is expected, while a current price of 102 represents a loan that is expected to be repaid in full, and also pays a yield marginally higher than market yield. The portfolio is distributed at both the very low end and the very high end of the disclosed range with a weighted average of approximately 90 points.
Credit spread: Valuation models for many credit derivatives require an input for the credit spread, which is a reflection of the credit quality of the associated referenced underlying. The credit spread of a particular security is quoted in relation to the yield on a benchmark security or reference rate, typically either US Treasury or LIBOR, and is generally expressed in terms of basis points. An increase/(decrease) in credit spread will increase/(decrease) the value of credit protection offered by CDS and other credit derivative products. The impact on the results of the Group of such changes depend on the nature and direction of the positions held. Credit spreads may be negative where the asset is more creditworthy than the benchmark against which the spread is calculated. A wider credit spread represents decreasing creditworthiness. The ranges of 65–125 basis points in loans and 2–1407 basis points in credit derivatives represents a diverse set of underlyings, with the lower end of the range representing credits of the highest quality (e.g., approximating the risk of LIBOR) and the upper end of the range representing greater levels of credit risk.
Constant prepayment rate: A prepayment rate represents the amount of unscheduled principal repayment for a pool of loans. The prepayment estimate is based on a number of factors, such as historical prepayment rates for previous loans that are similar pool loans and the future economic outlook, considering factors including, but not limited to, future interest rates. In general, a significant increase (decrease) in this unobservable input in isolation would result in a significantly higher (lower) fair value for bonds trading at a discount. For bonds trading at a premium the reverse would apply, with a decrease in fair value when the constant prepayment rate increases. However, in certain cases the effect of a change in prepayment speed upon instrument price is more complicated and is dependent upon both the precise terms of the securitization and the position of the instrument within the securitization capital structure.
For asset-backed securities, the range of 0–18% represents inputs across various classes of asset-backed securities. Securities with an input of 0% typically reflect no current prepayment behavior within their underlying collateral with no expectation of this changing in the immediate future, while the high range of 18% relates to securities that are currently experiencing high prepayments. Different classes of asset-backed securities typically show different ranges of prepayment characteristics depending on a combination of factors, including the borrowers’ ability to refinance, prevailing refinancing rates, and the quality or characteristics of the underlying loan collateral pools. The weighted average constant prepayment rate for the portfolio is 2%.
Note 24 Fair value measurement (continued)
For credit derivatives, the range of 0–15% represents the input assumption for credit derivatives on asset-backed securities. The range is driven in a similar manner to that for asset-backed securities.
For FX contracts and interest rate contracts, the ranges of 0–13% and 0–3%, respectively, represent the prepayment assumptions on securitizations underlying the BGS portfolio. This portfolio is less diverse than other asset-backed securities portfolios and the range of prepayment speed is therefore narrower.
Constant default rate (CDR): The CDR represents the percentage of outstanding principal balances in the pool that are projected to default and liquidate and is the annualized rate of default for a group of mortgages or loans. The CDR estimate is based on a number of factors, such as collateral delinquency rates in the pool and the future economic outlook. In general, a significant increase (decrease) in this unobservable input in isolation would result in significantly lower (higher) cash flows for the deal (and thus lower (higher) valuations). However, different instruments within the capital structure can react differently to changes in the CDR rate. Generally, subordinated bonds will decrease in value as CDR increases, but for well-protected senior bonds an increase in CDR may cause an increase in price. In addition, the presence of a guarantor wrap on the collateral pool of a security may result in notes at the junior end of the capital structure experiencing a price increase with an increase in the default rate.
The ranges of 0–10% for asset-backed securities and 0–12% for credit derivatives represent the expected default percentage across the individual instruments’ underlying collateral pools. For asset-backed securities, the weighted average CDR is 2%.
Loss severity/recovery rate: The projected loss severity/recovery rate reflects the estimated loss that will be realized given expected defaults. Loss severity is generally applied to collateral within asset-backed securities while the recovery rate is the analogous pricing input for corporate or sovereign credits. Recovery is the reverse of loss severity, so a 100% recovery rate is the equivalent of a 0% loss severity. Increases in loss severity levels/decrease in recovery rates will result in lower expected cash flows into the structure upon the default of the instruments. In general, a significant decrease (increase) in the loss severity in isolation would result in significantly higher (lower) fair value for the respective asset-backed securities. The impact of a change in recovery rate on a credit derivative position will depend upon whether credit protection has been bought or sold.
Loss severity is ultimately driven by the value recoverable from collateral held after foreclosure occurs relative to the loan principal and possibly unpaid interest accrued at that point. The range of 0–100% for asset-backed securities represents the different quality and nature of collateral within the asset-backed securities portfolio. The weighted average loss severity is 90%. For credit derivatives, the loss severity range of 0–100% applies to derivatives
on asset-backed securities and is broadly similar to the range for cash positions held. The recovery rate range of 0–95% represents a wide range of expected recovery levels on credit derivative contracts within the Level 3 portfolio.
Discount margin (DM) spread: The DM spread represents the discount rates used to present value cash flows of an asset to reflect the market return required for uncertainty in the estimated cash flows. DM spreads are a rate or rates applied on top of a floating index (e.g., LIBOR) to discount expected cash flows. Generally, a decrease (increase) in the unobservable input in isolation would result in a significantly higher (lower) fair value.
The different ranges represent the different discount rates across loans (1–15%), asset-backed securities (1–39%) and credit derivatives (0–39%). The high end of the range relates to securities that are priced very low within the market relative to the expected cash flow schedule and there is significant discounting relative to the expected cash flow schedule. This indicates that the market is pricing an increased risk of credit loss into the security that is greater than what is being captured by the expected cash flow generation process. The low ends of the ranges are typical of funding rates on better quality instruments. For asset-backed securities, the weighted average DM is 5.5%. For loans, the average effective DM is 1.84% compared with the disclosed range of 1–15%.
Equity dividend yields: The derivation of a forward price for an individual stock or index is important both for measuring fair value for forward or swap contracts and for measuring fair value using option pricing models. The relationship between the current stock price and the forward price, is based on a combination of expected future dividend levels and payment timings, and, to a lesser extent, the relevant funding rates applicable to the stock in question. Dividend yields are generally expressed as an annualized percentage of share price with the lowest limit of 0% representing a stock that is not expected to pay any dividend. The dividend yield and timing represents the most significant parameter in determining fair value for instruments that are sensitive to an equity forward price. The range of 0–10% reflects the expected range of dividend rates for the portfolio.
Volatility: Volatility measures the variability of future prices for a particular instrument and is generally expressed as a percentage, where a higher number reflects a more volatile instrument for which future price movements are more likely to occur. The minimum level of volatility is 0% and there is no theoretical maximum. Volatility is a key input into option models, where it is used to derive a probability-based distribution of future prices for the underlying instrument. The effect of volatility on individual positions within the portfolio is driven primarily by whether the option contract is a long or short position. In most cases, the fair value of an option increases as a result of an increase in volatility and is reduced by a decrease in volatility. Generally, volatility used in the
Financial information
Notes to the consolidated financial statements
Note 24 Fair value measurement (continued)
measurement of fair value is derived from active market option prices (referred to as “implied” volatility). A key feature of implied volatility is the volatility “smile” or “skew,” which represents the effect of pricing options of different option strikes at different implied volatility levels.
| – | | Volatility of interest rates – the range of 13–73% reflects the range of unobservable volatilities across different currencies and related underlying interest rate levels. Volatilities of low interest rates tend to be much higher than volatilities of high interest rates. In addition, different currencies may have significantly different implied volatilities. |
| – | | Volatility of foreign exchange – the range of 7–20% reflects differences across various FX rates. |
| – | | Volatility of equity stocks, equity and other indices – the range of 1–88% is reflective of the range of underlying stock volatilities. |
| – | | Volatility of mortality – the range of 21–128% represents mortality volatility assumptions for different components of the mortality contingent loan portfolio. The range in volatility inputs is driven by different characteristics of contracts within the portfolio. An increase in volatility will cause an increase in loan value as the notional drawn will tend to increase. |
Correlation: Correlation measures the inter-relationship between the movements of two variables. It is expressed as a percentage between –100% and +100% where +100% are perfectly correlated variables (meaning a movement of one variable is associated with a movement of the other variable in the same direction), and –100% are inversely correlated variables (meaning a movement of one variable is associated with a movement of the other variable in the opposite direction). The effect of correlation on the measurement of fair value is dependent on the specific terms of the instruments being valued, due to the range of different payoff features within such instruments.
| – | | Rate-to-rate correlation – the correlation between interest rates of two separate currencies. The range of 84–94% results from the different pairs of currency involved. |
| – | | Intra-curve correlation – the correlation between different tenor points of the same yield curve. Correlations are typically fairly high, as reflected by the range of 50–84%. |
| – | | Credit index correlation of 10–90% reflects the implied correlation derived from different indices across different parts of the benchmark index capital structure. The input is particularly important for bespoke and Level 3 index tranches. |
| – | | Credit pair correlation is particularly important for FTD credit structures. The range of 42–92% reflects the difference between credits with low correlation and similar highly correlated credits. |
| – | | Rate-to-FX correlation – captures the correlation between in- terest rates and FX rates. The range for the portfolio is (71)– 60%, which represents the relationship between interest rates and foreign exchange levels. The signage on such correlations |
| | | is dependent on the quotation basis of the underlying FX rate (e.g., EUR/USD and USD/EUR correlations to the same interest rate will have opposite signs). |
| – | | FX-to-FX correlation is particularly important for complex options that incorporate different FX rates in the projected payoff. The range of (83)–80% reflects the underlying characteristics across the main FX pairs to which the Group has exposures. |
| – | | Equity-to-equity correlation is particularly important for com- plex options that incorporate, in some manner, different equities in the projected payoff. The closer the correlation is to 100%, the more related one equity is to another. For example, equities with a very high correlation could be from different parts of the same corporate structure. The range of 17–99% is reflective of this. |
| – | | Equity-to-FX correlation is important for equity options based on a currency different to the currency of the underlying stock. The range of (52)–77% represents the range of the relation- ship between underlying stock and foreign exchange volatilities. |
Funding spread: Structured financing transactions are valued using synthetic funding curves that best represent the assets that are pledged as collateral to the transactions. They are not representative of where the Group can fund itself on an unsecured basis, but provide an estimate of where the Group can source and deploy secured funding with counterparties for a given type of collateral. The funding spreads are expressed in terms of basis points over or under LIBOR and if funding spreads widen this increases the impact of discounting. The range of 10–163 basis points for both structured repurchase agreements and structured reverse repurchase agreements represents the range of asset funding curves, where wider spreads are due to a reduction in liquidity of underlying collateral for funding purposes.
A small proportion of structured debt instruments and non-structured fixed-rate bonds within financial liabilities designated at fair value has an exposure to funding spreads that is longer in duration than the actively traded market. Such positions are within the range of 10 – 163 basis points reported above.
Upfront price points: A component in the price quotation of credit derivative contracts, whereby the overall fair value price level is split between the credit spread (basis points running over the life of the contract as described above) and a component that is quoted and settled upfront on transacting a new contract. This latter component is referred to as upfront price points and represents the difference between the credit spread paid as protection premium on a current contract versus a small number of standard contracts defined by the market. Distressed credit names frequently trade and quote CDS protection only in upfront points rather than as a running credit spread. An increase/(decrease) in upfront points will increase/(decrease) the value of credit protection offered by CDS and other credit derivative products. The
Note 24 Fair value measurement (continued)
effect on the results of the Group of increases or decreases in upfront price points depends on the nature and direction of the positions held. Upfront pricing points may be negative where a contract is quoting for a narrower premium than the market standard, but are generally positive, reflecting an increase in credit premium required by the market as creditworthiness deteriorates.
The range of (12)–68% within the table above represents the variety of current market credit spread levels relative to the benchmarks used as a quotation basis. Upfront points of (12)% reflect an instrument that is trading with a tighter credit spread than the underlying quotation instrument, while upfront points of 68% represent a distressed credit.
i) Sensitivity of fair value measurements to changes in unobservable input assumptions
The table on the following page summarizes those financial assets and liabilities classified as Level 3 for which a change in one or more of the unobservable inputs to reflect reasonably possible alternative assumptions would change fair value significantly, and the estimated effect thereof. As of 31 December 2013, the total favorable and unfavorable effects of changing one or more of the unobservable inputs to reflect reasonably possible alternative assumptions for financial instruments classified as Level 3 were CHF 1.2 billion and CHF 1.1 billion, respectively (31 December 2012: CHF 1.8 billion and CHF 1.4 billion, respectively). In the table on the following page, the significant change in sensitivity within equity/index derivative contracts from 31 December 2012 to 31 December 2013 resulted from the transfer of UBS’s option to acquire the equity of the SNB StabFund from Level 3 to Level 2 during the third quarter and the subsequent exercise.
The table shown presents the favorable and unfavorable effects for each class of financial assets and liabilities for which the potential change in fair value is considered significant. The sensitivity data presented represents an estimation of valuation uncertainty based on reasonably possible alternative values for Level 3 inputs at the balance sheet date and does not represent the estimated effect of stress scenarios. Typically, these financial assets and liabilities are sensitive to a combination of inputs from Levels 1–3. Although well-defined interdependencies may exist between Levels 1–2 and Level 3 parameters (e.g., between interest rates, which are generally Level 1 or Level 2, and prepayments, which are generally Level 3), these have not been incorporated in the
table. Further, direct inter-relationships between the Level 3 parameters discussed below are not a significant element of the valuation uncertainty.
Sensitivity data is estimated using a number of techniques including the estimation of price dispersion among different market participants, variation in modeling approaches and reasonably possible changes to assumptions used within the fair value measurement process. The sensitivity ranges are not always symmetrical around the fair values as the inputs used in valuations are not always precisely in the middle of the favorable and unfavorable range.
Sensitivity data is determined at a product or parameter level and then aggregated assuming no diversification benefit. The calculated sensitivity is applied to both the outright position and any related hedges. The main interdependencies across different products to a single unobservable input parameter have been included in the basis of netting exposures within the calculation. Aggregation without allowing for diversification involves the simple summation of individual results with, the total sensitivity therefore representing the impact of all unobservable inputs which, if moved to a reasonably possible favorable or unfavorable level at the same time, would result in a significant change in the valuation. Diversification would incorporate estimated correlations across different sensitivity results and, as such, would result in an overall sensitivity that would be less than the sum of the individual component sensitivities. The Group believes that, while there are diversification benefits within the portfolios representing these sensitivity numbers, they are not significant to this analysis.
Financial information
Notes to the consolidated financial statements
Note 24 Fair value measurement (continued)
Sensitivity of fair value measurements to changes in unobservable input assumptions1
| | | | | | | | | | | | | | | | |
| | 31.12.13 | | | 31.12.12 | |
| CHF million | | Favorable
changes2 | | | Unfavorable
changes2 | | | Favorable
changes2 | | | Unfavorable
changes2 | |
| Government bills/bonds | | | 17 | | | | (4 | ) | | | 29 | | | | (2 | ) |
| | | | | | | | | | | | | | | | | |
| Corporate bonds and municipal bonds, including bonds issued by financial institutions | | | 35 | | | | (76 | ) | | | 102 | | | | (70 | ) |
| | | | | | | | | | | | | | | | | |
| Traded loans, loans designated at fair value and loan commitments | | | 148 | | | | (70 | ) | | | 204 | | | | (40 | ) |
| | | | | | | | | | | | | | | | | |
| Asset-backed securities | | | 54 | | | | (46 | ) | | | 74 | | | | (48 | ) |
| | | | | | | | | | | | | | | | | |
| Equity instruments | | | 137 | | | | (84 | ) | | | 151 | | | | (76 | ) |
| | | | | | | | | | | | | | | | | |
| Interest rate derivative contracts, net | | | 127 | | | | (91 | ) | | | 27 | | | | (30 | ) |
| | | | | | | | | | | | | | | | | |
| Credit derivative contracts, net | | | 366 | | | | (419 | ) | | | 577 | | | | (556 | ) |
| | | | | | | | | | | | | | | | | |
| Foreign exchange derivative contracts, net | | | 57 | | | | (56 | ) | | | 89 | | | | (94 | ) |
| | | | | | | | | | | | | | | | | |
| Equity/index derivative contracts, net | | | 41 | | | | (43 | ) | | | 272 | | | | (272 | ) |
| | | | | | | | | | | | | | | | | |
| Structured debt instruments issued | | | 184 | | | | (151 | ) | | | 219 | | | | (151 | ) |
| | | | | | | | | | | | | | | | | |
| Other | | | 63 | | | | (54 | ) | | | 73 | | | | (75 | ) |
| | | | | | | | | | | | | | | | | |
| Total | | | 1,229 | | | | (1,094 | ) | | | 1,818 | | | | (1,414 | ) |
| | | | | | | | | | | | | | | | | |
1 Upon adoption of IFRS 13, UBS refined its methodologies for estimating the sensitivity of fair value measurements to changes in unobservable valuation input assumptions. Refer to “Note 1b Changes in accounting policies, comparability and other adjustments” for more information. 2 Of the total favorable change, CHF 154 million as of 31 December 2013 (31 December 2012: CHF 163 million) related to financial investments available-for-sale. Of the total unfavorable change, CHF 159 million as of 31 December 2013 (31 December 2012: CHF 124 million) related to financial investments available-for-sale.
j) Deferred day-1 profit or loss
As explained above, for new transactions resulting in a financial instrument classified as Level 3, the financial instrument is initially recognized at the transaction price. The transaction price may differ from the fair value obtained using a valuation technique, and any such difference is deferred and not recognized in the income statement and referred to as deferred day-1 profit or loss. The table below reflects the activity in deferred day-1 profit or loss for
these financial instruments, including the aggregate difference yet to be recognized in the income statement at the beginning and end of the reporting period and a reconciliation of changes during the reporting period. Amounts deferred are released and gains or losses are recorded inNet trading income when pricing of equivalent products or the underlying parameters become observable or when the transaction is closed out.
Deferred day 1 profit or loss
| | | | | | | | |
| | For the year ended | |
| CHF million | | 31.12.13 | | | 31.12.12 | |
| Balance at the beginning of the year | | | 474 | | | | 433 | |
| | | | | | | | | |
| Profit/(loss) deferred on new transactions | | | 694 | | | | 424 | |
| | | | | | | | | |
| (Profit)/loss recognized in the income statement | | | (653 | ) | | | (367 | ) |
| | | | | | | | | |
| Foreign currency translation | | | (29 | ) | | | (16 | ) |
| | | | | | | | | |
| Balance at the end of the year | | | 486 | | | | 474 | |
| | | | | | | | | |
Note 24 Fair value measurement (continued)
k) Financial instruments not measured at fair value
The following table reflects the estimated fair values and the fair value hierarchy for UBS’s financial instruments not measured at fair value.
Financial instruments not measured at fair value
| | | | | | | | | | | | | | | | | | | | | | | | | | | | |
| | | 31.12.13 | | | 31.12.12 | |
| | Carrying
value | | | Fair value | | | Carrying
value | | | Fair
value | |
| CHF billion | | Total | | | Total | | | Level 1 | | | Level 2 | | | Level 3 | | | Total | | | Total | |
| Assets | | | | | | | | | | | | | | | | | | | | | | | | | | | | |
| | | | | | | | | | | | | | | | | | | | | | | | | | | | | |
| Cash and balances with central banks | | | 80.9 | | | | 80.9 | | | | 80.9 | | | | 0.0 | | | | 0.0 | | | | 66.4 | | | | 66.4 | |
| | | | | | | | | | | | | | | | | | | | | | | | | | | | | |
| Due from banks | | | 17.2 | | | | 17.2 | | | | 14.7 | | | | 2.4 | | | | 0.0 | | | | 21.2 | | | | 21.2 | |
| | | | | | | | | | | | | | | | | | | | | | | | | | | | | |
| Cash collateral on securities borrowed | | | 27.5 | | | | 27.5 | | | | 0.0 | | | | 27.5 | | | | 0.0 | | | | 37.4 | | | | 37.4 | |
| | | | | | | | | | | | | | | | | | | | | | | | | | | | | |
| Reverse repurchase agreements | | | 91.6 | | | | 91.6 | | | | 0.0 | | | | 91.2 | | | | 0.4 | | | | 130.9 | | | | 131.1 | |
| | | | | | | | | | | | | | | | | | | | | | | | | | | | | |
| Cash collateral receivables on derivative instruments | | | 28.0 | | | | 28.0 | | | | 0.0 | | | | 28.0 | | | | 0.0 | | | | 30.4 | | | | 30.4 | |
| | | | | | | | | | | | | | | | | | | | | | | | | | | | | |
| Loans | | | 287.0 | | | | 289.3 | | | | 0.0 | | | | 165.5 | | | | 123.8 | | | | 279.9 | | | | 282.9 | |
| | | | | | | | | | | | | | | | | | | | | | | | | | | | | |
| Other assets | | | 17.6 | | | | 17.4 | | | | 0.0 | | | | 17.4 | | | | 0.0 | | | | 12.2 | | | | 12.2 | |
| | | | | | | | | | | | | | | | | | | | | | | | | | | | | |
| Liabilities | | | | | | | | | | | | | | | | | | | | | | | | | | | | |
| | | | | | | | | | | | | | | | | | | | | | | | | | | | | |
| Due to banks | | | 12.9 | | | | 12.9 | | | | 10.8 | | | | 2.1 | | | | 0.0 | | | | 23.0 | | | | 23.1 | |
| | | | | | | | | | | | | | | | | | | | | | | | | | | | | |
| Cash collateral on securities lent | | | 9.5 | | | | 9.5 | | | | 0.0 | | | | 9.5 | | | | 0.0 | | | | 9.2 | | | | 9.2 | |
| | | | | | | | | | | | | | | | | | | | | | | | | | | | | |
| Repurchase agreements | | | 13.8 | | | | 13.8 | | | | 0.0 | | | | 13.8 | | | | 0.0 | | | | 38.6 | | | | 38.6 | |
| | | | | | | | | | | | | | | | | | | | | | | | | | | | | |
| Cash collateral payables on derivative instruments | | | 49.1 | | | | 49.1 | | | | 0.0 | | | | 49.1 | | | | 0.0 | | | | 71.1 | | | | 71.1 | |
| | | | | | | | | | | | | | | | | | | | | | | | | | | | | |
| Due to customers | | | 390.8 | | | | 390.8 | | | | 0.0 | | | | 390.8 | | | | 0.0 | | | | 373.5 | | | | 373.5 | |
| | | | | | | | | | | | | | | | | | | | | | | | | | | | | |
| Debt issued | | | 81.4 | | | | 84.0 | | | | 0.0 | | | | 79.3 | | | | 4.7 | | | | 104.7 | | | | 107.7 | |
| | | | | | | | | | | | | | | | | | | | | | | | | | | | | |
| Other liabilities | | | 39.5 | | | | 39.5 | | | | 0.0 | | | | 39.5 | | | | 0.0 | | | | 44.8 | | | | 44.8 | |
| | | | | | | | | | | | | | | | | | | | | | | | | | | | | |
| Guarantees/Loan commitments | | | | | | | | | | | | | | | | | | | | | | | | | | | | |
| | | | | | | | | | | | | | | | | | | | | | | | | | | | | |
| Guarantees1 | | | 0.1 | | | | (0.1 | ) | | | 0.0 | | | | 0.0 | | | | (0.1 | ) | | | 0.1 | | | | (0.1 | ) |
| | | | | | | | | | | | | | | | | | | | | | | | | | | | | |
| Loan commitments2 | | | 0.0 | | | | 0.1 | | | | 0.0 | | | | 0.1 | | | | 0.0 | | | | 0.0 | | | | 0.3 | |
| | | | | | | | | | | | | | | | | | | | | | | | | | | | | |
1 The carrying value of guarantees represented a liability of CHF 0.1 billion as of 31 December 2013 (31 December 2012: CHF 0.1 billion). The estimated fair value of guarantees represented an asset of CHF 0.1 billion as of 31 December 2013 (31 December 2012: CHF 0.1 billion). 2 The carrying value of loan commitments represented a liability of CHF 0.0 billion as of 31 December 2013 (31 December 2012: CHF 0.0 billion). The estimated fair value of loan commitments represented a liability of CHF 0.1 billion as of 31 December 2013 (31 December 2012: CHF 0.3 billion).
Financial information
Notes to the consolidated financial statements
Note 24 Fair value measurement (continued)
The fair values included in the table on the previous page were calculated for disclosure purposes only. The fair value valuation techniques and assumptions described below relate only to the fair value of UBS’s financial instruments not measured at fair value. Other institutions may use different methods and assumptions for their fair value estimation, and therefore such fair value disclosures cannot necessarily be compared from one financial institution to another. UBS applies significant judgments and assumptions to arrive at these fair values, which are more holistic and less sophisticated than UBS’s established fair value and model governance policies and processes applied to financial instruments accounted for at fair value whose fair values impact UBS’s balance sheet and net profit. The following principles were applied when determining fair value estimates for financial instruments not measured at fair value:
| – | | For financial instruments with remaining maturities greater than three months, the fair value was determined from quoted market prices, if available. |
| – | | Where quoted market prices were not available, the fair values were estimated by discounting contractual cash flows using current market interest rates or appropriate yield curves for instruments with similar credit risk and maturity. These estimates generally include adjustments for counterparty credit or UBS’s own credit. |
| – | | For short-term financial instruments with remaining maturities of three months or less, the carrying amount, which is net of credit loss allowances, is generally considered a reasonable estimate of fair value. The following financial instruments not measured at fair value have remaining maturities of three months or less as of 31 December 2013: 100% of cash and balances with central banks, 86% of amounts due from banks, 100% of cash collateral on securities borrowed, 90% of reverse repurchase agreements, 100% of cash collateral receivables on derivatives, 51% of loans, 84% of amounts due to banks, 94% of cash collateral on securities lent, 96% of repurchase agreements, 100% of cash collateral payable on derivatives, 99% of amount due to customers and 17% of debt issued. |
| – | | The fair value estimates for repurchase and reverse repurchase agreements with variable and fixed interest rates, for all maturities, include the valuation of the interest rate component of these instruments. Credit and debit valuation adjustments have not been included in the valuation due to the short-term nature of these instruments. |
| – | | The estimated fair values of off-balance sheet financial instruments are based on market prices for similar facilities and guarantees. Where this information is not available, fair value is estimated using discounted cash flow analysis. |
Note 25 Restricted and transferred financial assets
This Note provides information on restricted financial assets (Note 25a), transfers of financial assets (Note 25b and 25c), and financial assets which are received as collateral with the right to resell or repledge these assets (Note 25d).
a) Restricted financial assets
During 2013, UBS has enhanced its disclosures on restricted financial assets in order to comply with IFRS 12 requirements on significant restrictions that impact the Group’s ability to use the assets and settle the liabilities of the Group. Restricted financial assets consist of assets pledged as collateral against an existing liability or contingent liability and other assets which are otherwise explicitly restricted such that they cannot be used to secure funding. In addition, UBS AG including its branches and its subsidiaries are generally not subject to significant restrictions that would prevent the transfer of dividends and capital within the Group, other than UBS AG’s regulated subsidiaries which are required to maintain capital to comply with local regulations, with a certain level of capital being not available for distribution or transfer. Non-regulated subsidiaries are generally not subject to dividend or capital transfer restrictions. However, exceptions may exist when restrictions are imposed as a result of a contractual-, entity- or country-specific arrangement or requirement.
Financial assets are mainly pledged as collateral in securities lending transactions, in repurchase transactions, against loans from Swiss mortgage institutions and in connection with the issuance of covered
bonds. The Group generally enters into repurchase and securities lending arrangements under standard market agreements, with a market based haircut applied to the collateral, which results in the associated liabilities having a carrying value below the carrying value of the assets. Pledged mortgage loans serve as collateral for existing liabilities against Swiss central mortgage institutions and for existing covered bond issuances of CHF 22,634 million as of 31 December 2013 (31 December 2012: CHF 21,902 million).
Other restricted financial assets include assets protected under client asset segregation rules, assets held by the Group’s insurance entities to back related liabilities to the policy holders, assets held in certain jurisdictions to comply with explicit minimum local asset maintenance requirements and assets held in consolidated bankruptcy remote entities such as certain investment funds and other structured entities. The carrying value of the liabilities associated with these other restricted financial assets is generally equal to the carrying value of the assets, with the exception of assets held to comply with local asset maintenance requirements for which the associated liabilities are greater.
Restricted financial assets
| | | | | | | | |
| | Carrying amount | |
| CHF million | | 31.12.13 | | | 31.12.12 | |
| Financial assets pledged as collateral | | | | | | | | |
| | | | | | | | | |
| Trading portfolio assets | | | 48,368 | | | | 53,656 | |
| | | | | | | | | |
of which: assets pledged as collateral which may be sold or repledged by counterparties | | | 42,449 | | | | 44,698 | |
| | | | | | | | | |
| Loans | | | 33,632 | | | | 34,005 | |
| | | | | | | | | |
of which: mortgage loans1 | | | 33,632 | | | | 33,928 | |
| | | | | | | | | |
| Total financial assets pledged as collateral2 | | | 82,000 | | | | 87,661 | |
| | | | | | | | | |
| Other restricted financial assets | | | | | | | | |
| | | | | | | | | |
| Due from banks | | | 6,570 | | | | 7,804 | |
| | | | | | | | | |
| Reverse repurchase agreements | | | 1,989 | | | | 1,872 | |
| | | | | | | | | |
| Trading portfolio assets | | | 24,252 | | | | 32,715 | |
| | | | | | | | | |
| Cash collateral receivables on derivative instruments | | | 7,939 | | | | 4,080 | |
| | | | | | | | | |
| Financial assets designated at fair value | | | 581 | | | | 655 | |
| | | | | | | | | |
| Financial investments available-for-sale | | | 44 | | | | 2,339 | |
| | | | | | | | | |
| Other | | | 169 | | | | 143 | |
| | | | | | | | | |
| Total other restricted financial assets3 | | | 41,544 | | | | 49,608 | |
| | | | | | | | | |
| Total financial assets pledged and other restricted financial assets | | | 123,544 | | | | 137,269 | |
| | | | | | | | | |
1 Of these pledged mortgage loans, approximately CHF 5.8 billion for 31 December 2013 (31 December 2012: approximately CHF 7.5 billion) could be withdrawn or used for future liabilities or covered bond issuances without breaching existing collateral requirements. 2 Does not include assets placed with central banks related to undrawn credit lines and for payment, clearing and settlement purposes (31 December 2013: CHF 4.3 billion, 31 December 2012: CHF 4.8 billion). 3 Other restricted financial assets as of 31 December 2013 included cash and cash equivalents of CHF 8.3 billion (31 December 2012: CHF 10.1 billion), of which CHF 6.2 billion under Due from banks (31 December 2012: CHF 7.8 billion), CHF 1.7 billion under Trading portfolio assets (31 December 2012: CHF 2.1 billion) and CHF 0.4 billion under Cash collateral receivables on derivative instruments (31 December 2012: CHF 0.2 billion).
449
Financial information
Notes to the consolidated financial statements
Note 25 Restricted and transferred financial assets (continued)
b) Transferred financial assets that are not derecognized in their entirety
The following table presents information for financial assets, which have been transferred but are subject to continued recognition in full, as well as recognized liabilities associated with those transferred assets.
Transferred financial assets subject to continued recognition in full
| | | | | | | | | | | | | | | | |
CHF million | | 31.12.13 | | | 31.12.12 | |
| | | Carrying value
of transferred
assets | | | Carrying value of
associated liabilities
recognized
on balance sheet | | | Carrying value of
transferred assets | | | Carrying value of
associated liabilities
recognized
on balance sheet | |
| Trading portfolio assets transferred which may be sold or repledged by counterparties | | | | | | | | | | | | | | | | |
| | | | | | | | | | | | | | | | | |
relating to securities lending and repurchase agreements in exchange for cash received | | | 16,296 | | | | 15,026 | | | | 23,573 | | | | 22,350 | |
| | | | | | | | | | | | | | | | | |
relating to securities lending agreements in exchange for securities received | | | 25,349 | | | | 0 | | | | 18,258 | | | | 0 | |
| | | | | | | | | | | | | | | | | |
relating to other financial asset transfers | | | 804 | | | | 442 | | | | 2,868 | | | | 152 | |
| | | | | | | | | | | | | | | | | |
| Total financial assets transferred | | | 42,449 | | | | 15,468 | | | | 44,698 | | | | 22,502 | |
| | | | | | | | | | | | | | | | | |
Transactions whereby financial assets are transferred, but continue to be recognized in their entirety on UBS’s balance sheet include securities lending and repurchase agreements as well as other financial asset transfers. Repurchase agreements and securities lending agreements are discussed in Notes 1a) 13) and 1a) 14). Repurchase and securities lending arrangements are, for the most part, conducted under standard market agreements, and are undertaken with counterparties subject to UBS’s normal credit risk control processes. Other financial asset transfers include securities transferred to collateralize derivative transactions.
As of 31 December 2013, approximately one-third of the transferred financial assets are trading portfolio assets transferred in exchange for cash, in which case the associated recognized liability represents the amount to be repaid to counterparties. For securities lending and repurchase agreements, a haircut between 0% and 15% is generally applied to the collateral, which results in associated liabilities having a
carrying value below the carrying value of the transferred assets. The counterparties to the associated liabilities presented in the table above have full recourse to UBS.
In securities lending arrangements entered into in exchange for the receipt of other securities as collateral, neither the securities received nor the obligation to return them are recognized on UBS’s balance sheet as the risks and rewards of ownership are not transferred to UBS. In cases where such financial assets received are subsequently sold or repledged in another transaction, this is not considered to be a transfer of financial assets.
Transferred assets other than trading portfolio assets which may be sold or repledged by counterparties were not material in 2013 and 2012.
Transferred financial assets that are not subject to derecognition in full, but which remain on the balance sheet to the extent of the Group’s continuing involvement, were not material in 2013 and 2012.
c) Transferred financial assets that are derecognized in their entirety with continuing involvement
Continuing involvement in a transferred and fully derecognized financial asset may result from contractual provisions in the transfer agreement or in a separate agreement with the counterparty or a third party entered into in connection with the transfer. Such transactions include purchased call options on transferred financial assets, certain lending
arrangements as well as interests purchased and retained upon the transfer of assets into securitization vehicles. The table below provides information on the Group’s continuing involvement in transferred and fully derecognized financial assets.
450
Note 25 Restricted and transferred financial assets (continued)
Transferred financial assets that are derecognized in their entirety with continuing involvement
| | | | | | | | | | | | | | | | | | | | | | | | |
CHF million | | 31.12.13 | |
| | | | | | | | | | | | | | | Gain/(loss) from continuing
involvement in transferred and
derecognized financial assets | |
| | | Balance sheet line item | | | Carrying amount
of continuing
involvement | | | Fair value of
continuing
involvement | | | Gain/(loss) recognized
at the date
of transfer of the
financial assets | | | For the year ended 31.12.13 | | | Life-to-date 31.12.13 | |
| Type of continuing involvement | | | | | | | | | | | | | | | | | | | | | | | | |
| | | | | | | | | | | | | | | | | | | | | | | | | |
| Lending arrangements | | | Loans | | | | 2,408 | | | | 2,384 | | | | 0 | | | | 43 | | | | 694 | |
| | | | | | | | | | | | | | | | | | | | | | | | | |
| Purchased and retained interests in securitization vehicles | |
| Trading portfolio assets/
Replacement values |
1 | | | (34 | ) | | | (34 | ) | | | 1 | | | | 6 | | | | (1,596 | ) |
| | | | | | | | | | | | | | | | | | | | | | | | | |
| Other | | | | | | | | | | | | | | | 6 | | | | | | | | | |
| | | | | | | | | | | | | | | | | | | | | | | | | |
| Total | | | | | | | 2,374 | | | | 2,350 | | | | 8 | | | | 49 | | | | (902 | ) |
| | | | | | | | | | | | | | | | | | | | | | | | | |
| | | | | | | | | | | | | | | | | | | | | | | | |
CHF million | | 31.12.12 | |
| | | | | | | | | | | | | | | Gain/(loss) from continuing
involvement in transferred and
derecognized financial assets | |
| | | Balance sheet line item | | | Carrying amount
of continuing
involvement | | | Fair value of
continuing
involvement | | | Gain/(loss) recognized
at the date
of transfer of the
financial assets | | | For the year ended 31.12.12 | | | Life-to-date 31.12.12 | |
| Type of continuing involvement | | | | | | | | | | | | | | | | | | | | | | | | |
| | | | | | | | | | | | | | | | | | | | | | | | | |
| Purchased call option2 | | | Positive replacement values | | | | 2,103 | | | | 2,103 | | | | (1,003 | ) | | | 526 | | | | (2,256 | ) |
| | | | | | | | | | | | | | | | | | | | | | | | | |
| Lending arrangements | | | Loans | | | | 3,342 | | | | 3,271 | | | | 0 | | | | 61 | | | | 651 | |
| | | | | | | | | | | | | | | | | | | | | | | | | |
| Purchased and retained interests in securitization vehicles | |
| Trading portfolio assets/
Replacement values |
1 | | | 205 | | | | 205 | | | | 0 | | | | 0 | | | | (1,701 | ) |
| | | | | | | | | | | | | | | | | | | | | | | | | |
| Total | | | | | | | 5,650 | | | | 5,579 | | | | (1,003 | ) | | | 587 | | | | (3,306 | ) |
| | | | | | | | | | | | | | | | | | | | | | | | | |
1 As of 31 December 2013, Purchased and retained interest in securitization vehicles consisted of Trading portfolio assets of CHF 34 million and Negative replacement values of CHF 68 million. As of 31 December 2012, Purchased and retained interest in securitization vehicles consisted of Trading portfolio assets of CHF 325 million and Negative replacement values of CHF 120 million. 2 Reflects the option to acquire the equity of the SNB StabFund which was exercised on 7 November 2013.
There are a limited number of specific transactions for which UBS has continuing involvement in derecognized financial assets, as detailed below.
Lending arrangements: loan to BlackRock fund
In 2008, UBS sold a portfolio of US RMBSs for proceeds of USD 15 billion to the RMBS Opportunities Master Fund, LP (the “RMBS fund”), an entity managed by BlackRock, Inc. The USD 15 billion proceeds were approximately in line with the fair value of the assets at the date of the transfer of the assets. The RMBS fund was capitalized with approximately USD 3.75 billion in equity raised by BlackRock from third-party investors and an eight-year amortizing USD 11.25 billion senior secured loan provided by UBS, which represents a continuing involvement in the assets transferred to the fund and is reflected in the table above. The maximum exposure to loss is equal to the carrying amount of loan to the RMBS fund.
Purchased and retained interests in securitization vehicles
In cases where UBS has transferred assets into securitization vehicles and retained or purchased interests therein, UBS has a continuing involvement in those transferred assets. The majority of our retained continuing involvement securitization positions held in the trading portfolio are collateralized debt obligations, US commercial mortgage-
backed securities and residential mortgage-backed securities. As a result of losses incurred in previous years, the majority of these continuing involvement positions have a carrying amount of zero as of 31 December 2013. As of 31 December 2013, the maximum exposure to loss related to purchased and retained interests in securitization structures was CHF 49 million compared with CHF 329 million as of 31 December 2012, both mainly related to trading portfolio assets. Life-to-date losses presented in the table above only relate to retained interests held as of 31 December 2013.
Financial information
Notes to the consolidated financial statements
Note 25 Restricted and transferred financial assets (continued)
d) Off-balance-sheet assets received
The following table presents the assets received from third parties that can be sold or repledged, that are not recognized on the balance sheet, but that are held as collateral, including amounts that have been sold or repledged.
Off-balance-sheet assets received
| | | | | | | | |
| CHF million | | 31.12.13 | | | 31.12.12 | |
| Fair value of assets received which can be sold or repledged | | | 351,712 | | | | 400,150 | |
| | | | | | | | | |
received as collateral under reverse repurchase, securities borrowing and lending arrangements, derivative transactions and other transactions | | | 348,205 | | | | 398,496 | |
| | | | | | | | | |
received in unsecured borrowings | | | 3,507 | | | | 1,654 | |
| | | | | | | | | |
| thereof sold or repledged¹ | | | 240,176 | | | | 284,692 | |
| | | | | | | | | |
in connection with financing activities | | | 193,879 | | | | 224,361 | |
| | | | | | | | | |
to satisfy commitments under short sale transactions | | | 26,609 | | | | 34,247 | |
| | | | | | | | | |
in connection with derivative and other transactions | | | 19,688 | | | | 26,084 | |
| | | | | | | | | |
1 Does not include off-balance-sheet assets (31 December 2013: CHF 38.4 billion, 31 December 2012: CHF 29.4 billion) placed with central banks related to undrawn credit lines and for payment, clearing and settlement purposes for which there are no associated liabilities or contingent liabilities.
Note 26 Offsetting financial assets and financial liabilities
UBS enters into netting agreements with counterparties to manage the credit risks associated primarily with repurchase and reverse repurchase transactions, securities borrowing and lending and over-the-counter and exchange-traded derivatives. These netting agreements and similar arrangements generally enable the counterparties to offset liabilities against available assets received – in the ordinary course of business and/or in the event that the counterparty to the transaction is unable to fulfill its contractual obligations. The right to offset is a legal right to settle or otherwise eliminate all or a portion of an amount due by applying an amount receivable from the same counterparty against it, thus reducing credit exposure. From a balance sheet presentation perspective, the criteria for offsetting financial assets and financial liabilities are highly restrictive. UBS offsets financial assets and financial liabilities on its balance sheet only when it has a currently enforceable legal right to offset the respective recognized amounts and intends either to settle on a net basis, or to realize the asset and settle the liability simultaneously. In assessing the criteria for a relevant set of facts and circumstances, emphasis is placed on the effectiveness of the operational mechanics of net or simultaneous settlements in eliminating all credit and liquidity exposure between counterparties at the time of settlement. These criteria preclude offsetting on the balance sheet for
substantial amounts of the Group’s financial assets and liabilities, even if these amounts may be subject to enforceable netting arrangements. For derivative contracts, balance sheet offsetting is generally only permitted in circumstances in which a market settlement mechanism (e.g., an exchange or clearing house) exists which effectively accomplishes net settlement through a daily cash margining process. Bilateral OTC derivatives and exchange traded derivatives that are not margined on a daily basis are commonly precluded from offsetting on the balance sheet unless a mechanism exists to provide for net settlement of the cash flows arising from these contracts. For repurchase arrangements and securities financings, balance sheet offsetting may be permitted only to the extent that financial assets and liabilities with a counterparty have the same maturity date and are settled through a clearing process by which intra-day credit and liquidity exposures are substantially eliminated. Thus, repurchase and securities financing arrangements that are not cleared through a formal mechanism, such as a clearing house or exchange, are generally not offset on the balance sheet. UBS engages in a variety of counterparty credit mitigation strategies in addition to netting and collateral arrangements. Therefore, the net amounts presented on the tables on the next pages do not purport to represent the Group’s actual credit exposure.
452
Note 26 Offsetting financial assets and financial liabilities (continued)
The table below provides a summary of financial assets subject to offsetting, enforceable master netting arrangements and similar agreements, as well as financial collateral received to mitigate credit exposures for these financial assets. The gross financial assets of the Group that are subject to offsetting, enforceable netting arrangements and similar agreements are reconciled to the net amounts presented within the associated balance sheet line, after giving effect to financial
liabilities with the same counterparties that have been offset on the balance sheet and other financial assets not subject to an enforceable netting arrangement or similar agreement. Further, related amounts for financial liabilities and collateral received that are not offset on the balance sheet are shown to arrive at financial assets after consideration of netting potential.
Financial assets subject to offsetting, enforceable master netting arrangements and similar agreements
| | | | | | | | | | | | | | | | | | | | | | | | | | | | | | | | |
| | 31.12.13 | |
| | | Assets subject to netting arrangements | | | Netting potential not recognized
in the balance sheet3 | | | | | | | | | | |
| CHF billion | | Gross assets
before balance
sheet netting | | | Balance sheet
netting with
gross liabilities2 | | | Assets
recognized
on the
balance
sheet, net | | | Financial
liabilities | | | Collateral
received | | | Assets after
consideration
of netting
potential | | | Assets not
subject to
enforceable
netting
arrangements
and other
out-of-
scope items | | | Total assets
recognized
on the
balance
sheet | |
| Cash collateral on securities borrowed | | | 26.5 | | | | 0.0 | | | | 26.5 | | | | (1.2 | ) | | | (25.2 | ) | | | 0.2 | | | | 1.0 | | | | 27.5 | |
| | | | | | | | | | | | | | | | | | | | | | | | | | | | | | | | | |
| Reverse repurchase agreements | | | 111.5 | | | | (25.4 | ) | | | 86.1 | | | | (5.4 | ) | | | (80.7 | ) | | | 0.0 | | | | 5.5 | | | | 91.6 | |
| | | | | | | | | | | | | | | | | | | | | | | | | | | | | | | | | |
| Positive replacement values | | | 240.7 | | | | (7.2 | ) | | | 233.5 | | | | (185.0 | ) | | | (35.1 | ) | | | 13.4 | | | | 12.3 | | | | 245.8 | |
| | | | | | | | | | | | | | | | | | | | | | | | | | | | | | | | | |
| Cash collateral receivables on derivative instruments1 | | | 223.8 | | | | (200.2 | ) | | | 23.5 | | | | (14.2 | ) | | | (1.1 | ) | | | 8.2 | | | | 4.5 | | | | 28.0 | |
| | | | | | | | | | | | | | | | | | | | | | | | | | | | | | | | | |
| Financial assets designated at fair value | | | 3.9 | | | | 0.0 | | | | 3.9 | | | | 0.0 | | | | (3.9 | ) | | | 0.1 | | | | 3.4 | | | | 7.4 | |
| | | | | | | | | | | | | | | | | | | | | | | | | | | | | | | | | |
| Total assets | | | 606.4 | | | | (232.9 | ) | | | 373.5 | | | | (205.8 | ) | | | (145.9 | ) | | | 21.8 | | | | 26.7 | | | | 400.3 | |
| | | | | | | | | | | | | | | | | | | | | | | | | | | | | | | | | |
| | | | | | | | | | | | | | | | | | | | | | | | | | | | | | | | |
| | 31.12.12 | |
| | | Assets subject to netting arrangements | | | Netting potential not recognized
in the balance sheet3 | | | | | | | | | | |
| CHF billion | | Gross assets
before balance
sheet netting | | | Balance sheet
netting with
gross liabilities2 | | | Assets
recognized
on the
balance
sheet, net | | | Financial
liabilities | | | Collateral
received | | | Assets after
consideration
of netting
potential | | | Assets not
subject to
enforceable
netting
arrangements
and other
out-of-
scope items | | | Total assets
recognized
on the
balance
sheet | |
| Cash collateral on securities borrowed | | | 37.4 | | | | 0.0 | | | | 37.4 | | | | (2.7 | ) | | | (34.4 | ) | | | 0.3 | | | | 0.0 | | | | 37.4 | |
| | | | | | | | | | | | | | | | | | | | | | | | | | | | | | | | | |
| Reverse repurchase agreements | | | 154.5 | | | | (34.8 | ) | | | 119.7 | | | | (9.6 | ) | | | (110.1 | ) | | | 0.0 | | | | 11.2 | | | | 130.9 | |
| | | | | | | | | | | | | | | | | | | | | | | | | | | | | | | | | |
| Positive replacement values | | | 416.8 | | | | (14.6 | ) | | | 402.1 | | | | (327.3 | ) | | | (57.3 | ) | | | 17.5 | | | | 16.8 | | | | 419.0 | |
| | | | | | | | | | | | | | | | | | | | | | | | | | | | | | | | | |
| Cash collateral receivables on derivative instruments1 | | | 351.8 | | | | (331.8 | ) | | | 20.1 | | | | (17.4 | ) | | | 0.0 | | | | 2.7 | | | | 10.2 | | | | 30.4 | |
| | | | | | | | | | | | | | | | | | | | | | | | | | | | | | | | | |
| Financial assets designated at fair value | | | 4.6 | | | | 0.0 | | | | 4.6 | | | | 0.0 | | | | (4.5 | ) | | | 0.1 | | | | 4.5 | | | | 9.1 | |
| | | | | | | | | | | | | | | | | | | | | | | | | | | | | | | | | |
| Total assets | | | 965.1 | | | | (381.2 | ) | | | 583.9 | | | | (357.1 | ) | | | (206.3 | ) | | | 20.6 | | | | 42.8 | | | | 626.8 | |
| | | | | | | | | | | | | | | | | | | | | | | | | | | | | | | | | |
1 The amount of Cash collateral receivables on derivative instruments recognized on the balance sheet, net, includes certain OTC derivatives which are in substance net settled on a daily basis under IAS 32 and ETD derivatives which are economically settled on a daily basis. In addition, this balance includes OTC and ETD cash collateral balances which correspond with the cash portion of collateral pledged, reflected on the Negative replacement values line in the table presented on the following page. 2 The logic of the table results in amounts presented in the “Balance sheet netting with gross liabilities” column corresponding directly to the amounts presented in the “Balance sheet netting with gross assets” column in the liabilities table presented on the following page. 3 For the purpose of this disclosure, the amounts of financial instruments and cash collateral not set off in the balance sheet have been capped by relevant netting agreement so as not to exceed the Net amount of financial assets presented on the balance sheet, i.e., over-collateralization, where it exists, is not reflected in the table.
Financial information
Notes to the consolidated financial statements
Note 26 Offsetting financial assets and financial liabilities (continued)
Financial liabilities subject to offsetting, enforceable master netting arrangements and similar agreements
| | | | | | | | | | | | | | | | | | | | | | | | | | | | | | | | |
| | 31.12.13 | |
| | | Liabilities subject to netting
arrangements | | | Netting potential not recognized
in the balance sheet3 | | | | | | | | | | |
| CHF billion | | Gross
liabilities
before
balance
sheet
netting | | | Balance sheet
netting with
gross assets2 | | | Liabilities
recognized
on the
balance
sheet, net | | | Financial
assets | | | Collateral
pledged | | | Liabilities
after
consideration
of netting
potential | | | Liabilities
not subject
to enforceable
netting
arrangements
and other out-of- scope items | | | Total
liabilities
recognized
on the
balance
sheet | |
| Cash collateral on securities lent | | | 8.5 | | | | 0.0 | | | | 8.5 | | | | (1.2 | ) | | | (7.3 | ) | | | 0.0 | | | | 1.0 | | | | 9.5 | |
| | | | | | | | | | | | | | | | | | | | | | | | | | | | | | | | | |
| Repurchase agreements | | | 34.2 | | | | (25.4 | ) | | | 8.8 | | | | (5.4 | ) | | | (3.4 | ) | | | 0.0 | | | | 5.0 | | | | 13.8 | |
| | | | | | | | | | | | | | | | | | | | | | | | | | | | | | | | | |
| Negative replacement values | | | 231.7 | | | | (7.2 | ) | | | 224.6 | | | | (185.0 | ) | | | (20.7 | ) | | | 18.8 | | | | 15.4 | | | | 240.0 | |
| | | | | | | | | | | | | | | | | | | | | | | | | | | | | | | | | |
| Cash collateral payables on derivative instruments1 | | | 240.5 | | | | (200.2 | ) | | | 40.3 | | | | (27.9 | ) | | | (3.6 | ) | | | 8.8 | | | | 8.8 | | | | 49.1 | |
| | | | | | | | | | | | | | | | | | | | | | | | | | | | | | | | | |
| Financial liabilities designated at fair value | | | 6.6 | | | | 0.0 | | | | 6.6 | | | | 0.0 | | | | (2.1 | ) | | | 4.6 | | | | 63.3 | | | | 69.9 | |
| | | | | | | | | | | | | | | | | | | | | | | | | | | | | | | | | |
| Total liabilities | | | 521.6 | | | | (232.9 | ) | | | 288.7 | | | | (219.5 | ) | | | (37.0 | ) | | | 32.2 | | | | 93.5 | | | | 382.3 | |
| | | | | | | | | | | | | | | | | | | | | | | | | | | | | | | | | |
| | | | | | | | | | | | | | | | | | | | | | | | | | | | | | | | |
| | 31.12.12 | |
| | | Liabilities subject to netting
arrangements | | | Netting potential not recognized
in the balance sheet3 | | | | | | | | | | |
| CHF billion | | Gross
liabilities
before
balance
sheet
netting | | | Balance
sheet
netting
with
gross
assets2 | | | Liabilities
recognized
on the
balance
sheet, net | | | Financial
assets | | | Collateral
pledged | | | Liabilities
after
consideration
of netting
potential | | | Liabilities
not subject
to enforceable
netting
arrangements
and other
out-of- scope items | | | Total
liabilities
recognized
on the
balance
sheet | |
| Cash collateral on securities lent | | | 9.2 | | | | 0.0 | | | | 9.2 | | | | (2.7 | ) | | | (6.4 | ) | | | 0.1 | | | | 0.0 | | | | 9.2 | |
| | | | | | | | | | | | | | | | | | | | | | | | | | | | | | | | | |
| Repurchase agreements | | | 56.2 | | | | (34.8 | ) | | | 21.4 | | | | (9.6 | ) | | | (11.8 | ) | | | 0.0 | | | | 17.1 | | | | 38.6 | |
| | | | | | | | | | | | | | | | | | | | | | | | | | | | | | | | | |
| Negative replacement values | | | 390.8 | | | | (14.6 | ) | | | 376.2 | | | | (327.3 | ) | | | (20.3 | ) | | | 28.6 | | | | 19.1 | | | | 395.3 | |
| | | | | | | | | | | | | | | | | | | | | | | | | | | | | | | | | |
| Cash collateral payables on derivative instruments1 | | | 391.3 | | | | (331.8 | ) | | | 59.6 | | | | (49.4 | ) | | | (0.4 | ) | | | 9.9 | | | | 11.5 | | | | 71.1 | |
| | | | | | | | | | | | | | | | | | | | | | | | | | | | | | | | | |
| Financial liabilities designated at fair value | | | 7.0 | | | | 0.0 | | | | 7.0 | | | | 0.0 | | | | (2.4 | ) | | | 4.6 | | | | 84.9 | | | | 91.9 | |
| | | | | | | | | | | | | | | | | | | | | | | | | | | | | | | | | |
| Total liabilities | | | 854.6 | | | | (381.2 | ) | | | 473.4 | | | | (389.0 | ) | | | (41.3 | ) | | | 43.1 | | | | 132.6 | | | | 606.1 | |
| | | | | | | | | | | | | | | | | | | | | | | | | | | | | | | | | |
1 The amount of Cash collateral payables on derivative instruments recognized on the balance sheet, net, includes certain OTC derivatives which are in substance net settled on a daily basis under IAS 32 and ETD derivatives which are economically settled on a daily basis. In addition, this balance includes OTC and ETD cash collateral balances which correspond with the cash portion of collateral received reflected on the Positive replacement values line in the table presented on the previous page. 2 The logic of the table results in amounts presented in the “Balance sheet netting with gross assets” column corresponding directly to the amounts presented in the Balance sheet netting with gross liabilities column in the assets table presented on the previous page. 3 For the purpose of this disclosure, the amounts of financial instruments and cash collateral not set off on the balance sheet have been capped by relevant netting arrangement so as not to exceed the Net amount of financial liabilities presented in the balance sheet, i.e., over-collateralization, where it exists, is not reflected in the table.
454
Note 27 Financial assets and liabilities – additional information
a) Measurement categories of financial assets and liabilities
The following table provides information about the carrying amounts of individual classes of financial instruments within the measurement categories of financial assets and liabilities as defined in IAS 39Financial Instruments: Recognition and Measurement. Only those assets and liabilities which are financial instruments as defined in IAS 32Financial
Instruments: Presentation are included in the table below, which causes certain balances to differ from those presented on the balance sheet.
| | è | | Refer to “Note 24 Fair value measurement” for more information on how fair value of financial instruments is determined |
Measurement categories of financial assets and liabilities
| | | | | | | | |
| CHF million | | 31.12.13 | | | 31.12.12 | |
| Financial assets1 | | | | | | | | |
| | | | | | | | | |
| Fair value through profit or loss, held for trading | | | | | | | | |
| | | | | | | | | |
| Trading portfolio assets | | | 114,249 | | | | 143,471 | |
| | | | | | | | | |
of which: assets pledged as collateral which may be sold or repledged by counterparties | | | 42,449 | | | | 44,698 | |
| | | | | | | | | |
| Debt issued2 | | | 202 | | | | 154 | |
| | | | | | | | | |
| Positive replacement values | | | 245,835 | | | | 418,957 | |
| | | | | | | | | |
| Total | | | 360,286 | | | | 562,581 | |
| | | | | | | | | |
| Fair value through profit or loss, other | | | | | | | | |
| | | | | | | | | |
| Financial assets designated at fair value | | | 7,364 | | | | 9,106 | |
| | | | | | | | | |
| Financial assets at amortized cost | | | | | | | | |
| | | | | | | | | |
| Cash and balances with central banks | | | 80,879 | | | | 66,383 | |
| | | | | | | | | |
| Due from banks | | | 17,170 | | | | 21,220 | |
| | | | | | | | | |
| Cash collateral on securities borrowed | | | 27,496 | | | | 37,372 | |
| | | | | | | | | |
| Reverse repurchase agreements | | | 91,563 | | | | 130,941 | |
| | | | | | | | | |
| Cash collateral receivables on derivative instruments | | | 28,007 | | | | 30,413 | |
| | | | | | | | | |
| Loans | | | 286,959 | | | | 279,901 | |
| | | | | | | | | |
| Other assets | | | 17,598 | | | | 12,155 | |
| | | | | | | | | |
| Total | | | 549,673 | | | | 578,385 | |
| | | | | | | | | |
| Available-for-sale | | | | | | | | |
| | | | | | | | | |
| Financial investments available-for-sale | | | 59,525 | | | | 66,230 | |
| | | | | | | | | |
| Total financial assets | | | 976,848 | | | | 1,216,302 | |
| | | | | | | | | |
| Financial liabilities | | | | | | | | |
| | | | | | | | | |
| Fair value through profit or loss, held for trading | | | | | | | | |
| | | | | | | | | |
| Trading portfolio liabilities | | | 26,609 | | | | 34,247 | |
| | | | | | | | | |
| Debt issued2 | | | 362 | | | | 271 | |
| | | | | | | | | |
| Negative replacement values | | | 239,953 | | | | 395,260 | |
| | | | | | | | | |
| Total | | | 266,924 | | | | 429,778 | |
| | | | | | | | | |
| Fair value through profit or loss, other | | | | | | | | |
| | | | | | | | | |
| Financial liabilities designated at fair value | | | 69,901 | | | | 91,901 | |
| | | | | | | | | |
| Amounts due under unit-linked contracts | | | 16,155 | | | | 15,299 | |
| | | | | | | | | |
| Total | | | 86,056 | | | | 107,201 | |
| | | | | | | | | |
| Financial liabilities at amortized cost | | | | | | | | |
| | | | | | | | | |
| Due to banks | | | 12,862 | | | | 23,024 | |
| | | | | | | | | |
| Cash collateral on securities lent | | | 9,491 | | | | 9,203 | |
| | | | | | | | | |
| Repurchase agreements | | | 13,811 | | | | 38,557 | |
| | | | | | | | | |
| Cash collateral payables on derivative instruments | | | 49,138 | | | | 71,148 | |
| | | | | | | | | |
| Due to customers | | | 390,825 | | | | 373,459 | |
| | | | | | | | | |
| Debt issued | | | 81,426 | | | | 104,719 | |
| | | | | | | | | |
| Other liabilities | | | 39,522 | | | | 44,807 | |
| | | | | | | | | |
| Total | | | 597,075 | | | | 664,918 | |
| | | | | | | | | |
| Total financial liabilities | | | 950,055 | | | | 1,201,896 | |
| | | | | | | | | |
1 As of 31 December 2013, based on contractual maturities, CHF 116 billion of Loans, CHF 0 billion of Due from banks, CHF 0 billion of Reverse repurchase agreements, CHF 31 billion of Financial investments available-for-sale and CHF 5 billion of Financial assets designated at fair value are expected to be recovered or settled after 12 months. As of 31 December 2012, CHF 113 billion of Loans, CHF 0 billion of Due from banks, CHF 1 billion of Reverse repurchase agreements, CHF 29 billion of Financial investments available-for-sale and CHF 7 billion of Financial assets designated at fair value are expected to be recovered or settled after 12 months. 2 Represents the embedded derivative component of structured debt issued for which the fair value option has not been applied and which is presented within Debt issued on the balance sheet. In 2013, the comparative period figures were corrected. As a result, financial assets presented for 31 December 2012 decreased by CHF 251 million and financial liabilities presented for 31 December 2012 increased by CHF 99 million.
455
Financial information
Notes to the consolidated financial statements
Note 27 Financial assets and liabilities – additional information (continued)
b) Maturity analysis of financial liabilities
The contractual maturities of our non-derivative and non-trading financial liabilities as of 31 December 2013 are based on the earliest date on which we could be contractually required to pay. The total amounts that contractually mature in each time-band are also shown for 31 December 2012. Derivative positions and trading liabilities,
predominantly made up of short sale transactions, are assigned to the columnDue within 1 month, as this provides a conservative reflection of the nature of these trading activities. The contractual maturities may extend over significantly longer periods.
Maturity analysis of financial liabilities1
| | | | | | | | | | | | | | | | | | | | | | | | |
| CHF billion | | Due within
1 month | | | Due between
1 and 3 months | | | Due between
3 and 12 months | | | Due between
1 and 5 years | | | Due after
5 years | | | Total | |
| Financial liabilities recognized on balance sheet2 | | | | | | | | | | | | | | | | | | | | | | | | |
| | | | | | | | | | | | | | | | | | | | | | | | | |
| Due to banks | | | 9.5 | | | | 1.3 | | | | 1.7 | | | | 0.3 | | | | 0.0 | | | | 12.9 | |
| | | | | | | | | | | | | | | | | | | | | | | | | |
| Cash collateral on securities lent | | | 8.3 | | | | 0.7 | | | | 0.6 | | | | | | | | | | | | 9.5 | |
| | | | | | | | | | | | | | | | | | | | | | | | | |
| Repurchase agreements | | | 12.1 | | | | 1.1 | | | | 0.2 | | | | 0.3 | | | | 0.1 | | | | 13.9 | |
| | | | | | | | | | | | | | | | | | | | | | | | | |
| Trading portfolio liabilities3, 4 | | | 26.6 | | | | | | | | | | | | | | | | | | | | 26.6 | |
| | | | | | | | | | | | | | | | | | | | | | | | | |
| Negative replacement values3 | | | 240.0 | | | | | | | | | | | | | | | | | | | | 240.0 | |
| | | | | | | | | | | | | | | | | | | | | | | | | |
| Cash collateral payables on derivative instruments | | | 49.1 | | | | | | | | | | | | | | | | | | | | 49.1 | |
| | | | | | | | | | | | | | | | | | | | | | | | | |
| Financial liabilities designated at fair value5 | | | 3.5 | | | | 4.1 | | | | 12.9 | | | | 31.6 | | | | 20.5 | | | | 72.6 | |
| | | | | | | | | | | | | | | | | | | | | | | | | |
| Due to customers | | | 378.1 | | | | 6.8 | | | | 5.6 | | | | 0.2 | | | | 0.2 | | | | 390.9 | |
| | | | | | | | | | | | | | | | | | | | | | | | | |
| Debt issued | | | 6.5 | | | | 8.9 | | | | 22.2 | | | | 33.7 | | | | 20.5 | | | | 91.8 | |
| | | | | | | | | | | | | | | | | | | | | | | | | |
| Other liabilities | | | 54.3 | | | | | | | | | | | | | | | | | | | | 54.3 | |
| | | | | | | | | | | | | | | | | | | | | | | | | |
| Total 31.12.13 | | | 788.1 | | | | 22.9 | | | | 43.1 | | | | 66.2 | | | | 41.3 | | | | 961.6 | |
| | | | | | | | | | | | | | | | | | | | | | | | | |
| Total 31.12.12 | | | 996.9 | | | | 28.0 | | | | 61.2 | | | | 78.6 | | | | 52.9 | | | | 1,217.6 | |
| | | | | | | | | | | | | | | | | | | | | | | | | |
| Financial liabilities not recognized on balance sheet6 | | | | | | | | | | | | | | | | | | | | | | | | |
| | | | | | | | | | | | | | | | | | | | | | | | | |
| Commitments | | | | | | | | | | | | | | | | | | | | | | | | |
| | | | | | | | | | | | | | | | | | | | | | | | | |
| Loan commitments | | | 54.5 | | | | 0.3 | | | | 0.1 | | | | 0.0 | | | | | | | | 54.9 | |
| | | | | | | | | | | | | | | | | | | | | | | | | |
| Underwriting commitments | | | 0.8 | | | | | | | | | | | | | | | | | | | | 0.8 | |
| | | | | | | | | | | | | | | | | | | | | | | | | |
| Total commitments | | | 55.2 | | | | 0.3 | | | | 0.1 | | | | 0.0 | | | | 0.0 | | | | 55.7 | |
| | | | | | | | | | | | | | | | | | | | | | | | | |
| Guarantees | | | 18.3 | | | | 0.0 | | | | 0.1 | | | | 0.2 | | | | 0.1 | | | | 18.8 | |
| | | | | | | | | | | | | | | | | | | | | | | | | |
| Forward starting transactions | | | | | | | | | | | | | | | | | | | | | | | | |
| | | | | | | | | | | | | | | | | | | | | | | | | |
| Reverse repurchase agreements | | | 9.4 | | | | | | | | | | | | | | | | | | | | 9.4 | |
| | | | | | | | | | | | | | | | | | | | | | | | | |
| Securities borrowing agreements | | | 0.0 | | | | | | | | | | | | | | | | | | | | 0.0 | |
| | | | | | | | | | | | | | | | | | | | | | | | | |
| Total 31.12.13 | | | 83.0 | | | | 0.3 | | | | 0.2 | | | | 0.3 | | | | 0.1 | | | | 83.9 | |
| | | | | | | | | | | | | | | | | | | | | | | | | |
| Total 31.12.12 | | | 97.9 | | | | 0.2 | | | | 0.3 | | | | 0.3 | | | | 0.1 | | | | 98.8 | |
| | | | | | | | | | | | | | | | | | | | | | | | | |
1 Non-financial liabilities such as deferred income, deferred tax liabilities, provisions and liabilities on employee compensation plans are not included in this analysis. 2 Except for trading portfolio liabilities and negative replacement values (see footnote 3), the amounts presented generally represent undiscounted cash flows of future interest and principal payments. 3 Carrying value is fair value. Management believes that this best represents the cash flows that would have to be paid if these positions had to be settled or closed out. Refer to “Note 14 Derivative instruments and hedge accounting” for undiscounted cash flows of derivatives designated in hedge accounting relationships. 4 Contractual maturities of trading portfolio liabilities are: CHF 24.3 billion due within one month (2012: CHF 32.5 billion), CHF 1.2 billion due between one month and one year (2012: CHF 0.5 billion), and CHF1.1 billion due between one and five years (2012: CHF 1.3 billion). 5 Future interest payments on variable rate liabilities are determined by reference to the applicable interest rate prevailing as of the reporting date. Future principal payments which are variable are determined by reference to the conditions existing at the reporting date. 6 Comprises the maximum irrevocable amount of guarantees, commitments and forward starting transactions.
456
Note 27 Financial assets and liabilities – additional information (continued)
c) Reclassification of financial assets
In the fourth quarter of 2008 and the first quarter of 2009, financial assets were reclassified out ofTrading portfolio assets toLoans. On their reclassification date, these assets had fair values of CHF 26 billion and CHF 0.6 billion, respectively.
The reclassification of financial assets reflected UBS’s change in intent and ability to hold these financial assets for the foreseeable future
rather than for trading in the near term. The foreseeable future is interpreted to mean a period of approximately 12 months following the date of reclassification. The financial assets were reclassified using their fair value on the date of the reclassification, which became their new cost basis at that date.
Held-for-trading assets reclassified to loans and receivables
| | | | | | | | |
| CHF billion | | 31.12.13 | | | 31.12.12 | |
| Carrying value | | | 1.5 | | | | 3.2 | |
| | | | | | | | | |
| Fair value | | | 1.5 | | | | 3.1 | |
| | | | | | | | | |
| Pro-forma fair value gain/(loss) | | | 0.0 | | | | (0.1 | ) |
| | | | | | | | | |
The following table provides notional values, fair values and carrying values by product category for the remaining reclassified financial assets.
Held-for-trading assets reclassified to loans and receivables
| | | | | | | | | | | | | | | | |
| | | 31.12.13 | |
| CHF billion | | Notional value | | | Fair value | | | Carrying value | | | Ratio of carrying
to notional
value (%) | |
| US student loan and municipal auction rate securities | | | 0.6 | | | | 0.5 | | | | 0.5 | | | | 95 | |
| | | | | | | | | | | | | | | | | |
| Monoline-protected assets | | | 0.6 | | | | 0.6 | | | | 0.6 | | | | 92 | |
| | | | | | | | | | | | | | | | | |
| Other assets | | | 0.5 | | | | 0.4 | | | | 0.4 | | | | 84 | |
| | | | | | | | | | | | | | | | | |
| Total | | | 1.6 | | | | 1.5 | | | | 1.5 | | | | 91 | |
| | | | | | | | | | | | | | | | | |
In 2013, the carrying value of the remaining reclassified financial assets decreased by CHF 1.7 billion, mainly due to sales and redemptions of US student loan auction rate securities and leveraged finance loans. The overall impact on operating profit before tax from the financial assets for the year ended 31 December 2013 was a profit of CHF 132 million (see
table below). If the financial assets had not been reclassified, the impact on operating profit before tax for the year ended 31 December 2013 would have been a profit of approximately CHF 0.2 billion (2012: CHF 0.3 billion).
Contribution of the reclassified assets to the income statement
| | | | | | | | |
| | For the year ended | |
| CHF million | | 31.12.13 | | | 31.12.12 | |
| Net interest income | | | 74 | | | | 116 | |
| | | | | | | | | |
| Credit loss (expense)/recovery | | | 4 | | | | (73 | ) |
| | | | | | | | | |
| Other income1 | | | 53 | | | | 7 | |
| | | | | | | | | |
| Impact on operating profit before tax | | | 132 | | | | 49 | |
| | | | | | | | | |
1 Includes net gains/losses on the disposal of reclassified financial assets.
Financial information
Notes to the consolidated financial statements
Note 27 Financial assets and liabilities – additional information (continued)
d) Maximum exposure to credit risk of financial assets designated at fair value
Financial assets designated at fair value totaled CHF 7,364 million as of 31 December 2013 (31 December 2012: CHF 9,106 million). Maximum exposure to credit risk from financial assets designated at fair value was CHF 6.8 billion as of 31 December 2013 (31 December 2012: CHF 8.5 billion). The exposure related to structured loans and reverse repurchase and securities borrowing agreements was mitigated by securities collateral of CHF 5.4 billion as of 31 December 2013 (31 December 2012: CHF 6.5 billion).
The maximum exposure to credit risk of loans, but not structured loans, is generally mitigated by credit derivatives or similar instruments.
Information regarding these instruments and the exposure which they mitigate is provided in the table below on a notional basis.
Investment fund units designated at fair value do not have a direct exposure to credit risk.
| | è | | Refer to “Note 24 Fair value measurement” for more information on financial assets designated at fair value |
| | è | | Refer to “Maximum exposure to credit risk” in the “Credit risk” section of this report for more information on collateral related to financial assets designated at fair value |
Notional amounts of loans designated at fair value and related credit derivatives
| | | | | | | | |
| CHF million | | 31.12.13 | | | 31.12.12 | |
| Loans – notional amount | | | 1,103 | | | | 2,102 | |
| | | | | | | | | |
| Credit derivatives related to loans – notional amount1 | | | 790 | | | | 1,025 | |
| | | | | | | | | |
| Credit derivatives related to loans – fair value1 | | | (8 | ) | | | 2 | |
| | | | | | | | | |
1 Credit derivatives contracts include credit default swaps, total return swaps and similar instruments.
The table below provides the impact on the fair values of loans from changes in credit risk for the periods presented and cumulatively since inception. Similarly, the change in fair value of credit derivatives and similar instruments which are used to hedge these loans is also provided.
Changes in fair value of loans and related credit derivatives attributable to changes in credit risk
| | | | | | | | | | | | | | | | |
| | For the year ended | | | Cumulative from inception
until the year ended | |
| CHF million | | 31.12.13 | | | 31.12.12 | | | 31.12.13 | | | 31.12.12 | |
| Changes in fair value of loans designated at fair value, attributable to changes in credit risk1 | | | 16 | | | | 22 | | | | 5 | | | | (10 | ) |
| | | | | | | | | | | | | | | | | |
| Changes in fair value of credit derivatives and similar instruments which mitigate the maximum exposure to credit risk of loans designated at fair value1 | | | (9 | ) | | | (18 | ) | | | (8 | ) | | | 2 | |
| | | | | | | | | | | | | | | | | |
1 Current and cumulative changes in the fair value of loans designated at fair value, attributable to changes in their credit risk, are only calculated for those loans outstanding at balance sheet date. Cumulative changes in the fair value of credit derivatives hedging such loans include all the derivatives which have been used to mitigate credit risk of these loans since designation at fair value. For loans reported under the fair value option, changes in fair value due to changes in the credit standing of the borrower are calculated using counterparty credit information obtained from independent market sources.
458
Note 28 Pension and other post-employment benefit plans
The following table provides information relating to pension costs for defined benefit plans and defined contribution plans. These costs are part ofPersonnel expenses.
Income statement – expenses related to pension and other post-employment benefit plans
| | | | | | | | | | | | |
| CHF million | | 31.12.13 | | | 31.12.12 | | | 31.12.11 | |
| Net periodic pension cost for defined benefit plans | | | 651 | | | | (222 | ) | | | 577 | |
| | | | | | | | | | | | | |
of which: related to major pension plans1 | | | 638 | | | | (116 | ) | | | 519 | |
| | | | | | | | | | | | | |
of which: Swiss plan | | | 555 | | | | (198 | ) | | | 453 | |
| | | | | | | | | | | | | |
of which: Non-Swiss plans | | | 82 | | | | 82 | | | | 66 | |
| | | | | | | | | | | | | |
of which: related to post-retirement medical and life insurance plans2 | | | (11 | ) | | | (102 | ) | | | (2 | ) |
| | | | | | | | | | | | | |
of which: related to remaining plans and other costs3 | | | 24 | | | | (3 | ) | | | 60 | |
| | | | | | | | | | | | | |
| Pension cost for defined contribution plans4 | | | 236 | | | | 240 | | | | 254 | |
| | | | | | | | | | | | | |
| Total pension and other post-employment benefit plans5 | | | 887 | | | | 18 | | | | 831 | |
| | | | | | | | | | | | | |
1 Refer to “Note 28a Defined benefit pension plans” for more information. 2 Refer to “Note 28b Post-retirement medical and life insurance plans” for more information. 3 Other costs include differences between actual and estimated performance award accruals and net accrued pension costs related to restructuring. 4 Refer to “Note 28c Defined contribution plans” for more information. 5 Refer to “Note 6 Personnel expenses” for more information.
The following table provides information relating to amounts recognized in other comprehensive income for defined benefit plans.
Other comprehensive income – gains/(losses) on pension and other post-employment benefit plans
| | | | | | | | | | | | |
| CHF million | | 31.12.13 | | | 31.12.12 | | | 31.12.11 | |
| Major pension plans1 | | | 1,168 | | | | 1,053 | | | | (2,120 | ) |
| | | | | | | | | | | | | |
of which: Swiss plan | | | 1,119 | | | | 1,095 | | | | (1,811 | ) |
| | | | | | | | | | | | | |
of which: Non-Swiss plans | | | 49 | | | | (42 | ) | | | (309 | ) |
| | | | | | | | | | | | | |
| Post-retirement medical and life insurance plans2 | | | 3 | | | | (26 | ) | | | (19 | ) |
| | | | | | | | | | | | | |
| Remaining plans | | | 7 | | | | (5 | ) | | | 0 | |
| | | | | | | | | | | | | |
| Gains/(losses) recognized in other comprehensive income, before tax | | | 1,178 | | | | 1,023 | | | | (2,141 | ) |
| | | | | | | | | | | | | |
| Tax (expense)/benefit relating to defined benefit plans recognized in other comprehensive income | | | (239 | ) | | | (413 | ) | | | 321 | |
| | | | | | | | | | | | | |
| Gains/(losses) recognized in other comprehensive income, after tax3 | | | 939 | | | | 609 | | | | (1,820 | ) |
| | | | | | | | | | | | | |
| Cumulative amount of gains/(losses) recognized in other comprehensive income, before tax | | | (4,364 | ) | | | (5,542 | ) | | | (6,565 | ) |
| | | | | | | | | | | | | |
| Cumulative tax (expense)/benefit relating to defined benefit plans recognized in other comprehensive income | | | 497 | | | | 736 | | | | 1,149 | |
| | | | | | | | | | | | | |
| Cumulative gains/(losses) recognized in other comprehensive income, after tax4 | | | (3,867 | ) | | | (4,806 | ) | | | (5,415 | ) |
| | | | | | | | | | | | | |
1 Refer to “Note 28a Defined benefit pension plans” for more information. 2 Refer to “Note 28b Post-retirement medical and life insurance plans” for more information. 3 Refer to the “Statement of comprehensive income.” 4 Refer to the “Statement of changes in equity.”
Financial information
Notes to the consolidated financial statements
Note 28 Pension and other post-employment benefit plans (continued)
The following tables provide information on UBS’s assets and liabilities with respect to pension and post-employment benefit plans. These are recognized on the balance sheet withinOther assets andOther liabilities. All major plans are currently in a deficit situation except for the Swiss plan which is in a surplus situation.
Balance sheet – net defined benefit pension and post-employment asset
| | | | | | | | |
| CHF million | | 31.12.13 | | | 31.12.12 | |
| Major pension plans1 | | | 952 | | | | 0 | |
| | | | | | | | | |
of which: Swiss plan | | | 952 | | | | 0 | |
| | | | | | | | | |
of which: Non-Swiss plans | | | 0 | | | | 0 | |
| | | | | | | | | |
| Post-retirement medical and life insurance plans | | | 0 | | | | 0 | |
| | | | | | | | | |
| Remaining plans | | | 0 | | | | 0 | |
| | | | | | | | | |
| Total net defined benefit pension and post-employment asset2 | | | 952 | | | | 0 | |
| | | | | | | | | |
1 Refer to “Note 28a Defined benefit pension plans” for more information. 2 Refer to “Note 18 Other assets.”
Balance sheet – net defined benefit pension and post-employment liability
| | | | | | | | |
| CHF million | | 31.12.13 | | | 31.12.12 | |
| Major pension plans1 | | | 903 | | | | 1,108 | |
| | | | | | | | | |
of which: Swiss plan | | | 0 | | | | 118 | |
| | | | | | | | | |
of which: Non-Swiss plans2 | | | 903 | | | | 990 | |
| | | | | | | | | |
| Post-retirement medical and life insurance plans3 | | | 114 | | | | 136 | |
| | | | | | | | | |
| Remaining plans | | | 31 | | | | 39 | |
| | | | | | | | | |
| Total net defined benefit pension and post-employment liability4 | | | 1,048 | | | | 1,284 | |
| | | | | | | | | |
1 Refer to “Note 28a Defined benefit pension plans” for more information. 2 Liability consists of: UK plan CHF 433 million, US plans CHF 186 million and German plans CHF 284 million (31 December 2012: UK plan CHF 422 million, US plans CHF 290 million and German plans CHF 277 million). 3 Refer to “Note 28b Post-retirement medical and life insurance plans” for more information. 4 Refer to “Note 23 Other liabilities.”
a) Defined benefit pension plans
UBS has established pension plans for its employees in various locations. The major plans are located in Switzerland, the UK, the US and Germany. Independent actuarial valuations for the plans in these countries are performed as required.
The overall investment policy and strategy for UBS’s defined benefit pension plans is guided by the objective of achieving an investment return which, together with contributions, ensures that there will be sufficient assets to pay pension benefits as they fall due while also mitigating the various risks of the plans. For the plans with assets (i.e., funded plans), the investment strategies for the plans are generally managed under local laws and regulations in each jurisdiction. The actual asset allocation is determined by the governance body with reference to the prevailing current and expected economic and market conditions and in consideration of specific asset class risk in the risk profile. Within this framework, UBS ensures that the fiduciaries consider how the asset investment strategy correlates with the maturity profile of the plan liabilities and the respective potential impact on the funded status of the plans, including potential short term liquidity requirements. Specific asset-liability matching strategies for each pension plan are independently determined by the responsible governance body in each country. The pension assets are invested in a diversified portfolio of assets across geographic regions to ensure a balance of risk and return to the extent allowed under local pension laws.
Swiss pension plan
The Swiss pension plan covers employees of UBS AG and its affiliated companies in Switzerland and exceeds the minimum benefit requirements under Swiss pension law. The pension fund must provide the minimum mandatory benefits in accordance with Swiss pension law. Contributions to the pension plan are paid by the employees and the employer. The Swiss pension plan allows employees a choice with regard to the level of contributions paid by the employee. Employee contributions are calculated as a percentage of contributory salary and are deducted monthly. The percentages deducted from salary depend on age and choice of contribution category and vary between 1% and 13.5% of contributory base salary and between 0% and 9% of contributory variable compensation. Depending on the age of the employee, UBS pays a contribution that ranges between 6.5% and 27.5% of contributory base salary and between 3.6% and 9% of contributory variable compensation for retirement credits. UBS also pays risk contributions which are used to finance benefits paid out in the event of death and disability, as well as to finance the old age bridging pension. The benefits include retirement benefits and disability, death and survivor pensions. The pension plan offers to members at the normal retirement age of 64 a choice between a lifetime pension with or without full restitution and a partial or full lump sum payment. Members can draw retirement benefits early
460
Note 28 Pension and other post-employment benefit plans (continued)
from the age of 58. The amount of pension payable is a result of the conversion rate applied on the accumulated balance of the individual plan participant’s pension account at the retirement date. The accumulated balance of each individual plan participant’s pension account is based on credited vested benefits transferred from previous employers, purchases of benefits and the employee and employer contributions that have been made to the pension account of each individual plan participant, as well as the interest accrued on the accumulated balance. The interest rate accrued is defined annually by the Pension Foundation Board. Although the Swiss pension plan is based on a defined contribution promise under Swiss pension law, it is accounted for as a defined benefit plan under IAS 19, primarily because of the obligation to accrue interest on the pension accounts and the payment of lifetime pensions. The Swiss pension plan is governed by the Pension Foundation Board as required by the Swiss pension law. The responsibilities of the Pension Foundation Board are defined by Swiss pension law and by the plan rules. According to Swiss pension law, a temporary limited underfunding is permitted. However, the Pension Foundation Board is required to take the necessary measures to ensure that full funding can be expected to be restored within a period up to a maximum of ten years. Under Swiss pension law, if the Swiss pension plan became significantly underfunded on a Swiss pension law basis, additional employer and employee contributions could be required. In these situations, the risk is shared between employer and employees, and the employer is not legally obliged to cover more than 50% of the additional contributions required. The Swiss pension plan has a technical funding ratio under Swiss pension law of 127.0% as of 31 December 2013 (31 December 2012: 123.4%), and thus it is not expected that additional contributions will be required in the next year. The investment strategy of the Swiss plan is in line with Swiss pension law, including the rules and regulations relating to diversification of plan assets. The Pension Foundation Board strives for a medium- and long-term consistency and sustainability between assets and liabilities. Under IAS 19, volatility arises in the Swiss pension plan net asset because the fair value of the plan assets is not directly correlated to movements in the value of the plan’s defined benefit obligation in the short term.
There are ongoing discussions in the Swiss government on possible changes to Swiss pension law. The outcome of these discussions and the timing of any resulting changes are uncertain.
In 2012, UBS announced certain changes to its Swiss pension plan. The main changes were a reduction in conversion rate on retirement and an increase of the normal retirement age, which served in part to offset the impact of the increased life expectancy reflected in the defined benefit obligation due to the adoption of the BVG 2010 generational table in 2011. This plan amendment reduced the defined benefit obligation by CHF 730 million resulting in a gain in 2012.
The employer contributions expected to be made to the Swiss pension plan in 2014 are estimated to be CHF 474 million. The actuarial assumptions used for the Swiss pension plan are based on the local
economic environment. Refer also to Note 1a) 24) for a description of the accounting policy for defined benefit pension plans.
The Swiss pension plan was in a surplus situation as of 31 December 2013 as the fair value of plan assets exceeded the defined benefit obligation by CHF 1,760 million (31 December 2012: deficit of CHF 118 million). However, such a surplus can only be recognized on the balance sheet to the extent that it does not exceed the estimated future economic benefit, which is the difference between the estimated future net service cost and the estimated future employer contributions. As of 31 December 2013, the estimated future economic benefit was CHF 952 million and hence, this was the amount recognized as net defined benefit asset on the balance sheet. The difference of CHF 808 million between the pension plan surplus and the estimated future economic benefit, the so-called asset ceiling effect, was recognized as a loss in other comprehensive income.
Non-Swiss pension plans
The non-Swiss locations of UBS operate various pension plans in accordance with local regulations and practices. The locations with significant defined benefit plans are the UK, the US and Germany. The remaining non-major plans are located mainly in Asia Pacific, Europe and the Americas. As these other plans are not significant to the financial results of UBS, no further disclosure is given within this note. The non-Swiss pension plans provide benefits in the event of retirement, death or disability. The level of benefits provided depends on the specific rate of benefit accrual and the level of employee compensation. The amounts shown for the non-Swiss pension plans reflect the net funded positions of the significant non-Swiss pension plans. UBS’s general principle is to ensure that the plans are appropriately funded under local pension regulations in each country and this is the primary driver for determining when additional contributions are required. Similar to the Swiss pension plan, volatility arises in the non-Swiss pension plans’ net liability because the fair value of the plan assets is not directly correlated to movements in the value of the plans’ defined benefit obligation. The employer contributions expected to be made to these pension plans in 2014 are estimated to be CHF 186 million. The funding policy for these plans is consistent with local government regulations and tax requirements. The actuarial assumptions used for the non-Swiss pension plans are based on the local economic environment.
Refer also to Note 1a) 24) for a description of the accounting policy for defined benefit pension plans.
UK
The UK plan is a career average revalued earnings scheme and benefits increase automatically based on UK price inflation. Normal retirement age for the UK plan is 60. The plan is closed to new entrants, who instead can participate in a defined contribution
Financial information
Notes to the consolidated financial statements
Note 28 Pension and other post-employment benefit plans (continued)
arrangement. On 1 July 2013, UBS closed the UK defined benefit pension plan for future service. After that date, UBS no longer recognizes current service costs for this plan. The closure of the plan for future service did not have a financial impact since the UK plan is a career average plan and past service benefits are indexed to UK price inflation. Plan participants who were active employees under the defined benefit plan were eligible to become participants of the defined contribution arrangement for any service after the plan was closed for future service.
There is a UK Pension Trustee Board which is required under local pension laws. The responsibility for governance of the UK plan lies jointly with the Pension Trustee Board and UBS. The employer contributions to the pension fund included regular contributions and specific deficit funding contributions up to the date of the closure of the UK plan for future service and thereafter represent agreed deficit funding contributions. The employer contributions are determined based on the last actuarial valuation which is conducted based on assumptions agreed by the Trustees and UBS. In the event of an underfunding, UBS must agree a deficit recovery plan with the Pension Trustee Board within statutory deadlines. As the plan’s obligation is to provide guaranteed lifetime pension benefits to plan participants upon retirement, increases in life expectancy will result in an increase in the plan’s liabilities. This is particularly significant in the UK plan where inflationary increases result in higher sensitivity to changes in the life expectancy.
Based on the plan rules and due to local pension legislation, there are caps on the level of inflationary increase applied to plan benefits. The plan assets are invested in a diversified class of assets and a portion of the plan assets are invested in inflation-indexed bonds to provide a partial hedge against inflation. If inflation increases, the plan obligation will likely increase more significantly than any change in the fair value of plan assets. This would result in an increase in the net defined benefit liability.
US
There are two distinct major pension plans in the US. Normal retirement age for the US plans is 65. The plans are closed to new entrants, who instead can participate in defined contribution plans. One plan is a contribution-based plan where each participant accrues a percentage of salary in a pension account. The pension account is credited annually
with interest based on a rate which is linked to the yield on a US government bond. Upon retirement, the plan participant can elect to receive the retirement benefit as a lump sum or a lifetime pension. The other plan provides a lifetime pension which is based on the career average earnings of each individual plan participant. There are pension plan fiduciaries for both of the major pension plans as required under local state pension laws. The fiduciaries, jointly with UBS, are responsible for the governance of the plans. Actuarial valuations are regularly completed for the plans and UBS has historically elected to make contributions to the plans in order to at least maintain a funded ratio of 80% as calculated under local pension regulations. The annual employer contributions are equal to the present value of benefits accrued each year plus a rolling amortization of any prior underfunding. If the employer contributes more than the minimum or the plan has assets exceeding the liabilities, the excess can be used to offset minimum funding requirements.
In 2013, UBS offered to certain deferred vested members of the US pension plans the option to receive a lump sum payment (or early annuity payments) instead of a lifetime pension. This resulted in a reduction of the defined benefit obligation of CHF 196 million, a reduction of fair value of plan assets of CHF 216 million and a charge to the income statement of CHF 20 million in 2013.
Germany
There are two different pension plans in Germany and both are contribution-based plans. Normal retirement age for the German plans is 65. The major pension plan is funded entirely by UBS, and the employer contribution is based on the salary of the employee. On an annual basis the accumulated account balance of the plan participant is credited with guaranteed interest at a rate of 5%. The other plan is a deferred compensation plan which is funded entirely by the employees. The deferred compensation plan has a guaranteed interest rate of 4% on contributions paid after 2009. The German plans are regulated under German pension law under which the responsibility to pay pension benefits when they are due is entirely the responsibility of UBS.
The following table provides an analysis of the movement in the net asset/(liability) recognized on the balance sheet for defined benefit pension plans between the beginning to the end of the year, as well as an analysis of amounts recognized in net profit and in other comprehensive income.
462
Note 28 Pension and other post-employment benefit plans (continued)
Defined benefit pension plans
| | | | | | | | | | | | | | | | |
CHF million | | Swiss | | | Non-Swiss | |
| For the year ended | | | 31.12.13 | | | | 31.12.12 | | | | 31.12.13 | | | | 31.12.12 | |
| | | | | | | | | | | | | | | | | |
| Defined benefit obligation at the beginning of the year | | | 21,901 | | | | 22,555 | | | | 4,773 | | | | 4,414 | |
| | | | | | | | | | | | | | | | | |
| Current service cost | | | 549 | | | | 531 | | | | 21 | | | | 33 | |
| | | | | | | | | | | | | | | | | |
| Interest expense | | | 399 | | | | 462 | | | | 199 | | | | 211 | |
| | | | | | | | | | | | | | | | | |
| Plan participant contributions | | | 197 | | | | 205 | | | | 0 | | | | 0 | |
| | | | | | | | | | | | | | | | | |
| Remeasurements of defined benefit obligation | | | (1,124 | ) | | | 29 | | | | 105 | | | | 258 | |
| | | | | | | | | | | | | | | | | |
of which: actuarial (gains)/losses arising from changes in demographic assumptions | | | 0 | | | | 0 | | | | (23 | ) | | | (27 | ) |
| | | | | | | | | | | | | | | | | |
of which: actuarial (gains)/losses arising from changes in financial assumptions | | | (1,114 | ) | | | 20 | 1 | | | 3 | | | | 269 | |
| | | | | | | | | | | | | | | | | |
of which: experience (gains)/losses | | | (10 | ) | | | 9 | | | | 125 | | | | 17 | |
| | | | | | | | | | | | | | | | | |
| Past service cost related to plan amendments | | | 0 | | | | (730 | ) | | | (196 | )2 | | | 0 | |
| | | | | | | | | | | | | | | | | |
| Curtailments | | | (37 | ) | | | (54 | ) | | | 0 | | | | 0 | |
| | | | | | | | | | | | | | | | | |
| Benefit payments | | | (1,183 | ) | | | (1,139 | ) | | | (204 | ) | | | (164 | ) |
| | | | | | | | | | | | | | | | | |
| Termination benefits | | | 36 | | | | 43 | | | | 0 | | | | 0 | |
| | | | | | | | | | | | | | | | | |
| Foreign currency translation | | | 0 | | | | 0 | | | | (26 | ) | | | 20 | |
| | | | | | | | | | | | | | | | | |
| Defined benefit obligation at the end of the year | | | 20,738 | | | | 21,901 | | | | 4,670 | | | | 4,773 | |
| | | | | | | | | | | | | | | | | |
of which: amounts owing to active members | | | 9,841 | | | | 10,602 | | | | 710 | | | | 713 | |
| | | | | | | | | | | | | | | | | |
of which: amounts owing to deferred members | | | 0 | | | | 0 | | | | 2,249 | | | | 2,378 | |
| | | | | | | | | | | | | | | | | |
of which: amounts owing to retirees | | | 10,897 | | | | 11,299 | | | | 1,711 | | | | 1,682 | |
| | | | | | | | | | | | | | | | | |
| Fair value of plan assets at the beginning of the year | | | 21,783 | | | | 20,614 | | | | 3,783 | | | | 3,458 | |
| | | | | | | | | | | | | | | | | |
| Return on plan assets excluding amounts included in interest income | | | 803 | | | | 1,124 | | | | 154 | | | | 216 | |
| | | | | | | | | | | | | | | | | |
| Interest income | | | 403 | | | | 460 | | | | 162 | | | | 167 | |
| | | | | | | | | | | | | | | | | |
| Employer contributions – excluding termination benefits | | | 470 | | | | 486 | | | | 125 | | | | 84 | |
| | | | | | | | | | | | | | | | | |
| Employer contributions – termination benefits | | | 36 | | | | 43 | | | | 0 | | | | 0 | |
| | | | | | | | | | | | | | | | | |
| Plan participant contributions | | | 197 | | | | 205 | | | | 0 | | | | 0 | |
| | | | | | | | | | | | | | | | | |
| Benefit payments | | | (1,183 | ) | | | (1,139 | ) | | | (204 | ) | | | (164 | ) |
| | | | | | | | | | | | | | | | | |
| Administration expenses, taxes and premiums paid | | | (11 | ) | | | (11 | ) | | | (5 | ) | | | (5 | ) |
| | | | | | | | | | | | | | | | | |
| Payments related to plan amendments | | | 0 | | | | 0 | | | | (216 | )2 | | | 0 | |
| | | | | | | | | | | | | | | | | |
| Foreign currency translation | | | 0 | | | | 0 | | | | (31 | ) | | | 26 | |
| | | | | | | | | | | | | | | | | |
| Fair value of plan assets at the end of the year | | | 22,498 | | | | 21,783 | | | | 3,768 | | | | 3,783 | |
| | | | | | | | | | | | | | | | | |
| Asset ceiling effect | | | 808 | | | | 0 | | | | 0 | | | | 0 | |
| | | | | | | | | | | | | | | | | |
| Net defined benefit asset/(liability) | | | 952 | | | | (118 | ) | | | (903 | ) | | | (990 | ) |
| | | | | | | | | | | | | | | | | |
| | | | |
| Movement in the net asset/(liability) recognized on the balance sheet | | | | | | | | | | | | | | | | |
| | | | | | | | | | | | | | | | | |
| Net asset/(liability) recognized on the balance sheet at the beginning of the year | | | (118 | ) | | | (1,941 | ) | | | (990 | ) | | | (956 | ) |
| | | | | | | | | | | | | | | | | |
| Net periodic pension cost | | | (555 | ) | | | 198 | | | | (82 | ) | | | (82 | ) |
| | | | | | | | | | | | | | | | | |
| Amounts recognized in other comprehensive income | | | 1,119 | | | | 1,095 | | | | 49 | | | | (42 | ) |
| | | | | | | | | | | | | | | | | |
| Employer contributions – excluding termination benefits | | | 470 | | | | 486 | | | | 125 | | | | 84 | |
| | | | | | | | | | | | | | | | | |
| Employer contributions – termination benefits | | | 36 | | | | 43 | | | | 0 | | | | 0 | |
| | | | | | | | | | | | | | | | | |
| Foreign currency translation | | | 0 | | | | 0 | | | | (5 | ) | | | 5 | |
| | | | | | | | | | | | | | | | | |
| Net asset/(liability) recognized on the balance sheet at the end of the year | | | 952 | | | | (118 | ) | | | (903 | ) | | | (990 | ) |
| | | | | | | | | | | | | | | | | |
| | | | |
| Funded and unfunded plans | | | | | | | | | | | | | | | | |
| | | | | | | | | | | | | | | | | |
| Defined benefit obligation from funded plans | | | 20,738 | | | | 21,901 | | | | 4,365 | | | | 4,472 | |
| | | | | | | | | | | | | | | | | |
| Defined benefit obligation from unfunded plans | | | 0 | | | | 0 | | | | 306 | | | | 301 | |
| | | | | | | | | | | | | | | | | |
| Plan assets | | | 22,498 | | | | 21,783 | | | | 3,768 | | | | 3,783 | |
| | | | | | | | | | | | | | | | | |
| Surplus/(deficit) | | | 1,760 | | | | (118 | ) | | | (903 | ) | | | (990 | ) |
| | | | | | | | | | | | | | | | | |
| Asset ceiling effect | | | 808 | | | | 0 | | | | 0 | | | | 0 | |
| | | | | | | | | | | | | | | | | |
| Net defined benefit asset/(liability) | | | 952 | | | | (118 | ) | | | (903 | ) | | | (990 | ) |
| | | | | | | | | | | | | | | | | |
1 During 2012, UBS revised its approach for the financial assumptions regarding calculating past service cost for certain members of the Swiss pension plan to consider not only age but also the initial employee contributions transferred to, or withdrawn from, the plan. This affected the distribution between past and future service costs, resulting in a reduction in the defined benefit obligation of CHF 841 million in 2012. This amount is offset by other remeasurement changes relating to changes in financial assumptions. 2 In 2013, UBS offered to certain deferred vested members of the US pension plans the option to receive a lump sum payment (or early annuity payments) instead of a lifetime pension. This resulted in a reduction of the defined benefit obligation, a reduction of fair value of plan assets and a charge to the income statement in 2013.
Financial information
Notes to the consolidated financial statements
Note 28 Pension and other post-employment benefit plans (continued)
Analysis of amounts recognized in net profit
| | | | | | | | | | | | | | | | |
CHF million | | Swiss | | | Non-Swiss | |
| For the year ended | | 31.12.13 | | | 31.12.12 | | | 31.12.13 | | | 31.12.12 | |
| Current service cost | | | 549 | | | | 531 | | | | 21 | | | | 33 | |
| | | | | | | | | | | | | | | | | |
| Interest expense related to defined benefit obligation | | | 399 | | | | 462 | | | | 199 | | | | 211 | |
| | | | | | | | | | | | | | | | | |
| Interest income related to plan assets | | | (403 | ) | | | (460 | ) | | | (162 | ) | | | (167 | ) |
| | | | | | | | | | | | | | | | | |
| Administration expenses, taxes and premiums paid | | | 11 | | | | 11 | | | | 5 | | | | 5 | |
| | | | | | | | | | | | | | | | | |
| Plan amendments | | | 0 | | | | (730 | ) | | | 20 | 1 | | | 0 | |
| | | | | | | | | | | | | | | | | |
| Curtailments | | | (37 | ) | | | (54 | ) | | | 0 | | | | 0 | |
| | | | | | | | | | | | | | | | | |
| Termination benefits | | | 36 | | | | 43 | | | | 0 | | | | 0 | |
| | | | | | | | | | | | | | | | | |
| Net periodic pension cost | | | 555 | | | | (198 | ) | | | 82 | | | | 82 | |
| | | | | | | | | | | | | | | | | |
Analysis of amounts recognized in other comprehensive income
| | | | | | | | | | | | | | | | |
CHF million | | Swiss | | | Non-Swiss | |
| For the year ended | | 31.12.13 | | | 31.12.12 | | | 31.12.13 | | | 31.12.12 | |
| Remeasurement of defined benefit obligation | | | 1,124 | | | | (29 | ) | | | (105 | ) | | | (258 | ) |
| | | | | | | | | | | | | | | | | |
| Return on plan assets excluding amounts included in interest income | | | 803 | | | | 1,124 | | | | 154 | | | | 216 | |
| | | | | | | | | | | | | | | | | |
| Asset ceiling effect | | | (808 | ) | | | 0 | | | | 0 | | | | 0 | |
| | | | | | | | | | | | | | | | | |
| Total gains/(losses) recognized in other comprehensive income | | | 1,119 | | | | 1,095 | | | | 49 | | | | (42 | ) |
| | | | | | | | | | | | | | | | | |
1 In 2013, UBS offered to certain deferred vested members of the US pension plans the option to receive a lump sum payment (or early annuity payments) instead of a lifetime pension. This resulted in a reduction of the defined benefit obligation, a reduction of fair value of plan assets and a charge to the income statement in 2013.
The following table provides information on the duration of the defined benefit pension obligations and the distribution of the timing of benefit payments.
| | | | | | | | | | | | | | | | |
| | Swiss | | | Non-Swiss1 | |
| | | 31.12.13 | | | 31.12.12 | | | 31.12.13 | | | 31.12.12 | |
| Duration of the defined benefit obligation | | | 15.1 | | | | 15.7 | | | | 18.9 | | | | 18.2 | |
| | | | | | | | | | | | | | | | | |
| Maturity analysis of benefits expected to be paid | |
| CHF million | | | | | | | | | | | | | | | | |
| Benefits expected to be paid within 12 months | | | 1,033 | | | | 1,036 | | | | 151 | | | | 150 | |
| | | | | | | | | | | | | | | | | |
| Benefits expected to be paid between 1 to 3 years | | | 2,051 | | | | 2,051 | | | | 321 | | | | 310 | |
| | | | | | | | | | | | | | | | | |
| Benefits expected to be paid between 3 to 6 years | | | 3,008 | | | | 3,022 | | | | 555 | | | | 538 | |
| | | | | | | | | | | | | | | | | |
| Benefits expected to be paid between 6 to 11 years | | | 5,630 | | | | 5,527 | | | | 1,168 | | | | 1,157 | |
| | | | | | | | | | | | | | | | | |
| Benefits expected to be paid between 11 to 16 years | | | 5,874 | | | | 5,783 | | | | 1,422 | | | | 1,471 | |
| | | | | | | | | | | | | | | | | |
| Benefits expected to be paid in more than 16 years | | | 28,915 | | | | 28,828 | | | | 8,970 | | | | 9,264 | |
| | | | | | | | | | | | | | | | | |
1 The duration of the defined benefit obligation represents a weighted average across non-Swiss plans.
The following tables show the principal actuarial assumptions used in calculating the defined benefit obligations.
| | | | | | | | | | | | | | | | |
| | Swiss | | | Non-Swiss1 | |
| | | 31.12.13 | | | 31.12.12 | | | 31.12.13 | | | 31.12.12 | |
| Principal actuarial assumptions used (%) | | | | | | | | | | | | | | | | |
| | | | | | | | | | | | | | | | | |
| Assumptions used to determine defined benefit obligations at the end of the year | | | | | | | | | | | | | | | | |
| | | | | | | | | | | | | | | | | |
| Discount rate | | | 2.3 | | | | 1.9 | | | | 4.6 | | | | 4.3 | |
| | | | | | | | | | | | | | | | | |
| Rate of salary increase | | | 2.5 | | | | 2.5 | | | | 3.2 | | | | 4.1 | |
| | | | | | | | | | | | | | | | | |
| Rate of pension increase | | | 0.0 | | | | 0.0 | | | | 3.3 | | | | 2.1 | |
| | | | | | | | | | | | | | | | | |
| Rate of interest credit on retirement savings | | | 2.6 | | | | 2.1 | | | | 1.1 | | | | 1.2 | |
| | | | | | | | | | | | | | | | | |
1 Represents weighted average assumptions across non-Swiss plans.
464
Note 28 Pension and other post-employment benefit plans (continued)
Mortality tables and life expectancies for major plans
| | | | | | | | | | | | | | | | | | |
| | | | | Life expectancy at age 65 for a male member currently | |
| | | | | aged 65 | | | aged 45 | |
| Country | | Mortality table | | 31.12.13 | | | 31.12.12 | | | 31.12.13 | | | 31.12.12 | |
| Switzerland | | BVG 2010 G | | | 21.3 | | | | 21.2 | | | | 23.1 | | | | 23.0 | |
| | | | | | | | | | | | | | | | | | | |
| UK | | S1NA_L CMI 2010 G, with projections | | | 24.4 | | | | 24.5 | | | | 27.3 | | | | 27.5 | |
| | | | | | | | | | | | | | | | | | | |
| US | | PPA mandated mortality table per IRC 1.430(h)(3) | | | 19.3 | | | | 19.2 | | | | 19.3 | | | | 19.2 | |
| | | | | | | | | | | | | | | | | | | |
| Germany | | Dr. K. Heubeck 2005 G | | | 19.7 | | | | 19.6 | | | | 22.4 | | | | 22.3 | |
| | | | | | | | | | | | | | | | | | | |
| | |
| | | | | Life expectancy at age 65 for a female member currently | |
| | | | | aged 65 | | | aged 45 | |
| Country | | Mortality table | | 31.12.13 | | | 31.12.12 | | | 31.12.13 | | | 31.12.12 | |
| Switzerland | | BVG 2010 G | | | 23.8 | | | | 23.7 | | | | 25.5 | | | | 25.4 | |
| | | | | | | | | | | | | | | | | | | |
| UK | | S1NA_L CMI 2010 G, with projections | | | 25.5 | | | | 25.6 | | | | 27.8 | | | | 27.9 | |
| | | | | | | | | | | | | | | | | | | |
| US | | PPA mandated mortality table per IRC 1.430(h)(3) | | | 21.1 | | | | 21.0 | | | | 21.1 | | | | 21.0 | |
| | | | | | | | | | | | | | | | | | | |
| Germany | | Dr. K. Heubeck 2005 G | | | 23.8 | | | | 23.7 | | | | 26.3 | | | | 26.2 | |
| | | | | | | | | | | | | | | | | | | |
The following table presents a sensitivity analysis for each significant actuarial assumption showing how the defined benefit obligation would have been affected by changes in the relevant actuarial assumption that were reasonably possible at the balance sheet date. This sensitivity analysis applies to the defined benefit obligation only and not to the net defined benefit asset/(liability) in its entirety, the measurement of which is driven by a number of factors including, in addition to the assumptions below, the fair value of plan assets.
Sensitivity analysis of significant actuarial assumptions1
| | | | | | | | | | | | | | | | |
| | Swiss plan: increase/(decrease)
in defined benefit obligation | | | Non-Swiss plans: increase/(decrease)
in defined benefit obligation | |
| CHF million | | 31.12.13 | | | 31.12.12 | | | 31.12.13 | | | 31.12.12 | |
| Discount rate | | | | | | | | | | | | | | | | |
| | | | | | | | | | | | | | | | | |
Increase by 50 basis points | | | (1,301 | ) | | | (1,438 | ) | | | (411 | ) | | | (410 | ) |
| | | | | | | | | | | | | | | | | |
Decrease by 50 basis points | | | 1,471 | | | | 1,639 | | | | 472 | | | | 470 | |
| | | | | | | | | | | | | | | | | |
| Rate of salary increase | | | | | | | | | | | | | | | | |
| | | | | | | | | | | | | | | | | |
Increase by 50 basis points | | | 142 | | | | 163 | | | | 1 | | | | 2 | |
| | | | | | | | | | | | | | | | | |
Decrease by 50 basis points | | | (138 | ) | | | (155 | ) | | | (1 | ) | | | (2 | ) |
| | | | | | | | | | | | | | | | | |
| Rate of pension increase | | | | | | | | | | | | | | | | |
| | | | | | | | | | | | | | | | | |
Increase by 50 basis points | | | 1,007 | | | | 1,118 | | | | 391 | | | | 355 | |
| | | | | | | | | | | | | | | | | |
Decrease by 50 basis points | | | – | 2 | | | – | 2 | | | (340 | ) | | | (281 | ) |
| | | | | | | | | | | | | | | | | |
| Rate of interest credit on retirement savings | | | | | | | | | | | | | | | | |
| | | | | | | | | | | | | | | | | |
Increase by 50 basis points | | | 270 | | | | 304 | | | | 7 | | | | 10 | |
| | | | | | | | | | | | | | | | | |
Decrease by 50 basis points | | | (259 | ) | | | (286 | ) | | | (6 | ) | | | (10 | ) |
| | | | | | | | | | | | | | | | | |
| Life expectancy | | | | | | | | | | | | | | | | |
| | | | | | | | | | | | | | | | | |
Increase in longevity by one additional year | | | 561 | | | | 613 | | | | 132 | | | | 125 | |
| | | | | | | | | | | | | | | | | |
1 The sensitivity analyses are based on a change in one assumption while holding all other assumptions constant, so that interdependencies between the assumptions are excluded. 2 As the assumed rate of pension increase was 0% as of 31 December 2013 and as of 31 December 2012, a downward change in assumption is not applicable.
Financial information
Notes to the consolidated financial statements
Note 28 Pension and other post-employment benefit plans (continued)
The following table provides information on the composition and fair value of plan assets of the Swiss pension plan and the non-Swiss pension plans.
Composition and fair value of plan assets
Swiss Plan
| | | | | | | | | | | | | | | | | | | | | | | | | | | | |
| | 31.12.13 | | | 31.12.12 | |
| | Fair Value | | | | | | Plan asset
allocation % | | | Fair Value | | | Plan asset
allocation % | |
| CHF million | | Quoted in
an active
market | | | Other | | | Total | | | | | | Quoted in
an active
market | | | Other | | | | |
| Cash and cash equivalents | | | 113 | | | | 0 | | | | 113 | | | | 1 | | | | 602 | | | | 0 | | | | 3 | |
| | | | | | | | | | | | | | | | | | | | | | | | | | | | | |
| Real estate/property | | | | | | | | | | | | | | | | | | | | | | | | | | | | |
| | | | | | | | | | | | | | | | | | | | | | | | | | | | | |
Domestic | | | 0 | | | | 2,523 | | | | 2,523 | | | | 11 | | | | 0 | | | | 2,377 | | | | 11 | |
| | | | | | | | | | | | | | | | | | | | | | | | | | | | | |
| Investment funds | | | | | | | | | | | | | | | | | | | | | | | | | | | | |
| | | | | | | | | | | | | | | | | | | | | | | | | | | | | |
Equity | | | | | | | | | | | | | | | | | | | | | | | | | | | | |
| | | | | | | | | | | | | | | | | | | | | | | | | | | | | |
Domestic | | | 617 | | | | 0 | | | | 617 | | | | 3 | | | | 597 | | | | 0 | | | | 3 | |
| | | | | | | | | | | | | | | | | | | | | | | | | | | | | |
Foreign | | | 5,935 | | | | 827 | | | | 6,761 | | | | 30 | | | | 5,210 | | | | 824 | | | | 28 | |
| | | | | | | | | | | | | | | | | | | | | | | | | | | | | |
Bonds1 | | | | | | | | | | | | | | | | | | | | | | | | | | | | |
| | | | | | | | | | | | | | | | | | | | | | | | | | | | | |
Domestic, AAA to BBB– | | | 3,018 | | | | 0 | | | | 3,018 | | | | 13 | | | | 3,492 | | | | 0 | | | | 16 | |
| | | | | | | | | | | | | | | | | | | | | | | | | | | | | |
Domestic, below BBB– | | | 0 | | | | 0 | | | | 0 | | | | 0 | | | | 0 | | | | 0 | | | | 0 | |
| | | | | | | | | | | | | | | | | | | | | | | | | | | | | |
Foreign, AAA to BBB– | | | 6,867 | | | | 0 | | | | 6,867 | | | | 31 | | | | 7,060 | | | | 0 | | | | 32 | |
| | | | | | | | | | | | | | | | | | | | | | | | | | | | | |
Foreign, below BBB– | | | 752 | | | | 0 | | | | 752 | | | | 3 | | | | 615 | | | | 0 | | | | 3 | |
| | | | | | | | | | | | | | | | | | | | | | | | | | | | | |
Real estate | | | | | | | | | | | | | | | | | | | | | | | | | | | | |
| | | | | | | | | | | | | | | | | | | | | | | | | | | | | |
Foreign | | | 0 | | | | 124 | | | | 124 | | | | 1 | | | | 0 | | | | 138 | | | | 1 | |
| | | | | | | | | | | | | | | | | | | | | | | | | | | | | |
Other | | | 1,220 | | | | 486 | | | | 1,707 | | | | 8 | | | | 593 | | | | 259 | | | | 4 | |
| | | | | | | | | | | | | | | | | | | | | | | | | | | | | |
| Other investments | | | 0 | | | | 15 | | | | 15 | | | | 0 | | | | 0 | | | | 16 | | | | 0 | |
| | | | | | | | | | | | | | | | | | | | | | | | | | | | | |
| Total | | | 18,523 | | | | 3,975 | | | | 22,498 | | | | 100 | | | | 18,169 | | | | 3,614 | | | | 100 | |
| | | | | | | | | | | | | | | | | | | | | | | | | | | | | |
| | | | | | | |
| | | | | | | | | | | | 31.12.13 | | | | | | | | | 31.12.12 | |
| Total fair value of plan assets | | | | | | | | | | | | | | | 22,498 | | | | | | | | | | | | 21,783 | |
| | | | | | | | | | | | | | | | | | | | | | | | | | | | | |
| of which: | | | | | | | | | | | | | | | | | | | | | | | | | | | | |
| | | | | | | | | | | | | | | | | | | | | | | | | | | | | |
Bank accounts at UBS and UBS debt instruments | | | | | | | | | | | | | | | 119 | | | | | | | | | | | | 611 | |
| | | | | | | | | | | | | | | | | | | | | | | | | | | | | |
UBS shares | | | | | | | | | | | | | | | 32 | | | | | | | | | | | | 32 | |
| | | | | | | | | | | | | | | | | | | | | | | | | | | | | |
Securities lent to UBS | | | | | | | | | | | | | | | 1,001 | 2 | | | | | | | | | | | 0 | |
| | | | | | | | | | | | | | | | | | | | | | | | | | | | | |
Property occupied by UBS | | | | | | | | | | | | | | | 143 | | | | | | | | | | | | 158 | |
| | | | | | | | | | | | | | | | | | | | | | | | | | | | | |
Derivative financial instruments, counterparty UBS | | | | | | | | | | | | | | | 287 | 2 | | | | | | | | | | | 83 | |
| | | | | | | | | | | | | | | | | | | | | | | | | | | | | |
Structured products, counterparty UBS | | | | | | | | | | | | | | | 122 | | | | | | | | | | | | 0 | |
| | | | | | | | | | | | | | | | | | | | | | | | | | | | | |
1 The bond credit ratings are primarily based on Standard and Poor’s credit ratings. Ratings AAA to BBB– and below BBB– represent investment grade and non-investment grade ratings, respectively. In cases where credit ratings from other rating agencies were used, these were converted to the equivalent rating in the Standard & Poor’s rating classification. 2 Securities lent to UBS and derivative financial instruments are presented gross of any collateral. Net of collateral, derivative financial instruments amounted to CHF 14 million as of 31 December 2013. Securities lent to UBS were fully covered by collateral as of 31 December 2013.
466
Note 28 Pension and other post-employment benefit plans (continued)
Composition and fair value of plan assets (continued)
Non-Swiss Plans
| | | | | | | | | | | | | | | | | | | | | | | | | | | | |
| | 31.12.13 | | | 31.12.12 | |
| | Fair Value | | | | | | Weighted
average
plan asset
allocation % | | | Fair Value | | | Weighted
average
plan asset
allocation % | |
| CHF million | | Quoted in
an active
market | | | Other | | | Total | | | | | | Quoted in
an active
market | | | Other | | | | |
| Cash and cash equivalents | | | 173 | | | | 0 | | | | 173 | | | | 5 | | | | 95 | | | | 0 | | | | 3 | |
| | | | | | | | | | | | | | | | | | | | | | | | | | | | | |
| Bonds1 | | | | | | | | | | | | | | | | | | | | | | | | | | | | |
| | | | | | | | | | | | | | | | | | | | | | | | | | | | | |
Domestic, AAA to BBB– | | | 66 | | | | 0 | | | | 66 | | | | 2 | | | | 121 | | | | 0 | | | | 3 | |
| | | | | | | | | | | | | | | | | | | | | | | | | | | | | |
Domestic, below BBB– | | | 42 | | | | 0 | | | | 42 | | | | 1 | | | | 121 | | | | 0 | | | | 3 | |
| | | | | | | | | | | | | | | | | | | | | | | | | | | | | |
Foreign, AAA to BBB– | | | 10 | | | | 0 | | | | 10 | | | | 0 | | | | 19 | | | | 0 | | | | 1 | |
| | | | | | | | | | | | | | | | | | | | | | | | | | | | | |
Foreign, below BBB– | | | 7 | | | | 0 | | | | 7 | | | | 0 | | | | 23 | | | | 0 | | | | 1 | |
| | | | | | | | | | | | | | | | | | | | | | | | | | | | | |
| Private equity | | | 1 | | | | 0 | | | | 1 | | | | 0 | | | | 0 | | | | 0 | | | | 0 | |
| | | | | | | | | | | | | | | | | | | | | | | | | | | | | |
| Investment funds | | | | | | | | | | | | | | | | | | | | | | | | | | | | |
| | | | | | | | | | | | | | | | | | | | | | | | | | | | | |
Equity | | | | | | | | | | | | | | | | | | | | | | | | | | | | |
| | | | | | | | | | | | | | | | | | | | | | | | | | | | | |
Domestic | | | 639 | | | | 3 | | | | 641 | | | | 17 | | | | 624 | | | | 4 | | | | 16 | |
| | | | | | | | | | | | | | | | | | | | | | | | | | | | | |
Foreign | | | 1,012 | | | | 0 | | | | 1,012 | | | | 27 | | | | 874 | | | | 0 | | | | 23 | |
| | | | | | | | | | | | | | | | | | | | | | | | | | | | | |
Bonds1 | | | | | | | | | | | | | | | | | | | | | | | | | | | | |
| | | | | | | | | | | | | | | | | | | | | | | | | | | | | |
Domestic, AAA to BBB– | | | 1,061 | | | | 0 | | | | 1,061 | | | | 28 | | | | 1,082 | | | | 0 | | | | 29 | |
| | | | | | | | | | | | | | | | | | | | | | | | | | | | | |
Domestic, below BBB– | | | 208 | | | | 0 | | | | 208 | | | | 6 | | | | 219 | | | | 0 | | | | 6 | |
| | | | | | | | | | | | | | | | | | | | | | | | | | | | | |
Foreign, AAA to BBB– | | | 100 | | | | 35 | | | | 135 | | | | 4 | | | | 125 | | | | 0 | | | | 3 | |
| | | | | | | | | | | | | | | | | | | | | | | | | | | | | |
Foreign, below BBB– | | | 62 | | | | 21 | | | | 83 | | | | 2 | | | | 132 | | | | 0 | | | | 4 | |
| | | | | | | | | | | | | | | | | | | | | | | | | | | | | |
Real estate | | | | | | | | | | | | | | | | | | | | | | | | | | | | |
| | | | | | | | | | | | | | | | | | | | | | | | | | | | | |
Domestic | | | 0 | | | | 103 | | | | 103 | | | | 3 | | | | 0 | | | | 95 | | | | 3 | |
| | | | | | | | | | | | | | | | | | | | | | | | | | | | | |
Foreign | | | 0 | | | | 0 | | | | 0 | | | | 0 | | | | 0 | | | | 0 | | | | 0 | |
| | | | | | | | | | | | | | | | | | | | | | | | | | | | | |
Other | | | 45 | | | | 160 | | | | 205 | | | | 5 | | | | 61 | | | | 163 | | | | 6 | |
| | | | | | | | | | | | | | | | | | | | | | | | | | | | | |
| Insurance contracts | | | 0 | | | | 15 | | | | 15 | | | | 0 | | | | 0 | | | | 15 | | | | 0 | |
| | | | | | | | | | | | | | | | | | | | | | | | | | | | | |
| Other investments | | | 0 | | | | 5 | | | | 5 | | | | 0 | | | | 8 | | | | 4 | | | | 0 | |
| | | | | | | | | | | | | | | | | | | | | | | | | | | | | |
| Total | | | 3,426 | | | | 342 | | | | 3,768 | | | | 100 | | | | 3,503 | | | | 280 | | | | 100 | |
| | | | | | | | | | | | | | | | | | | | | | | | | | | | | |
| Total fair value of plan assets | | | | | | | | | | | 3,768 | | | | | | | | | | | | 3,783 | | | | | |
| | | | | | | | | | | | | | | | | | | | | | | | | | | | | |
1 The bond credit ratings are primarily based on Standard and Poor’s credit ratings. Ratings AAA to BBB– and below BBB– represent investment grade and non-investment grade ratings, respectively. In cases where credit ratings from other rating agencies were used, these were converted to the equivalent rating in the Standard & Poor’s rating classification.
b) Post-retirement medical and life insurance plans
In the US and the UK, UBS offers retiree medical benefits that contribute to the health care coverage of certain employees and their beneficiaries after retirement. The UK medical plan is closed to new entrants. In the US, in addition to retiree medical benefits, UBS also provides retiree life insurance benefits to certain employees. The post-retirement medical benefits in the UK and the US cover all types of medical expenses including, but not limited to, cost of doctor visits, hospitalization, surgery and pharmaceuticals. The retirees contribute to the cost of the post-retirement medical benefits. These plans are not pre-funded plans and costs are incurred as amounts are paid.
In 2013, UBS announced changes to one of the US post-retirement medical and life insurance plans in relation to the eligibility criteria and
cost sharing. This change reduced the defined benefit obligation by CHF 9 million resulting in a gain of CHF 9 million in 2013.
Further in 2013, UBS announced a change to the other US post-retirement medical and life insurance plan in relation to the prescription drug coverage. This plan change reduced the defined benefit obligation by CHF 8 million resulting in a gain of CHF 8 million in 2013.
In 2012, UBS announced changes to the retiree medical and life insurance benefit plans in the US. This change reduced the defined benefit obligation by CHF 116 million with a corresponding gain recognized in the income statement in 2012.
The employer contributions expected to be made to the post-retirement medical and life insurance plans in 2014 are estimated to be CHF 7 million.
Financial information
Notes to the consolidated financial statements
Note 28 Pension and other post-employment benefit plans (continued)
The following table provides an analysis of the net asset/(liability) recognized on the balance sheet for post-retirement medical and life insurance plans between the beginning to the end of the year, as well as an analysis of amounts recognized in net profit and in other comprehensive income.
Post-retirement medical and life insurance plans
| | | | | | | | |
| CHF million | | | | | | |
| For the year ended | | | 31.12.13 | | | | 31.12.12 | |
| | | | | | | | | |
| Defined benefit obligation at the beginning of the year | | | 136 | | | | 219 | |
| | | | | | | | | |
| Current service cost | | | 1 | | | | 6 | |
| | | | | | | | | |
| Interest expense | | | 6 | | | | 9 | |
| | | | | | | | | |
| Plan participant contributions | | | 2 | | | | 3 | |
| | | | | | | | | |
| Remeasurements of defined benefit obligation | | | (3 | ) | | | 26 | |
| | | | | | | | | |
of which: actuarial (gains)/losses arising from changes in demographic assumptions | | | (1 | ) | | | 0 | |
| | | | | | | | | |
of which: actuarial (gains)/losses arising from changes in financial assumptions | | | (10 | ) | | | 10 | |
| | | | | | | | | |
of which: experience (gains)/losses | | | 8 | | | | 16 | |
| | | | | | | | | |
| Past service cost related to plan amendments | | | (17 | ) | | | (9 | ) |
| | | | | | | | | |
| Curtailments | | | 0 | | | | (108 | ) |
| | | | | | | | | |
| Benefit payments1 | | | (9 | ) | | | (9 | ) |
| | | | | | | | | |
| Foreign currency translation | | | (2 | ) | | | (1 | ) |
| | | | | | | | | |
| Defined benefit obligation at the end of the year | | | 114 | | | | 136 | |
| | | | | | | | | |
of which: amounts owing to active members | | | 15 | | | | 27 | |
| | | | | | | | | |
of which: amounts owing to deferred members | | | 0 | | | | 0 | |
| | | | | | | | | |
of which: amounts owing to retirees | | | 99 | | | | 109 | |
| | | | | | | | | |
| Fair value of plan assets at the end of the year | | | 0 | | | | 0 | |
| | | | | | | | | |
| Net defined benefit asset/(liability) | | | (114 | ) | | | (136 | ) |
| | | | | | | | | |
| | |
| Analysis of amounts recognized in net profit | | | | | | | | |
| | | | | | | | | |
| Current service cost | | | 1 | | | | 6 | |
| | | | | | | | | |
| Interest expense related to defined benefit obligation | | | 6 | | | | 9 | |
| | | | | | | | | |
| Past service cost related to plan amendments | | | (17 | ) | | | (9 | ) |
| | | | | | | | | |
| Curtailments | | | 0 | | | | (108 | ) |
| | | | | | | | | |
| Net periodic cost | | | (11 | ) | | | (102 | ) |
| | | | | | | | | |
| | |
| Analysis of gains/(losses) recognized in other comprehensive income | | | | | | | | |
| | | | | | | | | |
| Remeasurement of defined benefit obligation | | | 3 | | | | (26 | ) |
| | | | | | | | | |
| Total gains/(losses) recognized in other comprehensive income | | | 3 | | | | (26 | ) |
| | | | | | | | | |
1 Benefit payments are funded by employer contributions and plan participant contributions.
468
Note 28 Pension and other post-employment benefit plans (continued)
The post-retirement benefit obligation is determined by using the assumed average health care cost trend rate. On a country-by-country basis, the same discount rate is used for the calculation of the post-retirement benefit obligation from medical and life insurance plans as for the defined benefit obligations arising from pension plans.
The discount rate and the assumed average health care cost trend rates are presented in the following table. The calculation of the post-retirement benefit obligation also uses life expectancy rates, as disclosed in “Note 28a Defined benefit pension plans” above.
Principal weighted average actuarial assumptions used (%)1
Assumptions used to determine defined benefit obligations at the end of the year
| | | | | | | | |
| For the year ended | | 31.12.13 | | | 31.12.12 | |
| Discount rate | | | 4.8 | | | | 4.1 | |
| | | | | | | | | |
| Average health care cost trend rate – initial | | | 6.8 | | | | 7.6 | |
| | | | | | | | | |
| Average health care cost trend rate – ultimate | | | 5.1 | | | | 5.0 | |
| | | | | | | | | |
1 The assumptions for life expectancies are provided within “Note 28a Defined benefit pension plans.”
The following table presents a sensitivity analysis for each significant actuarial assumption showing how the defined benefit obligation would have been affected by changes in the relevant actuarial assumption that were reasonably possible at the balance sheet date.
Sensitivity analysis of significant actuarial assumptions1
| | | | | | | | |
| | | Increase/(decrease) in
defined benefit obligation | |
| CHF million | | 31.12.13 | | | 31.12.12 | |
| Discount rate | | | | | | | | |
| | | | | | | | | |
Increase by 50 basis points | | | (6 | ) | | | (8 | ) |
| | | | | | | | | |
Decrease by 50 basis points | | | 7 | | | | 9 | |
| | | | | | | | | |
| Average health care cost trend rate | | | | | | | | |
| | | | | | | | | |
Increase by 100 basis points | | | 9 | | | | 12 | |
| | | | | | | | | |
Decrease by 100 basis points | | | (8 | ) | | | (10 | ) |
| | | | | | | | | |
| Life expectancy | | | | | | | | |
| | | | | | | | | |
Increase in longevity by one additional year | | | 7 | | | | 9 | |
| | | | | | | | | |
1 The sensitivity analyses are based on a change in one assumption while holding all other assumptions constant, so that interdependencies between the assumptions are excluded.
c) Defined contribution plans
UBS also sponsors a number of defined contribution plans in its non-Swiss locations. The locations with significant defined contribution plans are the UK and the US. Certain plans permit employees to make contributions and earn matching or other contributions from UBS. The
employer contributions to these plans are recognized as an expense which, for the years ended 31 December 2013, 31 December 2012 and 31 December 2011, amounted to CHF 236 million, CHF 240 million and CHF 254 million, respectively.
Financial information
Notes to the consolidated financial statements
Note 28 Pension and other post-employment benefit plans (continued)
d) Related party disclosure
UBS is the principal bank for the pension fund of UBS in Switzer-land. In this function, UBS is engaged to execute most of the pension fund’s banking activities. These activities can include, but are not limited to, trading and securities lending and borrowing. All transactions have been executed under arm’s length conditions. The non-Swiss UBS pension funds do not have a similar banking relationship with UBS.
In 2008, UBS sold certain bank-occupied properties to the Swiss pension fund. Simultaneously, UBS and the Swiss pension fund entered into lease-back arrangements for some of the properties with 25-year lease terms and two renewal options for 10 years each. During 2009,
UBS renegotiated one of the lease contracts which reduced UBS’s remaining lease commitment. In 2013, after the first five years, the early break options for most of the leases were not exercised, which resulted in an increase in the minimum commitment for additional five years. As of 31 December 2013, the minimum commitment towards the Swiss pension fund under the related leases is approximately CHF 19 million (31 December 2012: CHF 11 million).
The following amounts have been received or paid by UBS from and to the pension funds in respect of these banking activities and arrangements.
Related party disclosure
| | | | | | | | | | | | |
| | For the year ended | |
| CHF million | | 31.12.13 | | | 31.12.12 | | | 31.12.11 | |
| Received by UBS | | | | | | | | | | | | |
| | | | | | | | | | | | | |
| Fees | | | 33 | | | | 31 | | | | 24 | |
| | | | | | | | | | | | | |
| Paid by UBS | | | | | | | | | | | | |
| | | | | | | | | | | | | |
| Rent | | | 8 | | | | 9 | | | | 10 | |
| | | | | | | | | | | | | |
| Interest | | | 1 | | | | 1 | | | | 3 | |
| | | | | | | | | | | | | |
| Dividends and capital repayments | | | 2 | | | | 0 | | | | 0 | |
| | | | | | | | | | | | | |
The transaction volumes in UBS shares and other UBS securities are as follows.
Transaction volumes – related parties
| | | | | | | | |
| | For the year ended | |
| | | 31.12.13 | | | 31.12.12 | |
| Financial instruments bought by pension funds | | | | | | | | |
| | | | | | | | | |
| UBS shares (in thousands of shares) | | | 1,459 | | | | 2,926 | |
| | | | | | | | | |
| UBS debt instruments (par values in CHF million) | | | 5 | | | | 10 | |
| | | | | | | | | |
| Financial instruments sold by pension funds or matured | | | | | | | | |
| | | | | | | | | |
| UBS shares (in thousands of shares) | | | 2,293 | | | | 3,645 | |
| | | | | | | | | |
| UBS debt instruments (par values in CHF million) | | | 8 | | | | 81 | |
| | | | | | | | | |
Details of the fair value of the plan assets of the defined pension plans are disclosed in “Note 28a Defined benefit pension plans.” In addition, UBS defined contribution pension funds held 16,192,501 UBS shares
with a fair value of CHF 278 million as of 31 December 2013 (31 December 2012: 16,690,174 UBS shares with a fair value of CHF 240 million).
470
Note 29 Equity participation and other compensation plans
a) Plans offered
UBS operates several equity participation and other compensation plans to align the interests of executives, managers and staff with the interests of shareholders. Some plans (e.g., Equity Plus and Equity Ownership Plan) are granted to eligible employees in approximately 50 countries and are designed to meet the legal, tax and regulatory requirements of each country in which they are offered. Certain plans are used in specific countries, business areas (e.g., awards granted within Wealth Management Americas), or are offered to members of the Group Executive Board (GEB) only. UBS operates compensation plans on a mandatory, discretionary and voluntary basis. The explanations below provide a general description of the terms of the most significant plans which relate to the performance year 2013 (granted in 2014) and those from prior years that are partly expensed in 2013. Refer to Note 1a) 25) for a description of the accounting policy related to equity participation and other compensation plans.
Mandatory share-based compensation plans
Equity Ownership Plan (EOP): Selected employees receive a portion of their annual performance-related compensation above a certain threshold in the form of an EOP award in UBS shares, notional shares or UBS performance shares (notional shares which are subject to performance conditions). From February 2014 onwards in general only notional shares and UBS performance shares are granted. Since 2011 (for the performance year 2010), performance shares have been granted to EOP participants who are risk-takers, Group Managing Directors or employees whose incentive exceeds a certain threshold. The performance shares granted in 2011 and 2012 will only vest in full if certain performance targets are met, i.e., if the participant’s business division is profitable (for Corporate Center participants, the Group as a whole needs to be profitable) in the financial year preceding the relevant vesting date. To determine if a business division is profitable in this context, adjustments to reported profitability may be made based on considerations relating to risk, quality and reliability of earnings. For performance shares granted in respect of the performance years 2012 and 2013, the performance conditions are based on the Group return on tangible equity and the divisional return on attributed equity (for Corporate Center participants, the return on attributed equity of the Group excluding Corporate Center). Replacement awards (including sign-on payments) can be offered in deferred cash under the EOP plan rules.
Awards in UBS shares allow for voting and dividend rights during the vesting period, whereas notional and performance shares represent a promise to receive UBS shares at vesting and do not allow for voting rights during the vesting period. Notional and performance shares granted before February 2014 have no rights to dividends, whereas for awards granted since February 2014 employees are entitled to receive a dividend equivalent which may be paid in notional shares and/or cash,
and which will vest on the same terms and conditions as the award. Awards granted in the form of UBS shares, notional shares and performance shares are settled by delivering UBS shares at vesting, except in countries where this is not permitted for legal or tax reasons. EOP awards granted until 2012 generally vest in three equal increments over a three-year vesting period and awards granted since March 2013 generally vest in equal increments two and three years following grant. The awards are generally forfeitable upon, among other circumstances, voluntary termination of employment with UBS. Compensation expense is recognized in the performance year if the employee meets the retirement eligibility requirements at the date of grant. Otherwise, compensation expense is recognized from the grant date to the earlier of the vesting date or the retirement eligibility date of the employee, on a tiered basis.
Senior Executive Equity Ownership Plan (SEEOP): Up to 2012 (performance year 2011) GEB members received a portion of their mandatory deferral in UBS shares or notional shares, which vest in one-fifth increments over a five-year vesting period and are forfeitable if certain conditions are not met. Awards granted since 2011 are subject to the same performance conditions as performance shares granted under the EOP, i.e., they will only vest in full if the participant’s business division is profitable (for Corporate Center participants, the Group as a whole must be profitable) in the financial year preceding scheduled vesting. Awards granted under SEEOP are settled by delivering UBS shares at vesting. Compensation expense is recognized on the same basis as for share-settled EOP awards. From 2013 (performance year 2012), GEB members have received EOP awards. No SEEOP awards were granted for the performance years 2012 and 2013.
Incentive Performance Plan (IPP): In 2010, GEB members and certain other senior employees received part of their annual incentive in the form of performance shares granted under the IPP. Each performance share granted is a contingent right to receive between one and three UBS shares at vesting, depending on the achievement of share price targets. The IPP awards vest in full after five years (i.e., in 2015) and are subject to continued employment with UBS. Compensation expense is recognized on a tiered basis from the grant date to the earlier of the vesting date or the retirement eligibility date of the employee. IPP was a one-time plan granted in 2010 only.
Performance Equity Plan (PEP): From 2010 to 2012, GEB members received part of their annual incentive in the form of performance shares granted under the PEP. Each performance share is a contingent right to receive between zero and two UBS shares at vesting, depending on the achievement of Economic Profit (EP) and Total Shareholder Return (TSR) targets. PEP awards vest in full after three years. EP is a risk-adjusted profit measure that takes into account the cost of risk capital. TSR measures the total return to UBS shareholders (in the form of share price appreciation and
Financial information
Notes to the consolidated financial statements
Note 29 Equity participation and other compensation plans (continued)
dividends) as compared to the constituents of a banking index. Vesting is subject to continued employment with UBS. Compensation expense is recognized on a tiered basis from the grant date to the earlier of the vesting date or the retirement eligibility date of the employee. No PEP awards were granted for the performance years 2012 and 2013.
2012 Special Plan Award Program for the Investment Bank (SPAP): In April 2012, certain Managing Directors and Group Managing Directors of the Investment Bank were granted an award of UBS shares which will vest three years after grant. Vesting is subject to performance conditions, continued employment with the firm and certain other conditions. The vesting of Special Plan awards is subject to performance conditions based on the level of reduction in risk-weighted assets achieved and the average return on risk-weighted assets in the Investment Bank for 2012, 2013 and 2014. Compensation expense is recognized from the grant date to the earlier of the vesting date or the retirement eligibility date of the employee.
Mandatory deferred cash compensation plans
Deferred Contingent Capital Plan (DCCP): The DCCP is a mandatory performance award deferral plan for all employees whose total compensation exceeds a certain threshold. Such employees receive part of their annual incentive in the form of notional bonds, which are a right to receive a cash payment at vesting. DCCP awards for the performance year 2012 (granted in 2013) vest in full five years from grant and are forfeited if the phase-in Basel III common equity tier 1 capital ratio of the Group falls below 7%, if FINMA determines that the DCCP awards need to be written down to prevent the insolvency, bankruptcy or failure of UBS AG, or if UBS AG has received a commitment of extraordinary support from the public sector that is necessary to prevent such insolvency, bankruptcy or failure. DCCP awards for the performance year 2013 (granted in 2014) are forfeited if the phase-in Basel III common equity tier 1 capital ratio of the Group falls below 10% for GEB members and 7% for non-GEB members. There was no change to the other forfeiture rules. Interest is paid annually for performance years in which the firm generates an adjusted profit before tax. In any years during the vesting period where UBS does not achieve an adjusted profit before tax, GEB members would forfeit 20% of the award. The awards are subject to standard forfeiture and harmful acts provisions, including voluntary termination of employment with UBS. Compensation expense is recognized in the performance year if the employee meets the retirement eligibility requirements at the date of grant. Otherwise, compensation expense is recognized from the grant date to the earlier of the vesting date or the retirement eligibility date of the employee.
Long-Term Deferred Retention Senior Incentive Scheme (LTDRSIS): Awards granted under the LTDRSIS are granted to employees in Australia and represent a profit share amount based on the profitability of the Australian business. Awards vest after three years and include an
arrangement which allows for unpaid installments to be reduced if the business has a loss during the calendar year preceding vesting. The awards are generally forfeitable upon voluntary termination of employment with UBS. Compensation expense is recognized in the performance year if the employee meets the retirement eligibility requirements at the date of the grant. Otherwise, compensation expense is recognized ratably from the grant date to the earlier of the vesting date or the retirement eligibility date of the employee.
Global Asset Management Equity Ownership Plan: In order to align their compensation with the performance of the funds they manage, all Global Asset Management employees receiving EOP awards, receive them in the form of cash-settled notional funds since 2012. The amount depends on the value of the relevant underlying Global Asset Management funds at the time of vesting. In prior years certain Global Asset Management employees received EOP awards in a combination of shares and cash-settled notional funds, the corresponding amount depended on the value of the underlying Global Asset Management funds at the time of vesting. The awards are generally forfeitable upon, among other circumstances, voluntary termination of employment with UBS. Compensation expense is recognized in the performance year if the employee meets the retirement eligibility requirements at the date of grant. Otherwise, compensation expense is recognized from the grant date to the earlier of the vesting date or the retirement eligibility date of the employee, on a tiered basis.
Cash Balance Plan (CBP): From 2010 to 2012, Group Executive Board (GEB) members received part of their annual incentive in the form of a mandatory deferred cash award. CBP awards are paid out in two equal installments during the two years following the year of grant, subject to certain performance conditions. Awards granted in 2011 and 2012 (for performance years 2010 and 2011, respectively) are subject to Group return on equity performance conditions, whereas awards granted in 2010 (for performance year 2009) are subject to profitability hurdles. After a GEB member has left the firm, the deferred portion of the CBP award continues to be at risk of forfeiture. Awards granted under the CBP from 2011 onwards are forfeited if a GEB member voluntarily terminates his or her employment and joins another financial services organization. Compensation expense is recognized in the performance year, which is generally the financial year prior to the grant date. No CBP awards were granted for the performance years 2012 and 2013.
Deferred Cash Plan (DCP): In 2011, DCP awards were granted to Investment Bank employees whose total compensation exceeded a certain threshold. DCP awards vest in one-third increments over a three-year period following grant. The awards are forfeitable upon voluntary termination of employment. Compensation expense is recognized ratably over the vesting period. DCP was a one-time plan granted in 2011.
Note 29 Equity participation and other compensation plans (continued)
Wealth Management Americas financial advisor compensation
Financial advisor compensation – cash payments consist primarily of a formula-based compensation plan, which fluctuates in proportion to the level of business activity.
UBS also may enter into compensation commitments with certain financial advisors primarily as a recruitment incentive and to incentivize financial advisors to achieve specified revenue production and other performance thresholds. The compensation is earned and paid to the employee during a period of continued employment and may be forfeited under certain circumstances. In most cases, UBS grants loans to financial advisors in connection with these compensation commitments.
GrowthPlus is a program for selected financial advisors whose revenue production and length of service exceeds defined thresholds from 2010 through 2017. Compensation arrangements were granted in 2010 and 2011 with potential arrangements to be granted in 2015 and 2018. The awards vest ratably over seven years from grant with the exception of the 2018 commitment, which vests over five years.
PartnerPlus is a mandatory deferred cash compensation plan for certain eligible employees. Awards (UBS contributions) are based on a predefined formula during the performance year. Participants are also allowed to voluntarily contribute additional amounts earned during the year, up to a percentage of their pay, which are vested upon contribution. Awards earn an above-market rate of interest during the initial four-year period and a market rate of interest thereafter. Voluntary contributions can earn an above-market rate of interest during the initial four-year period and a market rate of interest thereafter or along with vested company contributions can be benchmarked to various mutual funds when balances vest. Awards and all interest vest in 20% increments six to ten years following grant date. Awards and interest earned on both UBS and voluntary contributions are forfeitable under certain circumstances. Compensation expense for awards is recognized in the performance year if the employee meets the qualifying separation eligibility requirements at the date of grant. Otherwise, compensation expense for awards is recognized ratably commencing in the performance year to the earlier of the vesting date or the qualifying separation eligibility date of the employee. Compensation expense for voluntary contributions are recognized in the year of deferral.
Discretionary share-based compensation plans
Key Employee Stock Appreciation Rights Plan (KESAP) and Key Employee Stock Option Plan (KESOP): Until 2009, key and high potential employees were granted discretionary share-settled stock appreciation rights (SARs) or UBS options with a strike price not less than the fair market value of a UBS share on the date the SAR or option was granted. A SAR gives employees the right to receive a number of UBS shares equal to the value of any appreciation in the market price of a UBS share between the grant date and the exercise date. One option gives the right to acquire one registered UBS share at the option’s strike price. SARs
and options are settled by delivering UBS shares, except in countries where this is not permitted for legal reasons. These awards are generally forfeitable upon termination of employment with UBS. Compensation expense is recognized from the grant date to the earlier of the vesting date or the retirement eligibility date of the employee. No options or SARs awards have been granted since 2009.
Voluntary share-based compensation plans
Equity Plus Plan (Equity Plus): Equity Plus is a voluntary plan that provides eligible employees with the opportunity to purchase UBS shares at market value and receive, at no additional cost, one free notional UBS share for every three shares purchased, up to a maximum annual limit. Share purchases may be made annually from the performance award and/or monthly through regular deductions from salary. Shares purchased under Equity Plus are restricted from sale for a maximum of three years from the time of purchase. Equity Plus awards vest after up to three years. Prior to 2010, instead of notional shares participants received two UBS options for each share they purchased under this plan. The options had a strike price equal to the fair market value of a UBS share on the grant date, a two-year vesting period and generally expired ten years from the grant date. The options are forfeitable in certain circumstances and are settled by delivering UBS shares, except in countries where this is not permitted for legal reasons. Compensation expense for Equity Plus is recognized from the grant date to the earlier of the vesting date or the retirement eligibility date of the employee. For awards granted from April 2014 onwards, employees are entitled to receive a dividend equivalent which may be paid in either notional shares and/or cash.
Share delivery obligations
UBS satisfies share delivery obligations under its share-based plans either by purchasing UBS shares in the market or through the issuance of new shares. As of 31 December 2013, total future share delivery obligations in relation to employee share-based compensation awards were 109 million shares, taking into account the UBS share price at year-end 2013 as well as performance conditions. Share delivery obligations related to unvested and vested notional share awards, performance share awards, options and stock appreciation rights.
As of 31 December 2013, UBS held 73 million treasury shares (31 December 2012: 74 million shares) which were available to satisfy delivery obligations related to notional share awards, performance share awards, options and stock appreciation rights. An additional 139 million unissued shares (31 December 2012: 145 million shares) in conditional share capital (out of 150 million approved in 2006) were available to satisfy the delivery obligation related to options and stock appreciation rights. Treasury shares held or newly issued shares are delivered to employees at exercise or vesting.
Financial information
Notes to the consolidated financial statements
Note 29 Equity participation and other compensation plans (continued)
b) Effect on the income statement
Effect on the income statement for the financial year and future periods
The following table summarizes the compensation expenses recognized for the year ended 31 December 2013 and deferred compensation expenses that will be recognized as an expense in the income
statements of 2014 and later. The deferred compensation expenses in the table also include vested and non-vested awards granted mainly in February 2014, which relate to the performance year 2013.
Personnel expenses – Recognized and deferred1
| | | | | | | | | | | | | | | | | | | | | | | | |
| | Personnel expenses for the year
ended 2013 | | | Personnel expenses deferred to
2014 and later | |
| CHF million | | Expenses
relating to
awards for
2013 | | | Expenses
relating to
awards for
prior years | | | Total | | | Relating to
awards for
2013 | | | Relating to
awards for
prior years | | | Total | |
| Performance awards | | | | | | | | | | | | | | | | | | | | | | | | |
| | | | | | | | | | | | | | | | | | | | | | | | | |
| Cash performance awards | | | 1,942 | | | | (30 | ) | | | 1,912 | | | | 0 | | | | 0 | | | | 0 | |
| | | | | | | | | | | | | | | | | | | | | | | | | |
| Deferred Contingent Capital Plan (DCCP) | | | 152 | | | | 96 | | | | 248 | | | | 348 | | | | 230 | | | | 578 | |
| | | | | | | | | | | | | | | | | | | | | | | | | |
| Deferred cash plans (DCP and other cash plans) | | | 2 | | | | 53 | | | | 55 | | | | 7 | | | | 12 | | | | 19 | |
| | | | | | | | | | | | | | | | | | | | | | | | | |
| Equity Ownership Plan (EOP/SEEOP) – UBS shares | | | 190 | | | | 466 | | | | 656 | | | | 520 | | | | 307 | | | | 827 | |
| | | | | | | | | | | | | | | | | | | | | | | | | |
| Performance Equity Plan (PEP) | | | 0 | | | | 3 | | | | 3 | | | | 0 | | | | 0 | | | | 0 | |
| | | | | | | | | | | | | | | | | | | | | | | | | |
| Incentive Performance Plan (IPP) | | | 0 | | | | 33 | | | | 33 | | | | 0 | | | | 21 | | | | 21 | |
| | | | | | | | | | | | | | | | | | | | | | | | | |
| Total UBS share plans | | | 190 | | | | 502 | | | | 692 | | | | 520 | | | | 328 | | | | 848 | |
| | | | | | | | | | | | | | | | | | | | | | | | | |
| Equity Ownership Plan (EOP) – notional funds | | | 19 | | | | 60 | | | | 79 | | | | 37 | | | | 36 | | | | 73 | |
| | | | | | | | | | | | | | | | | | | | | | | | | |
| Total performance awards | | | 2,305 | | | | 681 | | | | 2,986 | | | | 912 | | | | 606 | | | | 1,518 | |
| | | | | | | | | | | | | | | | | | | | | | | | | |
| Variable compensation | | | | | | | | | | | | | | | | | | | | | | | | |
| Variable compensation – other | | | 152 | | | | 136 | | | | 288 | 2 | | | 340 | 3 | | | 398 | 4 | | | 738 | |
| | | | | | | | | | | | | | | | | | | | | | | | | |
| Financial advisor compensation – cash payments | | | 2,219 | | | | 0 | | | | 2,219 | | | | 0 | | | | 0 | | | | 0 | |
| | | | | | | | | | | | | | | | | | | | | | | | | |
| Compensation commitments with recruited financial advisors | | | 33 | | | | 605 | | | | 638 | | | | 440 | | | | 2,098 | | | | 2,538 | |
| | | | | | | | | | | | | | | | | | | | | | | | | |
| GrowthPlus and other deferral plans | | | 62 | | | | 132 | | | | 194 | | | | 107 | | | | 564 | | | | 671 | |
| | | | | | | | | | | | | | | | | | | | | | | | | |
| UBS share plans | | | 20 | | | | 69 | | | | 89 | | | | 45 | | | | 165 | | | | 210 | |
| | | | | | | | | | | | | | | | | | | | | | | | | |
| Wealth Management Americas: | | | | | | | | | | | | | | | | | | | | | | | | |
| Financial advisor compensation5 | | | 2,334 | | | | 806 | | | | 3,140 | | | | 592 | | | | 2,827 | | | | 3,419 | |
| | | | | | | | | | | | | | | | | | | | | | | | | |
| Total | | | 4,791 | | | | 1,623 | | | | 6,414 | | | | 1,844 | | | | 3,831 | | | | 5,675 | |
| | | | | | | | | | | | | | | | | | | | | | | | | |
1 Total share-based personnel expenses recognized for the year ended 31 December 2013 were CHF 1,042 million and were comprised of UBS share plans of CHF 787 million, Equity Ownership Plan – notional funds of CHF 79 million, related social security costs of CHF 65 million and other compensation plans (reported within Variable compensation – other) of CHF 111 million. 2 Includes replacement payments of CHF 78 million (CHF 72 million related to prior years), forfeiture credits of CHF 146 million (all related to prior years), severance payments of CHF 114 million (all related to current year) and retention plan and other payments of CHF 242 million (CHF 210 million related to prior years). 3 Includes DCCP interest of CHF 101 million for DCCP awards 2013 (granted in 2014). 4 Includes DCCP interest of CHF 109 million for DCCP awards 2012 (granted in 2013). 5 Financial advisor compensation consists of grid-based compensation based directly on compensable revenues generated by financial advisors and supplemental compensation calculated based on financial advisor productivity, firm tenure, assets and other variables. It also includes costs related to compensation commitments with financial advisors entered into at the time of recruitment, which are subject to vesting requirements. Amounts reflected as deferred expenses represent the maximum deferred exposure as of the balance sheet date.
474
Note 29 Equity participation and other compensation plans (continued)
Personnel expenses – Recognized and deferred1
| | | | | | | | | | | | | | | | | | | | | | | | |
| | Personnel expenses for the year
ended 2012 | | | Personnel expenses deferred to
2013 and later | |
| CHF million | | Expenses
relating to
awards for
2012 | | | Expenses
relating to
awards for
prior years | | | Total | | | Relating to
awards for
2012 | | | Relating to
awards for
prior years | | | Total | |
| Performance awards | | | | | | | | | | | | | | | | | | | | | | | | |
| | | | | | | | | | | | | | | | | | | | | | | | | |
| Cash performance awards | | | 1,411 | | | | (38 | ) | | | 1,373 | | | | 0 | | | | 0 | | | | 0 | |
| | | | | | | | | | | | | | | | | | | | | | | | | |
| Deferred Contingent Capital Plan (DCCP) | | | 145 | | | | 0 | | | | 145 | | | | 361 | | | | 0 | | | | 361 | |
| | | | | | | | | | | | | | | | | | | | | | | | | |
| Deferred cash plans (CBP, DCP and other cash plans) | | | 5 | | | | 149 | | | | 154 | | | | 10 | | | | 87 | | | | 97 | |
| | | | | | | | | | | | | | | | | | | | | | | | | |
| Equity Ownership Plan (EOP/SEEOP) – UBS shares | | | 135 | | | | 995 | | | | 1,130 | | | | 383 | | | | 495 | | | | 878 | |
| | | | | | | | | | | | | | | | | | | | | | | | | |
| Performance Equity Plan (PEP) | | | 0 | | | | 10 | | | | 10 | | | | 0 | | | | 4 | | | | 4 | |
| | | | | | | | | | | | | | | | | | | | | | | | | |
| Incentive Performance Plan (IPP) | | | 0 | | | | 62 | | | | 62 | | | | 0 | | | | 82 | | | | 82 | |
| | | | | | | | | | | | | | | | | | | | | | | | | |
| Total UBS share plans | | | 135 | | | | 1,067 | | | | 1,202 | | | | 383 | | | | 581 | | | | 964 | |
| | | | | | | | | | | | | | | | | | | | | | | | | |
| UBS share option plans (KESAP/KESOP) | | | 0 | | | | 14 | | | | 14 | | | | 0 | | | | 0 | | | | 0 | |
| | | | | | | | | | | | | | | | | | | | | | | | | |
| Equity Ownership Plan (EOP) – notional funds | | | 28 | | | | 84 | | | | 112 | | | | 20 | | | | 46 | | | | 66 | |
| | | | | | | | | | | | | | | | | | | | | | | | | |
| Total performance awards | | | 1,724 | | | | 1,276 | | | | 3,000 | | | | 774 | | | | 714 | | | | 1,488 | |
| | | | | | | | | | | | | | | | | | | | | | | | | |
| Variable compensation | | | | | | | | | | | | | | | | | | | | | | | | |
| | | | | | | | | | | | | | | | | | | | | | | | | |
| Variable compensation – other | | | 424 | | | | (57 | ) | | | 367 | 2 | | | 494 | 3 | | | 71 | | | | 565 | |
| | | | | | | | | | | | | | | | | | | | | | | | | |
| Financial advisor compensation – cash payments | | | 1,957 | | | | 0 | | | | 1,957 | | | | 0 | | | | 0 | | | | 0 | |
| | | | | | | | | | | | | | | | | | | | | | | | | |
| Compensation commitments with recruited financial advisors | | | 54 | | | | 579 | | | | 634 | | | | 587 | | | | 2,115 | | | | 2,702 | |
| | | | | | | | | | | | | | | | | | | | | | | | | |
| GrowthPlus and other deferral plans | | | 54 | | | | 129 | | | | 183 | | | | 54 | | | | 620 | | | | 674 | |
| | | | | | | | | | | | | | | | | | | | | | | | | |
| UBS share plans | | | 21 | | | | 78 | | | | 99 | | | | 66 | | | | 216 | | | | 282 | |
| | | | | | | | | | | | | | | | | | | | | | | | | |
| Wealth Management Americas: | | | | | | | | | | | | | | | | | | | | | | | | |
| Financial advisor compensation4 | | | 2,087 | | | | 786 | | | | 2,873 | | | | 706 | | | | 2,951 | | | | 3,657 | |
| | | | | | | | | | | | | | | | | | | | | | | | | |
| Total | | | 4,235 | | | | 2,005 | | | | 6,240 | | | | 1,974 | | | | 3,736 | | | | 5,710 | |
| | | | | | | | | | | | | | | | | | | | | | | | | |
1 Total share-based personnel expenses recognized for the year ended 31 December 2012 were CHF 1,584 million and were comprised of UBS share plans of CHF 1,261 million, UBS share option plans of CHF 14 million, Equity Ownership Plan – notional funds of CHF 112 million, related social security costs of CHF 89 million and other compensation plans (reported within Variable compensation – other) of CHF 108 million. 2 Includes replacement payments of CHF 109 million (CHF 94 million prior year), forfeiture credits of CHF 174 million (prior year), severance payments of CHF 303 million (current year) and retention plan and other payments of CHF 128 million (CHF 21 million prior year). 3 Includes DCCP interest of CHF 137 million. 4 Financial advisor compensation consists of grid-based compensation based directly on compensable revenues generated by financial advisors and supplemental compensation calculated based on financial advisor productivity, firm tenure, assets and other variables. It also includes costs related to compensation commitments with financial advisors entered into at the time of recruitment, which are subject to vesting requirements. Amounts reflected as deferred expenses represent the maximum deferred exposure as of the balance sheet date.
During 2013, UBS accelerated the recognition of expenses for certain deferred compensation arrangements relating to employees that were made redundant as part of restructuring programs. Based on the redundancy provisions of the plan rules, these employees retain their deferred compensation awards, however, as the employees are not required to provide future service, compensation expense relating to these awards was accelerated to the termination date based on the shortened service period. The amounts accelerated and recognized relating to share-based payment awards in 2013 and 2012 were CHF 62 million and CHF 63 million respectively, and the amounts related to
deferred cash awards were CHF 9 million and CHF 13 million, respectively.
UBS also shortened the service period for certain employees in accordance with the mutually agreed termination provisions of their deferred compensation awards. Expense recognition was accelerated to the revised vesting date. The amounts accelerated and recognized relating to share-based payment awards in 2013 and 2012 were CHF 11 million and CHF 20 million, respectively, and the amounts related to deferred cash awards were CHF 3 million and CHF 2 million, respectively.
Financial information
Notes to the consolidated financial statements
Note 29 Equity participation and other compensation plans (continued)
Personnel expenses – Recognized and deferred1
| | | | | | | | | | | | | | | | | | | | | | | | |
| | Personnel expenses for the year
ended 2011 | | | Personnel expenses deferred to
2012 and later | |
| CHF million | | Expenses
relating to
awards for
2011 | | | Expenses
relating to
awards for
prior years | | | Total | | | Relating to
awards for
2011 | | | Relating to
awards for
prior years | | | Total | |
| Performance awards | | | | | | | | | | | | | | | | | | | | | | | | |
| | | | | | | | | | | | | | | | | | | | | | | | | |
| Cash performance awards | | | 1,554 | | | | (88 | ) | | | 1,466 | | | | 0 | | | | 0 | | | | 0 | |
| | | | | | | | | | | | | | | | | | | | | | | | | |
| Deferred cash plans (CBP, DCP and other cash plans) | | | 34 | | | | 309 | | | | 343 | | | | 3 | | | | 179 | | | | 182 | |
| | | | | | | | | | | | | | | | | | | | | | | | | |
| Equity Ownership Plan (EOP/SEEOP) – UBS shares | | | 231 | | | | 1,153 | | | | 1,384 | | | | 740 | | | | 720 | | | | 1,460 | |
| | | | | | | | | | | | | | | | | | | | | | | | | |
| Performance Equity Plan (PEP) | | | 3 | | | | 5 | | | | 8 | | | | 10 | | | | 4 | | | | 14 | |
| | | | | | | | | | | | | | | | | | | | | | | | | |
| Incentive Performance Plan (IPP) | | | 0 | | | | 97 | | | | 97 | | | | 0 | | | | 134 | | | | 134 | |
| | | | | | | | | | | | | | | | | | | | | | | | | |
| Total UBS share plans | | | 234 | | | | 1,256 | | | | 1,490 | | | | 750 | | | | 858 | | | | 1,608 | |
| | | | | | | | | | | | | | | | | | | | | | | | | |
| UBS share option plans (KESAP/KESOP) | | | 0 | | | | 100 | | | | 100 | | | | 0 | | | | 15 | | | | 15 | |
| | | | | | | | | | | | | | | | | | | | | | | | | |
| Equity Ownership Plan (EOP) – notional funds | | | 25 | | | | 93 | | | | 118 | | | | 69 | | | | 48 | | | | 117 | |
| | | | | | | | | | | | | | | | | | | | | | | | | |
| Total performance awards | | | 1,847 | | | | 1,669 | | | | 3,516 | | | | 822 | | | | 1,100 | | | | 1,922 | |
| | | | | | | | | | | | | | | | | | | | | | | | | |
| Variable compensation | | | | | | | | | | | | | | | | | | | | | | | | |
| | | | | | | | | | | | | | | | | | | | | | | | | |
| Variable compensation – other | | | 295 | | | | (104 | ) | | | 191 | 2 | | | 132 | | | | 111 | | | | 243 | |
| | | | | | | | | | | | | | | | | | | | | | | | | |
| Financial advisor compensation – cash payments | | | 1,695 | | | | 0 | | | | 1,695 | | | | 0 | | | | 0 | | | | 0 | |
| | | | | | | | | | | | | | | | | | | | | | | | | |
| Compensation commitments with recruited financial advisors | | | 37 | | | | 499 | | | | 536 | | | | 561 | | | | 2,131 | | | | 2,692 | |
| | | | | | | | | | | | | | | | | | | | | | | | | |
| GrowthPlus and other deferral plans | | | 90 | | | | 89 | | | | 179 | | | | 377 | | | | 422 | | | | 799 | |
| | | | | | | | | | | | | | | | | | | | | | | | | |
| UBS share plans | | | 20 | | | | 88 | | | | 108 | | | | 86 | | | | 261 | | | | 347 | |
| | | | | | | | | | | | | | | | | | | | | | | | | |
| Wealth Management Americas: | | | | | | | | | | | | | | | | | | | | | | | | |
| Financial advisor compensation3 | | | 1,842 | | | | 676 | | | | 2,518 | | | | 1,024 | | | | 2,814 | | | | 3,838 | |
| | | | | | | | | | | | | | | | | | | | | | | | | |
| Total | | | 3,984 | | | | 2,242 | | | | 6,226 | | | | 1,978 | | | | 4,025 | | | | 6,003 | |
| | | | | | | | | | | | | | | | | | | | | | | | | |
1 Total share-based personnel expenses recognized for the year ended 31 December 2011 were CHF 1,789 million and were comprised of UBS share plans of CHF 1,490 million, UBS share option plans of CHF 100 million, Equity Ownership Plan – notional funds of CHF 118 million, related social security costs of CHF 39 million and other compensation plans (reported within Variable compensation – other) of CHF 42 million. 2 Includes replacement payments of CHF 121 million, forfeiture credits of CHF 215 million, severance payments of CHF 239 million and retention plan and other payments of CHF 46 million. 3 Financial advisor compensation consists of grid-based compensation based directly on compensable revenues generated by financial advisors and supplemental compensation calculated based on financial advisor productivity, firm tenure, assets and other variables. It also includes costs related to compensation commitments with financial advisors entered into at the time of recruitment, which are subject to vesting requirements. Amounts reflected as deferred expenses represent the maximum deferred exposure as of the balance sheet date.
Additional disclosures on mandatory, discretionary and voluntary share-based compensation plans (including notional funds granted under EOP)
The total share-based personnel expenses recognized for the years ended 31 December 2013, 2012 and 2011 were CHF 1,042 million, CHF 1,584 million, and CHF 1,789 million, respectively. This includes the current period expense, amortization and related social security costs for awards issued in prior periods and performance year expensing for awards granted to retirement-eligible employees where the terms of the awards do not require the employee to provide future services.
The total compensation expenses for non-vested share-based awards granted up to 31 December 2013 relating to prior years to be recognized in future periods is CHF 710 million and will be recognized as personnel expenses over a weighted average period of 2 years. This includes UBS
share plans, UBS share option plans, the Equity Ownership Plan (notional funds), other variable compensation and the Equity Plus Plan. Total deferred compensation amounts included in the 2013 table differ from this amount as the deferred compensation amounts also include non-vested awards granted in February 2014 related to the performance year 2013.
Actual payments to participants in cash-settled share-based plans, including amounts granted as notional funds issued under the EOP, for the years ended 31 December 2013 and 2012 were CHF 157 million and CHF 141 million respectively. The total carrying amount of the liability related to these plans was CHF 164 million as of 31 December 2013 and CHF 249 million as of 31 December 2012.
476
Note 29 Equity participation and other compensation plans (continued)
c) Movements during the year
UBS share and performance share awards
Movements in UBS share and notional share awards were as follows:
UBS share awards
| | | | | | | | | | | | | | | | |
| | | Number of
shares 2013 | | | Weighted
average grant
date fair
value (CHF) | | | Number of
shares 2012 | | | Weighted
average grant
date fair
value (CHF) | |
| Outstanding, at the beginning of the year | | | 249,059,529 | | | | 15 | | | | 214,698,539 | | | | 17 | |
| | | | | | | | | | | | | | | | | |
| Shares awarded during the year | | | 50,270,660 | | | | 15 | | | | 120,208,862 | | | | 12 | |
| | | | | | | | | | | | | | | | | |
| Distributions during the year | | | (99,955,951 | ) | | | 15 | | | | (72,997,669 | ) | | | 17 | |
| | | | | | | | | | | | | | | | | |
| Forfeited during the year | | | (12,740,747 | ) | | | 15 | | | | (12,850,203 | ) | | | 17 | |
| | | | | | | | | | | | | | | | | |
| Outstanding, at the end of the year | | | 186,633,491 | | | | 15 | | | | 249,059,529 | | | | 15 | |
| | | | | | | | | | | | | | | | | |
of which: shares vested for accounting purposes | | | 48,096,537 | | | | | | | | 61,555,483 | | | | | |
| | | | | | | | | | | | | | | | | |
The fair value of shares that became legally vested and were distributed (i.e., all restrictions were fulfilled) during the years ended 31 December 2013 and 2012 was CHF 1,398 million and CHF 1,216 million, respectively.
Movements in performance shares granted under the IPP are as follows:
Incentive Performance Plan
| | | | | | | | |
| | 2013 | |
| | | Number
of performance
shares 2013 | | | Weighted average fair
value of IPP
performance shares at
grant date (CHF)1 | |
| Forfeitable, at the beginning of the year | | | 14,231,831 | | | | 22 | |
| | | | | | | | | |
| Awarded during the year | | | 0 | | | | 0 | |
| | | | | | | | | |
| Vested during the year | | | (8,690 | )2 | | | 22 | |
| | | | | | | | | |
| Forfeited during the year | | | (1,072,118 | ) | | | 22 | |
| | | | | | | | | |
| Forfeitable, at the end of the year | | | 13,151,023 | 3 | | | 22 | |
| | | | | | | | | |
of which: performance shares vested for accounting purposes | | | 10,248,071 | | | | | |
| | | | | | | | | |
| |
| | | 2012 | |
| Forfeitable, at the beginning of the year | | | 16,137,466 | | | | 22 | |
| | | | | | | | | |
| Awarded during the year | | | 0 | | | | 0 | |
| | | | | | | | | |
| Vested during the year | | | (7,182 | ) | | | 22 | |
| | | | | | | | | |
| Forfeited during the year | | | (1,898,453 | ) | | | 22 | |
| | | | | | | | | |
| Forfeitable, at the end of the year | | | 14,231,831 | 3 | | | 22 | |
| | | | | | | | | |
of which: performance shares vested for accounting purposes | | | 8,965,917 | | | | | |
| | | | | | | | | |
1 The weighted average fair value takes into account the applicable performance conditions and the range of possible outcomes. 2 The corresponding number of UBS shares distributed in 2013 was 8,690. 3 As of 31 December 2013 and 31 December 2012, the number of deliverable UBS shares was equal to the number of forfeitable performance shares.
Financial information
Notes to the consolidated financial statements
Note 29 Equity participation and other compensation plans (continued)
Movements in performance shares granted under the PEP are as follows:
Performance Equity Plan
| | | | | | | | |
| | 2013 | |
| | | Number
of performance
shares 2013 | | | Weighted average fair
value of PEP
performance shares at grant date (CHF)1 | |
| Forfeitable, at the beginning of the year | | | 1,825,199 | | | | 16 | |
| | | | | | | | | |
| Awarded during the year | | | 0 | | | | 0 | |
| | | | | | | | | |
| Vested during the year | | | (359,613 | )2 | | | 16 | |
| | | | | | | | | |
| Forfeited during the year | | | (84,628 | ) | | | 17 | |
| | | | | | | | | |
| Forfeitable, at the end of the year | | | 1,380,958 | 3 | | | 16 | |
| | | | | | | | | |
of which: performance shares vested for accounting purposes | | | 1,041,901 | | | | | |
| | | | | | | | | |
| |
| | | 2012 | |
| Forfeitable, at the beginning of the year | | | 1,210,598 | | | | 18 | |
| | | | | | | | | |
| Awarded during the year | | | 845,580 | | | | 13 | |
| | | | | | | | | |
| Vested during the year | | | 0 | | | | 0 | |
| | | | | | | | | |
| Forfeited during the year | | | (230,979 | ) | | | 13 | |
| | | | | | | | | |
| Forfeitable, at the end of the year | | | 1,825,199 | 3 | | | 16 | |
| | | | | | | | | |
of which: performance shares vested for accounting purposes | | | 1,160,836 | | | | | |
| | | | | | | | | |
1 The weighted average fair value takes into account the applicable performance conditions and the range of possible outcomes. 2 The corresponding number of UBS shares distributed in 2013 was 186,999. 3 As of 31 December 2013, the number of deliverable UBS shares was 629,136 based on the applicable performance conditions. As of 31 December 2012, the number of deliverable UBS shares was 946,683 based on the applicable performance conditions.
UBS option awards
Movements in option awards were as follows:
UBS option awards
| | | | | | | | | | | | | | | | |
| | | Number of
options 2013 | | | Weighted
average exercise
price (CHF)1 | | | Number of
options 2012 | | | Weighted
average exercise
price (CHF)1 | |
| Outstanding, at the beginning of the year | | | 158,090,564 | | | | 43 | | | | 179,992,361 | | | | 43 | |
| | | | | | | | | | | | | | | | | |
| Granted during the year | | | 0 | | | | 0 | | | | 0 | | | | 0 | |
| | | | | | | | | | | | | | | | | |
| Exercised during the year | | | (3,430,697 | ) | | | 12 | | | | (992,180 | ) | | | 11 | |
| | | | | | | | | | | | | | | | | |
| Forfeited during the year | | | (177,272 | ) | | | 45 | | | | (1,283,626 | ) | | | 44 | |
| | | | | | | | | | | | | | | | | |
| Expired unexercised | | | (21,312,456 | ) | | | 36 | | | | (19,625,991 | ) | | | 40 | |
| | | | | | | | | | | | | | | | | |
| Outstanding, at the end of the year | | | 133,170,139 | | | | 45 | | | | 158,090,564 | | | | 43 | |
| | | | | | | | | | | | | | | | | |
| Exercisable, at the end of the year | | | 133,170,139 | | | | 45 | | | | 158,090,564 | | | | 43 | |
| | | | | | | | | | | | | | | | | |
1 Some of the options in this table have exercise prices denominated in USD which have been converted into CHF at the year-end spot exchange rate for the purposes of this table.
The following table provides additional information about option exercises, grants and intrinsic values:
| | | | | | | | |
| For the year ended | | 31.12.13 | | | 31.12.12 | |
| Weighted average share price of options exercised (CHF) | | | 17 | | | | 13 | |
| | | | | | | | | |
| Intrinsic value of options exercised during the year (CHF million) | | | 17.5 | | | | 3.6 | |
| | | | | | | | | |
| Weighted average grant date fair value of options granted (CHF) | | | N/A | | | | N/A | |
| | | | | | | | | |
478
Note 29 Equity participation and other compensation plans (continued)
The following table provides additional information about options outstanding and options exercisable as of 31 December 2013:
| | | | | | | | | | | | | | | | | | | | | | | | | | | | | | | | |
| | Options outstanding | | | Options exercisable | |
| Range of exercise prices | | Number of
options
outstanding | | | Weighted
average exercise price (CHF/USD) | | | Aggregate
intrinsic value
(CHF/USD
million) | | | Weighted
average remaining
contractual
term (years) | | | Number of
options
exercisable | | | Weighted
average
exercise price
(CHF/USD) | | | Aggregate
intrinsic value
(CHF/USD)
million) | | | Weighted
average
remaining
contractual
term (years) | |
| CHF Awards | | | | | | | | | | | | | | | | | | | | | | | | | | | | | | | | |
| | | | | | | | | | | | | | | | | | | | | | | | | | | | | | | | | |
| 10.21 – 15.00 | | | 11,949,232 | | | | 11.40 | | | | 66.0 | | | | 4.6 | | | | 11,949,232 | | | | 11.40 | | | | 66.0 | | | | 4.6 | |
| | | | | | | | | | | | | | | | | | | | | | | | | | | | | | | | | |
| 15.01 – 25.00 | | | 9,685,112 | | | | 18.89 | | | | 4.6 | | | | 4.7 | | | | 9,685,112 | | | | 18.89 | | | | 4.6 | | | | 4.7 | |
| | | | | | | | | | | | | | | | | | | | | | | | | | | | | | | | | |
| 25.01 – 35.00 | | | 26,937,351 | | | | 31.48 | | | | 0.0 | | | | 3.8 | | | | 26,937,351 | | | | 31.48 | | | | 0.0 | | | | 3.8 | |
| | | | | | | | | | | | | | | | | | | | | | | | | | | | | | | | | |
| 35.01 – 45.00 | | | 7,527,842 | | | | 42.01 | | | | 0.0 | | | | 1.0 | | | | 7,527,842 | | | | 42.01 | | | | 0.0 | | | | 1.0 | |
| | | | | | | | | | | | | | | | | | | | | | | | | | | | | | | | | |
| 45.01 – 55.00 | | | 15,333,852 | | | | 49.43 | | | | 0.0 | | | | 1.4 | | | | 15,333,852 | | | | 49.43 | | | | 0.0 | | | | 1.4 | |
| | | | | | | | | | | | | | | | | | | | | | | | | | | | | | | | | |
| 55.01 – 65.00 | | | 4,480,527 | | | | 60.09 | | | | 0.0 | | | | 2.7 | | | | 4,480,527 | | | | 60.09 | | | | 0.0 | | | | 2.7 | |
| | | | | | | | | | | | | | | | | | | | | | | | | | | | | | | | | |
| 65.01 – 75.00 | | | 44,254,456 | | | | 67.62 | | | | 0.0 | | | | 2.4 | | | | 44,254,456 | | | | 67.62 | | | | 0.0 | | | | 2.4 | |
| | | | | | | | | | | | | | | | | | | | | | | | | | | | | | | | | |
| 10.21 – 75.00 | | | 120,168,372 | | | | | | | | 70.6 | | | | | | | | 120,168,372 | | | | | | | | 70.6 | | | | | |
| | | | | | | | | | | | | | | | | | | | | | | | | | | | | | | | | |
| | | | | | | | |
| USD Awards | | | | | | | | | | | | | | | | | | | | | | | | | | | | | | | | |
| | | | | | | | | | | | | | | | | | | | | | | | | | | | | | | | | |
| 17.88 – 25.00 | | | 1,647 | | | | 20.59 | | | | 0.0 | | | | 1.0 | | | | 1,647 | | | | 20.59 | | | | 0.0 | | | | 1.0 | |
| | | | | | | | | | | | | | | | | | | | | | | | | | | | | | | | | |
| 25.01 – 35.00 | | | 5,749,053 | | | | 31.74 | | | | 0.0 | | | | 0.5 | | | | 5,749,053 | | | | 31.74 | | | | 0.0 | | | | 0.5 | |
| | | | | | | | | | | | | | | | | | | | | | | | | | | | | | | | | |
| 35.01 – 44.83 | | | 7,251,067 | | | | 37.59 | | | | 0.0 | | | | 1.2 | | | | 7,251,067 | | | | 37.59 | | | | 0.0 | | | | 1.2 | |
| | | | | | | | | | | | | | | | | | | | | | | | | | | | | | | | | |
| 17.88 – 44.83 | | | 13,001,767 | | | | | | | | 0.0 | | | | | | | | 13,001,767 | | | | | | | | 0.0 | | | | | |
| | | | | | | | | | | | | | | | | | | | | | | | | | | | | | | | | |
UBS SAR awards
Movements in SAR awards were as follows:
UBS SARs awards
| | | | | | | | | | | | | | | | |
| | | Number of SARs
2013 | | | Weighted
average exercise
price (CHF) | | | Number of SARs
2012 | | | Weighted
average exercise
price (CHF) | |
| Outstanding, at the beginning of the year | | | 33,118,335 | | | | 12 | | | | 55,021,238 | | | | 12 | |
| | | | | | | | | | | | | | | | | |
| Granted during the year | | | 0 | | | | 0 | | | | 0 | | | | 0 | |
| | | | | | | | | | | | | | | | | |
| Exercised during the year | | | (10,427,263 | ) | | | 11 | | | | (14,217,629 | ) | | | 11 | |
| | | | | | | | | | | | | | | | | |
| Forfeited during the year | | | (57,500 | ) | | | 11 | | | | (684,717 | ) | | | 11 | |
| | | | | | | | | | | | | | | | | |
| Expired unexercised | | | (1,189,556 | ) | | | 33 | | | | (7,000,557 | ) | | | 11 | |
| | | | | | | | | | | | | | | | | |
| Outstanding, at the end of the year | | | 21,444,016 | | | | 12 | | | | 33,118,335 | | | | 12 | |
| | | | | | | | | | | | | | | | | |
| Exercisable, at the end of the year | | | 21,444,016 | | | | 12 | | | | 33,118,335 | | | | 12 | |
| | | | | | | | | | | | | | | | | |
The following table provides additional information about SARs exercises, grants and intrinsic values:
| | | | | | | | |
| For the year ended | | 31.12.13 | | | 31.12.12 | |
| Weighted average share price of SARs exercised (CHF) | | | 17 | | | | 13 | |
| | | | | | | | | |
| Intrinsic value of SARs exercised during the year (CHF million) | | | 57.0 | | | | 24.6 | |
| | | | | | | | | |
| Weighted average grant date fair value of SARs granted (CHF) | | | N/A | | | | N/A | |
| | | | | | | | | |
Financial information
Notes to the consolidated financial statements
Note 29 Equity participation and other compensation plans (continued)
The following table provides additional information about SARs outstanding as of 31 December 2013:
| | | | | | | | | | | | | | | | | | | | | | | | | | | | | | | | |
| | SARs outstanding | | | SARs exercisable | |
| Range of exercise prices | | Number of
SARs
outstanding | | | Weighted
average
exercise
price (CHF) | | | Aggregate
intrinsic value
(CHF million) | | | Weighted average
remaining
contractual term
(years) | | | Number of
SARs
exercisable | | | Weighted
average
exercise price
(CHF) | | | Aggregate
intrinsic value
(CHF million) | | | Weighted average
remaining
contractual term
(years) | |
| CHF | | | | | | | | | | | | | | | | | | | | | | | | | | | | | | | | |
| | | | | | | | | | | | | | | | | | | | | | | | | | | | | | | | | |
| 9.35 – 12.50 | | | 20,979,066 | | | | 11.34 | | | | 117.0 | | | | 5.0 | | | | 20,979,066 | | | | 11.34 | | | | 117.0 | | | | 5.0 | |
| | | | | | | | | | | | | | | | | | | | | | | | | | | | | | | | | |
| 12.51 – 15.00 | | | 18,000 | | | | 14.71 | | | | 0.0 | | | | 5.5 | | | | 18,000 | | | | 14.71 | | | | 0.0 | | | | 5.5 | |
| | | | | | | | | | | | | | | | | | | | | | | | | | | | | | | | | |
| 15.01 – 17.50 | | | 92,950 | | | | 16.80 | | | | 0.0 | | | | 4.8 | | | | 92,950 | | | | 16.80 | | | | 0.0 | | | | 4.8 | |
| | | | | | | | | | | | | | | | | | | | | | | | | | | | | | | | | |
| 17.51 – 20.00 | | | 354,000 | | | | 19.25 | | | | 0.0 | | | | 5.6 | | | | 354,000 | | | | 19.25 | | | | 0.0 | | | | 5.6 | |
| | | | | | | | | | | | | | | | | | | | | | | | | | | | | | | | | |
| 9.35 – 20.00 | | | 21,444,016 | | | | | | | | 117.0 | | | | | | | | 21,444,016 | | | | | | | | 117.0 | | | | | |
| | | | | | | | | | | | | | | | | | | | | | | | | | | | | | | | | |
d) Valuation
UBS share awards
UBS measures compensation expense based on the average market price of the UBS share on the grant date as quoted on the SIX Swiss Exchange, taking into consideration post-vesting sale and hedge restrictions, non-vesting conditions and market conditions, where applicable. The fair value of the share awards subject to post-vesting sale and hedge restrictions is discounted based upon the duration of the post-vesting restriction and is referenced to the cost of purchasing an at-the-money European put option for the term of the transfer restriction. The weighted average discount for share and performance share awards granted during 2013 is approximately 13.4% (2012: 15.4%) of the market price of the UBS share. The grant date fair value of notional UBS shares without dividend entitlements also includes a deduction for the present value of future expected dividends to be paid between the grant date and distribution.
UBS options and SARs awards
Since 2010, the fair values of options and SARs have been determined using a standard closed-formula option valuation model. The expected
term of each instrument is calculated based on historical employee exercise behavior patterns, taking into account the share price, strike price, vesting period and the contractual life of the instrument. The term structure of volatility is derived from the implied volatilities of traded UBS options in combination with the observed long-term historical share price volatility. Expected future dividends are derived from traded UBS options or from the historical dividend pattern. No options or SARs have been granted since 2009.
Incentive Performance Plan (IPP) and Performance Equity Plan (PEP)
No IPP and no PEP awards were granted in 2013. For performance share awards granted in 2012, UBS obtained an independent third-party valuation based on the market conditions at the date of grant. The valuation methodology applied was a Monte Carlo simulation. The approach to determining input parameters and valuing the post-vesting transfer restriction is in line with that used for options. The fair value of PEP units granted in 2012 was determined using the following assumptions.
| | | | |
| | | 31.12.12 | |
| | | PEP CHF awards | |
| Expected total shareholder return volatility (%) | | | 43.00 | |
| | | | | |
| Expected economic profit volatility (%) | | | 16.00 | |
| | | | | |
| Risk-free interest rate (%) | | | 0.09 | |
| | | | | |
| Expected dividend (CHF) | | | 0.13 | |
| | | | | |
| Share price (CHF) | | | 12.76 | |
| | | | | |
480
Note 30 Interests in subsidiaries and other entities
a) Interests in subsidiaries
Effective 31 December 2013, UBS revised its approach to determining its significant subsidiaries to include only those entities that, either individually or in aggregate, contribute significantly to the Group’s financial position or results of operations, based on a number of criteria, including the subsidiaries’ equity and their contribution to the Group’s total assets and profit/(loss) before tax, in accordance with the requirements set by IFRS 12, Swiss regulations and the regulations of the US SEC.
Individually significant subsidiaries
The table below lists the Group’s individually significant subsidiaries as of 31 December 2013. Unless otherwise stated, the subsidiaries listed below have share capital consisting solely of ordinary shares, which are held fully by the Group, and the proportion of ownership interest held is equal to the voting rights held by the Group. The country where the respective registered office is located is also generally the principal place of business.
Individually significant subsidiaries as of 31 December 2013
| | | | | | | | | | | | | | | | | | | | |
| Company | | Registered office | | | Primary business division | | | | | | Share capital
in million | | | Equity interest
accumulated in % | |
| UBS Americas Inc. | | | Wilmington, Delaware, USA | | | | Investment Bank | | | | USD | | | | 0.0 | | | | 100.0 | |
| | | | | | | | | | | | | | | | | | | | | |
| UBS Bank USA | | | Salt Lake City, Utah, USA | | | | Wealth Management Americas | | | | USD | | | | 0.0 | | | | 100.0 | |
| | | | | | | | | | | | | | | | | | | | | |
| UBS Financial Services Inc. | | | Wilmington, Delaware, USA | | | | Wealth Management Americas | | | | USD | | | | 0.0 | | | | 100.0 | |
| | | | | | | | | | | | | | | | | | | | | |
| UBS Limited | | | London, United Kingdom | | | | Investment Bank | | | | GBP | | | | 226.6 | | | | 100.0 | |
| | | | | | | | | | | | | | | | | | | | | |
| UBS Securities LLC | | | Wilmington, Delaware, USA | | | | Investment Bank | | | | USD | | | | 1,283.1 | 1 | | | 100.0 | |
| | | | | | | | | | | | | | | | | | | | | |
1 Mainly comprised of non-voting preferred shares held by UBS Americas Inc.
UBS Limited and UBS Americas Inc. are fully held by UBS AG. UBS Bank USA and UBS Financial Services Inc. are fully held by UBS Americas Inc. 30% of UBS Securities LLC is held by UBS AG and 70% by UBS Americas Inc. (after consideration of preferred shares).
481
Financial information
Notes to the consolidated financial statements
Note 30 Interests in subsidiaries and other entities (continued)
Other subsidiaries
The table below lists other subsidiaries that are not individually significant but contribute to the Group’s total assets and aggregated profit before tax thresholds and are thereby selected in accordance with the requirements set by the US SEC.
Other subsidiaries as of 31 December 2013
| | | | | | | | | | | | | | | | |
| Company | | Registered office | | Primary business division | | | | | Share capital
in million | | | Equity interest
accumulated in % | |
| Topcard Service AG | | Glattbrugg, Switzerland | | Retail & Corporate | | | CHF | | | | 0.2 | | | | 100.0 | |
| | | | | | | | | | | | | | | | | |
| UBS (Italia) SpA | | Milan, Italy | | UBS Wealth Management | | | EUR | | | | 80.0 | | | | 100.0 | |
| | | | | | | | | | | | | | | | | |
| UBS (Luxembourg) S.A. | | Luxembourg, Luxembourg | | UBS Wealth Management | | | CHF | | | | 150.0 | | | | 100.0 | |
| | | | | | | | | | | | | | | | | |
| UBS Alternative and Quantitative Investments LLC | | Wilmington, Delaware, USA | | Global Asset Management | | | USD | | | | 0.1 | | | | 100.0 | |
| | | | | | | | | | | | | | | | | |
| UBS Beteiligungs-GmbH & Co. KG | | Frankfurt, Germany | | UBS Wealth Management | | | EUR | | | | 568.8 | | | | 100.0 | |
| | | | | | | | | | | | | | | | | |
| UBS Card Center AG | | Glattbrugg, Switzerland | | Retail & Corporate | | | CHF | | | | 0.1 | | | | 100.0 | |
| | | | | | | | | | | | | | | | | |
| UBS Credit Corp. | | Wilmington, Delaware, USA | | Wealth Management Americas | | | USD | | | | 0.0 | | | | 100.0 | |
| | | | | | | | | | | | | | | | | |
| UBS Deutschland AG | | Frankfurt, Germany | | UBS Wealth Management | | | EUR | | | | 176.0 | | | | 100.0 | |
| | | | | | | | | | | | | | | | | |
| UBS Fund Advisor, L.L.C. | | Wilmington, Delaware, USA | | Wealth Management Americas | | | USD | | | | 0.0 | | | | 100.0 | |
| | | | | | | | | | | | | | | | | |
| UBS Fund Management (Switzerland) AG | | Basel, Switzerland | | Global Asset Management | | | CHF | | | | 1.0 | | | | 100.0 | |
| | | | | | | | | | | | | | | | | |
| UBS Fund Services (Cayman) Ltd | | George Town, Cayman Islands | | Global Asset Management | | | USD | | | | 5.6 | | | | 100.0 | |
| | | | | | | | | | | | | | | | | |
| UBS Global Asset Management (Americas) Inc. | | Wilmington, Delaware, USA | | Global Asset Management | | | USD | | | | 0.0 | | | | 100.0 | |
| | | | | | | | | | | | | | | | | |
| UBS Global Asset Management (Japan) Ltd | | Tokyo, Japan | | Global Asset Management | | | JPY | | | | 2,200.0 | | | | 100.0 | |
| | | | | | | | | | | | | | | | | |
| UBS Global Asset Management (Singapore) Ltd | | Singapore, Singapore | | Global Asset Management | | | SGD | | | | 4.0 | | | | 100.0 | |
| | | | | | | | | | | | | | | | | |
| UBS Loan Finance LLC | | Wilmington, Delaware, USA | | Investment Bank | | | USD | | | | 0.1 | | | | 100.0 | |
| | | | | | | | | | | | | | | | | |
| UBS O’Connor LLC | | Dover, Delaware, USA | | Global Asset Management | | | USD | | | | 1.0 | | | | 100.0 | |
| | | | | | | | | | | | | | | | | |
| UBS Real Estate Securities Inc. | | Wilmington, Delaware, USA | | Investment Bank | | | USD | | | | 0.0 | | | | 100.0 | |
| | | | | | | | | | | | | | | | | |
| UBS Realty Investors LLC | | Boston, Massachusetts, USA | | Global Asset Management | | | USD | | | | 9.0 | | | | 100.0 | |
| | | | | | | | | | | | | | | | | |
| UBS Securities (Thailand) Ltd | | Bangkok, Thailand | | Investment Bank | | | THB | | | | 500.0 | | | | 100.0 | |
| | | | | | | | | | | | | | | | | |
| UBS Securities Australia Ltd | | Sydney, Australia | | Investment Bank | | | AUD | | | | 0.3 | 1 | | | 100.0 | |
| | | | | | | | | | | | | | | | | |
| UBS Securities Canada Inc. | | Toronto, Canada | | Investment Bank | | | CAD | | | | 10.0 | | | | 100.0 | |
| | | | | | | | | | | | | | | | | |
| UBS Securities España Sociedad de Valores SA | | Madrid, Spain | | Investment Bank | | | EUR | | | | 15.0 | | | | 100.0 | |
| | | | | | | | | | | | | | | | | |
| UBS Securities India Private Limited | | Mumbai, India | | Investment Bank | | | INR | | | | 140.0 | | | | 100.0 | |
| | | | | | | | | | | | | | | | | |
| UBS Securities Japan Co., Ltd. | | Tokyo, Japan | | Investment Bank | | | JPY | | | | 74,450.0 | | | | 100.0 | |
| | | | | | | | | | | | | | | | | |
| UBS Securities Pte. Ltd. | | Singapore, Singapore | | Investment Bank | | | SGD | | | | 420.4 | | | | 100.0 | |
| | | | | | | | | | | | | | | | | |
| UBS Services LLC | | Wilmington, Delaware, USA | | Investment Bank | | | USD | | | | 0.0 | | | | 100.0 | |
| | | | | | | | | | | | | | | | | |
| UBS Trust Company of Puerto Rico | | Hato Rey, Puerto Rico | | Wealth Management Americas | | | USD | | | | 0.1 | | | | 100.0 | |
| | | | | | | | | | | | | | | | | |
1 Includes a nominal amount relating to redeemable preference shares.
482
Note 30 Interests in subsidiaries and other entities (continued)
Changes in consolidation scope
On 1 January 2013, UBS adopted IFRS 10, resulting in a change in the consolidation status of certain entities. Refer to “Note 1b Changes in accounting policies, comparability and other adjustments” for an overview of the effects on total comprehensive income and on the balance sheet. There were no material changes in the scope of consolidation in 2013.
Non-controlling interests
As of 31 December 2013 and 31 December 2012, non-controlling interests were not material to the Group. In addition, as of these dates there were no significant restrictions on UBS’s ability to access or use the assets and settle the liabilities of the Group resulting from protective rights of non-controlling interests.
| | è | | Refer to the “Statement of changes in equity” for more information |
b) Interests in associates and joint ventures
As of 31 December 2013 and 31 December 2012, no associate or joint venture was individually material to the Group. In addition, there were no significant restrictions on the ability of associates or joint ventures to transfer
funds to UBS AG or its subsidiaries in the form of cash dividends or to repay loans or advances made. There were no quoted market prices for any associates or joint ventures of the Group.
Investments in associates and joint ventures
| | | | | | | | |
| CHF million | | 31.12.13 | | | 31.12.12 | |
| Carrying amount at the beginning of the year | | | 858 | | | | 795 | |
| | | | | | | | | |
| Additions | | | 0 | | | | 4 | |
| | | | | | | | | |
| Disposals | | | (2 | ) | | | (3 | ) |
| | | | | | | | | |
| Share of comprehensive income | | | 59 | | | | 113 | |
| | | | | | | | | |
of which: share of net profit1 | | | 49 | | | | 88 | |
| | | | | | | | | |
of which: share of other comprehensive income2 | | | 10 | | | | 25 | |
| | | | | | | | | |
| Dividends received | | | (69 | ) | | | (37 | ) |
| | | | | | | | | |
| Foreign currency translation | | | (4 | ) | | | (12 | ) |
| | | | | | | | | |
| Carrying amount at the end of the year | | | 842 | | | | 858 | |
| | | | | | | | | |
of which: associates | | | 815 | | | | 828 | |
| | | | | | | | | |
of which: UBS Securities Co. Limited3 | | | 369 | | | | 385 | |
| | | | | | | | | |
of which: SIX Group AG4 | | | 367 | | | | 366 | |
| | | | | | | | | |
of which: other associates | | | 78 | | | | 77 | |
| | | | | | | | | |
of which: joint ventures | | | 27 | | | | 30 | |
| | | | | | | | | |
1 For 2013, consists of CHF 37 million from associates and CHF 12 million from joint ventures. For 2012, consists of CHF 76 million from associates and CHF 12 million from joint ventures. 2 For 2013, consists of CHF 9 million from associates and CHF 1 million from joint ventures. For 2012, consists of CHF 24 million from associates and CHF 1 million from joint ventures. 3 UBS’s equity interest amounts to 20.0%. 4 UBS’s equity interest amounts to 17.3% and UBS is represented on the Board of Directors.
Financial information
Notes to the consolidated financial statements
Note 30 Interests in subsidiaries and other entities (continued)
c) Interests in unconsolidated structured entities
During 2013, the Group sponsored the creation of various structured entities (SE) and interacted with a number of non-sponsored SE, including securitization vehicles, client vehicles as well as certain investment funds, which UBS did not consolidate as of 31 December 2013 because it did not control these entities.
| | è | | Refer to Note 1a) 3) for more information on the nature, purpose, activities and financing structure of these entities |
The table below presents the Group’s interests in and maximum exposure to loss from unconsolidated SE as of 31 December 2013. In addition, the total assets held by the SE in which UBS had an interest as of 31 December 2013 are provided, except for investment funds sponsored by third parties, for which the carrying value of UBS’s interest as of 31 December 2013 has been disclosed.
Interests in unconsolidated structured entities
| | | | | | | | | | | | | | | | | | | | |
| | | 31.12.13 | |
| CHF million, except where indicated | | Securitization
vehicles | | | Client
vehicles | | | Investment
funds | | | Total | | | Maximum
exposure to loss1 | |
| Trading portfolio assets | | | 3,298 | | | | 544 | | | | 6,509 | | | | 10,350 | | | | 10,350 | |
| | | | | | | | | | | | | | | | | | | | | |
| Positive replacement values | | | 26 | | | | 16 | | | | 0 | | | | 42 | | | | 42 | |
| | | | | | | | | | | | | | | | | | | | | |
| Financial assets designated at fair value | | | | | | | 124 | 2 | | | 91 | | | | 215 | | | | 2,449 | |
| | | | | | | | | | | | | | | | | | | | | |
| Loans | | | 1,878 | | | | | | | | 366 | | | | 2,244 | | | | 2,244 | |
| | | | | | | | | | | | | | | | | | | | | |
| Financial investments available-for-sale | | | | | | | 4,020 | | | | 77 | | | | 4,096 | | | | 4,096 | |
| | | | | | | | | | | | | | | | | | | | | |
| Other assets | | | | | | | 53 | 2 | | | 6 | | | | 58 | | | | 933 | |
| | | | | | | | | | | | | | | | | | | | | |
| Total assets | | | 5,202 | 3 | | | 4,756 | | | | 7,048 | | | | 17,005 | | | | | |
| | | | | | | | | | | | | | | | | | | | | |
| Negative replacement values | | | 1,263 | 4 | | | | | | | 0 | | | | 1,263 | | | | 16 | |
| | | | | | | | | | | | | | | | | | | | | |
| Total liabilities | | | 1,263 | 5 | | | | | | | 0 | | | | 1,263 | | | | | |
| | | | | | | | | | | | | | | | | | | | | |
| Assets held by the unconsolidated structured entities in which UBS had an interest (CHF billion) | | | 390 | 6 | | | 96 | 7 | | | 266 | 8 | | | | | | | | |
| | | | | | | | | | | | | | | | | | | | | |
1 For purposes of this disclosure, maximum exposure to loss amounts do not consider the risk-reducing effects of collateral or other credit enhancements. 2 Represents the carrying value of loan commitments, both designated at fair value and held at amortized cost. The maximum exposure to loss for these instruments is equal to the notional amount. 3 Of the CHF 5.2 billion, CHF 5.0 billion or 96% was held by Corporate Center – Non-core and Legacy Portfolio. 4 Comprised of credit default swap (CDS) liabilities and other swap liabilities. The maximum exposure to loss for CDS is equal to the sum of the negative carrying value and the notional amount. For other swap liabilities, no maximum exposure to loss is reported. 5 Entirely held by Corporate Center – Non-core and Legacy Portfolio. 6 Represents principal amount outstanding. 7 Represents the market value of total assets. 8 Represents the net asset value of the investment funds sponsored by UBS (CHF 260 billion) and the carrying value of UBS’s interest in the investment funds not sponsored by UBS (CHF 7 billion).
The Group retains or purchases interests in unconsolidated SE in the form of direct investments, financing, guarantees, letters of credit, derivatives and through management contracts.
For retained interests, the Group’s maximum exposure to loss is generally equal to the carrying value of the Group’s interest in the SE, with the exception of guarantees, letters of credit and credit derivatives for which the contract’s notional amount, adjusted for losses already incurred, represents the maximum loss that the Group is exposed to. In addition, the current fair value of derivative swap instruments with a positive replacement value only, such as total return swaps, are presented as UBS’s maximum exposure to loss. Risk exposure for these swap instruments could change over time with market movements.
The maximum exposure to loss disclosed in the table above does not reflect the Group’s risk management activities, including effects from financial instruments that the Group may utilize to economically hedge the risks inherent in the unconsolidated SE or the risk reducing effects of collateral or other credit enhancements.
In 2013, the Group did not provide support, financial or otherwise, to an unconsolidated structured entity when the Group was not contractually obligated to do so, nor has the Group an intention to do so in the future.
In 2013, income earned from interests in unconsolidated SE primarily resulted from mark-to-market movements recognized in net trading income as well as fee and commission income received from UBS sponsored funds.
Interests in securitization vehicles
As of 31 December 2013, the Group retained interests in securitization vehicles related to financing, underwriting, secondary market and derivative trading activities. In some cases the Group may be required to absorb losses from an unconsolidated SE before other parties because the Group’s interest is subordinated to others in the ownership structure. An overview of the Group’s interests in unconsolidated securitization vehicles and the relative ranking and external credit rating of those interests as of 31 December 2013 is presented in the table on the next page.
484
Note 30 Interests in subsidiaries and other entities (continued)
Interests in unconsolidated securitization vehicles1
| | | | | | | | | | | | | | | | | | | | |
| | 31.12.13 | |
| CHF million, except where indicated | | Residential
mortgage-
backed
securities | | | Commercial
mortgage-
backed
securities | | | Other
asset-
backed
securities2 | | | Re-securitization3 | | | Total | |
| Sponsored by UBS | | | | | | | | | | | | | | | | | | | | |
| | | | | | | | | | | | | | | | | | | | | |
| Interests in senior tranches | | | 24 | | | | 103 | | | | 96 | | | | 627 | | | | 849 | |
| | | | | | | | | | | | | | | | | | | | | |
of which: rated investment grade | | | 23 | | | | 103 | | | | 90 | | | | 624 | | | | 839 | |
| | | | | | | | | | | | | | | | | | | | | |
of which: rated sub-investment grade | | | | | | | | | | | | | | | 1 | | | | 1 | |
| | | | | | | | | | | | | | | | | | | | | |
of which: defaulted | | | | | | | | | | | 6 | | | | 1 | | | | 7 | |
| | | | | | | | | | | | | | | | | | | | | |
of which: not rated | | | 1 | | | | 0 | | | | | | | | | | | | 1 | |
| | | | | | | | | | | | | | | | | | | | | |
| Interests in mezzanine tranches | | | 4 | | | | 27 | | | | 8 | | | | 33 | | | | 73 | |
| | | | | | | | | | | | | | | | | | | | | |
of which: rated investment grade | | | | | | | 20 | | | | 8 | | | | 33 | | | | 61 | |
| | | | | | | | | | | | | | | | | | | | | |
of which: rated sub-investment grade | | | 4 | | | | 6 | | | | | | | | 0 | | | | 10 | |
| | | | | | | | | | | | | | | | | | | | | |
of which: defaulted | | | 0 | | | | 1 | | | | | | | | 0 | | | | 2 | |
| | | | | | | | | | | | | | | | | | | | | |
| Interests in junior tranches | | | 0 | | | | | | | | | | | | | | | | 0 | |
| | | | | | | | | | | | | | | | | | | | | |
| Total | | | 28 | | | | 130 | | | | 104 | | | | 660 | | | | 922 | |
| | | | | | | | | | | | | | | | | | | | | |
of which: Trading portfolio assets | | | 28 | | | | 130 | | | | 57 | | | | 21 | | | | 237 | |
| | | | | | | | | | | | | | | | | | | | | |
of which: Loans | | | | | | | | | | | 47 | | | | 639 | | | | 686 | |
| | | | | | | | | | | | | | | | | | | | | |
| Total assets held by the vehicles in which UBS had an interest (CHF billion) | | | 1 | | | | 26 | | | | 2 | | | | 4 | | | | 32 | |
| | | | | | | | | | | | | | | | | | | | | |
| | | | | |
| Not sponsored by UBS | | | | | | | | | | | | | | | | | | | | |
| | | | | | | | | | | | | | | | | | | | | |
| Interests in senior tranches | | | 391 | | | | 745 | | | | 1,263 | | | | 449 | | | | 2,848 | |
| | | | | | | | | | | | | | | | | | | | | |
of which: rated investment grade | | | 332 | | | | 575 | | | | 1,112 | | | | 412 | | | | 2,431 | |
| | | | | | | | | | | | | | | | | | | | | |
of which: rated sub-investment grade | | | 57 | | | | 170 | | | | 148 | | | | 37 | | | | 412 | |
| | | | | | | | | | | | | | | | | | | | | |
of which: defaulted | | | 2 | | | | | | | | 3 | | | | | | | | 5 | |
| | | | | | | | | | | | | | | | | | | | | |
of which: not rated | | | 0 | | | | | | | | 0 | | | | | | | | 0 | |
| | | | | | | | | | | | | | | | | | | | | |
| Interests in mezzanine tranches | | | 218 | | | | 350 | | | | 369 | | | | 237 | | | | 1,173 | |
| | | | | | | | | | | | | | | | | | | | | |
of which: rated investment grade | | | 135 | | | | 212 | | | | 332 | | | | 211 | | | | 890 | |
| | | | | | | | | | | | | | | | | | | | | |
of which: rated sub-investment grade | | | 79 | | | | 133 | | | | 23 | | | | 25 | | | | 260 | |
| | | | | | | | | | | | | | | | | | | | | |
of which: defaulted | | | 5 | | | | 5 | | | | | | | | 0 | | | | 10 | |
| | | | | | | | | | | | | | | | | | | | | |
of which: not rated | | | 0 | | | | 0 | | | | 14 | | | | | | | | 14 | |
| | | | | | | | | | | | | | | | | | | | | |
| Interests in junior tranches | | | 88 | | | | 8 | | | | 134 | | | | 2 | | | | 234 | |
| | | | | | | | | | | | | | | | | | | | | |
of which: rated investment grade | | | 57 | | | | 4 | | | | 133 | | | | | | | | 194 | |
| | | | | | | | | | | | | | | | | | | | | |
of which: rated sub-investment grade | | | 21 | | | | 4 | | | | 1 | | | | | | | | 26 | |
| | | | | | | | | | | | | | | | | | | | | |
of which: defaulted | | | 0 | | | | 0 | | | | 0 | | | | | | | | 1 | |
| | | | | | | | | | | | | | | | | | | | | |
of which: not rated | | | 11 | | | | | | | | | | | | 2 | | | | 13 | |
| | | | | | | | | | | | | | | | | | | | | |
| Total | | | 698 | | | | 1,103 | | | | 1,766 | | | | 688 | | | | 4,254 | |
| | | | | | | | | | | | | | | | | | | | | |
of which: Trading portfolio assets | | | 698 | | | | 1,103 | | | | 763 | | | | 498 | | | | 3,062 | |
| | | | | | | | | | | | | | | | | | | | | |
of which: Loans | | | 0 | | | | 0 | | | | 1,002 | | | | 190 | | | | 1,192 | |
| | | | | | | | | | | | | | | | | | | | | |
| Total assets held by the vehicles in which UBS had an interest (CHF billion) | | | 103 | | | | 149 | | | | 70 | | | | 27 | | | | 349 | |
| | | | | | | | | | | | | | | | | | | | | |
1 This table excludes derivative transactions with securitization vehicles. 2 Includes credit card, car and student loan structures. 3 Includes collateralized debt obligations.
Financial information
Notes to the consolidated financial statements
Note 30 Interests in subsidiaries and other entities (continued)
The numbers outlined in the table on the previous page differ from the securitization positions presented in the “Supplemental disclosures required under Basel III Pillar 3 regulations” section of this report, primarily due to: (i) exclusion from the table above of synthetic securitizations transacted with entities that are not SE and transactions in which the Group did not have an interest because it did not absorb any risk, (ii) a different measurement basis in certain cases (e.g., IFRS carrying value within the table above compared with net exposure amount at default for Basel III Pillar 3 disclosures) and (iii) different classification of vehicles viewed as sponsored by the Group versus sponsored by third parties.
| | è | | Refer to Note 1a) items 3) and 12) for more information on when the Group is viewed as the sponsor of an SE and for the Group’s accounting policies regarding securitization vehicles established by UBS |
| | è | | Refer to the “Supplemental disclosures required under Basel III Pillar 3 regulations” section of this report for more information on securitization exposures |
Interests in client vehicles
As of 31 December 2013, the Group retained interests in client vehicles sponsored by the Group and third parties that relate to financing and derivative activities and to hedge structured product offerings. Included within these investments are securities guaranteed by US government agencies.
Interests in investment funds
The Group holds interests in a number of investment funds, primarily resulting from seed investments or to hedge structured product
offerings. In addition to the interests disclosed in the table on the previous page, the Group manages the assets of various pooled investment funds and receives fees which are based, in whole or part, on the net asset value of the fund and/or the performance of the fund. The specific fee structure is determined based on various market factors and considers the nature of the fund, the jurisdiction of incorporation as well as fee schedules negotiated with clients. These fee contracts represent an interest in the fund as they align the Group’s exposure to investors, providing a variable return which is based on the performance of the entity. Depending on the structure of the fund, these fees may be collected directly from the fund assets and/or from the investors. Any amounts due are collected on a regular basis and are backed by the assets of the fund. The Group did not have any material exposure to loss from these interests as of 31 December 2013.
Sponsored unconsolidated structured entities in which UBS did not have an interest
For several sponsored SE, no interest was held by the Group as of 31 December 2013. However, during the reporting period the Group transferred assets, provided services and held instruments which did not qualify as an interest with these sponsored SE, and accordingly earned income or incurred expenses from these entities. The table below presents the income earned and expenses incurred directly from these entities during 2013 as well as asset information. The table does not include income earned and expenses incurred from risk management activities, including income and expenses from financial instruments that the Group may utilize to economically hedge instruments transacted with the unconsolidated SE.
Sponsored unconsolidated structured entities in which UBS did not have an interest at year end1
| | | | | | | | | | | | | | | | |
| | | As of or for the year ended | |
| | | 31.12.13 | |
| CHF million, except where indicated | | Securitization
vehicles | | | Client
vehicles | | | Investment
funds | | | Total | |
| Net interest income | | | 1 | | | | (48 | ) | | | (19 | ) | | | (66 | ) |
| | | | | | | | | | | | | | | | | |
| Net fee and commission income | | | | | | | | | | | 64 | | | | 64 | |
| | | | | | | | | | | | | | | | | |
| Net trading income | | | (271 | ) | | | (368 | ) | | | 113 | | | | (525 | ) |
| | | | | | | | | | | | | | | | | |
| Total income | | | (270 | ) | | | (416 | ) | | | 159 | | | | (527 | ) |
| | | | | | | | | | | | | | | | | |
| Asset information (CHF billion) | | | 2 | 2 | | | 0 | 3 | | | 13 | 4 | | | | |
| | | | | | | | | | | | | | | | | |
1 This table excludes net profit attributable to preferred noteholders of CHF 204 million. 2 Represents total assets transferred to the respective securitization vehicles. Of the total amount transferred, CHF 1 billion was transferred by UBS and CHF 1 billion was transferred by third parties. 3 Represents total assets transferred to the respective client vehicles. The entire amount relates to assets transferred by UBS. 4 Represents the total net asset value of the respective investment funds.
During 2013, the Group primarily earned fees and incurred net trading losses from sponsored SE in which UBS did not hold an interest. The majority of the fee income arose from investment funds that are sponsored and administrated by the Group and managed by third parties. As the Group does not provide any active management services,
UBS was not exposed to risk from the performance of these entities and therefore was deemed not to have an interest in them.
In certain structures, the fees receivable for administrative purposes may be collected directly from the investors and have therefore not been included in the table above.
486
Note 30 Interests in subsidiaries and other entities (continued)
In addition, the Group incurred net trading losses from mark-to-market movements arising primarily from derivatives, such as interest rate swaps and credit derivatives in which the Group purchases protection, and financial liabilities designated at fair value, which do not qualify as interests because the Group does not absorb variability from the performance of the entity. The net losses reported do not reflect economic hedges or other mitigating effects from the Group’s risk management activities.
During 2013, UBS and third parties transferred assets totaling CHF 3 billion into sponsored securitization and client vehicles created in 2013. For sponsored investment funds, transfers arose during the period as investors invested and redeemed positions, thereby changing the overall size of the funds alongside market movements, resulting in a total closing net asset value of CHF 13 billion.
Note 31 Business combinations
Business combinations in 2013
In 2013, UBS completed the acquisition of all voting and ownership interests in Link Investimentos, a Brazilian financial services firm that was integrated into the Investment Bank. The acquisition cost was CHF 90 million of which CHF 55 million related to goodwill, CHF 21 million to intangible assets, primarily related to customer relationships, and CHF
14 million to other net assets. The acquisition costs included a cash payment of CHF 35 million and deferred consideration of CHF 55 million.
Business combinations in 2012
In 2012, no significant business combinations were completed.
Note 32 Changes in organization
Restructuring charges arise from programs that materially change either the scope of business undertaken by the Group or the manner in which such business is conducted. Restructuring charges are non-recurring, temporary costs that are necessary to effect such programs and include items such as severance and other personnel related charges, duplicate headcount costs, impairment and accelerated depreciation of assets, contract termination costs, consulting fees, and related infrastructure and system costs. These costs are presented in the income statement according to the underlying nature of the expense. As the costs associated with restructuring programs are temporary in nature, and in order to provide a more thorough understanding of business performance, such costs are separately presented on the following page.
Prior to 2013, restructuring charges were limited to (i) items recognized in the restructuring provision, consisting of severance and other personnel related items and onerous lease contracts and (ii) associated asset impairments. The expanded definition of restructuring charges better reflects the total economic costs arising from UBS’s restructuring programs and thus provides better information regarding the effects of its investment in significant transformational activities expected to reduce operating costs upon completion. This change solely affects the presentation of charges and does not affect the timing of when such charges are recognized in our operating results. The effect of this expanded definition on all prior periods is not material and thus no amounts have been restated.
Financial information
Notes to the consolidated financial statements
Note 32 Changes in organization (continued)
Net restructuring charges by business division and Corporate Center
| | | | | | | | | | | | |
| | For the year ended | |
| CHF million | | 31.12.13 | | | 31.12.12 | | | 31.12.11 | |
| Wealth Management | | | 178 | | | | 26 | | | | 82 | |
| | | | | | | | | | | | | |
| Wealth Management Americas | | | 59 | | | | (1 | ) | | | 10 | |
| | | | | | | | | | | | | |
| Retail & Corporate | | | 54 | | | | 3 | | | | 32 | |
| | | | | | | | | | | | | |
| Global Asset Management | | | 43 | | | | 20 | | | | 26 | |
| | | | | | | | | | | | | |
| Investment Bank | | | 210 | | | | 273 | | | | 202 | |
| | | | | | | | | | | | | |
| Corporate Center | | | 229 | | | | 51 | | | | 29 | |
| | | | | | | | | | | | | |
of which: Core Functions | | | (6 | ) | | | (8 | ) | | | 15 | |
| | | | | | | | | | | | | |
of which: Non-core and Legacy Portfolio | | | 235 | | | | 58 | | | | 14 | |
| | | | | | | | | | | | | |
| Total net restructuring charges | | | 772 | | | | 371 | | | | 380 | |
| | | | | | | | | | | | | |
of which: personnel expenses | | | 156 | | | | 358 | | | | 261 | |
| | | | | | | | | | | | | |
of which: general and administrative expenses | | | 548 | | | | 0 | | | | 93 | |
| | | | | | | | | | | | | |
of which: depreciation and impairment of property and equipment | | | 68 | | | | 14 | | | | 26 | |
| | | | | | | | | | | | | |
Net restructuring charges by personnel expense category
| | | | | | | | | | | | |
| | For the year ended | |
| CHF million | | 31.12.13 | | | 31.12.12 | | | 31.12.11 | |
| Salaries | | | 65 | | | | 64 | | | | 31 | |
| | | | | | | | | | | | | |
| Variable compensation – performance awards | | | (15 | ) | | | 115 | | | | 54 | |
| | | | | | | | | | | | | |
| Variable compensation – other | | | 88 | | | | 247 | | | | 122 | |
| | | | | | | | | | | | | |
| Contractors | | | 3 | | | | 0 | | | | 0 | |
| | | | | | | | | | | | | |
| Social security | | | 5 | | | | (10 | ) | | | 20 | |
| | | | | | | | | | | | | |
| Pension and other post-employment benefit plans | | | 8 | | | | (56 | ) | | | 30 | |
| | | | | | | | | | | | | |
| Wealth Management Americas: Financial advisor compensation | | | 0 | | | | 0 | | | | (1 | ) |
| | | | | | | | | | | | | |
| Other personnel expenses | | | 3 | | | | (1 | ) | | | 6 | |
| | | | | | | | | | | | | |
| Total net restructuring charges: personnel expenses | | | 156 | | | | 358 | | | | 261 | |
| | | | | | | | | | | | | |
Net restructuring charges by general and administrative expense category
| | | | | | | | | | | | |
| | For the year ended | |
| CHF million | | 31.12.13 | | | 31.12.12 | | | 31.12.11 | |
| Occupancy | | | 35 | | | | (1 | ) | | | (1 | ) |
| | | | | | | | | | | | | |
| Rent and maintenance of IT and other equipment | | | 8 | | | | 4 | | | | 1 | |
| | | | | | | | | | | | | |
| Administration | | | 2 | | | | 0 | | | | 0 | |
| | | | | | | | | | | | | |
| Travel and entertainment | | | 4 | | | | 0 | | | | 0 | |
| | | | | | | | | | | | | |
| Professional fees | | | 76 | | | | 1 | | | | 1 | |
| | | | | | | | | | | | | |
| Outsourcing of IT and other services | | | 59 | | | | 0 | | | | 0 | |
| | | | | | | | | | | | | |
| Other1 | | | 364 | | | | (5 | ) | | | 92 | |
| | | | | | | | | | | | | |
| Total net restructuring charges: general and administrative expenses | | | 548 | | | | 0 | | | | 93 | |
| | | | | | | | | | | | | |
1 Mainly comprised of onerous real estate lease contracts.
488
Note 33 Operating lease commitments
As of 31 December 2013, UBS was obligated under a number of non-cancellable operating leases for premises and equipment used primarily for banking purposes. The significant premises leases usually include renewal options and escalation clauses in line with general office rental market conditions, as well as rent adjustments based on price indices. However, the lease agreements do not contain
contingent rent payment clauses and purchase options, nor do they impose any restrictions on UBS’s ability to pay dividends, engage in debt financing transactions or enter into further lease agreements.
The minimum commitments for non-cancellable leases of premises and equipment are presented as follows.
| | | | |
| CHF million | | 31.12.13 | |
| Expenses for operating leases to be recognized in: | | | | |
| | | | | |
| 2014 | | | 737 | |
| | | | | |
| 2015 | | | 674 | |
| | | | | |
| 2016 | | | 583 | |
| | | | | |
| 2017 | | | 552 | |
| | | | | |
| 2018 | | | 469 | |
| | | | | |
| 2019 and thereafter | | | 2,316 | |
| | | | | |
| Subtotal commitments for minimum payments under operating leases | | | 5,330 | |
| | | | | |
| Less: Sublease rental income commitments | | | 383 | |
| | | | | |
| Net commitments for minimum payments under operating leases | | | 4,947 | |
| | | | | |
| | | | | | | | | | | | |
| CHF million | | 31.12.13 | | | 31.12.12 | | | 31.12.11 | |
| Gross operating lease expense recognized in the income statement | | | 792 | | | | 860 | | | | 837 | |
| | | | | | | | | | | | | |
| Sublease rental income | | | 74 | | | | 87 | | | | 84 | |
| | | | | | | | | | | | | |
| Net operating lease expense recognized in the income statement | | | 718 | | | | 773 | | | | 754 | |
| | | | | | | | | | | | | |
489
Financial information
Notes to the consolidated financial statements
Note 34 Related parties
UBS defines related parties as associates (entities which are significantly influenced by UBS), post-employment benefit plans for the benefit of UBS employees, key management personnel, close family members of key management personnel and entities which are, directly
or indirectly, controlled or jointly controlled by key management personnel or their close family members. Key management personnel is defined as members of the Board of Directors (BoD) and Group Executive Board (GEB).
a) Remuneration of key management personnel
The non-independent members of the BoD have top management employment contracts and receive pension benefits upon retirement. Total remuneration of the non-independent members of the BoD and GEB members, including those who stepped down during 2013, is provided in the table below.
Remuneration of key management personnel
| | | | | | | | | | | | |
| CHF million | | 31.12.13 | | | 31.12.12 | | | 31.12.11 | |
| Base salaries and other cash payments | | | 19 | | | | 20 | | | | 21 | |
| | | | | | | | | | | | | |
| Incentive awards – cash1 | | | 10 | | | | 0 | | | | 22 | |
| | | | | | | | | | | | | |
| Annual incentive award under DCCP | | | 19 | | | | 21 | | | | 0 | |
| | | | | | | | | | | | | |
| Employer’s contributions to retirement benefit plans | | | 2 | | | | 1 | | | | 1 | |
| | | | | | | | | | | | | |
| Benefits in kind, fringe benefits (at market value) | | | 2 | | | | 1 | | | | 1 | |
| | | | | | | | | | | | | |
| Equity-based compensation2 | | | 38 | | | | 34 | | | | 33 | |
| | | | | | | | | | | | | |
| Total | | | 88 | | | | 76 | | | | 79 | |
| | | | | | | | | | | | | |
1 Includes immediate and deferred cash. 2 Expenses for shares granted is measured at grant date and allocated over the vesting period, generally for 5 years. In 2013 and 2012, equity-based compensation was entirely comprised of EOP awards. In 2011, equity-based compensation included PEP and SEEOP awards, as well as blocked shares due to applicable UK FSA regulations.
The independent members of the BoD do not have employment or service contracts with UBS, and thus are not entitled to benefits upon termination of their service on the BoD. Payments to these individuals for their services as external board members amounted to CHF 7.6 million in 2013, CHF 7.6 million in 2012 and CHF 7.0 million in 2011.
b) Equity holdings of key management personnel
| | | | | | | | |
| | | 31.12.13 | | | 31.12.12 | |
| Number of stock options from equity participation plans held by non-independent members of the BoD and the GEB members1 | | | 2,865,603 | | | | 3,137,426 | |
| | | | | | | | | |
| Number of shares held by members of the BoD, GEB and parties closely linked to them2 | | | 3,951,869 | | | | 4,557,522 | |
| | | | | | | | | |
1 Refer to “Note 29 Equity participation and other compensation plans” for more information. 2 Excludes shares granted under variable compensation plans with forfeiture provisions.
Of the share totals above, 5,597 shares were held by close family members of key management personnel on 31 December 2013 and 31 December 2012, respectively. No shares were held by entities that are directly or indirectly controlled or jointly controlled by key management personnel or their close family members on 31 December
2013 and 31 December 2012. Refer to “Note 29 Equity participation and other compensation plans” for more information. As of 31 December 2013, no member of the BoD or GEB was the beneficial owner of more than 1% of UBS AG’s shares.
490
Note 34 Related parties (continued)
c) Loans, advances and mortgages to key management personnel
Non-independent members of the BoD and GEB members have been granted loans, fixed advances and mortgages on the same terms and conditions that are available to other employees, which are based on terms and conditions granted to third parties but are adjusted for
differing credit risk. Independent BoD members are granted loans and mortgages under general market conditions.
Movements in the loan, advances and mortgage balances are as follows.
Loans, advances and mortgages to key management personnel1
| | | | | | | | |
| CHF million | | 2013 | | | 2012 | |
| Balance at the beginning of the year | | | 19 | | | | 19 | |
| | | | | | | | | |
| Additions | | | 2 | | | | 5 | |
| | | | | | | | | |
| Reductions | | | (1 | ) | | | (5 | ) |
| | | | | | | | | |
| Balance at the end of the year | | | 20 | | | | 19 | |
| | | | | | | | | |
1 All loans are secured loans, except for CHF 311,308 in 2012.
Financial information
Notes to the consolidated financial statements
Note 34 Related parties (continued)
d) Other related party transactions with entities controlled by key management personnel
During 2013 and 2012, UBS entered into transactions at arm’s length with entities which are directly or indirectly controlled or jointly controlled by UBS’s key management personnel or their close family members. In 2013, these entities included H21 Macro Fund Ltd (Cayman
Islands), DKSH Holding Ltd. (Switzerland) and Immo Heudorf AG (Switzerland). In 2012, these entities included H21 Macro Fund Ltd (Cayman Islands) and Immo Heudorf AG (Switzerland).
Other related party transactions
| | | | | | | | |
| CHF million | | 2013 | | | 2012 | |
| Balance at the beginning of the year | | | 11 | | | | 11 | |
| | | | | | | | | |
| Additions | | | 0 | | | | 1 | |
| | | | | | | | | |
| Reductions | | | 1 | | | | 0 | |
| | | | | | | | | |
| Balance at the end of the year | | | 10 | 1 | | | 11 | 1 |
| | | | | | | | | |
1 Comprised of loans.
Other transactions with these related parties include:
| | | | | | | | |
| CHF million | | 2013 | | | 2012 | |
| Goods sold and services provided to UBS | | | 0 | | | | 0 | |
| | | | | | | | | |
| Fees received for services provided by UBS | | | 2 | | | | 0 | |
| | | | | | | | | |
e) Transactions with associates and joint ventures
All transactions with associates and joint ventures are conducted at arm’s length.
Loans and outstanding receivables to associates and joint ventures
| | | | | | | | |
| CHF million | | 2013 | | | 2012 | |
| Balance at the beginning of the year | | | 450 | | | | 231 | |
| | | | | | | | | |
| Additions | | | 2 | | | | 251 | |
| | | | | | | | | |
| Reductions | | | (163 | ) | | | (32 | ) |
| | | | | | | | | |
| Foreign currency translation | | | 0 | | | | 1 | |
| | | | | | | | | |
| Balance at the end of the year | | | 288 | | | | 450 | |
| | | | | | | | | |
of which: unsecured loans | | | 271 | | | | 276 | |
| | | | | | | | | |
of which: allowances for credit losses | | | 1 | | | | 1 | |
| | | | | | | | | |
Other transactions with associates and joint ventures transacted at arm’s length.
| | | | | | | | |
| | As of or for the year ended | |
| CHF million | | 31.12.13 | | | 31.12.12 | |
| Payments to associates and joint ventures for goods and services received | | | 163 | | | | 131 | |
| | | | | | | | | |
| Fees received for services provided to associates and joint ventures | | | 2 | | | | 0 | |
| | | | | | | | | |
| Commitments and contingent liabilities to associates and joint ventures | | | 2 | | | | 8 | |
| | | | | | | | | |
Refer to “Note 30 Interests in subsidiaries and other entities” for an overview of investments in associates and joint ventures.
f) Additional information
UBS may also engage in trading and risk management activities (e.g., swaps, options and forwards) with related parties. These transactions may give rise to credit risk either for UBS or for a related party towards UBS. As part of its normal course
of business, UBS is also a market-maker in equity and debt instruments and at times may hold positions in instruments of related parties. These transactions are generally entered into at arm’s length terms.
492
Note 35 Invested assets and net new money
Invested assets
Invested assets include all client assets managed by or deposited with UBS for investment purposes. Invested assets include managed fund assets, managed institutional assets, discretionary and advisory wealth management portfolios, fiduciary deposits, time deposits, savings accounts and wealth management securities or brokerage accounts. All assets held for purely transactional purposes and custody-only assets, including corporate client assets held for cash management and transactional purposes, are excluded from invested assets as the Group only administers the assets and does not offer advice on how the assets should be invested. Also excluded are non-bankable assets (e.g., art collections) and deposits from third-party banks for funding or trading purposes.
Discretionary assets are defined as client assets that UBS decides how to invest. Other invested assets are those where the client ultimately decides how the assets are invested. When a single product is created in one business division and sold in another, it is counted in both the business division that manages the investment and the one that distributes it. This results in double counting within UBS total invested assets, as both business divisions are providing a service independently to their respective clients, and both add value and generate revenue.
Net new money
Net new money in a reporting period is the amount of invested assets that are entrusted to UBS by new and existing clients, less those withdrawn by existing clients and clients who terminated their relationship with UBS.
Net new money is calculated using the direct method, under which inflows and outflows to/from invested assets are determined at the client level based on transactions. Interest and dividend income from invested assets are not counted as net new money inflows. Market and currency movements as well as fees, commissions and interest on loans charged are excluded from net new money, as are the effects resulting from any acquisition or divestment of a UBS subsidiary or business. Reclassifications between invested assets and custody-only assets as a result of a change in the service level delivered are generally treated as net new money flows. However, where such change in service level directly results from a new, externally imposed regulation, the one-time net effect of the implementation is reported as an asset reclassification without net new money impact.
The Investment Bank does not track invested assets and net new money. However, when a client is transferred from the Investment Bank to another business division, this produces net new money even though client assets were already with UBS. Net new money resulting from such transfers between business divisions was zero in 2013 and 2012.
| | | | | | | | |
| | For the year ended | |
| CHF billion | | 31.12.13 | | | 31.12.12 | |
| Fund assets managed by UBS | | | 244 | | | | 270 | |
| | | | | | | | | |
| Discretionary assets | | | 714 | | | | 635 | |
| | | | | | | | | |
| Other invested assets | | | 1,432 | | | | 1,325 | |
| | | | | | | | | |
| Total invested assets (double counts included) | | | 2,390 | | | | 2,230 | |
| | | | | | | | | |
of which: double count | | | 156 | | | | 172 | |
| | | | | | | | | |
of which: acquisitions (divestments) | | | (6.6 | ) | | | (13.8 | ) |
| | | | | | | | | |
| Net new money (double counts included) | | | 32.3 | | | | 32.9 | |
| | | | | | | | | |
493
Financial information
Notes to the consolidated financial statements
Note 36 Currency translation rates
The following table shows the rates of the main currencies used to translate the financial information of our foreign operations into Swiss francs.
| | | | | | | | | | | | | | | | | | | | |
| | | Spot rate | | | Average rate1 | |
| | As of | | | Year ended | |
| | | 31.12.13 | | | 31.12.12 | | | 31.12.13 | | | 31.12.12 | | | 31.12.11 | |
| 1 USD | | | 0.89 | | | | 0.92 | | | | 0.92 | | | | 0.93 | | | | 0.88 | |
| | | | | | | | | | | | | | | | | | | | | |
| 1 EUR | | | 1.23 | | | | 1.21 | | | | 1.23 | | | | 1.20 | | | | 1.23 | |
| | | | | | | | | | | | | | | | | | | | | |
| 1 GBP | | | 1.48 | | | | 1.49 | | | | 1.45 | | | | 1.49 | | | | 1.45 | |
| | | | | | | | | | | | | | | | | | | | | |
| 100 JPY | | | 0.85 | | | | 1.05 | | | | 0.95 | | | | 1.12 | | | | 1.11 | |
| | | | | | | | | | | | | | | | | | | | | |
1 Monthly income statement items of foreign operations with a functional currency other than Swiss franc are translated with month-end rates into Swiss francs. Disclosed average rates for a year represent an average of twelve month-end rates, weighted according to the income and expense volumes of all foreign operations of the Group with the same functional currency for each month. Weighted average rates for individual business divisions may deviate from the weighted average rates for the Group.
Note 37 Events after the reporting period
There have been no material events after the reporting period which would require disclosure in or adjustment to the 31 December 2013 Financial Statements.
494
Note 38 Swiss GAAP requirements
The consolidated Financial Statements of UBS are prepared in accordance with International Financial Reporting Standards (IFRS). The Swiss Financial Market Supervisory Authority (FINMA) requires banks which present their financial statements under IFRS to provide a narrative explanation of the main differences between IFRS and Swiss GAAP (FINMA Circular 2008/2 and the Banking Ordinance). Included in this note are the significant differences in regard to recognition and measurement between IFRS and the provisions of the Banking Ordinance and the guidelines of the FINMA governing financial statement reporting pursuant to Article 23 through Article 27 of the Banking Ordinance. The differences outlined in points two through nine also apply to the Parent Bank statutory accounts. Refer to Parent Bank financial statements “Note 2 Accounting policies, c) Accounting policies to be adopted in the future” for an outlook on the expected Swiss GAAP revision.
1. Consolidation
Under IFRS, all entities which are controlled by the Group are consolidated.
Under Swiss GAAP, only entities that are active in the field of banking and finance and real estate entities are subject to consolidation. Entities which are held temporarily are generally recorded as financial investments.
2. Financial investments available-for-sale
Under IFRS, financial investments available-for-sale are carried at fair value. Changes in fair value are recorded directly in equity until an investment is sold, collected or otherwise disposed of, or until an investment is determined to be impaired. At the time an available-for-sale investment is determined to be impaired, the cumulative unrealized loss previously recognized in equity is included in net profit or loss for the period. On disposal of a financial investment available-for-sale, the cumulative unrecognized gain or loss previously recognized in equity is recognized in the income statement.
Under Swiss GAAP, classification and measurement of financial investments available-for-sale depends on the nature of the investment. Equity instruments with no permanent holding intent and debt instruments are classified asFinancial investments and measured at lower of (amortized) cost or market. Market value adjustments up to the original cost amount and realized gains or losses upon disposal of the investment are recorded in the income statementas Other income from ordinary activities. Equity instruments with a permanent holding intent are classified as participations in Investments in subsidiaries and other participations and measured at cost less impairment. Impairment losses are recorded in the income statementas Impairment of investments in subsidiaries and other participations. Reversal of impairments up to the original cost amount as well as realized gains or losses upon disposal of the investment are recorded asExtraordinary income / Extraordinary expenses in the income statement.
3. Cash flow hedges
The Group designates derivative instruments in cash flow hedge accounting relationships. Under IFRS, when hedge accounting is applied, the fair value gain or loss on the effective portion of the derivative designated as a cash flow hedge is recognized in equity. When the hedged cash flows materialize, the accumulated unrecognized gain or loss is reclassified to income.
Under Swiss GAAP, the effective portion of the fair value change of the derivative instrument used to hedge cash flow exposures is deferred on the balance sheet asOther assets orOther liabilities. The deferred amounts are released to income when the hedged cash flows materialize.
4. Fair value option
Under IFRS, the Group applies the fair value option to certain financial assets and financial liabilities not held for trading. Instruments for which the fair value option is applied are accounted for at fair value with changes in fair value reflected inNet trading income. The fair value option is applied primarily to structured debt instruments, certain non-structured debt instruments, structured reverse repurchase and repurchase agreements and securities borrowing agreements, certain structured and non-structured loans as well as loan commitments
Under Swiss GAAP, the fair value option can only be applied to structured products issued that consist of a debt host contract and an embedded derivative(s) that requires bifurcation. Changes in fair value attributable to changes in own credit are not recognized in the income statement.
5. Goodwill and intangible assets
Under IFRS, goodwill acquired in a business combination is not amortized but tested annually for impairment. Intangible assets acquired in a business combination with an indefinite useful life are also not amortized but tested annually for impairment.
Under Swiss GAAP, goodwill and intangible assets with indefinite useful lives are amortized over a period not exceeding five years, unless a longer useful life, which may not exceed twenty years, can be justified.
495
Financial information
Notes to the consolidated financial statements
Note 38 Swiss GAAP requirements (continued)
6. Pension funds
Swiss GAAP permits the use of IFRS or Swiss accounting standards for pension funds, with the election made on a plan by plan basis.
UBS applies IFRS (IAS 19) for its non-Swiss defined benefit plans and Swiss accounting standards (Swiss GAAP FER 16, “FER 16”) for the Swiss pension plan in the Parent Bank. The requirements of FER 16 are better aligned with the specific nature of Swiss pension plans, which are hybrid in that they combine elements of defined contribution and defined benefit plans, but are treated as defined benefit plans under IFRS. The financial statements of the Swiss pension plan are prepared in accordance with Swiss GAAP FER 26 (“FER 26”). Key differences between FER 16/26 and IAS 19 relate to the treatment of future salary increases, which are not considered under FER 16/26, and the determination of the discount rate.
For defined benefit plans, IFRS requires the full defined benefit obligation net of the plan assets to be recorded on the balance sheet, with changes resulting from remeasurements recognized directly in equity. For plans for which IFRS is elected, Swiss GAAP requires that changes due to remeasurements are recognized in the income statement.
Swiss accounting standards require that employer contributions to the pension fund are recognized as personnel expenses in the income statement. Further, FER 16 requires an assessment as to whether, based on the financial statements of the pension fund prepared in accordance with Swiss accounting standards (FER 26), an economic benefit or obligation for the employer arises from the pension fund and is recognized in the balance sheet when conditions are met. Conditions for recording a pension asset or liability would be met if, for example, an employer contribution reserve is available or the employer is required to contribute to the reduction of a pension deficit (on an FER 26 basis).
7. Netting of replacement values
Under IFRS, replacement values are reported on a gross basis unless certain restrictive requirements are met. Under Swiss GAAP, replacement values and the related cash collateral are reported on a net basis, provided the master netting and the related collateral agreements are legally enforceable.
8. Restructuring provisions
Under Swiss GAAP, a provision for restructuring costs is recognized when a detailed formal plan is approved by the governing body responsible for the overall direction, supervision and control of the entity. For IFRS, in addition to a detailed formal plan for the restructuring, a provision for restructuring costs is recognized only when the entity also has raised a valid expectation in those affected that it will carry out the restructuring by starting to implement the plan or announcing its main features to those affected by it. Therefore, the recognition of a provision for restructuring may occur earlier under Swiss GAAP than under IFRS.
Furthermore under Swiss GAAP, the restructuring provision includes all costs that are directly related to the restructuring measures and that are not associated with the ongoing ordinary activities of the entity, whereas under IFRS, costs associated with the ongoing activities of the entity must not be included in the provision. Swiss GAAP results in a wider scope of charges being eligible for inclusion in the restructuring provision than IFRS.
9. Discontinued operations
Under certain conditions, IFRS requires that non-current assets or disposal groups be classified as held for sale. Disposal groups that meet the criteria of discontinued operations are presented in the income statement in a single line as Net income from discontinued operations.
Under Swiss GAAP, the concept of discontinued operations does not exist, therefore no such reclassification takes place.
10. Extraordinary income and expense
Certain items of non-recurring and non-operating income and expense are classified as extraordinary items under Swiss GAAP. This distinction is not available under IFRS.
496
Note 39 Supplemental guarantor information required under SEC regulations
Guarantee of PaineWebber securities
Following the acquisition of Paine Webber Group Inc. (PaineWebber), UBS AG entered into a full and unconditional guarantee of the senior notes, the subordinated notes and the trust preferred securities (“Debt Securities”) of PaineWebber. Prior to the acquisition, PaineWebber was an SEC registrant. Upon acquisition, PaineWebber was merged into UBS Americas Inc., a wholly-owned subsidiary of UBS AG.
Under the guarantee, if UBS Americas Inc. fails to make any timely payment under the Debt Securities agreements, the holders of the Debt
Securities or the Debt Securities trustee may demand payment from UBS AG without first proceeding against UBS Americas Inc. UBS AG’s obligations under the subordinated note guarantee are subordinated to the prior payment in full of the deposit liabilities of UBS AG and all other liabilities of UBS AG.
The information presented in this note is prepared in accordance with IFRS and should be read in conjunction with the consolidated financial statements of UBS of which this information is a part.
Supplemental guarantor consolidated income statement
| | | | | | | | | | | | | | | | | | | | |
CHF million For the year ended 31 December 2013 | | UBS AG
(Parent Bank)1 | | | UBS
Americas Inc. | | | Other
subsidiaries | | | Consolidating
entries | | | UBS Group | |
| Operating income | | | | | | | | | | | | | | | | | | | | |
| | | | | | | | | | | | | | | | | | | | | |
| Interest income | | | 11,308 | | | | 1,984 | | | | 1,204 | | | | (1,359 | ) | | | 13,137 | |
| | | | | | | | | | | | | | | | | | | | | |
| Interest expense | | | (7,086 | ) | | | (695 | ) | | | (930 | ) | | | 1,359 | | | | (7,351 | ) |
| | | | | | | | | | | | | | | | | | | | | |
| Net interest income | | | 4,221 | | | | 1,290 | | | | 275 | | | | 0 | | | | 5,786 | |
| | | | | | | | | | | | | | | | | | | | | |
| Credit loss (expense)/recovery | | | (14 | ) | | | (33 | ) | | | (3 | ) | | | 0 | | | | (50 | ) |
| | | | | | | | | | | | | | | | | | | | | |
| Net interest income after credit loss expense | | | 4,207 | | | | 1,257 | | | | 271 | | | | 0 | | | | 5,736 | |
| | | | | | | | | | | | | | | | | | | | | |
| Net fee and commission income | | | 6,426 | | | | 6,781 | | | | 3,079 | | | | 0 | | | | 16,287 | |
| | | | | | | | | | | | | | | | | | | | | |
| Net trading income | | | 4,592 | | | | 379 | | | | 159 | | | | 0 | | | | 5,130 | |
| | | | | | | | | | | | | | | | | | | | | |
| Income from subsidiaries | | | 283 | | | | 0 | | | | 0 | | | | (283 | ) | | | 0 | |
| | | | | | | | | | | | | | | | | | | | | |
| Other income | | | 1,073 | | | | 416 | | | | (909 | ) | | | 0 | | | | 580 | |
| | | | | | | | | | | | | | | | | | | | | |
| Total operating income | | | 16,582 | | | | 8,833 | | | | 2,600 | | | | (283 | ) | | | 27,732 | |
| | | | | | | | | | | | | | | | | | | | | |
| Operating expenses | | | | | | | | | | | | | | | | | | | | |
| | | | | | | | | | | | | | | | | | | | | |
| Personnel expenses | | | 8,099 | | | | 5,584 | | | | 1,499 | | | | 0 | | | | 15,182 | |
| | | | | | | | | | | | | | | | | | | | | |
| General and administrative expenses | | | 3,959 | | | | 3,364 | | | | 1,058 | | | | 0 | | | | 8,380 | |
| | | | | | | | | | | | | | | | | | | | | |
| Depreciation and impairment of property and equipment | | | 575 | | | | 133 | | | | 107 | | | | 0 | | | | 816 | |
| | | | | | | | | | | | | | | | | | | | | |
| Amortization and impairment of intangible assets | | | 6 | | | | 60 | | | | 17 | | | | 0 | | | | 83 | |
| | | | | | | | | | | | | | | | | | | | | |
| Total operating expenses | | | 12,639 | | | | 9,141 | | | | 2,681 | | | | 0 | | | | 24,461 | |
| | | | | | | | | | | | | | | | | | | | | |
| Operating profit/(loss) before tax | | | 3,943 | | | | (307 | ) | | | (81 | ) | | | (283 | ) | | | 3,272 | |
| | | | | | | | | | | | | | | | | | | | | |
| Tax expense/(benefit) | | | 567 | | | | (937 | ) | | | 261 | | | | 0 | | | | (110 | ) |
| | | | | | | | | | | | | | | | | | | | | |
| Net profit/(loss) | | | 3,376 | | | | 630 | | | | (342 | ) | | | (283 | ) | | | 3,381 | |
| | | | | | | | | | | | | | | | | | | | | |
| Net profit/(loss) attributable to preferred noteholders | | | 204 | | | | 0 | | | | 0 | | | | 0 | | | | 204 | |
| | | | | | | | | | | | | | | | | | | | | |
| Net profit/(loss) attributable to non-controlling interests | | | 0 | | | | 0 | | | | 5 | | | | 0 | | | | 5 | |
| | | | | | | | | | | | | | | | | | | | | |
| Net profit/(loss) attributable to UBS shareholders | | | 3,172 | | | | 630 | | | | (347 | ) | | | (283 | ) | | | 3,172 | |
| | | | | | | | | | | | | | | | | | | | | |
1 UBS AG (Parent Bank) prepares its audited financial statements in accordance with Swiss GAAP. UBS AG (Parent Bank) net profit for 2013 in accordance with Swiss GAAP was CHF 2,753 million. Refer to the UBS AG (Parent Bank) financial statements for more information. Amounts presented in this column serve as a basis for preparing Group Financial Statements under IFRS.
Financial information
Notes to the consolidated financial statements
Note 39 Supplemental guarantor information required under SEC regulations (continued)
Supplemental guarantor consolidated balance sheet
| | | | | | | | | | | | | | | | | | | | |
CHF million As of 31 December 2013 | | UBS AG
(Parent Bank)1 | | | UBS
Americas Inc. | | | Other
subsidiaries | | | Consolidating
entries | | | UBS Group | |
| Assets | | | | | | | | | | | | | | | | | | | | |
| | | | | | | | | | | | | | | | | | | | | |
| Cash and balances with central banks | | | 69,808 | | | | 8,893 | | | | 2,178 | | | | 0 | | | | 80,879 | |
| | | | | | | | | | | | | | | | | | | | | |
| Due from banks | | | 27,677 | | | | 7,009 | | | | 53,826 | | | | (71,342 | ) | | | 17,170 | |
| | | | | | | | | | | | | | | | | | | | | |
| Cash collateral on securities borrowed | | | 28,304 | | | | 33,385 | | | | 2,097 | | | | (36,290 | ) | | | 27,496 | |
| | | | | | | | | | | | | | | | | | | | | |
| Reverse repurchase agreements | | | 77,647 | | | | 28,757 | | | | 47,122 | | | | (61,963 | ) | | | 91,563 | |
| | | | | | | | | | | | | | | | | | | | | |
| Trading portfolio assets | | | 92,757 | | | | 7,848 | | | | 27,194 | | | | (4,951 | ) | | | 122,848 | |
| | | | | | | | | | | | | | | | | | | | | |
of which: assets pledged as collateral which may be sold or repledged by counterparties | | | 44,602 | | | | 1,862 | | | | 1,853 | | | | (5,869 | ) | | | 42,449 | |
| | | | | | | | | | | | | | | | | | | | | |
| Positive replacement values | | | 242,582 | | | | 8,219 | | | | 59,282 | | | | (64,248 | ) | | | 245,835 | |
| | | | | | | | | | | | | | | | | | | | | |
| Cash collateral receivables on derivative instruments | | | 23,834 | | | | 5,920 | | | | 19,977 | | | | (21,724 | ) | | | 28,007 | |
| | | | | | | | | | | | | | | | | | | | | |
| Financial assets designated at fair value | | | 6,519 | | | | 1,880 | | | | 3,257 | | | | (4,292 | ) | | | 7,364 | |
| | | | | | | | | | | | | | | | | | | | | |
| Loans | | | 274,616 | | | | 36,807 | | | | 15,231 | | | | (39,695 | ) | | | 286,959 | |
| | | | | | | | | | | | | | | | | | | | | |
| Financial investments available-for-sale | | | 50,014 | | | | 4,169 | | | | 5,343 | | | | 0 | | | | 59,525 | |
| | | | | | | | | | | | | | | | | | | | | |
| Investments in subsidiaries and associates | | | 67,175 | 2 | | | 1 | | | | 1 | | | | (66,335 | )2 | | | 842 | |
| | | | | | | | | | | | | | | | | | | | | |
| Property and equipment | | | 5,149 | | | | 603 | | | | 254 | | | | 0 | | | | 6,006 | |
| | | | | | | | | | | | | | | | | | | | | |
| Goodwill and intangible assets | | | 326 | | | | 4,906 | | | | 1,061 | | | | 0 | | | | 6,293 | |
| | | | | | | | | | | | | | | | | | | | | |
| Deferred tax assets | | | 4,946 | | | | 3,658 | | | | 241 | | | | 0 | | | | 8,845 | |
| | | | | | | | | | | | | | | | | | | | | |
| Other assets | | | 13,506 | | | | 7,572 | | | | 2,047 | | | | (2,896 | ) | | | 20,228 | |
| | | | | | | | | | | | | | | | | | | | | |
| Total assets | | | 984,858 | | | | 159,628 | | | | 239,112 | | | | (373,737 | ) | | | 1,009,860 | |
| | | | | | | | | | | | | | | | | | | | | |
| Liabilities | | | | | | | | | | | | | | | | | | | | |
| | | | | | | | | | | | | | | | | | | | | |
| Due to banks | | | 39,988 | | | | 39,449 | | | | 4,768 | | | | (71,342 | ) | | | 12,862 | |
| | | | | | | | | | | | | | | | | | | | | |
| Cash collateral on securities lent | | | 23,823 | | | | 19,261 | | | | 2,696 | | | | (36,290 | ) | | | 9,491 | |
| | | | | | | | | | | | | | | | | | | | | |
| Repurchase agreements | | | 10,039 | | | | 19,333 | | | | 46,402 | | | | (61,963 | ) | | | 13,811 | |
| | | | | | | | | | | | | | | | | | | | | |
| Trading portfolio liabilities | | | 22,142 | | | | 3,603 | | | | 5,480 | | | | (4,617 | ) | | | 26,609 | |
| | | | | | | | | | | | | | | | | | | | | |
| Negative replacement values | | | 235,870 | | | | 8,318 | | | | 60,013 | | | | (64,248 | ) | | | 239,953 | |
| | | | | | | | | | | | | | | | | | | | | |
| Cash collateral payables on derivative instruments | | | 36,846 | | | | 8,141 | | | | 25,874 | | | | (21,724 | ) | | | 49,138 | |
| | | | | | | | | | | | | | | | | | | | | |
| Financial liabilities designated at fair value | | | 67,912 | | | | 440 | | | | 6,084 | | | | (4,536 | ) | | | 69,901 | |
| | | | | | | | | | | | | | | | | | | | | |
| Due to customers | | | 346,246 | | | | 41,029 | | | | 43,245 | | | | (39,695 | ) | | | 390,825 | |
| | | | | | | | | | | | | | | | | | | | | |
| Debt issued | | | 78,470 | | | | 341 | | | | 2,866 | | | | (91 | ) | | | 81,586 | |
| | | | | | | | | | | | | | | | | | | | | |
| Provisions | | | 1,625 | | | | 938 | | | | 408 | | | | 0 | | | | 2,971 | |
| | | | | | | | | | | | | | | | | | | | | |
| Other liabilities | | | 28,781 | | | | 16,244 | | | | 20,648 | | | | (2,896 | ) | | | 62,777 | |
| | | | | | | | | | | | | | | | | | | | | |
| Total liabilities | | | 891,742 | | | | 157,098 | | | | 218,486 | | | | (307,402 | ) | | | 959,925 | |
| | | | | | | | | | | | | | | | | | | | | |
| Equity attributable to UBS shareholders | | | 91,222 | | | | 2,530 | | | | 20,585 | | | | (66,335 | ) | | | 48,002 | |
| | | | | | | | | | | | | | | | | | | | | |
| Equity attributable to preferred noteholders | | | 1,893 | | | | 0 | | | | 0 | | | | 0 | | | | 1,893 | |
| | | | | | | | | | | | | | | | | | | | | |
| Equity attributable to non-controlling interests | | | 0 | | | | 0 | | | | 41 | | | | 0 | | | | 41 | |
| | | | | | | | | | | | | | | | | | | | | |
| Total equity | | | 93,116 | 2 | | | 2,530 | | | | 20,626 | | | | (66,335 | )2 | | | 49,936 | |
| | | | | | | | | | | | | | | | | | | | | |
| Total liabilities and equity | | | 984,858 | | | | 159,628 | | | | 239,112 | | | | (373,737 | ) | | | 1,009,860 | |
| | | | | | | | | | | | | | | | | | | | | |
1 UBS AG (Parent Bank) prepares its audited financial statements in accordance with Swiss GAAP. UBS AG (Parent Bank) total assets and total equity as of 31 December 2013 in accordance with Swiss GAAP were CHF 715,917 million and CHF 35,437 million, respectively. Refer to the UBS AG (Parent Bank) financial statements for more information. Amounts presented in this column serve as a basis for preparing Group Financial Statements under IFRS. 2 Investments in subsidiaries which are presented gross in this table are eliminated against equity upon consolidation.
498
Note 39 Supplemental guarantor information required under SEC regulations (continued)
Supplemental guarantor consolidated statement of cash flows
| | | | | | | | | | | | | | | | |
CHF million For the year ended 31 December 2013 | | UBS AG
(Parent Bank)1 | | | UBS
Americas Inc. | | | Other
subsidiaries | | | UBS Group | |
| Net cash flow from/(used in) operating activities | | | 55,469 | | | | (8,159 | ) | | | 7,015 | | | | 54,325 | |
| | | | | | | | | | | | | | | | | |
| Cash flow from/(used in) investing activities | | | | | | | | | | | | | | | | |
| | | | | | | | | | | | | | | | | |
| Purchase of subsidiaries, associates and intangible assets | | | (49 | ) | | | 0 | | | | 0 | | | | (49 | ) |
| | | | | | | | | | | | | | | | | |
| Disposal of subsidiaries, associates and intangible assets2 | | | 136 | | | | 0 | | | | 0 | | | | 136 | |
| | | | | | | | | | | | | | | | | |
| Purchase of property and equipment | | | (1,032 | ) | | | (160 | ) | | | (44 | ) | | | (1,236 | ) |
| | | | | | | | | | | | | | | | | |
| Disposal of property and equipment | | | 545 | | | | 5 | | | | 91 | | | | 639 | |
| | | | | | | | | | | | | | | | | |
| Net (investment in)/divestment of financial investments available-for-sale | | | 751 | | | | 6,076 | | | | (861) | | | | 5,966 | |
| | | | | | | | | | | | | | | | | |
| Net cash flow from/(used in) investing activities | | | 351 | | | | 5,922 | | | | (815 | ) | | | 5,457 | |
| | | | | | | | | | | | | | | | | |
| Cash flow from/(used in) financing activities | | | | | | | | | | | | | | | | |
| | | | | | | | | | | | | | | | | |
| Net short-term debt issued/(repaid) | | | (1,400 | ) | | | 0 | | | | (2,890 | ) | | | (4,290 | ) |
| | | | | | | | | | | | | | | | | |
| Net movements in treasury shares and own equity derivative activity | | | (341 | ) | | | 0 | | | | 0 | | | | (341 | ) |
| | | | | | | | | | | | | | | | | |
| Increase in share capital | | | 1 | | | | 0 | | | | 0 | | | | 1 | |
| | | | | | | | | | | | | | | | | |
| Dividends paid on UBS shares | | | (564 | ) | | | 0 | | | | 0 | | | | (564 | ) |
| | | | | | | | | | | | | | | | | |
| Issuance of long-term debt, including financial liabilities designated at fair value | | | 27,442 | | | | 59 | | | | 513 | | | | 28,014 | |
| | | | | | | | | | | | | | | | | |
| Repayment of long-term debt, including financial liabilities designated at fair value | | | (65,112 | ) | | | (486 | ) | | | (3,356 | ) | | | (68,954 | ) |
| | | | | | | | | | | | | | | | | |
| Dividends paid and repayments of preferred notes | | | (1,415 | ) | | | 0 | | | | 0 | | | | (1,415 | ) |
| | | | | | | | | | | | | | | | | |
| Net changes of non-controlling interests | | | 0 | | | | 0 | | | | (6 | ) | | | (6 | ) |
| | | | | | | | | | | | | | | | | |
| Net activity in investments in subsidiaries | | | 12 | | | | 23 | | | | (35 | ) | | | 0 | |
| | | | | | | | | | | | | | | | | |
| Net cash flow from/(used in) financing activities | | | (41,377 | ) | | | (405 | ) | | | (5,774 | ) | | | (47,555 | ) |
| | | | | | | | | | | | | | | | | |
| Effects of exchange rate differences on cash and cash equivalents | | | (2,330 | ) | | | (207 | ) | | | (165 | ) | | | (2,702 | ) |
| | | | | | | | | | | | | | | | | |
| Net increase/(decrease) in cash and cash equivalents | | | 12,112 | | | | (2,850 | ) | | | 261 | | | | 9,524 | |
| | | | | | | | | | | | | | | | | |
| Cash and cash equivalents at the beginning of the year | | | 71,858 | | | | 14,275 | | | | 12,975 | | | | 99,108 | |
| | | | | | | | | | | | | | | | | |
| Cash and cash equivalents at the end of the year | | | 83,970 | | | | 11,425 | | | | 13,237 | | | | 108,632 | |
| | | | | | | | | | | | | | | | | |
| Cash and cash equivalents comprise: | | | | | | | | | | | | | | | | |
| | | | | | | | | | | | | | | | | |
| Cash and balances with central banks | | | 69,808 | | | | 8,893 | | | | 2,178 | | | | 80,879 | |
| | | | | | | | | | | | | | | | | |
| Money market paper3 | | | 4,224 | | | | 28 | | | | 35 | | | | 4,288 | |
| | | | | | | | | | | | | | | | | |
| Due from banks4 | | | 9,938 | | | | 2,503 | | | | 11,024 | | | | 23,465 | |
| | | | | | | | | | | | | | | | | |
| Total | | | 83,970 | | | | 11,425 | | | | 13,237 | | | | 108,632 | 5 |
| | | | | | | | | | | | | | | | | |
1 UBS AG (Parent Bank) prepares its audited financial statements in accordance with Swiss GAAP. Amounts presented in this column serve as a basis for preparing Group Financial Statements under IFRS. 2 Includes dividends received from associates. 3 Money market paper is included in the balance sheet under Trading portfolio assets and Financial investments available-for-sale. 4 Includes positions recognized on the balance sheet under Due from banks and Cash collateral receivables on derivative instruments. 5 CHF 8,333 million of cash and cash equivalents were restricted.
Financial information
Notes to the consolidated financial statements
Note 39 Supplemental guarantor information required under SEC regulations (continued)
Supplemental guarantor consolidated income statement
| | | | | | | | | | | | | | | | | | | | |
CHF million For the year ended 31 December 2012 | | UBS AG
(Parent Bank)1 | | | UBS
Americas Inc. | | | Other
subsidiaries | | | Consolidating
entries | | | UBS
Group | |
| Operating income | | | | | | | | | | | | | | | | | | | | |
| | | | | | | | | | | | | | | | | | | | | |
| Interest income | | | 13,376 | | | | 2,774 | | | | 1,882 | | | | (2,065 | ) | | | 15,968 | |
| | | | | | | | | | | | | | | | | | | | | |
| Interest expense | | | (9,395 | ) | | | (1,153 | ) | | | (1,507 | ) | | | 2,065 | | | | (9,990 | ) |
| | | | | | | | | | | | | | | | | | | | | |
| Net interest income | | | 3,982 | | | | 1,622 | | | | 375 | | | | 0 | | | | 5,978 | |
| | | | | | | | | | | | | | | | | | | | | |
| Credit loss (expense)/recovery | | | (7 | ) | | | (112 | ) | | | 1 | | | | 0 | | | | (118 | ) |
| | | | | | | | | | | | | | | | | | | | | |
| Net interest income after credit loss expense | | | 3,974 | | | | 1,510 | | | | 375 | | | | 0 | | | | 5,860 | |
| | | | | | | | | | | | | | | | | | | | | |
| Net fee and commission income | | | 5,933 | | | | 6,333 | | | | 3,130 | | | | 0 | | | | 15,396 | |
| | | | | | | | | | | | | | | | | | | | | |
| Net trading income | | | 3,119 | | | | 250 | | | | 157 | | | | 0 | | | | 3,526 | |
| | | | | | | | | | | | | | | | | | | | | |
| Income from subsidiaries | | | (3,981 | ) | | | 0 | | | | 0 | | | | 3,981 | | | | 0 | |
| | | | | | | | | | | | | | | | | | | | | |
| Other income | | | 1,545 | | | | 783 | | | | (1,687 | ) | | | 0 | | | | 641 | |
| | | | | | | | | | | | | | | | | | | | | |
| Total operating income | | | 10,590 | | | | 8,876 | | | | 1,976 | | | | 3,981 | | | | 25,423 | |
| | | | | | | | | | | | | | | | | | | | | |
| Operating expenses | | | | | | | | | | | | | | | | | | | | |
| | | | | | | | | | | | | | | | | | | | | |
| Personnel expenses | | | 7,682 | | | | 5,369 | | | | 1,686 | | | | 0 | | | | 14,737 | |
| | | | | | | | | | | | | | | | | | | | | |
| General and administrative expenses | | | 4,643 | | | | 2,618 | | | | 1,393 | | | | 0 | | | | 8,653 | |
| | | | | | | | | | | | | | | | | | | | | |
| Depreciation and impairment of property and equipment | | | 501 | | | | 104 | | | | 84 | | | | 0 | | | | 689 | |
| | | | | | | | | | | | | | | | | | | | | |
| Impairment of goodwill | | | 14 | | | | 2,860 | | | | 156 | | | | 0 | | | | 3,030 | |
| | | | | | | | | | | | | | | | | | | | | |
| Amortization and impairment of intangible assets | | | 3 | | | | 84 | | | | 20 | | | | 0 | | | | 106 | |
| | | | | | | | | | | | | | | | | | | | | |
| Total operating expenses | | | 12,843 | | | | 11,034 | | | | 3,339 | | | | 0 | | | | 27,216 | |
| | | | | | | | | | | | | | | | | | | | | |
| Operating profit/(loss) before tax | | | (2,254 | ) | | | (2,158 | ) | | | (1,363 | ) | | | 3,981 | | | | (1,794 | ) |
| | | | | | | | | | | | | | | | | | | | | |
| Tax expense/(benefit) | | | 6 | | | | 165 | | | | 290 | | | | 0 | | | | 461 | |
| | | | | | | | | | | | | | | | | | | | | |
| Net profit/(loss) | | | (2,260 | ) | | | (2,323 | ) | | | (1,653 | ) | | | 3,981 | | | | (2,255 | ) |
| | | | | | | | | | | | | | | | | | | | | |
| Net profit/(loss) attributable to preferred noteholders | | | 220 | | | | 0 | | | | 0 | | | | 0 | | | | 220 | |
| | | | | | | | | | | | | | | | | | | | | |
| Net profit/(loss) attributable to non-controlling interests | | | 0 | | | | 0 | | | | 5 | | | | 0 | | | | 5 | |
| | | | | | | | | | | | | | | | | | | | | |
| Net profit/(loss) attributable to UBS shareholders | | | (2,480 | ) | | | (2,323 | ) | | | (1,658 | ) | | | 3,981 | | | | (2,480 | ) |
| | | | | | | | | | | | | | | | | | | | | |
1 UBS AG (Parent Bank) prepares its audited financial statements in accordance with Swiss GAAP. Amounts presented in this column serve as a basis for preparing Group Financial Statements under IFRS.
Note 39 Supplemental guarantor information required under SEC regulations (continued)
Supplemental guarantor consolidated balance sheet
| | | | | | | | | | | | | | | | | | | | |
CHF million As of 31 December 2012 | | UBS AG
(Parent Bank)1 | | | UBS
Americas Inc. | | | Other
subsidiaries | | | Consolidating
entries | | | UBS
Group | |
| Assets | | | | | | | | | | | | | | | | | | | | |
| | | | | | | | | | | | | | | | | | | | | |
| Cash and balances with central banks | | | 54,192 | | | | 11,395 | | | | 796 | | | | 0 | | | | 66,383 | |
| | | | | | | | | | | | | | | | | | | | | |
| Due from banks | | | 29,107 | | | | 7,845 | | | | 68,734 | | | | (84,464 | ) | | | 21,220 | |
| | | | | | | | | | | | | | | | | | | | | |
| Cash collateral on securities borrowed | | | 35,749 | | | | 35,172 | | | | 3,126 | | | | (36,675 | ) | | | 37,372 | |
| | | | | | | | | | | | | | | | | | | | | |
| Reverse repurchase agreements | | | 105,197 | | | | 60,659 | | | | 59,962 | | | | (94,877 | ) | | | 130,941 | |
| | | | | | | | | | | | | | | | | | | | | |
| Trading portfolio assets | | | 117,337 | | | | 21,772 | | | | 29,026 | | | | (7,572 | ) | | | 160,564 | |
| | | | | | | | | | | | | | | | | | | | | |
of which: assets pledged as collateral which may be sold or repledged by counterparties | | | 47,226 | | | | 5,467 | | | | 2,466 | | | | (10,460 | ) | | | 44,698 | |
| | | | | | | | | | | | | | | | | | | | | |
| Positive replacement values | | | 416,098 | | | | 5,695 | | | | 128,949 | | | | (131,785 | ) | | | 418,957 | |
| | | | | | | | | | | | | | | | | | | | | |
| Cash collateral receivables on derivative instruments | | | 32,740 | | | | 4,045 | | | | 28,331 | | | | (34,703 | ) | | | 30,413 | |
| | | | | | | | | | | | | | | | | | | | | |
| Financial assets designated at fair value | | | 7,007 | | | | 3,037 | | | | 4,490 | | | | (5,428 | ) | | | 9,106 | |
| | | | | | | | | | | | | | | | | | | | | |
| Loans | | | 279,038 | | | | 38,663 | | | | 10,252 | | | | (48,053 | ) | | | 279,901 | |
| | | | | | | | | | | | | | | | | | | | | |
| Financial investments available-for-sale | | | 51,041 | | | | 10,484 | | | | 4,706 | | | | 0 | | | | 66,230 | |
| | | | | | | | | | | | | | | | | | | | | |
| Investments in subsidiaries and associates | | | 64,807 | 2 | | | 4 | | | | 1 | | | | (63,953 | )2 | | | 858 | |
| | | | | | | | | | | | | | | | | | | | | |
| Property and equipment | | | 5,034 | | | | 593 | | | | 376 | | | | 0 | | | | 6,004 | |
| | | | | | | | | | | | | | | | | | | | | |
| Goodwill and intangible assets | | | 323 | | | | 5,116 | | | | 1,023 | | | | 0 | | | | 6,461 | |
| | | | | | | | | | | | | | | | | | | | | |
| Deferred tax assets | | | 5,132 | | | | 2,643 | | | | 368 | | | | 0 | | | | 8,143 | |
| | | | | | | | | | | | | | | | | | | | | |
| Other assets | | | 10,924 | | | | 7,712 | | | | 1,730 | | | | (3,122 | ) | | | 17,244 | |
| | | | | | | | | | | | | | | | | | | | | |
| Total assets | | | 1,213,726 | | | | 214,835 | | | | 341,869 | | | | (510,633 | ) | | | 1,259,797 | |
| | | | | | | | | | | | | | | | | | | | | |
| Liabilities | | | | | | | | | | | | | | | | | | | | |
| | | | | | | | | | | | | | | | | | | | | |
| Due to banks | | | 54,795 | | | | 46,014 | | | | 6,680 | | | | (84,464 | ) | | | 23,024 | |
| | | | | | | | | | | | | | | | | | | | | |
| Cash collateral on securities lent | | | 19,704 | | | | 22,105 | | | | 4,069 | | | | (36,675 | ) | | | 9,203 | |
| | | | | | | | | | | | | | | | | | | | | |
| Repurchase agreements | | | 24,540 | | | | 51,057 | | | | 57,837 | | | | (94,877 | ) | | | 38,557 | |
| | | | | | | | | | | | | | | | | | | | | |
| Trading portfolio liabilities | | | 24,996 | | | | 8,892 | | | | 6,980 | | | | (6,620 | ) | | | 34,247 | |
| | | | | | | | | | | | | | | | | | | | | |
| Negative replacement values | | | 391,863 | | | | 5,856 | | | | 129,325 | | | | (131,785 | ) | | | 395,260 | |
| | | | | | | | | | | | | | | | | | | | | |
| Cash collateral payables on derivative instruments | | | 58,650 | | | | 10,907 | | | | 36,294 | | | | (34,703 | ) | | | 71,148 | |
| | | | | | | | | | | | | | | | | | | | | |
| Financial liabilities designated at fair value | | | 88,775 | | | | 988 | | | | 8,132 | | | | (5,994 | ) | | | 91,901 | |
| | | | | | | | | | | | | | | | | | | | | |
| Due to customers | | | 330,271 | | | | 45,107 | | | | 46,133 | | | | (48,053 | ) | | | 373,459 | |
| | | | | | | | | | | | | | | | | | | | | |
| Debt issued | | | 98,906 | | | | 353 | | | | 5,966 | | | | (388 | ) | | | 104,837 | |
| | | | | | | | | | | | | | | | | | | | | |
| Provisions | | | 1,166 | | | | 1,023 | | | | 347 | | | | 0 | | | | 2,536 | |
| | | | | | | | | | | | | | | | | | | | | |
| Other liabilities | | | 29,256 | | | | 20,497 | | | | 19,890 | | | | (3,122 | ) | | | 66,523 | |
| | | | | | | | | | | | | | | | | | | | | |
| Total liabilities | | | 1,122,924 | | | | 212,801 | | | | 321,653 | | | | (446,682 | ) | | | 1,210,697 | |
| | | | | | | | | | | | | | | | | | | | | |
| Equity attributable to UBS shareholders | | | 87,693 | | | | 2,034 | | | | 20,174 | | | | (63,951 | ) | | | 45,949 | |
| | | | | | | | | | | | | | | | | | | | | |
| Equity attributable to preferred noteholders | | | 3,109 | | | | 0 | | | | 0 | | | | 0 | | | | 3,109 | |
| | | | | | | | | | | | | | | | | | | | | |
| Equity attributable to non-controlling interests | | | 0 | | | | 0 | | | | 42 | | | | 0 | | | | 42 | |
| | | | | | | | | | | | | | | | | | | | | |
| Total equity | | | 90,802 | 2 | | | 2,034 | | | | 20,216 | | | | (63,951 | )2 | | | 49,100 | |
| | | | | | | | | | | | | | | | | | | | | |
| Total liabilities and equity | | | 1,213,726 | | | | 214,835 | | | | 341,869 | | | | (510,633 | ) | | | 1,259,797 | |
| | | | | | | | | | | | | | | | | | | | | |
1 UBS AG (Parent Bank) prepares its audited financial statements in accordance with Swiss GAAP. Amounts presented in this column serve as a basis for preparing Group Financial Statements under IFRS. 2 Investments in subsidiaries which are presented gross in this table are eliminated against equity upon consolidation.
Financial information
Notes to the consolidated financial statements
Note 39 Supplemental guarantor information required under SEC regulations (continued)
Supplemental guarantor consolidated statement of cash flows
| | | | | | | | | | | | | | | | |
CHF million For the year ended 31 December 2012 | | UBS AG
(Parent Bank)1 | | | UBS
Americas Inc. | | | Other
subsidiaries | | | UBS Group | |
| Net cash flow from/(used in) operating activities | | | 49,291 | | | | 10,795 | | | | 7,075 | | | | 67,160 | |
| | | | | | | | | | | | | | | | | |
| Cash flow from/(used in) investing activities | | | | | | | | | | | | | | | | |
| | | | | | | | | | | | | | | | | |
| Purchase of subsidiaries, associates and intangible assets | | | (11 | ) | | | 0 | | | | 0 | | | | (11 | ) |
| | | | | | | | | | | | | | | | | |
| Disposal of subsidiaries, associates and intangible assets2 | | | 41 | | | | 0 | | | | 0 | | | | 41 | |
| | | | | | | | | | | | | | | | | |
| Purchase of property and equipment | | | (878 | ) | | | (189 | ) | | | (50 | ) | | | (1,118 | ) |
| | | | | | | | | | | | | | | | | |
| Disposal of property and equipment | | | 194 | | | | 5 | | | | 3 | | | | 202 | |
| | | | | | | | | | | | | | | | | |
| Net (investment in)/divestment of financial investments available-for-sale | | | (12,429 | ) | | | (780 | ) | | | (785 | ) | | | (13,994 | ) |
| | | | | | | | | | | | | | | | | |
| Net cash flow from/(used in) investing activities | | | (13,082 | ) | | | (965 | ) | | | (832 | ) | | | (14,879 | ) |
| | | | | | | | | | | | | | | | | |
| Cash flow from/(used in) financing activities | | | | | | | | | | | | | | | | |
| | | | | | | | | | | | | | | | | |
| Net short-term debt issued/(repaid) | | | (26,177 | ) | | | 0 | | | | (11,790 | ) | | | (37,967 | ) |
| | | | | | | | | | | | | | | | | |
| Net movements in treasury shares and own equity derivative activity | | | (1,159 | ) | | | 0 | | | | 0 | | | | (1,159 | ) |
| | | | | | | | | | | | | | | | | |
| Dividends paid on UBS shares | | | (379 | ) | | | 0 | | | | 0 | | | | (379 | ) |
| | | | | | | | | | | | | | | | | |
| Issuance of long-term debt, including financial liabilities designated at fair value | | | 49,885 | | | | 575 | | | | 5,430 | | | | 55,890 | |
| | | | | | | | | | | | | | | | | |
| Repayment of long-term debt, including financial liabilities designated at fair value | | | (49,981 | ) | | | (23 | ) | | | (4,254 | ) | | | (54,259 | ) |
| | | | | | | | | | | | | | | | | |
| Dividends paid and repayments of preferred notes | | | (221 | ) | | | 0 | | | | 0 | | | | (221 | ) |
| | | | | | | | | | | | | | | | | |
| Net changes of non-controlling interests | | | 0 | | | | 0 | | | | (16 | ) | | | (16 | ) |
| | | | | | | | | | | | | | | | | |
| Net activity in investments in subsidiaries | | | (2,600 | ) | | | (99 | ) | | | 2,698 | | | | 0 | |
| | | | | | | | | | | | | | | | | |
| Net cash flow from/(used in) financing activities | | | (30,631 | ) | | | 452 | | | | (7,932 | ) | | | (38,110 | ) |
| | | | | | | | | | | | | | | | | |
| Effects of exchange rate differences on cash and cash equivalents | | | (200 | ) | | | (352 | ) | | | (121 | ) | | | (673 | ) |
| | | | | | | | | | | | | | | | | |
| Net increase/(decrease) in cash and cash equivalents | | | 5,377 | | | | 9,930 | | | | (1,808 | ) | | | 13,500 | |
| | | | | | | | | | | | | | | | | |
| Cash and cash equivalents at the beginning of the year | | | 66,481 | | | | 4,336 | | | | 14,793 | | | | 85,609 | |
| | | | | | | | | | | | | | | | | |
| Cash and cash equivalents at the end of the year | | | 71,858 | | | | 14,266 | | | | 12,985 | | | | 99,108 | |
| | | | | | | | | | | | | | | | | |
| Cash and cash equivalents comprise: | | | | | | | | | | | | | | | | |
| | | | | | | | | | | | | | | | | |
| Cash and balances with central banks | | | 54,192 | | | | 11,395 | | | | 796 | | | | 66,383 | |
| | | | | | | | | | | | | | | | | |
| Money market paper3 | | | 4,279 | | | | 47 | | | | 56 | | | | 4,381 | |
| | | | | | | | | | | | | | | | | |
| Due from banks4 | | | 13,387 | | | | 2,824 | | | | 12,133 | | | | 28,344 | |
| | | | | | | | | | | | | | | | | |
| Total | | | 71,858 | | | | 14,266 | | | | 12,985 | | | | 99,108 | 5 |
| | | | | | | | | | | | | | | | | |
1 UBS AG (Parent Bank) prepares its audited financial statements in accordance with Swiss GAAP. Amounts presented in this column serve as a basis for preparing Group Financial Statements under IFRS. 2 Includes dividends received from associates. 3 Money market paper is included in the balance sheet under Trading portfolio assets and Financial investments available-for-sale. 4 Includes positions recognized in the balance sheet under Due from banks and Cash collateral receivables on derivative instruments. 5 CHF 10,109 million of cash and cash equivalents were restricted.
Note 39 Supplemental guarantor information required under SEC regulations (continued)
Supplemental guarantor consolidated income statement
| | | | | | | | | | | | | | | | | | | | |
CHF million For the year ended 31 December 2011 | | UBS AG
(Parent Bank)1 | | | UBS
Americas Inc. | | | Other
subsidiaries | | | Consolidating
entries | | | UBS Group | |
| Operating income | | | | | | | | | | | | | | | | | | | | |
| | | | | | | | | | | | | | | | | | | | | |
| Interest income | | | 15,311 | | | | 2,910 | | | | 2,952 | | | | (3,203 | ) | | | 17,969 | |
| | | | | | | | | | | | | | | | | | | | | |
| Interest expense | | | (10,854 | ) | | | (1,102 | ) | | | (2,391 | ) | | | 3,203 | | | | (11,143 | ) |
| | | | | | | | | | | | | | | | | | | | | |
| Net interest income | | | 4,457 | | | | 1,808 | | | | 561 | | | | 0 | | | | 6,826 | |
| | | | | | | | | | | | | | | | | | | | | |
| Credit loss (expense)/recovery | | | (96 | ) | | | 18 | | | | (6 | ) | | | 0 | | | | (84 | ) |
| | | | | | | | | | | | | | | | | | | | | |
| Net interest income after credit loss expense | | | 4,361 | | | | 1,826 | | | | 555 | | | | 0 | | | | 6,742 | |
| | | | | | | | | | | | | | | | | | | | | |
| Net fee and commission income | | | 6,351 | | | | 5,757 | | | | 3,128 | | | | 0 | | | | 15,236 | |
| | | | | | | | | | | | | | | | | | | | | |
| Net trading income | | | 4,155 | | | | (81 | ) | | | 269 | | | | 0 | | | | 4,343 | |
| | | | | | | | | | | | | | | | | | | | | |
| Income from subsidiaries | | | 677 | | | | 0 | | | | 0 | | | | (677 | ) | | | 0 | |
| | | | | | | | | | | | | | | | | | | | | |
| Other income | | | 1,427 | | | | 728 | | | | (689 | ) | | | 0 | | | | 1,467 | |
| | | | | | | | | | | | | | | | | | | | | |
| Total operating income | | | 16,972 | | | | 8,230 | | | | 3,263 | | | | (677 | ) | | | 27,788 | |
| | | | | | | | | | | | | | | | | | | | | |
| Operating expenses | | | | | | | | | | | | | | | | | | | | |
| | | | | | | | | | | | | | | | | | | | | |
| Personnel expenses | | | 8,772 | | | | 5,199 | | | | 1,663 | | | | 0 | | | | 15,634 | |
| | | | | | | | | | | | | | | | | | | | | |
| General and administrative expenses | | | 2,577 | | | | 2,283 | | | | 1,099 | | | | 0 | | | | 5,959 | |
| | | | | | | | | | | | | | | | | | | | | |
| Depreciation and impairment of property and equipment | | | 564 | | | | 117 | | | | 81 | | | | 0 | | | | 761 | |
| | | | | | | | | | | | | | | | | | | | | |
| Amortization and impairment of intangible assets | | | 26 | | | | 80 | | | | 21 | | | | 0 | | | | 127 | |
| | | | | | | | | | | | | | | | | | | | | |
| Total operating expenses | | | 11,940 | | | | 7,679 | | | | 2,864 | | | | 0 | | | | 22,482 | |
| | | | | | | | | | | | | | | | | | | | | |
| Operating profit/(loss) before tax | | | 5,032 | | | | 551 | | | | 399 | | | | (677 | ) | | | 5,307 | |
| | | | | | | | | | | | | | | | | | | | | |
| Tax expense/(benefit) | | | 895 | | | | 61 | | | | (55 | ) | | | 0 | | | | 901 | |
| | | | | | | | | | | | | | | | | | | | | |
| Net profit/(loss) | | | 4,138 | | | | 490 | | | | 454 | | | | (677 | ) | | | 4,406 | |
| | | | | | | | | | | | | | | | | | | | | |
| Net profit/(loss) attributable to non-controlling interests | | | 0 | | | | 2 | | | | 266 | | | | 0 | | | | 268 | |
| | | | | | | | | | | | | | | | | | | | | |
| Net profit/(loss) attributable to UBS shareholders | | | 4,138 | | | | 488 | | | | 189 | | | | (677 | ) | | | 4,138 | |
| | | | | | | | | | | | | | | | | | | | | |
1 UBS AG (Parent Bank) prepares its audited financial statements in accordance with Swiss GAAP. Amounts presented in this column serve as a basis for preparing Group Financial Statements under IFRS.
Financial information
Notes to the consolidated financial statements
Note 39 Supplemental guarantor information required under SEC regulations (continued)
Supplemental guarantor consolidated statement of cash flows
| | | | | | | | | | | | | | | | |
CHF million For the year ended 31 December 2011 | | UBS AG
(Parent Bank)1 | | | UBS
Americas
Inc. | | | Other
subsidiaries | | | UBS
Group | |
| Net cash flow from/(used in) operating activities | | | (12,251 | ) | | | (933 | ) | | | (1,057 | ) | | | (14,241 | ) |
| | | | | | | | | | | | | | | | | |
| Cash flow from/(used in) investing activities | | | | | | | | | | | | | | | | |
| | | | | | | | | | | | | | | | | |
| Purchase of subsidiaries, associates and intangible assets | | | (58 | ) | | | 0 | | | | 0 | | | | (58 | ) |
| | | | | | | | | | | | | | | | | |
| Disposal of subsidiaries, associates and intangible assets2 | | | 50 | | | | 0 | | | | 0 | | | | 50 | |
| | | | | | | | | | | | | | | | | |
| Purchase of property and equipment | | | (917 | ) | | | (114 | ) | | | (98 | ) | | | (1,129 | ) |
| | | | | | | | | | | | | | | | | |
| Disposal of property and equipment | | | 137 | | | | 91 | | | | 5 | | | | 233 | |
| | | | | | | | | | | | | | | | | |
| Net (investment in)/divestment of financial investments available-for-sale | | | 19,125 | | | | 1,165 | | | | (9 | ) | | | 20,281 | |
| | | | | | | | | | | | | | | | | |
| Net cash flow from/(used in) investing activities | | | 18,336 | | | | 1,142 | | | | (101 | ) | | | 19,377 | |
| | | | | | | | | | | | | | | | | |
| Cash flow from/(used in) financing activities | | | | | | | | | | | | | | | | |
| | | | | | | | | | | | | | | | | |
| Net short-term debt issued/(repaid) | | | 5,459 | | | | 0 | | | | 9,879 | | | | 15,338 | |
| | | | | | | | | | | | | | | | | |
| Net movements in treasury shares and own equity derivative activity | | | (1,885 | ) | | | 0 | | | | 0 | | | | (1,885 | ) |
| | | | | | | | | | | | | | | | | |
| Issuance of long-term debt, including financial liabilities designated at fair value | | | 48,844 | | | | 197 | | | | 3,549 | | | | 52,590 | |
| | | | | | | | | | | | | | | | | |
| Repayment of long-term debt, including financial liabilities designated at fair value | | | (55,668 | ) | | | (8 | ) | | | (6,950 | ) | | | (62,626 | ) |
| | | | | | | | | | | | | | | | | |
| Net changes of non-controlling interests | | | 0 | | | | 0 | | | | (748 | ) | | | (748 | ) |
| | | | | | | | | | | | | | | | | |
| Net activity in investments in subsidiaries | | | 640 | | | | (366 | ) | | | (274 | ) | | | 0 | |
| | | | | | | | | | | | | | | | | |
| Net cash flow from/(used in) financing activities | | | (2,610 | ) | | | (177 | ) | | | 5,457 | | | | 2,670 | |
| | | | | | | | | | | | | | | | | |
| Effects of exchange rate differences on cash and cash equivalents | | | (2,587 | ) | | | 299 | | | | 159 | | | | (2,129 | ) |
| | | | | | | | | | | | | | | | | |
| Net increase/(decrease) in cash and cash equivalents | | | 889 | | | | 333 | | | | 4,457 | | | | 5,678 | |
| | | | | | | | | | | | | | | | | |
| Cash and cash equivalents at the beginning of the year | | | 65,592 | | | | 4,003 | | | | 10,339 | | | | 79,934 | |
| | | | | | | | | | | | | | | | | |
| Cash and cash equivalents at the end of the year | | | 66,481 | | | | 4,336 | | | | 14,796 | | | | 85,612 | |
| | | | | | | | | | | | | | | | | |
| Cash and cash equivalents comprise: | | | | | | | | | | | | | | | | |
| | | | | | | | | | | | | | | | | |
| Cash and balances with central banks | | | 38,094 | | | | 1,977 | | | | 568 | | | | 40,638 | |
| | | | | | | | | | | | | | | | | |
| Money market paper3 | | | 3,804 | | | | 29 | | | | 67 | | | | 3,900 | |
| | | | | | | | | | | | | | | | | |
| Due from banks4 | | | 24,582 | | | | 2,330 | | | | 14,162 | | | | 41,074 | |
| | | | | | | | | | | | | | | | | |
| Total | | | 66,481 | | | | 4,336 | | | | 14,796 | | | | 85,612 | |
| | | | | | | | | | | | | | | | | |
1 UBS AG (Parent Bank) prepares its audited financial statements in accordance with Swiss GAAP. Amounts presented in this column serve as a basis for preparing Group Financial Statements under IFRS. 2 Includes dividends received from associates. 3 Money market paper is included in the balance sheet under Trading portfolio assets and Financial investments available-for-sale. 4 Includes positions recognized in the balance sheet under Due from banks and Cash collateral receivables on derivative instruments.
Note 39 Supplemental guarantor information required under SEC regulations (continued)
Guarantee of other securities
The table below provides information on outstanding trust preferred securities which are registered under the US Securities Act and issued by US-domiciled entities that are 100% legally owned by UBS AG. These entities are not consolidated as UBS does not absorb any variability from the performance of these entities.
However, UBS AG has fully and unconditionally guaranteed these securities. UBS’s obligations under the trust preferred securities guarantee are subordinated to the prior payment in full of the deposit and all other liabilities of UBS. As of 31 December 2013, the amount of senior liabilities of UBS to which the holders of the subordinated debt securities would be subordinated was approximately CHF 948 billion.
Guarantee of other securities
| | | | | | | | | | | | | | |
| USD billion, unless otherwise indicated | | | | | | | As of 31.12.13 | |
| Issuing Entity | | Type of security | | Date issued | | | Interest (%) | | | Amount
outstanding | |
| UBS Preferred Funding Trust IV | | Non-cumulative trust preferred securities | | | May 2003 | | |
| one-month USD
LIBOR + 0.7 |
| | | 0.3 | |
| | | | | | | | | | | | | | | |
| UBS Preferred Funding Trust V | | Non-cumulative trust preferred securities | | | May 2006 | | | | 6.243 | | | | 1.0 | |
| | | | | | | | | | | | | | | |
Guarantee to UBS Ltd.
UBS AG has issued a guarantee for the benefit of each counter-party of UBS Limited. Under this guarantee, UBS AG irrevocably
and unconditionally guarantees each and every obligation that UBS Limited entered into. UBS AG promises to pay to that counterparty on demand any unpaid balance of such liabilities under the terms of the guarantee.
UBS AG (Parent Bank)
Parent Bank review
The following review is based on changes in UBS AG’s (Parent Bank) financial statements from 31 December 2012 to 31 December 2013.
Income statement
UBS AG (Parent Bank) recorded a net profit of CHF 2,753 million in 2013, compared with a net loss of CHF 6,645 million in 2012.
The profit before extraordinary items and tax was CHF 1,365 million, compared with a loss of CHF 3,016 million in the prior year. This was mainly a result of a CHF 2,935 million decline in the impairment of investments in subsidiaries and other participations, as the prior year included goodwill impairments in subsidiaries and the impact of the adoption of IAS 19R. Furthermore, expenses for allowances, provisions and losses decreased by CHF 1,076 million, mainly due to lower charges for provisions for litigation, regulatory and similar matters. In addition, operating expenses decreased by CHF 707 million, which was partly offset by a decrease in operating income amounting to CHF 300 million.
Extraordinary income was CHF 1,667 million compared with CHF 429 million in the prior year, mainly reflecting a reversal of impairments and provisions of subsidiaries and other participations as well as the release of the reinvestment relief provision related to the sale of UBS Pactual. Extraordinary expenses were CHF 9 million compared with CHF 4,117 million, mainly as 2012 included expenses related to changes in pension accounting.
Net interest income
Net interest income increased by CHF 183 million, or 5%, to CHF 4,044 million, reflecting a CHF 2,394 million decline in interest expenses, partly offset by CHF 2,211 million lower interest income.
The CHF 2,211 million decline in interest income was driven by CHF 1,255 million lower interest and discount income which mainly reflected lower interest earned on loans and advances. In addition, interest and dividend income from the trading portfolio decreased by CHF 849 million. Furthermore, interest and dividend income from financial investments decreased by CHF 107 million.
Interest expense decreased by CHF 2,394 million, mainly due to lower interest expenses on debt issued as well as due to banks and customers.
Net fee and commission income
Net fee and commission income increased by CHF 439 million to CHF 6,454 million.
Fee and commission income from securities and investment businesses increased by CHF 443 million to CHF 6,713 million. Portfolio management and advisory fees increased in Wealth Management. Brokerage fees increased in the Investment Bank due to improved market activity. Investment fund fees increased mainly in Global Asset Management. These increases were partly offset by a decrease in underwriting fees in the Investment Bank and Corporate Center.
Fee and commission expense decreased by CHF 36 million, mainly due to lower brokerage fees paid.
Net trading income
Net trading income was CHF 4,209 million in 2013 compared with CHF 5,097 million in 2012. Net trading income within the Corporate Client Solutions business in the Investment Bank was positive CHF 368 million, compared with negative CHF 743 million in 2012. Net trading income within the Investor Client Services business in the Investment Bank increased by CHF 914 million to CHF 3,566 million. Net trading income in other business divisions and Corporate Center was CHF 275 million compared with CHF 3,189 million in 2012.
Other income from ordinary activities
Other income from ordinary activities was CHF 2,368 million, a decline of CHF 33 million.
Dividend income from investments in subsidiaries and other participations increased by CHF 110 million to CHF 1,015 million.
Sundry ordinary income decreased by CHF 225 million to CHF 3,734 million. In 2013, sundry income included CHF 3,599 million of income received from subsidiaries for services rendered, a decrease of CHF 257 million compared with the prior year.
Sundry ordinary expenses decreased by CHF 77 million to CHF 2,492 million. Charges from subsidiaries for services received decreased by CHF 272 million to CHF 2,096 million. This was partly offset by losses of CHF 187 million related to the buyback of debt in public tender offers in 2013.
Operating expenses
Personnel expenses decreased by CHF 732 million to CHF 8,156 million, mainly as the prior year included restructuring charges of CHF 1,364 million and a credit of CHF 485 million related to changes to our Swiss pension plan.
General and administrative expenses increased by CHF 25 million.
507
Financial information
UBS AG (Parent Bank)
Impairment of investments in subsidiaries and other participations
Impairment of investments in subsidiaries and other participations decreased by CHF 2,935 million to CHF 1,275 million. Impairments in 2013 were mainly due to unfavorable foreign currency impacts, mainly related to US subsidiaries, updated strategic business outlooks and certain litigation charges. In 2012, the net asset value of subsidiaries which recorded a goodwill impairment declined, resulting in an impairment of the investments in those subsidiaries of CHF 2,951 million. In addition, the adoption of IAS 19R by foreign subsidiaries in 2012 also resulted in lower net asset values, resulting in an impairment of CHF 620 million of the respective investments.
Allowances, provisions and losses
Allowances, provisions and losses decreased by CHF 1,076 million to CHF 659 million, mainly as 2012 included higher charges for provisions for litigation, regulatory and similar matters, primarily as a result of charges for provisions arising from fines and disgorgement resulting from regulatory investigations concerning LIBOR and other benchmark rates. 2013 included a charge of CHF 110 million related to theSwiss-UK tax agreement.
Extraordinary income
Extraordinary income increased by CHF 1,238 million to CHF 1,667 million.
Reversals of impairments and provisions of subsidiaries and other participations increased by CHF 815 million to CHF 976 million, mainly due to a significant deferred tax assets write-up. Gains from disposals of subsidiaries and other participations increased by CHF 39 million and included gains of CHF 40 million resulting from the divestment of our participation in Euroclear Plc. Prior period related income decreased to CHF 49 million from CHF 115 million. Other extraordinary income of CHF 275 million mainly included gains on sales of real estate. Furthermore, in 2013, the reinvestment relief provision of CHF 291 million related to the sale of UBS Pactual in 2009 was released.
Extraordinary expenses
Extraordinary expenses decreased by CHF 4,108 million to CHF 9 million, mainly as 2012 included changes in pension accounting, which resulted in extraordinary expenses of CHF 3,954 million, of which CHF 3,063 million related to the Swiss pension plan and CHF 892 million related to non-Swiss defined benefit plans.
Tax expense/benefit
The tax expense in 2013 was CHF 270 million compared with a net tax benefit in 2012 of CHF 59 million.
Deferred tax assets are not accounted for or reported in UBS AG’s (Parent Bank) financial statements prepared under Swiss GAAP. As a consequence, there is no net upward revaluation of deferred tax assets and no amortization of deferred tax assets for tax losses used against profits arising from business operations. This is the main difference to the Group net income tax benefit of CHF 110 million for IFRS purposes, for which the net upward revaluation and net amortization of deferred tax assets represent the most significant elements.
Balance sheet
Assets
Total assets stood at CHF 716 billion as of 31 December 2013, a decrease of CHF 60 billion from 31 December 2012, predominantly in Non-core and Legacy Portfolio, reflecting the ongoing execution of our strategy.
Asset reductions mainly occurred within reverse repurchase agreements, trading balances in securities and precious metals, money market paper and positive replacement values. These decreases were partly offset by higher liquid assets held at central banks and increased holdings of high-quality corporate bonds.
Liquid assets and money market paper
Liquid assets increased by CHF 16 billion to CHF 70 billion as of 31 December 2013, mainly reflecting higher balances with central banks. Money market paper held decreased by CHF 9 billion to CHF 22 billion, primarily due to reductions in US, German, Dutch and Canadian government bills.
Due from banks and due from customers
Interbank lending (due from banks) decreased by CHF 40 billion to CHF 128 billion, mainly reflecting reduced reverse repurchase agreements and securities borrowing with UBS subsidiaries, in particular in the Americas and Europe.
Due from customers decreased by CHF 8 billion to CHF 153 billion, mainly due to a decrease in non-mortgage loans of CHF 3 billion, primarily in the Americas, a decrease in current accounts of CHF 3 billion, mainly in Switzerland, and a decrease in reverse repurchase agreements and securities borrowings with non-bank clients of CHF 2 billion. These decreases were partly offset by higher prime brokerage loan balances, mainly in the Americas, which increased by CHF 3 billion.
Mortgage loans
Mortgage loans increased by CHF 3 billion, mainly due to an increase in residential mortgages.
Trading balances in securities and precious metals and financial investments
Trading balances in securities and precious metals decreased by CHF 21 billion. Precious metal holdings were lower by CHF 8 billion, debt instruments were reduced by CHF 4 billion and investment fund units were down by CHF 4 billion. These decreases were partly offset by an increase in securities borrowing arrangements totaling CHF 6 billion.
Financial investments increased by CHF 4 billion to CHF 35 billion, primarily due to increased holdings of high-quality corporate bonds.
Investments in subsidiaries and other participations
Investments in subsidiaries and other participations increased by CHF 1 billion to CHF 22 billion. This was mainly due to the aforementioned write-up of subsidiaries of CHF 1 billion combined with net capital injections of CHF 1 billion, partly offset by write-downs of CHF 1 billion.
Positive replacement values
Positive replacement values, which are reported on a net basis provided the master netting and/or the related collateral agreements are legally enforceable, decreased by CHF 6 billion to CHF 29 billion, mainly as replacement values for interest rate contracts fell due to lower volumes and interest rate movements, whereas replacement values for credit derivatives fell due to the tightening of credit spreads and reduced volumes. Replacement values for equity/index contracts declined as a result of the exercise of our option to acquire the SNB StabFund’s equity. These decreases were partly offset by an increase in foreign exchange contracts.
Liabilities
Money market paper issued
Money market paper issued increased by CHF 2 billion to CHF 23 billion on 31 December 2013, mainly due to an increase in certificates of deposit outstanding, which was partly offset by a reduction in commercial paper outstanding.
Due to banks and due to customers
Due to banks decreased by CHF 23 billion to CHF 79 billion, reflecting lower unsecured interbank borrowing of CHF 15 billion and lower repurchase activity of CHF 11 billion. These decreases were partly offset by increased securities lending activity of CHF 4 billion. Total amounts due to customers increased by CHF 13 billion to CHF 377 billion, primarily due to an increase in deposit and personal accounts, mainly in the Americas and in Switzerland, respectively.
Trading portfolio liabilities
Trading portfolio liabilities declined by CHF 3 billion to CHF 22 billion as of 31 December 2013, mainly related to a reduction in debt instruments sold short, which was partly offset by an increase in equity instruments sold short.
Bonds issued and loans from central mortgage institutions
Bonds issued and loans from central mortgage institutions decreased by CHF 25 billion, primarily due to decreases in senior debt. As part of our reduction in wholesale funding, we successfully completed two cash tender offers during 2013 to repurchase certain subordinated and senior unsecured bonds.
Financial liabilities designated at fair value
Financial liabilities designated at fair value decreased by CHF 15 billion, primarily resulting from trade restructurings, lower valuation of structured debt as well as instrument maturities and redemptions.
Negative replacement values
Negative replacement values fell by CHF 6 billion to CHF 37 billion, primarily due to lower replacement values for interest rate and equity/index contracts.
Other liabilities and allowances and provisions
Other liabilities decreased by CHF 4 billion, mainly due to decreased deferrals for hedging instruments and settlements of liabilities.
Allowances and provisions remained stable at CHF 3 billion.
Equity
Total equity attributable to shareholders stood at CHF 35,437 million as of 31 December 2013, compared with CHF 33,176 million as of 31 December 2012. The increase was mainly due to the 2013 net profit of CHF 2,753 million. The general statutory reserve decreased by CHF 5,386 million to CHF 26,611 million as of 31 December 2013, mainly reflecting a partial appropriation of the loss in 2012 of CHF 4,894 million as well as the distribution out of the capital contribution reserve in May 2013.
The reserve for own shares increased by CHF 131 million to CHF 1,020 million, reflecting the net acquisition of treasury shares. Other reserves decreased by CHF 1,882 million, reflecting the partial appropriation of the loss in 2012 of CHF 1,751 million, as well as the net acquisition of treasury shares, which decreased other reserves by CHF 131 million.
Financial information
UBS AG (Parent Bank)
Parent Bank financial statements
Income statement
| | | | | | | | | | | | | | | | |
| | | | | For the year ended | | | % change from | |
| CHF million | | Note | | | 31.12.13 | | | 31.12.12 | | | 31.12.12 | |
| Interest and discount income | | | | | | | 8,792 | | | | 10,047 | | | | (12 | ) |
| | | | | | | | | | | | | | | | | |
| Interest and dividend income from trading portfolio | | | | | | | 2,409 | | | | 3,258 | | | | (26 | ) |
| | | | | | | | | | | | | | | | | |
| Interest and dividend income from financial investments | | | | | | | 135 | | | | 242 | | | | (44 | ) |
| | | | | | | | | | | | | | | | | |
| Interest expense | | | | | | | (7,292 | ) | | | (9,686 | ) | | | (25 | ) |
| | | | | | | | | | | | | | | | | |
| Net interest income | | | | | | | 4,044 | | | | 3,861 | | | | 5 | |
| | | | | | | | | | | | | | | | | |
| Credit-related fees and commissions | | | | | | | 324 | | | | 378 | | | | (14 | ) |
| | | | | | | | | | | | | | | | | |
| Fee and commission income from securities and investment business | | | | | | | 6,713 | | | | 6,270 | | | | 7 | |
| | | | | | | | | | | | | | | | | |
| Other fee and commission income | | | | | | | 649 | | | | 634 | | | | 2 | |
| | | | | | | | | | | | | | | | | |
| Fee and commission expense | | | | | | | (1,231 | ) | | | (1,267 | ) | | | (3 | ) |
| | | | | | | | | | | | | | | | | |
| Net fee and commission income | | | | | | | 6,454 | | | | 6,015 | | | | 7 | |
| | | | | | | | | | | | | | | | | |
| Net trading income | | | 3 | | | | 4,209 | | | | 5,097 | | | | (17 | ) |
| | | | | | | | | | | | | | | | | |
| Net income from disposal of financial investments | | | | | | | 81 | | | | 75 | | | | 8 | |
| | | | | | | | | | | | | | | | | |
| Dividend income from investments in subsidiaries and other participations | | | | | | | 1,015 | | | | 905 | | | | 12 | |
| | | | | | | | | | | | | | | | | |
| Income from real estate holdings | | | | | | | 30 | | | | 31 | | | | (3 | ) |
| | | | | | | | | | | | | | | | | |
| Sundry ordinary income | | | | | | | 3,734 | | | | 3,959 | | | | (6 | ) |
| | | | | | | | | | | | | | | | | |
| Sundry ordinary expenses | | | | | | | (2,492 | ) | | | (2,569 | ) | | | (3 | ) |
| | | | | | | | | | | | | | | | | |
| Other income from ordinary activities | | | | | | | 2,368 | | | | 2,401 | | | | (1 | ) |
| | | | | | | | | | | | | | | | | |
| Operating income | | | | | | | 17,074 | | | | 17,374 | | | | (2 | ) |
| | | | | | | | | | | | | | | | | |
| Personnel expenses | | | | | | | 8,156 | | | | 8,888 | | | | (8 | ) |
| | | | | | | | | | | | | | | | | |
| General and administrative expenses | | | | | | | 5,041 | | | | 5,016 | | | | 0 | |
| | | | | | | | | | | | | | | | | |
| Operating expenses | | | | | | | 13,197 | | | | 13,904 | | | | (5 | ) |
| | | | | | | | | | | | | | | | | |
| Operating profit | | | | | | | 3,877 | | | | 3,470 | | | | 12 | |
| | | | | | | | | | | | | | | | | |
| Impairment of investments in subsidiaries and other participations | | | | | | | 1,275 | | | | 4,210 | | | | (70 | ) |
| | | | | | | | | | | | | | | | | |
| Depreciation of fixed assets | | | | | | | 579 | | | | 541 | | | | 7 | |
| | | | | | | | | | | | | | | | | |
| Allowances, provisions and losses | | | | | | | 659 | | | | 1,735 | | | | (62 | ) |
| | | | | | | | | | | | | | | | | |
| Profit/(loss) before extraordinary items and taxes | | | | | | | 1,365 | | | | (3,016 | ) | | | | |
| | | | | | | | | | | | | | | | | |
| Extraordinary income | | | 4 | | | | 1,667 | | | | 429 | | | | 289 | |
| | | | | | | | | | | | | | | | | |
| Extraordinary expenses | | | 4 | | | | (9 | ) | | | (4,117 | ) | | | (100 | ) |
| | | | | | | | | | | | | | | | | |
| Tax (expense)/benefit | | | | | | | (270 | ) | | | 59 | | | | | |
| | | | | | | | | | | | | | | | | |
| Net profit/(loss) for the period | | | | | | | 2,753 | | | | (6,645 | ) | | | | |
| | | | | | | | | | | | | | | | | |
510
Balance sheet
| | | | | | | | | | | | | | | | |
| CHF million | | Note | | | 31.12.13 | | | 31.12.12 | | | % change from 31.12.12 | |
| Assets | | | | | | | | | | | | |
| Liquid assets | | | | | | | 69,808 | | | | 54,192 | | | | 29 | |
| | | | | | | | | | | | | | | | | |
| Money market paper | | | | | | | 22,159 | | | | 31,066 | | | | (29 | ) |
| | | | | | | | | | | | | | | | | |
| Due from banks | | | | | | | 127,689 | | | | 167,204 | | | | (24 | ) |
| | | | | | | | | | | | | | | | | |
| Due from customers | | | | | | | 153,326 | | | | 160,996 | | | | (5 | ) |
| | | | | | | | | | | | | | | | | |
| Mortgage loans | | | | | | | 152,479 | | | | 149,002 | | | | 2 | |
| | | | | | | | | | | | | | | | | |
| Trading balances in securities and precious metals | | | | | | | 94,841 | | | | 115,906 | | | | (18 | ) |
| | | | | | | | | | | | | | | | | |
| Financial investments | | | | | | | 34,985 | | | | 30,778 | | | | 14 | |
| | | | | | | | | | | | | | | | | |
| Investments in subsidiaries and other participations | | | | | | | 21,758 | | | | 21,090 | | | | 3 | |
| | | | | | | | | | | | | | | | | |
| Fixed assets | | | | | | | 5,193 | | | | 5,054 | | | | 3 | |
| | | | | | | | | | | | | | | | | |
| Accrued income and prepaid expenses | | | | | | | 2,025 | | | | 2,157 | | | | (6 | ) |
| | | | | | | | | | | | | | | | | |
| Positive replacement values | | | 13 | | | | 29,085 | | | | 35,206 | | | | (17 | ) |
| | | | | | | | | | | | | | | | | |
| Other assets | | | 5 | | | | 2,568 | | | | 3,037 | | | | (15 | ) |
| | | | | | | | | | | | | | | | | |
| Total assets | | | | | | | 715,917 | | | | 775,687 | | | | (8 | ) |
| | | | | | | | | | | | | | | | | |
of which: subordinated assets | | | | | | | 1,776 | | | | 3,776 | | | | (53 | ) |
| | | | | | | | | | | | | | | | | |
of which: amounts due from subsidiaries | | | | | | | 150,663 | | | | 201,982 | | | | (25 | ) |
| | | | | | | | | | | | | | | | | |
| | | | |
| Liabilities | | | | | | | | | | | | | | | | |
| | | | | | | | | | | | | | | | | |
| Money market paper issued | | | | | | | 22,885 | | | | 21,257 | | | | 8 | |
| | | | | | | | | | | | | | | | | |
| Due to banks | | | | | | | 79,207 | | | | 102,401 | | | | (23 | ) |
| | | | | | | | | | | | | | | | | |
| Trading portfolio liabilities | | | | | | | 22,165 | | | | 25,419 | | | | (13 | ) |
| | | | | | | | | | | | | | | | | |
| Due to customers on savings and deposit accounts | | | | | | | 106,040 | | | | 94,086 | | | | 13 | |
| | | | | | | | | | | | | | | | | |
| Other amounts due to customers | | | | | | | 271,339 | | | | 269,992 | | | | 0 | |
| | | | | | | | | | | | | | | | | |
| Medium-term notes | | | | | | | 779 | | | | 1,341 | | | | (42 | ) |
| | | | | | | | | | | | | | | | | |
| Bonds issued and loans from central mortgage institutions | | | | | | | 75,585 | | | | 100,166 | | | | (25 | ) |
| | | | | | | | | | | | | | | | | |
| Financial liabilities designated at fair value | | | | | | | 49,620 | | | | 64,808 | | | | (23 | ) |
| | | | | | | | | | | | | | | | | |
| Accruals and deferred income | | | | | | | 6,610 | | | | 6,434 | | | | 3 | |
| | | | | | | | | | | | | | | | | |
| Negative replacement values | | | 13 | | | | 37,415 | | | | 43,518 | | | | (14 | ) |
| | | | | | | | | | | | | | | | | |
| Other liabilities | | | 5 | | | | 6,029 | | | | 10,163 | | | | (41 | ) |
| | | | | | | | | | | | | | | | | |
| Allowances and provisions | | | 8 | | | | 2,805 | | | | 2,925 | | | | (4 | ) |
| | | | | | | | | | | | | | | | | |
| Total liabilities | | | | | | | 680,480 | | | | 742,511 | | | | (8 | ) |
| | | | | | | | | | | | | | | | | |
| | | | |
| Equity | | | | | | | | | | | | | | | | |
| | | | | | | | | | | | | | | | | |
| Share capital | | | 9,10 | | | | 384 | | | | 384 | | | | 0 | |
| | | | | | | | | | | | | | | | | |
| General statutory reserve | | | 9 | | | | 26,611 | | | | 31,997 | | | | (17 | ) |
| | | | | | | | | | | | | | | | | |
thereof capital contribution reserve | | | | | | | 41,692 | | | | 42,184 | | | | (1 | ) |
| | | | | | | | | | | | | | | | | |
thereof retained earnings | | | | | | | (15,081 | ) | | | (10,187 | ) | | | 48 | |
| | | | | | | | | | | | | | | | | |
| Reserve for own shares | | | 9 | | | | 1,020 | | | | 889 | | | | 15 | |
| | | | | | | | | | | | | | | | | |
thereof retained earnings | | | | | | | 1,020 | | | | 889 | | | | 15 | |
| | | | | | | | | | | | | | | | | |
| Other reserves | | | 9 | | | | 4,669 | | | | 6,551 | | | | (29 | ) |
| | | | | | | | | | | | | | | | | |
| Net profit/(loss) for the period | | | | | | | 2,753 | | | | (6,645 | ) | | | | |
| | | | | | | | | | | | | | | | | |
| Equity attributable to shareholders | | | 9 | | | | 35,437 | | | | 33,176 | | | | 7 | |
| | | | | | | | | | | | | | | | | |
| Total liabilities and equity | | | | | | | 715,917 | | | | 775,687 | | | | (8 | ) |
| | | | | | | | | | | | | | | | | |
of which: subordinated liabilities | | | | | | | 13,800 | | | | 15,985 | | | | (14 | ) |
| | | | | | | | | | | | | | | | | |
of which: amounts due to subsidiaries | | | | | | | 76,339 | | | | 103,148 | | | | (26 | ) |
| | | | | | | | | | | | | | | | | |
511
Financial information
UBS AG (Parent Bank)
Statement of appropriation of retained earnings
The Board of Directors proposes that the Annual General Meeting of Shareholders (AGM) on 7 May 2014 approves the following appropriation of retained earnings.
Proposed appropriation of retained earnings
| | |
| | For the year ended |
| CHF million | | 31.12.13 |
| Net profit for the period | | 2,753 |
| | | |
| Total available for appropriation | | 2,753 |
| | | |
| Appropriation to general statutory reserve: retained earnings | | 2,753 |
| | | |
| Total appropriation | | 2,753 |
| | | |
Proposed distribution of capital contribution reserve
The Board of Directors proposes that the AGM on 7 May 2014 approves the pay-out of CHF 0.25 per share of CHF 0.10 par value out of the capital contribution reserve. Provided that the proposed distribution of the capital contribution reserve is approved, the payment of CHF 0.25 per share would be made on 15 May 2014 to holders of shares on the record date 14 May 2014. The shares will be traded ex-dividend as of 12 May 2014, and accordingly the last day on which the shares may be traded with entitlement to receive a pay-out will be 9 May 2014.
| | |
| | For the year ended |
| CHF million, except where indicated | | 31.12.13 |
| Total capital contribution reserve before proposed distribution1,2 | | 41,692 |
| | | |
| Proposed distribution of capital contribution reserve within general statutory reserve: CHF 0.25 per dividend bearing share3 | | (961) |
| | | |
| Total capital contribution reserve after proposed distribution | | 40,732 |
| | | |
1 As presented on the balance sheet, the capital contribution reserve of CHF 41,692 million is a component of the general statutory reserve of CHF 26,611 million after taking into account negative retained earnings of CHF 15,081 million. 2 Effective 1 January 2011, the Swiss withholding tax law provides that payments out of the capital contribution reserve are not subject to withholding tax. This law has led to interpretational differences between the Swiss Federal Tax Authorities and companies about the qualifying amounts of capital contribution reserve and the disclosure in the financial statements. In view of this, the Swiss Federal Tax Authorities have confirmed that UBS would be able to repay to shareholders CHF 27.4 billion of disclosed capital contribution reserve (status as of 1 January 2011) without being subject to the withholding tax deduction that applies to dividends paid out of retained earnings. This amount reduced to CHF 26.5 billion as of 31 December 2013 subsequent to the distributions approved by the AGM 2012 and 2013. The decision about the remaining amount has been deferred to a future point in time. 3 Dividend-bearing shares are all shares issued except for treasury shares held by UBS AG (Parent Bank) as of the record date 14 May 2014.
512
Notes to the Parent Bank financial statements
Note 1 Business activities, risk assessment, outsourcing and personnel
Business activities
The business activities of UBS AG (Parent Bank) are described in the context of the description of the activities of the UBS Group in the “Operating environment and strategy” section of this report.
Risk assessment
UBS AG (Parent Bank), as the ultimate parent company of the UBS Group, is fully integrated into the Group-wide internal risk assessment process described in the audited part of the “Risk, treasury and capital management” section of this report.
Outsourcing
Outsourcing of information technology and other services through agreements with external service providers is in compliance with FINMA Circular 2008/7 “Outsourcing-banks.”
Personnel
UBS AG (Parent Bank) employed 33,291 personnel on a full-time equivalent basis as of 31 December 2013, compared with 35,153 personnel as of 31 December 2012.
Note 2 Accounting policies
a) Significant accounting policies
UBS AG’s (Parent Bank) financial statements are prepared in accordance with Swiss GAAP (FINMA Circular 2008/2 and the Banking Ordinance). The accounting policies are principally the same as for the consolidated financial statements outlined in “Note 1 Summary of significant accounting policies.” Major differences between the Swiss GAAP requirements and International Financial Reporting Standards are described in “Note 38 Swiss GAAP requirements” to the consolidated financial statements. The significant accounting policies applied for the statutory accounts of UBS AG (Parent Bank) are discussed below. In addition the presentation of the balance sheet and income statement under Swiss GAAP differs from the presentation under IFRS.
Treasury shares
Treasury shares are own equity instruments held by an entity. Under Swiss GAAP, treasury shares are recognized in the balance sheet asTrading balances in securities and precious metalsor asFinancial investments. Short positions in treasury shares are presented asTrading portfolio liabilities. Treasury shares recognized as trading balances (which include treasury shares held as economic hedges of equity compensation plans) and short positions in treasury shares are measured at fair value with unrealized gains or losses from remeasurement to fair value included in the income
statement. Treasury shares recognized asFinancial investmentsare valued according to the principles of lower of cost or market value. Realized gains and losses on the sale or acquisition of treasury shares are recognized in the income statement.
For treasury shares held asFinancial investments or for non-genuine trading purposes (e.g., treasury shares held to hedge equity compensation plans), aReserve for own shares must be created in equity through the reclassification of free reserves equal to the cost value of the treasury shares held. Repurchases of shares for the purpose of holding these asFinancial investments or non-genuine trading can be made to the extent that sufficient free reserves are available. TheReserve for own shares, is not available for distribution to shareholders. Total treasury shares held cannot exceed 10% of total issued shares.
Foreign currency translation
Assets and liabilities of foreign branches are translated into Swiss francs at the spot exchange rate at the balance sheet date. Income and expense items are translated at weighted average exchange rates for the period. All exchange differences are recognized in the income statement.
The main currency translation rates used by UBS AG (Parent Bank) can be found in “Note 36 Currency translation rates” to the consolidated financial statements.
513
Financial information
UBS AG (Parent Bank)
Note 2 Accounting policies (continued)
Investments in subsidiaries and other participations
Investments in subsidiaries and other participations are equity interests which are held for the purpose of UBS AG’s (Parent Bank) business activities or for strategic reasons. They include all directly held subsidiaries through which UBS AG (Parent Bank) conducts its business on a global basis. The investments are carried at cost less impairment. The carrying value is tested for impairment when indications for a decrease in value exist, which include incurrence of significant operating losses or a severe depreciation of the currency in which the investment is denominated. If an investment in a subsidiary is impaired, its value is generally written down to the net asset value. Subsequent recoveries in value are recognized up to the original cost value based on either the increased net asset value or a value above the net asset value if, in the opinion of management, forecasts of future profitability provide sufficient evidence that a carrying value above net asset value is supported. Management may exercise its discretion as to what extent and in which period a recovery in value is recognized.
Reversals of impairments are presented asExtraordinary incomein the income statement. Impairments of investments are presented inProfit/(loss) before extraordinary items and taxesunder Impairment of investments in subsidiaries and other participations. Impairments and partial or full reversal of impairments for a subsidiary on net basis are classified as extraordinary expense or extraordinary income respectively, if they relate to prior periods.
Deferred taxes
Deferred tax assets are not recognized in UBS AG’s (Parent Bank) financial statements under Swiss GAAP. However, deferred tax liabilities may be recognized for taxable temporary differences. The change in the deferred tax liability balance is recognized in profit or loss.
Equity participation and other compensation plans
Equity participation plans
Under Swiss GAAP, employee share and option awards are recognized as compensation expense and accrued over the performance year, which is generally the financial year prior to the grant date. Equity and cash-settled awards are classified as liabilities. The employee share option awards are remeasured to fair value at each balance sheet date. However, for employee share options that UBS intends to settle in shares from conditional capital, no compensation expense is recognized in the income statement as these awards are not a liability of UBS. Upon exercise of employee options, cash received for payment of the strike price is credited againstShare capital and theGeneral statutory reserve.
Other compensation plans
Fixed and variable deferred cash compensation is recognized as compensation expenses over the performance year.
Sundry income from ordinary activities and sundry ordinary expenses
Sundry income from ordinary activities mainly includes income from hard cost and revenue transfers between UBS AG (Parent Bank) and its subsidiaries and income from lower of cost or market accounting of financial investments.Sundry ordinary expensesmainly include costs for hard revenue transfers between UBS AG (Parent Bank) and its subsidiaries and expenses from lower of cost or market accounting of financial investments. Hard transfers of costs and revenues are performed on an arm’s length basis and are settled in cash between UBS AG (Parent Bank) and its subsidiaries.
Dispensations in statutory financial statements
As UBS Group prepares consolidated financial statements in accordance with IFRS, UBS AG (Parent Bank) is dispensed from various disclosures in the statutory financial statements.
Pension and otherpost-employment benefit plans
FINMA Circular 2008/2 “Accounting – banks” permits the use of IAS 19 or Swiss GAAP FER 16 (“FER 16”) for accounting for pension and other post-employment benefit plans. Election of the accounting standard may be done on a plan-by-plan basis. UBS AG (Parent Bank) applies FER 16 for the Swiss pension plan. FER 16 requires recognizing the employer contributions to the pension fund as personnel expenses. The employer contributions to the Swiss pension fund are determined as a percentage of contributory compensation. Under FER 16 it is periodically assessed whether, from the point of view of UBS AG (Parent Bank), an economic benefit or obligation arises from the pension fund which, when conditions are met, is recorded on the balance sheet. The financial statements of the pension fund prepared in accordance with Swiss GAAP FER 26 (“FER 26”) are used for the assessment.
UBS AG (Parent Bank) applies IAS 19 to the non-Swiss defined benefit plans. For Swiss GAAP, remeasurements of the defined benefit obligation and the plan assets are recognized in the income statement rather than equity. Key differences between FER 16/26 and IAS 19 include the treatment of future salary increases, which are not considered under FER 16/26, and the determination of the discount rate.
In 2012, UBS AG (Parent Bank) adopted the revisions to IAS 19 issued by the IASB in June 2011 (“IAS 19R”) for the non-Swiss defined benefit plans and at the same time adopted FER 16 for the Swiss pension plan.
Note 2 Accounting policies (continued)
b) Changes in accounting policies, comparability and other adjustments
Presentation of net defined benefit liabilities
On 31 December 2013, UBS has reclassified liabilities arising from non-Swiss defined benefit plans accounted for under IAS 19 of
CHF 563 million fromAllowances and provisions toOther liabilities and restated comparative 2012 information, following a reassessment of the economic nature of such liabilities.
c) Accounting policies to be adopted in the future
Amendment of accounting standards applicable to banks and securities dealers
The Swiss Code of Obligations’ provisions concerning financial reporting were revised and came into force on 1 January 2013, effective for annual periods beginning on or after 1 January 2015. Following this, the accounting standards applicable to banks and securities dealers are being amended accordingly. On 29 October 2013, the Swiss Federal Department of Finance released
the amended Banking Ordinance, and FINMA released its new circular “Accounting – banks,” both for consultation until 31 December 2013. Final rules are expected to be published during the second quarter of 2014 and are expected to be applicable for annual financial statements as of 31 December 2015 the latest. Under the proposed changes Swiss GAAP will be more closely aligned with IFRS in certain areas such as the fair value option, share-based compensation and treasury shares.
Financial information
UBS AG (Parent Bank)
Additional income statement information
Note 3 Net trading income
| | | | | | | | | | | | |
| | For the year ended | | | % change from | |
| CHF million | | 31.12.13 | | | 31.12.12 | | | 31.12.12 | |
| Investment Bank Corporate Client Solutions | | | 368 | | | | (743 | ) | | | | |
| | | | | | | | | | | | | |
| Investment Bank Investor Client Services | | | 3,566 | | | | 2,652 | | | | 34 | |
| | | | | | | | | | | | | |
| Other business divisions and Corporate Center | | | 275 | | | | 3,189 | | | | (91 | ) |
| | | | | | | | | | | | | |
| Total | | | 4,209 | | | | 5,097 | | | | (17 | ) |
| | | | | | | | | | | | | |
Note 4 Extraordinary income and expenses
| | | | | | | | | | | | |
| | For the year ended | | | % change from | |
| CHF million | | 31.12.13 | | | 31.12.12 | | | 31.12.12 | |
| Gains from disposals of subsidiaries and other participations | | | 76 | | | | 37 | | | | 105 | |
| | | | | | | | | | | | | |
| Reversal of impairments and provisions of subsidiaries and other participations | | | 976 | | | | 161 | | | | 506 | |
| | | | | | | | | | | | | |
| Prior period related income | | | 49 | | | | 115 | | | | (57 | ) |
| | | | | | | | | | | | | |
| Other extraordinary income | | | 275 | | | | 116 | | | | 137 | |
| | | | | | | | | | | | | |
| Release of reinvestment relief provision related to the sale of Pactual | | | 291 | | | | 0 | | | | | |
| | | | | | | | | | | | | |
| Total extraordinary income | | | 1,667 | | | | 429 | | | | 289 | |
| | | | | | | | | | | | | |
| Losses from disposals of subsidiaries and other participations | | | (3 | ) | | | (67 | ) | | | (96 | ) |
| | | | | | | | | | | | | |
| Prior period related expenses | | | (7 | ) | | | (96 | ) | | | (93 | ) |
| | | | | | | | | | | | | |
| Expenses related to changes in pension accounting1 | | | 0 | | | | (3,954 | ) | | | (100 | ) |
| | | | | | | | | | | | | |
| Total extraordinary expenses | | | (9 | ) | | | (4,117 | ) | | | (100 | ) |
| | | | | | | | | | | | | |
1 Of the CHF 3,954 million for 2012, CHF 3,063 million related to the Swiss pension plan and CHF 892 million to non-Swiss pension plans. Refer to “Note 2 Accounting policies” for more information.
Additional balance sheet information
Note 5 Other assets and liabilities
| | | | | | | | | | | | |
| CHF million | | 31.12.13 | | | 31.12.12 | | | % change from
31.12.12 | |
| Other assets | | | | | | | | | | | | |
| | | | | | | | | | | | | |
| Receivables from subsidiaries | | | 1,412 | | | | 1,784 | | | | (21 | ) |
| | | | | | | | | | | | | |
| Settlement and clearing accounts | | | 394 | | | | 470 | | | | (16 | ) |
| | | | | | | | | | | | | |
| VAT and other tax receivables | | | 313 | | | | 178 | | | | 76 | |
| | | | | | | | | | | | | |
| Other receivables | | | 449 | | | | 606 | | | | (26 | ) |
| | | | | | | | | | | | | |
| Total other assets | | | 2,568 | | | | 3,037 | | | | (15 | ) |
| | | | | | | | | | | | | |
| | | |
| Other liabilities | | | | | | | | | | | | |
| | | | | | | | | | | | | |
| CHF million | | 31.12.13 | | | 31.12.12 | | | % change from
31.12.12 | |
| Deferral position for hedging instruments | | | 2,690 | | | | 5,453 | | | | (51 | ) |
| | | | | | | | | | | | | |
| Payables to subsidiaries | | | 728 | | | | 770 | | | | (5 | ) |
| | | | | | | | | | | | | |
| Settlement and clearing accounts | | | 655 | | | | 757 | | | | (13 | ) |
| | | | | | | | | | | | | |
| Net defined benefit liabilities1 | | | 563 | | | | 510 | | | | 10 | |
| | | | | | | | | | | | | |
| VAT and other tax payables | | | 387 | | | | 451 | | | | (14 | ) |
| | | | | | | | | | | | | |
| Other payables | | | 1,006 | | | | 2,222 | | | | (55 | ) |
| | | | | | | | | | | | | |
| Total other liabilities | | | 6,029 | | | | 10,163 | | | | (41 | ) |
| | | | | | | | | | | | | |
1 In 2013, liabilities arising from non-Swiss defined benefit plans accounted for in accordance with IAS 19 were reclassified from Allowances and provisions to Other liabilities. Prior periods have been restated for this change in presentation. As a result, Other liabilities as of 31 December 2012 increased by CHF 510 million. Refer to “Note 2b Changes in accounting policies, comparability and other adjustments” for more information.
Note 6 Pledged assets
| | | | | | | | | | | | | | | | | | | | | | | | | | | | | | |
| | | | | 31.12.13 | | | | | 31.12.12 | | | | | Change in % | |
| CHF million | | | | Carrying
value of
pledged
assets | | | Associated
liability
recognized
on the
balance
sheet | | | | | Carrying
value of
pledged
assets | | | Associated
liability
recognized
on the
balance
sheet | | | | | Carrying
value of
pledged
assets | | | Associated
liability
recognized
on the
balance
sheet | |
| Money market paper | | | | | 496 | | | | 405 | | | | | | 1,880 | | | | 1,226 | | | | | | (70 | ) | | | (67 | ) |
| | | | | | | | | | | | | | | | | | | | | | | | | | | | | | | |
| Mortgage loans1 | | | | | 33,632 | | | | 22,634 | | | | | | 33,928 | | | | 21,902 | | | | | | (1 | ) | | | 3 | |
| | | | | | | | | | | | | | | | | | | | | | | | | | | | | | | |
| Securities | | | | | 45,071 | | | | 15,849 | | | | | | 49,316 | | | | 26,889 | | | | | | (9 | ) | | | (41 | ) |
| | | | | | | | | | | | | | | | | | | | | | | | | | | | | | | |
| Pledges of precious metals to subsidiaries | | | | | 4,144 | | | | 0 | | | | | | 4,163 | | | | 0 | | | | | | 0 | | | | | |
| | | | | | | | | | | | | | | | | | | | | | | | | | | | | | | |
| Total2 | | | | | 83,343 | | | | 38,888 | | | | | | 89,287 | | | | 50,017 | | | | | | (7 | ) | | | (22 | ) |
| | | | | | | | | | | | | | | | | | | | | | | | | | | | | | | |
1 These pledged mortgage loans serve as collateral for existing liabilities against Swiss central mortgage institutions and for existing covered bond issuances. Of these pledged mortgage loans, approximately CHF 5.8 billion for 31 December 2013 (31 December 2012: approximately CHF 7.5 billion) could be withdrawn or used for future liabilities or covered bond issuances without breaching existing collateral requirements. 2 Does not include assets placed with central banks related to undrawn credit lines and for payment, clearing and settlement purposes totaling CHF 3.3 billion as of 31 December 2013 (31 December 2012: CHF 3.5 billion).
UBS AG (Parent Bank) pledges assets mainly in securities lending transactions, in repurchase transactions, against loans from Swiss mortgage institutions, in connection with derivative transactions,
as security deposits for stock exchanges and clearing house memberships, and in connection with the issuance of covered bonds.
Financial information
UBS AG (Parent Bank)
Note 7 Swiss pension plan and non-Swiss defined benefit plans
a) Liabilities due to Swiss pension plan and non-Swiss defined benefit plans
| | | | | | | | |
| CHF million | | 31.12.13 | | | 31.12.12 | |
| Provision for Swiss pension plan | | | 0 | | | | 0 | |
| | | | | | | | | |
| Net defined benefit liabilities for non-Swiss defined benefit plans | | | 563 | | | | 510 | |
| | | | | | | | | |
| Total provision for Swiss pension plan and net defined benefit liabilities for non-Swiss defined benefit plans | | | 563 | | | | 510 | |
| | | | | | | | | |
| Bank accounts at UBS and UBS debt instruments held by Swiss pension fund | | | 119 | | | | 611 | |
| | | | | | | | | |
| UBS derivative financial instruments held by Swiss pension fund | | | 295 | | | | 98 | |
| | | | | | | | | |
| Total liabilities due to Swiss pension plan and non-Swiss defined benefit plans | | | 977 | | | | 1,219 | |
| | | | | | | | | |
b) Swiss pension plan1
| | | | | | | | |
| | As of or for the year ended | |
| CHF million | | 31.12.13 | | | 31.12.12 | |
| Pension plan surplus | | | 4,772 | | | | 4,115 | |
| | | | | | | | | |
| Economical benefit/(obligation) for UBS AG | | | 0 | | | | 0 | |
| | | | | | | | | |
| Change in economical benefit/obligation recognized in the income statement | | | 0 | | | | 0 | |
| | | | | | | | | |
| Employer contributions for the period recognized in the income statement under FER 16 | | | 468 | | | | 108 | |
| | | | | | | | | |
| Performance rewards related employer contributions accrued | | | 49 | | | | 14 | |
| | | | | | | | | |
| Total pension expense recognized in the income statement within Personnel expenses under FER 16 | | | 517 | | | | 121 | 2 |
| | | | | | | | | |
| Pension cost recognized in the income statement under IAS 19 | | | 0 | | | | (128 | ) |
| | | | | | | | | |
of which: current service cost | | | 0 | | | | 357 | |
| | | | | | | | | |
of which: past service cost related to plan amendment | | | 0 | | | | (485 | ) |
| | | | | | | | | |
| Total pension expense recognized in the income statement within Personnel expenses under IAS 19 | | | 0 | | | | (128 | )2 |
| | | | | | | | | |
| Total pension expense recognized in the income statement within Personnel expenses | | | 517 | | | | (6 | )3 |
| | | | | | | | | |
1 The pension plan surplus is determined in accordance with FER 26 and consists of the reserve for the fluctuation in asset value. The surplus did not represent an economical benefit for UBS AG in accordance with FER 16 as of 31 December 2013 or 31 December 2012. 2 The Swiss pension plan was accounted for in accordance with IAS 19 until 30 September 2012 and in accordance with FER 16 since 1 October 2012. 3 In addition, in 2012 extraordinary expenses of CHF 3,063 million were recognized related to changes in accounting for the Swiss pension plan. These extraordinary expenses included the reversal of the credit of CHF 485 million shown on the line Past service cost related to a plan amendment.
The Swiss pension plan had no employer contribution reserve in 2013 or 2012. Details on the Swiss pension plan and non-Swiss defined benefit plans can be found in “Note 28 Pension and other post-employment benefit plans” to the consolidated financial statements.
Note 8 Allowances and provisions1
| | | | | | | | | | | | | | | | | | | | | | | | |
| CHF million | | Balance at
31.12.12 | | | Provisions applied
in accordance
with their
specified purpose | | | Recoveries,
doubtful interest
and currency
translation
differences | | | Provisions released
to income | | | New provisions
charged to income | | | Balance at
31.12.13 | |
| Default risks | | | 754 | | | | (86 | ) | | | 9 | | | | (240 | ) | | | 310 | | | | 747 | |
| | | | | | | | | | | | | | | | | | | | | | | | | |
of which: specific allowances for due from customers and mortgage loans | | | 573 | | | | (85 | ) | | | 2 | | | | (127 | ) | | | 244 | | | | 606 | |
| | | | | | | | | | | | | | | | | | | | | | | | | |
of which: specific allowances for due from banks | | | 22 | | | | (1 | ) | | | 6 | | | | (11 | ) | | | 0 | | | | 15 | |
| | | | | | | | | | | | | | | | | | | | | | | | | |
of which: collective loan loss allowances2 | | | 113 | | | | | | | | | | | | (95 | ) | | | 1 | | | | 18 | |
| | | | | | | | | | | | | | | | | | | | | | | | | |
of which: provisions for loan commitments and guarantees | | | 47 | | | | | | | | 1 | | | | (6 | ) | | | 5 | | | | 46 | |
| | | | | | | | | | | | | | | | | | | | | | | | | |
of which: other allowances | | | | | | | | | | | | | | | | | | | 61 | | | | 61 | |
| | | | | | | | | | | | | | | | | | | | | | | | | |
| Operational risks | | | 23 | | | | (14 | ) | | | (1 | ) | | | (5 | ) | | | 17 | | | | 21 | |
| | | | | | | | | | | | | | | | | | | | | | | | | |
| Litigation risks3 | | | 501 | | | | (92 | ) | | | (13 | ) | | | (53 | ) | | | 383 | | | | 726 | |
| | | | | | | | | | | | | | | | | | | | | | | | | |
| Restructuring4 | | | 1,612 | | | | (449 | ) | | | 42 | | | | (184 | ) | | | 434 | | | | 1,455 | |
| | | | | | | | | | | | | | | | | | | | | | | | | |
| Real estate5 | | | 88 | | | | (20 | ) | | | 13 | | | | (4 | ) | | | 8 | | | | 84 | |
| | | | | | | | | | | | | | | | | | | | | | | | | |
| Employee benefits | | | 235 | | | | (21 | ) | | | (2 | ) | | | (23 | ) | | | 26 | | | | 215 | |
| | | | | | | | | | | | | | | | | | | | | | | | | |
| Provisions related to parental support provided by UBS AG (Parent Bank) to subsidiaries in the form of indemnities, letter of support, letters of undertaking and similar agreements | | | 84 | | | | | | | | | | | | | | | | 0 | | | | 85 | |
| | | | | | | | | | | | | | | | | | | | | | | | | |
| Deferred taxes | | | | | | | | | | | | | | | | | | | 3 | | | | 3 | |
| | | | | | | | | | | | | | | | | | | | | | | | | |
| Other provisions | | | 334 | | | | (3 | ) | | | 0 | | | | (293 | )6 | | | 131 | 7 | | | 169 | |
| | | | | | | | | | | | | | | | | | | | | | | | | |
| Total allowances and provisions | | | 3,633 | | | | (685 | ) | | | 48 | | | | (802 | ) | | | 1,312 | | | | 3,505 | |
| | | | | | | | | | | | | | | | | | | | | | | | | |
| Allowances deducted from assets | | | 707 | | | | | | | | | | | | | | | | | | | | 701 | |
| | | | | | | | | | | | | | | | | | | | | | | | | |
| Total allowances and provisions as per balance sheet | | | 2,925 | | | | | | | | | | | | | | | | | | | | 2,805 | |
| | | | | | | | | | | | | | | | | | | | | | | | | |
1 In 2013, liabilities arising from non-Swiss defined benefit plans accounted for in accordance with IAS 19 were reclassified from Allowances and provisions to Other liabilities. Prior periods have been restated for this change in presentation. As a result, Allowances and provisions as of 31 December 2012 decreased by CHF 510 million. Refer to “Note 2b Changes in accounting policies, comparability and other adjustments” for more information. 2 Mainly relates to due from customers. 3 Includes provisions for litigation resulting from security risks. 4 Refer to “Note 38 Swiss GAAP requirements” in the consolidated financial statements for more information with regard to differences between IFRS and Swiss GAAP with respect to timing of recognizing restructuring provisions. 5 Includes provisions for onerous lease contracts of CHF 16 million as of 31 December 2013 (31 December 2012: CHF 22 million) and reinstatement cost provisions for leasehold improvements of CHF 68 million as of 31 December 2013 (31 December 2012: CHF 66 million). 6 Mainly due to the release of the reinvestment relief provision related to the sale of UBS Pactual in 2009. 7 Mainly related to the Swiss-UK tax agreement.
Financial information
UBS AG (Parent Bank)
Note 9 Statement of shareholders’ equity
| | | | | | | | | | | | | | | | | | | | | | | | |
| CHF million | | Share
capital | | | General
statutory
reserve | | | Reserve
for own
shares | | | Other
reserves | | | Net profit/(loss)
for the period | | | Total shareholders’
equity (before
distribution of capital
contribution reserve) | |
| Balance as of 31 December 2011 and 1 January 2012 | | | 383 | | | | 32,350 | | | | 1,066 | | | | 934 | | | | 5,440 | | | | 40,174 | |
| | | | | | | | | | | | | | | | | | | | | | | | | |
| Capital increase | | | 0 | | | | 26 | | | | | | | | | | | | | | | | 26 | |
| | | | | | | | | | | | | | | | | | | | | | | | | |
| Net profit/(loss) appropriation | | | | | | | | | | | | | | | 5,440 | | | | (5,440 | ) | | | 0 | |
| | | | | | | | | | | | | | | | | | | | | | | | | |
| Prior year dividend | | | | | | | (379 | ) | | | | | | | | | | | | | | | (379 | ) |
| | | | | | | | | | | | | | | | | | | | | | | | | |
| Net profit/(loss) for the period | | | | | | | | | | | | | | | | | | | (6,645 | ) | | | (6,645 | ) |
| | | | | | | | | | | | | | | | | | | | | | | | | |
| Changes in reserve for own shares | | | | | | | | | | | (176 | ) | | | 176 | | | | | | | | 0 | |
| | | | | | | | | | | | | | | | | | | | | | | | | |
| Balance as of 31 December 2012 and 1 January 2013 | | | 384 | | | | 31,997 | | | | 889 | | | | 6,551 | | | | (6,645 | ) | | | 33,176 | |
| | | | | | | | | | | | | | | | | | | | | | | | | |
| Capital increase | | | 1 | | | | 71 | | | | | | | | | | | | | | | | 72 | |
| | | | | | | | | | | | | | | | | | | | | | | | | |
| Net profit/(loss) appropriation | | | | | | | (4,894 | ) | | | | | | | (1,751 | ) | | | 6,645 | | | | 0 | |
| | | | | | | | | | | | | | | | | | | | | | | | | |
| Prior year dividend | | | | | | | (564 | ) | | | | | | | | | | | | | | | (564 | ) |
| | | | | | | | | | | | | | | | | | | | | | | | | |
| Net profit/(loss) for the period | | | | | | | | | | | | | | | | | | | 2,753 | | | | 2,753 | |
| | | | | | | | | | | | | | | | | | | | | | | | | |
| Changes in reserve for own shares | | | | | | | | | | | 131 | | | | (131 | ) | | | | | | | 0 | |
| | | | | | | | | | | | | | | | | | | | | | | | | |
| Balance as of 31 December 2013 | | | 384 | | | | 26,611 | | | | 1,020 | | | | 4,669 | | | | 2,753 | | | | 35,437 | |
| | | | | | | | | | | | | | | | | | | | | | | | | |
Note 10 Share capital and significant shareholders
| | | | | | | | | | | | | | | | |
| | | Par value | | | Dividend bearing | |
| | | No. of shares | | | Capital in
CHF | | | No. of shares | | | Capital in
CHF | |
| Balance as of 31 December 2013 | | | | | | | | | | | | | | | | |
| | | | | | | | | | | | | | | | | |
| Issued | | | 3,842,002,069 | | | | 384,200,207 | | | | 3,768,225,119 | | | | 376,822,512 | |
| | | | | | | | | | | | | | | | | |
of which: shares outstanding | | | 3,768,201,817 | | | | 376,820,182 | | | | 3,768,201,817 | | | | 376,820,182 | |
| | | | | | | | | | | | | | | | | |
of which: treasury shares held by UBS AG (Parent Bank)1 | | | 73,776,950 | | | | 7,377,695 | | | | | | | | | |
| | | | | | | | | | | | | | | | | |
of which: treasury shares held by subsidiaries of UBS AG (Parent Bank)1 | | | 23,302 | | | | 2,330 | | | | 23,302 | | | | 2,330 | |
| | | | | | | | | | | | | | | | | |
| Conditional share capital | | | 518,759,156 | | | | 51,875,916 | | | | | | | | | |
| | | | | | | | | | | | | | | | | |
| Balance as of 31 December 2012 | | | | | | | | | | | | | | | | |
| | | | | | | | | | | | | | | | | |
| Issued | | | 3,835,250,233 | | | | 383,525,023 | | | | 3,747,463,874 | | | | 374,746,387 | |
| | | | | | | | | | | | | | | | | |
of which: shares outstanding | | | 3,747,370,632 | | | | 374,737,063 | | | | 3,747,370,632 | | | | 374,737,063 | |
| | | | | | | | | | | | | | | | | |
of which: treasury shares held by UBS AG (Parent Bank)1 | | | 87,786,359 | | | | 8,778,636 | | | | | | | | | |
| | | | | | | | | | | | | | | | | |
of which: treasury shares held by subsidiaries of UBS AG (Parent Bank)1 | | | 93,242 | | | | 9,324 | | | | 93,242 | | | | 9,324 | |
| | | | | | | | | | | | | | | | | |
| Conditional share capital | | | 625,510,992 | | | | 62,551,099 | | | | | | | | | |
| | | | | | | | | | | | | | | | | |
1 During 2013, 55.3 million treasury shares were acquired at market prices (2012: 114.3 million) and 69.4 million treasury shares were disposed of (2012: 111.4 million), mainly related to the delivery of shares under employee share based compensation plans.
Conditional share capital
As of 31 December 2013, 138,759,156 additional shares (31 December 2012: 145,510,992 shares) could have been issued to fund UBS’s employee share option programs.
On 14 April 2010, the Annual General Meeting of UBS AG shareholders approved the creation of conditional capital to a maximum number of 380,000,000 shares for conversion rights/warrants granted in connection with the issuance of bonds or similar financial instruments.
In 2013, the conditional capital of up to 100,000,000 shares, which was available in connection with an arrangement with the Swiss National Bank (SNB), was removed. The SNB provided a loan to the SNB StabFund, to which UBS transferred certain illiquid securities and other positions in 2008 and 2009. As part of this arrangement, UBS granted warrants on shares to the SNB, which would have been exercisable if the SNB had incurred a loss on the loan. In 2013, the loan was paid back in full, the warrants were terminated and the relevant conditional capital was removed.
Significant shareholders
According to disclosure notifications filed with UBS AG and the SIX under the Swiss Stock Exchange Act, on 18 September 2013, Government of Singapore Investment Corp., Singapore, disclosed the change of its corporate name to GIC Private Limited, effective from 22 July 2013, with a holding of 6.40% of the total share capital of UBS AG. The beneficial owner of this holding is the Government of Singapore. On 30 September 2011, Norges Bank, Oslo, the Central Bank of Norway, disclosed a holding of 3.04%. On 17 December 2009, BlackRock Inc., New York, disclosed a holding of 3.45%. In accordance with the Swiss Stock Exchange Act, the percentages indicated above were calculated in relation to the total UBS share capital reflected in the Articles
of Association at the time of the respective disclosure notification. Information on disclosures under the Swiss Stock Exchange Act can be found on the following website of the SIX:http://www.six-exchange-regulation.com/obligations/disclosure/major_ shareholders_en.html.
According to our share register, the shareholders (acting in their own name or in their capacity as nominees for other investors or beneficial owners) listed in the table below were registered with 3% or more of the total share capital as of 31 December 2013 and 2012.
| | è | | Refer to the “Corporate governance” section of this report for more information on significant shareholders and shareholders’ participation rights |
| | | | | | | | | | | | | | | | | | | | | | | | |
Shareholders registered in the UBS shares register with 3% or more of the total share capital as of 31 December 2013 and 2012 | |
| | | | | | 31.12.13 | | | | | | | | | 31.12.12 | | | | |
| | | Quantity | | | Total nominal
value CHF million | | | Share % | | | Quantity | | | Total nominal
value CHF million | | | Share % | |
| Chase Nominees Ltd., London | | | 450,540,638 | | | | 45 | | | | 11.73 | | | | 457,784,081 | | | | 46 | | | | 11.94 | |
| | | | | | | | | | | | | | | | | | | | | | | | | |
| GIC Private Limited, Singapore | | | 245,517,417 | | | | 25 | | | | 6.39 | | | | 245,517,417 | | | | 25 | | | | 6.40 | |
| | | | | | | | | | | | | | | | | | | | | | | | | |
| DTC (Cede & Co.), New York1 | | | 226,191,092 | | | | 23 | | | | 5.89 | | | | 202,368,918 | | | | 20 | | | | 5.28 | |
| | | | | | | | | | | | | | | | | | | | | | | | | |
| Nortrust Nominees Ltd, London | | | 143,960,557 | | | | 14 | | | | 3.75 | | | | 147,144,758 | | | | 15 | | | | 3.84 | |
| | | | | | | | | | | | | | | | | | | | | | | | | |
1 DTC (Cede & Co.), New York, “The Depository Trust Company,” is a US securities clearing organization.
Note 11 Transactions with related parties
Transactions with related parties (such as securities transactions, payment transfer services, borrowing and compensation for deposits) are conducted at internally agreed transfer prices or at arm’s length, or with respect to loans, fixed advances and mortgages to non-independent members of the Board of Directors and Group Executive Board members on the same terms and conditions that are available to other employees. Refer to the “Compensation of the members of the Board of Directors and the Group Executive Board” section of this report for information on loans granted to Group Executive Board and Board of Directors members. Amounts due from/to subsidiaries are disclosed on the balance sheet.
Financial information
UBS AG (Parent Bank)
Off-balance sheet and other information
Note 12 Commitments and contingent liabilities
| | | | | | | | | | | | |
| CHF million | | 31.12.13 | | | 31.12.12 | | | % change from
31.12.12 | |
| Contingent liabilities | | | 61,016 | | | | 115,254 | | | | (47 | ) |
| | | | | | | | | | | | | |
of which: Guarantees to third parties related to subsidiaries | | | 44,446 | | | | 97,335 | | | | (54 | ) |
| | | | | | | | | | | | | |
of which: credit guarantees and similar instruments | | | 7,816 | | | | 7,676 | | | | 2 | |
| | | | | | | | | | | | | |
of which: performance guarantees and similar instruments | | | 2,719 | | | | 2,847 | | | | (4 | ) |
| | | | | | | | | | | | | |
of which: documentary credits | | | 6,035 | | | | 7,397 | | | | (18 | ) |
| | | | | | | | | | | | | |
| Irrevocable commitments | | | 58,712 | | | | 68,420 | | | | (14 | ) |
| | | | | | | | | | | | | |
of which: loan commitments | | | 57,817 | | | | 67,448 | | | | (14 | ) |
| | | | | | | | | | | | | |
of which: payment commitment related to deposit insurance | | | 893 | | | | 972 | | | | (8 | ) |
| | | | | | | | | | | | | |
| Forward starting transactions1 | | | 18,970 | | | | 33,510 | | | | (43 | ) |
| | | | | | | | | | | | | |
of which: reverse repurchase agreements | | | 10,452 | | | | 22,321 | | | | (53 | ) |
| | | | | | | | | | | | | |
of which: securities borrowing agreements | | | 46 | | | | 249 | | | | (82 | ) |
| | | | | | | | | | | | | |
of which: repurchase agreements | | | 8,471 | | | | 10,940 | | | | (23 | ) |
| | | | | | | | | | | | | |
| Liabilities for calls on shares and other equities | | | 47 | | | | 63 | | | | (25 | ) |
| | | | | | | | | | | | | |
1 Cash to be paid in the future by either UBS or the counterparty.
The table above includes indemnities and guarantees issued by UBS AG (Parent Bank) for the benefit of subsidiaries and creditors of subsidiaries.
UBS AG has issued a guarantee for the benefit of each counterparty of UBS Limited. Under this guarantee, UBS AG irrevocably and unconditionally guarantees each and every obligation that UBS Limited entered into. UBS AG promises to pay to that counterparty on demand any unpaid balance of such liabilities under the terms of the guarantee. In instances in which the indemnity
amount issued by UBS AG (Parent Bank) is not specifically defined, the indemnity relates to the solvency or minimum capitalization of a subsidiary, and therefore no amount is included in the table above.
In addition, UBS AG (Parent Bank) is jointly and severally liable for the value added tax (VAT) liability of Swiss subsidiaries that belong to its VAT group. This contingent liability is not included in the table above.
Note 13 Derivative instruments1
| | | | | | | | | | | | | | | | | | | | | | | | |
| | | | | | 31.12.13 | | | | | | | | | 31.12.12 | | | | |
| CHF million, except where indicated | | PRV2 | | | NRV3 | | | Notional
values
(CHF billion)4 | | | PRV2 | | | NRV3 | | | Notional
values
(CHF billion)4 | |
| Interest rate contracts5 | | | 115,763 | | | | 112,033 | | | | 23,298 | | | | 236,793 | | | | 231,574 | | | | 28,093 | |
| | | | | | | | | | | | | | | | | | | | | | | | | |
| Credit derivative contracts | | | 16,665 | | | | 16,634 | | | | 1,290 | | | | 31,935 | | | | 33,152 | | | | 2,400 | |
| | | | | | | | | | | | | | | | | | | | | | | | | |
| Foreign exchange contracts5 | | | 69,224 | | | | 75,989 | | | | 6,082 | | | | 85,582 | | | | 95,872 | | | | 6,725 | |
| | | | | | | | | | | | | | | | | | | | | | | | | |
| Precious metal contracts5 | | | 1,982 | | | | 2,001 | | | | 49 | | | | 1,789 | | | | 2,118 | | | | 79 | |
| | | | | | | | | | | | | | | | | | | | | | | | | |
| Equity/Index contracts | | | 14,209 | | | | 19,400 | | | | 552 | | | | 13,397 | | | | 15,018 | | | | 505 | |
| | | | | | | | | | | | | | | | | | | | | | | | | |
| Commodities contracts, excluding precious metal contracts | | | 305 | | | | 421 | | | | 38 | | | | 797 | | | | 852 | | | | 86 | |
| | | | | | | | | | | | | | | | | | | | | | | | | |
| Total before netting6 | | | 218,148 | | | | 226,478 | | | | 31,310 | | | | 370,293 | | | | 378,606 | | | | 37,888 | |
| | | | | | | | | | | | | | | | | | | | | | | | | |
| Replacement value netting | | | 189,063 | | | | 189,063 | | | | | | | | 335,087 | | | | 335,087 | | | | | |
| | | | | | | | | | | | | | | | | | | | | | | | | |
| Total after netting | | | 29,085 | | | | 37,415 | | | | | | | | 35,206 | | | | 43,518 | | | | | |
| | | | | | | | | | | | | | | | | | | | | | | | | |
1 Bifurcated embedded derivatives are presented in the same balance sheet line as the host contract and are excluded from this table 2 PRV: Positive replacement value. 3 NRV: Negative replacement value. 4 Represents the sum of notional values related to PRV and NRV and other notional values. 5 In 2013, the classification of certain PRV and NRV, between interest contracts and foreign exchange contracts, was corrected for 31 December 2012. As a result, interest rate contracts PRV were reduced by CHF 1,774 million and interest rate contracts NRV were reduced by CHF 2,422 million (associated notional amount: reduced by CHF 35 billion) with corresponding increases made to foreign exchange contracts. In addition, a correction was made to 31 December 2012 notional values for precious metal contracts. Respective notional values were reduced by CHF 30 billion. 6 Replacement values are presented net of cash collateral, where applicable.
Note 14 Fiduciary transactions
| | | | | | | | | | | | |
| CHF million | | 31.12.13 | | | 31.12.12 | | | % change from
31.12.12 | |
| Deposits: | | | | | | | | | | | | |
| | | | | | | | | | | | | |
| with third-party banks | | | 5,153 | | | | 6,175 | | | | (17 | ) |
| | | | | | | | | | | | | |
| with subsidiaries | | | 1,725 | | | | 2,261 | | | | (24 | ) |
| | | | | | | | | | | | | |
| Total | | | 6,879 | | | | 8,436 | | | | (18 | ) |
| | | | | | | | | | | | | |
Fiduciary transactions encompass transactions entered into or granted by UBS that result in holding or placing assets on behalf of individuals, trusts, defined benefit plans and other institutions. Unless the recognition criteria for the assets are satisfied, these assets and the related income are excluded from UBS AG’s (Parent Bank) balance sheet and income statement, but disclosed in
this Note as off-balance sheet fiduciary transactions. Client deposits which are initially placed as fiduciary transactions with UBS AG (Parent Bank) may be recognized on UBS AG’s (Parent Bank) balance sheet in situations in which the deposit is subsequently placed within UBS AG (Parent Bank). In such cases, these deposits are not reported in the table above.
Financial information
UBS AG (Parent Bank)
Compensation of the members of the Board of Directors and the Group Executive Board
| | | | | | | | | | | | | | | | | | | | | | | | | | | | | | | | |
| Total compensation for GEB members for the performance years 2013 and 2012 | |
| CHF, except where indicated1 | |
| Name, function | | For the year | | | Base salary | | | Immediate
cash2 | | | Annual
performance
award under
EOP3 | | | Annual
performance
award under
DCCP4 | | | Benefits5 | | | Contributions
to retirement
benefit
plans6 | | | Total | |
| Sergio P. Ermotti, Group CEO | | | 2013 | | | | 2,500,000 | | | | 1,000,000 | | | | 4,530,000 | | | | 2,370,000 | | | | 127,300 | | | | 202,822 | | | | 10,730,122 | |
| | | | | | | | | | | | | | | | | | | | | | | | | | | | | | | | | |
| Sergio P. Ermotti, Group CEO (highest-paid) | | | 2012 | | | | 2,500,000 | | | | 0 | | | | 3,660,000 | | | | 2,440,000 | | | | 69,500 | | | | 201,088 | | | | 8,870,588 | |
| | | | | | | | | | | | | | | | | | | | | | | | | | | | | | | | | |
| Andrea Orcel (highest-paid) | | | 2013 | | | | 1,500,000 | | | | 1,000,000 | | | | 5,300,000 | | | | 2,700,000 | | | | 727,048 | | | | 202,822 | | | | 11,429,870 | |
| | | | | | | | | | | | | | | | | | | | | | | | | | | | | | | | | |
| Aggregate of all GEB members who were in office at | | | 2013 | | | | 16,873,360 | | | | 9,949,062 | | | | 33,894,646 | | | | 18,790,161 | | | | 1,548,784 | | | | 1,347,784 | | | | 82,403,796 | |
| | | | | | | | | | | | | | | | | | | | | | | | | | | | | | | | |
| the end of the year7 | | | 2012 | | | | 16,273,460 | | | | 0 | | | | 31,355,592 | | | | 20,903,728 | | | | 640,683 | | | | 1,233,719 | | | | 70,407,181 | |
| | | | | | | | | | | | | | | | | | | | | | | | | | | | | | | | | |
| Aggregate of all GEB members who stepped down | | | 2013 | | | | 0 | | | | 0 | | | | 0 | | | | 0 | | | | 0 | | | | 0 | | | | 0 | |
| | | | | | | | | | | | | | | | | | | | | | | | | | | | | | | | |
| during the year8 | | | 2012 | | | | 1,593,288 | | | | 0 | | | | 0 | | | | 0 | | | | 105,865 | | | | 14,799 | | | | 1,713,952 | |
| | | | | | | | | | | | | | | | | | | | | | | | | | | | | | | | | |
1 Local currencies are converted into CHF using the exchange rates as detailed in “Note 36 Currency translation rates” in the “Financial information” section of our Annual Report 2013. 2 For the performance year 2013, 20% was paid out in immediate cash, subject to a cash cap of CHF/USD 1 million. Due to applicable UK Prudential Regulation Authority regulations, the immediate cash includes blocked shares for Andrea Orcel. For the performance year 2012, no immediate cash was paid. 3 For EOP awards for the performance years 2013 and 2012, the number of shares allocated at grant has been determined by dividing the amount communicated by CHF 18.60 and USD 20.88 (for notional shares) for 2013, and by CHF 15.014 and USD 15.868 (for actual shares) and by CHF 13.97 and USD 14.77 (for notional shares) for 2012, based on the average price of UBS shares over the ten trading days prior to and including the grant date (28 February 2014 and 15 March 2013 respectively). For notional shares granted under EOP 2012 the number of notional shares has been adjusted for the estimated value of dividends paid on UBS shares over the vesting period. 4 DCCP awards vest after the five-year vesting period. The amount reflects the amount of the notional bond excluding future notional interest. For DCCP awards for the performance year 2013, the notional interest rate is set at 5.125% for awards denominated in USD and 3.500% for awards denominated in CHF. For DCCP awards for the performance year 2012, the notional interest rate is set at 6.25% for awards denominated in USD and 5.40% for awards denominated in CHF. 5 Benefits are all valued at market price. 6 This figure excludes the mandatory employer’s social security contributions, but includes the portion related to the employer’s contribution to the statutory pension scheme. The employee contribution is included in the base salary and annual incentive award components. 7 11 GEB members were in office on 31 December 2013 and on 31 December 2012 respectively. 8 2012 includes three months in office as a GEB member for Alexander Wilmot-Sitwell and 10 months in office as a GEB member for Carsten Kengeter. | |
| | | | | | | | | | | | | | | | | | | | | | | | | | | | |
| Share and option ownership/entitlements of GEB members on 31 December 2013/20121 | |
| Name, function | | on
31 December | | | Number of
unvested
shares/
at risk2 | | | Number of vested shares | | | Total number of shares | | | Potentially
conferred voting
rights in % | | | Number of
options3 | | | Potentially
conferred voting
rights in %4 | |
| Sergio P. Ermotti, | | | 2013 | | | | 453,460 | | | | 69,900 | | | | 523,360 | | | | 0.025 | | | | 0 | | | | 0.000 | |
| Group Chief Executive Officer | | | 2012 | | | | 220,928 | | | | 41,960 | | | | 262,888 | | | | 0.013 | | | | 0 | | | | 0.000 | |
| | | | | | | | | | | | | | | | | | | | | | | | | | | | | |
| Markus U. Diethelm, | | | 2013 | | | | 542,417 | | | | 108,007 | | | | 650,424 | | | | 0.032 | | | | 0 | | | | 0.000 | |
| Group General Counsel | | | 2012 | | | | 506,132 | | | | 126,098 | | | | 632,230 | | | | 0.030 | | | | 0 | | | | 0.000 | |
| | | | | | | | | | | | | | | | | | | | | | | | | | | | | |
| John A. Fraser, | | | 2013 | | | | 645,324 | | | | 268,945 | | | | 914,269 | | | | 0.044 | | | | 756,647 | | | | 0.037 | |
| Chairman and CEO Global Asset Management | | | 2012 | | | | 617,529 | | | | 315,270 | | | | 932,799 | | | | 0.045 | | | | 884,531 | | | | 0.042 | |
| | | | | | | | | | | | | | | | | | | | | | | | | | | | | |
| Lukas Gähwiler, | | | 2013 | | | | 504,800 | | | | 22,727 | | | | 527,527 | | | | 0.026 | | | | 0 | | | | 0.000 | |
| CEO UBS Switzerland and CEO Retail & Corporate | | | 2012 | | | | 412,199 | | | | 95,537 | | | | 507,736 | | | | 0.024 | | | | 0 | | | | 0.000 | |
| | | | | | | | | | | | | | | | | | | | | | | | | | | | | |
| Ulrich Körner, | | | 2013 | | | | 688,923 | | | | 208,887 | | | | 897,810 | | | | 0.044 | | | | 0 | | | | 0.000 | |
| Group Chief Operating Officer and CEO UBS Group EMEA | | | 2012 | | | | 605,284 | | | | 121,837 | | | | 727,121 | | | | 0.035 | | | | 0 | | | | 0.000 | |
| | | | | | | | | | | | | | | | | | | | | | | | | | | | | |
| Philip J. Lofts, | | | 2013 | | | | 601,553 | | | | 157,447 | | | | 759,000 | | | | 0.037 | | | | 500,741 | | | | 0.024 | |
| Group Chief Risk Officer | | | 2012 | | | | 542,402 | | | | 169,789 | | | | 712,191 | | | | 0.034 | | | | 536,173 | | | | 0.026 | |
| | | | | | | | | | | | | | | | | | | | | | | | | | | | | |
| Robert J. McCann, | | | 2013 | | | | 892,872 | | | | 65,971 | | | | 958,843 | | | | 0.046 | | | | 0 | | | | 0.000 | |
| CEO Wealth Management Americas and CEO UBS Group Americas | | | 2012 | | | | 658,470 | | | | 18,112 | | | | 676,582 | | | | 0.032 | | | | 0 | | | | 0.000 | |
| | | | | | | | | | | | | | | | | | | | | | | | | | | | | |
| Tom Naratil, | | | 2013 | | | | 422,516 | | | | 263,027 | | | | 685,543 | | | | 0.033 | | | | 867,087 | | | | 0.042 | |
| Group Chief Financial Officer | | | 2012 | | | | 340,757 | | | | 233,603 | | | | 574,360 | | | | 0.027 | | | | 935,291 | | | | 0.045 | |
| | | | | | | | | | | | | | | | | | | | | | | | | | | | | |
| Andrea Orcel, | | | 2013 | | | | 1,209,775 | | | | 0 | | | | 1,209,775 | | | | 0.059 | | | | 0 | | | | 0.000 | |
| CEO Investment Bank | | | 2012 | | | | 1,755,691 | | | | 0 | | | | 1,755,691 | | | | 0.084 | | | | 0 | | | | 0.000 | |
| | | | | | | | | | | | | | | | | | | | | | | | | | | | | |
| Chi-Won Yoon, | | | 2013 | | | | 502,762 | | | | 441,143 | | | | 943,905 | | | | 0.046 | | | | 538,035 | | | | 0.026 | |
| CEO UBS Group Asia Pacific | | | 2012 | | | | 478,986 | | | | 370,760 | | | | 849,746 | | | | 0.041 | | | | 578,338 | | | | 0.028 | |
| | | | | | | | | | | | | | | | | | | | | | | | | | | | | |
| Jürg Zeltner, | | | 2013 | | | | 624,415 | | | | 13,920 | | | | 638,335 | | | | 0.031 | | | | 203,093 | | | | 0.010 | |
| CEO UBS Wealth Management | | | 2012 | | | | 522,500 | | | | 38,329 | | | | 560,829 | | | | 0.027 | | | | 203,093 | | | | 0.010 | |
| | | | | | | | | | | | | | | | | | | | | | | | | | | | | |
| | | 2013 | | | | 7,088,817 | | | | 1,619,974 | | | | 8,708,791 | | | | 0.422 | | | | 2,865,603 | | | | 0.139 | |
| Total | | | 2012 | | | | 6,660,878 | | | | 1,531,295 | | | | 8,192,173 | | | | 0.391 | | | | 3,137,426 | | | | 0.150 | |
| | | | | | | | | | | | | | | | | | | | | | | | | | | | | |
1 This table includes all vested and unvested shares and options of GEB members, including related parties. 2 Includes shares granted under variable compensation plans with forfeiture provisions. The actual number of shares vesting in the future will be calculated under the terms of the plans. Refer to the “Deferred variable compensation plans” section in this report for more information on the plans. 3 Refer to “Note 29 Equity participation and other compensation plans” in the “Financial information” section of our Annual Report 2013 for more information. 4 No conversion rights are outstanding. | |
Financial information
UBS AG (Parent Bank)
| | | | | | | | | | | | | | | | | | | | | | | | |
| Compensation details and additional information for non-independent BoD members | |
| CHF, except where indicated1 | | | | | | | | | | | | | | | | | | | | | | | | |
| Name, function2 | | For the year | | | Base salary | | | Annual
share award | | | Benefits3 | | | Contributions
to retirement
benefit
plans4 | | | Total | |
Axel A. Weber, Chairman | | | 2013 | | | | 2,000,000 | | | | 3,720,000 | | | | 89,446 | | | | 260,070 | | | | 6,069,516 | |
| | | | | | | | | | | | | | | | | | | | | | | | |
| | | 2012 | | | | 1,322,581 | | | | 2,003,995 | 5 | | | 69,867 | | | | 171,898 | | | | 3,568,341 | |
| | | | | | | | | | | | | | | | | | | | | | | | | |
| Kaspar Villiger, former Chairman | | | 2013 | | | | – | | | | – | | | | – | | | | – | | | | – | |
| | | | | | | | | | | | | | | | | | | | | | | | | |
| | | 2012 | | | | 354,167 | | | | 200,000 | 5 | | | 54,926 | | | | – | | | | 609,093 | |
| | | | | | | | | | | | | | | | | | | | | | | | | |
1 Local currencies are converted into CHF using the exchange rates as detailed in “Note 36 Currency translation rates” in the “Financial information” section of our Annual Report 2013. 2 Axel A. Weber was the only non-independent member in office on 31 December 2013 and on 31 December 2012 respectively. Kaspar Villiger did not stand for re-election at the AGM on 3 May 2012.3 Benefits in kind are all valued at market price. 4 This figure excludes the mandatory employer’s social security contributions, but includes the portion related to the employer’s contribution to the statutory pension scheme. The employee contribution is included in the base salary and annual incentive award components. 5 These shares are blocked for four years. | |
| | | | | | | | | | | | | | | | | | | | | | | | | | | | | | | | | | | | | | | | | | | | | | | | | | |
| Remuneration details and additional information for independent BoD members |
| CHF, except where indicated1 | | | | | | | | | | | | | | | | | | | | | | | | | | | | | | | | | | | | | | |
| Name, function2 | | Audit
Committee | | | Human
Resources &
Compensation
Committee | | | Governance
& Nominating
Committee | | | Corporate
Responsibility
Committee | | | Risk
Committee | | | For the period
AGM to AGM | | | Base fee | | | Committee
retainer(s) | | | Additional
payments | | | Total | | | Share
percentage2 | | | Number
of
shares3,4 | | | |
| Michel Demaré, | | | M | | | | M | | | | M | | | | | | | | | | | | 2013/2014 | | | | 325,000 | | | | 400,000 | | | | 250,000 | 6 | | | 975,000 | | | | 50 | | | | 30,834 | | | |
| | | | | | | | | | | | | | | | | | | | | | | | | | | | | | | | | | | | | | | | | | | | | | | | | | |
| Vice Chairman | | | M | | | | | | | | M | | | | | | | | | | | | 2012/2013 | | | | 325,000 | | | | 300,000 | | | | 250,000 | 6 | | | 875,000 | | | | 50 | | | | 34,233 | | | |
| | | | | | | | | | | | | | | | | | | | | | | | | | | | | | | | | | | | | | | | | | | | | | | | | | | |
| David Sidwell, | | | | | | | | | | | M | | | | | | | | C | | | | 2013/2014 | | | | 325,000 | | | | 500,000 | | | | 250,000 | 6 | | | 1,075,000 | | | | 50 | | | | 33,997 | | | |
| | | | | | | | | | | | | | | | | | | | | | | | | | | | | | | | | | | | | | | | | | | | | | | | | | |
| Senior Independent Director | | | | | | | | | | | M | | | | | | | | C | | | | 2012/2013 | | | | 325,000 | | | | 500,000 | | | | 250,000 | 6 | | | 1,075,000 | | | | 50 | | | | 42,057 | | | |
| | | | | | | | | | | | | | | | | | | | | | | | | | | | | | | | | | | | | | | | | | | | | | | | | | | |
| Reto Francioni, | | | | | | | | | | | | | | | M | | | | | | | | 2013/2014 | | | | 325,000 | | | | 50,000 | | | | | | | | 375,000 | | | | 50 | | | | 11,859 | | | |
| | | | | | | | | | | | | | | | | | | | | | | | | | | | | | | | | | | | | | | | | | | | | | | | | | |
| member | | | | | | | | | | | | | | | | | | | | | | | 2012/2013 | | | | – | | | | – | | | | | | | | – | | | | – | | | | – | | | |
| | | | | | | | | | | | | | | | | | | | | | | | | | | | | | | | | | | | | | | | | | | | | | | | | | | |
| Rainer-Marc Frey, | | | | | | | M | | | | | | | | | | | | M | | | | 2013/2014 | | | | 325,000 | | | | 300,000 | | | | | | | | 625,000 | | | | 100 | | | | 37,394 | | | |
| | | | | | | | | | | | | | | | | | | | | | | | | | | | | | | | | | | | | | | | | | | | | | | | | | |
| member | | | | | | | M | | | | | | | | | | | | M | | | | 2012/2013 | | | | 325,000 | | | | 300,000 | | | | | | | | 625,000 | | | | 100 | | | | 46,367 | | | |
| | | | | | | | | | | | | | | | | | | | | | | | | | | | | | | | | | | | | | | | | | | | | | | | | | | |
| Ann F. Godbehere, | | | M | | | | C | | | | | | | | | | | | | | | | 2013/2014 | | | | 325,000 | | | | 500,000 | | | | | | | | 825,000 | | | | 50 | | | | 26,091 | | | |
| | | | | | | | | | | | | | | | | | | | | | | | | | | | | | | | | | | | | | | | | | | | | | | | | | |
| member | | | M | | | | C | | | | | | | | | | | | | | | | 2012/2013 | | | | 325,000 | | | | 500,000 | | | | | | | | 825,000 | | | | 50 | | | | 32,276 | | | |
| | | | | | | | | | | | | | | | | | | | | | | | | | | | | | | | | | | | | | | | | | | | | | | | | | | |
| Axel P. Lehmann, | | | | | | | | | | | | | | | | | | | M | | | | 2013/2014 | | | | 325,000 | | | | 200,000 | | | | | | | | 525,000 | | | | 100 | | | | 31,403 | | | |
| | | | | | | | | | | | | | | | | | | | | | | | | | | | | | | | | | | | | | | | | | | | | | | | | | |
| member | | | | | | | | | | | M | | | | | | | | M | | | | 2012/2013 | | | | 325,000 | | | | 300,000 | | | | | | | | 625,000 | | | | 100 | | | | 46,367 | | | |
| | | | | | | | | | | | | | | | | | | | | | | | | | | | | | | | | | | | | | | | | | | | | | | | | | | |
| Wolfgang Mayrhuber, | | | | | | | | | | | | | | | | | | | | | | | 2013/2014 | | | | – | | | | – | | | | | | | | – | | | | – | | | | – | | | |
| | | | | | | | | | | | | | | | | | | | | | | | | | | | | | | | | | | | | | | | | | | | | | | | | | |
| former member | | | | | | | M | | | | | | | | C | | | | | | | | 2012/2013 | | | | 325,000 | | | | 200,000 | | | | | | | | 525,000 | | | | 50 | | | | 20,539 | | | |
| | | | | | | | | | | | | | | | | | | | | | | | | | | | | | | | | | | | | | | | | | | | | | | | | | | |
| Helmut Panke, | | | | | | | M | | | | | | | | | | | | M | | | | 2013/2014 | | | | 325,000 | | | | 300,000 | | | | | | | | 625,000 | | | | 50 | | | | 19,765 | | | |
| | | | | | | | | | | | | | | | | | | | | | | | | | | | | | | | | | | | | | | | | | | | | | | | | | |
| member | | | | | | | M | | | | | | | | | | | | M | | | | 2012/2013 | | | | 325,000 | | | | 300,000 | | | | | | | | 625,000 | | | | 50 | | | | 24,452 | | | |
| | | | | | | | | | | | | | | | | | | | | | | | | | | | | | | | | | | | | | | | | | | | | | | | | | | |
| William G. Parrett, | | | C | | | | | | | | | | | | M | | | | | | | | 2013/2014 | | | | 325,000 | | | | 350,000 | | | | | | | | 675,000 | | | | 50 | | | | 21,347 | | | |
| | | | | | | | | | | | | | | | | | | | | | | | | | | | | | | | | | | | | | | | | | | | | | | | | | |
| member | | | C | | | | | | | | | | | | M | | | | | | | | 2012/2013 | | | | 325,000 | | | | 350,000 | | | | | | | | 675,000 | | | | 50 | | | | 26,408 | | | |
| | | | | | | | | | | | | | | | | | | | | | | | | | | | | | | | | | | | | | | | | | | | | | | | | | | |
| Isabelle Romy, | | | M | | | | | | | | M | | | | | | | | | | | | 2013/2014 | | | | 325,000 | | | | 300,000 | | | | | | | | 625,000 | | | | 50 | | | | 19,765 | | | |
| | | | | | | | | | | | | | | | | | | | | | | | | | | | | | | | | | | | | | | | | | | | | | | | | | |
| member | | | M | | | | | | | | M | | | | | | | | | | | | 2012/2013 | | | | 325,000 | | | | 300,000 | | | | | | | | 625,000 | | | | 50 | | | | 24,452 | | | |
| | | | | | | | | | | | | | | | | | | | | | | | | | | | | | | | | | | | | | | | | | | | | | | | | | | |
| Beatrice Weder di Mauro, | | | M | | | | | | | | | | | | | | | | M | | | | 2013/2014 | | | | 325,000 | | | | 400,000 | | | | | | | | 725,000 | | | | 50 | | | | 22,928 | | | |
| | | | | | | | | | | | | | | | | | | | | | | | | | | | | | | | | | | | | | | | | | | | | | | | | | |
| member | | | M | | | | | | | | | | | | M | | | | | | | | 2012/2013 | | | | 325,000 | | | | 250,000 | | | | | | | | 575,000 | | | | 50 | | | | 22,496 | | | |
| | | | | | | | | | | | | | | | | | | | | | | | | | | | | | | | | | | | | | | | | | | | | | | | | | | |
| Joseph Yam, | | | | | | | | | | | | | | | M | | | | M | | | | 2013/2014 | | | | 325,000 | | | | 250,000 | | | | | | | | 575,000 | | | | 50 | | | | 18,184 | | | |
| | | | | | | | | | | | | | | | | | | | | | | | | | | | | | | | | | | | | | | | | | | | | | | | | | |
| member | | | | | | | | | | | | | | | M | | | | M | | | | 2012/2013 | | | | 325,000 | | | | 250,000 | | | | | | | | 575,000 | | | | 50 | | | | 22,496 | | | |
| | | | | | | | | | | | | | | | | | | | | | | | | | | | | | | | | | | | | | | | | | | | | | | | | | | |
| Total 2013 | | | | | | | | | | | | | | | | | | | | | | | | | | | | | | | | | | | | | | | 7,625,000 | | | | | | | | | | | |
| | | | | | | | | | | | | | | | | | | | | | | | | | | | | | | | | | | | | | | | | | | | | | | | | | | |
| Total 2012 | | | | | | | | | | | | | | | | | | | | | | | | | | | | | | | | | | | | | | | 7,625,000 | | | | | | | | | | | |
| | | | | | | | | | | | | | | | | | | | | | | | | | | | | | | | | | | | | | | | | | | | | | | | | | | |
Legend:C = Chairperson of the respective Committee, M = Member of the respective Committee | | | | | | | | | | | | | | | | | | | |
1 Local currencies are converted into CHF using the exchange rates as detailed in “Note 36 Currency translation rates” in the “Financial information” section of our Annual Report 2013. 2 There were 11 independent BoD members in office on 31 December 2013. Reto Francioni was appointed at the AGM on 2 May 2013 and Wolfgang Mayrhuber did not stand for re-election at the AGM on 2 May 2013. There were 11 independent BoD members in office on 31 December 2012. Isabelle Romy and Beatrice Weder di Mauro were appointed at the AGM on 3 May 2012 and Bruno Gehrig did not stand for re-election at the AGM on 3 May 2012. 3 Fees are paid 50% in cash and 50% in blocked UBS shares. However, independent BoD members can elect to have 100% of their remuneration paid in blocked UBS shares. 4 For 2013, shares valued at CHF 18.60 (average price of UBS shares at SIX Swiss Exchange over the last 10 trading days of February 2014), and were granted with a price discount of 15% for a new value of CHF 15.81. These shares are blocked for four years. For 2012, shares valued at CHF 15.03 (average price of UBS shares at SIX Swiss Exchange over the last 10 trading days of February 2013), and were granted with a price discount of 15% for a new value of CHF 12.78. These shares are blocked for four years. 5 Number of shares is reduced in case of the 100% election to deduct social security contributions. All remuneration payments are subject to social security contributions/withholding tax. 6 This payment is associated with the Vice Chairman or the Senior Independent Director function, respectively. |
| | | | | | | | |
| Total payments to BoD members | |
| CHF, except where indicated1 | | For the year | | | Total | |
Aggregate of all BoD members | | | 2013 | | | | 13,694,516 | |
| | | | | | | | |
| | | | 2012 | | | | 11,802,434 | |
1 Local currencies are converted into CHF using the exchange rates as detailed in “Note 36 Currency translation rates” in the “Financial information” section of our Annual Report 2013. | |
| | | | | | | | | | | | |
| Number of shares of BoD members on 31 December 2013/20121 | |
| Name, function | | on 31 December | | | Number of shares held | | | Voting rights in % | |
Axel A. Weber, Chairman2 | | | 2013 | | | | 233,333 | | | | 0.011 | |
| | | | | | | | | | | | |
| | | 2012 | �� | | | 200,000 | | | | 0.010 | |
| | | | | | | | | | | | | |
Michel Demaré, Vice Chairman | | | 2013 | | | | 150,412 | | | | 0.007 | |
| | | | | | | | | | | | |
| | | 2012 | | | | 116,179 | | | | 0.006 | |
| | | | | | | | | | | | | |
David Sidwell, Senior Independent Director | | | 2013 | | | | 151,184 | | | | 0.007 | |
| | | | | | | | | | | | |
| | | 2012 | | | | 149,199 | | | | 0.007 | |
| | | | | | | | | | | | | |
Reto Francioni, member2 | | | 2013 | | | | 0 | | | | 0.000 | |
| | | | | | | | | | | | |
| | | 2012 | | | | – | | | | 0.000 | |
| | | | | | | | | | | | | |
Rainer-Marc Frey, member | | | 2013 | | | | 209,044 | | | | 0.010 | |
| | | | | | | | | | | | |
| | | 2012 | | | | 162,677 | | | | 0.008 | |
| | | | | | | | | | | | | |
Ann F. Godbehere, member | | | 2013 | | | | 113,562 | | | | 0.006 | |
| | | | | | | | | | | | |
| | | 2012 | | | | 81,286 | | | | 0.004 | |
| | | | | | | | | | | | | |
Axel P. Lehmann, member | | | 2013 | | | | 185,970 | | | | 0.009 | |
| | | | | | | | | | | | |
| | | 2012 | | | | 139,603 | | | | 0.007 | |
| | | | | | | | | | | | | |
Wolfgang Mayrhuber, former member3 | | | 2013 | | | | – | | | | 0.000 | |
| | | | | | | | | | | | |
| | | 2012 | | | | 38,957 | | | | 0.002 | |
| | | | | | | | | | | | | |
Helmut Panke, member | | | 2013 | | | | 162,244 | | | | 0.008 | |
| | | | | | | | | | | | |
| | | 2012 | | | | 137,792 | | | | 0.007 | |
| | | | | | | | | | | | | |
William G. Parrett, member | | | 2013 | | | | 99,914 | | | | 0.005 | |
| | | | | | | | | | | | |
| | | 2012 | | | | 91,078 | | | | 0.004 | |
| | | | | | | | | | | | | |
Isabelle Romy, member2 | | | 2013 | | | | 24,452 | | | | 0.001 | |
| | | | | | | | | | | | |
| | | 2012 | | | | 0 | | | | 0.000 | |
| | | | | | | | | | | | | |
Beatrice Weder di Mauro, member2 | | | 2013 | | | | 22,496 | | | | 0.001 | |
| | | | | | | | | | | | |
| | | 2012 | | | | 0 | | | | 0.000 | |
| | | | | | | | | | | | | |
Joseph Yam, member | | | 2013 | | | | 48,679 | | | | 0.002 | |
| | | | | | | | | | | | |
| | | 2012 | | | | 26,183 | | | | 0.001 | |
| | | | | | | | | | | | | |
Total | | | 2013 | | | | 1,401,290 | | | | 0.068 | |
| | | | | | | | | | | | |
| | | 2012 | | | | 1,142,954 | | | | 0.055 | |
| | | | | | | | | | | | | |
1 This table includes blocked and unblocked shares held by BoD members, including related parties. No options were granted in 2013 and 2012. 2 Reto Francioni was appointed at the AGM on 2 May 2013. Axel A. We-ber, Isabelle Romy and Beatrice Weder di Mauro were appointed at the AGM on 3 May 2012. 3 Wolfgang Mayrhuber did not stand for re-election at the AGM on 2 May 2013. | |
Financial information
UBS AG (Parent Bank)
| | | | | | | | | | | | | | | | |
| Compensation paid to former BoD and GEB members1 | | | | | | | |
| CHF, except where indicated2 | | | | | | | | | | | | |
| | | For the year | | | Compensation | | | Benefits | | | Total | |
| Former BoD members | | | 2013 | | | | 0 | | | | 0 | | | | 0 | |
| | | | | | | | | | | | | | | | |
| | | 2012 | | | | 0 | | | | 0 | | | | 0 | |
| | | | | | | | | | | | | | | | | |
| Aggregate of all former GEB members3 | | | 2013 | | | | 0 | | | | 27,809 | | | | 27,809 | |
| | | | | | | | | | | | | | | | |
| | | 2012 | | | | 0 | | | | 25,465 | | | | 25,465 | |
| | | | | | | | | | | | | | | | |
| Aggregate of all former BoD and GEB members | | | 2013 | | | | 0 | | | | 27,809 | | | | 27,809 | |
| | | | | | | | | | | | | | | | |
| | | | 2012 | | | | 0 | | | | 25,465 | | | | 25,465 | |
1 Compensation or remuneration that is connected with the former member’s activity on the BoD or GEB or that is not at market conditions. 2 Local currencies are converted into CHF using the exchange rates as detailed in “Note 36 Currency translation rates” in the “Financial information” section in the Annual Report 2013. 3 Includes one former GEB member in 2013 and 2012. | |
| | | | | | | | | | | | | | | | | | | | | | | | | | | | |
| Total of all vested and unvested shares of GEB members1,2 | |
| | | Total | | | of which
vested | | | of which vesting | |
| | | | | | | | | 2014 | | | 2015 | | | 2016 | | | 2017 | | | 2018 | |
Shares on 31 December 2013 | | | 8,708,791 | | | | 1,619,974 | | | | 1,652,867 | | | | 2,373,539 | | | | 1,263,412 | | | | 1,052,595 | | | | 746,404 | |
| | | | | | | | | | | | | | | | | | | | | | | | | | | | | |
| | | | | | | |
| | | | | | | | | 2013 | | | 2014 | | | 2015 | | | 2016 | | | 2017 | |
Shares on 31 December 2012 | | | 8,192,173 | | | | 1,531,295 | | | | 1,811,280 | | | | 1,652,867 | | | | 2,373,539 | | | | 517,001 | | | | 306,191 | |
| | | | | | | | | | | | | | | | | | | | | | | | | | | | | |
1 Includes related parties. 2 Includes shares granted under variable compensation plans with forfeiture provisions. The actual number of shares vesting in the future will be calculated under the terms of the plans. Refer to the “Deferred variable compensation plans” section in this report for more information on the plans. | |
| | | | | | | | | | | | | | | | | | | | | | | | |
| Total of all blocked and unblocked shares of BoD members1 | |
| | | Total | | | of which
unblocked | | | of which blocked until | |
| | | | | | | | | 2014 | | | 2015 | | | 2016 | | | 2017 | |
Shares on 31 December 2013 | | | 1,401,290 | | | | 201,098 | | | | 204,792 | | | | 216,451 | | | | 324,012 | | | | 454,937 | |
| | | | | | | | | | | | | | | | | | | | | | | | | |
| | | | | | | | | 2013 | | | 2014 | | | 2015 | | | 2016 | |
Shares on 31 December 2012 | | | 1,142,954 | | | | 56,624 | | | | 302,118 | | | | 204,792 | | | | 231,501 | | | | 347,919 | |
| | | | | | | | | | | | | | | | | | | | | | | | | |
1 Includes related parties. | |
| | | | | | | | | | | | | | | | | | | | | | | | | | | | | | | | | | | | | | | | | | | | | | | | | | | | |
Vested and unvested options of GEB members on 31 December 2013/20121 | |
on 31 December | |
| Total
number of
options2 |
| |
| Number of
options3 |
| |
| Year of
grant |
| |
| Vesting
date |
| |
| Expiry
date |
| |
| Strike
price |
| | | | on 31 December | |
| Total
number of
options2 |
| |
| Number of
options3 |
| |
| Year of
grant |
| |
| Vesting
date |
| |
| Expiry
date |
| |
| Strike
price |
|
| | | | | | | | | | | | | | | | | | | | | | | | | | | | | | | | | | | | | | | | | | | | | | | | | | | | | |
| | | | | | | | | | | | | | | | | | | | | | | | | | | | | | | | | | | | | | | | | | | | | | | | | | | | |
| Sergio P. Ermotti, Group Chief Executive Officer | | | | | Robert J. McCann, CEO Wealth Management Americas and CEO UBS Group Americas | |
| 2013 | | | 0 | | | | | | | | | | | | | | | | | | | | | | | | | 2013 | | | 0 | | | | | | | | | | | | | | | | | | | | | |
| 2012 | | | 0 | | | | | | | | | | | | | | | | | | | | | | | | | 2012 | | | 0 | | | | | | | | | | | | | | | | | | | | | |
| | | | | | | | | | | | | | | | | | | | | | | | | | | | | | | | | | | | | | | | | | | | | | | | | | | | |
| Markus U. Diethelm, Group General Counsel | | | | | Tom Naratil, Group Chief Financial Officer | | | | | | | | | | | | | |
| 2013 | | | 0 | | | | | | | | | | | | | | | | | | | | | | | | | 2013 | | | 867,087 | | | | 145,962 | | | | 2004 | | | | 01.03.2007 | | | | 27.02.2014 | | | | USD 38.13 | |
| 2012 | | | 0 | | | | | | | | | | | | | | | | | | | | | | | | | | | | | | | | 166,010 | | | | 2005 | | | | 01.03.2008 | | | | 28.02.2015 | | | | USD 44.81 | |
| | | | | | | | | | | | | | | | | | | | | | | | | | �� | | | | | | | | | | 142,198 | | | | 2006 | | | | 01.03.2009 | | | | 28.02.2016 | | | | CHF 72.57 | |
| John A. Fraser, Chairman and CEO Global Asset Management | | | | | | | | | | | | 131,277 | | | | 2007 | | | | 01.03.2010 | | | | 28.02.2017 | | | | CHF 73.67 | |
| 2013 | | | 756,647 | | | | 170,512 | | | | 2004 | | | | 01.03.2007 | | | | 27.02.2014 | | | | USD 38.13 | | | | | | | | | | | | 181,640 | | | | 2008 | | | | 01.03.2011 | | | | 28.02.2018 | | | | CHF 35.66 | |
| | | | | | | 202,483 | | | | 2005 | | | | 01.03.2008 | | | | 28.02.2015 | | | | USD 44.81 | | | | | | | | | | | | 100,000 | | | | 2009 | | | | 01.03.2012 | | | | 27.02.2019 | | | | CHF 11.35 | |
| | | | | | | 213,140 | | | | 2006 | | | | 01.03.2009 | | | | 28.02.2016 | | | | CHF 72.57 | | | | | 2012 | | | 935,291 | | | | 63,942 | | | | 2003 | | | | 31.01.2006 | | | | 31.01.2013 | | | | USD 22.53 | |
| | | | | | | 170,512 | | | | 2007 | | | | 01.03.2010 | | | | 28.02.2017 | | | | CHF 73.67 | | | | | | | | | | | | 4,262 | | | | 2003 | | | | 28.02.2005 | | | | 28.02.2013 | | | | USD 19.53 | |
| 2012 | | | 884,531 | | | | 127,884 | | | | 2003 | | | | 31.01.2006 | | | | 31.01.2013 | | | | USD 22.53 | | | | | | | | | | | | 145,962 | | | | 2004 | | | | 01.03.2007 | | | | 27.02.2014 | | | | USD 38.13 | |
| | | | | | | 170,512 | | | | 2004 | | | | 01.03.2007 | | | | 27.02.2014 | | | | USD 38.13 | | | | | | | | | | | | 166,010 | | | | 2005 | | | | 01.03.2008 | | | | 28.02.2015 | | | | USD 44.81 | |
| | | | | | | 202,483 | | | | 2005 | | | | 01.03.2008 | | | | 28.02.2015 | | | | USD 44.81 | | | | | | | | | | | | 142,198 | | | | 2006 | | | | 01.03.2009 | | | | 28.02.2016 | | | | CHF 72.57 | |
| | | | | | | 213,140 | | | | 2006 | | | | 01.03.2009 | | | | 28.02.2016 | | | | CHF 72.57 | | | | | | | | | | | | 131,277 | | | | 2007 | | | | 01.03.2010 | | | | 28.02.2017 | | | | CHF 73.67 | |
| | | | | | | 170,512 | | | | 2007 | | | | 01.03.2010 | | | | 28.02.2017 | | | | CHF 73.67 | | | | | | | | | | | | 181,640 | | | | 2008 | | | | 01.03.2011 | | | | 28.02.2018 | | | | CHF 35.66 | |
| | | | | | | | | | | | | | | | | | | | | | | | | | | | | | | | | | | | 100,000 | | | | 2009 | | | | 01.03.2012 | | | | 27.02.2019 | | | | CHF 11.35 | |
| | | | | | | | | | | | | | | | | | | | | | | | | | | | | | | | | | | | | | | | | | | | | | | | | | | | |
| Lukas Gähwiler, CEO UBS Switzerland and CEO Retail & Corporate | | | | | Andrea Orcel, CEO Investment Bank | | | | | | | | | | | | | | | | | |
| | | | | | | | | | | | | | | | | | | | | | | | | | | | | | | | | | | | | | | | | | | | | | | | | | | | |
| 2013 | | | 0 | | | | | | | | | | | | | | | | | | | | | | | | | 2013 | | | 0 | | | | | | | | | | | | | | | | | | | | | |
| | | | | | | | | | | | | | | | | | | | | | | | | | | | | | | | | | | | | | | | | | | | | | | | | | | | | |
| 2012 | | | 0 | | | | | | | | | | | | | | | | | | | | | | | | | 2012 | | | 0 | | | | | | | | | | | | | | | | | | | | | |
| | | | | | | | | | | | | | | | | | | | | | | | | | | | | | | | | | | | | | | | | | | | | | | | | | | | | |
| | | | | | | | | | | | | | | | | | | | | | | | | | | | | | | | | | | | | | | | | | | | | | | | | | | | |
| | | | | | | | | | | | | | | | | | | | | | | | | | | | | | | | | | | | | | | | | |
| Ulrich Körner, Group Chief Operating Officer and CEO UBS Group EMEA | | | | | Chi-Won Yoon, CEO UBS Group Asia Pacific | | | | | | | | | | | | | |
| 2013 | | | 0 | | | | | | | | | | | | | | | | | | | | | | | | | 2013 | | | 538,035 | | | | 6,200 | | | | 2004 | | | | 01.03.2005 | | | | 27.02.2014 | | | | CHF 44.32 | |
| | | | | | | | | | | | | | | | | | | | | | | | | | | | | | | | | | | | | | | | | | | | | | | | | | | | | |
| 2012 | | | 0 | | | | | | | | | | | | | | | | | | | | | | | | | | | | | | | | 4,262 | | | | 2004 | | | | 27.02.2006 | | | | 27.02.2014 | | | | CHF 44.32 | |
| | | | | | | | | | | | | | | | | | | | | | | | | | | | | | | | | | | | | | | | | | | | | | | | | | | | | |
| | | | | | | | | | | | | | | | | | | | | | | | | | | | | | | | | | | 6,198 | | | | 2004 | | | | 01.03.2006 | | | | 27.02.2014 | | | | CHF 44.32 | |
| | | | | | | | | | | | | | | | | | | | | | | | | | | | | | | | | | | | | | | | | | | | | | | | | | | | |
| Philip J. Lofts, Group Chief Risk Officer | | | | | | | | | | | | | | | | 6,195 | | | | 2004 | | | | 01.03.2007 | | | | 27.02.2014 | | | | CHF 44.32 | |
| | | | | | | | | | | | | | | | | | | | | | | | | | | | | | | | | | | | | | | | | | | | | | | | | | | | | |
| 2013 | | | 500,741 | | | | 35,524 | | | | 2004 | | | | 01.03.2005 | | | | 27.02.2014 | | | | CHF 44.32 | | | | | | | | | | | | 10,659 | | | | 2005 | | | | 01.03.2006 | | | | 28.02.2015 | | | | CHF 47.58 | |
| | | | | | | | | | | | | | | | | | | | | | | | | | | | | | | | | | | | | | | | | | | | | | | | | | | | |
| | | | | | | 35,524 | | | | 2004 | | | | 01.03.2006 | | | | 27.02.2014 | | | | CHF 44.32 | | | | | | | | | | | | 10,657 | | | | 2005 | | | | 01.03.2007 | | | | 28.02.2015 | | | | CHF 47.58 | |
| | | | | | | | | | | | | | | | | | | | | | | | | | | | | | | | | | | | | | | | | | | | | | | | | | | | |
| | | | | | | 35,521 | | | | 2004 | | | | 01.03.2007 | | | | 27.02.2014 | | | | CHF 44.32 | | | | | | | | | | | | 10,654 | | | | 2005 | | | | 01.03.2008 | | | | 28.02.2015 | | | | CHF 47.58 | |
| | | | | | | | | | | | | | | | | | | | | | | | | | | | | | | | | | | | | | | | | | | | | | | | | | | | |
| | | | | | | 117,090 | | | | 2005 | | | | 01.03.2008 | | | | 28.02.2015 | | | | CHF 52.32 | | | | | | | | | | | | 21,316 | | | | 2006 | | | | 01.03.2007 | | | | 28.02.2016 | | | | CHF 65.97 | |
| | | | | | | | | | | | | | | | | | | | | | | | | | | | | | | | | | | | | | | | | | | | | | | | | | | | |
| | | | | | | 117,227 | | | | 2006 | | | | 01.03.2009 | | | | 28.02.2016 | | | | CHF 72.57 | | | | | | | | | | | | 21,314 | | | | 2006 | | | | 01.03.2008 | | | | 28.02.2016 | | | | CHF 65.97 | |
| | | | | | | | | | | | | | | | | | | | | | | | | | | | | | | | | | | | | | | | | | | | | | | | | | | | |
| | | | | | | 85,256 | | | | 2007 | | | | 01.03.2010 | | | | 28.02.2017 | | | | CHF 73.67 | | | | | | | | | | | | 21,311 | | | | 2006 | | | | 01.03.2009 | | | | 28.02.2016 | | | | CHF 65.97 | |
| | | | | | | | | | | | | | | | | | | | | | | | | | | | | | | | | | | | | | | | | | | | | | | | | | | | |
| | | | | | | 74,599 | | | | 2008 | | | | 01.03.2011 | | | | 28.02.2018 | | | | CHF 35.66 | | | | | | | | | | | | 8,881 | | | | 2007 | | | | 01.03.2008 | | | | 28.02.2017 | | | | CHF 67.00 | |
| | | | | | | | | | | | | | | | | | | | | | | | | | | | | | | | | | | | | | | | | | | | | | | | | | | | | |
| 2012 | | | 536,173 | | | | 9,985 | | | | 2003 | | | | 01.03.2004 | | | | 31.01.2013 | | | | CHF 27.81 | | | | | | | | | | | | 8,880 | | | | 2007 | | | | 01.03.2009 | | | | 28.02.2017 | | | | CHF 67.00 | |
| | | | | | | | | | | | | | | | | | | | | | | | | | | | | | | | | | | | | | | | | | | | | | | | | | | | |
| | | | | | | 9,980 | | | | 2003 | | | | 01.03.2005 | | | | 31.01.2013 | | | | CHF 27.81 | | | | | | | | | | | | 8,880 | | | | 2007 | | | | 01.03.2010 | | | | 28.02.2017 | | | | CHF 67.00 | |
| | | | | | | | | | | | | | | | | | | | | | | | | | | | | | | | | | | | | | | | | | | | | | | | | | | | |
| | | | | | | 9,974 | | | | 2003 | | | | 01.03.2006 | | | | 31.01.2013 | | | | CHF 27.81 | | | | | | | | | | | | 42,628 | | | | 2008 | | | | 01.03.2011 | | | | 28.02.2018 | | | | CHF 32.45 | |
| | | | | | | | | | | | | | | | | | | | | | | | | | | | | | | | | | | | | | | | | | | | | | | | | | | | |
| | | | | | | 1,833 | | | | 2003 | | | | 01.03.2004 | | | | 28.02.2013 | | | | CHF 26.39 | | | | | | | | | | | | 350,000 | | | | 2009 | | | | 01.03.2012 | | | | 27.02.2019 | | | | CHF 11.35 | |
| | | | | | | | | | | | | | | | | | | | | | | | | | | | | | | | | | | | | | | | | | | | | | | | | | | | |
| | | | | | | 1,830 | | | | 2003 | | | | 01.03.2005 | | | | 28.02.2013 | | | | CHF 26.39 | | | | | 2012 | | | 578,338 | | | | 8,648 | | | | 2003 | | | | 01.03.2004 | | | | 31.01.2013 | | | | USD 20.49 | |
| | | | | | | | | | | | | | | | | | | | | | | | | | | | | | | | | | | | | | | | | | | | | | | | | | | | |
| | | | | | | 1,830 | | | | 2003 | | | | 01.03.2006 | | | | 28.02.2013 | | | | CHF 26.39 | | | | | | | | | | | | 8,642 | | | | 2003 | | | | 01.03.2005 | | | | 31.01.2013 | | | | USD 20.49 | |
| | | | | | | | | | | | | | | | | | | | | | | | | | | | | | | | | | | | | | | | | | | | | | | | | | | | |
| | | | | | | 35,524 | | | | 2004 | | | | 01.03.2005 | | | | 27.02.2014 | | | | CHF 44.32 | | | | | | | | | | | | 8,635 | | | | 2003 | | | | 01.03.2006 | | | | 31.01.2013 | | | | USD 20.49 | |
| | | | | | | | | | | | | | | | | | | | | | | | | | | | | | | | | | | | | | | | | | | | | | | | | | | | |
| | | | | | | 35,524 | | | | 2004 | | | | 01.03.2006 | | | | 27.02.2014 | | | | CHF 44.32 | | | | | | | | | | | | 4,262 | | | | 2003 | | | | 28.02.2005 | | | | 28.02.2013 | | | | USD 19.53 | |
| | | | | | | | | | | | | | | | | | | | | | | | | | | | | | | | | | | | | | | | | | | | | | | | | | | | |
| | | | | | | 35,521 | | | | 2004 | | | | 01.03.2007 | | | | 27.02.2014 | | | | CHF 44.32 | | | | | | | | | | | | 3,374 | | | | 2003 | | | | 01.03.2004 | | | | 28.02.2013 | | | | USD 19.53 | |
| | | | | | | | | | | | | | | | | | | | | | | | | | | | | | | | | | | | | | | | | | | | | | | | | | | | |
| | | | | | | 117,090 | | | | 2005 | | | | 01.03.2008 | | | | 28.02.2015 | | | | CHF 52.32 | | | | | | | | | | | | 3,371 | | | | 2003 | | | | 01.03.2005 | | | | 28.02.2013 | | | | USD 19.53 | |
| | | | | | | | | | | | | | | | | | | | | | | | | | | | | | | | | | | | | | | | | | | | | | | | | | | | |
| | | | | | | 117,227 | | | | 2006 | | | | 01.03.2009 | | | | 28.02.2016 | | | | CHF 72.57 | | | | | | | | | | | | 3,371 | | | | 2003 | | | | 01.03.2006 | | | | 28.02.2013 | | | | USD 19.53 | |
| | | | | | | | | | | | | | | | | | | | | | | | | | | | | | | | | | | | | | | | | | | | | | | | | | | | |
| | | | | | | 85,256 | | | | 2007 | | | | 01.03.2010 | | | | 28.02.2017 | | | | CHF 73.67 | | | | | | | | | | | | | | | | | | | | | | | | | | | | | |
| | | | | | | | | | | | | | | | | | | | | | | | | | | | | | | | | | | | | | | | | | | | | | | | | | | | |
| | | | | | | | 74,599 | | | | 2008 | | | | 01.03.2011 | | | | 28.02.2018 | | | | CHF 35.66 | | | | | | | | | | | | | | | | | | | | | | | | | | | | | |
1 This table includes all options of GEB members, including related parties. section of the Annual Report 2013 for more information. 2 No conversion rights are outstanding. 3 Refer to “Note 29 Equity participation and other compensation plans” in the “Financial information” section of our Annual Report 2013 for more information. | |
Financial information
UBS AG (Parent Bank)
Vested and unvested options of GEB members on 31 December 2013/20121 (continued)
| | | | | | | | | | | | | | | | | | | | | | | | | | | | | | | | | | | | | | | | | | | | | | | | | | | | | | |
on 31December | |
| Total
number
of
options2 |
| |
| Number
of
options3 |
| |
| Year
of
grant |
| |
| Vesting
date |
| |
| Expiry
date |
| |
| Strike
price |
| | | |
| on
31 December |
| |
| Total
number
of
options |
2 | |
| Number
of
options3 |
| |
| Year
of
grant |
| |
| Vesting
date |
| |
| Expiry
date |
| |
| Strike
price |
|
| | | | | | | |
| Chi-Won Yoon, CEO UBS Group Asia Pacific (continued) | | | | | | Jürg Zeltner, CEO UBS Wealth Management (continued) | |
| 2012 | | | | | | | 6,200 | | | | 2004 | | | | 01.03.2005 | | | | 27.02.2014 | | | | CHF 44.32 | | | | | | | | | | | | | | 230 | | | | 2006 | | | | 08.09.2008 | | | | 08.09.2016 | | | | CHF 65.76 | |
| | | | | | | 4,262 | | | | 2004 | | | | 27.02.2006 | | | | 27.02.2014 | | | | CHF 44.32 | | | | | | | | | | | | | | 221 | | | | 2006 | | | | 08.12.2008 | | | | 08.12.2016 | | | | CHF 67.63 | |
| | | | | | | 6,198 | | | | 2004 | | | | 01.03.2006 | | | | 27.02.2014 | | | | CHF 44.32 | | | | | | | | | | | | | | 7,105 | | | | 2007 | | | | 01.03.2008 | | | | 28.02.2017 | | | | CHF 67.00 | |
| | | | | | | 6,195 | | | | 2004 | | | | 01.03.2007 | | | | 27.02.2014 | | | | CHF 44.32 | | | | | | | | | | | | | | 7,105 | | | | 2007 | | | | 01.03.2009 | | | | 28.02.2017 | | | | CHF 67.00 | |
| | | | | | | 10,659 | | | | 2005 | | | | 01.03.2006 | | | | 28.02.2015 | | | | CHF 47.58 | | | | | | | | | | | | | | 7,103 | | | | 2007 | | | | 01.03.2010 | | | | 28.02.2017 | | | | CHF 67.00 | |
| | | | | | | 10,657 | | | | 2005 | | | | 01.03.2007 | | | | 28.02.2015 | | | | CHF 47.58 | | | | | | | | | | | | | | 223 | | | | 2007 | | | | 02.03.2009 | | | | 02.03.2017 | | | | CHF 67.08 | |
| | | | | | | 10,654 | | | | 2005 | | | | 01.03.2008 | | | | 28.02.2015 | | | | CHF 47.58 | | | | | | | | | | | | | | 42,628 | | | | 2008 | | | | 01.03.2011 | | | | 28.02.2018 | | | | CHF 35.66 | |
| | | | | | | 21,316 | | | | 2006 | | | | 01.03.2007 | | | | 28.02.2016 | | | | CHF 65.97 | | | | | | | | | | | | | | 90,000 | | | | 2009 | | | | 01.03.2012 | | | | 27.02.2019 | | | | CHF 11.35 | |
| | | | | | | 21,314 | | | | 2006 | | | | 01.03.2008 | | | | 28.02.2016 | | | | CHF 65.97 | | | | | | 2012 | | | | 203,093 | | | | 4,972 | | | | 2004 | | | | 01.03.2007 | | | | 27.02.2014 | | | | CHF 44.32 | |
| | | | | | | 21,311 | | | | 2006 | | | | 01.03.2009 | | | | 28.02.2016 | | | | CHF 65.97 | | | | | | | | | | | | | | 7,106 | | | | 2005 | | | | 01.03.2006 | | | | 28.02.2015 | | | | CHF 47.58 | |
| | | | | | | 8,881 | | | | 2007 | | | | 01.03.2008 | | | | 28.02.2017 | | | | CHF 67.00 | | | | | | | | | | | | | | 7,103 | | | | 2005 | | | | 01.03.2007 | | | | 28.02.2015 | | | | CHF 47.58 | |
| | | | | | | 8,880 | | | | 2007 | | | | 01.03.2009 | | | | 28.02.2017 | | | | CHF 67.00 | | | | | | | | | | | | | | 7,103 | | | | 2005 | | | | 01.03.2008 | | | | 28.02.2015 | | | | CHF 47.58 | |
| | | | | | | 8,880 | �� | | | 2007 | | | | 01.03.2010 | | | | 28.02.2017 | | | | CHF 67.00 | | | | | | | | | | | | | | 93 | | | | 2005 | | | | 04.03.2007 | | | | 04.03.2015 | | | | CHF 47.89 | |
| | | | | | | 42,628 | | | | 2008 | | | | 01.03.2011 | | | | 28.02.2018 | | | | CHF 32.45 | | | | | | | | | | | | | | 161 | | | | 2005 | | | | 06.06.2007 | | | | 06.06.2015 | | | | CHF 45.97 | |
| | | | | | | 350,000 | | | | 2009 | | | | 01.03.2012 | | | | 27.02.2019 | | | | CHF 11.35 | | | | | | | | | | | | | | 149 | | | | 2005 | | | | 09.09.2007 | | | | 09.09.2015 | | | | CHF 50.47 | |
| Jürg Zeltner, CEO UBS Wealth Management | | | | | | | | | | | | | | 127 | | | | 2005 | | | | 05.12.2007 | | | | 05.12.2015 | | | | CHF 59.03 | |
| 2013 | | | 203,093 | | | | 4,972 | | | | 2004 | | | | 01.03.2007 | | | | 27.02.2014 | | | | CHF 44.32 | | | | | | | | | | | | | | 7,106 | | | | 2006 | | | | 01.03.2007 | | | | 28.02.2016 | | | | CHF 65.97 | |
| | | | | | | 7,106 | | | | 2005 | | | | 01.03.2006 | | | | 28.02.2015 | | | | CHF 47.58 | | | | | | | | | | | | | | 7,103 | | | | 2006 | | | | 01.03.2008 | | | | 28.02.2016 | | | | CHF 65.97 | |
| | | | | | | 7,103 | | | | 2005 | | | | 01.03.2007 | | | | 28.02.2015 | | | | CHF 47.58 | | | | | | | | | | | | | | 7,103 | | | | 2006 | | | | 01.03.2009 | | | | 28.02.2016 | | | | CHF 65.97 | |
| | | | | | | 7,103 | | | | 2005 | | | | 01.03.2008 | | | | 28.02.2015 | | | | CHF 47.58 | | | | | | | | | | | | | | 110 | | | | 2006 | | | | 03.03.2008 | | | | 03.03.2016 | | | | CHF 65.91 | |
| | | | | | | 93 | | | | 2005 | | | | 04.03.2007 | | | | 04.03.2015 | | | | CHF 47.89 | | | | | | | | | | | | | | 242 | | | | 2006 | | | | 09.06.2008 | | | | 09.06.2016 | | | | CHF 61.84 | |
| | | | | | | 161 | | | | 2005 | | | | 06.06.2007 | | | | 06.06.2015 | | | | CHF 45.97 | | | | | | | | | | | | | | 230 | | | | 2006 | | | | 08.09.2008 | | | | 08.09.2016 | | | | CHF 65.76 | |
| | | | | | | 149 | | | | 2005 | | | | 09.09.2007 | | | | 09.09.2015 | | | | CHF 50.47 | | | | | | | | | | | | | | 221 | | | | 2006 | | | | 08.12.2008 | | | | 08.12.2016 | | | | CHF 67.63 | |
| | | | | | | 127 | | | | 2005 | | | | 05.12.2007 | | | | 05.12.2015 | | | | CHF 59.03 | | | | | | | | | | | | | | 7,105 | | | | 2007 | | | | 01.03.2008 | | | | 28.02.2017 | | | | CHF 67.00 | |
| | | | | | | 7,106 | | | | 2006 | | | | 01.03.2007 | | | | 28.02.2016 | | | | CHF 65.97 | | | | | | | | | | | | | | 7,105 | | | | 2007 | | | | 01.03.2009 | | | | 28.02.2017 | | | | CHF 67.00 | |
| | | | | | | 7,103 | | | | 2006 | | | | 01.03.2008 | | | | 28.02.2016 | | | | CHF 65.97 | | | | | | | | | | | | | | 7,103 | | | | 2007 | | | | 01.03.2010 | | | | 28.02.2017 | | | | CHF 67.00 | |
| | | | | | | 7,103 | | | | 2006 | | | | 01.03.2009 | | | | 28.02.2016 | | | | CHF 65.97 | | | | | | | | | | | | | | 223 | | | | 2007 | | | | 02.03.2009 | | | | 02.03.2017 | | | | CHF 67.08 | |
| | | | | | | 110 | | | | 2006 | | | | 03.03.2008 | | | | 03.03.2016 | | | | CHF 65.91 | | | | | | | | | | | | | | 42,628 | | | | 2008 | | | | 01.03.2011 | | | | 28.02.2018 | | | | CHF 35.66 | |
| | | | | | | 242 | | | | 2006 | | | | 09.06.2008 | | | | 09.06.2016 | | | | CHF 61.84 | | | | | | | | | | | | | | 90,000 | | | | 2009 | | | | 01.03.2012 | | | | 27.02.2019 | | | | CHF 11.35 | |
| | | | | | | | | | | | | | | | | | | | | | | | | | | | | | | | | | | | | | | | | | | | | | | | | | | | | | |
| | | | | | | | | | | | | | | | | | | | | | | | | | | | | | | | | | | | | | | | | | | | | | | | | | | | | | | |
1 This table includes all options of GEB members, including related parties. 2 No conversion rights are outstanding. 3 Refer to “Note 29 Equity participation and other compensation plans” in the “Financial information” section of our Annual Report 2013 for more information. | |
| | | | | | | | |
| Loans granted to GEB members on 31 December 2013/20121 | |
| CHF, except where indicated2 | | | | | | |
| Name, function | | on 31 December | | | Loans3 | |
| Ulrich Körner, Group Chief Operating Officer and CEO UBS Group EMEA (highest loan in 2013) | | | 2013 | | | | 5,181,976 | |
| | | | | | | | | |
| Markus U. Diethelm, Group General Counsel (highest loan in 2012) | | | 2012 | | | | 5,564,012 | |
| Aggregate of all GEB members | | | 2013 | | | | 18,763,976 | |
| | | | | | | | |
| | | | 2012 | | | | 18,862,820 | |
| | | | | | | | | |
1 No loans have been granted to related parties of the GEB members at conditions not customary in the market. 2 Local currencies are converted into CHF using the exchange rates as detailed in “Note 36 Currency translation rates” in the “Financial information” section in our Annual Report 2013. 3 All loans granted are secured loans, except for CHF 311,308 in 2012. | |
| | | | | | | | |
| Loans granted to BoD members on 31 December 2013/ 20121 | |
| CHF, except where indicated2 | | | | | | |
| | | on 31 December | | | Loans3,4 | |
| Aggregate of all BoD members | | | 2013 | | | | 1,520,000 | |
| | | | | | | | |
| | | | 2012 | | | | 500,000 | |
1 No loans have been granted to related parties of the BoD members at conditions not customary in the market. 2 Local currencies are converted into CHF using the exchange rates as detailed in “Note 36 Currency translation rates” in the “Financial information” section in our Annual Report 2013. 3 All loans granted are secured loans. 4 CHF 1,520,000 for Reto Francioni in 2013. CHF 500,000 for Michel Demaré in 2012. | |
Financial information
UBS AG (Parent Bank)
| | | | |

| | Ernst & Young Ltd |
| | Aeschengraben 9 |
| | P.O. Box |
| | CH-4002 Basel |
| | |
| | Phone | | +41 58 286 86 86 |
| | Fax | | +41 58 286 86 00 |
| | www.ey.com/ch |
To the General Meeting of
UBS AG, Zurich and Basel
Basel, 6 March 2014
Report of the statutory auditor on the financial statements
As statutory auditor, we have audited the accompanying financial statements of UBS AG, which comprise the balance sheet, income statement and notes on pages 510 to 531, for the year ended 31 December 2013.
Board of Directors’ responsibility
The Board of Directors is responsible for the preparation of the financial statements in accordance with the requirements of Swiss law and the company’s articles of incorporation. This responsibility includes designing, implementing and maintaining an internal control system relevant to the preparation of financial statements that are free from material misstatement, whether due to fraud or error. The Board of Directors is further responsible for selecting and applying appropriate accounting policies and making accounting estimates that are reasonable in the circumstances.
Auditor’s responsibility
Our responsibility is to express an opinion on these financial statements based on our audit. We conducted our audit in accordance with Swiss law and Swiss Auditing Standards. Those standards require that we plan and perform the audit to obtain reasonable assurance whether the financial statements are free from material misstatement.
An audit involves performing procedures to obtain audit evidence about the amounts and disclosures in the financial statements. The procedures selected depend on the auditor’s judgment, including the assessment of the risks of material misstatement of the financial statements, whether due to fraud or error. In making those risk assessments, the auditor considers the internal control system relevant to the entity’s preparation of the financial statements in order to design audit procedures that are appropriate in the circumstances, but not for the purpose of expressing an opinion on the effectiveness of the entity’s internal control system. An audit also includes evaluating the appropriateness of the accounting policies used and the reasonableness of accounting estimates made, as well as evaluating the overall presentation of the financial statements. We believe that the audit evidence we have obtained is sufficient and appropriate to provide a basis for our audit opinion.

532
Opinion
In our opinion, the financial statements for the year ended 31 December 2013 comply with Swiss law and the company’s articles of incorporation.
Report on other legal requirements
We confirm that we meet the legal requirements on licensing according to the Auditor Oversight Act (AOA) and independence (Art. 728 Code of Obligations (CO) and Art. 11 AOA) and that there are no circumstances incompatible with our independence.
In accordance with article 728a paragraph 1 item 3 CO and Swiss Auditing Standard 890, we confirm that an internal control system exists, which has been designed for the preparation of financial statements according to the instructions of the Board of Directors.
We further confirm that the proposed appropriation of available earnings complies with Swiss law and the company’s articles of incorporation. We recommend that the financial statements submitted to you be approved.
Ernst & Young Ltd
| | |

| | 
|
Jonathan Bourne Licensed Audit Expert (Auditor in charge) | | Thomas Schneider Licensed Audit Expert |
533
Financial information
UBS AG (Parent Bank)
| | | | | | |

| | Phone | | 044 444 35 82 | | BDO Ltd |
| | Fax | | 044 444 35 35 | | Fabrikstrasse 50 |
| | www.bdo.ch | | CH-8031 Zurich |
Independent Auditor’s Report
to the Board of Directors of
UBS AG, Zurich and Basel
As special auditors of UBS AG, we have audited the issue of new shares and the preconditions for the adjustment of the provisions regarding the conditional capital increase according to article 4a of the articles of association in the period from 1 January 2013 to 31 December 2013 in accordance with article 653f paragraph 1 of the Swiss code of obligations (CO).
According to article 4a of the articles of association, the following possibilities for the issue of conditional capital exist:
| | • | | Paragraph 1; employee stock option plans of UBS AG, based on the resolution of the annual general meeting of 19 April 2006. |
| | • | | Paragraph 2; conversion rights and/or warrants granted in connection with the issuance of bonds or similar financial instruments, based on the resolution of the annual general meeting of 14 April 2010. |
Board of Directors’ Responsibility
The Board of Directors is responsible for the new share issue in accordance with the legal requirements and the company’s articles of incorporation.
Auditor’s Responsibility
Our responsibility is to express an opinion based on our audit as to whether the new share issue complies with Swiss law and the company’s articles of incorporation. We conducted our audit in accordance with Swiss Auditing Standards. Those standards require that we comply with ethical requirements and plan and perform the audit to obtain reasonable assurance about whether the new share issue complies with the legal requirements and the company’s articles of incorporation.
An audit involves performing procedures to obtain audit evidence so that significant breaches of the legal requirements and the company’s articles of incorporation for the new share issue may be identified with reasonable assurance. The procedures selected depend on the auditor’s judgement, including the assessment of the risks of material breaches of the requirements concerning the new share issue, whether due to fraud or error.
We believe that the audit evidence we have obtained is sufficient and appropriate to provide a basis for our audit opinion.
Opinion
In our opinion
| | • | | the issue of 6’751’836 new registered shares of a nominal value of CHF 0.10 per share relating to the employee stock option plans of UBS AG, according to article 4a paragraph 1 of the articles of association, was in accordance with the provisions of Swiss law and the company’s articles of association; |
| | • | | no new registered shares relating to the conversion rights and/or warrants granted in connection with the issuance of bonds or similar financial instruments, according to article 4a paragraph 2 of the articles of association, were issued in the reporting period. |
Zurich, 3 February 2014
BDO Ltd
| | |

| | 
|
Werner Schiesser Licensed audit expert | | Jürg Caspar Licensed audit expert |
BDO Ltd, a limited company under Swiss law, incorporated in Zurich, forms part of the international BDO Network of independent member firms.
534

Confirmation of the auditors concerning removal of conditional capital increase
to the Board of Directors of
UBS AG, Zurich and Basel
As special auditors of UBS AG, we have audited the expiration of options relating to the conditional capital increase according to article 4a paragraph 2 of the articles of association in accordance with the provisions of article 653i of the Swiss code of obligations.
The provision of evidence that the option rights have expired is the responsibility of the board of directors. Our responsibility is to express an opinion on the accuracy of this statement, based on our audit. We confirm that we meet the legal requirements on licensing and independence.
Our audit was conducted in accordance with the Swiss auditing standards, which require that an audit be planned and performed to obtain reasonable assurance as to whether the conclusion as to the expired option rights are free of material misstatement. We have performed the audit procedures considered appropriate in the circumstances. We believe that our audit provides a reasonable basis for our opinion.
In our opinion the option rights relating to 100’000’000 registered shares of a nominal value of CHF 0.10 per share according to article 4a paragraph 2 of the articles of association, have expired.
Zurich, 6 November 2013
BDO Ltd
| | |
 | |  |
Werner Schiesser Licensed Audit Expert | | Jurg Caspar Auditor in Charge Licensed Audit Expert |
BDO Ltd, with its statutory seat in Zurich, is the legally independent Swiss member firm of the international 800 network
535
Supplemental disclosures required
under SEC regulations
A – Introduction
The following pages contain supplemental UBS Group disclosures which are required under SEC regulations. UBS’s consolidated financial statements have been prepared in accordance with International Financial Reporting Standards (IFRS) as issued by the International Accounting Standards Board (IASB) and are denominated in Swiss francs (CHF), the reporting currency of the Group.
537
Financial information
Supplemental disclosures required under SEC regulations
B – Selected financial data
The tables below provide information concerning the noon purchase rate for the Swiss franc, expressed in United States dollars, or USD, per one Swiss franc. The noon purchase rate is the rate in New York City for cable transfers in foreign currencies
as certified for customs purposes by the Federal Reserve Bank of New York.
On 28 February 2014, the noon purchase rate was 1.1351 USD per 1 CHF.
| | | | | | | | | | | | | | | | |
| Year ended 31 December | | High | | | Low | | | Average rate1
(USD per 1 CHF) | | | At period end | |
| 2009 | | | 1.0016 | | | | 0.8408 | | | | 0.9260 | | | | 0.9654 | |
| | | | | | | | | | | | | | | | | |
| 2010 | | | 1.0673 | | | | 0.8610 | | | | 0.9670 | | | | 1.0673 | |
| | | | | | | | | | | | | | | | | |
| 2011 | | | 1.3706 | | | | 1.0251 | | | | 1.1398 | | | | 1.0668 | |
| | | | | | | | | | | | | | | | | |
| 2012 | | | 1.1174 | | | | 1.0043 | | | | 1.0724 | | | | 1.0923 | |
| | | | | | | | | | | | | | | | | |
| 2013 | | | 1.1292 | | | | 1.0190 | | | | 1.0826 | | | | 1.1231 | |
| | | | | | | | | | | | | | | | | |
| | | | |
| Month | | High | | | Low | | | | | | | |
| September 2013 | | | 1.1061 | | | | 1.0597 | | | | | | | | | |
| | | | | | | | | | | | | | | | | |
| October 2013 | | | 1.1216 | | | | 1.0913 | | | | | | | | | |
| | | | | | | | | | | | | | | | | |
| November 2013 | | | 1.1053 | | | | 1.0846 | | | | | | | | | |
| | | | | | | | | | | | | | | | | |
| December 2013 | | | 1.1292 | | | | 1.1018 | | | | | | | | | |
| | | | | | | | | | | | | | | | | |
| January 2014 | | | 1.1176 | | | | 1.0970 | | | | | | | | | |
| | | | | | | | | | | | | | | | | |
| February 2014 | | | 1.1351 | | | | 1.1050 | | | | | | | | | |
| | | | | | | | | | | | | | | | | |
1 The average of the noon purchase rates on the last business day of each full month during the relevant period.
Key figures
| | | | | | | | | | | | | | | | | | | | |
| | As of or for the year ended | |
| CHF million, except where indicated | | 31.12.13 | | | 31.12.12 | | | 31.12.11 | | | 31.12.10 | | | 31.12.09 | |
| Group results | | | | | | | | | | | | | | | | | | | | |
| | | | | | | | | | | | | | | | | | | | | |
| Operating income | | | 27,732 | | | | 25,423 | | | | 27,788 | | | | 31,994 | | | | 22,601 | |
| | | | | | | | | | | | | | | | | | | | | |
| Operating expenses | | | 24,461 | | | | 27,216 | | | | 22,482 | | | | 24,650 | | | | 25,128 | |
| | | | | | | | | | | | | | | | | | | | | |
| Operating profit/(loss) from continuing operations before tax | | | 3,272 | | | | (1,794 | ) | | | 5,307 | | | | 7,345 | | | | (2,527 | ) |
| | | | | | | | | | | | | | | | | | | | | |
| Net profit/(loss) attributable to UBS shareholders | | | 3,172 | | | | (2,480 | ) | | | 4,138 | | | | 7,452 | | | | (2,700 | ) |
| | | | | | | | | | | | | | | | | | | | | |
| Diluted earnings per share (CHF)1 | | | 0.83 | | | | (0.66 | ) | | | 1.08 | | | | 1.94 | | | | (0.74 | ) |
| | | | | | | | | | | | | | | | | | | | | |
| Key performance indicators, balance sheet and capital management, and additional information2 | | | | | | | | | | | | | | | | | | | | |
| | | | | | | | | | | | | | | | | | | | | |
| Performance | | | | | | | | | | | | | | | | | | | | |
| | | | | | | | | | | | | | | | | | | | | |
| Return on equity (RoE) (%) | | | 6.7 | | | | (5.1 | ) | | | 9.1 | | | | 18.0 | | | | (7.9 | ) |
| | | | | | | | | | | | | | | | | | | | | |
| Return on tangible equity (%)3 | | | 8.0 | | | | 1.6 | | | | 11.9 | | | | 24.7 | | | | (6.1 | ) |
| | | | | | | | | | | | | | | | | | | | | |
| Return on risk-weighted assets, gross (%)4 | | | 11.4 | | | | 12.0 | | | | 13.7 | | | | 15.5 | | | | 9.9 | |
| | | | | | | | | | | | | | | | | | | | | |
| Return on assets, gross (%) | | | 2.5 | | | | 1.9 | | | | 2.1 | | | | 2.3 | | | | 1.5 | |
| | | | | | | | | | | | | | | | | | | | | |
| Growth | | | | | | | | | | | | | | | | | | | | |
| | | | | | | | | | | | | | | | | | | | | |
| Net profit growth (%)5 | | | N/A | | | | N/A | | | | (44.5 | ) | | | N/A | | | | N/A | |
| | | | | | | | | | | | | | | | | | | | | |
| Net new money growth (%)6 | | | 1.4 | | | | 1.6 | | | | 1.9 | | | | (0.8 | ) | | | (7.1 | ) |
| | | | | | | | | | | | | | | | | | | | | |
| Efficiency | | | | | | | | | | | | | | | | | | | | |
| | | | | | | | | | | | | | | | | | | | | |
| Cost/income ratio (%) | | | 88.0 | | | | 106.6 | | | | 80.7 | | | | 76.9 | | | | 102.8 | |
| | | | | | | | | | | | | | | | | | | | | |
| Capital strength | | | | | | | | | | | | | | | | | | | | |
| | | | | | | | | | | | | | | | | | | | | |
| Common equity tier 1 capital ratio (%, phase-in)7 | | | 18.5 | | | | 15.3 | | | | | | | | | | | | | |
| | | | | | | | | | | | | | | | | | | | | |
| Common equity tier 1 capital ratio (%, fully applied)7 | | | 12.8 | | | | 9.8 | | | | | | | | | | | | | |
| | | | | | | | | | | | | | | | | | | | | |
| BIS tier 1 capital ratio, Basel 2.5 (%) | | | | | | | 21.3 | | | | 15.9 | | | | | | | | | |
| | | | | | | | | | | | | | | | | | | | | |
| BIS total capital ratio, Basel 2.5 (%) | | | | | | | 25.2 | | | | 17.2 | | | | | | | | | |
| | | | | | | | | | | | | | | | | | | | | |
| Swiss SRB leverage ratio (%, phase-in)8 | | | 4.7 | | | | 3.6 | | | | | | | | | | | | | |
| | | | | | | | | | | | | | | | | | | | | |
| Balance sheet and capital management | | | | | | | | | | | | | | | | | | | | |
| | | | | | | | | | | | | | | | | | | | | |
| Total assets | | | 1,009,860 | | | | 1,259,797 | | | | 1,416,962 | | | | 1,314,813 | | | | 1,338,239 | |
| | | | | | | | | | | | | | | | | | | | | |
| Equity attributable to UBS shareholders | | | 48,002 | | | | 45,949 | | | | 48,530 | | | | 43,728 | | | | 37,704 | |
| | | | | | | | | | | | | | | | | | | | | |
| Total book value per share (CHF)9 | | | 12.74 | | | | 12.26 | | | | 12.95 | | | | 11.53 | | | | 10.71 | |
| | | | | | | | | | | | | | | | | | | | | |
| Tangible book value per share (CHF)9 | | | 11.07 | | | | 10.54 | | | | 10.36 | | | | 8.94 | | | | 7.58 | |
| | | | | | | | | | | | | | | | | | | | | |
| Common equity tier 1 capital (phase-in)7 | | | 42,179 | | | | 40,032 | | | | | | | | | | | | | |
| | | | | | | | | | | | | | | | | | | | | |
| Common equity tier 1 capital (fully applied)7 | | | 28,908 | | | | 25,182 | | | | | | | | | | | | | |
| | | | | | | | | | | | | | | | | | | | | |
| Risk-weighted assets (phase-in)7 | | | 228,557 | | | | 261,800 | | | | | | | | | | | | | |
| | | | | | | | | | | | | | | | | | | | | |
| Risk-weighted assets (fully applied)7 | | | 225,153 | | | | 258,113 | | | | | | | | | | | | | |
| | | | | | | | | | | | | | | | | | | | | |
| Total capital ratio (%) (phase-in)7 | | | 22.2 | | | | 18.9 | | | | | | | | | | | | | |
| | | | | | | | | | | | | | | | | | | | | |
| Total capital ratio (%) (fully applied)7 | | | 15.4 | | | | 11.4 | | | | | | | | | | | | | |
| | | | | | | | | | | | | | | | | | | | | |
| BIS tier 1 capital, Basel 2.5 | | | | | | | 40,982 | | | | 38,370 | | | | | | | | | |
| | | | | | | | | | | | | | | | | | | | | |
| BIS risk-weighted assets, Basel 2.5 | | | | | | | 192,505 | | | | 240,962 | | | | | | | | | |
| | | | | | | | | | | | | | | | | | | | | |
1 Refer to “Note 9 Earnings per share (EPS) and shares outstanding” to the consolidated financial statements for more information.2 For the definitions of our key performance indicators, refer to the “Measurement of performance” section of this report.3 Net profit/loss attributable to UBS shareholders before amortization and impairment of goodwill and intangible assets (annualized as applicable)/average equity attributable to UBS shareholders less average goodwill and intangible assets.4 Based on Basel III risk-weighted assets (phase-in) for 2013. Based on Basel 2.5 risk-weighted assets for 2012. Based on Basel II risk-weighted assets for 2011, 2010 and 2009.5 Not meaningful and not included if either the reporting period or the comparison period is a loss period.6 Group net new money includes net new money for Retail & Corporate and excludes interest and dividend income.7 Based on the Basel III framework as applicable for Swiss systemically relevant banks (SRB). Numbers for 31 December 2012 are on a pro-forma basis. Refer to the “Capital management” section of this report for more information.8 Refer to the “Capital management” section of this report for more information.9 Refer to “UBS shares” in the “Capital management” section.
539
Financial information
Supplemental disclosures required under SEC regulations
Key figures (continued)
| | | | | | | | | | | | | | | | | | | | |
| | As of or for the year ended | |
| CHF million, except where indicated | | 31.12.13 | | | 31.12.12 | | | 31.12.11 | | | 31.12.10 | | | 31.12.09 | |
| Additional information | | | | | | | | | | | | | | | | | | | | |
| | | | | | | | | | | | | | | | | | | | | |
| Average equity of average assets (%) | | | 4.0 | | | | 3.4 | | | | 3.2 | | | | 2.7 | | | | 1.7 | |
| | | | | | | | | | | | | | | | | | | | | |
| Invested assets (CHF billion)1 | | | 2,390 | | | | 2,230 | | | | 2,088 | | | | 2,075 | | | | 2,160 | |
| | | | | | | | | | | | | | | | | | | | | |
| Market capitalization2 | | | 65,007 | | | | 54,729 | | | | 42,843 | | | | 58,803 | | | | 57,108 | |
| | | | | | | | | | | | | | | | | | | | | |
| Registered ordinary shares (number) | | | 3,842,002,069 | | | | 3,835,250,233 | | | | 3,832,121,899 | | | | 3,830,840,513 | | | | 3,558,112,753 | |
| | | | | | | | | | | | | | | | | | | | | |
| Treasury shares (number) | | | 73,800,252 | | | | 87,879,601 | | | | 84,955,551 | | | | 38,892,031 | | | | 37,553,872 | |
| | | | | | | | | | | | | | | | | | | | | |
| Personnel (full-time equivalents) | | | 60,205 | | | | 62,628 | | | | 64,820 | | | | 64,617 | | | | 65,233 | |
| | | | | | | | | | | | | | | | | | | | | |
| Americas | | | 21,317 | | | | 21,995 | | | | 22,924 | | | | 23,178 | | | | 23,834 | |
| | | | | | | | | | | | | | | | | | | | | |
of which: USA | | | 20,037 | | | | 20,833 | | | | 21,746 | | | | 22,031 | | | | 22,702 | |
| | | | | | | | | | | | | | | | | | | | | |
| Asia Pacific | | | 7,116 | | | | 7,426 | | | | 7,690 | | | | 7,263 | | | | 6,865 | |
| | | | | | | | | | | | | | | | | | | | | |
| Europe, Middle East and Africa | | | 10,052 | | | | 10,829 | | | | 11,019 | | | | 10,892 | | | | 10,484 | |
| | | | | | | | | | | | | | | | | | | | | |
of which: United Kingdom | | | 5,595 | | | | 6,459 | | | | 6,674 | | | | 6,634 | | | | 6,204 | |
| | | | | | | | | | | | | | | | | | | | | |
of which: Rest of Europe | | | 4,303 | | | | 4,202 | | | | 4,182 | | | | 4,122 | | | | 4,145 | |
| | | | | | | | | | | | | | | | | | | | | |
of which: Middle East and Africa | | | 153 | | | | 167 | | | | 162 | | | | 137 | | | | 134 | |
| | | | | | | | | | | | | | | | | | | | | |
| Switzerland | | | 21,720 | | | | 22,378 | | | | 23,188 | | | | 23,284 | | | | 24,050 | |
| | | | | | | | | | | | | | | | | | | | | |
1 Group invested assets includes invested assets for Retail & Corporate.2 Refer to “UBS shares” in the “Capital management” section.
Income statement data
| | | | | | | | | | | | | | | | | | | | |
| | For the year ended | |
| CHF million, except where indicated | | 31.12.13 | | | 31.12.12 | | | 31.12.11 | | | 31.12.10 | | | 31.12.09 | |
| Interest income | | | 13,137 | | | | 15,968 | | | | 17,969 | | | | 18,872 | | | | 23,461 | |
| | | | | | | | | | | | | | | | | | | | | |
| Interest expense | | | (7,351 | ) | | | (9,990 | ) | | | (11,143 | ) | | | (12,657 | ) | | | (17,016 | ) |
| | | | | | | | | | | | | | | | | | | | | |
| Net interest income | | | 5,786 | | | | 5,978 | | | | 6,826 | | | | 6,215 | | | | 6,446 | |
| | | | | | | | | | | | | | | | | | | | | |
| Credit loss (expense)/recovery | | | (50 | ) | | | (118 | ) | | | (84 | ) | | | (66 | ) | | | (1,832 | ) |
| | | | | | | | | | | | | | | | | | | | | |
| Net interest income after credit loss (expense)/recovery | | | 5,736 | | | | 5,860 | | | | 6,742 | | | | 6,149 | | | | 4,614 | |
| | | | | | | | | | | | | | | | | | | | | |
| Net fee and commission income | | | 16,287 | | | | 15,396 | | | | 15,236 | | | | 17,160 | | | | 17,712 | |
| | | | | | | | | | | | | | | | | | | | | |
| Net trading income | | | 5,130 | | | | 3,526 | | | | 4,343 | | | | 7,471 | | | | (324 | ) |
| | | | | | | | | | | | | | | | | | | | | |
| Other income | | | 580 | | | | 641 | | | | 1,467 | | | | 1,214 | | | | 599 | |
| | | | | | | | | | | | | | | | | | | | | |
| Total operating income | | | 27,732 | | | | 25,423 | | | | 27,788 | | | | 31,994 | | | | 22,601 | |
| | | | | | | | | | | | | | | | | | | | | |
| Total operating expenses | | | 24,461 | | | | 27,216 | | | | 22,482 | | | | 24,650 | | | | 25,128 | |
| | | | | | | | | | | | | | | | | | | | | |
| Operating profit/(loss) from continuing operations before tax | | | 3,272 | | | | (1,794 | ) | | | 5,307 | | | | 7,345 | | | | (2,527 | ) |
| | | | | | | | | | | | | | | | | | | | | |
| Tax expense/(benefit) | | | (110 | ) | | | 461 | | | | 901 | | | | (409 | ) | | | (444 | ) |
| | | | | | | | | | | | | | | | | | | | | |
| Net profit/(loss) from continuing operations | | | 3,381 | | | | (2,255 | ) | | | 4,406 | | | | 7,754 | | | | (2,082 | ) |
| | | | | | | | | | | | | | | | | | | | | |
| Net profit/(loss) from discontinued operations | | | 0 | | | | 0 | | | | 0 | | | | 2 | | | | (7 | ) |
| | | | | | | | | | | | | | | | | | | | | |
| Net profit/(loss) | | | 3,381 | | | | (2,255 | ) | | | 4,406 | | | | 7,756 | | | | (2,089 | ) |
| | | | | | | | | | | | | | | | | | | | | |
| Net profit/(loss) attributable to preferred noteholders | | | 204 | | | | 220 | | | | | | | | | | | | | |
| | | | | | | | | | | | | | | | | | | | | |
| Net profit/(loss) attributable to non-controlling interests | | | 5 | | | | 5 | | | | 268 | | | | 304 | | | | 610 | |
| | | | | | | | | | | | | | | | | | | | | |
| Net profit/(loss) attributable to UBS shareholders | | | 3,172 | | | | (2,480 | ) | | | 4,138 | | | | 7,452 | | | | (2,700 | ) |
| | | | | | | | | | | | | | | | | | | | | |
| Cost/income ratio (%)1 | | | 88.0 | | | | 106.6 | | | | 80.7 | | | | 76.9 | | | | 102.8 | |
| | | | | | | | | | | | | | | | | | | | | |
| Per share data (CHF) | | | | | | | | | | | | | | | | | | | | |
| | | | | | | | | | | | | | | | | | | | | |
| Basic2 | | | 0.84 | | | | (0.66 | ) | | | 1.10 | | | | 1.97 | | | | (0.74 | ) |
| | | | | | | | | | | | | | | | | | | | | |
| Diluted2 | | | 0.83 | | | | (0.66 | ) | | | 1.08 | | | | 1.94 | | | | (0.74 | ) |
| | | | | | | | | | | | | | | | | | | | | |
| Cash dividends declared per share (CHF)3,4 | | | 0.25 | | | | 0.15 | | | | 0.10 | | | | N/A | | | | N/A | |
| | | | | | | | | | | | | | | | | | | | | |
| Cash dividends declared per share (USD)3,4 | | | | | | | 0.16 | | | | 0.11 | | | | N/A | | | | N/A | |
| | | | | | | | | | | | | | | | | | | | | |
| Dividend payout ratio (%)3,4 | | | 29.8 | | | | (22.7 | ) | | | 9.1 | | | | N/A | | | | N/A | |
| | | | | | | | | | | | | | | | | | | | | |
| Rates of return (%) | | | | | | | | | | | | | | | | | | | | |
| | | | | | | | | | | | | | | | | | | | | |
| Return on equity attributable to UBS shareholders5 | | | 6.7 | | | | (5.1 | ) | | | 9.1 | | | | 18.0 | | | | (7.9 | ) |
| | | | | | | | | | | | | | | | | | | | | |
| Return on average equity | | | 6.7 | | | | (5.0 | ) | | | 9.1 | | | | 17.9 | | | | (8.7 | ) |
| | | | | | | | | | | | | | | | | | | | | |
| Return on average assets | | | 0.3 | | | | (0.2 | ) | | | 0.3 | | | | 0.5 | | | | (0.1 | ) |
| | | | | | | | | | | | | | | | | | | | | |
1 Operating expenses/operating income before credit loss expense.2 Refer to “Note 9 Earnings per share (EPS) and shares outstanding” to the consolidated financial statements for more information.3 Dividends and/or distribution of capital contribution reserve are normally approved and paid in the year subsequent to the reporting period.4 For the year 2013, an amount of CHF 0.25 per share will be paid out of capital contribution reserve on 15 May 2014, subject to approval by shareholders at the Annual General Meeting on 7 May 2014. The USD amount per share will be determined on 12 May 2014.5 Net profit attributable to UBS shareholders/average equity attributable to UBS shareholders. The calculation excludes expected deductions for dividends and distribution of capital contribution reserve.
541
Financial information
Supplemental disclosures required under SEC regulations
Balance sheet data
| | | | | | | | | | | | | | | | | | | | |
| CHF million | | 31.12.13 | | | 31.12.12 | | | 31.12.11 | | | 31.12.10 | | | 31.12.09 | |
| Assets | | | | | | | | | | | | | | | | | | | | |
| | | | | | | | | | | | | | | | | | | | | |
| Total assets | | | 1,009,860 | | | | 1,259,797 | | | | 1,416,962 | | | | 1,314,813 | | | | 1,338,239 | |
| | | | | | | | | | | | | | | | | | | | | |
| Cash and balances with central banks | | | 80,879 | | | | 66,383 | | | | 40,638 | | | | 26,939 | | | | 20,899 | |
| | | | | | | | | | | | | | | | | | | | | |
| Due from banks | | | 17,170 | | | | 21,220 | | | | 23,218 | | | | 17,133 | | | | 16,804 | |
| | | | | | | | | | | | | | | | | | | | | |
| Cash collateral on securities borrowed | | | 27,496 | | | | 37,372 | | | | 58,763 | | | | 62,454 | | | | 63,507 | |
| | | | | | | | | | | | | | | | | | | | | |
| Reverse repurchase agreements | | | 91,563 | | | | 130,941 | | | | 213,501 | | | | 142,790 | | | | 116,689 | |
| | | | | | | | | | | | | | | | | | | | | |
| Trading portfolio assets | | | 122,848 | | | | 160,564 | | | | 181,525 | | | | 228,815 | | | | 232,258 | |
| | | | | | | | | | | | | | | | | | | | | |
of which: assets pledged as collateral which may be sold or repledged by counterparties | | | 42,449 | | | | 44,698 | | | | 39,936 | | | | 61,352 | | | | 44,221 | |
| | | | | | | | | | | | | | | | | | | | | |
| Positive replacement values | | | 245,835 | | | | 418,957 | | | | 486,584 | | | | 401,146 | | | | 421,694 | |
| | | | | | | | | | | | | | | | | | | | | |
| Cash collateral receivables on derivative instruments | | | 28,007 | | | | 30,413 | | | | 41,322 | | | | 38,071 | | | | 53,774 | |
| | | | | | | | | | | | | | | | | | | | | |
| Loans | | | 286,959 | | | | 279,901 | | | | 266,604 | | | | 262,877 | | | | 266,477 | |
| | | | | | | | | | | | | | | | | | | | | |
| Financial investments available-for-sale | | | 59,525 | | | | 66,230 | | | | 53,174 | | | | 74,768 | | | | 81,757 | |
| | | | | | | | | | | | | | | | | | | | | |
| Other assets | | | 20,228 | | | | 17,244 | | | | 15,492 | | | | 24,973 | | | | 26,459 | |
| | | | | | | | | | | | | | | | | | | | | |
| Liabilities | | | | | | | | | | | | | | | | | | | | |
| | | | | | | | | | | | | | | | | | | | | |
| Due to banks | | | 12,862 | | | | 23,024 | | | | 30,201 | | | | 41,490 | | | | 31,922 | |
| | | | | | | | | | | | | | | | | | | | | |
| Cash collateral on securities lent | | | 9,491 | | | | 9,203 | | | | 8,136 | | | | 6,651 | | | | 7,995 | |
| | | | | | | | | | | | | | | | | | | | | |
| Repurchase agreements | | | 13,811 | | | | 38,557 | | | | 102,429 | | | | 74,796 | | | | 64,175 | |
| | | | | | | | | | | | | | | | | | | | | |
| Trading portfolio liabilities | | | 26,609 | | | | 34,247 | | | | 39,480 | | | | 54,975 | | | | 47,469 | |
| | | | | | | | | | | | | | | | | | | | | |
| Negative replacement values | | | 239,953 | | | | 395,260 | | | | 473,400 | | | | 393,762 | | | | 409,943 | |
| | | | | | | | | | | | | | | | | | | | | |
| Cash collateral payables on derivative instruments | | | 49,138 | | | | 71,148 | | | | 67,114 | | | | 58,924 | | | | 66,097 | |
| | | | | | | | | | | | | | | | | | | | | |
| Financial liabilities designated at fair value | | | 69,901 | | | | 91,901 | | | | 88,982 | | | | 100,756 | | | | 112,653 | |
| | | | | | | | | | | | | | | | | | | | | |
| Due to customers | | | 390,825 | | | | 373,459 | | | | 342,409 | | | | 332,301 | | | | 339,263 | |
| | | | | | | | | | | | | | | | | | | | | |
| Debt issued | | | 81,586 | | | | 104,837 | | | | 140,617 | | | | 130,271 | | | | 131,352 | |
| | | | | | | | | | | | | | | | | | | | | |
| Other liabilities | | | 62,777 | | | | 66,523 | | | | 69,633 | | | | 70,412 | | | | 79,643 | |
| | | | | | | | | | | | | | | | | | | | | |
| Equity attributable to UBS shareholders | | | 48,002 | | | | 45,949 | | | | 48,530 | | | | 43,728 | | | | 37,704 | |
| | |
Ratio of earnings to fixed charges | |
The following table sets forth UBS’s ratio of earnings to fixed charges on an IFRS basis for the periods indicated. The ratios are calculated based on earnings from continuing operations. Ratios of earnings to fixed charges and preferred share dividends are not presented as there were no mandatory preferred share dividends in any of the periods indicated. | |
| | | For the year ended | |
| | | 31.12.13 | | | | 31.12.12 | | | | 31.12.11 | | | | 31.12.10 | | | | 31.12.09 | |
| | | 1.41 | | | | 0.83 | 1 | | | 1.42 | | | | 1.52 | | | | 0.83 | |
| | |
1 The ratio of earnings to fixed charges for the year ended 31 December 2012 was restated upon the adoption of IFRS 10. The ratios for the years ended prior to 31 December 2012 were not restated in line with the transition requirements of IFRS 10. | |
542
C – Information on the company
Property, plant and equipment
At 31 December 2013, UBS operated about 864 business and banking locations worldwide, of which about 42% were in Switzerland, 42% in the Americas, 11% in the rest of Europe, Middle East and Africa and 5% in Asia Pacific. Of the business and banking locations in Switzerland, 31% were owned directly
by UBS, with the remainder, along with most of UBS’s offices outside Switzerland, being held under commercial leases. These premises are subject to continuous maintenance and upgrading and are considered suitable and adequate for current and anticipated operations.
543
Financial information
Supplemental disclosures required under SEC regulations
D – Information required by industry guide 3
Selected statistical information
The following tables set forth selected statistical information regarding the Group’s banking operations extracted from the Financial Statements. Unless otherwise indicated, average balances for the years ended 31 December 2013, 31 December 2012
and 31 December 2011 are calculated from monthly data. The distinction between domestic and foreign is generally based on the booking location. For loans, this method is not significantly different from an analysis based on the domicile of the borrower.
544
Average balances and interest rates
The following table sets forth average interest-earning assets and average interest-bearing liabilities, along with the average yield, for the years ended.
| | | | | | | | | | | | | | | | | | | | | | | | | | | | | | | | | | | | |
| | 31.12.13 | | | 31.12.12 | | | 31.12.11 | |
| CHF million, except where indicated | | Average
balance | | | Interest
income | | | Average
yield (%) | | | Average
balance | | | Interest
income | | | Average
yield (%) | | | Average
balance | | | Interest
income | | | Average
yield (%) | |
| | | | | | | | | |
| Assets | | | | | | | | | | | | | | | | | | | | | | | | | | | | | | | | | | | | |
| | | | | | | | | | | | | | | | | | | | | | | | | | | | | | | | | | | | | |
| Due from banks | | | | | | | | | | | | | | | | | | | | | | | | | | | | | | | | | | | | |
| | | | | | | | | | | | | | | | | | | | | | | | | | | | | | | | | | | | | |
Domestic | | | 3,051 | | | | 8 | | | | 0.3 | | | | 3,566 | | | | 33 | | | | 0.9 | | | | 3,465 | | | | 22 | | | | 0.6 | |
| | | | | | | | | | | | | | | | | | | | | | | | | | | | | | | | | | | | | |
Foreign | | | 17,301 | | | | 82 | | | | 0.5 | | | | 24,718 | | | | 282 | | | | 1.1 | | | | 17,623 | | | | 142 | | | | 0.8 | |
| | | | | | | | | | | | | | | | | | | | | | | | | | | | | | | | | | | | | |
| Cash collateral on securities borrowed and reverse repurchase agreements | | | | | | | | | | | | | | | | | | | | | | | | | | | | | | | | | | | | |
| | | | | | | | | | | | | | | | | | | | | | | | | | | | | | | | | | | | | |
Domestic | | | 11,479 | | | | 10 | | | | 0.1 | | | | 4,884 | | | | 4 | | | | 0.1 | | | | 8,025 | | | | 15 | | | | 0.2 | |
| | | | | | | | | | | | | | | | | | | | | | | | | | | | | | | | | | | | | |
Foreign | | | 162,479 | | | | 575 | | | | 0.4 | | | | 263,958 | | | | 1,155 | | | | 0.4 | | | | 281,544 | | | | 1,485 | | | | 0.5 | |
| | | | | | | | | | | | | | | | | | | | | | | | | | | | | | | | | | | | | |
| Trading portfolio assets | | | | | | | | | | | | | | | | | | | | | | | | | | | | | | | | | | | | |
| | | | | | | | | | | | | | | | | | | | | | | | | | | | | | | | | | | | | |
Domestic | | | 5,189 | | | | 177 | | | | 3.4 | | | | 6,019 | | | | 235 | | | | 3.9 | | | | 12,821 | | | | 299 | | | | 2.3 | |
| | | | | | | | | | | | | | | | | | | | | | | | | | | | | | | | | | | | | |
Foreign taxable | | | 119,894 | | | | 2,736 | | | | 2.3 | | | | 156,581 | | | | 4,247 | | | | 2.7 | | | | 189,861 | | | | 5,163 | | | | 2.7 | |
| | | | | | | | | | | | | | | | | | | | | | | | | | | | | | | | | | | | | |
Foreign non-taxable | | | | | | | | | | | | | | | | | | | | | | | | | | | 1,313 | | | | 4 | | | | 0.3 | |
| | | | | | | | | | | | | | | | | | | | | | | | | | | | | | | | | | | | | |
Foreign total | | | 119,894 | | | | 2,736 | | | | 2.3 | | | | 156,581 | | | | 4,247 | | | | 2.7 | | | | 191,174 | | | | 5,167 | | | | 2.7 | |
| | | | | | | | | | | | | | | | | | | | | | | | | | | | | | | | | | | | | |
| Cash collateral receivables on derivative instruments | | | | | | | | | | | | | | | | | | | | | | | | | | | | | | | | | | | | |
| | | | | | | | | | | | | | | | | | | | | | | | | | | | | | | | | | | | | |
Domestic | | | 155 | | | | 0 | | | | 0.0 | | | | 9 | | | | 0 | | | | 0.0 | | | | 21 | | | | 0 | | | | 0.0 | |
| | | | | | | | | | | | | | | | | | | | | | | | | | | | | | | | | | | | | |
Foreign | | | 29,576 | | | | 70 | | | | 0.2 | | | | 36,895 | | | | 143 | | | | 0.4 | | | | 37,696 | | | | 324 | | | | 0.9 | |
| | | | | | | | | | | | | | | | | | | | | | | | | | | | | | | | | | | | | |
| Financial assets designated at fair value | | | | | | | | | | | | | | | | | | | | | | | | | | | | | | | | | | | | |
| | | | | | | | | | | | | | | | | | | | | | | | | | | | | | | | | | | | | |
Domestic | | | 414 | | | | 0 | | | | 0.0 | | | | 454 | | | | 0 | | | | 0.0 | | | | 493 | | | | 0 | | | | 0.0 | |
| | | | | | | | | | | | | | | | | | | | | | | | | | | | | | | | | | | | | |
Foreign | | | 10,113 | | | | 364 | | | | 3.6 | | | | 8,790 | | | | 369 | | | | 4.2 | | | | 8,262 | | | | 248 | | | | 3.0 | |
| | | | | | | | | | | | | | | | | | | | | | | | | | | | | | | | | | | | | |
| Loans | | | | | | | | | | | | | | | | | | | | | | | | | | | | | | | | | | | | |
| | | | | | | | | | | | | | | | | | | | | | | | | | | | | | | | | | | | | |
Domestic | | | 189,969 | | | | 3,974 | | | | 2.1 | | | | 185,969 | | | | 4,280 | | | | 2.3 | | | | 182,125 | | | | 4,604 | | | | 2.5 | |
| | | | | | | | | | | | | | | | | | | | | | | | | | | | | | | | | | | | | |
Foreign | | | 100,027 | | | | 2,420 | | | | 2.4 | | | | 88,246 | | | | 2,150 | | | | 2.4 | | | | 82,755 | | | | 2,203 | | | | 2.7 | |
| | | | | | | | | | | | | | | | | | | | | | | | | | | | | | | | | | | | | |
| Financial investments available-for-sale | | | | | | | | | | | | | | | | | | | | | | | | | | | | | | | | | | | | |
| | | | | | | | | | | | | | | | | | | | | | | | | | | | | | | | | | | | | |
Domestic | | | 1,980 | | | | 11 | | | | 0.6 | | | | 1,572 | | | | 8 | | | | 0.5 | | | | 3,465 | | | | 4 | | | | 0.1 | |
| | | | | | | | | | | | | | | | | | | | | | | | | | | | | | | | | | | | | |
Foreign taxable | | | 60,093 | | | | 310 | | | | 0.5 | | | | 61,233 | | | | 373 | | | | 0.6 | | | | 60,026 | | | | 611 | | | | 1.0 | |
| | | | | | | | | | | | | | | | | | | | | | | | | | | | | | | | | | | | | |
Foreign non-taxable | | | | | | | | | | | | | | | | | | | | | | | | | | | | | | | | | | | | |
| | | | | | | | | | | | | | | | | | | | | | | | | | | | | | | | | | | | | |
Foreign total | | | 60,093 | | | | 310 | | | | 0.5 | | | | 61,233 | | | | 373 | | | | 0.6 | | | | 60,026 | | | | 611 | | | | 1.0 | |
| | | | | | | | | | | | | | | | | | | | | | | | | | | | | | | | | | | | | |
| Other interest-earning assets | | | | | | | | | | | | | | | | | | | | | | | | | | | | | | | | | | | | |
| | | | | | | | | | | | | | | | | | | | | | | | | | | | | | | | | | | | | |
Domestic | | | | | | | | | | | | | | | | | | | | | | | | | | | | | | | | | | | | |
| | | | | | | | | | | | | | | | | | | | | | | | | | | | | | | | | | | | | |
Foreign | | | 8,953 | | | | 430 | | | | 4.8 | | | | 7,143 | | | | 439 | | | | 6.1 | | | | 12,001 | | | | 501 | | | | 4.2 | |
| | | | | | | | | | | | | | | | | | | | | | | | | | | | | | | | | | | | | |
| Total interest-earning assets | | | 720,674 | | | | 11,168 | | | | 1.5 | | | | 850,037 | | | | 13,718 | | | | 1.6 | | | | 901,496 | | | | 15,624 | | | | 1.7 | |
| | | | | | | | | | | | | | | | | | | | | | | | | | | | | | | | | | | | | |
Net interest income on swaps | | | | | | | 1,528 | | | | | | | | | | | | 1,804 | | | | | | | | | | | | 1,923 | | | | | |
| | | | | | | | | | | | | | | | | | | | | | | | | | | | | | | | | | | | | |
Interest income on off-balance sheet securities and other | | | | | | | 441 | | | | | | | | | | | | 446 | | | | | | | | | | | | 422 | | | | | |
| | | | | | | | | | | | | | | | | | | | | | | | | | | | | | | | | | | | | |
| Interest income and average interest-earning assets | | | 720,674 | | | | 13,137 | | | | 1.8 | | | | 850,037 | | | | 15,968 | | | | 1.9 | | | | 901,496 | | | | 17,969 | | | | 2.0 | |
| | | | | | | | | | | | | | | | | | | | | | | | | | | | | | | | | | | | | |
| Non-interest-earning assets | | | | | | | | | | | | | | | | | | | | | | | | | | | | | | | | | | | | |
| | | | | | | | | | | | | | | | | | | | | | | | | | | | | | | | | | | | | |
Positive replacement values | | | 337,092 | | | | | | | | | | | | 460,849 | | | | | | | | | | | | 410,839 | | | | | | | | | |
| | | | | | | | | | | | | | | | | | | | | | | | | | | | | | | | | | | | | |
Fixed assets | | | 6,054 | | | | | | | | | | | | 5,859 | | | | | | | | | | | | 5,420 | | | | | | | | | |
| | | | | | | | | | | | | | | | | | | | | | | | | | | | | | | | | | | | | |
Other | | | 115,921 | | | | | | | | | | | | 130,902 | | | | | | | | | | | | 86,469 | | | | | | | | | |
| | | | | | | | | | | | | | | | | | | | | | | | | | | | | | | | | | | | | |
| Total average assets | | | 1,179,741 | | | | | | | | | | | | 1,447,647 | | | | | | | | | | | | 1,404,224 | | | | | | | | | |
| | | | | | | | | | | | | | | | | | | | | | | | | | | | | | | | | | | | | |
545
Financial information
Supplemental disclosures required under SEC regulations
Average balances and interest rates (continued)
| | | | | | | | | | | | | | | | | | | | | | | | | | | | | | | | | | | | |
| | 31.12.13 | | | 31.12.12 | | | 31.12.11 | |
| CHF million, except where indicated | | Average
balance | | | Interest
expense | | | Average
interest
rate (%) | | | Average
balance | | | Interest
expense | | | Average
interest
rate (%) | | | Average
balance | | | Interest
expense | | | Average
interest
rate (%) | |
| | | | | | | | | |
| Liabilities and equity | | | | | | | | | | | | | | | | | | | | | | | | | | | | | | | | | | | | |
| | | | | | | | | | | | | | | | | | | | | | | | | | | | | | | | | | | | | |
| Due to banks | | | | | | | | | | | | | | | | | | | | | | | | | | | | | | | | | | | | |
| | | | | | | | | | | | | | | | | | | | | | | | | | | | | | | | | | | | | |
Domestic | | | 13,859 | | | | 37 | | | | 0.3 | | | | 25,843 | | | | 61 | | | | 0.2 | | | | 25,672 | | | | 259 | | | | 1.0 | |
Foreign | | | 4,073 | | | | 24 | | | | 0.6 | | | | 7,709 | | | | 65 | | | | 0.8 | | | | 10,250 | | | | 93 | | | | 0.9 | |
| Cash collateral on securities lent and repurchase agreements | | | | | | | | | | | | | | | | | | | | | | | | | | | | | | | | | | | | |
Domestic | | | 5,344 | | | | 2 | | | | 0.0 | | | | 6,289 | | | | 7 | | | | 0.1 | | | | 8,836 | | | | 12 | | | | 0.1 | |
Foreign | | | 65,088 | | | | 344 | | | | 0.5 | | | | 148,734 | | | | 768 | | | | 0.5 | | | | 168,429 | | | | 969 | | | | 0.6 | |
| Trading portfolio liabilities | | | | | | | | | | | | | | | | | | | | | | | | | | | | | | | | | | | | |
Domestic | | | 628 | | | | 12 | | | | 1.9 | | | | 886 | | | | 18 | | | | 2.0 | | | | 1,095 | | | | 26 | | | | 2.3 | |
Foreign | | | 29,874 | | | | 1,834 | | | | 6.1 | | | | 47,002 | | | | 2,424 | | | | 5.2 | | | | 52,373 | | | | 2,826 | | | | 5.4 | |
| Cash collateral payables on derivative instruments | | | | | | | | | | | | | | | | | | | | | | | | | | | | | | | | | | | | |
Domestic | | | 540 | | | | 0 | | | | 0.0 | | | | 1,131 | | | | 0 | | | | 0 | | | | 357 | | | | 0 | | | | 0 | |
Foreign | | | 59,896 | | | | 65 | | | | 0.1 | | | | 67,955 | | | | 134 | | | | 0.2 | | | | 58,731 | | | | 281 | | | | 0.5 | |
| Financial liabilities designated at fair value | | | | | | | | | | | | | | | | | | | | | | | | | | | | | | | | | | | | |
Domestic | | | 1,207 | | | | 9 | | | | 0.7 | | | | 1,335 | | | | 11 | | | | 0.8 | | | | 1,548 | | | | 10 | | | | 0.7 | |
Foreign | | | 79,182 | | | | 1,188 | | | | 1.5 | | | | 90,007 | | | | 1,733 | | | | 1.9 | | | | 91,920 | | | | 1,982 | | | | 2.2 | |
| Due to customers | | | | | | | | | | | | | | | | | | | | | | | | | | | | | | | | | | | | |
Domestic demand deposits | | | 126,953 | | | | 60 | | | | 0.0 | | | | 111,975 | | | | 95 | | | | 0.1 | | | | 95,679 | | | | 132 | | | | 0.1 | |
Domestic savings deposits | | | 95,937 | | | | 246 | | | | 0.3 | | | | 90,312 | | | | 356 | | | | 0.4 | | | | 82,004 | | | | 422 | | | | 0.5 | |
Domestic time deposits | | | 4,379 | | | | 15 | | | | 0.3 | | | | 4,821 | | | | 30 | | | | 0.6 | | | | 6,672 | | | | 41 | | | | 0.6 | |
Domestic total | | | 227,268 | | | | 321 | | | | 0.1 | | | | 207,108 | | | | 481 | | | | 0.2 | | | | 184,355 | | | | 595 | | | | 0.3 | |
Foreign1 | | | 155,312 | | | | 373 | | | | 0.2 | | | | 153,379 | | | | 594 | | | | 0.4 | | | | 145,772 | | | | 696 | | | | 0.5 | |
| Short-term debt | | | | | | | | | | | | | | | | | | | | | | | | | | | | | | | | | | | | |
Domestic | | | 1,703 | | | | 3 | | | | 0.2 | | | | 1,776 | | | | 9 | | | | 0.5 | | | | 1,303 | | | | 4 | | | | 0.3 | |
Foreign | | | 33,363 | | | | 170 | | | | 0.5 | | | | 48,525 | | | | 365 | | | | 0.8 | | | | 57,873 | | | | 382 | | | | 0.7 | |
| Long-term debt | | | | | | | | | | | | | | | | | | | | | | | | | | | | | | | | | | | | |
Domestic | | | 11,823 | | | | 281 | | | | 2.4 | | | | 11,188 | | | | 264 | | | | 2.4 | | | | 12,705 | | | | 126 | | | | 1.0 | |
Foreign | | | 50,053 | | | | 2,131 | | | | 4.3 | | | | 62,053 | | | | 2,525 | | | | 4.1 | | | | 57,830 | | | | 2,394 | | | | 4.1 | |
| Other interest-bearing liabilities | | | | | | | | | | | | | | | | | | | | | | | | | | | | | | | | | | | | |
Domestic | | | | | | | | | | | | | | | | | | | | | | | | | | | | | | | | | | | | |
Foreign | | | 35,706 | | | | 67 | | | | 0.2 | | | | 36,823 | | | | 98 | | | | 0.3 | | | | 36,926 | | | | 116 | | | | 0.3 | |
| | | | | | | | | | | | | | | | | | | | | | | | | | | | | | | | | | | | | |
| Total interest-bearing liabilities | | | 774,920 | | | | 6,863 | | | | 0.9 | | | | 917,743 | | | | 9,557 | | | | 1.0 | | | | 915,975 | | | | 10,772 | | | | 1.2 | |
Interest expense on off-balance sheet securities | | | | | | | 489 | | | | | | | | | | | | 433 | | | | | | | | | | | | 371 | | | | | |
| | | | | | | | | | | | | | | | | | | | | | | | | | | | | | | | | | | | | |
| Interest expense and average interest-bearing liabilities | | | 774,920 | | | | 7,351 | | | | | | | | 917,743 | | | | 9,990 | | | | | | | | 915,975 | | | | 11,143 | | | | | |
| Non-interest-bearing liabilities | | | | | | | | | | | | | | | | | | | | | | | | | | | | | | | | | | | | |
Negative replacement values | | | 321,004 | | | | | | | | | | | | 443,881 | | | | | | | | | | | | 402,535 | | | | | | | | | |
Other | | | 34,188 | | | | | | | | | | | | 33,722 | | | | | | | | | | | | 35,672 | | | | | | | | | |
| | | | | | | | | | | | | | | | | | | | | | | | | | | | | | | | | | | | | |
| Total liabilities | | | 1,130,111 | | | | | | | | | | | | 1,395,346 | | | | | | | | | | | | 1,354,182 | | | | | | | | | |
| Total equity | | | 49,630 | | | | | | | | | | | | 52,301 | | | | | | | | | | | | 50,042 | | | | | | | | | |
| | | | | | | | | | | | | | | | | | | | | | | | | | | | | | | | | | | | | |
| Total average liabilities and equity | | | 1,179,741 | | | | | | | | | | | | 1,447,647 | | | | | | | | | | | | 1,404,224 | | | | | | | | | |
| | | | | | | | | | | | | | | | | | | | | | | | | | | | | | | | | | | | | |
| Net interest income | | | | | | | 5,786 | | | | | | | | | | | | 5,978 | | | | | | | | | | | | 6,826 | | | | | |
| Net yield on interest-earning assets | | | | | | | | | | | 0.8 | | | | | | | | | | | | 0.7 | | | | | | | | | | | | 0.8 | |
| | | | | | | | | | | | | | | | | | | | | | | | | | | | | | | | | | | | | |
1 Due to customers in foreign offices consists mainly of time deposits.
The percentage of total average interest-earning assets attributable to foreign activities was 71% for 2013 (76% for 2012 and 77% for 2011). The percentage of total average interest-bearing liabilities attributable to foreign activities was 66% for 2013 (72% for 2012 and 74% for 2011). All assets and liabilities are translated into CHF at uniform month-end rates. Interest income and expense are translated at monthly average rates.
Average rates earned and paid on assets and liabilities can change from period to period based on the changes in interest rates in general, but are also affected by changes in the currency mix included in the assets and liabilities. This is especially true for foreign assets and liabilities. Tax-exempt income is not recorded on a tax-equivalent basis. For all three years presented, tax-exempt income is considered to be insignificant and the impact from such income is therefore negligible.
Analysis of changes in interest income and expense
The following tables allocate, by categories of interest-earning assets and interest-bearing liabilities, the changes in interest income and expense due to changes in volume and interest rates for the year ended 31 December 2013 compared with the year ended 31 December 2012, and for the year ended 31 December 2012 compared with the year ended 31 December 2011.
Volume and rate variances have been calculated on movements in average balances and changes in interest rates. Changes due to a combination of volume and rates have been allocated proportionally. Refer to the appropriate section of Industry Guide 3 for a discussion of the treatment of impaired and non-performing loans.
| | | | | | | | | | | | | | | | | | | | | | | | |
| | 2013 compared with 2012 | | | 2012 compared with 2011 | |
| | Increase/(decrease)
due to changes in | | | | | | Increase/(decrease)
due to changes in | | | | |
| CHF million | | Average
volume | | | Average
interest rate | | | Net
change | | | Average
volume | | | Average
interest rate | | | Net
change | |
| | | | | | |
| Interest income from interest-earning assets | | | | | | | | | | | | | | | | | | | | | | | | |
| | | | | | | | | | | | | | | | | | | | | | | | | |
| Due from banks | | | | | | | | | | | | | | | | | | | | | | | | |
Domestic | | | (5 | ) | | | (20 | ) | | | (25 | ) | | | 1 | | | | 10 | | | | 11 | |
Foreign | | | (82 | ) | | | (118 | ) | | | (200 | ) | | | 57 | | | | 83 | | | | 140 | |
| Cash collateral on securities borrowed and reverse repurchase agreements | | | | | | | | | | | | | | | | | | | | | | | | |
Domestic | | | 7 | | | | (1 | ) | | | 6 | | | | (6 | ) | | | (5 | ) | | | (11 | ) |
Foreign | | | (406 | ) | | | (174 | ) | | | (580 | ) | | | (88 | ) | | | (242 | ) | | | (330 | ) |
| Trading portfolio assets | | | | | | | | | | | | | | | | | | | | | | | | |
Domestic | | | (32 | ) | | | (26 | ) | | | (58 | ) | | | (156 | ) | | | 92 | | | | (64 | ) |
Foreign taxable | | | (991 | ) | | | (520 | ) | | | (1,511 | ) | | | (899 | ) | | | (17 | ) | | | (916 | ) |
Foreign non-taxable | | | 0 | | | | 0 | | | | 0 | | | | (4 | ) | | | 0 | | | | (4 | ) |
Foreign total | | | (991 | ) | | | (520 | ) | | | (1,511 | ) | | | (903 | ) | | | (17 | ) | | | (920 | ) |
| Cash collateral receivables on derivative instruments | | | | | | | | | | | | | | | | | | | | | | | | |
Domestic | | | 0 | | | | 0 | | | | 0 | | | | 0 | | | | 0 | | | | 0 | |
Foreign | | | (29 | ) | | | (44 | ) | | | (73 | ) | | | (7 | ) | | | (174 | ) | | | (181 | ) |
| Financial assets designated at fair value | | | | | | | | | | | | | | | | | | | | | | | | |
Domestic | | | 0 | | | | 0 | | | | 0 | | | | 0 | | | | 0 | | | | 0 | |
Foreign | | | 56 | | | | (61 | ) | | | (5 | ) | | | 16 | | | | 105 | | | | 121 | |
| Loans | | | | | | | | | | | | | | | | | | | | | | | | |
Domestic | | | 92 | | | | (398 | ) | | | (306 | ) | | | 96 | | | | (420 | ) | | | (324 | ) |
Foreign | | | 283 | | | | (13 | ) | | | 270 | | | | 148 | | | | (201 | ) | | | (53 | ) |
| Financial investments available-for-sale | | | | | | | | | | | | | | | | | | | | | | | | |
Domestic | | | 2 | | | | 1 | | | | 3 | | | | (2 | ) | | | 6 | | | | 4 | |
Foreign taxable | | | (7 | ) | | | (56 | ) | | | (63 | ) | | | 12 | | | | (250 | ) | | | (238 | ) |
Foreign non-taxable | | | 0 | | | | 0 | | | | 0 | | | | | | | | | | | | 0 | |
Foreign total | | | (7 | ) | | | (56 | ) | | | (63 | ) | | | 12 | | | | (250 | ) | | | (238 | ) |
| Other interest-bearing assets | | | | | | | | | | | | | | | | | | | | | | | | |
Domestic | | | 0 | | | | 0 | | | | 0 | | | | 0 | | | | 0 | | | | 0 | |
Foreign | | | 110 | | | | (119 | ) | | | (9 | ) | | | (204 | ) | | | 142 | | | | (62 | ) |
| | | | | | | | | | | | | | | | | | | | | | | | | |
| Interest income | | | | | | | | | | | | | | | | | | | | | | | | |
Domestic | | | 64 | | | | (443 | ) | | | (379 | ) | | | (67 | ) | | | (316 | ) | | | (383 | ) |
Foreign | | | (1,066 | ) | | | (1,105 | ) | | | (2,171 | ) | | | (969 | ) | | | (554 | ) | | | (1,523 | ) |
| | | | | | | | | | | | | | | | | | | | | | | | | |
| Total interest income from interest-earning assets | | | (1,002 | ) | | | (1,548 | ) | | | (2,550 | ) | | | (1,036 | ) | | | (870 | ) | | | (1,906 | ) |
| Net interest on swaps | | | | | | | | | | | (276 | ) | | | | | | | | | | | (119 | ) |
| Interest income on off-balance sheet securities and other | | | | | | | | | | | (5 | ) | | | | | | | | | | | 24 | |
| | | | | | | | | | | | | | | | | | | | | | | | | |
| Total interest income | | | | | | | | | | | (2,831 | ) | | | | | | | | | | | (2,001 | ) |
| | | | | | | | | | | | | | | | | | | | | | | | | |
547
Financial information
Supplemental disclosures required under SEC regulations
Analysis of changes in interest income and expense (continued)
| | | | | | | | | | | | | | | | | | | | | | | | |
| | 2013 compared with 2012 | | | 2012 compared with 2011 | |
| | Increase/(decrease)
due to changes in | | | | | | Increase/(decrease)
due to changes in | | | | |
| CHF million | | Average
volume | | | Average
interest rate | | | Net
change | | | Average
volume | | | Average
interest rate | | | Net
change | |
| | | | | | |
| Interest expense on interest-bearing liabilities | | | | | | | | | | | | | | | | | | | | | | | | |
| | | | | | | | | | | | | | | | | | | | | | | | | |
| Due to banks | | | | | | | | | | | | | | | | | | | | | | | | |
| | | | | | | | | | | | | | | | | | | | | | | | | |
Domestic | | | (24 | ) | | | 0 | | | | (24 | ) | | | 2 | | | | (200 | ) | | | (198 | ) |
| | | | | | | | | | | | | | | | | | | | | | | | | |
Foreign | | | (29 | ) | | | (12 | ) | | | (41 | ) | | | (23 | ) | | | (5 | ) | | | (28 | ) |
| | | | | | | | | | | | | | | | | | | | | | | | | |
| Cash collateral on securities lent and repurchase agreements | | | | | | | | | | | | | | | | | | | | | | | | |
| | | | | | | | | | | | | | | | | | | | | | | | | |
Domestic | | | (1 | ) | | | (4 | ) | | | (5 | ) | | | (3 | ) | | | (2 | ) | | | (5 | ) |
| | | | | | | | | | | | | | | | | | | | | | | | | |
Foreign | | | (418 | ) | | | (6 | ) | | | (424 | ) | | | (118 | ) | | | (83 | ) | | | (201 | ) |
| | | | | | | | | | | | | | | | | | | | | | | | | |
| Trading portfolio liabilities | | | | | | | | | | | | | | | | | | | | | | | | |
| | | | | | | | | | | | | | | | | | | | | | | | | |
Domestic | | | (5 | ) | | | (1 | ) | | | (6 | ) | | | (5 | ) | | | (3 | ) | | | (8 | ) |
| | | | | | | | | | | | | | | | | | | | | | | | | |
Foreign | | | (891 | ) | | | 301 | | | | (590 | ) | | | (290 | ) | | | (112 | ) | | | (402 | ) |
| | | | | | | | | | | | | | | | | | | | | | | | | |
| Cash collateral payables on derivative instruments | | | | | | | | | | | | | | | | | | | | | | | | |
| | | | | | | | | | | | | | | | | | | | | | | | | |
Domestic | | | 0 | | | | 0 | | | | 0 | | | | 0 | | | | 0 | | | | 0 | |
| | | | | | | | | | | | | | | | | | | | | | | | | |
Foreign | | | (16 | ) | | | (53 | ) | | | (69 | ) | | | 46 | | | | (193 | ) | | | (147 | ) |
| | | | | | | | | | | | | | | | | | | | | | | | | |
| Financial liabilities designated at fair value | | | | | | | | | | | | | | | | | | | | | | | | |
| | | | | | | | | | | | | | | | | | | | | | | | | |
Domestic | | | (1 | ) | | | (1 | ) | | | (2 | ) | | | (1 | ) | | | 2 | | | | 1 | |
| | | | | | | | | | | | | | | | | | | | | | | | | |
Foreign | | | (206 | ) | | | (339 | ) | | | (545 | ) | | | (42 | ) | | | (207 | ) | | | (249 | ) |
| | | | | | | | | | | | | | | | | | | | | | | | | |
| Due to customers | | | | | | | | | | | | | | | | | | | | | | | | |
| | | | | | | | | | | | | | | | | | | | | | | | | |
Domestic demand deposits | | | 15 | | | | (50 | ) | | | (35 | ) | | | 16 | | | | (53 | ) | | | (37 | ) |
| | | | | | | | | | | | | | | | | | | | | | | | | |
Domestic savings deposits | | | 22 | | | | (132 | ) | | | (110 | ) | | | 42 | | | | (108 | ) | | | (66 | ) |
| | | | | | | | | | | | | | | | | | | | | | | | | |
Domestic time deposits | | | (3 | ) | | | (12 | ) | | | (15 | ) | | | (11 | ) | | | 0 | | | | (11 | ) |
| | | | | | | | | | | | | | | | | | | | | | | | | |
Domestic total | | | 34 | | | | (194 | ) | | | (160 | ) | | | 47 | | | | (161 | ) | | | (114 | ) |
| | | | | | | | | | | | | | | | | | | | | | | | | |
Foreign | | | 8 | | | | (229 | ) | | | (221 | ) | | | 38 | | | | (140 | ) | | | (102 | ) |
| | | | | | | | | | | | | | | | | | | | | | | | | |
| Short-term debt | | | | | | | | | | | | | | | | | | | | | | | | |
| | | | | | | | | | | | | | | | | | | | | | | | | |
Domestic | | | 0 | | | | (6 | ) | | | (6 | ) | | | 1 | | | | 4 | | | | 5 | |
| | | | | | | | | | | | | | | | | | | | | | | | | |
Foreign | | | (121 | ) | | | (74 | ) | | | (195 | ) | | | (65 | ) | | | 48 | | | | (17 | ) |
| | | | | | | | | | | | | | | | | | | | | | | | | |
| Long-term debt | | | | | | | | | | | | | | | | | | | | | | | | |
| | | | | | | | | | | | | | | | | | | | | | | | | |
Domestic | | | 15 | | | | 2 | | | | 17 | | | | (15 | ) | | | 153 | | | | 138 | |
| | | | | | | | | | | | | | | | | | | | | | | | | |
Foreign | | | (492 | ) | | | 98 | | | | (394 | ) | | | 173 | | | | (42 | ) | | | 131 | |
| | | | | | | | | | | | | | | | | | | | | | | | | |
| Other interest-bearing liabilities | | | | | | | | | | | | | | | | | | | | | | | | |
| | | | | | | | | | | | | | | | | | | | | | | | | |
Domestic | | | 0 | | | | 0 | | | | 0 | | | | 0 | | | | 0 | | | | 0 | |
| | | | | | | | | | | | | | | | | | | | | | | | | |
Foreign | | | (3 | ) | | | (28 | ) | | | (31 | ) | | | 0 | | | | (18 | ) | | | (18 | ) |
| | | | | | | | | | | | | | | | | | | | | | | | | |
| Interest expense | | | | | | | | | | | | | | | | | | | | | | | | |
| | | | | | | | | | | | | | | | | | | | | | | | | |
Domestic | | | 18 | | | | (203 | ) | | | (185 | ) | | | 26 | | | | (208 | ) | | | (182 | ) |
| | | | | | | | | | | | | | | | | | | | | | | | | |
Foreign | | | (2,168 | ) | | | (342 | ) | | | (2,510 | ) | | | (281 | ) | | | (752 | ) | | | (1,033 | ) |
| | | | | | | | | | | | | | | | | | | | | | | | | |
| Total interest-bearing liabilities | | | (2,150 | ) | | | (544 | ) | | | (2,694 | ) | | | (255 | ) | | | (960 | ) | | | (1,215 | ) |
| | | | | | | | | | | | | | | | | | | | | | | | | |
| Interest expense on off-balance sheet securities | | | | | | | | | | | 56 | | | | | | | | | | | | 62 | |
| | | | | | | | | | | | | | | | | | | | | | | | | |
| Total interest expense | | | | | | | | | | | (2,639 | ) | | | | | | | | | | | (1,153 | ) |
| | | | | | | | | | | | | | | | | | | | | | | | | |
Deposits
The following table analyzes average deposits and average rates on each deposit category listed below for the years ended 31 December 2013, 2012 and 2011. The geographic allocation is based on the location of the office or branch where the deposit is made.
Deposits by foreign depositors in domestic offices were CHF 76,246 million, CHF 74,252 million and CHF 66,540 million as of 31 December 2013, 31 December 2012 and 31 December 2011, respectively.
| | | | | | | | | | | | | | | | | | | | | | | | |
| | 31.12.13 | | | 31.12.12 | | | 31.12.11 | |
| CHF million, except where indicated | | Average
deposits | | | Average
rate (%) | | | Average
deposits | | | Average
rate (%) | | | Average
deposits | | | Average
rate (%) | |
| Banks | | | | | | | | | | | | | | | | | | | | | | | | |
| | | | | | | | | | | | | | | | | | | | | | | | | |
| Domestic offices | | | | | | | | | | | | | | | | | | | | | | | | |
| | | | | | | | | | | | | | | | | | | | | | | | | |
| Demand deposits | | | 8,513 | | | | (0.1 | ) | | | 1,270 | | | | 0.0 | | | | 1,402 | | | | 0.0 | |
| | | | | | | | | | | | | | | | | | | | | | | | | |
| Time deposits | | | 5,346 | | | | 0.8 | | | | 2,296 | | | | 0.7 | | | | 2,063 | | | | 2.8 | |
| | | | | | | | | | | | | | | | | | | | | | | | | |
| Total domestic offices | | | 13,859 | | | | 0.3 | | | | 3,566 | | | | 0.5 | | | | 3,465 | | | | 1.6 | |
| | | | | | | | | | | | | | | | | | | | | | | | | |
| Foreign offices | | | | | | | | | | | | | | | | | | | | | | | | |
| | | | | | | | | | | | | | | | | | | | | | | | | |
| Interest-bearing deposits1 | | | 3,763 | | | | 0.6 | | | | 24,718 | | | | 0.8 | | | | 17,623 | | | | 1.0 | |
| | | | | | | | | | | | | | | | | | | | | | | | | |
| Total due to banks2 | | | 17,622 | | | | 0.3 | | | | 28,284 | | | | 0.8 | | | | 21,088 | | | | 1.1 | |
| | | | | | | | | | | | | | | | | | | | | | | | | |
| | | | | | |
| Customer accounts | | | | | | | | | | | | | | | | | | | | | | | | |
| | | | | | | | | | | | | | | | | | | | | | | | | |
| Domestic offices | | | | | | | | | | | | | | | | | | | | | | | | |
| | | | | | | | | | | | | | | | | | | | | | | | | |
| Demand deposits | | | 126,953 | | | | 0.0 | | | | 111,975 | | | | 0.1 | | | | 95,679 | | | | 0.1 | |
| | | | | | | | | | | | | | | | | | | | | | | | | |
| Savings deposits | | | 95,937 | | | | 0.3 | | | | 90,312 | | | | 0.4 | | | | 82,004 | | | | 0.5 | |
| | | | | | | | | | | | | | | | | | | | | | | | | |
| Time deposits | | | 4,379 | | | | 0.3 | | | | 4,821 | | | | 0.6 | | | | 6,672 | | | | 0.6 | |
| | | | | | | | | | | | | | | | | | | | | | | | | |
| Total domestic offices | | | 227,268 | | | | 0.1 | | | | 207,108 | | | | 0.2 | | | | 184,355 | | | | 0.3 | |
| | | | | | | | | | | | | | | | | | | | | | | | | |
| Foreign offices | | | | | | | | | | | | | | | | | | | | | | | | |
| | | | | | | | | | | | | | | | | | | | | | | | | |
| Demand deposits | | | 43,954 | | | | 0.0 | | | | 38,707 | | | | 0.1 | | | | 34,414 | | | | 0.1 | |
| | | | | | | | | | | | | | | | | | | | | | | | | |
| Time and savings deposits1 | | | 111,358 | | | | 0.3 | | | | 114,672 | | | | 0.5 | | | | 111,358 | | | | 0.6 | |
| | | | | | | | | | | | | | | | | | | | | | | | | |
| Total foreign offices | | | 155,312 | | | | 0.2 | | | | 153,379 | | | | 0.4 | | | | 145,772 | | | | 0.5 | |
| | | | | | | | | | | | | | | | | | | | | | | | | |
| Total due to customers | | | 382,580 | | | | 0.2 | | | | 360,487 | | | | 0.3 | | | | 330,127 | | | | 0.4 | |
| | | | | | | | | | | | | | | | | | | | | | | | | |
1 Mainly time deposits. 2 Due to banks is considered to represent short-term borrowings to the extent that the total Due to banks exceeds total Due from banks, without differentiating between domestic and foreign offices. The remainder of total Due to banks is considered to represent deposits for the purpose of this disclosure.
As of 31 December 2013, the maturity of time deposits was as follows:
| | | | | | | | |
| CHF million | | Domestic | | | Foreign | |
| Within 3 months | | | 5,857 | | | | 60,682 | |
| | | | | | | | | |
| 3 to 6 months | | | 1,966 | | | | 2,379 | |
| | | | | | | | | |
| 6 to 12 months | | | 285 | | | | 2,591 | |
| | | | | | | | | |
| 1 to 5 years | | | 43 | | | | 438 | |
| | | | | | | | | |
| Over 5 years | | | 5 | | | | 159 | |
| | | | | | | | | |
| Total time deposits | | | 8,155 | | | | 66,249 | |
| | | | | | | | | |
549
Financial information
Supplemental disclosures required under SEC regulations
Short-term borrowings
The following table presents the period-end, average and maximum month-end outstanding amounts for short-term borrowings, along with the average rates and period-end rates at and for the years ended 31 December 2013, 2012 and 2011.
| | | | | | | | | | | | | | | | | | | | | | | | | | | | | | | | | | | | |
| | Short-term debt | | | Due to banks1 | | | Repurchase agreements2 | |
| CHF million, except where indicated | | 31.12.13 | | | 31.12.12 | | | 31.12.11 | | | 31.12.13 | | | 31.12.12 | | | 31.12.11 | | | 31.12.13 | | | 31.12.12 | | | 31.12.11 | |
| Period-end balance | | | 27,633 | | | | 32,493 | | | | 71,377 | | | | 0 | | | | 1,782 | | | | 6,966 | | | | 41,160 | | | | 73,358 | | | | 152,121 | |
| | | | | | | | | | | | | | | | | | | | | | | | | | | | | | | | | | | | | |
| Average balance | | | 35,067 | | | | 50,301 | | | | 59,175 | | | | 309 | | | | 5,267 | | | | 14,834 | | | | 61,251 | | | | 145,831 | | | | 170,442 | |
| | | | | | | | | | | | | | | | | | | | | | | | | | | | | | | | | | | | | |
| Maximum month-end balance | | | 44,789 | | | | 72,432 | | | | 71,377 | | | | 1,370 | | | | 13,555 | | | | 20,080 | | | | 76,014 | | | | 183,207 | | | | 194,684 | |
| | | | | | | | | | | | | | | | | | | | | | | | | | | | | | | | | | | | | |
| Average interest rate during the period (%) | | | 0.5 | | | | 0.7 | | | | 0.7 | | | | 0.3 | | | | 0.4 | | | | 1.0 | | | | 0.2 | | | | 0.3 | | | | 0.4 | |
| | | | | | | | | | | | | | | | | | | | | | | | | | | | | | | | | | | | | |
| Average interest rate at period-end (%) | | | 0.4 | | | | 0.7 | | | | 0.7 | | | | 0.0 | | | | 0.2 | | | | 1.0 | | | | 0.2 | | | | 0.2 | | | | 0.3 | |
| | | | �� | | | | | | | | | | | | | | | | | | | | | | | | | | | | | | | | | |
1 Presented net of Due from banks to reflect short-term borrowings. The difference between the gross Due to banks amount and the amount disclosed here is presented as deposits from banks on the preceding page. 2 Repurchase agreements are presented on a gross basis, and therefore, for the purpose of this disclosure, do not reflect the effect of netting permitted under IFRS.
Contractual maturities of investments in debt instruments available-for-sale1,2
| | | | | | | | | | | | | | | | | | | | | | | | | | | | | | | | |
| | Within 1 year | | | 1 up to 5 years | | | 5 to 10 years | | | Over 10 years | |
| CHF million, except percentages | | Amount | | | Yield (%) | | | Amount | | | Yield (%) | | | Amount | | | Yield (%) | | | Amount | | | Yield (%) | |
| 31 December 2013 | | | | | | | | | | | | | | | | | | | | | | | | | | | | | | | | |
| | | | | | | | | | | | | | | | | | | | | | | | | | | | | | | | | |
| Swiss national government and agencies | | | | | | | | | | | 43 | | | | 0.46 | | | | 1 | | | | 3.55 | | | | | | | | | |
| | | | | | | | | | | | | | | | | | | | | | | | | | | | | | | | | |
| US Treasury and agencies | | | 849 | | | | 0.17 | | | | 13,010 | | | | 0.36 | | | | 3 | | | | 3.30 | | | | | | | | | |
| | | | | | | | | | | | | | | | | | | | | | | | | | | | | | | | | |
| Foreign governments and official institutions | | | 25,483 | | | | 0.27 | | | | 7,277 | | | | 0.55 | | | | 63 | | | | 0.98 | | | | 19 | | | | 12.16 | |
| | | | | | | | | | | | | | | | | | | | | | | | | | | | | | | | | |
| Corporate debt securities | | | 743 | | | | 0.52 | | | | 6,873 | | | | 0.80 | | | | 178 | | | | 0.85 | | | | 1 | | | | 6.60 | |
| | | | | | | | | | | | | | | | | | | | | | | | | | | | | | | | | |
| Mortgage-backed securities | | | | | | | | | | | | | | | | | | | 0 | | | | 4.71 | | | | 4,017 | | | | 2.09 | |
| | | | | | | | | | | | | | | | | | | | | | | | | | | | | | | | | |
| Total fair value3 | | | 27,075 | | | | | | | | 27,202 | | | | | | | | 245 | | | | | | | | 4,037 | | | | | |
| | | | | | | | | | | | | | | | | | | | | | | | | | | | | | | | | |
| | | | |
| | Within 1 year | | | 1 up to 5 years | | | 5 to 10 years | | | Over 10 years | |
| CHF million, except percentages | | Amount | | | Yield (%) | | | Amount | | | Yield (%) | | | Amount | | | Yield (%) | | | Amount | | | Yield (%) | |
| 31 December 2012 | | | | | | | | | | | | | | | | | | | | | | | | | | | | | | | | |
| | | | | | | | | | | | | | | | | | | | | | | | | | | | | | | | | |
| Swiss national government and agencies | | | 110 | | | | 0.13 | | | | 45 | | | | 0.44 | | | | | | | | | | | | 1 | | | | 4.00 | |
| | | | | | | | | | | | | | | | | | | | | | | | | | | | | | | | | |
| US Treasury and agencies | | | 11,152 | | | | 0.20 | | | | 12,397 | | | | 0.25 | | | | 877 | | | | 1.34 | | | | | | | | | |
| | | | | | | | | | | | | | | | | | | | | | | | | | | | | | | | | |
| Foreign governments and official institutions | | | 23,189 | | | | 0.27 | | | | 3,869 | | | | 0.74 | | | | 2 | | | | 3.11 | | | | 18 | | | | 8.15 | |
| | | | | | | | | | | | | | | | | | | | | | | | | | | | | | | | | |
| Corporate debt securities | | | 2,030 | | | | 0.69 | | | | 4,154 | | | | 0.93 | | | | 113 | | | | 4.76 | | | | 3 | | | | 8.83 | |
| | | | | | | | | | | | | | | | | | | | | | | | | | | | | | | | | |
| Mortgage-backed securities | | | | | | | | | | | | | | | | | | | 0 | | | | 4.62 | | | | 7,313 | | | | 1.51 | |
| | | | | | | | | | | | | | | | | | | | | | | | | | | | | | | | | |
| Total fair value3 | | | 36,482 | | | | | | | | 20,464 | | | | | | | | 993 | | | | | | | | 7,335 | | | | | |
| | | | | | | | | | | | | | | | | | | | | | | | | | | | | | | | | |
| | | | |
| | Within 1 year | | | 1 up to 5 years | | | 5 to 10 years | | | Over 10 years | |
| CHF million, except percentages | | Amount | | | Yield (%) | | | Amount | | | Yield (%) | | | Amount | | | Yield (%) | | | Amount | | | Yield (%) | |
| 31 December 2011 | | | | | | | | | | | | | | | | | | | | | | | | | | | | | | | | |
| | | | | | | | | | | | | | | | | | | | | | | | | | | | | | | | | |
| Swiss national government and agencies | | | 226 | | | | 0.21 | | | | 130 | | | | 0.88 | | | | | | | | | | | | 1 | | | | 4.00 | |
| | | | | | | | | | | | | | | | | | | | | | | | | | | | | | | | | |
| US Treasury and agencies | | | 10,082 | | | | 0.24 | | | | 5,891 | | | | 0.21 | | | | 1,157 | | | | 0.76 | | | | | | | | | |
| | | | | | | | | | | | | | | | | | | | | | | | | | | | | | | | | |
| Foreign governments and official institutions | | | 18,751 | | | | 0.42 | | | | 2,338 | | | | 0.83 | | | | 2 | | | | 3.04 | | | | 24 | | | | 6.76 | |
| | | | | | | | | | | | | | | | | | | | | | | | | | | | | | | | | |
| Corporate debt securities | | | 3,267 | | | | 0.73 | | | | 1,592 | | | | 1.47 | | | | 6 | | | | 10.87 | | | | 7 | | | | 10.54 | |
| | | | | | | | | | | | | | | | | | | | | | | | | | | | | | | | | |
| Mortgage-backed securities | | | | | | | | | | | | | | | | | | | 1 | | | | 4.47 | | | | 8,540 | | | | 2.42 | |
| | | | | | | | | | | | | | | | | | | | | | | | | | | | | | | | | |
| Total fair value3 | | | 32,326 | | | | | | | | 9,951 | | | | | | | | 1,166 | | | | | | | | 8,573 | | | | | |
| | | | | | | | | | | | | | | | | | | | | | | | | | | | | | | | | |
1 Debt instruments without fixed maturities are not disclosed in this table. 2 Average yields are calculated on an amortized cost basis. 3 Includes investments in debt instruments as of 31 December 2013 issued by US government and government agencies of CHF 17,876 million (31 December 2012: CHF 31,740 million, 31 December 2011: CHF 25,677 million), the German government of CHF 6,733 million (31 December 2012: CHF 6,669 million, 31 December 2011: CHF 1,991 million), and the UK government of CHF 8,089 million (31 December 2012: CHF 5,042 million, 31 December 2011: CHF 3,477 million).
Due from banks and loans (gross)
The Group’s lending portfolio is widely diversified across industry sectors. CHF 174.5 billion (57.2% of the total) consists of loans to thousands of private households, predominantly in Switzerland, and mostly secured by mortgages, financial collateral or other assets. Exposure to Banks and Financial institutions amounted to CHF 65 billion (21.3% of the total). Exposure to banks includes money market deposits with highly rated institutions. Excluding Banks and Financial institutions, the largest industry sector exposure as of 31 December 2013 was CHF 20 billion (6.6% of the total)
to Services. For further discussion of the loan portfolio, refer to the “Risk management and control” section of this report.
The following table illustrates the diversification of the loan portfolio among industry sectors as of 31 December 2013, 2012, 2011, 2010, and 2009. The industry categories presented are consistent with the classification of loans for reporting to the Swiss Financial Market Supervisory Authority (FINMA) and Swiss National Bank. Loans designated at fair value and loans held in the trading portfolio are excluded from the tables below.
| | | | | | | | | | | | | | | | | | | | |
| CHF million | | 31.12.13 | | | 31.12.12 | | | 31.12.11 | | | 31.12.10 | | | 31.12.09 | |
| Domestic | | | | | | | | | | | | | | | | | | | | |
| | | | | | | | | | | | | | | | | | | | | |
| Banks | | | 736 | | | | 532 | | | | 566 | | | | 1,130 | | | | 609 | |
| | | | | | | | | | | | | | | | | | | | | |
| Construction | | | 1,429 | | | | 1,360 | | | | 1,292 | | | | 1,356 | | | | 1,381 | |
| | | | | | | | | | | | | | | | | | | | | |
| Financial institutions | | | 4,643 | | | | 4,265 | | | | 4,257 | | | | 3,735 | | | | 4,370 | |
| | | | | | | | | | | | | | | | | | | | | |
| Hotels and restaurants | | | 1,817 | | | | 1,745 | | | | 1,831 | | | | 1,803 | | | | 1,882 | |
| | | | | | | | | | | | | | | | | | | | | |
| Manufacturing | | | 2,512 | | | | 2,976 | | | | 3,252 | | | | 3,192 | | | | 3,374 | |
| | | | | | | | | | | | | | | | | | | | | |
| Private households | | | 124,569 | | | | 123,167 | | | | 120,671 | | | | 119,796 | | | | 119,432 | |
| | | | | | | | | | | | | | | | | | | | | |
| Public authorities | | | 2,415 | | | | 2,708 | | | | 2,992 | | | | 4,908 | | | | 3,785 | |
| | | | | | | | | | | | | | | | | | | | | |
| Real estate and rentals | | | 14,511 | | | | 13,682 | | | | 13,169 | | | | 12,252 | | | | 11,745 | |
| | | | | | | | | | | | | | | | | | | | | |
| Retail and wholesale | | | 3,784 | | | | 4,345 | | | | 4,433 | | | | 4,101 | | | | 4,288 | |
| | | | | | | | | | | | | | | | | | | | | |
| Services | | | 5,330 | | | | 5,862 | | | | 5,770 | | | | 5,718 | | | | 5,702 | |
| | | | | | | | | | | | | | | | | | | | | |
| Other1 | | | 3,680 | | | | 3,538 | | | | 3,131 | | | | 3,117 | | | | 3,423 | |
| | | | | | | | | | | | | | | | | | | | | |
| Total domestic | | | 165,426 | | | | 164,180 | | | | 161,364 | | | | 161,108 | | | | 159,991 | |
| Foreign | | | | | | | | | | | | | | | | | | | | |
| | | | | | | | | | �� | | | | | | | | | | | |
| Banks | | | 16,497 | | | | 20,711 | | | | 22,669 | | | | 16,028 | | | | 16,227 | |
| | | | | | | | | | | | | | | | | | | | | |
| Chemicals | | | 178 | | | | 254 | | | | 392 | | | | 351 | | | | 2,358 | |
| | | | | | | | | | | | | | | | | | | | | |
| Construction | | | 1,132 | | | | 1,731 | | | | 750 | | | | 952 | | | | 741 | |
| | | | | | | | | | | | | | | | | | | | | |
| Electricity, gas and water supply | | | 1,337 | | | | 1,205 | | | | 746 | | | | 525 | | | | 653 | |
| | | | | | | | | | | | | | | | | | | | | |
| Financial institutions | | | 43,125 | | | | 40,650 | | | | 38,802 | | | | 41,307 | | | | 43,345 | |
| | | | | | | | | | | | | | | | | | | | | |
| Manufacturing | | | 1,850 | | | | 1,828 | | | | 1,955 | | | | 2,010 | | | | 2,547 | |
| | | | | | | | | | | | | | | | | | | | | |
| Mining | | | 1,175 | | | | 1,279 | | | | 1,979 | | | | 2,463 | | | | 2,217 | |
| | | | | | | | | | | | | | | | | | | | | |
| Private households | | | 49,920 | | | | 46,458 | | | | 41,045 | | | | 31,361 | | | | 33,166 | |
| | | | | | | | | | | | | | | | | | | | | |
| Public authorities | | | 1,322 | | | | 4,319 | | | | 5,459 | | | | 9,858 | | | | 10,781 | |
| | | | | | | | | | | | | | | | | | | | | |
| Real estate and rentals | | | 2,995 | | | | 2,721 | | | | 2,158 | | | | 1,420 | | | | 1,110 | |
| | | | | | | | | | | | | | | | | | | | | |
| Retail and wholesale | | | 1,791 | | | | 2,063 | | | | 2,044 | | | | 1,711 | | | | 1,438 | |
| | | | | | | | | | | | | | | | | | | | | |
| Services | | | 14,733 | | | | 10,735 | | | | 8,529 | | | | 9,534 | | | | 8,180 | |
| | | | | | | | | | | | | | | | | | | | | |
| Transport, storage and communication | | | 2,809 | | | | 3,021 | | | | 2,068 | | | | 1,652 | | | | 2,474 | |
| | | | | | | | | | | | | | | | | | | | | |
| Other2 | | | 606 | | | | 693 | | | | 703 | | | | 841 | | | | 734 | |
| | | | | | | | | | | | | | | | | | | | | |
| Total foreign | | | 139,471 | | | | 137,669 | | | | 129,300 | | | | 120,014 | | | | 125,969 | |
| | | | | | | | | | | | | | | | | | | | | |
| Total gross | | | 304,897 | | | | 301,849 | | | | 290,664 | | | | 281,121 | | | | 285,960 | |
| | | | | | | | | | | | | | | | | | | | | |
1 Includes chemicals, food and beverages, transportation, storage, mining, electricity, gas and water supply. 2 Includes food and beverages, hotels and restaurants.
551
Financial information
Supplemental disclosures required under SEC regulations
Due from banks and loans (gross) (continued)
The following table analyzes the Group’s mortgage portfolio by geographic origin of the client and type of mortgage as of 31 December 2013, 2012, 2011, 2010 and 2009. Mortgages are included in the industry categories mentioned on the previous page.
| | | | | | | | | | | | | | | | | | | | |
| CHF million | | 31.12.13 | | | 31.12.12 | | | 31.12.11 | | | 31.12.10 | | | 31.12.09 | |
| Mortgages | | | | | | | | | | | | | | | | | | | | |
| | | | | | | | | | | | | | | | | | | | | |
| Domestic | | | 144,852 | | | | 142,143 | | | | 138,204 | | | | 136,687 | | | | 136,029 | |
| | | | | | | | | | | | | | | | | | | | | |
| Foreign | | | 15,235 | | | | 12,311 | | | | 8,818 | | | | 6,174 | | | | 4,972 | |
| | | | | | | | | | | | | | | | | | | | | |
| Total gross mortgages | | | 160,086 | | | | 154,454 | | | | 147,022 | | | | 142,861 | | | | 141,001 | |
| | | | | | | | | | | | | | | | | | | | | |
| | | | | |
| Mortgages | | | | | | | | | | | | | | | | | | | | |
| | | | | | | | | | | | | | | | | | | | | |
| Residential | | | 137,370 | | | | 132,033 | | | | 125,775 | | | | 122,499 | | | | 121,031 | |
| | | | | | | | | | | | | | | | | | | | | |
| Commercial | | | 22,716 | | | | 22,421 | | | | 21,247 | | | | 20,362 | | | | 19,970 | |
| | | | | | | | | | | | | | | | | | | | | |
| Total gross mortgages | | | 160,086 | | | | 154,454 | | | | 147,022 | | | | 142,861 | | | | 141,001 | |
| | | | | | | | | | | | | | | | | | | | | |
Due from banks and loan maturities (gross)
| | | | | | | | | | | | | | | | |
| CHF million | | Within 1 year | | | 1 to 5 years | | | Over 5 years | | | Total | |
| Domestic | | | | | | | | | | | | | | | | |
| | | | | | | | | | | | | | | | | |
| Banks | | | 736 | | | | 0 | | | | 0 | | | | 736 | |
| | | | | | | | | | | | | | | | | |
| Mortgages | | | 64,951 | | | | 47,041 | | | | 32,859 | | | | 144,852 | |
| | | | | | | | | | | | | | | | | |
| Other loans | | | 15,641 | | | | 2,992 | | | | 1,206 | | | | 19,839 | |
| | | | | | | | | | | | | | | | | |
| Total domestic | | | 81,328 | | | | 50,033 | | | | 34,066 | | | | 165,426 | |
| | | | | | | | | | | | | | | | | |
| Foreign | | | | | | | | | | | | | | | | |
| | | | | | | | | | | | | | | | | |
| Banks | | | 16,322 | | | | 148 | | | | 26 | | | | 16,497 | |
| | | | | | | | | | | | | | | | | |
| Mortgages | | | 11,438 | | | | 1,376 | | | | 2,420 | | | | 15,235 | |
| | | | | | | | | | | | | | | | | |
| Other loans | | | 86,372 | | | | 15,693 | | | | 5,674 | | | | 107,739 | |
| | | | | | | | | | | | | | | | | |
| Total foreign | | | 114,132 | | | | 17,217 | | | | 8,121 | | | | 139,471 | |
| | | | | | | | | | | | | | | | | |
| Total gross | | | 195,460 | | | | 67,250 | | | | 42,186 | | | | 304,897 | |
| | | | | | | | | | | | | | | | | |
As of 31 December 2013, the total amount ofDue from banks andLoans due after one year granted at fixed- and floating-rates are as follows:
| | | | | | | | | | | | |
| CHF million | | 1 to 5 years | | | Over 5 years | | | Total | |
| Fixed-rate loans | | | 59,710 | | | | 37,239 | | | | 96,949 | |
| | | | | | | | | | | | | |
| Adjustable or floating-rate loans | | | 7,540 | | | | 4,947 | | | | 12,487 | |
| | | | | | | | | | | | | |
| Total | | | 67,250 | | | | 42,186 | | | | 109,437 | |
| | | | | | | | | | | | | |
Impaired and non-performing loans
A loan (included inDue from banks orLoans) is classified as non-performing: (i) when the payment of interest, principal or fees is overdue by more than 90 days, (ii) when insolvency proceedings have commenced or (iii) when obligations have been restructured on concessionary terms. For IFRS reporting purposes, the definition of impaired loans is more comprehensive, covering both non-performing loans and other situations where objective evidence indicates that UBS may be unable to collect all amounts due. Refer to “Impaired loans” in the “Risk management and control”
section of this report for comprehensive information on UBS’s impaired loans, of which non-performing loans are a component. Also, refer to “Note 1 Summary of significant accounting policies” to the consolidated financial statements for more information on the various risk factors that are considered to be indicative of impairment.
The table below provides an analysis of the Group’s non-performing loans.
| | | | | | | | | | | | | | | | | | | | |
| CHF million | | 31.12.13 | | | 31.12.12 | | | 31.12.11 | | | 31.12.10 | | | 31.12.09 | |
| | | | | | | | | | | | | | | | | | | | | |
| Non-performing loans: | | | | | | | | | | | | | | | | | | | | |
| | | | | | | | | | | | | | | | | | | | | |
| Domestic | | | 1,113 | | | | 1,121 | | | | 1,199 | | | | 1,164 | | | | 1,462 | |
| | | | | | | | | | | | | | | | | | | | | |
| Foreign | | | 469 | | | | 395 | | | | 329 | | | | 563 | | | | 3,940 | |
| | | | | | | | | | | | | | | | | | | | | |
| Total non-performing loans | | | 1,582 | | | | 1,516 | | | | 1,529 | | | | 1,727 | | | | 5,402 | |
| | | | | | | | | | | | | | | | | | | | | |
| | | | | |
| CHF million | | 31.12.13 | | | 31.12.12 | | | 31.12.11 | | | 31.12.10 | | | 31.12.09 | |
| | | | | | | | | | | | | | | | | | | | | |
| Gross interest income that would have been recorded on non-performing loans: | | | | | | | | | | | | | | | | | | | | |
| | | | | | | | | | | | | | | | | | | | | |
| Domestic | | | 6 | | | | 8 | | | | 10 | | | | 11 | | | | 13 | |
| | | | | | | | | | | | | | | | | | | | | |
| Foreign | | | 4 | | | | 3 | | | | 9 | | | | 35 | | | | 89 | |
| | | | | | | | | | | | | | | | | | | | | |
| Interest income included in Net profit for non-performing loans: | | | | | | | | | | | | | | | | | | | | |
| | | | | | | | | | | | | | | | | | | | | |
| Domestic | | | 23 | | | | 28 | | | | 29 | | | | 35 | | | | 41 | |
| | | | | | | | | | | | | | | | | | | | | |
| Foreign | | | 7 | | | | 6 | | | | 6 | | | | 19 | | | | 30 | |
| | | | | | | | | | | | | | | | | | | | | |
UBS does not, as a matter of policy, typically restructure loans to accrue interest at rates different from the original contractual terms or reduce the principal amount of loans. Instead, specific
loan allowances are established as necessary. Unrecognized interest related to restructured loans was not material to the results of operations in 2013, 2012, 2011, 2010 or 2009.
553
Financial information
Supplemental disclosures required under SEC regulations
Cross-border outstandings
Cross-border outstandings consist of balances with central banks and other financial institutions, loans, reverse repurchase agreements and cash collateral on securities borrowed with counterparties domiciled outside Switzerland. Guarantees and commitments are provided separately in the table below.
The following tables list those countries for which cross-border outstandings exceeded 0.75% of total IFRS assets as of 31 December 2013, 2012 and 2011. As of 31 December 2013, there were no outstandings that exceeded 0.75% of total IFRS assets in any country currently facing debt restructuring or liquidity problems
that the Group expects would materially impact the country’s ability to service its obligations. Aggregate country risk exposures are monitored and reported on an ongoing basis by the risk control organization, based on an internal framework. The internal risk view is not directly comparable to the cross-border outstandings in the table below due to different approaches to netting, differing trade populations and differing approach to allocation of exposures to countries. For more information on the country framework within risk control, refer to “Country risk” in the “Risk management and control” section of this report.
| | | | | | | | | | | | | | | | | | | | | | | | |
| | 31.12.13 | |
| CHF million | | Banks | | | Private sector | | | Public sector | | | Total outstandings | | | % of total assets | | | Guarantees and
Commitments1 | |
| USA | | | 23,167 | | | | 76,047 | | | | 51,287 | | | | 150,501 | | | | 14.9 | | | | 38,778 | |
| | | | | | | | | | | | | | | | | | | | | | | | | |
| United Kingdom | | | 10,872 | | | | 39,528 | | | | 8,583 | | | | 58,983 | | | | 5.8 | | | | 8,494 | |
| | | | | | | | | | | | | | | | | | | | | | | | | |
| Japan | | | 1,019 | | | | 17,009 | | | | 4,765 | | | | 22,794 | | | | 2.3 | | | | 289 | |
| | | | | | | | | | | | | | | | | | | | | | | | | |
| France | | | 4,793 | | | | 7,478 | | | | 56 | | | | 12,327 | | | | 1.2 | | | | 6,997 | |
| | | | | | | | | | | | | | | | | | | | | | | | | |
| Germany | | | 4,328 | | | | 2,664 | | | | 1,900 | | | | 8,891 | | | | 0.9 | | | | 2,062 | |
| | | | | | | | | | | | | | | | | | | | | | | | | |
| |
| | 31.12.12 | |
| CHF million | | Banks | | | Private sector | | | Public sector | | | Total outstandings | | | % of total assets | | | Guarantees and
Commitments1 | |
| USA | | | 45,371 | | | | 93,401 | | | | 35,125 | | | | 173,897 | | | | 13.8 | | | | 43,904 | |
| | | | | | | | | | | | | | | | | | | | | | | | | |
| United Kingdom | | | 13,366 | | | | 36,960 | | | | 4,287 | | | | 54,613 | | | | 4.3 | | | | 12,106 | |
| | | | | | | | | | | | | | | | | | | | | | | | | |
| Japan | | | 2,014 | | | | 21,943 | | | | 4,707 | | | | 28,663 | | | | 2.3 | | | | 2,208 | |
| | | | | | | | | | | | | | | | | | | | | | | | | |
| France | | | 4,885 | | | | 5,955 | | | | 409 | | | | 11,250 | | | | 0.9 | | | | 9,161 | |
| | | | | | | | | | | | | | | | | | | | | | | | | |
| |
| | 31.12.11 | |
| CHF million | | Banks | | | Private sector | | | Public sector | | | Total outstandings | | | % of total assets | | | Guarantees and
Commitments1 | |
| USA | | | 114,952 | | | | 107,132 | | | | 10,000 | | | | 232,084 | | | | 16.4 | | | | 46,285 | |
| | | | | | | | | | | | | | | | | | | | | | | | | |
| United Kingdom | | | 13,679 | | | | 37,945 | | | | 6,116 | | | | 57,740 | | | | 4.1 | | | | 13,487 | |
| | | | | | | | | | | | | | | | | | | | | | | | | |
| Japan | | | 3,799 | | | | 13,566 | | | | 3,020 | | | | 20,385 | | | | 1.4 | | | | 7,090 | |
| | | | | | | | | | | | | | | | | | | | | | | | | |
| France | | | 5,220 | | | | 12,830 | | | | 72 | | | | 18,122 | | | | 1.3 | | | | 8,034 | |
| | | | | | | | | | | | | | | | | | | | | | | | | |
1 Includes forward starting transactions (reverse repurchase agreements and securities borrowing agreements).
Summary of movements in allowances and provisions for credit losses
The following table provides an analysis of movements in allowances and provisions for credit losses.
UBS writes off loans against allowances only on final settlement of bankruptcy proceedings, the sale of the underlying assets
and/or in the case of debt forgiveness. Under Swiss law, a creditor can continue to collect from a debtor who has emerged from bankruptcy, unless the debt has been forgiven through a formal agreement.
| | | | | | | | | | | | | | | | | | | | |
| CHF million | | 31.12.13 | | | 31.12.12 | | | 31.12.11 | | | 31.12.10 | | | 31.12.09 | |
| Balance at beginning of year | | | 794 | | | | 938 | | | | 1,287 | | | | 2,820 | | | | 3,070 | |
| | | | | | | | | | | | | | | | | | | | | |
| Domestic | | | | | | | | | | | | | | | | | | | | |
| | | | | | | | | | | | | | | | | | | | | |
| Write-offs | | | | | | | | | | | | | | | | | | | | |
| | | | | | | | | | | | | | | | | | | | | |
| Construction | | | (2 | ) | | | (1 | ) | | | (8 | ) | | | (8 | ) | | | (15 | ) |
| | | | | | | | | | | | | | | | | | | | | |
| Financial institutions | | | (6 | ) | | | 0 | | | | (17 | ) | | | (47 | ) | | | (2 | ) |
| | | | | | | | | | | | | | | | | | | | | |
| Hotels and restaurants | | | 0 | | | | (1 | ) | | | 0 | | | | (1 | ) | | | (2 | ) |
| | | | | | | | | | | | | | | | | | | | | |
| Manufacturing | | | (4 | ) | | | (20 | ) | | | (31 | ) | | | (28 | ) | | | (21 | ) |
| | | | | | | | | | | | | | | | | | | | | |
| Private households | | | (38 | ) | | | (45 | ) | | | (59 | ) | | | (66 | ) | | | (61 | ) |
| | | | | | | | | | | | | | | | | | | | | |
| Real estate and rentals | | | 0 | | | | (2 | ) | | | (3 | ) | | | (2 | ) | | | (19 | ) |
| | | | | | | | | | | | | | | | | | | | | |
| Retail and wholesale | | | (11 | ) | | | (21 | ) | | | (37 | ) | | | (117 | ) | | | (41 | ) |
| | | | | | | | | | | | | | | | | | | | | |
| Services | | | (4 | ) | | | (6 | ) | | | (21 | ) | | | (49 | ) | | | (3 | ) |
| | | | | | | | | | | | | | | | | | | | | |
| Other1 | | | (1 | ) | | | (17 | ) | | | (6 | ) | | | (16 | ) | | | (12 | ) |
| | | | | | | | | | | | | | | | | | | | | |
| Total gross domestic write-offs | | | (67 | ) | | | (112 | ) | | | (183 | ) | | | (332 | ) | | | (177 | ) |
| | | | | | | | | | | | | | | | | | | | | |
| Foreign | | | | | | | | | | | | | | | | | | | | |
| | | | | | | | | | | | | | | | | | | | | |
| Write-offs | | | | | | | | | | | | | | | | | | | | |
| | | | | | | | | | | | | | | | | | | | | |
| Banks | | | (1 | ) | | | 0 | | | | (8 | ) | | | (2 | ) | | | (8 | ) |
| | | | | | | | | | | | | | | | | | | | | |
| Chemicals | | | 0 | | | | 0 | | | | 0 | | | | (846 | ) | | | (111 | ) |
| | | | | | | | | | | | | | | | | | | | | |
| Construction | | | (6 | ) | | | 0 | | | | 0 | | | | 0 | | | | (10 | ) |
| | | | | | | | | | | | | | | | | | | | | |
| Financial institutions | | | (44 | ) | | | (106 | ) | | | (39 | ) | | | (267 | ) | | | (685 | ) |
| | | | | | | | | | | | | | | | | | | | | |
| Manufacturing | | | 0 | | | | 0 | | | | 0 | | | | (22 | ) | | | (138 | ) |
| | | | | | | | | | | | | | | | | | | | | |
| Mining | | | 0 | | | | 0 | | | | 0 | | | | 0 | | | | (5 | ) |
| | | | | | | | | | | | | | | | | | | | | |
| Private households | | | (6 | ) | | | (15 | ) | | | (72 | ) | | | (21 | ) | | | (40 | ) |
| | | | | | | | | | | | | | | | | | | | | |
| Public authorities | | | (1 | ) | | | (54 | ) | | | (175 | ) | | | (1 | ) | | | (20 | ) |
| | | | | | | | | | | | | | | | | | | | | |
| Real estate and rentals | | | (1 | ) | | | 0 | | | | (7 | ) | | | (1 | ) | | | (196 | ) |
| | | | | | | | | | | | | | | | | | | | | |
| Retail and wholesale | | | (1 | ) | | | 0 | | | | 0 | | | | (1 | ) | | | (122 | ) |
| | | | | | | | | | | | | | | | | | | | | |
| Services | | | 0 | | | | (19 | ) | | | (1 | ) | | | (9 | ) | | | (413 | ) |
| | | | | | | | | | | | | | | | | | | | | |
| Transport, storage and communication | | | 0 | | | | (5 | ) | | | 0 | | | | (3 | ) | | | (37 | ) |
| | | | | | | | | | | | | | | | | | | | | |
| Other2 | | | 0 | | | | (2 | ) | | | 0 | | | | 0 | | | | (80 | ) |
| | | | | | | | | | | | | | | | | | | | | |
| Total gross foreign write-offs | | | (61 | ) | | | (201 | ) | | | (303 | ) | | | (1,173 | ) | | | (1,865 | ) |
| | | | | | | | | | | | | | | | | | | | | |
| Total usage of provisions | | | 0 | | | | 0 | | | | (14 | ) | | | 0 | | | | (5 | ) |
| | | | | | | | | | | | | | | | | | | | | |
| Total write-offs/usage of provisions | | | (128 | ) | | | (313 | ) | | | (501 | ) | | | (1,505 | ) | | | (2,046 | ) |
| | | | | | | | | | | | | | | | | | | | | |
| Recoveries | | | | | | | | | | | | | | | | | | | | |
| | | | | | | | | | | | | | | | | | | | | |
| Domestic | | | 35 | | | | 43 | | | | 50 | | | | 38 | | | | 44 | |
| | | | | | | | | | | | | | | | | | | | | |
| Foreign | | | 10 | | | | 21 | | | | 1 | | | | 41 | | | | 8 | |
| | | | | | | | | | | | | | | | | | | | | |
| Total recoveries | | | 45 | | | | 63 | | | | 51 | | | | 79 | | | | 52 | |
| | | | | | | | | | | | | | | | | | | | | |
| Total net write-offs/usage of provisions | | | (83 | ) | | | (250 | ) | | | (450 | ) | | | (1,427 | ) | | | (1,994 | ) |
| | | | | | | | | | | | | | | | | | | | | |
| Increase/(decrease) in specific allowances and provisions recognized in the income statement | | | 144 | | | | 133 | | | | 0 | | | | 67 | | | | 1,806 | |
| | | | | | | | | | | | | | | | | | | | | |
| Increase/(decrease) in collective loan loss allowances recognized in the income statement | | | (93 | ) | | | (15 | ) | | | 84 | | | | (2 | ) | | | 26 | |
| | | | | | | | | | | | | | | | | | | | | |
| Foreign currency translation | | | (9 | ) | | | (8 | ) | | | (1 | ) | | | (175 | ) | | | (61 | ) |
| | | | | | | | | | | | | | | | | | | | | |
| Other | | | (3 | ) | | | (3 | ) | | | 18 | | | | 1 | | | | (26 | )3 |
| | | | | | | | | | | | | | | | | | | | | |
| Balance at end of year4 | | | 750 | | | | 794 | | | | 938 | | | | 1,287 | | | | 2,820 | |
| | | | | | | | | | | | | | | | | | | | | |
1 Includes chemicals, food and beverages, transportation, storage, mining, electricity, gas and water supply.2 Includes food and beverages, hotels and restaurants.3 In 2009, the other adjustment was due to the sale of UBS Pactual.4 Includes allowances for cash collateral on securities borrowed.
555
Financial information
Supplemental disclosures required under SEC regulations
Allocation of the allowances and provisions for credit losses
The following table provides an analysis of the allocation of the allowances and provisions for credit loss by industry sector and geographic location as of 31 December 2013, 2012, 2011, 2010 and
2009. For a description of procedures with respect to allowances and provisions for credit losses, refer to the “Risk management and control” section of this report.
| | | | | | | | | | | | | | | | | | | | |
| CHF million | | 31.12.13 | | | 31.12.12 | | | 31.12.11 | | | 31.12.10 | | | 31.12.09 | |
| Domestic | | | | | | | | | | | | | | | | | | | | |
| | | | | | | | | | | | | | | | | | | | | |
| Banks | | | 3 | | | | 3 | | | | 1 | | | | 1 | | | | 1 | |
| | | | | | | | | | | | | | | | | | | | | |
| Construction | | | 16 | | | | 16 | | | | 15 | | | | 23 | | | | 27 | |
| | | | | | | | | | | | | | | | | | | | | |
| Financial services | | | 16 | | | | 21 | | | | 19 | | | | 28 | | | | 126 | |
| | | | | | | | | | | | | | | | | | | | | |
| Hotels and restaurants | | | 12 | | | | 9 | | | | 6 | | | | 5 | | | | 6 | |
| | | | | | | | | | | | | | | | | | | | | |
| Manufacturing | | | 57 | �� | | | 44 | | | | 65 | | | | 93 | | | | 104 | |
| | | | | | | | | | | | | | | | | | | | | |
| Private households | | | 54 | | | | 60 | | | | 77 | | | | 91 | | | | 119 | |
| | | | | | | | | | | | | | | | | | | | | |
| Public authorities | | | 0 | | | | 0 | | | | 0 | | | | 0 | | | | 1 | |
| | | | | | | | | | | | | | | | | | | | | |
| Real estate and rentals | | | 9 | | | | 10 | | | | 14 | | | | 19 | | | | 21 | |
| | | | | | | | | | | | | | | | | | | | | |
| Retail and wholesale | | | 152 | | | | 123 | | | | 131 | | | | 165 | | | | 221 | |
| | | | | | | | | | | | | | | | | | | | | |
| Services | | | 23 | | | | 24 | | | | 24 | | | | 45 | | | | 99 | |
| | | | | | | | | | | | | | | | | | | | | |
| Other1 | | | 24 | | | | 16 | | | | 28 | | | | 27 | | | | 43 | |
| | | | | | | | | | | | | | | | | | | | | |
| Total domestic specific allowances | | | 365 | | | | 326 | | | | 379 | | | | 497 | | | | 768 | |
| | | | | | | | | | | | | | | | | | | | | |
| Foreign | | | | | | | | | | | | | | | | | | | | |
| | | | | | | | | | | | | | | | | | | | | |
| Banks2 | | | 13 | | | | 19 | | | | 16 | | | | 23 | | | | 31 | |
| | | | | | | | | | | | | | | | | | | | | |
| Chemicals | | | 0 | | | | 1 | | | | 8 | | | | 8 | | | | 1,037 | |
| | | | | | | | | | | | | | | | | | | | | |
| Construction | | | 17 | | | | 20 | | | | 6 | | | | 2 | | | | 1 | |
| | | | | | | | | | | | | | | | | | | | | |
| Electricity, gas and water supply | | | 1 | | | | 1 | | | | 1 | | | | 0 | | | | 0 | |
| | | | | | | | | | | | | | | | | | | | | |
| Financial services | | | 37 | | | | 37 | | | | 96 | | | | 190 | | | | 414 | |
| | | | | | | | | | | | | | | | | | | | | |
| Manufacturing | | | 18 | | | | 23 | | | | 23 | | | | 15 | | | | 83 | |
| | | | | | | | | | | | | | | | | | | | | |
| Mining | | | 2 | | | | 0 | | | | 0 | | | | 0 | | | | 0 | |
| | | | | | | | | | | | | | | | | | | | | |
| Private households | | | 66 | | | | 45 | | | | 60 | | | | 139 | | | | 171 | |
| | | | | | | | | | | | | | | | | | | | | |
| Public authorities | | | 16 | | | | 39 | | | | 33 | | | | 171 | | | | 18 | |
| | | | | | | | | | | | | | | | | | | | | |
| Real estate and rentals | | | 2 | | | | 4 | | | | 10 | | | | 15 | | | | 36 | |
| | | | | | | | | | | | | | | | | | | | | |
| Retail and wholesale | | | 77 | | | | 39 | | | | 15 | | | | 8 | | | | 17 | |
| | | | | | | | | | | | | | | | | | | | | |
| Services | | | 35 | | | | 35 | | | | 28 | | | | 12 | | | | 100 | |
| | | | | | | | | | | | | | | | | | | | | |
| Transport, storage and communication | | | 19 | | | | 27 | | | | 39 | | | | 29 | | | | 7 | |
| | | | | | | | | | | | | | | | | | | | | |
| Other3 | | | 0 | | | | 0 | | | | 0 | | | | 0 | | | | 0 | |
| | | | | | | | | | | | | | | | | | | | | |
| Total foreign specific allowances | | | 303 | | | | 290 | | | | 335 | | | | 613 | | | | 1,913 | |
| | | | | | | | | | | | | | | | | | | | | |
| Collective loan loss allowances | | | 20 | | | | 114 | | | | 131 | | | | 47 | | | | 49 | |
| | | | | | | | | | | | | | | | | | | | | |
| Provisions for loan commitments and guarantees | | | 61 | | | | 64 | | | | 93 | | | | 130 | | | | 90 | |
| | | | | | | | | | | | | | | | | | | | | |
| Total allowances and provisions for credit losses4 | | | 750 | | | | 794 | | | | 938 | | | | 1,287 | | | | 2,820 | |
| | | | | | | | | | | | | | | | | | | | | |
1 Includes chemicals, food and beverages, transportation, storage, mining, electricity, gas and water supply.2 Counterparty allowances only.3 Includes food and beverages, hotels and restaurants.4 Includes allowances for cash collateral on securities borrowed.
Due from banks and loans by industry sector (gross)
The following table presents the percentage of loans in each industry sector and geographic location to total loans. This table can be read in conjunction with the preceding table showing the
breakdown of the allowances and provisions for credit losses by industry sectors to evaluate the credit risks in each of the categories.
| | | | | | | | | | | | | | | | | | | | |
| In % | | 31.12.13 | | | 31.12.12 | | | 31.12.11 | | | 31.12.10 | | | 31.12.09 | |
| Domestic | | | | | | | | | | | | | | | | | | | | |
| | | | | | | | | | | | | | | | | | | | | |
| Banks | | | 0.2 | | | | 0.2 | | | | 0.2 | | | | 0.4 | | | | 0.2 | |
| | | | | | | | | | | | | | | | | | | | | |
| Construction | | | 0.5 | | | | 0.5 | | | | 0.4 | | | | 0.5 | | | | 0.5 | |
| | | | | | | | | | | | | | | | | | | | | |
| Financial services | | | 1.5 | | | | 1.4 | | | | 1.5 | | | | 1.3 | | | | 1.5 | |
| | | | | | | | | | | | | | | | | | | | | |
| Hotels and restaurants | | | 0.6 | | | | 0.6 | | | | 0.6 | | | | 0.6 | | | | 0.7 | |
| | | | | | | | | | | | | | | | | | | | | |
| Manufacturing | | | 0.8 | | | | 1.0 | | | | 1.1 | | | | 1.1 | | | | 1.2 | |
| | | | | | | | | | | | | | | | | | | | | |
| Private households | | | 40.9 | | | | 40.8 | | | | 41.5 | | | | 42.6 | | | | 41.8 | |
| | | | | | | | | | | | | | | | | | | | | |
| Public authorities | | | 0.8 | | | | 0.9 | | | | 1.0 | | | | 1.7 | | | | 1.3 | |
| | | | | | | | | | | | | | | | | | | | | |
| Real estate and rentals | | | 4.8 | | | | 4.5 | | | | 4.5 | | | | 4.4 | | | | 4.1 | |
| | | | | | | | | | | | | | | | | | | | | |
| Retail and wholesale | | | 1.2 | | | | 1.4 | | | | 1.5 | | | | 1.5 | | | | 1.5 | |
| | | | | | | | | | | | | | | | | | | | | |
| Services | | | 1.7 | | | | 1.9 | | | | 2.0 | | | | 2.0 | | | | 2.0 | |
| | | | | | | | | | | | | | | | | | | | | |
| Other1 | | | 1.2 | | | | 1.2 | | | | 1.1 | | | | 1.1 | | | | 1.2 | |
| | | | | | | | | | | | | | | | | | | | | |
| Total domestic | | | 54.3 | | | | 54.4 | | | | 55.5 | | | | 57.3 | | | | 55.9 | |
| | | | | | | | | | | | | | | | | | | | | |
| Foreign | | | | | | | | | | | | | | | | | | | | |
| | | | | | | | | | | | | | | | | | | | | |
| Banks | | | 5.4 | | | | 6.9 | | | | 7.8 | | | | 5.7 | | | | 5.7 | |
| | | | | | | | | | | | | | | | | | | | | |
| Chemicals | | | 0.1 | | | | 0.1 | | | | 0.1 | | | | 0.1 | | | | 0.8 | |
| | | | | | | | | | | | | | | | | | | | | |
| Construction | | | 0.4 | | | | 0.6 | | | | 0.3 | | | | 0.3 | | | | 0.3 | |
| | | | | | | | | | | | | | | | | | | | | |
| Electricity, gas and water supply | | | 0.4 | | | | 0.4 | | | | 0.3 | | | | 0.2 | | | | 0.2 | |
| | | | | | | | | | | | | | | | | | | | | |
| Financial services | | | 14.1 | | | | 13.5 | | | | 13.3 | | | | 14.7 | | | | 15.2 | |
| | | | | | | | | | | | | | | | | | | | | |
| Manufacturing | | | 0.6 | | | | 0.6 | | | | 0.7 | | | | 0.7 | | | | 0.9 | |
| | | | | | | | | | | | | | | | | | | | | |
| Mining | | | 0.4 | | | | 0.4 | | | | 0.7 | | | | 0.9 | | | | 0.8 | |
| | | | | | | | | | | | | | | | | | | | | |
| Private households | | | 16.4 | | | | 15.4 | | | | 14.1 | | | | 11.2 | | | | 11.6 | |
| | | | | | | | | | | | | | | | | | | | | |
| Public authorities | | | 0.4 | | | | 1.4 | | | | 1.9 | | | | 3.5 | | | | 3.8 | |
| | | | | | | | | | | | | | | | | | | | | |
| Real estate and rentals | | | 1.0 | | | | 0.9 | | | | 0.7 | | | | 0.5 | | | | 0.4 | |
| | | | | | | | | | | | | | | | | | | | | |
| Retail and wholesale | | | 0.6 | | | | 0.7 | | | | 0.7 | | | | 0.6 | | | | 0.5 | |
| | | | | | | | | | | | | | | | | | | | | |
| Services | | | 4.8 | | | | 3.6 | | | | 2.9 | | | | 3.4 | | | | 2.9 | |
| | | | | | | | | | | | | | | | | | | | | |
| Transport, storage and communication | | | 0.9 | | | | 1.0 | | | | 0.7 | | | | 0.6 | | | | 0.9 | |
| | | | | | | | | | | | | | | | | | | | | |
| Other2 | | | 0.2 | | | | 0.2 | | | | 0.2 | | | | 0.3 | | | | 0.3 | |
| | | | | | | | | | | | | | | | | | | | | |
| Total foreign | | | 45.7 | | | | 45.6 | | | | 44.5 | | | | 42.7 | | | | 44.1 | |
| | | | | | | | | | | | | | | | | | | | | |
| Total gross | | | 100.0 | | | | 100.0 | | | | 100.0 | | | | 100.0 | | | | 100.0 | |
| | | | | | | | | | | | | | | | | | | | | |
1 Includes chemicals, food and beverages, transportation, storage, mining, electricity, gas and water supply.2 Includes food and beverages, hotels and restaurants.
557
Supplemental disclosures required under
Basel III Pillar 3 regulations
Financial information
Supplemental disclosures required under Basel III Pillar 3 regulations
Table of Contents
| | |
562 | | Introduction |
| |
563 | | Table 1a: Overview of disclosure requirements |
| 565 | | Risk exposure measures and derivation ofrisk-weighted assets |
565 | | Table 1b: Requirements by risk type |
| 566 | | Scope of regulatory consolidation |
| 566 | | Table 1c: Main legal entities according to the IFRS scope of consolidation not subject to the regulatory scope of consolidation |
| |
567 | | Risk-weighted assets |
| |
568 | | Table 2: Detailed segmentation of Basel III exposures and risk-weighted assets |
| |
| 570 | | Credit risk |
| |
| 570 | | Table 3: Counterparty credit risk by exposure segment and RWA |
| 571 | | Table 4: Regulatory gross credit exposure by geographical region |
| 571 | | Table 5: Regulatory gross credit exposure by counterparty type |
| 572 | | Table 6: Regulatory gross credit exposure by residual contractual maturity |
| 573 | | Table 7: Derivation of regulatory net credit exposure |
| 573 | | Table 8: Regulatory gross credit exposure covered by guarantees and credit derivatives |
| |
574 | | Advanced internal ratings-based approach |
575 | | Table 9a: Corporates – Advanced IRB approach: Regulatory net credit exposure, weighted average PD, LGD and RWA by internal UBS ratings |
576 | | Table 9b: Sovereigns – Advanced IRB approach: Regulatory net credit exposure, weighted average PD, LGD and RWA by internal UBS ratings |
577 | | Table 9c: Banks – Advanced IRB approach: Regulatory net credit exposure, weighted average PD, LGD and RWA by internal UBS ratings |
578 | | Table 9d: Residential mortgages – Advanced IRB approach: Regulatory net credit exposure, weighted average PD, LGD and RWA by internal UBS ratings |
579 | | Table 9e: Lombard – Advanced IRB approach: Regulatory net credit exposure, weighted average PD, LGD and RWA by internal UBS ratings |
580 | | Table 9f: Other Retail – Advanced IRB approach: Regulatory net credit exposure, weighted average PD, LGD and RWA by internal UBS ratings |
560
561
Financial information
Supplemental disclosures required under Basel III Pillar 3 regulations
Introduction
This section of the report provides the BIS Basel III Pillar 3 supplementary disclosure information as of 31 December 2013 for UBS Group to the extent that these required Pillar 3 disclosures are not included in other sections of our Annual Report 2013. The Basel III Pillar 3 disclosures were previously provided in the Basel III Pillar 3 report for the first half 2013 published on the UBS website. The corresponding disclosures published in our Annual Report 2012 were prepared in accordance with Basel 2.5.
The capital adequacy framework consists of three pillars, each of which focuses on a different aspect of capital adequacy. Pillar 1 provides a framework for measuring minimum capital requirements for the credit, market and operational risks faced by banks. Pillar 2 addresses the principles of the supervisory review process, emphasizing the need for a qualitative approach to supervising banks. Pillar 3 aims to encourage market discipline by requiring banks to publish a range of disclosures, mainly on risk and capital.
This report is based on phase-in rules under the BIS Basel III framework, as implemented by the revised Swiss Capital Adequacy Ordinance issued by the Swiss Federal Council and required by Swiss Financial Market Supervisory Authority (FINMA) regulation. In addition, systemically relevant banks (SRB) in Switzerland (currently UBS, Credit Suisse and, since 1 November 2013, Zürcher Kantonalbank) are required to comply with Swiss SRB-specific rules.
| | è | | Refer to the “Capital management” section of this report for more information on regulatory requirements including the differences between BIS Basel III and Swiss SRB |
FINMA requires us to publish comprehensive quantitative and qualitative Pillar 3 disclosures annually, as well as an update of quantitative disclosures and any significant changes to qualitative information semi-annually. The implementation of Basel III as of 1 January 2013 resulted in the introduction of new Pillar 1 concepts which required amendment of several Pillar 3 tables for 31 December 2013. Respective comparative 31 December 2012 tables and numbers are based on Basel 2.5 requirements and concepts. The numbers for 31 December 2012 presented in the Pillar 3 disclosures may be restated due to the retrospective implementation of IFRS 10.
| | è | | Refer to “Note 1b Changes in accounting policies, comparability and other adjustments” in the “Financial information” section of this report for more information on the adoption of IFRS 10 |
This section also contains a reference to the new Basel III disclosures of the indicators used in the calculation methodology for assessing the systemic importance of the G-SIBs and the resulting G-SIB buffer capital requirements.
562
Table 1a: Overview of disclosure requirements
The following table provides an overview of Pillar 3 disclosures in our Annual Report 2013.
| | | | | | |
Pillar 3 requirements | | Location of disclosure: Annual Report section | | Table in section “Supplemental disclosures required under Basel III Pillar 3 regulations” |
| Scope of consolidation | | Financial information – Note 1 Summary of significant accounting policies Supplemental disclosures required under Basel III Pillar 3 regulations | | Table 1c: Main legal entities according to the IFRS scope of consolidation not subject to the regulatory scope of consolidation |
| Capital structure | | Capital management (on page 230) | | |
| Capital adequacy | | Capital management (on pages 226 to 248) | | |
| Capital instruments | | Refer to “Bondholder information” at www.ubs.com/investors for more information | | |
| Risk management objectives, policies and methodologies (qualitative disclosures) | | Risk management and control (on pages 150 to 212) | | |
| Risk-weighted assets | | Capital management Supplemental disclosures required under Basel III Pillar 3 regulations | | Table 2: | | Detailed segmentation of Basel III exposures and risk-weighted assets |
| Credit risk | | Risk management and control Supplemental disclosures required under Basel III Pillar 3 regulations | | Table 3: | | Counterparty credit risk by exposure segment and RWA |
| | | | Table 4: | | Regulatory gross credit exposure by geographical region |
| | | | Table 5: | | Regulatory gross credit exposure by counterparty type |
| | | | Table 6: | | Regulatory gross credit exposure by residual contractual maturity |
| | | | | Table 7: | | Derivation of regulatory net credit exposure |
| | | | | Table 8: | | Regulatory gross credit exposure covered by guarantees and credit derivatives |
| | | | | Table 9a: | | Corporates – Advanced IRB approach: Regulatory net credit exposure, weighted average PD, LGD and RWA by internal UBS ratings |
| | | | | Table 9b: | | Sovereigns – Advanced IRB approach: Regulatory net credit exposure, weighted average PD, LGD and RWA by internal UBS ratings |
| | | | | Table 9c: | | Banks – Advanced IRB approach: Regulatory net credit exposure, weighted average PD, LGD and RWA by internal UBS ratings |
| | | | | Table 9d: | | Residential mortgages – Advanced IRB approach: Regulatory net credit exposure, weighted average PD, LGD and RWA by internal UBS ratings |
| | | | | Table 9e: | | Lombard – Advanced IRB approach: Regulatory net credit exposure, weighted average PD, LGD and RWA by internal UBS ratings |
| | | | | Table 9f: | | Other Retail – Advanced IRB approach: Regulatory net credit exposure, weighted average PD, LGD and RWA by internal UBS ratings |
| | | | | Table 10: | | Regulatory gross and net credit exposure by risk weight under the standardized approach |
| | | | | Table 11: | | Eligible financial collateral recognized under the standardized approach |
| | | | | Table 12: | | Credit exposure of derivative instruments |
| | | | | Table 13: | | Credit derivatives |
563
Financial information
Supplemental disclosures required under Basel III Pillar 3 regulations
Table 1a: Overview of disclosure requirements (continued)
The following table provides an overview of Pillar 3 disclosures in our Annual Report 2013.
| | | | | | |
Pillar 3 requirements | | Location of disclosure: Annual Report section | | Table in section “Supplemental disclosures required under Basel III Pillar 3 regulations” |
| Equity instruments in the banking book | | Supplemental disclosures required under Basel III Pillar 3 regulations | | Table 14: | | Equity instruments in the banking book |
| Market risk | | Risk management and control (on pages 188 to 204) | | |
| Operational risk | | Risk management and control (on pages 210 to 212) | | |
| Interest rate risk in the banking book | | Risk management and control (on pages 201 to 203) | | |
| Securitization | | Supplemental disclosures required under Basel III Pillar 3 regulations | | Table 15: | | Securitization/re-securitization |
| | | | Table 16: | | Securitization activity of the year in the banking book |
| | | | Table 17: | | Securitization activity of the year in the trading book |
| | | | | Table 18: | | Outstanding securitized exposures |
| | | | | Table 19: | | Impaired or past due securitized exposures and losses related to securitized exposures in the banking book |
| | | | | Table 20: | | Exposures intended to be securitized in the banking and trading book |
| | | | | Table 21: | | Securitization positions retained or purchased in the banking book |
| | | | | Table 22: | | Securitization positions retained or purchased in the trading book |
| | | | | Table 23: | | Capital requirement for securitization/re-securitization positions retained or purchased in the banking book |
| | | | | Table 24: | | Re-securitization positions retained or purchased in the banking book |
| | | | | Table 25: | | Re-securitization positions retained or purchased in the trading book |
| | | | | Table 26: | | Aggregated amount of securitized exposures subject to the market risk approach |
| | | | | Table 27: | | Correlation products subject to the comprehensive risk measure or the securitization framework for specific risk |
| | | | | Table 28: | | Securitization positions and capital requirement for trading book positions subject to the securitization framework |
| | | | | Table 29: | | Capital requirement for securitization positions related to correlation products |
| Composition of capital | | Supplemental disclosures required under Basel III Pillar 3 regulations | | Table 30: | | Reconciliation of accounting balance sheet to balance sheet under the regulatory scope of consolidation |
| | | | Table 31: | | Composition of capital |
| G-SIBs indicator | | Refer to “SEC filings and other disclosures” at www.ubs.com/investors | | | | |
| Remuneration | | Compensation (on pages 302 to 340) | | | | |
564
Risk exposure measures and derivation of risk-weighted assets
Measures of risk exposure may differ depending on whether the exposures are calculated for financial accounting purposes under International Financial Reporting Standards (IFRS), for determining our regulatory capital or for risk management purposes. Our Basel III Pillar 3 disclosures are generally based on measures of risk exposure used to calculate the regulatory capital required to underpin those risks.
The table below provides a more detailed summary of the approaches we use for the main risk categories for determining regulatory capital.
The naming conventions for the exposure segments used in the following tables are based on BIS rules and may differ from those under Swiss and European Union (EU) regulations. For example, “sovereigns” under the BIS naming convention equate to what are termed “central governments and central banks” under the Swiss and EU regulations. Similarly, “banks” equate to “institutions” and “residential mortgages” equate to “claims secured on residential real estate.”
Our risk-weighted assets (RWA) are published according to the BIS Basel III framework, as implemented by the revised Swiss Capital Adequacy Ordinance issued by the Swiss Federal Council and required by FINMA regulation.
| | è | | Refer to the “Capital management” section of this report for more information on the differences between BIS Basel III and Swiss SRB |
Table 1b: Requirements by risk type
| | |
| Category | | UBS approach |
| Credit risk | | Under the advanced internal ratings-based approach applied for the majority of our businesses, credit risk weights are determined by reference to internal counterparty ratings and loss given default estimates. We use internal models, approved by FINMA, to measure the credit risk exposures to third parties on over-the-counter derivatives and securities financing transactions. Our disclosure includes the Basel III requirements for credit risk that were adopted as of 1 January 2013 (e.g., stressed expected positive exposure, changes in the risk weighting of central counterparties, capital charge for credit valuation adjustments, asset value correlation (AVC) multiplier). For a subset of our credit portfolio, we apply the standardized approach, based on external ratings. |
Equity instruments in the banking book | | Simple risk-weight method under the advanced internal ratings-based approach. |
Credit valuation adjustment (CVA) | | The credit valuation adjustment (CVA) is an additional capital charge to the existing counterparty credit risk default charge. Banks are required to hold capital for the risk of mark-to-market losses (i.e., CVA) associated with the deterioration of counterparty credit quality. |
Settlement risk | | Capital requirements for failed transactions are determined according to the rules for failed trades and non-delivery-versus-payment transactions under the Basel III framework. |
| Non-counterparty-related risk | | Non-counterparty-related assets such as our premises, other properties and equipment and deferred tax assets on temporary differences require capital according to prescribed regulatory risk weights. |
| Market risk | | Regulatory capital requirement is calculated using a variety of methods approved by FINMA. The components are value-at-risk (VaR), stressed value-at-risk (SVaR), an add-on for risks which are potentially not fully modeled in VaR, the incremental risk charge, the comprehensive risk charge for the correlation portfolio and the securitization framework for securitization positions in the trading book described below. Details on the derivation of RWA for each of these components are provided in the “Risk management and control” section. |
| Operational risk | | We have developed a model to quantify operational risk, which meets the regulatory capital standard under the advanced measurement approach, that is approved by FINMA and includes the incremental operational risk RWA. |
| Securitization/re-securitization in the banking book (credit risk) and trading book (market risk) | | Securitization/re-securitization exposures in the banking book are assessed using the advanced internal ratings-based approach, applying risk weights based on external ratings and for distinct deals the supervisory formula based approach is used. Securitization/re-securitization exposures in the trading book are assessed for their general market risk as well as for their specific risk. The capital charged for general market risk is determined by the value-at-risk (VaR), stressed VaR (SVaR) method, whereas the capital charge for specific risk is determined using the comprehensive risk measure method or the internal ratings-based approach applying risk weights based on external ratings. |
| | è | | Refer to the “Risk management and control” section of this report for more information |
565
Financial information
Supplemental disclosures required under Basel III Pillar 3 regulations
Scope of regulatory consolidation
Generally, the scope of consolidation when calculating regulatory capital requirements follows the IFRS consolidation rules for subsidiaries directly or indirectly controlled by UBS AG that are active in the banking and finance business, but excludes subsidiaries in other sectors.
| | è | | Refer to “Note 1 Summary of significant accounting policies” and “Note 30 Interests in subsidiaries and other entities” in the “Financial information” section of this report for more information on the accounting policies and most relevant subsidiaries under the IFRS scope of consolidation, respectively |
The main differences in the basis of consolidation for IFRS and regulatory capital purposes relate to the following entities, and apply regardless of our level of control as of 31 December 2013:
| – | 178 real estate and commercial companies and investment schemes which were not consolidated for regulatory capital purposes, but are risk-weighted; |
| – | Seven insurance companies which were not consolidated for regulatory capital purposes, but fall under the threshold rules for deduction under Basel III; |
| – | Three joint ventures which were fully consolidated for regulatory capital purposes, and which were accounted for under the equity method for IFRS; and |
| – | Securitization vehicles which were not consolidated for regulatory capital purposes but which were treated under the securitization framework. |
Subsidiaries which are not included in the regulatory consolidation did not report any capital deficiencies at year-end 2013. In the banking book, 97 equity instruments were not required to be consolidated under IFRS and the regulatory scope of consolidation. This category mainly covers infrastructure holdings and joint operations (for example, settlement and clearing institutions, stock and financial futures exchanges). These entities fall under the threshold rules for deduction under Basel III.
| | è | | Refer to “Table 14: Equity instruments in the banking book” in this section for more information on the measurement of these Instruments |
| | è | | Refer to “Table 1c: Main legal entities according to the IFRS scope of consolidation not subject to the regulatory scope of consolidation” in this section for more information |
The table below provides a list of the most significant entities that are included in the IFRS scope of consolidation, but not in the regulatory capital scope of consolidation. We have no significant investments, which are included in the regulatory scope of consolidation but not in the IFRS scope of consolidation.
We have a significant participation in the SIX Group which is not part of the regulatory scope of consolidation. For regulatory capital purposes, it is risk-weighted.
| | è | | Refer to “Note 25 Restricted and transferred financial assets” in the “Financial information” section of this report for more information on transferability restrictions under IFRS 12 |
Table 1c: Main legal entities according to the IFRS scope of consolidation not subject to the regulatory scope of consolidation
| | | | | | | | | | |
| | 31.12.13 | | | |
| CHF million | | Total assets1 | | | Total equity1 | | | Purpose |
| UBS Global Asset Management Life Ltd | | | 10,023 | | | | 14 | | | Life insurance |
| | | | | | | | | | | |
| UBS International Life Limited | | | 5,066 | | | | 58 | | | Life Insurance |
| | | | | | | | | | | |
| UBS A&Q Alternative Solution Master Limited | | | 988 | | | | 953 | | | Investment vehicle for feeder funds2 |
| | | | | | | | | | | |
| UBS A&Q Alternative Solution Limited | | | 969 | | | | 953 | | | Investment vehicle for multiple investors2 |
| | | | | | | | | | | |
| UBS Alpha Select Hedge Fund | | | 680 | | | | 664 | | | Investment vehicle for multiple investors2 |
| | | | | | | | | | | |
| UBS Global Life AG – Vaduz | | | 683 | | | | 11 | | | Life insurance |
| | | | | | | | | | | |
| UBS Life AG – Zurich | | | 581 | | | | 58 | | | Life insurance |
| | | | | | | | | | | |
| UBS Life insurance company USA | | | 283 | | | | 38 | | | Life insurance |
| | | | | | | | | | | |
| O’Connor Global Multi-Strategy Alpha (Levered) Limited | | | 262 | | | | 254 | | | Investment vehicle for multiple investors2 |
| | | | | | | | | | | |
| UBS Multi-Manager Alternative Commodities Fund Ltd. | | | 258 | | | | 220 | | | Offshore hedge fund2 |
| | | | | | | | | | | |
| UBS Diversed Alpha XL Master Limited | | | 255 | | | | 254 | | | Fund2 |
| | | | | | | | | | | |
| UBS ATF Trading Fund | | | 189 | | | | 156 | | | Investment vehicle for multiple investors2 |
| | | | | | | | | | | |
1 Total assets and Total equity on a standalone basis. 2 Represents the net asset value (NAV) of issued fund units. These fund units are subject to liability treatment in the Group Financial Statements under IFRS.
566
Risk-weighted assets
“Table 2: Detailed segmentation of Basel III exposures and risk-weighted assets” provides a breakdown of our RWA and includes the enhanced risk coverage for stricter market and counterparty credit risk requirements introduced through the implementation of Basel III. Table 2 and subsequent tables provide a breakdown according to BIS-defined exposure segments as follows:
| – | Sovereigns (central governments and central banks as defined under Swiss regulations),consisting of exposures relating to sovereign states and their central banks, the BIS, the International Monetary Fund, the EU (including the European Central Bank) and eligible multilateral development banks. |
| – | Banks (as defined under Swiss regulations),consisting of exposures to legal entities holding a banking license. This segment also includes securities firms subject to supervisory and regulatory arrangements, including risk-based capital requirements, which are comparable to those applied to banks according to the framework. The BIS regulation also includes in this segment exposures to public sector entities with tax-raising power or entities whose liabilities are fully guaranteed by a public entity. |
| – | Corporates,consisting of all exposures that do not fit into any of the other exposure segments listed below. This segment includes private commercial entities such as corporations, partnerships or proprietorships, insurance companies, funds, exchanges and clearing houses. |
| – | Central counterparties –A central counterparty (CCP) is a clearing house that interposes itself between counterparties to |
| | contracts traded in one or more financial markets, becoming the buyer to every seller and the seller to every buyer and thereby ensuring the future performance of open contracts. A CCP becomes counterparty to trades with market participants through novation, an open offer system, or another legally binding arrangement. |
| – | Retail –Residential mortgages (claims secured on residential real estate as defined under Swiss regulations), consisting of residential mortgages, regardless of exposure size, if the obligor occupies or rents out the mortgaged property. |
| – | Retail –Lombard lending, consisting of loans made against the pledge of eligible marketable securities or cash. |
| – | Retail –Other retail, consisting of exposures to small businesses, private clients and other retail customers without mortgage financing. |
Table 2 also shows the gross and net exposure at default (EAD) per risk type and exposure segment for the current disclosure period, which form the basis for the calculation of the RWA as well as the capital requirement per exposure category. The Basel III credit risk-related components “Credit valuation adjustment (CVA)” and “Stressed expected positive exposure (sEPE)” are disclosed separately in the table below, as is the net EAD and RWA for central counterparties.
| | è | | Refer to the table “Basel III RWA by risk type, exposure and reporting segment” in the “Capital management” section of this report for more information on RWA by business division and Corporate Center |
567
Financial information
Supplemental disclosures required under Basel III Pillar 3 regulations
Table 2: Detailed segmentation of Basel III exposures andrisk-weighted assets
| | | | | | | | | | | | | | | | | | | | | | | | | | | | | | | | | | | | | | | | |
| | 31.12.13 | |
| | Basel III (phase-in) | |
| | Gross EAD | | | Net EAD | | | RWA | | | Capital requirement | |
| CHF million | | Total | | | Advanced
IRB/ model-
based
approach | | | Standard-
ized
approach | | | Total | | | Advanced
IRB/ model-
based
approach | | | Standard-
ized
approach | | | Total | | | Advanced
IRB/ model-
based
approach | | | Standard-
ized
approach | | | Total6 | |
| Credit risk | | | 644,448 | | | | 460,505 | | | | 164,328 | | | | 624,833 | | | | 97,472 | | | | 26,783 | | | | 124,255 | | | | 8,349 | | | | 2,294 | | | | 10,643 | |
| | | | | | | | | | | | | | | | | | | | | | | | | | | | | | | | | | | | | | | | | |
| Sovereigns | | | 148,381 | | | | 33,863 | | | | 114,518 | | | | 148,381 | | | | 840 | | | | 266 | | | | 1,106 | | | | 72 | | | | 23 | | | | 95 | |
| | | | | | | | | | | | | | | | | | | | | | | | | | | | | | | | | | | | | | | | | |
| Banks | | | 67,515 | | | | 54,396 | | | | 5,950 | | | | 60,346 | | | | 11,615 | | | | 1,981 | | | | 13,596 | | | | 995 | | | | 170 | | | | 1,165 | |
| | | | | | | | | | | | | | | | | | | | | | | | | | | | | | | | | | | | | | | | | |
| Corporates | | | 143,106 | | | | 118,279 | | | | 18,848 | | | | 137,127 | | | | 34,659 | | | | 13,606 | | | | 48,265 | | | | 2,969 | | | | 1,165 | | | | 4,134 | |
| | | | | | | | | | | | | | | | | | | | | | | | | | | | | | | | | | | | | | | | | |
| Central counterparties | | | 18,107 | | | | | | | | 18,106 | | | | 18,106 | | | | | | | | 1,793 | | | | 1,793 | | | | | | | | 154 | | | | 154 | |
| | | | | | | | | | | | | | | | | | | | | | | | | | | | | | | | | | | | | | | | | |
| Retail | | | 230,410 | | | | 217,831 | | | | 6,868 | | | | 224,699 | | | | 19,855 | | | | 3,346 | | | | 23,200 | | | | 1,701 | | | | 287 | | | | 1,987 | |
| | | | | | | | | | | | | | | | | | | | | | | | | | | | | | | | | | | | | | | | | |
Residential mortgages | | | 133,552 | | | | 128,563 | | | | 4,646 | | | | 133,209 | | | | 14,667 | | | | 1,680 | | | | 16,346 | | | | 1,256 | | | | 144 | | | | 1,400 | |
| | | | | | | | | | | | | | | | | | | | | | | | | | | | | | | | | | | | | | | | | |
Lombard lending | | | 92,661 | | | | 87,293 | | | | | | | | 87,293 | | | | 4,437 | | | | | | | | 4,437 | | | | 380 | | | | | | | | 380 | |
| | | | | | | | | | | | | | | | | | | | | | | | | | | | | | | | | | | | | | | | | |
Other retail | | | 4,197 | | | | 1,975 | | | | 2,222 | | | | 4,197 | | | | 751 | | | | 1,666 | | | | 2,417 | | | | 64 | | | | 143 | | | | 207 | |
| | | | | | | | | | | | | | | | | | | | | | | | | | | | | | | | | | | | | | | | | |
| Counterparty credit risk by exposure segment (excl. sEPE) | | | 607,518 | | | | 424,369 | | | | 164,290 | | | | 588,660 | | | | 66,969 | | | | 20,992 | | | | 87,960 | | | | 5,736 | | | | 1,798 | | | | 7,534 | |
| | | | | | | | | | | | | | | | | | | | | | | | | | | | | | | | | | | | | | | | | |
| Stressed EPE1 | | | 22,579 | | | | 22,579 | | | | | | | | 22,579 | | | | 6,202 | | | | | | | | 6,202 | | | | 531 | | | | | | | | 531 | |
| | | | | | | | | | | | | | | | | | | | | | | | | | | | | | | | | | | | | | | | | |
| Counterparty credit risk by exposure segment (incl. sEPE) | | | 630,097 | | | | 446,948 | | | | 164,290 | | | | 611,239 | | | | 73,171 | | | | 20,992 | | | | 94,163 | | | | 6,267 | | | | 1,798 | | | | 8,065 | |
| | | | | | | | | | | | | | | | | | | | | | | | | | | | | | | | | | | | | | | | | |
| Securitization/re-securitization in the banking book | | | 12,569 | | | | 11,928 | | | | | | | | 11,928 | | | | 8,352 | | | | | | | | 8,352 | | | | 715 | | | | | | | | 715 | |
| | | | | | | | | | | | | | | | | | | | | | | | | | | | | | | | | | | | | | | | | |
| Equity instruments in the banking book2 | | | 1,522 | | | | 1,522 | | | | | | | | 1,522 | | | | 4,999 | | | | | | | | 4,999 | | | | 428 | | | | | | | | 428 | |
| | | | | | | | | | | | | | | | | | | | | | | | | | | | | | | | | | | | | | | | | |
| Credit valuation adjustment (CVA) | | | | | | | | | | | | | | | | | | | 10,598 | | | | 5,696 | | | | 16,294 | | | | 908 | | | | 488 | | | | 1,396 | |
| | | | | | | | | | | | | | | | | | | | | | | | | | | | | | | | | | | | | | | | | |
| Settlement risk | | | 260 | | | | 107 | | | | 37 | | | | 144 | | | | 352 | | | | 95 | | | | 447 | | | | 30 | | | | 8 | | | | 38 | |
| | | | | | | | | | | | | | | | | | | | | | | | | | | | | | | | | | | | | | | | | |
| Non-counterparty-related risk | | | 19,491 | | | | | | | | 19,491 | | | | 19,491 | | | | | | | | 12,634 | | | | 12,634 | | | | | | | | 1,082 | | | | 1,082 | |
| | | | | | | | | | | | | | | | | | | | | | | | | | | | | | | | | | | | | | | | | |
| Market risk | | | 2,098 | | | | 1,966 | | | | | | | | 1,966 | | | | 13,727 | | | | | | | | 13,727 | | | | 1,176 | | | | | | | | 1,176 | |
| | | | | | | | | | | | | | | | | | | | | | | | | | | | | | | | | | | | | | | | | |
| Value-at-risk (VaR) | | | | | | | | | | | | | | | | | | | 1,746 | | | | | | | | 1,746 | | | | 150 | | | | | | | | 150 | |
| | | | | | | | | | | | | | | | | | | | | | | | | | | | | | | | | | | | | | | | | |
| Stressed value-at-risk (SVaR) | | | | | | | | | | | | | | | | | | | 2,604 | | | | | | | | 2,604 | | | | 223 | | | | | | | | 223 | |
| | | | | | | | | | | | | | | | | | | | | | | | | | | | | | | | | | | | | | | | | |
| Add-on for risks-not-in-VaR (RniV) | | | | | | | | | | | | | | | | | | | 2,025 | | | | | | | | 2,025 | | | | 173 | | | | | | | | 173 | |
| | | | | | | | | | | | | | | | | | | | | | | | | | | | | | | | | | | | | | | | | |
| Incremental risk charge (IRC) | | | | | | | | | | | | | | | | | | | 1,377 | | | | | | | | 1,377 | | | | 118 | | | | | | | | 118 | |
| | | | | | | | | | | | | | | | | | | | | | | | | | | | | | | | | | | | | | | | | |
| Comprehensive risk measure (CRM) | | | | | | | | | | | | | | | | | | | 4,176 | | | | | | | | 4,176 | | | | 358 | | | | | | | | 358 | |
| | | | | | | | | | | | | | | | | | | | | | | | | | | | | | | | | | | | | | | | | |
| Securitization/re-securitization in the trading book3 | | | 2,098 | | | | 1,966 | | | | | | | | 1,966 | | | | 1,799 | | | | | | | | 1,799 | | | | 154 | | | | | | | | 154 | |
| | | | | | | | | | | | | | | | | | | | | | | | | | | | | | | | | | | | | | | | | |
| Operational risk | | | | | | | | | | | | | | | | | | | 77,941 | | | | | | | | 77,941 | | | | 6,676 | | | | | | | | 6,676 | |
| | | | | | | | | | | | | | | | | | | | | | | | | | | | | | | | | | | | | | | | | |
of which: incremental RWA4 | | | | | | | | | | | | | | | | | | | 22,500 | | | | | | | | 22,500 | | | | 1,927 | | | | | | | | 1,927 | |
| | | | | | | | | | | | | | | | | | | | | | | | | | | | | | | | | | | | | | | | | |
| Total Swiss SRB | | | 666,036 | | | | 462,471 | | | | 183,818 | | | | 646,289 | | | | 189,141 | | | | 39,417 | | | | 228,557 | 5 | | | 16,201 | | | | 3,376 | | | | 19,577 | |
| | | | | | | | | | | | | | | | | | | | | | | | | | | | | | | | | | | | | | | | | |
1 Majority relates to exposures with Banks and Corporates. 2 Simple risk-weight method. 3 In line with Basel III Pillar 1 requirements, RWA related to securitization/re-securitizations in the trading book are newly presented as market risk RWA. Previously, these RWA were presented as credit risk RWA. Prior periods were restated for this change in presentation. 4 Incremental RWA reflect the effect of the supplemental operational risk capital analysis mutually agreed to by UBS and FINMA. 5 Refer to the “Capital management” section of this report for more information on the difference between phase-in and fully applied RWA numbers. 6 As we are required to comply with regulations based on the Basel III framework as applicable for Swiss systemically relevant banks (SRB), our capital disclosures are based on the Swiss SRB Basel III capital charge of 8.6% for 2013.
568
Table 2: Detailed segmentation of Basel 2.5 exposures andrisk-weighted assets (continued)
| | | | | | | | | | | | | | | | | | | | | | | | | | | | | | | | | | | | | | | | |
| | 31.12.12 | |
| | Basel 2.5 | |
| | Gross EAD | | | Net EAD | | | RWA | | | Capital requirement | |
| CHF million | | Total | | | Advanced
IRB/ model-
based
approach | | | Standard-
ized
approach | | | Total | | | Advanced
IRB/ model-
based
approach | | | Standard-
ized
approach | | | Total | | | Advanced
IRB/ model-
based
approach | | | Standard-
ized
approach | | | Total5 | |
| Credit risk | | | 602,514 | | | | 444,332 | | | | 138,106 | | | | 582,438 | | | | 82,344 | | | | 21,823 | | | | 104,167 | | | | 6,588 | | | | 1,746 | | | | 8,333 | |
| | | | | | | | | | | | | | | | | | | | | | | | | | | | | | | | | | | | | | | | | |
| Sovereigns | | | 142,271 | | | | 37,796 | | | | 104,354 | | | | 142,150 | | | | 3,205 | | | | 222 | | | | 3,427 | | | | 256 | | | | 18 | | | | 274 | |
| | | | | | | | | | | | | | | | | | | | | | | | | | | | | | | | | | | | | | | | | |
| Banks | | | 63,443 | | | | 48,506 | | | | 6,073 | | | | 54,580 | | | | 8,654 | | | | 2,083 | | | | 10,737 | | | | 692 | | | | 167 | | | | 859 | |
| | | | | | | | | | | | | | | | | | | | | | | | | | | | | | | | | | | | | | | | | |
| Corporates | | | 162,925 | | | | 132,829 | | | | 21,604 | | | | 154,433 | | | | 43,250 | | | | 16,312 | | | | 59,562 | | | | 3,460 | | | | 1,305 | | | | 4,765 | |
| | | | | | | | | | | | | | | | | | | | | | | | | | | | | | | | | | | | | | | | | |
| Central counterparties | | | | | | | | | | | | | | | | | | | | | | | | | | | | | | | | | | | | | | | | |
| | | | | | | | | | | | | | | | | | | | | | | | | | | | | | | | | | | | | | | | | |
| Retail | | | 216,324 | | | | 209,382 | | | | 5,960 | | | | 215,342 | | | | 18,737 | | | | 3,116 | | | | 21,854 | | | | 1,499 | | | | 249 | | | | 1,748 | |
| | | | | | | | | | | | | | | | | | | | | | | | | | | | | | | | | | | | | | | | | |
Residential mortgages | | | 129,657 | | | | 125,051 | | | | 3,625 | | | | 128,676 | | | | 13,888 | | | | 1,362 | | | | 15,250 | | | | 1,111 | | | | 109 | | | | 1,220 | |
| | | | | | | | | | | | | | | | | | | | | | | | | | | | | | | | | | | | | | | | | |
Lombard lending | | | 82,275 | | | | 82,271 | | | | | | | | 82,271 | | | | 4,111 | | | | | | | | 4,111 | | | | 329 | | | | | | | | 329 | |
| | | | | | | | | | | | | | | | | | | | | | | | | | | | | | | | | | | | | | | | | |
Other retail | | | 4,392 | | | | 2,060 | | | | 2,336 | | | | 4,396 | | | | 739 | | | | 1,754 | | | | 2,493 | | | | 59 | | | | 140 | | | | 199 | |
| | | | | | | | | | | | | | | | | | | | | | | | | | | | | | | | | | | | | | | | | |
| Counterparty credit risk by exposure segment | | | 584,963 | | | | 428,513 | | | | 137,992 | | | | 566,505 | | | | 73,847 | | | | 21,733 | | | | 95,580 | | | | 5,908 | | | | 1,739 | | | | 7,646 | |
| | | | | | | | | | | | | | | | | | | | | | | | | | | | | | | | | | | | | | | | | |
| Securitization/re-securitization in the banking book1 | | | 16,537 | | | | 14,995 | | | | | | | | 14,995 | | | | 5,497 | | | | | | | | 5,497 | | | | 440 | | | | | | | | 440 | |
| | | | | | | | | | | | | | | | | | | | | | | | | | | | | | | | | | | | | | | | | |
| Equity instruments in the banking book2 | | | 798 | | | | 798 | | | | | | | | 798 | | | | 2,972 | | | | | | | | 2,972 | | | | 238 | | | | | | | | 238 | |
| | | | | | | | | | | | | | | | | | | | | | | | | | | | | | | | | | | | | | | | | |
| Credit valuation adjustment (CVA) | | | | | | | | | | | | | | | | | | | | | | | | | | | | | | | | | | | | | | | | |
| | | | | | | | | | | | | | | | | | | | | | | | | | | | | | | | | | | | | | | | | |
| Settlement risk | | | 217 | | | | 26 | | | | 114 | | | | 141 | | | | 28 | | | | 91 | | | | 118 | | | | 2 | | | | 7 | | | | 9 | |
| | | | | | | | | | | | | | | | | | | | | | | | | | | | | | | | | | | | | | | | | |
| Non-counterparty-related risk | | | 16,810 | 3 | | | | | | | 16,810 | 3 | | | 16,810 | 3 | | | | | | | 6,248 | | | | 6,248 | | | | | | | | 500 | | | | 500 | |
| | | | | | | | | | | | | | | | | | | | | | | | | | | | | | | | | | | | | | | | | |
| Market risk | | | 7,646 | | | | 6,453 | | | | | | | | 6,453 | | | | 28,812 | | | | | | | | 28,812 | | | | 2,305 | | | | | | | | 2,305 | |
| | | | | | | | | | | | | | | | | | | | | | | | | | | | | | | | | | | | | | | | | |
| Value-at-risk (VaR) | | | | | | | | | | | | | | | | | | | 3,876 | | | | | | | | 3,876 | | | | 310 | | | | | | | | 310 | |
| | | | | | | | | | | | | | | | | | | | | | | | | | | | | | | | | | | | | | | | | |
| Stressed value-at-risk (sVaR) | | | | | | | | | | | | | | | | | | | 5,852 | | | | | | | | 5,852 | | | | 468 | | | | | | | | 468 | |
| | | | | | | | | | | | | | | | | | | | | | | | | | | | | | | | | | | | | | | | | |
| Add-on for Risk not in VaR (RniV) | | | | | | | | | | | | | | | | | | | 3,326 | | | | | | | | 3,326 | | | | 266 | | | | | | | | 266 | |
| | | | | | | | | | | | | | | | | | | | | | | | | | | | | | | | | | | | | | | | | |
| Incremental risk charge (IRC) | | | | | | | | | | | | | | | | | | | 5,192 | | | | | | | | 5,192 | | | | 415 | | | | | | | | 415 | |
| | | | | | | | | | | | | | | | | | | | | | | | | | | | | | | | | | | | | | | | | |
| Comprehensive risk measure (CRM) | | | | | | | | | | | | | | | | | | | 8,928 | | | | | | | | 8,928 | | | | 714 | | | | | | | | 714 | |
| | | | | | | | | | | | | | | | | | | | | | | | | | | | | | | | | | | | | | | | | |
| Securitization/Re-securitization in the trading book4 | | | 7,646 | | | | 6,453 | | | | | | | | 6,453 | | | | 1,639 | | | | | | | | 1,639 | | | | 131 | | | | | | | | 131 | |
| | | | | | | | | | | | | | | | | | | | | | | | | | | | | | | | | | | | | | | | | |
| Operational risk | | | | | | | | | | | | | | | | | | | 53,277 | | | | | | | | 53,277 | | | | 4,262 | | | | | | | | 4,262 | |
| | | | | | | | | | | | | | | | | | | | | | | | | | | | | | | | | | | | | | | | | |
| Total Swiss SRB | | | 626,970 | | | | 450,785 | | | | 154,917 | | | | 605,701 | | | | 164,434 | | | | 28,071 | | | | 192,505 | | | | 13,155 | | | | 2,246 | | | | 15,400 | |
| | | | | | | | | | | | | | | | | | | | | | | | | | | | | | | | | | | | | | | | | |
1 As of 31 December 2012, CHF 2.9 billion of the securitization exposures (including CHF 2.1 billion for the option to acquire the SNB StabFund’s equity) were deducted from capital and therefore did not generate RWA. 2 Simple risk-weight method. 3 In 2013, the comparative period 31 December 2012 figure for net EAD was restated. On a restated basis, as of 31 December 2012, these had a regulatory credit exposure of CHF 16.8 billion. 4 In line with Basel III Pillar 1 requirements, RWA related to securitization/re-securitization in the trading book are newly presented as market risk RWA. Previously, these RWA were presented as credit risk RWA. Prior periods were restated for this change in presentation. 5 Our capital disclosures are based on Basel 2.5 capital charge of 8.0% for 2012.
569
Financial information
Supplemental disclosures required under Basel III Pillar 3 regulations
Credit risk
The tables in this section provide details on the exposures used to determine the firm’s credit risk-related regulatory capital. The parameters applied under the advanced internal ratings-based approach are generally based on the same methodologies, data and systems we use for internal credit risk quantification, except where certain treatments are specified by regulatory requirements. These include, for example, the application of regulatory prescribed floors and multipliers, and differences with respect to eligibility criteria and exposure definitions. The exposure information presented in this section therefore differs from that disclosed in the “Risk management and control” sections of our quarterly and annual reports. Similarly, the regulatory capital prescribed measure of credit risk exposure also differs from that required under IFRS. The following credit risk-related tables are based on Basel III phase-in and correspond to the counterparty credit risk by exposure segment excluding the stressed expected positive exposure (sEPE), which is shown in “Table 2: Detailed segmentation of Basel III exposures and risk-weighted assets.”
| | è | | Refer to the “Risk management and control” section of this report for more information on credit risk |
The regulatory gross credit exposure for banking products is equal to the drawn loan amounts represented on the balance sheet, with the exception of off-balance sheet commitments where the regulatory gross credit exposure is calculated by applying a credit conversion factor to the undrawn amount or contingent claim.
For traded products, we determine the regulatory credit exposure on the majority of our derivative exposures by applying the effective expected positive exposure (EPE) and sEPE as defined in the Basel III framework. For a small portion of the derivatives portfolio we instead apply the current exposure method (CEM) based on the replacement value of derivatives in combination with a regulatory prescribed add-on. For a majority of securities financing transactions, we determine the regulatory gross credit exposure using the close-out period (COP) approach. The regulatory gross credit exposure for traded products is set equal to regulatory net credit exposure, in the credit risk tables on the following pages.
The regulatory net credit exposure detailed in the tables on the following pages is shown as the regulatory exposure at default after applying collateral, netting and other eligible risk mitigants permitted by the relevant regulations. The information on impaired and defaulted assets by segmentation, consistent with the regulatory capital treatment, is presented in the “Risk management and control” section of this report.
Table 3: Counterparty credit risk by exposure segment and RWA
This table shows the derivation of RWA from the regulatory gross credit exposure, broken down by major types of credit exposures according to classes of financial instruments.
| | | | | | | | | | | | | | | | | | | | | | | | |
| | Exposure | | | Average regulatory
risk-weighting1 | | | RWA2 | |
| CHF million | | Average regulatory
gross credit
exposure | | | Regulatory gross
credit exposure | | | Less: regulatory
credit risk offsets
and adjustments | | | Regulatory net
credit exposure | | | | | | | |
| Cash and balances with central banks | | | 74,586 | | | | 78,912 | | | | | | | | 78,912 | | | | 0% | | | | 75 | |
| | | | | | | | | | | | | | | | | | | | | | | | | |
| Due from banks | | | 19,765 | | | | 19,773 | | | | (4,950 | ) | | | 14,823 | | | | 27% | | | | 3,981 | |
| | | | | | | | | | | | | | | | | | | | | | | | | |
| Loans | | | 286,007 | | | | 284,711 | | | | (11,026 | ) | | | 273,685 | | | | 15% | | | | 41,159 | |
| | | | | | | | | | | | | | | | | | | | | | | | | |
| Financial assets designated at fair value | | | 4,908 | | | | 2,782 | | | | (1,022 | ) | | | 1,759 | | | | 32% | | | | 564 | |
| | | | | | | | | | | | | | | | | | | | | | | | | |
| Off-balance sheet | | | 36,242 | | | | 33,774 | | | | (309 | ) | | | 33,465 | | | | 27% | | | | 8,940 | |
| | | | | | | | | | | | | | | | | | | | | | | | | |
| Banking products | | | 421,508 | | | | 419,951 | | | | (17,308 | ) | | | 402,644 | | | | 14% | | | | 54,719 | |
| | | | | | | | | | | | | | | | | | | | | | | | | |
| Derivatives | | | 58,191 | | | | 45,718 | | | | | | | | 45,718 | | | | 26% | | | | 11,911 | |
| | | | | | | | | | | | | | | | | | | | | | | | | |
| Cash collateral receivables on derivative instruments | | | 15,453 | | | | 17,154 | | | | | | | | 17,154 | | | | 22% | | | | 3,766 | |
| | | | | | | | | | | | | | | | | | | | | | | | | |
| Securities financing | | | 54,404 | | | | 49,753 | | | | | | | | 49,753 | | | | 7% | | | | 3,364 | |
| | | | | | | | | | | | | | | | | | | | | | | | | |
| Traded products | | | 128,047 | | | | 112,625 | | | | | | | | 112,625 | | | | 17% | | | | 19,041 | |
| | | | | | | | | | | | | | | | | | | | | | | | | |
| Trading portfolio assets | | | 5,281 | | | | 3,412 | | | | (26 | ) | | | 3,387 | | | | 82% | | | | 2,761 | |
| | | | | | | | | | | | | | | | | | | | | | | | | |
| Financial investments available-for-sale | | | 61,269 | | | | 58,236 | | | | | | | | 58,236 | | | | 2% | | | | 1,130 | |
| | | | | | | | | | | | | | | | | | | | | | | | | |
| Accrued income and prepaid expenses | | | 6,126 | | | | 5,560 | | | | (53 | ) | | | 5,507 | | | | 80% | | | | 4,415 | |
| | | | | | | | | | | | | | | | | | | | | | | | | |
| Other assets | | | 8,493 | | | | 7,733 | | | | (1,472 | ) | | | 6,261 | | | | 94% | | | | 5,895 | |
| | | | | | | | | | | | | | | | | | | | | | | | | |
| Other products | | | 81,169 | | | | 74,942 | | | | (1,551 | ) | | | 73,391 | | | | 19% | | | | 14,200 | |
| | | | | | | | | | | | | | | | | | | | | | | | | |
| Total 31.12.13 | | | 630,724 | | | | 607,518 | | | | (18,859 | ) | | | 588,660 | | | | 15% | | | | 87,960 | |
| | | | | | | | | | | | | | | | | | | | | | | | | |
| Total 31.12.12 (Basel 2.5) | | | 627,142 | | | | 584,963 | | | | (18,458 | ) | | | 566,505 | | | | 17% | | | | 95,580 | |
| | | | | | | | | | | | | | | | | | | | | | | | | |
1 Average regulatory gross credit exposure is calculated using the four quarter averages. 2 The derivation of RWA is based on the various credit risk parameters of the advanced IRB approach and the standardized approach, respectively.
570
Table 4: Regulatory gross credit exposure by geographical region
This table provides a breakdown of our portfolio by major types of credit exposure according to classes of financial instruments and also by geographical regions. The geographical distribution is based on the legal domicile of the counterparty or issuer.
| | | | | | | | | | | | | | | | | | | | | | | | | | | | | | | | |
| CHF million | | Asia Pacific | | | Latin
America | | | Middle East
and Africa | | | North
America | | | Switzerland | | | Rest of
Europe | | | Total regulatory
gross credit
exposure | | | Total regulatory
net credit
exposure | |
| Cash and balances with central banks | | | 5,053 | | | | 0 | | | | | | | | 49,341 | | | | 13,811 | | | | 10,707 | | | | 78,912 | | | | 78,912 | |
| | | | | | | | | | | | | | | | | | | | | | | | | | | | | | | | | |
| Due from banks | | | 4,564 | | | | 162 | | | | 185 | | | | 3,181 | | | | 728 | | | | 10,952 | | | | 19,773 | | | | 14,823 | |
| | | | | | | | | | | | | | | | | | | | | | | | | | | | | | | | | |
| Loans | | | 19,041 | | | | 5,396 | | | | 4,087 | | | | 65,651 | | | | 164,638 | | | | 25,898 | | | | 284,711 | | | | 273,685 | |
| | | | | | | | | | | | | | | | | | | | | | | | | | | | | | | | | |
| Financial assets designated at fair value | | | 49 | | | | | | | | 148 | | | | 1,041 | | | | 514 | | | | 1,030 | | | | 2,782 | | | | 1,759 | |
| | | | | | | | | | | | | | | | | | | | | | | | | | | | | | | | | |
| Off-balance sheet | | | 1,098 | | | | 713 | | | | 408 | | | | 17,420 | | | | 7,074 | | | | 7,061 | | | | 33,774 | | | | 33,465 | |
| | | | | | | | | | | | | | | | | | | | | | | | | | | | | | | | | |
| Banking products | | | 29,805 | | | | 6,270 | | | | 4,828 | | | | 136,635 | | | | 186,764 | | | | 55,649 | | | | 419,951 | | | | 402,644 | |
| | | | | | | | | | | | | | | | | | | | | | | | | | | | | | | | | |
| Derivatives | | | 5,208 | | | | 548 | | | | 282 | | | | 12,498 | | | | 3,934 | | | | 23,248 | | | | 45,718 | | | | 45,718 | |
| | | | | | | | | | | | | | | | | | | | | | | | | | | | | | | | | |
| Cash collateral receivables on derivative instruments | | | 3,503 | | | | 4 | | | | 37 | | | | 3,147 | | | | 279 | | | | 10,184 | | | | 17,154 | | | | 17,154 | |
| | | | | | | | | | | | | | | | | | | | | | | | | | | | | | | | | |
| Securities financing | | | 4,467 | | | | 243 | | | | 1,704 | | | | 11,236 | | | | 3,285 | | | | 28,818 | | | | 49,753 | | | | 49,753 | |
| | | | | | | | | | | | | | | | | | | | | | | | | | | | | | | | | |
| Traded products | | | 13,178 | | | | 795 | | | | 2,022 | | | | 26,881 | | | | 7,499 | | | | 62,249 | | | | 112,625 | | | | 112,625 | |
| | | | | | | | | | | | | | | | | | | | | | | | | | | | | | | | | |
| Trading portfolio assets | | | 1,265 | | | | 90 | | | | 18 | | | | 884 | | | | 13 | | | | 1,142 | | | | 3,412 | | | | 3,387 | |
| | | | | | | | | | | | | | | | | | | | | | | | | | | | | | | | | |
| Financial investments available-for-sale | | | 5,482 | | | | 99 | | | | 13 | | | | 21,721 | | | | 1,605 | | | | 29,317 | | | | 58,236 | | | | 58,236 | |
| | | | | | | | | | | | | | | | | | | | | | | | | | | | | | | | | |
| Accrued income and prepaid expenses | | | 190 | | | | 24 | | | | 10 | | | | 3,745 | | | | 345 | | | | 1,247 | | | | 5,560 | | | | 5,507 | |
| | | | | | | | | | | | | | | | | | | | | | | | | | | | | | | | | |
| Other assets | | | 221 | | | | 16 | | | | 15 | | | | 2,642 | | | | 4,081 | | | | 759 | | | | 7,733 | | | | 6,261 | |
| | | | | | | | | | | | | | | | | | | | | | | | | | | | | | | | | |
| Other products | | | 7,158 | | | | 229 | | | | 56 | | | | 28,991 | | | | 6,044 | | | | 32,465 | | | | 74,942 | | | | 73,391 | |
| | | | | | | | | | | | | | | | | | | | | | | | | | | | | | | | | |
| Total 31.12.13 | | | 50,141 | | | | 7,294 | | | | 6,907 | | | | 192,507 | | | | 200,307 | | | | 150,363 | | | | 607,518 | | | | 588,660 | |
| | | | | | | | | | | | | | | | | | | | | | | | | | | | | | | | | |
| Total 31.12.12 (Basel 2.5) | | | 41,690 | | | | 6,798 | | | | 6,564 | | | | 194,557 | | | | 210,112 | | | | 125,242 | | | | 584,963 | | | | 566,505 | |
| | | | | | | | | | | | | | | | | | | | | | | | | | | | | | | | | |
Table 5: Regulatory gross credit exposure by counterparty type
This table provides a breakdown of our portfolio by major types of credit exposure according to classes of financial instruments and also by counterparty type. The classification of counterparty type applied here is also used for the grouping of the balance sheet. The counterparty type is different from the BIS-defined exposure segments used in certain other tables in this section.
| | | | | | | | | | | | | | | | | | | | | | | | |
| CHF million | | Private
individuals | | | Corporates1 | | | Public entities
(including
sovereigns and
central banks) | | | Banks and
multilateral
institutions | | | Total
regulatory
gross credit
exposure | | | Total
regulatory
net credit
exposure | |
| Cash and balances with central banks | | | | | | | 0 | | | | 78,686 | | | | 226 | | | | 78,912 | | | | 78,912 | |
| | | | | | | | | | | | | | | | | | | | | | | | | |
| Due from banks | | | | | | | | | | | 2,407 | | | | 17,366 | | | | 19,773 | | | | 14,823 | |
| | | | | | | | | | | | | | | | | | | | | | | | | |
| Loans | | | 181,855 | | | | 99,120 | | | | 3,736 | | | | | | | | 284,711 | | | | 273,685 | |
| | | | | | | | | | | | | | | | | | | | | | | | | |
| Financial assets designated at fair value | | | | | | | 2,200 | | | | 32 | | | | 550 | | | | 2,782 | | | | 1,759 | |
| | | | | | | | | | | | | | | | | | | | | | | | | |
| Off-balance sheet | | | 2,180 | | | | 29,855 | | | | 286 | | | | 1,453 | | | | 33,774 | | | | 33,465 | |
| | | | | | | | | | | | | | | | | | | | | | | | | |
| Banking products | | | 184,034 | | | | 131,175 | | | | 85,148 | | | | 19,595 | | | | 419,951 | | | | 402,644 | |
| | | | | | | | | | | | | | | | | | | | | | | | | |
| Derivatives | | | 1,530 | | | | 18,828 | | | | 6,143 | | | | 19,217 | | | | 45,718 | | | | 45,718 | |
| | | | | | | | | | | | | | | | | | | | | | | | | |
| Cash collateral receivables on derivative financial instruments | | | 1 | | | | 8,358 | | | | 138 | | | | 8,657 | | | | 17,154 | | | | 17,154 | |
| | | | | | | | | | | | | | | | | | | | | | | | | |
| Securities financing | | | 34 | | | | 34,586 | | | | 5,728 | | | | 9,404 | | | | 49,753 | | | | 49,753 | |
| | | | | | | | | | | | | | | | | | | | | | | | | |
| Traded products | | | 1,565 | | | | 61,772 | | | | 12,009 | | | | 37,278 | | | | 112,625 | | | | 112,625 | |
| | | | | | | | | | | | | | | | | | | | | | | | | |
| Trading portfolio assets | | | 1 | | | | 2,588 | | | | 301 | | | | 523 | | | | 3,412 | | | | 3,387 | |
| | | | | | | | | | | | | | | | | | | | | | | | | |
| Financial investments available-for-sale | | | 7 | | | | 9,864 | | | | 40,699 | | | | 7,665 | | | | 58,236 | | | | 58,236 | |
| | | | | | | | | | | | | | | | | | | | | | | | | |
| Accrued income and prepaid expenses | | | 3,678 | | | | 1,082 | | | | 157 | | | | 643 | | | | 5,560 | | | | 5,507 | |
| | | | | | | | | | | | | | | | | | | | | | | | | |
| Other assets | | | 679 | | | | 5,410 | | | | 391 | | | | 1,254 | | | | 7,733 | | | | 6,261 | |
| | | | | | | | | | | | | | | | | | | | | | | | | |
| Other products | | | 4,365 | | | | 18,944 | | | | 41,549 | | | | 10,085 | | | | 74,942 | | | | 73,391 | |
| | | | | | | | | | | | | | | | | | | | | | | | | |
| Total 31.12.13 | | | 189,964 | | | | 211,890 | | | | 138,706 | | | | 66,958 | | | | 607,518 | | | | 588,660 | |
| | | | | | | | | | | | | | | | | | | | | | | | | |
| Total 31.12.12 (Basel 2.5) | | | 182,867 | | | | 213,037 | | | | 135,228 | | | | 53,830 | | | | 584,963 | | | | 566,505 | |
| | | | | | | | | | | | | | | | | | | | | | | | | |
1 Also includes non-bank financial institutions.
571
Financial information
Supplemental disclosures required under Basel III Pillar 3 regulations
Table 6: Regulatory gross credit exposure by residual contractual maturity
This table provides a breakdown of our portfolio by major types of credit exposure according to classes of financial instruments and also by residual contractual maturity, not taking into account any early redemption features.
| | | | | | | | | | | | | | | | | | | | | | | | |
| CHF million | | Callable and
on demand1 | | | Due in 1 year or less | | | Due between
1 year and 5 years | | | Due over
5 years | | | Total
regulatory
gross credit
exposure2 | | | Total
regulatory
net credit
exposure | |
| Cash and balances with central banks | | | 78,912 | | | | | | | | | | | | | | | | 78,912 | | | | 78,912 | |
| | | | | | | | | | | | | | | | | | | | | | | | | |
| Due from banks | | | 15,407 | | | | 4,213 | | | | 127 | | | | 26 | | | | 19,773 | | | | 14,823 | |
| | | | | | | | | | | | | | | | | | | | | | | | | |
| Loans | | | 79,965 | | | | 92,219 | | | | 68,282 | | | | 44,246 | | | | 284,711 | | | | 273,685 | |
| | | | | | | | | | | | | | | | | | | | | | | | | |
| Financial assets designated at fair value | | | | | | | 295 | | | | 1,852 | | | | 635 | | | | 2,782 | | | | 1,759 | |
| | | | | | | | | | | | | | | | | | | | | | | | | |
| Off-balance sheet | | | 55 | | | | 7,849 | | | | 23,603 | | | | 2,267 | | | | 33,774 | | | | 33,465 | |
| | | | | | | | | | | | | | | | | | | | | | | | | |
| Banking products | | | 174,338 | | | | 104,574 | | | | 93,863 | | | | 47,175 | | | | 419,951 | | | | 402,644 | |
| | | | | | | | | | | | | | | | | | | | | | | | | |
| Derivatives | | | 70 | | | | 24,598 | | | | 8,155 | | | | 12,895 | | | | 45,718 | | | | 45,718 | |
| | | | | | | | | | | | | | | | | | | | | | | | | |
| Cash collateral receivables on derivative instruments | | | 6,360 | | | | 6,006 | | | | 2,144 | | | | 2,644 | | | | 17,154 | | | | 17,154 | |
| | | | | | | | | | | | | | | | | | | | | | | | | |
| Securities financing | | | 41,887 | | | | 7,433 | | | | 432 | | | | 2 | | | | 49,753 | | | | 49,753 | |
| | | | | | | | | | | | | | | | | | | | | | | | | |
| Traded products | | | 48,316 | | | | 38,037 | | | | 10,731 | | | | 15,540 | | | | 112,625 | | | | 112,625 | |
| | | | | | | | | | | | | | | | | | | | | | | | | |
| Trading portfolio assets | | | 201 | | | | 1,318 | | | | 887 | | | | 1,007 | | | | 3,412 | | | | 3,387 | |
| | | | | | | | | | | | | | | | | | | | | | | | | |
| Financial investments available-for-sale | | | 16 | | | | 26,967 | | | | 26,995 | | | | 4,258 | | | | 58,236 | | | | 58,236 | |
| | | | | | | | | | | | | | | | | | | | | | | | | |
| Accrued income and prepaid expenses | | | 2,470 | | | | 362 | | | | 1,728 | | | | 1,000 | | | | 5,560 | | | | 5,507 | |
| | | | | | | | | | | | | | | | | | | | | | | | | |
| Other assets | | | 7,733 | | | | | | | | | | | | | | | | 7,733 | | | | 6,261 | |
| | | | | | | | | | | | | | | | | | | | | | | | | |
| Other products | | | 10,420 | | | | 28,647 | | | | 29,610 | | | | 6,265 | | | | 74,942 | | | | 73,391 | |
| | | | | | | | | | | | | | | | | | | | | | | | | |
| Total 31.12.13 | | | 233,075 | | | | 171,259 | | | | 134,204 | | | | 68,981 | | | | 607,518 | | | | 588,660 | |
| | | | | | | | | | | | | | | | | | | | | | | | | |
| Total 31.12.12 (Basel 2.5) | | | 201,822 | | | | 176,125 | | | | 136,625 | | | | 70,391 | | | | 584,963 | | | | 566,505 | |
| | | | | | | | | | | | | | | | | | | | | | | | | |
1 For example loans without a fixed term and cash collateral receivables on derivative instruments, on which notice of termination has not been given. 2 Amounts presented in this table are based on contractual maturities and do not take into account early redemption features.
572
Table 7: Derivation of regulatory net credit exposure
This table provides a derivation of the regulatory net credit exposure from the regulatory gross credit exposure according to the advanced internal ratings-based approach and the standardized approach.
| | | | | | | | | | | | | | | | |
| CHF million | | Advanced IRB
approach | | | Standardized
approach | | | Total 31.12.13 | | | Total 31.12.12
(Basel 2.5) | |
| Total regulatory gross credit exposure | | | 436,764 | | | | 170,754 | | | | 607,518 | | | | 584,963 | |
| | | | | | | | | | | | | | | | | |
| Less: regulatory credit risk offsets and adjustments | | | (12,395 | ) | | | (6,464 | ) | | | (18,859 | ) | | | (18,458 | ) |
| | | | | | | | | | | | | | | | | |
| Total regulatory net credit exposure | | | 424,369 | | | | 164,290 | | | | 588,660 | | | | | |
| | | | | | | | | | | | | | | | | |
| Total 31.12.12 (Basel 2.5) | | | 428,513 | | | | 137,992 | | | | | | | | 566,505 | |
| | | | | | | | | | | | | | | | | |
| | è | | Refer to “Table 2: Detailed segmentation of Basel III exposures andrisk-weighted assets” in this section for more information on the regulatory net credit exposure by exposure segment |
Table 8: Regulatory gross credit exposure covered by guarantees and credit derivatives
This table provides a breakdown of exposures covered by guarantees as well as those covered by credit derivatives, according to BIS-defined exposure segments.
The amounts in the table reflect the values used for determining regulatory capital to the extent collateral are eligible under the BIS framework.
| | | | | | | | |
| CHF million | | Exposure covered by
guarantees1 | | | Exposure covered by
credit derivatives | |
| Exposure segment | | | | | | | | |
| | | | | | | | | |
| Corporates | | | 4,231 | | | | 12,300 | |
| | | | | | | | | |
| Sovereigns | | | 29 | | | | 39 | |
| | | | | | | | | |
| Banks | | | 377 | | | | 18 | |
| | | | | | | | | |
| Central counterparties | | | | | | | | |
| | | | | | | | | |
| Retail | | | | | | | | |
| | | | | | | | | |
Residential mortgages | | | 3 | | | | | |
| | | | | | | | | |
Lombard lending | | | 456 | | | | | |
| | | | | | | | | |
Other retail | | | 49 | | | | | |
| | | | | | | | | |
| Total 31.12.13 | | | 5,145 | | | | 12,357 | |
| | | | | | | | | |
| Total 31.12.12 (Basel 2.5) | | | 6,813 | | | | 16,331 | |
| | | | | | | | | |
1 Includes guarantees and standby letters of credit provided by third parties, mainly banks.
573
Financial information
Supplemental disclosures required under Basel III Pillar 3 regulations
Advanced internal ratings-based approach
UBS uses the advanced internal ratings-based (A-IRB) and standardized approaches for calculating credit risk exposures across all business divisions and the Corporate Center. Under the A-IRB approach, the required capital for credit risk is quantified through empirical models developed by the Bank for estimating the probability of default, loss given default, exposure at default and other parameters, subject to the approval of the regulator. Under the standardized approach, the Bank uses ratings from external credit rating agencies to quantify the required capital for credit risk. The A-IRB approach calculates RWA for the banking book using advanced
IRB risk measures like probability of default (PD) and loss given default (LGD), based on internal assessments.
| | è | | Refer to the “Risk management and control” section of this report for more information |
Tables 9a to 9f provide a breakdown of the regulatory net credit exposure-weighted average PD, LGD, RWA and the average risk weight by internal UBS ratings across BIS-defined exposure segments. In addition, a breakdown of the regulatory net credit exposure and RWA for which we apply the A-IRB approach by internal rating class is shown for each of the exposure segments.
574
Table 9a: Corporates – Advanced IRB approach: Regulatory net credit exposure, weighted average PD, LGD and RWA by internal UBS ratings
| | | | | | | | | | | | | | | | | | | | | | | | |
| | | 31.12.13 | |
| CHF million, except where indicated1 | | Regulatory net
credit exposure | | | of which: loan
commitments | | | Average
PD in %2 | | | Average
LGD in % | | | RWA | | | Average risk
weight in % | |
| Investment grade | | | | | | | | | | | | | | | | | | | | | | | | |
| | | | | | | | | | | | | | | | | | | | | | | | | |
| Rating 0 | | | 10 | | | | | | | | 0.0 | | | | 45.5 | | | | 1 | | | | 7.0 | |
| | | | | | | | | | | | | | | | | | | | | | | | | |
| Rating 1 | | | 10,199 | | | | 239 | | | | 0.0 | | | | 24.0 | | | | 565 | | | | 5.5 | |
| | | | | | | | | | | | | | | | | | | | | | | | | |
| Rating 2 | | | 28,845 | | | | 2,242 | | | | 0.0 | | | | 22.1 | | | | 1,650 | | | | 5.7 | |
| | | | | | | | | | | | | | | | | | | | | | | | | |
| Rating 3 | | | 17,027 | | | | 3,444 | | | | 0.1 | | | | 32.8 | | | | 3,154 | | | | 18.5 | |
| | | | | | | | | | | | | | | | | | | | | | | | | |
| Rating 4 | | | 10,317 | | | | 1,659 | | | | 0.2 | | | | 37.6 | | | | 3,400 | | | | 33.0 | |
| | | | | | | | | | | | | | | | | | | | | | | | | |
| Rating 5 | | | 11,673 | | | | 977 | | | | 0.4 | | | | 31.2 | | | | 4,573 | | | | 39.2 | |
| | | | | | | | | | | | | | | | | | | | | | | | | |
| Sub-Investment grade | | | | | | | | | | | | | | | | | | | | | | | | |
| | | | | | | | | | | | | | | | | | | | | | | | | |
| Rating 6 | | | 11,682 | | | | 595 | | | | 0.6 | | | | 21.8 | | | | 4,853 | | | | 41.5 | |
| | | | | | | | | | | | | | | | | | | | | | | | | |
| Rating 7 | | | 9,755 | | | | 519 | | | | 1.0 | | | | 22.6 | | | | 4,473 | | | | 45.9 | |
| | | | | | | | | | | | | | | | | | | | | | | | | |
| Rating 8 | | | 7,900 | | | | 907 | | | | 1.7 | | | | 22.4 | | | | 3,983 | | | | 50.4 | |
| | | | | | | | | | | | | | | | | | | | | | | | | |
| Rating 9 | | | 4,973 | | | | 576 | | | | 2.7 | | | | 20.8 | | | | 2,766 | | | | 55.6 | |
| | | | | | | | | | | | | | | | | | | | | | | | | |
| Rating 10 | | | 3,138 | | | | 1,238 | | | | 4.6 | | | | 23.2 | | | | 2,606 | | | | 83.1 | |
| | | | | | | | | | | | | | | | | | | | | | | | | |
| Rating 11 | | | 997 | | | | 403 | | | | 7.8 | | | | 19.1 | | | | 797 | | | | 80.0 | |
| | | | | | | | | | | | | | | | | | | | | | | | | |
| Rating 12 | | | 426 | | | | 122 | | | | 13.0 | | | | 19.6 | | | | 406 | | | | 95.4 | |
| | | | | | | | | | | | | | | | | | | | | | | | | |
| Rating 13 | | | 165 | | | | 54 | | | | 22.0 | | | | 21.2 | | | | 187 | | | | 113.3 | |
| | | | | | | | | | | | | | | | | | | | | | | | | |
| Total 31.12.13 | | | 117,104 | | | | 12,975 | | | | 0.8 | | | | 26.1 | | | | 33,414 | | | | 28.5 | |
| | | | | | | | | | | | | | | | | | | | | | | | | |
1 Impaired and defaulted assets are excluded from this table (RWA in December 2013, CHF 1,245 million). Refer to the “Risk management and control” section of this report for impaired and defaulted figures. 2 Average PD for the internal rating categories are based on median values.
| | | | | | | | | | | | | | | | | | | | | | | | |
| | | 31.12.12 | |
| CHF million, except where indicated1 | | Regulatory net
credit exposure | | | of which: loan
commitments | | | Average
PD in %2 | | | Average
LGD in % | | | RWA | | | Average risk
weight in % | |
| Investment grade | | | | | | | | | | | | | | | | | | | | | | | | |
| | | | | | | | | | | | | | | | | | | | | | | | | |
| Rating 0 | | | 28 | | | | | | | | 0.0 | | | | 42.9 | | | | 2 | | | | 7.4 | |
| | | | | | | | | | | | | | | | | | | | | | | | | |
| Rating 1 | | | 7,752 | | | | | | | | 0.0 | | | | 23.0 | | | | 489 | | | | 6.3 | |
| | | | | | | | | | | | | | | | | | | | | | | | | |
| Rating 2 | | | 29,450 | | | | 2,226 | | | | 0.0 | | | | 20.7 | | | | 1,906 | | | | 6.5 | |
| | | | | | | | | | | | | | | | | | | | | | | | | |
| Rating 3 | | | 25,340 | | | | 3,022 | | | | 0.1 | | | | 30.2 | | | | 4,028 | | | | 15.9 | |
| | | | | | | | | | | | | | | | | | | | | | | | | |
| Rating 4 | | | 16,042 | | | | 1,716 | | | | 0.2 | | | | 30.9 | | | | 4,755 | | | | 29.6 | |
| | | | | | | | | | | | | | | | | | | | | | | | | |
| Rating 5 | | | 11,446 | | | | 1,433 | | | | 0.4 | | | | 31.2 | | | | 8,598 | | | | 75.1 | |
| | | | | | | | | | | | | | | | | | | | | | | | | |
| Sub-Investment grade | | | | | | | | | | | | | | | | | | | | | | | | |
| | | | | | | | | | | | | | | | | | | | | | | | | |
| Rating 6 | | | 11,469 | | | | 695 | | | | 0.6 | | | | 25.7 | | | | 5,190 | | | | 45.3 | |
| | | | | | | | | | | | | | | | | | | | | | | | | |
| Rating 7 | | | 11,440 | | | | 642 | | | | 1.0 | | | | 24.8 | | | | 5,427 | | | | 47.4 | |
| | | | | | | | | | | | | | | | | | | | | | | | | |
| Rating 8 | | | 8,329 | | | | 777 | | | | 1.7 | | | | 21.0 | | | | 3,688 | | | | 44.3 | |
| | | | | | | | | | | | | | | | | | | | | | | | | |
| Rating 9 | | | 5,792 | | | | 775 | | | | 2.7 | | | | 24.2 | | | | 4,047 | | | | 69.9 | |
| | | | | | | | | | | | | | | | | | | | | | | | | |
| Rating 10 | | | 2,468 | | | | 1,022 | | | | 4.6 | | | | 27.1 | | | | 2,349 | | | | 95.2 | |
| | | | | | | | | | | | | | | | | | | | | | | | | |
| Rating 11 | | | 1,347 | | | | 487 | | | | 7.8 | | | | 19.1 | | | | 1,058 | | | | 78.5 | |
| | | | | | | | | | | | | | | | | | | | | | | | | |
| Rating 12 | | | 655 | | | | 239 | | | | 13.0 | | | | 14.4 | | | | 458 | | | | 69.9 | |
| | | | | | | | | | | | | | | | | | | | | | | | | |
| Rating 13 | | | 149 | | | | 22 | | | | 22.0 | | | | 8.6 | | | | 67 | | | | 45.0 | |
| | | | | | | | | | | | | | | | | | | | | | | | | |
| Total 31.12.12 (Basel 2.5) | | | 131,708 | | | | 13,057 | | | | 0.7 | | | | 25.9 | | | | 42,063 | | | | 31.9 | |
| | | | | | | | | | | | | | | | | | | | | | | | | |
1 Impaired and defaulted assets are excluded from this table (RWA in December 2012, CHF 1,188 million). Refer to the “Risk management and control” section of this report for impaired and defaulted figures. 2 Average PD for the internal rating categories are based on median values.
575
Financial information
Supplemental disclosures required under Basel III Pillar 3 regulations
Table 9b: Sovereigns – Advanced IRB approach: Regulatory net credit exposure, weighted average PD, LGD and RWA by internal UBS ratings
| | | | | | | | | | | | | | | | | | | | | | | | |
| | | 31.12.13 | |
| CHF million, except where indicated1 | | Regulatory net
credit exposure | | | of which: loan
commitments | | | Average
PD in %2 | | | Average
LGD in % | | | RWA | | | Average risk
weight in % | |
| Investment grade | | | | | | | | | | | | | | | | | | | | | | | | |
| | | | | | | | | | | | | | | | | | | | | | | | | |
| Rating 0 | | | 25,714 | | | | 1 | | | | 0.0 | | | | 39.4 | | | | 51 | | | | 0.2 | |
| | | | | | | | | | | | | | | | | | | | | | | | | |
| Rating 1 | | | 4,273 | | | | 194 | | | | 0.0 | | | | 31.3 | | | | 117 | | | | 2.7 | |
| | | | | | | | | | | | | | | | | | | | | | | | | |
| Rating 2 | | | 2,652 | | | | 16 | | | | 0.0 | | | | 42.5 | | | | 309 | | | | 11.7 | |
| | | | | | | | | | | | | | | | | | | | | | | | | |
| Rating 3 | | | 882 | | | | 6 | | | | 0.1 | | | | 43.5 | | | | 161 | | | | 18.2 | |
| | | | | | | | | | | | | | | | | | | | | | | | | |
| Rating 4 | | | 267 | | | | 24 | | | | 0.2 | | | | 58.6 | | | | 142 | | | | 53.4 | |
| | | | | | | | | | | | | | | | | | | | | | | | | |
| Rating 5 | | | 10 | | | | | | | | 0.4 | | | | 11.5 | | | | 2 | | | | 22.8 | |
| | | | | | | | | | | | | | | | | | | | | | | | | |
| Sub-Investment grade | | | | | | | | | | | | | | | | | | | | | | | | |
| | | | | | | | | | | | | | | | | | | | | | | | | |
| Rating 6 | | | 22 | | | | 0 | | | | 0.6 | | | | 39.2 | | | | 14 | | | | 64.5 | |
| | | | | | | | | | | | | | | | | | | | | | | | | |
| Rating 7 | | | 3 | | | | 0 | | | | 1.0 | | | | 51.5 | | | | 4 | | | | 133.0 | |
| | | | | | | | | | | | | | | | | | | | | | | | | |
| Rating 8 | | | 8 | | | | | | | | 1.7 | | | | 22.2 | | | | 6 | | | | 70.8 | |
| | | | | | | | | | | | | | | | | | | | | | | | | |
| Rating 9 | | | 2 | | | | 0 | | | | 2.7 | | | | 22.5 | | | | 1 | | | | 69.2 | |
| | | | | | | | | | | | | | | | | | | | | | | | | |
| Rating 10 | | | 0 | | | | | | | | 4.6 | | | | 10.0 | | | | 0 | | | | 47.1 | |
| | | | | | | | | | | | | | | | | | | | | | | | | |
| Rating 11 | | | 4 | | | | | | | | 7.8 | | | | 30.1 | | | | 6 | | | | 139.4 | |
| | | | | | | | | | | | | | | | | | | | | | | | | |
| Rating 12 | | | 1 | | | | | | | | 13.0 | | | | 10.0 | | | | 1 | | | | 58.6 | |
| | | | | | | | | | | | | | | | | | | | | | | | | |
| Rating 13 | | | 0 | | | | | | | | 22.0 | | | | 10.0 | | | | 0 | | | | 54.5 | |
| | | | | | | | | | | | | | | | | | | | | | | | | |
| Total 31.12.13 | | | 33,840 | | | | 240 | | | | 0.0 | | | | 38.8 | | | | 815 | | | | 2.4 | |
| | | | | | | | | | | | | | | | | | | | | | | | | |
1 Impaired and defaulted assets are excluded from this table (RWA in December 2013, CHF 25 million). Refer to the “Risk management and control” section of this report for impaired and defaulted figures. 2 Average PD for the internal rating categories are based on median values.
| | | | | | | | | | | | | | | | | | | | | | | | |
| | | 31.12.12 | |
| CHF million, except where indicated1 | | Regulatory net
credit exposure | | | of which: loan
commitments | | | Average
PD in %2 | | | Average
LGD in % | | | RWA | | | Average risk
weight in % | |
| Investment grade | | | | | | | | | | | | | | | | | | | | | | | | |
| | | | | | | | | | | | | | | | | | | | | | | | | |
| Rating 0 | | | 27,851 | | | | 1 | | | | 0.0 | | | | 25.9 | | | | 45 | | | | 0.2 | |
| | | | | | | | | | | | | | | | | | | | | | | | | |
| Rating 1 | | | 4,508 | | | | 95 | | | | 0.0 | | | | 32.6 | | | | 165 | | | | 3.7 | |
| | | | | | | | | | | | | | | | | | | | | | | | | |
| Rating 2 | | | 2,321 | | | | 25 | | | | 0.0 | | | | 41.3 | | | | 443 | | | | 19.1 | |
| | | | | | | | | | | | | | | | | | | | | | | | | |
| Rating 3 | | | 723 | | | | | | | | 0.1 | | | | 47.0 | | | | 189 | | | | 26.2 | |
| | | | | | | | | | | | | | | | | | | | | | | | | |
| Rating 4 | | | 2,271 | | | | 0 | | | | 0.2 | | | | 70.0 | | | | 2,270 | | | | 99.9 | |
| | | | | | | | | | | | | | | | | | | | | | | | | |
| Rating 5 | | | 32 | | | | 0 | | | | 0.4 | | | | 77.7 | | | | 27 | | | | 83.1 | |
| | | | | | | | | | | | | | | | | | | | | | | | | |
| Sub-Investment grade | | | | | | | | | | | | | | | | | | | | | | | | |
| | | | | | | | | | | | | | | | | | | | | | | | | |
| Rating 6 | | | 17 | | | | 0 | | | | 0.6 | | | | 21.0 | | | | 7 | | | | 43.3 | |
| | | | | | | | | | | | | | | | | | | | | | | | | |
| Rating 7 | | | 30 | | | | 1 | | | | 1.0 | | | | 31.7 | | | | 17 | | | | 56.2 | |
| | | | | | | | | | | | | | | | | | | | | | | | | |
| Rating 8 | | | 7 | | | | | | | | 1.7 | | | | 19.8 | | | | 4 | | | | 57.0 | |
| | | | | | | | | | | | | | | | | | | | | | | | | |
| Rating 9 | | | 4 | | | | 0 | | | | 2.7 | | | | 29.5 | | | | 3 | | | | 87.4 | |
| | | | | | | | | | | | | | | | | | | | | | | | | |
| Rating 10 | | | 0 | | | | | | | | 4.6 | | | | 21.2 | | | | 0 | | | | 83.5 | |
| | | | | | | | | | | | | | | | | | | | | | | | | |
| Rating 11 | | | 4 | | | | | | | | 7.8 | | | | 29.0 | | | | 6 | | | | 133.5 | |
| | | | | | | | | | | | | | | | | | | | | | | | | |
| Rating 12 | | | 0 | | | | | | | | 13.0 | | | | 10.0 | | | | 0 | | | | 54.8 | |
| | | | | | | | | | | | | | | | | | | | | | | | | |
| Rating 13 | | | 0 | | | | | | | | 22.0 | | | | 10.0 | | | | 0 | | | | 57.7 | |
| | | | | | | | | | | | | | | | | | | | | | | | | |
| Total 31.12.12 (Basel 2.5) | | | 37,769 | | | | 122 | | | | 0.0 | | | | 30.8 | | | | 3,177 | | | | 8.4 | |
| | | | | | | | | | | | | | | | | | | | | | | | | |
1 Impaired and defaulted assets are excluded from this table (RWA in December 2012, CHF 29 million). Refer to the “Risk management and control” section of this report for impaired and defaulted figures. 2 Average PD for the internal rating categories are based on median values.
576
Table 9c: Banks – Advanced IRB approach: Regulatory net credit exposure, weighted average PD, LGD and RWA by internal UBS ratings
| | | | | | | | | | | | | | | | | | | | | | | | |
| | | 31.12.13 | |
| CHF million, except where indicated1 | | Regulatory net
credit exposure | | | of which: loan
commitments | | | Average
PD in %2 | | | Average
LGD in % | | | RWA | | | Average risk
weight in % | |
| Investment grade | | | | | | | | | | | | | | | | | | | | | | | | |
| | | | | | | | | | | | | | | | | | | | | | | | | |
| Rating 0 | | | | | | | | | | | | | | | | | | | | | | | | |
| | | | | | | | | | | | | | | | | | | | | | | | | |
| Rating 1 | | | 2,094 | | | | 0 | | | | 0.0 | | | | 37.7 | | | | 174 | | | | 8.3 | |
| | | | | | | | | | | | | | | | | | | | | | | | | |
| Rating 2 | | | 36,415 | | | | 7,724 | | | | 0.0 | | | | 34.6 | | | | 6,823 | | | | 18.7 | |
| | | | | | | | | | | | | | | | | | | | | | | | | |
| Rating 3 | | | 9,714 | | | | 1,449 | | | | 0.1 | | | | 33.8 | | | | 1,586 | | | | 16.3 | |
| | | | | | | | | | | | | | | | | | | | | | | | | |
| Rating 4 | | | 3,206 | | | | 45 | | | | 0.2 | | | | 40.7 | | | | 1,189 | | | | 37.1 | |
| | | | | | | | | | | | | | | | | | | | | | | | | |
| Rating 5 | | | 1,196 | | | | 42 | | | | 0.4 | | | | 25.3 | | | | 415 | | | | 34.7 | |
| | | | | | | | | | | | | | | | | | | | | | | | | |
| Sub-Investment grade | | | | | | | | | | | | | | | | | | | | | | | | |
| | | | | | | | | | | | | | | | | | | | | | | | | |
| Rating 6 | | | 414 | | | | 4 | | | | 0.6 | | | | 37.0 | | | | 266 | | | | 64.2 | |
| | | | | | | | | | | | | | | | | | | | | | | | | |
| Rating 7 | | | 383 | | | | 0 | | | | 1.0 | | | | 43.5 | | | | 338 | | | | 88.3 | |
| | | | | | | | | | | | | | | | | | | | | | | | | |
| Rating 8 | | | 517 | | | | 197 | | | | 1.7 | | | | 16.2 | | | | 199 | | | | 38.5 | |
| | | | | | | | | | | | | | | | | | | | | | | | | |
| Rating 9 | | | 118 | | | | 5 | | | | 2.7 | | | | 36.7 | | | | 142 | | | | 119.7 | |
| | | | | | | | | | | | | | | | | | | | | | | | | |
| Rating 10 | | | 32 | | | | 0 | | | | 4.6 | | | | 41.6 | | | | 50 | | | | 159.5 | |
| | | | | | | | | | | | | | | | | | | | | | | | | |
| Rating 11 | | | 69 | | | | 1 | | | | 7.8 | | | | 38.0 | | | | 119 | | | | 172.3 | |
| | | | | | | | | | | | | | | | | | | | | | | | | |
| Rating 12 | | | 67 | | | | | | | | 13.0 | | | | 41.9 | | | | 140 | | | | 210.2 | |
| | | | | | | | | | | | | | | | | | | | | | | | | |
| Rating 13 | | | 0 | | | | | | | | 22.0 | | | | 19.0 | | | | 0 | | | | 112.3 | |
| | | | | | | | | | | | | | | | | | | | | | | | | |
| Total 31.12.13 | | | 54,225 | | | | 9,466 | | | | 0.1 | | | | 34.7 | | | | 11,441 | | | | 21.1 | |
| | | | | | | | | | | | | | | | | | | | | | | | | |
1 Impaired and defaulted assets are excluded from this table (RWA in December 2013, CHF 174 million). Refer to the “Risk management and control” section of this report for impaired and defaulted figures. 2 Average PD for the internal rating categories are based on median values.
| | | | | | | | | | | | | | | | | | | | | | | | |
| | | 31.12.12 | |
| CHF million, except where indicated1 | | Regulatory net
credit exposure | | | of which: loan
commitments | | | Average
PD in %2 | | | Average
LGD in % | | | RWA | | | Average risk weight in % | |
| Investment grade | | | | | | | | | | | | | | | | | | | | | | | | |
| | | | | | | | | | | | | | | | | | | | | | | | | |
| Rating 0 | | | | | | | | | | | | | | | | | | | | | | | | |
| | | | | | | | | | | | | | | | | | | | | | | | | |
| Rating 1 | | | 1,111 | | | | 8 | | | | 0.0 | | | | 32.7 | | | | 135 | | | | 12.2 | |
| | | | | | | | | | | | | | | | | | | | | | | | | |
| Rating 2 | | | 26,731 | | | | 10,072 | | | | 0.0 | | | | 28.0 | | | | 2,731 | | | | 10.2 | |
| | | | | | | | | | | | | | | | | | | | | | | | | |
| Rating 3 | | | 10,108 | | | | 1,795 | | | | 0.1 | | | | 32.0 | | | | 1,866 | | | | 18.5 | |
| | | | | | | | | | | | | | | | | | | | | | | | | |
| Rating 4 | | | 4,151 | | | | 15 | | | | 0.2 | | | | 42.0 | | | | 1,663 | | | | 40.1 | |
| | | | | | | | | | | | | | | | | | | | | | | | | |
| Rating 5 | | | 3,944 | | | | 29 | | | | 0.4 | | | | 11.5 | | | | 541 | | | | 13.7 | |
| | | | | | | | | | | | | | | | | | | | | | | | | |
| Sub-Investment grade | | | | | | | | | | | | | | | | | | | | | | | | |
| | | | | | | | | | | | | | | | | | | | | | | | | |
| Rating 6 | | | 854 | | | | 2 | | | | 0.6 | | | | 24.8 | | | | 331 | | | | 38.8 | |
| | | | | | | | | | | | | | | | | | | | | | | | | |
| Rating 7 | | | 424 | | | | 7 | | | | 1.0 | | | | 41.6 | | | | 344 | | | | 81.1 | |
| | | | | | | | | | | | | | | | | | | | | | | | | |
| Rating 8 | | | 645 | | | | 50 | | | | 1.7 | | | | 13.1 | | | | 185 | | | | 28.6 | |
| | | | | | | | | | | | | | | | | | | | | | | | | |
| Rating 9 | | | 29 | | | | 0 | | | | 2.7 | | | | 38.8 | | | | 29 | | | | 102.1 | |
| | | | | | | | | | | | | | | | | | | | | | | | | |
| Rating 10 | | | 104 | | | | 78 | | | | 4.6 | | | | 32.5 | | | | 116 | | | | 111.8 | |
| | | | | | | | | | | | | | | | | | | | | | | | | |
| Rating 11 | | | 96 | | | | 1 | | | | 7.8 | | | | 39.3 | | | | 179 | | | | 185.8 | |
| | | | | | | | | | | | | | | | | | | | | | | | | |
| Rating 12 | | | 1 | | | | | | | | 13.0 | | | | 40.0 | | | | 3 | | | | 189.7 | |
| | | | | | | | | | | | | | | | | | | | | | | | | |
| Rating 13 | | | 231 | | | | | | | | 22.0 | | | | 31.0 | | | | 450 | | | | 194.6 | |
| | | | | | | | | | | | | | | | | | | | | | | | | |
| Total 31.12.12 (Basel 2.5) | | | 48,430 | | | | 12,057 | | | | 0.3 | | | | 28.7 | | | | 8,573 | | | | 17.7 | |
| | | | | | | | | | | | | | | | | | | | | | | | | |
1 Impaired and defaulted assets are excluded from this table (RWA in December 2012, CHF 81 million). Refer to the “Risk management and control” section of this report for impaired and defaulted figures. 2 Average PD for the internal rating categories are based on median values.
577
Financial information
Supplemental disclosures required under Basel III Pillar 3 regulations
Table 9d: Residential mortgages – Advanced IRB approach: Regulatory net credit exposure, weighted average PD, LGD and RWA by internal UBS ratings
| | | | | | | | | | | | | | | | | | | | | | | | |
| | | 31.12.13 | |
| CHF million, except where indicated1 | | Regulatory net
credit exposure | | | of which: loan
commitments | | | Average
PD in %2 | | | Average
LGD in % | | | RWA | | | Average risk
weight in % | |
| Investment grade | | | | | | | | | | | | | | | | | | | | | | | | |
| | | | | | | | | | | | | | | | | | | | | | | | | |
| Rating 0 | | | | | | | | | | | | | | | | | | | | | | | | |
| | | | | | | | | | | | | | | | | | | | | | | | | |
| Rating 1 | | | 22,895 | | | | 107 | | | | 0.0 | | | | 9.8 | | | | 293 | | | | 1.3 | |
| | | | | | | | | | | | | | | | | | | | | | | | | |
| Rating 2 | | | 9,825 | | | | 17 | | | | 0.0 | | | | 9.7 | | | | 144 | | | | 1.5 | |
| | | | | | | | | | | | | | | | | | | | | | | | | |
| Rating 3 | | | 16,970 | | | | 43 | | | | 0.1 | | | | 10.3 | | | | 481 | | | | 2.8 | |
| | | | | | | | | | | | | | | | | | | | | | | | | |
| Rating 4 | | | 17,212 | | | | 48 | | | | 0.2 | | | | 10.6 | | | | 905 | | | | 5.3 | |
| | | | | | | | | | | | | | | | | | | | | | | | | |
| Rating 5 | | | 17,126 | | | | 73 | | | | 0.4 | | | | 11.5 | | | | 1,625 | | | | 9.5 | |
| | | | | | | | | | | | | | | | | | | | | | | | | |
| Sub-Investment grade | | | | | | | | | | | | | | | | | | | | | | | | |
| | | | | | | | | | | | | | | | | | | | | | | | | |
| Rating 6 | | | 11,931 | | | | 57 | | | | 0.6 | | | | 11.8 | | | | 1,740 | | | | 14.6 | |
| | | | | | | | | | | | | | | | | | | | | | | | | |
| Rating 7 | | | 12,796 | | | | 281 | | | | 1.0 | | | | 11.5 | | | | 2,474 | | | | 19.3 | |
| | | | | | | | | | | | | | | | | | | | | | | | | |
| Rating 8 | | | 8,612 | | | | 117 | | | | 1.7 | | | | 10.9 | | | | 2,157 | | | | 25.0 | |
| | | | | | | | | | | | | | | | | | | | | | | | | |
| Rating 9 | | | 5,577 | | | | 24 | | | | 2.7 | | | | 10.4 | | | | 1,806 | | | | 32.4 | |
| | | | | | | | | | | | | | | | | | | | | | | | | |
| Rating 10 | | | 3,160 | | | | 21 | | | | 4.6 | | | | 10.2 | | | | 1,358 | | | | 43.0 | |
| | | | | | | | | | | | | | | | | | | | | | | | | |
| Rating 11 | | | 1,370 | | | | 16 | | | | 7.8 | | | | 10.1 | | | | 756 | | | | 55.2 | |
| | | | | | | | | | | | | | | | | | | | | | | | | |
| Rating 12 | | | 475 | | | | 7 | | | | 13.0 | | | | 10.2 | | | | 320 | | | | 67.3 | |
| | | | | | | | | | | | | | | | | | | | | | | | | |
| Rating 13 | | | 156 | | | | 5 | | | | 22.0 | | | | 10.5 | | | | 122 | | | | 77.7 | |
| | | | | | | | | | | | | | | | | | | | | | | | | |
| Total 31.12.13 | | | 128,104 | | | | 816 | | | | 0.8 | | | | 10.7 | | | | 14,180 | | | | 11.1 | |
| | | | | | | | | | | | | | | | | | | | | | | | | |
1 Impaired and defaulted assets are excluded from this table (RWA in December 2013, CHF 487 million). Refer to the “Risk management and control” section of this report for impaired and defaulted figures. 2 Average PD for the internal rating categories are based on median values.
| | | | | | | | | | | | | | | | | | | | | | | | |
| | | 31.12.12 | |
| CHF million, except where indicated1 | | Regulatory net
credit exposure | | | of which: loan
commitments | | | Average
PD in %2 | | | Average
LGD in % | | | RWA | | | Average risk
weight in % | |
| Investment grade | | | | | | | | | | | | | | | | | | | | | | | | |
| | | | | | | | | | | | | | | | | | | | | | | | | |
| Rating 0 | | | | | | | | | | | | | | | | | | | | | | | | |
| | | | | | | | | | | | | | | | | | | | | | | | | |
| Rating 1 | | | | | | | | | | | | | | | | | | | | | | | | |
| | | | | | | | | | | | | | | | | | | | | | | | | |
| Rating 2 | | | 173 | | | | 0 | | | | 0.0 | | | | 23.0 | | | | 4 | | | | 2.3 | |
| | | | | | | | | | | | | | | | | | | | | | | | | |
| Rating 3 | | | 1,828 | | | | 6 | | | | 0.1 | | | | 23.0 | | | | 69 | | | | 3.8 | |
| | | | | | | | | | | | | | | | | | | | | | | | | |
| Rating 4 | | | 12,702 | | | | 12 | | | | 0.2 | | | | 14.9 | | | | 809 | | | | 6.4 | |
| | | | | | | | | | | | | | | | | | | | | | | | | |
| Rating 5 | | | 83,034 | | | | 60 | | | | 0.4 | | | | 13.2 | | | | 6,589 | | | | 7.9 | |
| | | | | | | | | | | | | | | | | | | | | | | | | |
| Sub-Investment grade | | | | | | | | | | | | | | | | | | | | | | | | |
| | | | | | | | | | | | | | | | | | | | | | | | | |
| Rating 6 | | | 14,285 | | | | 82 | | | | 0.6 | | | | 16.0 | | | | 2,024 | | | | 14.2 | |
| | | | | | | | | | | | | | | | | | | | | | | | | |
| Rating 7 | | | 6,125 | | | | 68 | | | | 1.0 | | | | 19.8 | | | | 1,361 | | | | 22.2 | |
| | | | | | | | | | | | | | | | | | | | | | | | | |
| Rating 8 | | | 3,253 | | | | 5 | | | | 1.7 | | | | 19.3 | | | | 943 | | | | 29.0 | |
| | | | | | | | | | | | | | | | | | | | | | | | | |
| Rating 9 | | | 1,355 | | | | 34 | | | | 2.7 | | | | 17.5 | | | | 496 | | | | 36.6 | |
| | | | | | | | | | | | | | | | | | | | | | | | | |
| Rating 10 | | | 543 | | | | 1 | | | | 4.6 | | | | 14.2 | | | | 250 | | | | 46.0 | |
| | | | | | | | | | | | | | | | | | | | | | | | | |
| Rating 11 | | | 596 | | | | 1 | | | | 7.8 | | | | 12.7 | | | | 330 | | | | 55.5 | |
| | | | | | | | | | | | | | | | | | | | | | | | | |
| Rating 12 | | | 323 | | | | 2 | | | | 13.0 | | | | 12.7 | | | | 222 | | | | 68.7 | |
| | | | | | | | | | | | | | | | | | | | | | | | | |
| Rating 13 | | | 394 | | | | 0 | | | | 22.0 | | | | 12.9 | | | | 323 | | | | 81.9 | |
| | | | | | | | | | | | | | | | | | | | | | | | | |
| Total 31.12.12 (Basel 2.5) | | | 124,611 | | | | 271 | | | | 0.6 | | | | 14.4 | | | | 13,421 | | | | 10.8 | |
| | | | | | | | | | | | | | | | | | | | | | | | | |
1 Impaired and defaulted assets are excluded from this table (RWA in December 2012, CHF 466 million). Refer to the “Risk management and control” section of this report for impaired and defaulted figures. 2 Average PD for the internal rating categories are based on median values.
578
Table 9e: Lombard – Advanced IRB approach: Regulatory net credit exposure, weighted average PD, LGD and RWA by internal UBS ratings
| | | | | | | | | | | | | | | | | | | | | | | | |
| | | 31.12.13 | |
| CHF million, except where indicated1 | | Regulatory net
credit exposure | | | of which: loan
commitments | | | Average
PD in %2 | | | Average
LGD in % | | | RWA | | | Average risk
weight in % | |
| Investment grade | | | | | | | | | | | | | | | | | | | | | | | | |
| | | | | | | | | | | | | | | | | | | | | | | | | |
| Rating 0 | | | | | | | | | | | | | | | | | | | | | | | | |
| | | | | | | | | | | | | | | | | | | | | | | | | |
| Rating 1 | | | | | | | | | | | | | | | | | | | | | | | | |
| | | | | | | | | | | | | | | | | | | | | | | | | |
| Rating 2 | | | 47,034 | | | | 259 | | | | 0.0 | | | | 20.0 | | | | 1,236 | | | | 2.6 | |
| | | | | | | | | | | | | | | | | | | | | | | | | |
| Rating 3 | | | 26,482 | | | | 19 | | | | 0.1 | | | | 20.0 | | | | 1,182 | | | | 4.5 | |
| | | | | | | | | | | | | | | | | | | | | | | | | |
| Rating 4 | | | 2,598 | | | | 16 | | | | 0.2 | | | | 20.0 | | | | 200 | | | | 7.7 | |
| | | | | | | | | | | | | | | | | | | | | | | | | |
| Rating 5 | | | 6,646 | | | | 25 | | | | 0.4 | | | | 20.0 | | | | 821 | | | | 12.3 | |
| | | | | | | | | | | | | | | | | | | | | | | | | |
| Sub-Investment grade | | | | | | | | | | | | | | | | | | | | | | | | |
| | | | | | | | | | | | | | | | | | | | | | | | | |
| Rating 6 | | | 2,241 | | | | 3 | | | | 0.6 | | | | 20.0 | | | | 387 | | | | 17.3 | |
| | | | | | | | | | | | | | | | | | | | | | | | | |
| Rating 7 | | | 890 | | | | 1 | | | | 1.0 | | | | 20.0 | | | | 192 | | | | 21.6 | |
| | | | | | | | | | | | | | | | | | | | | | | | | |
| Rating 8 | | | 431 | | | | 25 | | | | 1.7 | | | | 20.0 | | | | 111 | | | | 25.9 | |
| | | | | | | | | | | | | | | | | | | | | | | | | |
| Rating 9 | | | 36 | | | | 0 | | | | 2.7 | | | | 20.0 | | | | 11 | | | | 29.1 | |
| | | | | | | | | | | | | | | | | | | | | | | | | |
| Rating 10 | | | 649 | | | | 3 | | | | 4.6 | | | | 20.0 | | | | 201 | | | | 31.0 | |
| | | | | | | | | | | | | | | | | | | | | | | | | |
| Rating 11 | | | 286 | | | | | | | | 7.8 | | | | 20.0 | | | | 95 | | | | 33.3 | |
| | | | | | | | | | | | | | | | | | | | | | | | | |
| Rating 12 | | | | | | | | | | | | | | | | | | | | | | | | |
| | | | | | | | | | | | | | | | | | | | | | | | | |
| Rating 13 | | | | | | | | | | | | | | | | | | | | | | | | |
| | | | | | | | | | | | | | | | | | | | | | | | | |
| Total 31.12.13 | | | 87,293 | | | | 351 | | | | 0.2 | | | | 20.0 | | | | 4,436 | | | | 5.1 | |
| | | | | | | | | | | | | | | | | | | | | | | | | |
1 Impaired and defaulted assets are excluded from this table (RWA in December 2013, CHF 0.5 million). Refer to the “Risk management and control” section of this report for impaired and defaulted figures. 2 Average PD for the internal rating categories are based on median values.
| | | | | | | | | | | | | | | | | | | | | | | | |
| | | 31.12.12 | |
| CHF million, except where indicated1 | | Regulatory net
credit exposure | | | of which: loan
commitments | | | Average
PD in %2 | | | Average
LGD in % | | | RWA | | | Average risk
weight in % | |
| Investment grade | | | | | | | | | | | | | | | | | | | | | | | | |
| | | | | | | | | | | | | | | | | | | | | | | | | |
| Rating 0 | | | | | | | | | | | | | | | | | | | | | | | | |
| | | | | | | | | | | | | | | | | | | | | | | | | |
| Rating 1 | | | | | | | | | | | | | | | | | | | | | | | | |
| | | | | | | | | | | | | | | | | | | | | | | | | |
| Rating 2 | | | 45,445 | | | | 210 | | | | 0.0 | | | | 20.0 | | | | 1,195 | | | | 2.6 | |
| | | | | | | | | | | | | | | | | | | | | | | | | |
| Rating 3 | | | 25,423 | | | | 13 | | | | 0.1 | | | | 20.0 | | | | 1,134 | | | | 4.5 | |
| | | | | | | | | | | | | | | | | | | | | | | | | |
| Rating 4 | | | 2,772 | | | | 25 | | | | 0.2 | | | | 20.0 | | | | 213 | | | | 7.7 | |
| | | | | | | | | | | | | | | | | | | | | | | | | |
| Rating 5 | | | 3,945 | | | | 14 | | | | 0.4 | | | | 20.0 | | | | 487 | | | | 12.3 | |
| | | | | | | | | | | | | | | | | | | | | | | | | |
| Sub-Investment grade | | | | | | | | | | | | | | | | | | | | | | | | |
| | | | | | | | | | | | | | | | | | | | | | | | | |
| Rating 6 | | | 2,170 | | | | 5 | | | | 0.6 | | | | 20.0 | | | | 375 | | | | 17.3 | |
| | | | | | | | | | | | | | | | | | | | | | | | | |
| Rating 7 | | | 668 | | | | 0 | | | | 1.0 | | | | 20.0 | | | | 144 | | | | 21.6 | |
| | | | | | | | | | | | | | | | | | | | | | | | | |
| Rating 8 | | | 544 | | | | 21 | | | | 1.7 | | | | 20.0 | | | | 141 | | | | 25.9 | |
| | | | | | | | | | | | | | | | | | | | | | | | | |
| Rating 9 | | | 212 | | | | 0 | | | | 2.7 | | | | 20.0 | | | | 62 | | | | 29.1 | |
| | | | | | | | | | | | | | | | | | | | | | | | | |
| Rating 10 | | | 590 | | | | 11 | | | | 4.6 | | | | 20.0 | | | | 183 | | | | 31.0 | |
| | | | | | | | | | | | | | | | | | | | | | | | | |
| Rating 11 | | | 487 | | | | 2 | | | | 7.8 | | | | 20.0 | | | | 162 | | | | 33.3 | |
| | | | | | | | | | | | | | | | | | | | | | | | | |
| Rating 12 | | | | | | | | | | | | | | | | | | | | | | | | |
| | | | | | | | | | | | | | | | | | | | | | | | | |
| Rating 13 | | | | | | | | | | | | | | | | | | | | | | | | |
| | | | | | | | | | | | | | | | | | | | | | | | | |
| Total 31.12.12 (Basel 2.5) | | | 82,257 | | | | 300 | | | | 0.2 | | | | 20.0 | | | | 4,096 | | | | 5.0 | |
| | | | | | | | | | | | | | | | | | | | | | | | | |
1 Impaired and defaulted assets are excluded from this table (RWA in December 2012, CHF 15 million). Refer to the “Risk management and control” section of this report for impaired and defaulted figures. 2 Average PD for the internal rating categories are based on median values.
579
Financial information
Supplemental disclosures required under Basel III Pillar 3 regulations
Table 9f: Other Retail – Advanced IRB approach: Regulatory net credit exposure, weighted average PD, LGD and RWA by internal UBS ratings
| | | | | | | | | | | | | | | | | | | | | | | | |
| | | 31.12.13 | |
| CHF million, except where indicated1 | | Regulatory net
credit exposure | | | of which: loan
commitments | | | Average
PD in %2 | | | Average
LGD in % | | | RWA | | | Average risk
weight in % | |
| Investment grade | | | | | | | | | | | | | | | | | | | | | | | | |
| | | | | | | | | | | | | | | | | | | | | | | | | |
| Rating 0 | | | | | | | | | | | | | | | | | | | | | | | | |
| | | | | | | | | | | | | | | | | | | | | | | | | |
| Rating 1 | | | 14 | | | | | | | | 0.0 | | | | 6.5 | | | | 0 | | | | 0.7 | |
| | | | | | | | | | | | | | | | | | | | | | | | | |
| Rating 2 | | | 126 | | | | | | | | 0.0 | | | | 19.6 | | | | 3 | | | | 2.7 | |
| | | | | | | | | | | | | | | | | | | | | | | | | |
| Rating 3 | | | 10 | | | | | | | | 0.1 | | | | 12.3 | | | | 0 | | | | 2.8 | |
| | | | | | | | | | | | | | | | | | | | | | | | | |
| Rating 4 | | | 8 | | | | | | | | 0.2 | | | | 11.0 | | | | 0 | | | | 4.9 | |
| | | | | | | | | | | | | | | | | | | | | | | | | |
| Rating 5 | | | 10 | | | | | | | | 0.4 | | | | 8.5 | | | | 1 | | | | 5.5 | |
| | | | | | | | | | | | | | | | | | | | | | | | | |
| Sub-Investment grade | | | | | | | | | | | | | | | | | | | | | | | | |
| | | | | | | | | | | | | | | | | | | | | | | | | |
| Rating 6 | | | 6 | | | | 0 | | | | 0.6 | | | | 10.7 | | | | 1 | | | | 9.6 | |
| | | | | | | | | | | | | | | | | | | | | | | | | |
| Rating 7 | | | 135 | | | | | | | | 1.0 | | | | 26.3 | | | | 45 | | | | 33.6 | |
| | | | | | | | | | | | | | | | | | | | | | | | | |
| Rating 8 | | | 2 | | | | | | | | 1.7 | | | | 6.2 | | | | 0 | | | | 8.1 | |
| | | | | | | | | | | | | | | | | | | | | | | | | |
| Rating 9 | | | 1,644 | | | | 2 | | | | 2.7 | | | | 43.6 | | | | 688 | | | | 41.9 | |
| | | | | | | | | | | | | | | | | | | | | | | | | |
| Rating 10 | | | 10 | | | | | | | | 4.6 | | | | 21.7 | | | | 3 | | | | 34.0 | |
| | | | | | | | | | | | | | | | | | | | | | | | | |
| Rating 11 | | | 1 | | | | | | | | 7.8 | | | | 7.3 | | | | 0 | | | | 12.3 | |
| | | | | | | | | | | | | | | | | | | | | | | | | |
| Rating 12 | | | | | | | | | | | | | | | | | | | | | | | | |
| | | | | | | | | | | | | | | | | | | | | | | | | |
| Rating 13 | | | | | | | | | | | | | | | | | | | | | | | | |
| | | | | | | | | | | | | | | | | | | | | | | | | |
| Total 31.12.13 | | | 1,966 | | | | 2 | | | | 2.4 | | | | 39.8 | | | | 742 | | | | 37.8 | |
| | | | | | | | | | | | | | | | | | | | | | | | | |
1 Impaired and defaulted assets are excluded from this table (RWA in December 2013, CHF 9 million). Refer to the “Risk management and control” section of this report for impaired and defaulted figures. 2 Average PD for the internal rating categories are based on median values.
| | | | | | | | | | | | | | | | | | | | | | | | |
| | | 31.12.12 | |
| CHF million, except where indicated1 | | Regulatory net
credit exposure | | | of which: loan
commitments | | | Average
PD in %2 | | | Average
LGD in % | | | RWA | | | Average risk
weight in % | |
| Investment grade | | | | | | | | | | | | | | | | | | | | | | | | |
| | | | | | | | | | | | | | | | | | | | | | | | | |
| Rating 0 | | | | | | | | | | | | | | | | | | | | | | | | |
| | | | | | | | | | | | | | | | | | | | | | | | | |
| Rating 1 | | | | | | | | | | | | | | | | | | | | | | | | |
| | | | | | | | | | | | | | | | | | | | | | | | | |
| Rating 2 | | | 127 | | | | | | | | 0.0 | | | | 20.0 | | | | 4 | | | | 2.8 | |
| | | | | | | | | | | | | | | | | | | | | | | | | |
| Rating 3 | | | 1 | | | | | | | | 0.1 | | | | 20.0 | | | | 0 | | | | 4.7 | |
| | | | | | | | | | | | | | | | | | | | | | | | | |
| Rating 4 | | | 19 | | | | | | | | 0.2 | | | | 8.6 | | | | 1 | | | | 3.6 | |
| | | | | | | | | | | | | | | | | | | | | | | | | |
| Rating 5 | | | 61 | | | | | | | | 0.4 | | | | 7.1 | | | | 3 | | | | 4.3 | |
| | | | | | | | | | | | | | | | | | | | | | | | | |
| Sub-Investment grade | | | | | | | | | | | | | | | | | | | | | | | | |
| | | | | | | | | | | | | | | | | | | | | | | | | |
| Rating 6 | | | 102 | | | | | | | | 0.6 | | | | 29.6 | | | | 27 | | | | 26.9 | |
| | | | | | | | | | | | | | | | | | | | | | | | | |
| Rating 7 | | | 32 | | | | | | | | 1.0 | | | | 30.4 | | | | 21 | | | | 64.1 | |
| | | | | | | | | | | | | | | | | | | | | | | | | |
| Rating 8 | | | 357 | | | | 2 | | | | 1.7 | | | | 42.8 | | | | 200 | | | | 55.9 | |
| | | | | | | | | | | | | | | | | | | | | | | | | |
| Rating 9 | | | 1,337 | | | | | | | | 2.7 | | | | 42.0 | | | | 469 | | | | 35.2 | |
| | | | | | | | | | | | | | | | | | | | | | | | | |
| Rating 10 | | | 11 | | | | | | | | 4.6 | | | | 26.6 | | | | 5 | | | | 42.9 | |
| | | | | | | | | | | | | | | | | | | | | | | | | |
| Rating 11 | | | 4 | | | | | | | | 7.8 | | | | 16.7 | | | | 1 | | | | 25.1 | |
| | | | | | | | | | | | | | | | | | | | | | | | | |
| Rating 12 | | | | | | | | | | | | | | | | | | | | | | | | |
| | | | | | | | | | | | | | | | | | | | | | | | | |
| Rating 13 | | | 0 | | | | | | | | 22.0 | | | | 9.8 | | | | 0 | | | | 26.0 | |
| | | | | | | | | | | | | | | | | | | | | | | | | |
| Total 31.12.12 (Basel 2.5) | | | 2,051 | | | | 2 | | | | 2.2 | | | | 38.5 | | | | 730 | | | | 35.6 | |
| | | | | | | | | | | | | | | | | | | | | | | | | |
1 Impaired and defaulted assets are excluded from this table (RWA in December 2012, CHF 10 million). Refer to the “Risk management and control” section of this report for impaired and defaulted figures. 2 Average PD for the internal rating categories are based on median values.
580
Standardized approach
The standardized approach is generally applied where it is not possible to use the advanced internal ratings-based approach and/or where an exemption from the advanced internal ratings-based approach has been granted by FINMA. The standardized approach requires banks to use risk assessments prepared by external credit assessment institutions (ECAI) or export credit
agencies to determine the risk weightings applied to rated counterparties. We use FINMA-recognized ECAI risk assessments to determine the risk weightings for certain counterparties according to the BIS-defined exposure segments
We use three FINMA-recognized ECAI for this purpose: Standard & Poor’s Ratings Group, Moody’s Investors Service and Fitch Ratings. The mapping of external ratings to the standardized approach risk weights is determined by FINMA and published on its website.
Table 10: Regulatory gross and net credit exposure by risk weight under the standardized approach
This table provides a breakdown of the regulatory gross and net credit exposure by risk weight according to BIS-defined exposure segments for those credit exposures for which we apply the standardized approach.
| | | | | | | | | | | | | | | | | | | | | | | | | | | | |
CHF million | | Total exposure | | | Total exposure | |
| Risk weight | | 0% | | | > 0–35% | | | 36–75% | | | 76–100% | | | 150% | | | 31.12.13 | | | 31.12.12
(Basel 2.5) | |
| | | | | | | |
| Regulatory gross credit exposure | | | | | | | | | | | | | | | | | | | | | | | | | | | | |
| | | | | | | | | | | | | | | | | | | | | | | | | | | | | |
| Corporates | | | | | | | 5,982 | | | | 1,080 | | | | 17,773 | | | | 132 | | | | 24,967 | | | | 25,730 | |
| | | | | | | | | | | | | | | | | | | | | | | | | | | | | |
| Sovereigns | | | 114,132 | | | | 0 | | | | 240 | | | | 147 | | | | 0 | | | | 114,518 | | | | 104,354 | |
| | | | | | | | | | | | | | | | | | | | | | | | | | | | | |
| Banks | | | | | | | 3,332 | | | | 2,609 | | | | 10 | | | | | | | | 5,950 | | | | 6,078 | |
| | | | | | | | | | | | | | | | | | | | | | | | | | | | | |
| Central Counterparties | | | | | | | 18,101 | | | | | | | | 6 | | | | 0 | | | | 18,107 | | | | | |
| | | | | | | | | | | | | | | | | | | | | | | | | | | | | |
| Retail | | | | | | | | | | | | | | | | | | | | | | | | | | | | |
| | | | | | | | | | | | | | | | | | | | | | | | | | | | | |
Residential mortgages | | | | | | | 4,522 | | | | 110 | | | | 358 | | | | | | | | 4,989 | | | | 4,606 | |
| | | | | | | | | | | | | | | | | | | | | | | | | | | | | |
Lombard lending | | | | | | | | | | | | | | | | | | | | | | | | | | | | |
| | | | | | | | | | | | | | | | | | | | | | | | | | | | | |
Other retail | | | | | | | | | | | 2,220 | | | | 4 | | | | | | | | 2,224 | | | | 2,337 | |
| | | | | | | | | | | | | | | | | | | | | | | | | | | | | |
| Total 31.12.13 | | | 114,132 | | | | 31,936 | | | | 6,258 | | | | 18,297 | | | | 132 | | | | 170,754 | | | | | |
| | | | | | | | | | | | | | | | | | | | | | | | | | | | | |
| Total 31.12.12 (Basel 2.5) | | | 104,104 | | | | 12,558 | | | | 6,601 | | | | 19,576 | | | | 265 | | | | | | | | 143,104 | |
| | | | | | | | | | | | | | | | | | | | | | | | | | | | | |
| | | | | | | |
| Regulatory net credit exposure | | | | | | | | | | | | | | | | | | | | | | | | | | | | |
| | | | | | | | | | | | | | | | | | | | | | | | | | | | | |
| Corporates | | | | | | | 5,982 | | | | 1,071 | | | | 11,676 | | | | 118 | | | | 18,848 | | | | 21,604 | |
| | | | | | | | | | | | | | | | | | | | | | | | | | | | | |
| Sovereigns | | | 114,132 | | | | 0 | | | | 240 | | | | 147 | | | | 0 | | | | 114,518 | | | | 104,354 | |
| | | | | | | | | | | | | | | | | | | | | | | | | | | | | |
| Banks | | | | | | | 3,331 | | | | 2,609 | | | | 10 | | | | | | | | 5,950 | | | | 6,073 | |
| | | | | | | | | | | | | | | | | | | | | | | | | | | | | |
| Central Counterparties | | | | | | | 18,100 | | | | | | | | 6 | | | | 0 | | | | 18,106 | | | | | |
| | | | | | | | | | | | | | | | | | | | | | | | | | | | | |
| Retail | | | | | | | | | | | | | | | | | | | | | | | | | | | | |
| | | | | | | | | | | | | | | | | | | | | | | | | | | | | |
Residential mortgages | | | | | | | 4,522 | | | | 110 | | | | 15 | | | | | | | | 4,646 | | | | 3,625 | |
| | | | | | | | | | | | | | | | | | | | | | | | | | | | | |
Lombard lending | | | | | | | | | | | | | | | | | | | | | | | | | | | | |
| | | | | | | | | | | | | | | | | | | | | | | | | | | | | |
Other retail | | | | | | | | | | | 2,218 | | | | 4 | | | | | | | | 2,222 | | | | 2,336 | |
| | | | | | | | | | | | | | | | | | | | | | | | | | | | | |
| Total 31.12.13 | | | 114,132 | | | | 31,935 | | | | 6,248 | | | | 11,857 | | | | 118 | | | | 164,290 | | | | | |
| | | | | | | | | | | | | | | | | | | | | | | | | | | | | |
| Total 31.12.12 (Basel 2.5) | | | 104,104 | | | | 12,540 | | | | 6,601 | | | | 14,498 | | | | 249 | | | | | | | | 137,992 | |
| | | | | | | | | | | | | | | | | | | | | | | | | | | | | |
581
Financial information
Supplemental disclosures required under Basel III Pillar 3 regulations
Table 11: Eligible financial collateral recognized under the standardized approach
This table provides a breakdown of the financial collateral eligible for recognition in the regulatory capital calculation under the standardized approach, according to BIS-defined exposure segments.
| | | | | | | | | | | | | | | | |
CHF million | | Regulatory net credit exposure
under standardized approach | | | Eligible financial collateral recognized
in capital calculation1 | |
| | | 31.12.13 | | | 31.12.12 (Basel 2.5) | | | 31.12.13 | | | 31.12.12 (Basel 2.5) | |
| Exposure segment | | | | | | | | | | | | | | | | |
| | | | | | | | | | | | | | | | | |
| Corporates | | | 18,848 | | | | 21,604 | | | | 7,668 | | | | 6,821 | |
| | | | | | | | | | | | | | | | | |
| Sovereigns | | | 114,518 | | | | 104,354 | | | | 25 | | | | 37 | |
| | | | | | | | | | | | | | | | | |
| Banks | | | 5,950 | | | | 6,073 | | | | 500 | | | | 1,436 | |
| | | | | | | | | | | | | | | | | |
| Central Counterparties | | | 18,106 | | | | | | | | 887 | | | | | |
| | | | | | | | | | | | | | | | | |
| Retail | | | | | | | | | | | | | | | | |
| | | | | | | | | | | | | | | | | |
Residential mortgages | | | 4,646 | | | | 3,625 | | | | 343 | | | | 981 | |
| | | | | | | | | | | | | | | | | |
Lombard lending | | | | | | | | | | | | | | | | |
| | | | | | | | | | | | | | | | | |
Other retail | | | 2,222 | | | | 2,336 | | | | 22 | | | | 0 | |
| | | | | | | | | | | | | | | | | |
| Total | | | 164,290 | | | | 137,992 | | | | 9,444 | | | | 9,275 | |
| | | | | | | | | | | | | | | | | |
1 Reflects the impact of the application of regulatory haircuts for exposures not covered under an internal exposure model. The eligible financial collateral recognized in the capital calculation is based on the difference between the IFRS reported values and the regulatory net credit exposure. In 2013, the eligible financial collateral recognized under standardized approach for exposures covered under internal exposure models was restated as of 31 December 2012 from CHF 8,643 million to CHF 9,275 million.
Impairment, default and credit loss
The “Risk management and control” section of this report provides more information on the impaired, default and credit loss related disclosures.
| | è | | Refer to “Note 12 Allowances and provisions for credit losses” in the “Financial information” section of this report for more information |
582
Derivatives credit risk
Table 12: Credit exposure of derivative instruments
This table provides an overview of our credit exposures arising from derivatives. Exposures are provided based on the balance sheet carrying values of derivatives as well as regulatory net credit exposures. The net balance sheet credit exposure differs from
the regulatory net credit exposures because of differences in valuation methods, netting and collateral deductions used for accounting and regulatory capital purposes. Net current credit exposure is derived from gross positive replacement values, whereas regulatory net credit exposure is calculated using our internal credit valuation models.
| | | | | | | | |
| CHF million | | 31.12.13 | | | 31.12.12
(Basel 2.5) | |
| Gross positive replacement values | | | 245,835 | | | | 418,029 | |
| | | | | | | | | |
| Netting benefits recognized | | | (184,994 | ) | | | (327,320 | ) |
| | | | | | | | | |
| Collateral held | | | (33,567 | ) | | | (55,890 | ) |
| | | | | | | | | |
| Net current credit exposure | | | 27,274 | | | | 34,818 | |
| | | | | | | | | |
| | |
| Regulatory net credit exposure (total counterparty credit risk) | | | 45,718 | | | | 53,576 | |
| | | | | | | | | |
of which: treated with internal models (effective expected positive exposure [EPE]) | | | 38,906 | | | | 44,135 | |
| | | | | | | | | |
of which: treated with supervisory approaches (current exposure method) | | | 6,812 | | | | 9,441 | |
| | | | | | | | | |
| | |
| Breakdown of the collateral held | | | | | | | | |
| | | | | | | | | |
| Cash collateral | | | 27,900 | | | | 49,382 | |
| | | | | | | | | |
| Securities collateral and debt instruments collateral (excluding equity) | | | 5,490 | | | | 6,236 | |
| | | | | | | | | |
| Equity instruments collateral | | | 50 | | | | 101 | |
| | | | | | | | | |
| Other collateral | | | 127 | | | | 171 | |
| | | | | | | | | |
| Total collateral held | | | 33,567 | | | | 55,890 | |
| | | | | | | | | |
583
Financial information
Supplemental disclosures required under Basel III Pillar 3 regulations
Other credit risk information
Our credit derivatives trading is predominantly on a collateralized basis. This means that our mark-to-market exposures arising from derivatives activities with collateralized counterparties are typically closed out in full or reduced to nominal levels on a regular basis by the use of collateral.
Derivatives trading with counterparties with high credit ratings, for example a large bank or broker-dealer, is typically conducted under an International Swaps and Derivatives Association (ISDA) master netting agreement. Credit exposures to those counterparties from credit default swaps (CDS), together with exposures from other over-the-counter (OTC) derivatives, are netted and included in the calculation of the collateral that is required to
be posted. Trading with lower-rated counterparties such as hedge funds would generally require an initial margin to be posted by the counterparty.
We receive collateral from or post collateral to our counterparties based on our open net receivable or net payable from OTC derivative activities. Under the terms of the ISDA master netting agreement and similar agreements, this collateral, which generally takes the form of cash or highly liquid debt securities, is available to cover any amounts due under those derivative transactions.
The CDS settlement risk, including payment risk of CDS, has been mitigated to some extent by the development of a market-wide credit event auction process, which results in a wider use of cash settlement of CDS. We did not have any significant losses from failed settlements of CDS contracts in 2013.
Table 13: Credit derivatives1, 2
This table provides an overview of the notional amount of credit derivatives, including those used to manage risks within our banking and trading books.
| | | | | | | | | | | | | | | | | | | | | | | | | | | | | | | | |
| | Regulatory banking book | | | Regulatory trading book | | | Total | |
| Notional amounts, CHF million | | Protection
bought | | | Protection
sold | | | Total | | | Protection
bought | | | Protection
sold | | | Total | | | 31.12.13 | | | 31.12.12
(Basel 2.5) | |
| Credit default swaps | | | 22,525 | | | | 3,307 | | | | 25,832 | | | | 520,382 | | | | 522,446 | | | | 1,042,828 | | | | 1,068,660 | | | | 2,135,451 | |
| | | | | | | | | | | | | | | | | | | | | | | | | | | | | | | | | |
| Total rate of return swaps | | | 151 | | | | | | | | 151 | | | | 5,222 | | | | 809 | | | | 6,031 | | | | 6,182 | | | | 5,736 | |
| | | | | | | | | | | | | | | | | | | | | | | | | | | | | | | | | |
| Options and warrants | | | | | | | | | | | | | | | 3,597 | | | | 61 | | | | 3,658 | | | | 3,658 | | | | 3,559 | |
| | | | | | | | | | | | | | | | | | | | | | | | | | | | | | | | | |
| Total 31.12.133 | | | 22,676 | | | | 3,307 | | | | 25,983 | | | | 529,200 | | | | 523,317 | | | | 1,052,517 | | | | 1,078,500 | | | | | |
| | | | | | | | | | | | | | | | | | | | | | | | | | | | | | | | | |
| Total 31.12.12 (Basel 2.5) | | | 13,711 | | | | 119 | | | | 13,831 | | | | 1,070,580 | | | | 1,060,336 | | | | 2,130,916 | | | | | | | | 2,144,747 | |
| | | | | | | | | | | | | | | | | | | | | | | | | | | | | | | | | |
1 Notional amounts of credit derivatives are based on accounting definitions and do not include any netting benefits. For capital underpinning of the counterparty credit risk of derivative positions, the effective expected positive exposure (or exposure according to current exposure method) is taken. 2 Notional amounts are reported based on regulatory scope of consolidation and only include amounts related to PRV and NRV. 3 The year-end 2013 numbers are based on a revised methodology for presenting credit derivatives in the trading book versus the banking book. Prior periods were not restated. The treatments of credit derivatives under Pillar 1 are unchanged.
584
Equity instruments in the banking book
The regulatory capital view for equity instruments in the banking book differs from the IFRS view primarily due to the following:
| – | Differences in the basis of valuation, for example financial investments available-for-sale are subject to fair value accounting under IFRS but have to be treated under the “lower of cost or market” or “cost less impairment” concept for regulatory capital purposes. |
| – | The use of different frameworks to determine regulatory capital. Positions held in trading book, for example, are treated under market risk value-at-risk (VaR). |
| – | Differences in the scope of consolidation. |
| | è | | Refer to “Scope of regulatory consolidation” in this section for more information |
Table 14: Equity instruments in the banking book
The table below shows the different equity instruments categories held in the banking book with their amounts as disclosed under IFRS, followed by the regulatory capital adjustment amount. This adjustment considers the abovementioned differences to IFRS resulting in the total regulatory equity instruments exposure under the BIS framework, the corresponding RWA and the capital charge.
The table also shows net realized gains and losses and unrealized revaluation gains relating to equity instruments.
| | | | | | | | |
| | Book value | |
| CHF million | | 31.12.13 | | | 31.12.12
(Basel 2.5) | |
| Equity instruments | | | | | | | | |
| | | | | | | | | |
| Financial investments available-for-sale | | | 649 | | | | 572 | |
| | | | | | | | | |
| Financial assets designated at fair value | | | | | | | 25 | |
| | | | | | | | | |
| Investments in associates | | | 842 | | | | 858 | |
| | | | | | | | | |
| Total equity instruments under IFRS | | | 1,491 | | | | 1,455 | |
| | | | | | | | | |
| Regulatory capital adjustment1 | | | 885 | | | | 1,223 | |
| | | | | | | | | |
| Total equity instruments under regulatory capital | | | 2,376 | | | | 2,678 | |
| | | | | | | | | |
of which: to be risk-weighted | | | | | | | | |
| | | | | | | | | |
publicly traded | | | 132 | | | | 184 | |
| | | | | | | | | |
privately held2,3 | | | 1,225 | | | | 1,198 | |
| | | | | | | | | |
not deducted in application of threshold, but risk-weighted at 250% | | | 674 | | | | N/A | |
| | | | | | | | | |
of which: deduction from common equity tier 1 capital4 | | | 344 | | | | 1,297 | |
| | | | | | | | | |
| RWA according to simple risk-weight method5 | | | 4,999 | | | | 2,972 | |
| | | | | | | | | |
| Capital requirement according to simple risk-weight method5 | | | 428 | | | | 238 | |
| | | | | | | | | |
| Total capital charge | | | 772 | | | | 1,535 | |
| | | | | | | | | |
| | |
| Net realized gains/(losses) and unrealized gains from equity instruments | | | | | | | | |
| | | | | | | | | |
| Net realized gains/(losses) from disposals | | | 122 | | | | 122 | |
| | | | | | | | | |
| Unrealized revaluation gains | | | 11 | | | | 41 | |
| | | | | | | | | |
of which: included in tier 2 capital | | | 5 | | | | 18 | |
| | | | | | | | | |
1 Includes CHF 805 million investment fund units treated under debt investment under IFRS and other adjustments mainly due to trading book positions not treated under VaR, differences in the scope of consolidation and in the basis of valuation. 2 Includes CHF 509 million exposure booked in trust entities that did not generate risk-weighted assets (CHF 584 million on 31 December 2012). 3 Includes equity investments in companies active in the banking and finance business where UBS owns less than 10% of the entity’s common equity. 4 Under Basel III, goodwill of investments in associates is deducted from common equity tier 1 capital. 5 The risk-weighted assets of CHF 5 billion and the capital requirements of CHF 0.4 billion, as of 31 December 2013, are also disclosed in the “Equity instruments in the banking book” line of “Table 2: Detailed segmentation of Basel III exposures and risk-weighted assets.”
585
Financial information
Supplemental disclosures required under Basel III Pillar 3 regulations
Market risk
The market risk related Pillar 3 disclosures that were shown previously in the Pillar 3 report are consolidated in the “Risk management and control” section of this report.
586
Securitization
This section provides details of traditional and synthetic securitization exposures in the banking and trading book based on the Basel III framework. Under this framework, low-rated and/or unrated securitization exposures are no longer deducted from eligible capital as used to be the case under Basel 2.5 but are instead risk-weighted with a 1,250% factor. Other securitized exposures continue to be risk-weighted, generally, based on their external ratings. This section also provides details of the regulatory capital requirement associated with these exposures.
In a traditional securitization, a pool of loans (or other debt obligations) is typically transferred to structured entities that have been established to own the loan pool and to issue tranched securities to third-party investors referencing this pool of loans. In a synthetic securitization, legal ownership of securitized pools of assets is typically retained, but associated credit risk is transferred to structured entities typically through guarantees, credit derivatives or credit-linked notes. Hybrid structures with a mix of traditional and synthetic features are disclosed as synthetic securitizations.
We act in different roles in securitization transactions. As originator, we create or purchase financial assets, which are then securitized in traditional or synthetic securitization transactions, enabling us to transfer significant risk to third-party investors. As sponsor, we manage, provide financing or advise securitization
programs. In line with the Basel framework, sponsoring includes underwriting, that is, placing securities in the market. In all other cases, we act in the role of investor by taking securitization positions.
Basel III RWA attributable to securitization positions increased to CHF 10.2 billion as of 31 December 2013 from CHF 7.1 billion as of 31 December 2012 based on our Basel 2.5 RWA for securitizations. As of 31 December 2013, RWA for securitizations in Non-core and Legacy Portfolio stood at CHF 9.5 billion. This increase in the RWA due to the revised regulatory treatment of the low-rated or unrated securitization exposures, which are risk-weighted at 1,250% under Basel III, was offset mainly by sales and redemptions of student loan auction rate securities and commercial mortgage-backed securities during 2013. The exposures shown under other business divisions are all in the Investment Bank except for some positions deemed immaterial (based on RWA) relating to Wealth Management Americas.
| | è | | Refer to “Note 30 Interests in subsidiaries and other entities” in the “Financial information” section of this report for more information on structured entities |
| | è | | Refer to the tables “Composition of Non-core” and “Composition of Legacy Portfolio” in the “Risk management and control” section of this report for more information |
Table 15:Securitization/re-securitization
| | | | | | | | | | | | | | | | |
| | | 31.12.13 | |
| | | |
Basel III (phase-in) | | Gross EAD | | | Net
EAD | | | RWA | | | Capital
requirement | |
| CHF million | | | | | | | | | | | | | | | | |
| Securitization/re-securitization in the banking book | | | 12,569 | | | | 11,928 | | | | 8,352 | | | | 715 | |
| | | | | | | | | | | | | | | | | |
CC–Non-core and Legacy Portfolio | | �� | 8,767 | | | | 8,125 | | | | 7,772 | | | | 666 | |
| | | | | | | | | | | | | | | | | |
Other business divisions | | | 3,803 | | | | 3,803 | | | | 580 | | | | 50 | |
| | | | | | | | | | | | | | | | | |
| Securitization/re-securitization in the trading book | | | 2,098 | | | | 1,966 | | | | 1,799 | | | | 154 | |
| | | | | | | | | | | | | | | | | |
CC–Non-core and Legacy Portfolio | | | 1,896 | | | | 1,799 | | | | 1,711 | | | | 147 | |
| | | | | | | | | | | | | | | | | |
Other business divisions | | | 202 | | | | 167 | | | | 89 | | | | 8 | |
| | | | | | | | | | | | | | | | | |
| |
| | | 31.12.12 | |
| | | |
Basel 2.5 | | Gross EAD | | | Net
EAD | | | RWA | | | Capital
requirement | |
| CHF million | | | | | | | | | | | | | | | | |
| Securitization/re-securitization in the banking book | | | 16,537 | | | | 14,995 | | | | 5,497 | | | | 440 | |
| | | | | | | | | | | | | | | | | |
| Securitization/re-securitization in the trading book | | | 7,646 | | | | 6,453 | | | | 1,639 | | | | 131 | |
| | | | | | | | | | | | | | | | | |
587
Financial information
Supplemental disclosures required under Basel III Pillar 3 regulations
Objectives, roles and involvement
Securitization in the banking book
Securitization positions held in the banking book include tranches of synthetic securitization of loan exposures and over-the-counter derivatives. These were primarily hedging transactions executed in 2013 and 2012 by synthetically transferring counterparty credit risk. In addition, securitization in the banking book includes legacy risk positions, some of which were (i) reclassified under IFRS fromHeld for trading toLoans and receivables in the fourth quarter of 2008 and the first quarter of 2009, or (ii) classified asLoans and receivables when acquiring student loan auction rate securities from clients. As of 31 December 2013, this portfolio included student loan auction rate securities, collateralized debt obligations and collateralized loan obligations, some of which have credit default swap protection purchased from monoline insurers, as well as commercial mortgage-backed securities, residential mortgage-backed securities and reference-linked note programs. In addition, credit-risk hedging transactions in 2013 and 2012 increased our position in synthetic securitizations of portfolios of counterparty credit risk in over-the-counter derivatives and loan exposures. These transactions are primarily used to reduce our credit risk by synthetically transferring counterparty risk.
In 2013, we acted in the roles of both originator and sponsor. As originator, we sold originated commercial mortgage loans into securitization programs. As sponsor, we managed or advised securitization programs and helped to place the securities in the market. Refer to “Table 16: Securitization activity of the year in the banking book” for an overview of our originating and sponsoring activities in 2013 and 2012, respectively.
Securitization and re-securitization positions in the banking book are measured either at fair value or at amortized cost less impairment. The impairment assessment for a securitized position is generally based on the net present value of future cash flows expected from the underlying pool of assets.
Securitization in the trading book
Securitizations (including correlation products) held in the trading book are part of the trading activities, which typically include market-making and client facilitation. During 2013 we were also involved in the placement of securitized assets originated by other institutions in the market, that is, we acted in the role of a sponsor. In one case, we provided warehouse financing to collateralized loan obligation managers but did not retain any positions
from this type of sponsored deal. “Table 17: Securitization activity of the year in the trading book” provides an overview of our originating and sponsoring activities in full year 2013 and 2012, respectively. Included in the trading book are positions in our correlation book and legacy positions in leveraged super senior tranches. In the trading book, securitization and re-securitization positions are measured at fair value reflecting market prices where available or are based on our internal pricing models.
Type of structured entities and affiliated entities involved in the securitization transactions
For the securitization of third-party exposures, the type of structured entities employed is selected as appropriate based on the type of transaction undertaken. Examples of this include limited liability corporations, common law trusts and depositor entities.
We manage or advise significant groups of affiliated entities that invest in exposures we have securitized or in structured entities that we sponsor. Significant groups of affiliated entities include North Street, Brooklands/ELM, and East Street, which are involved in the US, European and Asia Pacific reference-linked note programs, respectively.
| | è | | Refer to “Note 30 Interests in subsidiaries and other entities” in the “Financial information” section of this report for more information on structured entities |
| | è | | Refer to the tables “Composition of Non-core” and “Composition of Legacy Portfolio” in the “Risk management and control” section of this report for more information on RWA by exposure category |
Managing and monitoring of the credit and market risk of securitization positions
The banking book securitization portfolio is subject to specific risk monitoring, which may include interest rate and credit spread sensitivity analysis, as well as inclusion in firm-wide earnings-at-risk, capital-at-risk and combined stress test metrics.
The trading book securitization positions are also subject to multiple risk limits in our Investment Bank, such as management VaR and stress limits as well as market value limits. As part of managing risks within the pre-defined risk limits, traders may utilize hedging and risk mitigation strategies. Hedging may however expose the firm to basis risks as the hedging instrument and the position being hedged may not always move in parallel. Such basis risks are managed within the overall limits. Any retained securitization from origination activities and any purchased securitization
588
positions are governed by risk limits together with any other trading positions. Legacy trading book securitization exposure is subject to the same management VaR limit framework. Additionally, risk limits are used to control the unwind, novation and asset sales process on an ongoing basis.
Regulatory capital treatment of securitization structures
Generally, in both the banking and trading book we apply the ratings-based approach to securitization positions using ratings, if available, from Standard & Poor’s, Moody’s and Fitch for all securitization and re-securitization exposures. The selection of the External Credit Assessment Institutions (ECAI) is based on the primary rating agency concept. This concept is applied, in principle, to avoid that the credit assessment by one ECAI is applied for one or more tranches and another ECAI for the other tranches unless this is the result of the application of the specific rules for multiple assessments. If any two of the abovementioned rating agencies have issued a rating for a particular position, we would apply the lower credit rating of the two. If all three rating agencies have issued a rating for a particular position, we would apply the middle credit rating of the three. Under the ratings-based approach, the amount of capital required for securitization and re-securitization exposures in the banking book is capped at the level of the capital requirement that would have been assessed against the underlying assets had they not been securitized. This treatment has been applied in particular to the US and European reference-linked note programs. For the purposes of determining regulatory capital and the Pillar 3 disclosure for these positions, the underlying exposures are reported under the standardized approach, the advanced internal ratings-based approach or the securitization approach, depending on the category of the underlying security. If the underlying security is reported under the standardized approach or the advanced internal ratings-based approach, the related positions are excluded from the tables on the following pages.
The supervisory formula approach is applied to synthetic securitizations of portfolios of counterparty credit risk inherent in over-the-counter derivatives and loan exposures for which an external rating was not sought. The supervisory formula approach is also applied to leveraged super senior tranches.
In the trading book, the comprehensive risk measure is used for the correlation portfolio as defined by Basel III requirements. This measure broadly covers securitizations of liquid corporate underlying assets as well as associated hedges that are not necessarily
securitizations, for example, single-name credit default swaps and credit default swaps on indices.
We do not apply the concentration ratio approach or the internal assessment approach to securitization positions.
The counterparty risk of interest rate or foreign currency derivatives with securitization vehicles is treated under the advanced internal ratings-based approach and is therefore not part of this disclosure.
Accounting policies
Refer to “Note 1 Summary of significant accounting policies” in the “Financial information” section of this report for information on our accounting policies that relate to our securitization activities, primarily “Note 1a) 3) Subsidiaries and structured entities” and “Note 1a) 12) Securitization structures set up by UBS.”
We disclose our intention to securitize exposures as an originator if assets are designated for securitization and a tentative pricing date for a transaction is known as of the balance sheet date or if a pricing of a transaction has been fixed. Exposures intended to be securitized continue to be valued in the same way until such time as the securitization transaction takes place.
Presentation principles
It is our policy to present Pillar 3 disclosures for securitization transactions and balances in line with the capital adequacy treatments which were applied under Pillar 1 in the respective period presented.
We do not amend comparative prior period numbers for presentational changes triggered by new and revised information from third-party data providers, as long as the updated information does not impact the Pillar 1 treatments of prior periods.
Good practice guidelines
On 18 December 2008, the European Banking Federation, the Association for Financial Markets in Europe, the European Savings Banks Group and the European Association of Public Banks and Funding Agencies published the “Industry good practice guidelines on Pillar 3 disclosure requirement for securitization.” These guidelines were slightly revised in 2009 and 2010, and this report complies with that publication in all material respects.
589
Financial information
Supplemental disclosures required under Basel III Pillar 3 regulations
Securitization in the banking and trading book
Tables 16 and 17 outline the exposures, that is, the transaction size at inception we securitized in the banking and trading book during 2013 and 2012. The activity is further broken down by our role (originator/sponsor) and by type (traditional/synthetic).
Amounts disclosed under theTraditional column of these tables reflect the total outstanding notes at par value issued by the securitization vehicle at issuance. For synthetic securitization transactions, the amounts disclosed generally reflect the balance sheet carrying values of the securitized exposures at issuance.
For securitization transactions where we acted as originator, exposures are split into two parts, those in which we have retained
securitization positions and/or continue to be involved on an ongoing basis (for example credit enhancement or implicit support), and those in which we have no retained securitization positions and/or have no further involvement.
Where we acted as both originator and sponsor to a securitization, originated assets are reported underOriginator and the total amount of the underlying assets securitized is reported underSponsor. As a result, as of 31 December 2013 and 31 December 2012, amounts of CHF 2.5 billion and CHF 3.8 billion, respectively, were included in “Table 16: Securitization activity of the year in the banking book” under bothOriginator andSponsor and “Table 18: Outstanding securitized exposures.”
Table 16: Securitization activity of the year in the banking book
| | | | | | | | | | | | | | | | | | | | | | | | | | | | |
| | Originator | | | Sponsor | |
| | Traditional | | | Synthetic | | | Realized
gains/(losses) on
traditional
securitizations | | | Traditional | | | Synthetic | |
| CHF million | | Securitization positions retained | | | No securitization positions retained | | | Securitisation positions retained | | | No securitization positions retained | | | | | | | | | | |
| Residential mortgages | | | | | | | | | | | | | | | | | | | | | | | | | | | | |
| | | | | | | | | | | | | | | | | | | | | | | | | | | | | |
| Commercial mortgages | | | 1,331 | | | | 1,199 | | | | | | | | | | | | 97 | | | | 7,580 | | | | | |
| | | | | | | | | | | | | | | | | | | | | | | | | | | | | |
| Credit card receivables | | | | | | | | | | | | | | | | | | | | | | | | | | | | |
| | | | | | | | | | | | | | | | | | | | | | | | | | | | | |
| Leasing | | | | | | | | | | | | | | | | | | | | | | | | | | | | |
| | | | | | | | | | | | | | | | | | | | | | | | | | | | | |
| Loans to corporates or small and medium-sized enterprises | | | | | | | | | | | | | | | | | | | | | | | | | | | | |
| | | | | | | | | | | | | | | | | | | | | | | | | | | | | |
| Consumer loans | | | | | | | | | | | | | | | | | | | | | | | | | | | | |
| | | | | | | | | | | | | | | | | | | | | | | | | | | | | |
| Student loans | | | | | | | | | | | | | | | | | | | | | | | | | | | | |
| | | | | | | | | | | | | | | | | | | | | | | | | | | | | |
| Trade receivables | | | | | | | | | | | | | | | | | | | | | | | | | | | | |
| | | | | | | | | | | | | | | | | | | | | | | | | | | | | |
| Re-securitizations | | | | | | | | | | | | | | | | | | | | | | | | | | | | |
| | | | | | | | | | | | | | | | | | | | | | | | | | | | | |
| Other | | | | | | | | | | | 876 | | | | | | | | | | | | | | | | | |
| | | | | | | | | | | | | | | | | | | | | | | | | | | | | |
| Total 31.12.13 | | | 1,331 | | | | 1,199 | | | | 876 | | | | 0 | | | | 97 | | | | 7,580 | | | | 0 | |
| | | | | | | | | | | | | | | | | | | | | | | | | | | | | |
| Residential mortgages | | | | | | | | | | | | | | | | | | | | | | | | | | | | |
| | | | | | | | | | | | | | | | | | | | | | | | | | | | | |
| Commercial mortgages | | | 3,768 | | | | | | | | | | | | | | | | 166 | | | | 7,189 | | | | | |
| | | | | | | | | | | | | | | | | | | | | | | | | | | | | |
| Credit card receivables | | | | | | | | | | | | | | | | | | | | | | | | | | | | |
| | | | | | | | | | | | | | | | | | | | | | | | | | | | | |
| Leasing | | | | | | | | | | | | | | | | | | | | | | | | | | | | |
| | | | | | | | | | | | | | | | | | | | | | | | | | | | | |
| Loans to corporates or small and medium-sized enterprises | | | | | | | | | | | | | | | | | | | | | | | | | | | | |
| | | | | | | | | | | | | | | | | | | | | | | | | | | | | |
| Consumer loans | | | | | | | | | | | | | | | | | | | | | | | | | | | | |
| | | | | | | | | | | | | | | | | | | | | | | | | | | | | |
| Student loans | | | | | | | | | | | | | | | | | | | | | | | | | | | | |
| | | | | | | | | | | | | | | | | | | | | | | | | | | | | |
| Trade receivables | | | | | | | | | | | | | | | | | | | | | | | | | | | | |
| | | | | | | | | | | | | | | | | | | | | | | | | | | | | |
| Re-securitizations | | | | | | | | | | | | | | | | | | | | | | | | | | | | |
| | | | | | | | | | | | | | | | | | | | | | | | | | | | | |
| Other | | | | | | | | | | | 6,735 | | | | | | | | | | | | | | | | | |
| | | | | | | | | | | | | | | | | | | | | | | | | | | | | |
| Total 31.12.12 (Basel 2.5) | | | 3,768 | | | | 0 | | | | 6,735 | | | | 0 | | | | 166 | | | | 7,189 | | | | 0 | |
| | | | | | | | | | | | | | | | | | | | | | | | | | | | | |
590
Table 17: Securitization activity of the year in the trading book
| | | | | | | | | | | | | | | | | | | | | | | | | | | | |
| | Originator | | | Sponsor1 | |
| | Traditional | | | Synthetic | | | Realized
gains/(losses) on
traditional
securitizations | | | Traditional | | | Synthetic | |
| CHF million | | Securitization
positions retained | | | No securitization positions retained | | | Securitization positions retained | | | No securitization positions retained | | | | |
| Residential mortgages | | | | | | | | | | | | | | | | | | | | | | | | | | | | |
| | | | | | | | | | | | | | | | | | | | | | | | | | | | | |
| Commercial mortgages | | | | | | | | | | | | | | | | | | | | | | | | | | | | |
| | | | | | | | | | | | | | | | | | | | | | | | | | | | | |
| Credit card receivables | | | | | | | | | | | | | | | | | | | | | | | | | | | | |
| | | | | | | | | | | | | | | | | | | | | | | | | | | | | |
| Leasing | | | | | | | | | | | | | | | | | | | | | | | | | | | | |
| | | | | | | | | | | | | | | | | | | | | | | | | | | | | |
| Loans to corporates or small and medium-sized enterprises | | | | | | | | | | | | | | | | | | | | | | | | | | | | |
| | | | | | | | | | | | | | | | | | | | | | | | | | | | | |
| Consumer loans | | | | | | | | | | | | | | | | | | | | | | | | | | | | |
| | | | | | | | | | | | | | | | | | | | | | | | | | | | | |
| Student loans | | | | | | | | | | | | | | | | | | | | | | | | | | | | |
| | | | | | | | | | | | | | | | | | | | | | | | | | | | | |
| Trade receivables | | | | | | | | | | | | | | | | | | | | | | | | | | | | |
| | | | | | | | | | | | | | | | | | | | | | | | | | | | | |
| Re-securitizations | | | | | | | | | | | | | | | | | | | | | | | | | | | | |
| | | | | | | | | | | | | | | | | | | | | | | | | | | | | |
| Other | | | | | | | | | | | | | | | | | | | | | | | | | | | | |
| | | | | | | | | | | | | | | | | | | | | | | | | | | | | |
| Total 31.12.13 | | | 0 | | | | 0 | | | | 0 | | | | 0 | | | | 0 | | | | 0 | | | | 0 | |
| | | | | | | | | | | | | | | | | | | | | | | | | | | | | |
| Residential mortgages | | | | | | | | | | | | | | | | | | | | | | | | | | | | |
| | | | | | | | | | | | | | | | | | | | | | | | | | | | | |
| Commercial mortgages | | | | | | | | | | | | | | | | | | | | | | | | | | | | |
| | | | | | | | | | | | | | | | | | | | | | | | | | | | | |
| Credit card receivables | | | | | | | | | | | | | | | | | | | | | | | | | | | | |
| | | | | | | | | | | | | | | | | | | | | | | | | | | | | |
| Leasing | | | | | | | | | | | | | | | | | | | | | | | | | | | | |
| | | | | | | | | | | | | | | | | | | | | | | | | | | | | |
| Loans to corporates or small and medium-sized enterprises | | | | | | | | | | | | | | | | | | | | | | | | | | | | |
| | | | | | | | | | | | | | | | | | | | | | | | | | | | | |
| Consumer loans | | | | | | | | | | | | | | | | | | | | | | | | | | | | |
| | | | | | | | | | | | | | | | | | | | | | | | | | | | | |
| Student loans | | | | | | | | | | | | | | | | | | | | | | | | | | | | |
| | | | | | | | | | | | | | | | | | | | | | | | | | | | | |
| Trade receivables | | | | | | | | | | | | | | | | | | | | | | | | | | | | |
| | | | | | | | | | | | | | | | | | | | | | | | | | | | | |
| Re-securitizations | | | | | | | | | | | | | | | | | | | | | | | 1,033 | | | | | |
| | | | | | | | | | | | | | | | | | | | | | | | | | | | | |
| Other | | | | | | | | | | | | | | | | | | | | | | | | | | | | |
| | | | | | | | | | | | | | | | | | | | | | | | | | | | | |
| Total 31.12.12 (Basel 2.5) | | | 0 | | | | 0 | | | | 0 | | | | 0 | | | | 0 | | | | 1,033 | | | | 0 | |
| | | | | | | | | | | | | | | | | | | | | | | | | | | | | |
1 The scope of this disclosure such that we do not include sponsor-only activity where we do not retain a position. In these cases we advised the originator or placed securities in the market for a fee, and did not otherwise impact our capital. On this basis we did not report any securitization activity in the year 2013.
591
Financial information
Supplemental disclosures required under Basel III Pillar 3 regulations
Table 18: Outstanding securitized exposures
This table outlines exposures (that is, outstanding transaction size) in which we have originated/sponsored and retained securitization positions at the balance sheet date in the banking or trading book and/or are otherwise involved on an ongoing basis (for example credit enhancement, implicit support).
Amounts disclosed under theTraditional column in this table reflect the total outstanding notes at par value issued by the securitization vehicle. For synthetic securitization transactions, we generally disclose the balance sheet carrying values of the exposures securitized or, for hybrid structures, the outstanding notes at par value issued by the securitization vehicle.
The table also includes securitization activities conducted in 2013 and 2012 in which we retained/purchased positions. These can also be found in “Table 16: Securitization activity of the year in the banking book” and “Table 17: Securitization activity of the year in the trading book.” Where no positions were retained, the outstanding transaction size is only disclosed in the year of inception for originator transactions.
All values in this table are as of the balance sheet date.
| | | | | | | | | | | | | | | | | | | | | | | | | | | | | | | | |
| | Banking Book | | | Trading Book1,2 | |
| | Originator | | | Sponsor | | | Originator | | | Sponsor | |
| CHF million | | Traditional | | | Synthetic | | | Traditional | | | Synthetic | | | Traditional | | | Synthetic | | | Traditional3 | | | Synthetic | |
| Residential mortgages | | | 658 | | | | | | | | 158 | | | | | | | | 1,324 | | | | | | | | 4,871 | | | | | |
| | | | | | | | | | | | | | | | | | | | | | | | | | | | | | | | | |
| Commercial mortgages | | | 2,529 | | | | | | | | 18,592 | | | | | | | | | | | | | | | | 15,323 | | | | | |
| | | | | | | | | | | | | | | | | | | | | | | | | | | | | | | | | |
| Credit card receivables | | | | | | | | | | | | | | | | | | | | | | | | | | | | | | | | |
| | | | | | | | | | | | | | | | | | | | | | | | | | | | | | | | | |
| Leasing | | | | | | | | | | | 553 | | | | | | | | | | | | | | | | | | | | | |
| | | | | | | | | | | | | | | | | | | | | | | | | | | | | | | | | |
| Loans to corporates or small and medium-sized enterprises | | | | | | | | | | | 741 | | | | | | | | | | | | | | | | | | | | | |
| | | | | | | | | | | | | | | | | | | | | | | | | | | | | | | | | |
| Consumer loans | | | | | | | | | | | | | | | | | | | | | | | | | | | | | | | | |
| | | | | | | | | | | | | | | | | | | | | | | | | | | | | | | | | |
| Student loans | | | | | | | | | | | 6,788 | | | | | | | | | | | | | | | | 770 | | | | | |
| | | | | | | | | | | | | | | | | | | | | | | | | | | | | | | | | |
| Trade receivables | | | | | | | | | | | | | | | | | | | | | | | | | | | | | | | | |
| | | | | | | | | | | | | | | | | | | | | | | | | | | | | | | | | |
| Re-securitizations | | | 585 | | | | 390 | | | | 3,426 | | | | | | | | 181 | | | | 951 | | | | | | | | | |
| | | | | | | | | | | | | | | | | | | | | | | | | | | | | | | | | |
| Other | | | | | | | 8,659 | | | | 754 | | | | | | | | | | | | | | | | | | | | | |
| | | | | | | | | | | | | | | | | | | | | | | | | | | | | | | | | |
| Total 31.12.13 | | | 3,772 | | | | 9,049 | | | | 31,011 | | | | 0 | | | | 1,505 | | | | 951 | | | | 20,963 | | | | 0 | |
| | | | | | | | | | | | | | | | | | | | | | | | | | | | | | | | | |
| Residential mortgages | | | 1,288 | | | | | | | | 2,474 | | | | | | | | 554 | | | | | | | | 7,578 | | | | | |
| | | | | | | | | | | | | | | | | | | | | | | | | | | | | | | | | |
| Commercial mortgages | | | 3,768 | | | | | | | | 14,772 | | | | | | | | | | | | | | | | 17,989 | | | | | |
| | | | | | | | | | | | | | | | | | | | | | | | | | | | | | | | | |
| Credit card receivables | | | | | | | | | | | 0 | | | | | | | | | | | | | | | | | | | | | |
| | | | | | | | | | | | | | | | | | | | | | | | | | | | | | | | | |
| Leasing | | | | | | | | | | | 306 | | | | | | | | | | | | | | | | | | | | | |
| | | | | | | | | | | | | | | | | | | | | | | | | | | | | | | | | |
| Loans to corporates or small and medium-sized enterprises | | | | | | | | | | | 394 | | | | | | | | | | | | | | | | | | | | | |
| | | | | | | | | | | | | | | | | | | | | | | | | | | | | | | | | |
| Consumer loans | | | | | | | | | | | 0 | | | | | | | | | | | | | | | | | | | | | |
| | | | | | | | | | | | | | | | | | | | | | | | | | | | | | | | | |
| Student loans | | | | | | | | | | | 13,296 | | | | | | | | | | | | | | | | 908 | | | | | |
| | | | | | | | | | | | | | | | | | | | | | | | | | | | | | | | | |
| Trade receivables | | | | | | | | | | | 0 | | | | | | | | | | | | | | | | | | | | | |
| | | | | | | | | | | | | | | | | | | | | | | | | | | | | | | | | |
| Re-securitizations | | | 840 | | | | 782 | | | | 3,489 | | | | | | | | 1,779 | | | | 976 | | | | 2,604 | | | | | |
| | | | | | | | | | | | | | | | | | | | | | | | | | | | | | | | | |
| Other | | | | | | | 8,590 | | | | 2,801 | | | | | | | | | | | | | | | | 1,236 | | | | | |
| | | | | | | | | | | | | | | | | | | | | | | | | | | | | | | | | |
| Total 31.12.12 (Basel 2.5) | | | 5,896 | | | | 9,372 | | | | 37,532 | | | | 0 | | | | 2,333 | | | | 976 | | | | 30,315 | | | | 0 | |
| | | | | | | | | | | | | | | | | | | | | | | | | | | | | | | | | |
1 As per FINMA Circular “Market Risk – Banks,” only the higher of the net long or the net short securitization positions in the trading book are to be underpinned for the regulatory capital purposes. This interim relief is granted until 31 December 2013. After the transition period both net long and net short positions require capital underpinning.2 In line with our disclosure principles we disclose the UBS originated and sponsored deals only where the positions result in an RWA or capital deduction under Pillar 1.3 The scope of this disclosure is such that we do not include sponsor-only activity where we do not retain a position. In these cases we advised the originator or placed securities in the market for a fee, and did not otherwise impact our capital.
592
Table 19: Impaired or past due securitized exposures and losses related to securitized exposures in the banking book
This table provides a breakdown of the outstanding impaired or past due exposures at the balance sheet date as well as losses recognized in our income statement for transactions in which we acted as originator or sponsor in the banking book. Losses are reported after taking into account the offsetting effects of any credit protection that is an eligible risk mitigation instrument under the Basel III framework for the retained or purchased positions.
Where we did not retain positions, impaired or past due information is only reported in the year of inception of a transaction. Where available, past due information was derived from investor reports. Past due is generally defined as delinquency above 60 days. Where investor reports do not provide this information, alternative methods have been applied, which may include an assessment of the fair value of the retained position or reference assets, or identification of any credit events.
| | | | | | | | | | | | | | | | | | | | | | | | | | | | | | | | |
| | 31.12.13 | | | 31.12.12 (Basel 2.5) | |
| | Originator | | | Sponsor | | | Originator | | | Sponsor | |
| CHF million | | Impaired or
past due in
securitized
exposures | | | Recognized
losses in
income
statement | | | Impaired or
past due in
securitized
exposures | | | Recognized
losses in
income
statement | | | Impaired or
past due in
securitized
exposures | | | Recognized
losses in
income
statement | | | Impaired or
past due in
securitized
exposures | | | Recognized
losses in
income
statement | |
| Residential mortgages | | | 323 | | | | | | | | 21 | | | | | | | | 791 | | | | 0 | | | | 468 | | | | 0 | |
| | | | | | | | | | | | | | | | | | | | | | | | | | | | | | | | | |
| Commercial mortgages | | | | | | | 0 | | | | 793 | | | | 11 | | | | | | | | 1 | | | | 761 | | | | 0 | |
| | | | | | | | | | | | | | | | | | | | | | | | | | | | | | | | | |
| Credit card receivables | | | | | | | | | | | | | | | | | | | | | | | | | | | | | | | | |
| | | | | | | | | | | | | | | | | | | | | | | | | | | | | | | | | |
| Leasing | | | | | | | | | | | | | | | | | | | | | | | | | | | 0 | | | | | |
| | | | | | | | | | | | | | | | | | | | | | | | | | | | | | | | | |
| Loans to corporates or small and medium-sized enterprises | | | | | | | | | | | | | | | | | | | | | | | | | | | | | | | | |
| | | | | | | | | | | | | | | | | | | | | | | | | | | | | | | | | |
| Consumer loans | | | | | | | | | | | | | | | | | | | | | | | | | | | | | | | | |
| | | | | | | | | | | | | | | | | | | | | | | | | | | | | | | | | |
| Student loans | | | | | | | | | | | 321 | | | | 3 | | | | | | | | | | | | 787 | | | | 8 | |
| | | | | | | | | | | | | | | | | | | | | | | | | | | | | | | | | |
| Trade receivables | | | | | | | | | | | | | | | | | | | | | | | | | | | | | | | | |
| | | | | | | | | | | | | | | | | | | | | | | | | | | | | | | | | |
| Re-securitizations | | | 307 | | | | | | | | | | | | 0 | | | | 373 | | | | 1 | | | | | | | | 0 | |
| | | | | | | | | | | | | | | | | | | | | | | | | | | | | | | | | |
| Other | | | 50 | | | | 115 | | | | | | | | 0 | | | | 67 | | | | 67 | | | | | | | | 1 | |
| | | | | | | | | | | | | | | | | | | | | | | | | | | | | | | | | |
| Total | | | 680 | | | | 115 | | | | 1,134 | | | | 15 | | | | 1,232 | | | | 68 | | | | 2,016 | | | | 9 | |
| | | | | | | | | | | | | | | | | | | | | | | | | | | | | | | | | |
Table 20: Exposures intended to be securitized in the banking and trading book
This table provides the amount of exposures by exposure type we intend to securitize in the banking and trading book. We disclose our intention to securitize exposures as an originator if assets are
designated for securitization and a tentative pricing date for a transaction is known at the balance sheet date or if a pricing of a transaction has been fixed.
| | | | | | | | | | | | | | | | |
| | 31.12.13 | | | 31.12.12 (Basel 2.5) | |
| CHF million | | Banking Book | | | Trading Book | | | Banking Book | | | Trading Book | |
| Residential mortgages | | | | | | | | | | | | | | | | |
| | | | | | | | | | | | | | | | | |
| Commercial mortgages | | | | | | | | | | | 447 | | | | | |
| | | | | | | | | | | | | | | | | |
| Credit card receivables | | | | | | | | | | | | | | | | |
| | | | | | | | | | | | | | | | | |
| Leasing | | | | | | | | | | | | | | | | |
| | | | | | | | | | | | | | | | | |
| Loans to corporates or small and medium-sized enterprises | | | | | | | | | | | | | | | | |
| | | | | | | | | | | | | | | | | |
| Consumer loans | | | | | | | | | | | | | | | | |
| | | | | | | | | | | | | | | | | |
| Student loans | | | | | | | | | | | | | | | | |
| | | | | | | | | | | | | | | | | |
| Trade receivables | | | | | | | | | | | | | | | | |
| | | | | | | | | | | | | | | | | |
| Re-securitizations | | | | | | | | | | | | | | | | |
| | | | | | | | | | | | | | | | | |
| Other | | | | | | | | | | | | | | | | |
| | | | | | | | | | | | | | | | | |
| Total | | | 0 | | | | 0 | | | | 447 | | | | 0 | |
| | | | | | | | | | | | | | | | | |
593
Financial information
Supplemental disclosures required under Basel III Pillar 3 regulations
Table 21: Securitization positions retained or purchased in the banking book
This table provides a breakdown of securitization positions we retained or purchased in the banking book, irrespective of our role in the securitization transaction. The value disclosed is the net exposure amount at default subject to risk-weighting at the balance sheet date.
| | | | | | | | | | | | | | | | |
| | 31.12.13 | | | 31.12.12 (Basel 2.5) | |
| CHF million | | On balance sheet | | | Off balance sheet | | | On balance sheet | | | Off balance sheet | |
| Residential mortgages | | | 541 | | | | | | | | 600 | | | | | |
| | | | | | | | | | | | | | | | | |
| Commercial mortgages | | | 351 | | | | | | | | 553 | | | | | |
| | | | | | | | | | | | | | | | | |
| Credit card receivables | | | | | | | | | | | | | | | | |
| | | | | | | | | | | | | | | | | |
| Leasing | | | 43 | | | | | | | | 47 | | | | | |
| | | | | | | | | | | | | | | | | |
| Loans to corporates or small and medium-sized enterprises | | | 349 | | | | | | | | 240 | | | | | |
| | | | | | | | | | | | | | | | | |
| Consumer loans | | | 1 | | | | | | | | 1 | | | | | |
| | | | | | | | | | | | | | | | | |
| Student loans | | | 1,060 | | | | | | | | 3,892 | | | | | |
| | | | | | | | | | | | | | | | | |
| Trade receivables | | | | | | | | | | | | | | | | |
| | | | | | | | | | | | | | | | | |
| Re-securitizations | | | 948 | | | | 161 | | | | 800 | | | | 147 | |
| | | | | | | | | | | | | | | | | |
| Other | | | 8,403 | 3 | | | 71 | | | | 9,334 | 3 | | | 33 | |
| | | | | | | | | | | | | | | | | |
| Total1,2 | | | 11,696 | | | | 232 | | | | 15,466 | | | | 180 | |
| | | | | | | | | | | | | | | | | |
1 The total exposure of CHF 11.9 billion as of 31 December 2013 is also disclosed in “Table 2: Detailed segmentation of Basel III exposures and risk-weighted assets” in line “Securitization/re-securitization in the banking book.”2 The total exposure of CHF 15.0 billion as of 31 December 2012 is also disclosed in “Table 2: Detailed segmentation of Basel 2.5 exposures and risk-weighted assets” in line “Securitization/re-securitization in the banking book” and excludes the deductions compared with the 31 December 2012 numbers shown above (CHF 15.6 billion).3 “Other” primarily includes securitization of portfolios of counterparty credit risk in over-the-counter (OTC) derivatives and loan exposures.
594
Table 22: Securitization positions retained or purchased in the trading book
This table provides a breakdown of securitization positions we purchased or retained in the trading book subject to the securitization framework for specific market risk, irrespective of our role in the securitization transaction. Gross long and gross short amounts reflect the positions prior to the eligible offsetting of cash and derivative positions. Net long and net short amounts are
the result of offsetting cash and derivative positions to the extent eligible under Basel III. The amounts disclosed are either the fair value or, in the case of derivative positions, the aggregate of the notional amount and the associated replacement value at the balance sheet date.
| | | | | | | | | | | | | | | | | | | | | | | | |
| | Cash positions | | | Derivative positions | | | Total | |
| CHF million | | Gross long | | | Gross short | | | Gross long | | | Gross short | | | Net long3 | | | Net short | |
| Residential mortgages | | | 86 | | | | 2 | | | | 1,036 | | | | 1,196 | | | | 109 | | | | 199 | |
| | | | | | | | | | | | | | | | | | | | | | | | | |
| Commercial mortgages | | | 462 | | | | 0 | | | | 847 | | | | 1,341 | | | | 477 | | | | 508 | |
| | | | | | | | | | | | | | | | | | | | | | | | | |
| Credit card receivables | | | | | | | | | | | | | | | | | | | | | | | | |
| | | | | | | | | | | | | | | | | | | | | | | | | |
| Leasing | | | | | | | | | | | | | | | | | | | | | | | | |
| | | | | | | | | | | | | | | | | | | | | | | | | |
| Loans to corporates or small and medium-sized enterprises | | | | | | | | | | | | | | | | | | | | | | | | |
| | | | | | | | | | | | | | | | | | | | | | | | | |
| Consumer loans | | | | | | | | | | | | | | | | | | | | | | | | |
| | | | | | | | | | | | | | | | | | | | | | | | | |
| Student loans | | | 0 | | | | 0 | | | | | | | | | | | | | | | | | |
| | | | | | | | | | | | | | | | | | | | | | | | | |
| Trade receivables | | | | | | | | | | | | | | | | | | | | | | | | |
| | | | | | | | | | | | | | | | | | | | | | | | | |
| Re-securitizations | | | 37 | | | | 1 | | | | 45 | | | | 72 | | | | 9 | | | | 8 | |
| | | | | | | | | | | | | | | | | | | | | | | | | |
| Other | | | 16 | | | | 0 | | | | 269 | | | | 269 | | | | 16 | | | | | |
| | | | | | | | | | | | | | | | | | | | | | | | | |
| Total 31.12.131 | | | 601 | | | | 3 | | | | 2,197 | | | | 2,878 | | | | 611 | | | | 715 | |
| | | | | | | | | | | | | | | | | | | | | | | | | |
| Residential mortgages | | | 49 | | | | | | | | 1,066 | | | | 1,175 | | | | 141 | | | | 125 | |
| | | | | | | | | | | | | | | | | | | | | | | | | |
| Commercial mortgages | | | 869 | | | | 25 | | | | 5,871 | | | | 6,704 | | | | 923 | | | | 926 | |
| | | | | | | | | | | | | | | | | | | | | | | | | |
| Credit card receivables | | | 3 | | | | | | | | | | | | | | | | 3 | | | | | |
| | | | | | | | | | | | | | | | | | | | | | | | | |
| Leasing | | | 7 | | | | | | | | | | | | | | | | 7 | | | | | |
| | | | | | | | | | | | | | | | | | | | | | | | | |
| Loans to corporates or small and medium-sized enterprises | | | 1 | | | | | | | | | | | | | | | | 1 | | | | | |
| | | | | | | | | | | | | | | | | | | | | | | | | |
| Consumer loans | | | | | | | | | | | | | | | | | | | | | | | | |
| | | | | | | | | | | | | | | | | | | | | | | | | |
| Student loans | | | | | | | | | | | | | | | | | | | | | | | | |
| | | | | | | | | | | | | | | | | | | | | | | | | |
| Trade receivables | | | | | | | | | | | | | | | | | | | | | | | | |
| | | | | | | | | | | | | | | | | | | | | | | | | |
| Re-securitizations | | | 411 | | | | 3 | | | | 235 | | | | 551 | | | | 168 | | | | 81 | |
| | | | | | | | | | | | | | | | | | | | | | | | | |
| Other | | | 15 | | | | 1 | | | | | | | | | | | | 14 | | | | 1 | |
| | | | | | | | | | | | | | | | | | | | | | | | | |
| Total 31.12.121,2(Basel 2.5) | | | 1,355 | | | | 29 | | | | 7,172 | | | | 8,430 | | | | 1,257 | | | | 1,134 | |
| | | | | | | | | | | | | | | | | | | | | | | | | |
1 Leveraged super senior tranches (subject to the securitization framework) are not included in this table, but disclosed in “Table 27: Correlation products subject to the comprehensive risk measure or the securitization framework for specific risk.”2 The total exposure of CHF 6.4 billion as of 31 December 2012 is also disclosed in “Table 2: Detailed segmentation of Basel III exposures and risk-weighted assets” in line“Securitization/re-securitization in the trading book” and excludes the deductions compared with the 31 December 2012 numbers shown above (CHF 1.2 billion) and the leveraged super senior tranches as per footnote 1.3 The net exposure at default of CHF 2.0 billion as of 31 December 2013 disclosed in “Table 2: Detailed segmentation of Basel III exposures and risk-weighted assets” (line “Securitization/re-securitization exposures”) comprises total net long position of CHF 0.6 billion (included in this table) and CHF 1.4 billion for leveraged super senior tranches.
595
Financial information
Supplemental disclosures required under Basel III Pillar 3 regulations
Table 23: Capital requirement forsecuritization/re-securitization positions retained or purchased in the banking book
The table provides the capital requirements for securitization and re-securitization positions we purchased or retained in the banking book, irrespective of our role in the securitization transaction, split by risk
weight bands and regulatory capital approach. We disclose securitization
and re-securitization positions which were previously deducted from capital under Basel 2.5 in the 1,250% risk-weighting band from 2013 onwards.
| | | | | | | | | | | | | | | | | | | | | | | | | | | | | | | | |
| | 31.12.13 | | | 31.12.12 (Basel 2.5) | |
| | Ratings-based approach | | | Supervisory formula approach | | | Ratings-based approach | | | Supervisory formula approach | |
| CHF million | | Securitization | | | Re- securitization | | | Securitization | | | Re- securitization | | | Securitization | | | Re- securitization | | | Securitization | | | Re- securitization | |
| over 0 – 20% | | | 25 | | | | | | | | 72 | | | | | | | | 54 | | | | | | | | 49 | | | | | |
| | | | | | | | | | | | | | | | | | | | | | | | | | | | | | | | | |
| over 20 – 35% | | | 8 | | | | 0 | | | | | | | | | | | | 7 | | | | 5 | | | | | | | | | |
| | | | | | | | | | | | | | | | | | | | | | | | | | | | | | | | | |
| over 35 – 50% | | | 3 | | | | 29 | | | | | | | | | | | | 4 | | | | 9 | | | | | | | | | |
| | | | | | | | | | | | | | | | | | | | | | | | | | | | | | | | | |
| over 50 – 75% | | | 17 | | | | 0 | | | | | | | | | | | | 17 | | | | 1 | | | | | | | | | |
| | | | | | | | | | | | | | | | | | | | | | | | | | | | | | | | | |
| over 75 – 100% | | | 14 | | | | 2 | | | | | | | | | | | | 23 | | | | | | | | | | | | | |
| | | | | | | | | | | | | | | | | | | | | | | | | | | | | | | | | |
| over 100 – 250% | | | 21 | | | | 8 | | | | | | | | | | | | 44 | | | | 23 | | | | | | | | | |
| | | | | | | | | | | | | | | | | | | | | | | | | | | | | | | | | |
| over 250 – 1,249% | | | 99 | | | | 65 | | | | | | | | | | | | 114 | | | | 65 | | | | | | | | | |
| | | | | | | | | | | | | | | | | | | | | | | | | | | | | | | | | |
| 1,250% | | | 308 | | | | 28 | | | | 17 | | | | | | | | | | | | | | | | | | | | | |
| | | | | | | | | | | | | | | | | | | | | | | | | | | | | | | | | |
| Total1,2 | | | 494 | | | | 132 | | | | 89 | | | | 0 | | | | 263 | | | | 103 | | | | 49 | | | | 0 | |
| | | | | | | | | | | | | | | | | | | | | | | | | | | | | | | | | |
1 Refer to “Table 2: Detailed segmentation of Basel III exposures and risk-weighted assets.” On 31 December 2013, CHF 8.4 billion banking book securitization exposures translated to an overall capital requirement of overall CHF 0.7 billion.2 On 31 December 2012, CHF 5.5 billion banking book securitization exposures translated to a capital requirement of CHF 0.4 billion without applying a scaling factor of 1.06.
Securitization exposures to be deducted from Basel III tier 1 capital
In 2013 and 2012, we have not retained any significant exposures relating to securitization for which we have recorded gains on sale.
Securitization exposures subject to early amortization in the banking and trading book
In 2013 and 2012, we had no securitization structures in the banking and trading book that are subject to early amortization treatment.
596
Table 24:Re-securitization positions retained or purchased in the banking book
The upper part of this table shows the total of re-securitization positions (cash as well as synthetic) held in the banking book, broken down into positions for which credit risk mitigation has been recognized and those for which no credit risk mitigation has been recognized. Credit risk mitigation includes protection bought by entering into credit derivatives with third-party protection sellers, as well as financial collateral received. Both bought credit protection
and financial collateral must be eligible under Basel III regulations.
The lower part of this table shows the re-securitization positions which have an integrated insurance wrapper, split into positions with investment grade, sub-investment grade and defaulted insurance. The values disclosed in both tables are the net exposure amount at default at the balance sheet date.
| | | | | | | | | | |
| CHF million | | With credit risk
mitigation | | Without credit risk
mitigation | | | Total | |
Total 31.12.13 | | | | | 1,109 | | | | 1,109 | |
| | | | | | | | | | | |
Total 31.12.12 (Basel 2.5) | | | | | 947 | | | | 947 | |
| | | | | | | | | | | |
| | | | | | |
| Re-securitization positions with integrated insurance wrapper broken down according to guarantor credit worthiness categories1 | | | |
| CHF million | | | | | |
| 0–5 | | Investment grade | | | | |
| | | | | | | |
| 6–13 | | Sub-investment grade | | | 1 | |
| | | | | | | |
| 14 | | Defaulted | | | | |
| | | | | | | |
| Total 31.12.13 | | | | | 1 | |
| | | | | | | |
| | |
| 0–5 | | Investment grade | | | | |
| | | | | | | |
| 6–13 | | Sub-investment grade | | | 22 | |
| | | | | | | |
| 14 | | Defaulted | | | | |
| | | | | | | |
| Total 31.12.12 (Basel 2.5) | | | | | 22 | |
| | | | | | | |
1Internal UBS rating.
597
Financial information
Supplemental disclosures required under Basel III Pillar 3 regulations
Table 25:Re-securitization positions retained or purchased in the trading book
The upper part of the table below outlines re-securitization positions retained or purchased subject to the securitization framework for specific market risk held in the trading book on a gross long and gross short basis, including synthetic long and short positions resulting from derivative transactions. It also includes positions on a net long and net short basis, that is, gross long and short positions after offsetting to the extent it is eligible under
Basel III. The lower part of the table discloses the total re-securitization positions which have an integrated insurance wrapper, split by positions with investment grade, sub-investment grade and defaulted insurance. As of 31 December 2013, none of the retained or purchased trading book re-securitization positions had an integrated insurance wrapper.
| | | | | | | | | | | | | | | | |
| CHF million | | Gross long | | | Gross short | | | Net long | | | Net short | |
| Total 31.12.13 | | | 82 | | | | 73 | | | | 9 | | | | 8 | |
| | | | | | | | | | | | | | | | | |
| | | | |
| Total 31.12.12 (Basel 2.5) | | | 646 | | | | 554 | | | | 168 | | | | 81 | |
| | | | | | | | | | | | | | | | | |
| | | | | | | | | | | | | | | | | | |
| Re-securitization positions with integrated insurance wrapper broken down according to guarantor credit worthiness categories1 | | | | |
| CHF million | | | | | | | | | | | | | | |
| 0–5 | | Investment grade | | | | | | | | | | | | | | | | |
| | | | | | | | | | | | | | | | | | | |
| 6–13 | | Sub-investment grade | | | | | | | | | | | | | | | | |
| | | | | | | | | | | | | | | | | | | |
| 14 | | Defaulted | | | | | | | | | | | | | | | | |
| | | | | | | | | | | | | | | | | | | |
| Total 31.12.13 | | | | | 0 | | | | 0 | | | | 0 | | | | 0 | |
| | | | | | | | | | | | | | | | | | | |
| | | | | |
| 0–5 | | Investment grade | | | 42 | | | | 46 | | | | 3 | | | | 7 | |
| | | | | | | | | | | | | | | | | | | |
| 6–13 | | Sub-investment grade | | | 2 | | | | 0 | | | | 2 | | | | | |
| | | | | | | | | | | | | | | | | | | |
| 14 | | Defaulted | | | 25 | | | | 18 | | | | 10 | | | | 3 | |
| | | | | | | | | | | | | | | | | | | |
| Total 31.12.12 (Basel 2.5) | | | | | 69 | | | | 64 | | | | 15 | | | | 10 | |
| | | | | | | | | | | | | | | | | | | |
1 Internal UBS rating.
598
Table 26: Aggregated amount of securitized exposures subject to the market risk approach
This table provides a split of the total outstanding exposures we have securitized in the trading book in the role of originator and/or sponsor. The table does not include positions from current year securitizations (where UBS was originator) unless they were retained at year-end. Disclosure is made only where we have retained positions in the trading book. The amount disclosed is the notional amount of the outstanding notes issued by the securitization vehicle at the balance sheet date.
| | | | | | | | | | | | | | | | |
| | Originator | | | Sponsor | |
| CHF million | | Traditional | | | Synthetic | | | Traditional | | | Synthetic | |
| Residential mortgages | | | 1,324 | | | | | | | | 4,871 | | | | | |
| | | | | | | | | | | | | | | | | |
| Commercial mortgages | | | | | | | | | | | 15,323 | | | | | |
| | | | | | | | | | | | | | | | | |
| Credit card receivables | | | | | | | | | | | | | | | | |
| | | | | | | | | | | | | | | | | |
| Leasing | | | | | | | | | | | | | | | | |
| | | | | | | | | | | | | | | | | |
| Loans to corporates or small and medium-sized enterprises | | | | | | | | | | | | | | | | |
| | | | | | | | | | | | | | | | | |
| Consumer loans | | | | | | | | | | | | | | | | |
| | | | | | | | | | | | | | | | | |
| Student loans | | | | | | | | | | | 770 | | | | | |
| | | | | | | | | | | | | | | | | |
| Trade receivables | | | | | | | | | | | | | | | | |
| | | | | | | | | | | | | | | | | |
| Re-securitizations | | | 181 | | | | 951 | | | | | | | | | |
| | | | | | | | | | | | | | | | | |
| Other | | | | | | | | | | | | | | | | |
| | | | | | | | | | | | | | | | | |
| Total 31.12.131,2 | | | 1,505 | | | | 951 | | | | 20,693 | | | | 0 | |
| | | | | | | | | | | | | | | | | |
| | | | |
| Residential mortgages | | | 554 | | | | | | | | 7,578 | | | | | |
| | | | | | | | | | | | | | | | | |
| Commercial mortgages | | | | | | | | | | | 17,989 | | | | | |
| | | | | | | | | | | | | | | | | |
| Credit card receivables | | | | | | | | | | | | | | | | |
| | | | | | | | | | | | | | | | | |
| Leasing | | | | | | | | | | | | | | | | |
| | | | | | | | | | | | | | | | | |
| Loans to corporates or small and medium-sized enterprises | | | | | | | | | | | | | | | | |
| | | | | | | | | | | | | | | | | |
| Consumer loans | | | | | | | | | | | | | | | | |
| | | | | | | | | | | | | | | | | |
| Student loans | | | | | | | | | | | 908 | | | | | |
| | | | | | | | | | | | | | | | | |
| Trade receivables | | | | | | | | | | | | | | | | |
| | | | | | | | | | | | | | | | | |
| Re-securitizations | | | 1,779 | | | | 976 | | | | 2,604 | | | | | |
| | | | | | | | | | | | | | | | | |
| Other | | | | | | | | | | | 1,236 | | | | | |
| | | | | | | | | | | | | | | | | |
| Total 31.12.1212(Basel 2.5) | | | 2,333 | | | | 976 | | | | 30,315 | | | | 0 | |
| | | | | | | | | | | | | | | | | |
1 As per FINMA Circular “Market risk-Banks” only the higher of the net long or the net short securitization positions in the trading book are to be underpinned for the regulatory capital purposes. This interim relief is granted until 31 December 2013. As of 1 January 2014, both net long and net short positions require capital underpinning.2 In line with our disclosure principles, we disclose the UBS originated and sponsored deals only where the positions result in a RWA or capital deduction under Pillar 1.
Table 27: Correlation products subject to the comprehensive risk measure or the securitization framework for specific risk
This table outlines products in the correlation portfolio that we retained or purchased in the trading book, irrespective of our role in the securitization transaction. They are subject to either the comprehensive risk measure or the securitization framework for specific risk. Correlation products subject to the securitization framework are leveraged super senior positions. The values disclosed
are market values for cash positions, replacement values and notional values for derivative positions. Derivatives are split by positive replacement value and negative replacement value. The reduction in replacement values and notionals is a result of expiration or sales of positions in our correlation book.
| | | | | | | | | | | | | | | | | | | | | | | | |
| | Cash positions | | | Derivative positions | |
31.12.13 | | Assets | | | Liabilities | | | Assets | | | Liabilities | |
| CHF million | | Market value | | | Market value | | | Positive
replacement
value | | | Positive
replacement
value notionals | | | Negative
replacement
value | | | Negative
replacement
value notionals | |
| | | | | | | | | | | | | | | | | | | |
| Positions subject to comprehensive risk measure | | | 71 | | | | 615 | | | | 998 | | | | 30,645 | | | | 1,298 | | | | 20,532 | |
| | | | | | | | | | | | | | | | | | | | | | | | | |
| Positions subject to securitization framework1 | | | | | | | | | | | 88 | | | | 5,970 | | | | 1 | | | | 1,465 | |
| | | | | | | | | | | | | | | | | | | | | | | | | |
| | | | | | |
| 31.12.12 (Basel 2.5) | | | | | | | | | | | | | | | | | | |
| Positions subject to comprehensive risk measure | | | 191 | | | | 1,748 | | | | 4,518 | | | | 110,653 | | | | 4,949 | | | | 91,266 | |
| | | | | | | | | | | | | | | | | | | | | | | | | |
| Positions subject to securitization framework1 | | | | | | | | | | | 152 | | | | 12,316 | | | | 52 | | | | 20,810 | |
| | | | | | | | | | | | | | | | | | | | | | | | | |
1Includes leveraged super senior tranches.
599
Financial information
Supplemental disclosures required under Basel III Pillar 3 regulations
Table 28: Securitization positions and capital requirement for trading book positions subject to the securitization framework
This table outlines securitization positions we purchased or retained and the capital charge in the trading book subject to the securitization framework for specific market risk, irrespective of our role in the securitization transaction, broken down by risk weight bands and regulatory capital approach. The amounts disclosed for securitization positions are market values at the balance sheet date after eligible netting under Basel III. We disclose securitization positions which were previously deducted from capital under Basel 2.5 in the 1,250% risk-weighting band from 2013 onwards.
| | | | | | | | | | | | | | | | | | | | | | | | | | | | | | | | | | | | | | | | | | | | | | | | | | | | | | | | |
| | | | | 31.12.13 | | | | | 31.12.12 (Basel 2.5) | |
| | | | | Ratings-based approach | | | | | Supervisory formula approach | | | | | Ratings-based approach | | | | | Supervisory formula approach | |
| CHF million | | | | Net long | | | Net
short | | | Capital
require- ment | | | | | Net long | | | Net
short | | | Capital
require- ment | | | | | Net long | | | Net
short | | | Capital
require- ment | | | | | Net long | | | Net
short | | | Capital
require- ment | |
| over 0 – 20% | | | | | 367 | | | | 715 | 1 | | | 4 | | | | | | | | | | | | | | | | | | | | 449 | | | | 987 | 1 | | | 7 | | | | | | | | | | | | | | | |
| | | | | | | | | | | | | | | | | | | | | | | | | | | | | | | | | | | | | | | | | | | | | | | | | | | | | | | | | |
| over 20 – 35% | | | | | 16 | | | | | | | | 0 | | | | | | | | | | | | | | | | | | | | 293 | | | | | | | | 7 | | | | | | | | | | | | | | | |
| | | | | | | | | | | | | | | | | | | | | | | | | | | | | | | | | | | | | | | | | | | | | | | | | | | | | | | | | |
| over 35 – 50% | | | | | 37 | | | | | | | | 2 | | | | | | | | | | | | | | | | | | | | 135 | | | | | | | | 5 | | | | | | | | | | | | | | | |
| | | | | | | | | | | | | | | | | | | | | | | | | | | | | | | | | | | | | | | | | | | | | | | | | | | | | | | | | |
| over 50 – 75% | | | | | 32 | | | | | | | | 2 | | | | | | | | | | | | | | | | | | | | 38 | | | | | | | | 2 | | | | | | | | | | | | | | | |
| | | | | | | | | | | | | | | | | | | | | | | | | | | | | | | | | | | | | | | | | | | | | | | | | | | | | | | | | |
| over 75 – 100% | | | | | 38 | | | | | | | | 3 | | | | | | | | | | | | | | | | | | | | 93 | | | | | | | | 7 | | | | | | | | | | | | | | | |
| | | | | | | | | | | | | | | | | | | | | | | | | | | | | | | | | | | | | | | | | | | | | | | | | | | | | | | | | |
| over 100 – 250% | | | | | 10 | | | | | | | | 2 | | | | | | | | | | | | | | | | | | | | 20 | | | | | | | | 4 | | | | | | | | | | | | | | | |
| | | | | | | | | | | | | | | | | | | | | | | | | | | | | | | | | | | | | | | | | | | | | | | | | | | | | | | | | |
| over 250 – 1,249% | | | | | 1 | | | | | | | | | | | | | | | | | | | | | | | | | | | | 29 | | | | | | | | 12 | | | | | | | | | | | | | | | |
| | | | | | | | | | | | | | | | | | | | | | | | | | | | | | | | | | | | | | | | | | | | | | | | | | | | | | | | | |
| 1,250% | | | | | 109 | | | | | | | | 118 | | | | | | | | | | | | | | | | | | | | | | | | | | | | | | | | | | | | | | | | | | | |
| | | | | | | | | | | | | | | | | | | | | | | | | | | | | | | | | | | | | | | | | | | | | | | | | | | | | | | | | |
| Total2 | | | | | 611 | | | | 715 | | | | 132 | | | | | | 0 | | | | 0 | | | | 0 | | | | | | 1,057 | | | | 987 | | | | 45 | | | | | | 0 | | | | 0 | | | | 0 | |
| | | | | | | | | | | | | | | | | | | | | | | | | | | | | | | | | | | | | | | | | | | | | | | | | | | | | | | | | |
1 As per FINMA Circular “Market risk-Banks” only the higher of the net long or the net short securitization positions in the trading book are to be underpinned for the regulatory capital purposes. This interim relief is granted until 31 December 2013. After the transition period both net long and net short positions require capital underpinning. The amount disclosed under net short is for information only, i.e., a 0% riskweight was applied.2 Leveraged super senior tranches (subject to the securitization framework) are not included in this table, but disclosed in “Table 27: Correlation products subject to the comprehensive risk measure or the securitization framework for specific risk.”
Table 29: Capital requirement for securitization positions related to correlation products
This table outlines the capital requirement for securitization positions in the trading book for correlation products, including positions subject to comprehensive risk measure and positions related to leveraged super senior positions and certain re-securitized corporate credit exposures positions subject to the securitization framework. Our model does not distinguish between “default risk,” “migration risk” and “correlation risk.”
| | | | | | | | |
CHF million | | 31.12.13 | | | 31.12.12
(Basel 2.5) | |
| | | Capital
requirement | | | Capital
requirement | |
| Positions subject to comprehensive risk measure | | | 358 | | | | 714 | |
| | | | | | | | | |
| Positions subject to securitization framework1 | | | 23 | | | | 86 | |
| | | | | | | | | |
| Total | | | 381 | | | | 800 | |
| | | | | | | | | |
1 Leveraged super senior tranches.
600
Composition of capital
With the objective of mitigating the risk of inconsistent disclosure formats undermining market participants’ ability to compare capital adequacy of banks across jurisdictions, the Basel Committee on Banking Supervision and FINMA require banks to publish their capital positions according to common templates. The following tables provide the required information. In addition to the reconciliation provided in the following tables, an overview of the main
features of our regulatory capital instruments as well as the full terms and conditions of those capital instruments are published in the “Bondholder information” section of our Investor Relations website.
| | è | | Refer to “Bondholder information” at www.ubs.com/investors for more information on the capital instruments of UBS Group and UBS AG (Parent Bank) |
Table 30: Reconciliation of accounting balance sheet to balance sheet under the regulatory scope of consolidation
The table below provides a reconciliation of the IFRS balance sheet to the balance sheet according to the regulatory scope of consolidation. Lines in the balance sheet under the regulatory scope of consolidation are expanded and referenced where relevant to display all components that are used in “Table 31: Composition of capital.”
| | | | | | | | | | | | | | | | | | | | |
| | | According to the
financial statement | | | Effect of
deconsolidated
entities
for regulatory
consolidation | | | Effect of additional
consolidated
entities for
regulatory
consolidation | | | According to the
regulatory
consolidation
scope | | | References1 | |
| CHF million | | 31.12.13 | | | | | | | | | | | | | |
| Cash and balances with central banks | | | 80,879 | | | | (0) | | | | | | | | 80,879 | | | | | |
| | | | | | | | | | | | | | | | | | | | | |
| Due from banks | | | 17,170 | | | | (591) | | | | | | | | 16,579 | | | | | |
| | | | | | | | | | | | | | | | | | | | | |
| Cash collateral on securities borrowed | | | 27,496 | | | | | | | | | | | | 27,496 | | | | | |
| | | | | | | | | | | | | | | | | | | | | |
| Reverse repurchase agreements | | | 91,563 | | | | | | | | | | | | 91,563 | | | | | |
| | | | | | | | | | | | | | | | | | | | | |
| Trading portfolio assets | | | 122,848 | | | | (16,538) | | | | | | | | 106,310 | | | | | |
| | | | | | | | | | | | | | | | | | | | | |
| Positive replacement values | | | 245,835 | | | | 23 | | | | | | | | 245,858 | | | | | |
| | | | | | | | | | | | | | | | | | | | | |
| Cash collateral receivables on derivative instruments | | | 28,007 | | | | | | | | | | | | 28,007 | | | | | |
| | | | | | | | | | | | | | | | | | | | | |
| Financial assets designated at fair value | | | 7,364 | | | | | | | | | | | | 7,364 | | | | | |
| | | | | | | | | | | | | | | | | | | | | |
| Loans | | | 286,959 | | | | 198 | | | | | | | | 287,156 | | | | | |
| | | | | | | | | | | | | | | | | | | | | |
| Financial investments available-for-sale | | | 59,525 | | | | (58) | | | | | | | | 59,467 | | | | | |
| | | | | | | | | | | | | | | | | | | | | |
| Consolidated participations | | | 0 | | | | 205 | | | | | | | | 205 | | | | | |
| | | | | | | | | | | | | | | | | | | | | |
| Investments in associates | | | 842 | | | | | | | | | | | | 842 | | | | | |
| | | | | | | | | | | | | | | | | | | | | |
of which: goodwill | | | 344 | | | | | | | | | | | | 344 | | | | 4 | |
| | | | | | | | | | | | | | | | | | | | | |
| Property and equipment | | | 6,006 | | | | (87) | | | | | | | | 5,919 | | | | | |
| | | | | | | | | | | | | | | | | | | | | |
| Goodwill and intangible assets | | | 6,293 | | | | (0) | | | | | | | | 6,293 | | | | | |
| | | | | | | | | | | | | | | | | | | | | |
of which: goodwill | | | 5,842 | | | | | | | | | | | | 5,842 | | | | 4 | |
| | | | | | | | | | | | | | | | | | | | | |
of which: intangible assets | | | 451 | | | | | | | | | | | | 451 | | | | 5 | |
| | | | | | | | | | | | | | | | | | | | | |
| Deferred tax assets | | | 8,845 | | | | 9 | | | | | | | | 8,854 | | | | | |
| | | | | | | | | | | | | | | | | | | | | |
of which: deferred tax assets recognized for tax loss carry-forwards, less deferred tax liabilities, as applicable | | | 6,267 | | | | 2 | | | | | | | | 6,270 | | | | 9 | |
| | | | | | | | | | | | | | | | | | | | | |
of which: deferred tax assets on temporary differences, less deferred tax liabilities, as applicable | | | 2,577 | | | | 7 | | | | | | | | 2,584 | | | | | |
| | | | | | | | | | | | | | | | | | | | | |
| Other assets | | | 20,228 | | | | (176) | | | | 4 | | | | 20,056 | | | | | |
| | | | | | | | | | | | | | | | | | | | | |
of which: net defined benefit pension and other post-employment assets | | | 952 | | | | | | | | | | | | 952 | | | | 10 | |
| | | | | | | | | | | | | | | | | | | | | |
| Total assets | | | 1,009,860 | | | | (17,015) | | | | 4 | | | | 992,849 | | | | | |
| | | | | | | | | | | | | | | | | | | | | |
1 References link respective lines of this table to the respective reference numbers provided in the column “References” in “Table 31: Composition of capital.”
601
Financial information
Supplemental disclosures required under Basel III Pillar 3 regulations
Table 30: Reconciliation of accounting balance sheet to balance sheet under the regulatory scope of consolidation (continued)
| | | | | | | | | | | | | | | | | | | | |
| | | According to the
financial statement | | | Effect of deconsolidated
entities
for regulatory
consolidation | | | Effect of additional
consolidated
entities for
regulatory
consolidation | | | According to the
regulatory consolidation
scope | | | References1 | |
| CHF million | | 31.12.13 | | | | | | | | | | | | | |
| Due to banks | | | 12,862 | | | | (49) | | | | 1 | | | | 12,813 | | | | | |
| | | | | | | | | | | | | | | | | | | | | |
| Cash collateral on securities lent | | | 9,491 | | | | | | | | | | | | 9,491 | | | | | |
| | | | | | | | | | | | | | | | | | | | | |
| Repurchase agreements | | | 13,811 | | | | | | | | | | | | 13,811 | | | | | |
| | | | | | | | | | | | | | | | | | | | | |
| Trading portfolio liabilities | | | 26,609 | | | | (53) | | | | | | | | 26,556 | | | | | |
| | | | | | | | | | | | | | | | | | | | | |
| Negative replacement values | | | 239,953 | | | | 226 | | | | | | | | 240,179 | | | | | |
| | | | | | | | | | | | | | | | | | | | | |
| Cash collateral payables on derivative instruments | | | 49,138 | | | | | | | | | | | | 49,138 | | | | | |
| | | | | | | | | | | | | | | | | | | | | |
| Financial liabilities designated at fair value | | | 69,901 | | | | 38 | | | | | | | | 69,939 | | | | | |
| | | | | | | | | | | | | | | | | | | | | |
| Due to customers | | | 390,825 | | | | 205 | | | | 1 | | | | 391,031 | | | | | |
| | | | | | | | | | | | | | | | | | | | | |
| Debt issued | | | 81,586 | | | | (34) | | | | | | | | 81,552 | | | | | |
| | | | | | | | | | | | | | | | | | | | | |
of which: amount eligible for low-trigger loss-absorbing tier 2 capital2 | | | 4,710 | | | | | | | | | | | | 4,710 | | | | 7 | |
| | | | | | | | | | | | | | | | | | | | | |
of which: amount eligible for capital instruments subject to phase-out from additional tier 1 capital3 | | | 1,220 | | | | | | | | | | | | 1,220 | | | | 6 | |
| | | | | | | | | | | | | | | | | | | | | |
of which: amount eligible for capital instruments subject to phase-out from tier 2 capital4 | | | 2,971 | | | | | | | | | | | | 2,971 | | | | 8 | |
| | | | | | | | | | | | | | | | | | | | | |
| Provisions | | | 2,971 | | | | (5) | | | | | | | | 2,966 | | | | | |
| | | | | | | | | | | | | | | | | | | | | |
| Other liabilities | | | 62,777 | | | | (17,288) | | | | 2 | | | | 45,491 | | | | | |
| | | | | | | | | | | | | | | | | | | | | |
of which: amount eligible for high-trigger loss-absorbing tier 2 capital (Deferred Contingent Capital Plan (DCCP))5 | | | 385 | | | | | | | | | | | | 385 | | | | 7 | |
| | | | | | | | | | | | | | | | | | | | | |
| Total liabilities | | | 959,925 | | | | (16,959) | | | | 3 | | | | 942,969 | | | | | |
| | | | | | | | | | | | | | | | | | | | | |
| Share capital | | | 384 | | | | (2) | | | | 2 | | | | 384 | | | | 1 | |
| | | | | | | | | | | | | | | | | | | | | |
| Share premium account | | | 33,952 | | | | 1 | | | | (1) | | | | 33,952 | | | | 1 | |
| | | | | | | | | | | | | | | | | | | | | |
| Treasury shares | | | (1,031) | | | | | | | | | | | | (1,031) | | | | 3 | |
| | | | | | | | | | | | | | | | | | | | | |
| Contracts on UBS shares with liability treatment | | | (46) | | | | | | | | | | | | (46) | | | | 3 | |
| | | | | | | | | | | | | | | | | | | | | |
| Retained earnings | | | 24,475 | | | | (184) | | | | | | | | 24,291 | | | | 2 | |
| | | | | | | | | | | | | | | | | | | | | |
| Cumulative net income recognized directly in equity, net of tax | | | (9,733) | | | | 129 | | | | (1) | | | | (9,605) | | | | 3 | |
| | | | | | | | | | | | | | | | | | | | | |
of which: unrealized (gains)/losses from cash flow hedges | | | 1,463 | | | | 0 | | | | | | | | 1,463 | | | | 11 | |
| | | | | | | | | | | | | | | | | | | | | |
| Equity attributable to UBS shareholders | | | 48,002 | | | | (57) | | | | 1 | | | | 47,946 | | | | | |
| | | | | | | | | | | | | | | | | | | | | |
| Equity attributable to preferred noteholders and equity attributable to non-controlling interests | | | 1,934 | | | | 1 | | | | | | | | 1,935 | | | | | |
| | | | | | | | | | | | | | | | | | | | | |
of which: capital instruments subject to phase-out from additional tier 1 capital2 | | | 1,893 | | | | | | | | | | | | 1,893 | | | | 6 | |
| | | | | | | | | | | | | | | | | | | | | |
| Total equity | | | 49,936 | | | | (55) | | | | 1 | | | | 49,881 | | | | | |
| | | | | | | | | | | | | | | | | | | | | |
| Total liabilities and equity | | | 1,009,860 | | | | (17,015) | | | | 4 | | | | 992,849 | | | | | |
| | | | | | | | | | | | | | | | | | | | | |
1 References link respective lines of this table to the respective reference numbers provided in the column “References” in “Table 31: Composition of capital.” 2 Represent IFRS book value. 3 IFRS book value is CHF 1,221 million. 4 IFRS book value is CHF 5,109 million. 5 Refer to the “Compensation” section of this report for more information on the Deferred Contingent Capital Plan.
602
Table 31: Composition of capital
The table below provides the “Composition of capital” as defined by the Basel Committee on Banking Supervision and FINMA. Reference is made to items reconciling to the balance sheet under the regulatory scope of consolidation as disclosed in “Table 30: Reconciliation of accounting balance sheet to balance sheet under the regulatory scope of consolidation.” Where relevant, the effect of phase-in arrangements is disclosed as well.
| | è | | Refer to the “Capital management” section of this report for more information on phase-in arrangements |
| | | | | | | | | | | | | | | | | | |
| | | | | Numbers fully
applied | | | Effect of the
transition phase | | | | | References1 | |
| CHF million, except where indicated | | 31.12.13 | | | 31.12.13 | | | | | | |
| 1 | | Directly issued qualifying common share (and equivalent for non-joint stock companies)
capital plus related stock surplus | | | | | 34,336 | | | | | | | | | | 1 | |
| | | | | | | | | | | | | | | | | | | |
| 2 | | Retained earnings | | | | | 24,291 | | | | | | | | | | 2 | |
| | | | | | | | | | | | | | | | | | | |
| 3 | | Accumulated other comprehensive income (and other reserves) | | | | | (10,682 | ) | | | | | | | | | 3 | |
| | | | | | | | | | | | | | | | | | | |
| 4 | | Directly issued capital subject to phase-out from CET1 (only applicable to non-joint stock companies) | | | | | | | | | | | | | | | | |
| | | | | | | | | | | | | | | | | | | |
| 5 | | Common share capital issued by subsidiaries and held by third parties (amount allowed in group CET1) | | | | | | | | | | | | | | | | |
| | | | | | | | | | | | | | | | | | | |
| 6 | | Common equity tier 1 capital before regulatory adjustments | | | | | 47,946 | | | | | | | | | | | |
| | | | | | | | | | | | | | | | | | | |
| 7 | | Prudential valuation adjustments | | | | | (107 | ) | | | | | | | | | | |
| | | | | | | | | | | | | | | | | | | |
| 8 | | Goodwill net of tax, less hybrid capital, as applicable | | | | | (6,157 | )3 | | | 3,113 | | | | | | 4, 6 | |
| | | | | | | | | | | | | | | | | | | |
| 9 | | Intangible assets, net of tax | | | | | (435 | )3 | | | | | | | | | 5 | |
| | | | | | | | | | | | | | | | | | | |
| 10 | | Deferred tax assets recognized for tax loss carry-forwards, less deferred tax liabilities, as applicable2 | | | | | (6,665 | ) | | | 6,665 | | | | | | 9 | |
| | | | | | | | | | | | | | | | | | | |
| 11 | | Unrealized (gains)/losses from cash flow hedges, net of tax | | | | | (1,463 | ) | | | | | | | | | 11 | |
| | | | | | | | | | | | | | | | | | | |
| 12 | | Expected losses on advanced internal ratings-based portfolio less general provisions | | | | | (304 | ) | | | | | | | | | | |
| | | | | | | | | | | | | | | | | | | |
| 13 | | Securitization gain on sale | | | | | | | | | | | | | | | | |
| | | | | | | | | | | | | | | | | | | |
| 14 | | Own credit related to financial liabilities designated at fair value and replacement values, net of tax | | | | | 304 | | | | | | | | | | | |
| | | | | | | | | | | | | | | | | | | |
| 15 | | Defined benefit pension and post-employment assets IAS 19R, net of tax | | | | | (952 | ) | | | 952 | | | | | | 10 | |
| | | | | | | | | | | | | | | | | | | |
| 16 | | Compensation and own shares related capital components (not recognized in net profit) | | | | | (1,430 | ) | | | | | | | | | | |
| | | | | | | | | | | | | | | | | | | |
| 17 | | Reciprocal crossholdings in common equity | | | | | | | | | | | | | | | | |
| | | | | | | | | | | | | | | | | | | |
| 17a | | Holdings with a significant investments in the common stock | | | | | | | | | | | | | | | | |
| | | | | | | | | | | | | | | | | | | |
| 17b | | Consolidated investments (CET1 instruments) | | | | | | | | | | | | | | | | |
| | | | | | | | | | | | | | | | | | | |
| 18 | | Investments in the capital of banking, financial and insurance entities that are outside the scope of regulatory consolidation, net of eligible short positions, where the bank does not own more than 10% of the issued share capital (amount above 10% threshold) | | | | | | | | | | | | | | | | |
| | | | | | | | | | | | | | | | | | | |
| 19 | | Significant investments in the common stock of banking, financial and insurance entities that are outside the scope of regulatory consolidation, net of eligible short positions (amount above 10% threshold) | | | | | | | | | | | | | | | | |
| | | | | | | | | | | | | | | | | | | |
| 20 | | Mortgage servicing rights (amount above 10% threshold) | | | | | | | | | | | | | | | | |
| | | | | | | | | | | | | | | | | | | |
| 21 | | Deferred tax assets arising from temporary differences (amount above 10% threshold, net of related tax liability) | | | | | | | | | | | | | | | | |
| | | | | | | | | | | | | | | | | | | |
| 22 | | Amount exceeding the 15% threshold | | | | | | | | | | | | | | | | |
| | | | | | | | | | | | | | | | | | | |
| 23 | | of which: significant investments in the common stock of financials | | | | | | | | | | | | | | | | |
| | | | | | | | | | | | | | | | | | | |
| 24 | | of which: mortgage servicing rights | | | | | | | | | | | | | | | | |
| | | | | | | | | | | | | | | | | | | |
| 25 | | of which: deferred tax assets arising from temporary differences | | | | | | | | | | | | | | | | |
| | | | | | | | | | | | | | | | | | | |
| 26 | | Expected losses on equity investments treated according to the PD/LGD approach | | | | | | | | | | | | | | | | |
| | | | | | | | | | | | | | | | | | | |
| 26a | | Other adjustments relating to the application of an internationally accepted accounting standard | | | | | (325 | ) | | | | | | | | | | |
| | | | | | | | | | | | | | | | | | | |
| 26b | | Other deductions | | | | | (1,502 | ) | | | 2,540 | | | | | | 7 | |
| | | | | | | | | | | | | | | | | | | |
| 27 | | Regulatory adjustments applied to common equity tier 1 due to insufficient additional tier 1 and tier 2 to cover deductions | | | | | | | | | | | | | | | | |
| | | | | | | | | | | | | | | | | | | |
| 28 | | Total regulatory adjustments to common equity tier 1 | | | | | (19,037 | ) | | | 13,271 | | | | | | | |
| | | | | | | | | | | | | | | | | | | |
| 29 | | Common equity tier 1 capital (CET1) | | | | | 28,908 | | | | 13,271 | | | | | | | |
| | | | | | | | | | | | | | | | | | | |
| 30 | | Directly issued qualifying additional tier 1 instruments plus related stock surplus | | | | | | | | | | | | | | | | |
| | | | | | | | | | | | | | | | | | | |
| 31 | | of which: classified as equity under applicable accounting standards | | | | | | | | | | | | | | | | |
| | | | | | | | | | | | | | | | | | | |
| 32 | | of which: classified as liabilities under applicable accounting standards | | | | | | | | | | | | | | | | |
| | | | | | | | | | | | | | | | | | | |
| 33 | | Directly issued capital instruments subject to phase-out from additional tier 1 | | | | | | | | | 3,113 | | | | | | 6 | |
| | | | | | | | | | | | | | | | | | | |
| 34 | | Additional tier 1 instruments (and CET1 instruments not included in row 5) issued by subsidiaries and held by third parties (amount allowed in group additional tier 1) | | | | | | | | | | | | | | | | |
| | | | | | | | | | | | | | | | | | | |
| 35 | | of which: instruments issued by subsidiaries subject to phase-out | | | | | | | | | | | | | | | | |
| | | | | | | | | | | | | | | | | | | |
| 36 | | Additional tier 1 capital before regulatory adjustments | | | | | 0 | | | | 3,113 | | | | | | | |
| | | | | | | | | | | | | | | | | | | |
1 References link respective lines of this table to the respective reference numbers provided in the column “References” in “Table 30: Reconciliation of accounting balance sheet to balance sheet under the regulatory scope of consolidation.” 2 The CHF 6,665 million deferred tax assets that rely on future profitability reported in line 10 differ from the CHF 6,269 million deferred tax assets shown in the line “Deferred tax assets” in Table 30 because the latter figure is shown after the offset of deferred tax liabilities for cash flow hedge gains (CHF 363 million) and other temporary differences, which are adjusted out in line 11 and other lines of this table. 3 The CHF 6,157 million reported in line 8 includes DTL on goodwill of CHF 29 million. The CHF 435 million reported in line 9 includes DTL on intangibles of CHF 16 million.
603
Financial information
Supplemental disclosures required under Basel III Pillar 3 regulations
Table 31: Composition of capital (continued)
| | | | | | | | | | | | | | | | | | |
| | | | | Numbers fully
applied | | | Effect of the
transition phase | | | | | References1 | |
| CHF million, except where indicated | | 31.12.13 | | | 31.12.13 | | | | | | |
| 37 | | Investments in own additional tier 1 instruments | | | | | | | | | | | | | | | | |
| | | | | | | | | | | | | | | | | | | |
| 38 | | Reciprocal crossholdings in additional tier 1 instruments | | | | | | | | | | | | | | | | |
| | | | | | | | | | | | | | | | | | | |
| 38a | | Holdings with a significant investments in the common stock | | | | | | | | | | | | | | | | |
| | | | | | | | | | | | | | | | | | | |
| 38b | | Holdings in companies which are to be consolidated (additional tier 1 instruments) | | | | | | | | | | | | | | | | |
| | | | | | | | | | | | | | | | | | | |
| 39 | | Investments in the capital of banking, financial and insurance entities that are outside the scope of regulatory consolidation, net of eligible short positions, where the bank does not own more than 10% of the issued common share capital of the entity (amount above 10% threshold) | | | | | | | | | | | | | | | | |
| | | | | | | | | | | | | | | | | | | |
| 40 | | Significant investments in the capital of banking, financial and insurance entities that are outside the scope of regulatory consolidation (net of eligible short positions) | | | | | | | | | | | | | | | | |
| | | | | | | | | | | | | | | | | | | |
| 41 | | National specific regulatory adjustments | | | | | | | | | (3,113) | | | | | | | |
| | | | | | | | | | | | | | | | | | | |
| 42 | | Regulatory adjustments applied to additional tier 1 due to insufficient tier 2 to cover deductions | | | | | | | | | | | | | | | | |
| | | | | | | | | | | | | | | | | | | |
| | Tier 1 adjustments on impact of transitional arrangements | | | | | | | | | (3,113) | | | | | | | |
| | | | | | | | | | | | | | | | | | | |
| | of which: prudential valuation adjustment | | | | | | | | | | | | | | | | |
| | | | | | | | | | | | | | | | | | | |
| | of which: own CET1 instruments | | | | | | | | | | | | | | | | |
| | | | | | | | | | | | | | | | | | | |
| | of which: goodwill net of tax, offset against hybrid capital | | | | | | | | | (3,113) | | | | | | 6 | |
| | | | | | | | | | | | | | | | | | | |
| | of which: other intangible assets (net of related tax liabilities) | | | | | | | | | | | | | | | | |
| | | | | | | | | | | | | | | | | | | |
| | of which: gains from the calculation of cash flow hedges | | | | | | | | | | | | | | | | |
| | | | | | | | | | | | | | | | | | | |
| | of which: IRB shortfall of provisions to expected losses | | | | | | | | | | | | | | | | |
| | | | | | | | | | | | | | | | | | | |
| | of which: gains on sales related to securitization transactions | | | | | | | | | | | | | | | | |
| | | | | | | | | | | | | | | | | | | |
| | of which: gains/losses in connection with own credit risk | | | | | | | | | | | | | | | | |
| | | | | | | | | | | | | | | | | | | |
| | of which: investments | | | | | | | | | | | | | | | | |
| | | | | | | | | | | | | | | | | | | |
| | of which: expected loss amount for equity exposures under the PD/LG approach and under the simple risk-weighting method | | | | | | | | | | | | | | | | |
| | | | | | | | | | | | | | | | | | | |
| | of which: mortgage servicing rights | | | | | | | | | | | | | | | | |
| | | | | | | | | | | | | | | | | | | |
| 42a | | Excess of the adjustments which are allocated to the CET1 capital | | | | | | | | | | | | | | | | |
| | | | | | | | | | | | | | | | | | | |
| 43 | | Total regulatory adjustments to additional tier 1 capital | | | | | 0 | | | | (3,113) | | | | | | | |
| | | | | | | | | | | | | | | | | | | |
| 44 | | Additional tier 1 capital (AT1) | | | | | 0 | | | | 0 | | | | | | | |
| | | | | | | | | | | | | | | | | | | |
| 45 | | Tier 1 capital (T1 = CET1 + AT1) | | | | | 28,908 | | | | 13,271 | | | | | | | |
| | | | | | | | | | | | | | | | | | | |
| 46 | | Directly issued qualifying tier 2 instruments plus related stock surplus | | | | | 5,665 | | | | | | | | | | 7 | 2 |
| | | | | | | | | | | | | | | | | | | |
| 47 | | Directly issued capital instruments subject to phase-out from tier 2 | | | | | | | | | 2,971 | | | | | | 8 | |
| | | | | | | | | | | | | | | | | | | |
| 48 | | Tier 2 instruments (and CET1 and additional tier 1 instruments not included in rows 5 or 34) issued by subsidiaries and held by third parties (amount allowed in group tier 2) | | | | | | | | | | | | | | | | |
| | | | | | | | | | | | | | | | | | | |
| 49 | | of which: instruments issued by subsidiaries subject to phase-out | | | | | | | | | | | | | | | | |
| | | | | | | | | | | | | | | | | | | |
| 50 | | Provisions | | | | | | | | | | | | | | | | |
| | | | | | | | | | | | | | | | | | | |
| 51 | | Tier 2 capital before regulatory adjustments | | | | | 5,665 | | | | 2,971 | | | | | | | |
| | | | | | | | | | | | | | | | | | | |
| 52 | | Investments in own tier 2 instruments | | | | | | | | | | | | | | | | |
| | | | | | | | | | | | | | | | | | | |
| 53 | | Reciprocal crossholdings in tier 2 instruments | | | | | | | | | | | | | | | | |
| | | | | | | | | | | | | | | | | | | |
| 53a | | Investments with a significant influence (tier 2 instruments) | | | | | | | | | | | | | | | | |
| | | | | | | | | | | | | | | | | | | |
| 53b | | Investments to be consolidated (tier 2 Instrumente) | | | | | | | | | | | | | | | | |
| | | | | | | | | | | | | | | | | | | |
| 54 | | Investments in the capital of banking, financial and insurance entities that are outside the scope of regulatory consolidation, net of eligible short positions, where the bank does not own more than 10% of the issued common share capital of the entity (amount above the 10% threshold) | | | | | | | | | | | | | | | | |
| | | | | | | | | | | | | | | | | | | |
| 55 | | Significant investments in the capital banking, financial and insurance entities that are outside the scope of regulatory consolidation (net of eligible short positions) | | | | | | | | | | | | | | | | |
| | | | | | | | | | | | | | | | | | | |
| 56 | | National specific regulatory adjustments | | | | | | | | | | | | | | | | |
| | | | | | | | | | | | | | | | | | | |
| | Additional deductions on the impact of transitional arrangements (further half-half deduction) | | | | | | | | | | | | | | | | |
| | | | | | | | | | | | | | | | | | | |
| 56a | | Excess of the adjustments which are allocated to the additional tier 1 capital | | | | | | | | | | | | | | | | |
| | | | | | | | | | | | | | | | | | | |
| 57 | | Total regulatory adjustments to tier 2 capital | | | | | 0 | | | | 0 | | | | | | | |
| | | | | | | | | | | | | | | | | | | |
| 58 | | Tier 2 capital (T2) | | | | | 5,665 | | | | 2,971 | | | | | | | |
| | | | | | | | | | | | | | | | | | | |
| | of which: high-trigger loss-absorbing capital | | | | | 955 | | | | | | | | | | 7 | |
| | | | | | | | | | | | | | | | | | | |
| | of which: low-trigger loss-absorbing capital | | | | | 4,710 | | | | | | | | | | 7 | |
| | | | | | | | | | | | | | | | | | | |
| 59 | | Total capital (TC = T1 + T2) | | | | | 34,573 | | | | 16,242 | | | | | | | |
| | | | | | | | | | | | | | | | | | | |
1 References link respective lines of this table to the respective reference numbers provided in the column “References” in “Table 30: Reconciliation of accounting balance sheet to balance sheet under the regulatory scope of consolidation.” 2 The CHF 5,665 million reported in line 46 includes the following positions: CHF 4,710 million low-trigger loss-absorbing tier 2 capital recognized in the line “Debt issued” in table 30, CHF 385 million DCCP recognized in the line “Other liabilities” in table 30 and CHF 570 million recognized in DCCP-related charge for regulatory capital purpose in line 26b of this table.
604
Table 31: Composition of capital (continued)
| | | | | | | | | | | | | | | | |
| | | | | Numbers fully
applied | | | Effect of the
transition phase | | | | | References1 |
| CHF million, except where indicated | | 31.12.13 | | | 31.12.13 | | | | | |
| | Amount with risk-weight pursuant the transitional arrangement (phase-in) | | | | | | | | | 3,404 | | | | | |
| | | | | | | | | | | | | | | | | |
| | of which: defined benefit pension fund assets | | | | | | | | | 3,460 | | | | | |
| | | | | | | | | | | | | | | | | |
| | of which: deferred tax assets on temporary differences | | | | | | | | | (56) | | | | | |
| | | | | | | | | | | | | | | | | |
| 60 | | Total risk-weighted assets | | | | | 225,153 | | | | 3,404 | | | | | |
| | | | | | | | | | | | | | | | | |
| | Capital ratios and buffers | | | | | | | | | | | | | | |
| | | | | | | | | | | | | | | | | |
| 61 | | Common equity tier 1 (as a percentage of risk-weighted assets) | | | | | 12.8 | | | | | | | | | |
| | | | | | | | | | | | | | | | | |
| 62 | | Tier 1 (Pos 29 as a percentage of risk-weighted assets) | | | | | 12.8 | | | | | | | | | |
| | | | | | | | | | | | | | | | | |
| 63 | | Total capital (pos 45 as a percentage of risk-weighted assets) | | | | | 15.4 | | | | | | | | | |
| | | | | | | | | | | | | | | | | |
| 64 | | Institution specific buffer requirement (minimum CET1 requirement plus capital conservation and countercyclical buffer requirements plus G-SIB buffer requirement, expressed as a percentage of risk-weighted assets) | | | | | 7.1 | | | | | | | | | |
| | | | | | | | | | | | | | | | | |
| 65 | | of which: capital conservation buffer | | | | | 3.6 | | | | | | | | | |
| | | | | | | | | | | | | | | | | |
| 66 | | of which: bank-specific countercyclical buffer requirement | | | | | 0.1 | | | | | | | | | |
| | | | | | | | | | | | | | | | | |
| 67 | | of which: G-SIB buffer requirement | | | | | | | | | | | | | | |
| | | | | | | | | | | | | | | | | |
| 68 | | Common equity tier 1 available to meet buffers (as a percentage of risk-weighted assets) | | | | | 18.5 | | | | | | | | | |
| | | | | | | | | | | | | | | | | |
| 68a | | Common equity tier 1 requirement including countercyclical buffer according to FINMA RS 11/2 | | | | | 7.1 | | | | | | | | | |
| | | | | | | | | | | | | | | | | |
| 68b | | Available common equity tier 1 (in percentage of risk-weighted assets) | | | | | 18.5 | | | | | | | | | |
| | | | | | | | | | | | | | | | | |
| 68c | | Tier 1 requirement including countercyclical buffer according to FINMA RS 11/2 | | | | | 7.1 | | | | | | | | | |
| | | | | | | | | | | | | | | | | |
| 68d | | Available tier 1 (in percentage of risk-weighted assets) | | | | | 18.5 | | | | | | | | | |
| | | | | | | | | | | | | | | | | |
| 68e | | Total capital requirement including countercyclical buffer according to FINMA RS 11/2 | | | | | 8.6 | | | | | | | | | |
| | | | | | | | | | | | | | | | | |
| 68f | | Available total capital (in percentage of risk-weighted assets) | | | | | 22.2 | | | | | | | | | |
| | | | | | | | | | | | | | | | | |
| 72 | | Non significant investments in the capital of other financials | | | | | 1,591 | | | | | | | | | |
| | | | | | | | | | | | | | | | | |
| 73 | | Significant investments in the common stock of financials | | | | | 697 | | | | | | | | | |
| | | | | | | | | | | | | | | | | |
| 74 | | Mortgage servicing rights (net of related tax liability) | | | | | | | | | | | | | | |
| | | | | | | | | | | | | | | | | |
| 75 | | Deferred tax assets arising from temporary differences (net of related tax liability) | | | | | 2,565 | | | | | | | | | |
| | | | | | | | | | | | | | | | | |
| | Applicable caps on the inclusion of provisions in tier 2 | | | | | | | | | | | | | | |
| | | | | | | | | | | | | | | | | |
| 76 | | Provisions eligible for inclusion in tier 2 in respect of exposures subject to standardised approach (prior to application of cap) | | | | | | | | | | | | | | |
| | | | | | | | | | | | | | | | | |
| 77 | | Cap on inclusion of provisions in tier 2 under standardized approach | | | | | | | | | | | | | | |
| | | | | | | | | | | | | | | | | |
| 78 | | Provisions eligible for inclusion in tier 2 in respect of exposures subject to internal ratings-based approach (prior to application of cap) | | | | | | | | | | | | | | |
| | | | | | | | | | | | | | | | | |
| 79 | | Cap for inclusion of provisions in tier 2 under internal ratings-based approach | | | | | | | | | | | | | | |
| | | | | | | | | | | | | | | | | |
1 References link respective lines of this table to the respective reference numbers provided in the column “References” in “Table 30: Reconciliation of accounting balance sheet to balance sheet under the regulatory scope of consolidation.”
605
Financial information
Supplemental disclosures required under Basel III Pillar 3 regulations
G-SIBs indicator
For the financial year ended 2013, all banks that qualify as global systemically important banks (G-SIBs) are required to disclose, as defined by the Basel Committee on Banking Supervision, the 12 indicators for assessing the systemic importance of G-SIBs. UBS, being classified as a G-SIB in 2013, is required to comply with these additional disclosure requirements. These 12 indicators fall under the five categories of size, cross-jurisdictional activity,
interconnectedness, substitutability/financial institution infrastructure and complexity, which are weighted equally and will be used for the G-SIB score calculation that drives the G-SIB surcharge to the CET1 capital ratio of 1.5%.
| | è | | Refer to “SEC filings and other disclosures” at www.ubs.com/ investors for more information on G-SIBs indicators |
606
Appendix
Abbreviations frequently used in our financial reports
| | |
| A | | |
ABS | | asset-backed securities |
AGM | | annual general meeting of shareholders |
AMA | | advanced measurement approach |
AoA | | articles of association |
APAC | | Asia Pacific |
ARS | | auction rate securities |
| |
| B | | |
BCBS | | Basel Committee on Banking Supervision |
BIS | | Bank for International Settlements |
bps | | basis points |
| |
| C | | |
CC | | Corporate Center |
CCF | | credit conversion factors |
CCP | | central counterparty |
CDO | | collateralized debt obligations |
CDR | | constant default rate |
CDS | | credit default swaps |
CET1 | | common equity tier 1 |
CHF | | Swiss franc |
CLN | | credit-linked notes |
CLO | | collateralized loan obligations |
CMBS | | commercial mortgage-backed securities |
CVA | | credit valuation adjustments |
| |
| D | | |
DBO | | defined benefit obligation |
DCCP | | deferred contingent capital plan |
DVA | | debit valuation adjustments |
| |
| E | | |
EAD | | exposure at default |
ECB | | European Central Bank |
EEA | | European Economic Area |
EMEA | | Europe, Middle East and Africa |
EPS | | earnings per share |
ETD | | exchange-traded derivatives |
ETF | | exchange-traded funds |
EU | | European Union |
EUR | | euro |
EURIBOR | | Euro Interbank Offered Rate |
| | |
| | |
F | | |
FCA | | UK Financial Conduct Authority |
FINMA | | Swiss Financial Market Supervisory Authority |
FRA | | forward rate agreements |
FTD | | first to default swaps |
FTP | | funds transfer price |
FX | | foreign exchange |
| |
| G | | |
GAAP | | generally accepted accounting principles |
GBP | | British pound |
G-SIB | | global systemically important banks |
| |
| I | | |
IASB | | International Accounting Standards Board |
IFRS | | International Financial Reporting Standards |
IRB | | internal ratings-based |
IRC | | incremental risk charge |
| |
| K | | |
KPI | | key performance indicator |
| |
| L | | |
LAC | | loss-absorbing capital |
LAS | | liquidity adjusted stress |
LCR | | Liquidity Coverage Ratio |
LGD | | loss given default |
LIBOR | | London Interbank Offered Rate |
LRD | | leverage ratio denominator |
LTV | | loan-to-value |
| |
| M | | |
MTN | | medium-term notes |
| |
| N | | |
NAV | | net asset value |
NRV | | negative replacement values |
NSFR | | Net Stable Funding Ratio |
| | |
| | |
O | | |
OECD | | Organization for Economic Cooperation and Development |
OCI | | other comprehensive income |
OTC | | over-the-counter |
| |
| P | | |
PD | �� | probability of default |
PRA | | UK Prudential Regulation Authority |
PRV | | positive replacement values |
| |
| R | | |
RBC | | risk-based capital |
RLN | | reference-linked notes |
RMBS | | residential mortgage-backed securities |
RoAE | | return on attributed equity |
RoE | | return on equity |
RV | | replacement values |
RWA | | risk-weighted assets |
| |
| S | | |
SE | | structured entity |
SEC | | US Securities and Exchange Commission |
SNB | | Swiss National Bank |
SRB | | systemically relevant banks |
| |
| U | | |
UK | | United Kingdom |
US | | United States of America |
USD | | US dollar |
| |
| V | | |
VaR | | value-at-risk |
607
Appendix
Information sources
Reporting publications
Annual publications: Annual report (SAP no. 80531): Published in both English and German, this single volume report provides a description of our Group strategy and performance, the strategy and performance of the business divisions and the Corporate Center, risk, treasury and capital management, corporate governance, responsibility and senior management compensation (including compensation to the Board of Directors and the Group Executive Board members), and financial information, including the financial statements.Review (SAP no. 80530): The booklet contains key information on our strategy and financials. It is published in English, German, French and Italian.Compensation Report (SAP no. 82307): The report discusses our compensation framework and provides information on compensation to the Board of Directors and the Group Executive Board members. It is published in English and German.
Quarterly publications: Letter to shareholders: The letter provides a quarterly update from executive management on our strategy and performance. The letter is published in English, German, French and Italian.Financial report (SAP no. 80834): The quarterly financial report provides an update on our strategy and performance for the respective quarter. It is published in English.
How to order reports: The annual and quarterly publications are available in PDF format on the internet atwww.ubs.com/investorsin the “Financial information” section. Printed copies can be ordered from the same website in the “Investor services” section, which can be accessed via the link on the left-hand side of the screen. Alternatively, they can be ordered by quoting the SAP number and the language preference where applicable, from UBS AG, F4UK–AUL, P.O. Box, CH-8098 Zurich, Switzerland.
Other information
Website: The “Investor Relations” website atwww.ubs.com/investors provides the following information on UBS: news releases, financial information (including results-related filings with the US Securities and Exchange Commission), corporate information, including UBS share price charts and data and dividend information, the UBS corporate calendar and presentations by management for investors and financial analysts. Information on the internet is available in English and German.
Result presentations: Our quarterly results presentations are webcast live. A playback of most presentations is downloadable atwww.ubs.com/presentations.
Messaging service/UBS news alert: On thewww.ubs.com/newsalerts website, it is possible to subscribe to receive news alerts about UBS via SMS or e-mail. Messages are sent in English, German, French or Italian and it is possible to state theme preferences for the alerts received.
Form 20-F and other submissions to the US Securities and Exchange Commission: We file periodic reports and submit other information about UBS to the US Securities and Exchange Commission (SEC). Principal among these filings is the annual report on Form 20-F, filed pursuant to the US Securities Exchange Act of 1934. The filing of Form 20-F is structured as a “wraparound” document. Most sections of the filing can be satisfied by referring to parts of the annual report. However, there is a small amount of additional information in Form 20-F which is not presented elsewhere, and is particularly targeted at readers in the US. Readers are encouraged to refer to this additional disclosure. Any document that we file with the SEC is available to read and copy on the SEC’s website,www.sec.gov, or at the SEC’s public reference room at 100 F Street, N.E., Room 1580, Washington, DC, 20549. Please call the SEC by dialing +1-800-SEC-0330 for further information on the operation of its public reference room. Please visitwww.ubs.com/investors for more information.
608
| | | | |
| | Cautionary Statement Regarding Forward-Looking Statements | This report contains statements that constitute “forward-looking statements,” including but not limited to management’s outlook for UBS’s financial performance and statements relating to the anticipated effect of transactions and strategic initiatives on UBS’s business and future development. While these forward-looking statements represent UBS’s judgments and expectations concerning the matters described, a number of risks, uncertainties and other important factors could cause actual developments and results to differ materially from UBS’s expectations. These factors include, but are not limited to: (i) the degree to which UBS is successful in executing its announced strategic plans, including its efficiency initiatives and its planned further reduction in Basel III risk-weighted assets (RWA); (ii) developments in the markets in which UBS operates or to which it is exposed, including movements in securities prices or liquidity, credit spreads, currency exchange rates and interest rates and the effect of economic conditions and market developments on the financial position or creditworthiness of UBS’s clients and counterparties; (iii) changes in the availability of capital and funding, including any changes in UBS’s credit spreads and ratings, or arising from requirements for bail-in debt or loss-absorbing capital; (iv) changes in or the implementation of financial legislation and regulation in Switzerland, the US, the UK and other financial centers that may impose more stringent capital (including leverage ratio), liquidity and funding requirements, incremental tax requirements, additional levies, limitations on permitted activities, constraints on remuneration or other measures; (v) uncertainty as to when and to what degree the Swiss Financial Market Supervisory Authority (FINMA) will approve reductions to the incremental RWA resulting from the supplemental operational risk capital analysis mutually agreed to by UBS and FINMA effective 31 December 2013, or will approve a limited reduction of capital requirements due to measures to reduce resolvability risk; (vi) possible changes to the legal entity structure or booking model of UBS Group in response to enacted, proposed or future legal and regulatory requirements, including capital requirements, the proposal to require non-US banks to establish intermediate holding companies for their US operations, resolvability requirements and the pending Swiss parliamentary proposals and proposals in other countries for mandatory structural reform of banks; (vii) changes in UBS’s competitive position, including whether differences in regulatory capital and other requirements among the major financial centers will adversely affect UBS’s ability to compete in certain lines of business; (viii) the liability to which UBS may be exposed, or possible constraints or sanctions that regulatory authorities might impose on UBS, due to litigation, contractual claims and regulatory investigations; (ix) the effects on UBS’s cross-border banking business of tax or regulatory developments and of possible changes in UBS’s policies and practices relating to this business; (x) UBS’s ability to retain and attract the employees necessary to generate revenues and to manage, support and control its businesses, which may be affected by competitive factors including differences in compensation practices; (xi) changes in accounting or tax standards or policies, and determinations or interpretations affecting the recognition of gain or loss, the valuation of goodwill, the recognition of deferred tax assets and other matters; (xii) limitations on the effectiveness of UBS’s internal processes for risk management, risk control, measurement and modeling, and of financial models generally; (xiii) whether UBS will be successful in keeping pace with competitors in updating its technology, particularly in trading businesses; (xiv) the occurrence of operational failures, such as fraud, unauthorized trading and systems failures; and (xv) the effect that these or other factors or unanticipated events may have on our reputation and the additional consequences that this may have on our business and performance. The sequence in which the factors above are presented is not indicative of their likelihood of occurrence or the potential magnitude of their consequences. Our business and financial performance could be affected by other factors identified in our past and future filings and reports, including those filed with the SEC. More detailed information about those factors is set forth in documents furnished by UBS and filings made by UBS with the SEC, including UBS’s Annual Report on Form 20-F for the year ended 31 December 2013. UBS is not under any obligation to (and expressly disclaims any obligation to) update or alter its forward-looking statements, whether as a result of new information, future events, or otherwise. Rounding | Numbers presented throughout this report may not add up precisely to the totals provided in the tables and text. Percentages and percent changes are calculated based on rounded figures displayed in the tables and text and may not precisely reflect the percentages and percent changes that would be derived based on figures that are not rounded. Tables | Within tables, blank fields generally indicate that the field is not applicable or not meaningful, or that information is not available as of the relevant date or for the relevant period. Zero values generally indicate that the respective figure is zero on an actual or rounded basis. | | |
| | | | |
609
UBS AG
P.O. Box, CH-8098 Zurich
P.O. Box, CH-4002 Basel
www.ubs.com