UNITED STATES
SECURITIES AND EXCHANGE COMMISSION
Washington, D.C. 20549
FORM 20-F
(Mark One)
| | |
o | | REGISTRATION STATEMENT PURSUANT TO SECTION 12(b) OR (g) OF THE SECURITIES EXCHANGE ACT OF 1934 |
OR
| | |
☑ | | ANNUAL REPORT PURSUANT TO SECTION 13 OR 15(d) OF THE SECURITIES EXCHANGE ACT OF 1934 |
For the fiscal year ended December 31, 2015
OR
| | |
o | | TRANSITION REPORT PURSUANT TO SECTION 13 OR 15(d) OF THE SECURITIES EXCHANGE ACT OF 1934 |
For the transition period from to .
OR
| | |
o | | SHELL COMPANY REPORT PURSUANT TO SECTION 13 OR 15(d) OF THE SECURITIES EXCHANGE ACT OF 1934 |
UBS Group AG
Commission file number: 1-36764
UBS AG
Commission file number: 1-15060
(Exact Name of Registrants as Specified in Their Respective Charters)
Switzerland
(Jurisdiction of Incorporation or Organization)
UBS Group AG
Bahnhofstrasse 45, CH-8001 Zurich, Switzerland
(Address of Principal Executive Office)
UBS AG
Bahnhofstrasse 45, CH-8001 Zurich, Switzerland and
Aeschenvorstadt 1, CH-4051 Basel, Switzerland
(Address of Principal Executive Offices)
David Kelly
677 Washington Boulevard
Stamford, CT 06901
Telephone: (203) 719-3000
(Name, Telephone, E-mail and/or Facsimile number and Address of Company Contact Person)
Securities registered or to be registered pursuant to Section 12(b) of the Act:
Please see page 3.
Securities registered or to be registered pursuant to Section 12(g) of the Act:
Please see page 5.
Securities for which there is a reporting obligation pursuant to Section 15(d) of the Act:
Please see page 5.
Indicate the number of outstanding shares of each of each issuer’s classes of capital or common stock as of 31 December 2015:
UBS Group AG
Ordinary shares, par value CHF 0.10 per share: 3,849,731,535 ordinary shares
(including 98,706,275 treasury shares)
UBS AG
Ordinary shares, par value CHF 0.10 per share: 3,858,408,466 ordinary shares
(none of which are treasury shares)
Indicate by check mark if the registrants are well-known seasoned issuers, as defined in Rule 405 of the Securities Act.
UBS Group AG |
Yes o | | No ☑ |
UBS AG |
Yes ☐ | | No ☑ |
If this report is an annual or transition report, indicate by check mark if the registrants are not required to file reports pursuant to Section 13 or 15(d) of the Securities Exchange Act of 1934.
Note — Checking the box above will not relieve any registrant required to file reports pursuant to Section 13 or 15(d) of the Securities Exchange Act of 1934 from their obligations under those Sections.
Indicate by check mark whether the Registrants (1) have filed all reports required to be filed by Section 13 or 15(d) of the Securities Exchange Act of 1934 during the preceding 12 months (or for such shorter period that the Registrants were required to file such reports) and (2) have been subject to such filing requirements for the past 90 days.
Indicate by check mark whether the registrants have submitted electronically and posted on their corporate Web site, if any, every Interactive Data File required to be submitted and posted pursuant to Rule 205 of Regulation S-T (§ 232.405 of this chapter) during the preceding 12 months (or for such shorter period that the registrants were required to submit and post such files).
����
Indicate by check mark whether the registrant is a large accelerated filer, an accelerated filer, or a non-accelerated filer. See definition of “accelerated filer and large accelerated filer” in Rule 12b-2 of the Exchange Act. (Check One):
| | UBS Group AG | | |
Large accelerated filer ☑ | | Accelerated filer o | | Non-accelerated filer ☐ |
| | UBS AG | | |
Large accelerated filer ☐ | | Accelerated filer ☐ | | Non-accelerated filer ☑ |
Indicate by check mark which basis of accounting the registrants have used to prepare the financial statements included in this filing.
| | | | |
U.S. GAAP o | | International Financial Reporting Standards as issued by the International Accounting Standards Board ☑ | | Other o |
If “Other” has been checked in response to the previous question, indicate by check mark which financial statement item the registrants have elected to follow.
If this is an annual report, indicate by check mark whether the registrants are shell companies (as defined in Rule 12b-2 of the Exchange Act)
Securities registered or to be registered pursuant to Section 12(b) of the Act:
UBS Group AG
| |
| Name of each exchange on |
Title of each class | which registered |
Ordinary Shares (par value of CHF 0.10 each) | New York Stock Exchange |
UBS AG
| |
| Name of each exchange on |
Title of each class | which registered |
$300,000,000 Floating Rate Noncumulative Trust Preferred Securities | New York Stock Exchange |
| | |
$300,000,000 Floating Rate Noncumulative Company Preferred Securities | New York Stock Exchange* |
| | |
$1,000,000,000 6.243% Noncumulative Trust Preferred Securities | New York Stock Exchange |
| | |
$1,000,000,000 6.243% Noncumulative Company Preferred Securities | New York Stock Exchange* |
| | |
Subordinated Guarantee of UBS AG with respect to each of the
Noncumulative Company Preferred Securities above | New York Stock Exchange* |
| | |
E-TRACS Linked to the UBS Bloomberg CMCI Food Total Return due April 5, 2038 | NYSE Arca |
| | |
E-TRACS Linked to the UBS Bloomberg CMCI Agriculture Total Return due April 5, 2038 | NYSE Arca |
| | |
E-TRACS Linked to the UBS Bloomberg CMCI Energy Total Return due April 5, 2038 | NYSE Arca |
| | |
E-TRACS Linked to the UBS Bloomberg CMCI Total Return due April 5, 2038 | NYSE Arca |
| |
E-TRACS Linked to the UBS Bloomberg CMCI Total Return Series B due April 5, 2038 | NYSE Arca |
| | |
E-TRACS Linked to the UBS Bloomberg CMCI Gold Total Return due April 5, 2038 | NYSE Arca |
| | |
E-TRACS Linked to the UBS Bloomberg CMCI Industrial Metals Total Return due April 5, 2038 | NYSE Arca |
| | |
E-TRACS Linked to the UBS Bloomberg CMCI Livestock Total Return due April 5, 2038 | NYSE Arca |
| | |
E-TRACS Linked to the UBS Bloomberg CMCI Silver Total Return due April 5, 2038 | NYSE Arca |
E-TRACS Long Platinum Linked to the UBS Bloomberg CMCI Platinum Total Return due May 14, 2018 | NYSE Arca |
| | |
E-TRACS Linked to the S&P 500 Gold Hedged Index due January 30, 2040 | NYSE Arca |
| |
E-TRACS Linked to the Bloomberg Commodity Index Total ReturnSM due October 31, 2039 | NYSE Arca |
E-TRACS Linked to the Alerian MLP Infrastructure Index due April 2, 2040 | NYSE Arca |
E-TRACS Linked to the Alerian MLP Infrastructure Index Series B due April 2, 2040 | NYSE Arca |
1xMonthly Short E-TRACS Linked to the Alerian MLP Infrastructure Total Return Index due October 1, 2040 | NYSE Arca |
E-TRACS Linked to the Alerian Natural Gas MLP Index due July 9, 2040 | NYSE Arca |
E-TRACS Linked to the Wells Fargo® MLP Index due October 29, 2040 | NYSE Arca |
E-TRACS Daily Long-Short VIX ETN due November 30, 2040 | NYSE Arca |
E-TRACS Linked to the Wells Fargo® Business Development Company Index due April 26, 2041 | NYSE Arca |
E-TRACS Linked to the Wells Fargo® Business Development Company Index Series B due April 26, 2041 | NYSE Arca |
2×Leveraged Long E-TRACS Linked to the Wells Fargo® Business Development Company Index due May 24, 2041 | NYSE Arca |
2×Leveraged Long E-TRACS Linked to the Wells Fargo® Business Development Company Index Series B due May 24, 2041 | NYSE Arca |
ETRACS Monthly Pay 2xLeveraged Dow Jones International Real Estate ETN due March 19, 2042 | NYSE Arca |
ETRACS Monthly Pay 2xLeveraged Dow Jones Select Dividend Index ETN due May 22, 2042 | NYSE Arca |
ETRACS Monthly Pay 2xLeveraged S&P Dividend ETN due May 22, 2042 | NYSE Arca |
ETRACS Alerian MLP Index ETN due July 18, 2042 | NYSE Arca |
ETRACS Alerian MLP Index ETN Series B due July 18, 2042 | NYSE Arca |
ETRACS Monthly Pay 2xLeveraged Mortgage REIT ETN due October 16, 2042 | NYSE Arca |
ETRACS Monthly Pay 2xLeveraged Mortgage REIT ETN Series B due October 16, 2042 | NYSE Arca |
ETRACS Diversified High Income ETN due September 18, 2043 | NYSE Arca |
ETRACS Monthly Pay 2xLeveraged Diversified High Income ETN due November 12, 2043 | NYSE Arca |
ETRACS Monthly Pay 2xLeveraged Closed-End Fund ETN due December 10, 2043 | NYSE Arca |
ETRACS Monthly Reset 2xLeveraged S&P 500® Total Return ETN due March 25, 2044 | NYSE Arca |
ETRACS Wells Fargo MLP Ex-Energy ETN due June 10, 2044 | NYSE Arca |
ETRACS Monthly Pay 2xLeveraged Wells Fargo MLP Ex-Energy ETN due June 24, 2044 | NYSE Arca |
ETRACS Monthly Pay 2xLeveraged US High Dividend Low Volatility ETN due September 30, 2044 | NYSE Arca |
ETRACS S&P 500 VEQTOR Switch ETN due December 2, 2044 | NYSE Arca |
ETRACS Monthly Pay 2xLeveraged US Small Cap High Dividend ETN due February 6, 2045 | NYSE Arca |
ETRACS Monthly Reset 2xLeveraged ISE Exclusively Homebuilders ETN due March 13, 2045 | NYSE Arca |
ETRACS ISE Exclusively Homebuilders ETN due March 13, 2045 | NYSE Arca |
ETRACS Monthly Pay 2xLeveraged MSCI US REIT index ETN due May 5, 2045 | NYSE Arca |
ETRACS 2xMonthly Leveraged S&P MLP Index ETN Series B due February 12. 2046 | NYSE Arca |
ETRACS 2xMonthly Leveraged Alerian MLP Infrastructure Index ETN Series B due February 12, 2046 | NYSE Arca |
UBS AG FI Enhanced Global High Yield ETN due March 3, 2026 | NYSE Arca |
UBS AG FI Enhanced Europe 50 ETN due February 12, 2016 | NYSE Arca |
ETRACS S&P GSCI Crude Oil Total Return Index ETN due February 22, 2046 | NYSE Arca |
| |
* Not for trading, but solely in connection with the registration of the corresponding Trust Preferred Securities. | |
| | | |
Securities registered or to be registered pursuant to Section 12(g) of the Act:
None
Securities for which there is a reporting obligation pursuant to Section 15(d) of the Act:
None
CAUTIONARY STATEMENT REGARDING FORWARD-LOOKING STATEMENTS
This report contains statements that constitute “forward-looking statements,” including but not limited to management’s outlook for UBS’s financial performance and statements relating to the anticipated effect of transactions and strategic initiatives on UBS’s business and future development. While these forward-looking statements represent UBS’s judgments and expectations concerning the matters described, a number of risks, uncertainties and other important factors could cause actual developments and results to differ materially from UBS’s expectations. These factors include, but are not limited to: (i) the degree to which UBS is successful in executing its announced strategic plans, including its cost reduction and efficiency initiatives and its targets for risk-weighted assets (RWA) and leverage ratio denominator (LRD), and the degree to which UBS is successful in implementing changes to its wealth management businesses to meet changing market, regulatory and other conditions; (ii) the continuing low or negative interest rate environment, developments in the macroeconomic climate and in the markets in which UBS operates or to which it is exposed, including movements in securities prices or liquidity, credit spreads, and currency exchange rates, and the effect of economic conditions and market developments on the financial position or creditworthiness of UBS’s clients and counterparties; (iii) changes in the availability of capital and funding, including any changes in UBS’s credit spreads and ratings, as well as availability and cost of funding to meet requirements for debt that will be eligible for total loss-absorbing capacity (TLAC) requirements, or loss-absorbing capital; (iv) changes in or the implementation of financial legislation and regulation in Switzerland, the US, the UK and other financial centers that may impose, or result in, more stringent capital, TLAC, leverage ratio, liquidity and funding requirements, incremental tax requirements, additional levies, limitations on permitted activities, constraints on remuneration or other measures; (v) uncertainty as to when and to what degree the Swiss Financial Market Supervisory Authority (FINMA) will approve reductions to the incremental RWA resulting from the supplemental operational risk capital analysis mutually agreed to by UBS and FINMA, or will approve a limited reduction of capital or gone concern requirements due to measures to reduce resolvability risk; (vi) the degree to which UBS is successful in implementing changes to its legal structure to improve its resolvability and meet related regulatory requirements, including changes in legal structure and reporting required to implement US enhanced prudential standards, implementing a service company model, the transfer of the Asset Management business to a holding company and the potential need to make further changes to the legal structure or booking model of UBS Group in response to legal and regulatory requirements relating to capital requirements, resolvability requirements and proposals in Switzerland and other countries for mandatory structural reform of banks, and the extent to which such changes have the intended effects; (vii) changes in UBS’s competitive position, including whether differences in regulatory capital and other requirements among the major financial centers will adversely affect UBS’s ability to compete in certain lines of business; (viii) changes in the standards of conduct applicable to our businesses that may result from new regulation or new enforcement of existing standards, including measures to impose new or enhanced duties when interacting with customers or in the execution and handling of customer transactions; (ix) the liability to which UBS may be exposed, or possible constraints or sanctions that regulatory authorities might impose on UBS, due to litigation, contractual claims and regulatory investigations, including the potential for disqualification from certain businesses or loss of licenses or privileges as a result of regulatory or other governmental sanctions; (x) the effects on UBS’s cross-border banking business of tax or regulatory developments and of possible changes in UBS’s policies and practices relating to this business; (xi) UBS’s ability to retain and attract the employees necessary to generate revenues and to manage, support and control its businesses, which may be affected by competitive factors including differences in compensation practices; (xii) changes in accounting or tax standards or policies, and determinations or interpretations affecting the recognition of gain or loss, the valuation of goodwill, the recognition of deferred tax assets and other matters; (xiii) limitations on the effectiveness of UBS’s internal processes for risk management, risk control, measurement and modeling, and of financial models generally; (xiv) whether UBS will be successful in keeping pace with competitors in updating its technology, particularly in trading businesses; (xv) the occurrence of operational failures, such as fraud, misconduct, unauthorized trading, financial crime, cyber-attacks, and systems failures; (xvi) restrictions to the ability of UBS Group AG to make payments or distributions, including due to restrictions to the ability of its subsidiaries to make loans or distributions, directly or indirectly, or, in case of financial difficulties, due to the exercise by FINMA of its broad statutory powers in relation to protective measures, restructuring and liquidation proceedings; (xvii) the degree to which changes in regulation, capital or legal structure, financial results or other factors, including methodology, assumptions, and stress scenarios, may affect UBS’s ability to maintain its stated capital return objective; and (xviii) the effect that these or other factors or unanticipated events may have on our reputation and the additional consequences that this may have on our business and performance. The sequence in which the factors above are presented is not indicative of their likelihood of occurrence or the potential magnitude of their consequences. Our business and financial performance could be affected by other factors identified in our past and future filings and reports, including those filed with the SEC. More detailed information about those factors is set forth in documents furnished by UBS and filings made by UBS with the SEC. UBS is not under any obligation to (and expressly disclaims any obligation to) update or alter its forward-looking statements, whether as a result of new information, future events, or otherwise.
Cross-reference table
Set forth below are the respective items of SEC Form 20-F, and the locations in this document where the corresponding information can be found.
- Annual Report refers to the Annual Report 2015 of UBS Group AG and UBS AG annexed hereto, which forms an integral part hereof.
- Supplement refers to certain supplemental information contained in this forepart of the Form 20-F, starting on page 13 following the cross-reference table.
- Financial Statements refers to the consolidated financial statements of either UBS Group AG or UBS AG, or both, depending upon the context, contained in the Annual Report
In the cross-reference table below, page numbers refer to either the Annual Report or the Supplement, as noted.
Please see page 18 of the Annual Report for definitions of terms used in this Form 20-F relating to UBS.
Form 20-F item | Response or location in this filing |
| |
Item 1. Identity of Directors, Senior Management and Advisors. | Not applicable |
Item 2. Offer Statistics and Expected Timetable. | Not applicable |
Item 3. Key Information | |
A – Selected Financial Data | Annual Report, Selected Financial Data (830-834 and 909-913 ) and Statement of changes in equity (402-405 and 572-575) The exchange rate for the Swiss franc on 11 March 2016, as reported by the Federal Reserve System (H.10 Weekly), was CHF 0.9813 per USD 1. See page 830 of the Annual Report for additional exchange rate information. |
B – Capitalization and Indebtedness. | Not applicable |
C – Reasons for the Offer and Use of Proceeds. | Not applicable |
D – Risk Factors. | Annual Report, Risk Factors (59-74) |
Item 4. Information on the Company. |
A – History and Development of the Company | 1-3: Annual Report, Corporate information (6) 4: Annual Report, The making of UBS (12-14), The legal structure of UBS Group (15-16) and Our strategy (33-37) 5-7: Not applicable |
B – Business Overview. | 1, 2, 5 and 7: Annual Report, UBS and its businesses (8-9) and 41-58, Note 2a to each set of Financial Statements (Segment reporting) (432-435 and 603-606),and Note 2b to each set of Financial Statements (Segment reporting by geographic location) (436 and 607) 3: Seasonal characteristics (38) 4: Not applicable 6: None 8: Regulation and supervision and Regulatory and legal developments (22-32), Supplement (13-14) |
C – Organizational Structure. | Annual Report, UBS and its businesses (8-9), The legal structure of UBS Group (15-16) and Note 30 to each set of Financial Statements (Interests in subsidiaries and other entities) (540-549 and 707-716) |
D – Property, Plant and Equipment. | Annual Report, Property, plant and equipment (835 and 914), Note 16 to each set of Financial Statements (Property, equipment and software) (458 and 628) , Note 33 to each set of Financial Statements, Operating leases and finance leases (552 and 719). |
Information required by Industry Guide 3 | Annual Report, Information required by industry guide 3 (836-850 and 915-929) and Selected financial data (830-834 and 909-913). |
Item 4A. Unresolved Staff Comments. | None. |
Item 5. Operating and Financial Review and Prospects. |
A – Operating Results. | Annual Report, UBS Group AG key figures (5), UBS AG (consolidated) key figures (561), Measurement of performance (38-39), Group performance (85-110), operating results by business division (111-148), Currency management (247), Capital management (248-285), Fluctuation in foreign exchange rates and continuing low or negative interest rates may have a detrimental effect on our capital strength, our liquidity and funding position, and our profitability (59), Current market climate (20-21) and Regulatory and legal developments (26-32) |
B – Liquidity and Capital Resources. | Annual Report, As UBS Group AG is a holding company, its operating results, financial condition and ability to pay dividends and other distributions and/or to pay its obligations in the future depend on funding, dividends and other distributions received directly or indirectly from its subsidiaries, which may be subject to restrictions (72), Seasonal characteristics (38), Cash flows (110), Interest rate risk in the banking book (217-221), Liquidity and funding management (234-246), Capital management (248-285), Note 25a to each set of Financial Statements (Restricted financial assets) (504 and 674), Currency management (247), Note 20 to each set of Financial Statements (Financial liabilities designated at fair value) (462-463 and 632-633), Note 21 to each set of Financial Statements (Debt issued held at amortized cost) (463-464 and 633-634) and Short-term borrowings (843 and 922). We believe that our working capital is sufficient for the company’s present requirements. Liquidity and capital management is undertaken at UBS as an integrated asset and liability management function. |
C—Research and Development, Patents and Licenses, etc. | Not applicable |
D—Trend Information. | Annual Report, Current market climate (20-21) and Regulatory and legal developments (26-32) |
E—Off-Balance Sheet Arrangements. | Annual Report, Off-balance sheet (107-109), Note 25 to each set of Financial Statements (Restricted and transferred financial assets) (504-507 and 674-677) and Note 33 to each set of Financial Statements (Operating leases and finance leases) (552 and 719) |
F—Tabular Disclosure of Contractual Obligations. | Annual Report, Contractual obligations (108-109) |
Item 6. Directors, Senior Management and Employees. |
A – Directors and Senior Management. | 1, 2 and 3: Annual Report, 299-319 4, 5: None |
B – Compensation. | 1: Annual Report, 342-388, Note 29 to each set of Financial Statements (Equity participation and other compensation plans) (530-539 and 700-706) and Note 34 to each set of Financial Statements (Related parties) (553-555 and 720-722) 2: Annual Report, Note 28 to each set of Financial Statements (Pension and other post-employment benefit plans) (513-529 and 683-689) |
C – Board practices. | 1: Annual Report, 306-310 2: Annual Report, 342-388, and Note 34 to each set of Financial Statements (Related parties) (553-555 and 720-722) 3: Annual Report, Audit committee (307) and Compensation Committee (307-308) |
D—Employees. | Annual Report, Our employees (335-341) |
E—Share Ownership. | Annual Report, 383-385, Note 29 to each set of Financial Statements (Equity participation and other compensation plans) (530-539 and 700-706) and “Equity holdings of key management personnel” in Note 34 to each set of Financial Statements (Related parties) (553 and 720) |
Item 7. Major Shareholders and Related Party Transactions. |
A—Major Shareholders. | Annual Report, Group structure and shareholders (290-291), Capital structure (292-296) and Voting rights, restrictions and representation (297) The number of shares of UBS Group AG held by the respective shareholders listed on page 291 of the Annual Report as holding 3% or more of total share capital is as follows: |
Shareholder | Number of shares held |
Chase Nominees Ltd., London | 351,860,165 |
GIC Private Limited, Singapore | 245,517,417 |
DTC (Cede & Co.), New York | 236,503,280 |
Nortrust Nominees Ltd., London | 138,540,340 |
The number of shares of UBS AG held by UBS Group AG as of 31 December 2015 was 3,858,408,466 shares. |
B—Related Party Transactions. | Annual Report, Loans granted to GEB members (386), Loans granted to BoD members (386) , and Note 34 to each set of Financial Statements (Related parties) (553-555 and 720-722) The loans disclosed in such sections (a) were made in the ordinary course of business, (b) were made on substantially the same terms, including interest rates and collateral, as those prevailing at the time for comparable transactions with other persons, and (c) did not involve more than the normal risk of collectability or present other unfavorable features. |
C—Interests of Experts and Counsel. | Not applicable |
Item 8. Financial Information. |
A—Consolidated Statements and Other Financial Information. | 1, 2, 3, 4, 5, 6: Please see Item 18 of this Form 20-F. 7: Information on material legal and regulatory proceedings is in Note 22 to each set of Financial Statements (Provisions and contingent liabilities) (465-477 and 635-647). For developments during the year, please see also Note 16 (Provisions and contingent liabilities), in the Financial Information section in our respective quarterly reports for the First, Second and Third Quarters 2015, filed on Forms 6-K dated May 5, 2015, July 28, 2015 and November 3, 2015, respectively; as well as the Provisions and litigation, regulatory and similar matters section in the Fourth quarter 2015 Financial supplement, filed on Form 6-K dated February 2, 2016. The disclosures in each such Quarterly Report or Financial supplement speak only as of their respective dates. 8: Annual Report, We are committed to an attractive capital returns policy (34), Distributions to shareholders (296) |
B—Significant Changes. | Annual Report, Note 1 to each set of Financial Statements (Summary of significant accounting policies) (409-431 and 579-602) and Note 37 to each set of Financial Statements (Events after the reporting period) (557 and 724) |
Item 9. The Offer and Listing. |
A – Offer and Listing Details. | 1,2,3,5,6,7: Not applicable 4: Annual Report, Stock exchange prices (285) |
B—Plan of Distribution. | Not applicable |
C—Markets. | Annual Report, Listing of UBS shares (284) |
D—Selling Shareholders. | Not applicable |
E—Dilution. | Not applicable |
F—Expenses of the Issue. | Not applicable |
Item 10. Additional Information. |
A—Share Capital. | Not applicable |
B—Memorandum and Articles of Association. | Annual Report, Elections and terms of office (306), Capital structure (292-296), Organizational principles and structure (306-309), Shareholders' participation rights (297-298), Significant shareholders (291) and Change of control and defense measures (320) Supplement, 14-19 |
C—Material Contracts. | The Terms & Conditions of the several series of tier 1 and tier 2 capital instruments issued to date, and to be issued pursuant to Deferred Capital Contingent Plans, are exhibits 4.1 through 4.9 to this Form 20-F. These notes are described under Tier 1 capital and Tier 2 capital on pages 255-259 of the Annual Report and Deferred Contingent Capital Plan on page 376 of the Annual Report. The settlement agreements and orders filed as exhibits 4.10 through 4.14 are described in section 5 (Foreign exchange, LIBOR, and benchmark rates, and other trading practices) of Note 22 (Provisions and contingent liabilities) to each set of Financial Statements (473-476 and 643-646). The Asset Transfer Agreement by which certain assets and liabilities of UBS AG were transferred to UBS Switzerland AG is filed as Exhibit 4.15, and is described under Establishment of UBS Switzerland AG on pages 764-765 of the Annual Report. |
D—Exchange Controls. | There are no restrictions under the Articles of Association of UBS Group AG or Swiss law, as presently in force, that limit the right of non-resident or foreign owners to hold UBS’s securities freely. There are currently no Swiss foreign exchange controls or other Swiss laws restricting the import or export of capital by UBS or its subsidiaries. In addition, there are currently no restrictions under Swiss law affecting the remittance of dividends, interest or other payments to non-resident holders of UBS securities. |
E—Taxation. | Supplement, 19-22 |
F—Dividends and Paying Agents. | Not applicable |
G—Statement by Experts. | Not applicable |
H—Documents on Display. | UBS files periodic reports and other information with the Securities and Exchange Commission. You may read and copy any document that we file with the SEC on the SEC’s website, www.sec.gov, or at the SEC’s public reference room at 100 F Street, N.E., Room 1580, Washington, D.C. 20549. Please call the SEC at 1-800-SEC-0330 (in the United States) or at +1 202 551 8090 (outside the United States) for further information on the operation of its public reference room. Much of this information may also be found on the UBS website at www.ubs.com/investors. |
I—Subsidiary Information. | Not applicable |
Item 11. Quantitative and Qualitative Disclosures About Market Risk. |
(a) Quantitative Information About Market Risk. | Annual Report, Market risk (204-223) |
(b) Qualitative Information About Market Risk. | Annual Report, Market risk (204-223) |
(c) Interim Periods. | Not applicable. |
Item 12. Description of Securities Other than Equity Securities. |
A – Debt Securities | Not applicable. |
B – Warrants and Rights | Not applicable. |
C – Other Securities | Not applicable. |
D – American Depositary Shares | Not applicable. |
Item 13. Defaults, Dividend Arrearages and Delinquencies. | There has been no material default in respect of any indebtedness of UBS or any of its significant subsidiaries or any arrearages of dividends or any other material delinquency not cured within 30 days relating to any preferred stock of UBS AG or any of its significant subsidiaries. |
Item 14. Material Modifications to the Rights of Security Holders and Use of Proceeds. | None |
Item 15. Controls and Procedures. |
(a) Disclosure Controls and Procedures | Annual Report, US disclosure requirements (324), and Exhibit 12 to this Form 20-F. |
(b) Management’s Annual Report on Internal Control over Financial Reporting | Annual Report, Management’s reports on internal control over financial reporting (393 and 563) |
(c) Attestation Report of the Registered Public Accounting Form | Annual Report, Reports of independent registered public accounting firm on internal control over financial reporting (394 and 564) |
(d) Changes in Internal Control over Financial Reporting | None |
Item 15T. Controls and Procedures. | Not applicable |
Item 16A. Audit Committee Financial Expert. | Annual Report, Audit Committee (307) and Corporate governance (288-289) All Audit Committee members have accounting or related financial management expertise and in compliance with the rules established pursuant to the US Sarbanes-Oxley Act of 2002, at least one member, the Chairperson William G. Parrett, qualifies as a financial expert. |
Item 16B. Code of Ethics. | Annual Report, How we do business (326-330) and Code of Business Conduct and Ethics (171). No waiver from any provision of the Code of Business Conduct and Ethics (the “Code”) was granted to any employee in 2015. The Code is published on our website under http://www.ubs.com/1/e/investors/corporategovernance/business_conduct.html. |
Item 16C. Principal Accountant Fees and Services. | Annual Report, Auditors (321-322) None of the non-audit services so disclosed were approved by the Audit Committee pursuant to paragraph (c) (7)(i)(C ) of Rule 2-01 of Regulation S-X. |
Item 16D. Exemptions from the Listing Standards for Audit Committees. | Not applicable |
Item 16E. Purchases of Equity Securities by the Issuer and Affiliated Purchasers. | Annual Report, Treasury share activities (283) UBS does not currently have a share repurchase program. |
Item 16F. Changes in Registrant’s Certifying Accountant. | Not applicable |
Item 16G. Corporate Governance. | Annual Report, Corporate governance (288-289) |
Item 17. Financial Statements. | Not applicable |
Item 18. Financial Statements. | Annual Report, Financial Statements and the Notes to the Financial Statements (389-738) |
Item 19. Exhibits | Supplement, 22-24 |
Supplemental information
Item 4. Information on the Company
B – Business Overview
Disclosure Pursuant To Section 219 of the Iran Threat Reduction And Syrian Human Rights Act
Section 219 of the U.S. Iran Threat Reduction and Syria Human Rights Act of 2012 (“ITRA”) added Section 13(r) to the U.S. Securities Exchange Act of 1934, as amended (the “Exchange Act”) requiring each SEC reporting issuer to disclose in its annual and, if applicable, quarterly reports whether it or any of its affiliates have knowingly engaged in certain activities, transactions or dealings relating to Iran or with the Government of Iran or certain designated natural persons or entities involved in terrorism or the proliferation of weapons of mass destruction during the period covered by the report. The required disclosure may include reporting of activities not prohibited by U.S. or other law, even if conducted outside the U.S. by non-U.S. affiliates in compliance with local law. Pursuant to Section 13(r) of the Exchange Act, we note the following for the period covered by this annual report:
UBS has a Group Sanctions Policy that prohibits transactions involving sanctioned countries, including Iran, and sanctioned individuals and entities. However, UBS maintains one account involving the Iranian government under the auspices of the United Nations in Geneva after agreeing with the Swiss government that it would do so only under certain conditions. These conditions include that payments involving the account must: (1) be made within Switzerland; (2) be consistent with paying rent, salaries, telephone and other expenses necessary for its operations in Geneva; and (3) not involve any Specially Designated Nationals (SDN) blocked or otherwise restricted under U.S. or Swiss law. In 2015, the gross revenues for this UN-related account were approximately USD 9,639 which were generated by fees charged to the account; the net profit was approximately USD 6,664 after deductions were taken for UBS internal costs for maintaining the account. UBS AG intends to continue maintaining this account pursuant to the conditions it has established with the Swiss Government and consistent with its Group Sanctions Policy.
As previously reported, UBS had certain outstanding legacy trade finance arrangements issued on behalf of Swiss client exporters in favor of their Iranian counterparties. At the time these trade finance arrangements were initiated in or about 2000, none of the Iran banks involved were WMD-designated. In February 2012 UBS ceased accepting payments on these outstanding export trade finance arrangements and worked with the Swiss government who insured these contracts (Swiss Export Risk Insurance "SERV"). On December 21, 2012, UBS and the SERV entered into certain Transfer and Assignment Agreements under which SERV purchased all of UBS's remaining receivables under or in connection with Iran-related export finance transactions. Hence, the SERV is the sole beneficiary of said receivables. There was no financial activity involving Iran in connection with these trade finance arrangements in 2015, and no gross revenue or net profit.
In connection with these trade finance arrangements, UBS has maintained one existing account relationship with an Iranian bank. This account was established prior to the U.S. designation of this bank and maintained due to the existing trade finance arrangements. In 2007, following the designation of the bank pursuant to sanctions issued by the US, UN and Switzerland, the account was blocked under Swiss law and remained subject to blocking requirements until January 2016. Client assets as of December 2015 were USD 3,174. As there have been no transactions involving this account in 2015 other than general account fees, there are no gross revenues or net profits to report for 2015.
Pursuant to the Joint Plan of Action (JPOA) and the Joint Comprehensive Plan of Action (JCPOA), the parties to these Plans, including the US, agreed to facilitate certain payments regarding funds of the Central Bank of Iran (CBI). The Swiss State Secretariat for Economic Affairs (SECO) was contacted in this regard by the US Office of Foreign Assets Control (OFAC), and SECO then approached UBS to request assistance in several such transfers of oil revenues for humanitarian purposes. On the basis of this request and specific written approval and guidance from OFAC regarding the transactions, UBS processed several transfers from the Bank of Japan to certain special purpose accounts at a third party bank in Switzerland. Following Implementation Day, the CBI was removed from the SDN list. These transactions yielded negligible gross revenues and no net profits.
Item 10. Additional Information.
B—Memorandum and Articles of Association.
Please see the Articles of Association of UBS Group AG and of UBS AG (Exhibits 1.1 and 1.2, respectively, to this Form 20-F) and the Organization Regulations of UBS Group AG and UBS AG (Exhibit 1.3 to this Form 20-F).
Set forth below is a summary of the material provisions of the Articles of Association of UBS Group AG, which we call the “Articles” throughout this document, Organization Regulations and the Swiss Code of Obligations relating to our shares. This description does not purport to be complete and is qualified in its entirety by references to Swiss law, including Swiss company law, and to the Articles and Organization Regulations.
The Articles of Association of UBS AG are substantially similar to the Articles of UBS Group AG, so the following description applies equally to UBS AG.
The principal legislation under which UBS Group AG and UBS AG operate, and under which the ordinary shares of UBS Group AG are issued, is the Swiss Code of Obligations.
The shares are registered shares with a par value of CHF 0.10 per share. The shares are fully paid up. The shares rank pari passu in all respects with each other, including voting rights, entitlement to dividends, liquidation proceeds in case of the liquidation of UBS Group AG, subscription or preemptive rights in the event of a share issue (Bezugsrechte) and preemptive rights in the event of the issuance of equity-linked securities (Vorwegzeichnungsrechte).
Each share carries one vote at our shareholders’ meetings. Voting rights may be exercised only after a shareholder has been recorded in our share register as a shareholder with voting rights. Registration with voting rights is subject to certain restrictions. See “— Transfer of Shares” and “—Shareholders’ Meeting”.
The Articles provide that we may elect not to print and deliver certificates in respect of registered shares. Shareholders may, however, following registration in the share register, request at any time that we issue a written statement in respect of their shares; however, the shareholder has no entitlement to the printing and delivery of share certificates.
Share Register and Transfer of Shares
UBS’s share register is kept by UBS Shareholder Services, P.O. Box, CH-8098 Zurich, Switzerland. Shareholder Services is responsible for the registration of the global shares. It is split into two parts – a Swiss register, which is maintained by UBS Group, acting as Swiss share registrar, and a US register, which is maintained by Computershare Inc., c/o Voluntary Corporate Actions 250 Royall Street, Suite V, Canton, MA 02021, as U.S. transfer agent (“Computershare”).
Swiss law and the Articles of UBS Group require UBS Group to keep a share register in which the names, addresses and nationality (for legal persons, the registered office) of the owners (and beneficial owners) of registered UBS Group Shares are recorded. The main function of the share register is to record shareholders entitled to vote and participate in general meetings, or to assert or exercise other rights related to voting rights.
In order to register UBS Group Shares in UBS Group’s share register, a purchaser must file a share registration form with UBS Group’s share register. Failing such registration, the purchaser may not vote at or participate in shareholders’ meetings.
The transfer of shares is effected by corresponding entry in the books of a bank or depository institution following an assignment in writing by the selling shareholder and notification of such assignment to us by the bank or depository institution. The transfer of shares further requires that the purchaser file a share registration form in order to be registered in our share register as a shareholder. Failing such registration, the purchaser may not vote at or participate in shareholders’ meetings.
Swiss law distinguishes between registration with and without voting rights. Shareholders must be registered in the share register as shareholders with voting rights in order to vote and participate in general meetings or to assert or exercise other rights related to voting rights. A purchaser of shares will be recorded in our share register with voting rights upon disclosure of its name and nationality (and for legal persons, the registered office). However, we may decline a registration with voting rights if the shareholder does not declare that it has acquired the shares in its own name and for its own account. If the shareholder refuses to make such declaration, it will be registered as a shareholder without voting rights.
There is no limitation under Swiss law or our Articles on the right of non-Swiss residents or nationals to own or vote our shares.
Shareholders’ Meeting
Under Swiss law, annual ordinary shareholders’ meetings must be held within six months after the end of our financial year, which is 31 December. Shareholders’ meetings may be convened by the Board of Directors (BoD) or, if necessary, by the statutory auditors, with twenty-days’ advance notice. The BoD is further required to convene an extraordinary shareholders’ meeting if so resolved by a shareholders’ meeting or if so requested by shareholders holding in aggregate at least 10% of our nominal share capital. Shareholders holding shares with an aggregate par value of at least CHF 62,500 have the right to request that a specific proposal be put on the agenda and voted upon at the next shareholders’ meeting. A shareholders’ meeting is convened by publishing a notice in the Swiss Official Commercial Gazette (Schweizerisches Handelsamtsblatt) at least twenty days prior to such meeting.
The Articles do not require a minimum number of shareholders to be present in order to hold a shareholders’ meeting.
Resolutions generally require the approval of an “absolute majority” of the votes cast at a shareholders’ meeting. Shareholders’ resolutions requiring a vote by absolute majority include:
- Amendments to the Articles;
- Elections of directors, Chairman of the BoD, members of the compensation committee and statutory auditors;
- Election of the independent proxy;
- Approval of the management report and the consolidated financial statements;
- Approval of the annual financial statements and the resolution on the use of the balance sheet profit (declaration of dividend);
- Approval of the compensation for the BoD and the Group Executive Board (GEB), including the approval of the maximum aggregate amount of compensation of the members of the BoD for the period until the next Annual General Meeting (AGM), the maximum aggregate amount of fixed compensation of the GEB members for the following financial year and the aggregate amount of variable compensation of the GEB members for the preceding financial year, with the exception of a supplementary amount of up to 40% for persons joining or promoted within the GEB;
- Decisions to discharge directors and management from liability for matters disclosed to the shareholders’ meeting; and
- Passing resolutions on matters which are by law or by the Articles reserved to the shareholders’ meeting (e.g., the ordering of an independent investigation into the specific matters proposed to the shareholders’ meeting).
Under the Articles, a resolution passed at a shareholders’ meeting with a supermajority of at least two thirds of the Shares represented at such meeting is required to:
- Change the limits on BoD size in the Articles;
- Remove one-fourth or more of the members of the BoD; or
- Delete or modify the above supermajority requirements.
Under Swiss corporate law, a resolution passed by at least two thirds of votes represented and an absolute majority of the par value of the shares represented must approve:
- A change in our stated purpose in the Articles;
- The creation of shares with privileged voting rights;
- A restriction on transferability or registration of shares;
- An increase in authorized or contingent capital or the creation of reserve capital in accordance with Swiss banking law;
- An increase in share capital against contribution in kind, for the purpose of acquisition and granting of special rights;
- Changes to pre-emptive rights;
- A change of domicile of the corporation; or
- Dissolution of the corporation.
At shareholders’ meetings, a shareholder can be represented by his or her legal representative or under a written power of attorney by another shareholder eligible to vote or, under a written or electronic power of attorney, by the independent proxy. Votes are taken electronically, by written ballot or by a show of hands. If a written ballot is requested by at least 3% of the votes present at the shareholders’ meeting or such ballot is ordered by the Chairman of the meeting, a written ballot will be conducted.
Net Profits and Dividends
Swiss law requires that at least 5% of the annual net profits of a corporation must be retained as general reserves until this equals 20% of the corporation’s paid-up share capital. Any net profits remaining are at the disposal of the shareholders’ meeting, except that, if an annual dividend exceeds 5% of the nominal share capital, then 10% of such excess must be retained as general reserves.
Under Swiss law, dividends may be paid out only if the corporation has sufficient distributable profits from previous business years or if the reserves of the corporation are sufficient to allow distribution of a dividend. In either event, dividends may be paid out only after approval by the shareholders’ meeting. The BoD may propose to the shareholders that a dividend be paid out. The auditors must confirm that the dividend proposal of the Board conforms with statutory law. In practice, the shareholders’ meeting usually approves the dividend proposal of the BoD.
Dividends are usually due and payable after the shareholders’ resolution relating to the allocation of profits has been passed. Under Swiss law, the statute of limitations in respect of dividend payments is five years.
U.S. holders of shares will receive dividend payments in U.S. dollars, unless they provide notice to our U.S. transfer agent, Computershare, that they wish to receive dividend payments in Swiss francs. The U.S. transfer agent will be responsible for paying the U.S. dollars or Swiss francs to registered holders, and for withholding any required amounts for taxes or other governmental charges. If the U.S. transfer agent determines, after consultation with us, that in its judgment any foreign currency received by it cannot be converted into U.S. dollars or transferred to U.S. holders, it may distribute the foreign currency received by it, or an appropriate document evidencing the right to receive such currency, or in its discretion hold such foreign currency for the accounts of U.S. holders.
Preemptive Rights
Under Swiss law, any share issue, whether for cash or non-cash consideration or for no consideration, is subject to the prior approval of the shareholders’ meeting. Shareholders of a Swiss corporation have certain preemptive rights to subscribe for new issues of shares in proportion to the nominal amount of shares held. The Articles or a resolution adopted at a shareholders’ meeting with a supermajority may, however, limit or suspend preemptive rights in certain limited circumstances.
Borrowing Power
Neither Swiss law nor the Articles restrict in any way our power to borrow and raise funds. No shareholders’ resolution is required.
Conflicts of Interests
Swiss law does not have a general provision on conflicts of interests. However, the Swiss Code of Obligations requires directors and members of senior management to safeguard the interests of the corporation and, as such, imposes a duty of care and a duty of loyalty on directors and officers. This rule is generally understood as disqualifying directors and senior officers from participating in decisions that directly affect them. Directors and officers are personally liable to the corporation for any breach of these provisions. In addition, Swiss law contains a provision under which payments made to a shareholder or a director or any person associated therewith, other than at arm’s length, must be repaid to us if the shareholder or director was acting in bad faith.
In addition, our Organization Regulations prohibit any member of the BoD or senior management from participating in discussions and decision-making regarding a matter as to which he or she has a conflict of interest, subject to exceptional circumstances in which the best interest of UBS Group dictates otherwise.
Repurchase of Shares
Swiss law limits a corporation’s ability to hold or repurchase its own shares. We and our subsidiaries may only repurchase shares if we have sufficient free reserves to pay the purchase price and if the aggregate nominal value of the shares does not exceed 10% of our nominal share capital. Furthermore, we must create a special reserve on our balance sheet in the amount of the purchase price of the acquired shares. Such shares held by us or our subsidiaries do not carry any rights to vote at shareholders’ meetings.
Notices
Notices to shareholders are made by publication in the Swiss Official Gazette of Commerce. The BoD may designate further means of communication for publishing notices to shareholders.
Registration and Business Purpose
UBS Group AG was incorporated and registered as a stock corporation (Aktiengesellschaft) under the laws of Switzerland. It was entered into the commercial register of Canton Zurich on 10 June 2014 under the registration number CHE-395.345.924 and has its registered domicile in Zurich, Switzerland. The business purpose of UBS Group AG, as set forth in its Articles, is the acquisition, holding, administration and sale of direct and indirect participations in enterprises of any kind, in particular in the areas of banking, financial, advisory, trading and service activities in Switzerland and abroad. UBS Group may establish enterprises of any kind in Switzerland and abroad, hold equity interests in these companies, and conduct their management. UBS Group is authorized to acquire, mortgage and sell real estate and building rights in Switzerland and abroad. UBS Group may provide loans, guarantees and other types of financing and securities for group companies and borrow and invest capital on the money and capital markets.
UBS AG was incorporated and registered as a stock corporation (Aktiengesellschaft) under the laws of Switzerland. It was entered into the commercial registers of Canton Zurich and Canton Basle-City on 29 June 1998 under the registration number CHE-101.329.561 and has registered domiciles in Zurich and Basel, Switzerland. The business purpose of UBS AG, as set forth in its Articles of Association, is the operation of a bank, with a scope of operations extending to all types of banking, financial, advisory, trading and service activities in Switzerland and abroad.
Duration, Liquidation and Merger
Our duration is unlimited.
Under Swiss law, we may be dissolved at any time by a shareholders’ resolution which must be passed by a supermajority of at least two-thirds of the votes represented and an absolute majority of the nominal value of the shares represented at the meeting. Dissolution by law or court order is possible, for example, if we become bankrupt.
Under Swiss law, any surplus arising out of a liquidation (after the settlement of all claims of all creditors) is distributed to shareholders in proportion to the paid-up nominal value of shares held.
Disclosure of Principal Shareholders
Under the applicable provisions of the Swiss Stock Exchange Act, shareholders and shareholders acting in concert with third parties who reach, exceed or fall below the thresholds of 3%, 5%, 10%, 15%, 20%, 25%, 33 1/3%, 50% or 66 2/3% of the voting rights of a Swiss-listed corporation must notify the corporation and the SIX Swiss Exchange on which such shares are listed of such holdings, whether or not the voting rights can be exercised. Following receipt of such notification, the corporation has the obligation to inform the public. The corporation must disclose in an attachment to the balance sheet the identity of any shareholders who own in excess of 5% of its shares.
Mandatory Tender Offer
Under the applicable provisions of the Swiss Stock Exchange Act, shareholders and shareholders acting in concert with third parties who acquire more than 33 1/3% of the voting rights of a Swiss-listed company will have to submit a takeover bid to all remaining shareholders. A waiver from the mandatory bid rule may be granted by our supervisory authority. If no waiver is granted, the mandatory takeover bid must be made pursuant to the procedural rules set forth in the Swiss Stock Exchange Act and implementing ordinances.
Other
Ernst & Young Ltd, Aeschengraben 9, CH-4051 Basel, Switzerland, have been appointed as statutory auditors and as auditors of the consolidated accounts of both UBS Group AG and UBS AG. The auditors are subject to election by the shareholders at the ordinary general meeting on an annual basis.
E—Taxation.
This section outlines the material Swiss tax and U.S. federal income tax consequences of the ownership of UBS ordinary shares by a U.S. holder (as defined below) who holds UBS ordinary shares as capital assets. It is designed to explain the major interactions between Swiss and U.S. taxation for U.S. persons who hold UBS shares.
The discussion does not address the tax consequences to persons who hold UBS ordinary shares in particular circumstances, such as tax-exempt entities, banks, financial institutions, life insurance companies, broker-dealers, traders in securities that elect to use a mark-to-market method of accounting for securities holdings, holders liable for alternative minimum tax, holders that actually or constructively own 10% or more of the voting stock of UBS, holders that hold UBS ordinary shares as part of a straddle or a hedging or conversion transaction, holders that purchase or sell UBS ordinary shares as part of a wash sale for tax purposes or holders whose functional currency for U.S. tax purposes is not the U.S. dollar. This discussion also does not apply to holders who acquired their UBS ordinary shares through a tax-qualified retirement plan, nor generally to unvested UBS ordinary shares held under deferred compensation arrangements.
If a partnership (or other entity treated as a partnership) holds UBS ordinary shares, the U.S. federal income tax treatment of a partner will generally depend on the status of the partner and the tax treatment of the partnership. A partner in a partnership holding the UBS ordinary shares should consult its tax advisor with regard to the U.S. federal income tax treatment of an investment in the ordinary shares.
The discussion is based on the tax laws of Switzerland and the United States, including the U.S. Internal Revenue Code of 1986, as amended, its legislative history, existing and proposed regulations under the Internal Revenue Code, published rulings and court decisions, as in effect on the date of this document, as well as the Convention between the United States of America and the Swiss Confederation for the Avoidance of Double Taxation with Respect to Taxes on Income, which we call the “Treaty,” all of which may be subject to change or change in interpretation, possibly with retroactive effect.
For purposes of this discussion, a “U.S. holder” is any beneficial owner of UBS ordinary shares that is for U.S. federal income tax purposes:
- A citizen or resident of the United States;
- A domestic corporation or other entity taxable as a corporation;
- An estate, the income of which is subject to U.S. federal income tax without regard to its source; or
- A trust, if a court within the United States is able to exercise primary supervision over the administration of the trust and one or more U.S. persons have the authority to control all substantial decisions of the trust.
The discussion does not generally address any aspects of Swiss taxation other than income and capital taxation or of U.S. taxation other than federal income taxation. Holders of UBS shares are urged to consult their tax advisors regarding the U.S. federal, state and local and the Swiss and other tax consequences of owning and disposing of these shares in their particular circumstances.
(a) Ownership of UBS Ordinary Shares - Swiss Taxation
Dividends and Distributions
Dividends paid by UBS to a holder of UBS ordinary shares (including dividends on liquidation proceeds and stock dividends) are in principle subject to a Swiss federal withholding tax at a rate of 35%.
Until the end of 2010, the Par Value Principle was applicable. Under the Par Value Principle any distribution, which was not a repayment of the par value of the shares, was subject to Swiss withholding tax.
On 1 January 2011, the Par Value Principle was replaced by the Capital Contribution Principle. Under the Capital Contribution Principle, the repayment of capital contributions, including share premiums made by the shareholders after December 31, 1996 is in principle no longer subject to Swiss withholding tax if certain requirements regarding the booking of these capital contributions are met. The Swiss Federal Tax Administration issued guidelines on how the Capital Contribution Principle has to be applied.
A U.S. holder that qualifies for Treaty benefits may apply for a refund of the withholding tax withheld in excess of the 15% Treaty rate (or for a full refund in case of qualifying retirement arrangements). The claim for refund must be filed with the Swiss Federal Tax Administration, Eigerstrasse 65, CH-3003 Berne, Switzerland no later than December 31 of the third year following the end of the calendar year in which the income subject to withholding was due. The form used for obtaining a refund is Swiss Tax Form 82 (82 C for companies; 82 E for other entities; 82 I for individuals; 82 R for regulated investment companies), which may be obtained from any Swiss Consulate General in the United States or from the Swiss Federal Tax Administration at the address above. The form must be filled out in triplicate with each copy duly completed and signed before a notary public in the United States. The form must be accompanied by evidence of the deduction of withholding tax withheld at the source.
Transfers of UBS Ordinary Shares
The purchase or sale of UBS ordinary shares, whether by Swiss resident or non-resident holders (including U.S. holders), may be subject to a Swiss securities transfer stamp duty of up to 0.15% calculated on the purchase price or sale proceeds if it occurs through or with a bank or other securities dealer as defined in the Swiss Federal Stamp Tax Act in Switzerland or the Principality of Liechtenstein. In addition to the stamp duty, the sale of UBS ordinary shares by or through a member of a recognized stock exchange may be subject to a stock exchange levy.
Capital gains realized by a U.S. holder upon the sale of UBS ordinary shares are not subject to Swiss income or gains taxes, unless such U.S. holder holds such shares as business assets of a Swiss business operation qualifying as a permanent establishment for the purposes of the Treaty. In the latter case, gains are taxed at ordinary Swiss individual or corporate income tax rates, as the case may be, and losses are deductible for purposes of Swiss income taxes.
(b) Ownership of UBS Ordinary Shares - U.S. Federal Income Taxation
Dividends and Distributions
Subject to the passive foreign investment company rules discussed below, a U.S. holder will include in gross income the gross amount of any dividend paid, before reduction for Swiss withholding taxes, by UBS out of its current or accumulated earnings and profits, as determined for U.S. federal income tax purposes, as ordinary income when the dividend is actually or constructively received by the U.S. holder. Distributions in excess of current and accumulated earnings and profits, as determined for U.S. federal income tax purposes, will be treated as a return of capital to the extent of the U.S. holder’s basis in its UBS ordinary shares and thereafter as capital gain.
Dividends paid to a noncorporate U.S. holder that constitute qualified dividend income will be taxable to the holder at a maximum rate of 20%, provided that the holder has a holding period in the shares of more than 60 days during the 121-day period beginning 60 days before the ex-dividend date and meets other holding period requirements. Dividends paid by UBS with respect to the shares will generally be qualified dividend income.
For U.S. federal income tax purposes, a dividend will include a distribution characterized under Swiss law as a repayment of capital contributions if the distribution is made out of current or accumulated earnings and profits, as described above.
Dividends will generally be income from sources outside the United States for foreign tax credit limitation purposes, and will, depending on the holder’s circumstances, be either “passive” or “general” income for purposes of computing the foreign tax credit allowable to the holder. Special rules apply in determining the foreign tax credit limitation with respect to dividends that are subject to the maximum 20% rate. The dividend will not be eligible for the dividends-received deduction generally allowed to U.S. corporations in respect of dividends received from other U.S. corporations.
The amount of the dividend distribution included in income of a U.S. holder will be the U.S. dollar value of the Swiss franc payments made, determined at the spot Swiss franc/U.S. dollar rate on the date such dividend distribution is includible in the income of the U.S. holder, regardless of whether the payment is in fact converted into U.S. dollars. Generally, any gain or loss resulting from currency exchange fluctuations during the period from the date the dividend payment is included in income to the date such dividend payment is converted into U.S. dollars will be treated as ordinary income or loss and will not be eligible for the special tax rate applicable to qualified dividend income. Such gain or loss will generally be income or loss from sources within the United States for foreign tax credit limitation purposes.
Subject to U.S. foreign tax credit limitations, the nonrefundable Swiss tax withheld and paid over to Switzerland will be creditable or deductible against the U.S. holder’s U.S. federal income tax liability. To the extent a refund of the tax withheld is available to a U.S. holder under the laws of Switzerland or under the Treaty, the amount of tax withheld that is refundable will not be eligible for credit against the U.S. holder’s U.S. federal income tax liability, whether or not the refund is actually obtained. See “(a) Ownership of UBS Ordinary Shares – Swiss Taxation” above, for the procedures for obtaining a tax refund.
Transfers of UBS Ordinary Shares
Subject to the passive foreign investment company rules discussed below, a U.S. holder that sells or otherwise disposes of UBS ordinary shares generally will recognize capital gain or loss for U.S. federal income tax purposes equal to the difference between the U.S. dollar value of the amount realized and its tax basis, determined in U.S. dollars, in such UBS ordinary shares. Capital gain of a non-corporate U.S. holder is generally taxed at preferential rates if the UBS ordinary shares were held for more than one year. The gain or loss will generally be income or loss from sources within the United States for foreign tax credit limitation purposes.
Passive Foreign Investment Company Rules
UBS believes that UBS ordinary shares should not be treated as stock of a passive foreign investment company for U.S. federal income tax purposes, but this conclusion is a factual determination made annually and thus may be subject to change. In general, UBS will be a passive foreign investment company with respect to a U.S. holder if, for any taxable year in which the U.S. holder held UBS ordinary shares, either (i) at least 75% of the gross income of UBS for the taxable year is passive income or (ii) at least 50% of the value, determined on the basis of a quarterly average, of UBS’s assets is attributable to assets that produce or are held for the production of passive income (including cash). If UBS were to be treated as a passive foreign investment company, gain realized on the sale or other disposition of UBS ordinary shares would in general not be treated as capital gain. Instead, unless a U.S. holder elects to be taxed annually on a mark-to-market basis with respect to its UBS ordinary shares, such gain and certain “excess distributions” would be treated as having been realized ratably over the holder’s holding period for the shares and generally would be taxed at the highest tax rate in effect for each such year to which the gain was allocated, together with an interest charge in respect of the tax attributable to each such year. With certain exceptions, a holder’s UBS ordinary shares will be treated as stock in a passive foreign investment company if UBS was a passive foreign investment company at any time during the holder’s holding period in the UBS ordinary shares. In addition, dividends received from UBS would not be eligible for the preferential tax rate applicable to qualified dividend income if UBS were to be treated as a passive foreign investment company either in the taxable year of the distribution or the preceding taxable year, but would instead be taxable at rates applicable to ordinary income.
Item 19. Exhibits.
|
| |
Exhibit number | Description |
| |
1.1 | Articles of Association of UBS Group AG dated 15 February 2016. |
| |
1.2 | Articles of Association of UBS AG dated 7 May 2015. |
| |
1.3 | Organization Regulations of UBS Group AG and UBS AG dated 1 January 2016. |
| |
2(b) | Instruments defining the rights of the holders of long-term debt issued by UBS Group AG and its subsidiaries. |
| |
| We agree to furnish to the SEC upon request, copies of the instruments, including indentures, defining the rights of the holders of our long-term debt and of our subsidiaries’ long-term debt. |
| |
4.1 | Terms and Conditions of Tier 2 Subordinated Notes of UBS AG due 2023, issued 22 May 2013. (Incorporated by reference to Exhibit 4.2 to UBS AG's Annual Report on Form 20-F for the fiscal year ended December 31, 2013) |
| |
4.2 | Terms and Conditions of Tier 2 Subordinated Notes of UBS AG due 12 February 2026, issued 13 February 2014. (Incorporated by reference to Exhibit 4.3 to UBS AG's Annual Report on Form 20-F for the fiscal year ended December 31, 2013) |
| |
4.3 | Terms and Conditions of Tier 2 Subordinated Notes of UBS AG due 2024, issued 15 May 2014. (Incorporated by reference to Exhibit 4.3 to UBS AG's Annual Report on Form 20-F for the fiscal year ended December 31, 2014) |
| |
4.4 | Terms and Conditions of USD 1.25 billion 7% Tier 1 Subordinated Notes issued by UBS Group AG on 19 February 2015. (Incorporated by reference to Exhibit 4.4 to UBS AG's Annual Report on Form 20-F for the fiscal year ended December 31, 2014) |
| |
4.5 | Terms and Conditions of USD 1.25 billion 7.125% Tier 1 Subordinated Notes issued by UBS Group AG on 19 February 2015. (Incorporated by reference to Exhibit 4.5 to UBS AG's Annual Report on Form 20-F for the fiscal year ended December 31, 2014) |
| |
4.6 | Terms and Conditions of EUR 1 billion 5.75% Tier 1 Subordinated Notes issued by UBS Group AG on 19 February 2015. (Incorporated by reference to Exhibit 4.6 to UBS AG's Annual Report on Form 20-F for the fiscal year ended December 31, 2014) |
| |
4.7 | Terms and Conditions of additional Tier 1 capital instruments to be issued pursuant to the Deferred Contingent Capital Plan 2014/15. (Incorporated by reference to Exhibit 4.7 to UBS AG's Annual Report on Form 20-F for the fiscal year ended December 31, 2014) |
| |
4.8 | Terms and Conditions of USD 1.575 billion Tier 1 Subordinated Notes issued by UBS Group AG on 7 August 2015. |
| |
4.9 | Terms and Conditions of additional Tier 1 capital instruments to be issued pursuant to the Deferred Contingent Capital Plan 2015/16. |
| |
4.10 | Commodity Futures Trading Commission Order Instituting Proceedings Pursuant to Section 6(c)(4)(A) and 6(d) of the Commodity Exchange Act, Making Findings, and Imposing Remedial Sanctions, dated November 11, 2014. |
| |
4.11 | Financial Conduct Authority Final Notice issued 11 November 2014. |
| |
4.12 | Swiss Financial Market Supervisory Authority Report on Foreign Exchange Trading at UBS AG dated 12 November 2014. |
| |
4.13 | Plea Agreement between the Criminal Division of the US Department of Justice and UBS AG dated May 20, 2015. |
| |
4.14 | Board of Governors of the Federal Reserve System and State of Connecticut Department of Banking Order to Cease and Desist and Order of Assessment of a Civil Money Penalty Issued Upon Consent Pursuant to the Federal Deposit Insurance Act, as Amended, dated May 20, 2015. |
| |
4.15 | Asset Transfer Agreement between UBS AG and UBS Switzerland AG dated 12 June 2015 (Incorporated by reference to Form 6-K of UBS AG filed on June 17, 2015). |
| |
7 | Statement regarding ratio of earnings to fixed charges. |
| |
8 | Significant Subsidiaries of UBS Group AG. |
| |
| Please see Note 30 to each set of Financial Statements (Interests in subsidiaries and other entities), on pages 540-549 and 707-716 of the Annual Report. |
| |
12 | The certifications required by Rule 13(a)-14(a) (17 CFR 240.13a-14(a)) |
| |
13 | The certifications required by Rule 13(a)-14(b) (17 CFR 240.13a-14(b)) and Section 1350 of Chapter 63 of Title 18 of the U.S. Code (18 U.S.C. 1350). |
15.1 | Consent of Ernst & Young Ltd. with respect to UBS Group AG |
| |
15.2 | Consent of Ernst & Young Ltd. with respect to UBS AG |
SIGNATURES
The registrant hereby certifies that it meets all of the requirements for filing on Form 20-F and that it has duly caused the undersigned to sign this annual report on its behalf.
UBS Group AG
_/s/ Sergio Ermotti_______________
Name: Sergio Ermotti
Title: Group Chief Executive Officer
_/s/ Kirt Gardner__________________
Name: Kirt Gardner
Title: Group Chief Financial Officer
UBS AG
_/s/ Sergio Ermotti_______________
Name: Sergio Ermotti
Title: Group Chief Executive Officer
_/s/ Kirt Gardner __________________
Name: Kirt Gardner
Title: Group Chief Financial Officer
March 18, 2016

UBS Group AG and UBS AG
Annual Report 2015
Annual Report 2015
Letter to shareholders
Dear shareholders,
In 2015, many of the macroeconomic and geopolitical issues we highlighted in our outlook statements materialized, and in some cases became more pressing. A number of developments continued to create uncertainty in global economic and financial markets: the mixed outlook on global growth; the absence of credible improvements in the eurozone; fiscal and monetary uncertainty, including the impact of negative rates; instability resulting from falling commodity and energy prices, as well as rising geopolitical tensions. In addition, a number of specific macroeconomic events had a particular impact on UBS, including the Swiss National Bank’s (SNB) decision in January to abandon its euro currency floor, and the relative weakness of the Chinese economy in the second half of the year.
Against this backdrop we stayed close to our clients while prudently managing risk and resources to deliver a net profit attributable to shareholders of CHF 6.2 billion, up 79% on the previous year, our best full-year result in eight years. We also achieved a full-year adjusted1 return on tangible equity of 13.7%, above our full-year 2015 target of around 10%. In addition, we continued to strengthen our capital position and reported a fully-applied Swiss systemically relevant bank (SRB) common equity tier 1 capital ratio of 14.5% and a Swiss SRB leverage ratio of 5.3% at year end, leaving us well-positioned to deal with both challenging market conditions and the future requirements of the revised Swiss too big to fail (TBTF) framework.
This strong performance was driven by the dedication of our employees and the disciplined execution of our strategy and has allowed us to deliver on our capital return commitment to shareholders, even in a difficult environment. As previously announced in our fourth-quarter earnings release, we are proposing an ordinary dividend of CHF 0.60 per share, as well as a special dividend of CHF 0.25 per share, reflecting a significant net upward revaluation of deferred tax assets in 2015.
In 2015, Wealth Management’s adjusted1 profit before tax was up 13% on the prior year to CHF 2.8 billion (reported CHF 2.7 billion), its best annual pre-tax adjusted1 profit since 2008. Wealth Management Americas’ adjusted1 profit before tax was USD 874 million (reported USD 754 million) with record operating income, and solid net new money of USD 21.4 billion. Personal & Corporate Banking posted its best adjusted1 profit before tax since 2010 with CHF 1.7 billion (reported CHF 1.6 billion) and attracted a record number of new clients. Asset Management’s adjusted1 profit before tax of CHF 610 million (reported CHF 584 million) was up 20% year on year, making progress towards its medium-term profit target. The Investment Bank delivered a strong performance with an adjusted1 profit before tax of CHF 2.3 billion (reported CHF 1.9 billion), and achieved an adjusted1 return on attributed equity of 31% for the full year.
Over the past two years, we made significant investments to execute on a series of measures to improve the resolvability of the Group in response to TBTF requirements in Switzerland and other countries. In 2015, we transferred our Personal & Corporate Banking and Wealth Management businesses booked in Switzerland from UBS AG to UBS Switzerland AG, and implemented a more self-sufficient business and operating model for UBS Limited, our investment banking subsidiary in the UK. We established UBS Business Solutions AG as a direct subsidiary of UBS Group AG, to act as the Group service company. Also during 2015, UBS AG established a new subsidiary, UBS Americas Holding LLC, which we intend to designate as our intermediate holding company for our US subsidiaries in accordance with the new Dodd-Frank rules for foreign banks in the US. The successful completion of these measures not only improves the firm’s resolvability, but should also allow us to qualify for a capital rebate under the proposed new Swiss TBTF rules.
We were honored with a number of prestigious awards for operational excellence throughout the year. UBS dominated the recently announced 2015 Euromoney awards, reclaiming the title “Best Private Banking Services Overall” and “Best Global Wealth Manager”. In July, UBS Switzerland confirmed its status as the country’s premier universal bank, taking the Euromoney prize for “Best Bank in Switzerland” for the fourth year running. Our Investment Bank was named “Bank of the Year” by the International Financing Review for the first time. The publication singled out the Investment Bank’s remarkable transformation over the last few years and the success of its client-centric model. UBS was also named “Outstanding Global Private Bank – Overall” as well as “Outstanding Global Private Bank – Asia Pacific” by Private Banker International.
1 Refer to “Group performance” in the “Financial and operating performance” section of this report for more information on adjusted results.

Annual Report 2015
Letter to shareholders
We also continued to build on our position and reputation as a sustainability leader. UBS was named industry group leader in the Dow Jones Sustainability Indices (DJSI). DJSI praised our role in offering a variety of sustainability-focused portfolios, as well as creating a reporting framework to help clients better understand these investments. As of 31 December 2015, sustainable investments increased to CHF 934 billion, representing over a third of total invested assets. As the United Nations’ COP21 Climate Change Summit convened in Paris in November, we added our voice in support of a comprehensive agreement of all parties to combat climate change and reduce greenhouse gas emissions. At the same time, UBS reaffirmed its own commitment to limit the effects of climate change and enable the transition to a low-carbon economy.
In 2015, we expanded our program of community engagement. Our global volunteer program saw 16,356 (27%) of our employees contribute over 130,000 hours to community projects. In addition, we donated over CHF 37 million to foundations in Switzerland, and made direct cash contributions of over CHF 27 million to a variety of global projects, more than 90% of which were in support of education and entrepreneurial initiatives.
Technology and innovation remained a priority in 2015. We further upgraded our IT infrastructure and enhanced our technology offering for customers with our e- and mobile-banking solutions. This included the award-winning Swiss peer-to-peer mobile payments application “Paymit,” and Wealth Management Online – a new digital platform for Wealth Management clients in Switzerland and Europe International. Our Investment Bank continued to upgrade UBS Neo, its highly innovative, award-winning client platform, with further features and enhancements.
UBS also opened its own innovation lab at Level39, Europe’s largest technology accelerator and incubator. The lab is exploring potential applications for Blockchain and other disruptive digital technologies in financial services. UBS received awards for “Most Innovative Digital Offering” from Private Banker International and “Most Innovative Investment Bank for Financial Institutions” by The Banker. UBS’s commitment to and interest in innovation was also highlighted by the launch of the first ever UBS Future of Finance Challenge, an international competition for entrepreneurs and technology startups developing ideas and solutions for the financial services industry. The competition attracted over 600 entrants from 50 countries.
We would like to take this opportunity to thank both our shareholders and our clients for their continued support. We are confident that by striving for excellence and putting our clients at the center of everything we do, we can grow our business profitably over the long term and continue to deliver attractive returns to shareholders. We look forward to seeing many of you at this year’s AGM.
18 March 2016
Yours sincerely,
UBS
Axel A. Weber Sergio P. Ermotti
Chairman of the Group Chief Executive Officer
Board of Directors
UBS Group AG key figures1
| | As of or for the year ended |
CHF million, except where indicated | | 31.12.15 | 31.12.14 | 31.12.13 |
| | | | |
Group results | | | | |
Operating income | | 30,605 | 28,027 | 27,732 |
Operating expenses | | 25,116 | 25,567 | 24,461 |
Operating profit / (loss) before tax | | 5,489 | 2,461 | 3,272 |
Net profit / (loss) attributable to UBS Group AG shareholders | | 6,203 | 3,466 | 3,172 |
Diluted earnings per share (CHF)² | | 1.64 | 0.91 | 0.83 |
| | | | |
Key performance indicators³ | | | | |
Profitability | | | | |
Return on tangible equity (%) | | 13.7 | 8.2 | 8.0 |
Return on assets, gross (%) | | 3.1 | 2.8 | 2.5 |
Cost / income ratio (%) | | 81.8 | 91.0 | 88.0 |
Growth | | | | |
Net profit growth (%) | | 79.0 | 9.3 | |
Net new money growth for combined wealth management businesses (%)⁴ | | 2.2 | 2.5 | 3.4 |
Resources | | | | |
Common equity tier 1 capital ratio (fully applied, %)⁵ | | 14.5 | 13.4 | 12.8 |
Leverage ratio (phase-in, %)⁶ | | 6.2 | 5.4 | 4.7 |
| | | | |
Additional information | | | | |
Profitability | | | | |
Return on equity (RoE) (%) | | 11.8 | 7.0 | 6.7 |
Return on risk-weighted assets, gross (%)⁷ | | 14.1 | 12.4 | 11.4 |
Resources | | | | |
Total assets | | 942,819 | 1,062,478 | 1,013,355 |
Equity attributable to UBS Group AG shareholders | | 55,313 | 50,608 | 48,002 |
Common equity tier 1 capital (fully applied)⁵ | | 30,044 | 28,941 | 28,908 |
Common equity tier 1 capital (phase-in)⁵ | | 40,378 | 42,863 | 42,179 |
Risk-weighted assets (fully applied)⁵ | | 207,530 | 216,462 | 225,153 |
Risk-weighted assets (phase-in)⁵ | | 212,302 | 220,877 | 228,557 |
Common equity tier 1 capital ratio (phase-in, %)⁵ | | 19.0 | 19.4 | 18.5 |
Total capital ratio (fully applied, %)⁵ | | 22.9 | 18.9 | 15.4 |
Total capital ratio (phase-in, %)⁵ | | 26.8 | 25.5 | 22.2 |
Leverage ratio (fully applied, %)⁶ | | 5.3 | 4.1 | 3.4 |
Leverage ratio denominator (fully applied)⁶ | | 897,607 | 997,822 | 1,015,306 |
Leverage ratio denominator (phase-in)⁶ | | 904,014 | 1,004,869 | 1,022,924 |
Liquidity coverage ratio (%)⁸ | | 124 | 123 | 110 |
Other | | | | |
Invested assets (CHF billion)⁹ | | 2,689 | 2,734 | 2,390 |
Personnel (full-time equivalents) | | 60,099 | 60,155 | 60,205 |
Market capitalization¹⁰ | | 75,147 | 63,526 | 65,007 |
Total book value per share (CHF)¹⁰ | | 14.75 | 13.94 | 12.74 |
Tangible book value per share (CHF)¹⁰ | | 13.00 | 12.14 | 11.07 |
1 Represents information for UBS Group AG (consolidated). Comparative information as of 31 December 2013 is the same as previously reported for UBS AG (consolidated) as UBS Group AG (consolidated) is considered to be the continuation of UBS AG (consolidated). Refer to the “The legal structure of UBS Group” section and to “Note 1 Summary of significant accounting policies” in the “Consolidated financial statements” section of this report for more information. 2 Refer to "Note 9 Earnings per share (EPS) and shares outstanding" in the "Consolidated financial statements" section of this report for more information. 3 Refer to the "Measurement of performance" section of this report for the definitions of our key performance indicators. 4 Based on adjusted net new money, which excludes the negative effect on net new money in 2015 of CHF 9.9 billion from our balance sheet and capital optimization program. 5 Based on the Basel III framework as applicable for Swiss systemically relevant banks (SRBs). Refer to the "Capital management" section of this report for more information. 6 Calculated in accordance with Swiss SRB rules. From 31 December 2015 onward, the Swiss SRB leverage ratio denominator calculation is fully aligned with the BIS Basel III rules. Prior-period figures are calculated in accordance with former Swiss SRB rules and are therefore not fully comparable. Refer to the "Capital management" section of this report for more information. 7 Based on phase-in risk-weighted assets. 8 Refer to the "Liquidity and funding management" section of this report for more information. Figures reported for 31 December 2015 represent a 3-month average. Figures for 31 December 2014 and 31 December 2013 were calculated on a pro forma basis and represent spot numbers. 9 Includes invested assets for Personal & Corporate Banking. 10 Refer to the "UBS shares" section of this report for more information. |

UBS Group AG is incorporated and domiciled in Switzerland and operates under the Swiss Code of Obligations as an Aktiengesellschaft, a stock corporation. Its registered office is at Bahnhofstrasse 45, CH-8001 Zurich, Switzerland, phone +41-44-234 11 11, and its corporate identification number is CHE-395.345.924. UBS Group AG was incorporated on 10 June 2014 and was established in 2014 as the holding company of the UBS Group. UBS Group AG shares are listed on the SIX Swiss Exchange and on the New York Stock Exchange (ISIN: CH0244767585; CUSIP: H42097107).
UBS AG is incorporated and domiciled in Switzerland and operates under the Swiss Code of Obligations as an Aktiengesellschaft, a stock corporation. The addresses and telephone numbers of the two registered offices of UBS AG are: Bahnhofstrasse 45, CH-8001 Zurich, Switzerland, phone +41-44-234 11 11; and Aeschenvorstadt 1, CH-4051 Basel, Switzerland, phone +41-61-288 50 50. The corporate identification number is CHE-101.329.561. UBS AG is a bank. The company was formed on 29 June 1998, when Union Bank of Switzerland (founded 1862) and Swiss Bank Corporation (founded 1872) merged to form UBS AG.
Switchboards
For all general inquiries.
Zurich +41-44-234 1111
London +44-20-7568 0000
New York +1-212-821 3000
Hong Kong +852-2971 8888
www.ubs.com/contact
Investor Relations
UBS’s Investor Relations team supports institutional, professional and retail investors from our offices in Zurich, London, New York and Singapore.
UBS Group AG, Investor Relations
P.O. Box, CH-8098 Zurich, Switzerland
www.ubs.com/investors
Hotline Zurich +41-44-234 4100
Hotline New York +1-212-882 5734
Fax (Zurich) +41-44-234 3415
Media Relations
UBS’s Media Relations team supports
global media and journalists from
offices in Zurich, London, New York
and Hong Kong.
www.ubs.com/media
Zurich +41-44-234 8500
mediarelations@ubs.com
London +44-20-7567 4714
ubs-media-relations@ubs.com
New York +1-212-882 5857
mediarelations-ny@ubs.com
Hong Kong +852-2971 8200
sh-mediarelations-ap@ubs.com
Office of the Group Company Secretary
The Group Company Secretary receives
inquiries on compensation and related
issues addressed to members of the
Board of Directors.
UBS Group AG, Office of the
Group Company Secretary
P.O. Box, CH-8098 Zurich, Switzerland
sh-company-secretary@ubs.com
Hotline +41-44-235 6652
Fax +41-44-235 8220
Shareholder Services
UBS’s Shareholder Services team, a unit
of the Group Company Secretary office, is
responsible for the registration of the
global registered shares.
UBS Group AG, Shareholder Services
P.O. Box, CH-8098 Zurich, Switzerland
sh-shareholder-services@ubs.com
Hotline +41-44-235 6652
Fax +41-44-235 8220
US Transfer Agent
For global registered share-related
inquiries in the US.
Computershare Trust Company NA
P.O. Box 30170
College Station
TX 77842-3170, USA
Shareholder online inquiries:
https://www-us.computershare.com/
investor/Contact
Shareholder website:
www.computershare.com/investor
Calls from the US +1-866-305-9566
Calls from outside
the US +1-781-575-2623
TDD for hearing impaired
+1-800-231-5469
TDD Foreign Shareholders
+1-201-680-6610
Corporate calendar UBS Group AG
Publication of the first quarter 2016 report: Tuesday, 3 May 2016
Annual General Meeting 2016: Thursday, 10 May 2016
Publication of the second quarter 2016 report: Friday, 29 July 2016
Publication of the third quarter 2016 report: Tuesday, 1 November 2016
Corporate calendar UBS AG
Publication of the first quarter 2016 report: Friday, 6 May 2016
Additional publication dates of quarterly and annual reports
will be made available as part of the corporate calendar of UBS AG at www.ubs.com/investors.
Publisher: UBS Group AG, Zurich, Switzerland | www.ubs.com
Language: English
© UBS 2016. The key symbol and UBS are among the registered and unregistered trademarks of UBS. All rights reserved.
UBS and its businesses
We provide financial advice and solutions to private, institutional and corporate clients worldwide, as well as private clients in Switzerland. The operational structure of the Group is comprised of our Corporate Center and five business divisions: Wealth Management, Wealth Management Americas, Personal & Corporate Banking, Asset Management and the Investment Bank. Our strategy builds on the strengths of all of our businesses and focuses our efforts on areas in which we excel, while seeking to capitalize on the compelling growth prospects in the businesses and regions in which we operate, in order to generate attractive and sustainable returns for our shareholders. All of our businesses are capital-efficient and benefit from a strong competitive position in their targeted markets.
Wealth Management
Wealth Management provides comprehensive advice and financial services to wealthy private clients around the world, with the exception of those served by Wealth Management Americas. UBS is a global firm with global capabilities, and its clients benefit from a full spectrum of resources, including wealth planning, investment management solutions and corporate finance advice, banking and lending solutions, as well as a wide range of specific offerings. Wealth Management’s guided architecture model gives clients access to a wide range of products from the world's leading third-party institutions that complement its own products.
Wealth Management Americas
Wealth Management Americas is one of the leading wealth managers in the Americas in terms of financial advisor productivity and invested assets. Its business includes UBS’s domestic US and Canadian wealth management businesses, as well as international business booked in the US. It provides a fully integrated set of wealth management solutions designed to address the needs of ultra high net worth and high net worth clients.
Personal & Corporate Banking
Effective January 2016, the business division Retail & Corporate was renamed Personal & Corporate Banking. This change is reflected throughout this report.
Personal & Corporate Banking provides comprehensive financial products and services to UBS's private, corporate and institutional clients in Switzerland, maintaining a leading position in these segments and embedding its offering in a multi-channel approach. The business is a central element of UBS’s universal bank delivery model in Switzerland, supporting other business divisions by referring clients and growing the wealth of the firm's private clients so they can be transferred to Wealth Management. Personal & Corporate Banking leverages the cross-selling potential of UBS's asset-gathering and investment bank businesses, and manages a substantial part of UBS’s Swiss infrastructure and banking products platform.
Asset Management
Effective October 2015, the business division Global Asset Management was renamed Asset Management. This change is reflected throughout this report.
Asset Management is a large-scale asset manager, with a presence in 22 countries. It offers investment capabilities and investment styles across all major traditional and alternative asset classes to institutions, wholesale intermediaries and wealth management clients around the world. It is a leading fund house in Europe, the largest mutual fund manager in Switzerland, the third-largest international asset manager in Asia, the second largest fund of hedge funds manager and one of the largest real estate investment managers in the world.
Investment Bank
The Investment Bank provides corporate, institutional and wealth management clients with expert advice, innovative solutions, execution and comprehensive access to international capital markets. It offers advisory services and provides in-depth cross-asset research, along with access to equities, foreign exchange, precious metals and selected rates and credit markets, through its business units, Corporate Client Solutions and Investor Client Services. The Investment Bank is an active participant in capital markets flow activities, including sales, trading and market-making across a range of securities.
Corporate Center
Corporate Center is comprised of Services, Group Asset and Liability Management (Group ALM) and Non-core and Legacy Portfolio. Services includes the Group’s control functions such as finance, risk control (including compliance) and legal. In addition, it provides all logistics and support services, including operations, information technology, human resources, regulatory relations and strategic initiatives, communications and branding, corporate services, physical security, information security as well as outsourcing, nearshoring and offshoring. Group ALM is responsible for centrally managing the Group’s liquidity and funding position, as well as providing other balance sheet and capital management services to the Group. Non-core and Legacy Portfolio is comprised of the non-core businesses and legacy positions that were part of the Investment Bank prior to its restructuring.
Our Board of Directors as of 31 December 2015

 1 Axel A. Weber Chairman of the Board of Directors / Chairperson of the Corporate Culture and Responsibility Committee / Chairperson of the Governance and Nominating Committee 2 David Sidwell Senior Independent Director / Chairperson of the Risk Committee / member of the Governance and Nominating Committee 3 Reto Francioni Member of the Compensation Committee / member of the Corporate Culture and Responsibility Committee / member of the Risk Committee 4 Ann F. Godbehere Chairperson of the Compensation Committee / member of the Audit Committee 5 William G. Parrett Chairperson of the Audit Committee / member of the Compensation Committee / member of the Corporate Culture and Responsibility Committee 6 Isabelle Romy Member of the Audit Committee / member of the Governance and Nominating Committee 7 Beatrice Weder di Mauro Member of the Audit Committee / member of the Risk Committee 8 Joseph Yam Member of the Corporate Culture and Responsibility Committee / member of the Risk Committee 9 Axel P. Lehmann Member of the Risk Committee until 31 December 2015 10 Jes Staley (resigned as of 28 October 2015) Michel Demaré (not on this picture) Independent Vice Chairman / member of the Audit Committee / member of the Compensation Committee / member of the Governance and Nominating Committee
The Board of Directors (BoD) of UBS Group AG and UBS AG, each under the leadership of the Chairman, consists of six to twelve members as per our Articles of Association (AoA). The BoD decides on the strategy of the Group upon recommendation of the Group Chief Executive Officer (Group CEO) and is responsible for the overall direction, supervision and control of the Group and its management as well as for supervising compliance with applicable laws, rules and regulations. The BoD exercises oversight over UBS Group AG and its subsidiaries and is responsible for ensuring the establishment of a clear Group governance framework to ensure effective steering and supervision of the Group, taking into account the material risks to which UBS Group AG and its subsidiaries are exposed. The BoD has ultimate responsibility for the success of the Group and for delivering sustainable shareholder value within a framework of prudent and effective controls, approves all financial statements for issue and appoints and removes all Group Executive Board (GEB) members.
Our Group Executive Board as of 31 December 2015

 1 Sergio P. Ermotti Group Chief Executive Officer 2 Markus U. Diethelm Group General Counsel 3 Lukas Gähwiler President Personal & Corporate Banking and President UBS Switzerland 4 Ulrich Körner President Asset Management and President UBS Europe, Middle East and Africa 5 Tom Naratil Group Chief Financial Officer and Group Chief Operating Officer until 31 December 2015 / President Wealth Management Americas and President UBS Americas as of 1 January 2016 6 Andrea Orcel President Investment Bank 7 Jürg Zeltner President Wealth Management 8 Philip J. Lofts Group Chief Risk Officer until 31 December 2015 9 Robert J. McCann President Wealth Management Americas and President UBS Americas until 31 December 2015 10 Chi-Won Yoon President UBS Asia Pacific until 31 December 2015
UBS Group AG and UBS AG operate under a strict dual board structure, as mandated by Swiss banking law, and therefore the BoD delegates the management of the business to the GEB. Under the leadership of the Group CEO, the GEB has executive management responsibility for the steering of the Group and its business. It assumes overall responsibility for developing the Group and business division strategies and the implementation of approved strategies.
® Refer to “Board of Directors” and “Group Executive Board” in the “Corporate governance” section of this report or to www.ubs.com/bod and www.ubs.com/geb, for the full biographies of our BoD and GEB members
The making of UBS
UBS has played a pivotal role in the development and growth of Switzerland’s banking tradition since the firm’s origins in the mid-19th century.
The origins of the banking industry in Switzerland can be traced back to medieval times. This long history may help explain the widespread impression, reinforced in popular fiction, that Switzerland has always possessed a strong financial sector. In reality, the size and international reach of the Swiss banking sector today is largely a product of the second half of the 20th century, strongly influenced by two banks: Union Bank of Switzerland and Swiss Bank Corporation (SBC), which merged to form UBS in 1998.
At the time of the merger, both banks were already well-established and successful in their own right. Union Bank of Switzerland celebrated its 100th anniversary in 1962, tracing its origins back to the Bank in Winterthur. SBC marked its centenary in 1972 with celebrations in honor of its founding forebear, the Basler Bankverein. The historical roots of PaineWebber, acquired by UBS in 2000, go back to 1879, while S.G. Warburg, the historical pillar of UBS’s Investment Bank, commenced operations in 1946.
In the early 1990s, SBC and Union Bank of Switzerland were both commercial banks operating mainly out of Switzerland. The banks shared a similar vision: to become a world leader in wealth management, a successful global investment bank and a top-tier global asset manager, while remaining an important commercial and retail bank in their home market of Switzerland.
Union Bank of Switzerland, the largest Swiss bank of its time, pursued these goals primarily through a strategy of organic growth. In contrast, SBC, then the third-largest Swiss bank, grew mainly through a combination of partnerships and acquisitions. In 1989, SBC started a joint venture with O’Connor, a leading US derivatives firm, before fully acquiring it in 1992. In 1994, SBC added to its capabilities when it acquired Brinson Partners, a leading US-based institutional asset management firm.
The next major milestone was in 1995, when SBC acquired S.G. Warburg, the British merchant bank. The deal helped SBC fill a strategic gap in its corporate finance, brokerage, and research capabilities and, most importantly, brought with it an institutional client franchise that remains crucial to our equities business to this day.

The 1998 merger of SBC and Union Bank of Switzerland into the firm we know today created a world-class wealth manager and the largest universal bank in Switzerland, complemented by a strong investment bank and a leading global institutional asset manager. In 2000, UBS grew further with the acquisition of PaineWebber, establishing the firm as a significant player in the US. Over the last 50+ years, UBS has established a strong presence in the Asia Pacific region, where it is the leading wealth manager and a top-tier investment bank, as well as in the emerging markets.
In 2007, the effects of the global financial crisis started to be felt across the financial industry. This crisis had its origins in the securitized financial product business linked to the US residential real estate market. Between the third quarter of 2007 and the fourth quarter of 2009, we incurred significant losses on these types of assets. We responded with decisive action, designed to reduce risk exposures and stabilize our businesses, including raising capital. Since then, we have continued to improve the firm’s capital strength to meet new and enhanced industry-wide regulatory requirements. Our position as one of the world’s best-capitalized banks, together with our stable funding and sound liquidity positions, provides us with a solid foundation for our success.
In 2012, the year of our 150th anniversary, we accelerated the strategic transformation to create a business model that is better adapted to the new regulatory and market conditions and that we believe results in more consistent and high-quality returns. To this effect, we launched the Pillars, Principles and Behaviors in 2014 as a foundation for our new corporate strategy, identity and culture. In the same year, we established UBS Group AG as the Group holding company and, in 2015, we transferred the Personal & Corporate Banking and the Wealth Management business booked in Switzerland from UBS AG to the wholly owned subsidiary UBS Switzerland AG, with its own banking license, thereby significantly advancing our strategic transformation process.
We remain committed to executing our strategy aimed at ensuring the firm’s long-term success and delivering sustainable returns for our shareholders.
® Refer to www.ubs.com/history for more information on UBS’s history of more than 150 years
The legal structure of UBS Group
Over the past two years, we have undertaken a series of measures to improve the resolvability of the Group in response to too big to fail (TBTF) requirements in Switzerland and other countries in which the Group operates.
In December 2014, UBS Group AG completed an exchange offer for the shares of UBS AG and established UBS Group AG as the holding company for UBS Group.
During 2015, UBS Group AG filed and completed a court procedure under article 33 of the Swiss Stock Exchange Act (SESTA procedure) resulting in the cancellation of the shares of the remaining minority shareholders of UBS AG. As a result, UBS Group AG now owns 100% of the outstanding shares of UBS AG.
In June 2015, we transferred our Personal & Corporate Banking and Wealth Management business booked in Switzerland from UBS AG to UBS Switzerland AG.
In the second quarter of 2015, we also completed the implementation of a more self-sufficient business and operating model for UBS Limited, our investment banking subsidiary in the UK, under which UBS Limited bears and retains a larger proportion of the risk and reward in its business activities.

In the third quarter, we established UBS Business Solutions AG as a direct subsidiary of UBS Group AG to act as the Group service company. We will transfer the ownership of the majority of our existing service subsidiaries to this entity. We expect that the transfer of shared service and support functions into the service company structure will be implemented in a staged approach through 2018. The purpose of the service company structure is to improve the resolvability of the Group by enabling us to maintain operational continuity of critical services should a recovery or resolution event occur.
Also during 2015, UBS AG established a new subsidiary, UBS Americas Holding LLC, which we intend to designate as our intermediate holding company for our US subsidiaries prior to the 1 July 2016 deadline under new rules for foreign banks in the US pursuant to the Dodd-Frank Wall Street Reform and Consumer Protection Act (Dodd-Frank). During the third quarter of 2015, UBS AG contributed its equity participation in the principal US operating subsidiaries to UBS Americas Holding LLC to meet the requirement under Dodd-Frank that the intermediate holding company own all of our US operations, except branches of UBS AG.
® Refer to the “Legal entity financial and regulatory information” section of this report for more information
We have also established a new subsidiary of UBS AG, UBS Asset Management AG, into which we expect to transfer the majority of the operating subsidiaries of Asset Management during 2016. We continue to consider further changes to the legal entities used by Asset Management, including the transfer of operations conducted by UBS AG in Switzerland into a subsidiary of UBS Asset Management AG.
Our strategy, our business and the way we serve the vast majority of our clients are not affected by these changes. These plans do not create the need to raise additional common equity capital and are not expected to materially affect the firm’s capital-generating capability.
We are confident that the establishment of UBS Group AG and UBS Switzerland AG, along with our other announced measures, will substantially enhance the resolvability of the Group. The Swiss Financial Market Supervisory Authority (FINMA) has confirmed that these measures are in principle suitable to warrant a capital requirement rebate under the current Swiss capital regulation. Therefore, the Group should qualify for a rebate on the gone concern requirements under the new Swiss TBTF proposal, which should result in lower overall capital requirements for the Group. The amount and timing of any such rebate will depend on the actual execution of these measures and can therefore only be specified once all measures have been implemented.
We continue to consider further changes to the Group’s legal structure in response to capital and other regulatory requirements, and in order to obtain any rebate in capital requirements for which the Group may be eligible. Such changes may include the transfer of operating subsidiaries of UBS AG to become direct subsidiaries of UBS Group AG, consolidation of operating subsidiaries in the European Union, and adjustments to the booking entity or location of products and services. These structural changes are being discussed on an ongoing basis with FINMA and other regulatory authorities, and remain subject to a number of uncertainties that may affect their feasibility, scope or timing.

External reporting approach
General requirements
Our external reporting requirements and the scope of our external reports are defined by general accounting law and principles, relevant stock and debt listing rules, specific legal and regulatory requirements, as well as by our own financial reporting policies. As a global firm with shares listed both on the SIX Swiss Exchange and the NYSE, we have to prepare and publish consolidated financial statements in accordance with International Financial Reporting Standards (IFRS) on at least a half-yearly basis. However, we have decided to publish our results on a quarterly basis in order to provide shareholders with more timely disclosures than required by law. Additionally, statutory financial statements are prepared annually as the basis for our Swiss tax return, the appropriation of retained earnings and a potential distribution of dividends, subject to shareholder approval at the Annual General Meeting (AGM). Management’s discussion and analysis (MD&A) complements our annual financial statements by providing information on (i) our strategy and the environment in which we operate, (ii) the financial and operating performance of our business divisions and Corporate Center, (iii) our risk, treasury and capital management and (iv) our corporate governance, corporate responsibility and compensation frameworks.
Our Annual Reports and Form 20-F
Information on UBS Group AG and on UBS AG is available on www.ubs.com/investors as follows:
– A combined Annual Report providing all relevant and required disclosures for both UBS Group AG and UBS AG, which is also the basis for our combined Form 20-F filing, and
– An Annual Report for UBS Group AG only.
The MD&A included in the combined Annual Report is on a UBS Group AG consolidated basis, unless otherwise specified. In particular, specific UBS AG (consolidated) information is provided with respect to risk profile, capital and leverage ratio, as well as corporate governance. Financial information for UBS AG (consolidated) does not differ materially from UBS Group AG on a consolidated basis. Refer to the table "Comparison UBS Group AG (consolidated) versus UBS AG (consolidated)" in the "Consolidated financial statements" section of this report for more information.

Operating environment and strategy
Signposts Throughout the Annual Report, signposts that are displayed at the beginning of a section, table or chart – Audited | EDTF | Pillar 3 | – indicate that those items have been audited, have addressed the recommendations of the Enhanced Disclosure Task Force, or satisfy Basel Pillar 3 disclosure requirements, respectively. A “triangle” symbol – ▲▲▲ – indicates the end of the signpost. |
Operating environment and strategy
Current market climate
Current market climate
The global economy expanded in aggregate, but divergent growth trends were in evidence, and disinflationary factors persisted.
Global economic developments in 2015
2015 was a year of expanding global output, characterized by gradual improvement in advanced economies, set against a continued slowing in emerging economies.
Many large advanced economies – in particular, the eurozone and Japan – enjoyed a stronger pace of economic activity, underpinned by continued loose monetary policy. However, global inflation rates remained unexpectedly low, as a result of a rebalancing of the Chinese economy, ongoing deleveraging in corporate sectors with excessive debt and oversupply, and continued commodity price declines driven by supply / demand imbalances.
A number of macroeconomic and geopolitical shocks impacted the path of global economic expansion. Particularly noteworthy were the fear of a Greek exit from the eurozone, a first quantitative easing package from the European Central Bank, which was extended later in the year, extreme volatility in Chinese onshore equity markets, uncertainty around the timing and speed of US interest rate rises, and policy decisions by the Swiss National Bank (SNB).
Switzerland
In UBS's home market, the year began with a decision by the SNB to discontinue the minimum targeted exchange rate for the Swiss franc versus the euro, which had been in place since September 2011. At the same time, the SNB lowered the interest rate on deposit account balances at the SNB that exceed a given exemption threshold by 50 basis points to negative 0.75%.
This move created difficult conditions for Swiss franc depositors, and reduced the profitability of many financial market transactions in Swiss francs. In aggregate, continued Swiss franc strength against the euro, as well as the British pound, led to material deflationary pressures on the local economy and negatively affected the contribution of net exports and inventories to Swiss economic growth.
However, strong domestic consumption trends continued, aided in part by an annual population growth of 1.2%.
United States
The US economy expanded modestly and consumer spending remained the biggest contributor to economic growth. However, a strong US dollar dampened the growth contribution from net exports. Business sentiment and investment intentions remained cautious, given concerns over worldwide growth in demand.
US labor markets showed significant improvements, as the unemployment rate declined and real labor income increased. The Board of Governors of the Federal Reserve System (Federal Reserve) determined labor market and core inflation data to be sufficiently strong to raise the target range of the federal funds rate in December 2015 from 0-0.25% to 0.25-0.5%, the first interest rate hike in nine years.
Eurozone
In the eurozone, economic growth gained momentum, as monetary policy efforts fostered lending growth. The European Central Bank announced monetary policy-easing measures in January 2015, specifically a quantitative easing program of EUR 60 billion per month to lower economy-wide borrowing costs. The resulting euro depreciation also offered significant support to export-oriented eurozone economies.
Significant easing in financial conditions in the first quarter of 2015 supported stronger monetary growth and real activity. This was corroborated by stronger lending growth via the banking sector. However, despite these positive developments, concerns over the economic slowdown and rebalancing in emerging markets, notably China, led to some softening in real activity and confidence indicators in the latter half of the year. Fiscal conditions moved from significant austerity toward a neutral position with respect to growth impact.
Japan
The pace of Japanese economic growth improved compared to the recession in 2014, but was constrained by relatively low wage growth. An increase in sales taxes implemented in April 2014 continued to weigh on consumer demand through 2015, and lower energy prices were not sufficient to offset slow wage growth. Additionally, the aforementioned sales tax increase did not raise core inflation, which lingered well below the Bank of Japan’s 2% target throughout the second half of 2015.
Concerns over the impact of slower growth in China, and the reluctance of the Bank of Japan to further loosen its monetary policy, also impacted international demand for Japanese goods and services.
China
In China, policymakers responded to private-sector debt imbalances and excess industrial capacity with material easing in monetary and banking financial conditions. However, GDP growth continued to slow compared with prior years.
High private-sector leverage, a large policy-induced switch from investment-driven to consumption-driven growth, and a deceleration in property market activity resulted in slowing industrial output, tightening of onshore financing conditions, and building domestic deflationary pressures. Lower demand for commodities also reflected global disinflationary forces, which were supplemented by a surprise devaluation of the Chinese yuan against the US dollar in August.
A mixture of tighter macroprudential policy and less state support for overindebted businesses led to higher credit spreads and sharp equity market declines as a speculation bubble in the stock market unwound. The Chinese authorities responded with several interest rate and reserve ratio requirement cuts, which resulted in some evidence of a stabilizing real economic growth trend, albeit at a lower level, by year-end.
In late November, the Chinese yuan was accepted for inclusion in the International Monetary Fund's Special Drawing Rights basket, with effect from October 2016.
Other emerging markets
Other major emerging markets continued to face challenges ranging from overly tight domestic financial conditions, inflation pressures arising from currency depreciation, and lower commodity prices.
Large depreciation in local currencies and higher costs of borrowing were seen in select emerging countries, as the prospect and eventual decision from the Fed to raise US interest rates resulted in a strengthening US dollar and elevated costs of external funding.
The Russian economy was particularly impacted by ongoing economic sanctions, negative ramifications of a lower oil price on government finances and the weakness of the Russian ruble against the US dollar. Local financial conditions remained tight, following the Central Bank of Russia’s moves to stem the declining international value of the currency by raising domestic policy interest rates late in 2014.
Geopolitical developments, such as corruption allegations in Brazil and tensions between oil-producing Saudi Arabia and Iran, highlighted the idiosyncratic risks of doing business and investing in emerging economies.
Economic and market outlook for 2016
Based on UBS Research’s economic models, we expect a modest slowing in the pace of global economic expansion in 2016, with significant underlying differences in growth rates dependent on the degree of economy-wide deleveraging.
The US, where private sector deleveraging is most advanced, should enjoy higher labor income gains and robust domestic consumer activity. However, inventory effects and lower investment due to oil price declines may offset this positive consumer outlook. Additionally, the US high-yield bond market may experience an increase in defaults, concentrated particularly in the energy sector.
In the eurozone, we observe persistent support from loose monetary policy and expect a rise in real disposable spending power, more readily available credit, and mildly expansionary fiscal policy. Together, these factors should support a moderate improvement in growth prospects.
Swiss economic growth should continue at a pace similar to 2015, and we expect downward pressure on year-on-year inflation to persist due to the ongoing impact of low commodity prices.
Japan's economic growth will likely remain heavily dependent on domestic demand. The negative impact of lower oil prices on consumer price inflation should abate, but inflation is expected to miss the Bank of Japan's 2% inflation target in 2016.
We expect emerging markets to stabilize in aggregate, but exhibit heterogeneous growth paths. We believe China is likely to avoid a hard landing as a result of continued monetary policy loosening and fiscal stimulus. However, the broader Asia region may remain under pressure from slower trade growth, high levels of debt, and disinflationary pressures.
We are closely monitoring a number of potential geopolitical risks. These include, but are not limited to, uncertainty over the UK's status in the EU; the impact of migration on European politics; disruptions to political systems driven by emergent political parties or organizations; an escalation of geopolitical tension in the Middle East and North Africa; and acts of terrorism or cyberattacks. The realization of any of these risks could pose wider challenges to the global economic outlook.
Operating environment and strategy
Regulation and supervision
Regulation and supervision
The Swiss Financial Market Supervisory Authority is UBS’s home country regulator and consolidated supervisor. As a financial services provider with a global footprint, we are also regulated and supervised by the relevant authorities in each of the jurisdictions in which we conduct business. The following sections summarize the key regulatory requirements and supervision of our business in Switzerland as well as in the US and the UK, our next two largest areas of operations.
UBS Group AG and its subsidiaries are subject to consolidated supervision by the Swiss Financial Market Supervisory Authority (FINMA) under the Swiss Federal Law on Banks and Savings Banks (Banking Act), and the related ordinances which impose requirements, including minimum capital, liquidity, risk concentration and organizational requirements. Through UBS AG and UBS Switzerland AG, which are licensed as banks in Switzerland, we may engage in a full range of financial services activities in Switzerland and abroad, including personal banking, commercial banking, investment banking and asset management.
We are also subject to supervision and functional regulation in the markets in which we operate outside of Switzerland, including the US, the UK and the EU. Since the financial crisis of 2007–2009, regulation of financial services firms has been undergoing significant changes both in Switzerland and in the other countries where we operate. These changes, which continue to require significant resources to implement, have a significant effect on how we conduct our business and result in increased ongoing costs.
® Refer to the “Regulatory and legal developments” and "Risk factors" sections of this report for more information.
Regulation and supervision in Switzerland
Capital regulation
A revised banking ordinance and capital adequacy ordinance implementing the Basel III capital standards and the Swiss too big to fail (TBTF) law became effective on 1 January 2013.
In 2015, the Swiss Federal Council published proposed revisions to the Swiss TBTF framework. For Swiss systemically relevant banks (SRBs) that operate internationally, including UBS, the proposal would increase the existing Swiss SRB capital requirements based on risk-weighted assets (RWA) and the leverage ratio denominator and would establish an additional “gone concern” requirement, which, together with the going concern requirement, represents the total loss-absorbing capacity (TLAC) required for Swiss SRBs. The new requirements would be phased in and become fully applicable by 1 January 2020. The proposal would make the Swiss capital regime among the most demanding in the world. In addition, Swiss authorities have exercised authority to impose countercyclical capital buffers for real estate related exposures in Switzerland and we have agreed with FINMA to an incremental operational risk capital buffer.
The Basel Committee on Banking Supervision (BCBS) has issued far-reaching proposals on changes to the standardized approach to credit risk and to the calculation of operational risk, as well as a revised market risk framework. It has introduced mandatory disclosure of RWA based on a harmonized approach. It is also conducting a review of the risk-based capital framework and is expected to issue proposals on the design of a capital floor framework. We expect that Switzerland will incorporate the revisions to the BCBS framework in its capital requirements following completion of the proposals.
® Refer to the "Regulatory and legal developments," "Risk factors" and "Capital management" sections of this report for more information.
Liquidity and funding
As a Swiss SRB, we are required to maintain a liquidity coverage ratio (LCR) of high-quality liquid assets to estimated stressed net short-term funding outflows, and will be required to maintain a net stable funding ratio (NSFR), which are intended to ensure that we are not overly reliant on short-term funding and that we have sufficient long-term funding for illiquid assets.
® Refer to the "Treasury management" and "Risk factors" sections of this report for more information.
Resolution planning and resolvability
The revised Swiss Banking Act and capital adequacy ordinances provide FINMA with additional powers to intervene in order to prevent a failure or resolve a failing financial institution, including UBS Group, UBS AG and UBS Switzerland AG. These measures may be triggered when certain thresholds are breached and permit the exercise of considerable discretion by FINMA in determining whether, when or in what manner to exercise such powers. In case of a possible insolvency, FINMA may impose more onerous requirements on us, including restrictions on the payment of dividends and interest. Although the actions that FINMA may take in such circumstances are not yet defined, we could be required directly or indirectly, for example, to alter our legal structure (e.g., to separate lines of business into dedicated entities, with limitations on intra-group funding and certain guarantees), or to reduce business risk in some manner. The Swiss Banking Act also provides FINMA with the ability to extinguish or convert to common equity the liabilities of a bank in connection with its resolution.
Swiss TBTF requirements require Swiss SRBs, including UBS, to put in place viable emergency plans to preserve the operation of systemically important functions despite a failure of the institution, to the extent that such activities are not sufficiently separated in advance. The current Swiss TBTF law provides for the possibility of a limited rebate on capital requirements for Swiss SRBs that adopt measures to reduce resolvability risk beyond what is legally required. Such measures include changes to the legal structure of a bank group in a manner that would insulate parts of the group to exposure from risks arising from other parts of the group, thereby making it easier to dispose of certain parts of the group in a recovery scenario, to liquidate or dispose of certain parts of the group in a resolution scenario or to execute a debt bail-in. The proposal for a revised TBTF ordinance also contemplates a limited rebate on the proposed TLAC requirement based on improvements to resolvability. However, there is no certainty with respect to timing or size of a potential rebate.
® Refer to the “Regulatory and legal developments” section of this report for more information on proposed revisions to the Swiss TBTF framework
® Refer to “If we experience financial difficulties, FINMA has the power to open resolution or liquidation proceedings or impose protective measures in relation to UBS Group AG, UBS AG or UBS Switzerland AG, and such proceedings or measures may have a material adverse effect on our shareholders and creditors” in the “Risk factors” section of this report for more information
® Refer to the “The legal structure of UBS Group” section of this report for more information
Supervision
FINMA fulfills its statutory supervisory responsibilities through licensing, regulation, monitoring and enforcement. Generally, prudential supervision in Switzerland is based on a division of tasks between FINMA and authorized audit firms. Under this two-tier supervisory system, FINMA has responsibility for overall supervision and enforcement measures while the authorized audit firms carry out official duties on behalf of FINMA. The responsibilities of external auditors encompass the audit of financial statements, the risk-based assessment of banks’ compliance with prudential requirements and on-site audits.
As we are considered systemically relevant in Switzerland, we are subject to more rigorous supervision than most other Swiss banks. To promote supervisory cooperation and coordination, FINMA has implemented a Supervisory College and a Crisis Management College with US and UK authorities and an expanded General Supervisory College, including more than a dozen of our host regulators.
The Swiss National Bank (SNB) contributes to the stability of the financial system through macro-prudential measures and monetary policy, while also providing liquidity to the banking system. It does not exercise any banking supervision authority and is not responsible for enforcing banking legislation, but works together with FINMA to assist in the regulation of Swiss systemically relevant banks.
® Refer to the “Regulatory and legal developments” and “Risk factors” sections of this report for more information
Regulation and supervision outside of Switzerland
Regulation and supervision in the US
We maintain branches of UBS AG in the US and as a result, our operations in the US are subject to overall regulation and supervision by the Board of Governors of the Federal Reserve (Federal Reserve Board) under a number of laws. UBS AG has been designated a financial holding company under the Bank Holding Company Act of 1956, as amended (BHCA). Financial holding companies may engage in a broader spectrum of activities than holding companies of US banks or foreign banking organizations that are not financial holding companies. These activities include expanded authority to underwrite and deal in securities and commodities and to make merchant banking investments in commercial and real estate entities. To maintain our financial holding company status, (i) the Group and UBS Bank USA (a Federal Deposit Insurance Corporation (FDIC)-insured depository institution subsidiary), are required to meet certain capital ratios, (ii) the US branches of UBS AG and UBS Bank USA are required to maintain certain examination ratings, and (iii) UBS Bank USA is required to maintain a rating of at least “satisfactory” under the Community Reinvestment Act of 1977.
We are subject to Federal Reserve Board regulations issued under the Dodd-Frank Act that from 1 July 2016 will require foreign banking organizations (FBO) operating in the US to hold all US subsidiary operations through a single US intermediate holding company (IHC). The regulations require our IHC to meet risk-based capital, leverage ratio and liquidity requirements, subject the IHC to Federal Reserve Board stress test and capital plan requirements and impose governance requirements on the IHC and our operations in the US.
Regulations implementing the "Volcker Rule" became effective in July 2015. In general, the Volcker Rule prohibits any banking entity from engaging in proprietary trading and from owning interests in hedge funds and other private fund vehicles. The Volcker Rule also broadly limits investments and other transactional activities between a bank and funds that the bank has sponsored or with which the bank has certain other relationships. The Volcker Rule permits us and other non-US banking entities to engage in certain activities that would otherwise be prohibited to the extent that they are conducted entirely outside the US and certain other conditions are met. We have established a global compliance and reporting framework to ensure compliance with the Volcker Rule and the available exemptions. Although the full effect of the Volcker Rule remains uncertain given the complexity of the implementing regulations and the required compliance framework, it could have a substantial impact on market liquidity and the economics of market-making activities.
Operating environment and strategy
Regulation and supervision
UBS AG maintains branches and representative offices in several states, including Connecticut, Illinois, New York, California and Florida. These branches are authorized and supervised either by the Office of the Comptroller of the Currency (OCC) or the state banking authority of the state in which the branch is located. We also maintain a trust company and UBS Bank USA, which are licensed and regulated by state regulators. Only the deposits of UBS Bank USA, headquartered in the state of Utah, are insured by the FDIC. The regulation of our US branches and subsidiaries imposes activity and prudential restrictions on the business and operations of those branches and subsidiaries, including limits on extensions of credit to any single borrower and on transactions with affiliates.
The licensing authority of each state-licensed US branch may, in certain circumstances, take possession of the business and property of UBS located in the state of the UBS offices it licenses. These circumstances generally include violations of law, unsafe business practices and insolvency. As long as we maintain one or more federal branches licensed by the OCC, the OCC also has the authority to take possession of all the US operations of UBS under broadly similar circumstances, as well as in the event that a judgment against a federally licensed branch remains unsatisfied. If exercised, this federal power would pre-empt the state insolvency regimes that would otherwise be applicable to our state-licensed branches. As a result, if the OCC exercised its authority over the US branches of UBS pursuant to federal law in the event of a UBS insolvency, all US assets of UBS would generally be applied first to satisfy creditors of UBS’s US branches as a group, and then made available for application pursuant to any Swiss insolvency proceeding.
UBS Financial Services Inc. and UBS Securities LLC, as well as our other US-registered broker-dealer subsidiaries, are subject to laws and regulations that cover all aspects of the securities and futures business. These entities are regulated by a number of different government agencies and self-regulatory organizations, including the Securities and Exchange Commission (SEC), the Financial Industry Regulatory Authority, the Commodities Futures Trading Commission (CFTC), the Municipal Securities Rulemaking Board and the exchanges of which it is a member, depending on the specific nature of the respective broker-dealer’s business. In addition, the US states and territories have local securities commissions that regulate and monitor activities in the interest of investor protection. These regulators have a variety of sanctions available, including the authority to conduct administrative proceedings that can result in censure, fines, the issuance of cease-and-desist orders or the suspension or expulsion of the broker-dealer or its directors, officers or employees.
UBS Asset Management (Americas) Inc. and our other US-registered investment advisor entities are regulated primarily by the SEC and are subject to regulations that cover all aspects of the investment advisory business. Some of these entities are also registered with the CFTC as commodity trading advisors (CTAs) and / or commodity pool operators (CPOs) and in connection with their activities as CTAs and / or CPOs are regulated by the CFTC. To the extent these entities manage plan assets of employee benefit plans subject to the Employee Retirement Income Security Act of 1974, their activities are subject to regulation by the US Department of Labor.
® Refer to the “Regulatory and legal developments” and “Risk factors” sections of this report for more information
Regulation and supervision in the UK
Our operations in the UK are mainly regulated by two bodies: the Prudential Regulation Authority (PRA), an affiliated authority of the Bank of England, and the Financial Conduct Authority (FCA). The PRA’s main objective relating to the banking sector is to promote the safety and soundness of UK-regulated financial firms. The FCA is responsible for securing an appropriate degree of consumer protection, protecting the integrity of the UK financial system and promoting effective competition in the interest of consumers.
The PRA and FCA operate a risk-based approach to supervision and have a wide variety of supervisory tools available to them, including regular risk assessments, on-site inspections, which may relate to an industry-wide theme or be firm-specific, and the ability to commission reports by skilled persons, who may be the firm’s auditors, information technology specialists, lawyers or other consultants as appropriate. The UK regulators also have a wide set of sanctions at their disposal, which may be imposed under the Financial Services and Markets Act.
Some of our subsidiaries and affiliates are also regulated by the London Stock Exchange and other UK securities and commodities exchanges of which they are a member. We are also subject to the requirements of the UK Panel on Takeovers and Mergers, where relevant.
Financial services regulation in the UK is conducted in accordance with EU directives which require, among other things, compliance with certain capital and liquidity adequacy standards, client protection requirements and conduct of business rules, such as the Markets in Financial Instruments Directive I and recovery planning and other related requirements from the Bank Recovery and Resolution Directive. These directives apply throughout the EU and are reflected in the regulatory regimes of the various member states.
® Refer to the “Regulatory and legal developments” and “Risk factors” sections of this report for more information
Market regulation
Substantial changes in the laws and regulations governing markets and trading activity have been enacted or are being considered.
In June 2015, the Swiss Parliament adopted new regulation of the financial market infrastructure in Switzerland which came into effect on 1 January 2016 (subject to phase-in provisions) and mandates the clearing of over-the-counter (OTC) derivatives with a central counterparty.
In the EU, similar changes have been introduced largely through the new Markets in Financial Instruments Directive (MiFID II) and Regulation (MiFIR), that will make significant changes to the OTC derivative markets, to the regulation and operation of markets for other financial instruments, as well as to other related laws. These directives and more detailed implementing measures are expected to take effect in 2017. They will make significant changes to the provision of financial services in and into the European Economic Area, including increased pre- and post-trade transparency, further restrictions on the provision of inducements, introduction of a new discretionary trading venue with the aim of regulating broker crossing networks; increased regulation of algorithmic trading activities; increased conduct of business requirements; and strengthened supervisory powers which include powers for authorities to ban products or services in particular situations.
In the US, several aspects of market regulation have been addressed in the Dodd-Frank Act and subsequent additional rulemaking by the SEC and CFTC, including money market mutual fund reforms, electronic trading platform disclosure, regulation imposing systems and controls requirements, and new cybersecurity requirements, under their respective authorities.
OTC derivatives regulation
In 2009, the G20 countries committed to require all standardized OTC derivative contracts to be traded on exchanges or trading facilities and cleared through central counterparties. This commitment is being implemented through Dodd-Frank in the US and corresponding legislation in the EU, Switzerland and other jurisdictions, and has and will continue to have a significant effect on our OTC derivatives business, which is conducted primarily in the Investment Bank. For example, we expect that, as a rule, the shift of OTC derivatives trading to a central clearing model will tend to reduce profit margins in these products, although some market participants may be able to offset this effect with higher trading volumes in commoditized products. These market changes are likely to reduce the revenue potential of certain lines of business for market participants generally, and we may be adversely affected.
UBS AG registered as a swap dealer with the CFTC in the US at the end of 2012, enabling the continuation of its swaps business with US persons. We expect to register UBS AG as a security-based swap dealer with the SEC, when its registration is required. Regulations issued by the CFTC and those proposed by the SEC impose substantial new requirements on registered swap dealers for clearing, trade execution, transaction reporting, recordkeeping, risk management and business conduct. Certain of the CFTC's regulations, including those relating to swap data reporting, recordkeeping, compliance and supervision, apply to UBS AG globally. Application of the CFTC and SEC regulations continues to present a substantial implementation burden, will likely duplicate or conflict with legal requirements applicable to us outside the US, including in Switzerland, and may put us at a competitive disadvantage to firms that are not required to register as swap dealers with the SEC or CFTC.
Anti-money laundering and anti-corruption
A major focus of US government policy relating to financial institutions in recent years has been combating money laundering and terrorist financing. The US Bank Secrecy Act and other laws and regulations applicable to UBS require the maintenance of effective policies, procedures and controls to detect, prevent and report money laundering and terrorist financing, and to verify the identity of our clients. As a result, failure to maintain and implement adequate programs to prevent money laundering and terrorist financing could result in significant legal and reputational risk.
We are subject to laws and regulations in jurisdictions in which we operate, including the US Foreign Corrupt Practices Act and the UK Bribery Act, prohibiting corrupt or illegal payments to government officials and others. We maintain policies, procedures and internal controls intended to comply with these laws and regulations.
Data protection
We are subject to laws and regulations concerning the use and protection of customer, employee and other personal information and confidential information, including provisions under Swiss law, the EU Data Protection Directive and laws of other jurisdictions.
Compensation practices
We are subject to laws and regulations and regulatory oversight that significantly affect our compensation practices, including the Minder initiative in Switzerland, which requires a shareholder vote on the aggregate compensation of each of our Board of Directors and Group Executive Board, FINMA ordinances and EU regulation. These laws and regulations are intended to curb compensation deemed excessive or to ensure that the compensation structure of financial institutions does not encourage excessive risk-taking. We have made significant changes to the structure of our compensation arrangements to comply with these requirements and may make future changes as these requirements evolve.
Operating environment and strategy
Regulatory and legal developments
Regulatory and legal developments
Key developments in Switzerland
EDTF | Proposed new requirements for Swiss systemically relevant banks
In December 2015, the Federal Department of Finance published for consultation a revised too big to fail (TBTF) ordinance based on the cornerstones announced by the Swiss Federal Council in October 2015. For Swiss systemically relevant banks (SRBs) that operate internationally, the proposal would revise existing Swiss SRB capital requirements and would establish additional gone concern requirements, which, together with the going concern requirement, represents the total loss-absorbing capacity, or TLAC. TLAC encompasses regulatory capital such as common equity tier 1 (CET1), additional tier 1 (AT1) and tier 2 capital as well as liabilities that can be written down or converted into equity in case of resolution or recovery measures. The proposal would make the Swiss capital regime among the most demanding in the world.
The proposed going concern capital requirements consist of basic requirements for all Swiss SRBs to maintain a leverage ratio of 4.5% and a ratio of capital to risk-weighted assets (RWA) of 12.9%. A progressive buffer would be added on top of the basic requirements, reflecting the degree of systemic importance. The progressive buffer for UBS is expected to be 0.5% of its leverage ratio denominator (LRD) and 1.4% of RWA, resulting in total going concern capital requirements of 5.0% of LRD and 14.3% of RWA (excluding countercyclical buffer requirements). The going concern leverage ratio proposal would require a minimum CET1 capital ratio of 3.5% of LRD and of up to 1.5% in high-trigger AT1 capital instruments. The minimum CET1 capital requirement will remain unchanged at 10% of RWA, and the balance of the RWA-based capital requirement, i.e., 4.3%, may be met with high-trigger AT1 instruments.
The gone concern requirements would be 5.0% of LRD and 14.3% of RWA for internationally active Swiss SRBs and may be met with senior debt that is TLAC eligible. Banks would be eligible for a reduction of the gone concern requirements if they demonstrate improved resolvability.
The proposal envisages transitional arrangements for outstanding low- and high-trigger tier 2 instruments to qualify as going concern capital until the earlier of 31 December 2019 or their maturity or first call date. Thereafter, they may be used to meet the gone concern requirement until one year before maturity. Low-trigger AT1 capital instruments will continue to qualify as going concern capital until the first call date and thereafter may also be used to meet the gone concern requirement. The proposed Swiss TBTF ordinance would permit a reduction of up to 2% of the LRD and 5.7% of RWA gone concern requirements for measures taken to improve resolvability. The amount and timing of any such reduction will be determined by FINMA as such measures are implemented.
The new capital rules are expected to come into force as of 1 July 2016. We intend to use the four-year phase-in period to fully implement the new requirements. We intend to meet the new CET1 leverage ratio requirement of 3.5% by retaining sufficient earnings while maintaining our commitment to total capital returns to shareholders of at least 50% of net profit attributable to shareholders, provided that we maintain a fully applied CET1 capital ratio of at least 13%, and consistent with our objective of maintaining a post-stress fully applied CET1 capital ratio of at least 10%. Furthermore, we plan to continue our issuance of AT1 instruments and TLAC-eligible senior debt to meet the new requirements without increasing overall liabilities.
® Refer to “If we are unable to maintain our capital strength, this may adversely affect our ability to execute our strategy, client franchise and competitive position” in the “Risk factors” section of this report for more information
In addition to defining the new capital requirements, the Swiss Federal Council has proposed that the implementation of a Swiss emergency plan be completed by the end of 2019. The Swiss emergency plan defines the measures required to ensure a continuation of systemically relevant functions in Switzerland. ▲

Implementation of the global Automatic Exchange of Information standard underway
In December 2015, the Swiss Parliament adopted proposals to create the legal basis for the implementation of the global automatic exchange of information (AEI) standard in tax matters. At the same time, it ratified the joint Organization for Economic Cooperation and Development (OECD) and Council of Europe Convention on Mutual Administrative Assistance, as well as the Multilateral Competent Authority Agreement.
Separately, the Swiss Parliament rejected in December 2015 a draft law from the Swiss Federal Council for banks and other financial intermediaries in Switzerland to comply with enhanced due diligence requirements when accepting assets from clients resident in states without an AEI agreement.
In November 2015, the Swiss Federal Council submitted the EU-Swiss and the Australia-Swiss agreements on the AEI to Parliament for approval. In early 2016, consultations were initiated on the implementation of the AEI with the British crown dependencies of Jersey, Guernsey and the Isle of Man, as well as with Japan, South Korea, Canada, Iceland and Norway. In the past, we have experienced outflows of cross-border client assets from our Swiss booking center as a result of changes in local tax regimes or their enforcement.
® Refer to the “Risk factors” section of this report for more information
Operating environment and strategy
Regulatory and legal developments
Swiss Parliament adopts Financial Market Infrastructure Act
In June 2015, the Swiss Parliament adopted the Financial Market Infrastructure Act (FMIA). The FMIA changes the regulation of financial market infrastructure in Switzerland, to provide an international level playing field, and implements the G20 commitments on over-the-counter (OTC) derivatives in Switzerland, including (i) mandating clearing via a central counterparty, (ii) transaction reporting to a trade repository, (iii) risk mitigation measures and (iv) mandatory trading of derivatives on a stock exchange or other trading facility once this has been introduced in partner states. The FMIA also (i) introduces new licensing requirements for stock exchanges, multilateral and organized trading facilities, central counterparties, central securities depositaries, trade repositories and payment systems, (ii) imposes transparency requirements for securities trading on platforms and (iii) establishes a basis for regulating high-frequency trading. The FMIA also empowers the Swiss Federal Council to impose position limits for commodity derivatives, should this be deemed necessary at a later date. The new law entered into force in January 2016 together with the Swiss Federal Council's Financial Market Infrastructure Ordinance, the respective FINMA ordinance and amendments to the SNB's National Bank Ordinance. For some requirements, transitional periods are provided up to January and August 2017. The FMIA is expected to affect the way UBS trades securities and derivatives, particularly OTC derivatives, leading over time to standardized OTC derivatives being centrally cleared to reduce counterparty risk, and may have other effects on markets. In addition, the FMIA creates additional reporting obligations and will require foreign financial market infrastructure to obtain FINMA approval for providing services in Switzerland. UBS is taking the necessary steps to prepare for implementation, including the fulfillment of organizational requirements, risk mitigation and OTC trade reporting.
Financial Services Act and Financial Institutions Act to enter parliamentary debate
On 4 November 2015, the Swiss Federal Council adopted the dispatch on the Financial Services Act (FinSA) and the Financial Institutions Act (FinIA). Both items will jointly enter parliamentary debate in 2016. The FinSA primarily aims to improve client protection and has far-reaching consequences for the provision of financial services in Switzerland. The FinIA will provide a differentiated supervisory regime for financial institutions and introduce a prudential supervision of managers of individual client assets, managers of the assets of occupational benefits schemes, and trustees. A final assessment for both acts can only be made once the parliamentary debate has been concluded.
Key developments in the EU
Bank Recovery and Resolution Directive
The Bank Recovery and Resolution Directive (BRRD) came into force during 2014. This directive seeks to achieve a harmonized approach to the recovery and resolution of banks in the EU and broadly covers measures relating to recovery and resolution planning, early intervention powers for authorities and resolution tools should a bank fail or be deemed likely to fail.
The majority of the Directive has been applicable from 1 January 2015, while the bail-in tool became applicable on 1 January 2016. UBS’s EU subsidiaries that are credit institutions or investment firms are subject to the requirements of the Directive, while EU member states have the right to apply the provisions of the Directive to UBS’s EU-based branches in certain circumstances.
The Single Resolution Mechanism (SRM) implements the BRRD in the eurozone. The SRM became fully operational on 1 January 2016. The SRM is an important step in the completion of the European Banking Union. The aim of the SRM is to ensure an orderly resolution of failing banks with minimum impact on the real economy and public finances of the participating member states and beyond. The SRM establishes uniform rules and procedures for the resolution of entities, removes obstacles to resolution in order to make the European banking system more secure, and ensures a unified decision-making process for resolution within the European Banking Union to foster market confidence. UBS (Luxembourg) S.A. is directly supervised by the European Central Bank (ECB) under the Single Supervisory Mechanism and thereby automatically falls under the SRM. The Single Resolution Board is expected to determine minimum requirements for eligible liabilities (MREL) for UBS (Luxembourg) S.A. over the course of 2016. As MREL are set on a case–by-case basis, the potential impact on UBS is not yet clear. It is possible that we will need to increase loss-absorbing capacity at the UBS (Luxembourg) S.A. level as a result of the new requirements.
In the UK, the Bank of England (BoE) issued a consultation paper in December 2015 on the UK implementation of the BRRD's MREL. These requirements are expected to be established on a case-by-case basis and will apply directly to UBS Limited. The BoE states that where the resolution strategy of a UK subsidiary of a non-UK headquartered bank is based on the home resolution authority taking the lead with the BoE in a supporting role (as is the case for UBS Limited), it will set MREL for the subsidiary to reflect the agreed resolution strategy. MREL for such institutions will generally need to be satisfied through capital or subordinated liabilities issued to the foreign parent company and therefore will be subordinated to senior operating liabilities. UBS Limited is required to be fully compliant with its applicable MREL by 1 January 2020.
MREL is conceptually similar to the Financial Stability Board’s (FSB) total loss absorbing capacity (TLAC) standards and the two are broadly compatible although not identical.
EU Markets in Financial Instruments Directive II and Regulation package application date expected to be delayed to January 2018
The European Commission (EC) has formally proposed a one-year delay to the EU Markets in Financial Instruments Directive II and Regulation package (MiFID II / MiFIR), postponing its application to 3 January 2018. Any delay is subject to the approval of the European Parliament and the Council of the EU. Once applied, MiFID II / MiFIR will have significant impact in five broad areas: (i) market structure, (ii) transparency, (iii) European Securities and Market Authority (ESMA) powers; (iv) conduct of business / investor protection, and (v) third-country market access. Final implementing measures are expected to be adopted by the EC in the first half of 2016. MiFID II / MiFIR is expected to significantly affect processes and practices in UBS's asset management, investment banking and wealth management businesses.
Areas of significant change include requirements for higher levels of non-equity transparency, restrictions on the volume of equity trading that can take place on a non-pre-trade transparent basis, increased levels of best execution transparency, potential restrictions on the current model for payment for investment research, increased product governance requirements, and the introduction of commodities position reporting.
European Market Infrastructure Regulation clearing obligations and non-cleared derivative risk mitigation requirements to become applicable during 2016
The G20 leaders agreed in 2009 that all standardized OTC derivative contracts should be traded on exchanges or electronic trading platforms, where appropriate, and cleared through Central Counterparties (CCPs) by the end of 2012. In the EU, the clearing and reporting requirements are being implemented via European Market Infrastructure Regulation (EMIR), while the trading obligations are being implemented via the review of MiFID. EMIR came into force on 16 August 2012. On 21 December 2015, rules requiring mandatory clearing of OTC derivatives through a CCP came into force for certain OTC interest rate swaps. The clearing obligation will be phased in and will apply from 21 June 2016 for Category 1 counterparties, including UBS Limited. The rules include a three-year transitional period for intra-group transactions between an EU and a non-EU group counterparty. The EC has also adopted a clearing obligation for certain credit default swaps (CDSs). This proposed clearing obligation still requires approval by the European Parliament and the Council of the EU before it becomes applicable. UBS Limited and other UBS entities will be impacted by the clearing obligations, as we will be required to clear our own in-scope OTC derivative transactions as well as provide clearing services to some of our clients. The risk mitigation requirements for non-cleared derivatives (including mandatory exchange of initial margin and variation margin) will apply from 1 September 2016. These new requirements are expected to have a significant impact on the operations of, and collateral requirements for, UBS Limited.
Preliminary Agreement on Data Protection Regulation reached
In December 2015, the European Parliament and the Council of the EU reached a political agreement on the European Data Protection framework, which consists of a regulation on personal data protection and a directive dealing with data protection in law enforcement contexts. The new framework regulates the processing of personal data of our clients and employees located (i) in the EU, irrespective of whether or not we process the personal data in the EU, and (ii) outside the EU to the extent that such processing is effected by a natural or legal person, public authority, agency or any other body established in the EU. As such, it has extensive extraterritorial impact. The framework includes new rights for individuals, including a right to have personal data removed from records, and to request access to the data stored by banks at no cost and within a short timeframe. Moreover, significant financial penalties have been introduced for non-compliance with the new framework. The new framework is expected to become effective in the first quarter of 2018, and is likely to impact UBS's global data processing activities.
Agreement on EU Benchmarks Regulation reached
The European Parliament and Council of the EU have reached political agreement on the EU Benchmarks Regulation (EBR), which aims to improve the accuracy and integrity of benchmarks. New rules apply to administrators, contributors and users of benchmarks.
The regulation is likely to have a cross-divisional impact and potentially a cross-regional impact, as it affects UBS at three levels: (i) as administrator of UBS indices, (ii) as contributor to various benchmarks, and (iii) as a user of benchmarks. The definition of benchmarks is broad. The governance, control and transparency requirements for administrators and contributors may carry cost implications. The new authorization requirement and third-country regime may have a significant impact across the industry and will likely result in a reduction of available benchmarks for use in financial instruments and financial contracts. The use of EU benchmarks (captured by the EBR) in financial contracts or financial instruments, or to measure the performance of investment funds may impact our product strategy. The EBR is expected to enter into force in the third quarter of 2016 and become effective in 2018.
Operating environment and strategy
Regulatory and legal developments
Senior Managers and Certification Regime to apply from March 2016
The UK Banking Reform Act, which entered into force in March 2015, implements key recommendations of the Parliamentary Commission on Banking Standards (PCBS). As part of implementing the PCBS recommendations, the UK Prudential Regulation Authority and the Financial Conduct Authority (FCA) are introducing the Senior Managers and Certification regimes (SMCR). The Senior Managers Regime will focus accountability on a small number of senior managers specified by the PRA or FCA, whether physically based in the UK or overseas. The Certification Regime will require relevant firms to assess the fitness and propriety of certain employees who could pose a risk of significant harm to the firm or any of its clients. The SMCR for banks applies from 7 March 2016. The SMCR applies directly to UBS Limited and the London branch of UBS AG.
Key developments in the US
US Securities and Exchange Commission releases final and proposed rules for security-based swaps
In 2015, the US Securities and Exchange Commission (SEC) finalized or proposed a number of rules relating to security-based swaps (SBSs).
In January 2015, the SEC proposed additional security-based swap (SBS) transaction reporting rules and guidance. The Reporting and Dissemination of Security-Based Swap Information Regulation (Regulation SBSR) outlines the information that must be reported and publicly disseminated for SBS transactions and assigns reporting duties. The final rules address the cross-border application of Regulation SBSR and specify that any SBS transaction involving a US person, registered SBS dealer or registered major SBS participant, whether as a direct counterparty or as a guarantor, must be reported regardless of where the transaction is executed. The compliance date for these new rules, which will increase reporting requirements and associated costs, will depend on the finalization of the proposed rule and on the date the first SBS data repository becomes effective.
In February 2016, the SEC finalized rules that apply registration, reporting, public dissemination and business conduct requirements to SBS transactions of non-US companies that use US personnel to arrange, negotiate or execute SBSs in connection with their dealing activity. The finalized rules specify, among other things, that such transactions be counted toward the requirement to register as an SBS dealer. The rules do not impose mandatory clearing or mandatory trade execution on an SBS between two non-US persons solely because one or both counterparties arrange, negotiate or execute the SBS using personnel located in the US.
In August 2015, the SEC finalized its rules describing the registration application process for SBS dealers. Among other things, the rules require non-resident SBS dealers to obtain a legal opinion that concludes that the SBS dealer can, as a matter of law, provide the SEC with access to its books and records and submit to on-site examination, as well as a certification that it can and will do so. UBS intends to register at least UBS AG as an SBS dealer.
SEC proposes clawback rules for incentive-based compensation
In July 2015, the SEC proposed rules that would require national securities exchanges and associations to establish additional listing standards. These would require listed companies, such as UBS, to develop and enforce clawback policies stipulating that if a listed company has to make a material restatement of its financial statements resulting from an error, it must reclaim incentive-based compensation from current and former executive officers that they would not have received on the basis of such restatement.
US Department of Labor re-proposes fiduciary rule
In April 2015, the US Department of Labor (DOL) re-proposed a fiduciary rule (first proposed in 2010) that would expand the definition of “fiduciary” under the Employee Retirement Income Security Act of 1974 (ERISA). Under the revised proposal, all advisors, including broker-dealers, would be required to abide by an ERISA fiduciary standard in dealings with qualified retirement plans and individual retirement accounts. The revised proposal would result in a prohibition on a variety of customary transactions and fee arrangements in the financial services industry with respect to retirement investors. In addition to providing narrow carve-outs for certain activities, the DOL also issued exemptions from the prohibited transaction rules. Wealth Management Americas and Asset Management would be required to make material changes to their businesses, for example by implementing a new fee structure, if the rule is adopted as proposed.
US Federal Reserve Board proposes total loss-absorbing capacity rules, as well as long-term debt and clean holding company requirements
In October 2015, the Federal Reserve Board proposed a rule for total loss-absorbing capacity (TLAC) and long-term debt (LTD) requirements for covered bank holding companies and the Intermediate Holding Companies (IHCs) of foreign banks. The proposal would require IHCs, such as that of UBS, to hold internal LTD based on the greatest of 7% of RWA, 3% of total leverage exposure if subject to the supplementary leverage ratio (SLR), and 4% of average total consolidated assets. The internal TLAC requirement would depend on whether the IHC is a non-resolution entity or a resolution entity, as defined in the rule. Non-resolution IHCs, which require certification from the home country regulator, would be required to hold the greatest of 16% of RWA, 6% of total leverage exposure if subject to the SLR, and 8% of average total consolidated assets. Resolution IHCs would be required to hold the greatest of 18% of RWA, 6.75% of total leverage exposure if subject to the SLR, and 9% of average total consolidated assets. We intend to seek the certification necessary to classify our IHC as a non-resolution IHC.
The proposal also applies an internal TLAC buffer of 2.5% plus any applicable countercyclical capital buffer. A breach would subject the IHC to restrictions on distributions and discretionary bonus payments. The proposal’s clean holding company requirements would prohibit or limit IHCs from entering into certain financial arrangements that could create obstacles to orderly resolution. The UBS IHC would be subject to the requirements under the proposal.
US regulators finalize margin rules for non-cleared swaps
The prudential regulators, including the Federal Reserve Board, Federal Deposit Insurance Corporation (FDIC), and Office of the Comptroller of the Currency (together, Agencies) approved a final rule to establish margin and capital requirements for covered swap entities for non-cleared swaps. The rule establishes the minimum amount of initial and variation margin that a covered swap entity must exchange with its counterparties, based on the category of the counterparty, as defined in the rule. Under the rule, substituted compliance is allowed if the Agencies determine a foreign regulatory framework is comparable. The final rule differs from the proposal by creating specific rules for affiliate transactions. The rule will become effective as of 1 April 2016, but compliance dates will be phased in from September 2016 to September 2020. UBS will be subject to the Agencies’ final rules.
Far-reaching regulatory revisions and reform proposals on the international level
Basel Committee on Banking Supervision proposes changes to the standardized approach for credit risk
The Basel Committee on Banking Supervision (BCBS) released a second consultative document on revisions to the standardized approach for credit risk in December 2015. The proposal would reintroduce the use of external credit ratings for exposures to banks and corporates and would adopt a loan-to-value approach to risk weighting of real estate loans. The consultation ran until 11 March 2016 and the BCBS intends to finalize the revisions by the end of 2016.
BCBS issues revised market risk framework
In January 2016, the BCBS published a revised market risk framework, which defines minimum capital requirements for market risk exposures. The market risk framework includes stricter rules on the designation of instruments as either trading or banking book, a more prescriptive internal-model approach aimed at increasing consistency across banks, as well as a revised and more risk-sensitive standardized approach, which may also be used as a fall back to the internal-model approach. The BCBS will conduct further quantitative impact studies in order to monitor the effect of the capital requirements and to ensure consistency in the application of the framework. We expect Switzerland to finalize these changes in the domestic regulations no later than 1 January 2019, the deadline set by the BCBS.
BCBS continues review of risk-based capital framework
The BCBS also published two consultation papers during 2015 as part of its review of the capital framework to balance simplicity and risk sensitivity, and to promote comparability. The first paper is a consultation on the risk management, capital treatment and supervision of interest rate risk in the banking book, expanding upon and intending to ultimately replace the Basel Committee's 2004 principles for the management and supervision of interest rate risk. The second paper is a consultation on the Credit Valuation Adjustment (CVA) Risk Framework, intending to ensure that all important drivers of credit valuation adjustment risk and its hedges are covered in the Basel regulatory capital standard, in order to align the capital standard with the fair value measurement of CVA employed under various accounting regimes, and to ensure consistency with the proposed revisions to the market risk framework under the Basel Committee's fundamental review of the trading book.
In addition, as part of its quarterly review, the Bank for International Settlements (BIS) published a paper on the leverage ratio calibration. Subject to various caveats, the paper finds that there is considerable room to raise the leverage ratio requirement above its original 3% "test" level, to within a range of about 4-5%. The BCBS intends to complete the final calibration of the leverage ratio, and any further adjustments to its definition, by 2017, with a view to migrating to a Pillar 1 (minimum capital requirement) treatment on 1 January 2018.
Financial Stability Board defines a regulatory framework for haircuts on non-centrally cleared securities financing transactions
In November 2015, the Financial Stability Board (FSB) issued the final framework for haircuts on non-centrally cleared securities financing transactions, defining haircut floors to non-bank-to-non-bank transactions. This completes the FSB's policy recommendations in the framework for haircuts on certain non-centrally cleared securities financing transactions that were published in October 2014. The framework of numerical haircut floors applies to non-centrally cleared securities financing transactions in which financing against collateral other than government securities is provided to non-banks. The framework is intended to limit the build-up of excessive leverage outside the banking system.
Operating environment and strategy
Regulatory and legal developments
BCBS and G20 work on corporate governance principles
The BCBS published updated principles on corporate governance for banks in July 2015. These principles are intended to provide a framework within which banks and supervisors should operate. The framework consists of 13 principles, describing the roles and responsibilities of the directors and senior management, including (i) the role of directors in overseeing the implementation of effective risk management systems, (ii) directors’ collective competence and obligation to dedicate sufficient time to their mandates, (iii) strengthen the guidance on risk governance and the importance of a sound risk culture , and (iv) compensation systems form a key component of the governance and incentive structure through which the board and senior management of a bank convey acceptable risk-taking behavior and reinforce the bank's operating and risk culture. The G20 finance ministers also endorsed the revised G20 / OECD Principles of Corporate Governance in September 2015. We continue to strive for and maintain a high standard of corporate governance. We note that national implementation of these standards and application of the standards to specific jurisdictions and entities, including the aforementioned senior management regimes in the UK and the governance regulations for our IHC, will present challenges to the overall governance of the Group.
Our strategy
We are committed to providing our clients with superior financial advice and solutions while generating attractive and sustainable returns for shareholders. Capital strength is the foundation of our success. Our strategy builds on the strengths of all our businesses and focuses our efforts on areas in which we excel, while seeking to capitalize on the growth prospects in the businesses and regions in which we operate. Our strategy centers on our leading wealth management businesses and our premier universal bank in Switzerland, enhanced by our asset management business and our Investment Bank. These businesses share three key characteristics: they benefit from a strong competitive position in their targeted markets, are capital efficient, and offer an attractive structural growth and profitability outlook. Our strategic priorities are the continued execution of our strategy to enable us to deliver on our performance targets, improving our effectiveness and efficiency, and making further investments to take advantage of growth opportunities.
Who we are
We are the world's largest and fastest growing wealth manager and the only bank with a truly global wealth management franchise at the center of its strategy. Our footprint is unique, and we benefit from significant scale in an industry with attractive growth prospects in excess of GDP-growth and rising barriers to entry. We have a leading position across the attractive high net worth and ultra high net worth client segments. Our value proposition is highly scalable and can be tailored to our clients’ financial needs and preferences. The partnership between our wealth management businesses and Personal & Corporate Banking in Switzerland, Asset Management and the Investment Bank is a key differentiating factor and a competitive advantage of our wealth management franchise.
Strong capital position and capital efficient business model
Capital strength is the foundation of our success. It provides our clients and all other stakeholders with a strong sense of comfort, creating a distinct competitive advantage for our businesses. Our fully applied common equity tier 1 (CET1) capital ratio is the highest among our peer group of large global banks, and we are well-positioned to meet the proposed requirements of the revised Swiss too big to fail (TBTF) framework. Our highly capital-accretive and efficient business model helps us adapt to changes in regulatory requirements, while pursuing growth opportunities without the need for significant earnings retention. We believe that our business model can generate an adjusted return on tangible equity of more than 15%, which we aim to achieve in 2018.
Operating environment and strategy
Our strategy
We are committed to an attractive capital returns policy
EDTF | Our earnings capacity, capital efficiency and low-risk profile support our objective to deliver sustainable and growing returns to our shareholders. We are committed to a total capital return to shareholders of at least 50% of net profit attributable to shareholders, provided that we maintain a fully applied CET1 capital ratio of at least 13% and consistent with our objective of maintaining a post-stress fully applied CET1 capital ratio of at least 10%. Total capital returns will consist of an ordinary dividend, which we intend to grow steadily over time, and other forms of capital returns. Our ordinary dividend was established at CHF 0.50 for the financial year 2014. For the financial year 2015, our Board of Directors intends to propose a total dividend payment of CHF 0.85 per share, comprised of an ordinary dividend of CHF 0.60 per share, up 20% compared with 2014, and a special dividend of CHF 0.25 per share, reflecting a significant net upward revaluation of deferred tax assets in 2015. The total dividend of CHF 0.85 per share represents a payout ratio of 52%. ▲
Industry trends
Business transformation
In response to the evolving market and regulatory environment, the industry is continuing to observe adjustments to strategies and business portfolios, particularly across large European banks. We communicated our strategy in 2011 and accelerated its execution in 2012. We focused on creating a business model that is better adapted to the new regulatory and market environment and that we believe results in more consistent and high-quality returns. Having completed our business transformation in 2014, we are now capitalizing on our strong strategic position by focusing on growing the profitability of our core businesses and delivering attractive returns to our shareholders. As a consequence, we believe we are well-positioned to adapt to the changing market environment and capture the benefits of new and evolving industry trends. We are confident with our capabilities and market position, but we will not be complacent.
Wealth accumulation
The wealth management industry offers fundamentally attractive economics with a forecast for robust wealth accumulation around the world. According to the Boston Consulting Group Global Wealth Report 2015, the ultra high net worth segment is expected to expand by about 11% annually from 2014 to 2019, and the high net worth segment by about 7% annually. Asia Pacific and the emerging markets are expected to be the fastest-growing regions, with an estimated average annual market growth rate of approximately 11% for the high net worth and ultra high net worth segments combined. Even mature markets, such as Western Europe and North America, are forecast to see wealth accumulation grow within the high net worth and ultra high net worth segments at an annual rate exceeding expected GDP growth. Despite the attractiveness of a capital-light and highly cash flow-generative business, we believe that wealth management is likely to remain a highly fragmented industry and barriers to entry are expected to increase, partly due to significant investments needed to meet current and proposed regulatory requirements.
Our unique investment engine is an essential component of our holistic wealth management offering and sets us apart from our peers. The combination of our strategic focus on wealth management, our unique footprint and capabilities, and our leading position across the attractive ultra high net worth and high net worth client segments, enable us to benefit from significant scale, which we expect will help us capture market growth and increase share of wallet.
Demographics, wealth transfer and retirement funding
Demographic changes, including the increasing average age of the world’s population, escalating costs associated with the care of an ageing population and the funding challenges faced by public pension systems, will be a key long-term driver for both wealth consumption and wealth transfer, which will also impact retirement funding. The strong reliance on public pension schemes will make reform especially urgent in certain countries. Although each country will follow its own regulatory agenda, a general and gradual shift from public to privately funded pension schemes seems inevitable.

These developments are expected to benefit our businesses, as individuals and privately funded pension schemes seek investment advice and tailored service offerings with a relevant product range. Our strong capabilities in asset management, as well as our ability to tailor our service offerings to our clients’ financial needs and preferences, put us in a position of strength to address these emerging needs.
Digitalization
Over the last few years, investments in financial technology have multiplied, and the market expects continued digital disruption in the financial industry, driven by consumer preferences and expectations. We expect that core technologies, such as automated investment advice, mobile access to banking services, distributed ledger technology and natural language user interfaces, will be ready for application in the financial services industry in the near future. Digital capabilities are likely to play a significant role in transforming not only how banks operate internally, but also how banks interact with clients. The financial services industry will have to adapt to a new digital reality driven by evolving client needs, increasing demand for efficiency, accelerating technological innovation and the emergence of new market participants.
UBS acknowledged early on that there is a need for constant innovation, and has launched several initiatives to meet evolving client expectations in personalization, convenience and transparency. Our technology is used extensively by our clients, and it allows us to increase market share and customer loyalty, and to attract new business. We are focused on leveraging our technology not only to improve the services for our clients, but also to increase scalability by providing more efficient methods for delivering content, to directly access clients, to improve automation in the back office to increase efficiency, and to derive the most meaningful information from vast amounts of data to better manage our business.
We have also created innovation labs in London, Singapore and Zurich to research how UBS can further foster innovation as a key driver for business growth and improved efficiency. Recognizing that innovation is not something UBS can do on its own, we have engaged with a wide range of startup companies, venture capitalists and academic institutions, for example, with the "Future of finance" challenge, which involved 600 participants world-wide. In another example, UBS launched an initiative to explore blockchain technology, and has become one of the thought leaders in this fundamental new technology and its applications for financial services. Furthermore, in 2015, UBS, together with the SIX and Zürcher Kantonalbank, successfully launched the new peer-to-peer mobile payments application "Paymit" in Switzerland, winning the "Master of Swiss Apps" award.
Further adaptation of operating models
Operating models in the financial services industry are expected to continue to evolve, given an increase in operational cost pressure, reflecting higher regulatory costs, together with a subdued revenue environment. This persistent push for efficiency is forcing banks to reassess front-to-back processes, focus on identifying potential for standardization, and to rethink the ownership of value chain components, which will be supported by a continuous increase in straight-through processing capabilities and reduced repetitive human intervention. Over the past few years, a diverse network of suppliers has emerged that is both disaggregating the service and supply chain and changing the dynamics of demand and supply in the banking sector.
In 2015, we established UBS Business Solutions AG to act as the Group’s service company subsidiary and we plan to transfer the majority of our middle- and back-office processes into the service company structure. The transfer is a first step in enabling us to commercialize middle- and back-office processes and benefit from economies of scale. In addition, it allows us to take advantage of opportunities to share regulatory investments.
Banking intermediation
Against the backdrop of digitalization and new market participants, the banking sector’s role as a facilitator of economic policy and an enabler of domestic growth may come under threat, as well as renewed discussion and scrutiny. The combination of enhanced regulatory requirements, reduced risk appetite and subdued macroeconomic prospects continues to curb the lending appetite of banks. Other financial industry players, such as asset managers, insurers and hedge funds, are increasingly stepping into banking intermediation and risk-taking areas, even though they are currently still focused on more specific or niche areas, such as long-dated assets and high-risk lending. It is expected that this trend will continue with its extent and pace dependent on regulatory developments.
Despite these challenges, we believe banks still have the necessary capital and the competitive ability to preserve their core role in the economy and to have continued access to their traditional revenue sources.
Operating environment and strategy
Our strategy
Regulation
There has been continuous regulatory pressure on the financial services industry to become simpler, more transparent and more resilient, and it is expected that regulation will remain a major driver of change for the industry.
We believe we have the right business model to comply with the new, more demanding regulations without the need to change our strategy. We have the highest fully applied CET1 capital ratio among our peer group of large global banks and we have made substantial progress in our efforts to improve resolvability. We are well prepared to meet the requirements of the proposed revised Swiss too big to fail framework over the phase-in period and by the effective date in 2020, and we intend to use the four-year period to fully implement the new requirements.
® Refer to the "Regulatory and legal developments" section of this report for more information on the proposed revised Swiss too big to fail framework
Our strategic priorities
EDTF | We intend to build on our successful track record and focus on three key strategic priorities as set out below. ▲
1. Continue to execute our strategy and deliver on our performance targets
EDTF | The strategic change we initiated in 2011 was driven by our decision to focus on our strengths and by anticipation of more demanding regulation. We outlined a strategy that works in a number of business environments. Having successfully completed our transformation, we now continue to execute our strategy in a focused and disciplined manner. ▲
2. Improve effectiveness and efficiency
EDTF | At year-end 2015, we achieved CHF 1.1 billion of net cost reductions versus full-year 2013 and we remain fully committed to achieving our net cost reduction target of CHF 2.1 billion by year-end 2017. Our effectiveness and efficiency improvements are centered on creating the right infrastructure and cost framework for the future, including workforce and footprint. In addition, we will continue to invest heavily in technology, compliance and risk control, as our initiatives create more stable IT platforms, reduce the need for manual intervention, and enable faster upgrades and overall stronger controls. ▲
3. Invest for growth
EDTF | We will continue to build our capabilities in technology and digitalization with a focus on further strengthening our position, particularly in regions such as the Americas and Asia Pacific. Our investments in technology are attracting broad industry recognition, but, more importantly, they are used extensively by our clients and allow us to capture market share and attract business. We also remain committed to investing in the development of our existing employees and to hiring the best available talent. The ability to take advantage of growth opportunities in technology and our continued focus on attracting the right people and developing the talent we have in order to achieve their full potential will help us to better serve our clients. ▲
Our performance targets and expectations
The tables on the next page show our performance targets and expectations for the Group, the business divisions and Corporate Center for 2016 and beyond. The performance targets and expectations are calculated on an annual basis, except for adjusted pre-tax profit growth for our combined wealth management businesses, which represents a through the cycle target. Our performance targets and expectations are based on adjusted results that exclude items that management believes are not representative of the underlying performance of our businesses, such as restructuring expenses and gains and losses on sales of businesses and real estate, and assume constant foreign currency translation rates, unless otherwise indicated.
Business divisions and Corporate Center
Operating environment and strategy
Measurement of performance
UBS – leading universal bank in Switzerland

UBS is the preeminent universal bank in Switzerland, the only country where we operate in all five of our business areas: personal banking, wealth management, corporate and institutional banking, investment bank and asset management. We are fully committed to our home market, as our leading position in Switzerland is crucial in terms of sustaining our global brand and profit stability. Drawing on our network of around 300 branches and 4,500 client-facing staff, complemented by modern digital banking services and customer service centers, we are able to reach approximately 80% of Swiss wealth and serve one in three households, high net worth individuals and pension funds, more than 120,000 companies, and around 80% of banks domiciled in Switzerland. In 2015, Euromoney acknowledged our preeminent position in Switzerland with its prestigious Best Bank in Switzerland award for the fourth consecutive year.
Our universal bank model is central to our success. We differentiate ourselves by leveraging our strengths across all segments. Our management approach promotes cross-divisional thinking, enables effective collaboration across all business areas and allows us to utilize our resources efficiently. As a result, we are in an excellent position to meet our
clients’ needs with a comprehensive range of banking products and services drawn from across our business segments. Our universal bank model has proven itself to be highly effective and consistently contributes substantially to the Group.
Our distribution model is based on a multichannel strategy. We strive to offer a unique client experience, giving clients the choice in how to interact with us – via branches, customer service centers or digital channels. Our expanding electronic and mobile banking offering is very well-regarded and we continue to see a steadily rising number of users and client interactions. In 2015, users of our e-banking service exceeded the 1.5 million mark, while we reached the milestone of 500,000 downloads of our Mobile Banking app earlier in 2015.
We strengthened our segment-specific offering with the introduction of Wealth Management Online and Corporate Financial Management. We also increased the ways clients can interact with us by launching Live Chat and the new retirement calculators on ubs.com. The joint introduction of Paymit with SIX and Zürcher Kantonalbank has made UBS the leader in the Swiss mobile payment space: UBS Paymit achieved more than 150,000 downloads by the end of 2015, received excellent client feedback in the Apple App Store and earned external recognition with the ”Master of Swiss Apps 2015” award. We will continue to build on our position as the leading multi-channel bank in Switzerland and as an innovator in digital services to improve our client experience, capture market share and increase efficiency.
Measurement of performance
Performance measures
Key performance indicators
EDTF | Our key performance indicator (KPI) framework focuses on key drivers of total shareholder return, measured by the dividend yield and price appreciation of our shares. The Group and business divisions are managed based on this KPI framework, which emphasizes risk awareness, effective risk and capital management, sustainable profitability and client focus. Both Group and business division KPIs are taken into account in determining variable compensation.
Our senior management reviews the KPI framework on a regular basis by considering prevailing strategy, business conditions and the environment in which we operate. The KPIs are disclosed consistently in our quarterly and annual reporting to facilitate comparison of our performance over the reporting periods.
In addition to KPIs, we disclose our performance targets. These performance targets, which are defined in order to track the achievement of our strategic plan, are based on our KPIs as well as on additional balance sheet and capital management performance measures. ▲
® Refer to the “Our strategy” section of this report for more information on performance targets
New key performance indicators in 2016
EDTF | In 2016, the revised Swiss too big to fail going concern leverage ratio will replace the Swiss SRB leverage ratio as a Group KPI, as it is expected to become the relevant regulatory measure in 2016. ▲
Client / invested assets reporting
We report two distinct metrics for client funds:
– The metric client assets encompasses all client assets managed by or deposited with us, including custody-only assets.
– The metric invested assets is more restrictive and includes only client assets managed by or deposited with us for investment purposes.
Of the two, invested assets is the more important metric. Net new money in a reported period is the amount of invested assets that are entrusted to us by new or existing clients less those withdrawn by existing clients or clients who terminated their relationship with us. Wealth Management Americas also reports net new money including interest and dividend income, in line with historical reporting practice in the US market.
When products are managed in one business division and sold by another, they are counted in both the investment management unit and the distribution unit. This results in double-counting within our total invested assets, as both units provide an independent service to their client, add value and generate revenues. Most double-counting arises when mutual funds are managed by Asset Management and sold by Wealth Management or Wealth Management Americas. The business divisions involved count these funds as invested assets. This approach is in line with both finance industry practices and our open-architecture strategy, and allows us to accurately reflect the performance of each individual business. Overall, CHF 185 billion of invested assets were double-counted as of 31 December 2015 (CHF 173 billion as of 31 December 2014).
® Refer to “Note 35 Invested assets and net new money” in the “Consolidated financial statements” section of this report for more information
Seasonal characteristics
Our main businesses may show seasonal patterns. The Investment Bank’s revenues have been affected in some years by the seasonal characteristics of general financial market activity and deal flows in investment banking. Other business divisions may also be impacted by seasonal components, such as lower client activity levels related to the summer and end-of-year holiday seasons, annual income tax payments (which are concentrated in the second quarter in the US) and asset withdrawals that tend to occur in the fourth quarter.
Operating environment and strategy

Wealth Management
Wealth Management provides wealthy private clients with investment advice and solutions tailored to their individual needs. At the end of 2015, we had a presence in more than 40 countries and invested assets of CHF 947 billion.
Business
We provide comprehensive advice and financial services to wealthy private clients around the world, with the exception of those served by Wealth Management Americas. UBS is a global firm with global capabilities, and our clients benefit from a full spectrum of resources, including wealth planning, investment management solutions and corporate finance advice, banking and lending solutions, as well as the specific offerings outlined below. Our guided architecture model gives clients access to a wide range of products from the world's leading third-party institutions that complement our own products.
Strategy and clients
The wealth management business has attractive long-term growth prospects and we expect its growth to outpace that of gross domestic product globally. From a client segment perspective, the global ultra high net worth market, including family offices, has the highest growth potential, followed by the high net worth and affluent markets. Our broad client base and strong global footprint put us in an excellent position to capture the growth opportunities across regions and segments.
We are the preeminent wealth manager globally and aim to provide our clients with comprehensive, tailored advice. We serve private clients, particularly in the ultra high net worth (generally considered to be clients with more than CHF 50 million in investable assets, with some market-driven differentiation), high net worth (generally considered to be clients with CHF 2 million to CHF 50 million in investable assets, with some market-driven differentiation) and affluent (generally considered to be clients with CHF 250 thousand to CHF 2 million in investable assets, with some market-driven differentiation) segments. We have unique scale, an industry-leading platform, and a broad-based setup, being active in the most diverse wealth management markets and segments.
We measure the performance of our business against five key performance indicators: pre-tax profit growth, cost / income ratio, net new money growth, gross margin on invested assets and net margin on invested assets. We also evaluate our performance against our annual performance targets, which comprise a cost / income ratio of 55–65%, a net new money growth rate of 3–5%, and together with Wealth Management Americas, a pre-tax profit growth of 10–15%, as defined in the “Our strategy” section of this report. We have defined a set of strategic priorities to enable us to drive profitable growth and be at the forefront of shaping the wealth management industry. As the industry transforms, our aim is to increasingly translate our competitive advantages into profitable market share gains.
® Refer to the “Our strategy” section of this report for more information on our targets
Operating environment and strategy
Wealth Management
Investment management and portfolio construction are at the heart of our offering. Clients who opt for a discretionary investment mandate delegate the management of their assets to a team of professional portfolio managers. Clients who prefer to be actively involved can choose an advisory mandate. The portfolios of advisory mandate clients are monitored and analyzed closely, and they receive tailored proposals to help them make informed investment decisions. We aspire to reach a mandate penetration of approximately 40% of Wealth Management’s invested assets, to provide a greater selection of value-added services to our clients. Growing our mandates business also contributes to higher recurring revenues.
We seek to capitalize on our market-leading position in the ultra high net worth business and to increase share considerably in this high-growth segment. We also invest significantly in growing our high net worth and affluent client segments, especially by leveraging and further strengthening our leading competence in investment management, as well as investing in our digital capabilities.
We cater to the specific needs of our diverse client segments. Our ultra high net worth clients have access to the infrastructure we offer to our institutional clients. Through our Global Family Office Group, our most sophisticated ultra high net worth clients benefit from tailored institutional coverage and global execution provided by dedicated specialist teams from both Wealth Management and the Investment Bank. We offer our high net worth clients the full range of our investment management capabilities. For example, UBS Advice, which forms part of our advisory mandate offering, provides our clients with tailored investment advice. It is an industry leader in terms of how it uses state-of-the-art technology to systematically monitor client portfolios to detect risks as well as deviations from their selected investment strategies. We believe that both our advisory and discretionary mandate offerings provide a superior value proposition as they both provide our clients with the best of our investment management capabilities.
All clients can invest in the full range of financial instruments, from single securities such as equities and bonds to various investment funds, structured products and alternative investments. Additionally, we offer clients advice on structured lending and corporate finance. Our integrated client service model allows us to bundle capabilities from across the Group to identify investment opportunities in all market conditions and create solutions that suit individual client needs. This collaboration is also crucial to our focused expansion in key onshore markets, where we continue to benefit from the established business relationships of our local Investment Bank and Asset Management teams.
We invest significantly in digitalization and innovation to meet the evolving needs of our client base. To support the rapid development of state-of-the-art banking services and to ensure that these are delivered consistently, we are further consolidating and extending our IT platform globally. In addition, we are developing new solutions to deliver our leading content through digital channels. For example, in 2015, we launched Wealth Management Online, giving our clients electronic access to our offering, including our portfolio management and advisory services. We also introduced My House View, an interactive filter for our investment research, enabling users to easily find the content most relevant to them.
Our operating model is continually adapted to focus on efficiency, simplicity and digital innovation. For example, we will leverage our Swiss platform across our most important markets in Asia and Europe following successful deployment in Germany in 2015. In addition, we continue to make focused investments in our onshore businesses to capture growth opportunities.
Our booking centers across the globe give us a strong local presence that allows us to book client assets in multiple locations, in response to client preferences. The strength and scope of our franchise also help us adapt swiftly to a changing legal and regulatory environment.
In Asia Pacific, we have accelerated our growth with a particular focus on Hong Kong and Singapore, the leading financial centers in the region, and China. In 2015, we opened a branch in Kowloon, our first branch in Hong Kong outside the central business district, and we continue to expand our local onshore presence in China to help capture long-term growth opportunities. We are also developing our presence in major onshore markets such as Japan and Taiwan.
In the emerging markets, we are focused on markets such as Mexico, Brazil, Turkey, Russia, Israel and Saudi Arabia. We regularly assess our local presence to ensure proximity to our clients in key markets, aiming to serve them most efficiently out of key hubs in the major emerging regions. Many emerging market clients prefer to book their assets in established financial centers and, to that end, we are strengthening our coverage for such clients through our booking centers in Switzerland and the UK, as well as in the US through Wealth Management Americas.
In Europe, our long-established local presence in all major markets supports our growth ambition. We recognized the converging needs of clients early and combined our offshore and onshore businesses. This gives clients across the region access to our extensive Swiss product offering, and creates economies of scale, enabling us to deal efficiently with increased regulatory and fiscal requirements.
In Switzerland, based on our integrated business model, we collaborate closely with our colleagues in the personal and corporate banking, asset management, and investment banking businesses. This creates opportunities to expand our business through client referrals and generates efficiencies by enabling us to make use of UBS’s extensive branch network, which includes around 100 wealth management offices.
Our global financial intermediaries business supports our growth ambitions by providing us with access to markets and clients beyond our own client advisor network. Additionally, it acts as a strategic business partner for more than 2,000 financial intermediaries in all major financial centers. It offers them professional investment advisory services, a global banking infrastructure and tailored solutions, helping financial intermediaries to advise their end-clients more effectively.
Organizational structure
Headquartered in Switzerland, we have a presence in more than 40 countries with approximately 190 offices, of which around 100 are in Switzerland. As of the end of 2015, we employed 10,239 people worldwide, of which 4,019 were client advisors.
We are governed by executive, operating and risk committees and are primarily organized along regional lines with our business areas being Asia Pacific, Europe, Global Emerging Markets, Switzerland and Global Ultra High Net Worth. Our business is supported by the Chief Investment Office and a global Investment Products and Services unit, as well as central functions managed by the Chief Operating Officer, and shared services provided by Corporate Center.
Competitors
Our major global competitors include the private banking operations of Credit Suisse, JP Morgan, Deutsche Bank, BNP Paribas, HSBC, Citigroup and Julius Bär. In the European domestic markets, we primarily compete with the local private banking operations of large banks such as RBS in the UK, Deutsche Bank in Germany and UniCredit in Italy. In Asia Pacific, the private banking franchises of Citigroup, Credit Suisse and HSBC are our main competitors.
Investment advice and solutions
As part of a global, integrated firm, we are a dynamic wealth manager with investment management capabilities at our core. Our approach focuses on a fundamental understanding of our clients’ lifecycle needs and financial objectives. Based on this approach, we seek to provide superior investment advice and solutions. Our client advisors are proactive in their relationships with clients, and we have a systematic process for developing a thorough understanding of our clients’ financial objectives and risk appetite. Our wealth planners – part of our specialist product team – often support client advisors as they guide their clients in making financial decisions based on their lifecycle needs. With this comprehensive service, we offer them wealth planning advice and products, and we ascertain their investment strategy, which serves as the foundation for the investment solutions we offer them. Client advisors regularly review their clients’ investor profiles to make sure they correspond to their evolving priorities and changing risk tolerance. Our bespoke training programs and the ongoing support the firm provides to our client advisors enable them to deliver superior advice and solutions to our clients. All our client advisors must obtain the Wealth Management Diploma, a program accredited by Switzerland’s State Secretariat for Economic Affairs that ensures a high level of knowledge and expertise. For our most senior client advisors, we offer extensive training through the Wealth Management Master program.
Our global Chief Investment Office synthesizes the research and expertise of our global network of economists, strategists, analysts and investment specialists across all business divisions worldwide. These experts closely monitor and assess financial market developments. This allows us to deliver real-time insights and to include local expertise in our global investment process. Using these analyses, and in consultation with our external partner network at the UBS Investor Forum, which includes many of the world’s most successful money managers, the Chief Investment Office establishes a clear, concise and consistent investment view, known as "the UBS House View".
Operating environment and strategy
Wealth Management
The UBS House View identifies and communicates investment opportunities and market risks to help protect and grow our clients’ wealth, and we aim to apply and implement it consistently in our clients’ portfolios. The UBS House View is also reflected in our strategic and tactical asset allocations, both of which underpin the investment strategies for our flagship discretionary mandates. The strategic asset allocation is an essential part of our disciplined style of managing our clients’ wealth, and strives to ensure that our clients remain on course to meet their financial goals over the long term. It is complemented by our tactical asset allocation, which uses our global expertise to help our clients navigate markets and ultimately improve the risk and return trade-off potential of their portfolios.
Our Investment Products and Services unit ensures our solutions are in step with market conditions by aligning our discretionary and advisory offerings with our UBS House View. To help our clients address the challenges of an increasingly complex financial world, we continue to develop innovative products. For example, in 2015, we introduced new discretionary investment solutions based on a new Chief Investment Office asset allocation framework.
Our products are aimed at achieving positive relative performance in various market scenarios. They are developed from a wide range of sources, including Investment Products and Services, Asset Management, the Investment Bank and third parties, as we operate within a guided architecture model. By aggregating private investment flows into institutional-size flows, we can offer our clients access to investments normally available only to institutional clients.

Wealth Management Americas
Wealth Management Americas develops advice-based relationships through its financial advisors, who deliver a fully integrated set of wealth management solutions designed to address the needs of ultra high net worth and high net worth clients.
Business
We are one of the leading wealth managers in the Americas in terms of financial advisor productivity and invested assets. Our business includes UBS’s domestic US and Canadian wealth management businesses, as well as international business booked in the US. We have attractive growth opportunities and a clear strategy focused on serving our target client segments. As of 31 December 2015, invested assets totaled USD 1,033 billion.
Strategy and clients
Our goal is to be the best wealth management business in the Americas. With our client-focused, advisor-centric strategy, we deliver advice-based wealth management solutions and banking services through our financial advisors in key metropolitan markets, providing a fully integrated set of products and services to meet the needs of our target client segments – high net worth clients and ultra high net worth clients – while also serving the needs of core affluent clients. We define high net worth clients as those with investable assets of between USD 1 million and USD 10 million, and ultra high net worth clients as those with investable assets of more than USD 10 million. Core affluent clients are defined as those with investable assets of between USD 250,000 and USD 1 million. The Global Family Office – Americas, a joint venture between Wealth Management Americas and the Investment Bank, provides integrated, comprehensive wealth management and institutional-type services to selected Family Office clients. Our Wealth Advice Center serves emerging affluent clients with investable assets of less than USD 250,000. We are committed to providing high-quality advice to our clients across all their financial needs by employing the best professionals in the industry, delivering the highest standard of execution, and running a streamlined and efficient business.

Operating environment and strategy
Wealth Management Americas
We measure the performance of our business against five key performance indicators: pre-tax profit growth, cost / income ratio, net new money growth, gross margin on invested assets and net margin on invested assets. We also evaluate our performance against our annual performance targets, which comprise a cost / income ratio of 75–85%, a net new money growth rate of 2–4% and, together with Wealth Management, a pre-tax profit growth of 10–15%, as defined in the “Our strategy” section of this report.
® Refer to the “Our strategy” section of this report for more information on our targets
We believe we are uniquely positioned to serve high net worth and ultra high net worth investors in the world’s largest wealth market. With a network of 7,140 financial advisors and over USD 1 trillion in invested assets, we are large enough to be meaningful, but focused enough to be nimble, which enables us to combine the advantages of large and boutique wealth managers. We aim to differentiate ourselves from competitors and be a trusted and leading provider of financial advice and solutions to our clients by enabling our financial advisors to leverage the full resources of UBS, including access to wealth management research, our global Chief Investment Office, and solutions from our asset-gathering businesses and the Investment Bank. These resources are augmented by our commitment to an open architecture platform and supported by our partnerships with many of the world’s leading third-party institutions. Moreover, our wealth management offering is complemented by banking, mortgage and financing solutions that enable us to provide advice on both the asset and liability sides of our clients’ balance sheets.
We believe the long-term growth prospects of the wealth management business are attractive in the Americas, with high net worth and ultra high net worth expected to be the fastest growing segments in terms of invested assets in the region. In 2015, our strategy and focus led to continued retention of high-quality financial advisors and net new money growth. Building on this progress, we aim for continued growth in our business by developing our financial advisors’ focus toward delivering holistic advice across the full spectrum of client needs, leveraging the global capabilities of UBS to clients by continuing to expand our cross-business collaboration efforts throughout the firm, and delivering banking and lending services that complement our wealth management solutions. We also plan to continue investing in improved platforms and technology, while remaining disciplined on cost. We expect these efforts to enable us to achieve higher levels of client satisfaction, strengthen our client relationships, and lead to greater revenue productivity among our financial advisors.
Organizational structure
Wealth Management Americas consists of branch networks in the US, Puerto Rico, Canada and Uruguay, with 7,140 financial advisors as of 31 December 2015. Most corporate and operational functions are located in the Wealth Management Americas home office in Weehawken, New Jersey and the UBS Business Solutions Center in Nashville, Tennessee.
In the US and Puerto Rico, we operate primarily through UBS subsidiaries. Securities and operations activities are conducted primarily through two registered broker-dealers, UBS Financial Services Inc. and UBS Financial Services Incorporated of Puerto Rico. Our banking services in the US include those conducted through the UBS AG branches and UBS Bank USA, a federally regulated bank in Utah, which offers Federal Deposit Insurance Corporation (FDIC)-insured deposit accounts, collateralized lending services, mortgages and credit cards.
Canadian wealth management and banking operations are conducted through UBS Bank (Canada), and Uruguayan wealth management operations are conducted through UBS Financial Services Montevideo.
 ` `
| | 
|
Competitors
We compete with national full-service brokerage firms, domestic and global private banks, regional broker-dealers, independent broker-dealers, registered investment advisors, trust companies and other financial services firms offering wealth management services to US and Canadian private clients, as well as foreign non-resident clients seeking wealth management services within the US. Our main competitors include the wealth management businesses of Bank of America, Morgan Stanley and Wells Fargo.
Products and services
We offer clients a full array of solutions that focus on their individual financial needs. Comprehensive planning supports clients through the various stages of their lives, including education funding, charitable giving, estate strategies, insurance, retirement and trusts, and foundations, with corresponding product offerings for each stage. Our advisors work closely with internal consultants in areas such as wealth planning, portfolio strategy, retirement and annuities, alternative investments, managed accounts, structured products, banking and lending, equities and fixed income. Clients also benefit from our dedicated Wealth Management Research team, which provides research guidance to help support our clients’ investment decisions.
Our offering is designed to meet a wide variety of investment objectives, including wealth accumulation and preservation, income generation and portfolio diversification. To address the full range of our clients’ financial needs, we also offer competitive lending and cash management services such as securities-backed lending, resource management accounts, FDIC-insured deposits, mortgages and credit cards.
Additionally, our UBS Equity Plan Advisory Services is a leading provider of equity compensation plan services and advice to more than 150 US corporations, representing one million participants worldwide. For corporate and institutional clients, we offer a robust suite of solutions, including equity compensation, administration, investment consulting, defined benefit and contribution programs, and cash management services.
Our clients can choose asset-based pricing, transaction-based pricing or a combination of both. Asset-based accounts have access to both discretionary and non-discretionary investment advisory programs. Non-discretionary advisory programs enable the client to maintain control over all account transactions, while clients with discretionary advisory programs authorize investment professionals to manage a portfolio on their behalf. Depending on the type of discretionary program, the client can give investment discretion to a qualified financial advisor, a team of our investment professionals or a third-party investment manager. Separately, we also offer mutual fund advisory programs, whereby a financial advisor works with the client to create a diversified portfolio of mutual funds guided by a research-driven asset allocation framework.
For clients who favor individual securities, we offer a broad range of equity and fixed income instruments. In addition, qualified clients may invest in structured products and alternative investment offerings to complement their portfolio strategies.
All of these solutions are supported by a dedicated capital markets group. This group collaborates with the Investment Bank and Asset Management in order to access the resources of the entire firm, as well as with third-party investment banks and asset management firms.
Operating environment and strategy
Personal & Corporate Banking
Personal & Corporate Banking
As the leading personal and corporate banking business in Switzerland, our goal is to deliver comprehensive financial products and services to private, corporate and institutional clients, provide stable and substantial profits for the Group and create revenue opportunities for other businesses within the Group.
Business
We provide comprehensive financial products and services to our private, corporate and institutional clients in Switzerland, maintaining a leading position in these client segments and embedding our offering in a multi-channel approach. As shown in the “Business mix” chart below, our personal and corporate banking business generates stable profits which contribute substantially to the overall financial performance of the Group. We are among the leading players in the private and corporate loan market in Switzerland, with a well-collateralized lending portfolio of CHF 136 billion as of 31 December 2015, as shown in the “Loans, gross” chart below. This portfolio is managed conservatively, focusing on profitability and credit quality rather than market share.
Our personal and corporate banking business is a central element of UBS’s universal bank delivery model in Switzerland, supporting other business divisions by referring clients to them and assisting private clients to build their wealth to a level at which we can transfer them to our Wealth Management unit. Furthermore, we leverage the cross-selling potential of products and services provided by our asset-gathering and investment bank businesses. In addition, we manage a substantial part of UBS’s Swiss infrastructure and Swiss banking products platform, which are both leveraged across the Group.
Strategy and clients
Our strategy focuses on profitable and qualitative growth in Switzerland. In the personal banking business we continue to pursue our strategy of growing our business in high-quality loans moderately and selectively and to further leverage the potential from digitalization.
We aspire to be the bank of choice for private clients in Switzerland by delivering value-added services. Currently, we serve one in three Swiss households. Our distribution network is comprised of around 300 branches, 1,250 automated teller machines, including self-service terminals, and 4 customer service centers, as well as state-of-the-art digital banking services. Technology is fundamentally transforming the way we deliver our products and services. We are, therefore, continuously expanding and enhancing our multi-channel offering and will continue to build on our long tradition as a leader and innovator in digital services to deliver superior client experience, capture market share and increase efficiency. Moreover, we follow a life-cycle-based product approach to provide our clients with tailored solutions to meet their particular needs in their different stages of life. With regard to execution, we ensure a client-focused and efficient sales process.
We measure the performance of our business against four key performance indicators: pre-tax profit growth, cost / income ratio, net new business volume growth for personal banking and net interest margin. We also evaluate our performance against our annual performance targets, which comprise a cost / income ratio of 50–60%, a net new business volume growth rate of 1–4% for personal banking, and a net interest margin of 140–180 basis points, as defined in the “Our strategy” section of this report.
® Refer to the “Our strategy” section of this report for more information on our targets
In the corporate and institutional business we focus on a qualitative growth strategy. Our key strategic focus is centered on continuous improvement of our profitability and capital efficiency. Through cross-divisional collaboration, we deliver our full value proposition to our clients, leveraging our capabilities across all business divisions.
Our size in Switzerland and the diversity of businesses we operate put us in an advantageous position to serve all our clients’ complex financial needs in an integrated and efficient way. We aim to be the main bank of corporate and institutional clients ranging from small and medium-sized enterprises to multinationals, and from pension funds and insurers to commodity traders and banks. We serve more than 120,000 companies, including more than 85% of the 1,000 largest Swiss corporations, one in three pension funds in Switzerland including 75 of the largest 100, and around 80% of banks domiciled in Switzerland. We strive to selectively expand our market share in Switzerland with a focus on cash flow-based lending and fee and trading business. Additionally, we systematically expand our international footprint, leveraging our product capabilities to optimally serve Swiss corporate clients with activities abroad as well as global corporate clients with headquarters in Switzerland.
Our clients value the good work we do and have rewarded it once again. In 2015, for the fifth consecutive year, the international finance magazine Euromoney named UBS “Best Domestic Cash Manager Switzerland” on the basis of a survey of cash managers and chief financial officers. Additionally, in 2015, UBS was rated as a leading asset servicing provider across several categories according to the R&M Survey, one of the industry’s most important client surveys, recognizing UBS as the “Best Custodian for Asset Managers”.
As the leading private and corporate banking business in Switzerland, we understand the importance of our role in supporting our clients’ needs. We continuously review structures and processes in order to simplify our service commitments across the business, including streamlining our processes, reducing the administrative burden on our client advisors and enhancing their long-term productivity without compromising our risk standards.
Continuous development, particularly of our client-facing staff, is a crucial element of our strategy, as this is our key to ensuring superior client service. UBS is a front-runner in the Swiss market in terms of the certification of its client advisors and has set a standard with its state-accredited ISO certification program. Other banking groups in Switzerland have followed UBS in adopting the standard for their own certification programs.
Organizational structure
We are a core element of UBS’s universal bank delivery model in Switzerland, which allows us to extend the expertise of the entire bank to our Swiss private, corporate and institutional clients. Switzerland is the only country where we operate in private, corporate and institutional banking, wealth and asset management, as well as investment bank services.
To ensure consistent delivery throughout Switzerland, the Swiss network is organized into 10 geographical regions. Dedicated management teams in the regions and in the branches derived from all business areas are responsible for executing the universal bank model, fostering cross-divisional collaboration and ensuring that the public and clients have a uniform experience based on a single corporate image and shared standards of service.
Competitors
In the Swiss retail business, our competitors are Raiffeisen, Credit Suisse, the cantonal banks, PostFinance, and other regional and local Swiss banks.
In the Swiss corporate and institutional business, our main competitors are Credit Suisse, the cantonal banks and foreign banks in Switzerland.
Operating environment and strategy
Personal & Corporate Banking
Products and services
Our private clients have access to a comprehensive life-cycle-based offering, comprising easy-to-understand products, including cash accounts, payments, savings and retirement solutions, investment fund products, residential mortgages, a loyalty program and advisory services. We provide financing and investment solutions to our corporate and institutional clients, offering access to equity and debt capital markets, syndicated and structured credit, private placements, leasing and traditional financing. Our transaction banking offers solutions for payment and cash management services, trade and export finance, receivable finance, as well as global custody solutions to institutional clients. In 2015, we implemented a number of product and service innovations. Examples include the launch of our innovative Corporate Financial Management for our small and medium-sized clients, the development of an electronic document presentation service for trade finance transactions, as well as the continued extension of our corporate banking capabilities targeted at subsidiaries and branches of Swiss clients in Singapore and Hong Kong. Additionally, we further extended our Multi-channel Center to optimally steer clients across digital and non-digital channels and to create a unique client experience. To best leverage our value proposition to clients, close collaboration with our investment bank and asset management businesses are key building blocks in our universal bank strategy. This enables us to offer capital market products, foreign exchange products, hedging strategies and trading capabilities, as well as to provide corporate finance advice through the Investment Bank and state-of-the-art fund solutions and portfolio management through Asset Management.
Our distribution model is based on a solid, balanced multi-channel strategy. Our expanding electronic and mobile banking offering is very well-regarded and we continue to see a steadily rising number of users and client interactions. The joint introduction of Paymit with SIX and Zürcher Kantonalbank has made UBS the leader in the Swiss mobile payment space. UBS Paymit achieved more than 150,000 downloads by the end of 2015. We will continue to build on our position as the leading multi-channel bank in Switzerland and as an innovator in digital services to improve client experience, capture market share and increase efficiency.
Asset Management
Asset Management is a large-scale asset manager, with a presence in 22 countries. We offer investment capabilities and investment styles across all major traditional and alternative asset classes to institutions, wholesale intermediaries and wealth management clients around the world.
Business
We are a leading fund house in Europe, the largest mutual fund manager in Switzerland, the third-largest international asset manager in Asia, the second largest fund of hedge funds manager and one of the largest real estate investment managers in the world. We provide investment management products and services to a broad range of clients around the world, including: corporate and public pension plans; sovereign institutions such as governments and central banks; supranationals; endowments, municipalities and charities; insurance companies; wholesale intermediaries; financial institutions; and private clients.
Our global investment capabilities include equities, fixed income, currency, hedge funds, real estate, infrastructure and private equity, which can also be combined into customized solutions and multi-asset strategies. Complementing our investment offering, our fund services business provides administration services for traditional UBS and third-party funds.
We have a diverse client base located throughout the world. As of 31 December 2015, invested assets totaled CHF 650 billion and assets under administration were CHF 407 billion. Approximately 66% of invested assets were from institutional clients and the remainder was from wholesale clients, including UBS’s wealth management businesses and third parties.

Operating environment and strategy
Asset Management
Approximately 30% of invested assets were managed in passive strategies, 9% were money market assets and the remaining 61% were managed in active, non-money market strategies.
Strategy and clients
We aspire to provide our clients with the best ideas and superior investment performance by drawing on the breadth and depth of our insights and capabilities to deliver high-quality solutions and services.
Our aim is to drive profitable and sustainable growth across our client segments. For third-party clients, we are focusing our growth ambitions on key markets, strengthening our institutional business and accelerating the growth of our wholesale business. We are also intensifying our coverage and collaboration with UBS’s wealth management businesses to continue to deliver products that meet their clients’ needs.
Our global business model has proven resilient to challenging market conditions, and provides a solid foundation to capture growth opportunities despite shifting market dynamics.
In 2015 we sold our Alternative Fund Services (AFS) business to Mitsubishi UFJ Financial Group, as part of our strategy to focus on delivering best-in-class investment management capabilities to our clients.
We intend to build on our areas of strength in traditional, alternative and passive investments. In alternatives, we will continue to expand our established positions in real estate and hedge funds, leveraging our expertise and best practice across all investment areas. To further develop our solutions offering to meet client needs across alternative and traditional asset classes, we have brought together our customized client solutions capabilities. In passive investments, we continue to develop our well-established capabilities, including indexed strategies and exchange-traded funds (ETFs).
To support the successful execution of our strategy, we are investing in our operating platform and in attracting, developing and retaining world-class professionals.
We measure the performance of our business against five key performance indicators: pre-tax profit growth, cost / income ratio, net new money growth, gross margin on invested assets and net margin on invested assets. We also evaluate our performance against our annual performance targets, which include an annual pre-tax profit of CHF 1 billion in the medium term, a cost / income ratio of 60–70%, and 3–5% net new money growth, excluding money market flows, as defined in the “Our strategy” section of this report.
® Refer to the “Our strategy” section of this report for more information on our targets
The asset management industry has seen continued asset inflows. The long-term outlook is positive, with three main drivers: (i) populations are aging in developed countries and this will increase future savings requirements; (ii) governments are continuing to reduce support for pensions and benefits, leading to a greater need for private funding; and (iii) emerging regulation is creating opportunities for asset managers that have the scale to deliver new value-added services.
Organizational structure
Following the sale of our AFS business, at the end of 2015 we employed 2,277 personnel in 22 countries, and have our principal offices in Chicago, Frankfurt, Hartford, Hong Kong, London, New York, Singapore, Sydney, Tokyo and Zurich.
Effective 1 January 2016, our structure is organized around the following investment areas and functions:
– Investment and business areas: Equities, Multi-Asset & O’Connor; Fixed Income; Global Real Estate; Infrastructure and Private Equity; Solutions; and Fund Services.
– Distribution: global and regional teams responsible for client servicing and coverage;
– Products: global and regional teams responsible for product development and lifecycle management
– Support functions, including the Chief Operating Officer area and shared services provided by Corporate Center.
Competitors
Our competitors include global firms with wide-ranging capabilities and distribution channels, such as BlackRock, JP Morgan Asset Management, BNP Paribas Investment Partners, Amundi, Goldman Sachs Asset Management, AllianceBernstein Investments, Schroders and Morgan Stanley Investment Management. Our other competitors include firms with a specific market or asset class focus.
Products and services
We offer clients a wide range of investment products and services in different asset class capabilities, which can be delivered through segregated, pooled or advisory mandates as well as registered investment funds in a variety of jurisdictions. Our active traditional and alternative capabilities are:
– Equities – investment strategies with varying risk and return objectives, including global, region-focused and thematic strategies, as well as high alpha, growth and quantitative styles.
– Multi-Asset – global and regional asset allocation and currency investment strategies across the risk / return spectrum.
– O’Connor – a global, relative value-focused, single-manager hedge fund platform providing investors with absolute and risk-adjusted returns.
– Fixed Income – global, regional and local market-based single-sector, multi-sector and extended sector strategies such as high yield and emerging market debt. The team also manages unconstrained fixed income and currency strategies.
– Global Real Estate – global and regional strategies across the major real estate sectors, mainly focused on core and value-added strategies, and also including other strategies across the risk / return spectrum.
– Infrastructure and Private Equity – direct infrastructure investment in core infrastructure assets globally, and multi-manager infrastructure and private equity strategies in broadly diversified fund of funds portfolios.
Our Solutions business offers:
– Multi-manager hedge fund solutions and advisory services, providing exposure to hedge fund investments with tailored risk and return profiles.
– Customized multi-asset solutions and advisory services, including risk-managed and structured strategies, manager selection, pension risk management, risk advisory and global tactical asset allocation.
Our passive capabilities include indexed, alternative beta and rules-based strategies across equities, fixed income, commodities, real estate and alternatives with benchmarks ranging from mainstream to highly customized indices and rules-driven solutions. Products are offered in a variety of structures, including ETFs, pooled funds, structured funds and mandates.
Operating environment and strategy
Investment Bank
Investment Bank
The Investment Bank provides corporate, institutional and wealth management clients with expert advice, innovative solutions, execution and comprehensive access to international capital markets. We offer advisory services and provide in-depth cross-asset research, along with access to equities, foreign exchange, precious metals and selected rates and credit markets, through our business units, Corporate Client Solutions and Investor Client Services. The Investment Bank is an active participant in capital markets flow activities, including sales, trading and market-making across a range of securities.
Business
The Investment Bank is organized as two distinct but aligned business units:
Corporate Client Solutions
Corporate Client Solutions includes all advisory and financing solutions businesses, origination, structuring and execution, including equity and debt capital markets in service of corporate, financial institution, sponsor clients and UBS’s wealth management businesses.
Investor Client Services
Investor Client Services includes execution, distribution and trading for institutional investors and provides support to Corporate Client Solutions and UBS’s wealth management businesses. It includes our equities businesses, including cash, derivatives and financing services, cross-asset class research capabilities, and our foreign exchange franchise, precious metals, rates and credit businesses. The Investor Client Services unit also provides distribution and risk management capabilities required to support all of our businesses.
Strategy and clients
We aspire to provide best-in-class services and solutions to our corporate, institutional and wealth management clients, through an integrated, solutions-led approach, driven by intellectual capital and leveraging our award-winning electronic platforms. With our client-centric business model, we are an ideal partner for our wealth management, personal & corporate banking and asset management businesses, and we are well-positioned to provide our clients with deep market insight as well as global coverage and execution.
We continue to focus on our traditional strengths in advisory, capital markets, equities and foreign exchange businesses, complemented by a re-focused rates and credit platform, in order to deliver attractive, sustainable, risk-adjusted returns. Supported by world-class research and technology capabilities, we continue to pioneer innovative and integrated solutions across asset classes. We are thus able to support our clients as they adapt to evolving market structures, driven by regulatory and technological changes.
Our Corporate Client Solutions business unit includes our advisory and capital markets businesses and financing solutions, which are geared toward industries and regions that offer the best opportunities to meet our long-term strategic goals. We are present in all major financial markets, with coverage based on a comprehensive matrix of country, sector and product banking professionals.
Within Investor Client Services, we are one of the leading equities franchises in the world. The business continues to leverage its global distribution platform and comprehensive product capabilities, to support a broad client base, including UBS’s wealth management businesses, and institutional and retail investors, providing access to primary and secondary equity markets globally. Our foreign exchange and precious metals businesses, underpinned by a world-class distribution platform, continue to be a cornerstone of our services. Consistent with our strategy, our rates and credit businesses are focused on client flow and solutions, in addition to executing and clearing exchange-traded fixed income and commodities derivatives. In line with the equities and foreign exchange businesses, the rates and credit businesses serve our capital markets business through an intermediation model.
To ensure the ongoing successful execution of our strategy, we continue to invest in technology and selectively recruit talent in key areas across the business. Furthermore, we remain focused on our ongoing cost reduction programs and on strengthening our operational risk framework. In 2015, we continued to further optimize internal efficiencies by implementing a targeted technology plan. This plan is based on a long-term portfolio approach across businesses aimed at enhancing the effectiveness of our platform for clients. In addition, we continue to take measures to simplify our production processes, achieve leaner front-to-back processes and operate with a reduced real-estate footprint.
To support our goal of earning attractive returns on our allocated capital, we operate within a tightly controlled framework of balance sheet, risk-weighted assets and leverage ratio denominator. Consistent with this, we assess both the Corporate Client Solutions and the Investor Client Services business units based on the returns they generate individually, as well as considering the support and contribution they provide to each other.
We assess the performance of our business through five key performance indicators: pre-tax profit growth, cost / income ratio, return on attributed equity (RoaE), gross return on assets and average value-at-risk (VaR). We also evaluate our performance against our performance targets, which comprise a cost / income ratio of 70–80% and an annual pre-tax RoaE of greater than 15%, as defined in the “Our strategy” section of this report. In addition, we have short- to medium-term expectations for fully applied risk-weighted assets of CHF 85 billion, and a fully applied leverage ratio denominator of CHF 325 billion.
® Refer to the “Our strategy” section of this report for more information on our targets and expectations
Organizational structure
At the end of 2015, we employed 5,243 personnel in over 35 countries, and had our principal offices in Hong Kong, London, New York, Singapore, Sydney, Tokyo and Zurich.
To ensure that our corporate and institutional clients benefit from our global reach and capabilities in tailoring solutions to meet their individual needs, we are organized into two client-centric business units: Corporate Client Solutions and Investor Client Services. Dedicated management teams in these business units complement our global product capabilities with their regional expertise to foster cross-product and cross-divisional collaboration, enabling us to deliver the firm’s comprehensive range of services to our clients.
We are governed by executive, operating and risk committees and operate through UBS AG branches, and other subsidiaries of UBS Group. Securities activities in the US are conducted through UBS Securities LLC, a registered broker-dealer. In the UK, Investment Bank activities are conducted mainly out of UBS AG London Branch and UBS Limited, consistent with the modified operating model implemented during 2014 and 2015 for UBS Limited.
Competitors
Competing firms are active in many of the businesses and markets in which we participate, but our Investment Bank’s strategy is unique. The main competitors of our equities, foreign exchange and corporate advisory businesses are the major global investment banks, including Bank of America Merrill Lynch, Barclays, Citigroup, Credit Suisse, Deutsche Bank, Goldman Sachs, JP Morgan Chase and Morgan Stanley.
Products and services
Corporate Client Solutions
This unit provides client coverage, advisory, debt and equity capital market solutions and financing solutions for corporate, financial institution, financial sponsor clients and clients of UBS’s wealth management businesses. Corporate Client Solutions works closely with Investor Client Services in the distribution and risk management of capital markets products and financing solutions. With a presence in all major financial markets, Corporate Client Solutions is managed by region and is organized on a matrix of product, industry sector and country banking professionals. Its main business lines are as follows:
– Advisory provides bespoke solutions for our clients’ most complex strategic challenges. This includes domestic and cross-border mergers and acquisitions, as well as spin-offs, exchange offers, leveraged buyouts, joint ventures, exclusive sales, restructurings, takeover defense, corporate broking and other advisory services.
– Equity capital markets offers equity capital-raising services, as well as related derivative products and risk management solutions. Its services include managing initial public offerings, follow-ons, including rights issues and block trades, as well as private placements, equity-linked transactions and other strategic equities solutions.
– Debt capital markets works closely with corporate and financial institution clients in raising debt capital, including investment-grade and emerging market bonds, high-yield bonds, subordinated debt and hybrid capital. It also offers event-driven (acquisition, leveraged buy-out) loans, bonds and mezzanine financing. All debt products are provided alongside risk management solutions, including derivatives in close collaboration with our foreign exchange, rates and credit businesses.
– Financing solutions serves corporate and investor clients across the globe by providing customized solutions across asset classes via a wide range of financing capabilities, including structured financing, real estate finance and special situations.
– Risk management includes corporate lending and associated hedging activities.
Operating environment and strategy
Investment Bank
Investor Client Services
Investor Client Services, which includes our equities business and our foreign exchange, rates and credit business, provides a comprehensive distribution platform with enhanced cross-asset delivery as well as specialist skills to our corporate, institutional and wealth management clients.
Equities
We are one of the world’s largest equities houses and one of the leading participants in the primary and secondary markets for cash equities and equity derivatives. We provide a full front-to-back product suite globally, including financing, execution, clearing and custody services. Our franchise takes a client-centric approach in serving hedge funds, asset managers, wealth management advisors, financial institutions and sponsors, pension funds, sovereign wealth funds and corporations globally. We distribute, structure, execute, finance and clear cash equity and equity derivative products. Our research franchise provides in-depth investment analysis on companies, sectors, regions, macroeconomic trends, public policy and asset-allocation strategies. The main business lines of the equities unit are:
– Cash provides clients with liquidity, investment advisory, trade execution and consultancy services, together with comprehensive access to primary and secondary markets, corporate management and subject matter experts. We offer full-service trade execution for single stocks and portfolios, including capital commitment, block trading, small-cap execution and commission management services. In addition, we provide clients with a full suite of advanced electronic trading products, direct market access to over 100 venues worldwide, including low-latency execution, innovative algorithms and pre-trade, post-trade and real-time analytical tools. Our broker and intermediary services franchise offers execution and price improvement to retail wholesalers.
– Derivatives provides a full range of flow and structured products, convertible bonds and strategic equity solutions with global access to primary and secondary markets. It enables clients to manage risk and meet funding requirements through a wide range of listed, over-the-counter, securitized and fund-wrapped products. We create and distribute structured products and notes for institutional and retail investors with investment returns linked to companies, sectors and indices across multiple asset classes, including commodities.
– Financing services provides a fully integrated platform for our hedge fund clients, including prime brokerage, capital introduction, clearing and custody, synthetic financing and securities lending. In addition, we execute and clear exchange-traded equity derivatives in more than 45 markets globally.
Foreign exchange, rates and credit
Foreign exchange, rates and credit consists of our foreign exchange franchise, which ranks in the top tier globally, and our market-leading precious metals business, as well as select rates and credit businesses. These businesses support the execution, distribution and risk management related to corporate and institutional client businesses, and they also meet the needs of UBS’s wealth management clients via targeted intermediaries. We are focused on building a leading agency execution and electronic trading business, and continue to maintain high levels of balance sheet velocity. The main business lines are:
– Foreign exchange provides a full range of G10 and emerging markets currency and precious metals services globally. We are one of the leading foreign exchange market-makers in the professional spot, forwards and options markets. We provide clients worldwide with first-class execution facilities (voice, electronic, algorithmic) coupled with our robust advisory and structuring capabilities when tailored solutions best fit our clients’ positioning, hedging or liquidity management. We have been present in physical and non-physical precious metals markets for almost a century, providing trading, investing and hedging across the precious metals spectrum.
– Rates and credit encompasses sales, trading and market-making in a selected number of rates and credit products, including standardized rates-driven products, interest rate swaps, medium-term notes, government and corporate bonds, bank notes, credit derivatives and the execution and clearing of exchange-traded fixed income and commodities derivatives. In addition, we work closely with Corporate Client Solutions, providing support to our debt capital markets businesses and tailoring customized financing solutions for our clients.
Research
UBS Securities Research offers its clients key insights on multiple securities in major financial markets around the globe.
Designed to be closely aligned with the needs of its clients, UBS Securities Research’s approach to sell-side financial research starts with identifying the issues that drive market prices. In our flagship 'Q-series' reports, which are based on questions received from our clients, UBS Securities Research analysts, economists and strategists address issues with a coordinated perspective across regions, sectors, and asset classes.
With insightful evidence being a continued need for our clients, we have established UBS Evidence Lab, which is now the sell-side's largest team of experienced primary research experts. Working in collaboration with UBS Securities Research analysts, UBS Evidence Lab helps uncover new evidence on key issues that inform clients on investment decisions, facilitated by its cutting-edge toolkit of techniques.
Corporate Center
Corporate Center is comprised of Services, Group Asset and Liability Management (Group ALM) and Non-core and Legacy Portfolio. Services includes the Group’s control functions and provides all logistics and support services to our businesses. Group ALM is responsible for centrally managing the Group’s liquidity and funding position, as well as providing other balance sheet and capital management services to the Group. Non-core and Legacy Portfolio is comprised of the non-core businesses and legacy positions that were part of the Investment Bank prior to its restructuring.
Strategic priorities and initiatives
Achieving greater effectiveness and efficiency is the primary focus of our strategy across the whole of Corporate Center. At year-end 2015, we achieved CHF 1.1 billion of net cost reductions compared with full-year 2013 and we remain fully committed to achieving our net cost reduction target of CHF 2.1 billion by year-end 2017. We continue to focus our efforts on the strategic levers that can be categorized into workforce and footprint, organization and process optimization, and technology.
Today, 27% of employees and contractors are in offshore or nearshore locations compared with 18% two years ago. In addition to lower future personnel expenses, this allows us to tap growing talent pools and realize efficiencies by reducing our footprint in high-cost real estate locations.
Through organization and process optimization, we seek to increase effectiveness and efficiency by leveraging common capabilities and creating centralized functions. Within Group Technology, we continue to modernize our infrastructure and simplify our portfolio of applications.
Group Asset and Liability Management continues to focus on optimizing our asset and liability positions across the Group. The key drivers of these activities are the management of our structural risks, including foreign exchange sensitivity, counterparty credit risk and interest rate risk in the banking book; the ongoing evolution of the global regulatory landscape; and changes to the financial resource requirements of our business divisions.
Non-core and Legacy Portfolio continues a wind-down strategy that balances the further disciplined reduction of both our risk-weighted assets and our leverage ratio denominator, weighed against the ultimate benefit for shareholders.
® Refer to the “Our strategy” section of this report for more information
Corporate Center – Services
At the end of 2015, 23,470 personnel were employed in Corporate Center – Services. Corporate Center – Services allocates the majority of its operating expenses associated with shared services functions to the business divisions and other Corporate Center units for which the respective services are performed based on service consumption, including operations, information technology, human resources, regulatory relations and strategic initiatives, communications and branding, corporate services, physical security, information security as well as outsourcing, nearshoring and offshoring. Additionally, operating expense associated with control functions, including Group Finance, Group Risk and Group General Counsel, is allocated to the business divisions and other Corporate Center units based on utilization.
Each year, as part of the annual business planning cycle, Corporate Center – Services agrees with the business divisions, Non-core and Legacy Portfolio as well as Group ALM cost allocations for services at fixed amounts or at variable amounts based on fixed formulas, depending on capital and service consumption levels as well as the nature of the service performed. However, as actual costs incurred may differ from those expected, Corporate Center – Services may recognize significant under- or over-allocations depending on various factors, including Corporate Center – Services' ability to manage the delivery of its services and achieve cost savings.
Operating expenses remaining in Corporate Center – Services after allocations relate mainly to Group governance functions and other corporate activities, certain strategic and regulatory projects and certain retained restructuring expenses.
Operating environment and strategy
Corporate Center
Group Chief Financial Officer
Our Group Chief Financial Officer (Group CFO) is responsible for ensuring transparency in, and the assessment of, the financial performance of our Group and business divisions and for the Group’s financial accounting, controlling, forecasting, planning and reporting processes. The Group CFO also provides advice on financial aspects of strategic projects and transactions. The Group CFO is also responsible for management and control of the Group’s tax affairs and for treasury and capital management, including management and control of our regulatory capital ratios, as well as funding and liquidity risk with independent oversight from the Group Chief Risk Officer (Group CRO). After consultation with the Audit Committee of the Board of Directors (BoD), our Group CFO makes proposals to the BoD regarding the accounting standards adopted by the Group, and defines financial reporting and disclosure standards. Together with the Group Chief Executive Officer (Group CEO), the Group CFO provides external certifications under sections 302 and 404 of the Sarbanes-Oxley Act of 2002, and, in coordination with the Group CEO, manages relations with investors and external analysts. The Group CFO supports the Group CEO in strategy development and key strategic topics. The Corporate Development function supports UBS’s senior management in the definition, implementation and monitoring of UBS’s strategy.
Group Chief Operating Officer
Our Group Chief Operating Officer (Group COO) is responsible for Group Technology, Group Operations and Group Corporate Services. The Group COO is responsible for providing high-quality, cost-effective and differentiating Group-wide IT services and tools in line with the needs of the business divisions and Corporate Center and for the delivery of a wide range of operational services across all business divisions and regions. The Group COO is also responsible for supplying real estate infrastructure and general administrative services, and for directing and controlling all supply and demand management activities for the entire firm. He supports the firm with its third-party sourcing strategies and takes responsibility for the bank’s nearshore, offshore, outsourcing and supplier-related processes. The Group COO supports the Group in enabling change and transition by improving the effectiveness and efficiency of UBS’s operating model and processes, reducing complexity and enhancing the flexibility and agility of the organization.
Group Chief Risk Officer
The Group Chief Risk Officer (Group CRO) is responsible for the development of the Group’s risk appetite framework, its risk management and control principles and risk policies. In accordance with the risk appetite framework approved by the BoD, the Group CRO is responsible for the implementation of appropriate independent control frameworks for the Group’s credit, market, treasury, country, compliance and operational risks. The Group CRO is also responsible for the development and implementation of the frameworks for risk measurement, aggregation, portfolio controls and, jointly with the Group CFO, for risk reporting. The Group CRO has approval authority for transactions, positions, exposures, portfolio limits and credit risk provisions / allowances in accordance with the risk control authorities delegated to this role. The Group CRO has management responsibility over the divisional, regional and firm-wide risk control functions, and monitors and challenges the bank’s risk-taking activities. Our Group Security Services function is also part of the Group CRO area.
Group General Counsel
Our Group General Counsel (Group GC) is responsible for legal matters, policies and processes, and for managing the legal function of our Group. In addition, the Group GC is responsible for legal oversight in respect of the Group’s key regulatory interactions and for maintaining the relationships with our key regulators with respect to legal matters. The Group GC is also responsible for reporting legal risks and material litigation, as well as managing internal, special and regulatory investigations.
Corporate Center – Group ALM
Group ALM manages the structural risks of our balance sheet including pricing and managing the Group’s structural interest rate and currency risk, funding and liquidity risk, currency basis and interest rate basis risk and collateral risk. Group ALM also seeks to optimize the Group’s financial performance by better matching assets and liabilities within the context of the Group’s liquidity, funding and capital targets. Group ALM serves all business divisions and other Corporate Center units, and its risk management is fully integrated into the Group’s risk governance framework.
The results of certain hedging activities, including any non-economic volatility caused by the applicable accounting treatment, are retained by Group ALM.
Revenues generated by the Group ALM’s banking book interest rate risk management activities performed on behalf of Wealth Management and Personal & Corporate Banking are fully allocated to the originating business divisions. Funding and liquidity costs are allocated to the business divisions and other Corporate Center units based on their consumption, which is driven by various internal funding and liquidity models. The Group seeks to maintain liquidity and funding levels at, or above, the minimum regulatory requirements.
Corporate Center – Non-core and Legacy Portfolio
Corporate Center – Non-core and Legacy Portfolio is comprised of the positions from businesses that were part of the Investment Bank prior to its restructuring, and is overseen by a committee consisting of the Group Chief Executive Officer, the Group Chief Financial Officer and the Group Chief Risk Officer.
Non-core and Legacy Portfolio’s positions are managed and exited over time with the objective of maximizing shareholder value, in line with our strategic plan.
Risk factors
EDTF | Certain risks, including those described below, may impact our ability to execute our strategy or otherwise affect our business activities, financial condition, results of operations and prospects. Because the business of a broad-based international financial services firm such as UBS is inherently exposed to risks that become apparent only with the benefit of hindsight, risks of which we are not presently aware or which we currently do not consider to be material could also impact our ability to execute our strategy. In addition, these risks could affect our business activities, financial condition, results of operations and prospects. The order of presentation of the risk factors below does not indicate the likelihood of their occurrence or the potential magnitude of their consequences. ▲
Fluctuation in foreign exchange rates and continuing low or negative interest rates may have a detrimental effect on our capital strength, our liquidity and funding position, and our profitability
EDTF | We prepare our consolidated financial statements in Swiss francs. However, a substantial portion of our assets, liabilities, invested assets, revenues and expenses, equity of foreign operations and risk-weighted assets (RWA) are denominated in other currencies, particularly the US dollar, the euro and the British pound. Accordingly, changes in foreign exchange rates have an effect on our reported income and expenses, and on other reported figures such as other comprehensive income, invested assets, balance sheet assets, RWA and common equity tier 1 (CET1) capital. These effects may adversely affect our income, balance sheet, capital, leverage and liquidity ratios.
The portion of our operating income denominated in non-Swiss franc currencies is greater than the portion of operating expenses denominated in non-Swiss franc currencies. Moreover, a significant portion of the equity of our foreign operations is denominated in US dollars, euros, British pounds and other foreign currencies. Therefore, the appreciation of the Swiss franc against other currencies generally has an adverse effect on our earnings and equity, including on deferred tax assets, in the absence of any mitigating actions.
Similarly, a significant portion of our capital and RWA is denominated in US dollars, euros, British pounds and other foreign currencies. In order to hedge the CET1 capital ratio, CET1 capital needs to have foreign currency exposure, leading to currency sensitivity of CET1 capital. As a consequence, it is not possible to simultaneously fully hedge the capital and the capital ratio. As the proportion of RWA denominated in foreign currencies outweighs the capital in these currencies, a significant appreciation of the Swiss franc against these currencies could benefit our capital ratios, while a significant depreciation of the Swiss franc against these currencies could adversely affect our Basel III capital ratios.
On 15 January 2015, the Swiss National Bank (SNB) discontinued the minimum targeted exchange rate for the Swiss franc versus the euro, which had been in place since September 2011. At the same time, the SNB lowered the interest rate on deposit account balances at the SNB that exceed a given exemption threshold. These decisions resulted in an immediate, considerable strengthening of the Swiss franc against the euro, US dollar, British pound, Japanese yen and several other currencies, as well as a reduction in Swiss franc interest rates. The longer-term exchange rate of the Swiss franc against these other currencies is not certain, nor is the future direction of Swiss franc interest rates. Several other central banks have also adopted a negative-interest-rate policy.
Swiss counterparties are, in general, highly reliant on the domestic economy and the economies to which they export, in particular the EU and the US. In addition, the EUR / CHF exchange rate is an important risk factor for Swiss corporates. The stronger Swiss franc may have a negative effect on the Swiss economy, particularly on exporters, which could adversely affect some of the counterparties within our domestic lending portfolio and lead to an increase in the level of credit loss expenses in future periods from the low levels recently observed.
Moreover, our equity and capital are also affected by changes in interest rates. In particular, the calculation of our net defined benefit assets and liabilities is sensitive to the discount rate applied. Any further reduction in interest rates would lower the discount rates and result in an increase in pension plan deficits due to the long duration of corresponding liabilities. This would lead to a corresponding reduction in our equity and fully applied CET1 capital.
Operating environment and strategy
Risk factors
A continuing low or negative interest rate environment would likely have an adverse effect on the repricing of UBS's assets and liabilities, and may significantly impact the net interest income generated from our wealth management businesses and Personal & Corporate Banking. The low or negative interest rate environment may affect customer behavior and hence the overall balance sheet structure. It may also affect the performance of our wealth management businesses, particularly given the associated cost of maintaining the high-quality liquid assets (HQLA) required to cover regulatory outflow assumptions embedded in the liquidity coverage ratio (LCR), which could be exacerbated by a reduction of the aforementioned SNB deposit exemption threshold for banks. Mitigating actions that we have taken, or may take in the future, to counteract these effects, such as the introduction of selective deposit fees or minimum lending rates, have resulted and could further result in the loss of customer deposits, a key source of our funding, net new money outflows and / or a declining market share in our domestic lending. ▲
Regulatory and legal changes may adversely affect our business and our ability to execute our strategic plans
EDTF | Fundamental changes in the laws and regulations affecting financial institutions can have a material and adverse effect on our business. In the wake of the 2007–2009 financial crisis and the subsequent instability in global financial markets, regulators and legislators have proposed, have adopted, or are actively considering, a wide range of changes to these laws and regulations. These measures are generally designed to address the perceived causes of the crisis and to limit the systemic risks posed by major financial institutions. They include the following:
– significantly higher regulatory capital requirements;
– changes in the definition and calculation of regulatory capital;
– changes in the calculation of RWA, including potential requirements to calculate or disclose RWA using less risk-sensitive standardized approaches rather than the internal models approach we currently use as required by the Swiss Financial Market Supervisory Authority (FINMA) under the Basel III framework;
– prudential adjustments to valuation of assets at the discretion of regulators;
– changes in the calculation of the leverage ratio and the introduction of a more demanding leverage ratio;
– new or significantly enhanced liquidity and stable funding requirements;
– requirements to maintain liquidity and capital in jurisdictions in which activities are conducted and booked;
– limitations on principal trading and other activities;
– new licensing, registration and compliance regimes;
– limitations on risk concentrations and maximum levels of risk;
– taxes and government levies that would effectively limit balance sheet growth or reduce the profitability of trading and other activities;
– cross-border market access restrictions;
– a variety of measures constraining, taxing or imposing additional requirements relating to compensation;
– adoption of new liquidation regimes intended to prioritize the preservation of systemically significant functions;
– requirements to maintain loss-absorbing capital or debt instruments subject to write-down as part of recovery measures or a resolution of the Group or a Group company, including requirements for subsidiaries to maintain such instruments;
– requirements to adopt structural and other changes designed to reduce systemic risk and to make major financial institutions easier to manage, restructure, disassemble or liquidate, including ring-fencing certain activities and operations within separate legal entities; and
– requirements to adopt risk and other governance structures at a local jurisdiction or entity level.
Many of these measures have been adopted and their implementation has had a material effect on our business. Others will be implemented over the next several years; some are subject to legislative action or to further rulemaking by regulatory authorities before final implementation. As a result, there remains significant uncertainty regarding a number of the measures referred to above, including whether, or the form in which, they will be adopted, the timing and content of implementing regulations and interpretations, and the dates of their effectiveness. In addition, the cumulative effect of the changes in laws and regulations in Switzerland and the other jurisdictions in which we operate remains uncertain. The implementation of such measures and further, more restrictive changes may materially affect our business and our ability to execute our strategic plans, impose additional implementation, compliance and other costs on us, or require us to increase prices for, or cease offering of, certain services and products.
Notwithstanding attempts by regulators to align their efforts, the measures adopted or proposed differ significantly across the major jurisdictions, making it increasingly difficult to manage a global institution. Moreover, the absence of a coordinated approach puts institutions headquartered in jurisdictions that impose relatively more stringent standards at a disadvantage. Switzerland has adopted capital and liquidity requirements for its major international banks that are among the strictest of the major financial centers. This could put Swiss banks, such as UBS, at a disadvantage when they compete with peer financial institutions subject to more lenient regulation or with unregulated non-bank competitors. ▲
® Refer to the “Regulatory and legal developments” section of this report for more information
Regulatory and legislative changes in Switzerland
EDTF | Swiss regulatory changes with regards to capital, liquidity and other areas have generally proceeded more quickly than those in other major jurisdictions. FINMA, the SNB and the Swiss Federal Council are implementing requirements that are significantly more onerous and restrictive for major Swiss banks, such as UBS, than those adopted or proposed by regulatory authorities in other major global financial centers.
Capital and TBTF regulation: A revised banking ordinance and capital adequacy ordinance implementing the Basel III capital standards and the Swiss TBTF law became effective on 1 January 2013. As a systemically relevant Swiss bank, we are subject to base capital requirements, as well as a progressive buffer that scales with our total exposure (a metric that is based on our balance sheet size) and market share in Switzerland. In 2015, the Swiss Federal Council published proposed revisions to the Swiss TBTF framework that would significantly increase our capital requirements based on RWA and impose a significantly higher leverage ratio requirement. In addition, the proposed revisions to the TBTF ordinance would impose a total loss absorbing capital requirement. Moreover, Swiss governmental authorities have, and have exercised, the authority to impose an additional countercyclical buffer capital requirement and have further required banks using the internal ratings-based (IRB) approach to use a bank-specific multiplier when calculating RWA for Swiss residential mortgages, income-producing residential and commercial real estate (IPRE) and credit exposures to corporates for the Investment Bank. In addition, UBS has mutually agreed with FINMA to an incremental operational capital requirement to be held against litigation, regulatory and similar matters and other contingent liabilities, which added CHF 13.3 billion to our RWA as of 31 December 2015. There is no assurance that we will not be subject to increases in capital requirements in the future, from the imposition of further add-ons in the calculation of RWA or other components of minimum capital requirements.
Switzerland has implemented new Basel Committee on Banking Supervision (BCBS) requirements for the mandatory Pillar 3 disclosures of RWA based on a harmonized approach, and we expect it will implement, when finalized, the BCBS revisions relating to (i) modifications of the internal ratings-based approach for credit risk, (ii) the fundamental review of the trading book, including a standardized approach, for market risk, (iii) the standardized approach for credit risk, (iv) the introduction of a floor based on the standardized approach, and (v) the calculation of operational risks. The revisions to the BCBS standards are likely to increase our credit risk and market risk RWA and, based on initial analysis, also our operational risk RWA. Implementation of these revisions would result in significant implementation costs to us. In addition, a floor based on a standardized approach would likely be less risk sensitive and may result in significantly higher RWA.
Liquidity and funding: As a Swiss SRB, we are required to maintain an LCR of high-quality liquid assets to estimated stressed short-term net cash outflows, and we will also be required to maintain a net stable funding ratio (NSFR). Both of these requirements are intended to ensure that we are not overly reliant on short-term funding and that we have sufficient long-term funding for illiquid assets.
These requirements, together with liquidity and funding requirements imposed by other jurisdictions in which we operate, oblige us to maintain substantially higher levels of overall liquidity than was previously the case, or limit our efforts to optimize interest expense. Increased capital, funding and liquidity requirements make certain lines of business less attractive and may reduce our overall ability to generate profits. The LCR and NSFR calculations make assumptions about the relative likelihood and amount of outflows of funding and available sources of additional funding in a market or firm-specific stress situation. There can be no assurance that in an actual stress situation our funding outflows would not exceed the assumed amounts.
Resolution planning and resolvability: The Swiss banking act and capital adequacy ordinances provide FINMA with significant powers to intervene in order to prevent a failure of, or resolve, a failing financial institution. FINMA has considerable discretion in determining whether, when, or in what manner to exercise such powers.
In case of a threatened insolvency, FINMA may impose more onerous requirements on us, including restrictions on the payment of dividends and interest. FINMA could also require us, directly or indirectly, for example, to alter our legal structure, including by separating lines of business into dedicated entities, with limitations on intra-group funding and certain guarantees, or to further reduce business risk levels in some manner.
The Swiss banking act also provides FINMA with the ability to extinguish or convert to common equity the capital instruments and liabilities of UBS Group AG, UBS AG and UBS Switzerland AG in connection with a resolution. FINMA has broad powers and significant discretion in the exercise of its powers in connection with a resolution proceeding. Certain classes of creditors, such as Swiss deposits, are protected. As a result, holders of obligations of an entity subject to a Swiss restructuring proceeding may have their obligations extinguished or converted to equity even though obligations ranking on a parity with or junior to such obligations are not restructured.
Swiss TBTF requirements require Swiss SRBs, including UBS, to put in place viable emergency plans to preserve the operation of systemically important functions in the event of a failure of the institution, to the extent that such activities are not sufficiently separated in advance. The current Swiss TBTF law provides for the possibility of a limited reduction of capital requirements for Swiss SRBs that adopt measures to reduce resolvability risk beyond what is legally required. Such actions include changes to the legal structure of a bank group in a manner that would insulate parts of the group to exposure from risks arising from other parts of the group, thereby making it easier to dispose of certain parts of the group in a recovery scenario, to liquidate or dispose of certain parts of the group in a resolution scenario or to execute a debt bail-in. The aforementioned proposal for a revised TBTF ordinance contemplates a limited reduction of the proposed gone concern requirement based on improvements to resolvability. However, there is no certainty with respect to timing or size of a potential rebate.
Operating environment and strategy
Risk factors
Movement of businesses to subsidiaries, which we refer to in this section as subsidiarization, will require significant time and resources to implement. As also discussed below, subsidiarization in Switzerland and elsewhere may create operational, capital, liquidity, funding and tax inefficiencies and may increase our own and our counterparties' credit risk.
There can be no assurance that the execution of the changes we have undertaken, planned or may implement in the future, will result in a material reduction in capital or gone concern requirements or that these changes will satisfy existing or future requirements for resolvability or mandatory structural change in banking organizations.
Market regulation: In June 2015, the Swiss Parliament adopted new regulation of the financial market infrastructure in Switzerland which came into effect on 1 January 2016, subject to phase-in provisions, and mandates, among other things, the clearing of OTC derivatives with a central counterparty. These laws may have a material impact on the market infrastructure that we use, available platforms, collateral management and the way we interact with clients. In addition, these initiatives may cause us to incur material implementation costs. ▲
Regulatory and legislative changes outside Switzerland
EDTF | Regulatory and legislative changes in other locations in which we operate may subject us to a wide range of new restrictions both in individual jurisdictions and, in some cases, globally.
Banking structure and activity limitations: Regulatory and legislative changes may subject us to requirements to move activities from UBS AG branches into subsidiaries. Such subsidiarization can create operational, capital, liquidity, funding and tax inefficiencies, increase our aggregate credit exposure to counterparties as they transact with multiple entities within our Group, expose our businesses to local capital, liquidity and funding requirements, and potentially give rise to client and counterparty concerns about the credit quality of individual subsidiaries. Such changes could also negatively affect our funding model and severely limit our booking flexibility.
For example, we have significant operations in the UK and currently use UBS AG's London branch as a global booking center for many types of products. We have been required by the Prudential Regulatory Authority (PRA) and by FINMA to very substantially increase the capitalization of our UK bank subsidiary, UBS Limited, and may be required to change our booking practices to reduce, or even eliminate, our utilization of UBS AG's London branch as a global booking center for the ongoing business of the Investment Bank.
We are subject to the US "Volcker Rule" under the Dodd-Frank Act and may become subject to other regulations substantively limiting the types of activities in which we may engage. We have incurred substantial costs to implement a compliance and monitoring framework to comply with the Volcker Rule and have been required to modify our business activities both inside and outside of the US to conform to its activity limitations. The Volcker Rule may also have a substantial impact on market liquidity and the economics of market-making activities.
OTC derivatives regulation: In 2009, the G20 countries committed to require all standardized over-the-counter (OTC) derivative contracts to be traded on exchanges or trading facilities and cleared through central counterparties. This commitment is being implemented through Dodd-Frank in the US and corresponding legislation in the EU, Switzerland – where the new regulation came into effect on 1 January 2016 – and other jurisdictions, and has and will continue to have a significant effect on our OTC derivatives business, which is conducted primarily in the Investment Bank. For example, we expect that, as a rule, the shift of OTC derivatives trading to a central clearing model will tend to reduce profit margins in these products. These market changes are likely to reduce the revenue potential of certain lines of business for market participants generally, and we may be adversely affected.
UBS AG registered as a swap dealer with the Commodity Futures Trading Commission (CFTC) in the US at the end of 2012, enabling the continuation of its swaps business with US persons. We expect to register UBS AG as a security-based swap dealer with the SEC, when its registration is required. Some of these regulations, including those relating to swap data reporting, recordkeeping, compliance and supervision, apply to UBS AG globally. The changes in OTC derivative regulation in the US, the EU, Switzerland and elsewhere continue to present a substantial implementation burden, and in some cases US rules will likely duplicate or conflict with legal requirements applicable to us elsewhere, including in Switzerland, and may place us at a competitive disadvantage to firms that are not required to register as swap dealers in the US with the SEC or CFTC.
Regulation of cross-border provision of financial services: In many instances, we provide services on a cross-border basis. We are therefore sensitive to barriers restricting market access for third-country firms. In particular, efforts in the EU to harmonize the regime for third-country firms to access the European market may have the effect of creating new barriers that adversely affect our ability to conduct business in these jurisdictions from Switzerland. In addition, a number of jurisdictions are increasingly regulating cross-border activities on the basis of some notion of comity, e.g., substituted compliance and equivalence determination. A negative determination in certain jurisdictions could limit our access to the market in those jurisdictions and may negatively influence our ability to act as a global firm. In addition, as jurisdictions tend to apply such determinations on a jurisdictional level rather than on an entity level, we will generally need to rely on jurisdictions' willingness to collaborate.▲
Resolution and recovery; bail-in
EDTF | We are currently required to produce recovery and resolution plans in the US, the UK, Switzerland and Germany and are likely to face similar requirements for our operations in other jurisdictions, including our operations in the EU as a whole as part of the proposed EU Bank Recovery and Resolution Directive. If a recovery or resolution plan is determined by the relevant authority to be inadequate or not credible, relevant regulation may authorize the authority to place limitations on the scope or size of our business in that jurisdiction, oblige us to hold higher amounts of capital or liquidity, or to change our legal structure or business in order to remove the relevant impediments to resolution. Resolution plans may increase the pressure on us to make structural changes, such as the creation of separate legal entities, if the resolution plan in any jurisdiction identifies impediments that are not acceptable to the relevant regulators. Such structural changes may negatively affect our ability to benefit from synergies between business units, and if they include the creation of separate legal entities, may have the other negative consequences mentioned above with respect to subsidiarization more generally.
Regulatory requirements for banks to maintain minimum TLAC, such as those contemplated under the proposed revised Swiss TBTF ordinance, or requirements to maintain TLAC at subsidiaries, e.g., those proposed by the Federal Reserve Board for US IHC, as well as the power of resolution authorities to bail in TLAC and other debt obligations and uncertainty as to how such powers will be exercised, will likely increase our cost of funding and could potentially increase the total amount of funding required absent other changes in our business. ▲
Possible consequences of regulatory and legislative developments
EDTF | Planned and potential regulatory and legislative developments in Switzerland and in other jurisdictions in which we have operations may have a material adverse effect on our ability to execute our strategic plans, on the profitability or viability of certain business lines globally or in particular locations, and in some cases, on our ability to compete with other financial institutions. The developments have been, and will likely continue to be costly to implement. They could also have a negative effect on our legal structure or business model, potentially generating capital inefficiencies and affecting our profitability. Finally, the uncertainty related to, or the implementation of, legislative and regulatory changes may have a negative impact on our relationships with clients and our success in attracting client business. ▲
If we are unable to maintain our capital strength, this may adversely affect our ability to execute our strategy, client franchise and competitive position
EDTF | Our capital position, as measured by our risk-weighted capital and leverage ratios under Swiss SRB Basel III requirements, is determined by our RWA, our leverage ratio denominator and our eligible capital. RWA, leverage ratio denominator and eligible capital may fluctuate based on a number of factors.
RWA are credit, non-counterparty related, market and operational risk positions, measured and risk-weighted according to regulatory criteria. They are driven by our business activities and by changes in the risk profile of our exposures, as well as the effect of currency and methodology changes and regulatory requirements. For instance, substantial market volatility, a widening of credit spreads, which is a major driver of our value-at-risk, adverse currency movements, increased counterparty risk, deterioration in the economic environment, or increased operational risk could result in a rise in RWA. Our eligible capital would be reduced if we experienced losses recognized within net profit or other comprehensive income, as determined for the purpose of the regulatory capital calculation, which may also render it more difficult or more costly for us to raise new capital. In addition, eligible capital can be reduced for a number of other reasons, including certain reductions in the ratings of securitization exposures, acquisitions and divestments changing the level of goodwill, adverse currency movements affecting the value of equity, prudential adjustments that may be required due to the valuation uncertainty associated with certain types of positions, and changes in the value of certain pension fund assets and liabilities or in the interest rate and other assumptions used to calculate the changes in our net defined benefit obligation recognized in other comprehensive income. Refer to "Fluctuation in foreign exchange rates and continuing low or negative interest rates may have a detrimental effect on our capital strength, our liquidity and funding position, and our profitability" above for more information on the effect on capital of changes to pension plan defined benefit obligations. Any such increase in RWA or reduction in eligible capital could materially reduce our capital ratios.
Risks captured in the operational risk component of RWA have become increasingly significant as a component of our overall RWA. We have significantly reduced our market risk and credit risk RWA as we have executed our strategy, however, operational risk events, particularly those arising from litigation, regulatory and similar matters have resulted in significant increases in operational risk RWA. We have agreed on a supplemental analysis with FINMA that is used to calculate an incremental operational risk capital charge to be held for litigation, regulatory and similar matters and other contingent liabilities which as of 31 December 2015 was CHF 13.3 billion. There can be no assurance that UBS will be successful in settling these matters at existing or future provision levels, and reducing or eliminating the incremental operational risk component of RWA.
Operating environment and strategy
Risk factors
The required levels and calculation of our regulatory capital and the calculation of our RWA are also subject, in Switzerland or in other jurisdictions in which we operate, to changes in regulatory requirements or their interpretation, as well as the exercise of regulatory discretion. Changes in the calculation of RWA, or, as already discussed above, the imposition of additional supplemental RWA charges or multipliers applied to certain exposures, or the imposition of a RWA floor based on the standardized approach or other methodology changes could substantially increase our RWA. In addition, we may not be successful in our plans to further reduce RWA, either because we are unable to carry out fully the actions we have planned or because other business or regulatory developments or actions counteract to some degree the benefit of our actions.
In addition to the risk-based capital requirements, we are subject to a minimum leverage ratio requirement for Swiss SRBs and expect to become subject to significantly higher leverage ratio-based capital and TLAC requirements under the proposed revisions to the Swiss TBTF framework. The leverage ratio operates separately from the risk-based capital requirements. It is a simple balance sheet measure and therefore limits balance sheet-intensive activities, such as lending, more than activities that are less balance sheet-intensive, and it may constrain our business activities even if we satisfy other risk-based capital requirements. Increases in the minimum leverage ratio or the imposition of other LRD-based requirements, such as in the current Swiss proposal, may adversely affect the profitability of some of our businesses, make these businesses less competitive and adversely affect our profitability. ▲
® Refer to the “Regulatory and legal developments” section of this report for more information
We may not be successful in completing our announced strategic plans
EDTF | In October 2012, we announced a significant acceleration in the implementation of our strategy. The strategy included transforming our Investment Bank to focus it on its traditional strengths, very significantly reducing Basel III RWA and further strengthening our capital position, and significantly reducing costs and improving efficiency. We have substantially completed the transformation of our business. As part of our strategy, we have also announced annual performance expectations and targets for the Group, the business divisions and Corporate Center. In the third quarter of 2015 we amended some of these for 2016 and future years, in light of actual and forecasted changes in macroeconomic conditions, the announcement of the new Swiss TBTF proposal and the continuing costs of meeting new regulatory requirements. A risk remains that we may need to further amend our targets and expectations, that we may not succeed in executing the rest of our plans, that our plans may be delayed, that market events or other factors may adversely affect the implementation of our plans or that their effects may differ from those intended.
In particular, we have substantially reduced the RWA and LRD usage of our Non-core and Legacy Portfolio positions, but there is no assurance that we will continue to be able to exit the remaining positions as quickly as our plans suggest or that we will not incur significant losses in doing so. The continued illiquidity and complexity of many of our legacy risk positions in particular could make it difficult to sell or otherwise exit these positions and reduce the RWA and LRD usage associated with these exposures.
As part of our strategy, we also have a program underway to achieve significant incremental cost reductions. Delivering on our cost reduction initiatives is one of our key priorities, but a number of factors could negatively impact our plans. Higher permanent regulatory costs and business demand than we had originally anticipated have partly offset our gross cost reductions, and although we currently expect to achieve the net cost reduction that we had targeted for 2015 by around the middle of 2016, we could be further challenged in the execution of this and our further cost reduction plans. Moreover, the success of our strategy and our ability to reach some of our announced targets depends on the success of the effectiveness and efficiency measures we are able to carry out. As is often the case with major effectiveness and efficiency programs, our plans involve significant risks. Included among these are the risks that restructuring costs may be higher and may be recognized sooner than we have projected, that we may not be able to identify feasible cost reduction opportunities that are also consistent with our business goals, and that cost reductions may be realized later or may be less than we anticipate. Changes in our work force as a result of outsourcing, nearshoring or offshoring or staff reductions may introduce new operational risks that, if not effectively addressed could affect our ability to recognize the desired cost and other benefits from such changes or could result in operational losses. Changes in workforce location or reductions in workforce can lead to expenses recognized in the income statement well in advance of the cost savings intended to be achieved through such workforce strategy. For example, under International Financial Reporting Standards (IFRS) we are required to recognize provisions for real estate lease contracts when the unavoidable costs of meeting the obligations under the contracts exceed the benefits expected to be received under them. Additionally, closure or disposal of operations may result in foreign currency translation losses (or gains) previously recorded in other comprehensive income being reclassified to the income statement.
As we implement our effectiveness and efficiency programs we may also experience unintended consequences such as the loss or degradation of capabilities that we need in order to maintain our competitive position and achieve our targeted returns. ▲
Material legal and regulatory risks arise in the conduct of our business
EDTF | The nature of our business subjects us to significant regulatory oversight and liability risk. As a global financial services firm operating in more than 50 countries, we are subject to many different legal, tax and regulatory regimes. We are involved in a variety of claims, disputes, legal proceedings and government investigations and inquiries, including matters related to our cross border business and licensing, trading practices, securities offerings including residential mortgage-backed securities, sales practices and suitability, accounting matters, anti-money laundering, sanctions and anti-corruption laws and investment management practices. These proceedings expose us to substantial monetary damages and legal defense costs, injunctive relief and criminal and civil penalties, in addition to potential regulatory restrictions on our businesses. The outcome of most of these matters, and their potential effect on our future business or financial results, is extremely difficult to predict.
In December 2012, we announced settlements totaling approximately CHF 1.4 billion in fines by and disgorgements to US, UK and Swiss authorities to resolve investigations by those authorities relating to LIBOR and other benchmark interest rates. We entered into a non-prosecution agreement (NPA) with the US Department of Justice (DOJ) and UBS Securities Japan Co. Ltd. also pleaded guilty to one count of wire fraud relating to the manipulation of certain benchmark interest rates. In May 2015, the DOJ exercised its discretion to terminate the NPA based on its determination that we had committed a US crime in relation to foreign exchange matters. As a consequence, UBS AG has pleaded guilty to one count of wire fraud for conduct in the LIBOR matter, and has agreed to pay a USD 203 million fine and accept a three-year term of probation.
Our settlements with governmental authorities in connection with foreign exchange and LIBOR and benchmark interest rates starkly illustrate the much-increased level of financial and reputational risk now associated with regulatory matters in major jurisdictions. Very large fines and disgorgement amounts were assessed against us, and we were required to enter guilty pleas, despite our full cooperation with the authorities in the investigations relating to LIBOR and other benchmark interest rates, and despite our receipt of conditional leniency or conditional immunity from antitrust authorities in a number of jurisdictions, including the US and Switzerland. We understand that, in determining the consequences for us, the authorities considered the fact that it had in the recent past been determined that we had engaged in serious misconduct in several other matters.
We continue to be subject to a large number of claims, disputes, legal proceedings and government investigations, including the matters described in the notes to the consolidated financial statements included in this report and we expect that our ongoing business activities will continue to give rise to such matters in the future. The extent of our financial exposure to these and other matters is material and could substantially exceed the level of provisions that we have established. We are not able to predict the financial and other terms on which some of these matters may be resolved. Litigation, regulatory and similar matters may also result in non-monetary penalties and consequences. Among other things, a guilty plea to, or conviction of, a crime (including as a result of termination of the NPA) could have material consequences for us. Resolution of regulatory proceedings may require us to obtain waivers of regulatory disqualifications to maintain certain operations, may entitle regulatory authorities to limit, suspend or terminate licenses and regulatory authorizations and may permit financial market utilities to limit, suspend or terminate our participation in such utilities. Failure to obtain such waivers, or any limitation, suspension or termination of licenses, authorizations or participations, could have material consequences for us.
Ever since our material losses arising from the 2007 to 2009 financial crisis, we have been subject to a very high level of regulatory scrutiny and to certain regulatory measures that constrain our strategic flexibility. While we believe that we have remediated the deficiencies that led to those losses as well as the unauthorized trading incident announced in September 2011, the LIBOR-related settlements of 2012 and settlements with some regulators of matters related to our foreign exchange and precious metals business, the resulting effects of these matters on our reputation and relationships with regulatory authorities have proven to be more difficult to overcome. We are determined to address the issues that have arisen in these and other matters in a thorough and constructive manner. We are in active dialog with our regulators concerning the actions that we are taking to improve our operational risk management and control framework, but there can be no assurance that our efforts will have the desired effects. As a result of this history, our level of risk with respect to regulatory enforcement may be greater than that of some of our peers. ▲
® Refer to “Note 22 Provisions and contingent liabilities” in the "Consolidated financial statements" of this report for more information
Operating environment and strategy
Risk factors
Operational risks affect our business
EDTF | Our businesses depend on our ability to process a large number of complex transactions across multiple and diverse markets in different currencies, to comply with requirements of many different legal and regulatory regimes to which we are subject and to prevent, or promptly detect and stop, unauthorized, fictitious or fraudulent transactions. We also rely on access to, and on the functioning of, systems maintained by third parties, including clearing systems, exchanges, information processors and central counterparties. Failure of our systems or third party systems could have an adverse effect on us. Our operational risk management and control systems and processes are designed to help ensure that the risks associated with our activities, including those arising from process error, failed execution, misconduct, unauthorized trading, fraud, system failures, financial crime, cyber-attacks, breaches of information security and failure of security and physical protection, are appropriately controlled.
We devote significant resources to maintain systems and processes that are designed to protect our systems, networks and software and to protect the confidentiality of information belonging to our customers and us. However, we and other financial services firms have been subject to breaches of security and to cyber and other forms of attack, some of which are sophisticated and targeted attacks intended to gain access to confidential information or systems, disrupt service or destroy data. It is possible that we may not be able to anticipate, detect or recognize threats to our systems or data or that our preventative measures will not be effective to prevent an attack or a security breach. A successful breach or circumvention of security of our systems or data could have significant negative consequences for us, including disruption of our operations, misappropriation of confidential information concerning us or our customers, damage to our systems, financial losses for us or customers, violations of data privacy and similar laws, litigation exposure and damage to our reputation.
A major focus of US governmental policy relating to financial institutions in recent years has been fighting money laundering and terrorist financing. Regulations applicable to us impose obligations to maintain effective policies, procedures and controls to detect, prevent and report money laundering and terrorist financing, and to verify the identity of our clients. We are also subject to laws and regulations related to corrupt and illegal payments to government officials by others, such as the US Foreign Corrupt Practices Act and the UK Bribery Act. We have implemented policies, procedures and internal controls that are designed to comply with such laws and regulations. Failure to maintain and implement adequate programs to combat money laundering, terrorist financing or corruption, or any failure of our programs in these areas, could have serious consequences both from legal enforcement action and from damage to our reputation.
Although we seek to continuously adapt our capability to detect and respond to the risks described above, if our internal controls fail or prove ineffective in identifying and remedying these risks, we could suffer operational failures that might result in material losses, such as the loss from the unauthorized trading incident announced in September 2011.
Our wealth and asset management businesses operate in an environment of increasing regulatory scrutiny and changing standards. Legislation and regulation have changed and are likely to continue to change fiduciary and other standards of care for asset managers and advisors and have increased focus on mitigating or eliminating conflicts of interest between a manager or advisor and the client. These changes have presented, and likely will continue to present, regulatory and operational risks if not implemented effectively across the global systems and processes of investment managers and other industry participants. If we fail to effectively implement controls to ensure full compliance with new, more stringent standards in the wealth and asset management industry, we could be subject to additional fines and sanctions as a result. These could have an impact on our ability to operate or grow our wealth and asset management businesses in line with our strategy.
Certain types of operational control weaknesses and failures could also adversely affect our ability to prepare and publish accurate and timely financial reports. Following the unauthorized trading incident announced in September 2011, management determined that we had a material weakness in our internal control over financial reporting as of the end of 2010 and 2011, although this did not affect the reliability of our financial statements for either year.
In addition, despite the contingency plans we have in place, our ability to conduct business may be adversely affected by a disruption in the infrastructure that supports our businesses and the communities in which we are located. This may include a disruption due to natural disasters, pandemics, civil unrest, war or terrorism and involve electrical, communications, transportation or other services used by us or third parties with whom we conduct business. ▲
Our reputation is critical to the success of our business
EDTF | Our reputation is critical to the success of our strategic plans. Damage to our reputation can have fundamental negative effects on our business and prospects. Reputational damage is difficult to reverse, and improvements tend to be slow and difficult to measure. This was demonstrated in recent years, as our very large losses during the financial crisis, the US cross-border matter (relating to the governmental inquiries and investigations relating to our cross-border private banking services to US private clients during the years 2000–2007 and the settlements entered into with US authorities with respect to this matter) and other events seriously damaged our reputation. Reputational damage was an important factor in our loss of clients and client assets across our asset-gathering businesses, and contributed to our loss of and difficulty in attracting staff in 2008 and 2009. These developments had short-term and also more lasting adverse effects on our financial performance, and we recognized that restoring our reputation would be essential to maintaining our relationships with clients, investors, regulators and the general public, as well as with our employees. More recently, the unauthorized trading incident announced in September 2011 and our involvement in the LIBOR matter and investigations relating to our foreign exchange and precious metals business have also adversely affected our reputation. Any further reputational damage could have a material adverse effect on our operational results and financial condition and on our ability to achieve our strategic goals and financial targets. ▲
Performance in the financial services industry is affected by market conditions and the macroeconomic climate
EDTF | Our businesses are materially affected by market and economic conditions. Adverse changes in interest rates, credit spreads, securities' prices, market volatility and liquidity, foreign exchange levels, commodity prices, and other market fluctuations, as well as changes in investor sentiment, can affect our earnings and ultimately our financial and capital positions.
A market downturn and weak macroeconomic conditions can be precipitated by a number of factors, including geopolitical events, changes in monetary or fiscal policy, trade imbalances, natural disasters, pandemics, civil unrest, war or terrorism. Because financial markets are global and highly interconnected, even local and regional events, such as the ongoing European sovereign debt concerns or concerns around the potential exit from the EU by the UK or a significant slowing of economic growth in China can have widespread impact well beyond the countries in which they occur.
A crisis could develop, regionally or globally, as a result of disruptions in emerging markets as well as developed markets that are susceptible to macroeconomic and political developments, or as a result of the failure of a major market participant. Macroeconomic and political developments can have unpredictable and destabilizing effects, as reflected in our Global Recession scenario, which we implemented in 2015 as the binding scenario in our combined stress-testing framework, and which assumes a hard landing in China leading to severe contagion of Asian and emerging markets economies and at the same time multiple debt restructurings in Europe, related direct losses for European banks and fear of a eurozone breakup severely affecting developed markets such as Switzerland, the UK and the US.
We have material exposures to a number of markets, both as a wealth manager and as an investment bank. Moreover, our strategic plans depend more heavily on our ability to generate growth and revenue in emerging markets, including China, causing us to be more exposed to the risks associated with them. Toward the end of 2015, uncertainties regarding macroeconomic developments in China, and emerging markets more broadly, as well as weakening of commodity prices, particularly oil, have given rise to increased market volatility, which could well persist throughout 2016.
A reduction in business and client activity and market volumes, as significant market volatility can determine and, as we have recently experienced, affects transaction fees, commissions and margins, particularly in our wealth management businesses and our Investment Bank. A market downturn is likely to reduce the volume and valuations of assets we manage on behalf of clients, reducing our asset and performance-based fees. On the other side, reduced market liquidity or volatility limits trading and arbitrage opportunities and impedes our ability to manage risks, impacting both trading income and performance-based fees. Additionally, deteriorating market conditions could cause a decline in the value of assets that we own and account for as investments or trading positions.
The regional balance of our business mix also exposes us to risk. Our Investment Bank equities business, for example, is more heavily weighted to Europe and Asia, and therein our derivatives business is more heavily weighted to structured products for wealth management clients, in particular with European and Asian underlyings. Turbulence in these markets can therefore affect us more than other financial service providers.
The ongoing low interest rate environment will further erode interest margins in several of our businesses and adversely affect our net defined benefit obligations in relation to our pension plans. Moreover, negative interest rates announced by central banks in Switzerland or elsewhere may also affect client behavior. Also, changes to our deposit and lending pricing and structure that we have made and may make to respond to negative interest rates and client behavior may cause deposit outflows (as happened with Wealth Management’s balance sheet and capital optimization program in 2015), reduce business volumes or otherwise adversely affect our businesses, particularly given the associated cost of maintaining the high-quality liquid assets required to cover regulatory outflow assumptions embedded in the LCR.
Operating environment and strategy
Risk factors
Credit risk is an integral part of many of our activities, including lending, underwriting and derivatives activities. Worsening economic conditions and adverse market developments could lead to impairments and defaults on credit exposures and on our trading and investment positions. Losses may be exacerbated by declines in the value of collateral we hold. We are exposed to risk in, among others, our prime brokerage, reverse repurchase and Lombard lending activities, as the value or liquidity of the assets against which we provide financing may decline rapidly.
Because we have very substantial exposures to other major financial institutions, the failure of one or more such institutions could also have a material effect on us.
We are a member of numerous securities and derivative exchanges and clearing houses. In connection with some of those memberships, we may be required to pay a share of the financial obligations of another member who defaults or we may be otherwise exposed to additional financial obligations.
Moreover, if individual countries impose restrictions on cross-border payments or other exchange or capital controls, or change their currency, for example, if one or more countries should leave the euro, we could suffer losses from enforced default by counterparties, be unable to access our own assets, or be impeded in, or prevented from, managing our risks.
The developments mentioned above have in the past affected and could materially affect the performance of the business units and of UBS as a whole, and ultimately our financial and capital position. There are related risks that, as a result of the factors listed above, the carrying value of goodwill of a business unit might suffer impairment and deferred tax asset levels may need to be adjusted. ▲
We may not be successful in implementing changes in our wealth management businesses to meet changing market, regulatory and other conditions
EDTF | We are exposed to possible outflows of client assets in our asset-gathering businesses and to changes affecting the profitability of our wealth management businesses and we may not be successful in implementing the business changes needed to address them.
We experienced substantial net outflows of client assets in our wealth management and asset management businesses in 2008 and 2009. The net outflows resulted from a number of different factors, including our substantial losses, damage to our reputation, the loss of client advisors, difficulty in recruiting qualified client advisors and tax, legal and regulatory developments concerning our cross-border private banking business. Many of these factors have been successfully addressed. However, long-term changes affecting the cross-border private banking business model will continue to affect client flows in the wealth management businesses for an extended period of time.
One of the important drivers behind the longer-term reduction in the amount of cross-border private banking assets, particularly in Europe but increasingly also in other regions, including emerging markets, is the heightened focus of fiscal authorities on cross-border investments. For the last several years, UBS has experienced net withdrawals in its Swiss booking center from clients domiciled elsewhere in Europe, in many cases related to the negotiation of tax treaties between Switzerland and other countries. Changes in local tax laws or regulations and their enforcement, the implementation of cross-border tax information exchange regimes, including international agreements for automatic tax information exchange, national tax amnesty or enforcement programs or similar actions, in Europe or elsewhere in the world, may affect the ability or the willingness of our clients to do business with us, and result in additional, and possibly material, cross-border outflows, or affect the viability of our strategies and business model.
The net new money inflows in recent years in our Wealth Management business division have come predominantly from clients in Asia Pacific and in the ultra high net worth segment globally. Over time, inflows from these lower-margin segments and markets have been replacing outflows from higher-margin segments and markets, in particular cross-border clients. This dynamic, combined with changes in client product preferences as a result of which low-margin products account for a larger share of our revenues than in the past, put downward pressure on our return on invested assets and adversely affect the profitability of our Wealth Management business division.
We will continue our efforts to adjust to client trends, regulatory and market dynamics as necessary, in an effort to overcome the effects of changes in the business environment on our profitability, balance sheet and capital positions, but there is no assurance that we will be able to counteract those effects. Moreover, initiatives we may carry out for this purpose may cause net new money outflows and reductions in client deposits, as happened with Wealth Management's balance sheet and capital optimization program in 2015. In addition, we have made changes to our business offerings and pricing practices in line with the Swiss Supreme Court case concerning retrocessions (fees paid to a bank for distributing third-party and intra-group investment funds and structured products) and other industry developments. These changes may adversely affect our margins on these products and the current offering may be less attractive to clients than the products it replaces. There is no assurance that we will be successful in our efforts to offset the adverse impact of these or similar trends and developments. ▲
® Refer to “Wealth Management” in the "Financial and operating performance" section of this report for more information
We may be unable to identify or capture revenue or competitive opportunities, or retain and attract qualified employees
EDTF | The financial services industry is characterized by intense competition, continuous innovation, detailed, and sometimes fragmented, regulation and ongoing consolidation. We face competition at the level of local markets and individual business lines, and from global financial institutions that are comparable to us in their size and breadth. Barriers to entry in individual markets and pricing levels are being eroded by new technology. We expect these trends to continue and competition to increase. Our competitive strength and market position could be eroded if we are unable to identify market trends and developments, do not respond to them by devising and implementing adequate business strategies, adequately developing or updating our technology, particularly in trading businesses, or are unable to attract or retain the qualified people needed to carry them out.
The amount and structure of our employee compensation are affected not only by our business results but also by competitive factors and regulatory considerations. Constraints on the amount or structure of employee compensation, higher levels of deferral, performance conditions and other circumstances triggering the forfeiture of unvested awards may adversely affect our ability to retain and attract key employees, and may in turn negatively affect our business performance.
We have made changes to the terms of compensation awards to reflect the demands of various stakeholders, including regulatory authorities and shareholders. These terms include the introduction of a deferred contingent capital plan with many of the features of the loss-absorbing capital that we have issued in the market but with a higher capital ratio write-down trigger for members of the Group Executive Board, increased average deferral periods for stock awards, and expanded forfeiture, and to a more limited extent claw-back, provisions for certain awards linked to business performance.
In the EU we are subject to legislation that caps the amount of variable compensation in proportion to the amount of fixed compensation for employees in key risk-taker roles, and whose application could potentially extend to a wider group of employees, on the basis of the revised guidelines on sound remuneration policies published by the European Banking Authority in December 2015.
Moreover, from the 2015 annual general meeting, Swiss law requires UBS to submit to the binding vote of the shareholders the aggregate compensation of each of the board of directors and the executive board on an annual basis.
These requirements, while intended to better align the interests of our staff with those of other stakeholders, increase the risk that key employees will be attracted by competitors and decide to leave us, and that we may be less successful than our competitors in attracting qualified employees. The loss of key staff and the inability to attract qualified replacements, depending on which and how many roles are affected, could seriously compromise our ability to execute our strategy and to successfully improve our operating and control environment. ▲
We hold legacy and other risk positions that may be adversely affected by conditions in the financial markets; legacy risk positions may be difficult to liquidate
EDTF | Like other financial market participants, we were severely affected by the financial crisis that began in 2007. The deterioration of financial markets since the beginning of the crisis was extremely severe by historical standards, and we recorded substantial losses on fixed income trading positions, particularly in 2008 and 2009. Although we have significantly reduced our risk exposures starting in 2008, and more recently as we progress our strategy and focus on complying with Swiss TBTF standards, we continue to hold substantial legacy risk positions, primarily in Corporate Center - Non-core and Legacy Portfolio. In many cases, these risk positions remain illiquid, and we continue to be exposed to the risk that the remaining positions may again deteriorate in value.
Moreover, we hold positions related to real estate in various countries, and could suffer losses on these positions. These positions include a substantial Swiss mortgage portfolio. Although management believes that this portfolio has been very prudently managed, we could nevertheless be exposed to losses if the concerns expressed by the Swiss National Bank and others about unsustainable price escalation in the Swiss real estate market come to fruition. Other macroeconomic developments, such as the implications on export markets of the appreciation of the Swiss franc, the adoption of negative interest rates by the Swiss National Bank or other central banks or any return of crisis conditions within the eurozone, or the EU, and the potential implications of the decision in Switzerland to reinstate immigration quotas for EU / EEA countries, could also adversely affect the Swiss economy, our business in Switzerland in general and, in particular, our Swiss mortgage and corporate loan portfolios. ▲
We depend on our risk management and control processes to avoid or limit potential losses in our businesses
EDTF | Controlled risk-taking is a major part of the business of a financial services firm. Some losses from risk-taking activities are inevitable, but to be successful over time, we must balance the risks we take against the returns we generate. We must, therefore, diligently identify, assess, manage and control our risks, not only in normal market conditions but also as they might develop under more extreme, stressed conditions, when concentrations of exposures can lead to severe losses.
Operating environment and strategy
Risk factors
As seen during the financial crisis of 2007–2009, we are not always able to prevent serious losses arising from extreme or sudden market events that are not anticipated by our risk measures and systems. Value-at-risk, a statistical measure for market risk, is derived from historical market data, and thus by definition could not have anticipated the losses suffered in the stressed conditions of the financial crisis. Moreover, stress loss and concentration controls and the dimensions in which we aggregated risk to identify potentially highly correlated exposures proved to be inadequate. Notwithstanding the steps we have taken to strengthen our risk management and control framework, we could suffer further losses in the future if, for example:
– we do not fully identify the risks in our portfolio, in particular risk concentrations and correlated risks;
– our assessment of the risks identified or our response to negative trends proves to be untimely, inadequate, insufficient or incorrect;
– markets move in ways that we do not expect – in terms of their speed, direction, severity or correlation – and our ability to manage risks in the resulting environment is, therefore, affected;
– third parties to whom we have credit exposure or whose securities we hold for our own account are severely affected by events not anticipated by our models, and accordingly we suffer defaults and impairments beyond the level implied by our risk assessment; or
– collateral or other security provided by our counterparties proves inadequate to cover their obligations at the time of their default.
We also manage risk on behalf of our clients in our asset and wealth management businesses. The performance of assets we hold for our clients in these activities could be adversely affected by the same factors. If clients suffer losses or the performance of their assets held with us is not in line with relevant benchmarks against which clients assess investment performance, we may suffer reduced fee income and a decline in assets under management, or withdrawal of mandates.
If we decide to support a fund or another investment that we sponsor in our asset or wealth management businesses, we might, depending on the facts and circumstances, incur expenses that could increase to material levels.
Investment positions, such as equity investments made as part of strategic initiatives and seed investments made at the inception of funds that we manage, may also be affected by market risk factors. These investments are often not liquid and generally are intended or required to be held beyond a normal trading horizon. They are subject to a distinct control framework. Deteriorations in the fair value of these positions would have a negative impact on our earnings. ▲
Valuations of certain positions rely on models; models have inherent limitations and may use inputs that have no observable source
EDTF | If available, the fair value of a financial instrument or non-financial asset or liability is determined using quoted prices in active markets for identical assets or liabilities. Where the market is not active, fair value is established using a valuation technique, including pricing models. Where available, valuation techniques use market observable assumptions and inputs. If such information is not available, inputs may be derived by reference to similar instruments in active markets, from recent prices for comparable transactions or from other observable market data. If market observable data is not available, we select non-market observable inputs to be used in our valuation techniques.
We also use internally developed valuation models. Such models have inherent limitations; different assumptions and inputs would generate different results, and these differences could have a significant impact on our financial results. We regularly review and update our valuation models to incorporate all factors that market participants would consider in setting a price, including factoring in current market conditions. Judgment is an important component of this process, and failure to make the changes necessary to reflect evolving market conditions could have a material adverse effect on our financial results. Moreover, evolving market practice may result in changes to valuation techniques that could have a material impact on our financial results.
Changes in model inputs or calibration, changes in the valuation methodology incorporated in models, or failure to make the changes necessary to reflect evolving market conditions could have a material adverse effect on our financial results. ▲
Liquidity and funding management are critical to our ongoing performance
EDTF | The viability of our business depends on the availability of funding sources, and our success depends on our ability to obtain funding at times, in amounts, for tenors and at rates that enable us to efficiently support our asset base in all market conditions. A substantial part of our liquidity and funding requirements is met using short-term unsecured funding sources, including retail and wholesale deposits and the regular issuance of money market securities. The volume of our funding sources has generally been stable, but could change in the future due to, among other things, general market disruptions or widening credit spreads, which could also influence the cost of funding. A change in the availability of short-term funding could occur quickly.
Reductions in our credit ratings can increase our funding costs, in particular with regard to funding from wholesale unsecured sources, and can affect the availability of certain kinds of funding. In addition, as we experienced in connection with Moody's downgrade of our long-term rating in June 2012, rating downgrades can require us to post additional collateral or make additional cash payments under master trading agreements relating to our derivatives businesses. Our credit ratings, together with our capital strength and reputation, also contribute to maintaining client and counterparty confidence and it is possible that ratings changes could influence the performance of some of our businesses.
More stringent capital and liquidity and funding requirements will likely lead to increased competition for both secured funding and deposits as a stable source of funding, and to higher funding costs. The addition of loss-absorbing debt as a component of capital requirements and the potential future requirements to maintain senior unsecured debt that could be written down in the event of our insolvency or other resolution, may increase our funding costs or limit the availability of funding of the types required. ▲
Our financial results may be negatively affected by changes to accounting standards
EDTF | We report our results and financial position in accordance with IFRS as issued by the International Accounting Standards Board (IASB). Changes to IFRS or interpretations thereof, may cause our future reported results and financial position to differ from current expectations, or historical results to differ from those previously reported due to the adoption of accounting standards on a retrospective basis. Such changes may also affect our regulatory capital and ratios. We monitor potential accounting changes and when these are finalized by the IASB, we determine the potential impact and disclose significant future changes in our financial statements. Currently, there are a number of issued but not yet effective IFRS changes, as well as potential IFRS changes, some of which could be expected to impact our reported results, financial position and regulatory capital in the future. For example, IFRS 9, when fully adopted, will require us to record loans at inception net of expected losses instead of recording credit losses on an incurred loss basis. ▲
Our financial results may be negatively affected by changes to assumptions supporting the value of our goodwill
EDTF | The goodwill that we have recognized on the respective balance sheets of our operating segments is tested for impairment at least annually. Our impairment test in respect of the assets recognized as of 31 December 2015 indicated that our respective goodwill balances are not impaired. The impairment test is based on assumptions regarding estimated earnings, discount rates and long-term growth rates impacting the recoverable amount of each segment and on estimates of the carrying amounts of the segments to which the goodwill relates. If the estimated earnings and other assumptions in future periods deviate from the current outlook, the value of the goodwill in any one or more of our businesses may become impaired in the future, giving rise to losses in the income statement. ▲
The effect of taxes on our financial results is significantly influenced by reassessments of our deferred tax assets
EDTF | The deferred tax assets (DTAs) that we have recognized on our balance sheet as of 31 December 2015 based on prior years' tax losses reflect the probable recoverable level based on future taxable profit as informed by our business plans. If the business plan earnings and assumptions in future periods substantially deviate from current forecasts, the amount of recognized DTAs may need to be adjusted in the future. These adjustments may include write-downs of DTAs through the income statement.
Our effective tax rate is highly sensitive both to our performance as well as our expectation of future profitability as reflected in our business plans. Our results in recent periods have demonstrated that changes in the recognition of DTAs can have a very significant effect on our reported results. If our performance is expected to improve, particularly in the US, or the UK, we could potentially recognize additional DTAs as a result of that assessment. The effect of doing so would be to significantly reduce our effective tax rate in years in which additional DTAs are recognized and to increase our effective tax rate in future years. Conversely, if our performance in those countries is expected to produce diminished taxable profit in future years, we may be required to write down all or a portion of the currently recognized DTAs through the income statement. This would have the effect of increasing our effective tax rate in the year in which any write-downs are taken.
Operating environment and strategy
Risk factors
For 2016, notwithstanding the effects of any potential reassessment of the level of deferred tax assets, we expect the effective tax rate to be in the range of 22% to 25%. Consistent with past practice, we expect to revalue our deferred tax assets in the second half of 2016 based on a reassessment of future profitability taking into account updated business plan forecasts. The full-year effective tax rate could change significantly on the basis of this reassessment. It could also change if aggregate tax expenses in respect of profits from branches and subsidiaries without loss coverage differ from what is expected. Part of the aforementioned reassessment of future profitability includes consideration of a possible further extension of the forecast period used for US deferred tax asset recognition purposes to eight years from the seven years used as of 31 December 2015. The determination of whether to extend the forecast period by an additional year will be made on the basis of all relevant facts and circumstances existing at that time. Inasmuch as the ex-ante parameters we have established for further extending the forecast period are more challenging to satisfy than in prior years, it is therefore less probable that we will add an eighth year to the forecast period in 2016 for purposes of revaluing our US deferred tax assets.
UBS’s effective tax rate is also sensitive to any future reductions in statutory tax rates, particularly in the US and Switzerland. Reductions in the statutory tax rate would cause the expected future tax benefit from items such as tax loss carry-forwards in the affected locations to diminish in value. This in turn would cause a write-down of the associated DTAs.
In addition, statutory and regulatory changes, as well as changes to the way in which courts and tax authorities interpret tax laws could cause the amount of taxes ultimately paid by UBS to materially differ from the amount accrued.
Moreover, we have undertaken, or are considering, changes to our legal structure in the US, the UK, Switzerland and other countries in response to regulatory changes. Tax laws or the tax authorities in these countries may prevent the transfer of tax losses incurred in one legal entity to newly organized or reorganized subsidiaries or affiliates or may impose limitations on the utilization of tax losses that relate to businesses formerly conducted by the transferor. Were this to occur in situations where there were also limited planning opportunities to utilize the tax losses in the originating entity, the DTAs associated with such tax losses could be written down through the income statement. ▲
As UBS Group AG is a holding company, its operating results, financial condition and ability to pay dividends and other distributions and / or to pay its obligations in the future depend on funding, dividends and other distributions received directly or indirectly from its subsidiaries, which may be subject to restrictions
EDTF | UBS Group AG's ability to pay dividends and other distributions and to pay its obligations in the future will depend on the level of funding, dividends and other distributions, if any, received from UBS AG and any new subsidiaries established by UBS Group AG in the future. The ability of such subsidiaries to make loans or distributions (directly or indirectly) to UBS Group AG may be restricted as a result of several factors, including restrictions in financing agreements, the requirements of applicable law and regulatory, fiscal or other restrictions. UBS Group AG's direct and indirect subsidiaries, including UBS AG, UBS Switzerland AG, UBS Limited and the US IHC (when designated) are subject to laws and regulations that restrict dividend payments, authorize regulatory bodies to block or reduce the flow of funds from those subsidiaries to UBS Group AG, or limit or prohibit transactions with affiliates. Restrictions and regulatory actions of this kind could impede access to funds that UBS Group AG may need to make payments.
In addition, UBS Group AG's right to participate in a distribution of assets upon a subsidiary's liquidation or reorganization is subject to all prior claims of the subsidiary's creditors.
Subordinated debt and capital instruments issued by UBS Group AG that contribute to its regulatory capital contractually prevent UBS Group AG to propose the distribution of dividends to shareholders, other than in the form of shares, if we do not pay interest on these instruments.
UBS Group AG's credit rating could be lower than the rating of UBS AG, which may adversely affect the market value of the securities and other obligations of UBS Group AG on a standalone basis.
Furthermore, we expect that UBS Group AG may guarantee some of the payment obligations of certain of our subsidiaries from time to time. These guarantees may require UBS Group AG to provide substantial funds or assets to subsidiaries or their creditors or counterparties at a time when UBS Group AG is in need of liquidity to fund its own obligations. ▲
Our stated capital returns objective is based, in part, on capital ratios that are subject to regulatory change and may fluctuate significantly
EDTF | We are committed to a total capital return to shareholders of at least 50% of net profit attributable to our shareholders, provided that we maintain a fully applied CET1 capital ratio of at least 13%, and consistent with our objective of maintaining a post-stress fully applied CET1 capital ratio of at least 10%.
Our ability to maintain a fully applied CET1 capital ratio of at least 13% is subject to numerous risks, including the financial results of our businesses, changes to capital standards such as the changes currently proposed in Switzerland, methodologies and interpretation that may adversely affect the calculation of our fully applied CET1 capital ratio, and the imposition of risk add-ons or capital buffers. Refer to "Fluctuation in foreign exchange rates and continuing low or negative interest rates may have a detrimental effect on our capital strength, our liquidity and funding position, and our profitability" and to "If we are unable to maintain our capital strength, this may adversely affect our ability to execute our strategy, client franchise and competitive position" above for more information on certain factors that could cause our capital ratios to fluctuate significantly, including the effect on capital of changes to pension plan defined benefit obligations.
Moreover, changes in the methodology, assumptions, stress scenario, market conditions, business volumes and other factors may result in material changes in our post-stress fully applied CET1 capital ratio. These factors may lead to material fluctuations in our post-stress fully applied CET1 capital ratio during any period. In assessing whether our post-stress fully applied CET1 capital ratio objective has been met at any time, we may consider both the current ratio and our expectation as to future developments in the ratio.
To calculate our post-stress CET1 capital ratio, we forecast capital one year ahead based on internal projections of earnings, expenses, distributions to shareholders and other factors affecting CET1 capital, including our net defined benefit plan assets and liabilities. We also forecast one-year developments in RWA. We adjust these forecasts based on assumptions as to how they may change as a result of a severe stress event. We then further deduct from capital the stress loss estimated using our combined stress test (CST) framework to arrive at the post-stress fully applied CET1 capital ratio. Changes to our results, business plans and forecasts, in the assumptions used to reflect the effect of a stress event on our business forecasts or in the results of our CST, could have a material effect on our stress scenario results and on the calculation of our post-stress fully applied CET1 capital ratio.
Our CST framework relies on various risk exposure measurement methodologies which are predominantly proprietary, on our selection and definition of potential stress scenarios and on our assumptions regarding estimates of changes in a wide range of macroeconomic variables and certain idiosyncratic events for each of those scenarios. We periodically review these methodologies, and assumptions are subject to periodic review and change on a regular basis. Our risk exposure measurement methodologies may change in response to developing market practice and enhancements to our own risk control environment, and input parameters for models may change due to changes in positions, market parameters and other factors.
Our stress scenarios, the events comprising a scenario and the assumed shocks and market and economic consequences applied in each scenario are subject to periodic review and change. A change in the CST scenario used to calculate the post-stress fully applied CET1 capital ratio, or in the assumptions used in a particular scenario, may cause the post-stress fully applied CET1 capital ratio to fluctuate materially.
Our business plans and forecasts are subject to inherent uncertainty, our choice of stress test scenarios and the market and macroeconomic assumptions used in each scenario are based on judgments and assumptions about possible future events. Our risk exposure measurement methodologies are subject to inherent limitations, rely on numerous assumptions as well as on data which may have inherent limitations. In particular, certain data is not available on a monthly basis and we may therefore rely on prior month / quarter data as an estimate.
All of these factors may result in our post-stress fully applied CET1 capital ratio, as calculated using our methodology for any period, being materially higher or lower than the actual effect of a stress scenario. ▲
If we experience financial difficulties, FINMA has the power to open resolution or liquidation proceedings or impose protective measures in relation to UBS Group AG, UBS AG or UBS Switzerland AG, and such proceedings or measures may have a material adverse effect on our shareholders and creditors
EDTF | Under the Swiss Banking Act, FINMA is able to exercise broad statutory powers with respect to Swiss banks and Swiss parent companies of financial groups, such as UBS AG, UBS Group AG and UBS Switzerland AG, if there is justified concern that the entity is over-indebted, has serious liquidity problems or, after the expiration of any relevant deadline, no longer fulfils capital adequacy requirements. Such powers include ordering protective measures, instituting restructuring proceedings (and exercising any Swiss resolution powers in connection therewith), and instituting liquidation proceedings, all of which may have a material adverse effect on our shareholders and creditors or may prevent UBS Group AG or UBS AG from paying dividends or making payments on debt obligations.
Protective measures may include, but are not limited to, certain measures that could require or result in a moratorium on, or the deferment of, payments. We would have limited ability to challenge any such protective measures. Additionally, creditors would have no right under Swiss law or in Swiss courts to reject, seek the suspension of, or challenge the imposition of any such protective measures, including those that require or result in the deferment of payments owed to creditors.
Operating environment and strategy
Risk factors
If restructuring proceedings are opened with respect to UBS Group AG, UBS AG or UBS Switzerland AG, the resolution powers, which FINMA may exercise, include the power to (i) transfer all or some of the assets, debt and other liabilities, and contracts of the entity subject to proceedings to another entity, (ii) stay for a maximum of two business days the termination of, or the exercise of rights to terminate, netting rights, rights to enforce or dispose of certain types of collateral or rights to transfer claims, liabilities or certain collateral, under contracts to which the entity subject to proceedings is a party, and/or (iii) partially or fully write down the equity capital and, if such equity capital is fully written down, convert into equity or write down the capital and other debt instruments of the entity subject to proceedings. Shareholders and creditors would have no right to reject, or to seek the suspension of, any restructuring plan pursuant to which such resolution powers are exercised. They would have only limited rights to challenge any decision to exercise resolution powers or to have that decision reviewed by a judicial or administrative process or otherwise.
Upon full or partial write-down of the equity and of the debt of the entity subject to restructuring proceedings, the relevant shareholders and creditors would receive no payment in respect of the equity and debt that is written down, the write-down would be permanent, and the investors would not, at such time or at any time thereafter, receive any shares or other participation rights, or be entitled to any write-up or any other compensation in the event of a potential recovery of the debtor. If FINMA orders the conversion of debt of the entity subject to restructuring proceedings into equity, the securities received by the investors may be worth significantly less than the original debt and may have a significantly different risk profile, and such conversion would also dilute the ownership of existing shareholders. In addition, creditors receiving equity would be effectively subordinated to all creditors in the event of a subsequent winding up, liquidation or dissolution of the entity subject to restructuring proceedings, which would increase the risk that investors would lose all or some of their investment.
FINMA has broad powers and significant discretion in the exercise of its powers in connection with a resolution proceeding. Certain categories of debt obligations, such as certain types of deposits, are protected. As a result, holders of obligations of an entity subject to a Swiss restructuring proceeding may have their obligations written down or converted into equity even though obligations ranking on par with or junior to such obligations are not written down or converted.
Moreover, FINMA has expressed its preference for a "single-point-of-entry" resolution strategy for global systemically important financial groups, led by the bank's home supervisory and resolution authorities and focused on the top-level group company. This would mean that, if UBS AG or one of UBS Group AG's other subsidiaries faces substantial losses, FINMA could open restructuring proceedings with respect to UBS Group AG only and order a bail-in of its liabilities if there is a justified concern that in the near future such losses could impact UBS Group AG. In that case, it is possible that the obligations of UBS AG or any other subsidiary of UBS Group AG would remain untouched and outstanding, while the equity capital and the capital and other debt instruments of UBS Group AG would be written down and / or converted into equity of UBS Group AG in order to recapitalize UBS AG or such other subsidiary. ▲
Financial and operating performance
.
Financial and operating performance
Critical accounting policies
Critical accounting policies
Basis of accounting
We prepare our consolidated financial statements in accordance with International Financial Reporting Standards (IFRS) as issued by the International Accounting Standards Board (IASB). The application of these accounting standards requires the use of judgment, based on estimates and assumptions that may involve significant uncertainty at the time they are made. Such judgments, including the underlying estimates and assumptions, which encompass historical experience, expectations of the future and other factors are regularly evaluated to determine their continuing relevance based on current conditions. Using different assumptions could cause the reported results to differ. Changes in assumptions may have a significant impact on the financial statements in the periods when changes occur.
We believe that the assumptions we have made are appropriate under the circumstances, and that our financial statements therefore fairly present, in all material respects, the financial position of UBS as of 31 December 2015, and the results of our operations and cash flows for the period then ended in accordance with IFRS. Alternative outcomes and sensitivity analyses discussed or referred to in this section are included solely to assist the reader in understanding the uncertainty inherent in the estimates and assumptions used in our financial statements. They are not intended to suggest that other estimates and assumptions would be more appropriate.
This section discusses accounting policies that are deemed critical to our financial position, the results of our operations and cash flows, because they are material in terms of the items to which they apply, and they involve significant assumptions and estimates. A broader and more detailed description of our significant accounting policies is included in “Note 1 Summary of significant accounting policies” in the “Consolidated financial statements” section of this report.
Fair value of financial instruments
We account for a significant portion of our assets and liabilities at fair value. Under IFRS, the relative degree of uncertainty associated with the measurement of fair value is reflected by use of a three-level valuation hierarchy. The best evidence of fair value is a quoted price in an actively traded market (Level 1). In the event that the market for a financial instrument is not active, or where quoted prices are not otherwise available, a valuation technique is used. In these cases, fair value is estimated using observable data in respect of similar financial instruments as well as financial models. Level 2 of the hierarchy pertains to instruments for which inputs to a valuation technique are principally based on observable market data. Level 3 applies to instruments that are measured by a valuation technique that incorporates one or more significant unobservable inputs. Valuation techniques that rely to a greater extent on unobservable inputs require a higher level of judgment to calculate a fair value than those based entirely on observable inputs. Substantially all of our financial assets and financial liabilities are based on observable prices and inputs and hence are classified in Levels 1 and 2 of the hierarchy.
Where valuation techniques, including models, are used to determine fair values, they are periodically reviewed and validated by qualified personnel, independent of those who created them. Models are calibrated to ensure that outputs reflect actual data and comparable market prices. Also, models prioritize the use of observable inputs, when available, over unobservable inputs. Judgment is required in selecting appropriate models as well as inputs for which observable data is less readily or not available.
Our valuation techniques may not fully reflect all the factors relevant to the positions we hold. Valuations are therefore adjusted, where appropriate, to allow for additional factors, including model risk, liquidity risk and credit risk. We use different approaches to calculate the credit risk, depending on the nature of the instrument. A credit-valuation-adjustment approach based on an expected exposure profile is used to adjust the fair value of derivative instruments, including funded derivative instruments which are classified as Financial assets designated at fair value, to reflect counterparty credit risk. Correspondingly, a debit-valuation-adjustment approach is applied to incorporate our own credit risk, where applicable, in the fair value of derivative instruments. We incorporate funding valuation adjustments into the valuation estimates for certain OTC derivatives, reflecting the market cost of unsecured funding in the valuation of such instruments.
In 2015, we made further enhancements to our valuation methodology for the own credit component of fair value of financial liabilities designated at fair value. This change in accounting estimate resulted in a gain of CHF 260 million.
® Refer to “Note 1b Changes in accounting policies, comparability and other adjustments” in the “Consolidated financial statements” section of this report for more information
As of 31 December 2015, financial assets and financial liabilities for which valuation techniques are used and whose significant inputs are considered observable (Level 2) amounted to CHF 216 billion and CHF 230 billion, respectively, (61% and 85% of total financial assets measured at fair value and total financial liabilities measured at fair value, respectively). Financial assets and financial liabilities whose valuations include significant unobservable inputs (Level 3) amounted to CHF 9 billion and CHF 14 billion, respectively, (3% and 5% of total financial assets measured at fair value and total financial liabilities measured at fair value, respectively). These amounts reflect the effect of offsetting, wherever such presentation is required under IFRS.
Uncertainty inherent in estimating unobservable market inputs can affect the amount of gain or loss recorded for a particular position. While we believe our valuation techniques are appropriate and consistent with those of other market participants, the use of different techniques or assumptions to determine the fair value of certain financial instruments could result in a different estimate of fair value at the reporting date. As of 31 December 2015, the total favorable and unfavorable effects of changing one or more of the unobservable inputs to reflect reasonably possible alternative assumptions for financial instruments classified as Level 3 were CHF 809 million and CHF 640 million, respectively.
® Refer to “Note 24 Fair value measurement” in the “Consolidated financial statements” section of this report for more information
Allowances for credit losses on loans and receivables measured at amortized cost
Allowances for credit losses represent management’s best estimate of credit losses incurred in the loan portfolio at the balance sheet date due to credit deterioration of the issuer or counterparty. The portion of the Group’s loan portfolio that is measured at amortized cost less impairment consists of financial assets presented on the balance sheet lines Due from banks and Loans.
A credit loss expense is recognized if there is objective evidence that we will be unable to collect all amounts due (or the equivalent thereof) on a claim based on the original contractual terms due to credit deterioration of the issuer or counterparty. Allowances for credit losses are evaluated at both a counterparty-specific level and collectively. Under this incurred loss model, a financial asset or group of financial assets is impaired if there is objective evidence that a credit loss has occurred by the balance sheet date. Judgment is used in making assumptions when calculating impairment losses both on a counterparty-specific level and collectively.
The impairment loss for a loan is the excess of the carrying value of the financial asset over the estimated recoverable amount. The estimated recoverable amount is the present value, calculated using the loan’s original effective interest rate, of expected future cash flows, including amounts that may result from restructuring or the liquidation of collateral. If a loan has a variable interest rate, the discount rate for calculating the recoverable amount is the current effective interest rate. An allowance for credit losses is reported as a reduction of the carrying value of the financial asset on the balance sheet.
Collective allowances for credit losses are calculated for portfolios with similar credit risk characteristics, taking into account historical loss experience and current conditions. The methodology and assumptions used are reviewed regularly to reduce any differences between estimated and actual loss experience. For all of our portfolios, we also assess whether there have been any unforeseen developments which might result in impairments but which are not immediately observable. To determine whether such an event-driven collective allowance for credit losses is required, we consider global economic drivers to assess the most vulnerable countries and industries.
As of 31 December 2015, the gross loan portfolio was CHF 313 billion and the related allowances for credit losses amounted to CHF 0.7 billion, consisting of specific and collective allowances of CHF 683 million and CHF 6 million, respectively.
® Refer to “Note 1a item 11 Allowances and provisions for credit losses,” “Note 10 Due from banks and loans (held at amortized cost),” and “Note 12 Allowances and provisions for credit losses” in the “Consolidated financial statements” section of this report for more information
® Refer to “Policies for past due, non-performing and impaired claims” in the “Risk management and control” section of this report for more information
Goodwill impairment test
We perform an impairment test on our goodwill assets on an annual basis, or when indicators of impairment exist. We consider the segments, as reported in “Note 2 Segment reporting,” as separate cash-generating units. The impairment test is performed for each segment to which goodwill is allocated by comparing the recoverable amount, based on its value-in-use, to the carrying amount of the respective segment. An impairment charge is recognized if the carrying amount exceeds the recoverable amount. The impairment test is based on the assumptions described below.
The recoverable amounts are determined using a discounted cash flow model, adapted to use inputs that consider features of the banking business and its regulatory environment. The recoverable amount of a segment is the sum of the discounted earnings attributable to shareholders from the first three forecasted years and the terminal value.
Financial and operating performance
Critical accounting policies
The carrying amount for each segment is determined by reference to our equity attribution framework described in the “Capital management” section of this report. Attributed equity equals the capital that a segment requires to conduct its business and is considered an appropriate starting point to determine the carrying value of the segments. The attributed equity methodology is aligned with the business planning process, the inputs from which are used in calculating the recoverable amounts of the respective cash-generating units.
Valuation parameters used within our impairment test model are linked to external market information, where applicable. The model used to determine the recoverable amount is most sensitive to changes in the forecast earnings available to shareholders in years one to three, to changes in the discount rates, and to changes in the long-term growth rate.
Key assumptions used to determine the recoverable amounts of each segment are tested for sensitivity by applying a reasonably possible change to those assumptions. Forecast earnings available to shareholders were changed by 10%, the discount rates were changed by 1.0 percentage point and the long-term growth rates were changed by 0.5 percentage point. Under all scenarios, the recoverable amounts for each segment exceeded the respective carrying amount, such that the reasonably possible changes in key assumptions would not result in impairment with respect to the goodwill balances of any of our cash-generating units as of 31 December 2015.
If the estimated earnings and other assumptions in future periods deviate from the current outlook, the value of our goodwill may become impaired in the future, giving rise to losses in the income statement. Recognition of any impairment of goodwill would reduce IFRS equity attributable to UBS shareholders and net profit. It would not impact cash flows and, as goodwill is required to be deducted from capital under the Basel capital framework, no impact is expected on the Group’s total capital ratios.
As of 31 December 2015, total goodwill recognized on the balance sheet was CHF 6.2 billion, of which CHF 1.3 billion, CHF 3.5 billion and CHF 1.4 billion was carried by Wealth Management, Wealth Management Americas and Asset Management, respectively. On the basis of the impairment testing methodology described above, we concluded that the year-end 2015 balances of goodwill allocated to our segments remain recoverable and thus were not impaired.
® Refer to “Note 1a item 21 Goodwill and intangible assets,” “Note 2 Segment reporting” and “Note 17 Goodwill and intangible assets” in the “Consolidated financial statements” section of this report for more information
Deferred taxes
Deferred tax assets arise from a variety of sources, with the most significant being: (i) tax losses that can be carried forward and utilized against profits in future years and (ii) expenses recognized in our income statement that are not deductible until the associated cash flows occur.
We record a valuation allowance to reduce our deferred tax assets to the amount which can be recognized under IAS 12, Income Taxes. The level of deferred tax asset recognition is influenced by management’s assessment of our future profitability based on relevant business plan forecasts. Existing assessments are reviewed and, if necessary, revised to reflect changed circumstances. This review is conducted annually, in the second half of each year when the business planning process is undertaken, but adjustments may be made at other times, if required. In a situation where recent losses have been incurred, IAS 12 requires convincing evidence that there will be sufficient future profits against which the deferred tax assets can be utilized.
If the estimated earnings and other assumptions in future periods deviate from the current outlook, the value of our deferred tax assets may become impaired in the future, giving rise to losses in the income statement. Recognition of any impairment of deferred tax assets would reduce IFRS equity attributable to UBS shareholders and net profit. It would not impact cash flows and, as tax loss carry-forward deferred tax assets, as well as temporary difference deferred tax assets in excess of 10% of common equity tier 1 (CET1) capital, are required to be deducted for the purposes of calculating Basel III fully-applied CET1 capital, the capital ratio may not be significantly affected.
Swiss tax losses may be carried forward for seven years, US federal tax losses for 20 years and UK and Jersey tax losses for an unlimited period. As of 31 December 2015, our deferred tax assets amounted to CHF 12.8 billion, which included CHF 7.1 billion in respect of tax losses carried forward and CHF 5.7 billion of deductible temporary differences (mainly in Switzerland and the US) that may be utilized to offset taxable income in future years.
® Refer to “Note 1a item 22 Income taxes” and “Note 8 Income taxes” in the “Consolidated financial statements” section and “The effect of taxes on our financial results is significantly influenced by reassessments of our deferred tax assets” in the “Risk factors” section of this report for more information
Provisions
Provisions are liabilities of uncertain timing or amount, and are recognized when we have a present obligation as a result of a past event, it is probable that an outflow of resources will be required to settle the obligation and a reliable estimate of the amount of the obligation can be made. An established provision for an item or class is representative of the best estimate of the outflow of economic benefits required to settle the present obligation as of the balance sheet date.
Recognition of provisions often involves significant judgment in assessing the existence of an obligation resulting from past events and in estimating the probability, timing and amount of any outflows of resources. This is particularly the case for litigation, regulatory and similar matters, which, because of their nature, are subject to many uncertainties, making their outcome difficult to predict. Such matters may involve unique fact patterns or novel legal theories, proceedings which have not yet been initiated or are at early stages of adjudication, or as to which alleged damages have not been quantified by the claimants. Determining whether an obligation exists as a result of a past event and estimating the probability, timing and amount of any potential outflows is based on a variety of assumptions, variables, and known and unknown uncertainties. The amount of any provision recognized can be very sensitive to the assumptions used and there could be a wide range of possible outcomes for any particular matter. Statistical or other quantitative analytical tools are of limited use in determining whether to establish or determine the amount of provisions for litigation, regulatory and similar matters. Furthermore, information currently available to management may be incomplete or inaccurate, increasing the risk of erroneous assumptions with regards to the future developments of such matters. Management regularly reviews all the available information regarding such matters, including advice from legal advisors, to assess whether the recognition criteria for provisions have been satisfied for those matters and, if not, to evaluate whether such matters represent contingent liabilities. Legal advice is a significant consideration in determining whether it is more likely than not that an obligation exists as a result of a past event and in assessing the probability, timing and amount of any potential outflows.
As of 31 December 2015, total provisions amounted to CHF 4,164 million, of which CHF 2,983 million related to litigation, regulatory and similar matters. Since the future outflow of resources in respect of these matters cannot be determined with certainty based on currently available information, the actual outflows may ultimately prove to be substantially greater (or may be less) than the provisions recognized.
® Refer to “Note 22 Provisions and contingent liabilities” and “Note 1a item 27 Provisions” in the “Consolidated financial statements” section of this report for more information
Pension and other post-employment benefit plans
The full defined benefit obligation, net of plan assets, relating to our pension and other post-employment benefits is recognized on the balance sheet, with changes resulting from re-measurements recorded immediately in other comprehensive income. If the fair value of the plan assets is higher than the present value of the defined benefit obligation, the measurement of the resulting defined benefit asset is limited to the present value of economic benefits available in the form of refunds from the plan or reductions in future contributions to the plan. The net defined benefit liability or asset at the end of the year and the related personnel expense depend on the expected future benefits to be provided, determined using a number of financial and demographic assumptions. The most significant assumptions include life expectancy, the discount rate, expected salary increases, pension rates, and in addition, for the Swiss plan and one of the US defined benefit pension plans, interest credits on retirement savings account balances. We regularly review the actuarial assumptions used in calculating our defined benefit obligations to ensure the most appropriate estimate of our obligation. As part of the review, we also consult with independent actuarial firms.
Life expectancy is determined by reference to published mortality tables. The discount rate is determined by reference to the rates of return on high-quality fixed-income investments of appropriate currency and term at the measurement date. The assumption for salary increases reflects the long-term expectations for salary growth and takes into account inflation, seniority, promotion and other relevant factors such as supply and demand in the labor market. For a sensitivity analysis of the defined benefit obligation to these significant actuarial assumptions, refer to “Note 28 Pension and other post-employment benefit plans” in the “Consolidated financial statements” section of this report.
The most significant plan is the Swiss pension plan. Consistent with 2014, life expectancy for this plan has been based on the 2010 BVG generational mortality tables. The assumption for the discount rate has changed to 1.09% in 2015 from 1.15% in the prior year. Additional information on the update to assumptions for both the Swiss and non-Swiss plans during the year are included in “Note 28 Pension and other post-employment benefit plans.”
® Refer to “Note 1a item 24 Pension and other post-employment benefit plans” and “Note 28 Pension and other post-employment benefit plans” in the “Consolidated financial statements” section of this report for more information
Financial and operating performance
Critical accounting policies
Equity compensation
We recognize share-based compensation awarded to employees as compensation expense based on their fair value at grant date. The fair value of UBS Group AG shares issued to employees is determined by reference to quoted market prices, adjusted, when relevant, to take into account the terms and conditions inherent in the award. Certain performance shares issued by UBS to its employees have features that are not directly comparable with our shares traded in active markets. Accordingly, we determine the fair value using suitable valuation models. Several recognized valuation models exist. The models we apply have been selected because they are able to accommodate the specific features included in the instruments granted to our employees. If we were to use different models, the values produced would differ, even if the same inputs were used.
The models we use require inputs, such as expected dividends and share price volatility, as well as adjustments for certain non-vesting conditions. Some of the model inputs we use are not market observable and have to be estimated or derived from available data. Use of different estimates would produce different valuations, which in turn would result in recognition of higher or lower compensation expense.
® Refer to “Note 1a item 25 Equity participation and other compensation plans” and “Note 29 Equity participation and other compensation plans” in the “Consolidated financial statements” section of this report for more information
Consolidation of structured entities
We sponsor the formation of structured entities (SEs) and interact with non-sponsored SEs for a variety of reasons, including allowing clients to obtain or be exposed to particular risk profiles, to provide funding or to sell or purchase credit risk. An SE is an entity that has been designed so that voting or similar rights are not the dominant factor in deciding who controls the entity. Such entities generally have a narrow and well-defined objective and include those historically referred to as special purpose entities and some investment funds.
In accordance with IFRS, UBS consolidates only SEs that it controls, with control being defined as a function of three elements: power over the relevant activities of the entity, exposure to variable returns and an investor’s ability to use its power to affect its returns. UBS consolidates an entity when all three elements of control are present. Where UBS has an interest in an SE that absorbs variability, we consider whether UBS has power over the SE which allows it to affect the variability of its returns. Consideration is given to all facts and circumstances to determine whether the Group has power over the SE; that is, the current ability to direct the relevant activities of the SE when decisions about those activities need to be made. Determining whether we have power to direct the relevant activities requires a significant degree of judgment in light of all facts and circumstances. In making that determination, we consider a range of factors, including the purpose and design of the SE, any rights held through contractual arrangements such as call rights, put rights or liquidation rights, as well as potential decision-making rights. Where the Group has power over the relevant activities, a further assessment is made to determine whether, through that power, it has the ability to affect its own returns; that is, assessing whether power is held in a principal or agent capacity. Consideration is given to the overall relationship between UBS, the SE and other parties involved in the SE. In particular, we assess the following: (i) the scope of decision-making authority, (ii) rights held by other parties, including removal or other participating rights and (iii) exposure to variability, including remuneration, relative to the total variability of the SE, as well as whether UBS’s exposure is different from that of other investors. Appropriate weightings are applied to each of these factors on the basis of the particular facts and circumstances.
® Refer to “Note 1a item 3 Subsidiaries and structured entities” and “Note 30 Interests in subsidiaries and other entities” in the “Consolidated financial statements” section of this report for more information
Significant accounting and financial reporting changes
Significant accounting changes
Own credit
In 2015, we further enhanced our valuation methodology for the own credit component of fair value of financial liabilities designated at fair value. This change in accounting estimate resulted in a gain of CHF 260 million.
® Refer to “Note 1b Changes in accounting policies, comparability and other adjustments” in the “Consolidated financial statements” section of this report for more information
Review of actuarial assumptions used in calculating defined benefit obligations
In 2015, we carried out a methodology review of the actuarial assumptions used in calculating our defined benefit obligation (DBO) for our Swiss pension plan and as a result, we enhanced our methodology for estimating the discount rate. Furthermore, we refined our approach to estimating the rate of salary increases, the rate of interest credit on retirement savings, the employee turnover rate, the rate of employee disabilities and the rate of marriage. These improvements in estimates resulted in a total net decrease of CHF 2.1 billion in the DBO of the Swiss pension plan and a corresponding gain of CHF 2.0 billion recognized within other comprehensive income (OCI) attributable to UBS Group AG shareholders.
Furthermore, we enhanced methodologies and refined approaches used to estimate various actuarial assumptions for our UK pension plan, which resulted in a total net decrease of CHF 0.2 billion in the DBO of the UK pension plan and a corresponding gain of CHF 0.2 billion recognized within OCI attributable to UBS Group AG shareholders.
® Refer to “Note 1b Changes in accounting policies, comparability and other adjustments” in the “Consolidated financial statements” section of this report for more information
Financial reporting changes
New structure of Corporate Center
As of 1 January 2015, Corporate Center – Core Functions was reorganized into two new units, Corporate Center – Services and Corporate Center – Group Asset and Liability Management (Group ALM). Therefore, we now report: (i) Corporate Center – Services, (ii) Corporate Center – Group ALM and (iii) Corporate Center – Non-Core and Legacy Portfolio separately, which enhances the transparency of Corporate Center activities.
Group ALM is responsible for centrally managing the Group’s liquidity and funding position, as well as providing other balance sheet and capital management services to the Group. Most of the income generated and expenses incurred by Group ALM from these activities continues to be allocated to the business divisions and other Corporate Center units. Own credit gains and losses on financial liabilities designated at fair value are presented in Group ALM.
Corporate Center – Services includes the Group’s control functions and all logistics and support functions serving the business divisions and other Corporate Center units. Most of the expenses of Corporate Center – Services are allocated to the business divisions and other Corporate Center units.
Service and personnel allocations from Corporate Center –Services to business divisions and other Corporate Center units
In 2015, we revised the presentation of service allocations from Corporate Center – Services to the business divisions and other Corporate Center units to better reflect the economic relationship between them. These cost allocations were previously presented within the Personnel expenses, General and administrative expenses and Depreciation and impairment of property, equipment and software line items and are newly presented in the Services (to) / from business divisions and Corporate Center line items. Prior-period information has been restated to reflect this change. This change in presentation did not affect total operating expenses or performance before tax of the business divisions and Corporate Center units for any period presented. Similarly, personnel of Corporate Center – Services are no longer allocated to the business divisions and other Corporate Center units. Prior-period information has been restated accordingly.
Financial and operating performance
Significant accounting and financial reporting changes
Change in segment reporting related to fair value gains and losses on certain internal funding transactions
Consistent with changes in the manner in which operating segment performance is assessed, beginning in 2015, we have applied fair value accounting for certain internal funding transactions between Corporate Center – Group ALM and the Investment Bank and Corporate Center – Non-core and Legacy Portfolio, rather than applying amortized cost accounting. This treatment better aligns with the mark-to-market basis on which these internal transactions are risk managed within the Investment Bank and Corporate Center – Non-core and Legacy Portfolio. The terms of the funding transactions remain otherwise unchanged. Prior periods have been restated to reflect this change. As a result, the Investment Bank’s operating income and performance before tax decreased by CHF 37 million for the year ended 31 December 2014 and by CHF 162 million for the year ended 31 December 2013, with offsetting increases in Corporate Center. This change did not affect the Group’s total operating income or net profit for any period presented.
® Refer to “Note 1b Changes in accounting policies, comparability and other adjustments” in the “Consolidated financial statements” section of this report for more information
Retail & Corporate renamed Personal & Corporate Banking
Effective 2016, the business division Retail & Corporate was renamed Personal & Corporate Banking. This change is reflected throughout this report.
Global Asset Management renamed Asset Management
In 2015, the business division Global Asset Management was renamed Asset Management. This change is reflected throughout this report.
A&Q hedge fund solutions renamed Hedge Fund Solutions
In 2015, A&Q hedge funds solutions, the multi-manager hedge fund business, was renamed Hedge Fund Solutions (HFS). This business continues to be reported together with the O’Connor business under the business line name O’Connor and Hedge Fund Solutions, within the business division Asset Management.
Non-core and Legacy portfolio disclosures
Following a substantial reduction in risk exposure over the past years, we have merged our disclosures for Non-core and Legacy Portfolio and included them in the Corporate Center section of our reports, including the disclosures previously provided in the “Risk management and control” section. Details on risk-weighted assets, leverage ratio denominator and balance sheet assets for the remaining Non-core and Legacy Portfolio exposures are now provided in one combined table.
Change in Asset Management business lines
As of 1 January 2016, Asset Management was reorganized into the following business lines: (i) Equities, Multi-asset & O’Connor, (ii) Fixed Income, (iii) Global Real Estate, (iv) Infrastructure & Private Equity, (v) Solutions and (vi) Fund Services. In our first quarter 2016 report, we will reflect this change and provide more information.
Accounting for expected credit losses under IFRS 9, Financial Instruments
EDTF | In July 2014, the IASB published the final version of IFRS 9, Financial Instruments, with a mandatory effective date of 1 January 2018. The standard reflects the classification and measurement, impairment and hedge accounting phases of the IASB’s project to replace IAS 39, Financial instruments: Recognition and Measurement. The standard includes the introduction of a forward-looking expected credit loss (ECL) approach, replacing the incurred loss impairment approach for financial instruments in IAS 39, and the loss-provisioning approach for financial guarantees and lending commitments in IAS 37, Provisions, contingent liabilities and contingent assets.
In November 2015, the Enhanced Disclosure Task Force (EDTF) published disclosure recommendations for IFRS 9 in its report “Impact of Expected Credit Loss Approaches on Bank Risk Disclosures.” Disclosures are recommended during the transition period and once IFRS 9 is fully adopted, to ensure that changes and impacts arising from using an expected loss model are transparent, understandable and consistently applied. We address these recommendations below. More granular information will be provided as we approach the adoption of IFRS 9 on 1 January 2018.
IFRS 9 is a key strategic initiative for UBS and is currently being implemented under the joint sponsorship of the Group Chief Risk Officer and the Group Chief Financial Officer. The implementation project structure has been defined to address the critical requirements of the standard and to manage the appropriate involvement of key stakeholders, including Risk Control, Finance, Group Technology and the business divisions. Steering and Operating Committees, a Technical Board and individual workstreams have been created to ensure a streamlined implementation with appropriate controls and governance over all decisions. We have finalized key technical accounting and risk methodology decisions and are currently focusing on model development, IT architecture, and consequential implementation work. We are also undertaking an impact assessment, and intend to perform a parallel run in 2017. ▲
Moving from an incurred loss to an expected credit loss impairment approach
EDTF | Under the current incurred loss impairment approach in IAS 39, a financial asset or group of financial assets is impaired if there is objective evidence as a result of one or more events (so-called trigger events) having occurred since the financial asset was recognized, that we will be unable to collect all amounts under the contract. Once a trigger event has occurred, allowances for credit losses are established based on the difference between the carrying amount and the present value of future estimated cash flows.
IFRS 9 no longer requires a trigger event to have occurred before credit loss allowances are recognized. Instead, entities are required to recognize a 12-month, or less if the exposure period is less than 12 months, allowance for financial assets measured at amortized cost, debt instruments fair valued through other comprehensive income, lease receivables, financial guarantees and loan commitments from initial recognition. The ECL should reflect an unbiased and probability-weighted amount that is determined by evaluating a range of possible outcomes and that incorporates reasonable and supportable information about past events, current conditions, forecasts of future economic conditions and the time value of money.
If a significant increase in credit risk (SICR) arises after the instrument is initially recognized, a lifetime ECL allowance is required. Life-time ECL allowances are always recognized for credit-impaired financial assets.
A SICR may be assessed at an individual financial asset level, or, where appropriate, on a collective basis. Assessments on a collective basis will only be made where the in-scope financial instruments share the same credit risk characteristics.
We will determine whether a SICR has occurred at the reporting date by assessing changes in an instrument’s risk of default since initial recognition. A range of indicators will be considered, including, but not limited to, significant changes in the actual or expected credit rating of the borrower, internal indicators of credit risk and external market indicators of credit risk or general economic conditions.
The SICR assessment and the ECL calculation will use point in time (PIT) based parameters, including probability of default (PD), leveraging the respective parameters determined under the Basel III through the cycle (TTC) based approach, with adjustments made to account for current conditions and to incorporate forward-looking economic information which will include interest and foreign exchange rates, gross domestic product forecasts, unemployment rates, real estate price indices and other relevant risk parameters. Although ECL is not a stress loss concept, we plan to leverage our existing stress testing models to capture the effects of forward-looking economic information.
The definition and assessment of what constitutes a SICR, and in particular the incorporation of forward-looking information is inherently subjective and will involve the use of significant judgment. We are establishing effective and robust governance and controls around the ECL calculation process, including what constitutes a SICR and the use of forward-looking information. Our economists, risk methodology personnel and credit risk officers will be involved in developing the forward-looking macroeconomic assumptions to be used in the ECL calculation, which will be validated and approved through a new governance process that will provide for a consistent use of forward-looking information throughout UBS.
Implementation of the IFRS 9 ECL approach is generally expected to result in an increase in recognized credit loss allowances, as compared to the current incurred-loss approach. This is due in part to the 12-month ECL allowance that must be reported for all in-scope instruments, and to the lifetime ECL allowance that will apply to positions following a SICR and prior to an incurred credit loss event. Upon adoption, any change in credit loss allowances will be booked as an adjustment to retained earnings. In addition, increased income statement volatility is expected on an ongoing basis, due to the application of forward-looking assumptions and the SICR approach. We are currently assessing the impact of the IFRS 9 ECL requirements on our financial statements and we intend to disclose the potential impact no later than in our Annual Report 2017. In addition, we are monitoring the potential effects on our regulatory capital requirements. The Swiss Financial Market Supervisory Authority (FINMA) and the Basel Committee on Banking Supervision (BCBS) have not yet issued guidance on how IFRS 9 expected credit losses will be treated for regulatory capital purposes.
Financial and operating performance
Significant accounting and financial reporting changes
The table below sets out certain key differences between the definitions we apply in determining expected losses under the current Basel III framework and those planned to be used in determining ECL for IFRS 9 purposes. We do not expect the definition of default under IFRS 9 to be different from the definition used for the purpose of our advanced internal ratings-based approach, and the term is therefore not included in the table below. ▲
® Refer to “Credit risk models” in the “Risk management and control” section of this report for more information

Group performance
Net profit attributable to UBS Group AG shareholders was CHF 6,203 million in 2015 compared with CHF 3,466 million in 2014. We recorded an operating profit before tax of CHF 5,489 million compared with CHF 2,461 million, largely reflecting an increase of CHF 2,578 million in operating income, mainly due to increased net interest and trading income in the Investment Bank and our wealth management businesses, as well as reduced losses in Corporate Center – Non-core and Legacy Portfolio. Operating expenses decreased by CHF 451 million, mainly driven by a CHF 1,507 million lower net charge for provisions for litigation, regulatory and similar matters, partly offset by higher restructuring expenses and increased personnel expenses. We recorded a net tax benefit of CHF 898 million compared with CHF 1,180 million, reflecting net upward revaluations of deferred tax assets in both years, which more than offset tax expenses for taxable profits.
Income statement | | | | | | |
| | For the year ended | | % change from |
CHF million | | 31.12.15 | 31.12.14 | 31.12.13 | | 31.12.14 |
Net interest income | | 6,732 | 6,555 | 5,786 | | 3 |
Credit loss (expense) / recovery | | (117) | (78) | (50) | | 50 |
Net interest income after credit loss expense | | 6,615 | 6,477 | 5,736 | | 2 |
Net fee and commission income | | 17,140 | 17,076 | 16,287 | | 0 |
Net trading income | | 5,742 | 3,842 | 5,130 | | 49 |
of which: net trading income excluding own credit | | 5,190 | 3,551 | 5,413 | | 46 |
of which: own credit on financial liabilities designated at fair value | | 553 | 292 | (283) | | 89 |
Other income | | 1,107 | 632 | 580 | | 75 |
Total operating income | | 30,605 | 28,027 | 27,732 | | 9 |
of which: net interest and trading income | | 12,474 | 10,397 | 10,915 | | 20 |
Personnel expenses | | 15,981 | 15,280 | 15,182 | | 5 |
General and administrative expenses | | 8,107 | 9,387 | 8,380 | | (14) |
Depreciation and impairment of property, equipment and software | | 920 | 817 | 816 | | 13 |
Amortization and impairment of intangible assets | | 107 | 83 | 83 | | 29 |
Total operating expenses | | 25,116 | 25,567 | 24,461 | | (2) |
Operating profit / (loss) before tax | | 5,489 | 2,461 | 3,272 | | 123 |
Tax expense / (benefit) | | (898) | (1,180) | (110) | | (24) |
Net profit / (loss) | | 6,386 | 3,640 | 3,381 | | 75 |
Net profit / (loss) attributable to preferred noteholders | | | 142 | 204 | | (100) |
Net profit / (loss) attributable to non-controlling interests | | 183 | 32 | 5 | | 472 |
Net profit / (loss) attributable to UBS Group AG shareholders | | 6,203 | 3,466 | 3,172 | | 79 |
| | | | | | |
Comprehensive income | | | | | | |
Total comprehensive income | | 5,781 | 5,220 | 2,524 | | 11 |
Total comprehensive income attributable to preferred noteholders | | | 221 | 559 | | (100) |
Total comprehensive income attributable to non-controlling interests | | 83 | 79 | 4 | | 5 |
Total comprehensive income attributable to UBS Group AG shareholders | | 5,698 | 4,920 | 1,961 | | 16 |
Financial and operating performance
Group performance
Adjusted results¹˒² | | | | | | | | | | |
| | For the year ended 31.12.15 |
CHF million | | Wealth Management | Wealth Management Americas | Personal & Corporate Banking | Asset Management | Investment Bank | CC Services³ | CC Group ALM | CC Non-core and Legacy Portfolio | UBS |
Operating income as reported | | 8,155 | 7,381 | 3,877 | 2,057 | 8,821 | 241 | 277 | (203) | 30,605 |
of which: own credit on financial liabilities designated at fair value⁴ | | | | | | | | 553 | | 553 |
of which: gains on sales of real estate | | | | | | | 378 | | | 378 |
of which: gains on sales of subsidiaries and businesses⁵ | | 169 | | | 56 | | | | | 225 |
of which: net foreign currency translation gain⁶ | | | | | | | | 88 | | 88 |
of which: gain related to our investment in the SIX Group | | 15 | | 66 | | | | | | 81 |
of which: gain from a further partial sale of our investment in Markit | | | | | | 11 | | | | 11 |
of which: net losses related to the buyback of debt | | | | | | | | (257) | | (257) |
Operating income (adjusted) | | 7,971 | 7,381 | 3,811 | 2,001 | 8,810 | (137) | (107) | (203) | 29,526 |
| | | | | | | | | | |
Operating expenses as reported | | 5,465 | 6,663 | 2,231 | 1,474 | 6,929 | 1,059 | (5) | 1,301 | 25,116 |
of which: personnel-related restructuring expenses⁵ | | 20 | 0 | 2 | 4 | 14 | 406 | 0 | 14 | 460 |
of which: non-personnel-related restructuring expenses⁵ | | 38 | 0 | 0 | 11 | 7 | 719 | 0 | 0 | 775 |
of which: restructuring expenses allocated from CC Services⁵ | | 265 | 137 | 99 | 68 | 376 | (986) | 0 | 43 | 0 |
of which: gain related to a change to retiree benefit plans in the US⁷ | | | (21) | | | | | | | (21) |
of which: impairment of an intangible asset | | | | | | 11 | | | | 11 |
Operating expenses (adjusted) | | 5,142 | 6,547 | 2,130 | 1,392 | 6,522 | 919 | (5) | 1,245 | 23,891 |
| | | | | | | | | | |
Operating profit / (loss) before tax as reported | | 2,689 | 718 | 1,646 | 584 | 1,892 | (818) | 282 | (1,503) | 5,489 |
Operating profit / (loss) before tax (adjusted) | | 2,828 | 834 | 1,681 | 610 | 2,288 | (1,056) | (102) | (1,447) | 5,635 |
| | | | | | | | | | |
| | For the year ended 31.12.14 |
CHF million | | Wealth Management | Wealth Management Americas | Personal & Corporate Banking | Asset Management | Investment Bank | CC Services³ | CC Group ALM | CC Non-core and Legacy Portfolio | UBS |
Operating income as reported | | 7,901 | 6,998 | 3,741 | 1,902 | 8,308 | 37 | 2 | (862) | 28,027 |
of which: own credit on financial liabilities designated at fair value⁴ | | | | | | | | 292 | | 292 |
of which: gains on sales of real estate | | | | | | | 44 | | | 44 |
of which: gain from the partial sale of our investment in Markit | | | | | | 43 | | | | 43 |
of which: impairment of a financial investment available-for-sale | | | | | | (48) | | | | (48) |
Operating income (adjusted) | | 7,901 | 6,998 | 3,741 | 1,902 | 8,313 | (7) | (290) | (862) | 27,696 |
| | | | | | | | | | |
Operating expenses as reported | | 5,574 | 6,099 | 2,235 | 1,435 | 8,392 | 688 | 0 | 1,144 | 25,567 |
of which: personnel-related restructuring expenses⁵ | | 18 | 0 | 4 | 19 | 64 | 221 | 0 | 1 | 327 |
of which: non-personnel-related restructuring expenses⁵ | | 49 | 0 | 0 | 2 | 36 | 263 | 0 | 0 | 350 |
of which: restructuring expenses allocated from CC Services⁵ | | 119 | 55 | 60 | 30 | 161 | (454) | 0 | 29 | 0 |
of which: gain related to changes to retiree benefit plans in US⁷ | | 0 | (9) | 0 | (8) | (20) | 0 | 0 | (3) | (41) |
Operating expenses (adjusted) | | 5,389 | 6,053 | 2,171 | 1,393 | 8,151 | 658 | 0 | 1,116 | 24,931 |
| | | | | | | | | | |
Operating profit / (loss) before tax as reported | | 2,326 | 900 | 1,506 | 467 | (84) | (652) | 2 | (2,005) | 2,461 |
Operating profit / (loss) before tax (adjusted) | | 2,511 | 946 | 1,570 | 509 | 162 | (666) | (290) | (1,977) | 2,766 |
Adjusted results¹˒² (continued) |
| | For the year ended 31.12.13 |
CHF million | | Wealth Management | Wealth Management Americas | Personal & Corporate Banking | Asset Management | Investment Bank | CC Services³ | CC Group ALM | CC Non-core and Legacy Portfolio | UBS |
Operating income as reported | | 7,563 | 6,538 | 3,756 | 1,935 | 8,438 | 178 | (841) | 166 | 27,732 |
of which: own credit on financial liabilities designated at fair value⁴ | | | | | | | | (283) | | (283) |
of which: gains on sales of real estate | | | | | | | 288 | | | 288 |
of which: net losses related to the buyback of debt | | | | | | | | (194) | 27 | (167) |
of which: gains on sales of subsidiaries and businesses | | | | | 34 | 55 | | | | 89 |
of which: net foreign currency translation loss⁶ | | | | | | | | (24) | | (24) |
Operating income (adjusted) | | 7,563 | 6,538 | 3,756 | 1,901 | 8,383 | (110) | (340) | 139 | 27,829 |
| | | | | | | | | | |
Operating expenses as reported | | 5,316 | 5,680 | 2,298 | 1,359 | 6,300 | 804 | 43 | 2,660 | 24,461 |
of which: personnel-related restructuring expenses⁵ | | 40 | 0 | 0 | 2 | (38) | 129 | 0 | 23 | 156 |
of which: non-personnel-related expenses expenses⁵ | | 35 | 0 | 0 | 2 | 1 | 578 | 0 | 0 | 616 |
of which: restructuring expenses allocated from CC Services⁵ | | 104 | 59 | 54 | 38 | 247 | (714) | 0 | 211 | 0 |
Operating expenses (adjusted) | | 5,138 | 5,621 | 2,244 | 1,316 | 6,090 | 810 | 43 | 2,425 | 23,689 |
| | | | | | | | | | |
Operating profit / (loss) before tax as reported | | 2,247 | 858 | 1,458 | 576 | 2,138 | (626) | (884) | (2,494) | 3,272 |
Operating profit / (loss) before tax (adjusted) | | 2,425 | 917 | 1,512 | 585 | 2,293 | (920) | (383) | (2,286) | 4,141 |
1 Adjusted results are non-GAAP financial measures as defined by SEC regulations. 2 Comparative figures in this table may differ from those originally published in quarterly and annual reports due to adjustments following organizational changes, restatements due to the retrospective adoption of new accounting standards or changes in accounting policies, and events after the reporting period. 3 Corporate Center Services operating expenses presented in this table are after service allocations to business divisions and other Corporate Center units. 4 Refer to “Note 24 Fair value measurement” in the “Consolidated financial statements” section of this report for more information. 5 Refer to “Note 32 Changes in organization and disposals” in the “Consolidated financial statements” section of this report for more information. 6 Related to the disposal of subsidiaries. 7 Refer to “Note 28 Pension and other post-employment benefit plans” in the “Consolidated financial statements” section of this report for more information. |
Financial and operating performance
Group performance
2015 compared with 2014
Results
We recorded an operating profit before tax of CHF 5,489 million compared with CHF 2,461 million, largely reflecting an increase of CHF 2,578 million in operating income, mainly due to increased net interest and trading income in the Investment Bank and our wealth management businesses, as well as reduced losses in Corporate Center – Non-core and Legacy Portfolio. Operating expenses decreased by CHF 451 million, mainly driven by a CHF 1,507 million lower net charge for provisions for litigation, regulatory and similar matters, partly offset by higher restructuring expenses and increased personnel expenses.
In addition to reporting our results in accordance with IFRS, we report adjusted results that exclude items that management believes are not representative of the underlying performance of our businesses. Such adjusted results are non-GAAP financial measures as defined by SEC regulations. For 2015, the items we excluded were an own credit gain of CHF 553 million, gains on sales of real estate of CHF 378 million which primarily related to the sale of a property in Geneva, Switzerland, net gains on sales of subsidiaries and businesses of CHF 225 million, a net foreign currency translation gain from the disposal of subsidiaries of CHF 88 million, a gain of CHF 81 million related to our investment in the SIX Group, a gain of CHF 11 million from a further partial sale of our investment in Markit, net losses related to the buyback of debt in a tender offer of CHF 257 million, net restructuring expenses of CHF 1,235 million, a gain of CHF 21 million related to a change to retiree benefit plans in the US and an impairment of an intangible asset of CHF 11 million. For 2014, the items we excluded were an own credit gain of CHF 292 million, gains on sales of real estate of CHF 44 million, a gain of CHF 43 million from the partial sale of our investment in Markit, a loss of CHF 48 million related to the impairment of a financial investment available-for-sale, net restructuring expenses of CHF 677 million and a gain of CHF 41 million related to changes to retiree benefit plans in the US.
On this adjusted basis, profit before tax was CHF 5,635 million compared with CHF 2,766 million in the prior year.
Adjusted operating income increased by CHF 1,830 million to CHF 29,526 million, largely due to an increase of CHF 1,816 million in adjusted net interest and trading income, reflecting increases in the Investment Bank and our wealth management businesses, as well as reduced losses in Corporate Center – Non-core and Legacy Portfolio.
Adjusted operating expenses decreased by CHF 1,040 million to CHF 23,891 million, mainly due to a CHF 1,507 million lower net charge for provisions for litigation, regulatory and similar matters, partly offset by CHF 548 million higher personnel expenses.
As a result of ongoing efforts to optimize our legal entity structure, we anticipate that some foreign currency translation gains and losses previously booked directly into equity through other comprehensive income will be reclassified to the income statement in future periods due to the sale or closure of UBS AG branches and subsidiaries. In this respect, we currently expect to record net foreign currency translation losses of around CHF 130 million in the first quarter of 2016. These losses will be treated as adjusting items and recorded in Corporate Center – Group Asset and Liability Management (Group ALM). The reclassification of foreign currency translation losses to the income statement will not affect shareholders’ equity or regulatory capital.
Operating income
Total operating income was CHF 30,605 million compared with CHF 28,027 million. On an adjusted basis, total operating income increased by CHF 1,830 million to CHF 29,526 million. Adjusted net interest and trading income increased by CHF 1,816 million, reflecting increases in the Investment Bank and our wealth management businesses, as well as reduced losses in Corporate Center – Non-core and Legacy Portfolio. Net fee and commission income increased by CHF 64 million, mainly in Wealth Management Americas and Asset Management. Adjusted other income was broadly unchanged.
Net interest and trading income
Net interest and trading income increased by CHF 2,077 million to CHF 12,474 million. 2015 included an own credit gain on financial liabilities designated at fair value of CHF 553 million, compared with a gain of CHF 292 million. In 2015, we made further enhancements to our valuation methodology for the own credit component of fair value of financial liabilities designated at fair value. This change in accounting estimate resulted in a gain of CHF 260 million. Excluding the effect of own credit in both years, net interest and trading income increased by CHF 1,816 million to CHF 11,921 million, reflecting increases in the Investment Bank and our wealth management businesses, as well as reduced losses in Corporate Center – Non-core and Legacy Portfolio.
We will adopt the own credit presentation requirements of IFRS 9 in the first quarter of 2016. Under this aspect of IFRS 9, changes in the fair value of financial liabilities designated at fair value through profit and loss related to own credit will be recognized in other comprehensive income and will not be reclassified to the Income statement. We will adopt the other requirements of IFRS 9 as of the mandatory effective date of 1 January 2018.
® Refer to the “Significant accounting and financial reporting changes” section for more information on the enhancements to our valuation methodology for own credit
In Wealth Management, net interest and trading income increased by CHF 189 million. Net interest income increased by CHF 161 million, mainly due to higher lending revenues and an increase in allocated revenues from Group ALM, and net trading income increased by CHF 28 million.
In Wealth Management Americas, net interest and trading income increased by CHF 185 million to CHF 1,537 million, mainly due to higher net interest income, reflecting continued growth in loan and deposit balances.
In Personal & Corporate Banking, net interest and trading income increased by CHF 77 million to CHF 2,613 million, mainly due to higher net interest income from loans and deposits, reflecting our pricing measures.
In the Investment Bank, net interest and trading income increased by CHF 669 million to CHF 5,186 million, mainly due to higher revenues in our Foreign Exchange and Rates businesses within Investor Client Services, reflecting elevated client activity and higher volatility, particularly heightened following the Swiss National Bank’s actions of 15 January 2015. Furthermore, also within Investor Client Services, Financing services revenues were higher driven primarily by increased client activity in Prime Brokerage and Equity Financing.
Corporate Center – Group ALM net interest and trading income, excluding the effect of own credit in both years, increased by CHF 148 million, mainly reflecting higher income related to high-quality liquid assets.
In Corporate Center – Non-core and Legacy Portfolio, net interest and trading income improved by CHF 591 million, primarily reflecting reduced losses from novation and unwind activities. Furthermore, 2014 included a net loss of CHF 345 million related to funding and debit valuation adjustments (FVA/DVA) on derivatives, of which CHF 252 million was recorded upon the implementation of FVA.
® Refer to “Note 3 Net interest and trading income” in the “Consolidated financial statements” section of this report for more information
® Refer to the “Significant accounting and financial reporting changes” section for more information on a change in segment reporting related to fair value gains and losses on certain internal funding transactions
Credit loss expense / recovery
Net credit loss expense was CHF 117 million compared with CHF 78 million. The Investment Bank recorded a net credit loss expense of CHF 68 million, mainly related to the energy sector, compared with a net recovery of CHF 2 million. Net credit loss expense in Personal & Corporate Banking was CHF 37 million compared with CHF 95 million, predominantly due to lower expenses for newly impaired positions.
® Refer to the “Investment Bank, Personal & Corporate Banking and Risk management and control” sections of this report for more information
Net interest and trading income | | | | | | |
| | For the year ended | | % change from |
CHF million | | 31.12.15 | 31.12.14 | 31.12.13 | | 31.12.14 |
| | | | | | |
Net interest and trading income | | | | | | |
Net interest income | | 6,732 | 6,555 | 5,786 | | 3 |
Net trading income | | 5,742 | 3,842 | 5,130 | | 49 |
Total net interest and trading income | | 12,474 | 10,397 | 10,915 | | 20 |
Wealth Management | | 3,034 | 2,845 | 2,868 | | 7 |
Wealth Management Americas | | 1,537 | 1,352 | 1,323 | | 14 |
Personal & Corporate Banking | | 2,613 | 2,536 | 2,485 | | 3 |
Asset Management | | (5) | 0 | 9 | | |
Investment Bank | | 5,186 | 4,517 | 4,852 | | 15 |
of which: Corporate Client Solutions | | 1,001 | 1,030 | 1,146 | | (3) |
of which: Investor Client Services | | 4,185 | 3,487 | 3,707 | | 20 |
Corporate Center | | 110 | (854) | (622) | | |
of which: Services | | (3) | 34 | (166) | | |
of which: Group ALM | | 426 | 16 | (535) | | |
of which: own credit on financial liabilities designated at fair value | | 553 | 292 | (283) | | 89 |
of which: Non-core and Legacy Portfolio | | (313) | (904) | 79 | | (65) |
Total net interest and trading income | | 12,474 | 10,397 | 10,915 | | 20 |
Financial and operating performance
Group performance
Credit loss (expense) / recovery | | | | | | |
| | For the year ended | | % change from |
CHF million | | 31.12.15 | 31.12.14 | 31.12.13 | | 31.12.14 |
Wealth Management | | 0 | (1) | (10) | | (100) |
Wealth Management Americas | | (4) | 15 | (27) | | |
Personal & Corporate Banking | | (37) | (95) | (18) | | (61) |
Investment Bank | | (68) | 2 | 2 | | |
Corporate Center | | (8) | 2 | 3 | | |
of which: Non-core and Legacy Portfolio | | (8) | 2 | 3 | | |
Total | | (117) | (78) | (50) | | 50 |
Net fee and commission income
Net fee and commission income increased by CHF 64 million to CHF 17,140 million.
Portfolio management and advisory fees increased by CHF 515 million to CHF 7,858 million, primarily in Wealth Management Americas, largely due to an increase in managed account fees, reflecting higher invested asset levels. Portfolio management and advisory fees also increased in Wealth Management and Asset Management.
Underwriting fees decreased by CHF 224 million, reflecting lower equity and debt underwriting fees, largely in the Investment Bank.
Investment fund fees declined by CHF 150 million, primarily reflecting a decrease in mutual fund related fees in Wealth Management Americas and lower transaction-based income in Wealth Management. This was partly offset by an increase in Asset Management.
® Refer to “Note 4 Net fee and commission income” in the “Consolidated financial statements” section of this report for more information
Other income
Other income was CHF 1,107 million compared with CHF 632 million. On an adjusted basis, other income decreased by CHF 12 million. Adjusted income related to associates and subsidiaries decreased by CHF 124 million, mainly as 2014 included a gain of CHF 65 million on an investment in an associate which was reclassified to a financial investment available-for-sale following its initial public offering, as well as a gain of CHF 58 million related to the release of a provision for litigation, regulatory and similar matters which was recorded as other income. This was partly offset by CHF 92 million higher adjusted income from financial investments classified as available-for-sale, primarily related to net gains on sales of equity investments in 2015, mainly within the Investment Bank.
® Refer to “Note 5 Other income” in the “Consolidated financial statements” section of this report for more information
Recurring net fee and transaction-based income in Wealth Management, Wealth Management Americas and Personal & Corporate Banking
Recurring net fee income for Wealth Management, Wealth Management Americas and Personal & Corporate Banking includes fees for services provided on an ongoing basis such as portfolio management fees, asset-based investment fund fees, custody fees and account-keeping fees, which are generated on the respective business divisions’ client assets. This is part of total net fee and commission income in the UBS Group financial statements. Transaction-based income includes the non-recurring portion of net fee and commission income for these business divisions, mainly consisting of brokerage and transaction-based investment fund fees, as well as credit card fees and fees for payment transactions, together with the respective divisional net trading income.
® Refer to the “Wealth Management,” “Wealth Management Americas” and “Personal & Corporate Banking” sections of this report for more information
Operating income Wealth Management, Wealth Management Americas and Personal & Corporate Banking |
| | Wealth Management | | Wealth Management Americas | | Personal & Corporate Banking |
| | For the year ended |
CHF million | | 31.12.15 | 31.12.14 | 31.12.13 | | 31.12.15 | 31.12.14 | 31.12.13 | | 31.12.15 | 31.12.14 | 31.12.13 |
Net interest income | | 2,326 | 2,165 | 2,061 | | 1,174 | 983 | 936 | | 2,270 | 2,184 | 2,144 |
Recurring net fee income | | 3,820 | 3,783 | 3,567 | | 4,623 | 4,294 | 3,796 | | 544 | 556 | 511 |
Transaction-based income | | 1,778 | 1,928 | 1,887 | | 1,555 | 1,678 | 1,800 | | 959 | 1,022 | 1,034 |
Other income | | 231 | 25 | 57 | | 31 | 30 | 33 | | 140 | 75 | 86 |
Income | | 8,155 | 7,902 | 7,573 | | 7,384 | 6,984 | 6,565 | | 3,913 | 3,836 | 3,774 |
Credit loss (expense) / recovery | | 0 | (1) | (10) | | (4) | 15 | (27) | | (37) | (95) | (18) |
Total operating income | | 8,155 | 7,901 | 7,563 | | 7,381 | 6,998 | 6,538 | | 3,877 | 3,741 | 3,756 |
Operating expenses
Total operating expenses decreased by CHF 451 million to CHF 25,116 million. Restructuring expenses were CHF 1,235 million compared with CHF 677 million, largely related to our transitioning activities to nearshore and offshore locations. Personnel-related restructuring expenses increased by CHF 133 million to CHF 460 million, while non-personnel-related restructuring expenses increased by CHF 425 million to CHF 775 million.
On an adjusted basis, excluding restructuring expenses and gains related to changes to retiree benefit plans in the US in both years and an impairment of an intangible asset in 2015, total operating expenses decreased by CHF 1,040 million to CHF 23,891 million. This decrease was mainly due to a CHF 1,507 million lower net charge for provisions for litigation, regulatory and similar matters, partly offset by CHF 548 million higher adjusted personnel expenses, primarily reflecting an increase in expenses for variable compensation.
® Refer to “Note 32 Changes in organization and disposals” in the “Consolidated financial statements” section of this report for more information on restructuring expenses
Personnel expenses
Personnel expenses increased by CHF 701 million to CHF 15,981 million and included restructuring expenses of CHF 460 million compared with CHF 327 million, largely related to our transitioning activities to nearshore and offshore locations. On an adjusted basis, excluding restructuring expenses and gains related to changes to retiree benefit plans in the US, personnel expenses increased by CHF 548 million to CHF 15,542 million.
Expenses for salaries, excluding restructuring expenses, decreased by CHF 154 million to CHF 5,970 million, primarily reflecting a reduction in staff levels.
Excluding restructuring expenses, total variable compensation expenses increased by CHF 297 million. Expenses for current-year awards increased by CHF 272 million, reflecting improved business performance. Expenses relating to the amortization of prior years’ awards increased by CHF 24 million.
Financial advisor compensation in Wealth Management Americas increased by CHF 167 million to CHF 3,552 million, primarily due to unfavorable foreign currency translation effects.
Operating expenses | | | | | | |
| | For the year ended | | % change from |
CHF million | | 31.12.15 | 31.12.14 | 31.12.13 | | 31.12.14 |
Personnel expenses (adjusted)¹ | | | | | | |
Salaries | | 5,970 | 6,124 | 6,203 | | (3) |
Total variable compensation | | 3,410 | 3,113 | 3,201 | | 10 |
of which: relating to current year² | | 2,610 | 2,338 | 2,369 | | 12 |
of which: relating to prior years³ | | 799 | 775 | 832 | | 3 |
Wealth Management Americas: Financial advisor compensation⁴ | | 3,552 | 3,385 | 3,140 | | 5 |
Other personnel expenses⁵ | | 2,613 | 2,372 | 2,481 | | 10 |
Total personnel expenses (adjusted)¹ | | 15,542 | 14,994 | 15,026 | | 4 |
Non-personnel expenses (adjusted)¹ | | | | | | |
General and administrative expenses | | 7,346 | 9,068 | 7,832 | | (19) |
of which: provisions for litigation, regulatory and similar matters | | 1,087 | 2,594 | 1,701 | | (58) |
of which: other general and administrative expenses | | 6,259 | 6,474 | 6,132 | | (3) |
Depreciation and impairment of property, equipment and software | | 908 | 788 | 748 | | 15 |
Amortization and impairment of intangible assets | | 94 | 81 | 83 | | 16 |
Total non-personnel expenses (adjusted)¹ | | 8,349 | 9,937 | 8,662 | | (16) |
Total operating expenses (adjusted)¹ | | 23,891 | 24,931 | 23,689 | | (4) |
Adjusting items | | 1,225 | 636 | 772 | | 93 |
of which: personnel-related restructuring expenses | | 460 | 327 | 156 | | 41 |
of which: non-personnel-related restructuring expenses | | 775 | 350 | 616 | | 121 |
of which: gains related to changes to retiree benefit plans in the US⁶ | | (21) | (41) | | | (49) |
of which: impairment of an intangible asset | | 11 | | | | |
Total operating expenses as reported | | 25,116 | 25,567 | 24,461 | | (2) |
1 Excluding adjusting items. 2 Includes expenses relating to performance awards and other variable compensation for the respective performance year. 3 Consists of amortization of prior years' awards relating to performance awards and other variable compensation. 4 Financial advisor compensation consists of grid-based compensation based directly on compensable revenues generated by financial advisors and supplemental compensation calculated based on financial advisor productivity, firm tenure, assets and other variables. It also includes expenses related to compensation commitments with financial advisors entered into at the time of recruitment which are subject to vesting requirements. 5 Consists of expenses related to contractors, social security, pension and other post-employment benefit plans and other personnel expenses. Refer to "Note 6 Personnel expenses" in the "Consolidated financial statements" section of this report for more information. 6 Refer to "Note 28 Pension and other post-employment benefit plans" in the "Consolidated financial statements" section of this report for more information. |
Financial and operating performance
Group performance
Other personnel expenses, excluding restructuring expenses and the aforementioned gains related to changes to retiree benefit plans in the US, increased by CHF 241 million to CHF 2,613 million, mainly due to an increase of CHF 113 million in costs for pension and other post-employment benefits plans and CHF 113 million higher expenses for contractors.
® Refer to “Note 6 Personnel expenses” in the “Consolidated financial statements” section of this report for more information
® Refer to “Note 28 Pension and other post-employment benefit plans” in the “Consolidated financial statements” section of this report for more information
® Refer to “Note 29 Equity participation and other compensation plans” in the “Consolidated financial statements” section of this report for more information
® Refer to the “Compensation” section of this report for more information
General and administrative expenses
General and administrative expenses decreased by CHF 1,280 million to CHF 8,107 million. Net restructuring expenses increased to CHF 761 million from CHF 319 million, largely related to our transitioning activities to nearshore and offshore locations. On an adjusted basis, excluding net restructuring expenses, general and administrative expenses decreased by CHF 1,722 million, mainly due to a CHF 1,507 million lower net charge for provisions for litigation, regulatory and similar matters.
At this point in time, we believe that the industry continues to operate in an environment in which expenses associated with litigation, regulatory and similar matters will remain elevated for the foreseeable future and we continue to be exposed to a number of significant claims and regulatory matters.
Excluding restructuring expenses, other general and administrative expenses decreased by CHF 215 million, primarily as 2014 included net expenses of CHF 120 million related to certain disputed receivables. Furthermore, occupancy costs and expenses for outsourcing of IT and other services decreased.
General and administrative expenses also included a net expense of CHF 166 million for the annual UK bank levy in 2015, mainly in the Investment Bank and in Non-core and Legacy Portfolio, compared with a net expense of CHF 123 million in 2014.
® Refer to “Note 7 General and administrative expenses” in the “Consolidated financial statements” section of this report for more information
® Refer to “Note 22 Provisions and contingent liabilities” in the “Consolidated financial statements” section of this report for more information
Depreciation, impairment and amortization
Depreciation and impairment of property, equipment and software increased by CHF 103 million to CHF 920 million. Excluding restructuring expenses of CHF 12 million compared with CHF 29 million, depreciation expenses increased by CHF 120 million, largely driven by higher depreciation expenses related to internally generated capitalized software.
Amortization and impairment of intangible assets was CHF 107 million compared with CHF 83 million. On an adjusted basis, these expenses increased by CHF 13 million.
® Refer to “Note 16 Property, equipment and software” in the “Consolidated financial statements” section of this report for more information
® Refer to “Note 17 Goodwill and intangible assets” in the “Consolidated financial statements” section of this report for more information
Tax
We recognized a net income tax benefit of CHF 898 million for 2015, which included a net Swiss tax expense of CHF 569 million and a net non-Swiss tax benefit of CHF 1,467 million, primarily relating to the upward revaluation of US deferred tax assets.
The Swiss tax expense included a current tax expense of CHF 239 million related to taxable profits, against which no losses were available to offset, mainly earned by Swiss subsidiaries. In addition, it included a net deferred tax expense of CHF 330 million, which mainly reflected a net decrease in deferred tax assets previously recognized in relation to tax losses carried forward, partially offset by an increase in recognized deferred tax assets in relation to temporary differences.
The net non-Swiss tax benefit included a current tax expense of CHF 476 million in respect of taxable profits earned by non-Swiss subsidiaries and branches, against which no losses were available to offset. This was more than offset by a net deferred tax benefit of CHF 1,943 million, primarily due to an increase in our US deferred tax assets, reflecting updated profit forecasts and an extension of the relevant taxable profit forecast period used in valuing our deferred tax assets. Based on the performance of our businesses, and the accuracy of historical forecasts, the deferred tax asset forecast period for US taxable profits was extended to seven years from six. We also consider other factors in evaluating the recoverability of our deferred tax assets, including the remaining tax loss carry-forward period, and our confidence level in assessing the probability of taxable profit beyond the current forecast period. Estimating future profitability is inherently subjective and is particularly sensitive to future economic, market and other conditions which are difficult to predict.
For 2016, notwithstanding the effects of any potential reassessment of the level of deferred tax assets, we expect the effective tax rate to be in the range of 22% to 25%. Consistent with past practice, we expect to revalue our deferred tax assets in the second half of 2016 based on a reassessment of future profitability taking into account updated business plan forecasts. The full-year effective tax rate could change significantly on the basis of this reassessment. It could also change if aggregate tax expenses in respect of profits from branches and subsidiaries without loss coverage differ from what is expected. Part of the aforementioned reassessment of future profitability includes consideration of a possible further extension of the forecast period used for US deferred tax asset recognition purposes to eight years from the seven years used as of 31 December 2015. The determination of whether to extend the forecast period by an additional year will be made on the basis of all relevant facts and circumstances existing at that time. Inasmuch as the ex-ante parameters we have established for further extending the forecast period are more challenging to satisfy than in prior years, it is therefore less probable that we will add an eighth year to the forecast period in 2016 for purposes of revaluing our US deferred tax asset.
On 16 March 2016, the UK Government announced a proposed change in law which would reduce the proportion of banks' annual taxable profits that can be offset by UK tax losses carried forward from 50% to 25% with effect from 1 April 2016. The proposed change in law would also reduce the UK corporate income tax rate from 18% to 17% with effect from 1 April 2020. To the extent that these changes are enacted in 2016, we would expect to incur a reduction in recognized deferred tax assets of approximately CHF 125 million.
® Refer to “Note 8 Income taxes” in the “Consolidated financial statements” section of this report for more information
Total comprehensive income attributable to UBS Group AG shareholders
Total comprehensive income attributable to UBS Group AG shareholders includes all changes in equity (including net profit) attributed to UBS Group AG shareholders during a period, except those resulting from investments by and distributions to UBS Group AG shareholders, as well as equity-settled share-based payments. Items included in comprehensive income, but not in net profit, are reported within other comprehensive income (OCI). These items will be reclassified to net profit when the underlying item is sold or realized, with the exception of gains and losses on defined benefit plans and certain property revaluations.
In 2015, total comprehensive income attributable to UBS Group AG shareholders was CHF 5,698 million, reflecting net profit of CHF 6,203 million, partly offset by negative OCI of CHF 506 million.
In 2015, OCI related to cash flow hedges was negative CHF 509 million compared with positive CHF 689 million in 2014, primarily reflecting lower unrealized gains on hedging derivatives from decreases in long-term interest rates.
Foreign currency translation OCI was negative CHF 231 million, primarily resulting from the significant weakening of the euro and British pound against the Swiss franc, combined with the reclassification of net gains totaling CHF 90 million to the income statement.
OCI associated with financial investments classified as available-for-sale was negative CHF 63 million, mainly as previously unrealized net gains were reclassified from OCI to the income statement upon sale of investments, partly offset by net unrealized gains following decreases in long-term interest rates. We currently expect to recognize in the income statement gains of approximately CHF 100 million, deferred in OCI, during the first half of 2016, as transactions involving certain equity investments classified as available-for-sale are closed. These expected gains will be recorded in Personal & Corporate Banking and Wealth Management and, consistent with past practice, treated as adjusting items. The reclassification of gains from OCI to the income statement will not affect shareholders’ equity, but will increase CET1 capital.
Defined benefit plan OCI was CHF 298 million. In 2015, we carried out a methodology review of the actuarial assumptions used in calculating our defined benefit obligations (DBOs). This resulted in an OCI gain of CHF 2,002 million related to the Swiss pension plan and an OCI gain of CHF 188 million related to the UK pension plan. Total pre-tax OCI related to UK defined benefit plans was CHF 321 million, reflecting a net reduction in the DBO of CHF 444 million, primarily resulting from aforementioned changes in assumptions and an increase in the applicable discount rate, partly offset by a decrease of CHF 123 million in the fair value of the underlying plan assets. In addition, we recorded total net pre-tax OCI gains of CHF 53 million on our Swiss pension plan. This reflected an OCI gain of CHF 1,212 million related to a net DBO reduction, primarily due to aforementioned changes in assumptions, partly offset by a market-driven decline in the applicable discount rate, as well as an OCI gain of CHF 105 million due to an increase in the fair value of the underlying plan assets. These OCI gains were almost entirely offset by an OCI reduction of CHF 1,265 million representing the excess of the pension surplus over the estimated future economic benefit.
® Refer to the “Significant accounting and financial reporting changes” section of this report for more information on our review of actuarial assumptions in calculating defined benefit obligations
® Refer to the “Statement of comprehensive income” in the “Consolidated financial statements” section of this report for more information
® Refer to “Note 28 Pension and other post-employment benefit plans” in the “Consolidated financial statements” section of this report for more information on OCI related to defined benefit plans
Financial and operating performance
Group performance
Net profit attributable to preferred noteholders and non-controlling interests
Net profit attributable to preferred noteholders was zero in 2015 compared with CHF 142 million in the prior year. Subsequent to the exchange offer in the fourth quarter of 2014, the preferred notes issued by UBS AG were reclassified in 2015 to equity attributable to non-controlling interests in the UBS Group AG consolidated financial statements.
Net profit attributable to non-controlling interests was CHF 183 million in 2015 compared with CHF 32 million in the prior year. This mainly related to net profit attributable to non-controlling interests in UBS AG which was CHF 103 million in 2015. As a result of the completion of the SESTA procedure in the third quarter of 2015, UBS Group AG owns 100% of the issued shares of UBS AG. Since then, profits of UBS AG were fully attributable to UBS Group AG shareholders.
Furthermore, dividends of CHF 76 million were paid to preferred noteholders, for which no accrual was required in a prior period.
We currently expect to attribute net profit to non-controlling interests related to preferred notes issued by UBS AG of approximately CHF 80 million in 2016, all in the second quarter, approximately CHF 70 million in 2017 and less than CHF 10 million per year from 2018.
Key figures
Cost / income ratio
The cost / income ratio was 81.8% in 2015 compared with 91.0% in the prior year. On an adjusted basis, the cost / income ratio was 80.6% compared with 89.8% and was above our short- to medium-term expectation of 65% to 75%.
Return on tangible equity
The return on tangible equity (RoTE) was 13.7% in 2015 compared with 8.2% in the prior year. On an adjusted basis, the RoTE was 13.7% compared with 8.6% and was above our target of around 10% in 2015.
Common equity tier 1 capital ratio
Our fully applied CET1 capital ratio increased 1.1 percentage points to 14.5% as of 31 December 2015, exceeding our target ratio of 13.0%. This increase was driven by a CHF 9.0 billion decrease in risk-weighted assets and a CHF 1.1 billion increase in CET1 capital.
Return on equity | | | | | | |
| | As of or for the year ended | | % change from |
CHF million, except where indicated | | 31.12.15 | 31.12.14 | 31.12.13 | | 31.12.14 |
| | | | | | |
Net profit | | | | | | |
Net profit attributable to UBS Group AG shareholders | | 6,203 | 3,466 | 3,172 | | 79 |
Amortization and impairment of intangible assets | | 107 | 83 | 83 | | 29 |
Pre-tax adjusting items¹ | | 135 | 305 | 869 | | (56) |
Tax effect on adjusting items² | | (140) | (125) | (135) | | 12 |
Adjusted net profit attributable to UBS Group AG shareholders³ | | 6,305 | 3,729 | 3,989 | | 69 |
| | | | | | |
Equity | | | | | | |
Equity attributable to UBS Group AG shareholders | | 55,313 | 50,608 | 48,002 | | 9 |
Less: goodwill and intangible assets⁴ | | 6,568 | 6,564 | 6,293 | | 0 |
Tangible equity attributable to UBS Group AG shareholders | | 48,745 | 44,044 | 41,709 | | 11 |
| | | | | | |
Return on equity | | | | | | |
Return on equity (%) | | 11.8 | 7.0 | 6.7 | | |
Return on tangible equity (%) | | 13.7 | 8.2 | 8.0 | | |
Adjusted return on tangible equity (%) | | 13.7 | 8.6 | 9.8 | | |
1 Refer to the table "Adjusted results" in this section for more information. 2 Generally reflects an indicative tax rate of 22% on pre-tax adjusting items, apart from own credit on financial liabilities designated at fair value, which has a lower indicative tax rate of 2%. 3 Net profit attributable to UBS Group AG shareholders excluding amortization and impairment of intangible assets, pre-tax adjusting items and tax effect on pre-tax adjusting items. 4 Goodwill and intangible assets used in the calculation of tangible equity attributable to UBS Group AG shareholders as of 31 December 2014 have been adjusted to reflect the non-controlling interests in UBS AG. |
Risk-weighted assets
Our risk-weighted assets (RWA) decreased by CHF 9.0 billion to CHF 207.5 billion on a fully applied basis as of 31 December 2015, below our short- to medium-term expectation of around CHF 250 billion. Credit risk RWA decreased by CHF 4.2 billion, primarily due to derivative trade unwinds and novations in Corporate Center – Non-core and Legacy Portfolio. Market risk RWA decreased by CHF 4.4 billion driven by risk reductions due to market movements. Operational risk RWA decreased by CHF 1.6 billion driven by lower incremental operational risk RWA based on the supplemental operational risk capital analysis mutually agreed to by UBS and FINMA.
® Refer to the “Investment Bank,” “Corporate Center” and “Capital management” sections of this report for more information
Leverage ratio denominator
Our fully-applied LRD decreased by CHF 80 billion to CHF 898 billion as of 31 December 2015 from the pro forma comparative number of CHF 978 billion as of 1 January 2015 and was below our short- to medium-term expectation of around CHF 950 billion. The decrease during 2015 mainly reflected incremental netting and collateral mitigation benefits of CHF 39 billion, currency effects of CHF 24 billion and a decrease of CHF 13 billion related to methodology changes.
® Refer to the “Investment Bank,” “Corporate Center” and “Capital management” sections of this report for more information
Net new money and invested assets
Management’s discussion and analysis on net new money and invested assets is provided in the “Wealth Management”, “Wealth Management Americas” and “Asset Management” sections of this report.
Net new money¹ | | | | |
| | For the year ended |
CHF billion | | 31.12.15 | 31.12.14 | 31.12.13 |
Wealth Management | | 12.9 | 34.4 | 35.9 |
Wealth Management (adjusted)² | | 22.8 | 34.4 | 35.9 |
Wealth Management Americas | | 21.3 | 9.6 | 17.6 |
Asset Management | | (5.4) | 15.9 | (19.9) |
of which: excluding money market flows | | (0.7) | 22.6 | (4.8) |
of which: money market flows | | (4.7) | (6.7) | (15.1) |
1 Net new money excludes interest and dividend income. 2 Adjusted net new money excludes the negative effect on net new money in 2015 of CHF 9.9 billion from our balance sheet and capital optimization program. |
Invested assets | | | | | | |
| | As of | | % change from |
CHF billion | | 31.12.15 | 31.12.14 | 31.12.13 | | 31.12.14 |
Wealth Management | | 947 | 987 | 886 | | (4) |
Wealth Management Americas | | 1,035 | 1,027 | 865 | | 1 |
Asset Management | | 650 | 664 | 583 | | (2) |
of which: excluding money market funds | | 592 | 600 | 518 | | (1) |
of which: money market funds | | 58 | 64 | 65 | | (9) |
|
Financial and operating performance
Group performance
Regional performance
The operating regions shown in the “Regional performance” table below correspond to the regional management structure of the Group. The allocation of income and expenses to these regions reflects, and is consistent with, the basis on which the business is managed and its performance evaluated. These allocations involve assumptions and judgments that management considers to be reasonable, and may be refined to reflect changes in estimates or management structure.
The main principles of the allocation methodology are that client revenues are attributed to the domicile of the client, and trading and portfolio management revenues are attributed to the country where the risk is managed. This revenue attribution is consistent with the mandate of our country and regional Presidents. Expenses are allocated in line with revenues. Certain revenues and expenses, such as those related to Corporate Center – Non-core and Legacy Portfolio, certain litigation expenses and restructuring expenses and other items, are managed at the Group level. These revenues and expenses are included in the Global column.
Regional performance |
| | Americas | | Asia Pacific | | Europe, Middle East and Africa |
| | For the year ended |
CHF billion | | 31.12.15 | 31.12.14 | 31.12.13 | | 31.12.15 | 31.12.14 | 31.12.13 | | 31.12.15 | 31.12.14 | 31.12.13 |
Operating income | | | | | | | | | | | | |
Wealth Management | | 0.5 | 0.5 | 0.4 | | 2.1 | 1.9 | 1.7 | | 3.8 | 4.0 | 3.9 |
Wealth Management Americas | | 7.4 | 7.0 | 6.5 | | 0.0 | 0.0 | 0.0 | | 0.0 | 0.0 | 0.0 |
Personal & Corporate Banking | | 0.0 | 0.0 | 0.0 | | 0.0 | 0.0 | 0.0 | | 0.0 | 0.0 | 0.0 |
Asset Management | | 0.7 | 0.7 | 0.7 | | 0.3 | 0.3 | 0.3 | | 0.4 | 0.4 | 0.4 |
Investment Bank | | 2.8 | 2.6 | 2.5 | | 2.6 | 2.4 | 2.6 | | 2.5 | 2.4 | 2.2 |
Corporate Center | | 0.0 | 0.0 | 0.0 | | 0.0 | 0.0 | 0.0 | | 0.0 | 0.0 | 0.0 |
Total operating income | | 11.3 | 10.7 | 10.2 | | 5.0 | 4.6 | 4.5 | | 6.8 | 6.8 | 6.6 |
| | | | | | | | | | | | |
Operating expenses | | | | |
Wealth Management | | 0.4 | 0.4 | 0.4 | | 1.5 | 1.3 | 1.2 | | 2.8 | 3.0 | 2.9 |
Wealth Management Americas | | 6.7 | 6.1 | 5.7 | | 0.0 | 0.0 | 0.0 | | 0.0 | 0.0 | 0.0 |
Personal & Corporate Banking | | 0.0 | 0.0 | 0.0 | | 0.0 | 0.0 | 0.0 | | 0.0 | 0.0 | 0.0 |
Asset Management | | 0.5 | 0.5 | 0.5 | | 0.2 | 0.2 | 0.2 | | 0.4 | 0.4 | 0.4 |
Investment Bank | | 2.1 | 2.0 | 2.0 | | 1.7 | 1.7 | 1.6 | | 2.1 | 1.9 | 1.8 |
Corporate Center | | 0.0 | 0.0 | 0.0 | | 0.0 | 0.0 | 0.0 | | 0.0 | 0.0 | 0.0 |
Total operating expenses | | 9.6 | 9.0 | 8.5 | | 3.4 | 3.2 | 3.0 | | 5.2 | 5.2 | 5.0 |
| | | | | | | | | | | | |
Operating profit / (loss) before tax | | | | |
Wealth Management | | 0.1 | 0.1 | 0.1 | | 0.6 | 0.6 | 0.5 | | 1.1 | 1.0 | 1.1 |
Wealth Management Americas | | 0.7 | 0.9 | 0.9 | | 0.0 | 0.0 | 0.0 | | 0.0 | 0.0 | 0.0 |
Personal & Corporate Banking | | 0.0 | 0.0 | 0.0 | | 0.0 | 0.0 | 0.0 | | 0.0 | 0.0 | 0.0 |
Asset Management | | 0.2 | 0.2 | 0.2 | | 0.1 | 0.1 | 0.1 | | 0.1 | 0.0 | 0.0 |
Investment Bank | | 0.7 | 0.6 | 0.6 | | 0.9 | 0.7 | 1.0 | | 0.4 | 0.5 | 0.4 |
Corporate Center | | 0.0 | 0.0 | 0.0 | | 0.0 | 0.0 | 0.0 | | 0.0 | 0.0 | 0.0 |
Operating profit / (loss) before tax | | 1.7 | 1.8 | 1.7 | | 1.6 | 1.4 | 1.5 | | 1.5 | 1.5 | 1.5 |
| | | | | | | | | | |
Switzerland | | Global | | Total |
For the year ended |
31.12.15 | 31.12.14 | 31.12.13 | | 31.12.15 | 31.12.14 | 31.12.13 | | 31.12.15 | 31.12.14 | 31.12.13 |
| | | | | | | | | | |
1.6 | 1.5 | 1.5 | | 0.2 | 0.0 | 0.1 | | 8.2 | 7.9 | 7.6 |
0.0 | 0.0 | 0.0 | | 0.0 | 0.0 | 0.0 | | 7.4 | 7.0 | 6.5 |
3.9 | 3.7 | 3.8 | | 0.0 | 0.0 | 0.0 | | 3.9 | 3.7 | 3.8 |
0.6 | 0.5 | 0.5 | | 0.1 | 0.0 | 0.0 | | 2.1 | 1.9 | 1.9 |
1.0 | 1.0 | 1.1 | | (0.1) | (0.1) | 0.0 | | 8.8 | 8.3 | 8.4 |
0.0 | 0.0 | 0.0 | | 0.3 | (0.8) | (0.5) | | 0.3 | (0.8) | (0.5) |
7.1 | 6.8 | 6.8 | | 0.5 | (0.9) | (0.4) | | 30.6 | 28.0 | 27.7 |
| | | | | | | | | | |
| | | | | | | | | | |
0.9 | 0.9 | 0.8 | | 0.0 | 0.0 | 0.0 | | 5.5 | 5.6 | 5.3 |
0.0 | 0.0 | 0.0 | | 0.0 | 0.0 | 0.0 | | 6.7 | 6.1 | 5.7 |
2.2 | 2.2 | 2.3 | | 0.0 | 0.0 | 0.0 | | 2.2 | 2.2 | 2.3 |
0.3 | 0.3 | 0.3 | | 0.0 | 0.1 | 0.0 | | 1.5 | 1.4 | 1.4 |
0.6 | 0.7 | 0.7 | | 0.4 | 2.1 | 0.3 | | 6.9 | 8.4 | 6.3 |
0.0 | 0.0 | 0.0 | | 2.4 | 1.8 | 3.5 | | 2.4 | 1.8 | 3.5 |
4.0 | 4.1 | 4.1 | | 2.8 | 4.1 | 3.8 | | 25.1 | 25.6 | 24.5 |
| | | | | | | | | | |
| | | | | | | | | | |
0.7 | 0.7 | 0.6 | | 0.2 | 0.0 | 0.0 | | 2.7 | 2.3 | 2.2 |
0.0 | 0.0 | 0.0 | | 0.0 | 0.0 | 0.0 | | 0.7 | 0.9 | 0.9 |
1.6 | 1.5 | 1.5 | | 0.0 | 0.0 | 0.0 | | 1.6 | 1.5 | 1.5 |
0.2 | 0.2 | 0.2 | | 0.0 | (0.1) | 0.0 | | 0.6 | 0.5 | 0.6 |
0.4 | 0.3 | 0.4 | | (0.5) | (2.2) | (0.2) | | 1.9 | (0.1) | 2.1 |
0.0 | 0.0 | 0.0 | | (2.0) | (2.7) | (4.0) | | (2.0) | (2.7) | (4.0) |
3.1 | 2.7 | 2.7 | | (2.3) | (5.0) | (4.2) | | 5.5 | 2.5 | 3.3 |
Financial and operating performance
Group performance
2014 compared with 2013
Results
We recorded an operating profit before tax of CHF 2,461 million compared with CHF 3,272 million, largely reflecting an increase of CHF 1,106 million in operating expenses, driven by a CHF 893 million higher net charge for provisions for litigation, regulatory and similar matters. Operating income increased by CHF 295 million, due to CHF 789 million higher net fee and commission income, largely offset by a CHF 518 million decline in net interest and trading income. We recorded a net tax benefit of CHF 1,180 million compared with a net tax benefit of CHF 110 million in the prior year, reflecting net upward revaluations of deferred tax assets in both years, which more than offset tax expenses in respect of taxable profits.
In addition to reporting our results in accordance with IFRS, we report adjusted results that exclude items that management believes are not representative of the underlying performance of our businesses. Such adjusted results are non-GAAP financial measures as defined by SEC regulations. For 2014, the items we excluded were an own credit gain of CHF 292 million, gains on sales of real estate of CHF 44 million, a gain of CHF 43 million from the partial sale of our investment in Markit, a loss of CHF 48 million related to the impairment of a financial investment available-for-sale, net restructuring expenses of CHF 677 million and a gain of CHF 41 million related to changes to retiree benefit plans in the US. For 2013, the items we excluded were an own credit loss of CHF 283 million, gains on sales of real estate of CHF 288 million, net losses related to the buyback of debt in tender offers of CHF 167 million, gains on sales of subsidiaries and businesses of CHF 89 million, a net foreign currency translation loss from the disposal of subsidiaries of CHF 24 million and net restructuring expenses of CHF 772 million.
On this adjusted basis, profit before tax was CHF 2,766 million compared with CHF 4,141 million in the prior year.
Adjusted operating income decreased by CHF 133 million to CHF 27,696 million, mainly reflecting a decline of CHF 1,066 million in adjusted net interest and trading income, largely offset by an increase in net fee and commission income of CHF 789 million and CHF 172 million higher adjusted other income.
Adjusted operating expenses increased by CHF 1,242 million to CHF 24,931 million, mainly due to a CHF 893 million higher net charge for provisions for litigation, regulatory and similar matters, as well as CHF 381 million higher other non-personnel expenses. Adjusted personnel expenses were largely unchanged.
Operating income
Total operating income was CHF 28,027 million compared with CHF 27,732 million. On an adjusted basis, total operating income decreased by CHF 133 million to CHF 27,696 million. Adjusted net interest and trading income declined CHF 1,066 million, largely in Corporate Center – Non-core and Legacy Portfolio and in the Investment Bank, partly offset by an increase in Corporate Center – Services. Net fee and commission income increased by CHF 789 million, mainly in our wealth management businesses, as well as in the Investment Bank. Adjusted other income increased by CHF 172 million.
Net interest and trading income
Net interest and trading income decreased by CHF 518 million to CHF 10,397 million. 2014 included an own credit gain on financial liabilities designated at fair value of CHF 292 million, primarily as life-to-date own credit losses partially reversed due to time decay. The prior year included an own credit loss on financial liabilities of CHF 283 million. Excluding the effect of own credit in both years and a gain related to the buyback of debt in tender offers of CHF 27 million in 2013, net interest and trading income decreased by CHF 1,066 million to CHF 10,105 million, mainly in Non-core and Legacy Portfolio and in the Investment Bank.
In the Investment Bank, net interest and trading income decreased by CHF 335 million to CHF 4,517 million. Within Investor Client Services, Foreign Exchange, Rates and Credit net interest and trading income decreased by CHF 214 million, with lower revenues across most products as client activity and volatility levels decreased compared with 2013, reflecting the ongoing macroeconomic uncertainty. Corporate Client Solutions net interest and trading income declined by CHF 116 million, largely due to lower revenues within Equities Capital Markets, which included revenues from a large private transaction in 2013. This was partly offset by higher revenues in Debt Capital Markets, due to higher revenues from leveraged finance, as well as reduced negative risk management revenues, mainly due to the positive effect of widening credit spreads during 2014.
In Corporate Center – Non-core and Legacy Portfolio, net interest and trading income decreased by CHF 983 million. Non-core net interest and trading income decreased by CHF 304 million, partly as 2014 included a net loss of CHF 175 million from the implementation of funding valuation adjustments (FVA) on derivatives. Further, 2014 included losses in Rates of CHF 197 million, mainly from novation and unwind activities compared with gains of CHF 23 million in the prior year. Legacy Portfolio net interest and trading income decreased by CHF 680 million. In 2013, we exercised our option to acquire the SNB StabFund’s equity and recorded total option revaluation gains of CHF 431 million prior to the exercise. 2014 included a loss of CHF 108 million resulting from the termination of certain credit default swap (CDS) contracts and a net loss from the implementation of FVA on derivatives of CHF 77 million.
® Refer to the “Significant accounting and financial reporting changes” section of this report for more information on a change in segment reporting related to fair value gains and losses on certain internal funding transactions
Credit loss expense / recovery
We recorded net credit loss expenses of CHF 78 million compared with CHF 50 million in the prior year.
Net credit loss expenses in Personal & Corporate Banking were CHF 95 million compared with CHF 18 million in the prior year. 2014 included net specific credit loss allowances of CHF 105 million compared with CHF 113 million in the prior year, which was primarily related to corporate clients in both periods. In addition, 2014 included a release of CHF 10 million in collective loan loss allowances compared with a release of CHF 95 million in 2013, which partly reflected the overall improved outlook for relevant industries.
Wealth Management Americas recorded a net credit loss recovery of CHF 15 million in 2014, mainly reflecting the full release of a loan loss allowance for a single client, as well as releases of loan loss allowances on securities-backed lending facilities collateralized by Puerto Rico municipal securities and related funds. In the prior year, Wealth Management Americas recorded a net credit loss expense of CHF 27 million, largely due to loan loss allowances on securities-backed lending facilities collateralized by Puerto Rico municipal securities and related funds.
Net fee and commission income
Net fee and commission income increased by CHF 789 million to CHF 17,076 million.
Portfolio management and advisory fees increased by CHF 718 million to CHF 7,343 million, primarily in Wealth Management Americas, largely due to an increase in managed account fees, reflecting higher invested asset levels. Portfolio management and advisory fees also increased in Wealth Management, primarily due to an increase in invested assets, the positive effect of pricing measures and continued growth in discretionary and advisory mandates. These increases were partly offset by lower income due to the effect of ongoing outflows of assets from cross-border clients and due to the migration into retrocession-free products for investment mandates during 2013.
Merger and acquisitions and corporate finance fees increased by CHF 118 million to CHF 731 million, predominantly in the Investment Bank, mainly reflecting an increased volume of mergers and acquisition transactions in 2014.
Underwriting fees rose by CHF 96 million, mainly reflecting higher equity underwriting fees, largely in the Investment Bank, due to higher revenues from public offerings as the fee pool increased.
Other income
Other income was CHF 632 million compared with CHF 580 million in the prior year. Adjusted other income increased by CHF 172 million.
Income related to associates and subsidiaries increased by CHF 90 million when excluding a net gain of CHF 31 million on the sale of our remaining proprietary trading business in 2013. 2014 included a gain of CHF 65 million in Corporate Client Solutions within the Investment Bank on an investment in an associate which was reclassified to a financial investment available-for-sale following its initial public offering. 2014 also included a gain of CHF 58 million related to the release of a provision for litigation, regulatory and similar matters, which was recorded as other income in Corporate Center – Services, compared with a gain of CHF 21 million in 2013.
Excluding a gain of CHF 43 million from the partial sale of our investment in Markit and a loss of CHF 48 million related to the impairment of a financial investment available-for-sale, both in 2014, adjusted income from financial investments classified as available-for-sale decreased by CHF 20 million.
Adjusted other income other than income related to associates and subsidiaries and from financial investments classified as available-for-sale increased by CHF 102 million when excluding gains on sales of real estate of CHF 44 million in 2014 and CHF 288 million in 2013, net losses related to the buyback of debt in tender offers of CHF 194 million in 2013 and a gain on the sale of Asset Management’s Canadian domestic business of CHF 34 million in 2013.
Operating expenses
Total operating expenses increased by CHF 1,106 million to CHF 25,567 million. Restructuring expenses were CHF 677 million compared with CHF 772 million in the prior year. Personnel-related restructuring expenses increased by CHF 171 million to CHF 327 million, while non-personnel-related restructuring expenses decreased by CHF 266 million to CHF 350 million.
On an adjusted basis, excluding restructuring expenses in both years as well as gains related to changes to retiree benefit plans in the US of CHF 41 million in 2014, total operating expenses increased by CHF 1,242 million to CHF 24,931 million. This increase was mainly due to a CHF 893 million higher net charge for provisions for litigation, regulatory and similar matters as well as CHF 381 million higher other non-personnel expenses, due to higher costs for outsourcing of IT and other services as well as higher professional fees. Adjusted personnel expenses were largely unchanged.
Financial and operating performance
Group performance
Personnel expenses
Personnel expenses increased by CHF 98 million to CHF 15,280 million and included CHF 327 million personnel-related restructuring expenses compared with CHF 156 million in the prior year. On an adjusted basis, excluding restructuring expenses and the aforementioned gains related to changes to retiree benefit plans in the US in 2014, personnel expenses decreased slightly by CHF 32 million to CHF 14,994 million.
Expenses for salaries, excluding restructuring expenses, decreased by CHF 79 million to CHF 6,124 million, mainly reflecting an increase in the capitalization of personnel expenses related to internally generated computer software, partly offset by expenses for role-based allowances.
Excluding restructuring expenses, total variable compensation expenses decreased by CHF 88 million to CHF 3,113 million. Expenses for current year awards decreased by CHF 31 million and expenses for prior-year awards by CHF 57 million.
Financial advisor compensation in Wealth Management Americas increased by CHF 245 million to CHF 3,385 million, corresponding with higher compensable revenues.
Other personnel expenses, excluding restructuring expenses and the aforementioned gains related to changes to retiree benefit plans in the US, decreased by CHF 109 million to CHF 2,372 million, largely due to a decline of CHF 98 million in costs for pension and other post-employment benefits plans.
General and administrative expenses
General and administrative expenses increased by CHF 1,007 million to CHF 9,387 million. On an adjusted basis, excluding net restructuring expenses of CHF 319 million in 2014 compared with CHF 548 million in the prior year, general and administrative expenses increased by CHF 1,236 million, mainly due to a CHF 893 million higher net charge for provisions for litigation, regulatory and similar matters, as well as higher costs for outsourcing of IT and other services and higher professional fees.
Outsourcing of IT and other services, excluding restructuring expenses, increased by CHF 240 million.
General and administrative expenses also included a net expense of CHF 123 million for the annual UK bank levy for 2014, mainly in the Investment Bank and in Non-core and Legacy Portfolio, compared with a net expense of CHF 124 million in the prior year. Further, 2014 included net expenses of CHF 120 million in Non-core and Legacy Portfolio related to certain disputed receivables compared with an impairment charge of CHF 87 million in the prior year.
Tax
We recognized a net income tax benefit of CHF 1,180 million for 2014, which included a Swiss tax expense of CHF 1,395 million and a net foreign tax benefit of CHF 2,574 million.
The Swiss tax expense included a current tax expense of CHF 46 million related to taxable profits, against which no losses were available to offset, mainly earned by Swiss subsidiaries. In addition, it included a deferred tax expense of CHF 1,348 million, mainly reflecting the net decrease of deferred tax assets previously recognized in relation to tax losses carried forward.
The net foreign tax benefit included current tax expense of CHF 409 million in respect of taxable profits earned by non-Swiss subsidiaries and branches, against which no losses were available to offset. This was more than offset by a net deferred tax benefit of CHF 2,983 million, primarily reflecting an increase in US deferred tax assets.
Total comprehensive income attributable to UBS Group AG shareholders
Total comprehensive income attributable to UBS Group AG shareholders was CHF 4,920 million, reflecting net profit attributable to UBS Group AG shareholders of CHF 3,466 million and OCI attributable to UBS Group AG shareholders of CHF 1,453 million.
In 2014, OCI included foreign currency translation gains of CHF 1,795 million, primarily related to the significant strengthening of the US dollar against the Swiss franc. OCI related to cash flow hedges was positive CHF 689 million, mainly reflecting decreases in long-term interest rates across all major currencies. OCI associated with financial investments classified as available-for-sale was positive CHF 141 million, mainly due to an increase in net unrealized gains following decreases in long-term interest rates, partly offset by previously unrealized net gains that were reclassified from OCI to the income statement upon sale of investments.
These OCI gains were partly offset by negative OCI on defined benefit plans of CHF 1,172 million. A pre-tax OCI loss of CHF 995 million was recorded for the Swiss pension plan, which was mainly due to an increase in the defined benefit obligation, resulting from a significant decline in the applicable discount rate, which is linked to the returns on Swiss AA-rated corporate bonds and decreased from 2.3% as of 31 December 2013 to 1.2% as of 31 December 2014. This was partly offset by an increase in the fair value of the underlying plan assets and the reversal of the asset ceiling effect. Net pre-tax OCI losses on non-Swiss pension plans amounted to CHF 414 million and primarily related to the UK and US pension plans.
Net profit attributable to preferred noteholders and non-controlling interests
Net profit attributable to preferred noteholders was CHF 142 million in 2014 compared with CHF 204 million in the prior year. Dividends of CHF 81 million were paid to preferred noteholders, for which no accrual was required in a prior period. In addition, 2014 included an accrual of CHF 30 million for future dividend payments. Furthermore, the purchase of UBS AG shares by UBS Group AG pursuant to the exchange offer caused a trigger event which resulted in accruals for future distributions to preferred noteholders of CHF 31 million. Subsequent to the exchange offer, the preferred notes issued by UBS AG were reclassified to equity attributable to non-controlling interests from a UBS Group AG perspective.
Net profit attributable to non-controlling interests was CHF 32 million in 2014, which largely reflected net profit attributable to non-controlling interests in UBS AG and was related to the non-tendered or not subsequently exchanged UBS AG shares.
Financial and operating performance
Balance sheet
Balance sheet
As of 31 December 2015, our balance sheet assets stood at CHF 943 billion, a decrease of CHF 120 billion or 11% from 31 December 2014, mainly due to reductions in positive replacement values (PRV) in both Corporate Center – Non-core and Legacy Portfolio and the Investment Bank. Funded assets, which represent total assets excluding PRV and collateral delivered against over-the-counter derivatives, decreased by CHF 19 billion to CHF 756 billion, primarily due to currency effects resulting from the strengthening of the Swiss franc against the euro and British pound. Excluding these currency effects, funded assets were broadly unchanged.
Balance sheet | | | | |
| | | | % change from |
CHF million | 31.12.15 | 31.12.14 | | 31.12.14 |
| | | | |
Assets | | | | |
Cash and balances with central banks | 91,306 | 104,073 | | (12) |
Due from banks | 11,948 | 13,334 | | (10) |
Cash collateral on securities borrowed | 25,584 | 24,063 | | 6 |
Reverse repurchase agreements | 67,893 | 68,414 | | (1) |
Trading portfolio assets | 124,035 | 138,156 | | (10) |
of which: assets pledged as collateral which may be sold or repledged by counterparties | 51,943 | 56,018 | | (7) |
Positive replacement values | 167,435 | 256,978 | | (35) |
Cash collateral receivables on derivative instruments | 23,763 | 30,979 | | (23) |
Financial assets designated at fair value | 6,146 | 4,951 | | 24 |
Loans | 311,954 | 315,757 | | (1) |
Financial investments available-for-sale | 62,543 | 57,159 | | 9 |
Investments in associates | 954 | 927 | | 3 |
Property, equipment and software | 7,695 | 6,854 | | 12 |
Goodwill and intangible assets | 6,568 | 6,785 | | (3) |
Deferred tax assets | 12,835 | 11,060 | | 16 |
Other assets | 22,160 | 22,988 | | (4) |
Total assets | 942,819 | 1,062,478 | | (11) |
| | | | |
Liabilities | | | | |
Due to banks | 11,836 | 10,492 | | 13 |
Cash collateral on securities lent | 8,029 | 9,180 | | (13) |
Repurchase agreements | 9,653 | 11,818 | | (18) |
Trading portfolio liabilities | 29,137 | 27,958 | | 4 |
Negative replacement values | 162,430 | 254,101 | | (36) |
Cash collateral payables on derivative instruments | 38,282 | 42,372 | | (10) |
Financial liabilities designated at fair value | 62,995 | 75,297 | | (16) |
Due to customers | 390,185 | 410,207 | | (5) |
Debt issued | 93,147 | 91,207 | | 2 |
Provisions | 4,164 | 4,366 | | (5) |
Other liabilities | 75,652 | 71,112 | | 6 |
Total liabilities | 885,511 | 1,008,110 | | (12) |
Balance sheet (continued) |
| | | | % change from |
CHF million | 31.12.15 | 31.12.14 | | 31.12.14 |
| | | | |
Equity | | | | |
Share capital | 385 | 372 | | 3 |
Share premium | 31,164 | 32,590 | | (4) |
Treasury shares | (1,693) | (1,393) | | 22 |
Retained earnings | 29,504 | 22,134 | | 33 |
Other comprehensive income recognized directly in equity, net of tax | (4,047) | (3,093) | | 31 |
Equity attributable to UBS Group AG shareholders | 55,313 | 50,608 | | 9 |
Equity attributable to non-controlling interests | 1,995 | 3,760 | | (47) |
Total equity | 57,308 | 54,368 | | 5 |
Total liabilities and equity | 942,819 | 1,062,478 | | (11) |
Assets development by business division and Corporate Center unit
Investment Bank
Investment Bank total assets decreased by CHF 39 billion to CHF 253 billion, primarily due to a CHF 26 billion reduction in PRV, mainly within our Foreign Exchange, Rates and Credit business and largely resulting from net maturities of foreign exchange derivative contracts. Funded assets decreased by CHF 11 billion to CHF 160 billion, mainly due to lower trading portfolio assets in our Foreign Exchange, Rates and Credit business, driven by a reduction in client activity in the fourth quarter.
Corporate Center – Non-core and Legacy Portfolio
Non-core and Legacy Portfolio total assets decreased by CHF 75 billion to CHF 94 billion, mainly reflecting CHF 62 billion lower PRV. Within our rates portfolio, PRV decreased by CHF 57 billion, driven by fair value decreases following interest rate movements, as well as by our ongoing reduction activity including negotiated bilateral settlements, third-party novations, including transfers to central clearing houses, and agreements to net down trades with other dealer counterparties. Collateral delivered against OTC derivatives decreased by CHF 9 billion. Funded assets decreased by CHF 4 billion to CHF 7 billion, mainly due to the sale of the last remaining structured bond position in the non-linear rates portfolio and the last collateralized loan obligation bond positions within the securitizations portfolio, as well as a partial loan repayment in credit.
Corporate Center – Group ALM
Corporate Center – Group ALM total assets were broadly unchanged at CHF 238 billion, as a reduction in cash and balances with central banks was mostly offset by increases in financial investments classified as available-for-sale and reverse repurchase agreements, mainly due to a rebalancing of our high-quality liquid assets.
Total assets and funded assets |
| | 31.12.15 | | 31.12.14 |
CHF billion | | Investment Bank | CC – Group ALM | CC – Non-core and Legacy Portfolio | Other | UBS | | Investment Bank | CC – Group ALM | CC – Non-core and Legacy Portfolio | Other | UBS |
Total assets | | 253.5 | 237.5 | 94.4 | 357.4 | 942.8 | | 292.3 | 237.9 | 169.8 | 362.4 | 1,062.5 |
Less: positive replacement values | | (83.4) | (0.1) | (78.5) | (5.4) | (167.4) | | (109.2) | (0.1) | (140.7) | (7.0) | (257.0) |
Less: collateral delivered against OTC derivatives¹ | | (10.2) | (0.1) | (8.9) | 0.0 | (19.2) | | (12.5) | (0.4) | (17.9) | 0.00 | (30.7) |
Funded assets | | 159.9 | 237.3 | 7.0 | 352.0 | 756.2 | | 170.7 | 237.4 | 11.3 | 355.4 | 774.8 |
1 Mainly consists of cash collateral receivables on derivative instruments and reverse repurchase agreements. |
Financial and operating performance
Balance sheet
Other business divisions
Wealth Management and Personal & Corporate Banking total assets decreased CHF 8 billion and CHF 3 billion to CHF 120 billion and CHF 141 billion, respectively, mainly reflecting lower lending balances.
Wealth Management Americas total assets increased by CHF 5 billion to CHF 61 billion primarily due to increased lending activities. Corporate Center – Services total assets increased by CHF 3 billion to CHF 23 billion, primarily due to increases in recognized deferred tax assets and in property, equipment and software.
Asset Management total assets were broadly unchanged at CHF 13 billion.
Assets and liabilities development by product category
Cash and balances with central banks
Cash and balances with central banks decreased by CHF 13 billion to CHF 91 billion as of 31 December 2015, primarily due to the aforementioned rebalancing of our high-quality liquid assets in Corporate Center – Group ALM.
Lending
Loans decreased by CHF 4 billion to CHF 312 billion, predominantly in Wealth Management, partly offset by an increase in Wealth Management Americas. Interbank lending and financial assets designated at fair value were broadly unchanged at CHF 12 billion and CHF 6 billion, respectively.
Collateral trading
Collateral trading assets, which consist of reverse repurchase agreements and cash collateral on securities borrowed, were broadly unchanged at CHF 93 billion as an increase in reverse repurchase agreements in Corporate Center – Group ALM, mainly due to the aforementioned rebalancing of our high-quality liquid assets, was mostly offset by a client-driven reduction in reverse repurchase agreements in the Investment Bank.
Collateral trading liabilities, which consist of repurchase agreements and cash collateral on securities lent, reduced by CHF 3 billion to CHF 18 billion.
Trading portfolio
Trading portfolio assets decreased CHF 14 billion to CHF 124 billion, primarily within the Investment Bank, in both our Equities and Rates and Credit businesses, mainly reflecting client-driven reductions and currency effects. Trading portfolio assets within Non-core and Legacy Portfolio continued to decline, primarily due to the aforementioned sales and unwinds.
Trading portfolio liabilities were broadly unchanged at CHF 29 billion.
Replacement values
Positive and negative replacement values were lower on both sides of the balance sheet, decreasing by CHF 90 billion and CHF 92 billion to CHF 167 billion and CHF 162 billion, respectively, resulting from aforementioned reductions in the Investment Bank and Non-core and Legacy Portfolio.
Financial investments classified as available-for-sale
Financial investments available-for-sale increased by CHF 5 billion to CHF 63 billion, mainly reflecting the aforementioned rebalancing of our high-quality liquid assets.
Short-term borrowings
Short-term borrowings, which include short-term debt issued and interbank borrowing, decreased by CHF 5 billion to CHF 33 billion, mainly due to a CHF 6 billion reduction in short-term debt issued, primarily reflecting net maturities of both certificates of deposit and commercial paper, partly offset by a CHF 1 billion increase in interbank lending.
® Refer to the “Treasury management” section of this report for more information
Due to customers
Customer deposits decreased by CHF 20 billion to CHF 390 billion, primarily reflecting our balance sheet and capital optimization program in Wealth Management, lower demand deposits in Personal & Corporate Banking and currency effects, partly offset by net inflows in Wealth Management Americas.
® Refer to the “Treasury management” section of this report for more information
Long-term debt issued
Long-term debt outstanding, which consists of financial liabilities designated at fair value and long-term debt issued, decreased by CHF 4 billion to CHF 135 billion primarily resulting from the repurchase of certain senior and subordinated debt and covered bonds with an aggregate principal amount equivalent to CHF 6.1 billion through a tender offer, combined with decreases in financial liabilities designated at fair value, reflecting client-driven reductions in the Investment Bank and maturities in Non-core and Legacy Portfolio. These decreases were partly offset by issuances of additional tier 1 capital perpetual notes and senior unsecured debt.
® Refer to the “Treasury management” section of this report for more information
Other
Other assets decreased by CHF 6 billion, primarily due to a CHF 7 billion reduction in cash collateral receivables on derivative instruments following the reduction in replacement values, partly offset by a CHF 2 billion increase in recognized deferred tax assets.
Other liabilities were broadly unchanged, as a reduction in cash collateral payables on derivative instruments was offset by an increase in prime brokerage payables.

Financial and operating performance
Balance sheet
Equity development
Equity attributable to UBS Group AG shareholders increased by CHF 4,705 million to CHF 55,313 million as of 31 December 2015 from CHF 50,608 million a year earlier. Total comprehensive income attributable to UBS Group AG shareholders was CHF 5,698 million, reflecting net profit of CHF 6,203 million, partly offset by negative other comprehensive income (OCI) of CHF 506 million. The negative OCI included foreign currency translation losses of CHF 231 million combined with negative OCI related to cash flow hedges and financial investments available-for-sale of CHF 509 million and CHF 63 million, respectively, partly offset by net gains on defined benefit plans of CHF 298 million.
Share premium decreased primarily due to the distribution of CHF 2,760 million out of the capital contribution reserve of UBS Group AG, partly offset by employee share-based compensation of CHF 302 million, mainly reflecting the amortization of deferred equity compensation awards.
Net treasury share activity decreased equity attributable to UBS Group AG shareholders by CHF 263 million, mainly reflecting the net acquisition of treasury shares in relation to employee share-based compensation awards.
In 2015, UBS Group AG increased its ownership interest in UBS AG to 100% following the completion of the SESTA procedure. This resulted in an increase of CHF 1,724 million in equity attributable to UBS Group AG shareholders.
® Refer to the "The legal structure of UBS Group" section of this report for more information on the establishment of UBS Group AG
® Refer to the “Statement of changes in equity” in the “Consolidated financial statements” section of this report for more information
® Refer to “Total comprehensive income attributable to UBS Group AG shareholders” in the “Group performance“ section of this report for more information
Intra-period balances
Balance sheet positions disclosed in this section represent year-end positions. Intra-period balance sheet positions fluctuate in the ordinary course of business and may differ from quarter-end and year-end positions.

Off-balance sheet
Off-balance sheet arrangements
In the normal course of business, we enter into transactions that may not be recognized in whole or in part on our balance sheet as a result of applying International Financial Reporting Standards (IFRS). These transactions include derivative instruments, guarantees and similar arrangements, as well as some purchased and retained interests in non-consolidated structured entities (SEs), which are transacted for a number of reasons, including market-making and hedging activities, to meet specific needs of our clients or to offer investment opportunities to clients through entities that are not controlled by us.
When we, through these arrangements, incur an obligation or become entitled to an asset, we recognize these on the balance sheet. It should be noted that in certain instances the amount recognized on the balance sheet does not represent the full gain or loss potential inherent in such arrangements.
® Refer to “Note 1a Significant accounting policies items 3 and 5” and “Note 30 Interests in subsidiaries and other entities” in the “Consolidated financial statements” section of this report for more information
The following paragraphs provide more information on several distinct off-balance sheet arrangements. Additional off-balance sheet information is primarily provided in Notes 14, 22, 25, 30 and 33 in the “Consolidated financial statements” section of this report, as well as in the “UBS Group AG consolidated supplemental disclosures required under Basel III Pillar 3 regulations” section of this report.
Risk disclosures, including our involvement with off-balance sheet vehicles
Refer to the “Risk, treasury and capital management” section of this report for comprehensive credit, market and liquidity risk information related to our exposures, which includes exposures to off-balance sheet vehicles.
Support provided to non-consolidated investment funds
In 2015, the Group did not provide material support, financial or otherwise, to unconsolidated investment funds when the Group was not contractually obligated to do so, nor does the Group have an intention to do so.
Guarantees and similar arrangements
In the normal course of business, we issue various forms of guarantees, commitments to extend credit, standby and other letters of credit to support our clients, commitments to enter into forward starting transactions, note issuance facilities and revolving underwriting facilities. With the exception of related premiums, generally these guarantees and similar obligations are kept as off-balance sheet items unless a provision to cover probable losses is required.
As of 31 December 2015, the net exposure (gross values less sub-participations) from guarantees and similar instruments was CHF 13.3 billion, compared with CHF 14.9 billion as of 31 December 2014. Fee income from issuing guarantees was not significant to total revenues in 2015.
Guarantees represent irrevocable assurances that, subject to the satisfaction of certain conditions, require that we make payments in the event that our clients fail to fulfill their obligations to third parties. We also enter into commitments to extend credit in the form of credit lines that are available to secure the liquidity needs of our clients. The majority of these unutilized credit lines range in maturity from one month to five years. If customers fail to meet their obligations, our maximum exposure to credit risk is the contractual amount of these instruments. The risk is similar to the risk involved in extending loan facilities and is subject to the same risk management and control framework. In 2015, we recognized a net credit loss expense of CHF 2 million related to loan commitments and guarantees compared with a net credit loss recovery of CHF 49 million in 2014. Provisions recognized for guarantees and loan commitments were CHF 35 million as of 31 December 2015 and CHF 23 million as of 31 December 2014.
® Refer to “Note 12 Allowances and provisions for credit losses” in the “Consolidated financial statements” section of this report for more information on provisions for loan commitments and guarantees
For certain obligations, we enter into partial sub-participations to mitigate various risks from guarantees and loan commitments. A sub-participation is an agreement by another party to take a share of the loss in the event that the obligation is not fulfilled by the obligor and, where applicable, to fund a part of the credit facility. We retain the contractual relationship with the obligor, and the sub-participant has only an indirect relationship. We only enter into sub-participation agreements with banks to which we ascribe a credit rating equal to or better than that of the obligor.
Furthermore, we provide representations, warranties and indemnifications to third parties in the normal course of business.
Financial and operating performance
Off-balance sheet
Guarantees, commitments and forward starting transactions |
| | | | | | | | |
The table below shows the maximum irrevocable amount of guarantees, commitments and forward starting transactions |
| | | | | | | | |
| | 31.12.15 | | 31.12.14 |
CHF million | | Gross | Sub-participations | Net | | Gross | Sub-participations | Net |
Guarantees | | | | | | | | |
Credit guarantees and similar instruments | | 6,708 | (315) | 6,393 | | 7,126 | (346) | 6,780 |
Performance guarantees and similar instruments | | 3,035 | (699) | 2,336 | | 3,285 | (706) | 2,579 |
Documentary credits | | 6,276 | (1,707) | 4,569 | | 7,283 | (1,740) | 5,543 |
Total guarantees | | 16,019 | (2,721) | 13,298 | | 17,694 | (2,792) | 14,902 |
Loan commitments | | 56,067 | (1,559) | 54,508 | | 50,688 | (1,256) | 49,431 |
Forward starting transactions¹ | | | | | | | | |
Reverse repurchase agreements | | 6,577 | | | | 10,304 | | |
Securities borrowing agreements | | 6 | | | | 125 | | |
Repurchase agreements | | 6,323 | | | | 5,368 | | |
1 Cash to be paid in the future by either UBS or the counterparty. |
Clearing house and exchange memberships
We are a member of numerous securities and derivative exchanges and clearing houses. In connection with some of those memberships, we may be required to pay a share of the financial obligations of another member who defaults or we may be otherwise exposed to additional financial obligations. While the membership rules vary, obligations generally would arise only if the exchange or clearing house had exhausted its resources. We consider the probability of a material loss due to such obligations to be remote.
Swiss deposit insurance
Swiss banking law and the deposit insurance system require Swiss banks and securities dealers to jointly guarantee an amount of up to CHF 6 billion for privileged client deposits in the event that a Swiss bank or securities dealer becomes insolvent. The Swiss Financial Market Supervisory Authority (FINMA) estimates our share in the deposit insurance system to be CHF 0.9 billion. The deposit insurance is a guarantee and exposes us to additional risk. This is not reflected in the table above due to its unique characteristics. As of 31 December 2015, we considered the probability of a material loss from our obligation to be remote.
Contractual obligations
The table below summarizes payments due by period under contractual obligations as of 31 December 2015.
All contracts included in this table, with the exception of purchase obligations (i.e., those in which we are committed to purchasing determined volumes of goods and services), are either recognized as liabilities on our balance sheet or, in the case of operating leases, disclosed in “Note 33 Operating leases and finance leases” in the “Consolidated financial statements” section of this report.
Contractual obligations | | | | | | |
| | Payment due by period |
CHF million | | Within 1 year | 1–3 years | 3–5 years | Over 5 years | Total |
Long-term debt obligations | | 55,186 | 35,320 | 17,316 | 44,293 | 152,116 |
Finance lease obligations | | 15 | 18 | 5 | 0 | 38 |
Operating lease obligations | | 746 | 1,250 | 894 | 1,869 | 4,759 |
Purchase obligations | | 1,556 | 1,269 | 397 | 589 | 3,811 |
Total | | 57,503 | 37,858 | 18,612 | 46,751 | 160,725 |
Long-term debt obligations as of 31 December 2015 were CHF 152 billion and consisted of financial liabilities designated at fair value (CHF 68 billion) and long-term debt issued (CHF 84 billion) and represent both estimated future interest and principal payments on an undiscounted basis. Refer to “Note 27b Maturity analysis of financial liabilities” in the “Consolidated financial statements” section of this report for more information. Approximately half of total long-term debt obligations had a variable rate of interest. Amounts due on interest rate swaps used to hedge interest rate risk inherent in fixed-rate debt issued, and designated in fair value hedge accounting relationships, are not included in the table on the previous page. The notional amount of these interest rate swaps was CHF 48 billion as of 31 December 2015. Financial liabilities designated at fair value mostly consist of structured notes and are generally economically hedged, but it would not be practicable to estimate the amount and / or timing of the payments on interest swaps used to hedge these instruments as interest rate risk inherent in respective liabilities is generally risk managed on a portfolio level.
Within purchase obligations, the obligation to employees under mandatory notice periods is excluded (i.e., the period in which we must pay contractually agreed salaries to employees leaving the firm).
Our liabilities recognized on the balance sheet as Due to banks, Cash collateral on securities lent, Repurchase agreements, Trading portfolio liabilities, Negative replacement values, Cash collateral payables on derivative instruments, Due to customers, Provisions and Other liabilities are excluded from the table on the previous page. Refer to the respective Notes in the “Consolidated financial statements” section of this report for more information on these liabilities.
Financial and operating performance
Cash flow
Cash flows
As a global financial institution, our cash flows are complex and often may bear little relation to our net earnings and net assets. Consequently, we believe that a traditional cash flow analysis is less meaningful in evaluating our liquidity position than the liquidity, funding and capital management frameworks and measures described within the “Risk, treasury and capital management” section of this report.
Statement of cash flows (condensed) | | | |
| | For the year ended |
CHF million | | 31.12.15 | 31.12.14 |
Net cash flow from / (used in) operating activities | | 3,109 | 7,205 |
Net cash flow from / (used in) investing activities | | (8,441) | 2,596 |
Net cash flow from / (used in) financing activities | | (6,595) | 2,108 |
Effects of exchange rate differences on cash and cash equivalents | | (1,742) | 8,522 |
Net increase / (decrease) in cash and cash equivalents | | (13,670) | 20,430 |
Cash and cash equivalents at the end of the year | | 103,044 | 116,715 |
2015
As of 31 December 2015, cash and cash equivalents totaled CHF 103.0 billion, a decrease of CHF 13.7 billion from 31 December 2014, driven by net cash outflows from investing and financing activities, as described below, as well as foreign currency translation effects of CHF 1.7 billion.
Operating activities
In 2015, net cash inflows from operating activities were CHF 3.1 billion, mainly reflecting net operating cash inflows (before changes in operating assets and liabilities and income taxes paid, net of refunds) of CHF 7.0 billion, partly offset by net cash outflows of CHF 3.4 billion resulting from an overall decrease in operating liabilities which more than offset a net decrease in operating assets. Net operating cash inflows of CHF 7.0 billion (before changes in operating assets and liabilities and income taxes paid, net of refunds) were comprised of the net profit of CHF 6.4 billion and non-cash adjusting items which were largely offsetting. Net cash outflows related to changes in operating assets and liabilities of CHF 3.4 billion were attributable to a reduction in customer deposits of CHF 18.4 billion and outflows of CHF 5.6 billion resulting from securities financing transactions, partly offset by net cash inflows of CHF 7.8 billion from an increase in Other liabilities, namely prime brokerage payables, a reduction of CHF 8.1 billion in trading portfolio assets and a decrease of CHF 3.3 billion of cash collateral receivables on derivative instruments, net of payables.
In 2014, net cash inflows from operating activities of CHF 7.2 billion were primarily driven by significant reductions in cash collateral on securities borrowed and reverse repurchase agreements, which resulted in a net cash inflow of CHF 32.3 billion, and a net cash inflow from customer deposits of CHF 8.8 billion, partly offset by a net cash outflow of CHF 20.4 billion from an increase in loans, as well as other net cash outflows.
Investing activities
Investing activities resulted in a net cash outflow of CHF 8.4 billion in 2015, primarily related to a net cash outflow of CHF 7.6 billion related to net increases in financial investments classified as available-for-sale.
Compared with 2014, the net cash flow from investing activities declined to a net outflow of CHF 8.4 billion from a net inflow of CHF 2.6 billion, mainly related to the aforementioned increase in financial investments classified as available-for-sale.
Financing activities
Financing activities resulted in a net cash outflow of CHF 6.6 billion in 2015, mainly due to net redemptions of short-term debt of CHF 6.4 billion and the distribution of capital contribution reserves to shareholders of CHF 2.8 billion, partly offset by net issuances of long-term debt, including financial liabilities designated at fair value, of CHF 3.6 billion.
Compared with 2014, the net cash flow from financing activities decreased to a net outflow of CHF 6.6 billion from a net inflow of CHF 2.1 billion, mainly due to a CHF 3.5 billion increase in net redemptions of short-term debt, CHF 3.2 billion lower net issuances of long-term debt and a CHF 1.8 billion higher distribution of capital contribution reserves to shareholders.
Wealth Management
Profit before tax was CHF 2,689 million in 2015 compared with CHF 2,326 million in 2014. Adjusted profit before tax increased by CHF 317 million to CHF 2,828 million, mainly due to a CHF 290 million lower net charge for provisions for litigation, regulatory and similar matters and CHF 70 million higher operating income, mainly due to higher net interest income. Adjusted net new money inflows were CHF 22.8 billion compared with CHF 34.4 billion, resulting in a net new money growth rate of 2.3% compared with 3.9%.
Wealth Management¹ |
| | As of or for the year ended | | % change from |
CHF million, except where indicated | | 31.12.15 | 31.12.14 | 31.12.13 | | 31.12.14 |
Net interest income | | 2,326 | 2,165 | 2,061 | | 7 |
Recurring net fee income | | 3,820 | 3,783 | 3,567 | | 1 |
Transaction-based income | | 1,778 | 1,928 | 1,887 | | (8) |
Other income | | 231 | 25 | 57 | | 824 |
Income | | 8,155 | 7,902 | 7,573 | | 3 |
Credit loss (expense) / recovery | | 0 | (1) | (10) | | (100) |
Total operating income | | 8,155 | 7,901 | 7,563 | | 3 |
Personnel expenses | | 2,532 | 2,467 | 2,433 | | 3 |
General and administrative expenses | | 637 | 918 | 708 | | (31) |
Services (to) / from other business divisions and Corporate Center | | 2,289 | 2,180 | 2,165 | | 5 |
of which: services from CC – Services | | 2,209 | 2,122 | 2,074 | | 4 |
Depreciation and impairment of property, equipment and software | | 5 | 4 | 3 | | 25 |
Amortization and impairment of intangible assets | | 3 | 5 | 7 | | (40) |
Total operating expenses² | | 5,465 | 5,574 | 5,316 | | (2) |
Business division operating profit / (loss) before tax | | 2,689 | 2,326 | 2,247 | | 16 |
| | | | | | |
Key performance indicators³ | | | | | | |
Pre-tax profit growth (%) | | 15.6 | 3.5 | (6.6) | | |
Cost / income ratio (%) | | 67.0 | 70.5 | 70.2 | | |
Net new money growth (%)⁴ | | 2.3 | 3.9 | 4.4 | | |
Gross margin on invested assets (bps) | | 86 | 85 | 88 | | 1 |
Net margin on invested assets (bps) | | 28 | 25 | 26 | | 12 |
Financial and operating performance
Wealth Management
Wealth Management (continued)¹ |
| | As of or for the year ended | | % change from |
CHF million, except where indicated | | 31.12.15 | 31.12.14 | 31.12.13 | | 31.12.14 |
| | | | | | |
Additional information | | | | | | |
Recurring income⁵ | | 6,146 | 5,949 | 5,628 | | 3 |
Recurring income as a percentage of income (%) | | 75.4 | 75.3 | 74.3 | | |
Average attributed equity (CHF billion)⁶ | | 3.5 | 3.4 | 3.5 | | 3 |
Return on attributed equity (%) | | 77.4 | 67.9 | 64.2 | | |
Risk-weighted assets (fully applied, CHF billion)⁷ | | 25.3 | 25.4 | 20.9 | | 0 |
Risk-weighted assets (phase-in, CHF billion)⁷ | | 25.3 | 25.8 | 21.4 | | (2) |
Return on risk-weighted assets, gross (%)⁸ | | 31.5 | 33.8 | 38.7 | | |
Leverage ratio denominator (fully applied, CHF billion)⁹ | | 119.0 | 138.3 | 122.1 | | (14) |
Goodwill and intangible assets (CHF billion) | | 1.3 | 1.4 | 1.3 | | (7) |
Net new money (CHF billion) | | 12.9 | 34.4 | 35.9 | | |
Net new money adjusted (CHF billion)¹⁰ | | 22.8 | 34.4 | 35.9 | | |
Invested assets (CHF billion) | | 947 | 987 | 886 | | (4) |
Client assets (CHF billion) | | 1,122 | 1,160 | 1,023 | | (3) |
Loans, gross (CHF billion) | | 105.2 | 112.7 | 96.8 | | (7) |
Due to customers (CHF billion) | | 172.3 | 191.3 | 189.4 | | (10) |
Personnel (full-time equivalents) | | 10,239 | 10,337 | 9,988 | | (1) |
Client advisors (full-time equivalents) | | 4,019 | 4,250 | 4,164 | | (5) |
1 Comparative figures in this table may differ from those originally published in quarterly and annual reports due to adjustments following organizational changes, restatements due to the retrospective adoption of new accounting standards or changes in accounting policies, and events after the reporting period. 2 Refer to "Note 32 Changes in organization and disposals" in the "Consolidated financial statements" section of this report for information on restructuring expenses. 3 Refer to the "Measurement of performance" section of this report for the definitions of our key performance indicators. 4 Based on adjusted net new money. 5 Recurring income consists of net interest income and recurring net fee income. 6 Refer to the "Capital management" section of this report for more information on the equity attribution framework. 7 Based on the Basel III framework as applicable for Swiss systemically relevant banks (SRBs). 8 Based on phase-in risk-weighted assets. 9 Calculated in accordance with Swiss SRB rules. From 31 December 2015 onwards, the leverage ratio denominator calculation is fully aligned with the BIS Basel III rules. Prior-period figures are calculated in accordance with former Swiss SRB rules and are therefore not fully comparable. Refer to the "Capital management" section of this report for more information. 10 Adjusted net new money excludes the negative effect on net new money in 2015 of CHF 9.9 billion from our balance sheet and capital optimization program. |
Regional breakdown of key figures¹˒² |
As of or for the year ended 31.12.15 | Europe | Asia Pacific | Switzerland | Emerging markets | of which: ultra high net worth | of which: Global Family Office³ |
Net new money (CHF billion) | 1.9 | 13.7 | 3.6 | (5.7) | 16.5 | (0.6) |
Net new money adjusted (CHF billion)⁴ | 3.5 | 15.7 | 5.5 | (1.4) | 23.4 | 1.0 |
Net new money growth (%)⁵ | 1.0 | 5.8 | 3.1 | (0.8) | 4.7 | 1.4 |
Invested assets (CHF billion) | 343 | 272 | 174 | 156 | 505 | 76 |
Gross margin on invested assets (bps) | 80 | 78 | 92 | 96 | 56 | 42⁶ |
Client advisors (full-time equivalents) | 1,367 | 1,092 | 771 | 705 | 728⁷ | |
1 Refer to the "Measurement of performance” section of this report for the definitions of our key performance indicators. 2 Based on the Wealth Management business area structure, and excluding minor functions with 84 client advisors, CHF 2 billion of invested assets, and CHF 0.5 billion of adjusted net new money outflows in 2015. 3 Joint venture between Wealth Management and the Investment Bank. Global Family Office is reported as a sub-segment of ultra high net worth and is included in the ultra high net worth figures. 4 Adjusted net new money excludes the negative effect on net new money from our balance sheet and capital optimization program. 5 Based on adjusted net new money. 6 Gross margin includes income booked in the Investment Bank. Gross margin only based on income booked in Wealth Management is 25 basis points. 7 Represents client advisors who exclusively serve ultra high net worth clients. In addition to these, other client advisors may also serve certain ultra high net worth clients, but not exclusively. |
2015 compared with 2014
Results
Operating income
Total operating income increased by CHF 254 million to CHF 8,155 million. Excluding net gains of CHF 169 million on the sale of subsidiaries and businesses and a CHF 15 million gain related to our investment in the SIX Group, adjusted operating income increased by CHF 70 million to CHF 7,971 million, mainly due to higher net interest income and recurring net fee income, partly offset by lower transaction-based income.
Net interest income increased by CHF 161 million to CHF 2,326 million, mainly due to higher lending revenues and an increase in allocated revenues from Corporate Center – Group Asset and Liability Management (Group ALM).
Recurring net fee income increased by CHF 37 million to CHF 3,820 million, reflecting the positive effects of a continued increase in discretionary and advisory mandate penetration and pricing measures, partly offset by lower income due to the ongoing effects of cross-border outflows.
Transaction-based income decreased by CHF 150 million to CHF 1,778 million across all regions, mainly due to reduced client activity, most notably in Europe and emerging markets. The overall decrease was mainly related to investment funds, fixed income cash products and structured products, partly offset by higher foreign exchange trading and mandate revenues. Transaction-based revenues allocated from Group ALM also decreased. These decreases were partly offset by a fee of CHF 45 million received from Personal & Corporate Banking for the shift of certain clients from Wealth Management to Personal & Corporate Banking as a result of a detailed client segmentation review.
Other income increased by CHF 206 million to CHF 231 million, mainly related to the aforementioned net gains.
Operating expenses
Total operating expenses decreased by CHF 109 million to CHF 5,465 million. Excluding restructuring expenses of CHF 323 million compared with CHF 185 million, adjusted operating expenses decreased by CHF 247 million to CHF 5,142 million, mainly as the net charge for provisions for litigation, regulatory and similar matters declined to CHF 104 million from CHF 394 million.
Personnel expenses increased by CHF 65 million to CHF 2,532 million. Excluding restructuring expenses of CHF 20 million compared with CHF 18 million, adjusted personnel expenses increased by CHF 63 million, mainly due to higher pension-related costs and increased expenses for variable compensation, as well as salary increases, partly offset by favorable foreign currency translation effects and the effect of personnel reductions.
General and administrative expenses decreased by CHF 281 million to CHF 637 million. Excluding restructuring expenses of CHF 38 million compared with CHF 48 million, adjusted general and administrative expenses decreased by CHF 271 million, mainly due to the aforementioned decreased net charge for provisions for litigation, regulatory and similar matters.
Net expenses for services from other business divisions and Corporate Center increased by CHF 109 million to CHF 2,289 million. Excluding restructuring expenses of CHF 265 million compared with CHF 119 million, adjusted net expenses for services decreased by CHF 37 million to CHF 2,024 million, mainly due to lower expenses from Group Operations and Group Corporate Services, partly offset by higher expenses from Group ALM.
® Refer to the "Significant accounting and financial reporting changes" section of this report for more information on the change in presentation of service allocations from Corporate Center – Services to business divisions and other Corporate Center units
Cost / income ratio
The cost / income ratio was 67.0% compared with 70.5%. On an adjusted basis, the cost / income ratio was 64.5% compared with 68.2% and was within our target range of 55% to 65%.
Net new money
Adjusted net new money, which excludes net outflows of CHF 9.9 billion from our balance sheet and capital optimization program, was CHF 22.8 billion and was driven by inflows in Asia Pacific, Switzerland and Europe, partly offset by outflows in emerging markets. This resulted in a net new money growth rate of 2.3% compared with 3.9%, below our target range of 3% to 5%. Adjusted net new money was negatively affected by client de-leveraging and cross-border outflows. On a global basis, adjusted net new money from ultra high net worth clients was CHF 23.4 billion compared with CHF 29.8 billion. On a reported basis, total net new money was CHF 12.9 billion compared with CHF 34.4 billion. For 2016, we expect to be able to absorb the currently anticipated headwinds, including cross-border-related outflows, within our net new money target growth range of 3% to 5%.
Invested assets
Invested assets decreased by CHF 40 billion to CHF 947 billion as of 31 December 2015 due to negative foreign currency translation effects of CHF 25 billion, a CHF 16 billion reduction due to the aforementioned sale of subsidiaries and businesses that did not affect net new money, and negative market performance of CHF 9 billion, partly offset by net new money inflows of CHF 13 billion, which include the net outflows of CHF 10 billion from our balance sheet and capital optimization program. Mandate penetration increased to 26.4% of invested assets as of 31 December 2015 compared with 24.4% as of 31 December 2014.
Financial and operating performance
Wealth Management
Margins on invested assets
The net margin on invested assets increased 3 basis points to 28 basis points. On an adjusted basis, the net margin on invested assets increased 3 basis points to 30 basis points. The gross margin on invested assets increased 1 basis point to 86 basis points and decreased 1 basis point to 84 basis points on an adjusted basis.
Personnel
Wealth Management employed 10,239 personnel as of 31 December 2015 compared with 10,337 as of 31 December 2014.
The number of client advisors decreased by 231 to 4,019 with reductions in Europe, Asia Pacific and emerging markets, mainly due to a reduction in the number of lower-producing advisors and the reclassification of certain staff from client advisors to non-client facing staff.
The number of non-client facing staff increased by 133 to 6,220, mainly due to hiring for our strategic and regulatory priorities, the shift of a team of real estate financing experts from Personal & Corporate Banking to Wealth Management, and the aforementioned reclassification, partly offset by the effect of the sale of subsidiaries and businesses in 2015.
® Refer to the "Significant accounting and financial reporting changes" section of this report for more information on personnel allocations from Corporate Center – Services to business divisions and other Corporate Center units
Balance sheet and capital optimization program
In the first half of 2015, Wealth Management launched a global program intended to optimize its leverage ratio denominator (LRD) and liquidity coverage ratio (LCR), adapting its business to the new regulatory and interest rate environments. The program was launched to mitigate the impact of reduced and, in some cases, negative interest rates on our performance, particularly given the associated cost of maintaining the high-quality liquid assets (HQLA) required to cover regulatory outflow assumptions embedded in the LCR. We have changed pricing for a number of clients with a high proportion of short-term deposits relative to invested assets, particularly focusing on non-operational deposits. We offered these clients options to redeploy deposit balances into cash alternatives and investment products, or consider repricing their existing products. The vast majority of these clients have chosen to retain their relationship with us, but we recorded a reduction in customer deposits of CHF 14 billion from affected clients. In the second and third quarter, we recorded total net new money outflows of CHF 9.9 billion, which we have treated as an adjusting item.
In the aggregate, the program has reduced the LRD and HQLA requirements for our business. The clients in scope for this program generated minimal economic profit for the bank, and subsequent to our efforts, economic profit on retained relationships has materially improved.
2014 compared with 2013
Results
Operating income
Total operating income was CHF 7,901 million compared with CHF 7,563 million, primarily due to higher recurring net fee income and net interest income.
Net interest income increased by CHF 104 million to CHF 2,165 million, mainly due to higher net interest income from Lombard loans and mortgages as well as a positive effect from methodology changes in the allocation of liquidity and funding costs and benefits for loans and deposits between Wealth Management and Corporate Center – Group Asset and Liability Management (Group ALM). These effects were partly offset by lower net interest income from client deposits and lower allocated revenues from Group ALM.
Recurring net fee income increased by CHF 216 million to CHF 3,783 million, primarily due to an increase in invested assets, the positive effect of pricing measures and continued growth in discretionary and advisory mandates. These increases were partly offset by lower income due to ongoing outflows of assets from cross-border clients and the migration into retrocession-free products for investment mandates during 2013.
Transaction-based income increased by CHF 41 million to CHF 1,928 million. The overall increase was mainly related to structured products, mandates, wealth planning services and hedge funds, partly offset by lower income from foreign exchange trading and investment funds. In addition, 2014 included first-time fees paid to Personal & Corporate Banking for net client shifts and referrals.
Other income decreased by CHF 32 million to CHF 25 million, mainly due to a decline in revenues for other services and as the prior year included a gain of CHF 25 million related to the divestment of our participation in Euroclear Plc.
Operating expenses
Total operating expenses were CHF 5,574 million, an increase of CHF 258 million from the prior year. Excluding restructuring expenses of CHF 185 million compared with CHF 178 million, adjusted operating expenses increased by CHF 251 million to CHF 5,389 million, mainly due to an increased net charge for provisions for litigation, regulatory and similar matters to CHF 394 million from CHF 89 million, while the prior year included a charge in relation to the Swiss-UK tax agreement of CHF 107 million.
Personnel expenses increased by CHF 34 million to CHF 2,467 million. Excluding restructuring expenses of CHF 18 million compared with CHF 40 million, adjusted personnel expenses increased by CHF 56 million, mainly due to salary increases, higher variable compensation expenses and staff hiring, partly offset by reduced pension-related expenses.
General and administrative expenses increased by CHF 210 million to CHF 918 million. Excluding restructuring expenses of CHF 48 million compared with CHF 35 million, adjusted general and administrative expenses increased by CHF 197 million, mainly due to the aforementioned increased net charge for provisions for litigation, regulatory and similar matters, while the prior year included a charge in relation to the aforementioned Swiss-UK tax agreement.
Net expenses for services from other business divisions and Corporate Center increased by CHF 15 million to CHF 2,180 million. Excluding restructuring expenses of CHF 119 million compared with CHF 104 million, adjusted net expenses were unchanged at CHF 2,061 million. Higher charges from Group Technology and Group Operations were offset by reduced charges from Personal & Corporate Banking, lower pension-related expenses and lower charges from Group Corporate Services.
® Refer to the "Significant accounting and financial reporting changes" section of this report for more information on the change in presentation of service allocations from Corporate Center – Services to business divisions and other Corporate Center units
Cost / income ratio
The cost / income ratio was 70.5% compared with 70.2%. The adjusted cost / income ratio was 68.2% compared with 67.8%.
Net new money
The net new money growth rate decreased to 3.9% from 4.4% and was within our target range of 3% to 5%. Net new money was CHF 34.4 billion with the strongest net inflows in Asia Pacific, followed by Switzerland and emerging markets. Net outflows in Europe mainly reflected cross-border asset outflows, partly offset by net inflows from domestic markets. On a global basis, net new money from ultra high net worth clients was CHF 29.8 billion compared with CHF 33.6 billion.
Financial and operating performance
Wealth Management
Invested assets
Invested assets were CHF 987 billion as of 31 December 2014, representing an increase of CHF 101 billion from 31 December 2013, due to positive market performance of CHF 38 billion, net new money inflows of CHF 34 billion and positive foreign currency translation effects of CHF 32 billion.
Margins on invested assets
The net margin on invested assets decreased 1 basis point to 25 basis points. On an adjusted basis, the net margin on invested assets decreased 1 basis point to 27 basis points. The gross margin on invested assets decreased 3 basis points to 85 basis points on both a reported and an adjusted basis.
Personnel
Wealth Management employed 10,337 personnel as of 31 December 2014 compared with 9,988 as of 31 December 2013, reflecting an increase in both non-client facing staff and client advisors.
The number of client advisors increased by 86 to 4,250, mainly reflecting an increase in Asia Pacific, our key strategic growth area, partly offset by reductions in Europe. The number of non-client facing staff increased by 263 to 6,087, mainly due to staff hires for our strategic and regulatory priorities.
® Refer to the "Significant accounting and financial reporting changes" section of this report for more information on personnel allocations from Corporate Center – Services to business divisions and other Corporate Center units
Wealth Management Americas
Profit before tax was USD 754 million compared with USD 981 million, mainly reflecting a higher net charge for provisions for litigation, regulatory and similar matters, and other provisions. Adjusted profit before tax decreased to USD 874 million from USD 1,030 million. Net new money inflows were USD 21.4 billion compared with USD 10.0 billion in the prior year, resulting in a net new money growth rate of 2.1% compared with 1.0%.
Wealth Management Americas – in US dollars¹ |
| | As of or for the year ended | | % change from |
USD million, except where indicated | | 31.12.15 | 31.12.14 | 31.12.13 | | 31.12.14 |
Net interest income | | 1,215 | 1,067 | 1,014 | | 14 |
Recurring net fee income | | 4,795 | 4,666 | 4,109 | | 3 |
Transaction-based income | | 1,614 | 1,825 | 1,946 | | (12) |
Other income | | 32 | 33 | 36 | | (3) |
Income | | 7,657 | 7,590 | 7,105 | | 1 |
Credit loss (expense) / recovery | | (4) | 16 | (30) | | |
Total operating income | | 7,653 | 7,606 | 7,075 | | 1 |
Personnel expenses | | 4,746 | 4,741 | 4,439 | | 0 |
Financial advisor compensation² | | 2,921 | 2,944 | 2,708 | | (1) |
Compensation commitments with recruited financial advisors³ | | 761 | 733 | 690 | | 4 |
Salaries and other personnel costs | | 1,064 | 1,063 | 1,041 | | 0 |
General and administrative expenses | | 845 | 597 | 415 | | 42 |
Services (to) / from other business divisions and Corporate Center | | 1,252 | 1,234 | 1,239 | | 1 |
of which: services from CC – Services | | 1,236 | 1,217 | 1,220 | | 2 |
Depreciation and impairment of property, equipment and software | | 3 | 0 | 0 | | |
Amortization and impairment of intangible assets | | 53 | 52 | 53 | | 2 |
Total operating expenses⁴ | | 6,899 | 6,625 | 6,147 | | 4 |
Business division operating profit / (loss) before tax | | 754 | 981 | 927 | | (23) |
| | | | | | |
Key performance indicators⁵ | | | | | | |
Pre-tax profit growth (%) | | (23.1) | 5.8 | 45.3 | | |
Cost / income ratio (%) | | 90.1 | 87.3 | 86.5 | | |
Net new money growth (%) | | 2.1 | 1.0 | 2.3 | | |
Gross margin on invested assets (bps) | | 74 | 76 | 79 | | (3) |
Net margin on invested assets (bps) | | 7 | 10 | 10 | | (30) |
|
Financial and operating performance
Wealth Management Americas
Wealth Management Americas – in US dollars (continued)¹ |
| | As of or for the year ended | | % change from |
USD million, except where indicated | | 31.12.15 | 31.12.14 | 31.12.13 | | 31.12.14 |
| | | | | | |
Additional information | | | | | | |
Recurring income⁶ | | 6,010 | 5,733 | 5,122 | | 5 |
Recurring income as a percentage of income (%) | | 78.5 | 75.5 | 72.1 | | |
Average attributed equity (USD billion)⁷ | | 2.6 | 2.9 | 3.0 | | (10) |
Return on attributed equity (%) | | 29.3 | 33.8 | 30.9 | | |
Risk-weighted assets (fully applied, USD billion)⁸ | | 21.9 | 21.8 | 27.3 | | 0 |
Risk-weighted assets (phase-in, USD billion)⁸ | | 21.9 | 22.0 | 27.5 | | 0 |
Return on risk-weighted assets, gross (%)⁹ | | 33.9 | 29.2 | 30.0 | | |
Leverage ratio denominator (fully applied, USD billion)¹⁰ | | 62.8 | 63.7 | 64.1 | | (1) |
Goodwill and intangible assets (USD billion) | | 3.7 | 3.8 | 3.8 | | (3) |
Net new money (USD billion) | | 21.4 | 10.0 | 19.0 | | |
Net new money including interest and dividend income (USD billion)¹¹ | | 47.8 | 37.2 | 44.2 | | |
Invested assets (USD billion) | | 1,033 | 1,032 | 970 | | 0 |
Client assets (USD billion) | | 1,084 | 1,087 | 1,025 | | 0 |
Loans, gross (USD billion) | | 48.7 | 44.6 | 39.1 | | 9 |
Due to customers (USD billion) | | 83.1 | 73.5 | 67.3 | | 13 |
Recruitment loans to financial advisors | | 3,179 | 2,925 | 3,063 | | 9 |
Other loans to financial advisors | | 418 | 374 | 401 | | 12 |
Personnel (full-time equivalents) | | 13,611 | 13,322 | 13,545 | | 2 |
Financial advisors (full-time equivalents) | | 7,140 | 6,997 | 7,137 | | 2 |
1 Comparative figures in this table may differ from those originally published in quarterly and annual reports due to adjustments following organizational changes, restatements due to the retrospective adoption of new accounting standards or changes in accounting policies, and events after the reporting period. 2 Financial advisor compensation consists of grid-based compensation based directly on compensable revenues generated by financial advisors and supplemental compensation calculated based on financial advisor productivity, firm tenure, assets and other variables. 3 Compensation commitments with recruited financial advisors represents charges related to compensation commitments granted to financial advisors at the time of recruitment which are subject to vesting requirements. 4 Refer to "Note 32 Changes in organization and disposals" in the "Consolidated financial statements" section of this report for information on restructuring expenses. 5 Refer to the "Measurement of performance" section of this report for the definitions of our key performance indicators. 6 Recurring income consists of net interest income and recurring net fee income. 7 Refer to the "Capital management" section of this report for more information on the equity attribution framework. 8 Based on the Basel III framework as applicable for Swiss systemically relevant banks (SRBs). 9 Based on phase-in risk-weighted assets. 10 Calculated in accordance with Swiss SRB rules. From 31 December 2015 onwards, the leverage ratio denominator calculation is fully aligned with the BIS Basel III rules. Prior-period figures are calculated in accordance with former Swiss SRB rules and are therefore not fully comparable. Refer to the "Capital management" section of this report for more information. 11 Presented in line with historical reporting practice in the US market. |
Wealth Management Americas – in Swiss francs¹ |
| | As of or for the year ended | | % change from |
CHF million, except where indicated | | 31.12.15 | 31.12.14 | 31.12.13 | | 31.12.14 |
Net interest income | | 1,174 | 983 | 936 | | 19 |
Recurring net fee income | | 4,623 | 4,294 | 3,796 | | 8 |
Transaction-based income | | 1,555 | 1,678 | 1,800 | | (7) |
Other income | | 31 | 30 | 33 | | 3 |
Income | | 7,384 | 6,984 | 6,565 | | 6 |
Credit loss (expense) / recovery | | (4) | 15 | (27) | | |
Total operating income | | 7,381 | 6,998 | 6,538 | | 5 |
Personnel expenses | | 4,579 | 4,363 | 4,102 | | 5 |
Financial advisor compensation² | | 2,817 | 2,710 | 2,503 | | 4 |
Compensation commitments with recruited financial advisors³ | | 735 | 675 | 638 | | 9 |
Salaries and other personnel costs | | 1,027 | 979 | 962 | | 5 |
General and administrative expenses | | 822 | 550 | 383 | | 49 |
Services (to) / from other business divisions and Corporate Center | | 1,209 | 1,137 | 1,145 | | 6 |
of which: services from CC – Services | | 1,193 | 1,121 | 1,127 | | 6 |
Depreciation and impairment of property, equipment and software | | 3 | 0 | 0 | | |
Amortization and impairment of intangible assets | | 51 | 48 | 49 | | 6 |
Total operating expenses⁴ | | 6,663 | 6,099 | 5,680 | | 9 |
Business division operating profit / (loss) before tax | | 718 | 900 | 858 | | (20) |
| | | | | | |
Key performance indicators⁵ | | | | | | |
Pre-tax profit growth (%) | | (20.2) | 4.9 | 43.7 | | |
Cost / income ratio (%) | | 90.2 | 87.3 | 86.5 | | |
Net new money growth (%) | | 2.1 | 1.1 | 2.3 | | |
Gross margin on invested assets (bps) | | 74 | 76 | 79 | | (3) |
Net margin on invested assets (bps) | | 7 | 10 | 10 | | (30) |
| | | | | | |
Additional information | | | | | | |
Recurring income⁶ | | 5,798 | 5,276 | 4,732 | | 10 |
Recurring income as a percentage of income (%) | | 78.5 | 75.5 | 72.1 | | |
Average attributed equity (CHF billion)⁷ | | 2.5 | 2.7 | 2.8 | | (7) |
Return on attributed equity (%) | | 29.0 | 33.6 | 30.9 | | |
Risk-weighted assets (fully applied, CHF billion)⁸ | | 21.9 | 21.7 | 24.3 | | 1 |
Risk-weighted assets (phase-in, CHF billion)⁸ | | 21.9 | 21.9 | 24.5 | | 0 |
Return on risk-weighted assets, gross (%)⁹ | | 33.7 | 29.4 | 30.0 | | |
Leverage ratio denominator (fully applied, CHF billion)¹⁰ | | 62.9 | 63.3 | 57.2 | | (1) |
Goodwill and intangible assets (CHF billion) | | 3.7 | 3.7 | 3.4 | | 0 |
Net new money (CHF billion) | | 21.3 | 9.6 | 17.6 | | |
Net new money including interest and dividend income (CHF billion)¹¹ | | 46.9 | 35.0 | 40.8 | | |
Invested assets (CHF billion) | | 1,035 | 1,027 | 865 | | 1 |
Client assets (CHF billion) | | 1,085 | 1,081 | 914 | | 0 |
Loans, gross (CHF billion) | | 48.8 | 44.4 | 34.8 | | 10 |
Due to customers (CHF billion) | | 83.2 | 73.1 | 60.0 | | 14 |
Recruitment loans to financial advisors | | 3,184 | 2,909 | 2,733 | | 9 |
Other loans to financial advisors | | 418 | 372 | 358 | | 12 |
Personnel (full-time equivalents) | | 13,611 | 13,322 | 13,545 | | 2 |
Financial advisors (full-time equivalents) | | 7,140 | 6,997 | 7,137 | | 2 |
1 Comparative figures in this table may differ from those originally published in quarterly and annual reports due to adjustments following organizational changes, restatements due to the retrospective adoption of new accounting standards or changes in accounting policies, and events after the reporting period. 2 Financial advisor compensation consists of grid-based compensation based directly on compensable revenues generated by financial advisors and supplemental compensation calculated based on financial advisor productivity, firm tenure, assets and other variables. 3 Compensation commitments with recruited financial advisors represents charges related to compensation commitments granted to financial advisors at the time of recruitment which are subject to vesting requirements. 4 Refer to "Note 32 Changes in organization and disposals" in the "Consolidated financial statements" section of this report for information on restructuring expenses. 5 Refer to the "Measurement of performance" section of this report for the definitions of our key performance indicators. 6 Recurring income consists of net interest income and recurring net fee income. 7 Refer to the "Capital management" section of this report for more information on the equity attribution framework. 8 Based on the Basel III framework as applicable for Swiss systemically relevant banks (SRBs). 9 Based on phase-in risk-weighted assets. 10 Calculated in accordance with Swiss SRB rules. From 31 December 2015 onwards, the leverage ratio denominator calculation is fully aligned with the BIS Basel III rules. Prior-period figures are calculated in accordance with former Swiss SRB rules and are therefore not fully comparable. Refer to the "Capital management" section of this report for more information. 11 Presented in line with historical reporting practice in the US market. |
Financial and operating performance
Wealth Management Americas
2015 compared with 2014
Results
Operating income
Total operating income increased by USD 47 million to USD 7,653 million due to higher net interest income and continued growth in managed account fees, partly offset by lower transaction-based income and a net credit loss expense in 2015 compared with a net credit loss recovery in 2014.
Net interest income increased by USD 148 million to USD 1,215 million, reflecting continued growth in loan and deposit balances. The average mortgage portfolio balance increased 16% and the average securities-backed lending portfolio balance increased 12%.
Recurring net fee income increased by USD 129 million to USD 4,795 million, mainly due to increased managed account fees, reflecting higher invested asset levels.
Transaction-based income decreased by USD 211 million to USD 1,614 million, primarily due to lower client activity.
We incurred a net credit loss expense of USD 4 million compared with a net recovery of USD 16 million. The 2014 net recovery included the full release of a loan loss allowance for a single client as well as releases of loan loss allowances on securities-backed lending facilities collateralized by Puerto Rico municipal securities and related funds.
® Refer to the “Risk management and control” section of this report for more information on our exposure to Puerto Rico municipal securities and related funds
Operating expenses
Operating expenses increased by USD 274 million to USD 6,899 million. Excluding restructuring expenses of USD 141 million compared with USD 59 million, and a gain of USD 21 million compared with USD 10 million related to a change to retiree benefit plans in the US, adjusted operating expenses increased by USD 203 million to USD 6,779 million. This was primarily due to a USD 178 million higher net charge for provisions for litigation, regulatory and similar matters, and an increase in other provisions and legal fees, partly offset by lower expenses from Corporate Center – Services.
Excluding a gain of USD 20 million related to a change to retiree benefit plans in the US compared with USD 8 million, adjusted personnel expenses increased by USD 18 million to USD 4,766 million, mainly due to higher compensation commitments for recruited financial advisors, partly offset by lower financial advisor compensation, reflecting lower compensable revenues.
General and administrative expenses increased by USD 248 million to USD 845 million, mainly as the net charge for provisions for litigation, regulatory and similar matters increased to USD 356 million from USD 178 million. Furthermore, we recorded higher expenses for other provisions and increased legal fees.
Excluding restructuring expenses of USD 141 million, compared with USD 59 million, and a gain of USD 2 million for both years related to a change to retiree benefit plans, adjusted net expenses for services from other business divisions and Corporate Center decreased by USD 64 million to USD 1,113 million, reflecting lower expenses from Corporate Center – Services.
® Refer to the "Significant accounting and financial reporting changes" section of this report for more information on the change in presentation of service allocations from Corporate Center – Services to business divisions and other Corporate Center units
Cost / income ratio
The cost / income ratio was 90.1% compared with 87.3%. On an adjusted basis, the cost / income ratio was 88.5% compared with 86.6% and was above our target range of 75% to 85%.
Net new money
Net new money was USD 21.4 billion, reflecting strong inflows from advisors who have been with the firm for more than one year, as well as net inflows from newly recruited advisors. Net new money growth was 2.1% compared with 1.0%, within our target range of 2% to 4%. Including interest and dividend income, net new money inflows were USD 47.8 billion compared with USD 37.2 billion in the prior year.
Invested assets
Invested assets were USD 1,033 billion as of 31 December 2015, an increase of USD 1 billion from 31 December 2014, reflecting strong net new money inflows of USD 21 billion, mostly offset by negative market performance of USD 20 billion. Managed account assets increased by USD 5 billion to USD 351 billion, and comprised 34% of invested assets, unchanged from 31 December 2014.
Margins on invested assets
The net margin on invested assets was 7 basis points compared with 10 basis points and the adjusted net margin on invested assets decreased 2 basis points to 8 basis points. The gross margin on invested assets decreased 2 basis points to 74 basis points.
Personnel
As of 31 December 2015, Wealth Management Americas employed 13,611 personnel, an increase of 289 from 31 December 2014. Financial advisor headcount increased by 143 to 7,140, reflecting the hiring of experienced financial advisors and continued low financial advisor attrition. Non-financial advisor headcount increased by 146 to 6,471, due to an increase in financial advisor support staff.
® Refer to the "Significant accounting and financial reporting changes" section of this report for more information on personnel allocations from Corporate Center – Services to business divisions and other Corporate Center units
2014 compared with 2013
Results
Operating income
Total operating income increased by USD 531 million to USD 7,606 million due to continued growth in managed account fees within recurring net fee income and higher net interest income, partly offset by lower transaction-based income.
Net interest income increased by USD 53 million to USD 1,067 million due to continued growth in loan and deposit balances. The average mortgage portfolio balance increased 37% and the average securities-backed lending portfolio balance increased 12%.
Recurring net fee income increased by USD 557 million to USD 4,666 million, mainly due to a 21% increase in managed account fees, reflecting higher invested asset levels.
Transaction-based income decreased by USD 121 million to USD 1,825 million, mainly due to lower client activity.
We recorded a net credit loss recovery of USD 16 million compared with a net expense of USD 30 million in the prior year. The 2014 net recovery included the full release of a loan loss allowance for a single client as well as releases of loan loss allowances on securities-backed lending facilities collateralized by Puerto Rico municipal securities and related funds. The expenses in the prior year were largely due to loan loss allowances on securities-backed lending facilities collateralized by Puerto Rico municipal securities and related funds.
® Refer to the “Risk management and control” section of this report for more information on our exposure to Puerto Rico municipal securities and related funds
Operating expenses
Operating expenses increased by USD 478 million to USD 6,625 million from USD 6,147 million. Excluding restructuring expenses of USD 59 million compared with USD 64 million and a gain of USD 10 million related to a change to retiree benefit plans in the US, adjusted operating expenses increased by USD 493 million to USD 6,576 million. This was primarily due to higher financial advisor compensation, as well as a higher net charge for provisions for litigation, regulatory and similar matters.
Personnel expenses increased by USD 302 million to USD 4,741 million. Excluding a gain of USD 8 million related to changes to retiree benefit plans in the US in 2014, adjusted personnel expenses increased by USD 309 million to USD 4,748 million, mainly due to USD 236 million higher financial advisor compensation resulting from higher compensable revenues.
General and administrative expenses increased by USD 182 million to USD 597 million, mainly due to an increased net charge for provisions for litigation, regulatory and similar matters of USD 178 million compared with USD 36 million.
Excluding restructuring expenses of USD 59 million compared with USD 64 million, and a gain of USD 2 million in 2014 related to a change to retiree benefit plans, net expenses for services from other business divisions and Corporate Center increased by USD 2 million.
® Refer to the "Significant accounting and financial reporting changes" section of this report for more information on the change in presentation of service allocations from Corporate Center – Services to business divisions and other Corporate Center units
Cost / income ratio
The cost / income ratio was 87.3% compared with 86.5%. On an adjusted basis, the cost / income ratio was 86.6% compared with 85.6%.
Net new money
In 2014, net new money totaled USD 10.0 billion and was predominantly comprised of net inflows from financial advisors employed with UBS for more than one year. Net new money was USD 19.0 billion in the prior year. The net new money growth rate was 1.0% in 2014. Including interest and dividend income, net new money inflows were USD 37.2 billion compared with USD 44.2 billion in the prior year.
Invested assets
Invested assets were USD 1,032 billion as of 31 December 2014, an increase of USD 62 billion from 31 December 2013, reflecting positive market performance of USD 52 billion and net new money inflows of USD 10 billion. During 2014, managed account assets increased by USD 38 billion to USD 346 billion as of 31 December 2014, and comprised 34% of invested assets compared with 32% as of 31 December 2013.
Margins on invested assets
The net margin on invested assets was 10 basis points, unchanged from 2013 and the adjusted net margin on invested assets decreased 1 basis point to 10 basis points. The gross margin on invested assets decreased 3 basis points to 76 basis points.
Personnel
As of 31 December 2014, Wealth Management Americas employed 13,322 personnel, a decrease of 223 from 31 December 2013. Financial advisor headcount decreased by 140 to 6,997 mainly due to attrition of lower-producing advisors. Non-financial advisor headcount decreased by 83 to 6,325.
® Refer to the "Significant accounting and financial reporting changes" section of this report for more information on personnel allocations from Corporate Center – Services to business divisions and other Corporate Center units
Financial and operating performance
Personal & Corporate Banking
Personal & Corporate Banking
Profit before tax was CHF 1,646 million in 2015 compared with CHF 1,506 million in 2014. Adjusted profit before tax increased by CHF 111 million to CHF 1,681 million, reflecting a lower net credit loss expense and reduced operating expenses, as well as higher income. The net new business volume growth rate for our personal banking business increased to 2.4% from 2.3%.
Personal & Corporate Banking¹ | | | | | | |
| | As of or for the year ended | | % change from |
CHF million, except where indicated | | 31.12.15 | 31.12.14 | 31.12.13 | | 31.12.14 |
Net interest income | | 2,270 | 2,184 | 2,144 | | 4 |
Recurring net fee income | | 544 | 556 | 511 | | (2) |
Transaction-based income | | 959 | 1,022 | 1,034 | | (6) |
Other income | | 140 | 75 | 86 | | 87 |
Income | | 3,913 | 3,836 | 3,774 | | 2 |
Credit loss (expense) / recovery | | (37) | (95) | (18) | | (61) |
Total operating income | | 3,877 | 3,741 | 3,756 | | 4 |
Personnel expenses | | 873 | 850 | 843 | | 3 |
General and administrative expenses | | 264 | 293 | 297 | | (10) |
Services (to) / from other business divisions and Corporate Center | | 1,077 | 1,074 | 1,140 | | 0 |
of which: services from CC – Services | | 1,180 | 1,196 | 1,301 | | (1) |
Depreciation and impairment of property, equipment and software | | 17 | 17 | 19 | | 0 |
Amortization and impairment of intangible assets | | 0 | 0 | 0 | | |
Total operating expenses² | | 2,231 | 2,235 | 2,298 | | 0 |
Business division operating profit / (loss) before tax | | 1,646 | 1,506 | 1,458 | | 9 |
| | | | | | |
Key performance indicators³ | | | | | | |
Pre-tax profit growth (%) | | 9.3 | 3.3 | (20.2) | | |
Cost / income ratio (%) | | 57.0 | 58.3 | 60.9 | | |
Net interest margin (bps) | | 167 | 159 | 156 | | 5 |
Net new business volume growth for personal banking (%) | | 2.4 | 2.3 | 1.9 | | |
| | | | | | |
Additional information | | | | | | |
Average attributed equity (CHF billion)⁴ | | 3.9 | 4.1 | 4.1 | | (5) |
Return on attributed equity (%) | | 41.9 | 36.7 | 35.6 | | |
Risk-weighted assets (fully applied, CHF billion)⁵ | | 34.6 | 33.1 | 29.7 | | 5 |
Risk-weighted assets (phase-in, CHF billion)⁵ | | 34.6 | 34.4 | 31.4 | | 1 |
Return on risk-weighted assets, gross (%)⁶ | | 11.2 | 11.3 | 11.7 | | |
Leverage ratio denominator (fully applied, CHF billion)⁷ | | 153.8 | 165.9 | 164.7 | | (7) |
Goodwill and intangible assets (CHF billion) | | 0.0 | 0.0 | 0.0 | | |
Business volume for personal banking (CHF billion) | | 148 | 143 | 141 | | 3 |
Net new business volume for personal banking (CHF billion) | | 3.4 | 3.2 | 2.6 | | |
Client assets (CHF billion) | | 444 | 434 | 404 | | 2 |
Due to customers (CHF billion) | | 132.4 | 137.3 | 133.2 | | (4) |
Loans, gross (CHF billion) | | 135.6 | 137.4 | 136.5 | | (1) |
Secured loan portfolio as a percentage of total loan portfolio, gross (%) | | 93.9 | 93.1 | 93.1 | | |
Impaired loan portfolio as a percentage of total loan portfolio, gross (%) | | 0.6 | 0.8 | 0.7 | | |
Personnel (full-time equivalents) | | 5,058 | 5,206 | 5,209 | | (3) |
1 Comparative figures in this table may differ from those originally published in quarterly and annual reports due to adjustments following organizational changes, restatements due to the retrospective adoption of new accounting standards or changes in accounting policies, and events after the reporting period. 2 Refer to "Note 32 Changes in organization and disposals" in the "Consolidated financial statements" section of this report for information on restructuring expenses. 3 Refer to the "Measurement of performance" section of this report for the definitions of our key performance indicators. 4 Refer to the "Capital management" section of this report for more information on the equity attribution framework. 5 Based on the Basel III framework as applicable for Swiss systemically relevant banks (SRBs). 6 Based on phase-in risk-weighted assets. 7 Calculated in accordance with Swiss SRB rules. From 31 December 2015 onwards, the leverage ratio denominator calculation is fully aligned with the BIS Basel III rules. Prior-period figures are calculated in accordance with former Swiss SRB rules and are therefore not fully comparable. Refer to the "Capital management" section of this report for more information. |
2015 compared with 2014
Results
Operating income
Total operating income increased by CHF 136 million to CHF 3,877 million and included a gain of CHF 66 million related to our investment in the SIX Group. Excluding this gain, adjusted operating income increased by CHF 70 million to CHF 3,811 million, reflecting higher net interest income and a lower net credit loss expense, partly offset by decreased transaction-based and recurring net fee income.
Net interest income increased by CHF 86 million to CHF 2,270 million, primarily due to higher income from loans and deposits, reflecting our pricing measures.
Recurring net fee income decreased by CHF 12 million to CHF 544 million, mainly reflecting lower fee income allocated from Corporate Center – Group Asset and Liability Management (Group ALM) for the provision of collateral in relation to issued covered bonds, as well as decreased revenues from non-asset-based products. This was partly offset by increased revenues for account keeping, banking packages and custody services.
Transaction-based income decreased by CHF 63 million to CHF 959 million, mainly driven by a fee of CHF 45 million paid to Wealth Management for the shift of certain clients from Wealth Management to Personal & Corporate Banking as a result of a detailed client segmentation review, as well as lower credit card fees.
Other income increased by CHF 65 million to CHF 140 million, mainly due to the aforementioned gain related to our investment in the SIX Group.
We recorded a net credit loss expense of CHF 37 million compared with CHF 95 million, predominantly due to lower expenses for newly impaired positions.
® Refer to the “Risk management and control” section of this report for more information
Operating expenses
Operating expenses decreased by CHF 4 million to CHF 2,231 million. Excluding restructuring expenses of CHF 101 million compared with CHF 64 million, adjusted operating expenses decreased by CHF 41 million to CHF 2,130 million.
Personnel expenses increased by CHF 23 million to CHF 873 million, mainly reflecting increased expenses for variable compensation and higher pension-related costs.
General and administrative expenses decreased by CHF 29 million to CHF 264 million, mainly reflecting a net release of CHF 2 million of provisions for litigation, regulatory and similar matters compared with a net charge of CHF 59 million in the prior year. This was partly offset by higher marketing expenses, which included a one-time reversal of an accrual in 2014.
Net expenses for services from Corporate Center and other business divisions increased by CHF 3 million to CHF 1,077 million. Excluding restructuring expenses of CHF 99 million compared with CHF 60 million, adjusted net expenses decreased by CHF 36 million to CHF 978 million, reflecting lower expenses from Group Operations and Group Corporate Services, partly offset by higher expenses from Group Technology.
® Refer to the "Significant accounting and financial reporting changes" section of this report for more information on the change in presentation of service allocations from Corporate Center – Services to business divisions and other Corporate Center units
Cost / income ratio
The cost / income ratio was 57.0% compared with 58.3%. On an adjusted basis, the cost / income ratio was 55.4% compared with 56.6% and remained within our target range of 50% to 60%.
Net interest margin
The net interest margin increased 8 basis points to 167 basis points and remained within the target range of 140 to 180 basis points.
Net new business volume growth for personal banking
The net new business volume growth rate for our personal banking business was 2.4% compared with 2.3% and remained within the target range of 1% to 4%. Net new client assets were positive while net new loans were slightly negative. It is our strategy to grow our business in high-quality loans moderately and selectively.
Personnel
Personal & Corporate Banking employed 5,058 personnel as of 31 December 2015, a decrease of 148 compared with 5,206 personnel as of 31 December 2014, reflecting the shift of a team of real estate financing experts from Personal & Corporate Banking to Wealth Management, as well as staff reductions, including those related to our ongoing cost reduction programs.
® Refer to the "Significant accounting and financial reporting changes" section of this report for more information on personnel allocations from Corporate Center – Services to business divisions and other Corporate Center units
Financial and operating performance
Personal & Corporate Banking
2014 compared with 2013
Results
Operating income
Total operating income decreased by CHF 15 million to CHF 3,741 million, reflecting an increased net credit loss expense, as well as lower transaction-based and other income, largely offset by higher recurring net fee income and increased net interest income.
Net interest income increased by CHF 40 million to CHF 2,184 million, mainly due to higher revenues allocated from Group ALM and a higher loan margin. This was partly offset by a decline in the deposit margin, despite selective pricing measures, as the persistently low interest rate environment continued to have an adverse effect on our replication portfolios.
Recurring net fee income increased by CHF 45 million to CHF 556 million, mainly as certain fees related to personal bank accounts were recorded as recurring net fee income in 2014, totaling CHF 58 million in 2014, while these fees were recorded as transaction-based income in 2013.
Transaction-based income decreased by CHF 12 million to CHF 1,022 million, mainly reflecting the aforementioned change in classification of certain fees related to personal bank accounts. This was partly offset by first-time fees received from Wealth Management for net client shifts and referrals.
Other income decreased by CHF 11 million to CHF 75 million, mainly as 2013 included a CHF 27 million gain related to the divestment of our participation in Euroclear Plc., partly offset by higher income from our participation in the SIX Group in 2014.
The net credit loss expense was CHF 95 million in 2014 compared with CHF 18 million. The 2014 net expense included net specific credit loss allowances of CHF 105 million compared with CHF 113 million in the prior year, which was primarily related to corporate clients in both periods. In addition, 2014 included a release of CHF 10 million in collective loan loss allowances compared with a release of CHF 95 million in 2013, which partly reflected the overall improved outlook for relevant industries.
Operating expenses
Operating expenses decreased by CHF 63 million to CHF 2,235 million. Excluding restructuring expenses of CHF 64 million compared with CHF 54 million, adjusted operating expenses decreased by CHF 73 million to CHF 2,171 million.
Personnel expenses increased by CHF 7 million to CHF 850 million. Excluding restructuring expenses, adjusted personnel expenses increased by CHF 3 million to CHF 846 million, reflecting higher expenses for variable compensation and a smaller release of accruals for untaken vacation, partly offset by lower pension-related costs.
General and administrative expenses decreased by CHF 4 million to CHF 293 million, as lower marketing expenses, which included a one-time reversal of an accrual in 2014, were partly offset by higher professional fees.
Net expenses for services from other business divisions and Corporate Center decreased by CHF 66 million to CHF 1,074 million. Excluding restructuring expenses of CHF 60 million compared with CHF 54 million, adjusted net expenses decreased by CHF 72 million to CHF 1,014 million, reflecting lower expenses from Group Technology and Group Operations.
® Refer to the "Significant accounting and financial reporting changes" section of this report for more information on the change in presentation of service allocations from Corporate Center – Services to business divisions and other Corporate Center units
Cost / income ratio
The cost / income ratio was 58.3% compared with 60.9%. On an adjusted basis excluding restructuring expenses, the cost / income ratio was 56.6% compared with 59.5%.
Net interest margin
The net interest margin increased 3 basis points to 159 basis points, reflecting the aforementioned increase in net interest income partly offset by a slightly higher average loan volume.
Net new business volume growth for personal banking
The net new business growth rate for our personal banking business was 2.3% compared with 1.9%. Both net new client assets and, to a lesser extent, net new loans were positive. The slight increase in loans reflected our strategy to grow our business in high-quality loans moderately and selectively.
Personnel
Personal & Corporate Banking employed 5,206 personnel as of 31 December 2014, almost unchanged from 5,209 as of 31 December 2013.
® Refer to the "Significant accounting and financial reporting changes" section of this report for more information on personnel allocations from Corporate Center – Services to business divisions and other Corporate Center units
Asset Management
Profit before tax was CHF 584 million in 2015 compared with CHF 467 million in 2014. Adjusted profit before tax was CHF 610 million compared with CHF 509 million, primarily reflecting higher management fees. Excluding money market flows, net new money outflows were CHF 0.7 billion compared with net inflows of CHF 22.6 billion. 2015 included CHF 33 billion of outflows driven by client liquidity needs, largely from lower-margin passive products.
Asset Management¹ |
| | As of or for the year ended | | % change from |
CHF million, except where indicated | | 31.12.15 | 31.12.14 | 31.12.13 | | 31.12.14 |
Net management fees² | | 1,903 | 1,756 | 1,739 | | 8 |
Performance fees | | 154 | 146 | 196 | | 5 |
Total operating income | | 2,057 | 1,902 | 1,935 | | 8 |
Personnel expenses | | 729 | 643 | 609 | | 13 |
General and administrative expenses | | 232 | 305 | 218 | | (24) |
Services (to) / from other business divisions and Corporate Center | | 502 | 478 | 521 | | 5 |
of which: services from CC – Services | | 523 | 495 | 535 | | 6 |
Depreciation and impairment of property, equipment and software | | 2 | 2 | 4 | | 0 |
Amortization and impairment of intangible assets | | 8 | 9 | 8 | | (11) |
Total operating expenses³ | | 1,474 | 1,435 | 1,359 | | 3 |
Business division operating profit / (loss) before tax | | 584 | 467 | 576 | | 25 |
| | | | | | |
Key performance indicators⁴ | | | | | | |
Pre-tax profit growth (%) | | 25.1 | (18.9) | 1.2 | | |
Cost / income ratio (%) | | 71.7 | 75.4 | 70.2 | | |
Net new money growth excluding money market flows (%) | | (0.1) | 4.4 | (1.0) | | |
Gross margin on invested assets (bps) | | 32 | 31 | 33 | | 3 |
Net margin on invested assets (bps) | | 9 | 8 | 10 | | 13 |
| | | | | | |
Information by business line | | | | | | |
Operating income | | | | | | |
Traditional Investments | | 1,143 | 1,118 | 1,144 | | 2 |
O'Connor and Hedge Fund Solutions | | 198 | 210 | 266 | | (6) |
Global Real Estate | | 403 | 353 | 317 | | 14 |
Infrastructure and Private Equity | | 57 | 42 | 38 | | 36 |
Fund Services | | 257 | 178 | 171 | | 44 |
Total operating income | | 2,057 | 1,902 | 1,935 | | 8 |
| | | | | | |
Gross margin on invested assets (bps) | | | | | | |
Traditional Investments | | 21 | 21 | 22 | | 0 |
O'Connor and Hedge Fund Solutions | | 53 | 66 | 95 | | (20) |
Global Real Estate | | 84 | 84 | 76 | | 0 |
Infrastructure and Private Equity | | 62 | 49 | 48 | | 27 |
Total gross margin | | 32 | 31 | 33 | | 3 |
Financial and operating performance
Asset Management
Asset Management (continued)¹ |
| | As of or for the year ended | | % change from |
CHF million, except where indicated | | 31.12.15 | 31.12.14 | 31.12.13 | | 31.12.14 |
| | | | | | |
Net new money (CHF billion) | | | | | | |
Traditional Investments | | (13.0) | 10.7 | (18.5) | | |
O'Connor and Hedge Fund Solutions | | 4.3 | 3.3 | (2.5) | | |
Global Real Estate | | 3.4 | 2.3 | 1.2 | | |
Infrastructure and Private Equity | | (0.2) | (0.5) | 0.0 | | |
Total net new money | | (5.4) | 15.9 | (19.9) | | |
Net new money excluding money market flows | | (0.7) | 22.6 | (4.8) | | |
of which: from third parties | | (7.7) | 11.3 | 0.7 | | |
of which: from UBS's wealth management businesses | | 7.0 | 11.3 | (5.5) | | |
Money market flows | | (4.7) | (6.7) | (15.1) | | |
of which: from third parties | | (3.4) | 0.0 | (1.5) | | |
of which: from UBS's wealth management businesses | | (1.3) | (6.7) | (13.6) | | |
| | | | | | |
Invested assets (CHF billion) | | | | | | |
Traditional Investments | | 550 | 574 | 506 | | (4) |
O'Connor and Hedge Fund Solutions | | 39 | 35 | 27 | | 11 |
Global Real Estate | | 52 | 46 | 42 | | 13 |
Infrastructure and Private Equity | | 10 | 9 | 8 | | 11 |
Total invested assets | | 650 | 664 | 583 | | (2) |
of which: excluding money market funds | | 592 | 600 | 518 | | (1) |
of which: money market funds | | 58 | 64 | 65 | | (9) |
| | | | | | |
Assets under administration by Fund Services | | | | | | |
Assets under administration (CHF billion)⁵ | | 407 | 520 | 432 | | (22) |
Net new assets under administration (CHF billion)⁶ | | 24.0 | 43.9 | 3.8 | | (45) |
Gross margin on assets under administration (bps) | | 5 | 4 | 4 | | 25 |
| | | | | | |
Additional information | | | | | | |
Average attributed equity (CHF billion)⁷ | | 1.6 | 1.7 | 1.8 | | (6) |
Return on attributed equity (%) | | 36.5 | 27.5 | 32.0 | | |
Risk-weighted assets (fully applied, CHF billion)⁸ | | 2.6 | 3.8 | 3.7 | | (32) |
Risk-weighted assets (phase-in, CHF billion)⁸ | | 2.6 | 3.9 | 3.8 | | (33) |
Return on risk-weighted assets, gross (%)⁹ | | 62.1 | 51.2 | 51.1 | | |
Leverage ratio denominator (fully applied, CHF billion)¹⁰ | | 2.7 | 14.9 | 14.0 | | (82) |
Goodwill and intangible assets (CHF billion) | | 1.4 | 1.5 | 1.4 | | (7) |
Personnel (full-time equivalents) | | 2,277 | 2,323 | 2,217 | | (2) |
1 Comparative figures in this table may differ from those originally published in quarterly and annual reports due to adjustments following organizational changes, restatements due to the retrospective adoption of new accounting standards or changes in accounting policies, and events after the reporting period. 2 Net management fees include transaction fees, fund administration revenues (including net interest and trading income from lending activities and foreign exchange hedging as part of the fund services offering), gains or losses from seed money and co-investments, funding costs, gains and losses on the sale of subsidiaries and businesses and other items that are not performance fees. 3 Refer to "Note 32 Changes in organization and disposals" in the "Consolidated financial statements" section of this report for information on restructuring expenses. 4 Refer to the "Measurement of performance" section of this report for the definitions of our key performance indicators. 5 This includes UBS and third-party fund assets, for which the fund services unit provides professional services, including fund set-up, accounting and reporting for traditional investment funds and alternative funds. 6 Inflows of assets under administration from new and existing funds less outflows from existing funds or fund exits. 7 Refer to the "Capital management" section of this report for more information on the equity attribution framework. 8 Based on the Basel III framework as applicable for Swiss systemically relevant banks (SRBs). 9 Based on phase-in risk-weighted assets. 10 Calculated in accordance with Swiss SRB rules. From 31 December 2015 onwards, the leverage ratio denominator calculation is fully aligned with the BIS Basel III rules. Prior-period figures are calculated in accordance with former Swiss SRB rules and are therefore not fully comparable. Refer to the "Capital management" section of this report for more information. |
2015 compared with 2014
Results
Operating income
Total operating income was CHF 2,057 million compared with CHF 1,902 million. Excluding a gain of CHF 56 million on the sale of our Alternative Fund Services (AFS) business, adjusted operating income was CHF 2,001 million compared with CHF 1,902 million. Adjusted net management fees increased by CHF 91 million to CHF 1,847 million, primarily in Global Real Estate and Fund Services. Performance fees increased by CHF 8 million to CHF 154 million, mainly in Traditional Investments and Global Real Estate, partly offset by lower revenues in O'Connor and Hedge Fund Solutions.
Approximately 25% of O’Connor and Hedge Fund Solutions performance fee-eligible assets exceeded high-water marks as of 31 December 2015, a decline from 65% as of 31 December 2014, reflecting the challenging market conditions in the second half of 2015.
Operating expenses
Total operating expenses were CHF 1,474 million compared with CHF 1,435 million. Excluding restructuring expenses of CHF 82 million compared with CHF 50 million, as well as a gain of CHF 8 million related to changes to retiree benefit plans in the US in the prior year, adjusted operating expenses were CHF 1,392 million, almost unchanged from 2014.
Personnel expenses were CHF 729 million compared with CHF 643 million. Excluding restructuring expenses of CHF 4 million compared with CHF 19 million, as well as a CHF 4 million gain related to retiree benefit plans in the prior year, adjusted personnel expenses increased by CHF 97 million to CHF 725 million. This was mainly driven by higher salary-related costs as a result of increased staffing levels, excluding the effect of the aforementioned sale of AFS, as well as higher expenses for variable compensation.
General and administrative expenses were CHF 232 million compared with CHF 305 million. Excluding restructuring expenses of CHF 9 million compared with CHF 1 million, adjusted general and administrative expenses decreased by CHF 81 million to CHF 223 million. This decrease was mainly due to a charge for litigation, regulatory and similar matters of CHF 55 million in 2014, as well as an expense of CHF 14 million in 2014 for a provision for a settlement related to a fund liquidation.
Net expenses for services from other business divisions and Corporate Center were CHF 502 million compared with CHF 478 million. Excluding restructuring expenses of CHF 68 million compared with CHF 30 million, as well as a CHF 4 million gain related to retiree benefit plans in the prior year, adjusted net expenses for services from other business divisions and Corporate Center decreased by CHF 18 million to CHF 434 million. Lower expenses from Group Operations were partially offset by higher expenses from Group Technology.
® Refer to the "Significant accounting and financial reporting changes" section of this report for more information on the change in presentation of service allocations from Corporate Center – Services to business divisions and other Corporate Center units
Cost / income ratio
The cost / income ratio was 71.7% compared with 75.4%. On an adjusted basis, the cost / income ratio was 69.6% compared with 73.2% and was within our target range of 60% to 70%.
Net new money
Excluding money market flows, net new money outflows were CHF 0.7 billion compared with net inflows of CHF 22.6 billion, which resulted in a negative net new money growth rate of 0.1% compared with a positive growth rate of 4.4%, below our target range of 3% to 5%. By client segment, net outflows from third parties were CHF 7.7 billion compared with net inflows of CHF 11.3 billion. 2015 included CHF 33 billion of outflows driven by client liquidity needs, largely from lower-margin passive products. Net outflows were mainly from clients serviced from Europe. Net new money inflows from clients of UBS’s wealth management businesses were CHF 7.0 billion compared with CHF 11.3 billion, mainly from clients serviced from Asia Pacific and Switzerland.
Money market net outflows were CHF 4.7 billion compared with CHF 6.7 billion. By client segment, net new money outflows from third parties were CHF 3.4 billion compared with zero. Net outflows from Americas, Switzerland and Europe, Middle East and Africa were partly offset by net inflows in Asia Pacific. Net outflows from clients of UBS’s wealth management businesses were CHF 1.3 billion compared with CHF 6.7 billion.
Financial and operating performance
Asset Management
Invested assets
Invested assets were CHF 650 billion as of 31 December 2015 compared with CHF 664 billion as of 31 December 2014, reflecting negative foreign currency translation effects of CHF 11 billion and net new money outflows of CHF 5 billion, partly offset by favorable market performance of CHF 4 billion.
As of 31 December 2015, CHF 195 billion, or 30%, of invested assets was managed in passive strategies, and CHF 58 billion, or 9%, was money market assets. The remaining 61% of invested assets was managed in active, non-money market strategies. On a regional basis, 34% of invested assets related to clients serviced from Switzerland, 23% from the Americas, 22% from Europe, Middle East and Africa, and 21% from Asia Pacific.
Assets under administration
Net new assets under administration were CHF 24.0 billion compared with CHF 43.9 billion. Total assets under administration decreased to CHF 407 billion as of 31 December 2015 from CHF 520 billion as of 31 December 2014. This was due to a reduction of CHF 132 billion related to the sale of our AFS business and negative foreign currency translation effects of CHF 5 billion, partly offset by the aforementioned inflows of CHF 24 billion.
Margins on invested assets
The net margin on invested assets was 9 basis points compared with 8 basis points. The adjusted net margin remained unchanged at 9 basis points. The gross margin was 32 basis points compared with 31 basis points and the adjusted gross margin was unchanged at 31 basis points.
Personnel
Asset Management employed 2,277 personnel as of 31 December 2015 compared with 2,323 personnel as of 31 December 2014, mainly reflecting the aforementioned sale of our AFS business, partly offset by increases in Traditional Investments and Global Real Estate.
® Refer to the "Significant accounting and financial reporting changes" section of this report for more information on personnel allocations from Corporate Center – Services to business divisions and other Corporate Center units
Investment performance
Equity market conditions were increasingly volatile as the year progressed with a notable sell-off in the second half of the year. Overall, our active equity funds performed strongly against benchmarks and peers, especially in Europe, Asia and emerging markets. However, a number of our intrinsic-value strategies faced challenges as valuation spreads widened, especially in the US. Passive strategies and our growing range of alternative index or smart beta products tracked indices closely.
For fixed income, 2015 was another challenging year for active managers. However, our active funds demonstrated strong rankings versus peers during the year. Reducing risk throughout the year in volatile commodity related sectors within high-yield and emerging market debt delivered positive results. Solid results in regional markets such as Swiss bonds and US municipal bonds contributed positively as well. Bond issuer specific risk in investment-grade markets negatively affected our overall performance in some cases. Liquidity and passive strategies continued to achieve their capital preservation and tracking error goals.
Our multi-asset strategies had a varied year. Both benchmark-relative and peer-relative strategies had a wide range of active returns, as asset allocation effects were mixed but the implementation of the strategy with specific stocks negatively affected our overall performance. Absolute return strategies suffered from a number of shocks to financial markets. Our risk taking in foreign exchange added positively to our performance. Our multi-asset fund performance remained attractive over longer horizons. Global convertible strategies were modestly behind their benchmarks for the year but, longer-term, continued to retain good peer rankings.
O’Connor’s flagship multi-strategy hedge fund performed in line with its multi-strategy peers and was ahead of the broad hedge fund average.
In a challenging year for hedge funds, Hedge Fund Solutions (HFS) delivered positive returns in core broad-based diversified portfolios, generally outperforming relevant hedge fund benchmarks. HFS's performance was particularly strong in diversified neutral portfolios.
Global Real Estate’s US composite and UK direct investment strategies all produced double digit returns in 2015. German direct and multi-manager indirect strategies also delivered strong positive absolute returns for the year. Japanese real estate investment trusts produced mostly positive results whereas pan-European direct funds produced negative absolute returns. The Swiss composite was slightly negative versus the market index for the year, while the Swiss real estate securities composite was positive. Both composites generated positive absolute returns for the year.
For our Private Equity portfolios, the momentum seen in 2014 continued until mid-2015, leading to strong performance and distributions for investors. Despite a considerable slowdown in the second part of the year, overall performance for the year was good. Infrastructure multi-manager portfolios saw vibrant investment activity in 2015 as well as rising distributions driven by cash flows from underlying assets.
Investment performance as of 31 December 2015 | | | | | |
| | | | Annualized |
| | | | | |
Active funds versus benchmark | | 1 year | | 3 years | 5 years |
Percentage of fund assets equaling or exceeding benchmark | | | | | |
Equities¹ | | 75 | | 86 | 77 |
Fixed income¹ | | 56 | | 56 | 65 |
Multi-asset¹ | | 55 | | 85 | 73 |
Total Traditional Investments | | 61 | | 74 | 70 |
Real estate² | | 37 | | 42 | 42 |
| | | | | |
Active funds versus peers | | | | | |
Percentage of fund assets ranking in first or second quartile / equaling or exceeding peer index | | | | | |
Equities¹ | | 73 | | 80 | 75 |
Fixed income¹ | | 79 | | 71 | 65 |
Multi-asset¹ | | 43 | | 75 | 78 |
Total Traditional Investments | | 66 | | 75 | 72 |
Real estate² | | 59 | | 88 | 88 |
Hedge funds³ | | 89 | | 85 | 84 |
| | | | | |
Passive funds tracking accuracy | | | | | |
Percentage of passive fund assets within applicable tracking tolerance | | | | | |
All asset classes⁴ | | 84 | | 93 | 92 |
1 Percentage of active fund assets above benchmark (gross of fees) / peer median. Universe of European domiciled active wholesale funds available to UBS's wealth management businesses and other wholesale intermediaries as of 31 December 2015. Source: versus peers: ThomsonReuters LIM (Lipper Investment Management); versus benchmark: UBS. Universe represents approximately 71% of all active fund assets and 27% of all actively managed assets (including segregated accounts) in these asset classes. 2 Percentage of real estate fund assets above benchmark (gross of fess) / peer median. Universe (versus benchmark) includes all fully discretionary real estate funds with a benchmark representing approximately 70% of real estate gross invested assets as at 31 December 2015. Source: IPD, NFI-ODCE, SXI Real Estate Funds TR. Universe (versus peers) includes all real estate funds with externally verifiable peer groups representing approximately 22% of real estate gross invested assets as of 31 December 2015. Source: ThomsonReuters LIM (Lipper Investment Management). 3 Percentage of fund assets above appropriate HFRI peer indices. Universe of key hedge funds and fund-of-fund products managed on a fully discretionary basis representing approximately 35% of total O'Connor and Hedge Fund Solutions invested assets. 4 Percentage of passive fund assets within applicable tracking tolerance on a gross of fees basis. Performance information represents a universe of European domiciled institutional and wholesale funds representing approximately 46% of total passive invested assets as of 31 December 2015. Source: UBS. |
Financial and operating performance
Asset Management
2014 compared with 2013
Results
Operating income
Total operating income was CHF 1,902 million compared with CHF 1,935 million in 2013. Performance fees were CHF 50 million lower at CHF 146 million compared with CHF 196 million, mainly in the O’Connor and A&Q business line (now O’Connor and Hedge Fund Solutions). This was partly offset by higher net management fees, which increased to CHF 1,756 million from CHF 1,739 million in 2013. Net management fees in 2013 included a gain of CHF 34 million on the sale of our Canadian domestic business. Excluding this gain in 2013, adjusted net management fees were CHF 51 million higher in 2014, primarily in Global Real Estate and Traditional Investments.
Operating expenses
Total operating expenses were CHF 1,435 million in 2014 compared with CHF 1,359 million in 2013. Excluding restructuring expenses of CHF 50 million in 2014 and CHF 43 million in 2013, as well as a gain of CHF 8 million in 2014 related to changes to retiree benefit plans in the US, adjusted operating expenses were CHF 77 million higher at CHF 1,393 million compared with CHF 1,316 million. The increase was mainly due to a net charge for provisions for litigation, regulatory and similar matters of CHF 55 million compared with zero in 2013.
Personnel expenses were CHF 643 million compared with CHF 609 million. Excluding restructuring expenses of CHF 19 million compared with CHF 2 million, and a CHF 4 million gain related to retiree benefit plans in the US in 2014, adjusted personnel expenses were CHF 21 million higher at CHF 628 million compared with CHF 607 million.
General and administrative expenses were CHF 305 million compared with CHF 218 million. Excluding restructuring expenses of CHF 1 million compared with zero, adjusted general and administrative expenses were CHF 86 million higher at CHF 304 million compared with CHF 218 million. This increase was mainly due to the aforementioned charge for provisions for litigation, regulatory and similar matters and a provision for a possible settlement related to a fund liquidation.
Net expenses for services from other divisions and Corporate Center were CHF 478 million compared with CHF 521 million. Excluding restructuring expenses of CHF 30 million compared with CHF 38 million, and a CHF 4 million gain related to retiree benefit plans in the US in 2014, adjusted net services were CHF 31 million lower at CHF 452 million in 2014, mainly due to lower expenses from Group Operations, Group Technology and Group Finance, as well as lower expenses for variable compensation.
® Refer to the "Significant accounting and financial reporting changes" section of this report for more information on the change in presentation of service allocations from Corporate Center – Services to business divisions and other Corporate Center units
Cost / income ratio
The cost / income ratio was 75.4% compared with 70.2%. The adjusted cost / income ratio increased to 73.2% from 69.2%.
Net new money
The net new money growth rate, excluding money market flows, was 4.4% compared with negative 1.0% in the prior year.
Excluding money market flows, net new money inflows were CHF 22.6 billion compared with net new money outflows of CHF 4.8 billion. By client segment, net inflows from third parties were CHF 11.3 billion compared with CHF 0.7 billion in 2013. Net inflows were mainly from clients serviced from Switzerland, Asia Pacific and Europe. Net new money inflows from clients of UBS’s wealth management businesses were CHF 11.3 billion compared with net outflows of CHF 5.5 billion in the prior year. This improvement mainly resulted from increased transparency around available products and better matching of attractive products to wealth management clients’ needs. The net inflows were mainly from clients serviced from Asia Pacific and Europe.
Money market net outflows were CHF 6.7 billion compared with CHF 15.1 billion. By client segment, net flows from third parties were zero compared with net outflows of CHF 1.5 billion in the prior year. Net inflows in Asia Pacific and Switzerland were offset by net outflows in the Americas and Europe. Net outflows from clients of UBS’s wealth management businesses were CHF 6.7 billion compared with CHF 13.6 billion in the prior year. In both years, net outflows were primarily due to an ongoing initiative by Wealth Management Americas to increase deposit account balances in UBS banking entities. This led to outflows of CHF 3.9 billion from money market funds managed by Asset Management in 2014 and CHF 8.3 billion in 2013. The corresponding increase in deposit account balances in Wealth Management Americas does not constitute net new money.
Invested assets
Invested assets were CHF 664 billion as of 31 December 2014 compared with CHF 583 billion as of 31 December 2013. Positive foreign currency translation effects of CHF 36 billion, favorable market performance of CHF 30 billion, and net new money inflows of CHF 16 billion all contributed to the overall increase of CHF 81 billion.
As of 31 December 2014, CHF 209 billion, or 31%, of invested assets was managed in passive strategies and CHF 64 billion, or 10%, of invested assets was money market assets. The remaining 59% of invested assets was managed in active, non-money market strategies. On a regional basis, 32% of invested assets related to clients serviced from Switzerland, 24% from Europe, Middle East and Africa, 23% from the Americas, and 21% from Asia Pacific.
Assets under administration
Net new assets under administration were CHF 43.9 billion compared with CHF 3.8 billion in the prior year. Total assets under administration increased to CHF 520 billion as of 31 December 2014 from CHF 432 billion as of 31 December 2013, mainly due to new assets under administration of CHF 44 billion, favorable market performance of CHF 25 billion and positive foreign currency translation effects of CHF 20 billion.
Margins on invested assets
The net margin on invested assets was 8 basis points compared with 10 basis points. The adjusted net margin was 9 basis points compared with 10 basis points. The gross margin decreased 2 basis points to 31 basis points, mainly due to lower performance fees.
Personnel
Asset Management employed 2,323 personnel as of 31 December 2014 compared with 2,217 personnel as of 31 December 2013. The net increase of 106 personnel primarily reflected increases in Traditional Investments and Fund Services.
® Refer to the "Significant accounting and financial reporting changes" section of this report for more information on personnel allocations from Corporate Center – Services to business divisions and other Corporate Center units
Financial and operating performance
Investment Bank
Investment Bank
The Investment Bank recorded a profit before tax of CHF 1,892 million in 2015 compared with a loss before tax of CHF 84 million in 2014. On an adjusted basis, the Investment Bank recorded a profit before tax of CHF 2,288 million compared with CHF 162 million, mainly due to a CHF 1,853 million lower net charge for provisions for litigation, regulatory and similar matters, as well as increased revenues in Investor Client Services, partly offset by lower revenues in Corporate Client Solutions. Fully applied risk-weighted assets decreased by CHF 4 billion to CHF 63 billion as of 31 December 2015. The return on attributed equity for 2015 was 31.3% on an adjusted basis, above our target of over 15%.
Investment Bank¹ | | | | | | |
| | As of or for the year ended | | % change from |
CHF million, except where indicated | | 31.12.15 | 31.12.14 | 31.12.13 | | 31.12.14 |
Corporate Client Solutions | | 2,960 | 3,189 | 2,983 | | (7) |
Advisory | | 709 | 708 | 588 | | 0 |
Equity Capital Markets | | 1,047 | 1,021 | 1,142 | | 3 |
Debt Capital Markets | | 691 | 1,005 | 888 | | (31) |
Financing Solutions | | 441 | 497 | 603 | | (11) |
Risk Management | | 73 | (42) | (239) | | |
Investor Client Services | | 5,929 | 5,118 | 5,453 | | 16 |
Equities | | 3,962 | 3,659 | 3,765 | | 8 |
Foreign Exchange, Rates and Credit | | 1,967 | 1,459 | 1,688 | | 35 |
Income | | 8,889 | 8,306 | 8,436 | | 7 |
Credit loss (expense) / recovery | | (68) | 2 | 2 | | |
Total operating income | | 8,821 | 8,308 | 8,438 | | 6 |
Personnel expenses | | 3,220 | 2,964 | 2,899 | | 9 |
General and administrative expenses | | 841 | 2,671 | 843 | | (69) |
Services (to) / from other business divisions and Corporate Center | | 2,817 | 2,711 | 2,517 | | 4 |
of which: services from CC – Services | | 2,731 | 2,658 | 2,487 | | 3 |
Depreciation and impairment of property, equipment and software | | 26 | 32 | 28 | | (19) |
Amortization and impairment of intangible assets | | 24 | 15 | 13 | | 60 |
Total operating expenses² | | 6,929 | 8,392 | 6,300 | | (17) |
Business division operating profit / (loss) before tax | | 1,892 | (84) | 2,138 | | |
| | | | | | |
Key performance indicators³ | | | | | | |
Pre-tax profit growth (%) | | | | 481.0 | | |
Cost / income ratio (%) | | 78.0 | 101.0 | 74.7 | | |
Return on attributed equity (%) | | 25.9 | (1.1) | 26.6 | | |
Return on assets, gross (%) | | 3.2 | 3.2 | 3.3 | | |
Average VaR (1-day, 95% confidence, 5 years of historical data) | | 12 | 12 | 13 | | 0 |
Investment Bank (continued)¹ |
| | As of or for the year ended | | % change from |
CHF million, except where indicated | | 31.12.15 | 31.12.14 | 31.12.13 | | 31.12.14 |
| | | | | | |
Additional information | | | | | | |
Total assets (CHF billion)⁴ | | 253.5 | 292.3 | 240.0 | | (13) |
Funded assets (CHF billion)⁵ | | 159.9 | 170.7 | 157.2 | | (6) |
Average attributed equity (CHF billion)⁶ | | 7.3 | 7.6 | 8.0 | | (4) |
Risk-weighted assets (fully applied, CHF billion)⁷ | | 62.9 | 66.7 | 62.3 | | (6) |
Risk-weighted assets (phase-in, CHF billion)⁷ | | 62.9 | 67.0 | 62.6 | | (6) |
Return on risk-weighted assets, gross (%)⁸ | | 13.6 | 12.9 | 13.0 | | |
Leverage ratio denominator (fully applied, CHF billion)⁹ | | 268.0 | 288.3 | 270.3 | | (7) |
Goodwill and intangible assets (CHF billion) | | 0.1 | 0.1 | 0.1 | | 0 |
Compensation ratio (%) | | 36.2 | 35.7 | 34.4 | | |
Impaired loan portfolio as a percentage of total loan portfolio, gross (%) | | 1.5 | 0.3 | 0.2 | | |
Personnel (full-time equivalents) | | 5,243 | 5,194 | 5,165 | | 1 |
1 Comparative figures in this table may differ from those originally published in quarterly and annual reports due to adjustments following organizational changes, restatements due to the retrospective adoption of new accounting standards or changes in accounting policies, and events after the reporting period. 2 Refer to "Note 32 Changes in organization and disposals" in the "Consolidated financial statements" section of this report for information on restructuring expenses. 3 Refer to the "Measurement of performance" section of this report for the definitions of our key performance indicators. 4 Based on third-party view, i.e., without intercompany balances. 5 Funded assets are defined as total IFRS balance sheet assets less positive replacement values (PRV) and collateral delivered against over-the-counter (OTC) derivatives. 6 Refer to the "Capital management" section of this report for more information on the equity attribution framework. 7 Based on the Basel III framework as applicable for Swiss systemically relevant banks (SRBs). 8 Based on phase-in risk-weighted assets. 9 Calculated in accordance with Swiss SRB rules. From 31 December 2015 onwards, the leverage ratio denominator calculation is fully aligned with the BIS Basel III rules. Prior-period figures are calculated in accordance with former Swiss SRB rules and are therefore not fully comparable. Refer to the "Capital management" section of this report for more information. |
Financial and operating performance
Investment Bank
2015 compared with 2014
Results
Operating income
Total operating income increased by CHF 513 million or 6% to CHF 8,821 million, as revenues in Investor Client Services increased by CHF 811 million, partly offset by CHF 229 million lower revenues in Corporate Client Solutions. On an adjusted basis, excluding gains of CHF 11 million in 2015 and CHF 43 million in 2014 related to partial sales of our investment in the financial information services company Markit, as well as an impairment loss of CHF 48 million on a financial investment in 2014, total operating income increased by CHF 497 million or 6% to CHF 8,810 million from CHF 8,313 million. Net credit loss expense was CHF 68 million, mainly related to the energy sector, compared with a recovery of CHF 2 million in the prior year. In US dollar terms, adjusted operating income increased 1%.
® Refer to the “Risk management and control” section of this report for more information
® Refer to the “Significant accounting and financial reporting changes” section of this report for more information on the change in segment reporting related to fair value gains and losses on certain internal funding transactions
Operating expenses
Total operating expenses decreased by CHF 1,463 million or 17% to CHF 6,929 million. Excluding restructuring expenses of CHF 396 million compared with CHF 261 million, an impairment loss of CHF 11 million on an intangible asset in 2015 and gains of CHF 20 million related to changes to retiree benefit plans in the US in 2014, total adjusted operating expenses decreased by CHF 1,629 million or 20% to CHF 6,522 million, mainly as the net charge for provisions for litigation, regulatory and similar matters decreased to CHF 2 million from CHF 1,855 million, partly offset by higher expenses for variable compensation, in line with improved business performance. In US dollar terms, adjusted operating expenses decreased 23%.
Personnel expenses increased to CHF 3,220 million from CHF 2,964 million. Excluding restructuring expenses of CHF 14 million compared with CHF 64 million, as well as an CHF 11 million gain related to changes to retiree benefit plans in the US in 2014, personnel expenses increased to CHF 3,206 million from CHF 2,911 million, mainly due to higher performance-related variable compensation expenses.
General and administrative expenses decreased to CHF 841 million from CHF 2,671 million. Excluding restructuring expenses of CHF 7 million in 2015 compared with CHF 30 million, general and administrative expenses decreased to CHF 834 million from CHF 2,641 million, mainly due to the aforementioned reduction in the net charge for provisions for litigation, regulatory and similar matters. The charge for the annual UK bank levy was CHF 98 million compared with CHF 64 million.
Net expenses for services from other business divisions and Corporate Center increased to CHF 2,817 million from CHF 2,711 million. Excluding restructuring costs of CHF 376 million in 2015 and CHF 161 million as well as a gain of CHF 9 million related to changes to retiree benefit plans in the US in 2014, adjusted net expenses for services from other business divisions and Corporate Center decreased to CHF 2,441 million from CHF 2,559 million.
® Refer to the “Significant accounting and financial reporting changes” section of this report for more information on the change in presentation of service allocations from Corporate Center – Services to business divisions and other Corporate Center units
Cost / income ratio
The cost / income ratio decreased to 78.0% from 101.0%. On an adjusted basis, the cost / income ratio decreased to 73.5% from 98.1% and was within our target range of 70% to 80%.
Return on attributed equity
Return on attributed equity (RoAE) for 2015 was 25.9%, and 31.3% on an adjusted basis, above our target of over 15%.
® Refer to the “Capital management” section of this report for more information
Funded assets
Funded assets decreased by CHF 11 billion to CHF 160 billion as of 31 December 2015, mainly due to lower trading portfolio assets in our Foreign Exchange, Rates and Credit business, driven by a reduction in client activity in the fourth quarter.
® Refer to the “Balance sheet“ section of this report for more information
Risk-weighted assets
Fully applied risk-weighted assets (RWA) decreased by CHF 4 billion to CHF 63 billion as of 31 December 2015, below our limit of CHF 70 billion for 2015 and our short- to medium-term expectation of CHF 85 billion. The decrease was mainly due to CHF 3 billion lower market risk RWA, primarily related to a reduction in stressed value-at-risk and risks-not-in-VaR.
® Refer to the “Capital management” section of this report for more information
Leverage ratio denominator
The fully applied Swiss systemically relevant bank (SRB) leverage ratio denominator (LRD) was CHF 268 billion as of 31 December 2015, below our short- to medium-term expectation of CHF 325 billion. From 31 December 2015 onwards, the Swiss SRB LRD calculation is fully aligned with the BIS Basel III rules. Prior-period figures are calculated in accordance with the former Swiss SRB rules and are therefore not fully comparable.
® Refer to the “Capital Management“ section of this report for more information
Operating income by business unit
Corporate Client Solutions
Corporate Client Solutions revenues decreased by 7% to CHF 2,960 million from CHF 3,189 million, largely due to lower revenues in Debt Capital Markets and Financing Solutions. In US dollar terms, revenues decreased 12%.
Advisory and Equity Capital Markets revenues were both broadly in line with 2014 at CHF 709 million and CHF 1,047 million, respectively.
Debt Capital Markets revenues decreased 31% to CHF 691 million from CHF 1,005 million, mainly due to lower revenues from leveraged finance following a global fee pool decline of 23%. Investment grade revenues were broadly in line with 2014.
Financing Solutions revenues decreased 11% to CHF 441 million compared with CHF 497 million, reflecting lower volumes and margin compression in 2015.
Risk Management revenues improved to positive CHF 73 million from negative CHF 42 million, mainly due to gains on portfolio macro hedges and lower risk management costs associated with corporate lending.
Investor Client Services
Investor Client Services revenues increased 16% to CHF 5,929 million from CHF 5,118 million due to higher revenues in both Equities and Foreign Exchange, Rates and Credit. In US dollar terms, revenues increased 11%.
Equities
Equities revenues increased 8% to CHF 3,962 million from CHF 3,659 million. Excluding the aforementioned gains and impairment loss on financial investments in 2014, adjusted revenues increased 7% to CHF 3,962 million from CHF 3,703 million due to higher revenues in Financing Services and, to a lesser extent, in Cash, partly offset by lower revenues in Derivatives.
Cash revenues increased to CHF 1,371 million from CHF 1,352 million. Excluding a gain related to a financial investment of CHF 4 million in 2014, adjusted revenues increased to CHF 1,371 million from CHF 1,348 million, mainly due to higher commission income as client activity levels increased.
Derivatives revenues decreased to CHF 1,046 million from CHF 1,089 million, driven by weaker performance in Europe, Middle East and Africa, partly offset by increased revenues in the Americas and Asia Pacific.
Financing services revenues increased to CHF 1,581 million from CHF 1,289 million, driven primarily by increased client activity in Prime Brokerage and Equity Financing.
Foreign Exchange, Rates and Credit
Foreign Exchange, Rates and Credit revenues increased 35% to CHF 1,967 million from CHF 1,459 million. Excluding gains related to financial investments of CHF 11 million compared with CHF 39 million, adjusted revenues increased to CHF 1,956 million from CHF 1,420 million, mainly due to higher revenues in our Foreign Exchange and Rates businesses, reflecting elevated client activity and higher volatility, particularly heightened following the Swiss National Bank’s actions of 15 January 2015.
Personnel
The Investment Bank employed 5,243 personnel as of 31 December 2015, slightly up from 5,194 as of 31 December 2014.
® Refer to the “Significant accounting and financial reporting changes” section of this report for more information on personnel allocations from Corporate Center – Services to business divisions and other Corporate Center units
Financial and operating performance
Investment Bank
2014 compared with 2013
Results
Operating income
Total operating income decreased CHF 130 million or 2% to CHF 8,308 million from CHF 8,438 million, as revenues in Investor Client Services declined CHF 335 million, partly offset by CHF 206 million higher revenues in Corporate Client Solutions. On an adjusted basis, excluding an impairment loss of CHF 48 million on a financial investment classified as available-for-sale and a gain of CHF 43 million from the partial sale of our investment in the financial information services company Markit, both in 2014, as well as a CHF 55 million gain from the sale of our remaining proprietary trading business in 2013, total operating income decreased CHF 70 million or 1% to CHF 8,313 million from CHF 8,383 million. In US dollar terms, adjusted operating income was in line with the prior year.
® Refer to the “Significant accounting and financial reporting changes” section of this report for more information on the change in segment reporting related to fair value gains and losses on certain internal funding transactions
Operating expenses
Total operating expenses increased by CHF 2,092 million or 33% to CHF 8,392 million compared with CHF 6,300 million. Excluding restructuring expenses of CHF 261 million in 2014 and CHF 210 million in 2013, and gains of CHF 20 million related to changes to retiree benefit plans in the US in 2014, total operating expenses increased by CHF 2,061 million or 34% to CHF 8,151 million compared with CHF 6,090 million. This increase was mainly due to a CHF 1,846 million higher net charge for provisions for litigation, regulatory and similar matters, as well as higher services (to)/from other business units and higher professional fees, and was partly offset by lower personnel expenses. In US dollar terms, adjusted operating expenses increased 34%.
Personnel expenses increased to CHF 2,964 million from CHF 2,899 million. Excluding restructuring expenses of CHF 64 million and the aforementioned gains of CHF 11 million related to changes to retiree benefit plans in the US in 2014, as well as a restructuring-related gain of CHF 38 million in 2013, adjusted personnel expenses decreased to CHF 2,912 million from CHF 2,937 million.
General and administrative expenses increased to CHF 2,671 million from CHF 843 million. Excluding restructuring expenses of CHF 30 million compared with CHF 1 million, adjusted general and administrative expenses increased to CHF 2,641 million from CHF 842 million, mainly due to the aforementioned increase in the net charge for provisions for litigation, regulatory and similar matters, and higher capital tax expense, partly offset by lower professional fees.
Net expenses for services from other business divisions and Corporate Center increased to CHF 2,711 million from CHF 2,517 million. Excluding restructuring expenses of CHF 161 million and a gain of CHF 9 million related to changes to retiree benefit plans in the US in 2014, compared with restructuring expenses of CHF 247 million in 2013, adjusted net expenses for services from other business divisions and Corporate Center increased to CHF 2,559 million from CHF 2,270 million.
® Refer to the “Significant accounting and financial reporting changes” section of this report for more information on the change in presentation of service allocations from Corporate Center – Services to business divisions and other Corporate Center units
Cost / income ratio
The cost / income ratio increased to 101% from 75%. On an adjusted basis, the cost / income ratio increased to 98% from 73%.
Return on attributed equity
RoAE for 2014 was negative 1.1%, and positive 2.1% on an adjusted basis.
Funded assets
Funded assets increased to CHF 171 billion as of 31 December 2014 from CHF 157 billion as of 31 December 2013, mainly due to foreign currency translation effects. Excluding foreign currency translation effects, funded assets increased by approximately CHF 3 billion, mainly due to higher trading assets in the equities business.
Risk-weighted assets
Fully applied risk-weighted assets (RWA) increased to CHF 67 billion as of 31 December 2014 from CHF 62 billion as of 31 December 2013. The increase was mainly due to CHF 6 billion higher market risk RWA related to risks-not-in-VaR and stressed value-at-risk, partly offset by CHF 1 billion lower operational risk RWA, resulting from a reduction in the incremental RWA resulting from the supplemental operational risk capital analysis mutually agreed to by UBS and FINMA.
Operating income by business unit
Corporate Client Solutions
Corporate Client Solutions revenues increased 7% to CHF 3,189 million from CHF 2,983 million, largely due to higher revenues in Advisory and Debt Capital Markets and lower Risk Management charges, partly offset by lower revenues in Equity Capital Markets and Financing Solutions. In US dollar terms, revenues increased 8%.
Advisory revenues increased 20% to CHF 708 million from CHF 588 million, mainly reflecting an increased volume of mergers and acquisition transactions in 2014.
Equity Capital Markets revenues decreased 11% to CHF 1,021 million from CHF 1,142 million. This decrease was mainly due to a large private transaction recorded in 2013, partly offset by higher revenues from public offerings in 2014 as the fee pool increased 19%.
Debt Capital Markets revenues increased 13% to CHF 1,005 million from CHF 888 million, due to higher revenues from leveraged finance, partly offset by slightly lower investment grade revenues. Excluding a gain on an investment in an associate, which was reclassified to a financial investment available-for-sale following its initial public offering in 2014, adjusted leveraged finance revenues were broadly in line with 2013.
Financing Solutions revenues decreased 18% to CHF 497 million compared with CHF 603 million, mainly due to a reduction in revenues in the real estate finance business.
Risk Management revenues improved to negative CHF 42 million from negative CHF 239 million, mainly due to the positive effect of widening credit spreads during 2014.
Investor Client Services
Investor Client Services revenues decreased 6% to CHF 5,118 million from CHF 5,453 million, due to lower revenues in both the equities and foreign exchange, rates and credit businesses. In US dollar terms, revenues decreased 5%.
Equities
Equities revenues decreased 3% to CHF 3,659 million from CHF 3,765 million. Excluding the aforementioned gains and impairment loss on financial investments in 2014, as well as a gain from the sale of our remaining proprietary trading business in 2013, adjusted revenues were CHF 3,703 million compared with CHF 3,710 million due to lower revenues in Derivatives, other equities and Cash, largely offset by higher revenues in Financing Services.
Cash revenues decreased to CHF 1,352 million compared with CHF 1,374 million, mainly due to lower commission income as client activity levels declined. Excluding the gain on a financial investment in 2014, adjusted Cash revenues decreased to CHF 1,348 million from CHF 1,374 million.
Derivatives revenues decreased to CHF 1,089 million from CHF 1,199 million, mainly as a result of lower trading revenues, reflecting lower volatility levels during 2014.
Financing Services revenues increased to CHF 1,289 million from CHF 1,084 million, mainly due to higher equity finance revenues.
Other equities revenues were negative CHF 70 million compared with positive CHF 108 million. Excluding an impairment loss of CHF 48 million on a financial investment in 2014 and a gain from the sale of our former proprietary trading business in 2013, other equities revenues decreased to negative CHF 22 million from positive CHF 53 million. This decrease was mainly due to higher revenues in 2013 related to equity investments prior to their transfer to Corporate Center – Non-core and Legacy Portfolio, as well as a gain related to the divestment of our participation in Euroclear Plc.
Foreign Exchange, Rates and Credit
Foreign Exchange, Rates and Credit revenues decreased 14% to CHF 1,459 million from CHF 1,688 million. Excluding aforementioned gains related to a financial investment, adjusted revenues decreased to CHF 1,420 million from CHF 1,688 million, with lower revenues across most products, as client activity and volatility levels decreased compared with 2013.
Foreign Exchange revenues declined, mainly due to lower revenues from the foreign exchange spot and options businesses, reflecting lower client activity and volatility levels.
Rates and Credit revenues declined, primarily due to weaker trading performance in the credit business.
Personnel
The Investment Bank employed 5,194 personnel as of 31 December 2014, an increase of 29 compared with 5,165 personnel as of 31 December 2013.
® Refer to the “Significant accounting and financial reporting changes” section of this report for more information on personnel allocations from Corporate Center – Services to business divisions and other Corporate Center units
Financial and operating performance
Corporate Center
Corporate Center
Corporate Center¹ | | | | | | |
| | As of or for the year ended | | % change from |
CHF million, except where indicated | | 31.12.15 | 31.12.14 | 31.12.13 | | 31.12.14 |
Total operating income | | 315 | (823) | (498) | | |
Personnel expenses | | 4,049 | 3,993 | 4,296 | | 1 |
General and administrative expenses | | 5,311 | 4,650 | 5,931 | | 14 |
Services (to) / from business divisions | | (7,894) | (7,580) | (7,488) | | 4 |
Depreciation and impairment of property, equipment and software | | 868 | 762 | 761 | | 14 |
Amortization and impairment of intangible assets | | 21 | 6 | 6 | | 250 |
Total operating expenses² | | 2,354 | 1,832 | 3,507 | | 28 |
Operating profit / (loss) before tax | | (2,040) | (2,655) | (4,004) | | (23) |
| | | | | | |
Additional information | | | | | | |
Average attributed equity (CHF billion)³ | | 25.8 | 20.5 | 23.3 | | 26 |
Total assets (CHF billion)⁴ | | 354.5 | 427.6 | 462.5 | | (17) |
Risk-weighted assets (fully applied, CHF billion)⁵ | | 60.2 | 65.8 | 84.2 | | (9) |
Risk-weighted assets (phase-in, CHF billion)⁵ | | 65.0 | 67.9 | 84.9 | | (4) |
Leverage ratio denominator (fully applied, CHF billion)⁶ | | 291.2 | 327.2 | 386.9 | | (11) |
Personnel (full-time equivalents) | | 23,671 | 23,773 | 24,082 | | 0 |
1 Comparative figures in this table may differ from those originally published in quarterly and annual reports due to adjustments following organizational changes, restatements due to the retrospective adoption of new accounting standards or changes in accounting policies, and events after the reporting period. 2 Refer to “Note 32 Changes in organization and disposals" in the "Consolidated financial statements" section of this report for information on restructuring expenses. 3 Refer to the "Capital management" section of this report for more information on the equity attribution framework. 4 Based on third-party view, i.e., without intercompany balances. 5 Based on the Basel III framework as applicable for Swiss systemically relevant banks (SRBs). 6 Calculated in accordance with Swiss SRB rules. From 31 December 2015 onwards, the leverage ratio denominator calculation is fully aligned with the BIS Basel III rules. Prior-period figures are calculated in accordance with former Swiss SRB rules and are therefore not fully comparable. Refer to the "Capital management" section of this report for more information. |
Corporate Center – Services
Corporate Center – Services recorded a loss before tax of CHF 818 million in 2015 compared with a loss of CHF 652 million in the prior year. Total operating expenses remaining in Corporate Center – Services after allocations to business divisions and other Corporate Center units were CHF 1,059 million. Total operating income was CHF 241 million, mainly reflecting gains on sales of real estate.
Corporate Center – Services¹ | | | | | | |
| | As of or for the year ended | | % change from |
CHF million, except where indicated | | 31.12.15 | 31.12.14 | 31.12.13 | | 31.12.14 |
Total operating income | | 241 | 37 | 178 | | 551 |
Personnel expenses | | 3,903 | 3,843 | 4,065 | | 2 |
General and administrative expenses | | 4,483 | 4,123 | 4,249 | | 9 |
Depreciation and impairment of property, equipment and software | | 868 | 762 | 761 | | 14 |
Amortization and impairment of intangible assets | | 21 | 6 | 4 | | 250 |
Total operating expenses before allocations to business divisions and other CC units | | 9,274 | 8,734 | 9,080 | | 6 |
Services (to) / from business divisions and other CC units | | (8,215) | (8,046) | (8,276) | | 2 |
of which: services to Wealth Management | | (2,209) | (2,122) | (2,074) | | 4 |
of which: services to Wealth Management Americas | | (1,193) | (1,121) | (1,127) | | 6 |
of which: services to Personal & Corporate Banking | | (1,180) | (1,196) | (1,301) | | (1) |
of which: services to Asset Management | | (523) | (495) | (535) | | 6 |
of which: services to Investment Bank | | (2,731) | (2,658) | (2,487) | | 3 |
of which: services to CC – Group ALM | | (95) | (82) | (87) | | 16 |
of which: services to CC – Non-core and Legacy Portfolio | | (314) | (411) | (693) | | (24) |
Total operating expenses² | | 1,059 | 688 | 804 | | 54 |
Operating profit / (loss) before tax | | (818) | (652) | (626) | | 25 |
| | | | | | |
Additional information | | | | | | |
Average attributed equity (CHF billion)³ | | 19.6 | 12.3 | 9.5 | | 59 |
Total assets (CHF billion)⁴ | | 22.6 | 19.9 | 17.2 | | 14 |
Risk-weighted assets (fully applied, CHF billion)⁵ | | 23.6 | 23.0 | 15.3 | | 3 |
Risk-weighted assets (phase-in, CHF billion)⁵ | | 28.3 | 25.1 | 16.0 | | 13 |
Leverage ratio denominator (fully applied, CHF billion)⁶ | | 4.8 | (2.6) | | | |
Personnel (full-time equivalents) | | 23,470 | 23,517 | 23,747 | | 0 |
1 Comparative figures in this table may differ from those originally published in quarterly and annual reports due to adjustments following organizational changes, restatements due to the retrospective adoption of new accounting standards or changes in accounting policies, and events after the reporting period. 2 Refer to "Note 32 Changes in organization and disposals" in the "Consolidated financial statements" section of this report for information on restructuring expenses. 3 Beginning in 2015, Group items are shown within Corporate Center – Services. Prior periods have been restated. Refer to the "Capital management" section of this report for more information on the equity attribution framework. 4 Based on third-party view, i.e., without intercompany balances. 5 Based on the Basel III framework as applicable for Swiss systemically relevant banks (SRBs). 6 Calculated in accordance with Swiss SRB rules. From 31 December 2015 onwards, the leverage ratio denominator calculation is fully aligned with the BIS Basel III rules. Prior-period figures are calculated in accordance with former Swiss SRB rules and are therefore not fully comparable. Refer to the "Capital management" section of this report for more information. |
Financial and operating performance
Corporate Center
2015 compared with 2014
Results
Operating income
Total operating income was CHF 241 million in 2015 compared with CHF 37 million in 2014, mainly as gains on sales of real estate increased to CHF 378 million from CHF 44 million, primarily due to the sale of a property in Geneva, Switzerland. This was partly offset by lower income from the investment of the Group's equity allocated from Corporate Center – Group Asset and Liability Management (Group ALM). Furthermore, 2014 included a gain of CHF 58 million related to the release of a provision for litigation, regulatory and similar matters, which was recorded within other income.
Operating expenses
Operating expenses before service allocations to business divisions and other Corporate Center units
On a gross basis, before service allocations to the business divisions and other Corporate Center units, total operating expenses increased by CHF 540 million to CHF 9,274 million. Restructuring expenses were CHF 1,125 million compared with CHF 484 million in the prior year, mainly related to our transitioning activities to nearshore and offshore locations. 2015 also included a gain of CHF 2 million related to a change to retiree benefit plans in the US compared with a gain of CHF 16 million in 2014. Excluding these items, adjusted operating expenses before service allocations were CHF 8,151 million compared with CHF 8,266 million in the prior year. This decrease of CHF 115 million was mainly due to CHF 139 million lower personnel expenses as well as decreased occupancy costs and professional fees. These decreases were partly offset by a net charge for provisions for litigation, regulatory and similar matters of CHF 15 million compared with a net release of provisions of CHF 125 million. Moreover, 2015 included higher depreciation expenses related to internally generated capitalized software.
Personnel expenses increased by CHF 60 million to CHF 3,903 million and included restructuring expenses of CHF 406 million compared with CHF 221 million. 2015 also included the aforementioned gain of CHF 2 million related to retiree benefit plans compared with a gain of CHF 16 million. On an adjusted basis, personnel expenses were CHF 3,499 million compared with CHF 3,638 million, mainly as a result of outsourcing, nearshoring and offshoring initiatives.
General and administrative expenses increased by CHF 360 million to CHF 4,483 million. On an adjusted basis, excluding net restructuring expenses of CHF 707 million compared with CHF 240 million, general and administrative expenses decreased by CHF 107 million, mainly due to lower occupancy costs and professional fees. These decreases were partly offset by the aforementioned net charge for provisions for litigation, regulatory and similar matters compared with a net release.
Depreciation and impairment of property, equipment and software increased to CHF 868 million from CHF 762 million, reflecting increased depreciation expenses related to internally generated capitalized software.
Services to / from business divisions and other Corporate Center units
Net expenses for services to business divisions and other Corporate Center units were CHF 8,215 million compared with CHF 8,046 million. Excluding restructuring expenses of CHF 986 million compared with CHF 454 million and a gain of CHF 2 million related to a change to retiree benefit plans in the US compared with a gain of CHF 16 million, net expenses for services were CHF 7,231 million, compared with CHF 7,608 million, mainly related to lower personnel expenses and occupancy costs, partly offset by increased depreciation expenses.
® Refer to the “Significant accounting and financial reporting changes” section of this report for more information on the change in presentation of service allocations from Corporate Center – Services to business divisions and other Corporate Center units
Operating expenses after service allocations to/from business divisions and other Corporate Center units
Operating expenses remaining in Corporate Center – Services, after allocations relate mainly to Group governance functions and other corporate activities, as well as to certain strategic and regulatory projects and certain restructuring expenses.
Total operating expenses remaining in Corporate Center – Services after allocations increased to CHF 1,059 million compared with CHF 688 million. This increase of CHF 371 million was mainly due to the aforementioned net charge for provisions for litigation, regulatory and similar matters compared with a net release, as well as restructuring expenses of CHF 140 million compared with CHF 30 million. Furthermore, the full-year costs incurred by Corporate Center – Services exceeded the cost allocations to the business divisions and Non-core and Legacy Portfolio which were agreed as part of the annual business planning cycle.
Personnel
As of 31 December 2015, Corporate Center – Services employed 23,470 personnel compared with 23,517 at the end of the prior year. The net decrease of 47 personnel was mainly related to outsourcing activities, largely offset by increases in risk control and in our nearshoring and offshoring locations.
® Refer to the “Significant accounting and financial reporting changes” section of this report for more information on personnel allocations from Corporate Center – Services to business divisions and other Corporate Center units
2014 compared with 2013
Operating income
Total operating income was CHF 37 million in 2014 compared with CHF 178 million in 2013, mainly due to lower gains on sales of real estate of CHF 44 million compared with CHF 288 million. In addition, 2014 included a gain of CHF 58 million related to the release of a provision for litigation, regulatory and similar matters, which was recorded within other income.
Operating expenses
Operating expenses before service allocations to business divisions and other Corporate Center units
On a gross basis, before service allocations to the business divisions and other Corporate Center units, total operating expenses decreased by CHF 346 million to CHF 8,734 million. Restructuring expenses were CHF 484 million compared with CHF 707 million in the prior year. 2014 also included gains of CHF 16 million related to changes to retiree benefit plans in the US. Excluding these items, adjusted operating expenses before service allocations were CHF 8,266 million compared with CHF 8,373 million in the prior year. This decrease of CHF 107 million was mainly due to CHF 298 million lower personnel expenses and a net release of CHF 125 million of provisions for litigation, regulatory and similar matters compared with a net charge of CHF 187 million. These decreases were partly offset by higher professional fees related to our strategic and regulatory priorities and increased outsourcing activities.
Personnel expenses decreased by CHF 222 million to CHF 3,843 million. On an adjusted basis, excluding net restructuring expenses of CHF 221 million in 2014 and CHF 129 million in 2013, as well as the aforementioned gains of CHF 16 million related to changes to retiree benefit plans in the US, personnel expenses were CHF 3,638 million in 2014 compared with CHF 3,936 million in the prior year. This decrease of CHF 298 million was mainly due to outsourcing and offshoring initiatives, lower expenses for variable compensation as well as our ongoing cost reduction programs.
General and administrative expenses decreased by CHF 126 million to CHF 4,123 million. On an adjusted basis, excluding net restructuring expenses of CHF 240 million compared with CHF 513 million, general and administrative expenses increased by CHF 147 million, mainly due to higher professional fees related to our strategic and regulatory priorities as well as increased outsourcing activities. These increases were partly offset by a net release of CHF 125 million of provisions for litigation, regulatory and similar matters compared with a net charge of CHF 187 million.
Depreciation and impairment of property, equipment and software increased marginally to CHF 762 million, mainly reflecting higher depreciation expenses related to internally generated capitalized software, largely offset by CHF 42 million lower restructuring expenses.
Services to / from business divisions and other Corporate Center units
Net expenses for services to business divisions and other Corporate Center units were CHF 8,046 million compared with CHF 8,276 million, largely related to lower restructuring expenses.
® Refer to the “Significant accounting and financial reporting changes” section of this report for more information on the change in presentation of service allocations from Corporate Center – Services to business divisions and other Corporate Center units
Operating expenses after service allocations to/from business divisions and other Corporate Center units
Operating expenses remaining in Corporate Center – Services relate mainly to Group governance functions and other corporate activities, and certain strategic and regulatory projects.
Total operating expenses remaining in Corporate Center – Services, after allocations to the business divisions and other Corporate Center units, decreased to CHF 688 million from CHF 804 million. This decrease of CHF 116 million was mainly due to the aforementioned net release of provisions for litigation, regulatory and similar matters compared with a net charge, partly offset by additional expenses related to our strategic and regulatory priorities.
Risk-weighted assets
Fully applied Basel III RWA increased by CHF 8 billion to CHF 23 billion as of 31 December 2014, primarily due to CHF 3 billion higher incremental RWA resulting from the supplemental operational risk capital analysis mutually agreed to by UBS and FINMA and CHF 3 billion higher market risk RWA, mainly reflecting reduced diversification benefits.
Personnel
As of 31 December 2014, Corporate Center – Services employed 23,517 personnel compared with 23,747 personnel at the end of the prior year. This decrease of 230 personnel was mainly related to our ongoing cost reduction programs and outsourcing activities.
® Refer to the “Significant accounting and financial reporting changes” section of this report for more information on personnel allocations from Corporate Center – Services to business divisions and other Corporate Center units
Financial and operating performance
Corporate Center
Corporate Center – Group Asset and Liability Management
Corporate Center – Group Asset and Liability Management recorded a profit before tax of CHF 282 million in 2015 compared with CHF 2 million in 2014.
Corporate Center – Group ALM¹ | | | | | | |
| | As of or for the year ended | | % change from |
CHF million, except where indicated | | 31.12.15 | 31.12.14 | 31.12.13 | | 31.12.14 |
Gross income excluding own credit | | 600 | 831 | 363 | | (28) |
Allocations to business divisions and other CC units | | (876) | (1,120) | (921) | | (22) |
of which: Wealth Management | | (471) | (481) | (486) | | (2) |
of which: Wealth Management Americas | | (104) | (116) | (193) | | (10) |
of which: Personal & Corporate Banking | | (421) | (461) | (396) | | (9) |
of which: Asset Management | | (15) | (27) | (23) | | (44) |
of which: Investment Bank | | 211 | 100 | 217 | | 111 |
of which: CC – Services | | (145) | (217) | (218) | | (33) |
of which: CC – Non-core and Legacy Portfolio | | 71 | 82 | 179 | | (13) |
Own credit² | | 553 | 292 | (283) | | 89 |
Total operating income | | 277 | 2 | (841) | | |
Personnel expenses | | 30 | 26 | 26 | | 15 |
General and administrative expenses | | 21 | 21 | 14 | | 0 |
Depreciation and impairment of property, equipment and software | | 0 | 0 | 0 | | |
Amortization and impairment of intangible assets | | 0 | 0 | 0 | | |
Services (to) / from business divisions and other CC units | | (56) | (47) | 3 | | 19 |
of which: Wealth Management | | (37) | (17) | (11) | | 118 |
of which: Wealth Management Americas | | (6) | (6) | (5) | | 0 |
of which: Personal & Corporate Banking | | (19) | (8) | (5) | | 138 |
of which: Asset Management | | 0 | (3) | (3) | | (100) |
of which: Investment Bank | | (59) | (54) | (32) | | 9 |
of which: CC – Services | | 95 | 82 | 87 | | 16 |
of which: CC – Non-core and Legacy Portfolio | | (29) | (40) | (27) | | (28) |
Total operating expenses³ | | (5) | 0 | 43 | | |
Operating profit / (loss) before tax | | 282 | 2 | (884) | | |
| | | | | | |
Additional information | | | | | | |
Average attributed equity (CHF billion)⁴ | | 3.3 | 3.2 | 3.1 | | 3 |
Total assets (CHF billion)⁵ | | 237.5 | 237.9 | 230.2 | | 0 |
Risk-weighted assets (fully applied, CHF billion)⁶ | | 6.0 | 7.1 | 5.4 | | (15) |
Risk-weighted assets (phase-in, CHF billion)⁶ | | 6.0 | 7.1 | 5.4 | | (15) |
Leverage ratio denominator (fully applied, CHF billion)⁷ | | 240.2 | 236.3 | | | 2 |
Personnel (full-time equivalents) | | 125 | 120 | 113 | | 4 |
1 Comparative figures in this table may differ from those originally published in quarterly and annual reports due to adjustments following organizational changes, restatements due to the retrospective adoption of new accounting standards or changes in accounting policies, and events after the reporting period. 2 Represents own credit changes on financial liabilities designated at fair value through profit or loss. The cumulative own credit gain for such debt held on 31 December 2015 amounts to CHF 0.3 billion. This gain has reduced the fair value of financial liabilities designated at fair value recognized on our balance sheet. 3 Refer to "Note 32 Changes in organization and disposals" in the "Consolidated financial statements" section of this report for information on restructuring expenses. 4 Refer to the "Capital management" section of this report for more information on the equity attribution framework. 5 Based on third-party view, i.e., without intercompany balances. 6 Based on the Basel III framework as applicable for Swiss systemically relevant banks (SRBs). 7 Calculated in accordance with Swiss SRB rules. From 31 December 2015 onwards, the leverage ratio denominator calculation is fully aligned with the BIS Basel III rules. Prior-period figures are calculated in accordance with former Swiss SRB rules and are therefore not fully comparable. Refer to the "Capital management" section of this report for more information. |
2015 compared with 2014
Results
Operating income
Gross income excluding own credit
Gross income excluding own credit was CHF 600 million in 2015 and included a loss of CHF 257 million related to the buyback of debt in a tender offer, as well as a net foreign currency translation gain of CHF 88 million related to the disposal of subsidiaries. Excluding these items, adjusted gross income excluding own credit was CHF 769 million compared with CHF 831 million.
Gross revenues from balance sheet risk management activities were CHF 1,715 million compared with CHF 1,695 million. Income related to high-quality liquid assets (HQLA) increased by CHF 216 million to CHF 296 million and revenues from banking book interest rate risk management performed on behalf of Wealth Management and Personal & Corporate Banking increased by CHF 34 million to CHF 758 million. In addition, 2015 included a CHF 38 million higher gain from the Group ALM-managed monthly conversion of non-Swiss franc profits. These increases were partly offset by higher interest expenses arising from the issuance of additional tier 1 (AT1) capital and senior unsecured debt during 2015 and lower income from the investment of the Group's equity, following the Swiss National Bank actions on 15 January 2015.
Hedging activities resulted in a gross gain of CHF 94 million compared with a gain of CHF 73 million, largely related to gains of CHF 169 million on cross-currency basis swaps held as economic hedges and of CHF 66 million related to our cash flow hedges, compared with gains of CHF 142 million and CHF 55 million, respectively. These gains were partly offset by a loss of CHF 166 million on interest rate derivatives held to hedge HQLA, driven by a decline in US dollar interest rates, compared with a loss of CHF 133 million in the prior year. Unlike fair value changes in hedging interest rate derivatives, which are recognized immediately in the income statement, the HQLA that are hedged are held as financial investments classified as available-for-sale with unrealized fair value changes recorded in other comprehensive income within equity.
Group ALM incurred funding costs of CHF 1,039 million compared with CHF 937 million. This increase was driven by a fair value loss of CHF 19 million on certain internal funding transactions compared with a gain of CHF 82 million in the previous year. The net interest expense was stable at CHF 1,020 million as maturing long-term debt was replaced with new AT1 capital and senior unsecured debt.
Allocations to business divisions and other Corporate Center units
Allocations to the business divisions and other Corporate Center units mainly consist of income generated from interest-rate risk management activities and the investment of the Group’s equity, offset by charges for liquidity and funding, various collateral management activities and costs of issuance of capital instruments.
Group ALM allocated revenues of CHF 876 million compared with CHF 1,120 million in the prior year, mainly due to lower income from the investment of the Group's equity and issuance fees related to AT1 capital and senior unsecured debt.
Operating income after allocations
Group ALM retains central funding costs, certain income from hedging activities, own credit on financial liabilities designated at fair value, and the aforementioned loss related to the buyback of debt and foreign currency translation gains and losses related to the disposal of subsidiaries.
Net operating income remaining in Group ALM was CHF 277 million compared with CHF 2 million.
Own credit on financial liabilities designated at fair value was a gain of CHF 553 million compared with a gain of CHF 292 million. In 2015, we made further enhancements to our valuation methodology for the own credit component of fair value of financial liabilities designated at fair value. This change in accounting estimate resulted in a gain of CHF 260 million.
® Refer to the “Significant accounting and financial reporting changes” section of this report for more information on the change in own credit valuation methodology
® Refer to Note 24 “Fair value measurement” in the “Consolidated financial statements” section of this report for more information on own credit
Operating expenses
Total operating expenses net of allocations were negative CHF 5 million compared with zero in the prior year, as costs allocated to the business divisions and other Corporate Center units were slightly higher than the actual costs incurred by Group ALM.
Balance sheet assets
Total assets were broadly unchanged at CHF 238 billion, as a reduction in cash and balances with central banks was mostly offset by increases in financial investments classified as available-for-sale and reverse repurchase agreements, mainly due to a rebalancing of our HQLA.
Financial and operating performance
Corporate Center
2014 compared with 2013
Results
Operating income
Gross income excluding own credit
Gross income excluding own credit was CHF 831 million in 2014 compared with CHF 363 million in the prior year, which included net losses of CHF 194 million related to the buyback of debt as well as a foreign currency translation loss of CHF 24 million related to the disposal of a subsidiary. Excluding these items, adjusted gross income excluding own credit was CHF 831 million compared with CHF 581 million.
Gross revenues from balance sheet risk management activities were CHF 1,695 million compared with CHF 1,678 million. Income related to HQLA increased by CHF 131 million to CHF 80 million and revenues from the banking book interest rate risk management performed on behalf of Wealth Management and Personal & Corporate Banking increased by CHF 104 million to CHF 724 million. These increases were partly offset by higher interest expenses due to the issuance of AT1 capital and senior unsecured debt and lower income from the investment of the Group's equity.
Hedging activities resulted in a gross gain of CHF 73 million compared with a loss of CHF 361 million, largely related to gains of CHF 142 million on cross-currency basis swaps held as economic hedges and of CHF 55 million related to our cash flow hedges, compared with losses of CHF 203 million and CHF 147 million, respectively. These gains were partly offset by a loss of CHF 133 million on interest rate derivatives held to hedge HQLA, compared with a gain of CHF 12 million in the prior year.
Group ALM incurred funding costs of CHF 937 million compared with CHF 736 million, mainly as 2014 included a fair value gain of CHF 82 million on certain internal funding transactions compared with a gain of CHF 343 million in the previous year. Moreover, funding costs were reduced by CHF 60 million to CHF 1,019 million, mainly related to senior unsecured debt.
Allocations to business divisions and other Corporate Center units
Allocations to the business divisions and other Corporate Center units mainly consist of income generated from interest-rate risk management activities and the investment of the Group’s equity, offset by charges for liquidity and funding, various collateral management activities and costs of issuance of capital instruments.
Group ALM allocated revenues of CHF 1,120 million compared with CHF 921 million in the prior year, mainly due to higher income generated from interest rate risk management activities and decreased funding costs.
Operating income after allocations
Group ALM retains central funding costs, certain income from hedging activities, own credit on financial liabilities designated at fair value, and the aforementioned loss related to the buyback of debt and foreign currency translation loss related to the disposal of a subsidiary.
Net operating income remaining in Group ALM was positive CHF 2 million compared with negative CHF 841 million.
Own credit on financial liabilities designated at fair value was a gain of CHF 292 million compared with a loss of CHF 283 million.
Operating expenses
Total operating expenses net of allocations were zero compared with CHF 43 million in the prior year, as actual costs incurred by Group ALM were allocated to the business divisions and other Corporate Center units in 2014 whereas expenses were retained in 2013.
Corporate Center – Non-core and Legacy Portfolio
Corporate Center – Non-core and Legacy Portfolio recorded a loss before tax of CHF 1,503 million in 2015 compared with a loss of CHF 2,005 million in 2014. Operating income was negative CHF 203 million, mainly related to losses from unwind and novation activity. Operating expenses increased to CHF 1,301 million from CHF 1,144 million, mainly due to a CHF 427 million higher net charge for provisions for litigation, regulatory and similar matters, partly offset by lower net expenses for services from other Corporate Center units.
Corporate Center – Non-core and Legacy Portfolio¹ |
| | As of or for the year ended | | % change from |
CHF million, except where indicated | | 31.12.15 | 31.12.14 | 31.12.13 | | 31.12.14 |
Income | | (195) | (863) | 163 | | (77) |
Credit loss (expense) / recovery² | | (8) | 2 | 3 | | |
Total operating income | | (203) | (862) | 166 | | (76) |
Personnel expenses | | 116 | 124 | 205 | | (6) |
General and administrative expenses | | 807 | 507 | 1,668 | | 59 |
Services (to) / from business divisions and other CC units | | 378 | 513 | 785 | | (26) |
of which: services from CC – Services | | 314 | 411 | 693 | | (24) |
Depreciation and impairment of property, equipment and software | | 0 | 0 | 0 | | |
Amortization and impairment of intangible assets | | 0 | 0 | 2 | | |
Total operating expenses³ | | 1,301 | 1,144 | 2,660 | | 14 |
Operating profit / (loss) before tax | | (1,503) | (2,005) | (2,494) | | (25) |
| | | | | | |
Additional information | | | | | | |
Average attributed equity (CHF billion)⁴ | | 2.9 | 4.9 | 10.8 | | (41) |
Total assets (CHF billion)⁵ | | 94.4 | 169.8 | 215.1 | | (44) |
Risk-weighted assets (fully applied, CHF billion)⁶ | | 30.7 | 35.7 | 63.5 | | (14) |
Risk-weighted assets (phase-in, CHF billion)⁶ | | 30.7 | 35.7 | 63.5 | | (14) |
Leverage ratio denominator (fully applied, CHF billion)⁷ | | 46.2 | 93.4 | 160.0 | | (51) |
Personnel (full-time equivalents) | | 77 | 137 | 222 | | (44) |
1 Comparative figures in this table may differ from those originally published in quarterly and annual reports due to adjustments following organizational changes, restatements due to the retrospective adoption of new accounting standards or changes in accounting policies, and events after the reporting period. 2 Includes credit loss (expense) / recovery on reclassified and acquired securities. 3 Refer to "Note 32 Changes in organization and disposals" in the "Consolidated financial statements" section of this report for information on restructuring expenses. 4 Refer to the "Capital management" section of this report for more information on the equity attribution framework. 5 Based on third-party view, i.e., without intercompany balances. 6 Based on the Basel III framework as applicable for Swiss systemically relevant banks (SRBs). 7 Calculated in accordance with Swiss SRB rules. From 31 December 2015 onwards, the leverage ratio denominator calculation is fully aligned with the BIS Basel III rules. Prior-period figures are calculated in accordance with former Swiss SRB rules and are therefore not fully comparable. Refer to the "Capital management" section of this report for more information. |
Financial and operating performance
Corporate Center
2015 compared with 2014
Results
Operating income
Operating income was negative CHF 203 million in 2015 and mainly related to losses from novation and unwind activities, and to valuation losses on financial assets designated at fair value.
In the prior year, revenues were negative CHF 862 million, mainly due to a net loss of CHF 345 million related to funding and debit valuation adjustments (FVA/DVA) on derivatives, of which CHF 252 million was recorded upon the implementation of FVA. In addition, 2014 included negative revenues of CHF 197 million due to novation und unwind activity in Rates, a loss of CHF 108 million resulting from the termination of certain credit default swap contracts and a loss of CHF 97 million in structured credit as a result of exiting the majority of the correlation trading portfolio.
Operating expenses
Total operating expenses increased to CHF 1,301 million from CHF 1,144 million in the prior year, largely as the net charge for provisions for litigation, regulatory and similar matters increased by CHF 427 million to CHF 620 million. This increase was partly offset by CHF 135 million lower net expenses for services from business divisions and other Corporate Center units as a result of reduced consumption of shared services. Moreover, 2014 included CHF 120 million in net expenses related to certain disputed receivables. 2015 included a charge of CHF 50 million for the annual UK bank levy compared with CHF 52 million in 2014.
® Refer to the “Significant accounting and financial reporting changes” section of this report for more information on the change in presentation of service allocations from Corporate Center – Services to business divisions and other Corporate Center units
Balance sheet assets
During 2015, balance sheet assets decreased to CHF 94 billion from CHF 170 billion, mainly reflecting CHF 62 billion lower positive replacement values (PRV). Within our rates portfolio, PRV decreased by CHF 57 billion, driven by fair value decreases following interest rate movements, as well as by our ongoing reduction activity including negotiated bilateral settlements (unwinds), third-party novations, including transfers to central clearing houses (trade migrations) and agreements to net down trades with other dealer counterparties (trade compressions). Collateral delivered against over-the-counter (OTC) derivatives decreased by CHF 9 billion. Funded assets decreased by CHF 4 billion to CHF 7 billion, mainly due to the sale of the last remaining structured bond position in the non-linear rates portfolio and the last collateralized loan obligation bond positions within the securitizations portfolio, as well as a partial loan repayment in credit.
Funded assets and PRV classified as Level 3 in the fair value hierarchy totaled CHF 2 billion as of 31 December 2015.
Risk-weighted assets
Risk-weighted assets (RWA) decreased by CHF 5 billion to CHF 31 billion, mainly as a result of reductions of outstanding OTC derivative transactions, reflecting negotiated bilateral settlements with specific counterparties, third-party novations and trade compressions.
Leverage ratio denominator
The fully applied Swiss systemically relevant bank (SRB) leverage ratio denominator (LRD) was CHF 46 billion as of 31 December 2015. From 31 December 2015 onwards, the Swiss SRB LRD calculation is fully aligned with the BIS Basel III rules. Prior-period figures are calculated in accordance with the former Swiss SRB rules and are therefore not fully comparable.
Personnel
As of 31 December 2015, a total of 77 front-office personnel were employed within Non-core and Legacy Portfolio compared with 137 at the end of the prior year.
® Refer to the “Significant accounting and financial reporting changes” section of this report for more information on personnel allocations from Corporate Center – Services to business divisions and other Corporate Center units
Composition of Non-core and Legacy Portfolio
An overview of the composition of Non-core and Legacy Portfolio is presented in the table below.
The groupings of positions by category and the order in which these are listed are not necessarily representative of the magnitude of the risks associated with them, nor do the metrics shown in the tables necessarily represent the risk measures used to manage and control these positions. The funded assets and PRV measures presented are intended to provide additional transparency regarding progress in the execution of our strategy to exit these positions.
CHF billion
Exposure category | Description | RWA¹ | Funded assets² | PRV³ | LRD⁴ |
31.12.15 | 31.12.14 | 31.12.15 | 31.12.14 | 31.12.15 | 31.12.14 | 31.12.15 | 31.12.14 |
Rates (linear) | Consists of linear OTC products (primarily vanilla interest rate, inflation, basis and cross-currency swaps for all major currencies and some emerging markets) and non-linear OTC products (vanilla and structured options). More than 95% of gross PRV is collateralized. Uncollateralized exposures are well diversified across counterparties, of which the majority is rated investment grade. More than 50% of gross PRV is due to mature by end-2021. | 3.6 | 6.0 | 0.9 | 0.4 | 48.8 | 88.3 | 17.8 | 47.4 |
Rates (non-linear) | 0.7 | 1.2 | 0.1 | 0.7 | 20.5 | 38.3 | 2.8 | 12.8 |
Credit | Consists primarily of a residual structured credit book that is largely hedged against market risk. The remaining counterparty risk is fully collateralized and diversified across multiple names. The residual structured credit book is expected to materially run off by end-2018. Also includes corporate lending and residual distressed credit positions, with a similar expected run-off profile. | 0.5 | 1.0 | 0.4 | 1.1 | 1.4 | 3.7 | 7.0 | 13.7 |
Securitizations | Consists primarily of a portfolio of CDS positions referencing ABS assets with related cash and synthetic hedges to mitigate the impact of directional movements. The majority of the positions are expected to run off by end-2018. | 1.5 | 3.9 | 1.2 | 2.6 | 0.5 | 1.1 | 1.9 | 4.6 |
Auction preferred stock (APS) and auction rate securities (ARSs) | Portfolio of long-dated APS and municipal ARSs. All APS was rated A or above and all ARS exposures were rated Ba1 or above as of 31 December 2015. | 0.9 | 0.9 | 2.8 | 3.0 | – | – | 2.8 | 2.9 |
Muni swaps and options | Swaps and options with US state and local governments. Over 95% of the PRV is with counterparties that were rated investment grade as of 31 December 2015. | 0.5 | 0.6 | – | – | 3.4 | 4.2 | 2.5 | 2.8 |
Other | Exposures to CVA and related hedging activity, as well as a diverse portfolio of smaller positions. | 1.8 | 2.8 | 1.5 | 3.4 | 4.0 | 5.1 | 11.3 | 9.2 |
Operational risk | Operational risk RWA allocated to Non-core and Legacy Portfolio. | 21.1 | 19.3 | – | – | – | – | – | – |
Total | | 30.7 | 35.7 | 7.0 | 11.3 | 78.5 | 140.7 | 46.2 | 93.4 |
1 Fully applied and phase-in Basel III RWA. 2 Funded assets are defined as total balance sheet assets less positive replacement values (PRV) and collateral delivered against OTC derivatives (CHF 8.9 billion as of 2015 and CHF 17.9 billion as of 2014). 3 Positive replacement values (gross exposure excluding the effect of any counterparty netting). 4 Calculated in accordance with Swiss SRB rules. From 31 December 2015 onwards, the leverage ratio denominator calculation is fully aligned with the BIS Basel III rules. Prior-period figures are calculated in accordance with former Swiss SRB rules and are therefore not fully comparable. Refer to the “Capital management” section of this report for more information.
Financial and operating performance
Corporate Center
2014 compared with 2013
Results
Operating income
Income was negative CHF 862 million in 2014, mainly due to a net loss of CHF 345 million related to funding and debit valuation adjustments (FVA / DVA) on derivatives, of which CHF 252 million was recorded upon the implementation of FVA. In addition, 2014 included negative revenues of CHF 197 million, mainly due to novation and unwind activity in Rates, a loss of CHF 108 million resulting from the termination of certain CDS contracts, as well as a loss of CHF 97 million in structured credit as a result of the exit of the majority of the correlation trading portfolio. This was partly offset by a valuation gain of CHF 68 million on certain equity positions.
In the prior year, revenues were CHF 166 million. In 2013, we exercised our option to acquire the SNB StabFund’s equity and recorded total option revaluation gains of CHF 431 million prior to the exercise.
Operating expenses
Total operating expenses decreased to CHF 1,144 million from CHF 2,660 million in the prior year, largely as the net charge for provisions for litigation, regulatory and similar matters declined by CHF 1,127 million to CHF 193 million. Furthermore, restructuring expenses declined by CHF 204 million to CHF 31 million. 2014 included a charge of CHF 52 million for the annual UK bank levy compared with CHF 68 million in 2013. Also, 2014 included CHF 120 million in net expenses related to certain disputed receivables compared with CHF 88 million in 2013.
® Refer to the “Significant accounting and financial reporting changes” section of this report for more information on the change in presentation of service allocations from Corporate Center – Services to business divisions and other Corporate Center units
Balance sheet assets
During 2014, balance sheet assets decreased by CHF 45 billion to CHF 170 billion, largely due to a CHF 33 billion decline in positive replacement values. During 2014, we executed a series of risk transfers to exit the majority of the correlation trading portfolio, which involved entering into a large number of back-to-back trades to transfer market risk. We subsequently derecognized these trades from our balance sheet via novations to third parties, thereby transferring credit risk, and reducing PRV by approximately CHF 11 billion. The originally targeted novations were thus completed. Within our rates portfolio, PRV decreased due to negotiated bilateral settlements with specific counterparties, third-party novations, including transfers to central clearing houses, and agreements to net down trades with other dealer counterparties, partly offset by currency and interest rate movements. Funded assets decreased by CHF 10 billion to CHF 11 billion, mainly due to the full loan repayment to the BlackRock fund, the full exit of precious metal holdings held on behalf of clients and the maturing of the last remaining trade in the structured reverse repurchase agreement portfolio. Furthermore, funded assets declined following the final exit from student loan auction rate securities, the sale of CMBS assets used to hedge certain CDS contracts facing monolines that were terminated during 2014 and a number of smaller position reductions.
Risk-weighted assets
RWA decreased significantly by CHF 28 billion to CHF 36 billion, mainly as a result of reductions of outstanding OTC derivative transactions by means of negotiated bilateral settlements with specific counterparties, third-party novations or trade compressions. In addition, the aforementioned exit of the majority of the correlation trading portfolio and termination of certain CDS contracts as well as the sale of the remaining student loan auction rate securities positions resulted in lower RWA. Furthermore, incremental RWA resulting from the supplemental operational risk capital analysis mutually agreed to by UBS and FINMA decreased by CHF 4 billion.
Leverage ratio denominator
The leverage ratio denominator decreased to CHF 93 billion as of 31 December 2014 from CHF 160 billion at the end of the prior year, mainly due to a reduction in average balance sheet assets.
Personnel
As of 31 December 2014, a total of 137 front-office personnel were employed within Non-core and Legacy Portfolio compared with 222 at the end of the prior year.
® Refer to the “Significant accounting and financial reporting changes” section of this report for more information on personnel allocations from Corporate Center – Services to business divisions and other Corporate Center units
Risk, treasury and capital management
Audited information according to IFRS 7 and IAS 1 Risk and capital disclosures provided in line with the requirements of International Financial Reporting Standard 7 (IFRS 7) Financial Instruments: Disclosures, and International Accounting Standard 1 (IAS 1) Financial Statements: Presentation form part of the financial statements audited by the independent registered public accounting firm, Ernst & Young Ltd, Basel. Information that has been subject to audit is marked as “Audited” within this section of the report and is considered part of the audited financial statements included in the “Consolidated financial statements” section of this report. Audited information provided in this section applies to both UBS Group AG (consolidated) and UBS AG (consolidated). Differences between these two scopes of consolidation are provided where applicable. |
Risk, treasury and capital management
Table of contents
Risk, treasury and capital management
Implementation of the recommendations of the Enhanced Disclosure Task Force (EDTF)
Implementation of EDTF recommendations
The Enhanced Disclosure Task Force (EDTF) was established by the Financial Stability Board (FSB) in 2012 to facilitate discussion among users, authors and other interested parties as to how disclosure can be enhanced to help restore investor confidence in banks. In its “Enhancing the Risk Disclosure of Banks” report issued on 29 October 2012, the EDTF set out recommendations designed to guide banks in disclosing their risk, liquidity and funding, and capital management in a more transparent and comprehensible way.
The EDTF recommendations are based on seven principles, which emphasize the importance of clear, balanced, comprehensive and relevant disclosures. Moreover, they require that disclosures be based on the same information that senior management uses for making its strategic decisions and managing the bank’s risks. These principles are closely aligned with our own financial disclosure principles of transparency, consistency, simplicity, relevance and best practice.
Consistent with our financial disclosure principles, we regard the enhancement of our disclosures as an ongoing commitment. We continue to regularly review our disclosures for further amendments that may be necessary to better reflect the developments in our business, as well as the principles and recommendations established by the EDTF.
The index on the following pages contains a short summary of each of the 32 EDTF recommendations and the cross-references to the locations in our Annual Report 2015 and Pillar 3 disclosures that support the objectives of each recommendation.
® Refer to “Information policy” in the “Corporate governance, responsibility and compensation” section of this report for more information on our financial disclosure principles
Throughout the Annual Report, signposts that are displayed at the beginning of a section, table or chart – Audited | EDTF | Pillar 3 | – indicate that those items have been audited, have addressed the recommendations of the Enhanced Disclosure Task Force, or satisfy Basel Pillar 3 disclosure requirements, respectively. A “triangle” symbol – ▲▲▲ – indicates the end of the signpost.
EDTF index | | | | |
EDTF recommendations and our disclosures | | Location of the disclosures | | |
| | Operating environment and strategy / risk, treasury and capital management / corporate governance, responsibility and compensation | Consolidated financial statements | Additional regulatory information |
| | | | |
General | | | | |
1. Presentation of related information Table with cross-references to the locations of the disclosures in our Annual Report 2015 and Pillar 3 section | | ® EDTF index p. 153-159 | – | – |
2. Risk terminology Definition of the risk terms and risk measures which we use, including indication of key parameters in our risk models | Risk terms | ® Risk definitions p. 165 ® Risk concentrations p. 176 ® Accounting for expected credit losses under IFRS 9, Financial Instruments p. 82-84 | – | – |
| Risk measures | ® Risk measurement p. 173-176 | – | – |
| Key parameters and measurement models | ® Credit risk: Credit risk models p. 198; Probability of default p. 199; Key features of our main credit risk models, Internal UBS rating scale and mapping of external ratings p. 198; Loss given default, Exposure at default, Expected loss p. 199, Stress loss p. 200 ® Market risks: Market risk stress loss, Value-at-Risk (VaR) p. 207; Stressed VaR p. 212; Incremental risk charge p. 215; Comprehensive risk measure p. 216 ® Country risk exposure measure p. 224 ® Operational risk: Advanced measurement approach model p. 232-233 ® Liquidity coverage ratio 235-237 ® Net stable funding ratio p. 244 ® Asset funding p. 243 ® Business risk: Measurement of performance p. 39-40 | – | – |
3. Top and emerging risks Qualitative and quantitative description of top and emerging risks in relation to our business activities and developments of such risks during the reporting period | | ® Risk factors p. 59-74 Risk, treasury and capital management: Key developments p. 160-162 ® Top and emerging risks p. 166-167 ® Accounting for expected credit losses under IFRS 9, Financial Instruments p. 82-84 | – | – |
4. Regulatory ratio developments Description of new key regulatory ratios, pro forma disclosures for these ratios in accordance with FINMA guidance, and information on UBS’s implementation plan for adopting the new requirements | Liquidity and funding | ® Strategy and objectives p. 234 ® Liquidity coverage ratio p. 235-237 ® Net stable funding ratio p. 244 | – | – |
| Capital | ® Proposed new requirements for Swiss SRB p. 26-27 ® Capital management activities p. 249 ® Our capital requirements p. 252 ® Capital ratios p. 254 ® Leverage ratio framework p. 270-271 ® Leverage ratio information p. 272-274 | – | – |
Risk, treasury and capital management
Implementation of the recommendations of the Enhanced Disclosure Task Force (EDTF)
EDTF recommendations and our disclosures | | Location of the disclosures | | |
| | Operating environment and strategy / risk, treasury and capital management / corporate governance, responsibility and compensation | Consolidated financial statements | Additional regulatory information |
| | | | |
Risk governance and risk management strategies / business model | | | | |
5. Risk management organization Summary overview of our key roles and responsibilities for managing risks | Organization and responsibilities | ® Risk definitions p. 165 ® Risk governance p. 168-169 | – | – |
| Processes for managing key risks | ® Risk appetite framework p. 169–173 Overview of measurement, monitoring and management techniques: Credit risk p. 177; Market risk p. 204-205 ® Country risk framework p. 224 ® Operational risk framework p. 230–231 ® Accounting for expected credit losses under IFRS 9, Financial Instruments p. 82-84 | – | – |
6. Risk culture Overview of our principles with respect to risk-taking measures in place to maintain the desired risk culture | Risk culture | ® Risk principles and risk culture p. 170-172 | – | – |
| Procedures and strategies applied to support the culture | ® Organizational principles and structure (Audit Committee, Compensation Committee, Risk Committee) p. 307–308 ® UBS and Society p. 325–330 ® Qualitative measures used in determining compensation p. 348, 354, 359 and 364 | – | – |
7. Business model Risk origination resulting from our business activities and description of how the risks relate to line items in the balance sheet and income statement | Sources of risk and risk management | ® Risk factors p. 59-74 Overview of risks arising from our business activities p. 163 Key risks, risk measures and performance by business division and Corporate Center unit p. 164 ® Risk measures and performance p. 164 ® Main sources of credit risk p. 177 ® Main sources of market risk p. 204 ® Currency management p. 247 | – | – |
| Risk appetite in the context of the business model | ® Risk, treasury and capital management: Key developments p. 160–162 ® Risk appetite framework p. 169–173 | – | – |
| Risk measures and relation of risk measures to line items in the balance sheet and income statement | Market risks: ® Market risk exposures arising from our business activities p. 205–206 | – | Credit risks: ® Table 3: Regulatory credit risk exposure and RWA ® Table 4: Regulatory gross credit risk exposure by geographical region Table 5: Regulatory gross credit risk exposure by counterparty type Table 6: Regulatory gross credit risk exposure by residual contractual maturity ® Table 16: Equity instruments in the banking book |
EDTF recommendations and our disclosures | | Location of the disclosures | | |
| | Operating environment and strategy / risk, treasury and capital management / corporate governance, responsibility and compensation | Consolidated financial statements | Additional regulatory information |
| | | | |
8. Stress testing Information on the use of stress testing within our risk governance and appetite framework, on scenarios applied and agreed with the regulators and the linkage of stress testing results to our risk appetite | | ® Risk appetite framework p. 169–173 ® Stress testing p. 173–175 ® Credit risk: stress loss p. 200 ® Market risk stress loss p. 207 ® Stress testing – liquidity and funding p. 240 | – | – |
Capital adequacy and risk-weighted assets | | | | |
9. Minimum capital requirements Pillar 1 capital requirements, including capital surcharges for G-SIBs and the application of counter-cyclical and capital conservation buffers | | ® Regulatory framework, Capital requirements p. 251–253 ® Swiss SRB capital information (UBS Group) p. 254–255 ® FINMA increment to our AMA based operational risk-related RWA p. 232 | – | – |
10. Components of capital Summary of the information as disclosed in the Pillar 3 report on capital | | ® Eligible capital p. 255–257 ® Reconciliation IFRS equity to Swiss SRB capital p. 257 ® Additional tier 1 and tier 2 capital instruments p. 258-259 | – | ® Table 30: Composition of capital |
11. Flow statement of capital Tabular information in prescribed format | | ® Swiss SRB capital movement p. 256 | – | – |
12. Strategic and capital planning Management’s view on the required or targeted level of capital and how this will be established | | ® Proposed new requirements for Swiss SRB p. 26–27 ® Our strategy p. 34–36 ® Capital management objectives p. 248 ® Capital planning p. 248 ® Capital management activities p. 249–250 | – | – |
13. Risk-weighted assets and related business activities Information on our RWA, and related capital requirements together with underlying exposures | | ® Information on Corporate Center RWA in the table Composition of Non-core and Legacy Portfolio p. 147 ® Risk-weighted assets (UBS Group) p. 262–269 | – | Table 2: Detailed segmentation of exposures and risk-weighted assets ® Table 3: Regulatory credit risk exposure and RWA |
14. Capital requirements for each risk type Quantitative information accompanied by reference to significant models used | | Overview: ® Risk-weighted assets (UBS Group) p. 262–269 Market risks: ® Derivation of regulatory VaR-based RWA and related calculations p. 211–212 ® Derivation of SVaR-based RWA and related calculations p. 212 Derivation of RWA add-on for risks-not-in-VaR and related calculations p. 214 ® Derivation of IRC-based RWA and related calculations p. 215 ® Derivation of CRM-based RWA and related calculations p. 216 | – | Table 2: Detailed segmentation of exposures and risk-weighted assets ® Table 3: Regulatory credit risk exposure and RWA |
Risk, treasury and capital management
Implementation of the recommendations of the Enhanced Disclosure Task Force (EDTF)
EDTF recommendations and our disclosures | | Location of the disclosures | | |
| | Operating environment and strategy / risk, treasury and capital management / corporate governance, responsibility and compensation | Consolidated financial statements | Additional regulatory information |
| | | | |
15. Credit risk analysis Break-down of the credit risk exposures by regulatory parameters and based on a 14-point UBS internal scale | | ® Internal UBS rating scale and mapping of external ratings p. 198 | – | Regulatory net credit risk exposure, weighted average PD, LGD and RWA by internal UBS ratings: ® Table 9a: Sovereigns – Advanced IRB approach ® Table 9b: Banks – Advanced IRB approach ® Table 9c: Corporates – Advanced IRB approach ® Table 9d: Residential mortgages –Advanced IRB approach ® Table 9e: Lombard lending – Advanced IRB approach ® Table 9f: Qualifying revolving retail exposures – Advanced IRB approach ® Table 9g: Other retail – Advanced IRB approach ® Standardized approach Regulatory gross and net credit risk exposure: ® Table 10a: by risk weight under the standardized approach ® Table 10b: under the standardized approach risk-weighted using external ratings |
16. Flow statement of risk-weighted assets Tabular information in prescribed format | | ® Risk-weighted assets movement by key driver – fully applied p. 266 ® Risk-weighted assets by exposure segment p. 263–265 ® RWA development in 2015, Definition of key RWA movement driver categories p. 267–269 | – | – |
17. Credit risk model performance Information on credit risk models including back testing of probability of default, loss given default and credit conversion factors as well as expected loss analysis | | ® Credit risk model confirmation p. 200 ® Backtesting, Main credit models backtesting by regulatory exposure segment p. 200–201 ® Changes to models and model parameters during the period p. 201 | – | ® Table 13: Total actual and expected credit losses |
EDTF recommendations and our disclosures | | Location of the disclosures | | |
| | Operating environment and strategy / risk, treasury and capital management / corporate governance, responsibility and compensation | Consolidated financial statements | Additional regulatory information |
| | | | |
Liquidity | | | | |
18. Liquidity needs and reserves Description of our approach to liquidity management during the normal course of business and during crisis events | Liquidity risk management framework and components of liquidity | ® Strategy and objectives p. 234 ® Liquidity p. 235–240 ® Stress testing p. 240 ® High-quality liquid assets and LCR 235– 237 ® Asset encumbrance p. 238–239 ® Governance p. 234 ® Internal funding and funds transfer pricing p. 241 | – | – |
19. Encumbered and unencumbered assets Available and unrestricted assets to support potential funding and collateral needs | | ® Asset encumbrance p. 238–239 ® Credit ratings p. 244 | ® Note 25 Restricted and transferred financial assets p. 504 – 507 | – |
20. Contractual maturity analysis Analysis of assets, liabilities and off-balance sheet commitments based on the earliest date on which we could be required to pay / latest maturity date of assets, indicating behavioral characteristics as presumed by UBS in order to adjust contractual maturities for risk management purposes | | ® Maturity analysis of assets and liabilities p. 245–246 ® Long-term debt – contractual maturities p. 242 ® Stress testing p. 240 | – | – |
21. Funding strategy Description of our approach to funding, available funding sources, dependencies and concentrations | | ® Funding by product and currency p. 241 ® Internal funding and funds transfer pricing p. 241 ® Changes in sources of funding during the reporting period p. 242–243 ® Funding by currency p. 242 ® Asset funding p. 243 | – | – |
Market risk | | | | |
22. Market risk linkage to the balance sheet Presentation of trading and non-trading market risk factors relevant to the UBS business, including quantitative and qualitative information on the risk factors | | ® Market risk exposures arising from our business activities p. 205–206 ® Effect of interest rate changes on shareholders’ equity and CET1 capital p. 218–219 ® Refer also to EDTF 7 Business model and EDTF 13 Risk-weighted assets and related business activities above for further cross-references | – | – |
23. Market risk analysis Qualitative and quantitative breakdowns of significant trading and non-trading market risk factors | | ® Trading market risk disclosures for VaR, SVaR, IRC, CRM and securitization positions p. 207–217 ® Interest rate risk in the banking book p. 217–221 ® Other market risk exposures p. 222–223 | – | – |
Risk, treasury and capital management
Implementation of the recommendations of the Enhanced Disclosure Task Force (EDTF)
EDTF recommendations and our disclosures | | Location of the disclosures | | |
| | Operating environment and strategy / risk, treasury and capital management / corporate governance, responsibility and compensation | Consolidated financial statements | Additional regulatory information |
| | | | |
24. Market risk measurement model performance Qualitative and quantitative information on our primary market risk measurement models VaR and market risk stress loss, their methodology, assumptions, model limitations and back testing | | ® Value-at-Risk p. 207–213 ® VaR limitations p. 210 ® Backtesting of VaR p. 210–211 ® Development of backtesting revenues against backtesting VaR p. 210 ® VaR model confirmation p. 211 | – | – |
25. Other market risk management techniques Qualitative and quantitative information on each of our complementary market risk measurement models, methodology, assumptions, model limitations and back testing | | ® Market risk stress loss p. 207 ® Stressed VaR p. 212–213 ® Risks-not-in-VaR p. 214 ® Incremental risk charge p. 215 ® Comprehensive risk measure p. 216 | – | – |
Credit risk | | | | |
26. Analysis of credit risk exposures Presentation of the credit risk profile and of significant credit risk components in each business division by relevant parameters such as region, industry sector or banking products | | ® Credit risk profile of the Group – IFRS view p. 177–186 ® Credit risk profile of the Group – Internal risk view p. 187–195 ® Exposures to selected eurozone countries p. 225–226 ® Exposure from single-name credit default swaps referencing to Greece, Italy, Ireland, Portugal or Spain p. 227 ® Emerging markets net exposure by internal UBS country rating category p. 227 ® Emerging market net exposures by major geographical region and product type p. 228 | – | ® Due from banks and loans p. 846–847 |
27. Policies for impaired and non-performing loans Treatment of claims where payments are past due or other criteria indicating non-performance are met, or where there is objective evidence that amounts due cannot be fully collected | | ® Policies for past due, non-performing and impaired claims p. 202–203 | ® Allowances and provisions for credit losses in Note 1 Summary of significant accounting policies p. 415–416 | – |
28. Analysis of impaired and non-performing loans Overview of balances and development of claims which meet the criteria in our policies for non-performing or impaired loans | | ® Impaired financial instruments p. 181–185 ® Past due but not impaired loans p. 186 | ® Note 12 Allowances and provisions for credit losses
p. 447 | ® Impaired and non-performing loans p. 848 ® Summary of movements in allowances and provisions for credit losses p. 850 ® Allocation of the allowances and provisions for credit losses p. 851 |
EDTF recommendations and our disclosures | | Location of the disclosures | | |
| | Operating environment and strategy / risk, treasury and capital management / corporate governance, responsibility and compensation | Consolidated financial statements | Additional regulatory information |
| | | | |
29. Counterparty credit risk from derivative transactions Quantitative and qualitative analysis of the counterparty credit risk that arises from our derivatives transactions | | ® Traded products p. 194–195 | ® Note 14 Derivative instruments and hedge accounting p. 449–456 ® Note 26 Offsetting financial assets and financial liabilities p. 507 | ® Table 14 Credit risk exposure of derivative instruments |
30. Credit risk mitigation Information on our use of collateral and credit hedging | | ® Maximum exposure to credit risk p. 177–179 ® Credit risk mitigation p. 196–197 | ® Note 11 Cash collateral on securities borrowed and lent, reverse repurchase and repurchase agreements, and derivative instruments p. 446 ® Note 26 Offsetting financial assets and financial liabilities p. 507 | – |
Other risks | | | | |
31. Other risks Description of how we identify, measure and manage risks consequential to our business activities other than credit, market, liquidity, funding, operational and foreign exchange risks | | ® Risk factors p. 59–74 ® UBS and Society p. 325–330 ® Risk categories p. 165 | – | – |
32. Publicly known risk events Information on matters that management considers to be material or otherwise significant due to potential financial, reputation or other effects, together with disclosures on the effect on our business, the lessons learned and the resulting changes to risk processes already implemented or in progress | | ® Operational risk: Compliance and operational risk control developments during the period p. 229–230 | ® Note 22 Provisions and contingent liabilities p. 466 – 477 ® Note 37 Events after the reporting period p. 557 | – |
Risk, treasury and capital management
Key developments
Key developments
Our credit risk profile has remained stable over the year and our net credit loss expense remained low relative to the size of our lending portfolios. We continued to manage market risks at low levels. We concluded our program to combine the Compliance and Operational Risk Control functions and maintained our focus on enhancing our operational risk framework. Notwithstanding these developments, operational risks remain elevated for UBS and the industry.
Credit risks
EDTF | Gross banking products exposure was CHF 485 billion compared with CHF 497 billion at the end of 2014. Gross impaired exposure increased slightly by CHF 0.1 billion to CHF 1.5 billion, and net credit loss expense totaled CHF 117 million for the year compared with CHF 78 million, which continued to be low relative to the size of our lending portfolios.
A substantial portion of our lending exposure arises from our Swiss domestic business, which offers corporate loans and mortgage loans secured against residential properties and income-producing real estate, and is therefore linked to the condition of the Swiss economy. These domestic lending portfolios have continued to perform well, with net credit loss expense and delinquency levels remaining low. Nevertheless, we remain mindful that the continued strength of the Swiss franc could have a negative effect on the economy, in particular on exporters, and we continue to closely monitor developments in the Swiss economy. Were these negative effects to materialize, they could adversely affect some of our counterparties and lead to an increase in credit loss expense in future periods.
Due to the current low-price environment in commodities, exposures to certain counterparties in the energy sector currently carry more risk than in prior periods. As of 31 December 2015, our total net banking products exposure to the oil and gas sector, predominantly recorded within the Investment Bank, was CHF 6.1 billion, including both funded and unfunded exposures, mainly in North America. About half of this exposure was to the integrated and mid-stream segments, which we expect to be less affected by the currently low energy price levels. Exposures potentially vulnerable to low energy prices are closely monitored and we have macro hedges in place to mitigate some of this risk. Specific allowances for these energy-related exposures totaled CHF 40 million as of 31 December 2015. A sustained period of depressed energy prices could result in an increased credit loss expense for this sub-segment of our portfolio in future periods.
Loan underwriting activity in the Investment Bank, which gives rise to concentrated exposure of a temporary nature, was muted for much of 2015, but picked up toward the end of the year. The increase in activity was predominantly investment grade business, driven by strategic mergers and acquisitions. While distribution of these investment grade exposures has been sound, conditions in the sub-investment grade markets have remained challenging such that some lower-rated deals have not been distributed as planned, leading to a buildup in the level of our exposures intended for syndication. These exposures are classified as held for trading, with fair values reflecting the market conditions at the end of the year.
The global market sell-off in the third quarter of 2015 led to a higher level of margin calls within our security-backed lending businesses, although margin calls were largely resolved within the normal process and did not result in any material losses. ▲
® Refer to “Credit risk” in the “Risk management and control” section of this report for more information
® Refer to “Investment Bank” under “Credit risk” in the “Risk management and control” section of this report for more information on our exposures to the energy sector
Market risks
EDTF | We continued to manage market risks in our trading businesses at low levels. We continued to see some volatility in our risk profile and value-at-risk, largely driven by positions arising from client facilitation, as well as option expiries. ▲
® Refer to “Market risk” in the “Risk management and control” section of this report for more information
Consequential risks
EDTF | In 2015, we concluded our program to combine the Compliance and Operational Risk Control functions in order to manage the Group’s compliance, conduct and operational risks in a fully integrated manner. This transformation has resulted in a strengthened control environment, the introduction of globally consistent processes, substantial enhancements to our detective control capabilities, and a well-defined operating model which is aligned to the Group's strategy and evolving regulatory requirements.
We continued to invest significantly in dedicated security programs to strengthen our cyber defense. The threats faced across the financial industry are broadly similar and include data theft, increasingly by criminal organizations, disruption of service, such as so-called distributed denial of service attacks, and cyber fraud, often through business email compromise and phishing attacks. To effectively address the challenges posed by the dynamic external environment and our own technological innovation, we have recently appointed a Head of Cyber Risk. The role will focus on enterprise governance for cyber-related activities, and will include regular assessments of cyber threat intelligence, analysis of the effectiveness of our controls, and progress in improving our cyber defense capability.
We have substantially completed a program of remediation work that has focused on further strengthening our front-office processes and controls within the FX business. In addition, our systems have been enhanced to better segregate sensitive information, and our monitoring and surveillance capability was significantly enhanced so that we can more proactively detect unusual patterns of employee behavior and improper business and employee practices. This program also meets the specific undertakings made to the U.S. Commodity Futures Trading Commission, the Connecticut Department of Banking, the U.S. Department of Justice, the UK Financial Conduct Authority, the Swiss Financial Market Supervisory Authority and the Federal Reserve Bank of New York, as part of the resolution of the FX matter. Where applicable we are applying similar control and monitoring enhancements across our other trading businesses including the Rates and Credit, Equities and Non-Core and Legacy businesses.
The management of conduct risks has been central to our remediation activities and we have implemented a firm-wide conduct risk framework that is embedded into the existing operational risk framework. This framework includes conduct-related management information which is reviewed at business and regional governance forums, providing metrics on employee conduct, clients and markets, with employee conduct a central consideration in the annual compensation process. We also significantly strengthened our oversight controls regarding personal account dealing for our personnel by centralizing all accounts either within UBS, or into a number of defined brokers.
Other key developments included the consolidation of related operational resilience disciplines into a single function, continued enhancement of our monitoring and surveillance capabilities with a focus on more powerful and versatile enterprise-wide analytics systems and centralized services, and the completion of a capability enhancement program for our financial crime risk control environment.
We will maintain our focus on enhancing the operational risk control environment, with our strategy for 2016 focusing on continued development of our core capabilities in the prevention of financial crime, monitoring and surveillance and conduct risk, while strengthening our control frameworks for cyber threats, vendor management and transformational change.
Financial crime is particularly noteworthy given the current volatility in the geopolitical and associated sanctions environment, which continues to reinforce the importance of a robust, sophisticated and agile anti-financial crime framework. ▲
® Refer to “Anti-money laundering and anti-corruption” in the “Regulation and supervision” section of this report for more information
® Refer to “Note 22b Litigation, regulatory and similar matters” in the “Consolidated financial statements” section of this report for more information
Liquidity management
EDTF | We continued to maintain a sound liquidity position throughout the year. Our high-quality liquid assets increased to CHF 208 billion from CHF 188 billion in 2014, and our three-month average liquidity coverage ratio was 124% for the fourth quarter. ▲
® Refer to the “Treasury management” section of this report for more information
Funding management
EDTF | We further strengthened our funding profile through the issuance of loss absorbing capital in the form of additional tier 1 capital and senior unsecured notes. As of 31 December 2015, our pro forma net stable funding ratio was stable at 105% compared with 31 December 2014. As part of optimizing our interest expense, while maintaining our strong liquidity, funding and capital position, in December 2015, we successfully executed a cash tender offer to repurchase certain senior and subordinated debt and covered bonds with an aggregate principal repurchase amount equivalent to approximately CHF 6.1 billion. ▲
® Refer to the “Treasury management” section of this report for more information
Risk, treasury and capital management
Key developments
Capital management
EDTF | Our strong capital position provides us with a solid foundation for growing our business and enhancing our competitive positioning. At the end of 2015, our common equity tier 1 (CET1) capital ratio increased to 14.5% on a fully applied basis, the highest fully applied capital ratio in our peer group of large global banks. On a phase-in basis, our CET1 capital ratio was 19.0%. As of 31 December 2015, our Swiss SRB leverage ratio was 5.3% on a fully applied basis and 6.2% on a phase-in basis. Effective 31 December 2015, our Swiss SRB leverage ratio denominator calculation is fully aligned with the Bank for International Settlements (BIS) Basel III definition. In 2015, we issued the equivalent of CHF 5.2 billion of additional tier 1 perpetual capital notes, as well as CHF 5.6 billion of senior unsecured debt which will contribute to our total loss-absorbing capacity in anticipation of international regulatory developments, including revisions to the Swiss too big to fail framework. ▲
® Refer to the “Capital management” section of this report for more information
Risk management and control
Overview of risks arising from our business activities
EDTF | Our business is constrained by the capital we have available to cover risk-weighted assets (RWA) resulting from the risks in our business, by the size of our on- and off-balance sheet assets through their contribution to our leverage ratio and regulatory liquidity ratios, and by our risk appetite. Together, these constraints create a close link between our strategy, the risks that our businesses take and the balance sheet and capital resources that we have available.
As described in the “Capital management” section of this report, our equity attribution framework reflects our objectives of maintaining a strong capital base and managing our businesses in a way that they appropriately balance profit potential, risk, balance sheet and capital usage. The framework establishes this link through the inclusion of RWA, the Swiss SRB leverage ratio denominator (LRD) and risk-based capital (RBC), an internal measure of risk similar to economic capital, as three key drivers for the allocation of tangible equity to our business divisions and Corporate Center. In addition to tangible equity, we allocate equity to support goodwill and intangible assets as well as certain capital deduction items to arrive at total equity attributed to the business divisions and Corporate Center.
For each of our business divisions and Corporate Center units, the table on the next page presents the correlation between their risk exposures, the measures described above and their performance. In addition to the key risks inherent in each business division and Corporate Center unit, the table presents an overview of the key drivers of tangible attributed equity (RWA, LRD and RBC), as well as tangible attributed equity, total assets and adjusted operating profit before tax. We present tangible attributed equity, because we consider it to be more closely correlated with the risk measures applied. This helps explain how the activities in our business divisions and Corporate Center are reflected in our risk measures, and it explains the performance of the business divisions and Corporate Center in the context of these requirements. ▲
® Refer to the “Capital management” section of this report for more information on RWA, LRD and our equity attribution framework
® Refer to “Statistical measures” in this section for more information on RBC
® Refer to the “Adjusted results” table in the “Group performance” section of this report for more information
Risk, treasury and capital management
Risk management and control

EDTF |
Risk measures and performance |
| | 31.12.15 |
| | Wealth Management | Wealth Management Americas | Personal & Corporate Banking | Asset Management | Investment Bank | CC – Services | CC – Group ALM | CC – Non-core and Legacy Portfolio | Group |
CHF billion, as of or for the year ended | | | | | | | | | | |
Risk-weighted assets (fully applied)¹ | | 25.3 | 21.9 | 34.6 | 2.6 | 62.9 | 23.6 | 6.0 | 30.7 | 207.5 |
of which: credit risk | | 12.6 | 8.5 | 32.9 | 1.7 | 35.5 | 1.3 | 5.0 | 6.9 | 104.4 |
of which: market risk | | 0.0 | 1.0 | 0.0 | 0.0 | 10.5 | (2.9)² | 0.9 | 2.6 | 12.1 |
of which: operational risk | | 12.6 | 12.4 | 1.6 | 0.9 | 16.8 | 9.5 | 0.1 | 21.1 | 75.1 |
Leverage ratio denominator (fully applied)³ | | 119.0 | 62.9 | 153.8 | 2.7 | 268.0 | 4.8 | 240.2 | 46.2 | 897.6 |
Risk-based capital⁴ | | 1.0 | 1.3 | 2.9 | 0.3 | 6.1 | 12.6 | 3.6 | 2.7 | 30.3 |
Average tangible attributed equity⁵ | | 2.8 | 1.9 | 3.9 | 0.4 | 7.2 | 15.9 | 3.2 | 2.9 | 38.2 |
Total assets | | 119.9 | 61.0 | 141.2 | 12.9 | 253.5 | 22.6 | 237.5 | 94.4 | 942.8 |
Operating profit / (loss) before tax (adjusted)⁶ | | 2.8 | 0.8 | 1.7 | 0.6 | 2.3 | (1.1) | (0.1) | (1.4) | 5.6 |
| | | | | | | | | | |
| | 31.12.14 |
| | Wealth Management | Wealth Management Americas | Personal & Corporate Banking | Asset Management | Investment Bank | CC – Services | CC – Group ALM | CC – Non-core and Legacy Portfolio | Group |
CHF billion, as of or for the year ended | | | | | | | | | | |
Risk-weighted assets (fully applied)¹ | | 25.4 | 21.7 | 33.1 | 3.8 | 66.7 | 23.0 | 7.1 | 35.7 | 216.5 |
of which: credit risk | | 12.3 | 8.7 | 31.4 | 3.0 | 35.0 | 1.1 | 4.3 | 12.8 | 108.6 |
of which: market risk | | 0.0 | 1.0 | 0.0 | 0.0 | 13.6 | (4.5)² | 2.7 | 3.6 | 16.5 |
of which: operational risk | | 12.9 | 11.9 | 1.6 | 0.8 | 18.1 | 12.1 | 0.1 | 19.3 | 76.7 |
Leverage ratio denominator (fully applied)³ | | 138.3 | 63.3 | 165.9 | 14.9 | 288.3 | (2.6) | 236.3 | 93.4 | 997.8 |
Risk-based capital⁴ | | 1.3 | 1.1 | 3.0 | 0.3 | 6.8 | 9.1 | 4.3 | 3.6 | 29.5 |
Average tangible attributed equity⁵ | | 2.7 | 2.1 | 4.1 | 0.5 | 7.4 | 8.8 | 3.2 | 4.9 | 33.7 |
Total assets | | 127.6 | 56.0 | 143.7 | 15.2 | 292.3 | 19.9 | 237.9 | 169.8 | 1,062.5 |
Operating profit / (loss) before tax (adjusted)⁶ | | 2.5 | 0.9 | 1.6 | 0.5 | 0.2 | (0.7) | (0.3) | (1.9) | 2.8 |
1 Based on the Basel III framework as applicable for Swiss systemically relevant banks (SRBs). Refer to the “Capital management” section of this report for more information. 2 Negative market risk numbers are due to the diversification effect allocated to CC – Services. 3 Calculated in accordance with Swiss SRB rules. From 31 December 2015 onward, the leverage ratio denominator calculation is fully aligned with the BIS Basel III rules. Prior-period figures are calculated in accordance with former Swiss SRB rules and are therefore not fully comparable. Refer to the “Capital management” section of this report for more information. 4 Refer to “Statistical measures” in the “Risk management and control” section of this report for more information on risk-based capital. 5 Refer to the “Capital management” section of this report for more information on our equity attribution framework. 6 Adjusted results are non-GAAP financial measures as defined by SEC regulations. Refer to the “Adjusted results” table in the “Group performance” section of this report for more information. |
p
Risk categories
We categorize the risks faced by our business divisions and Corporate Center as outlined in the table below.

Risk, treasury and capital management
Risk management and control
Top and emerging risks
EDTF | Our approach to identifying and monitoring top and emerging risks is an ongoing part of our risk management framework. The top and emerging risks disclosed below reflect those that we currently think have the potential to significantly affect the Group and which could materialize within one year. Investors should also carefully consider all information set out in the “Risk factors” section of this report, where we discuss the top and emerging risks in more detail, as well as other risks we currently consider material, that may impact our ability to execute our strategy and may affect our business activities, financial condition, results of operations and prospects.
Regulatory and legislative changes: We continue to be exposed to a number of regulatory and legislative changes, some of which have already been adopted and implemented, but also some that are subject to legislative action or to further rulemaking by regulatory authorities before final implementation. This results in uncertainty as to whether and in which form these regulatory and legislative changes will be adopted, the timing and content of implementing regulations and interpretations and / or the dates of their effectiveness. In addition, both adopted and proposed changes differ significantly across the major jurisdictions, making it difficult to manage a global institution and potentially putting us at a disadvantage to those peers operating either in only one jurisdiction or in jurisdictions where the regulatory environment is considered to be less stringent. Moreover, managing the risk profile of a subsidiarized organization results in increased effort and complexity. While we aim to leverage Group-wide global frameworks and processes, local regulatory requirements can result in potential inefficiencies such as, for example, the application of different models for the same risk, the retention of buffer capital in subsidiaries that impede on the free flow of capital across the Group, and the requirement for staff to be resident in the local jurisdiction.
We have programs in place to address the risks arising from regulatory and legislative changes, including ongoing monitoring of proposals, providing guidance and feedback to the relevant authorities and developing internal assessment and implementation plans. During 2015, our more active programs included those relating to resolution planning and resolvability, changes to our legal entity structure and operating model, and new and revised capital, liquidity and funding-related regulations, as well as requirements related to risk data aggregation and reporting. We have made good progress across all of these programs in preparing for their implementation, including the establishment of UBS Group AG as the holding company of the UBS Group and the successful establishment of UBS Switzerland AG. ▲
® Refer to “Regulatory and legislative changes may adversely affect our business and ability to execute our strategic plans” in the “Risk factors” section of this report for more information
Legal and regulatory enforcement risks: EDTF | We are subject to a large number of claims, disputes, legal proceedings and government investigations and we anticipate that our ongoing business activities will continue to give rise to such matters in the future. We continue to work on enhancing our operational risk framework and our relationships with regulatory authorities and on resolving open matters in a manner most beneficial to our stakeholders. Information on those litigation, regulatory and similar matters currently considered significant by management is disclosed in Note 22 of the “Consolidated financial statements” section of this report. The extent of our financial exposure to these and other matters could be material and could substantially exceed the level of provisions that we have established, which was CHF 3.0 billion as of 31 December 2015. At this point in time, we believe that the industry continues to operate in an environment where the net charge associated with litigation, regulatory and similar matters will remain elevated for the foreseeable future, and we will continue to be exposed to a number of significant claims and regulatory matters. ▲
® Refer to “Material legal and regulatory risks arise in the conduct of our business” in the “Risk factors” section of this report for more information
Market conditions and the macroeconomic climate: EDTF | We are exposed to a number of macroeconomic issues as well as general market conditions. These external pressures may have a significant adverse effect on our business activities and related financial results, primarily through reduced margins, asset impairments and other valuation adjustments. Accordingly, these macroeconomic factors are considered in our development of stress testing scenarios for our ongoing risk management activities.
Management continues to consider developments in the eurozone to be of greatest significance to us, but we also perceive a growing risk from the macroeconomic developments in China and emerging markets more broadly, as well as the weakening of commodity prices, particularly oil. These factors have given rise to increased market volatility in 2015, which could well persist throughout 2016. In addition, as our strategic plans depend heavily upon our ability to generate growth and revenue in emerging markets, we are monitoring developments in these regions very closely. The potential effects of a China-led global economic slowdown have been captured in the calculation of our post-stress fully applied common equity tier 1 (CET1) capital ratio following the replacement of the Eurozone Crisis scenario with a new Global Recession scenario as the binding scenario in our combined stress testing framework.
Given the limited negative fallout from recent experiences in Europe and Japan, there is a growing perception that negative interest rates have become a conventional policy tool, and there is a strong possibility that rates will be cut further in the coming months. Prolonged negative rates could lead to unpredictable structural shifts in behavior and economic and financial distortions.
We continue to closely monitor developments in our domestic economy, which is heavily reliant on exports, and for which the continued strength of the Swiss franc could have a negative effect. ▲
® Refer to “Interest rate risk in the banking book” in this section and to the “Risk factors” section of this report for more information on negative interest rates
® Refer to “Performance in the financial services industry is affected by market conditions and the macroeconomic climate” and “Fluctuation in foreign exchange rates and continuing low or negative interest rates may have a detrimental effect on our capital strength, our liquidity and funding position, and our profitability” in the “Risk factors” section of this report for more information
® Refer to “Risk measurement” in this section for more information on macroeconomic considerations, including stress testing
® Refer to “Country risk” in this section for more information on our exposures to selected eurozone and emerging markets countries
Reputational risk: EDTF | Our reputation is critical to achieving our strategic goals and financial targets, and damage to it can have fundamental negative effects on our business and prospects. This has been emphasized for us in recent years, following events such as the matters related to LIBOR and investigations into our foreign exchange business. This has triggered an enhanced focus on improving and sustaining a strong risk culture and UBS behaviors across the Group, the implementation of a coherent and holistic conduct risk framework, and the continuing development of our surveillance and monitoring capabilities. ▲
® Refer to “Our reputation is critical to the success of our business” in the “Risk factors” section of this report for more information
® Refer to “Risk culture” in this section for more information
® Refer to “Operational risk” in this section for more information
Cyber risk: EDTF | One of the most critical and constantly evolving risks facing the broader industry is the threat of cyber- attacks. Along with the rest of the industry we face ongoing threats, such as data theft, disruption of service and cyber fraud, all of which have the potential for extremely significant impact. We continue to invest significantly in dedicated security programs to strengthen our cyber defense. We have recently appointed a Head of Cyber Risk to effectively address the challenges posed by the dynamic external environment and our own technology innovation. The role will focus on enterprise governance for cyber-related activities, and will include regular assessments of cyber threat intelligence, analysis of the effectiveness of our controls, and progress on improving our capability. To further enhance our resilience, our cyber response framework, comprising ”Analyze,“ "Protect,“ ”Detect“ and ”Respond / Recover“ capabilities, will be further strengthened through a dedicated program and will include assessments of our vendor's capabilities. ▲
® Refer to “Operational risk” in this section for more information
Other operational risks: EDTF | Due to the operational complexity of all our businesses, we are continually exposed to operational risks such as process error, failed execution and fraud. We believe we have a strong operational risk management framework in place to help ensure that these risks are appropriately controlled. However, in line with the industry, some areas retain an elevated level of inherent risk, specifically financial crime, anti-money laundering / know your client, internal and external fraud, and anti-bribery and corruption. Our operational risks management framework has been significantly enhanced following the unauthorized trading incident in 2011. In view of the changing nature of operational risks and the environment within which we operate, we continuously review our associated control frameworks to allow us to make enhancements where necessary. Our strategy for 2016 will focus on continued development of our core capabilities in the prevention of financial crime and monitoring and surveillance. In addition, conduct risk will remain a high priority to ensure that we treat clients and the markets in which we operate appropriately. We will continue to strengthen our control frameworks for vendor management and transformational change. ▲
® Refer to “Operational risks affect our business” in the “Risk factors” section of this report for more information
® Refer to “Operational risk” in this section for more information on our management of operational risk
Risk, treasury and capital management
Risk management and control
Risk governance
EDTF | Pillar 3 | Our risk governance framework operates along three lines of defense. Business management, as the first line of defense, owns its respective risk exposures and is required to maintain effective processes and systems to manage their risks, including robust and comprehensive internal controls and documented procedures. Business management must also have appropriate supervisory controls and review processes in place to identify control weaknesses, inadequate processes and unexpected events. Control functions act as the second line of
defense, providing independent oversight of primary and consequential risks. This includes setting risk limits and protecting against non-compliance with applicable laws and regulations. Group Internal Audit (GIA) forms the third line of defense, evaluating the overall effectiveness of governance, risk management and the control environment, including the assessment of how the first and second lines of defense meet their objectives. ▲▲
These key roles and responsibilities for risk management and control are illustrated in the following chart and described below.
Audited | EDTF | Pillar 3 | The Board of Directors (BoD) is responsible for determining the risk principles, risk appetite and major portfolio limits of the Group, including their allocation to the business divisions and Corporate Center. The risk assessment and management oversight performed by the BoD considers evolving best practices and is intended to conform to statutory requirements. The BoD is supported by the BoD Risk Committee, which monitors and oversees the risk profile of the Group and the implementation of the risk framework as approved by the BoD, as well as assessing the Group’s key risk measurement methodologies. The Corporate Culture and Responsibility Committee supports the BoD in fulfilling its duty to safeguard and advance the Group’s reputation for responsible and sustainable conduct. It reviews and assesses stakeholder concerns and expectations pertaining to the societal performance of UBS and the development of UBS’s corporate culture and their possible consequences for UBS, and recommends appropriate actions to the BoD. The Chairman of the BoD and the Audit Committee oversee the performance of Group Internal Audit.
The Group Executive Board (GEB) implements the risk framework, controls the Group’s risk profile and approves key risk policies.
The Group Chief Executive Officer (Group CEO) is responsible for the results of the Group, has risk authority over transactions, positions and exposures, and also allocates portfolio limits approved by the BoD within the business divisions and Corporate Center.
Business management comprises business division and regional Presidents. The business division Presidents are accountable for the results of their business divisions. This includes actively managing their risk exposures, and ensuring profit potential, risk, balance sheet and capital usage are balanced. The regional Presidents coordinate and implement UBS’s strategy in their region, jointly with the business division Presidents and heads of the control and support functions. They have a veto power over decisions with respect to all business activities that may have a negative regulatory or reputational effect in their respective regions.
The Group Chief Risk Officer (Group CRO) reports directly to the Group CEO and has functional and management authority over Risk Control throughout the Group. Risk Control provides independent oversight of all primary and most consequential risks as outlined in the “Risk categories” section above. This includes establishing methodologies to measure and assess risk, setting risk limits, and developing and operating an appropriate risk control infrastructure. The risk control process is supported by a framework of policies and authorities. Business division, regional and legal entity Chief Risk Officers have delegated authority for their respective divisions, regions and entities. Moreover, authorities are delegated to risk officers according to their expertise, experience and responsibilities.
The Group Chief Financial Officer (Group CFO) is responsible for ensuring that disclosure of our financial performance meets regulatory requirements and corporate governance standards with clarity and transparency. The Group CFO is also responsible for the management of UBS’s tax affairs, treasury and capital, including management of funding and liquidity risk and UBS’s regulatory capital ratios. The Group CFO is also responsible for implementation of the associated control frameworks, with the exception of the control framework for treasury activities, for which responsibility is with Risk Control.
The Group General Counsel (Group GC) is responsible for implementing the Group’s risk management and control principles for legal matters, and for managing the legal function for the UBS Group. The Group GC is responsible for reporting legal risks and material litigation, and for managing legal, internal, special and regulatory investigations.
Group Internal Audit (GIA) independently, objectively and systematically assesses the adherence to our strategy, the effectiveness of governance, risk management and control processes at Group, business division and regional levels, including compliance with legal, regulatory and statutory requirements, as well as with internal policies and contracts. GIA has a functional reporting line to the Audit Committee. ▲▲▲
Risk appetite framework
EDTF | Pillar 3 | Our risk appetite is defined at the aggregate level and reflects the types of risk that we are willing to accept or intend to avoid. It is established via a complementary set of qualitative and quantitative objectives defined on a Group-wide level and embedded throughout our business divisions and legal entities through Group, business division and legal entity policies, limits and authorities. These objectives are a critical foundation to maintaining a robust risk culture throughout our organization. The “Risk appetite framework” chart depicts the key elements of this framework, which are described in more detail below.
Qualitative statements, reflected in the Group’s Risk Management and Control Principles, and various policies and initiatives, aim to ensure we maintain the desired risk culture.
Quantitative risk appetite objectives relate Group-wide risk exposure to our risk capacity and are designed to enhance the Group’s resilience against the impact of potential severe adverse economic or geopolitical events. They cover areas such as the Group’s capital buffer, solvency, earnings, leverage, liquidity and funding, and are subject to periodic review, including as part of the annual business planning process.
These objectives are complemented by operational risk appetite objectives, which are established for each of our operational risk categories, for example market conduct, theft, fraud, data confidentiality, and technology risks. Operational risk events that exceed risk tolerances set according to predetermined percentages of the firm’s operating income must be escalated to the business division President or higher, as appropriate.
Risk, treasury and capital management
Risk management and control

The status of risk appetite objectives is evaluated each month, and reported to the BoD and the GEB. Our risk appetite may change over time and, as a consequence, portfolio limits and risk authorities will be subject to periodic reviews and changes, in particular in the context of the annual business planning process.
In addition, escalation triggers embedded in the firm’s Recovery Plan are drawn from the set of risk limits that management monitors on a routine basis.
Our risk appetite framework is encompassed in a single overarching policy and conforms to the Financial Stability Board’s “Principles for An Effective Risk Appetite Framework” published on 18 November 2013. ▲▲
Risk principles and risk culture
EDTF | A strong and dynamic risk culture is a prerequisite for success in today’s highly complex operating environment. We are focused on fostering and further strengthening our culture as a source of sustainable competitive advantage both from a risk and a performance point of view. By placing prudent and disciplined risk-taking at the center of every decision, we want to achieve our goals of delivering unrivaled client satisfaction, creating long-term value for stakeholders, and making UBS one of the most attractive companies to work for in the world.
Our risk appetite framework combines all the important elements of our risk culture, expressed in our Pillars, Principles and Behaviors, our Risk Management and Control Principles, our Code of Business Conduct and Ethics, and our Total Reward Principles. Together, these aim to align the decisions we make with the firm’s strategy, principles and risk appetite. They help define who we are and the way we operate each day, providing a solid foundation for promoting risk awareness, leading to appropriate risk taking and establishing robust risk management and control processes. ▲
Pillars, Principles and Behaviors
EDTF | Our risk culture is based on our three keys to success – Pillars (capital strength, efficiency and effectiveness, and risk management), Principles (client focus, excellence and sustainable performance) and Behaviors (integrity, collaboration and challenge). A strong emphasis is placed on every individual’s accountability for adhering to our principles and behaviors at all times, with an unremitting focus on the long-term objectives and success of UBS, thereby safeguarding the firm’s reputation, our most valuable asset. ▲
Risk Management and Control Principles
EDTF | These principles highlight the key aspects of our risk management and control philosophy and are consistent with our three-lines-of-defense model. ▲
Code of Business Conduct and Ethics
EDTF | The Code of Business Conduct and Ethics (Code) outlines the principles and practices that all our employees and BoD members are required to follow unreservedly, both in letter and in spirit, supported by an annual adherence certification process. Included in the Code are requirements covering laws, rules and regulations, ethical and responsible behavior, information management, the work environment, social responsibility and disciplinary measures. ▲
Total Reward Principles
EDTF | Our performance measurement and management process requires that all employees have risk objectives aligned to their roles and responsibilities. This helps reinforce their understanding that rigorous risk management plays an essential role in our efforts to deliver the best possible client experience and achieve our business objectives. In short, everyone at UBS is responsible for anticipating, addressing and managing risks. The performance measurement and management process links into the Group’s compensation framework.
Our compensation philosophy is to provide our employees with compensation that recognizes their individual contributions, team, business division and Group performance, and clearly links their pay to performance, not simply the delivery of business targets, but also how those results were achieved through our employees' behaviors. As explained in more detail in the “Compensation” section of this report, the performance of GEB members is assessed through both quantitative and qualitative factors. Qualitative factors include reinforcing a culture of accountability and responsibility, demonstrating commitment to being a responsible corporate citizen and acting with integrity in all interactions with our stakeholders.
The “Compensation” section of this report explains how the compensation of each employee is decided and shows how the individual’s contribution to promoting our principles and standards of behaviors is factored into the compensation process. The process includes an examination of the individual’s efforts to actively manage risk, striking an appropriate balance between risk and reward, and to what extent the individual exhibited professional and ethical behavior. Forfeiture provisions enable the firm to forfeit some, or all, of any unvested deferred portion of compensation should an employee commit certain harmful acts and in other select circumstances.
® Refer to the “Our employees” and “Compensation” sections of this report for more information
In embedding the desired risk culture within the Group, these principles are supported by a range of initiatives covering employees at all levels, which include the elements described below. ▲
House View on Leadership
EDTF | Leadership is a critical component in developing a culture that is a source of pride and competitive advantage. Introduced in September 2014, the UBS House View on Leadership is a set of explicit expectations for leaders that establishes consistent leadership standards across UBS. It was developed by a cross-business group of employees and external experts, led by the Group Executive Board. In 2015, the House View of Leadership was integrated into all promotion, hiring and development processes for positions at Director level and higher. The aim is to improve hiring decisions, and to support the development and promotion of present and future UBS leaders. It is also used as a basis for leadership development programs and initiatives. ▲
Principles of good supervision
EDTF | The Group has defined principles of good supervision, which establish clear expectations of managers and employees with respect to supervisory responsibilities, specifically: to take responsibility, to organize their business, to know their employees and what they do, to know their business, to create a good compliance culture and to respond to and resolve issues. Supervisors are expected to understand and set a good example of professional behavior and to act as role models, to be open about issues, to be alert to unusual behavior and to act on any red flags, ensuring that issues are resolved. We have established frameworks intended to ensure adherence to these principles. ▲
Whistleblowing
EDTF | We continue to promote a culture of constructive challenge, encouraging employees to speak up. Our whistleblowing policy provides a formal framework and multiple channels for all employees to raise concerns, either openly or anonymously, about suspected breaches of laws, regulations, rules and other legal requirements to which the Group is subject, or our Code of Business Conduct and Ethics, policies, or any relevant professional standards. Raising employee awareness through training and communication is an integral part of our approach. We have established procedures which are intended to ensure that whistleblowing concerns are investigated, and appropriate and consistent action is taken. ▲
Risk, treasury and capital management
Risk management and control
Compliance and risk training
EDTF | We have a mandatory training program in place for all employees covering a range of compliance and risk-related topics, including anti-money laundering and operational risk. In addition, more specialized training is provided for employees depending on their specific roles and responsibilities, such as training on credit risk and market risk for those working in trading areas. During 2015, our employees and external staff were required to complete over 800,000 mandatory training sessions, an increase of approximately 14% from 2014. Approximately 65% of these sessions were produced by Compliance and Operational Risk Control (C&ORC), as we continue to focus on strengthening our risk culture. As a rule, the training sessions need to be completed, usually together with an assessment, within a specified deadline. Failure to complete mandatory training sessions satisfactorily within the given deadline results in consequences including disciplinary action. In 2015, our ultimate completion rate for these mandatory training sessions was 100%. ▲
Quantitative risk appetite objectives
EDTF | Pillar 3 | Through a set of quantitative risk appetite objectives, we aim to ensure that our aggregate risk exposure remains within our desired risk capacity, based on our capital and business plans. The specific definition of risk capacity for each objective seeks to ensure that we have sufficient capital, earnings and funding liquidity to protect our business franchises and exceed minimum regulatory requirements under a severe stress event. The risk appetite objectives are evaluated as part of the annual business planning process, and approved by the BoD. The comparison of risk exposure with risk capacity is a key consideration in management decisions on potential adjustments to the business strategy and the risk profile of the Group.
We make use of both scenario-based stress tests and statistical risk measurement techniques to assess the impact of a severe stress event at a Group-wide level. These complementary frameworks capture exposures to all material primary and consequential risks across our business divisions and Corporate Center units. ▲▲
® Refer to “Risk measurement” in this section for more information on our stress test and statistical frameworks
EDTF | Pillar 3 | Risk appetite objectives at the business division level are logically derived from and must conform to the Group-wide objectives. They may also comprise objectives specific to the division, related to the specific activities and risks in that division. Risk appetite objectives are also set for certain legal entities. These must be consistent with the Group-wide Risk Appetite Framework and approved in accordance with the regulations of the legal entity and the firm’s regulations. Differences may exist that reflect the specific nature, size, complexity and regulations applicable to the relevant legal entity.
In determining our risk capacity, we adjust projected earnings from the strategic plan for business risk to reflect lower expected earnings and lower expenses, for example due to the reversal of variable compensation accruals in a severe stress event. We also adjust our capital to take into account the impact of stress on deferred tax assets, pension plan assets and liabilities, and accruals for capital returns to shareholders.
The chart on the previous page provides an overview of our quantitative risk appetite objectives. ▲p
Risk measurement
Audited | EDTF | Pillar 3 | A variety of methodologies and measurements are applied to quantify the risks of our portfolios and potential risk concentrations. Risks that are not fully reflected within standard measures are subject to additional controls, which may include pre-approval of specific transactions and the application of specific restrictions. Models to quantify risk are generally developed by dedicated units within control functions and are subject to independent verification. ▲
Applied models and methodologies must be approved and regularly reviewed in accordance with regulatory requirements as well as internal policies to test that models perform as expected, produce results comparable with actual events and values, and reflect best-in-practice approaches as well as recent academic developments. Accordingly, we assess whether the model is performing satisfactorily, whether additional analysis is required, and whether recalibration or redevelopment needs to be performed. Results and conclusions are presented to the relevant governance body and, as required, to regulators.
The ongoing process of assessing model quality and performance in the production environment comprises two components: model verification, being the initial and regular assessment of the model’s conceptual soundness, performed by Quantitative Risk Control (QRC), and model confirmation, representing the regular process of confirming the accuracy and appropriateness of the model output and its application, carried out by the model developers and reviewed by QRC. ▲▲
® Refer to “Credit risk,” “Market risk” and “Operational risk” in this section for more information on model confirmation procedures
Stress testing
EDTF | We perform stress testing to quantify the loss that could result from extreme, yet plausible macroeconomic and geopolitical stress events. This enables us to identify, better understand and manage our potential vulnerabilities and risk concentrations. Stress testing plays a key role in our limits framework at Group-wide, business division, legal entity and portfolio levels. Stress test results are regularly reported to the BoD, the Risk Committee and the GEB. We also provide detailed stress loss analyses to the Swiss Financial Market Supervisory Authority (FINMA) in accordance with its requirements. As described in the “Risk appetite framework” section above, stress testing, along with statistical loss measures, plays a central role in our risk appetite and business planning processes.
Our stress testing framework incorporates three pillars: (i) combined stress tests, (ii) a comprehensive range of portfolio and risk-type-specific stress tests and (iii) reverse stress testing.
Risk, treasury and capital management
Risk management and control
Our combined stress test (CST) framework is scenario-based and aims to quantify overall Group-wide losses which could result from a number of potential global systemic events. The framework captures all material primary and consequential risks, as well as business risks, as indicated in the “Risk categories” section above. Scenarios are forward-looking and encompass macroeconomic and geopolitical stress events calibrated to different levels of potential severity. Each scenario is implemented through the expected evolution of market indicators and economic variables under that scenario. The resulting effect on our primary, consequential and business risks is then assessed to estimate the overall loss and capital implications were the scenario to occur. At least once a year, the Risk Committee approves the most relevant scenario, known as the binding scenario, to be used as the main scenario for regular CST reporting and for monitoring risk exposure against our minimum capital, earnings and leverage ratio objectives in our risk appetite framework. Results are reported to, and discussed with, the Risk Committee and the GEB on a monthly basis and reported to the BoD and FINMA monthly.
Within the overall model governance framework overseen by the Group CRO and Group CFO, the Enterprise-wide Stress Committee (ESC) is responsible for ensuring the consistency and adequacy of the assumptions and scenarios used for our Group-wide stress measures. As part of these responsibilities, the ESC is charged with ensuring that the suite of stress scenarios adequately reflects current and potential developments in the macroeconomic and geopolitical environment, our current and planned business activities, and actual or potential risk concentrations and vulnerabilities in our portfolios. The ESC meets at least quarterly and is comprised of Group, business division and legal entity representatives of Risk Control. In executing its responsibilities, the ESC considers input from the Risk “Think Tank,” a panel of senior representatives from the business divisions, Risk Control and economic research, which meets quarterly to review the current and possible future market environment, with the aim of identifying potential stress scenarios which could materially affect the Group’s profitability. This results in a range of internal stress scenarios that are developed and evolve over time, separate from the scenarios mandated by FINMA.
Each scenario captures a wide range of macroeconomic variables that are considered relevant to assessing the effect of the stress scenario on our portfolios. These include gross domestic product (GDP), equity indices, interest rates, foreign exchange rates, commodities, property prices and unemployment. Assumed changes in these macroeconomic variables in each scenario are used to stress the key risk drivers of our portfolios. For example, lower GDP growth and rising interest rates may reduce the income of clients to whom we have lent money, leading to changes in the credit risk parameters for probability of default, loss given default and exposure at default, and resulting in higher predicted credit losses in the stress scenario. We also capture the business risk resulting from lower fee, interest and trading income, and lower expenses. These effects are measured across all material risk types and all businesses to calculate the aggregate estimated effect of the scenario on profit and loss, other comprehensive income, RWA, Swiss SRB leverage ratio denominator (LRD) and, ultimately, our capital and leverage ratios. The assumed changes in macroeconomic variables are updated periodically to take account of changes in the current and possible future market environment.
Through 2015, the binding scenario for CST was the internal Eurozone Crisis scenario, which assumed a sharp deterioration in the eurozone economy triggering sovereign and bank defaults in certain peripheral countries, a downturn in financial markets and contagion to the global economy. CST risk exposure was broadly stable over the year with most of the month-to-month variability in this measure coming from temporary loan underwriting exposure in the Investment Bank.
As part of the CST framework, five additional stress scenarios were routinely monitored throughout 2015.
– Recession scenario represents renewed financial market turmoil due to the failure of a major global financial institution, leading to prolonged financial deleveraging and dramatically plunging activity around the globe.
– US Crisis scenario represents a loss of confidence in the US, leading to international portfolio repositioning out of US dollar-denominated assets, sparking an abrupt and substantial US dollar sell-off. The US is pushed back into recession, other industrialized countries replicate this pattern and inflationary concerns lead to an overall higher interest rate level.
– China Hard Landing scenario represents an economic correction in China with the resulting impact on the global economy, particularly emerging markets.
– Middle East / North Africa scenario represents a spill-over of political upheaval leading to a spike in oil prices and a recession in developed countries.
– Depression scenario represents a more pronounced and prolonged version of the Eurozone Crisis scenario. Additional peripheral countries default and exit the eurozone, and advanced economies are pulled into a prolonged period of economic stagnation.
As a result of the recent market developments, the main stress scenario used in our business planning process is a new Global Recession scenario, which combines elements of the Eurozone Crisis and China Hard Landing scenarios. The Global Recession scenario assumes that a hard landing in China would lead to severe contagion of Asian and emerging markets economies, while multiple debt restructurings in Europe, related direct losses for European banks and fear of a eurozone breakup would severely affect developed markets such as Switzerland, the UK and the US. This Global Recession scenario has replaced the Eurozone Crisis scenario in our suite of combined stress testing scenarios, and was adopted as the binding scenario at the end of 2015, ensuring that the potential effects of a China-led global economic slowdown are captured in the calculation of our post-stress fully applied common equity tier 1 (CET1) capital ratio.
Portfolio-specific stress tests are measures that are tailored to the risks of specific portfolios. Our portfolio stress loss measures are informed by past events, but also include forward-looking elements. For example, the expected market movements within our liquidity adjusted stress metric are derived using a combination of historical market behavior, based on an analysis of historical events, and forward-looking analysis including consideration of defined scenarios that have not occurred historically. Results of portfolio-specific stress tests may be subject to limits to explicitly control risk-taking, or may be monitored without limits to identify vulnerabilities.
Reverse stress testing starts from a defined stress outcome (for example, a specified loss amount, reputational damage, a liquidity shortfall, or a breach of regulatory capital ratios) and works backwards to identify the economic or financial scenarios that could result in such an outcome. As such, reverse stress testing is intended to complement forward stress tests by assuming “what if” outcomes that could extend beyond the range normally considered, and thereby potentially challenge assumptions regarding severity and plausibility. The results of reverse stress testing are reported to relevant governance bodies according to the materiality and scope of the exercise.
Additionally, we routinely analyze the effect of increases or decreases in interest rates and changes in the structure of yield curves.
Moreover, Group Treasury perform stress testing to determine the optimum asset and liability structure that allows us to maintain an appropriately balanced liquidity and funding position under various scenarios. These scenarios differ from those outlined above, because they are focused on specific situations which could generate liquidity and funding stress, as opposed to the scenarios used in the CST framework, which focus on the impact on profit and loss and capital.
Most major financial firms employ stress tests, but their approaches vary significantly, having been tailored to their individual business models and portfolios. Moreover, there is a lack of industry standards defining stress scenarios or the way they should be applied to a firm’s risk exposures. Consequently, comparisons of stress test results between firms can be misleading and, therefore, like many of our peers, we do not publish quantitative stress test results of our internal stress tests. p
® Refer to “Credit risk,” and “Market risk” in this section for more information on stress loss measures
® Refer to “Our stated capital returns objective is based, in part, on capital ratios that are subject to regulatory change and may fluctuate significantly” in the “Risk factors” section of this report for more information
Statistical measures
EDTF | In addition to our scenario-based CST measure, we employ a statistical stress framework that allows us to calculate and aggregate risks using statistical techniques, enabling us to derive stress events at chosen confidence levels.
This framework is used to derive a distribution of potential earnings based on historically observed market changes in combination with the firm’s actual risk exposures, considering effects on both income and expenses. From this we determine earnings-at-risk (EaR), which measures the potential shortfall in earnings (i.e., the deviation from forecasted earnings) at a 95% confidence level and is evaluated over a one-year horizon. EaR is used for the assessment of the earnings objectives in our risk appetite framework.
We extend the EaR measure by incorporating the effects of gains and losses recognized through other comprehensive income, to derive a distribution of potential effects of stress events on common equity tier 1 (CET1) capital. From this distribution, we derive our capital-at-risk (CaR) buffer measure at a 95% confidence level for the assessment of our capital and leverage ratio risk appetite objectives, and we derive our CaR solvency measure at a 99.9% confidence level for the assessment of our solvency risk appetite objective.
The CaR solvency measure is also used as the basis to derive the contributions of business divisions and Corporate Center to risk-based capital (RBC), which is a core component of our equity attribution framework. RBC measures the potential capital impairment from an extreme stress event at a 99.9% confidence level to estimate the capital required to absorb unexpected loss while remaining able to fully repay all creditors. We revised several elements of the RBC model during the year. The net effect of these model changes was a moderate increase in the overall level of RBC. ▲
® Refer to the “Capital management” section of this report for more information on the equity attribution framework
Risk, treasury and capital management
Risk management and control
Portfolio and position limits
EDTF | The Group-wide stress and statistical metrics are complemented by lower-level portfolio and position limits, triggers and targets. The combination of these measures provides for a comprehensive, granular control framework which is applied to our business divisions and Corporate Center, as well as the significant legal entities as relevant to the key risks arising from their business models.
We apply limits to a variety of exposures at the portfolio level, using statistical and stress-based measures, such as value-at-risk, liquidity adjusted stress, notional loan underwriting limits, economic value sensitivity and portfolio default simulations for our loan books. These are complemented with a set of controls for net interest income sensitivity, mark-to-market losses on available-for-sale portfolios, and the effect of foreign exchange movements on capital and capital ratios.
Portfolio measures are supplemented with position-level controls. Risk measures for position controls are based on market risk sensitivities and counterparty-level credit risk exposures. Market risk sensitivities include sensitivities to changes in general market risk factors such as equity indices, foreign exchange rates and interest rates, and sensitivities to issuer-specific factors such as changes in an issuer’s credit spread or default risk. We monitor a significant number of market risk controls for the Investment Bank and Corporate Center – Group Asset and Liability Management and Non-core and Legacy Portfolio on a daily basis. Counterparty measures capture the current and potential future exposure to an individual counterparty taking into account collateral and legally enforceable netting agreements. ▲
Risk concentrations
Audited | EDTF | Pillar 3 | A risk concentration exists where (i) a position is affected by changes in a group of correlated factors, or a group of positions are affected by changes in the same risk factor or a group of correlated factors, and (ii) the exposure could, in the event of large but plausible adverse developments, result in significant losses. The categories in which risk concentrations may occur include counterparties, industries, legal entities, countries or geographical regions, products and businesses. ▲▲
The identification of risk concentrations requires judgment, as potential future developments cannot be accurately predicted and may vary from period to period. In determining whether we have a risk concentration, we consider a number of elements, both individually and collectively. These elements include the shared characteristics of the positions and our counterparties, the size of the position or group of positions, the sensitivity of the position or group of positions to changes in risk factors and the volatility and correlations of those factors. Also important in our assessment is the liquidity of the markets where the positions are traded, and the availability and effectiveness of hedges or other potential risk-mitigating factors. The value of a hedging instrument may not always move in line with the position being hedged, and this mismatch is referred to as basis risk.
Risk concentrations are subject to increased oversight by Risk Control and are assessed to determine whether they should be reduced or mitigated depending on the available means to do so. It is possible that material losses could occur on asset classes, positions and hedges, particularly if the correlations that emerge in a stressed environment differ markedly from those envisaged by our risk models. ▲
® Refer to “Credit risk” and “Market risk” in this section for more information on the compositions of our portfolios
® Refer to the “Risk factors” section of this report for more information
Credit risk
Audited | EDTF | Pillar 3 | Main sources of credit risk
– A substantial portion of our lending exposure arises from our Swiss domestic business, which offers corporate loans and mortgage loans secured against residential properties and income-producing real estate, and is therefore tied to the health of the Swiss economy.
– Within the Investment Bank, our credit exposure is predominantly investment grade. Loan underwriting activity gives rise to concentrated exposure of a temporary nature.
– Our wealth management businesses conduct securities-based lending and mortgage lending.
– Credit risk within Non-core and Legacy Portfolio relates to derivatives transactions, predominantly carried out on a cash-collateralized basis, and securitized positions. ▲▲▲
Audited | EDTF | Pillar 3 | Overview of measurement, monitoring and management techniques
– Credit risk arising from transactions with individual counterparties is measured according to our estimates of probability of default, exposure at default and loss given default. Limits are established for individual counterparties and groups of related counterparties covering banking and traded products as well as settlement amounts. Risk control authorities are approved by the Board of Directors and are delegated to the Group Chief Executive Officer, Group Chief Risk Officer and divisional Chief Risk Officers based on risk exposure amounts and internal credit rating.
– Limits apply not only to the current outstanding amount, but also to contingent commitments and the potential future exposure of traded products.
– For the Investment Bank, our monitoring, measurement and limit framework distinguishes between exposures intended to be held to maturity (take-and-hold exposures) and those which are intended to be held for a short term, pending distribution or risk transfer (temporary exposures).
– We also use models to derive portfolio credit risk measures of expected loss, statistical loss and stress loss at the Group-wide and business division levels and establish portfolio level limits at these levels.
– Credit risk concentrations can arise if clients are engaged in similar activities, are located in the same geographical region or have comparable economic characteristics, for example, if their ability to meet contractual obligations would be similarly affected by changes in economic, political or other conditions. To avoid credit risk concentrations, we establish limits and / or operational controls that constrain risk concentrations at portfolio and sub-portfolio levels with regard to sector exposure, country risk and specific product exposures. ▲▲▲
Credit risk profile of the Group – IFRS view
Maximum exposure to credit risk
Audited | EDTF | The tables on the following pages provide the Group’s maximum exposure to credit risk by class of financial instrument and the respective collateral and other credit enhancements mitigating credit risk for these classes of financial instruments. This view is in accordance with International Financial Reporting Standards (IFRS). The maximum exposure to credit risk includes the carrying amounts of financial instruments recognized on the balance sheet subject to credit risk and the notional amounts for off-balance sheet arrangements.
Where information is available, collateral is presented at fair value. For other collateral such as real estate, a reasonable alternative value is used. Credit enhancements, such as credit derivative contracts and guarantees, are included at their notional amounts. Both are capped at the maximum exposure to credit risk for which they serve as security.
Further on in this section, we provide complementary views of credit risk based on our internal management view, which can differ in certain respects from the requirements of IFRS. ▲▲
® Refer to the “UBS Group AG consolidated supplemental disclosures required under Basel III Pillar 3 regulations” section of this report for more information on the credit exposures used in the determination of our required regulatory capital and additional information on credit derivatives
Risk, treasury and capital management
Risk management and control
Audited | EDTF |
Maximum exposure to credit risk | | | | |
| | 31.12.15 |
| | | Collateral | | Credit enhancements |
CHF billion | | Maximum exposure to credit risk | Cash collateral received | Collateral- ized by securities | Secured by real estate | Other collateral¹ | | Netting | Credit derivative contracts | Guarantees |
Financial assets measured at amortized cost on the balance sheet | | | | | | | | | | |
Balances with central banks | | 89.8 | | | | | | | | |
Due from banks² | | 11.9 | | 0.2 | | | | | | 0.1 |
Loans | | 312.0 | 13.1 | 101.0 | 164.4 | 15.2 | | | 0.4 | 2.9 |
Cash collateral on securities borrowed | | 25.6 | | 25.1 | | | | | | |
Reverse repurchase agreements | | 67.9 | | 62.8 | | 4.6 | | | | |
Cash collateral receivables on derivative instruments³ | | 23.8 | | | | | | 12.4 | | |
Other assets | | 20.0 | | 11.1 | | | | | | |
Total financial assets measured at amortized cost | | 550.9 | 13.1 | 200.1 | 164.4 | 19.8 | | 12.4 | 0.4 | 3.0 |
Financial assets measured at fair value on the balance sheet | | | | | | | | | | |
Positive replacement values⁴ | | 167.4 | | 5.8 | | | | 142.7 | | |
Trading portfolio assets – debt instruments⁵˒⁶ | | 29.0 | | | | | | | | |
Financial assets designated at fair value – debt instruments⁷ | | 5.6 | | 3.5 | | 0.1 | | | 0.6 | |
Financial investments available-for-sale – debt instruments⁷ | | 61.7 | | | | | | | | |
Total financial assets measured at fair value | | 263.7 | 0.0 | 9.3 | 0.0 | 0.1 | | 142.7 | 0.6 | 0.0 |
Total maximum exposure to credit risk reflected on the balance sheet | | 814.7 | 13.1 | 209.4 | 164.4 | 19.8 | | 155.2 | 1.0 | 3.0 |
Guarantees⁸ | | 16.0 | 1.2 | 2.1 | 0.2 | 1.5 | | | 0.1 | 3.0 |
Loan commitments⁸ | | 56.1 | | 1.8 | 1.7 | 8.7 | | | 6.9 | 2.0 |
Forward starting transactions, reverse repurchase and securities borrowing agreements | | 6.6 | | 6.6 | | | | | | |
Total maximum exposure to credit risk not reflected on the balance sheet | | 78.6 | 1.2 | 10.5 | 1.9 | 10.2 | | 0.0 | 7.0 | 5.0 |
Total⁹ | | 893.3 | 14.3 | 220.0 | 166.3 | 30.1 | | 155.2 | 8.1 | 8.0 |
|
▲p
Maximum exposure to credit risk (continued) |
| | 31.12.14 |
| | Maximum exposure to credit risk | Collateral | | Credit enhancements |
CHF billion | | Cash collateral received | Collateral- ized by securities | Secured by real estate | Other collateral¹ | | Netting | Credit derivative contracts | Guarantees |
Financial assets measured at amortized cost on the balance sheet | | | | | | | | | | |
Balances with central banks | | 102.3 | | | | | | | | |
Due from banks² | | 13.3 | | 0.2 | | | | | | 0.2 |
Loans | | 315.8 | 14.3 | 94.8 | 166.1 | 21.2 | | | 0.7 | 2.6 |
Cash collateral on securities borrowed | | 24.1 | | 23.8 | | | | | | |
Reverse repurchase agreements | | 68.4 | | 63.2 | | 4.7 | | | | |
Cash collateral receivables on derivative instruments³ | | 31.0 | | | | | | 20.4 | | |
Other assets | | 21.2 | | 12.7 | | | | | | 0.0 |
Total financial assets measured at amortized cost | | 576.1 | 14.4 | 194.7 | 166.1 | 25.9 | | 20.4 | 0.7 | 2.8 |
Financial assets measured at fair value on the balance sheet | | | | | | | | | | |
Positive replacement values⁴ | | 257.0 | | 5.7 | | | | 223.9 | | |
Trading portfolio assets - debt instruments⁵˒⁶ | | 31.8 | | | | | | | | |
Financial assets designated at fair value – debt instruments⁷ | | 4.3 | | 3.3 | | 0.1 | | | 0.7 | |
Financial investments available-for-sale – debt instruments⁷ | | 56.2 | | | | | | | | |
Total financial assets measured at fair value | | 349.4 | 0.0 | 9.0 | 0.0 | 0.1 | | 223.9 | 0.7 | 0.0 |
Total maximum exposure to credit risk reflected on the balance sheet | | 925.4 | 14.4 | 203.6 | 166.1 | 26.0 | | 244.2 | 1.4 | 2.8 |
Guarantees⁸ | | 17.7 | 1.4 | 1.7 | 0.2 | 1.9 | | | 0.8 | 3.1 |
Loan commitments⁸ | | 50.7 | 0.1 | 3.8 | 1.9 | 9.2 | | | 8.5 | 1.6 |
Forward starting transactions, reverse repurchase and securities borrowing agreements | | 10.4 | | 10.4 | | | | | | |
Total maximum exposure to credit risk not reflected on the balance sheet | | 78.8 | 1.4 | 16.0 | 2.1 | 11.1 | | 0.0 | 9.3 | 4.7 |
Total⁹ | | 1,004.2 | 15.8 | 219.6 | 168.2 | 37.1 | | 244.2 | 10.7 | 7.5 |
1 Includes but not limited to life insurance contracts, inventory, accounts receivable, mortgage loans, patents, and copyrights. 2 Due from banks includes amounts held with third-party banks on behalf of clients. The credit risk associated with these balances may be borne by those clients. 3 Included within cash collateral receivables on derivative instruments are margin balances due from exchanges or clearing houses. Some of these margin balances reflect amounts transferred on behalf of clients who retain the associated credit risk. The amount shown in the netting column represents the netting potential not recognized in the balance sheet. Refer to “Note 26 Offsetting financial assets and financial liabilities” for more information. 4 The amount shown in the netting column represents the netting potential not recognized in the balance sheet. Refer to “Note 26 Offsetting financial assets and financial liabilities” in the “Consolidated financial statements” section of this report for more information. 5 These positions are generally managed under the market risk framework and are included in VaR. For the purpose of this disclosure, collateral and credit enhancements were not considered. 6 Does not include debt instruments held for unit-linked investment contracts and investment fund units. 7 Does not include investment fund units. 8 The amount shown in the "Guarantees" column largely relates to sub-participations. Refer to the “Off-balance sheet” section in this report for more information. 9 As of 31 December 2015, total maximum exposure to credit risk for UBS AG (consolidated) was CHF 0.7 billion higher than for UBS Group, all related to unsecured “Loans”. As of 31 December 2014, total maximum exposure to credit risk for UBS AG (consolidated) was CHF 0.3 billion higher than for UBS Group, of which CHF 0.2 billion related to unsecured “Loans” and CHF 0.1 billion related to unsecured “Other assets.” |
▲p
Risk, treasury and capital management
Risk management and control
Audited | EDTF |
Financial assets subject to credit risk by rating category |
CHF billion | | 31.12.15 |
Rating category¹ | | 0–1 | 2–3 | 4–5 | 6–8 | 9–13 | defaulted | Total |
Balances with central banks | | 87.9 | 1.3 | 0.6 | | | | 89.8 |
Due from banks | | 1.3 | 8.8 | 1.1 | 0.7 | | | 11.9 |
Loans | | 31.9 | 132.1 | 67.5 | 61.4 | 17.7 | 1.4 | 312.0 |
Cash collateral on securities borrowed and reverse repurchase agreements | | 21.7 | 40.2 | 20.1 | 11.2 | 0.4 | | 93.5 |
Positive replacement values | | 20.7 | 116.9 | 23.2 | 5.9 | 0.7 | | 167.4 |
Cash collateral receivables on derivative instruments | | 8.4 | 10.2 | 4.7 | 0.4 | 0.1 | | 23.8 |
Trading portfolio assets – debt instruments² | | 14.2 | 8.6 | 3.1 | 1.9 | 1.2 | | 29.0 |
Financial investments available-for-sale – debt instruments³ | | 52.4 | 9.2 | | | | | 61.7 |
Other financial instruments⁴ | | 0.3 | 2.7 | 8.6 | 11.0 | 2.7 | 0.4 | 25.6 |
Guarantees, commitments and forward starting transactions | | | | | | | | |
Guarantees | | 2.2 | 7.1 | 3.6 | 2.2 | 0.7 | 0.3 | 16.0 |
Loan commitments | | 1.8 | 22.4 | 19.6 | 6.1 | 6.2 | 0.0 | 56.1 |
Forward starting reverse repurchase agreements | | | 6.5 | | 0.0 | | | 6.6 |
Forward starting securities borrowing agreements | | | | | | | | 0.0 |
Total⁵ | | 242.6 | 366.0 | 152.1 | 100.8 | 29.6 | 2.2 | 893.3 |
| | | | | | | | |
CHF billion | | 31.12.14 |
Rating category¹ | | 0–1 | 2–3 | 4–5 | 6–8 | 9–13 | defaulted | Total |
Balances with central banks | | 102.0 | 0.3 | | | | | 102.3 |
Due from banks | | 1.5 | 8.3 | 2.9 | 0.5 | 0.1 | | 13.3 |
Loans | | 29.1 | 140.0 | 61.2 | 66.6 | 17.8 | 1.2 | 315.8 |
Cash collateral on securities borrowed and reverse repurchase agreements | | 1.9 | 66.2 | 11.7 | 11.4 | 1.2 | | 92.5 |
Positive replacement values | | 18.7 | 203.1 | 26.3 | 7.8 | 0.8 | 0.3 | 257.0 |
Cash collateral receivables on derivative instruments | | 4.8 | 20.5 | 5.0 | 0.7 | | | 31.0 |
Trading portfolio assets – debt instruments² | | 12.2 | 10.9 | 3.5 | 2.6 | 2.6 | | 31.8 |
Financial investments available-for-sale – debt instruments³ | | 46.5 | 9.6 | 0.1 | | | | 56.2 |
Other financial instruments⁴ | | 0.1 | 3.8 | 8.5 | 13.0 | 0.1 | 0.1 | 25.6 |
Guarantees, commitments and forward starting transactions | | | | | | | | |
Guarantees | | 2.8 | 7.5 | 3.3 | 3.1 | 0.7 | 0.2 | 17.7 |
Loan commitments | | 1.3 | 28.7 | 8.1 | 6.4 | 6.4 | | 50.7 |
Forward starting reverse repurchase agreements | | | 9.8 | 0.5 | | | | 10.3 |
Forward starting securities borrowing agreements | | | 0.1 | | | | | 0.1 |
Total⁵ | | 220.9 | 508.6 | 131.1 | 112.0 | 29.6 | 2.0 | 1,004.2 |
1 Refer to the “Internal UBS rating scale and mapping of external ratings” table in this section for more information on rating categories. 2 Does not include debt instruments held for unit-linked investment contracts and investment fund units. 3 Does not include investment fund units. 4 Comprised of financial assets designated at fair value – debt instruments (excluding investment fund units) and other assets. 5 As of 31 December 2015, total financial assets subject to credit risk for UBS AG (consolidated) was CHF 0.7 billion higher than for UBS Group, all related to “Loans” in rating categories 4–5. As of 31 December 2014, total financial assets subject to credit risk for UBS AG (consolidated) was CHF 0.3 billion higher than for UBS Group, of which CHF 0.2 billion related to “Loans” and CHF 0.1 billion related to “Other assets,” all in rating categories 6–8. |
▲p
Impaired financial instruments
Audited | EDTF | Pillar 3 | The following tables show impaired financial instruments, comprising loans, guarantees and loan commitments, and securities financing transactions. Gross impaired financial instruments increased slightly by CHF 0.1 billion to CHF 1.5 billion as of 31 December 2015. After deducting the estimated liquidation proceeds of collateral and specific allowances and provisions, net impaired financial instruments was CHF 0.6 billion as of 31 December 2015 compared with CHF 0.5 billion at the end of the prior year.
The table on the next page provides a breakdown of movements in the specific and collective allowances and provisions for impaired financial instruments. ▲▲▲
® Refer to the “Investment Bank, Non-Core and Legacy Portfolio, and Group ALM: distribution of net OTC derivatives and SFT exposure across internal UBS ratings and loss given default (LGD) buckets” table in this section for OTC derivative exposures in the Investment Bank and Non-core and Legacy Portfolio which are rated at level 13 or in default according to our internal rating scale
Audited | EDTF | Pillar 3 |
Impaired financial instruments by type |
CHF million | | Gross impaired financial instruments | | Allowances and provisions¹ | | Estimated liquidation proceeds of collateral² | | Net impaired financial instruments |
| | 31.12.15 | 31.12.14 | | 31.12.15 | 31.12.14 | | 31.12.15 | 31.12.14 | | 31.12.15 | 31.12.14 |
Loans (including due from banks) | | 1,226 | 1,204 | | (692) | (708) | | (163) | (180) | | 371 | 316 |
Guarantees and loan commitments | | 292 | 187 | | (35) | (23) | | (4) | (1) | | 252 | 162 |
Defaulted securities financing transactions | | | 5 | | | (4) | | | (1) | | | 0 |
Total impaired financial instruments | | 1,518 | 1,396 | | (727) | (735) | | (168) | (182) | | 623 | 479 |
1 Includes CHF 6 million in collective loan loss allowances (31 December 2014: CHF 8 million). 2 Does not include oil and gas reserves related to reserve-based lending. |
▲▲▲
EDTF | Pillar 3 |
Impaired financial instruments by geographical region | | | |
CHF million | Impaired financial instruments | Specific allowances and provisions | Impaired financial instruments net of specific allowances and provisions | Collective allowances | Total allowances and provisions 31.12.15 | Total allowances and provisions 31.12.14 |
Asia Pacific | 92 | (58) | 34 | 0 | (58) | (38) |
Latin America | 29 | (21) | 9 | 0 | (21) | (19) |
Middle East and Africa | 12 | (6) | 6 | 0 | (6) | (22) |
North America | 229 | (107) | 123 | (2) | (108) | (50) |
Switzerland | 924 | (364) | 559 | (4) | (369) | (411) |
Rest of Europe | 231 | (165) | 66 | 0 | (165) | (194) |
Total 31.12.15 | 1,518 | (721) | 797 | (6) | (727) | |
Total 31.12.14 | 1,396 | (727) | 668 | (8) | | (735) |
|
▲p
Risk, treasury and capital management
Risk management and control
EDTF | Pillar 3 |
Impaired financial instruments by exposure segment | | | |
CHF million | Impaired financial instruments | Specific allowances and provisions | Collective allowances | Total allowances and provisions 31.12.15 | Write-offs for the year ended 31.12.15 | Total allowances and provisions 31.12.14² |
Sovereigns | 12 | (14) | 0 | (14) | (1) | (14) |
Banks | 7 | (6) | 0 | (6) | 0 | (15) |
Corporates | 1,236 | (589) | | (589) | (136) | (609) |
Central Counterparties | 0 | 0 | 0 | 0 | 0 | 0 |
Retail | | | | | | |
Residential mortgages | 125 | (40) | 0 | (40) | 0 | (39) |
Lombard lending | 63 | (47) | 0 | (47) | (2) | (19) |
Qualifying revolving other retail exposures | 24 | (17) | 0 | (17) | (24) | (16) |
Other retail | 51 | (9) | | (9) | (2) | (15) |
Non allocated segment¹ | 0 | | (6) | (6) | 0 | (8) |
Total 31.12.15 | 1,518 | (721) | (6) | (727) | (164) | |
Total 31.12.14 | 1,396 | (727) | (8) | | (154) | (735) |
1 With the exception of Wealth Management Americas Lombard lending, collective loan loss allowances are not allocated to individual counterparties. 2 Following improvements in data sourcing, the allocation to the exposure segments for 31 December 2014 have been restated to ensure comparability with the figures as of 31 December 2015. |
▲▲
EDTF | Pillar 3 |
Changes in allowances and provisions |
CHF million | Specific allowances and provisions for banking products and securities financing | Collective allowances | For the year ended 31.12.15 | For the year ended 31.12.14 |
Balance at the beginning of the year | 727 | 8 | 735 | 750 |
Write-offs/usage of provisions | (162) | (2) | (164) | (154) |
Recoveries | 48 | 0 | 48 | 29 |
Increase / (decrease) recognized in the income statement | 117 | 0 | 117 | 78 |
Foreign currency translation | (11) | 0 | (11) | 21 |
Other | 2 | 0 | 2 | 11 |
Balance at the end of the year | 721 | 6 | 727 | 735 |
▲p
Impaired loans
EDTF | Pillar 3 | Gross impaired loans (including due from banks) increased slightly to CHF 1,226 million as of 31 December 2015 from CHF 1,204 million at the end of the prior year. The majority of this exposure relates to loans in our Swiss domestic business, although also reflects new impairments related to lending to the energy sector in the Investment Bank. The ratio of impaired loans to total loans remained unchanged at 0.4%.
Audited | As of 31 December 2015, collateral held against our impaired loan exposure mainly consisted of real estate and securities. It is our policy to dispose of foreclosed real estate as soon as practicable. The carrying amount of foreclosed property recorded in our balance sheet under Other assets at the end of 2015 and 2014 amounted to CHF 44 million and CHF 43 million, respectively. We seek to liquidate collateral held in the form of financial assets expeditiously and at prices considered fair. This may require us to purchase assets for our own account, where permitted by law, pending orderly liquidation. ▲
Specific and collective allowances and provisions for credit losses decreased slightly by CHF 8 million to CHF 727 million as of 31 December 2015. This includes collective loan loss allowances of CHF 6 million, a reduction of CHF 2 million from the prior year.
The “Loss history statistics” table below provides a five-year history of our credit loss experience for loans (including due from banks) relative to our impaired and non-performing loans. ▲▲
® Refer to “Policies for past due, non-performing and impaired claims” in this section, and to “Note 10 Due from banks and loans (held at amortized cost)” and “Note 12 Allowances and provisions for credit losses” in the “Consolidated financial statements” section of this report for more information
EDTF |
Loss history statistics | | | | | |
CHF million, except where indicated | 31.12.15 | 31.12.14 | 31.12.13 | 31.12.12 | 31.12.11 |
Due from banks and loans (gross) | 324,594 | 329,800 | 301,601 | 301,849 | 290,664 |
Impaired loans (including due from banks) | 1,226 | 1,204 | 1,241 | 1,606 | 2,155 |
Non-performing loans (including due from banks) | 1,630 | 1,602 | 1,582 | 1,516 | 1,529 |
Allowances and provisions for credit losses¹˒² | 727 | 735 | 750 | 794 | 938 |
of which: allowances for due from banks and loans¹ | 692 | 708 | 686 | 728 | 842 |
Net write-offs³ | 116 | 124 | 83 | 250 | 450 |
of which: net write-offs for due from banks and loans | 116 | 124 | 83 | 250 | 413 |
Credit loss (expense) / recovery⁴ | (117) | (78) | (50) | (118) | (84) |
of which: credit loss (expense) / recovery for due from banks and loans | (117) | (78) | (50) | (134) | (126) |
Ratios | | | | | |
Impaired loans as a percentage of due from banks and loans (gross) | 0.4 | 0.4 | 0.4 | 0.5 | 0.7 |
Non-performing loans as a percentage of due from banks and loans (gross) | 0.5 | 0.5 | 0.5 | 0.5 | 0.5 |
Allowances as a percentage of due from banks and loans (gross) | 0.2 | 0.2 | 0.2 | 0.2 | 0.3 |
Net write-offs as a percentage of average due from banks and loans (gross) outstanding during the period | 0.0 | 0.0 | 0.0 | 0.1 | 0.1 |
1 Includes collective loan loss allowances. 2 Includes provisions for loan commitments and allowances for securities financing transactions. 3 Includes net write-offs for loan commitments and securities financing transactions. 4 Includes credit loss (expense) / recovery for loan commitments and securities financing transactions. |
p
Risk, treasury and capital management
Risk management and control
EDTF | Pillar 3 |
Allowances and provisions for credit losses¹ | | | | | | |
| | IFRS exposure, gross² | | Impaired exposure, gross | | Estimated liquidation proceeds of collateral³ | | Allowances and provisions for credit losses⁴ | | Impairment ratio (%) |
CHF million, except where indicated | | 31.12.15 | 31.12.14 | | 31.12.15 | 31.12.14 | | 31.12.15 | 31.12.14 | | 31.12.15 | 31.12.14 | | 31.12.15 | 31.12.14 |
| | | | | | | | | | | | | | | |
Group | | | | | | | | | | | | | | | |
Balances with central banks | | 89,776 | 102,303 | | | | | | | | | | | | |
Due from banks | | 11,951 | 13,347 | | 1 | 11 | | | | | 3 | 13 | | 0.0 | 0.1 |
Loans | | 312,643 | 316,452 | | 1,225 | 1,192 | | 163 | 180 | | 689 | 695 | | 0.4 | 0.4 |
Guarantees | | 16,019 | 17,694 | | 256 | 180 | | 4 | 1 | | 32 | 23 | | 1.6 | 1.0 |
Loan commitments | | 56,067 | 50,688 | | 36 | 7 | | | | | 3 | | | 0.1 | 0.0 |
Total | | 486,456⁵ | 500,483⁵ | | 1,518 | 1,391 | | 168 | 181 | | 727 | 731 | | 0.3 | 0.3 |
| | | | | | | | | | | | | | | |
Wealth Management | | | | | | | | | | | | | | | |
Balances with central banks | | 1,344 | 320 | | | | | | | | | | | | |
Due from banks | | 1,107 | 1,326 | | | | | | | | | | | | |
Loans | | 105,167 | 112,701 | | 109 | 81 | | 19 | 3 | | 89 | 70 | | 0.1 | 0.1 |
Guarantees | | 2,267 | 2,021 | | | | | | | | 1 | 1 | | | |
Loan commitments | | 1,270 | 1,960 | | | | | | | | | | | | |
Total | | 111,155 | 118,328 | | 109 | 81 | | 19 | 3 | | 90 | 70 | | 0.1 | 0.1 |
| | | | | | | | | | | | | | | |
Wealth Management Americas | | | | | | | | | | | | |
Balances with central banks | | 0 | 0 | | | | | | | | | | | | |
Due from banks | | 1,899 | 2,074 | | | | | | | | | | | | |
Loans | | 48,754 | 44,356 | | 29 | 26 | | | | | 28 | 27 | | 0.1 | 0.1 |
Guarantees | | 747 | 756 | | | | | | | | | | | | |
Loan commitments | | 279 | 293 | | | | | | | | | | | | |
Total | | 51,678 | 47,480 | | 29 | 26 | | 0 | 0 | | 28 | 27 | | 0.1 | 0.1 |
| | | | | | | | | | | | | | | |
Personal & Corporate Banking | | | | | | | | | | | | | | | |
Balances with central banks | | 0 | 0 | | | | | | | | | | | | |
Due from banks | | 1,493 | 1,773 | | 1 | 11 | | | | | 3 | 13 | | 0.1 | 0.6 |
Loans | | 135,616 | 137,417 | | 870 | 1,035 | | 144 | 176 | | 496 | 568 | | 0.6 | 0.8 |
Guarantees | | 7,900 | 8,670 | | 255 | 180 | | 4 | 1 | | 31 | 23 | | 3.2 | 2.1 |
Loan commitments | | 8,463 | 8,352 | | 20 | 5 | | | | | | | | 0.2 | 0.1 |
Total | | 153,473 | 156,211 | | 1,146 | 1,231 | | 149 | 178 | | 530 | 603 | | 0.7 | 0.8 |
| | | | | | | | | | | | | | | |
Asset Management | | | | | | | | | | |
Balances with central banks | | 0 | 0 | | | | | | | | | | | | |
Due from banks | | 433 | 566 | | | | | | | | | | | | |
Loans | | 11 | 364 | | | | | | | | | | | | |
Guarantees | | 0 | 0 | | | | | | | | | | | | |
Loan commitments | | 0 | 0 | | | | | | | | | | | | |
Total | | 443 | 930 | | 0 | 0 | | 0 | 0 | | 0 | 0 | | 0.0 | 0.0 |
| | | | | | | | | | | | | | | |
Investment Bank | | | | | | | | | | | | | | | |
Balances with central banks | | 345 | 76 | | | | | | | | | | | | |
Due from banks | | 4,177 | 4,505 | | | | | | | | | | | | |
Loans | | 13,088 | 12,033 | | 202 | 38 | | | | | 62 | 24 | | 1.5 | 0.3 |
Guarantees | | 4,958 | 5,902 | | 1 | | | | | | | | | 0.0 | |
Loan commitments | | 44,648 | 36,333 | | 15 | 2 | | | | | 3 | | | 0.0 | 0.0 |
Total | | 67,217 | 58,848 | | 219 | 41 | | 0 | 0 | | 65 | 24 | | 0.3 | 0.1 |
Allowances and provisions for credit losses (continued) |
| | IFRS exposure, gross² | | Impaired exposure, gross | | Estimated liquidation proceeds of collateral³ | | Allowances and provisions for credit losses⁴ | | Impairment ratio (%) |
CHF million, except where indicated | | 31.12.15 | 31.12.14 | | 31.12.15 | 31.12.14 | | 31.12.15 | 31.12.14 | | 31.12.15 | 31.12.14 | | 31.12.15 | 31.12.14 |
| | | | | | | | | | | | | | | |
CC – Services | | | | | | | | | | | |
Balances with central banks | | 0 | 0 | | | | | | | | | | | | |
Due from banks | | 576 | 413 | | | | | | | | | | | | |
Loans | | 36 | 31 | | | | | | | | 0 | 0 | | | |
Guarantees | | 11 | 11 | | | | | | | | | | | | |
Loan commitments | | 0 | 0 | | | | | | | | | | | | |
Total | | 623 | 454 | | 0 | 0 | | 0 | 0 | | 0 | 0 | | 0.0 | 0.0 |
| | | | | | | | | | | | | | | |
CC – Group ALM | | | | | | | | | |
Balances with central banks | | 88,087 | 101,907 | | | | | | | | | | | | |
Due from banks | | 2,210 | 2,563 | | | | | | | | | | | | |
Loans | | 6,788 | 5,291 | | | | | | | | | | | | |
Guarantees | | 0 | 0 | | | | | | | | | | | | |
Loan commitments | | 0 | 0 | | | | | | | | | | | | |
Total | | 97,086 | 109,761 | | 0 | 0 | | 0 | 0 | | 0 | 0 | | 0.0 | 0.0 |
| | | | | | | | | | | | | | | |
CC – Non-core and Legacy Portfolio | | | | | | | | | | | | |
Balances with central banks | | 0 | 0 | | | | | | | | | | | | |
Due from banks | | 56 | 127 | | | | | | | | | | | | |
Loans | | 3,183 | 4,260 | | 15 | 12 | | | | | 14 | 6 | | 0.5 | 0.3 |
Guarantees | | 137 | 335 | | | | | | | | | | | | |
Loan commitments | | 1,406 | 3,750 | | | | | | | | | | | | |
Total | | 4,782 | 8,471 | | 15 | 12 | | 0 | 0 | | 14 | 6 | | 0.3 | 0.1 |
1 Excludes allowances for securities financing transactions (31 December 2015: CHF 0 million, 31 December 2014: CHF 4 million). 2 The measurement requirements of IFRS differ in certain respects from our internal management view of credit risk. 3 Does not include oil and gas reserves related to reserve-based lending. 4 Includes CHF 6 million (31 December 2014: CHF 8 million) in collective loan loss allowances for credit losses. 5 As of 31 December 2015, total IFRS exposure of UBS AG (consolidated) was CHF 0.7 billion higher than the exposure of UBS Group, related to receivables of UBS AG and UBS Switzerland AG against UBS Group AG. |
▲▲
EDTF |
Development of individually impaired loans (including due from banks) | | | |
| | For the year ended |
CHF million | | 31.12.15 | 31.12.14 |
Balance at the beginning of the year | | 1,204 | 1,241 |
New impaired loans | | 465 | 388 |
Increase in existing impaired loans | | 71 | 124 |
Repayments / sales / upgrades | | (354) | (403) |
Write-offs | | (162)¹ | (154) |
Foreign currency translations and other adjustments | | 2 | 6 |
Balance at the end of the year | | 1,226 | 1,204 |
1 Does not include CHF 2 million in write-offs charged directly to collective loan loss allowances. |
p
Risk, treasury and capital management
Risk management and control
Past due but not impaired loans
EDTF | Pillar 3 | The table below shows a breakdown of total loan balances where payments have been missed, but which we do not consider impaired because we expect to collect all amounts due under the contractual terms of the loans or the equivalent value from liquidation of collateral. The loan balances in the table arise predominantly within Personal & Corporate Banking, where delayed payments are routinely observed and, to a lesser extent, Wealth Management.
The amount of past due but not impaired mortgage loans was not significant compared with the overall size of the mortgage portfolio. ▲▲
® Refer to “Policies for past due, non-performing and impaired claims” in this section and “Note 1 Summary of significant accounting policies” in the “Consolidated financial statements” section of this report for more information on our impairment policies
Audited | EDTF | Pillar 3 |
Past due but not impaired loans | | | |
CHF million | | 31.12.15 | 31.12.14 |
1–10 days | | 141 | 92 |
11–30 days | | 69 | 74 |
31–60 days | | 37 | 18 |
61–90 days | | 16 | 9 |
>90 days | | 663 | 769 |
of which: mortgage loans | | 529 | 646 |
Total | | 927 | 961 |
▲▲▲
EDTF | Pillar 3 |
Past due but not impaired mortgage loans | | | |
CHF million | | 31.12.15 | | 31.12.14 |
| | Total mortgage loans | of which: past due > 90 days but not impaired | | Total mortgage loans | of which: past due > 90 days but not impaired |
Total | | 153,044 | 529 | | 154,689 | 646 |
▲p
Credit risk profile of the Group – Internal risk view
EDTF | The exposures detailed in this section are based on our internal management view of credit risk which differs in certain respects from the measurement requirements of IFRS.
Internally, we categorize credit risk exposures into two broad categories: banking products and traded products. Banking products comprise drawn loans, undrawn guarantees and loan commitments, due from banks and balances with central banks. Traded products comprise over-the-counter (OTC) derivatives, exchange-traded derivatives (ETD) and securities financing transactions (SFTs), comprised of securities borrowing and lending and repurchase and reverse repurchase agreements. ▲
Banking products
EDTF | The breakdowns of our banking product exposures are shown before and after allowances and provisions for credit losses and related single-name credit hedges. The effect of portfolio hedges, such as index CDSs, is not reflected. Guarantees and loan commitments are shown on a notional basis, without applying credit conversion factors.
Total gross banking products exposure decreased to CHF 485 billion as of 31 December 2015 compared with CHF 497 billion at the end of 2014, mainly due to decreases in balances with central banks in Corporate Center – Group ALM, partly offset by an increase in loan underwriting exposure at the end of the year in the Investment Bank. ▲
EDTF |
Banking products exposure by business division and Corporate Center unit | | | |
| | 31.12.15 |
CHF million | | Wealth Management | Wealth Management Americas | Personal & Corporate Banking | Asset Management | Investment Bank | CC – Services | CC – Group ALM | CC – Non-core and Legacy Portfolio | Group |
Balances with central banks | | 1,344 | 0 | 0 | 0 | 345 | 0 | 88,087 | 0 | 89,776 |
Due from banks | | 1,107 | 1,899 | 1,493 | 433 | 9,544 | 576 | 2,210 | 35 | 17,297 |
Loans¹ | | 105,167 | 48,754 | 135,616 | 11 | 15,464 | 36 | 6,788 | 100 | 311,937 |
Guarantees | | 2,267 | 747 | 7,900 | 0 | 5,607 | 11 | 0 | 84 | 16,616 |
Loan commitments | | 1,270 | 279 | 8,463 | 0 | 37,867 | 0 | 0 | 1,472 | 49,352 |
Banking products exposure² | | 111,155 | 51,678 | 153,473 | 443 | 68,828 | 623 | 97,086 | 1,692 | 484,978³ |
Banking products exposure, net⁴ | | 111,065 | 51,650 | 152,943 | 443 | 61,207 | 623 | 97,086 | 1,180 | 476,196 |
| | | | | | | | | | |
| | 31.12.14 |
CHF million | | Wealth Management | Wealth Management Americas | Personal & Corporate Banking | Asset Management | Investment Bank | CC – Services | CC – Group ALM | CC – Non-core and Legacy Portfolio | Group |
Balances with central banks | | 320 | 0 | 0 | 0 | 76 | 0 | 101,907 | 0 | 102,303 |
Due from banks | | 1,326 | 2,074 | 1,773 | 566 | 9,272 | 413 | 2,563 | 137 | 18,123 |
Loans¹ | | 112,701 | 44,356 | 137,417 | 364 | 15,688 | 31 | 5,291 | 199 | 316,046 |
Guarantees | | 2,021 | 756 | 8,670 | 0 | 6,501 | 11 | 0 | 234 | 18,193 |
Loan commitments | | 1,960 | 293 | 8,352 | 0 | 28,308 | 0 | 0 | 3,454 | 42,367 |
Banking products exposure² | | 118,328 | 47,480 | 156,211 | 930 | 59,845 | 454 | 109,761 | 4,024 | 497,033³ |
Banking products exposure, net⁴ | | 118,257 | 47,453 | 155,608 | 930 | 50,986 | 454 | 109,761 | 2,622 | 486,071 |
1 Does not include reclassified securities and similar acquired securities in our CC – Non-core and Legacy Portfolio. 2 Excludes loans designated at fair value. 3 As of 31 December 2015, total banking products exposure of UBS AG (consolidated) was CHF 0.7 billion higher than the exposure of UBS Group, related to receivables of UBS AG and UBS Switzerland AG against UBS Group AG. 4 Net of allowances, provisions, and hedges. |
p
Risk, treasury and capital management
Risk management and control
Wealth Management
EDTF | Gross banking products exposure within Wealth Management decreased to CHF 111 billion as of 31 December 2015 compared with CHF 118 billion as of 31 December 2014, as a result of client deleveraging in the Lombard book and due to a CHF 2 billion shift of Swiss-booked wealth management mortgage exposure to Personal & Corporate Banking.
Our Wealth Management loan portfolio is mainly secured by securities, residential property and cash as outlined in the “Wealth Management: loan portfolio, gross” table below. Most of the loans secured by securities were of high quality, with 95% rated investment grade as of 31 December 2015, based on our internal ratings, unchanged from 31 December 2014.
The portfolio of mortgage loans secured by properties outside Switzerland increased to CHF 6.0 billion as of 31 December 2015 from CHF 5.8 billion at the end of the prior year. The overall quality of this portfolio remained high, with an average loan-to-value (LTV) ratio of 56% in Europe and 42% in Asia Pacific.▲
Wealth Management Americas
EDTF | Gross banking products exposure within Wealth Management Americas increased to CHF 52 billion as of 31 December 2015 from CHF 47 billion as of 31 December 2014, driven by increased loan origination. This exposure largely relates to loans secured by securities and residential mortgage loans.
Out of the loans secured by securities, 96% were rated investment grade as of 31 December 2015, based on our internal ratings, unchanged compared with 31 December 2014. As of 31 December 2015, these investment grade loans reflect 80% of the total loan portfolio, compared with 81% as of 31 December 2014.
The mortgage loan portfolio consists primarily of residential mortgages offered in the US. Gross exposure increased to CHF 8.4 billion as of 31 December 2015 from CHF 7.6 billion at the end of the prior year. The overall quality of this portfolio remained high with an average LTV of 58%, unchanged from 2014, and we have experienced negligible credit losses since the inception of the mortgage program in 2009. The five largest geographic concentrations in the portfolio were in California (30%), New York (16%), Florida (9%), Texas (4%) and New Jersey (4%).
The amount of impaired loans increased to CHF 29 million as of 31 December 2015 from CHF 26 million at the end of the prior year, with most of the impairment relating to securities-backed loan facilities collateralized by Puerto Rico municipal securities and related funds. ▲
EDTF |
Wealth Management: loan portfolio, gross |
| | 31.12.15 | | 31.12.14 |
| | CHF million | % | | CHF million | % |
Secured by residential property | | 34,004 | 32.3 | | 36,018 | 32.0 |
Secured by commercial / industrial property | | 1,998 | 1.9 | | 2,205 | 2.0 |
Secured by cash | | 11,859 | 11.3 | | 13,354 | 11.8 |
Secured by securities | | 50,123 | 47.7 | | 49,464 | 43.9 |
Secured by guarantees and other collateral | | 6,851 | 6.5 | | 11,147 | 9.9 |
Unsecured loans | | 333 | 0.3 | | 514 | 0.5 |
Total loans, gross | | 105,167 | 100.0 | | 112,701 | 100.0 |
Total loans, net of allowances | | 105,078 | | | 112,631 | |
▲
EDTF |
Wealth Management Americas: loan portfolio, gross | | | | |
| | 31.12.15 | | 31.12.14 |
| | CHF million | % | | CHF million | % |
Secured by residential property | | 8,378 | 17.2 | | 7,558 | 17.0 |
Secured by commercial / industrial property | | 0 | 0.0 | | 0 | 0.0 |
Secured by cash | | 1,020 | 2.1 | | 796 | 1.8 |
Secured by securities | | 37,092 | 76.1 | | 33,983 | 76.6 |
Secured by guarantees and other collateral | | 1,959 | 4.0 | | 1,746 | 3.9 |
Unsecured loans | | 305 | 0.6 | | 274 | 0.6 |
Total loans, gross | | 48,754 | 100.0 | | 44,356 | 100.0 |
Total loans, net of allowances | | 48,726 | | | 44,329 | |
|
p
Personal & Corporate Banking
EDTF | As of 31 December 2015, gross banking products exposure within Personal & Corporate Banking was CHF 153 billion, a decrease of CHF 3 billion compared with 31 December 2014. Net banking products exposure also decreased by CHF 3 billion to CHF 153 billion, approximately 64% of which was classified as investment grade compared with 63% in the prior year. More than 80% of the exposure is categorized in the lowest loss given default (LGD) bucket of 0% to 25%.
The size of Personal & Corporate Banking’s gross loan portfolio decreased slightly by CHF 2 billion to CHF 136 billion. At year-end 2015, 94% of this portfolio was secured by collateral, mainly residential and commercial property. Of the total unsecured amount, 66% related to cash flow-based lending to corporate counterparties and 18% related to lending to public authorities. Based on our internal ratings, 52% of the unsecured loan portfolio was rated investment grade compared with 53% in 2014.
Our Swiss mortgage portfolio, including Swiss mortgage loans originating from our Wealth Management business, is discussed further below.
Our Swiss corporate banking products portfolio, which totaled CHF 24.4 billion as of 31 December 2015 compared with CHF 25.5 billion as of 31 December 2014, consists of loans, guarantees and loan commitments to multinational and domestic counterparties. Although this portfolio is well diversified across industries, these Swiss counterparties are, in general, highly reliant on the domestic economy and the economies to which they export, in particular the EU and the US. In addition, the EUR / CHF exchange rate is an important risk factor for Swiss corporates. While credit loss expense for this portfolio has remained low in 2015, given the reliance of the Swiss economy on exports, the continuing strength of the Swiss franc may have a negative effect on the Swiss economy, which could affect some of the counterparties within our domestic lending portfolio and lead to an increase in the level of credit loss expenses in future periods.
The delinquency ratio, being the ratio of past due but not impaired loans to total loans, was 0.7% for the corporate loan portfolio as of 31 December 2015 compared with 0.6% as of 31 December 2014. ▲
® Refer to “Credit risk models” in this section for more information on LGD, rating grades and rating agency mappings
EDTF | Our mortgage loan portfolio secured by residential and commercial real estate in Switzerland continues to be our largest loan portfolio. These mortgage loans, totaling CHF 138 billion as of 31 December 2015, mainly originate from Personal & Corporate Banking, but also include mortgage loans originating from Wealth Management. As of 31 December 2015, the majority of these mortgage loans, CHF 124 billion related to residential properties that the borrower was either occupying or renting out, and where there was full recourse to the borrower. Of this CHF 124 billion, approximately CHF 88 billion related to properties occupied by the borrower, with an average LTV ratio of 51% as of 31 December 2015 compared with 52% as of 31 December 2014. The average LTV for newly originated loans for this portion was 62% in 2015, unchanged compared with 2014. The remaining CHF 36 billion of the Swiss residential mortgage loan portfolio relates to properties rented out by the borrower and the average LTV of this portfolio was 56% as of 31 December 2015, unchanged compared with 31 December 2014. The average LTV for newly originated Swiss residential mortgage loans was 57% in 2015 compared with 55% in 2014.
As illustrated in the “Swiss mortgages: distribution of net exposure at default (EAD) across exposure segments and loan-to-value (LTV) buckets,” table, over 99% of the aggregate amount of Swiss residential mortgage loans would continue to be covered by the real estate collateral even if the value assigned to that collateral were to decrease by 20%, and more than 98% would remain covered by the real estate collateral even if the value assigned to that collateral were to decrease 30%. In this table, the amount of each mortgage loan is allocated across the LTV buckets to indicate the portion at risk at the various value levels shown. For example, a loan of CHF 75 billion with an LTV ratio of 75% (collateral value of CHF 100 billion) would result in allocations of CHF 30 billion in the less-than-30% bucket, CHF 20 billion in the 31–50% bucket, CHF 10 billion in the 51–60% bucket, CHF 10 billion in the 61–70% bucket and CHF 5 billion in the 71–80% bucket. ▲
EDTF |
Personal & Corporate Banking: loan portfolio, gross | | | | | | |
| | 31.12.15 | | 31.12.14 |
| | CHF million | % | | CHF million | % |
Secured by residential property | | 100,181 | 73.9 | | 99,839 | 72.7 |
Secured by commercial / industrial property | | 19,641 | 14.5 | | 20,202 | 14.7 |
Secured by cash | | 242 | 0.2 | | 163 | 0.1 |
Secured by securities | | 693 | 0.5 | | 794 | 0.6 |
Secured by guarantees and other collateral | | 6,607 | 4.9 | | 6,884 | 5.0 |
Unsecured loans | | 8,252 | 6.1 | | 9,536 | 6.9 |
Total loans, gross | | 135,616 | 100.0 | | 137,417 | 100.0 |
Total loans, net of allowances | | 135,120 | | | 136,848 | |
▲
Risk, treasury and capital management
Risk management and control
EDTF |
Personal & Corporate Banking: distribution of banking products exposure across internal UBS ratings and loss given default (LGD) buckets |
CHF million, except where indicated | | 31.12.15 | | 31.12.14² |
| | Exposure | LGD buckets | Weighted average LGD (%) | | Exposure | Weighted average LGD (%) |
Internal UBS rating¹ | | 0–25% | 26–50% | 51–75% | 76–100% | |
Investment grade | | 98,283 | 83,011 | 13,163 | 1,945 | 164 | 16 | | 97,763 | 16 |
Sub-investment grade | | 55,190 | 44,298 | 9,531 | 1,312 | 50 | 18 | | 58,448 | 18 |
of which: 6−9 | | 48,543 | 40,012 | 7,450 | 1,074 | 7 | 17 | | 52,254 | 17 |
of which: 10−12 | | 4,628 | 4,133 | 414 | 39 | 42 | 14 | | 4,156 | 14 |
of which: 13 and defaulted | | 2,019 | 153 | 1,667 | 199 | | 38 | | 2,038 | 38 |
Total exposure before deduction of allowances and provisions | | 153,473 | 127,309 | 22,693 | 3,257 | 214 | 17 | | 156,211 | 17 |
Less: allowances and provisions | | (530) | | | | | | | (603) | |
Net banking products exposure | | 152,943 | | | | | | | 155,608 | |
1 The ratings of the major credit rating agencies, and their mapping to our internal rating scale, are shown in the “Internal UBS rating scale and mapping of external ratings” table in the “Credit risk models” section of this report. 2 Following improvements in data sourcing, the rating split and weighted average LGD for 31 December 2014 have been restated to ensure comparability with the figures as of 31 December 2015. |
▲
EDTF |
Personal & Corporate Banking: unsecured loans by industry sector |
CHF million | | 31.12.15 | | 31.12.14 |
| | CHF million | % | | CHF million | % |
Construction | | 113 | 1.4 | | 113 | 1.2 |
Financial institutions | | 1,203 | 14.6 | | 916 | 9.6 |
Hotels and restaurants | | 69 | 0.8 | | 54 | 0.6 |
Manufacturing | | 1,204 | 14.6 | | 1,627 | 17.1 |
Private households | | 1,313 | 15.9 | | 1,306 | 13.7 |
Public authorities | | 1,461 | 17.7 | | 1,906 | 20.0 |
Real estate and rentals | | 120 | 1.5 | | 572 | 6.0 |
Retail and wholesale | | 1,181 | 14.3 | | 1,732 | 18.2 |
Services | | 1,405 | 17.0 | | 1,184 | 12.4 |
Other | | 183 | 2.2 | | 125 | 1.3 |
Net exposure | | 8,252 | 100 | | 9,536 | 100.0 |
▲
EDTF |
Swiss mortgages: distribution of net exposure at default (EAD) across exposure segments and loan-to-value (LTV) buckets |
CHF billion, except where indicated | | | 31.12.15 | | | 31.12.14 |
| | | LTV buckets | | | |
Exposure segment | | | ≤30% | 31–50% | 51–60% | 61–70% | 71–80% | 81–100% | >100% | Total | | Total |
Residential mortgages | Net EAD | | 69.9 | 30.6 | 8.1 | 3.8 | 1.2 | 0.2 | 0.0 | 113.8 | | 115.2 |
as a % of row total | | 61 | 27 | 7 | 3 | 1 | 0 | 0 | 100 | | |
Income-producing real estate (IPRE) | Net EAD | | 11.5 | 5.0 | 1.4 | 0.7 | 0.2 | 0.1 | 0.0 | 19.0 | | 19.9 |
as a % of row total | | 61 | 26 | 8 | 4 | 1 | 0 | 0 | 100 | | |
Corporates | Net EAD | | 4.7 | 2.0 | 0.6 | 0.3 | 0.1 | 0.1 | 0.1 | 7.9 | | 8.2 |
as a % of row total | | 60 | 26 | 7 | 3 | 2 | 1 | 1 | 100 | | |
Other segments | Net EAD | | 0.7 | 0.2 | 0.1 | 0.0 | 0.0 | 0.0 | 0.0 | 1.0 | | 1.1 |
as a % of row total | | 68 | 20 | 5 | 3 | 2 | 1 | 0 | 100 | | |
Mortgage-covered exposure | Net EAD | | 86.8 | 37.9 | 10.1 | 4.8 | 1.6 | 0.3 | 0.1 | 141.6 | | 144.4 |
as a % of total | | 61 | 27 | 7 | 3 | 1 | 0 | 0 | 100 | | |
Mortgage-covered exposure 31.12.14 | Net EAD | | 86.7 | 39.3 | 10.9 | 5.3 | 1.7 | 0.4 | 0.1 | 144.4 | | |
as a % of total | | 60 | 27 | 8 | 4 | 1 | 0 | 0 | 100 | | |
p
Asset Management
Gross banking products exposure within Asset Management was less than CHF 1 billion as of 31 December 2015.
Investment Bank
EDTF | The Investment Bank’s lending activities are largely associated with corporates and non-bank financial institutions. The business is broadly diversified across industry sectors, but concentrated in North America.
The gross banking products exposure of the Investment Bank increased to CHF 69 billion as of 31 December 2015 compared with CHF 60 billion as of 31 December 2014. The increase in exposure was due to an increase in temporary loan underwriting activity toward the end of the year, which was predominantly investment grade and driven by strategic mergers and acquisitions. While distribution of these investment grade exposures has been sound, conditions in the sub-investment grade markets have remained challenging, such that some lower-rated deals have not been distributed as planned, leading to a buildup in the level of our exposures intended for syndication. These exposures are classified as held for trading, with fair values reflecting the market conditions at the end of the year.
The Investment Bank actively manages the credit risk of this portfolio and, as of 31 December 2015, held CHF 7.6 billion of single-name credit default swaps (CDSs) hedges against its exposures to corporates and other non-banks, a decrease of CHF 1.3 billion compared with 2014. In addition, the Investment Bank held CHF 276 million of loss protection from the subordinated tranches of structured credit protection, which is not reflected in the “Investment Bank: banking products” table.
Net banking products exposure, excluding balances with central banks and the vast majority of due from banks, and after allowances, provisions and hedges, increased to CHF 53.0 billion as of 31 December 2015 from CHF 42.9 billion at the end of 2014, driven by the aforementioned higher level of loan underwriting at the end of 2015. At the end of the year, and based on our internal ratings, 63% of the Investment Bank’s net banking products exposure was classified as investment grade compared with 59% at the end of the prior year. The majority of the Investment Bank’s net banking products exposure had estimated LGD of between 0% and 50%.
Due to the current low price environment in commodities, exposures to certain counterparties in the energy sector currently carry more risk than in prior periods. As of 31 December 2015 our total net banking products exposure to the oil and gas sector, mainly in North America, was CHF 6.1 billion, including both funded and unfunded exposures, of which CHF 5.9 billion was recorded within the Investment Bank and the remaining exposure within Corporate Center – Non-core and Legacy Portfolio. Of this, CHF 2.5 billion was related to the infrastructure-like midstream sub-sector, which we expect to be less affected by lower energy prices, because revenues for transportation are largely fee or volume based. Less than CHF 0.5 billion of this midstream exposure is to counterparties we rate as sub-investment grade. Exposure to the exploration & production (E&P) sub-sector amounted to CHF 2.0 billion, almost evenly split between oil and gas. This is one of the sub-sectors we consider to be most directly exposed to prolonged low commodity prices. The largest component of this E&P-related exposure is reserve-based lending with counterparties we rate as sub-investment grade, secured by proven reserves, typically revalued on a semi-annual basis. Refining-related exposure totaled CHF 0.8 billion, predominantly in asset-based lending. Our exposure to the integrated sub-sector was CHF 0.5 billion, entirely with counterparties we rate as high investment grade. The exposure to the services & supply sub-sector was CHF 0.4 billion. We also consider this one of the sub-sectors most directly exposed to prolonged low commodity prices, as revenues are driven by the level of exploration and production activity and as security is typically equipment that has low recovery values in distress.
Using an assumed average oil price of USD 25 per barrel through the end of 2017, we estimate that we could incur an additional credit loss expense of approximately CHF 100 million. In arriving at this estimate we have considered, among other things, the estimated effect of the decline in the value of oil and gas reserves pledged in support of reserve-based loans in the exploration and production segment, assumed higher default rates and lower recoveries for the oilfield services segment and made other significant assumptions. We have not taken into account any broader macroeconomic effects of a prolonged period of depressed energy prices, nor have we considered indirect effects. All of these factors may result in actual losses being materially higher or lower than this estimate, and there can be no certainty over the timing of recognition of actual losses.
Specific allowances for these energy-related exposures totaled CHF 40 million as of 31 December 2015. A sustained period of depressed energy prices could result in an increased credit loss expense for this sub-segment of our portfolio in future periods. ▲
® Refer to “Credit risk models” in this section for more information on LGD, rating grades and rating agency mappings
Risk, treasury and capital management
Risk management and control
EDTF |
Investment Bank: banking products¹ | | |
CHF million | 31.12.15 | 31.12.14 |
Total exposure, before deduction of allowances, provisions and hedges | 60,628 | 51,744 |
Less: allowances, provisions | (59) | (19) |
Less: credit protection bought (credit default swaps, notional)² | (7,555) | (8,835) |
Net exposure after allowances, provisions and hedges | 53,014 | 42,890 |
1 Internal risk view, excludes balances with central banks, internal risk adjustments and the vast majority of due from banks exposures. 2 The effects of portfolio hedges, such as index credit default swaps (CDSs), and of loss protection from the subordinated tranches of structured credit protection are not reflected in this table. |
▲
EDTF |
Investment Bank: distribution of net banking products exposure, across internal UBS ratings and loss given default (LGD) buckets |
CHF million, except where indicated | | | 31.12.15 | | 31.12.14 |
| | Exposure | LGD buckets | Weighted average LGD (%) | | Exposure | Weighted average LGD (%) |
Internal UBS rating¹ | | 0–25% | 26–50% | 51–75% | 76–100% | |
Investment grade | | 33,465 | 7,136 | 14,632 | 8,288 | 3,409 | 49 | | 25,177 | 44 |
Sub-investment grade | | 19,548 | 12,814 | 5,234 | 506 | 994 | 22 | | 17,713 | 19 |
of which: 6−9 | | 13,365 | 9,698 | 2,753 | 486 | 427 | 20 | | 11,951 | 19 |
of which: 10−12 | | 5,949 | 2,941 | 2,428 | 20 | 561 | 27 | | 5,647 | 21 |
of which: 13 and defaulted | | 234 | 175 | 53 | 0 | 6 | 14 | | 115 | 23 |
Net banking products exposure, after application of credit hedges | | 53,014 | 19,950 | 19,866 | 8,794 | 4,404 | 39 | | 42,890 | 34 |
1 The ratings of the major credit rating agencies, and their mapping to our internal rating scale, are shown in the “Internal UBS rating scale and mapping of external ratings“ table in the “Credit risk models“ section of this report. |
▲
EDTF |
Investment Bank: net banking products exposure by geographical region |
| | 31.12.15 | | 31.12.14 |
| | CHF million | % | | CHF million | % |
Asia Pacific | | 2,168 | 4.1 | | 1,864 | 4.3 |
Latin America | | 132 | 0.2 | | 210 | 0.5 |
Middle East and Africa | | 27 | 0.1 | | 84 | 0.2 |
North America | | 44,419 | 83.8 | | 34,495 | 80.4 |
Switzerland | | 163 | 0.3 | | 214 | 0.5 |
Rest of Europe | | 6,103 | 11.5 | | 6,024 | 14.0 |
Net exposure | | 53,014 | 100.0 | | 42,890 | 100.0 |
▲
EDTF |
Investment Bank: net banking products exposure by industry sector |
| | 31.12.15 | | 31.12.14 |
| | CHF million | % | | CHF million | % |
Banks | | 2,468 | 4.7 | | 2,272 | 5.3 |
Chemicals | | 636 | 1.2 | | 1,295 | 3.0 |
Electricity, gas, water supply | | 3,173 | 6.0 | | 2,465 | 5.7 |
Financial institutions, excluding banks | | 19,990 | 37.7 | | 14,482 | 33.8 |
Manufacturing¹ | | 6,794 | 12.8 | | 4,858² | 11.3 |
Mining¹ | | 3,331 | 6.3 | | 6,160 | 14.4 |
Public authorities | | 2,451 | 4.6 | | 1,302² | 3.0 |
Real estate and construction | | 4,487 | 8.5 | | 4,678 | 10.9 |
Retail and wholesale | | 681 | 1.3 | | 855 | 2.0 |
Technology and communications | | 3,847 | 7.3 | | 1,838 | 4.3 |
Transport and storage¹ | | 4,005 | 7.6 | | 1,560² | 3.6 |
Other | | 1,150 | 2.2 | | 1,126² | 2.6 |
Net exposure¹ | | 53,014 | 100.0 | | 42,890 | 100.0 |
of which: oil and gas¹ | | 5,930 | 11.2 | | 6,564 | 15.3 |
1 As of 31 December 2015, the CHF 5.9 billion Investment Bank net banking product exposure to the oil and gas sector comprised CHF 2.6 billion related to mining, CHF 2.5 billion related to transport and storage and CHF 0.8 billion related to manufacturing. As of 31 December 2014, the CHF 6.6 billion Investment Bank net banking products exposure to the oil and gas sector comprised CHF 5.5 billion related to mining, CHF 0.4 billion related to transport and storage and CHF 0.7 billion related to manufacturing. 2 Prior year numbers were restated to account for enhanced sector granularity. |
▲
Risk, treasury and capital management
Risk management and control
Corporate Center – Group Asset and Liability Management
EDTF | Gross banking products exposure within Corporate Center – Group Asset and Liability Management (Group ALM), which arises primarily in connection with treasury activities, decreased by CHF 13 billion to CHF 97 billion. This was driven by a decrease in balances with central banks of CHF 14 billion, largely due to the rebalancing of our high-quality, liquid assets managed centrally by Group ALM. ▲
® Refer to the “Balance sheet” section of this report for more information on the development of balances with central banks
Corporate Center – Non-core and Legacy Portfolio
® Refer to “Corporate Center – Non-core and Legacy Portfolio” in the “Financial and operating performance” section of this report for more information
Traded products
EDTF | Traded products include OTC derivatives exposures, as well as SFT and ETD exposures. Credit risk arising from traded products, after the effects of master netting agreements but excluding credit valuation adjustments and hedges, decreased by CHF 4 billion to CHF 45 billion as of 31 December 2015. OTC derivatives accounted for CHF 22 billion, exposures from SFTs were CHF 14 billion, and ETD exposures amounted to CHF 8 billion. OTC derivatives exposures are generally measured as net positive replacement values after the application of legally enforceable netting agreements and the deduction of cash and marketable securities held as collateral. SFT exposures are reported taking into account collateral received, and ETD exposures take into account collateral margin calls.
The majority of the traded products exposures, totaling CHF 35 billion, were within the Investment Bank, Non-Core and Legacy Portfolio and Group ALM. Of this, CHF 0.3 billion was related to counterparties in the energy sector, predominantly rated investment grade. As counterparty risk for traded products is managed at counterparty level, no further split between exposures in the Investment Bank and those in Non-core and Legacy Portfolio and Group ALM is provided. The traded products exposure includes OTC derivative exposures of CHF 16 billion in the Investment Bank and Non-core and Legacy Portfolio, a decrease of CHF 5 billion from the prior year, primarily due to our ongoing reduction activity in Non-core and Legacy Portfolio and client-driven reductions in the Investment Bank. The SFT exposures, which arise mainly within the Investment Bank and Group ALM, amounted to CHF 14 billion and the ETD exposures were CHF 6 billion. The tables on the following pages provide more information on the OTC derivatives and SFT exposures of the Investment Bank, Non-Core and Legacy Portfolio and Group ALM. ▲
EDTF |
Investment Bank, Non-core and Legacy Portfolio and Group ALM: traded products exposure |
CHF million | | OTC derivatives¹ | SFT | ETD | Total | | Total |
| | 31.12.15 | | 31.12.14 |
Total exposure, before deduction of credit valuation adjustments and hedges | | 15,502 | 13,657 | 6,099 | 35,258 | | 39,875 |
Less: credit valuation adjustments and allowances | | (470) | | | (470) | | (700) |
Less: credit protection bought (credit default swaps, notional) | | (1,076) | | | (1,076) | | (998) |
Net exposure after credit valuation adjustments, allowances and hedges | | 13,955 | 13,657 | 6,099 | 33,712 | | 38,177 |
1 Net replacement value includes the effect of netting agreements (including cash collateral) in accordance with Swiss federal banking law. |
▲
EDTF |
Investment Bank, Non-Core and Legacy Portfolio, and Group ALM: distribution of net OTC derivatives and SFT exposure across internal UBS ratings and loss given default (LGD) buckets |
CHF million, except where indicated | | | 31.12.15 | | 31.12.14 |
| | Exposure | LGD buckets | Weighted average LGD (%) | | Exposure | Weighted average LGD (%) |
Internal UBS rating¹ | | 0–25% | 26–50% | 51–75% | 76–100% | |
Net OTC derivatives exposure | | | | | | | | | | |
Investment grade | | 13,176 | 4,380 | 7,865 | 558 | 373 | 30 | | 18,040 | 29 |
Sub-investment grade | | 779 | 63 | 655 | 9 | 53 | 36 | | 913 | 38 |
of which: 6−9 | | 343 | 31 | 252 | 8 | 51 | 48 | | 445 | 39 |
of which: 10−12 | | 92 | 31 | 60 | 0 | 0 | 30 | | 114 | 31 |
of which:13 and defaulted | | 344 | 0 | 342 | 0 | 2 | 26 | | 355 | 39 |
Total net OTC exposure, after credit valuation adjustments and hedges | | 13,955 | 4,443 | 8,520 | 566 | 426 | 31 | | 18,953 | 30 |
| | | | | | | | | | |
Net SFT exposure | | | | | | | | | | |
Investment grade | | 13,531 | 6,520 | 6,234 | 269 | 508 | 27 | | 11,674 | 33 |
Sub-investment grade | | 126 | 3 | 9 | 12 | 102 | 89 | | 399 | 81 |
Total net SFT exposure | | 13,657 | 6,524 | 6,243 | 280 | 610 | 28 | | 12,073 | 34 |
1 The ratings of the major credit rating agencies, and their mapping to our internal rating masterscale, are shown in the “Internal UBS rating scale and mapping of external ratings“ table in the “Credit risk models“ section of this report. |
▲
EDTF |
Investment Bank, Non-Core and Legacy Portfolio, and Group ALM: net OTC derivatives and SFT exposure by geographical region |
| | Net OTC derivatives | | Net SFT |
| | 31.12.15 | | 31.12.14 | | 31.12.15 | | 31.12.14 |
| | CHF million | % | | CHF million | % | | CHF million | % | | CHF million | % |
Asia Pacific | | 1,194 | 8.6 | | 2,956 | 15.6 | | 1,661 | 12.2 | | 2,123 | 17.6 |
Latin America | | 51 | 0.4 | | 171 | 0.9 | | 117 | 0.9 | | 122 | 1.0 |
Middle East and Africa | | 132 | 0.9 | | 157 | 0.8 | | 740 | 5.4 | | 900 | 7.5 |
North America | | 4,878 | 35.0 | | 6,704 | 35.4 | | 2,929 | 21.5 | | 2,927 | 24.2 |
Switzerland | | 512 | 3.7 | | 811 | 4.3 | | 1,275 | 9.3 | | 1,252 | 10.4 |
Rest of Europe | | 7,189 | 51.5 | | 8,153 | 43.0 | | 6,935 | 50.8 | | 4,750 | 39.3 |
Net exposure | | 13,955 | 100.0 | | 18,953 | 100.0 | | 13,657 | 100.0 | | 12,073 | 100.0 |
▲
EDTF |
Investment Bank, Non-Core and Legacy Portfolio, and Group ALM: net OTC derivatives and SFT exposure by industry |
| | Net OTC derivatives | | Net SFT |
| | 31.12.15 | | 31.12.14 | | 31.12.15 | | 31.12.14 |
| | CHF million | % | | CHF million | % | | CHF million | % | | CHF million | % |
Banks | | 4,621 | 33.1 | | 6,152 | 32.5 | | 4,995 | 36.6 | | 4,025 | 33.3 |
Chemicals | | 28 | 0.2 | | 29 | 0.2 | | | | | | |
Electricity, gas, water supply | | 306 | 2.2 | | 276 | 1.5 | | | | | | |
Financial institutions, excluding banks | | 5,336 | 38.2 | | 7,687 | 40.6 | | 8,151 | 59.7 | | 7,176 | 59.4 |
Manufacturing | | 564 | 4.0 | | 740 | 3.9 | | | | | | |
Mining | | 178 | 1.3 | | 128 | 0.7 | | | | | | |
Public authorities | | 2,085 | 14.9 | | 2,775 | 14.6 | | 509 | 3.7 | | 871 | 7.2 |
Retail and wholesale | | 15 | 0.1 | | 72 | 0.4 | | | | | | |
Transport, storage and communication | | 285 | 2.0 | | 437 | 2.3 | | 2 | 0.0 | | 0 | 0.0 |
Other | | 537 | 3.8 | | 657 | 3.5 | | 1 | 0.0 | | 1 | 0.0 |
Net exposure | | 13,955 | 100.0 | | 18,953 | 100.0 | | 13,657 | 100.0 | | 12,073 | 100.0 |
p
Risk, treasury and capital management
Risk management and control
Credit risk mitigation
Audited | EDTF | Pillar 3 | We actively manage the credit risk in our portfolios by taking collateral against exposures and by utilizing credit hedging. ▲▲▲
Lending secured by real estate
Audited | EDTF | Pillar 3 | We use a scoring model as part of a standardized front-to-back process to support credit decisions for the origination or modification of Swiss mortgage loans. The two key factors within this model are an affordability calculation relative to gross income and the loan-to-value (LTV) ratio. ▲
The calculation of affordability takes into account interest payments, minimum amortization requirements, potential property maintenance costs and, in the case of properties expected to be rented out, the level of rental income. Interest payments are estimated using a predefined framework, which takes into account the potential for significant increases in interest rates during the lifetime of the loan.
For properties occupied by the borrower, the maximum LTV allowed within the standard approval process is 80%. This is reduced to 60% in the case of vacation properties and luxury real estate. For properties rented out by the borrower, the maximum LTV allowed within the standard approval process ranges from 60% to 80%, depending on the type of property, the age of the property and the amount of any renovation work required.
Audited | The value assigned by UBS to each property is based on the lowest value determined from internally calculated valuations, the purchase price and, in some cases, an additional external valuation. ▲
We use two separate models provided by a market-leading external vendor to derive property valuations for owner-occupied residential properties (ORP) and income-producing real estate. For ORP, we estimate the current value of properties by using a regression model (hedonic model) to compare detailed characteristics for each property against a database of property transactions. In addition to the model-derived values, valuations for ORP are updated quarterly throughout the lifetime of the loan by using region-specific real estate price indices. The price indices are sourced from an external vendor and are subject to internal validation and benchmarking against two other external vendors. On an annual basis, we use these valuations to compute indexed LTV for all ORP and consider these together with other risk measures (e.g., rating migration and behavioral information) to identify higher-risk loans, which are then reviewed individually by client advisors and credit officers, with actions taken where they are considered necessary.
For income-producing real estate, a capitalization model is used to determine the property valuation by discounting estimated sustainable future income using a capitalization rate based on various attributes. These attributes consider regional as well as specific property characteristics such as market and location data (e.g., vacancy rates), benchmarks (e.g., for running costs) and certain other standardized input parameters (e.g., property condition). Rental income from properties is reviewed at a minimum once every three years, but indications of significant changes in the amount of rental income or in the vacancy rate can trigger an interim reappraisal.
To take market developments into account for these models, the external vendor regularly updates the parameters and / or refines the architecture for each model. Model changes and parameter updates are subject to the same validation procedures as for our internally developed models.
Audited | We similarly apply underwriting guidelines for our Wealth Management Americas mortgage loan portfolio to ensure affordability of the loans and sufficiency of collateral.▲
These include: maximum loan amounts, maturities and LTV limits by type of property, debt-to-income limits, required reserves as a percentage of proposed loan amounts and appropriate credit score guidelines. The maximum LTV allowed within the standard approval process ranges from 45% to 80% depending on property type and overall loan size. ▲▲
® Refer to “Personal & Corporate Banking” in “Credit risk profile of the Group – Internal risk view” in this section for more information on LTV in our Swiss mortgage portfolio
® Refer to “Wealth Management Americas” in “Credit risk profile of the Group – Internal risk view” in this section for more information on LTV in our Wealth Management Americas mortgage portfolio
Exposures secured by other forms of collateral
Audited | EDTF | Pillar 3 | Lombard loans and other lending such as securities financing transactions are secured against the pledge of eligible marketable securities, guarantees and other forms of collateral. Eligible financial securities primarily include transferable securities (such as bonds and equities), which are liquid and actively traded, and other transferable securities such as approved structured products for which regular prices are available and for which the issuer of the security provides a market.
We apply discounts (haircuts) to reflect the collateral’s risk and to derive the lending value. ▲
Haircuts for eligible marketable securities are calculated to cover the possible change in the market value over a given close-out period and confidence level. For less liquid instruments such as structured products and certain bonds, and for products with long redemption periods, the close-out period might be much longer than that for highly liquid instruments, resulting in a higher haircut. For cash, life insurance policies and guarantees / letters of credit, haircuts are determined on a product / client-specific basis. ▲▲
Audited | EDTF | Pillar 3 | We also consider concentration risks across collateral posted on a divisional level, and additionally perform targeted Group-wide reviews of concentrations. A concentration of collateral in single securities, issuers or issuer groups, industry sectors, countries, regions or currencies may result in higher risk and reduced liquidity. In such cases, the lending value of the collateral, margin call and close-out levels are adjusted accordingly. ▲
Exposures and collateral values are monitored on a daily basis to ensure that the credit exposure continues to be covered by sufficient collateral. A shortfall occurs when the lending value drops below the exposure. If a shortfall exceeds a defined trigger level, a margin call is initiated, requiring the client to provide additional collateral, reduce the exposure or take other action to bring the exposure in line with the lending value of the collateral. If the shortfall widens, or is not corrected within the required period, a close-out is initiated, through which collateral is liquidated, open derivative positions are closed and guarantees or letters of credit are called.
We also conduct stress testing of collateralized exposures to simulate market events which increase the risk of collateral shortfalls and unsecured exposures by significantly reducing the value of the collateral, increasing the exposure of traded products, or both. ▲▲
® Refer to “Stress loss” in “Credit risk models” in this section for more information on our stress testing
Audited | EDTF | Pillar 3 | Trading in OTC derivatives is conducted through central counterparties (CCPs) where practicable. Where CCPs are not used, we have clearly defined processes for entering into netting and collateral arrangements, including the requirement to have a legal opinion on the enforceability of contracts in relevant jurisdictions in the case of insolvency. Trading is generally conducted under bilateral International Swaps and Derivatives Association (ISDA) or ISDA-equivalent master netting agreements, which allow for the close-out and netting of all transactions in the event of default. For most major market participant counterparties, we may in addition use two-way collateral agreements under which either party can be required to provide collateral in the form of cash or marketable securities, typically limited to well-rated government debt, when the exposure exceeds specified levels. ▲▲▲
® Refer to “Note 14 Derivative instruments and hedge accounting” in the “Consolidated financial statements” section of this report for more information on our OTC derivatives settled through central counterparties
® Refer to “Note 26 Offsetting financial assets and financial liabilities” in the “Consolidated financial statements” section of this report for more information on the effect of netting and collateral arrangements on our derivative exposures
Credit hedging
Audited | EDTF | Pillar 3 | We utilize single-name credit default swaps (CDSs), credit index CDSs, bespoke protection, and other instruments to actively manage credit risk in the Investment Bank and Non-core and Legacy Portfolio. This is aimed at reducing concentrations of risk from specific counterparties, sectors or portfolios.
We maintain strict guidelines for taking credit hedges into account for credit risk mitigation purposes. For example, when monitoring exposures against counterparty limits, we do not usually recognize credit risk mitigants such as proxy hedges (credit protection on a correlated but different name) or credit index CDSs. Buying credit protection also creates credit exposure against the protection provider. We monitor our exposures to credit protection providers and the effectiveness of credit hedges as part of our overall credit exposures to the relevant counterparties. For credit protection purchased to hedge the lending portfolio, this includes monitoring mismatches between the maturity of the credit protection purchased and the maturity of the associated loan. Such mismatches result in basis risk and may reduce the effectiveness of the credit protection. Mismatches are routinely reported to credit officers and mitigating actions are taken when considered necessary. ▲▲▲
® Refer to “Note 14 Derivative instruments and hedge accounting” in the “Consolidated financial statements” section of this report for more information
Mitigation of settlement risk
EDTF | Pillar 3 | To mitigate settlement risk, we reduce our actual settlement volumes through the use of multilateral and bilateral agreements with counterparties, including payment netting.
Our most significant source of settlement risk is foreign exchange transactions. We are a member of Continuous Linked Settlement, a foreign exchange clearing house which allows transactions to be settled on a delivery versus payment basis, thereby significantly reducing foreign exchange-related settlement risk relative to the volume of business. However, the mitigation of settlement risk through Continuous Linked Settlement membership and other means does not fully eliminate our credit risk in foreign exchange transactions (resulting from changes in exchange rates prior to settlement), which is managed as part of our overall credit risk management of OTC derivatives. ▲p
Risk, treasury and capital management
Risk management and control
Credit risk models
Audited | EDTF | Pillar 3 | We have developed tools and models in order to estimate future credit losses that may be implicit in our current portfolio.
Exposures to individual counterparties are measured based on three generally accepted parameters: probability of default (PD), loss given default (LGD) and exposure at default (EAD). For a given credit facility, the product of these three parameters results in the expected loss. These parameters are the basis for the majority of our internal measures of credit risk, and are key inputs for the regulatory capital calculation under the advanced internal ratings-based approach of the Basel III framework governing international convergence of capital. We also use models to derive the portfolio credit risk measures of expected loss, statistical loss and stress loss. ▲
The “Key features of our main credit risk models” table summarizes the key features of the models that we use to derive PD, LGD and EAD for our main portfolios and is followed by more detailed explanations of these parameters. ▲▲
® Refer to the “UBS Group AG consolidated supplemental disclosures required under Basel III Pillar 3 regulations” section of this report for more information on the regulatory capital calculation under the advanced internal ratings-based approach
EDTF | Pillar 3 |
Key features of our main credit risk models |
| Portfolio in scope | Model approach | Main drivers | Number of years loss data |
Probability of default | Swiss owner-occupied mortgages | Score card | Behavioral data, affordability relative to income, property type, loan-to-value | 21 |
| Income-producing real estate mortgages | Transaction rating | Loan-to-value, debt-service-coverage | 21 |
| Lombard lending | Merton type | Loan-to-value, portfolio volatility | 10–15 |
| Personal & Corporate Banking – Corporates | Score card | Financial data including balance sheet ratios and profit and loss, and behavioral data | 21 |
| Investment Bank – Banks | Score card | Financial data including balance sheet ratios and profit and loss | 5–10 |
| Investment Bank – Corporates | Score card / market data | Financial data including balance sheet ratios and profit and loss, and market data | 5–10 |
Loss given default | Swiss owner-occupied mortgages | Actuarial model | Historical observed loss rates, loan-to-value, property type | 21 |
| Income-producing real estate mortgages | Actuarial model | Historical observed loss rates | 21 |
| Lombard lending | Actuarial model | Historical observed loss rates | 10–15 |
| Personal & Corporate Banking – Corporates | Actuarial model | Historical observed loss rates | 17 |
| Investment Bank – all counterparties | Actuarial model | Counterparty- and facility-specific, including industry segment, collateral, seniority, legal environment and bankruptcy procedures | 5–10 |
Exposure at default | Banking products | Statistical model | Exposure type (committed credit lines, revocable credit lines, contingent products) | >10 |
| Traded products | Statistical model | Product-specific market drivers, e.g., interest rates | n/a |
▲▲
Audited | EDTF | Pillar 3 |
Internal UBS rating scale and mapping of external ratings |
Internal UBS rating | 1-year PD range in % | Description | Moody's Investors Service mapping | Standard & Poor's mapping | Fitch mapping |
0 and 1 | 0.00–0.02 | Investment grade | Aaa | AAA | AAA |
2 | 0.02–0.05 | | Aa1 to Aa3 | AA+ to AA– | AA+ to AA– |
3 | 0.05–0.12 | | A1 to A3 | A+ to A– | A+ to AA– |
4 | 0.12–0.25 | | Baa1 to Baa2 | BBB+ to BBB | BBB+ to BBB |
5 | 0.25–0.50 | | Baa3 | BBB– | BBB– |
6 | 0.50–0.80 | Sub-investment grade | Ba1 | BB+ | BB+ |
7 | 0.80–1.30 | | Ba2 | BB | BB |
8 | 1.30–2.10 | | Ba3 | BB– | BB– |
9 | 2.10–3.50 | | B1 | B+ | B+ |
10 | 3.50–6.00 | | B2 | B | B |
11 | 6.00–10.00 | | B3 | B– | B– |
12 | 10.00–17.00 | | Caa | CCC | CCC |
13 | >17 | | Ca to C | CC to C | CC to C |
Counterparty is in default (CDF) | Default | Defaulted | | D | D |
▲▲p
Probability of default
EDTF | Pillar 3 | The probability of default (PD) is an estimate of the likelihood of a counterparty defaulting on its contractual obligations over the next 12 months. PD ratings are used for credit risk measurement and are an important input for determining credit risk approval authorities.
PD is assessed using rating tools tailored to the various categories of counterparties. Statistically developed score cards, based on key attributes of the obligor, are used to determine PD for many of our corporate clients and for loans secured by real estate. Where available, market data may also be used to derive the PD for large corporate counterparties. For Lombard loans, Merton-type model simulations taking into account potential changes in the value of securities collateral are used in our rating approach. These categories are also calibrated to our internal credit rating scale (masterscale), which is designed to ensure a consistent assessment of default probabilities across counterparties. Our masterscale expresses one-year default probabilities that we determine through our various rating tools by means of distinct classes, whereby each class incorporates a range of default probabilities. Counterparties migrate between rating classes as our assessment of their PD changes.
The ratings of the major credit rating agencies, and their mapping to our internal rating masterscale and internal PD bands, are shown in the “Internal UBS rating scale and mapping of external ratings” table on the previous page. The mapping is based on the long-term average of one-year default rates available from the rating agencies. For each external rating category, the average default rate is compared with our internal PD bands to derive a mapping to our internal rating scale. Our internal rating of a counterparty may, therefore, diverge from one or more of the correlated external ratings shown in the table. Observed defaults by rating agencies may vary through economic cycles, and we do not necessarily expect the actual number of defaults in our equivalent rating band to equal the rating agencies’ average in any given period. We periodically assess the long-term average default rates of credit rating agencies’ grades, and we adjust their mapping to our masterscale as necessary to reflect any material changes. ▲▲
Loss given default
EDTF | Pillar 3 | Loss given default (LGD) is the magnitude of the likely loss if there is a default. LGD estimates include loss of principal, interest and other amounts (such as work-out costs, including the cost of carrying an impaired position during the work-out process) less recovered amounts. We determine LGD based on the likely recovery rate of claims against defaulted counterparties, which depends on the type of counterparty and any credit mitigation by way of collateral or guarantees. Our estimates are supported by our internal loss data and external information where available. Where we hold collateral, such as marketable securities or a mortgage on a property, loan-to-value ratios are a key parameter in determining LGD. ▲▲
Exposure at default
EDTF | Pillar 3 | Exposure at default (EAD) represents the amount we expect to be owed by a counterparty at the time of a possible default. We derive EAD from our current exposure to the counterparty and the possible future development of that exposure.
The EAD of a loan is the drawn or face value of the loan. For loan commitments and guarantees, the EAD includes the amount drawn as well as potential future amounts that may be drawn, which are estimated based on historical observations.
For traded products, we derive the EAD by modeling the range of possible exposure outcomes at various points in time using scenario and statistical techniques. We assess the net amount that may be owed to us or that we may owe to others, taking into account the effect of market moves over the potential time it would take to close out our positions. For exchange-traded derivatives, our calculation of EAD takes into account collateral margin calls. When measuring individual counterparty exposure against credit limits, we consider the maximum likely exposure measured to a high level of confidence. However, when aggregating exposures to different counterparties for portfolio risk measurement purposes, we use the expected exposure to each counterparty at a given time period (usually one year) generated by the same model.
We assess our exposures where there is a material correlation between the factors driving the credit quality of the counterparty and those driving the potential future value of our traded product exposure (wrong-way risk), and we have established specific controls to mitigate these risks. ▲▲
Expected loss
EDTF | Pillar 3 | Credit losses are an inherent cost of doing business, but the occurrence and amount of credit losses can be erratic. In order to quantify future credit losses that may be implicit in our current portfolio, we use the concept of expected loss.
Expected loss is a statistical measure used to estimate the average annual costs we expect to experience from positions that become impaired. The expected loss for a given credit facility is a product of the three components described above: PD, EAD and LGD. We aggregate the expected loss for individual counterparties to derive our expected portfolio credit losses.
Expected loss is the basis for quantifying credit risk in all our portfolios. It is also the starting point for the measurement of our portfolio statistical loss and stress loss.
We use a statistical modeling approach to estimate the loss profile of each of our credit portfolios over a one-year period to a specified level of confidence. The mean value of this loss distribution is the expected loss. The loss estimates deviate from the mean value due to statistical uncertainty on the defaulting counterparties and to systematic default relationships among counterparties within and between segments. The statistical measure is sensitive to concentration risks on individual counterparties and groups of counterparties. The outcome provides an indication of the level of risk in our portfolio and the way it may develop over time. ▲▲
Risk, treasury and capital management
Risk management and control
Stress loss
EDTF | Pillar 3 | We complement our statistical modeling approach with scenario-based stress loss measures. Stress tests are run on a regular basis to monitor the potential impact of extreme, but nevertheless plausible events on our portfolios, under which key credit risk parameters are assumed to deteriorate substantially. Where we consider it appropriate, we apply limits on this basis.
Stress scenarios and methodologies are tailored to the nature of the portfolios, ranging from regionally focused to global systemic events, and varying in time horizon. For example, for our loan underwriting portfolio, we apply a global market event under which, simultaneously, the market for loan syndication freezes, market conditions significantly worsen, and credit quality deteriorates. Similarly, for Lombard lending, we apply a range of scenarios representing instantaneous market shocks to all collateral and exposure positions, taking into consideration their liquidity and potential concentrations. The portfolio-specific stress test for our mortgage lending business in Switzerland reflects a multi-year event, and the overarching stress test for global wholesale and counterparty credit risk to corporates uses a one-year global stress event and takes into account exposure concentrations to single counterparties. ▲▲
® Refer to “Stress testing” in this section for more information on our stress testing framework
Credit risk model confirmation
EDTF | Pillar 3 | Our approach to model confirmation involves both quantitative methods, including monitoring compositional changes in the portfolios and the results of backtesting, and qualitative assessments, including feedback from users on the model output as a practical indicator of the performance and reliability of the model.
Material changes in a portfolio composition may invalidate the conceptual soundness of the model. We therefore perform regular analysis of the evolution of portfolios to identify such changes in the structure and credit quality of portfolios. This includes analysis of changes in key attributes, changes in portfolio concentration measures, as well as changes in RWA. ▲▲
® Refer to “Risk measurement” in this section for more information on our approach to model confirmation procedures
EDTF | Pillar 3 |
Main credit models backtesting by regulatory exposure segment |
| Length of time series used for the calibration (in years) | | Actual rates in % | | Estimated average rates at the start of the period in % |
| | Average of last 5 years¹ | Min. of last 5 years² | Max. of last 5 years² | |
Probability of default | | | | | | | |
Sovereigns | >10 | | 0.00 | 0.00 | 0.00 | | 0.22 |
Banks³ | >10 | | 0.08 | 0.06 | 0.13 | | 0.61 |
Corporates⁴ | >10 | | 0.22 | 0.19 | 0.28 | | 0.55 |
Retail | | | | | | | |
Residential mortgages | >20 | | 0.15 | 0.13 | 0.19 | | 0.52 |
Lombard lending | >10 | | 0.01 | 0.00 | 0.02 | | 0.13 |
Other retail | >10 | | 0.29 | 0.16 | 0.45 | | 1.01 |
| | | | | | | |
Loss given default | | | | | | | |
Sovereigns | >10 | | | | | | 41.11 |
Banks³˒⁵ | >10 | | 12.71 | | | | 37.71 |
Corporates | >10 | | 24.60 | 14.33 | 30.28 | | 20.80 |
Retail | | | | | | | |
Residential mortgages | >20 | | 1.60 | 0.24 | 2.23 | | 6.61 |
Lombard lending | >10 | | 22.61 | 6.23 | 6.23 | | 20.00 |
Other retail | >10 | | 18.77 | 0.11 | 30.69 | | 43.03 |
| | | | | | | |
Credit conversion factor | | | | | | | |
Corporates | >10 | | 21.53 | 9.75 | 44.32 | | 33.45 |
1 Average of all observations over the last five years. 2 Minimum / maximum annual average of observations in any single year from the last five years. Yearly averages are only calculated where five or more observations occurred during that year. 3 Includes central counterparties. 4 Reported averages are low due to the effect of managed funds, which have relatively low default rates. 5 For Banks, no minimum / maximum LGDs are reported, since there were less than 5 observations in each year between 2011 and 2015. |
▲p
Backtesting
EDTF | Pillar 3 | We monitor the performance of our models by backtesting and benchmarking them, whereby model outcomes are compared with actual results, based on our internal experience as well as externally observed results. To assess the predictive power of our credit exposure models for traded products such as OTC derivatives and ETD products, we statistically compare the predicted future exposure distributions at different forecast horizons with the realized values.
For PD, we use statistical modeling to derive a predicted distribution of the number of defaults. The observed number of defaults is then compared with this distribution, allowing us to derive a statistical level of confidence in the model conservativeness. In addition, we derive a lower and upper bound for the average default rate. If the portfolio average PD lies outside the derived interval, the rating tool is, as a general rule, recalibrated.
For LGD, the backtesting statistically tests whether the mean difference between the observed and predicted LGD is zero. If the test rejects, then there is evidence that our predicted LGD is too low. In such cases, models are recalibrated where these differences are outside expectations.
Credit conversion factors (CCFs), used for the calculation of EAD for undrawn facilities with corporate counterparties, are dependent on several contractual dimensions of the credit facility. We compare the predicted amount drawn with observed historical utilization of such facilities for defaulted counterparties. If any statistically significant deviation is observed, the relevant CCFs are redefined.
The table on the previous page compares the current model calibration for PD, LGD and CCFs with historical observed values over the last five years. ▲▲
Changes to models and model parameters during the period
EDTF | Pillar 3 | As part of our continuous efforts to enhance models to reflect market developments and new available data, certain models were modified over the course of 2015. For the Swiss small and medium corporate clients, a revised rating tool was implemented in 2015, which includes behavioral information as an additional rating driver. Moreover, this rating tool was recalibrated based on an extended data history.
Revised rating methodologies for banks and leveraged corporates were introduced by combining a purely quantitative rating based on the empirical regression between counterparty financial characteristics and default events with a structured qualitative overlay, which allows for Risk Officers expert opinion to be included in the rating assessment. Where required, changes to models and model parameters were approved by the Swiss Financial Market Supervisory Authority (FINMA) prior to implementation. ▲▲
Risk, treasury and capital management
Risk management and control
Policies for past due, non-performing and impaired claims
EDTF | Pillar 3 | The diagram “Exposure categorization” illustrates how we categorize banking products and securities financing transactions (SFTs) as performing, non-performing or impaired.
Audited | For products accounted for on a fair value basis, such as OTC derivatives, credit deterioration is recognized through a credit valuation adjustment (CVA), and these products are therefore not subject to the below impairment framework.
We consider a claim at amortized cost (loan, guarantee, loan commitment or SFT) to be past due when a contractual payment has not been received by its contractual due date. This includes account overdrafts where the credit limit is exceeded. Past due claims are not considered impaired where we expect to collect all amounts due under the contractual terms of the claims.
A past due claim is considered non-performing when the payment of interest, principal or fees is overdue by more than 90 days. Claims are also classified as non-performing when insolvency proceedings / enforced liquidation have commenced or obligations have been restructured on preferential terms, such as preferential interest rates, extension of maturity or subordination. Non-performing claims are rated as being in counterparty default on our internal rating scale.
Individual claims are classified as impaired if following an individual impairment assessment, an allowance or provision for credit losses is established. Accordingly, both performing and non-performing loans may be classified as impaired. ▲▲▲
Restructured claims
Audited | EDTF | We do not operate a general policy for restructuring claims in order to avoid counterparty default. Where restructuring does take place, we assess each case individually. Typical features of terms and conditions granted through restructuring to avoid default may include the provision of special interest rates, postponement of interest or principal payments, modification of the schedule of repayments, subordination or amendment of loan maturity.
If a loan is restructured with preferential conditions (i.e., new terms and conditions are agreed which do not meet the normal current market criteria for the quality of the obligor and the type of loan), the claim is still classified as non-performing and is rated as being in counterparty default. It will remain so until the loan is collected, written off or non-preferential conditions are granted that supersede the preferential conditions, and will be assessed for impairment on an individual basis. ▲▲
Individual and collective impairment assessments
Audited | EDTF | Pillar 3 | Claims are assessed individually for impairment where there are indicators that an impairment may exist. Otherwise claims are included in a collective impairment assessment. ▲▲▲
Individual impairment assessment
Audited | EDTF | Pillar 3 | Non-performing status is considered an indicator that a loan may be impaired and therefore non-performing claims are assessed individually for impairment. However, an impairment analysis would be carried out irrespective of non-performing status if other objective evidence indicates that a loan may be impaired. Any event that impacts current and future cash flows may be an indication of impairment and trigger an assessment by the risk officer. Such events may be (i) significant collateral shortfalls due to a fall in lending values (securities and real estate), (ii) increase in loan or derivative exposures, (iii) significant financial difficulties of a client and (iv) high probability of the client's bankruptcy, debt moratorium or financial reorganization.
Individual claims are assessed for impairment based on the borrower’s overall financial condition, resources and payment record, the prospects of support from contractual guarantors and, where applicable, the realizable value of any collateral. The recoverable amount is determined from all relevant cash flows and, where this is lower than the carrying amount of the claim, the claim is considered impaired.
We have established processes to determine the carrying values of impaired claims in compliance with IFRS requirements. Our credit controls applied to valuation processes and workout agreements are the same for credit products measured at amortized cost and fair value. Our workout strategy and estimation of recoverable amounts are independently approved in accordance with our credit authorities. ▲▲▲
Collective impairment assessment
Audited | EDTF | Pillar 3 | We assess our portfolios of claims carried at amortized cost with similar credit risk characteristics for collective impairment in order to consider if these portfolios contain impaired claims that cannot yet be individually identified. To cover the time lag between the occurrence of an impairment event and its identification based on the policies above, we establish collective loan loss allowances based on the estimated loss for the portfolio over the average period between trigger events and the identification of any individual impairment. These portfolios are not considered impaired loans in the tables shown in this section.
Additionally, for all of our portfolios we assess whether there have been any developments which might result in event-driven impairments that are not immediately observable. These events could be stress situations, such as a natural disaster or a country crisis, or they could result from significant changes in the legal or regulatory environment. To determine whether a collective impairment exists, we regularly use a set of global economic drivers to assess the most vulnerable countries and review the impact of any potential impairment event. ▲▲▲
Recognition of impairment
Audited | EDTF | Pillar 3 | The recognition of impairment in our financial statements depends on the accounting treatment of the claim. For claims carried at amortized cost, impairment is recognized through the creation of an allowance, or in the case of off-balance sheet items such as guarantees and loan commitments through a provision, both charged to the income statement as a credit loss expense. For derivatives, which are carried at fair value, a deterioration of the credit quality is recognized as a credit valuation adjustment in the income statement in Net trading income. ▲▲▲
® Refer to “Note 1 Summary of significant accounting policies” and “Note 24a Valuation principles” in the “Consolidated financial statements” section of this report for more information on allowances and provisions for credit losses and credit valuation adjustments
Risk, treasury and capital management
Risk management and control
Market risk
Audited | EDTF | Pillar 3 | Main sources of market risk
– Market risks arise from both our trading and non-trading business activities.
– Trading market risks arise mainly in connection with securities and derivatives trading for market-making and client facilitation purposes within our Investment Bank, from remaining positions within Non-core and Legacy Portfolio and also from our municipal securities trading business within Wealth Management Americas.
– Non-trading market risk arises predominantly in the form of interest rate and foreign exchange risks in connection with personal banking and lending in our wealth management businesses, our personal and corporate banking businesses in Switzerland and the Investment Bank’s lending business, in addition to treasury activities.
– Corporate Center – Asset and Liability Management (Group ALM) assumes market risks in the process of managing interest rate risk, structural foreign exchange risks and the liquidity and funding profile of the Group.
– Equity and debt investments can also give rise to market risks, as can some aspects of our employee benefits such as defined benefit pension schemes. ▲▲▲
Audited | EDTF | Pillar 3 | Overview of measurement, monitoring and management techniques
– Market risk limits are set for the Group, the business divisions and Corporate Center and at granular levels within the various business lines, reflecting the nature and magnitude of the market risks.
– Our primary portfolio measures of market risk are liquidity-adjusted stress (LAS) loss and value-at-risk (VaR). Both are common to all our business divisions and subject to limits that are approved by the Board of Directors (BoD).
– These measures are complemented by concentration and granular limits for general and specific market risk factors. Our trading businesses are subject to multiple market risk limits. These limits take into account the extent of market liquidity and volatility, available operational capacity, valuation uncertainty, and, for our single-name exposures, the credit quality of issuers.
– Issuer risk is controlled by limits applied at business division level based on jump-to-zero measures, which estimate our maximum default exposure (the loss in the case of a default event assuming zero recovery).
– Non-trading foreign exchange risks are managed under market risk limits, with the exception of Group ALM’s management of consolidated capital activity.
Our Treasury Risk Control function applies a holistic risk framework which sets the appetite for treasury-related risk-taking activities across the Group. A key element of the framework is an overarching economic value sensitivity limit, set by the BoD. This limit is linked to the level of Basel III common equity tier 1 (CET1) capital and takes into account risks arising from interest rates, foreign exchange and credit spreads. In addition, the sensitivity of net interest income to changes in interest rates is monitored against targets set by the Group Chief Executive Officer in order to analyze the outlook and volatility of net interest income based on market expected interest rates. Limits are also set by the BoD to balance the impact of foreign exchange movements on our CET1 capital and CET1 capital ratio. Non-trading interest rate and foreign exchange risks are included in our Group-wide statistical and stress testing metrics which flow into our risk appetite framework.
Equity and debt investments are subject to a range of risk controls including pre-approval of new investments by business management and Risk Control and regular monitoring and reporting. They are also included in our Group-wide statistical and stress testing metrics which flow into our risk appetite framework. ▲▲▲
® Refer to the “Treasury management” section of this report for more information on Group ALM’s management of foreign exchange risks
® Refer to the “Capital management” section of this report for more information on the sensitivity of our CET1 capital and CET1 capital ratio to currency movements
Market risk exposures arising from our business activities
EDTF | The table on the next page highlights the most significant sources of our trading market risk exposures and the interest rate risk in our banking book exposures, categorized according to the business activities that primarily generate the risks and the classification of positions on the balance sheet. In practice, and particularly for positions classified in the banking book, we take account of natural risk offsets that occur between balance sheet line items, for example loans and deposits, and manage the residual exposures. The table does not show the foreign exchange risks arising from Group ALM’s management of consolidated capital activity discussed in the “Treasury management” section of this report.
Also shown in the table is the specific capital treatment for positions classified within the trading book in accordance with regulatory requirements (regulatory trading book). The amount of capital required to underpin market risk in the regulatory trading book is calculated using a variety of methods approved by FINMA. The components of market risk RWA are value-at-risk (VaR), stressed VaR (SVaR), an add-on for risks which are potentially not fully modeled in VaR, the incremental risk charge (IRC), the comprehensive risk measure (CRM) for the correlation portfolio and the securitization framework for securitization positions in the trading book. More information on each of these components is detailed in the “Market risk exposures arising from our primary business activities” table on the next page. ▲
Risk, treasury and capital management
Risk management and control
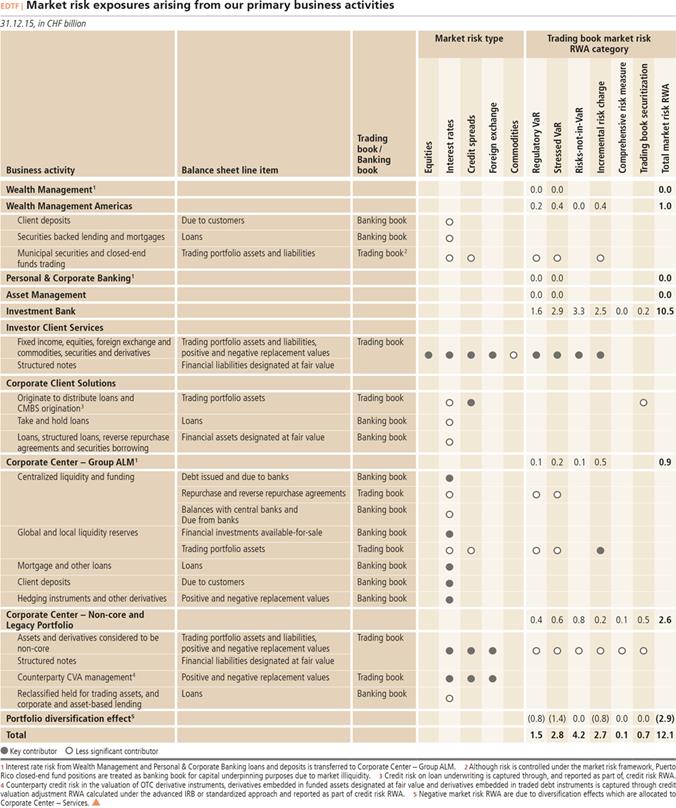
Market risk stress loss
EDTF | Pillar 3 | We measure and manage our market risks primarily through a comprehensive framework of non-statistical measures and related limits. This includes an extensive series of stress tests and scenario analyses, which we continuously evaluate in order to ensure that any losses resulting from an extreme, yet plausible, event do not exceed our risk appetite. ▲▲
Liquidity adjusted stress
EDTF | Pillar 3 | Our primary measure of stress loss for Group-wide market risk is liquidity-adjusted stress (LAS). The LAS framework is designed to capture the economic losses that could arise under specified stress scenarios. This is in part achieved by replacing the standard one-day and 10-day holding period assumptions used for management and regulatory VaR with liquidity-adjusted holding periods, as explained below. Shocks are then applied to positions based on the expected market movements over the liquidity-adjusted holding periods resulting from the specified scenario.
The holding periods used in LAS are calibrated to reflect the amount of time it would take to reduce or hedge the risk of positions in each major risk factor in a stressed environment, assuming maximum utilization of the relevant position limits. Holding periods are also subject to minimum periods, regardless of observed liquidity levels, reflecting the fact that identification of and reaction to a crisis may not always be immediate.
The expected market movements are derived using a combination of historical market behavior, based on an analysis of historical events, and forward-looking analysis including consideration of defined scenarios that have not occurred historically.
LAS-based limits are applied at a number of levels: Group-wide, business divisions and Corporate Center, business areas and sub-portfolios. In addition, LAS forms the core market risk component of our combined stress test framework and is therefore integral to our overall risk appetite framework. ▲▲
® Refer to “Risk appetite framework” in this section for more information
® Refer to “Stress testing” in this section for more information on our stress testing framework

VaR definition
Audited | EDTF | Pillar 3 | Value-at-risk (VaR) is a statistical measure of market risk, representing the market risk losses that could potentially be realized over a set time horizon (holding period) at an established level of confidence. The measure assumes no change in the Group’s trading positions over the set time horizon.
We calculate VaR on a daily basis, based on the direct application of historical changes in market risk factors to our current positions – a method known as historical simulation. We use a single VaR model for both internal management purposes and for determining market risk regulatory capital requirements, although we consider different confidence levels and time horizons. For internal management purposes, we establish risk limits and measure exposures using VaR at the 95% confidence level with a one-day holding period, aligned to the way we consider the risks associated with our trading activities. The regulatory measure of market risk used to underpin the market risk capital requirement under Basel III requires a measure equivalent to a 99% confidence level using a 10-day holding period. ▲
Additionally, the population of the portfolio within management and regulatory VaR is slightly different. The population within regulatory VaR meets minimum regulatory requirements for inclusion in regulatory VaR. Management VaR includes a broader population of positions. For example, regulatory VaR excludes the credit spread risks from the securitization portfolio, which are treated instead under the securitization approach for regulatory purposes. ▲▲
Risk, treasury and capital management
Risk management and control
Management VaR for the period
EDTF | The tables below show minimum, maximum, average and period-end management VaR by business division and Corporate Center unit, and by general market risk type. Market risk, measured as 1-day, 95% confidence level management VaR continued to be managed at low levels and average VaR remained stable in 2015 compared with the prior year. With VaR at such low levels, we continued to observe large relative changes driven by positions arising from client facilitation, as well as option expiries, the effect of which can be seen in the maximum VaR for the period. ▲
Audited | EDTF |
Management value-at-risk (1-day, 95% confidence, 5 years of historical data) by business division and Corporate Center unit and general market risk type¹ |
| | For the year ended 31.12.15 |
CHF million | | | | | | Equity | Interest rates | Credit spreads | Foreign exchange | Commodities |
| | Min. | | | | 5 | 7 | 4 | 1 | 0 |
| | | Max. | | | 23 | 18 | 9 | 11 | 5 |
| | | | Average | | 9 | 11 | 6 | 4 | 2 |
| | | | | 31.12.15 | 7 | 9 | 4 | 3 | 1 |
Total management VaR, Group | | 10 | 25 | 15 | 13 | Average (per business division and risk type) |
Wealth Management | | 0 | 0 | 0 | 0 | 0 | 0 | 0 | 0 | 0 |
Wealth Management Americas | | 0 | 1 | 0 | 0 | 0 | 1 | 1 | 0 | 0 |
Personal & Corporate Banking | | 0 | 0 | 0 | 0 | 0 | 0 | 0 | 0 | 0 |
Asset Management | | 0 | 0 | 0 | 0 | 0 | 0 | 0 | 0 | 0 |
Investment Bank | | 7 | 22 | 12 | 10 | 9 | 6 | 3 | 4 | 2 |
CC – Services | | 0 | 0 | 0 | 0 | 0 | 0 | 0 | 0 | 0 |
CC – Group ALM² | | 4 | 16 | 8 | 6 | 0 | 8 | 0 | 1 | 0 |
CC – Non-core and Legacy Portfolio | | 5 | 9 | 6 | 5 | 0 | 4 | 5 | 1 | 0 |
Diversification effect³˒⁴ | | | | (12) | (9) | 0 | (9) | (4) | (1) | 0 |
| | | | | | | | | | |
| | For the year ended 31.12.14 |
CHF million | | | | | | Equity | Interest rates | Credit spreads | Foreign exchange | Commodities |
| | Min. | | | | 5 | 7 | 6 | 2 | 1 |
| | | Max. | | | 24 | 11 | 12 | 8 | 3 |
| | | | Average | | 9 | 9 | 9 | 4 | 2 |
| | | | | 31.12.14 | 14 | 8 | 7 | 4 | 1 |
Total management VaR, Group | | 10 | 23 | 14 | 17 | Average (per business division and risk type) |
Wealth Management | | 0 | 0 | 0 | 0 | 0 | 0 | 0 | 0 | 0 |
Wealth Management Americas | | 0 | 2 | 1 | 1 | 0 | 1 | 2 | 0 | 0 |
Personal & Corporate Banking | | 0 | 0 | 0 | 0 | 0 | 0 | 0 | 0 | 0 |
Asset Management | | 0 | 0 | 0 | 0 | 0 | 0 | 0 | 0 | 0 |
Investment Bank | | 7 | 24 | 12 | 17 | 9 | 7 | 5 | 3 | 2 |
CC – Core Functions² | | 3 | 7 | 4 | 5 | 0 | 4 | 0 | 1 | 0 |
CC – Non-core and Legacy Portfolio | | 6 | 11 | 8 | 6 | 2 | 5 | 7 | 1 | 0 |
Diversification effect³˒⁴ | | | | (11) | (12) | (2) | (8) | (5) | (1) | 0 |
1 Statistics at individual levels may not be summed to deduce the corresponding aggregate figures. The minima and maxima for each level may well occur on different days, and likewise, the VaR for each business line or risk type, being driven by the extreme loss tail of the corresponding distribution of simulated profits and losses for that business line or risk type, may well be driven by different days in the historical timeseries, rendering invalid the simple summation of figures to arrive at the aggregate total. 2 Following changes in the organization of Corporate Center units as of 1 January 2015, amounts previously reported under CC – Core Functions are now reported under CC – Group ALM. 3 Difference between the sum of the standalone VaR for the business divisions and Corporate Center units and the VaR for the Group as a whole. 4 As the minimum and maximum occur on different days for different business divisions and Corporate Center, it is not meaningful to calculate a portfolio diversification effect. |
▲▲
Regulatory VaR for the period
EDTF | Pillar 3 | The tables below show minimum, maximum, average and period-end regulatory VaR by business division and Corporate Center unit, and by general market risk type. Regulatory VaR exhibits a similar pattern to management VaR, with a more pronounced variability reflected in the reported maximum levels due to the 10-day holding period used. ▲▲
EDTF | Pillar 3 |
Regulatory value-at-risk (10-day, 99% confidence, 5 years of historical data) by business division and Corporate Center unit and general market risk type¹ |
| | For the year ended 31.12.15 |
CHF million | | | | | | Equity | Interest rates | Credit spreads | Foreign exchange | Commodities |
| | Min. | | | | 22 | 14 | 14 | 6 | 4 |
| | | Max. | | | 66 | 42 | 40 | 72 | 20 |
| | | | Average | | 35 | 28 | 24 | 25 | 9 |
| | | | | 31.12.15 | 27 | 16 | 14 | 20 | 6 |
Total regulatory VaR, Group | | 28 | 77 | 45 | 32 | Average (per business division and risk type) |
Wealth Management | | 0 | 2 | 0 | 0 | 0 | 0 | 0 | 0 | 0 |
Wealth Management Americas | | 3 | 6 | 5 | 4 | 0 | 5 | 4 | 0 | 0 |
Personal & Corporate Banking | | 0 | 1 | 0 | 0 | 0 | 0 | 0 | 0 | 0 |
Asset Management | | 0 | 0 | 0 | 0 | 0 | 0 | 0 | 0 | 0 |
Investment Bank | | 26 | 74 | 43 | 33 | 35 | 21 | 16 | 24 | 8 |
CC – Services | | 0 | 0 | 0 | 0 | 0 | 0 | 0 | 0 | 0 |
CC – Group ALM² | | 1 | 43 | 19 | 2 | 0 | 17 | 1 | 4 | 0 |
CC – Non-core and Legacy Portfolio | | 8 | 27 | 14 | 10 | 0 | 10 | 12 | 4 | 4 |
Diversification effect³˒⁴ | | | | (36) | (16) | 0 | (26) | (10) | (7) | (3) |
| | | | | | | | | | |
| | For the year ended 31.12.14 |
CHF million | | | | | | Equity | Interest rates | Credit spreads | Foreign exchange | Commodities |
| | Min. | | | | 23 | 18 | 32 | 4 | 5 |
| | | Max. | | | 60 | 48 | 69 | 59 | 32 |
| | | | Average | | 33 | 27 | 45 | 24 | 12 |
| | | | | 31.12.14 | 46 | 22 | 34 | 24 | 7 |
Total regulatory VaR, Group | | 31 | 104 | 50 | 60 | Average (per business division and risk type) |
Wealth Management | | 0 | 0 | 0 | 0 | 0 | 0 | 0 | 0 | 0 |
Wealth Management Americas | | 3 | 11 | 5 | 6 | 0 | 5 | 7 | 0 | 0 |
Personal & Corporate Banking | | 0 | 0 | 0 | 0 | 0 | 0 | 0 | 0 | 0 |
Asset Management | | 0 | 0 | 0 | 0 | 0 | 0 | 0 | 0 | 0 |
Investment Bank | | 29 | 87 | 45 | 57 | 33 | 26 | 31 | 21 | 11 |
CC – Core Functions² | | 6 | 35 | 15 | 19 | 0 | 15 | 2 | 4 | 0 |
CC – Non-core and Legacy Portfolio | | 15 | 48 | 28 | 16 | 2 | 15 | 28 | 9 | 2 |
Diversification effect³˒⁴ | | | | (43) | (38) | (2) | (34) | (23) | (10) | (1) |
1 Statistics at individual levels may not be summed to deduce the corresponding aggregate figures. The minima and maxima for each level may well occur on different days, and likewise, the VaR for each business line or risk type, being driven by the extreme loss tail of the corresponding distribution of simulated profits and losses for that business line or risk type, may well be driven by different days in the historical timeseries, rendering invalid the simple summation of figures to arrive at the aggregate total. 2 Following changes in the organization of Corporate Center units as of 1 January 2015, amounts previously reported under CC – Core Functions are now reported under CC – Group ALM. 3 Difference between the sum of the standalone VaR for the business divisions and Corporate Center units and the VaR for the Group as a whole. 4 As the minimum and maximum occur on different days for different business divisions and Corporate Center, it is not meaningful to calculate a portfolio diversification effect. |
▲▲
Risk, treasury and capital management
Risk management and control
VaR limitations
Audited | EDTF | Pillar 3 | Actual realized market risk losses may differ from those implied by our VaR for a variety of reasons.
– The VaR measure is calibrated to a specified level of confidence and may not indicate potential losses beyond this confidence level.
– The one-day time horizon used for VaR for internal management purposes, or 10-day in the case of the regulatory VaR measure, may not fully capture the market risk of positions that cannot be closed out or hedged within the specified period.
– In certain cases, VaR calculations approximate the impact of changes in risk factors on the values of positions and portfolios. This may happen because the number of risk factors included in the VaR model is necessarily limited. For example, yield curve risk factors do not exist for all future dates.
– The effect of extreme market movements is subject to estimation errors, which may result from non-linear risk sensitivities, as well as the potential for actual volatility and correlation levels to differ from assumptions implicit in the VaR calculations.
– The use of a five-year window means that sudden increases in market volatility will tend not to increase VaR as quickly as the use of shorter historical observation periods, but the increase will affect our VaR for a longer period of time. Similarly, following a period of increased volatility, as markets stabilize, VaR predictions will remain more conservative for a period of time influenced by the length of the historical observation period.
We recognize that no single measure may encompass the entirety of risks associated with a position or portfolio. Consequently, we employ a suite of various metrics with both overlapping and complementary characteristics in order to create a holistic framework which ensures material completeness of risk
identification and measurement. As a statistical aggregate risk measure, VaR supplements our comprehensive stress testing framework.
Moreover, we have an established framework to identify and quantify potential risks that are not fully captured by our VaR model. This framework is explained later in this section. ▲▲▲
Backtesting of VaR
EDTF | Pillar 3 | For backtesting purposes, we compute backtesting VaR using a 99% confidence level and one-day holding period for the population included within regulatory VaR. The backtesting process compares backtesting VaR calculated on positions at the close of each business day with the revenues generated by those positions on the following business day. Backtesting revenues exclude non-trading revenues, such as fees and commissions and revenues from intraday trading, to ensure a like-for-like comparison. A backtesting exception occurs when backtesting revenues are negative and the absolute value of those revenues is greater than the previous day’s backtesting VaR.
Statistically, given the confidence level of 99%, two to three backtesting exceptions per year can be expected. More exceptions than this could indicate that the VaR model is not performing appropriately, as could too few exceptions over a prolonged period of time. However, as noted in the VaR limitations above, a sudden increase or decrease in market volatility relative to the five-year window could lead to a higher or lower number of exceptions, respectively. Accordingly, Group-level backtesting exceptions are investigated, as are exceptional positive backtesting revenues, with results being reported to senior business management, the Group Chief Risk Officer and the divisional Chief Risk Officers. Backtesting exceptions are also reported to internal and external auditors and to the relevant regulators.

The “Group: development of backtesting revenues against backtesting VaR” chart on the previous page shows the 12-month development of backtesting VaR against the Group's backtesting revenues for 2015. The chart shows both the negative and positive tails of the backtesting VaR distribution at 99% confidence intervals representing, respectively, the losses and gains that could potentially be realized over a one-day period at that level of confidence. Although less pronounced than in previous years, the asymmetry between the negative and positive tails is due to the long gamma risk profile that has been run historically in the Investment Bank. This long gamma position profits from increases in volatility, which therefore benefits the positive tail of the VaR simulated profit and loss distribution.
The histogram “Investment Bank and Corporate Center – Non-core and Legacy Portfolio daily revenue distribution” shows the daily revenue distribution for the Investment Bank and Non-core and Legacy Portfolio for 2015. This includes, in addition to backtesting revenues, revenues such as commissions and fees, revenues for intraday trading and own credit.
There were four Group VaR negative backtesting exceptions during 2015, all of which occurred in the second half of the year. The trading losses that caused the two exceptions in the period from August to mid-September, as well as the three positive backtesting revenue spikes during this period, were primarily driven by the onshore / offshore Chinese foreign exchange basis risk. UBS is exposed to this risk from its allocated Qualified Foreign Institutional Investor (QFII) quota, which allows foreign investors to access the onshore capital markets. The volatility in this currency basis increased substantially after the People’s Bank of China unexpectedly and significantly weakened its daily fixing for the Chinese yuan against the US dollar on 11 August 2015. In response to these extreme market moves outside the 99th percentile of the historical VaR time series, UBS significantly reduced its Chinese onshore / offshore foreign exchange basis exposure. The two exceptions at the end of September and November were driven by a combination of (i) a contraction in the aforementioned foreign exchange basis and further market moves and (ii) adjustments to trading revenues resulting from month-end or other non-daily valuation adjustments which partly map to risks accounted for in the capital underpinning for risk-not-in-VaR.
We do not believe that the recent increase in the number of downside exceptions indicates a material deficiency in our VaR model, given the specific circumstances outlined above and the statistical expectation of two to three exceptions per year.
The positive backtesting revenue in January, as shown in the chart, resulted from significant market volatility following the Swiss National Bank’s decision to discontinue its exchange rate floor for the Swiss franc against the euro. Extreme market moves, particularly in foreign exchange markets, were observed far outside the 99th percentile of the historical VaR timeseries. ▲▲
VaR model confirmation
EDTF | In addition to model backtesting performed for regulatory purposes, described above, we also conduct extended backtesting for our internal model confirmation purposes. This includes observing model performance across the entire profit and loss distribution, not just the tails, and at multiple levels within the business division and Corporate Center hierarchies. ▲
® Refer to “Risk measurement” in this section for more information on our approach to model confirmation procedures
VaR model developments in 2015
Audited | EDTF | Pillar 3 | We made no significant changes to the VaR model during 2015, although we improved the VaR model by integrating selected risks-not-in-VaR items, the impact of which was negligible. ▲▲▲
Derivation of regulatory VaR-based RWA
EDTF | Pillar 3 | Regulatory VaR is used to derive the regulatory VaR component of the market risk Basel III RWA, as shown in the “Capital management” section of this report as well as in “Table 2: Detailed segmentation of Basel III exposures and risk-weighted assets” in the “UBS Group AG consolidated supplemental disclosures required under Basel III Pillar 3 regulations” section of this report. This calculation takes the maximum of the period-end regulatory VaR and the average regulatory VaR for the 60 trading days immediately preceding the period end, multiplied by a VaR multiplier set by FINMA. The VaR multiplier, which was three as of 31 December 2015, is dependent upon the number of VaR backtesting exceptions within a 250 business day window. When the number of exceptions is greater than four, the multiplier increases gradually from three to a maximum of four if 10 or more backtesting exceptions occur. This is then multiplied by a risk weight factor of 1,250% to determine RWA. This calculation is set out in the table on the next page. ▲▲
EDTF | Pillar 3 |
Backtesting regulatory value-at-risk (1-day, 99% confidence, 5 years of historical data) |
| | For the year ended 31.12.15 | | For the year ended 31.12.14 |
CHF million | | Min. | Max. | Average | 31.12.15 | | Min. | Max. | Average | 31.12.14 |
Group | | 14 | 35 | 21 | 18 | | 15 | 38 | 22 | 20 |
▲▲
Risk, treasury and capital management
Risk management and control
EDTF | Pillar 3 |
Calculation of regulatory VaR-based RWA as of 31 December 2015 | |
CHF million | Period end regulatory VaR (A) | 60-day average regulatory VaR (B) | VaR multiplier (C) | Max (A, B x C) (D) | Risk weight factor (E) | Basel III RWA (D x E) | |
| |
| 32 | 41 | 3.0 | 122 | 1,250% | 1,528 | |
▲p

EDTF | Pillar 3 | Stressed VaR (SVaR) adopts broadly the same methodology as regulatory VaR and is calculated using the same population, holding period (10-day) and confidence level (99%). However, unlike regulatory VaR, the historical data set for SVaR is not limited to five years. SVaR uses continuous one-year data sets to derive the largest potential loss arising from a one-year period of significant financial stress relevant to the current portfolio of the Group.
SVaR is subject to the same limitations as noted for VaR above, but the use of one-year data sets avoids the smoothing effect of the five-year data set used for VaR, and the removal of the five-year window provides for a longer history of potential loss events.
Therefore, although the significant period of stress during the financial crisis is no longer contained in the historical 5-year period used for regulatory VaR, SVaR will continue to use this data. This approach is intended to reduce the procyclicality of the regulatory capital requirements for market risks.
We made no significant changes to the SVaR model during 2015. ▲▲
SVaR for the period
EDTF | Pillar 3 | Over the year, SVaR has exhibited a similar pattern to that noted for management and regulatory VaR above. ▲▲
Derivation of SVaR-based RWA
EDTF | Pillar 3 | SVaR is used to derive the SVaR component of the market risk Basel III RWA as shown in the “Capital management“ section of this report as well as in “Table 2: Detailed segmentation of Basel III exposures and risk-weighted assets” in the “UBS Group AG consolidated supplemental disclosures required under Basel III Pillar 3 regulations” section of this report. The derivation of this component is similar to that explained above for regulatory VaR, and is shown below. ▲▲
EDTF | Pillar 3 |
Calculation of SVaR-based RWA as of 31 December 2015 |
| Period end SVaR (A) | 60-day average SVaR (B) | VaR multiplier (C) | Max (A, B x C) (D) | Risk weight factor (E) | Basel III RWA (D x E) |
CHF million |
| 58 | 76 | 3.0 | 227 | 1,250% | 2,835 |
▲▲
EDTF | Pillar 3 |
Stressed value-at-risk (10-day, 99% confidence, historical data from 1 January 2007 to present) by business division and Corporate Center unit and general market risk type¹ |
| | For the year ended 31.12.15 |
CHF million | | | | | | Equity | Interest rates | Credit spreads | Foreign exchange | Commodities |
| | Min. | | | | 46 | 25 | 46 | 11 | 7 |
| | | Max. | | | 274 | 131 | 113 | 156 | 63 |
| | | | Average | | 87 | 58 | 74 | 55 | 20 |
| | | | | 31.12.15 | 57 | 56 | 48 | 31 | 16 |
Total stressed VaR, Group | | 54 | 291 | 96 | 58 | Average (per business division and risk type) |
Wealth Management | | 0 | 3 | 0 | 0 | 0 | 0 | 0 | 0 | 0 |
Wealth Management Americas | | 7 | 18 | 11 | 10 | 0 | 9 | 15 | 0 | 0 |
Personal & Corporate Banking | | 0 | 2 | 0 | 0 | 0 | 0 | 0 | 0 | 0 |
Asset Management | | 0 | 0 | 0 | 0 | 0 | 0 | 0 | 0 | 0 |
Investment Bank | | 48 | 306 | 92 | 63 | 87 | 49 | 50 | 56 | 18 |
CC – Services | | 0 | 0 | 0 | 0 | 0 | 0 | 0 | 0 | 0 |
CC – Group ALM² | | 5 | 75 | 42 | 8 | 0 | 40 | 5 | 7 | 0 |
CC – Non-core and Legacy Portfolio | | 15 | 66 | 32 | 20 | 0 | 24 | 24 | 7 | 7 |
Diversification effect³˒⁴ | | | | (81) | (41) | 0 | (64) | (21) | (15) | (5) |
| | | | | | | | | | |
| | For the year ended 31.12.14 |
CHF million | | | | | | Equity | Interest rates | Credit spreads | Foreign exchange | Commodities |
| | Min. | | | | 46 | 18 | 74 | 9 | 9 |
| | | Max. | | | 348 | 156 | 233 | 281 | 84 |
| | | | Average | | 71 | 67 | 121 | 56 | 29 |
| | | | | 31.12.14 | 103 | 32 | 98 | 45 | 16 |
Total stressed VaR, Group | | 63 | 373 | 94 | 105 | Average (per business division and risk type) |
Wealth Management | | 0 | 0 | 0 | 0 | 0 | 0 | 0 | 0 | 0 |
Wealth Management Americas | | 9 | 22 | 14 | 15 | 0 | 8 | 22 | 0 | 0 |
Personal & Corporate Banking | | 0 | 0 | 0 | 0 | 0 | 0 | 0 | 0 | 0 |
Asset Management | | 0 | 0 | 0 | 0 | 0 | 0 | 0 | 0 | 0 |
Investment Bank | | 50 | 381 | 86 | 101 | 70 | 50 | 89 | 51 | 28 |
CC – Core Functions² | | 29 | 66 | 44 | 44 | 0 | 41 | 6 | 6 | 0 |
CC – Non-core and Legacy Portfolio | | 23 | 115 | 54 | 30 | 9 | 46 | 56 | 17 | 3 |
Diversification effect³˒⁴ | | | | (104) | (85) | (8) | (78) | (52) | (18) | (2) |
1 Statistics at individual levels may not be summed to deduce the corresponding aggregate figures. The minima and maxima for each level may well occur on different days, and likewise, the VaR for each business line or risk type, being driven by the extreme loss tail of the corresponding distribution of simulated profits and losses for that business line or risk type, may well be driven by different days in the historical timeseries, rendering invalid the simple summation of figures to arrive at the aggregate total. 2 Following changes in the organization of Corporate Center units as of 1 January 2015, amounts previously reported under CC – Core Functions are now reported under CC – Group ALM. 3 Difference between the sum of the standalone VaR for the business divisions and Corporate Center units and the VaR for the Group as a whole. 4 As the minimum and maximum occur on different days for different business divisions and Corporate Center, it is not meaningful to calculate a portfolio diversification effect. |
▲▲
Risk, treasury and capital management
Risk management and control
Risks-not-in-VaR
Risks-not-in-VaR definition
EDTF | Pillar 3 | We have an established framework to identify and quantify potential risk factors that are not fully captured by our VaR model. We refer to these risk factors as risks-not-in-VaR (RniV). This framework is used to underpin these potential risk factors with regulatory capital, calculated as a multiple of regulatory VaR and SVaR.
RniV arises from approximations made by the VaR model to quantify the effect of risk factor changes on the profit and loss of positions and portfolios, as well as the use of proxies for certain market risk factors. We categorize RniV by means of items and keep track of which instrument classes are affected by each item.
When new types of instruments are included in the VaR population, we assess whether new items must be added to the inventory of RniV items. ▲▲
Risks-not-in-VaR quantification
EDTF | Pillar 3 | Risk officers perform a quantitative assessment for each position in the inventory of RniV annually. The assessment is made in terms of a 10-day 99%-VaR measure applied to the difference between the profit and loss scenarios which would have been produced based on our best estimate given available data, and the profit and loss scenarios generated by the current model used for the regulatory VaR calculation. Whenever the available market data allows, a historical simulation approach with five years of historical data is used to estimate the 10-day 99%-VaR for an item. Other eligible methods are based on analytical considerations or stress test and worst-case assessments. Statistical methods are used to aggregate the standalone risks, yielding a Group-level 10-day 99%-VaR estimate of the entire inventory of RniV items at the specific date. The ratio of this amount to regulatory VaR is used to produce estimates for arbitrary points in time by scaling the corresponding regulatory VaR figures with that fixed ratio. An analogous approach is applied for SVaR. ▲▲
Risks-not-in-VaR mitigation
EDTF | Pillar 3 | Material RniV items are monitored and controlled by means and measures other than VaR, such as position limits and stress limits. Additionally, there are ongoing initiatives to extend the VaR model to better capture these risks. ▲▲
Derivation of RWA add-on for risks-not-in-VaR
EDTF | Pillar 3 | The RniV framework is used to derive the RniV-based component of the market risk Basel III RWA, using the aforementioned approach, which is approved by FINMA and subject to an annual recalibration. As the RWA from RniV are add-ons, they do not reflect any diversification benefits across risks capitalized through VaR and SVaR.
Following the annual calibration of the ratios in the third quarter of 2015, FINMA confirmed that the RniV VaR and SVaR capital ratios remained unchanged at 105% and 92%, respectively.
FINMA continues to require that RniV stressed VaR capital is floored at RniV VaR capital.
Based on the regulatory VaR and SVaR RWA noted above, the RniV RWA add-ons as of 31 December 2015 reduced to CHF 1.6 billion and CHF 2.6 billion, respectively, compared with CHF 2.1 billion and CHF 3.8 billion as of 31 December 2014, following the reduction in VaR and SVaR. ▲▲

EDTF | Pillar 3 | The incremental risk charge (IRC) represents an estimate of the default and rating migration risk of all trading book positions with issuer risk, except for equity products and securitization exposures, measured over a one-year time horizon at a 99.9% confidence level. The calculation of the measure assumes all positions in the IRC portfolio have a one-year liquidity horizon and are kept unchanged over this period.
The portfolio default and rating migration loss distribution is estimated using a Monte Carlo simulation of correlated rating migration events (defaults and rating changes) for all issuers in the IRC portfolio, based on a Merton-type model. For each position, default losses are calculated based on the maximum default exposure measure (the loss in the case of a default event assuming zero recovery) and a random recovery concept. To account for potential basis risk between instruments, different recovery values may be generated for different instruments even if they belong to the same issuer. To calculate rating migration losses, a linear (delta) approximation is used. A loss due to a rating migration event is calculated as the estimated change in credit spread due to the change in rating migration, multiplied by the corresponding sensitivity of a position to changes in credit spreads.
The table below provides a breakdown of the Group’s period-end incremental risk charge by business division and Corporate Center unit. The reduction in the Group’s period-end IRC was mainly driven by a risk reduction in the Group ALM liquidity asset buffer and a model change applied in the fourth quarter of 2015. ▲▲
Derivation of IRC-based RWA
EDTF | Pillar 3 | IRC is calculated weekly, the results of which are used to derive the IRC-based component of the market risk Basel III RWA, as shown in the “Capital management” section of this report as well as in “Table 2: Detailed segmentation of Basel III exposures and risk-weighted assets” in the “UBS Group AG consolidated supplemental disclosures required under Basel III Pillar 3 regulations” section of this report. The derivation is similar to that for VaR and SVaR-based RWA, but without a VaR multiplier, and is shown below. ▲▲
EDTF | Pillar 3 |
Incremental risk charge by business division and Corporate Center unit |
| | For the year ended 31.12.15 | | For the year ended 31.12.14 |
CHF million | | Min. | Max. | Average | 31.12.15 | | Min. | Max. | Average | 31.12.14 |
Wealth Management | | | | | | | | | | |
Wealth Management Americas | | 19 | 67 | 40 | 30 | | 11 | 28 | 19 | 27 |
Personal & Corporate Banking | | | | | | | | | | |
Asset Management | | | | | | | | | | |
Investment Bank | | 128 | 197 | 161 | 197 | | 130 | 300 | 182 | 197 |
CC – Services | | | | | | | | | | |
CC – Group ALM¹ | | 53 | 116 | 81 | 60 | | 102 | 165 | 131 | 108 |
CC – Non-core and Legacy Portfolio | | 15 | 51 | 29 | 27 | | 31 | 92 | 57 | 46 |
Diversification effect²˒³ | | | | (106) | (95) | | | | (213) | (135) |
Total incremental risk charge, Group | | 159 | 235 | 205 | 219 | | 93 | 264 | 175 | 243 |
1 Following changes in the organization of Corporate Center units as of 1 January 2015, amounts previously reported under CC – Core functions are now reported under CC – Group ALM. 2 Difference between the sum of the standalone IRC for the business divisions and Corporate Center units and the IRC for the Group as a whole. 3 As the minimum and maximum occur on different days for different business divisions and Corporate Center, it is not meaningful to calculate a portfolio diversification effect. |
▲▲
EDTF | Pillar 3 |
Calculation of IRC-based RWA as of 31 December 2015 |
| Period end IRC (A) | Average of last 12 weeks IRC (B) | Max (A, B) (C) | Risk weight factor (D) | Basel III RWA (C x D) |
CHF million |
| 219 | 201 | 219 | 1,250% | 2,732 |
▲▲
Risk, treasury and capital management
Risk management and control
EDTF | Pillar 3 | The comprehensive risk measure (CRM) is an estimate of the default and complex price risk, including the convexity and cross-convexity of the CRM portfolio across credit spread, correlation and recovery, measured over a one-year time horizon at a 99.9% confidence level. The calculation of the measure assumes that all positions in the CRM portfolio have a one-year liquidity horizon and are kept unchanged over this time period. The model scope covers collateralized debt obligation (CDO) swaps, credit-linked notes (CLNs), 1st and nth-to-default swaps and CLNs and hedges for these positions, including credit default swaps (CDSs), CLNs and index CDSs.
The CRM profit and loss distribution is estimated using a Monte Carlo simulation of defaults over the next 12 months, and calculates resulting cash flows in the CRM portfolio. The
portfolio is then revalued on the one-year horizon date, with inputs such as credit spreads and index basis being migrated from spot to horizon date. The 99.9% negative quantile of the resulting profit and loss distribution is then taken to be the CRM result. Our CRM methodology is subject to minimum qualitative standards as well as stress testing.
Since the exit of the Non-core correlation trading portfolio market risk in 2014, the CRM for the Group has remained at low levels, as shown in the table below. ▲▲
® Refer to “Corporate Center – Non-core and Legacy Portfolio” in the “Risk management and control” section of this report for more information on the Non-core correlation trading portfolio
Derivation of CRM-based RWA
EDTF | Pillar 3 | CRM is calculated weekly, and the results are used to derive the CRM-based component of the market risk Basel III RWA, as shown in the “Capital management” section of this report as well as in “Table 2: Detailed segmentation of Basel III exposures and risk-weighted assets” in the “UBS Group AG consolidated supplemental disclosures required under Basel III Pillar 3 regulations” section of this report. The calculation is subject to a floor equal to 8% of the equivalent capital charge under the specific risk measure (SRM) for the correlation trading portfolio. The calculation is shown below. ▲▲
EDTF | Pillar 3 |
Comprehensive risk measure | | | | | | | | | | |
| | For the year ended 31.12.15 | | For the year ended 31.12.14 |
CHF million | | Min. | Max. | Average | 31.12.15 | | Min. | Max. | Average | 31.12.14 |
Total comprehensive risk measure, Group | | 4 | 12 | 8 | 5 | | 5 | 335 | 120 | 6 |
▲▲
EDTF | Pillar 3 |
Calculation of CRM-based RWA as of 31 December 2015 |
CHF million | Period end CRM (A) | Average of last 12 weeks CRM (B)¹ | Max (A, B) (C) | Risk weight factor (D) | Basel III RWA (C x D) |
| 5 | 7 | 7 | 1,250% | 84 |
1 CRM = Max (CRM model result, 8% of equivalent charge under the SRM). |
▲▲
Securitization positions in the trading book
EDTF | Pillar 3 | Our exposure to securitization positions in the trading book is limited and relates primarily to positions in Corporate Center – Non-core and Legacy Portfolio which we continue to wind down. A small amount of exposure also arises from secondary trading in commercial mortgage-backed securities in the Investment Bank. Refer to “Table 2: Detailed segmentation of Basel III exposures and risk-weighted assets” in the “UBS Group AG consolidated supplemental disclosures required under Basel III Pillar 3 regulations” section of this report for more information. ▲▲
Interest rate risk in the banking book
Sources of interest rate risk in the banking book
Audited | EDTF | Pillar 3 | Interest rate risk in the banking book arises from balance sheet positions such as Loans and receivables, client deposits and Debt issued, Available-for-sale instruments, certain Instruments designated at fair value through profit or loss, derivatives measured at fair value through profit or loss and derivatives utilized for cash flow hedge accounting purposes, as well as related funding transactions. These positions may impact Other comprehensive income or profit or loss, depending on their accounting treatment.
Our largest banking book interest rate exposures arise from client deposits and lending products in both our wealth management businesses and Personal & Corporate Banking. For Wealth Management and Personal & Corporate Banking, the inherent interest rate risks are transferred either by means of back-to-back transactions or, in the case of products with no contractual maturity date or direct market-linked rate, by replicating portfolios from the originating business into Group ALM, which manages the risks on an integrated basis allowing for netting interest rate risks across different sources. Any residual interest rate risks in Wealth Management and Personal & Corporate Banking that are not transferred to Group ALM are managed locally and are subject to independent monitoring and control both in the locations by local risk control units as well as centrally by Market Risk Control. To manage the interest rate risk centrally, Group ALM utilizes derivative instruments, most of which are in designated hedge accounting relationships. A significant amount of interest rate risk also arises from Group ALM financing and investing activities, for example the investment and refinancing of non-monetary corporate balance sheet items that have indefinite maturities, such as equity, goodwill and real estate. For these items, senior management has defined specific target durations based on which we fund and invest as applicable. These targets are defined by replication portfolios, which establish rolling benchmarks to execute against. Group ALM also maintains a portfolio of available-for-sale debt investments to meet the Group’s liquidity needs. In the first quarter of 2015, we shortened the target duration for the investment of our Swiss franc-denominated equity, primarily in response to the prevailing negative Swiss franc interest rate environment. This resulted in an initial increase in negative interest rate sensitivity in Group ALM. This exposure was subsequently reduced as Group ALM rebalanced the banking book to meet the new target duration of equity. As of 31 December 2015, our consolidated equity was invested as follows: in Swiss francs with an average duration of approximately two years and fair value sensitivity of CHF 4 million per basis point; in US dollars with an average duration of approximately five years and a sensitivity of CHF 10 million per basis point. The sensitivities relate directly to the chosen durations.
Interest rate risk within Wealth Management Americas arises from the business division’s portfolio of available-for-sale investments, in addition to its lending and deposit products offered to clients. This interest rate risk is closely measured, monitored and managed within approved risk limits and controls, taking into account Wealth Management Americas’ balance sheet items that mutually offset interest rate risk.
Banking book interest rate exposure in the Investment Bank arises predominantly from the business of Corporate Client Solutions, where transactions are subject to approval on a case-by-case basis.
Corporate Center – Non-core and Legacy Portfolio assets that were reclassified to Loans and receivables from Held for trading in the fourth quarter of 2008 and the first quarter of 2009, and certain other debt securities held as Loans and receivables, also give rise to non-trading interest rate risk. ▲▲▲
Risk, treasury and capital management
Risk management and control
Effect of interest rate changes on shareholders’ equity and CET1 capital
EDTF | The “Accounting and capital effect of changes in interest rates” table below illustrates the accounting and CET1 capital treatment of gains and losses resulting from changes in interest rates. For instruments held at fair value, a change in interest rates results in an immediate fair value gain or loss recognized either in the Income statement or through Other comprehensive income (OCI). For assets and liabilities held at amortized cost, a change in interest rates does not result in a change in the carrying amount of the instruments, but could affect the amount of interest income or expense recognized over time in the Income statement. Typically, increases in interest rates would lead to an immediate reduction in the value of our longer-term assets held at fair value, but we would expect this to be offset over time through higher net interest income (NII) on our core banking products.
® Refer to “Reconciliation IFRS equity to Swiss SRB capital” in the “Capital management” section of this report for more information
In addition to the differing accounting treatments, our banking book positions have different sensitivities to different points on the yield curves. For example, our portfolios of available-for-sale debt securities and interest rate swaps designated as cash flow hedges, on the whole, are more sensitive to changes in longer-duration interest rates, whereas our deposits and a significant portion of our loans contributing to net interest income are more sensitive to short-term rates. These factors are important as yield curves may not shift on a parallel basis and could, for example, exhibit an initial steepening, followed by a subsequent flattening over time.
By virtue of the accounting treatment and yield curve sensitivities outlined above, in a steepening yield curve scenario we would expect to recognize an initial reduction in shareholders’ equity as a result of fair value losses through OCI. This would be compensated over time by increased NII once increases in interest rates affect the shorter end of the yield curve in particular. The effect on CET1 capital would be similar, albeit less pronounced, as gains and losses on interest rate swaps designated as cash flow hedges are not recognized for regulatory capital purposes.
We subject the interest rate-sensitive banking book exposures to a suite of interest rate scenarios in order to assess the effect on expected NII over both a 1-year and a 3-year time horizon assuming constant business volumes. We also consider the effect of the interest rate movements in each scenario on the fair value recognized through OCI of the available-for-sale debt portfolios and cash flow hedges managed by Group ALM. The scenario assessment also includes the estimated effect through OCI on shareholders' equity and CET1 capital from pension fund assets and liabilities. While select standard scenarios, such as a parallel rise in all yield curves of 100 basis points, are retained and regularly used, other scenarios are adopted as a function of changing market conditions.
EDTF | Pillar 3 |
Accounting and capital effect of changes in interest rates¹ |
| Recognition | | Shareholders' equity | | CET1 capital |
| Timing | Location | | Gains | Losses | | Gains | Losses |
Available-for-sale debt portfolios | Immediate | OCI | | l | l | | | l |
Economic hedges classified as held for trading | Immediate | Income statement | | l | l | | l | l |
Designated cash flow hedges | Immediate | OCI² | | l | l | | | |
Loans and deposits at amortized costs | Gradual | Income statement | | l | l | | l | l |
1 Refer to the “Reconciliation IFRS equity to Swiss SRB capital” table in the “Capital management” section of this report for more information on the differences between shareholders' equity and CET1 capital. 2 Excluding hedge ineffectiveness which is recognized in the income statement in accordance with IFRS. |
▲▲
At the end of 2015, the following scenarios were analyzed in detail:
– Negative IR (NIR) then Recovery: euro and Swiss franc yield curves drop 50 basis points in parallel during the first three months with no zero-floor applied, and therefore become negative, or more negative. Yield curves in US dollars and other currencies, on the other hand, drop 25 basis points in parallel, but remain floored at zero. Thereafter, all rates recover according to market-implied forward rates.
– NIR then Constant: same assumptions as the NIR then Recovery scenario, but after the first three months, rates do not recover but remain at the then-prevailing levels until the end of the simulated time horizon.
– Eurozone Deflation and Fed Tapering: US dollar yield curve rises and steepens; euro and Swiss franc yield curves develop as in the NIR then Recovery scenario.
– Parallel +100 basis points: All yield curves rise 100 basis points in parallel.
– 2015 CCAR Adverse: Federal Reserve Comprehensive Capital Analysis and Review (CCAR) – Adverse Scenario.
– 2015 CCAR Severely Adverse: Federal Reserve CCAR – Severely Adverse Scenario.
– Quantitative Easing then Recovery: Central banks keep markets flooded with liquidity, pinning down short-end rates (zero or negative interest rate policy). Bond markets / investors subsequently take fright over inflation fears, resulting in long-end rates spiking up sharply (resulting in 5-year forward rates reaching pre-2008 levels); short-end rates eventually follow suit.
– Flattener: yield curves across all currencies undergo a sharp rise for short tenors, with only a modest rise in the long end of the yield curve: +200 basis points for tenors up to 1 year, +100 basis points for 5 years and +20 basis points for 8-year to 10-year tenors.
– Constant Rates: All rates stay at current levels.
The results are compared to a baseline NII, which is calculated assuming interest rates in all currencies develop according to their market-implied forward rates and under the assumption of constant business volumes. The calculated effects on baseline NII range between a deterioration of 4% and 17% over a 1-year and 3-year horizon, respectively, and an improvement of approximately 17% over both a 1-year and a 3-year horizon. The most adverse scenario is the NIR then Constant scenario over a 1-year horizon and the CCAR Severely Adverse scenario over a 3-year horizon. The most beneficial scenario over a 1-year scenario is the Flattener and the Parallel +100 basis points scenario over a 3-year horizon.
In addition to the above scenario analysis, we also monitor the sensitivity of the NII to immediate parallel shocks of –200 and +200 basis points compared with baseline NII (again, under the assumption of a constant balance sheet volume and structure). Any resulting reduction in first-year NII relative to the baseline NII is subject to predefined threshold levels to monitor the extent to which the NII is exposed to an adverse movement in market rates. As of 31 December 2015, the baseline NII would have been approximately 11% less under a parallel shock of –200 basis points, whereas under a parallel +200 basis point shock, the baseline NII would have been approximately 31% higher.
A key factor in our ability to improve our NII throughout 2015, despite the low and negative interest rate environment in Swiss francs in particular, has been the large degree of self-funding of our lending businesses through our deposit base in Wealth Management and Personal & Corporate Banking, along with appropriate adjustments to our interest rate product pricing. Should we lose this equilibrium on the balance sheet due to, for example, unattractive pricing relative to our peers for either our mortgages or our deposits, this could have consequences for our ability to maintain our NII at current levels in a persistently low and negative interest rate environment. Because we assume constant business volumes, these risks do not manifest themselves in the above-mentioned interest rate scenarios.
Moreover, should the low and negative interest rate environment persist or worsen, this could lead to additional pressure on our NII. While our NII in Swiss francs would remain largely insulated from a further decrease in Swiss franc interest rates, assuming we succeed in maintaining the aforementioned equilibrium, we could face additional costs to hold our Swiss franc high-quality liquid asset portfolio. A reduction of the Swiss National Bank's deposit exemption threshold for banks would also lead to increased costs that we might not be able to offset by, for example, passing on some of the costs to our depositors. Should euro interest rates also become significantly negative, this could likewise increase our liquidity costs and put our NII generated from euro-denominated loans and deposits at risk to volume imbalances occurring. Depending on the overall economic and market environment, sustained and significant negative rates could also lead to our Wealth Management and Personal & Corporate Banking clients paying down their loans together with reducing any excess cash they hold with us as deposits. This would reduce the underlying business volume and lower NII accordingly.
A net decrease in deposits would require replacement funding at a relative cost increase that would depend on various factors, including the term and nature of the replacement funding, whether such funding is raised in the wholesale markets, or whether such funding is raised from swapping with available funding denominated in another currency. On the other hand, imbalances leading to an excess deposit position could require investments at negative yields, which we might not be able to sufficiently compensate for as a result of our excess deposit balance charging mechanisms. ▲
Risk, treasury and capital management
Risk management and control
Interest rate risk sensitivity to parallel shifts in yield curves
Audited | EDTF | Pillar 3 | Interest rate risk in the banking book is not underpinned for capital purposes, but is subject to a regulatory threshold. As of 31 December 2015, the economic-value effect of an adverse parallel shift in interest rates of ±200 basis points on our banking book interest rate risk exposures is significantly below the threshold of 20% of eligible capital recommended by regulators.
The interest rate risk sensitivity figures presented in the “Interest rate sensitivity – banking book” table on the next page represent the effect of +1, ±100 and ±200-basis-point parallel moves in yield curves on present values of future cash flows, irrespective of accounting treatment. For some portfolios, the +1-basis-point sensitivity has been estimated by dividing the +100-basis-point sensitivity by 100. In the prevailing negative interest rate environment for the Swiss franc in particular, and to a lesser extent for the euro, interest rates for Wealth Management and Personal & Corporate Banking client transactions are generally being floored at non-negative levels. Accordingly, for the purposes of this disclosure table, downward moves of 100 / 200 basis points are floored to ensure that the resulting shocked interest rates do not turn negative. The flooring results in nonlinear sensitivity behavior.
The sensitivity of the banking book to rising rates increased year on year by negative CHF 3.4 million per basis point. This was mainly due to an increased negative sensitivity in Wealth Management Americas due to higher short-term US dollar market rates on its modeled deposit duration, resulting in a lower (i.e., less positive) sensitivity contribution from the liability side of its banking book. The sensitivity of the banking book to rising rates includes the interest rate sensitivities arising from debt investments classified as Financial investments available-for-sale and their associated hedges. The sensitivity of these positions (excluding hedges and excluding investments in funds accounted for as available-for-sale) to a 1-basis-point parallel increase in the yields of the respective instruments is approximately negative CHF 9 million, which would be recorded in Other comprehensive income if such change occurred.
The sensitivity of the banking book to rising rates also includes interest rate sensitivities arising from interest rate swaps designated in cash flow hedges. Fair value gains or losses associated with the effective portion of these swaps are recognized initially in Equity. When the hedged forecast cash flows affect profit or loss, the associated gains or losses on the hedging derivatives are reclassified from Equity to profit or loss. These swaps are predominantly denominated in US dollars, euros, British pounds and Swiss francs. As of 31 December 2015, the fair value of these interest rate swaps amounted to CHF 2.3 billion (positive replacement values) and CHF 0.2 billion (negative replacement values). The effect of a 1-basis-point increase of underlying LIBOR curves would have decreased equity by approximately CHF 22 million, excluding adjustments for tax. ▲▲▲
® Refer to “Note 15 Financial investments available-for-sale” in the “Consolidated financial statements” section of this report for more information
Audited | EDTF | Pillar 3 |
Interest rate sensitivity – banking book¹ | | | | | | |
| | 31.12.15 |
CHF million | | –200 bps | –100 bps | +1 bp | +100 bps | +200 bps |
CHF | | (33.9) | (33.9) | (0.2) | (15.5) | (29.1) |
EUR | | 27.0 | 26.2 | (0.3) | (29.7) | (55.5) |
GBP | | (165.5) | (42.4) | 0.1 | (0.8) | (15.6) |
USD | | 838.7 | 438.8 | (3.8) | (380.4) | (763.4) |
Other | | (1.2) | (2.1) | 0.1 | 8.2 | 16.5 |
Total effect on interest rate-sensitive banking book positions | | 665.0 | 386.5 | (4.1) | (418.3) | (847.0) |
of which: Wealth Management Americas | | 806.5 | 440.1 | (3.7) | (365.3) | (732.5) |
of which: Investment Bank | | 28.9 | 18.0 | (0.2) | (18.9) | (39.7) |
of which: CC – Group ALM² | | (168.6) | (73.6) | (0.2) | (19.2) | (43.7) |
of which: CC – Non-core and Legacy Portfolio | | (2.8) | 1.2 | (0.1) | (9.6) | (20.5) |
| | | | | | |
| | 31.12.14 |
CHF million | | –200 bps | –100 bps | +1 bp | +100 bps | +200 bps |
CHF | | (16.2) | (15.8) | (0.3) | (27.3) | (51.0) |
EUR | | 72.1 | 66.0 | (0.6) | (57.0) | (106.9) |
GBP | | (5.6) | (8.1) | 0.2 | 23.0 | 46.3 |
USD | | 130.7 | 76.5 | (0.2) | (21.0) | (52.8) |
Other | | 1.8 | (5.1) | 0.2 | 17.7 | 36.0 |
Total effect on interest rate-sensitive banking book positions | | 182.7 | 113.5 | (0.7) | (64.5) | (128.5) |
of which: Wealth Management Americas | | 181.7 | 129.9 | (0.5) | (48.5) | (110.6) |
of which: Investment Bank | | 53.8 | 34.2 | (0.5) | (52.2) | (111.4) |
of which: CC – Core Functions² | | (37.3) | (44.3) | 0.3 | 42.8 | 106.8 |
of which: CC – Non-core and Legacy Portfolio | | (11.0) | (3.5) | (0.1) | (6.2) | (12.6) |
1 Does not include interest rate sensitivities for credit valuation adjustments on monoline credit protection, US and non-US reference-linked notes. 2 Following changes in the organization of the Corporate Center units as of 1 January 2015, amounts previously reported under CC – Core Functions are now reported under CC – Group ALM. |
▲▲▲
Risk, treasury and capital management
Risk management and control
Other market risk exposures
Own credit
EDTF | We are exposed to changes in UBS’s own credit which are reflected in the valuation of those financial liabilities designated at fair value, for which UBS’s own credit risk would be considered by market participants. We also estimate debit valuation adjustments (DVA) to incorporate own credit in the valuation of derivatives. Changes in fair value due to changes in own credit are recognized in the income statement and therefore affect shareholders’ equity and CET1 capital.
We will adopt the own credit presentation requirements of IFRS 9 in the first quarter of 2016. Under this aspect of IFRS 9, changes in the fair value of financial liabilities designated at fair value through profit and loss related to own credit will be recognized in Other comprehensive income (OCI) and will not be reclassified to the Income statement. ▲
® Refer to “Note 24 Fair value measurement” in the “Consolidated financial statements” section of this report for more information on own credit
Structural foreign exchange risk
EDTF | On consolidation, assets and liabilities held in foreign operations are translated into Swiss francs at the closing foreign exchange rate on the balance sheet date, and items of income and expense are translated into Swiss francs at the average rate for the period. The resulting foreign exchange differences are recognized in Other comprehensive income and therefore affect shareholders’ equity and CET1 capital.
Group ALM employs strategies to manage this foreign currency exposure, including matched funding of assets and liabilities and net investment hedging. ▲
® Refer to the “Treasury management” section of this report for more information on our exposure to and management of structural foreign exchange risk
Equity investments
Audited | EDTF | Under IFRS, equity investments not in the trading book may be classified as financial investments classified as available-for-sale, Financial assets designated at fair value or Investments in associates.
We make direct investments in a variety of entities and buy equity holdings in both listed and unlisted companies for a variety of purposes. This includes investments, such as exchange and clearing house memberships that are held to support our business activities. We may also make investments in funds that we manage in order to fund or “seed” them at inception, or to demonstrate that our interests concur with those of investors. We also buy, and are sometimes required by agreement to buy, securities and units from funds that we have sold to clients.
The fair value of equity investments tends to be influenced by factors specific to the individual investments. Equity investments are generally intended to be held for the medium or long term and may be subject to lockup agreements. For these reasons, we generally do not control these exposures using the market risk measures applied to trading activities. However, such equity investments are subject to a different range of controls, including pre-approval of new investments by business management and Risk Control, portfolio and concentration limits, and regular monitoring and reporting to senior management. They are also included in our Group-wide statistical and stress testing metrics which flow into our risk appetite framework.
As of 31 December 2015, we held equity investments totaling CHF 1.6 billion, of which CHF 0.6 billion were classified as Financial investments available-for-sale, and CHF 1.0 billion as Investments in associates. This was broadly unchanged from the prior year. ▲▲
® Refer to “Note 15 Financial investments available-for-sale” and “Note 30 Interests in subsidiaries and other entities” in the “Consolidated financial statements” section of this report for more information
Debt investments
Audited | EDTF | Debt investments classified as Financial investments available-for-sale are measured at fair value with changes in fair value recorded through Equity, and can broadly be categorized as money market instruments and debt securities primarily held for statutory, regulatory or liquidity reasons.
The risk control framework applied to debt instruments classified as Financial investments available-for-sale depends on the nature of the instruments and the purpose for which we hold them. Our exposures may be included in market risk limits or be subject to specific monitoring and interest rate sensitivity analysis. They are also included in our Group-wide statistical and stress testing metrics, which flow into our risk appetite framework.
Debt instruments classified as Financial investments available-for-sale had a fair value of CHF 61.9 billion as of 31 December 2015 compared with CHF 56.5 billion as of 31 December 2014. ▲▲
® Refer to “Note 15 Financial investments available-for-sale” in the “Consolidated financial statements” section of this report for more information
® Refer to “Interest rate risk sensitivity to parallel shifts in yield curves” in this section for more information
® Refer to the “Treasury management” section of this report for more information
Pension risk
EDTF | We provide a number of pension plans for past and current employees, some of which are classified as defined benefit pension plans under IFRS. These defined benefit plans can have a material effect on our IFRS equity and CET1 capital.
In order to meet the expected future benefit payments, the plans invest employee and employer contributions in various asset classes. The funded status of the plan is the difference between the fair value of these assets and the present value of the expected future benefit payments to plan members (the defined benefit obligation).
Under IFRS, a negative funded status (where the fair value of the assets is insufficient to meet the defined benefit obligation) is recognized on our balance sheet as a liability. It is also deducted from CET1 capital.
A positive funded status is recognized as an asset on the balance sheet, but it is capped at the economic benefit available to UBS, as described in "Note 1a item 24 Pension and other post-employment benefit plans" in the “Consolidated financial statements” section of this report. It cannot be recognized in CET1 capital.
At each balance sheet date, the fair value of the assets and the defined benefit obligation are remeasured, with changes in value recognized through other comprehensive income, subject to the aforementioned cap on a positive funded status.
Pension risk is the risk that the funded status of defined benefit plans might decrease, negatively affecting our IFRS equity and / or our CET1 capital. This can arise either from a fall in the plan assets’ value or in the investment returns, an increase in defined benefit obligations, or a combination of these.
Important risk factors affecting the fair value of the plan assets are, among others, equity market returns, interest rates, bond yields, and real estate prices.
Important risk factors affecting the present value of the expected future benefit payments include high-grade bonds yields, interest rates, inflation rates and life expectancy.
Pension risk is included in our Group-wide statistical and stress testing metrics that flow into our risk appetite framework. The potential effects are thus captured in the calculation of our post-stress fully applied CET1 capital ratio. ▲
® Refer to “Note 28 Pension and other post-employment benefit plans” in the "Consolidated financial statements" section of this report for more information on defined benefit plans
® Refer to “Stress testing” in the “Risk management and control” section of this report for more information on our stress testing framework
® Refer to “Consideration of stress scenarios” in the “Capital management” section of this report for more information on our post-stress fully applied CET1 capital ratio
® Refer to “Fluctuation in foreign exchange rates and continuing low or negative interest rates may have a detrimental effect on our capital strength, our liquidity and funding position, and our profitability” and “Our stated capital returns objective is based, in part, on capital ratios that are subject to regulatory change and may fluctuate significantly” in the “Risk factors” section of this report for more information
UBS own share exposure
EDTF | We hold our own shares primarily to hedge employee share and option participation plans. A smaller number are held by the Investment Bank in connection with market-making and hedging activities. ▲
® Refer to “Holding of UBS Group AG shares” in the “Capital management” section of this report for more information
Risk, treasury and capital management
Risk management and control
Country risk
Macroeconomic developments during the period
Continued weak commodity prices and the Federal Reserve rate hike put pressure on a number of key emerging markets. Our largest emerging markets exposure is to China, where growth continued to be moderate in 2015, and financial markets experienced episodes of extreme volatility. Eurozone concerns and European Central Bank policy included the prospect of a Greek exit from the common currency, and a migrant / refugee crisis driven by turmoil in the Middle East and in North Africa.
Country risk framework
Country risk includes all country-specific events that occur within a sovereign’s jurisdiction and may lead to an impairment of UBS’s exposures. Country risk can take the form of sovereign risk, which refers to the ability and willingness of a government to honor its financial commitments; transfer risk, which would arise if an issuer or counterparty could not acquire foreign currencies following a moratorium of a central bank on foreign exchange transfers; or “other” country risk. “Other” country risk may manifest itself through increased and multiple counterparty and issuer default risk (systemic risk) on the one hand, and by events that may affect the standing of a country (e.g., political stability, institutional and legal framework) on the other hand. We have a well-established risk control framework, through which we assess the risk profile of all countries where we have exposure.
EDTF | We attribute to each foreign country a sovereign rating, which expresses the probability of the sovereign defaulting on its own financial obligations in foreign currency. Our ratings are expressed by statistically derived default probabilities as described in the “Probability of default” section. Based on this internal analysis we also define the probability of a transfer event occurring and establish rules as to how the aspects of “other” country risk should be incorporated into the analysis of the counterparty rating of entities that are domiciled in the respective country.
Our risk exposure to foreign countries considers the credit ratings assigned to those countries. A country risk ceiling (i.e., maximum aggregate exposure) applies to our exposures to counterparties or issuers of securities and financial investments in the respective foreign country. We may limit the extension of credit, transactions in traded products or positions in securities based on a country ceiling, even if our exposure to a counterparty is otherwise acceptable.
For internal measurement and control of country risk, we also consider the financial impact of market disruptions arising prior to, during, and following a country crisis. These may take the form of a severe deterioration in a country’s debt, equity or other asset markets, or a sharp depreciation of the currency. We use stress testing to assess the potential financial impact of a severe country and / or sovereign crisis. This involves the development of plausible stress scenarios for combined stress testing and the identification of countries that may potentially be subject to a crisis event, determining potential losses and making assumptions about recovery rates depending on the types of credit transactions involved and their economic importance to the affected countries.
Our exposures to market risks are also subject to regular stress tests that cover major global scenarios, which are used for combined stress testing as well, whereby we apply market shock factors to equity indices, interest and currency rates in all relevant countries and consider the potential liquidity of the instruments. ▲
Country risk exposure
Country risk exposure measure
EDTF | The presentation of country risk follows our internal risk view, whereby the basis for measurement of exposures depends on the product category into which we have classified our exposures. In addition to the classification of exposures into banking products and traded products as defined in the “Credit risk profile of the Group – Internal risk view” section, we classify within trading inventory, issuer risk on securities such as bonds and equities, as well as the risk relating to the underlying reference assets for derivative positions, including those linked to credit protection we buy or sell, loan or security underwriting commitments pending distribution and single-stock margin loans for syndication.
As we manage the trading inventory on a net basis, we net the value of long positions against short positions with the same underlying issuer. Net exposures are, however, floored at zero per issuer in the figures presented. We therefore do not recognize the potentially offsetting benefit of certain hedges and short positions across issuers.
We do not recognize any expected recovery values when reporting country exposures as Exposure before hedges except for the risk-reducing effects of master netting agreements and collateral held in the form of either cash or portfolios of diversified marketable securities, which we deduct from the basic positive exposure values. Within banking products and traded products, the risk-reducing effect of any credit protection is taken into account on a notional basis when determining the Net of hedges exposures. ▲
Country risk exposure allocation
EDTF | In general, exposures are shown against the country of domicile of the contractual counterparty or the issuer of the security. For some counterparties whose economic substance in terms of assets or source of revenues is primarily located in a different country, the exposure is allocated to the risk domicile of that country. ▲
This is the case, for example, with legal entities incorporated in financial offshore centers, which have their main assets and revenue streams outside the country of domicile. The same principle applies to exposures for which we hold third-party guarantees or collateral, where we report the exposure against the country of domicile of either the guarantor or the issuer of the underlying security, or against the country where pledged physical assets are located.
We apply a specific approach for banking products exposures to branches of financial institutions which are located in a country other than that of the domicile of the legal entity. In such cases, exposures are recorded in full against the country of domicile of the counterparty and additionally in full against the country in which the branch is located.
In the case of derivatives, we show the counterparty risk associated with the positive replacement value against the country of domicile of the counterparty (presented within traded products). In addition, the risk associated with the instantaneous fall in value of the underlying reference asset to zero (assuming no recovery) is shown against the country of domicile of the issuer of the reference asset (presented within trading inventory). This approach ensures that we capture both the counterparty and, where applicable, issuer elements of risk arising from derivatives and applies comprehensively for all derivatives, including single-name credit default swaps (CDSs) and other credit derivatives.
As a basic example: if CDS protection for a notional value of 100 bought from a counterparty domiciled in country X referencing debt of an issuer domiciled in country Y has a positive replacement value of 20, we record (i) the fair value of the CDS (20) against country X (within traded products) and (ii) the hedge benefit (notional minus fair value) of the CDS (100 – 20 = 80) against country Y (within trading inventory). In the example of protection bought, the 80 hedge benefit would offset any exposure arising from securities held and issued by the same entity as the reference asset, floored at zero per issuer. In the case of protection sold, this would be reflected as a risk exposure of 80 in addition to any exposure arising from securities held and issued by the same entity as the reference asset. In the case of derivatives referencing a basket of assets, the issuer risk against each reference entity is calculated as the expected change in fair value of the derivative given an instantaneous fall in value to zero of the corresponding reference asset (or assets) issued by that entity. Exposures are then aggregated by country across issuers, floored at zero per issuer.
Exposures to selected eurozone countries
EDTF | Our exposure to peripheral European countries remains limited, but we nevertheless remain watchful regarding the potential broader implications of adverse developments in the eurozone. As noted in the “Stress testing” section, a eurozone crisis remains a core part of the new binding Global Recession scenario for Combined Stress Test purposes, making it central to the regular monitoring of risk exposure against the minimum capital, earnings and leverage ratio objectives in our risk appetite framework.
The “Exposures to selected eurozone countries” table on the next page provides an overview of our exposures to eurozone countries rated lower than AAA/Aaa by at least one of the major rating agencies as of 31 December 2015. The table shows an internal risk view of gross and net exposures split by sovereign, agencies and central banks, local governments, banks and other counterparties (including corporates, insurance companies and funds). Exposures to Andorra, Cyprus, Estonia, Latvia, Lithuania (after euro adoption on 1 January 2015), Malta, Monaco, Montenegro, San Marino, Slovakia and Slovenia are grouped in Other. ▲
Pillar 3 | CDSs are primarily bought and sold in relation to our trading businesses, but are also used to hedge parts of our risk exposure, including that related to select eurozone countries. As of 31 December 2015, and not taking into account the risk-reducing effect of master netting agreements, we had purchased approximately CHF 20 billion gross notional of single name CDS protection on issuers domiciled in Greece, Italy, Ireland, Portugal or Spain (GIIPS) and had sold CHF 19 billion gross notional of single-name CDS protection. On a net basis, taking into account the risk reducing effect of master netting agreements, this equates to approximately CHF 4 billion notional purchased and CHF 3 billion notional sold. More than 99% of gross protection purchased was from investment grade counterparties (based on our internal ratings) and on a collateralized basis. The vast majority of this was from financial institutions domiciled outside the eurozone. Approximately CHF 0.1 billion of the gross protection purchased was from counterparties domiciled in a GIIPS country with just over CHF 40 million from counterparties domiciled in the same country as the reference entity. p
Risk, treasury and capital management
Risk management and control
EDTF |
Exposures to selected eurozone countries |
CHF million | | Total | | Banking products (loans, guarantees, loan commitments) | | Traded products (counterparty risk from derivatives and securities financing) after master netting agreements and net of collateral | | Trading inventory (securities and potential benefits / remaining exposure from derivatives) |
31.12.15 | | | Net of hedges¹ | | Exposure before hedges | Net of hedges¹ | of which: unfunded | | Exposure before hedges | Net of hedges | | Net long per issuer |
France | | 6,331 | 6,004 | | 1,284 | 963 | 469 | | 1,399 | 1,392 | | 3,649 |
Sovereign, agencies and central bank | | 3,583 | 3,577 | | 14 | 14 | | | 45 | 38 | | 3,524 |
Local governments | | 60 | 60 | | | | | | 57 | 57 | | 2 |
Banks | | 365 | 365 | | 137 | 137 | | | 209 | 209 | | 19 |
Other² | | 2,323 | 2,003 | | 1,132 | 812 | | | 1,087 | 1,087 | | 103 |
Netherlands | | 6,650 | 5,895 | | 1,522 | 1,041 | 355 | | 1,207 | 933 | | 3,921 |
Sovereign, agencies and central bank | | 3,799 | 3,799 | | 7 | 7 | | | 1 | 1 | | 3,791 |
Local governments | | | | | | | | | | | | |
Banks | | 562 | 562 | | 35 | 35 | | | 474 | 474 | | 53 |
Other² | | 2,289 | 1,534 | | 1,479 | 998 | | | 732 | 458 | | 78 |
Spain | | 1,621 | 1,290 | | 570 | 239 | 216 | | 377 | 377 | | 674 |
Sovereign, agencies and central bank | | 39 | 39 | | 1 | 1 | | | | | | 38 |
Local governments | | 1 | 1 | | | | | | | | | 1 |
Banks | | 463 | 463 | | 55 | 55 | | | 347 | 347 | | 61 |
Other² | | 1,119 | 788 | | 514 | 183 | | | 30 | 30 | | 574 |
Italy | | 2,086 | 1,605 | | 1,687 | 1,263 | 805 | | 350 | 293 | | 48 |
Sovereign, agencies and central bank | | 62 | 5 | | | | | | 62 | 4 | | 1 |
Local governments | | 79 | 79 | | | | | | 77 | 77 | | 2 |
Banks | | 415 | 415 | | 370 | 370 | | | 32 | 32 | | 13 |
Other² | | 1,530 | 1,106 | | 1,317 | 893 | | | 180 | 180 | | 33 |
Austria | | 1,518 | 1,410 | | 52 | 52 | 23 | | 250 | 143 | | 1,215 |
Sovereign, agencies and central bank | | 1,202 | 1,094 | | | | | | 108 | 0 | | 1,094 |
Local governments | | 0 | 0 | | | | | | | | | 0 |
Banks | | 289 | 289 | | 31 | 31 | | | 140 | 140 | | 118 |
Other² | | 27 | 27 | | 21 | 21 | | | 3 | 3 | | 3 |
Ireland³ | | 1,287 | 1,287 | | 294 | 294 | 174 | | 910 | 910 | | 83 |
Sovereign, agencies and central bank | | 18 | 18 | | | | | | | | | 18 |
Local governments | | | | | | | | | | | | |
Banks | | 35 | 35 | | 16 | 16 | | | 9 | 9 | | 11 |
Other² | | 1,233 | 1,233 | | 279 | 279 | | | 901 | 901 | | 54 |
Finland | | 1,091 | 1,058 | | 91 | 58 | 2 | | 117 | 117 | | 883 |
Sovereign, agencies and central bank | | 622 | 622 | | | | | | | | | 622 |
Local governments | | 22 | 22 | | | | | | 9 | 9 | | 12 |
Banks | | 329 | 329 | | 2 | 2 | | | 84 | 84 | | 243 |
Other² | | 119 | 86 | | 89 | 56 | | | 23 | 23 | | 6 |
Belgium | | 514 | 514 | | 199 | 199 | 5 | | 116 | 116 | | 199 |
Sovereign, agencies and central bank | | 218 | 218 | | | | | | 35 | 35 | | 183 |
Local governments | | 11 | 11 | | | | | | | | | 11 |
Banks | | 188 | 188 | | 178 | 178 | | | 9 | 9 | | 1 |
Other² | | 97 | 97 | | 21 | 21 | | | 72 | 72 | | 4 |
Portugal | | 138 | 73 | | 119 | 53 | 52 | | 0 | 0 | | 19 |
Sovereign, agencies and central bank | | 1 | 1 | | | | | | | | | 1 |
Local governments | | | | | | | | | | | | |
Banks | | 11 | 11 | | 10 | 10 | | | 0 | 0 | | 1 |
Other² | | 127 | 62 | | 109 | 44 | | | 0 | 0 | | 18 |
Greece | | 9 | 9 | | 5 | 5 | 0 | | 0 | 0 | | 4 |
Sovereign, agencies and central bank | | 1 | 1 | | | | | | | | | 1 |
Local governments | | | | | | | | | | | | |
Banks | | 4 | 4 | | 4 | 4 | | | 0 | 0 | | 0 |
Other² | | 4 | 4 | | 0 | 0 | | | | | | 3 |
Other⁴ | | 123 | 123 | | 105 | 105 | 8 | | 3 | 3 | | 15 |
1 Not deducted from the “Net of hedges” exposures are total allowances and provisions for credit losses of CHF 52 million (of which: Malta CHF 37 million, Ireland CHF 6 million and France CHF 5 million). 2 Includes corporates, insurance companies and funds. 3 The majority of the Ireland exposure relates to funds and foreign bank subsidiaries. 4 Represents aggregate exposures to Andorra, Cyprus, Estonia, Latvia, Lithuania, Malta, Monaco, Montenegro, San Marino, Slovakia and Slovenia. |
p
EDTF |
Exposure from single-name credit default swaps referencing Greece, Italy, Ireland, Portugal or Spain (GIIPS) |
| | Protection bought | | Protection sold | | Net position (after application of counterparty master netting agreements) |
CHF million | | | | of which: counterparty domiciled in GIIPS country | | of which: counterparty domicile is the same as the reference entity domicile | | | | |
31.12.15 | | Notional | RV | | Notional | RV | | Notional | RV | | Notional | RV | | Buy notional | Sell notional | PRV | NRV |
Greece | | 82 | (1) | | 0 | 0 | | 0 | 0 | | (129) | (1) | | 0 | (47) | 1 | (4) |
Italy | | 15,163 | (22) | | 52 | (1) | | 30 | 0 | | (14,731) | (63) | | 2,163 | (1,730) | 59 | (144) |
Ireland | | 909 | (21) | | 11 | 0 | | 0 | 0 | | (865) | 25 | | 443 | (399) | 11 | (7) |
Portugal | | 718 | (16) | | 0 | 0 | | 0 | 0 | | (741) | 13 | | 260 | (283) | 10 | (13) |
Spain | | 3,008 | 306 | | 70 | (1) | | 10 | 0 | | (2,313) | 29 | | 1,473 | (778) | 385 | (49) |
Total | | 19,879 | 245 | | 133 | (1) | | 40 | 0 | | (18,779) | 3 | | 4,338 | (3,237) | 466 | (217) |
▲
Pillar 3 | Holding CDSs for credit default protection does not necessarily protect the buyer of protection against losses, as the contracts will only pay out under certain scenarios. The effectiveness of our CDS protection as a hedge of default risk is influenced by a number of factors, including the contractual terms under which the CDS was written. Generally, only the occurrence of a credit event as defined by the CDS terms (which may include among other events, failure to pay, restructuring or bankruptcy) results in a payment under the purchased credit protection contracts. For CDS contracts on sovereign obligations, repudiation can also be deemed as a default event. The determination as to whether a credit event has occurred is made by the relevant International Swaps and Derivatives Association (ISDA) determination committees (comprised of various ISDA member firms) based on the terms of the CDS and the facts and circumstances surrounding the event. ▲
Exposure to emerging market countries
The “Emerging markets net exposure by major geographical region and product type” table on the following page shows the five largest emerging market country exposures in each major geographical area by product type as of 31 December 2015 compared with 31 December 2014. Based on the sovereign rating categories, as of 31 December 2015, 83% of our emerging market country exposure was rated investment grade compared with 94% as of 31 December 2014.
Our direct net exposure to Russia was CHF 0.7 billion as of 31 December 2015, approximately half of which related to margin loans to Russian borrowers which are secured by global depository receipts issued by Russian companies. Our direct net exposure to China was CHF 6.6 billion as of 31 December 2015, approximately 80% of which related to the trading inventory category, which is measured at fair value. Of that trading inventory exposure, the majority is a result of managing our Qualified Foreign Institutional Investor (QFII) quota through short-term fund placements.
EDTF |
Emerging markets net exposure¹ by internal UBS country rating category | | |
CHF million | 31.12.15 | 31.12.14 |
Investment grade | 14,274 | 18,993 |
Sub-investment grade | 2,906 | 1,107 |
Total | 17,180 | 20,101 |
1 Net of credit hedges (for banking products and for traded products); net long per issuer (for trading inventory). Total allowances and provisions of CHF 91 million are not deducted (31 December 2014: CHF 83 million). |
▲
Risk, treasury and capital management
Risk management and control
EDTF |
Emerging market net exposures by major geographical region and product type |
CHF million | | Total | | Banking products (loans, guarantees, loan commitments) | | Traded products (counterparty risk from derivatives and securities financing) after master netting agreements and net of collateral | | Trading inventory (securities and potential benefits / remaining exposure from derivatives) |
| | Net of hedges¹ | | Net of hedges¹ | | Net of hedges | | Net long per issuer |
| | 31.12.15 | 31.12.14 | | 31.12.15 | 31.12.14 | | 31.12.15 | 31.12.14 | | 31.12.15 | 31.12.14 |
Emerging America | | 1,304 | 1,850 | | 437 | 537 | | 396 | 548 | | 472 | 765 |
Brazil | | 953 | 1,250 | | 213 | 227 | | 363 | 400 | | 377 | 623 |
Mexico | | 168 | 300 | | 111 | 165 | | 21 | 66 | | 35 | 68 |
Colombia | | 59 | 94 | | 46 | 49 | | 9 | 27 | | 3 | 19 |
Argentina | | 28 | 40 | | 21 | 23 | | | | | 7 | 17 |
Venezuela | | 23 | 20 | | 0 | 0 | | | | | 23 | 20 |
Other | | 73 | 145 | | 44 | 73 | | 3 | 54 | | 26 | 19 |
Emerging Asia | | 12,023 | 13,807 | | 4,202 | 4,151 | | 1,134 | 2,730 | | 6,687 | 6,927 |
China | | 6,603 | 6,982 | | 1,020 | 1,341 | | 160 | 378 | | 5,423 | 5,263 |
Hong Kong | | 1,224 | 2,000 | | 864 | 574 | | 163 | 1,052 | | 196 | 373 |
South Korea | | 1,223 | 1,680 | | 554 | 323 | | 405 | 713 | | 264 | 643 |
India | | 1,223 | 1,227 | | 988 | 949 | | 180 | 235 | | 56 | 43 |
Taiwan | | 712 | 923 | | 184 | 229 | | 199 | 266 | | 330 | 428 |
Other | | 1,038 | 996 | | 593 | 734 | | 27 | 85 | | 418 | 177 |
Emerging Europe | | 1,611 | 1,728 | | 962 | 922 | | 64 | 77 | | 585 | 729 |
Russia | | 697 | 886 | | 217 | 317 | | 29 | 28 | | 451 | 541 |
Turkey | | 472 | 374 | | 409 | 276 | | 15 | 27 | | 48 | 70 |
Azerbaijan | | 135 | 153 | | 122 | 147 | | 13 | 5 | | | 1 |
Croatia | | 66 | 11 | | 66 | 10 | | | | | 0 | 1 |
Hungary | | 43 | 41 | | 1 | 1 | | 0 | 8 | | 41 | 32 |
Other | | 198 | 264 | | 147 | 171 | | 7 | 9 | | 44 | 84 |
Middle East and Africa | | 2,242 | 2,716 | | 861 | 1,012 | | 914 | 1,093 | | 467 | 611 |
South Africa | | 678 | 470 | | 79 | 80 | | 240 | 52 | | 359 | 339 |
Saudi Arabia | | 399 | 576 | | 169 | 148 | | 231 | 428 | | | 0 |
Kuwait | | 382 | 445 | | 16 | 12 | | 365 | 433 | | | 0 |
United Arab Emirates | | 243 | 464 | | 176 | 247 | | 61 | 122 | | 5 | 95 |
Israel | | 172 | 203 | | 87 | 48 | | 5 | 13 | | 80 | 142 |
Other | | 369 | 559 | | 334 | 479 | | 11 | 45 | | 24 | 35 |
Total | | 17,180 | 20,101 | | 6,461 | 6,622 | | 2,508 | 4,447 | | 8,211 | 9,032 |
1 Not deducted are total allowances and provisions for credit losses of CHF 91 million (31 December 2014: CHF 83 million). |
▲
Operational risk
Compliance and operational risk control developments during the period
EDTF | In 2015, we concluded our program to combine Compliance and Operational Risk Control (C&ORC) in order to manage the Group’s compliance, conduct and operational risks in a fully integrated manner. This transformation has resulted in a strengthened control environment, the introduction of globally consistent processes, substantial enhancements to our detective control capabilities, and an operating model which is well-defined, agile and aligned to the Group's strategy and evolving regulatory requirements. Additionally, as an integrated function, we are able to give a broader, more consistent view of the operational risks we face and provide more coherent challenge to the business. Throughout 2015, we took a number of concrete steps to strengthen the management of operational risk, including implementation of a common risk assessment methodology which enables better data analytics and comparisons to be made across and between businesses. We also took on a broader scope of risk assessments led by the business divisions, and strengthened the control environment through review of our key controls across the most critical risk themes.
While we have completed many enhancements during the Compliance and Operational Risk Control integration, best practices across the industry are continually evolving, new risks continue to emerge and threats continue to change. Our strategy for 2016 will, therefore, focus on continued development of our core capabilities in the prevention of financial crime, monitoring and surveillance, and conduct risk, while strengthening our control frameworks for cyber threats, vendor management and transformational change. Moreover, we will continue to work proactively to identify and tackle emerging risks, while refining the operating model to increase effectiveness and deliver efficiency.
The development of our monitoring and surveillance capabilities continues with a focus on more powerful and versatile Group-wide analytics systems and centralized services. The benefits of our automated monitoring capabilities for electronic and audio communications and sophisticated client, trade and cross-border surveillance are starting to become evident. They have allowed us to swiftly identify relevant policy breaches and suspicious patterns of activity. Continuing focus in this area remains vital as regulatory expectations increase and technology capability continues to develop. Our geographical and business coverage will be increased and we will enhance our analytical capabilities to ensure best use of data and optimized delivery of insights.
In 2015, we strengthened our operational resilience function with the integration of the Group Technology Risk organization into C&ORC. Increasing the operational resilience of the firm will remain a key focus for 2016 with continued enhancements to our vendor framework, cyber defense and transformational change risk management framework.
We continue to invest significantly in dedicated security programs to strengthen our cyber defense. The threats faced across the financial industry are broadly similar and include data theft committed increasingly by criminal organizations, disruption of service, such as distributed denial of service attacks, and cyber fraud, often through business email compromise and phishing attacks. We have recently appointed a Head of Cyber Risk in order to effectively address the challenges posed by the dynamic external environment and our own technology innovation. The role focuses on the enterprise governance for cyber-related activities, and includes regular assessments of cyber threat intelligence, analysis of the effectiveness of our controls, and progress on improving our cyber defense capability. To further enhance our resilience against one of the most critical, constantly evolving risks facing the broader industry, we continue to strengthen our cyber response framework, comprising "Analyze," "Protect," "Detect" and "Respond / Recover" capabilities, through a dedicated program. The cyber response framework also includes assessments of our vendors' capabilities.
Risk, treasury and capital management
Risk management and control
Ensuring that the financial crime risk control environment remains effective and is constantly updated to reflect new threats is critical to protecting client and firm assets. This is particularly important given the current volatility in the geopolitical and associated sanctions environment, which continues to reinforce the importance of a robust, sophisticated and agile anti-financial crime framework. The completion of a capability enhancement program in 2015 allowed us to make significant progress, for example through the introduction of enhanced payments monitoring capability. We continue to develop our core systems for financial crime prevention and protection against fraud, including an enhanced global anti-money laundering risk assessment and control framework, new capabilities in the monitoring of business relationships and improved detection of potential bribery and corruption risks. Given the rapidly changing and developing geopolitical environment, we will need to further integrate these solutions and adapt their ability to detect and respond to changes in clients’ behavior and risk characteristics. The ongoing changes in the geopolitical environment also mean that we continue to closely monitor the international sanctions regimes, and ensure that our anti-terrorist financing controls are as robust as possible.
Suitability risk, quality of advice and price transparency will remain areas of heightened focus for the financial industry, as low interest rates and major legislative change programs, such as the Markets in Financial Instruments Directive II in the EU, continue. These developments are in addition to intensified regulatory interest in product tailoring and cross-divisional service offerings. We continue to enhance the governance and controls around our suitability and product risk taxonomies to sustainably support the Group's growth strategy and product innovation. Our suitability and product control frameworks are designed to set clear standards in line with applicable laws and client requirements effectively communicate our suitability strategy and continuously monitor and enforce adherence to suitability standards and controls.
Cross-border risk remains an area of regulatory attention for global financial institutions, with a strong focus on fiscal transparency and increased legislation, such as the automatic exchange of information. We continue to adapt our cross-border control framework in response to regulatory developments and to facilitate compliant client-driven cross-border business.
We have substantially completed a program of remediation work that has focused on further strengthening our front-office processes and controls within the FX business. In addition, our systems have been enhanced to better segregate sensitive information, and our monitoring and surveillance capability was significantly enhanced so that we can more proactively detect unusual patterns of employee behavior and improper business and employee practices. This program also meets the specific undertakings made to the U.S. Commodity Futures Trading Commission, the Connecticut Department of Banking, the U.S. Department of Justice, the UK Financial Conduct Authority, the Swiss Financial Market Supervisory Authority (FINMA) and the Federal Reserve Bank of New York, as part of the resolution of the FX matter. Where applicable we are applying similar control and monitoring enhancements across our other trading businesses including the Rates and Credit, Equities and Non-Core and Legacy businesses.
Achieving the fairest outcomes for our clients and safeguarding market integrity are of critical importance to the firm. The management of conduct risks has been central to our remediation activities and we have implemented a firm-wide conduct risk framework that is embedded into the existing operational risk framework. This framework includes conduct-related management information which is reviewed at business and regional governance forums, providing metrics on employee conduct, clients and markets, with employee conduct a central consideration in the annual compensation process. We also significantly strengthened our oversight controls regarding personal account dealing for our personnel by centralizing all accounts either within UBS, or into a number of defined brokers.
In addition to the developments and areas of key focus noted above, we have made further progress in supplementing our risk assessment processes with a forward-looking view of the broader risk environment in which UBS operates. Consideration of key drivers of change such as the UBS strategy, the macroeconomic outlook, technical innovation and regulatory developments allow us to refine our global risk assessment and planning activities. In acknowledgement of the dynamic industry and the environment in which we operate, we will continue to refine and strengthen our risk framework to ensure it is agile and aligned with the Group's strategy, is responsive to regulatory requirements and supports forward-looking risk identification.
We are continuously enhancing our stakeholder engagement as an important complement to our risk assessment processes. In 2015, we reinforced and clarified the mission and mandate for C&ORC through the establishment of a comprehensive service delivery and operating model, with clear distinction between the risk responsibilities of the control functions (second line of defense) and the business functions (first line of defense). Work to increase the effectiveness of challenge from the second line of defense and support the first line of defense in their risk management responsibilities will continue throughout 2016. Part of this strategy is to transform the way we respond to enquiries, manage approvals and handle incidents leveraging firm-wide standard solutions. ▲
Operational risk framework
EDTF | Pillar 3 | Operational risk is an inherent part of our business. Losses can result from inadequate or flawed internal processes, decisions and systems, or from external events. We provide a framework that supports the identification and assessment of material operational risks and their potential concentrations, in order to achieve an appropriate balance between risk and return.
The business division Presidents and the Corporate Center function heads are ultimately accountable for the effectiveness of operational risk management and for the implementation of the operational risk framework. Management in all functions is responsible for ensuring an appropriate operational risk management environment, including the establishment and maintenance of robust internal controls, effective supervision and a strong risk culture.
C&ORC provides an independent and objective view of the adequacy of operational risk management across the Group. It is governed by the C&ORC Management Committee, which is chaired by the Global Head of Compliance & Operational Risk Control, who reports to the Group Chief Risk Officer and is a member of the Risk Executive Committee.
The operational risk framework describes general requirements for managing and controlling operational risk at UBS. It is built on four main pillars:
1. classification of inherent risks through the operational risk taxonomy;
2. assessment of the design and operating effectiveness of controls through the internal control assessment process;
3. assessment of residual risk through the operational and business risk assessment processes, and
4. remediation to address identified deficiencies which are outside accepted levels of residual risk.
The operational risk taxonomy provides a clear and logical classification of our inherent operational risks, across all business divisions. Throughout the organizational hierarchy, a level of risk tolerance must be agreed for each of the taxonomy categories, together with a minimum set of internal controls and associated performance thresholds considered necessary to keep risk exposure within acceptable levels.
All functions within our firm are required to perform a semi-annual internal control assessment process whereby they assess and evidence the design and operating effectiveness of their key controls. This also forms the basis for the assessment and testing of the controls which oversee financial reporting as required by the Sarbanes-Oxley Act, section 404 (SOX 404). The framework facilitates the identification of SOX 404-relevant controls for independent testing, functional assessments, management affirmation and where necessary, remediation tracking. UBS employs a consistent global framework to assess the aggregated impact of control deficiencies and the adequacy of remediation efforts.
The UBS risk assessment approach covers all business activities and internal as well as external factors posing a threat to UBS Group. Aggregated with any weaknesses in the control environment, the risk assessment articulates the current operational risk exposure against agreed risk tolerance levels.
Significant control deficiencies that surface during the internal control and risk assessment processes must be reported in the operational risk inventory, and sustainable remediation must be defined and executed. All significant issues are assigned to owners at the senior management level and must be reflected in the respective manager’s annual performance measurement and management objectives. To assist with prioritization of all known operational risk issues, irrespective of origin, a common rating methodology is adopted by all internal control functions and both internal and external audit. Group Internal Audit conducts an issue assurance process after a risk issue has been closed, in order to maintain rigorous management discipline in the sustainable mitigation and control of operational risk issues.
Responsibility for the front-to-back control environment and risk management is held by the Chief Operating Officers and supported by our transparent reporting.
Risk and behaviors remain embedded in our performance and compensation considerations, and as a firm we continue to deliver employee behavioral initiatives such as the “Principles of Good Supervision,” and mandatory compliance and risk training. ▲▲
Risk, treasury and capital management
Risk management and control
Advanced measurement approach model
EDTF | Pillar 3 | The operational risk framework detailed above is aligned to and underpins the calculation of regulatory capital, which in turn allows us to quantify operational risk and set effective management incentives.
We measure operational risk exposure and calculate operational risk regulatory capital by using the advanced measurement approach (AMA) in accordance with FINMA requirements.
For regulated subsidiaries, the basic indicator or standardized approaches are adopted as agreed with local regulators. Regulatory requirements are currently leading to the implementation of AMA models for specific UBS entities. The operational risk regulatory capital requirements for the new banking subsidiary of UBS AG in Switzerland were determined and finalized in 2015. The design of the AMA model, which has been tailored to meet the new subsidiary’s operational risk exposure, has been aligned with the Group model from a methodological and calibration process perspective, with adaptations where necessary. Following finalization, the output was presented to FINMA and approved for use.
The AMA model consists of a backward-looking historical and a forward-looking scenario component. The historical component takes a retrospective view based on our history of operational risk losses since January 2002, excluding extreme losses incurred by UBS, which are captured within the scenario component. The key assumption within the historical component is that past events form a reasonable proxy for future events. A distribution of aggregated losses over one year is derived by modeling severities and frequencies separately and then combining them. This is referred to as a loss distribution approach and is used to project future total losses based on historical experience and to determine the expected loss portion of our capital requirement.
The scenario component takes a forward-looking view of potential operational losses that may occur, taking into account the operational risk issues facing the Group. The aim is to determine a reasonable estimate of unexpected or tail loss exposure (corresponding to a low-frequency / high-severity event). At this point, 20 AMA Units of Measures (UoM) are utilized by the current model and all are aligned to the operational risk framework taxonomy.
For each of the models UoM, three frequency / severity pairs are defined, representing the base, stress and worst case. Calibration and adjustments to the scenario component parameters are based on internal extreme losses, loss data from peer banks, outputs of the integrated risk assessments, including consideration of the business and internal control environment, as well as extensive annual verification by internal subject matter experts. The chart below provides a high-level overview of the model components and their respective inputs into the calculation.

The AMA model adds the sampled annual losses from the historical and the scenario component to derive the regulatory capital figure which equals the 99.9% quantile of the overall annual operational risk loss distribution.
Currently, we do not reflect mitigation through insurance or any other risk transfer mechanism in our AMA model.
In 2015, the Group AMA model design, methodology and calibration were subject to significant redevelopment. We submitted all revisions to FINMA with the intention of implementing them in 2016 following regulatory approval. The changes focus on model construct, initial calibration, business environment and internal control factors, diversification, a litigation specific component and combining internal/external losses.
A FINMA increment to our AMA-based operational risk-related RWA (OR RWA) in relation to known or unknown litigation, compliance and other operational risk matters took effect on 1 October 2013 and continued to be applied throughout 2015. As mutually agreed between UBS and FINMA, the incremental OR RWA was subject to recalculations based on supplemental analysis performed each quarter. The incremental OR RWA calculated based upon this supplemental analysis as of 31 December 2015 was CHF 13.3 billion, a decrease of CHF 4.2 billion compared with 31 December 2014. In 2016, the aim is to replace the incremental OR RWA and have the total OR RWA calculated by the upgraded AMA. Stress litigation assessments will be an inherent part of the upgraded AMA.
We continued to allocate operational risk regulatory capital to the business divisions and Corporate Center based on historical losses. ▲▲
AMA model confirmation
EDTF | Pillar 3 | The Group AMA model is subject to an annual quantitative and qualitative review to ensure that model parameters are plausible and reflect the developing operational risk profile of the firm. This review is independently verified by Quantitative Risk Control and supplemented with additional sensitivity and benchmarking analysis. ▲▲
AMA future developments
In 2015, the Basel Committee on Banking Supervision announced that significant changes regarding the calculation of operational risk capital were being drafted. In March 2016, a consultation document was issued that proposed replacing the AMA with a Standardized Measurement Approach. UBS is currently reviewing the proposals and will participate in the consultation process.
® Refer to the “Capital management” section of this report for more information on the development of risk-weighted assets for operational risk
® Refer to “Risk measurement” in this section for more information on our approach to model confirmation procedures
® Refer to “If we are unable to maintain our capital strength, this may adversely affect our ability to execute our strategy, client franchise and competitive position” in the “Risk factors” section of this report for more information
Risk, treasury and capital management
Treasury management
Treasury management
Liquidity and funding management
Strategy and objectives
Audited | EDTF | We manage our liquidity and funding risk with the overall objective of optimizing the value of our business franchise across a broad range of market conditions and in consideration of current and future regulatory constraints as described below. We employ a number of measures to monitor our liquidity and funding positions under normal and stressed conditions. In particular, we use stress scenarios to apply behavioral adjustments to our balance sheet and calibrate the results from these internal stress models with external measures, primarily the evolving regulatory requirements for the liquidity coverage ratio (LCR) and the net stable funding ratio (NSFR). ▲▲
This section provides more detailed information on current and potential future regulatory requirements, our governance structure, our liquidity and funding management, including our sources of liquidity and funding, and our contingency planning and stress testing.
Governance
Audited | EDTF | Our liquidity and funding strategy is proposed by Group Treasury, approved by the Group Asset and Liability Management Committee (Group ALCO), a committee of the Group Executive Board, and overseen by the Risk Committee of the Board of Directors. ▲
Group Treasury monitors and oversees the implementation and execution of our liquidity and funding strategy, and ensures adherence to our liquidity and funding policies, including limits and targets. Group Treasury reports on the Group’s overall liquidity and funding position, including funding status and concentration risks, at least monthly to the Group ALCO and the Risk Committee. This enables close control of both our cash and collateral, including our stock of high-quality liquid assets (HQLA), and ensures that the Group’s general access to wholesale cash markets is centralized in Corporate Center – Group Asset and Liability Management (Group ALM). In addition, should a crisis require contingency funding measures to be invoked, Group Treasury is responsible for coordinating liquidity generation with representatives of the relevant business areas.
Audited | Liquidity and funding limits and targets are set at a Group and business division level, and are reviewed and reconfirmed at least once a year by the Board of Directors, the Group ALCO, the Group Chief Financial Officer, the Group Treasurer and the business divisions, taking into consideration current and projected business strategy and risk tolerance. The principles underlying our limit and target framework are designed to maximize and sustain the value of our business franchise and maintain an appropriate balance in the asset and liability structure. Structural limits and targets focus on the structure and composition of the balance sheet, while supplementary limits and targets are designed to drive the utilization, diversification and allocation of funding resources. Together the limits and targets focus on liquidity and funding risk, including stress testing, for periods of up to one year. To complement and support this framework, Group Treasury monitors the markets with a dashboard of early warning indicators reflecting the current liquidity situation. The liquidity status indicators are used at a Group level to assess both the overall global and regional situations for potential threats. Treasury Risk Control provides independent oversight over liquidity and funding risks. ▲▲
® Refer to the “Corporate governance” section of this report for more information
Liquidity
Audited | EDTF | Our liquidity risk management aims to maintain a sound liquidity position to meet all our liabilities when due and to provide adequate time and financial flexibility to respond to a firm-specific liquidity crisis in a generally stressed market environment, without incurring unacceptable losses or risking sustained damage to our various businesses. Complementing this, our funding risk management aims for the optimal asset and liability structure to finance our businesses reliably and cost-efficiently. Our Group contingency funding plan is an integral part of our global crisis management concept, which covers various types of crisis events. This contingency funding plan contains an assessment of contingent funding sources in a stressed environment, liquidity status indicators and metrics, and contingency procedures. Our funding diversification and global scope help protect our liquidity position in the event of a crisis. We regularly assess and test all material, known and expected cash flows, as well as the level and availability of high-grade collateral that could be used to raise additional funding if required. Our contingent funding sources include a large, multi-currency portfolio of unencumbered, high-quality assets managed centrally by Group ALM, a majority of which is short-term, available and unutilized liquidity facilities at several major central banks, and contingent reductions of liquid trading portfolio assets. ▲▲
Liquidity coverage ratio
EDTF | The LCR measures the short-term resilience of a bank’s liquidity profile by comparing whether sufficient high-quality liquid assets (HQLA) are available to survive expected net cash outflows from a significant liquidity stress scenario, as defined by the relevant regulator.
The Basel Committee on Banking Supervision (BCBS) standards require an LCR of at least 100% by 2019, with a phase-in period starting from 2015. Since 1 January 2015, UBS, as a Swiss systemically relevant bank, has been required to maintain a total LCR of at least 100%, as well as a Swiss franc-denominated LCR of at least 100%. In addition, both UBS AG and UBS Switzerland AG are subject to minimum LCR requirements on a standalone basis.
In a period of financial stress, the Swiss Financial Market Supervisory Authority (FINMA) may allow banks to use their HQLA and let their LCR temporarily fall below the minimum threshold of 100%.
We monitor the LCR in Swiss francs and in all other significant currencies in order to manage any currency mismatches between HQLA and the net expected cash outflows in times of stress.
HQLA are low-risk unencumbered assets under the control of the Group Treasurer, which are easily and immediately convertible into cash at little or no loss of value, to meet liquidity needs in a thirty-calendar-day liquidity stress scenario. The HQLA stock at UBS consists primarily of assets that qualify as Level 1 in the LCR framework, including cash, central bank reserves and government bonds.
Beginning in 2015, FINMA rules require us to publicly disclose the LCR on a quarterly basis, calculated based on the three-month average of the LCR components. Our 3-month average LCR for the fourth quarter of 2015 was 124%. Figures disclosed as of 31 December 2014 are provided on a pro forma basis. As these are calculated on a spot basis, prior period figures are not fully comparable.
Pillar 3 | Additional information on the UBS Group AG (consolidated) LCR can be found in the document “UBS Group AG (consolidated) regulatory information” which is provided in “Quarterly reporting” at www.ubs.com/investors. ▲▲
® Refer to the “Legal entity financial and regulatory information” section of this report for more information
EDTF | Pillar 3 |
Liquidity coverage ratio |
| | Average 4Q15¹ | 31.12.14 |
CHF billion, except where indicated | | Total adjusted value² | | Pro forma |
High-quality liquid assets | | 208 | | 188 |
Net cash outflows | | 167 | | 152 |
Liquidity coverage ratio (%) | | 124 | | 123 |
1 The average fourth quarter 2015 net cash outflows and liquidity coverage ratio disclosed in our fourth quarter 2015 earnings release were adjusted from CHF 163 billion and 128% to CHF 167 billion and 124%, respectively. 2 Calculated after the application of haircuts and cash inflow and outflow rates as well as, where applicable, caps on Level 2 assets and cash inflows. |
pp
Risk, treasury and capital management
Treasury management
EDTF |
High-quality liquid assets |
| | Average 4Q15 |
CHF billion | | Level 1 weighted liquidity value | Level 2 weighted liquidity value¹ | Total weighted liquidity value¹ | Total carrying value |
Cash and balances with central banks | | 117 | 0 | 117 | 117 |
Securities recognized as financial investments available-for-sale | | 50 | 6 | 55 | 56 |
Securities received as collateral (off-balance sheet) | | 31 | 4 | 36 | 36 |
Total high-quality liquid assets | | 198 | 10 | 208 | 210 |
1 Calculated after the application of haircuts. |
▲
EDTF |
Cash outflows and inflows |
| | Average 4Q15 |
CHF billion, except where indicated | | Unweighted value | Weighted value¹ |
| | | |
Cash outflows | | | |
Retail deposits and deposits from small business customers | | 218 | 24 |
of which: stable deposits | | 35 | 1 |
of which: less stable deposits | | 183 | 23 |
Unsecured wholesale funding | | 200 | 124 |
of which: operational deposits (all counterparties) | | 34 | 8 |
of which: non-operational deposits (all counterparties) | | 148 | 98 |
of which: unsecured debt | | 18 | 18 |
Secured wholesale funding | | | 39 |
Additional requirements: | | 159 | 59 |
of which: outflows related to derivatives and other transactions | | 97 | 39 |
of which: outflows related to loss of funding on debt products² | | 0 | 0 |
of which: committed credit and liquidity facilities | | 62 | 20 |
Other contractual funding obligations | | 20 | 19 |
Other contingent funding obligations | | 222 | 10 |
Total cash outflows | | | 275 |
| | | |
Cash inflows | | | |
Secured lending | | 181 | 53 |
Inflows from fully performing exposures | | 59 | 31 |
Other cash inflows | | 23 | 23 |
Total cash inflows | | 263 | 107 |
1 Calculated after the application of haircuts and cash inflow and outflow rates. 2 Includes outflows related to loss of funding on asset-backed securities, covered bonds, other structured financing instruments, asset-backed commercial papers, structured entities (conduits), securities investment vehicles and other such financing facilities. |
p
EDTF |

▲
Risk, treasury and capital management
Treasury management
Asset encumbrance
EDTF | Part of our future funding and collateral needs are supported by assets that are currently available and unrestricted. The table on the next page presents both total International Financial Reporting Standards (IFRS) on-balance sheet assets and off-balance sheet assets received as collateral, allocating these amounts between those assets that are available and those assets that are encumbered or otherwise not available to support future funding and collateral needs.
Assets are presented as encumbered if they have been pledged as collateral against an existing liability or if they are otherwise not available for the purpose of securing additional funding. Included within the latter category are assets protected under client asset segregation rules, assets held by the Group’s insurance entities to back related liabilities to the policy holders, assets held in certain jurisdictions to comply with explicit minimum local asset maintenance requirements and assets held in consolidated bankruptcy remote entities, such as certain investment funds and other structured entities.
® Refer to “Note 25 Restricted and transferred financial assets” in the “Consolidated financial statements” section of this report for more information
Assets that cannot be pledged as collateral represent those assets that are not encumbered, but by their nature, are not considered available to secure funding or to meet collateral needs. These mainly include secured financing receivables, positive replacement values for derivatives, cash collateral receivables, deferred tax assets, goodwill and intangible assets.
All other assets are presented as Unencumbered. Shown separately are those assets that are considered to be readily available to secure funding or to meet collateral needs, and consist of cash and securities readily realizable in the normal course of business. These include cash and deposits with central banks, our multi-currency portfolio of unencumbered, high-quality assets managed centrally by Group ALM, a majority of which are short term, and unencumbered positions in our trading portfolio.
The majority of unencumbered assets not considered readily available to secure funding or to meet collateral needs are loans. This category also includes assets held by our subsidiaries and branches of UBS AG that are available to meet funding and collateral needs in certain jurisdictions, but are not readily available for use by the Group as a whole. This may be as a result of local regulatory requirements, including liquidity requirements and large exposure limitations. Readily available unencumbered assets held by our subsidiaries and branches of UBS AG may also be subject to restrictions that limit the total amount of, or terms under which, assets may be made available to other Group entities. p
EDTF |
Asset Encumbrance | | | | | | | |
CHF million | Total Group assets (IFRS) | Encumbered | | Unencumbered | Assets that cannot be pledged as collateral |
Assets pledged as collateral | Assets otherwise restricted and not available to secure funding | | Cash and securities available to secure funding | Other realizable assets |
Balance sheet as of 31 December 2015 | | | | | | | |
Cash and balances with central banks | 91,306 | | | | 86,325 | 4,979 | 3 |
Due from banks | 11,948 | | 3,285 | | | 8,662 | 1 |
Financial assets designated at fair value | 6,146 | | 337 | | | 3,678 | 2,130 |
Loans | 311,954 | 24,980 | | | | 279,647 | 7,327 |
of which: mortgage loans | 163,091 | 24,980 | | | | 138,112 | |
Lending | 330,048 | 24,980 | 3,622 | | | 291,987 | 9,458 |
Cash collateral on securities borrowed | 25,584 | | | | | | 25,584 |
Reverse repurchase agreements | 67,893 | | 1,099 | | | | 66,794 |
Collateral trading | 93,477 | | 1,099 | | | | 92,378 |
Trading portfolio assets excluding financial assets for unit-linked investment contracts | 108,516 | 57,023¹ | 8,869 | | 36,350 | 6,273 | |
of which: government bills / bonds | 16,193 | 5,786 | 4,031 | | 5,882 | 494 | |
of which: corporate bonds, municipal bonds, including bonds issued by financial institutions | 9,026 | 2,506 | 3,130 | | 2,332 | 1,058 | |
of which: loans | 2,585 | | | | | 2,585 | |
of which: investment fund units | 11,928 | 4,237 | 1,557 | | 5,869 | 265 | |
of which: asset-backed securities | 1,159 | 223 | | | 786 | 149 | |
of which: mortgage-backed securities | 508 | 134 | | | 225 | 149 | |
of which: equity instruments | 63,984 | 44,271 | 152 | | 17,840 | 1,722 | |
of which: precious metals and other physical commodities | 3,642 | | | | 3,642 | | |
Financial assets for unit-linked investment contracts | 15,519 | | 15,519 | | | | |
Positive replacement values | 167,435 | | | | | | 167,435 |
Financial investments available-for-sale | 62,543 | 632 | 502 | | 51,482 | 9,927 | |
Cash collateral receivables on derivative instruments | 23,763 | | 7,104 | | | | 16,659 |
Investments in associates | 954 | | | | | 954 | |
Property, equipment and software | 7,695 | | | | | 7,695 | |
Goodwill and intangible assets | 6,568 | | | | | | 6,568 |
Deferred tax assets | 12,835 | | | | | | 12,835 |
Other assets | 22,160 | | 480 | | | | 21,680 |
Other | 73,975 | | 7,584 | | | 8,648 | 57,742 |
Total assets 31.12.15 | 942,819 | 82,635 | 37,196 | | 174,158 | 321,814 | 327,017 |
Total assets 31.12.14 | 1,062,478 | 92,144 | 38,997 | | 179,074 | 330,224 | 422,058 |
| | | | | | | |
| | Encumbered | | Unencumbered | |
| Fair value of assets received which can be sold or repledged | Fair value of assets received that have been sold or repledged as collateral | Fair value of assets received otherwise restricted and not available to secure funding | | Fair value of assets available to secure funding | Fair value of other realizable assets | |
CHF million | |
Off-balance sheet as of 31 December 2015 | | | |
Fair value of assets received as collateral which can be sold or repledged | 401,511 | 286,757 | 10,432 | | 80,476 | 23,846 | |
Total off-balance sheet 31.12.15 | 401,511 | 286,757 | 10,432 | | 80,476 | 23,846 | |
Total off-balance sheet 31.12.14 | 388,855 | 271,963 | 9,681 | | 89,371 | 17,841 | |
Total balance sheet and off-balance sheet for UBS Group AG (consolidated) as of 31.12.15 | | 369,392 | 47,628 | | 254,635 | 345,659 | 327,017 |
of which: fair value of assets available to secure funding in UBS AG (standalone)² | | | | | 157,531 | | |
of which: fair value of assets available to secure funding in UBS Switzerland AG (standalone)²˒³ | | | | | 80,282 | | |
Total balance sheet and off-balance sheet for UBS Group AG (consolidated) as of 31.12.14 | | 364,108 | 48,678 | | 268,444 | 348,064 | 422,058 |
of which: fair value of assets available to secure funding in UBS AG (standalone)² | | | | | 241,661 | | |
of which: fair value of assets available to secure funding in UBS Switzerland AG (standalone)²˒³ | | | | | | | |
1 Includes CHF 51,943 million assets pledged as collateral which may be sold or repledged by counterparties. 2 Assets held by subsidiaries and branches of UBS AG may be subject to restrictions that limit the total amount of, or terms under which, assets may be made available to other Group entities. 3 UBS Switzerland AG was established in 2015. Refer to "The legal structure of the UBS Group" section of this report for more information. |
p
Risk, treasury and capital management
Treasury management
EDTF |
Assets available to secure funding by currency |
CHF million | 31.12.15 | 31.12.14 |
Swiss franc | 53,831 | 38,525 |
US dollar | 85,359 | 124,113 |
Euro | 43,259 | 39,861 |
Other | 72,185 | 65,945 |
Total | 254,635 | 268,444 |
▲
Stress testing
Audited | EDTF | We perform stress testing to determine the optimum asset and liability structure that allows us to maintain an appropriately balanced liquidity and funding position under various scenarios. Liquidity crisis scenario analysis and contingency funding planning support the liquidity management process. This ensures that immediate corrective measures to absorb potential sudden liquidity shortfalls can be put into effect. ▲
We model our liquidity exposures under two main potential scenarios that encompass stressed and acute market conditions, including considering the possible impact on our access to markets from stress events affecting all parts of our business. ▲
Stressed scenario
EDTF | As a liquidity crisis could have a myriad of causes, the stressed scenario encompasses potential stress effects across all markets, currencies and products but it is not typically firm-specific. In addition to the loss of ability to replace maturing wholesale funding, it assumes a gradual decline of otherwise stable client deposits and liquidity outflows corresponding to a two-notch downgrade.
We use a cash capital model, which incorporates the stress scenario and measures the amount of long-term funding available to fund illiquid assets. The illiquid portion of assets is the difference (the haircut) between the carrying value of an asset on the balance sheet and its effective cash value when used as collateral in a secured funding transaction. Long-term funding used as cash capital to support illiquid assets is comprised of unsecured funding with a remaining time to maturity of at least one year, shareholders’ equity and core deposits, which are the portion of our customer deposits that are deemed to have a behavioral maturity of at least one year. ▲
Acute scenario
EDTF | The acute scenario represents an extreme stress event that combines a firm-specific crisis with market disruption. This scenario assumes substantial outflows on otherwise stable client deposits, mainly due on demand, inability to renew or replace maturing unsecured wholesale funding, unusually large drawdowns on loan commitments, reduced capacity to generate liquidity from trading assets, liquidity outflows corresponding to a three-notch downgrade triggering contractual obligations to unwind derivative positions or to deliver additional collateral and additional collateral needs due to adverse movements in the market values of derivatives. It is run both daily and monthly, with the former used to project potential cash outflows over a one-month time horizon for day-to-day risk management, while the latter involves a more detailed assessment of asset and liability cash flows.
These models and their assumptions are reviewed regularly to incorporate the latest business and market developments. We continuously refine the assumptions used in our crisis scenario and maintain a robust, actionable and tested contingency plan.▲
® Refer to “Risk measurement” in the “Risk management and control” section of this report for more information on stress testing
Funding
Audited | EDTF | Group Treasury regularly monitors our funding status, including concentration risks, to ensure we maintain a well-balanced and diversified liability structure. Our funding activities are planned by analyzing the overall liquidity and funding profile of our balance sheet, taking into account the amount of stable funding that would be needed to support ongoing business activities through periods of difficult market conditions. ▲
Our business activities generate asset and liability portfolios that are highly diversified with respect to market, product, tenor and currency. This reduces our exposure to individual funding sources and provides a broad range of investment opportunities, reducing liquidity risk.
Our wealth management businesses and Personal & Corporate Banking provide significant, cost-efficient and reliable sources of funding. These include core deposits and our portfolio of Swiss residential mortgages, a portion of which is pledged as collateral to generate long-term funding through Swiss Pfandbriefe. In addition, we have a number of short-, medium- and long-term funding programs under which we issue senior unsecured and structured notes, as well as short-term secured debt, generally for the highest-quality assets. These programs allow institutional and private investors in Europe, the US and Asia Pacific to customize their investments in UBS’s debt. Collectively, these broad product offerings and funding sources, together with the global scope of our business activities, support our funding stability. ▲
Internal funding and funds transfer pricing
EDTF | We employ an integrated liquidity and funding framework to govern the liquidity management of all our branches and subsidiaries and our major sources of liquidity are channeled through entities that are fully consolidated. Group ALM meets internal demands for funding by channeling funds from units generating surplus cash to those in need of financing.
Funding costs and benefits are allocated to our business divisions and Non-core and Legacy Portfolio according to our liquidity and funding risk management framework. Our internal funds transfer pricing system is designed to provide the proper liability structure to support the assets and planned activities of each business division while minimizing cross-divisional subsidies. The funds transfer pricing mechanism aims to allocate funding and liquidity costs to the activities generating the liquidity and funding risks and deals with the movement of funds from those businesses in surplus to those that have a shortfall. Funding is internally transferred or allocated among businesses at rates and tenors that reflect each business’s asset composition, liquidity and reliable external funding. We regularly review our internal funds transfer pricing mechanisms, and make enhancements where appropriate to help better accomplish our liquidity and funding management objectives.
In 2015 we continued to improve our fund transfer pricing methodologies, ensuring that divisions share in the benefits of raising liabilities and originating assets, with the pricing curve incentivizing a balanced funding position from a currency and tenor perspective. Funds transfer pricing falls under the governance of Group Treasury. ▲
EDTF |
Funding by product and currency |
| | In CHF billion | | | | | | | | | | | |
| | All currencies | | All currencies¹ | | CHF¹ | | EUR¹ | | USD¹ | | Others¹ |
| | 31.12.15 | 31.12.14 | | 31.12.15 | 31.12.14 | | 31.12.15 | 31.12.14 | | 31.12.15 | 31.12.14 | | 31.12.15 | 31.12.14 | | 31.12.15 | 31.12.14 |
Securities lending | | 8.0 | 9.2 | | 1.2 | 1.3 | | 0.0 | 0.1 | | 0.2 | 0.2 | | 0.7 | 0.9 | | 0.2 | 0.2 |
Repurchase agreements | | 9.7 | 11.8 | | 1.5 | 1.7 | | 0.0 | 0.0 | | 0.6 | 0.4 | | 0.7 | 0.5 | | 0.2 | 0.8 |
Due to banks | | 11.8 | 10.5 | | 1.8 | 1.5 | | 0.4 | 0.4 | | 0.1 | 0.1 | | 0.7 | 0.5 | | 0.5 | 0.5 |
Short-term debt issued² | | 21.2 | 27.4 | | 3.2 | 4.0 | | 0.1 | 0.2 | | 0.4 | 0.3 | | 2.4 | 3.1 | | 0.4 | 0.4 |
Retail savings / deposits | | 161.8 | 156.4 | | 24.5 | 22.7 | | 13.8 | 13.4 | | 0.8 | 0.8 | | 9.9 | 8.5 | | 0.0 | 0.0 |
Demand deposits | | 173.2 | 186.7 | | 26.3 | 27.1 | | 7.9 | 7.9 | | 5.2 | 5.3 | | 9.7 | 10.0 | | 3.5 | 3.9 |
Fiduciary deposits | | 6.1 | 14.8 | | 0.9 | 2.1 | | 0.1 | 0.1 | | 0.1 | 0.5 | | 0.6 | 1.2 | | 0.1 | 0.4 |
Time deposits | | 49.0 | 52.3 | | 7.4 | 7.6 | | 1.7 | 1.3 | | 0.1 | 0.2 | | 3.8 | 3.8 | | 1.8 | 2.3 |
Long-term debt issued³ | | 134.9 | 139.1 | | 20.5 | 20.2 | | 2.3 | 2.6 | | 5.7 | 5.5 | | 10.8 | 10.2 | | 1.7 | 1.9 |
Cash collateral payables on derivative instruments | | 38.3 | 42.4 | | 5.8 | 6.1 | | 0.2 | 0.3 | | 2.1 | 2.6 | | 2.7 | 2.4 | | 0.8 | 0.8 |
Prime brokerage payables | | 45.3 | 38.6 | | 6.9 | 5.6 | | 0.1 | 0.0 | | 1.0 | 0.7 | | 4.4 | 4.0 | | 1.3 | 0.9 |
Total | | 659.4 | 689.2 | | 100.0 | 100.0 | | 26.6 | 26.2 | | 16.3 | 16.7 | | 46.5 | 45.1 | | 10.6 | 12.0 |
1 As a percent of total funding sources. 2 Short-term debt issued is comprised of certificates of deposit, commercial paper, acceptances and promissory notes, and other money market paper. 3 Long-term debt issued also includes debt with a remaining time to maturity of less than one year. |
▲
Risk, treasury and capital management
Treasury management
Changes in sources of funding during the reporting period
EDTF | In 2015, total customer deposits decreased to CHF 390 billion from CHF 410 billion, or 59.2% of our total funding sources. Our ratio of customer deposits to outstanding loan balances was 125% compared with 130% as of 31 December 2014.
Long-term debt excluding structured debt, which is comprised of senior and subordinated debt and is presented within Debt issued on the balance sheet, increased to CHF 71.9 billion as of 31 December 2015 from CHF 63.8 billion as of 31 December 2014, primarily due to an increase in our senior debt, which is comprised of both publicly and privately placed notes and bonds as well as covered bonds, to CHF 54.2 billion from CHF 47.7 billion.
During 2015, we issued senior unsecured debt totaling the equivalent of CHF 13.6 billion, which consisted of USD 7.9 billion and EUR 5.3 billion, with tenors between 18 months and five years without any optional calls, bearing both floating- and fixed-rate coupons. We also contributed to our loss-absorbing capital by issuing additional tier 1 perpetual capital notes equivalent to CHF 3.5 billion and CHF 1.5 billion in February and August 2015, respectively. In September and November 2015, we issued US dollar- and euro-denominated senior unsecured debt that will contribute to our total loss-absorbing capacity, equivalent to CHF 4.2 billion and CHF 1.4 billion, respectively. During the year, we also continued to raise medium- and long-term funds through medium-term notes and private placements and through CHF 0.8 billion of Swiss Pfandbriefe issuances. These issuances were partly offset by CHF 7.1 billion in redemptions of senior and subordinated debt and covered bonds. In addition, as part of optimizing our interest expense, while maintaining our strong liquidity, funding and capital position, we successfully executed a cash tender offer in December 2015 to repurchase certain senior and subordinated debt and covered bonds with an aggregate principal repurchase amount equivalent to approximately CHF 6.1 billion.
As shown on the long-term debt contractual maturities chart below, CHF 8.4 billion, or 12%, of outstanding long-term debt excluding structured debt will mature within one year compared with CHF 8.4 billion, or 13%, in the prior year. In addition, CHF 0.2 billion of subordinated debt has an early call date in 2016.


Our short-term interbank deposits (presented as Due to banks on the balance sheet), together with our outstanding short-term debt, represented 5.0% of total funding sources compared with 5.5% as of 31 December 2014.
Secured financing, in the form of repurchase agreements and securities lent against cash collateral received, represented 2.7% of our funding sources as of 31 December 2015 compared with 3.0% as of 31 December 2014. As of 31 December 2015, we were borrowing CHF 76 billion less cash on a collateralized basis than we were lending, slightly higher than the difference of CHF 71 billion as of 31 December 2014. ▲

Risk, treasury and capital management
Treasury management
Net stable funding ratio
EDTF | In June 2015, the BCBS issued its guidance on “Net stable funding ratio (NSFR) disclosure standards,” which are intended to provide a common disclosure framework for banks to disclose the calculation of the NSFR adopted by the BCBS in October 2014. Internationally active banks must comply with the NSFR and disclosure requirements from 1 January 2018, subject to national adoption requirements. ▲
EDTF |
Pro forma net stable funding ratio | | |
CHF billion, except where indicated | 31.12.15 | 31.12.14 |
Available stable funding | 426 | 372 |
Required stable funding | 403 | 352 |
Pro forma net stable funding ratio (%) | 105 | 106 |
▲
EDTF | The NSFR framework is intended to limit over-reliance on short-term wholesale funding to encourage a better assessment of funding risk across all on- and off-balance sheet items, and to promote funding stability. NSFR consists of two components: the available stable funding (ASF) and the required stable funding (RSF). ASF is defined as the portion of capital and liabilities expected to be available over the period of one year. RSF is a function of the maturity, encumbrance and other characteristics of assets held and off-balance sheet exposures. The BCBS NSFR regulatory framework requires a ratio of at least 100% from 2018.
We report our estimated pro forma NSFR based on current guidance from FINMA and will adjust our NSFR reporting according to the final implementation of the BCBS NSFR disclosure standards in Switzerland. On 31 December 2015, our estimated pro forma NSFR was stable at 105% compared with 31 December 2014.p
Credit ratings
EDTF | Credit ratings can affect the cost and availability of funding, especially funding from wholesale unsecured sources. Our credit ratings can also influence the performance of some of our businesses and levels of client and counterparty confidence. Rating agencies take into account a range of factors when assessing creditworthiness and setting credit ratings. These include the company’s strategy, its business position and franchise value, stability and quality of earnings, capital adequacy, risk profile and management, liquidity management, diversification of funding sources, asset quality and corporate governance. Credit ratings reflect the opinions of the rating agencies and can change at any time.
Pillar 3 | In evaluating our liquidity requirements, we consider the potential impact of a reduction in UBS's long-term credit ratings and a corresponding reduction in short-term ratings. If our credit ratings were to be downgraded, “rating trigger” clauses, especially in derivative transactions, could result in an immediate cash outflow due to the unwinding of derivative positions, the need to deliver additional collateral or other ratings-based requirements. Based on UBS’s credit ratings as of 31 December 2015, contractual liquidity outflows of approximately CHF 0.7 billion, CHF 2.2 billion and CHF 2.6 billion would have been required in the event of a one-notch, two-notch and three-notch reduction in long-term credit ratings, respectively. Of these outflows, the portion related to over-the-counter transactions is approximately CHF 0.2 billion, CHF 1.6 billion and CHF 1.9 billion, respectively.
There were a number of rating actions on UBS AG’s and UBS Group AG’s solicited credit ratings in 2015. Moody's Investors Service (Moody’s) placed UBS AG's long-term senior debt rating on review for possible downgrade following the publication of Moody's new bank rating methodology on 17 March 2015, but subsequently affirmed UBS AG's rating on 8 July 2015. On 12 October 2015, Moody's placed UBS AG's long-term senior debt rating under review for possible upgrade, and subsequently upgraded it to A1 from A2 (stable outlook) on 11 January 2016. Standard & Poor’s affirmed UBS AG's long-term counterparty credit rating at A and UBS Group AG's rating at BBB+, and revised the outlook from stable to positive on 2 December 2015. Fitch Ratings affirmed UBS AG's and UBS Group AG's long-term issuer default rating at A, and revised the outlook from stable to positive on 8 December 2015. ▲▲
® Refer to “Liquidity and funding management are critical to our ongoing performance” in the “Risk factors” section of this report for more information
Maturity analysis of assets and liabilities
EDTF | The table on the next page provides an analysis of consolidated total assets, liabilities and off-balance sheet commitments by residual contractual maturity at the balance sheet date. The contractual maturity of liabilities is based on carrying amounts and the earliest date on which we could be required to pay. The contractual maturity of assets is based on carrying amounts and the latest date the asset will mature. This basis of presentation is in accordance with the respective recommendations of the Enhanced Disclosure Task Force and differs from “Note 27b Maturity analysis of financial liabilities” in the “Consolidated financial statements” section of this report, which is presented on an undiscounted basis, as required by IFRS.
Derivative replacement values and trading portfolio assets and liabilities are assigned to the column Due less than 1 month, although the respective contractual maturities may extend over significantly longer periods.
Financial assets and liabilities with no contractual maturity (such as equity securities) are included in the Perpetual / Not applicable time bucket. Undated or perpetual instruments are classified based on the contractual notice period which the counterparty of the instrument is entitled to give. Where there is no contractual notice period, undated or perpetual contracts are included in the Perpetual / Not applicable time bucket.
Non-financial assets and liabilities with no contractual maturity (such as property, plant and equipment, goodwill and intangible assets and current and deferred tax assets and liabilities) are generally included in the Perpetual / Not applicable time bucket.
Loan commitments are classified on the basis of the earliest date they can be drawn down. ▲
Risk, treasury and capital management
Treasury management
EDTF |
Maturity analysis of assets and liabilities |
CHF billion | Due within 1 month | Due between 1 and 3 months | Due between 3 and 6 months | Due between 6 and 9 months | Due between 9 and 12 months | Due between 1 and 2 years | Due between 2 and 5 years | Due over 5 years | Perpetual / Not applicable | Total |
| | | | | | | | | | |
Assets | | | | | | | | | | |
Cash and balances with central banks | 91.3 | | | | | | | | | 91.3 |
Due from banks | 10.8 | 0.6 | 0.2 | 0.1 | 0.1 | 0.0 | 0.0 | 0.0 | | 11.9 |
Cash collateral on securities borrowed | 25.6 | | | | | | | | | 25.6 |
Reverse repurchase agreements | 42.4 | 16.5 | 5.6 | 1.3 | 1.0 | 0.5 | 0.6 | | | 67.9 |
Trading portfolio assets | 124.0 | | | | | | | | | 124.0 |
of which: assets pledged as collateral which may be sold or repledged by counterparties | 51.9 | | | | | | | | | 51.9 |
Positive replacement values | 167.4 | | | | | | | | | 167.4 |
Cash collateral receivables on derivative instruments | 23.8 | | | | | | | | | 23.8 |
Financial assets designated at fair value | 0.4 | 0.0 | 0.3 | 0.9 | 0.5 | 1.1 | 2.0 | 0.4 | 0.5 | 6.1 |
Loans | 110.3 | 50.1 | 13.4 | 7.1 | 7.8 | 20.8 | 53.8 | 48.7 | 0.0 | 312.0 |
of which: residential mortgages | 13.4 | 27.8 | 6.1 | 2.5 | 2.6 | 13.3 | 34.9 | 41.0 | | 141.6 |
of which: commercial mortgages | 3.4 | 7.5 | 1.2 | 0.4 | 0.7 | 1.5 | 4.0 | 2.9 | | 21.5 |
of which: Lombard loans | 81.4 | 12.0 | 4.4 | 2.5 | 2.8 | 1.8 | 1.9 | 0.1 | | 107.0 |
of which: other loans | 12.1 | 2.7 | 1.7 | 1.8 | 1.7 | 4.0 | 13.0 | 2.0 | | 39.0 |
of which: securities | | | | | | 0.1 | 0.0 | 2.7 | | 2.8 |
Financial investments available-for-sale | 0.9 | 5.2 | 5.8 | 14.0 | 6.0 | 9.2 | 16.9 | 3.8 | 0.8 | 62.5 |
Investments in associates | | | | | | | | | 1.0 | 1.0 |
Property, equipment and software | | | | | | | | | 7.7 | 7.7 |
Goodwill and intangible assets | | | | | | | | | 6.6 | 6.6 |
Deferred tax assets | | | | | | | | | 12.8 | 12.8 |
Other assets | 17.3 | 0.0 | 0.0 | 0.0 | 0.0 | 0.3 | 2.6 | 1.9 | | 22.2 |
Total assets 31.12.15 | 614.3 | 72.4 | 25.4 | 23.5 | 15.4 | 31.8 | 75.8 | 54.9 | 29.4 | 942.8 |
Total assets 31.12.14 | 746.1 | 67.0 | 25.1 | 16.7 | 18.3 | 34.6 | 73.2 | 54.2 | 27.2 | 1,062.5 |
| | | | | | | | | | |
Liabilities | | | | | | | | | | |
Due to banks | 8.1 | 2.3 | 0.8 | 0.1 | 0.1 | 0.3 | 0.1 | 0.0 | | 11.8 |
Cash collateral on securities lent | 5.7 | 1.3 | 1.0 | | | | | | | 8.0 |
Repurchase agreements | 7.9 | 1.4 | 0.1 | 0.0 | 0.0 | 0.0 | | 0.1 | | 9.7 |
Trading portfolio liabilities | 29.1 | | | | | | | | | 29.1 |
Negative replacement values | 162.4 | | | | | | | | | 162.4 |
Cash collateral payables on derivative instruments | 38.3 | | | | | | | | | 38.3 |
Financial liabilities designated at fair value | 14.9 | 15.8 | 7.0 | 3.0 | 2.9 | 6.1 | 5.3 | 8.0 | | 63.0 |
Due to customers | 371.8 | 13.1 | 3.7 | 0.6 | 0.3 | 0.1 | 0.4 | 0.1 | | 390.2 |
Debt issued | 6.5 | 9.4 | 9.9 | 4.8 | 0.3 | 11.1 | 22.3 | 23.8 | 5.2 | 93.1 |
Provisions | 4.2 | | | | | | | | | 4.2 |
Other liabilities | 71.6 | 2.7 | | | | 0.1 | 0.8 | 0.2 | 0.3 | 75.7 |
Total liabilities 31.12.15 | 720.4 | 46.0 | 22.6 | 8.6 | 3.6 | 17.7 | 28.8 | 32.3 | 5.4 | 885.5 |
Total liabilities 31.12.14 | 823.5 | 50.0 | 19.8 | 9.6 | 8.0 | 16.9 | 38.8 | 39.7 | 1.9 | 1,008.1 |
| | | | | | | | | | |
Guarantees, commitments and forward starting transactions |
Loan commitments | 55.7 | 0.2 | 0.1 | 0.0 | 0.0 | 0.0 | | | | 56.1 |
Guarantees | 15.9 | 0.0 | 0.0 | 0.0 | 0.0 | 0.0 | 0.1 | 0.0 | | 16.0 |
| | | | | | | | | | |
Reverse repurchase agreements | 6.6 | | | | | | | | | 6.6 |
Securities borrowing agreements | 0.0 | | | | | | | | | 0.0 |
Total 31.12.15 | 78.1 | 0.2 | 0.2 | 0.0 | 0.0 | 0.1 | 0.1 | 0.0 | | 78.7 |
Total 31.12.14 | 78.3 | 0.1 | 0.1 | 0.0 | 0.0 | 0.1 | 0.1 | 0.0 | | 78.8 |
▲
Currency management
EDTF | Pillar 3 | Our Group currency management activities are designed to reduce adverse currency effects on our reported financial results in Swiss francs, within limits set by the Board of Directors. Corporate Center – Group Asset and Liability Management (Group ALM) focuses on three principal areas of currency risk management: (i) currency-matched funding of investments in non-Swiss franc assets and liabilities, (ii) sell-down of non-Swiss franc profits and losses and (iii) selective hedging of anticipated non-Swiss franc profits and losses. Non-trading foreign exchange risks are managed under market risk limits, with the exception of consolidated capital activity managed by Group ALM. ▲▲
Currency-matched funding and investment of non-Swiss franc assets and liabilities
EDTF | Pillar 3 | For monetary balance sheet items and non-core investments, as far as it is practical and efficient, we follow the principle of matching the currencies of our assets and liabilities for funding purposes. This avoids profits and losses arising from the translation of non-Swiss franc assets and liabilities.
Net investment hedge accounting is applied to non-Swiss franc core investments to balance the effect of foreign exchange movements on both the common equity tier 1 (CET1) capital and CET1 capital ratio on a fully applied basis. ▲▲
® Refer to “Note 1a Summary of significant accounting policies” and “Note 14 Derivative instruments and hedge accounting” in the “Consolidated financial statements” section of this report for more information
Sell-down of non-Swiss franc reported profits and losses
Pillar 3 | Reported profit and losses are translated each month from their original transaction currencies into Swiss francs using the relevant month-end rate. Income statement items of foreign subsidiaries and branches with a functional currency other than the Swiss franc are translated into Swiss francs on a monthly basis using the relevant month-end rate. Weighted average rates for a year represent an average of 12 month-end rates, weighted according to the income and expense volumes of all foreign subsidiaries and branches with the same functional currency for each month. To reduce earnings volatility on the translation of previously recognized earnings in foreign currencies, Group ALM centralizes the profits and losses arising in UBS AG and its branches and sells or buys the profit or loss for Swiss francs. Our operating entities follow a similar monthly sell-down process into their own reporting currencies. Retained earnings in operating entities with a reporting currency other than the Swiss franc are integrated and managed as part of net investment hedge accounting. ▲
Hedging of anticipated future reported non-Swiss franc profits and losses
EDTF | Pillar 3 | At any time, the Group ALCO may instruct Group ALM to execute hedges to protect anticipated future profit and losses in foreign currencies against possible adverse trends of foreign exchange rates. Although intended to hedge future earnings, these transactions are accounted for as open currency positions and are subject to internal market risk limits for value at risk and stress loss limits. ▲▲
® Refer to the “Capital management” section of this report for more information on our active management of sensitivity to currency movements and its effect on our key ratios
Risk, treasury and capital management
Capital management
Capital management
Our strong capital position provides us with a solid foundation for growing our business and enhancing our competitive positioning. At the end of 2015, our common equity tier 1 (CET1) capital ratio1 increased to 14.5% on a fully applied basis, the highest fully applied capital ratio in our peer group of large global banks. On a phase-in basis, our CET1 capital ratio was 19.0%. As of 31 December 2015, our Swiss SRB leverage ratio was 5.3% on a fully applied basis and 6.2% on a phase-in basis. Effective 31 December 2015, our Swiss SRB leverage ratio denominator calculation is fully aligned with the BIS Basel III definition. In 2015, we issued the equivalent of CHF 5.2 billion of additional tier 1 perpetual capital notes, as well as CHF 5.6 billion of senior unsecured debt that will contribute to our total loss-absorbing capacity in anticipation of international regulatory developments, including revisions to the Swiss too big to fail framework.
Capital management objectives
Audited | EDTF | Adequate capital is a prerequisite to conduct our business activities, in accordance with both our own internal assessment and regulatory requirements. ▲ We are committed to maintaining a strong capital position and sound capital ratios at all times, to support the growth of our businesses as well as to meet potential regulatory changes in future capital requirements. We intend to do so mainly through a combination of our retained earnings and the issuance of additional tier 1 (AT1) capital, including Deferred Contingent Capital Plan (DCCP) grants, as well as the issuance of instruments which will contribute to our total loss-absorbing capacity (TLAC).
Ongoing compliance with regulatory capital requirements and target capital ratios is central to our capital adequacy management. As of 31 December 2015, our fully applied CET1 capital ratio was above our target of at least 13% and was above the Swiss Financial Market Supervisory Authority’s (FINMA) requirements for Swiss systemically relevant banks (SRBs), which are stricter than the Basel Committee on Banking Supervision (BCBS) requirements.

We believe that our capital strength provides great comfort to our stakeholders, contributes to UBS’s strong credit ratings and is the foundation of our success. ▲
® Refer to the “Our strategy” section of this report for more information on our performance targets and expectations
® Refer to the “Regulatory and legal developments” section of this report for more information on proposed revisions to the Swiss too big to fail framework
® Refer to the “Our stated capital returns objective is based, in part, on capital ratios that are subject to regulatory change and may fluctuate significantly” in the “Risk factors” section of this report for more information on the risks related to our capital ratios
Capital planning
Audited | EDTF | The annual strategic planning process includes a capital planning component and is key in defining mid and longer-term capital targets. It is based on an attribution of Group risk-weighted assets (RWA) and leverage ratio denominator (LRD) limits to the business divisions. These resource allocations in turn affect business plans and earnings projections, which are then reflected in our capital plans. ▲
Capital limits and targets are established at both Group and business division levels, and submitted to the Board of Directors for approval or for information at least annually. Group Treasury plans for and monitors consolidated RWA, LRD and capital developments. Capital planning and monitoring is also done at the legal entity level for those entities subject to prudential supervision. Our monitoring may inform a need for us to make adjustments to RWA or LRD limits, to take actions related to the issuance or redemption of capital instruments, or to make other decisions. Any breach of the limits in place triggers the imposition of a series of required remediating actions necessary to return the exposures to a limit-compliant level. Monitoring activities also consider developments in capital regulations. ▲
1 Unless otherwise indicated, all information in this section is based on the Basel III framework as applicable for Swiss systematically relevant banks (SRBs).
Capital management activities
Audited | EDTF | Pillar 3 | During 2015, we managed our capital in accordance with our performance targets and expectations. In the target-setting process, we take into account the current and potential future capital requirements, including capital buffer requirements. We also consider our aggregate risk exposure in terms of capital-at-risk, the views of rating agencies, comparisons with peer institutions and the effect of expected accounting policy changes. ▲
Our progress in 2015 toward meeting the Swiss SRB fully applied capital requirements was supported by a series of capital transactions, including:
– the issuance of AT1 perpetual capital notes, consisting of USD 1.25 billion high-trigger loss-absorbing notes, USD 1.25 billion low-trigger loss-absorbing notes and EUR 1.0 billion low-trigger loss-absorbing notes in February 2015, and USD 1.58 billion high-trigger loss-absorbing notes in August 2015; and
– an increase of CHF 0.5 billion in high-trigger loss-absorbing capital related to DCCP grants for the performance year 2015, qualifying as Swiss SRB-compliant AT1 capital. ▲▲
In anticipation of international regulatory developments, including revisions to the Swiss too big to fail (TBTF) framework, we began to issue instruments in 2015 which will contribute to our TLAC and completed our inaugural issuances of TLAC-eligible senior unsecured debt, successfully placing CHF 5.6 billion of notes.
We have additionally taken a series of measures intended to improve our resolvability and we expect that the Group will qualify for a rebate on the gone concern requirements under the new Swiss TBTF proposal. The amount and timing of any such rebate will depend on the actual execution of these measures and can therefore only be specified once all measures are implemented.
Subject to market and other conditions, we currently expect to replace maturing senior debt with TLAC-eligible senior debt, and maturing tier 2 instruments with AT1 instruments. As previously TBTF-compliant AT1 and tier 2 instruments will remain eligible for capital treatment under the new regime on a grandfathering basis, we do not intend to use the proposed changes in the TBTF regime as a trigger to exercise our right to call outstanding tier 2 and low-trigger AT1 instruments. The total amount of TLAC we issue will be affected by any reduction in the gone concern requirement we are granted for improved resolvability. The proposed Swiss TBTF ordinance would permit a reduction of up to 2% of the LRD and 5.7% of RWA gone concern requirements for measures taken to improve resolvability. The amount and timing of any such reduction will be determined by FINMA as such measures are implemented.
® Refer to the “Treasury management” section of this report for more information on our debt issuances in 2015
® Refer to the “Regulatory and legal developments” section of this report for more information on proposed revisions to the Swiss too big to fail framework
® Refer to the “The legal structure of UBS Group” section of this report for more information on changes to our legal structure
Financial resource optimization
EDTF | Pillar 3 | We manage our balance sheet, RWA and LRD levels within our regulatory limits and internal targets. Our strategic focus continues to be on achieving an optimal attribution and utilization of financial resources between our business divisions and Corporate Center, as well as between our legal entities, while remaining within the prescribed limits on a Group and divisional level.
During the year, we managed our RWA and LRD within our defined thresholds. As of 31 December 2015, we were within both our short- to medium-term RWA expectation of around CHF 250 billion and our short- to medium-term LRD expectation of around CHF 950 billion. The Investment Bank was also within the short- to medium-term RWA expectation of around CHF 85 billion and the short- to medium-term LRD expectation of around CHF 325 billion at the end of the year.▲p
Risk, treasury and capital management
Capital management
Active management of sensitivity to currency movements
EDTF | Pillar 3 | Corporate Center – Group Asset and Liability Management (Group ALM) is mandated with the task of minimizing adverse effects from changes in currency rates on our fully applied CET1 capital and CET1 capital ratio. A significant portion of our capital and RWA is denominated in US dollars, euros, British pounds and other foreign currencies. In order to hedge the CET1 capital ratio, CET1 capital needs to have foreign currency exposure, leading to currency sensitivity of CET1 capital. As a consequence, it is not possible to simultaneously fully hedge the capital and the capital ratio. As the proportion of RWA denominated in foreign currencies outweighs the capital in these currencies, a significant appreciation of the Swiss franc against these currencies could benefit our capital ratios, while a significant depreciation of the Swiss franc against these currencies could adversely affect our capital ratios. The Group Asset and Liability Management Committee, a committee of the UBS Group Executive Board, can adjust the currency mix in capital, within limits set by the Board of Directors, to balance the effect of foreign exchange movements on the fully applied CET1 capital and capital ratio. Limits are in place for the sensitivity of both CET1 capital and the capital ratio to an appreciation or depreciation of 10% in the value of the Swiss franc against other currencies.
We estimate that a 10% depreciation of the Swiss franc against other currencies would have increased our fully applied RWA by CHF 9.1 billion and our fully applied CET1 capital by CHF 933 million as of 31 December 2015 (31 December 2014: CHF 10.5 billion and CHF 1,007 million, respectively) and reduced our fully applied CET1 capital ratio by 17 basis points (31 December 2014: 17 basis points). Conversely, we estimate that a 10% appreciation of the Swiss franc against other currencies would have reduced our fully applied RWA by CHF 8.2 billion and our fully applied CET1 capital by CHF 844 million (31 December 2014: CHF 9.5 billion and CHF 911 million, respectively) and increased our fully applied CET1 capital ratio by 17 basis points (31 December 2014: 17 basis points).
Our leverage ratio is also sensitive to foreign exchange movements due to the currency mix of our capital and LRD. When adjusting the currency mix in capital, potential effects on the leverage ratios are taken into account and the sensitivity of the leverage ratio to an appreciation or depreciation of 10% in the value of the Swiss franc against other currencies is actively monitored.
We estimate that a 10% depreciation of the Swiss franc against other currencies would have increased our fully applied leverage ratio denominator (LRD) by CHF 70 billion and reduced our fully applied Swiss SRB leverage ratio by 11 basis points. Conversely, we estimate that a 10% appreciation of the Swiss franc against other currencies would have reduced our fully applied LRD by CHF 63 billion and increased our fully applied Swiss SRB leverage ratio by 12 basis points.
These sensitivities do not consider foreign currency translation effects related to defined benefit plans other than those related to the currency translation of the net equity of foreign operations. ▲p
Consideration of stress scenarios
EDTF | Through a set of quantitative risk appetite objectives, we aim to ensure that aggregate risk exposure is within our desired risk capacity, based on our capital and business plans. We use both scenario-based stress tests and statistical frameworks to assess the impact of a severe stress event at an aggregate, Group-wide level. We are committed to total capital returns to shareholders of at least 50% of net profit attributable to shareholders, provided that we maintain a fully applied CET1 capital ratio of at least 13% and consistent with our objective of maintaining a post-stress fully applied CET1 capital ratio of at least 10%. Our post-stress CET1 capital ratio exceeded the 10% objective as of 31 December 2015. ▲
® Refer to “Our stated capital returns objective is based, in part, on capital ratios that are subject to regulatory change and may fluctuate significantly” in the “Risk factors” section of this report for more information on the calculation of our post-stress CET1 capital ratio and related risks
® Refer to the “Risk management and control” section of this report for more information on our risk appetite and combined stress test framework
Swiss SRB capital framework
EDTF | UBS is considered a systemically relevant bank (SRB) under Swiss banking law and both UBS Group and UBS AG are, on a consolidated basis, required to comply with regulations based on the Basel III framework as applicable for Swiss SRBs. All our capital disclosures therefore focus on Swiss SRB capital information. Differences between Swiss SRB and BIS capital information on a UBS Group level are outlined in the “Differences between Swiss SRB and BIS capital” section. ▲
® Refer to the “Legal entity financial and regulatory information” section of this report for information on capital requirements for UBS AG and UBS Switzerland AG on a standalone basis
Regulatory framework
EDTF | The Basel III framework came into effect in Switzerland on 1 January 2013 and includes prudential filters for the calculation of capital. These prudential filters consist mainly of capital deductions for deferred tax assets (DTAs) recognized for tax loss carry-forwards, DTAs on temporary differences that exceed a certain threshold and effects related to defined benefit plans. As these filters are being phased in between 2014 and 2018, their effects are gradually factored into our calculations of capital, RWA and capital ratios on a phase-in basis and are entirely reflected in our capital, RWA and capital ratios on a fully applied basis.
In 2015, we deducted from our phase-in CET1 capital 40% (2014: 20%) of: (i) DTAs recognized for tax loss carry-forwards, (ii) DTAs on temporary differences that exceed the threshold of 10% of CET1 capital before deduction of DTAs on temporary differences and (iii) the effects related to net defined benefit pension plan assets under IAS 19 (revised).
In 2015, we accelerated the phase-in of the cumulative difference between the IAS 19 (revised) accounting applied for fully applied CET1 calculations and the pro forma IAS 19 treatment applied for CET1 phase-in calculations.
Capital instruments that were treated as hybrid tier 1 capital and as tier 2 capital under the Basel 2.5 framework are being phased out under Basel III between 2013 and 2019. On a phase-in basis, our capital and capital ratios include the applicable portion of these capital instruments not yet phased out. Our capital and capital ratios on a fully applied basis do not include these capital instruments. ▲
Proposed changes to capital requirements and regulation
EDTF | In December 2015, the Swiss Federal Department of Finance published for consultation a draft revised TBTF ordinance based on the cornerstones announced by the Swiss Federal Council in October 2015. In line with the announced cornerstones, the proposal would revise the capital and leverage ratio requirements for Swiss systemically relevant banks and includes new gone concern requirements.
® Refer to the “Regulatory and legal developments” section of this report for more information on the proposed revisions to the Swiss TBTF framework
In 2015, the BCBS continued its review of the capital framework to balance simplicity and risk sensitivity, and to promote comparability. The BCBS released a second consultative document on revisions to the standardized approach for credit risk in December 2015. The proposal would reintroduce the use of external credit ratings for exposures to banks and corporates and adopt a loan-to-value approach to risk weighting of real estate loans. The BCBS intends to finalize the revisions by the end of 2016.
In January 2016, the BCBS published a revised market risk framework, which defines minimum capital requirements for market risk exposures. The market risk framework includes stricter rules on the designation of instruments as either trading or banking book, a more prescriptive internal-model approach aimed at increasing consistency across banks, as well as a revised and more risk-sensitive standardized approach, which may also be used as a fall back to the internal-model approach. The BCBS will conduct further quantitative impact studies in order to monitor the effect of the capital requirements and to ensure consistency in the application of the framework. We expect Switzerland to finalize these changes in the domestic regulations no later than 1 January 2019, the deadline set by the BCBS.▲
® Refer to the “Regulatory and legal developments” section of this report for more information
Risk, treasury and capital management
Capital management

Capital requirements
EDTF | As of 31 December 2015, our total capital requirement for both UBS Group and UBS AG (consolidated) was 12.6% of RWA compared with 11.1% as of 31 December 2014. The requirement as of 31 December 2015 consisted of: (i) base capital of 4.5%, (ii) buffer capital of 5.3%, of which 0.2% was attributable to the countercyclical buffer capital requirement and (iii) progressive buffer capital of 2.8%. We satisfied the base and buffer capital requirements, including the countercyclical buffer, through our CET1 capital. In addition, since 31 March 2015, high-trigger loss-absorbing capital is included in the buffer capital. Low-trigger loss-absorbing capital satisfied the progressive buffer capital requirement.
National regulators can put in place a countercyclical buffer requirement of up to 2.5% of RWA for credit exposures in their jurisdiction. The Swiss Federal Council has activated a countercyclical buffer requirement of 2% of RWA for mortgage loans on residential property in Switzerland, applicable since 30 June 2014. In 2016, we will begin to apply additional countercyclical buffer requirements introduced for other Basel Committee member jurisdictions. The requirements will be phased-in and become fully effective on 1 January 2019.
Our requirement for the progressive buffer is dynamic and depends on our leverage ratio denominator (LRD) and our market share in the loans and deposits business in Switzerland. In the second quarter of 2015, the progressive buffer requirement for 2019 was reduced to 4.5% from 5.4%, reflecting updated LRD and market share information for 2014 provided by FINMA in June 2015. As a result, our total 2015 capital requirement on a phase-in basis decreased to 12.6% from the previously reported 13.0%. ▲
Moreover, banks governed under the Swiss SRB framework are eligible for a capital rebate on the progressive buffer if they take actions that facilitate recovery and resolvability beyond the minimum requirements to ensure the integrity of systemically important functions in the case of an impending insolvency. We have taken a series of measures to improve our resolvability. We are confident that the establishment of UBS Group AG and UBS Switzerland AG, along with our other announced measures as described in the “The legal structure of UBS Group” section of this report, will substantially enhance the resolvability of the Group. FINMA has confirmed that these measures were in principle suitable to warrant a rebate under the current Swiss capital regulation. Therefore, we expect that the Group will qualify for a rebate on the gone concern requirements under the new Swiss TBTF framework proposal. The amount and timing of any such rebate will depend on the actual execution of these measures and can therefore only be specified once all measures are implemented.
Similar to the other capital component requirements, the progressive buffer requirement is phased in gradually until 2019. As of 31 December 2015, the progressive buffer requirement was 2.8% compared with 2.5% as of 31 December 2014.
® Refer to the “The legal structure of UBS Group” section of this report for more information on changes to our legal structure
The Financial Stability Board (FSB) determined that UBS is a global systemically important bank (G-SIB), using an indicator-based methodology adopted by the BCBS. Based on published indicators, G-SIB are subject to additional CET1 capital buffer requirements in the range of 1.0% to 3.5%. These requirements will be phased in from 1 January 2016 to 31 December 2018, and will become fully effective on 1 January 2019. As our aforementioned Swiss SRB capital requirements exceed the BCBS requirements including the G-SIB buffer, UBS is not affected by the above additional G-SIB requirements.
EDTF | Pillar 3 |
Swiss SRB capital ratio requirements and information (phase-in) |
| | Capital ratio (%) | | Capital |
| | Requirement¹ | | Actual²˒³ | | Requirement | | Eligible²˒³ |
CHF million, except where indicated | | 31.12.15 | | 31.12.15 | | 31.12.14 | | 31.12.15 | | 31.12.15 | 31.12.14 |
Base capital (common equity tier 1 capital) | | 4.5 | | 4.5 | | 4.0 | | 9,554 | | 9,554 | 8,835 |
Buffer capital (common equity tier 1 capital and high-trigger loss-absorbing capital) | | 5.3⁴ | | 16.8 | | 15.4 | | 11,236 | | 35,564 | 34,027 |
of which: effect of countercyclical buffer | | 0.2 | | 0.2 | | 0.1 | | 356 | | 356 | 322 |
Progressive buffer capital (low-trigger loss-absorbing capital) | | 2.8 | | 5.0 | | 5.2 | | 6,011 | | 10,679 | 11,398 |
Phase-out capital (tier 2 capital) | | | | 0.5 | | 0.9 | | | | 996 | 2,050 |
Total | | 12.6 | | 26.8 | | 25.5 | | 26,800 | | 56,792 | 56,310 |
1 Prior to the implementation of the Swiss SRB framework, FINMA also defined a total capital ratio target for UBS Group of 14.4%, which will be effective until it is exceeded by the Swiss SRB phase-in requirement. 2 Swiss SRB CET1 capital exceeding the base capital requirement is allocated to the buffer capital. 3 From 31 March 2015 onward, high-trigger loss-absorbing capital (LAC) is included in the buffer capital. Prior to 31 March 2015, high-trigger LAC was included in the progressive buffer capital. 4 CET1 capital can be substituted by high-trigger loss-absorbing capital up to 2.3% in 2015. |
▲▲
Risk, treasury and capital management
Capital management
Swiss SRB capital information (UBS Group)
In this section, we disclose capital information on a consolidated UBS Group basis. Capital information for UBS AG on a consolidated basis is provided in the “UBS AG (consolidated) capital and leverage ratio information” section of this report.
Capital ratios
EDTF | Our fully applied CET1 capital ratio increased 1.1 percentage points to 14.5% as of 31 December 2015, exceeding our target ratio of 13.0%. This increase was driven by a CHF 9.0 billion decrease in risk-weighted assets (RWA) and a CHF 1.1 billion increase in CET1 capital. On a phase-in basis, our CET1 capital ratio decreased 0.4 percentage points to 19.0% as of 31 December 2015, mainly due to a decrease of CHF 2.5 billion in CET1 capital, partly offset by a decrease of CHF 8.6 billion in RWA.
Our tier 1 capital ratio increased 3.8 percentage points to 17.4% on a fully applied basis and 1.6 percentage points to 21.0% on a phase-in basis. Both increases resulted from the aforementioned changes in RWA and CET1 capital, as well as the aforementioned issuances of low- and high-trigger loss-absorbing AT1 capital in February and August 2015 and DCCP awards granted for the performance year 2015.
Our fully applied total capital ratio increased 4.0 percentage points to 22.9% as of 31 December 2015 and 1.3 percentage points to 26.8% on a phase-in basis.▲

EDTF | Pillar 3 |
Swiss SRB capital information |
| | | | | | Phase-in | | Fully applied |
CHF million, except where indicated | | | | | | 31.12.15 | | 31.12.14 | | 31.12.15 | 31.12.14 |
Common equity tier 1 capital | | | | | | | | | | | |
Common equity tier 1 capital | | | | | | 40,378 | | 42,863 | | 30,044 | 28,941 |
Additional tier 1 capital | | | | | | | | | | | |
High-trigger loss-absorbing capital¹ | | | | | | 3,828 | | 0 | | 3,828 | 467 |
Low-trigger loss-absorbing capital² | | | | | | 353 | | 0 | | 2,326 | 0 |
Total additional tier 1 capital³ | | | | | | 4,181 | | 0 | | 6,154 | 467 |
Tier 1 capital | | | | | | 44,559 | | 42,863 | | 36,198 | 29,408 |
Tier 2 capital | | | | | | | | | | | |
High-trigger loss-absorbing capital | | | | | | 912 | | 946 | | 912 | 946 |
Low-trigger loss-absorbing capital | | | | | | 10,325 | | 10,451 | | 10,325 | 10,451 |
Phase-out capital | | | | | | 996 | | 2,050 | | | |
Total tier 2 capital | | | | | | 12,233 | | 13,448 | | 11,237 | 11,398 |
Total capital | | | | | | 56,792 | | 56,310 | | 47,435 | 40,806 |
Common equity tier 1 capital ratio (%) | | | | | | 19.0 | | 19.4 | | 14.5 | 13.4 |
Tier 1 capital ratio (%) | | | | | | 21.0 | | 19.4 | | 17.4 | 13.6 |
Total capital ratio (%) | | | | | | 26.8 | | 25.5 | | 22.9 | 18.9 |
Risk-weighted assets | | | | | | 212,302 | | 220,877 | | 207,530 | 216,462 |
1 As of 31 December 2014, on a phase-in basis, high-trigger loss-absorbing capital of CHF 467 million was fully offset by required deductions for goodwill. 2 Consists on a phase-in basis of low-trigger loss-absorbing capital (31 December 2015: CHF 2,326 million) partly offset by required deductions for goodwill (31 December 2015: CHF 1,973 million). 3 Includes on a phase-in basis hybrid capital subject to phase-out (31 December 2015: CHF 1,954 million and 31 December 2014: CHF 3,210 million), fully offset by required deductions for goodwill. |
▲▲
Eligible capital
Tier 1 capital
EDTF | Pillar 3 | Our tier 1 capital consists of CET1 capital and AT1 capital. The analysis of our 2015 tier 1 capital movement is provided in the “Swiss SRB capital movement” table.
Audited | Our CET1 capital mainly consists of share capital, share premium, which consists primarily of additional paid-in capital related to shares issued, and retained earnings. A detailed reconciliation of IFRS equity to CET1 capital is provided in the “Reconciliation IFRS equity to Swiss SRB capital” table. ▲▲
Our fully applied CET1 capital increased by CHF 1.1 billion to CHF 30.0 billion, mainly reflecting the 2015 operating profit before tax excluding own credit, partly offset by accruals for proposed dividends to shareholders and current tax effects. Our phase-in CET1 capital decreased by CHF 2.5 billion to CHF 40.4 billion, primarily as the 2015 operating profit before tax excluding own credit was more than offset by accruals for proposed dividends to shareholders, a reduction related to the accelerated application of the IAS 19 (revised) treatment of defined benefit plans and a decrease related to the additional phase-in effect of capital deductions on DTAs for tax loss carry-forwards, which increased from 20% to 40% effective 1 January 2015. ▲
Risk, treasury and capital management
Capital management
EDTF | Pillar 3 |
Swiss SRB capital movement |
| | 2015 | | 2014 |
CHF million | | Phase-in | | Fully applied | | Phase-in | | Fully applied |
Common equity tier 1 capital at the beginning of the year | | 42,863 | | 28,941 | | 42,179 | | 28,908 |
Operating profit / (loss) before tax | | 5,306 | | 5,306 | | 2,286 | | 2,286 |
Current tax effect | | (715) | | (715) | | (476) | | (476) |
Deferred tax assets recognized for tax loss carry-forwards, additional phase-in effect ¹ | | (1,467) | | | | (1,333) | | |
Deferred tax assets recognized for tax loss carry-forwards | | (359) | | | | 690 | | |
Deferred tax assets recognized for temporary differences | | 1,602 | | 310 | | 754 | | 150 |
Defined benefit pension plans, acceleration and phase-in effect | | (3,334)² | | | | (699)¹ | | |
Defined benefit pension plans | | 295 | | 265 | | 144 | | (461) |
Own credit related to financial liabilities designated at fair value and replacement value, net of tax | | (578) | | (578) | | (168) | | (168) |
Compensation and own shares-related capital components (including share premium) | | (208) | | (208) | | 420 | | 420 |
Goodwill, net of tax, less hybrid capital and loss-absorbing capital | | 281 | | 30 | | 590 | | 27 |
Foreign currency translation effects | | (257) | | (234) | | 1,188 | | 948 |
Accruals for proposed dividends to shareholders | | (3,188) | | (3,188) | | (2,827) | | (2,827) |
Other | | 136 | | 114 | | 113 | | 133 |
Total movement | | (2,485) | | 1,102 | | 683 | | 33 |
Common equity tier 1 capital at the end of the year | | 40,378 | | 30,044 | | 42,863 | | 28,941 |
Additional tier 1 capital at the beginning of the year | | 0 | | 467 | | 0 | | 0 |
Issuance of high-trigger loss-absorbing capital | | 3,381 | | 3,381 | | 467 | | 467 |
Issuance of low-trigger loss-absorbing capital | | 2,266 | | 2,266 | | 0 | | 0 |
Call of hybrid capital | | (1,040) | | | | 0 | | |
Goodwill, net of tax, offset against hybrid capital and loss-absorbing capital | | (251) | | | | (563) | | |
Foreign currency translation effects and other | | (175) | | 40 | | 96 | | 0 |
Total movement | | 4,181 | | 5,687 | | 0 | | 467 |
Additional tier 1 capital at the end of the year | | 4,181 | | 6,154 | | 0 | | 467 |
Tier 2 capital at the beginning of the year | | 13,448 | | 11,398 | | 8,636 | | 5,665 |
Issuance of loss-absorbing capital | | 0 | | 0 | | 4,567 | | 4,567 |
Repurchase of capital instruments | | (690) | | | | (1,211) | | |
Foreign currency translation effects and other | | (525) | | (161) | | 1,456 | | 1,166 |
Total movement | | (1,214) | | (161) | | 4,812 | | 5,733 |
Tier 2 capital at the end of the year | | 12,233 | | 11,237 | | 13,448 | | 11,398 |
Total capital at the end of the year | | 56,792 | | 47,435 | | 56,310 | | 40,806 |
1 31 December 2015 reflects the 20% additional phase-in effect, resulting in an increase from 20% to 40%. 31 December 2014 reflects the phase-in effect of 20%. 2 Includes the effect of accelerating the phase-in of the cumulative difference between IAS19 (revised) and IAS19, as well as the associated reversal of deferred tax assets recognized for tax loss carry-forwards. |
▲▲
Audited | EDTF | Our AT1 capital increased by CHF 5.7 billion to CHF 6.2 billion on a fully applied basis, mainly due to the aforementioned issuances of AT1 capital in 2015. As of 31 December 2015, our high-trigger loss-absorbing AT1 capital amounted to CHF 3.8 billion and our low-trigger loss-absorbing AT1 capital amounted to CHF 2.3 billion. High-trigger loss-absorbing AT1 capital as of 31 December 2015 included CHF 1.0 billion of DCCP awards granted for the performance years 2015 and 2014.
On a phase-in basis, our AT1 capital was CHF 4.2 billion as of 31 December 2015, consisting of the aforementioned high-trigger and low-trigger loss-absorbing capital of CHF 3.8 billion and CHF 2.3 billion, respectively, as well as CHF 2.0 billion in hybrid capital subject to phase-out. Low-trigger loss-absorbing capital and hybrid capital were partly offset by required deductions of CHF 3.9 billion related to goodwill. ▲
® Refer to the “Additional tier 1 and tier 2 capital instruments” table on the following pages for details on the write-down triggers of our AT1 and tier 2 capital instruments ▲
Tier 2 capital
Audited | EDTF | Pillar 3 | During 2015, our tier 2 capital decreased by CHF 0.2 billion to CHF 11.2 billion on a fully applied basis and by CHF 1.2 billion to CHF 12.2 billion on a phase-in basis. The decrease in phase-in tier 2 capital was due to the repurchase of certain tier 2 capital instruments in December 2015 as part of a tender offer, as well as currency translation effects.
As of 31 December 2015, tier 2 capital included CHF 10.3 billion of low-trigger loss-absorbing capital, consisting of one euro-denominated and four US dollar-denominated subordinated notes. Moreover, our tier 2 capital included high-trigger loss-absorbing capital of CHF 0.9 billion, as outstanding DCCP awards granted for the performance years 2012 and 2013 qualify as tier 2 loss-absorbing capital.
The remainder of phase-in tier 2 capital of CHF 1.0 billion consisted of outstanding tier 2 instruments which will be phased out by 2019. ▲
® Refer to the “Additional tier 1 and tier 2 capital instruments” table on the following pages for details on the write-down triggers of our tier 2 capital instruments p▲
Audited | EDTF | Pillar 3 |
Reconciliation IFRS equity to Swiss SRB capital |
| | Phase-in | | Fully applied |
CHF million | | 31.12.15 | 31.12.14 | | 31.12.15 | 31.12.14 |
Equity attributable to UBS Group AG shareholders | | 55,313 | 50,608 | | 55,313 | 50,608 |
Equity attributable to non-controlling interests in UBS AG | | | 1,702 | | | 1,702 |
Equity attributable to preferred noteholders and other non-controlling interests | | 1,995 | 2,058 | | 1,995 | 2,058 |
Total IFRS equity | | 57,308 | 54,368 | | 57,308 | 54,368 |
Equity attributable to preferred noteholders and other non-controlling interests | | (1,995) | (2,058) | | (1,995) | (2,058) |
Defined benefit plans (before phase-in, as applicable)¹ | | | 3,997 | | (50) | 0 |
Defined benefit plans, phase-in² | | (20) | (799) | | | |
Deferred tax assets recognized for tax loss carry-forwards (before phase-in, as applicable) | | | | | (7,468) | (8,047) |
Deferred tax assets recognized for tax loss carry-forwards, phase-in² | | (2,988) | (1,605) | | | |
Deferred tax assets on temporary differences, excess over threshold | | (702) | 0 | | (2,598) | (604) |
Goodwill, net of tax, less hybrid capital and loss-absorbing capital³ | | (2,618) | (3,010) | | (6,545) | (6,687) |
Intangible assets, net of tax | | (323) | (410) | | (323) | (410) |
Unrealized (gains) / losses from cash flow hedges, net of tax | | (1,638) | (2,156) | | (1,638) | (2,156) |
Compensation and own shares-related capital components (including share premium) | | (1,383) | (1,219) | | (1,383) | (1,219) |
Own credit related to financial liabilities designated at fair value and replacement values, net of tax | | (442) | 136 | | (442) | 136 |
Unrealized gains related to financial investments available-for-sale, net of tax | | (402) | (384) | | (402) | (384) |
Prudential valuation adjustments | | (83) | (123) | | (83) | (123) |
Consolidation scope | | (130) | (88) | | (130) | (88) |
Accruals for proposed dividends to shareholders | | (3,188) | (2,827) | | (3,188) | (2,827) |
Other⁴ | | (1,018) | (959) | | (1,018) | (959) |
Common equity tier 1 capital | | 40,378 | 42,863 | | 30,044 | 28,941 |
High-trigger loss-absorbing capital | | 3,828 | 467 | | 3,828 | 467 |
Low-trigger loss-absorbing capital | | 2,326 | 0 | | 2,326 | 0 |
Hybrid capital subject to phase-out | | 1,954 | 3,210 | | | |
Goodwill, net of tax, offset against hybrid capital and loss-absorbing capital | | (3,927) | (3,677) | | | |
Additional tier 1 capital | | 4,181 | 0 | | 6,154 | 467 |
Tier 1 capital | | 44,559 | 42,863 | | 36,198 | 29,408 |
Tier 2 capital | | 12,233 | 13,448 | | 11,237 | 11,398 |
Total capital | | 56,792 | 56,310 | | 47,435 | 40,806 |
1 Phase-in number net of tax, fully applied number pre-tax. 2 As of 31 December 2015, the phase-in deduction applied was 40%; as of 31 December 2014, the phase-in deduction applied was 20%. 3 Includes goodwill related to significant investments in financial institutions of CHF 360 million. 4 Includes the net charge for the compensation-related increase in high-trigger loss-absorbing capital for tier 2 and additional tier 1 capital and other items. |
▲▲p
Risk, treasury and capital management
Capital management
EDTF | Pillar 3 |
Additional tier 1 and tier 2 capital instruments¹ |
| | | | | |
Additional tier 1 capital instruments (Swiss SRB compliant) |
CHF million, except where indicated | | |
No. | Issuer | ISIN | Issue date | Outstanding amount as of 31.12.15 | Amount recognized in regulatory capital as of 31.12.15 |
1 | UBS Group AG, Switzerland, or employing subsidiaries³ | | 31.12.14 | CHF 474 | CHF 474 |
2 | UBS Group AG, Switzerland | CH0271428309 | 19.02.15 | EUR 1,000 | CHF 1,081 |
3 | UBS Group AG, Switzerland | CH0271428317 | 19.02.15 | USD 1,250 | CHF 1,249 |
4 | UBS Group AG, Switzerland | CH0271428333 | 19.02.15 | USD 1,250 | CHF 1,245 |
5 | UBS Group AG, Switzerland | CH0286864027 | 07.08.15 | USD 1,575 | CHF 1,587 |
6 | UBS Group AG, Switzerland, or employing subsidiaries³ | | 31.12.15 | CHF 518 | CHF 518 |
Total additional tier 1 capital | | | | CHF 6,154 |
| | | | | |
High-trigger loss-absorbing tier 2 capital instruments (Swiss SRB compliant) |
CHF million, except where indicated | | |
No. | Issuer | ISIN | Issue date | Outstanding amount as of 31.12.15 | Amount recognized in regulatory capital as of 31.12.15 |
1 | UBS Group AG, Switzerland, or employing subsidiaries³˒⁴ | | 31.12.12 | CHF 434 | CHF 434 |
2 | UBS Group AG, Switzerland, or employing subsidiaries³˒⁴ | | 31.12.13 | CHF 478 | CHF 478 |
Total high-trigger loss-absorbing tier 2 capital | | | | CHF 912 |
| | | | | |
Low-trigger loss-absorbing tier 2 capital instruments (Swiss SRB compliant) |
CHF million, except where indicated | | |
No. | Issuer | ISIN | Issue date | Outstanding amount as of 31.12.15 | Amount recognized in regulatory capital as of 31.12.15 |
1 | UBS AG, Switzerland, Jersey branch | XS0747231362 | 22.02.12 | USD 2,000 | CHF 2,004 |
2 | UBS AG, Switzerland, Stamford branch | US90261AAB89 | 17.08.12 | USD 2,000 | CHF 1,959 |
3 | UBS AG, Switzerland | CH0214139930 | 22.05.13 | USD 1,500 | CHF 1,482 |
4 | UBS AG, Switzerland | CH0236733827 | 13.02.14 | EUR 2,000 | CHF 2,279 |
5 | UBS AG, Switzerland | CH0244100266 | 15.05.14 | USD 2,500 | CHF 2,602 |
Total low-trigger loss-absorbing tier 2 capital | | | | CHF 10,325 |
| | | | | |
Phase-out tier 2 capital instruments |
CHF million, except where indicated | | |
No. | Issuer | ISIN | Issue date | Outstanding amount as of 31.12.15 | Amount recognized in regulatory capital as of 31.12.15 |
1 | UBS AG, Switzerland, New York branch | US870836AC77 | 21.07.95 | USD 251 | CHF 251 |
2 | UBS AG, Switzerland, New York branch | US870845AC84 | 03.09.96 | USD 218 | CHF 215 |
3 | UBS AG, Switzerland, New York branch | US87083KAM45 | 20.06.97 | USD 220 | CHF 44 |
4 | UBS AG, Switzerland, Jersey branch | XS0062270581 | 18.12.95 | GBP 61 | CHF 91 |
5 | UBS AG, Switzerland, Jersey branch | XS0257741834 | 21.06.06 | GBP 113 | CHF 166 |
6 | UBS AG, Switzerland, Jersey branch | XS0331313055 | 19.11.07 | GBP 130 | CHF 190 |
7 | UBS AG, Switzerland | CH0035789210 | 27.12.07 | CHF 192 | CHF 39 |
Total phase-out tier 2 capital | | | | CHF 996 |
1 Refer to "Bondholder information" at www.ubs.com/investors for more information on the key features of the hybrid capital instruments subject to phase-out under Swiss SRB rules and outstanding as of 31 December 2015. 2 The capital instruments would be written down due to a viability event, as defined in the terms and conditions of the instruments, if FINMA determined that a write-down were necessary to ensure UBS's viability, or UBS received a commitment of governmental support that FINMA determined to be necessary to ensure UBS's viability. Refer to "Bondholder information" at www.ubs.com/investors for more information on the terms and conditions of the instruments and refer to item 23 in “Note 1a Significant accounting polices" in the “Consolidated financial statements” section of this report for more information on the accounting treatment of such instruments. 3 Relates to DCCP awards. 4 Issued by UBS AG and transferred in the fourth quarter of 2014 to UBS Group AG as part of the Group reorganization. 5 CET1 write-down thresholds are set on UBS AG (consolidated) level. |
| | | |
| | | |
| | | |
| | | |
Coupon rate and frequency of payment | Maturity date | Optional call date | Write-down trigger² |
Issues in CHF: 4%, issues in USD: 7.125%, annually | Perpetual | 01.03.20 | CET1 ratio < 7 / 10% or viability event |
5.75% / Reset Interest Rate, annually | Perpetual | 19.02.22 | CET1 ratio < 5.125% or viability event |
7.125% / Reset Interest Rate, annually | Perpetual | 19.02.20 | CET1 ratio < 7% or viability event |
7.00% / Reset Interest Rate, annually | Perpetual | 19.02.25 | CET1 ratio < 5.125% or viability event |
6.875% / Reset Interest Rate, annually | Perpetual | 07.08.25 | CET1 ratio < 7% or viability event |
Issues in CHF: 4.15%, issues in USD: 7.35%, annually | Perpetual | 01.03.21 | CET1 ratio < 7 / 10% or viability event |
| | | |
| | | |
| | | |
| | | |
Coupon rate and frequency of payment | Maturity date | Optional call date | Write-down trigger² |
Issues in CHF: 5.40%, issues in USD: 6.25%, annually | 01.03.18 | | CET1 ratio < 7% or viability event |
Issues in CHF: 3.5%, issues in USD: 5.125%, annually | 01.03.19 | | CET1 ratio < 7 / 10% or viability event |
| | | |
| | | |
| | | |
| | | |
Coupon rate and frequency of payment | Maturity date | Optional call date | Write-down trigger²˒⁵ |
7.25% / 6.061% + Mid Market Swap Rate from 22 February 2017, annually | 22.02.22 | 22.02.17 | CET1 ratio < 5% or viability event |
7.625%, semi-annually | 17.08.22 | | CET1 ratio < 5% or viability event |
4.75% / 3.765% + Mid Market Swap Rate from 22 May 2018, annually | 22.05.23 | 22.05.18 | CET1 ratio < 5% or viability event |
4.75% / 3.40% + Mid Market Swap Rate from 12 February 2021, annually | 12.02.26 | 12.02.21 | CET1 ratio < 5% or viability event |
5.125%, annually | 12.05.24 | | CET1 ratio < 5% or viability event |
| | | |
| | | |
| | | |
| | | |
Coupon rate and frequency of payment | Maturity date | Optional call date | |
7.5%, semi-annually | 15.07.25 | | |
7.75%, semi-annually | 01.09.26 | | |
7.375%, semi-annually | 15.06.17 | | |
8.75%, annually | 18.12.25 | | |
5.25% / 3-month Sterling LIBOR + 1.29%, annually / quarterly | 21.06.21 | 21.06.16 | |
6.375% / 3-month Sterling LIBOR + 2.10%, annually / quarterly | 19.11.24 | 19.11.19 | |
4.125%, annually | 27.12.17 | | |
| | | |
▲▲
Risk, treasury and capital management
Capital management
Advanced measurement approach model
Pillar 3 | We have estimated the loss in capital that we could incur as a result of the risks associated with the matters described in “Note 22 Provisions and contingent liabilities” to our consolidated financial statements. For this purpose, we have used the advanced measurement approach (AMA) methodology that we use when determining the capital requirements associated with operational risks, based on a 99.9% confidence level over a 12-month horizon. The methodology takes into consideration UBS and industry experience for the AMA operational risk categories to which those matters correspond, as well as the external environment affecting risks of these types, in isolation from other areas. On this standalone basis, we estimate the loss in capital that we could incur over a 12-month period as a result of our risks associated with these operational risk categories at CHF 3.7 billion as of 31 December 2015. Because this estimate is based upon historical data for the relevant risk categories, it does not constitute a subjective assessment of UBS’s actual exposures in those matters and does not take into account any provisions recognized for those matters. For this reason, and because some of those matters are not expected to be resolved within the next 12 months, any possible losses that we may incur with respect to these matters may be materially more or materially less than this estimated amount.
In accordance with FINMA requirements, we reviewed the methodology and calibration of our AMA model for operational risk during 2015. Subject to FINMA approval, we anticipate that we will implement the revised model in the first quarter of 2016 and expect that the estimated capital loss described in the paragraphs above would be greater under the revised model. ▲
® Refer to “Note 22 Provisions and contingent liabilities” in the “Consolidated financial statements” section of this report for more information
Additional capital information
Pillar 3 | In order to ensure the consistency and comparability of regulatory capital instruments disclosures for all market participants, BIS and FINMA Pillar 3 rules require banks and banking groups to disclose the main features of eligible capital instruments and their terms and conditions.
® Refer to “Bondholder information” at www.ubs.com/investors for more information on the capital instruments of UBS Group and of UBS AG both on a consolidated and a standalone basis
In order to fulfill BIS and FINMA Pillar 3 composition of capital disclosure requirements, we disclose a full reconciliation of all regulatory capital elements to the published IFRS balance sheet.
® Refer to the “UBS Group AG consolidated supplemental disclosures required under Basel III Pillar 3 regulations” section of this report for more information
BIS and Swiss SRB rules require banks to disclose differences between the accounting scope of consolidation and the regulatory scope of consolidation.
The scope of consolidation for the purpose of calculating Group regulatory capital is generally the same as the scope under IFRS and includes subsidiaries directly or indirectly controlled by UBS Group AG that are active in the banking and finance sector. However, subsidiaries consolidated under IFRS that are active in sectors other than banking and finance are excluded from the regulatory scope of consolidation.
® Refer to “Note 1 Summary of significant accounting policies” and “Note 30 Interests in subsidiaries and other entities” in the “Consolidated financial statements” section of this report for more information on the IFRS scope of consolidation and the list of significant subsidiaries included as of 31 December 2015
® Refer to the “UBS Group AG consolidated supplemental disclosures required under Basel III Pillar 3 regulations” section of this report for more information on entities that are treated differently under the regulatory and the IFRS scope of consolidation
Capital information for UBS AG, UBS Switzerland AG and UBS Limited on a standalone basis is disclosed in the “Legal entity financial and regulatory information” section of this report. ▲
Differences between Swiss SRB and BIS capital
Our Swiss SRB and BIS capital is the same on both a fully applied and a phase-in basis, except for two specific tier 2 capital items. First, as of 31 December 2015, the amount of our tier 2 high-trigger loss-absorbing capital, in the form of DCCP awards for 2012 and 2013, was CHF 452 million higher under Swiss SRB rules than under BIS rules. Second, a portion of unrealized gains on financial investments classified as available-for-sale, totaling CHF 202 million as of 31 December 2015, was recognized as tier 2 capital under BIS rules, but not under Swiss SRB regulations.
Differences between Swiss SRB and BIS capital information |
As of 31.12.15 | | Phase-in | | Fully applied |
CHF million, except where indicated | | Swiss SRB | BIS | Differences Swiss SRB versus BIS | | Swiss SRB | BIS | Differences Swiss SRB versus BIS |
Common equity tier 1 capital | | | | | | | | |
Common equity tier 1 capital | | 40,378 | 40,378 | 0 | | 30,044 | 30,044 | 0 |
Additional tier 1 capital | | | | | | | | |
High-trigger loss-absorbing capital | | 3,828 | 3,828 | 0 | | 3,828 | 3,828 | 0 |
Low-trigger loss-absorbing capital | | 353 | 353 | 0 | | 2,326 | 2,326 | 0 |
Total additional tier 1 capital | | 4,181 | 4,181 | 0 | | 6,154 | 6,154 | 0 |
Tier 1 capital | | 44,559 | 44,559 | 0 | | 36,198 | 36,198 | 0 |
Tier 2 capital | | | | | | | | |
High-trigger loss-absorbing capital | | 912 | 460 | 452 | | 912 | 460 | 452 |
Low-trigger loss-absorbing capital | | 10,325 | 10,325 | 0 | | 10,325 | 10,325 | 0 |
Phase-out capital and other tier 2 capital | | 996 | 1,198 | (202) | | | 202 | (202) |
Total tier 2 capital | | 12,233 | 11,983 | 250 | | 11,237 | 10,987 | 250 |
Total capital | | 56,792 | 56,542 | 250 | | 47,435 | 47,185 | 250 |
Common equity tier 1 capital ratio (%) | | 19.0 | 19.0 | 0.0 | | 14.5 | 14.5 | 0.0 |
Tier 1 capital ratio (%) | | 21.0 | 21.0 | 0.0 | | 17.4 | 17.4 | 0.0 |
Total capital ratio (%) | | 26.8 | 26.6 | 0.2 | | 22.9 | 22.7 | 0.2 |
Risk-weighted assets | | 212,302 | 212,302 | 0 | | 207,530 | 207,530 | 0 |
Risk, treasury and capital management
Capital management
Risk-weighted assets (UBS Group)
EDTF | Our risk-weighted assets (RWA) are the same under Swiss SRB and BIS rules. Moreover, RWA on a fully applied basis are the same as on a phase-in basis, except for differences related to defined benefit plans and deferred tax assets (DTAs) on temporary differences.
On a fully applied basis, any net defined benefit pension asset recognized in accordance with IAS 19 (revised) is fully deducted from CET1 capital. On a phase-in basis, the deduction of net defined benefit pension assets from capital is phased in, and the portion of the net defined benefit pension asset that is not yet deducted from CET1 capital is risk weighted at 100%.
On a fully applied basis, DTAs on temporary differences below the fully applied deduction threshold are risk weighted at 250%. On a phase-in basis, the amount that is risk weighted at 250% is higher due to the higher deduction threshold.
Due to the aforementioned differences, as of 31 December 2015, our phase-in RWA were CHF 4.8 billion higher than our fully applied RWA, entirely attributable to non-counterparty-related risk RWA.
RWA decreased by CHF 9.0 billion to CHF 207.5 billion on a fully applied basis as of 31 December 2015, below our short- to medium-term expectation of around CHF 250 billion. On a phase-in basis, RWA decreased by CHF 8.6 billion to CHF 212.3 billion as of 31 December 2015. The “Risk-weighted assets by exposure segment” and “Risk-weighted assets movement by key driver – fully applied” tables on the following pages provide additional granularity on RWA movements. ▲
® Refer to “Table 2: Detailed segmentation of exposures and risk-weighted assets” in the “UBS Group AG consolidated supplemental disclosures required under Basel III Pillar 3 regulations” section of this report for more information on gross and net exposure at default by exposure segment
EDTF | Pillar 3 |
Risk-weighted assets by exposure segment |
| | 31.12.15 |
CHF billion | | Wealth Management | Wealth Management Americas | Personal & Corporate Banking | Asset Manage- ment | Investment Bank | CC – Services | CC – Group ALM | CC – Non-core and Legacy Portfolio | Total RWA | Total capital requirement¹ |
Credit risk | | 12.6 | 8.5 | 32.9 | 1.7 | 35.5 | 1.3 | 5.0 | 6.9 | 104.4 | 13.2 |
Advanced IRB approach | | 8.5 | 3.4 | 31.2 | 1.0 | 32.0 | 0.2 | 3.9 | 5.0 | 85.2 | 10.8 |
Sovereigns | | 0.0 | 0.0 | 0.1 | 0.0 | 0.5 | 0.0 | 2.0 | 0.1 | 2.7 | 0.3 |
Banks | | 0.0 | 0.0 | 1.1 | 0.0 | 5.1 | 0.0 | 0.9 | 0.8 | 7.9 | 1.0 |
Corporates | | 0.5 | 0.0 | 15.1 | 0.0 | 23.5 | 0.0 | 1.0 | 1.7 | 41.8 | 5.3 |
Retail | | 7.4 | 3.3 | 13.6 | 0.0 | 0.0 | 0.0 | 0.0 | 0.0 | 24.2 | 3.1 |
Other² | | 0.6 | 0.1 | 1.4 | 1.0 | 2.9 | 0.1 | 0.1 | 2.3 | 8.6 | 1.1 |
Standardized approach | | 4.1 | 5.1 | 1.7 | 0.7 | 3.6 | 1.1 | 1.0 | 2.0 | 19.2 | 2.4 |
Sovereigns | | 0.2 | 0.0 | 0.0 | 0.0 | 0.0 | 0.0 | 0.0 | 0.0 | 0.3 | 0.0 |
Banks | | 0.1 | 0.4 | 0.1 | 0.1 | 0.1 | 0.1 | 0.0 | 0.2 | 1.1 | 0.1 |
Corporates | | 1.2 | 1.2 | 0.1 | 0.6 | 1.7 | 1.0 | 0.3 | 1.0 | 7.1 | 0.9 |
Central counterparties | | 0.0 | 0.0 | 0.0 | 0.0 | 1.8 | 0.0 | 0.7 | 0.3 | 2.8 | 0.4 |
Retail | | 2.3 | 3.4 | 0.1 | 0.0 | 0.0 | 0.0 | 0.0 | 0.0 | 5.8 | 0.7 |
Other² | | 0.3 | 0.1 | 1.4 | 0.0 | (0.1) | 0.0 | 0.0 | 0.4 | 2.1 | 0.3 |
Non-counterparty-related risk | | 0.1 | 0.0 | 0.1 | 0.0 | 0.1 | 20.5 | 0.0 | 0.0 | 20.7 | 2.6 |
Deferred tax assets recognized for temporary differences | | 0.0 | 0.0 | 0.0 | 0.0 | 0.0 | 12.9 | 0.0 | 0.0 | 12.9 | 1.6 |
Property, equipment and software | | 0.0 | 0.0 | 0.0 | 0.0 | 0.0 | 7.5 | 0.0 | 0.0 | 7.6 | 1.0 |
Other | | 0.1 | 0.0 | 0.0 | 0.0 | 0.0 | 0.0 | 0.0 | 0.0 | 0.2 | 0.0 |
Market risk | | 0.0 | 1.0 | 0.0 | 0.0 | 10.5 | (2.9)³ | 0.9 | 2.6 | 12.1 | 1.5 |
Value-at-risk (VaR) | | 0.0 | 0.2 | 0.0 | 0.0 | 1.6 | (0.8) | 0.1 | 0.4 | 1.5 | 0.2 |
Stressed value-at-risk (SVaR) | | 0.0 | 0.4 | 0.0 | 0.0 | 2.9 | (1.4) | 0.2 | 0.6 | 2.8 | 0.4 |
Add-on for risks-not-in-VaR | | 0.0 | 0.0 | 0.0 | 0.0 | 3.3 | 0.0 | 0.1 | 0.8 | 4.2 | 0.5 |
Incremental risk charge (IRC) | | 0.0 | 0.4 | 0.0 | 0.0 | 2.5 | (0.8) | 0.5 | 0.2 | 2.7 | 0.3 |
Comprehensive risk measure (CRM) | | 0.0 | 0.0 | 0.0 | 0.0 | 0.0 | 0.0 | 0.0 | 0.1 | 0.1 | 0.0 |
Securitization / re-securitization in the trading book | | 0.0 | 0.0 | 0.0 | 0.0 | 0.2 | 0.0 | 0.0 | 0.5 | 0.7 | 0.1 |
Operational risk | | 12.6 | 12.4 | 1.6 | 0.9 | 16.8 | 9.5 | 0.1 | 21.1 | 75.1 | 9.5 |
of which: incremental RWA⁴ | | 5.5 | 1.7 | 0.5 | 0.0 | 0.0 | 3.0 | 0.0 | 2.6 | 13.3 | 1.7 |
Total RWA, phase-in | 25.3 | 21.9 | 34.6 | 2.6 | 62.9 | 28.3 | 6.0 | 30.7 | 212.3 | 26.8 |
Phase-out items⁵ | | 0.0 | 0.0 | 0.0 | 0.0 | 0.0 | 4.7 | 0.0 | 0.0 | 4.8 | |
Total RWA, fully applied | 25.3 | 21.9 | 34.6 | 2.6 | 62.9 | 23.6 | 6.0 | 30.7 | 207.5 | |
1 Calculated based on our Swiss SRB total capital requirement of 12.6% of RWA. 2 Includes securitization / re-securitization exposures in the banking book, equity exposures in the banking book according to the simple risk weight method, credit valuation adjustments, settlement risk and business transfers. 3 Corporate Center - Services market risk RWA were negative, as they included the effect of portfolio diversification across businesses. 4 Incremental RWA reflect the effect of the supplemental operational risk capital analysis mutually agreed to by UBS and FINMA. 5 Phase-out items are entirely related to non-counterparty-related risk RWA. |
▲▲
Risk, treasury and capital management
Capital management
EDTF | Pillar 3 |
Risk-weighted assets by exposure segment (continued) |
| | 31.12.14 |
CHF billion | | Wealth Management | Wealth Management Americas | Personal & Corporate Banking | Asset Manage- ment | Investment Bank | CC – Services | CC – Group ALM | CC – Non-core and Legacy Portfolio | Total RWA | Total capital requirement¹ |
Credit risk | | 12.3 | 8.7 | 31.4 | 3.0 | 35.0 | 1.1 | 4.3 | 12.8 | 108.6 | 12.1 |
Advanced IRB approach | | 8.2 | 3.0 | 29.8 | 1.5 | 29.3 | 0.2 | 4.2 | 10.2 | 86.3 | 9.6 |
Sovereigns | | 0.0 | 0.0 | 0.1 | 0.0 | 0.7 | 0.0 | 0.4 | 0.1 | 1.3 | 0.1 |
Banks | | 0.0 | 0.0 | 1.1 | 0.0 | 3.7 | 0.1 | 1.7 | 1.4 | 8.1 | 0.9 |
Corporates | | 0.4 | 0.0 | 15.4 | 0.0 | 21.0 | 0.0 | 2.0 | 2.3 | 41.1 | 4.6 |
Retail | | 7.1 | 2.9 | 11.9 | 0.0 | 0.0 | 0.0 | 0.0 | 0.0 | 21.9 | 2.4 |
Other² | | 0.6 | 0.1 | 1.3 | 1.5 | 3.9 | 0.1 | 0.0 | 6.4 | 13.9 | 1.5 |
Standardized approach | | 4.1 | 5.7 | 1.7 | 1.5 | 5.7 | 0.9 | 0.1 | 2.6 | 22.3 | 2.5 |
Sovereigns | | 0.1 | 0.0 | 0.0 | 0.0 | 0.0 | 0.0 | 0.0 | 0.0 | 0.2 | 0.0 |
Banks | | 0.2 | 0.9 | 0.1 | 0.1 | 0.2 | 0.1 | 0.5 | 0.3 | 2.4 | 0.3 |
Corporates | | 1.1 | 3.0 | 0.3 | 1.4 | 1.8 | 0.8 | 1.2 | 1.0 | 10.6 | 1.2 |
Central counterparties | | 0.0 | 0.0 | 0.0 | 0.0 | 0.7 | 0.0 | 0.8 | 0.0 | 1.5 | 0.2 |
Retail | | 2.2 | 1.7 | 0.1 | 0.0 | 0.0 | 0.0 | 0.0 | 0.0 | 4.0 | 0.4 |
Other² | | 0.5 | 0.1 | 1.1 | 0.0 | 3.0 | 0.0 | (2.5) | 1.3 | 3.6 | 0.4 |
Non-counterparty-related risk | | 0.6 | 0.2 | 1.4 | 0.1 | 0.3 | 16.4 | 0.0 | 0.0 | 19.1 | 2.1 |
Deferred tax assets on temporary differences | | 0.0 | 0.0 | 0.0 | 0.0 | 0.0 | 8.9 | 0.0 | 0.0 | 8.9 | 1.0 |
Property, equipment and software | | 0.0 | 0.0 | 0.0 | 0.0 | 0.1 | 6.6 | 0.0 | 0.0 | 6.8 | 0.8 |
Other³ | | 0.6 | 0.2 | 1.4 | 0.1 | 0.3 | 0.9 | 0.0 | 0.0 | 3.4 | 0.4 |
Market risk | | 0.0 | 1.0 | 0.0 | 0.0 | 13.6 | (4.5)⁴ | 2.7 | 3.6 | 16.5 | 1.8 |
Value-at-risk (VaR) | | 0.0 | 0.2 | 0.0 | 0.0 | 1.8 | (1.0) | 0.5 | 0.5 | 2.0 | 0.2 |
Stressed value-at-risk (SVaR) | | 0.0 | 0.5 | 0.0 | 0.0 | 4.0 | (2.4) | 1.2 | 0.8 | 4.1 | 0.5 |
Add-on for risks-not-in-VaR | | 0.0 | 0.0 | 0.0 | 0.0 | 5.0 | 0.0 | 0.1 | 0.9 | 5.9 | 0.7 |
Incremental risk charge (IRC) | | 0.0 | 0.3 | 0.0 | 0.0 | 2.5 | (1.1) | 1.0 | 0.4 | 3.0 | 0.3 |
Comprehensive risk measure (CRM) | | 0.0 | 0.0 | 0.0 | 0.0 | 0.0 | 0.0 | 0.0 | 0.1 | 0.1 | 0.0 |
Securitization / re-securitization in the trading book | | 0.0 | 0.0 | 0.0 | 0.0 | 0.3 | 0.0 | 0.0 | 1.0 | 1.3 | 0.1 |
Operational risk | | 12.9 | 11.9 | 1.6 | 0.8 | 18.1 | 12.1 | 0.1 | 19.3 | 76.7 | 8.5 |
of which: incremental RWA⁵ | | 5.5 | 1.7 | 0.5 | 0.0 | 1.2 | 6.0 | 0.0 | 2.6 | 17.5 | 1.9 |
Total RWA, phase-in | | 25.8 | 21.9 | 34.4 | 3.9 | 67.0 | 25.1 | 7.1 | 35.7 | 220.9 | 24.6 |
Phase-out items⁶ | | 0.4 | 0.2 | 1.4 | 0.1 | 0.2 | 2.1 | 0.0 | 0.0 | 4.4 | |
Total RWA, fully applied | | 25.4 | 21.7 | 33.1 | 3.8 | 66.7 | 23.0 | 7.1 | 35.7 | 216.5 | |
1 Calculated based on our Swiss SRB total capital requirement of 11.1% of RWA. 2 Includes securitization / re-securitization exposures in the banking book, equity exposures in the banking book according to the simple risk weight method, credit valuation adjustments, settlement risk and business transfers. 3 Primarily relates to defined benefit plans. 4 Corporate Center - Services market risk RWA were negative, as they included the effect of portfolio diversification across businesses. 5 Incremental RWA reflect the effect of the supplemental operational risk capital analysis mutually agreed to by UBS and FINMA. 6 Phase-out items are entirely related to non-counterparty-related risk RWA. |
▲▲
EDTF | Pillar 3 |
Risk-weighted assets by exposure segment (continued) |
| | 31.12.15 vs. 31.12.14 |
CHF billion | | Wealth Management | Wealth Management Americas | Personal & Corporate Banking | Asset Manage- ment | Investment Bank | CC – Services | CC – Group ALM | CC – Non-core and Legacy Portfolio | Total RWA |
Credit risk | | 0.3 | (0.2) | 1.5 | (1.3) | 0.5 | 0.2 | 0.7 | (5.9) | (4.2) |
Advanced IRB approach | | 0.3 | 0.4 | 1.4 | (0.5) | 2.7 | 0.0 | (0.3) | (5.2) | (1.1) |
Sovereigns | | 0.0 | 0.0 | 0.0 | 0.0 | (0.2) | 0.0 | 1.6 | 0.0 | 1.4 |
Banks | | 0.0 | 0.0 | 0.0 | 0.0 | 1.4 | (0.1) | (0.8) | (0.6) | (0.2) |
Corporates | | 0.1 | 0.0 | (0.3) | 0.0 | 2.5 | 0.0 | (1.0) | (0.6) | 0.7 |
Retail | | 0.3 | 0.4 | 1.7 | 0.0 | 0.0 | 0.0 | 0.0 | 0.0 | 2.3 |
Other | | 0.0 | 0.0 | 0.1 | (0.5) | (1.0) | 0.0 | 0.1 | (4.1) | (5.3) |
Standardized approach | | 0.0 | (0.6) | 0.0 | (0.8) | (2.1) | 0.2 | 0.9 | (0.6) | (3.1) |
Sovereigns | | 0.1 | 0.0 | 0.0 | 0.0 | 0.0 | 0.0 | 0.0 | 0.0 | 0.1 |
Banks | | (0.1) | (0.5) | 0.0 | 0.0 | (0.1) | 0.0 | (0.5) | (0.1) | (1.3) |
Corporates | | 0.1 | (1.8) | (0.2) | (0.8) | (0.1) | 0.2 | (0.9) | 0.0 | (3.5) |
Central counterparties | | 0.0 | 0.0 | 0.0 | 0.0 | 1.1 | 0.0 | (0.1) | 0.3 | 1.3 |
Retail | | 0.1 | 1.7 | 0.0 | 0.0 | 0.0 | 0.0 | 0.0 | 0.0 | 1.8 |
Other | | (0.2) | 0.0 | 0.3 | 0.0 | (3.1) | 0.0 | 2.5 | (0.9) | (1.5) |
Non-counterparty-related risk | | (0.5) | (0.2) | (1.3) | (0.1) | (0.2) | 4.1 | 0.0 | 0.0 | 1.6 |
Deferred tax assets on temporary differences | | 0.0 | 0.0 | 0.0 | 0.0 | 0.0 | 4.0 | 0.0 | 0.0 | 4.0 |
Property, equipment and software | | 0.0 | 0.0 | 0.0 | 0.0 | (0.1) | 0.9 | 0.0 | 0.0 | 0.8 |
Other | | (0.5) | (0.2) | (1.4) | (0.1) | (0.3) | (0.9) | 0.0 | 0.0 | (3.2) |
Market risk | | 0.0 | 0.0 | 0.0 | 0.0 | (3.1) | 1.6 | (1.8) | (1.0) | (4.4) |
Value-at-risk (VaR) | | 0.0 | 0.0 | 0.0 | 0.0 | (0.2) | 0.2 | (0.4) | (0.1) | (0.5) |
Stressed value-at-risk (SVaR) | | 0.0 | (0.1) | 0.0 | 0.0 | (1.1) | 1.0 | (1.0) | (0.2) | (1.3) |
Add-on for risks-not-in-VaR | | 0.0 | 0.0 | 0.0 | 0.0 | (1.7) | 0.0 | 0.0 | (0.1) | (1.7) |
Incremental risk charge (IRC) | | 0.0 | 0.1 | 0.0 | 0.0 | 0.0 | 0.3 | (0.5) | (0.2) | (0.3) |
Comprehensive risk measure (CRM) | | 0.0 | 0.0 | 0.0 | 0.0 | 0.0 | 0.0 | 0.0 | 0.0 | 0.0 |
Securitization / re-securitization in the trading book | | 0.0 | 0.0 | 0.0 | 0.0 | (0.1) | 0.0 | 0.0 | (0.5) | (0.6) |
Operational risk | | (0.3) | 0.5 | 0.0 | 0.1 | (1.3) | (2.6) | 0.0 | 1.8 | (1.6) |
of which: incremental RWA | | 0.0 | 0.0 | 0.0 | 0.0 | (1.2) | (3.0) | 0.0 | 0.0 | (4.2) |
Total RWA, phase-in | | (0.5) | 0.0 | 0.2 | (1.3) | (4.1) | 3.2 | (1.1) | (5.0) | (8.6) |
Phase-out items | | (0.4) | (0.2) | (1.4) | (0.1) | (0.2) | 2.6 | 0.0 | 0.0 | 0.4 |
Total RWA, fully applied | | (0.1) | 0.2 | 1.5 | (1.2) | (3.8) | 0.6 | (1.1) | (5.0) | (9.0) |
▲▲
Risk, treasury and capital management
Capital management
EDTF | Pillar 3 |
Risk-weighted assets movement by key driver – fully applied |
CHF billion | Wealth Management | Wealth Management Americas | Personal & Corporate Banking | Asset Management | Investment Bank | CC - Services | CC - Group ALM | CC – Non-core and Legacy Portfolio | Group |
Total RWA as of 31.12.14 | 25.4 | 21.7 | 33.1 | 3.8 | 66.7 | 23.0 | 7.1 | 35.7 | 216.5 |
Credit risk RWA movement during the year 2015: | 0.3 | (0.2) | 1.5 | (1.3) | 0.5 | 0.2 | 0.7 | (5.9) | (4.2) |
Methodology and policy changes | 0.5 | 0.0 | 2.3 | 0.0 | 3.4 | 0.0 | 0.9 | 0.0 | 7.1 |
Model updates | 0.0 | 0.0 | 0.5 | 0.0 | 0.0 | 0.0 | 0.0 | 0.0 | 0.5 |
Acquisitions and disposals of business operations | 0.0 | 0.0 | 0.0 | (0.8) | 0.0 | 0.0 | 0.0 | 0.0 | (0.8) |
Credit quality | 0.0 | 0.0 | 0.0 | 0.0 | 0.0 | 0.0 | 0.0 | 0.8 | 0.7 |
Asset size | 0.0 | (0.3) | (1.1) | (0.4) | (2.2) | 0.5 | (0.3) | (6.1) | (9.9) |
Foreign exchange movements | (0.3) | 0.0 | (0.1) | (0.1) | (0.7) | (0.3) | 0.1 | (0.6) | (2.0) |
Non-counterparty-related risk RWA movement during the year 2015: | (0.1) | 0.0 | 0.0 | 0.0 | (0.1) | 1.4 | 0.0 | 0.0 | 1.4 |
Exposure movements | (0.1) | 0.0 | 0.0 | 0.0 | 0.0 | 1.5 | 0.0 | 0.1 | 1.5 |
Foreign exchange movements | 0.0 | 0.0 | 0.0 | 0.0 | 0.0 | (0.1) | 0.0 | (0.1) | (0.1) |
Market risk RWA movement during the year 2015: | 0.0 | 0.0 | 0.0 | 0.0 | (3.1) | 1.6¹ | (1.8) | (1.0) | (4.4) |
Methodology changes | 0.0 | 0.0 | 0.0 | 0.0 | 0.0 | 0.0 | 0.0 | 0.0 | 0.0 |
Model updates | 0.0 | 0.0 | 0.0 | 0.0 | (1.5) | 1.5 | 0.0 | 0.1 | 0.1 |
Regulatory add-ons | 0.0 | 0.0 | 0.0 | 0.0 | (0.6) | 0.1 | 0.0 | 0.5 | 0.0 |
Movement in risk levels | 0.0 | 0.0 | 0.0 | 0.0 | (1.0) | (0.1) | (1.8) | (1.6) | (4.5) |
Operational risk RWA movement during the year 2015: | (0.3) | 0.5 | 0.0 | 0.1 | (1.3) | (2.6) | 0.0 | 1.8 | (1.6) |
Incremental operational risk | 0.0 | 0.0 | 0.0 | 0.0 | (1.2) | (3.0) | 0.0 | 0.0 | (4.2) |
Other model updates | (0.2) | 0.5 | 0.0 | 0.1 | (0.1) | 0.3 | 0.1 | 1.8 | 2.6 |
Total movement | (0.1) | 0.2 | 1.5 | (1.2) | (3.8) | 0.6 | (1.1) | (5.0) | (9.0) |
Total RWA as of 31.12.15 | 25.3 | 21.9 | 34.6 | 2.6 | 62.9 | 23.6 | 6.0 | 30.7 | 207.5 |
1 Includes the effect of portfolio diversification across businesses. |
▲▲
RWA development in 2015
EDTF | Refer to “Definition of key RWA movement driver categories” in this section for information about the definition of key driver categories and underlying judgments and assumptions.
Credit risk
Credit risk RWA decreased by CHF 4.2 billion to CHF 104.4 billion as of 31 December 2015. The decrease was mainly driven by asset size reductions of CHF 9.9 billion and currency effects of CHF 2.0 billion, partly offset by a CHF 7.6 billion effect from methodology and policy changes mandated by our regulator.
Asset size
The decrease in credit risk RWA due to asset size reductions of CHF 9.9 billion was driven by decreases in Corporate Center – Non-core and Legacy Portfolio, the Investment Bank and Personal & Corporate Banking.
A decrease of CHF 6.1 billion in Corporate Center – Non-core and Legacy Portfolio was mainly due to a decrease of CHF 1.3 billion in credit risk RWA from derivative exposures within the Banks and Corporates exposure segments, mainly due to derivative trade unwinds and novations as part of our ongoing reduction activity, as well as a corresponding decrease of CHF 2.6 billion, reported within the category “Other,” due to lower advanced and standardized credit valuation adjustments (CVAs). A further decrease of CHF 1.7 billion resulted from the sale of banking book securitization positions.
In the Investment Bank, a decrease in asset size of CHF 2.2 billion within the category “Other” was mainly due to client-driven exposure reductions, primarily in derivatives, resulting in lower advanced and standardized credit valuation adjustments (CVAs).
In addition, credit risk RWA decreased by CHF 1.1 billion in Personal & Corporate Banking, mainly due to lower client activity in 2015, resulting in a reduction in loan exposures.
Methodology and policy changes
The increase in credit risk RWA from methodology and policy changes of CHF 7.6 billion was driven by an additional CHF 3.4 billion from an increase in the internal ratings-based multiplier on Investment Bank exposures to corporates, and by an additional CHF 2.8 billion in Personal & Corporate Banking resulting from an increase in the multipliers on income-producing real estate and Swiss residential mortgages, with an effect of CHF 1.0 billion and CHF 1.8 billion, respectively.
Credit quality
A reduction in credit hedges in Corporate Center – Non-core and Legacy Portfolio resulted in an increase in credit risk RWA of CHF 0.8 billion.
Acquisitions and disposals of business operations
The decrease of CHF 0.8 billion in credit risk RWA in Asset Management was related to the disposal of our Alternative Fund Services business.
Non-counterparty-related risk
Phase-in non-counterparty-related risk RWA increased by CHF 1.6 billion to CHF 20.7 billion. This was mainly due to an increase of CHF 4.1 billion in Corporate Center – Services, driven by additional DTAs on temporary differences, as well as property, equipment and software recognized in the year. This was partly offset by decreases of CHF 1.4 billion, CHF 0.9 billion and CHF 0.5 billion in Personal & Corporate Banking, Corporate Center – Services and Wealth Management, respectively, driven by the accelerated application of the IAS 19 (revised) treatment of defined benefit plans.
Fully applied non-counterparty-related risk RWA increased by CHF 1.4 billion to CHF 15.9 billion, driven by the increase in DTAs on temporary differences and property, equipment and software as noted above.
® Refer to the “Group performance” section of this report for more information on deferred tax assets
Market risk
Market risk RWA decreased by CHF 4.4 billion to CHF 12.1 billion. The decrease was mainly due to reductions in value-at-risk (VaR) and stressed VaR of CHF 0.5 billion and CHF 1.3 billion, respectively, related to lower exposure in the 60-day average calculation, as well as a corresponding decrease of CHF 1.7 billion in the add-on for risks-not-in-VaR. These decreases were driven by risk reductions due to market movements, primarily within Group ALM and the Investment Bank, as well as actively reduced securitization and re-securitization exposures in Corporate Center – Non-core and Legacy portfolio.
® Refer to the “Risk management and control” section of this report for more information on market risk developments, including stressed VaR and the risks-not-in-VaR framework
Operational risk
Operational risk RWA decreased by CHF 1.6 billion to CHF 75.1 billion. Incremental operational risk RWA based on the supplemental operational risk capital analysis mutually agreed to by UBS and FINMA decreased by CHF 4.2 billion to CHF 13.3 billion as of 31 December 2015. Of this decrease, CHF 3.0 billion was attributable to Corporate Center – Services and CHF 1.2 billion to the Investment Bank. This effect was partly offset by a CHF 2.6 billion increase in operational risk RWA, mainly arising from an update to the parameters of our advanced measurement approach model used for the calculation of operational risk capital during 2015. ▲
Risk, treasury and capital management
Capital management
EDTF | Definition of key RWA movement driver categories
We employ a range of analyses in our RWA monitoring framework to identify the key drivers of movements in the positions. This includes a top-down identification approach for several sub-components of the RWA movement, leveraging information available from our monthly detailed calculation, substantiation and control processes. Particular attention is paid to identifying and segmenting items within the day-to-day control of the business and those items that are driven by changes in risk models or methodology.
Movements | | Key driver description |
Credit risk RWA movements | | |
Methodology and policy changes | | Represents RWA movements due to methodological changes in calculations driven by regulatory policy changes, including revisions to existing regulations, new regulations and add-ons mandated by our regulator. The effect of methodology and policy changes on RWA is estimated based on the portfolio at the time of the implementation of the change. |
Model updates | | Represents RWA movements arising from the implementation of new models and from parameter changes to existing models. The RWA effect of model updates is estimated based on the portfolio at the time of the implementation of the change. |
Acquisitions and disposals of business operations
| | Represents the movement in RWA as a result of the disposal or acquisition of business operations, quantified based on the credit risk exposures as at the end of the month preceding a disposal or following an acquisition. Acquisitions and disposals of exposures in the ordinary course of business are reflected under asset size. |
Credit quality | | Represents RWA movements resulting from changes in the underlying credit quality of counterparties. These are caused by changes to risk parameters which arise from actions such as, but not limited to, change in counterparty ratings, loss given default or changes in credit hedges. |
Asset size | | Represents all RWA movements that are not attributable to the other key drivers. This includes movements arising in the normal course of business, such as growth in credit exposures or reduction in asset size from sales and write-offs. The amounts reported for each business division and Corporate Center unit may also include the effect of transfers and allocations of exposures between business divisions reflected in the period. |
Foreign exchange movements | | Represents RWA movements as a result of changes in exchange rates of the transaction currencies versus the Swiss franc. |
Non-counterparty-related risk RWA movements | | |
Exposure movements | | Represents RWA movements arising from changes in deferred tax assets on temporary differences as well as from the purchase or sale of property, equipment, software and other underlying exposures. |
Foreign exchange movements | | Represents RWA movements as a result of changes in exchange rates of the transaction currencies versus the Swiss franc. |
Market risk RWA movements | | |
Methodology changes | | Represents methodology changes to the calculation driven by regulatory and internal policy decisions. In some cases, the effects of methodology changes are assessed at the time of implementation, and may not reflect the effects for the entire year. Moreover, methodology changes may, on occasion, be implemented at the same time as parameter updates and changes in regulatory add-ons, the effects of which cannot be fully disaggregated. |
Model updates | | Includes routine updates to model parameters such as the roll-forward of the five-year historical data used for VaR. The effect of each parameter update, assessed at the point of implementation, has been used to approximate the combined effect over the year. |
Regulatory add-ons | | Represents the “Risks-not-in-VaR” add-on described in the “Risk management and control” section of this report. The effect of recalibrations are calculated by applying the old and new multiplication factors to the year-end VaR and SVaR-based RWA. |
Movement in risk levels | | Represents changes as a result of movements in risk levels that are derived after accounting for the movements in the abovementioned three specific drivers. This includes changes in positions, effects of market moves on risk levels and currency translation effects. The amounts reported for each business division and Corporate Center unit may also include the effect of transfers and allocations of exposures between business divisions reflected in the period. |
Operational risk RWA movements | | |
Incremental operational risk | | Represents RWA movements relating to changes in the incremental operational risk RWA based on the supplemental operational risk capital analysis mutually agreed to by UBS and FINMA. |
Other model updates | | Represents RWA movements arising from the regular update of the parameters of our advanced measurement approach (AMA) model. |
▲
Risk, treasury and capital management
Capital management
Leverage ratio framework

EDTF | In November 2014, FINMA published the circular “Leverage ratio – banks”, which aligned the calculation of the leverage ratio denominator (LRD) with the rules issued by the Bank for International Settlements (BIS) in the “Basel III leverage ratio framework and disclosure requirements” document issued in January 2014.
Effective 31 December 2015, we implemented the guidance of this FINMA circular, ahead of its mandatory effective date of 1 January 2016. The Swiss SRB leverage ratio and Swiss SRB LRD for periods prior to 31 December 2015 are calculated in accordance with the former Swiss SRB denominator definition and are therefore not fully comparable with 31 December 2015 figures. However, comparable figures as of 1 January 2015 are provided on a pro forma basis at the Group level.
The new Swiss SRB leverage ratio is calculated by dividing the sum of period-end CET1, AT1 and other loss-absorbing capital by the period-end BIS leverage ratio denominator (LRD). There is no change to the calculation of the leverage ratio numerator under the new Swiss SRB rules. Under BIS rules, only CET1 and AT1 capital are included in the numerator, whereas under Swiss SRB rules, other loss-absorbing capital is also included.
The BIS LRD consists of IFRS on-balance sheet assets and off-balance sheet items. Derivative exposures are adjusted for a number of items, including replacement value and eligible cash variation margin netting, the current exposure method add-on and net notional amounts for written credit derivatives. Moreover, the BIS LRD includes an additional charge for counterparty credit risk related to securities financing transactions.
The transition to the new Swiss SRB LRD rules resulted in an overall reduction of our LRD calculated on a spot basis, mainly due to positive effects from off-balance sheet items, as well as from changes in the scope of consolidation. These positive effects were partly offset by the effect of more stringent requirements on the treatment of securities financing transactions and derivative exposures.
In line with FINMA disclosure requirements, we disclose both the new Swiss SRB leverage ratio and the BIS leverage ratio.
The Swiss SRB leverage ratio requirement is equal to 24% of the capital ratio requirements, excluding the countercyclical buffer requirement. As of 31 December 2015, the effective total leverage ratio requirement was 3.0%. Our CET1 capital covered the leverage ratio requirements for the base and buffer capital components and the low-trigger loss-absorbing capital satisfied our leverage ratio requirement for the progressive buffer component. In addition, high-trigger loss-absorbing capital is included in the buffer capital component for UBS Group. ▲
® Refer to the “Legal entity financial and regulatory information” section of this report for more information on leverage ratio requirements on a legal entity level
Proposed changes to leverage ratio requirements
As previously noted, in December 2015, the Swiss Federal Department of Finance published for consultation a draft revised TBTF ordinance based on the cornerstones announced by the Swiss Federal Council in October 2015. In line with the announced cornerstones, the proposal would revise the capital and leverage ratio requirements for Swiss systemically relevant banks and includes new gone concern requirements.
® Refer to the “Regulatory and legal developments” section of this report for more information on the proposed revisions to the Swiss TBTF framework
EDTF |
Swiss SRB leverage ratio requirements and information (phase-in) |
| | Swiss SRB leverage ratio (%) | | Swiss SRB leverage ratio capital |
| | Requirement¹ | | Actual²˒³˒⁴ | | Requirement | | Eligible²˒³˒⁴ |
CHF million, except where indicated | | 31.12.15 | | 31.12.15 | 31.12.14 | | 31.12.15 | | 31.12.15 | 31.12.14 |
Base capital (common equity tier 1 capital) | | 1.1 | | 1.1 | 1.0 | | 9,763 | | 9,763 | 9,647 |
Buffer capital (common equity tier 1 capital and high-trigger loss-absorbing capital) | | 1.2⁵ | | 3.9 | 3.3 | | 11,119 | | 35,354 | 33,216 |
Progressive buffer capital (low-trigger loss-absorbing capital) | | 0.7 | | 1.2 | 1.1 | | 6,143 | | 10,679 | 11,398 |
Total | | 3.0 | | 6.2 | 5.4 | | 27,026 | | 55,796 | 54,260 |
1 Requirements for base capital (24% of 4.5%), buffer capital (24% of 5.1%) and progressive buffer capital (24% of 2.8%). The total leverage ratio requirement of 3.0% is the current phase-in requirement according to the Swiss Capital Adequacy Ordinance. In addition, FINMA defined a total leverage ratio target of 3.5%, which will be effective until it is exceeded by the Swiss SRB phase-in requirement. 2 Swiss SRB CET1 capital exceeding the base capital requirement is allocated to the buffer capital. 3 Since 31 March 2015, high-trigger loss-absorbing capital (LAC) is included in the buffer capital. As of 31 December 2014, high-trigger LAC was included in the progressive buffer capital. 4 The leverage ratio denominator (LRD) used to calculate the requirements is calculated in accordance with Swiss SRB rules. From 31 December 2015 onward, these are fully aligned to the BIS Basel III rules and the LRD is reported on a spot basis. Prior to the alignment to BIS rules, the LRD was calculated based on former FINMA rules and reported on a 3-month average basis. 5 CET1 capital can be substituted by high-trigger LAC up to 0.5% in 2015. |
▲
Risk, treasury and capital management
Capital management
Leverage ratio information
Swiss SRB leverage ratio
As of 31 December 2015, our Swiss SRB leverage ratio was 5.3% on a fully applied basis and 6.2% on a phase-in basis. The fully-applied LRD decreased by CHF 80 billion to CHF 898 billion from the pro forma comparative number of CHF 978 billion as of 1 January 2015 and was below our short- to medium-term expectation of around CHF 950 billion. The decrease during 2015 mainly reflected incremental netting and collateral mitigation benefits of CHF 39 billion, currency effects of CHF 24 billion and a decrease of CHF 13 billion related to other methodology changes. Additional reductions totaling CHF 5 billion were due to changes in book size and other effects.
The decrease in LRD related to improvements in incremental netting and collateral mitigation benefits mainly reflected improved netting of long and short written credit derivative positions, as well as increased netting of eligible cash variation margin. In the aggregate, these changes resulted in CHF 22 billion lower derivative exposures. In addition, counterparty credit risk for securities financing transactions decreased by CHF 14 billion due to the consideration of incremental collateral.
The methodology changes that contributed to a decrease in LRD relate to the exclusion of uncommitted security-based lending credit facilities in our wealth management businesses, following a reassessment that we are not committed to extend credit under these contracts. Moreover, it included the effect from a reassessment of the treatment of forward-starting transactions.
® Refer to the “Balance sheet” section of this report for more information on balance sheet movements
EDTF |
Swiss SRB leverage ratio¹ | | | | | | |
| | Swiss SRB (new) | | Swiss SRB (former) |
CHF million, except where indicated | | As of 31.12.15 | | Pro forma as of 1.1.15 | | Average 4Q14 |
Total IFRS assets | | 942,819 | | 1,062,478 | | 1,057,361 |
Difference between IFRS and regulatory scope of consolidation² | | (16,763) | | (18,602) | | (18,525) |
Less derivative exposures and securities financing transactions³ | | (300,834) | | (396,295) | | (394,192) |
On-balance sheet exposures (excluding derivative exposures and securities financing transactions) | | 625,222 | | 647,581 | | 644,644 |
Derivative exposures³ | | 128,866 | | 161,415 | | 169,267 |
Securities financing transactions³ | | 120,086 | | 135,707 | | 97,905 |
Off-balance sheet items | | 41,132 | | 54,839 | | 88,750 |
Other adjustments⁴ | | | | | | 19,184 |
Items deducted from Swiss SRB tier 1 capital, phase-in | | (11,291) | | (14,879) | | (14,879) |
Total exposures (leverage ratio denominator), phase-in⁵ | | 904,014 | | 984,663 | | 1,004,869 |
Additional items deducted from Swiss SRB tier 1 capital, fully applied | | (6,407) | | (7,047) | | (7,047) |
Total exposures (leverage ratio denominator), fully applied⁵ | | 897,607 | | 977,617 | | 997,822 |
| | | | | | |
Phase-in | | 31.12.15 | | 31.12.14 | | 31.12.14 |
Common equity tier 1 capital | | 40,378 | | 42,863 | | 42,863 |
Loss-absorbing capital | | 15,418 | | 11,398 | | 11,398 |
Common equity tier 1 capital including loss-absorbing capital | | 55,796 | | 54,260 | | 54,260 |
Swiss SRB leverage ratio (%) | | 6.2 | | 5.5 | | 5.4 |
| | | | | | |
Fully applied | | 31.12.15 | | 31.12.14 | | 31.12.14 |
Common equity tier 1 capital | | 30,044 | | 28,941 | | 28,941 |
Loss-absorbing capital | | 17,391 | | 11,865 | | 11,865 |
Common equity tier 1 capital including loss-absorbing capital | | 47,435 | | 40,806 | | 40,806 |
Swiss SRB leverage ratio (%) | | 5.3 | | 4.2 | | 4.1 |
1 Calculated in accordance with Swiss SRB rules. From 31 December 2015 onward, the Swiss SRB leverage ratio denominator (LRD) calculation is fully aligned to the BIS Basel III rules and the LRD is reported on a spot basis. For comparison purposes, the equivalent number for 1 January 2015 is provided on a pro forma basis. Prior to the alignment to BIS rules, the LRD was calculated based on former FINMA rules and reported on a 3-month average basis and is therefore not fully comparable to the LRD reported for 31 December 2015, although the presentation format was aligned. 2 Represents the difference between the IFRS and the regulatory scope of consolidation, which is the applicable scope for the LRD calculation. 3 Consists of positive replacement values, cash collateral receivables on derivative instruments, cash collateral on securities borrowed, reverse repurchase agreements, margin loans and prime brokerage receivables related to securities financing transactions in accordance with the regulatory scope of consolidation, which are presented separately under derivative exposures and securities financing transactions in this table. 4 Includes assets of entities consolidated under IFRS but not in regulatory scope of consolidation, which were included under the former Swiss SRB LRD calculation rules. 5 In accordance with former Swiss SRB LRD calculation rules, the leverage ratio denominator excludes forward starting repos, securities lending indemnifications and CEM add-ons for exchange-traded derivatives (ETD), both proprietary and agency transactions, and for OTC derivatives with a qualifying central counterparty. |
▲
EDTF |
Changes in fully applied leverage ratio denominator by key driver¹ |
CHF billion | | Pro forma LRD as of 1.1.15 | Currency effects | Incremental netting and collateral mitigation | Other methodology changes | Book size and other | LRD as of 31.12.15 |
On-balance sheet exposures (excluding derivative exposures and securities financing transactions)² | | 648 | (11) | (4) | | (8) | 625 |
Derivative exposures² | | 161 | (9) | (22) | | (1) | 129 |
Securities financing transactions² | | 136 | (3) | (14) | | 1 | 120 |
Off-balance sheet items | | 55 | (1) | | (13) | | 41 |
Deduction items | | (22) | | | | 4 | (18) |
Total | | 978 | (24) | (39) | (13) | (5) | 898 |
1 The leverage ratio denominator (LRD) is calculated in accordance with Swiss SRB rules based on the regulatory scope of consolidation. From 31 December 2015 onward, these are fully aligned to the BIS Basel III rules and the LRD is reported on a spot basis. This table compares the 31 December 2015 LRD with the equivalent 1 January 2015 LRD, provided on a pro forma basis. 2 Excludes positive replacement values, cash collateral receivables on derivative instruments, cash collateral on securities borrowed, reverse repurchase agreements, margin loans and prime brokerage receivables related to securities financing transactions, which are presented separately under derivative exposures and securities financing transactions in this table. |
▲
Risk, treasury and capital management
Capital management
EDTF |
Leverage ratio denominator by business division and Corporate Center unit¹ |
| | As of 31.12.15 |
CHF billion | | Wealth Management | Wealth Management Americas | Personal & Corporate Banking | Asset Management | Investment Bank | CC – Services | CC – Group ALM | CC – Non-Core and Legacy Portfolio | Total LRD |
Total IFRS assets | | 119.9 | 61.0 | 141.2 | 12.9 | 253.5 | 22.6 | 237.5 | 94.4 | 942.8 |
Difference between IFRS and regulatory scope of consolidation² | | (6.0) | (0.2) | 0.0 | (10.2) | (0.7) | 0.0 | 0.3 | 0.0 | (16.8) |
Less derivative exposures and securities financing transactions³ | | (2.0) | (1.8) | (2.7) | 0.0 | (139.4) | 0.0 | (67.0) | (87.9) | (300.8) |
On-balance sheet exposures (excluding derivative exposures and securities financing transactions) | | 111.8 | 59.0 | 138.5 | 2.7 | 113.5 | 22.5 | 170.8 | 6.5 | 625.2 |
Derivative exposures³ | | 4.0 | 1.7 | 3.5 | 0.0 | 81.8 | 0.0 | 1.5 | 36.3 | 128.9 |
Securities financing transactions³ | | 0.0 | 1.1 | 0.0 | 0.0 | 48.6 | 0.0 | 67.8 | 2.5 | 120.1 |
Off-balance sheet items | | 3.2 | 1.0 | 11.9 | 0.0 | 24.1 | 0.0 | 0.0 | 0.8 | 41.1 |
Items deducted from Swiss SRB tier 1 capital, phase-in | | | | | | | (11.3) | | | (11.3) |
Total exposures (leverage ratio denominator), phase-in | | 119.0 | 62.9 | 153.8 | 2.7 | 268.0 | 11.3 | 240.2 | 46.2 | 904.0 |
Additional items deducted from Swiss SRB tier 1 capital, fully applied | | | | | | | (6.4) | | | (6.4) |
Total exposures (leverage ratio denominator), fully applied | | 119.0 | 62.9 | 153.8 | 2.7 | 268.0 | 4.8 | 240.2 | 46.2 | 897.6 |
| | | | | | | | | | |
| | Average 4Q14 |
CHF billion | | Wealth Management | Wealth Management Americas | Personal & Corporate Banking | Asset Management | Investment Bank | CC – Services | CC – Group ALM | CC – Non-Core and Legacy Portfolio | Total LRD |
Total IFRS assets | | 127.6 | 54.4 | 143.8 | 14.8 | 291.5 | 19.4 | 236.3 | 169.6 | 1,057.4 |
Difference between IFRS and regulatory scope of consolidation² | | (6.5) | (0.3) | 0.0 | (11.2) | (0.7) | (0.1) | 0.3 | 0.0 | (18.5) |
Less derivative exposures and securities financing transactions³ | | (2.9) | (1.6) | (2.6) | (0.2) | (155.2) | 0.0 | (78.7) | (153.0) | (394.2) |
On-balance sheet exposures (excluding derivative exposures and securities financing transactions) | | 118.2 | 52.5 | 141.2 | 3.5 | 135.5 | 19.2 | 157.9 | 16.6 | 644.6 |
Derivative exposures³ | | 4.0 | 0.9 | 3.4 | 0.2 | 74.5 | 0.0 | 14.2 | 72.0 | 169.3 |
Securities financing transactions³ | | 0.0 | 0.7 | 0.0 | 0.0 | 32.8 | 0.0 | 64.0 | 0.5 | 97.9 |
Off-balance sheet items | | 9.5 | 9.0 | 21.2 | 0.0 | 44.5 | 0.0 | 0.0 | 4.4 | 88.7 |
Other adjustments⁴ | | 6.6 | 0.2 | 0.1 | 11.2 | 0.9 | 0.0 | 0.2 | 0.0 | 19.2 |
Items deducted from Swiss SRB tier 1 capital, phase-in | | | | | | | (14.9) | | | (14.9) |
Total exposures (leverage ratio denominator), phase-in⁵ | | 138.3 | 63.3 | 165.9 | 14.9 | 288.3 | 4.5 | 236.3 | 93.4 | 1,004.9 |
Additional items deducted from Swiss SRB tier 1 capital, fully applied | | | | | | | (7.0) | | | (7.0) |
Total exposures (leverage ratio denominator), fully applied⁵ | | 138.3 | 63.3 | 165.9 | 14.9 | 288.3 | (2.6) | 236.3 | 93.4 | 997.8 |
1 Calculated in accordance with Swiss SRB rules. From 31 December 2015 onward, the Swiss SRB leverage ratio denominator (LRD) calculation is fully aligned to the BIS Basel III rules and the LRD is reported on a spot basis. Prior to the alignment to BIS rules, the LRD was calculated based on former FINMA rules and reported on a 3-month average basis and is therefore not fully comparable to the LRD reported for 31 December 2015, although the presentation format was aligned. 2 Represents the difference between the IFRS and the regulatory scope of consolidation, which is the applicable scope for the LRD calculation. 3 Consists of positive replacement values, cash collateral receivables on derivative instruments, cash collateral on securities borrowed, reverse repurchase agreements, margin loans and prime brokerage receivables related to securities financing transactions in accordance with the regulatory scope of consolidation, which are presented separately under derivative exposures and securities financing transactions in this table. 4 Includes assets of entities consolidated under IFRS but not in regulatory scope of consolidation, which were included under the former Swiss SRB LRD calculation rules. 5 In accordance with former Swiss SRB LRD calculation rules, the leverage ratio denominator excludes forward starting repos, securities lending indemnifications and CEM add-ons for exchange-traded derivatives (ETD), both proprietary and agency transactions, and for OTC derivatives with a qualifying central counterparty. |
▲
BIS leverage ratio
More detailed BIS leverage ratio information in line with FINMA disclosure requirements can be found in the document “UBS Group AG (consolidated) regulatory information” which is available in “Quarterly reporting” at www.ubs.com/investors.
Pillar 3 |
BIS Basel III leverage ratio | | | | | | |
CHF million, except where indicated |
Phase-in | | 31.12.15 |
BIS Basel III tier 1 capital | | | | 44,559 |
Total exposures (leverage ratio denominator) | | | | 904,014 |
BIS Basel III leverage ratio (%) | | | | 4.9 |
| | | | | | |
Fully applied | | 31.12.15 |
BIS Basel III tier 1 capital | | | | 36,198 |
Total exposures (leverage ratio denominator) | | | | 897,607 |
BIS Basel III leverage ratio (%) | | | | 4.0 |
▲
Risk, treasury and capital management
Capital management
UBS AG (consolidated) capital and leverage ratio information
In this section, we disclose UBS AG (consolidated) capital and leverage ratio information and differences between UBS Group AG (consolidated) and UBS AG (consolidated).
Capital information
Swiss SRB capital ratio requirements and information (phase-in) - UBS AG (consolidated) |
| | Capital ratio (%) | | Capital |
| | Requirement¹ | | Actual² | | Requirement | | Eligible² |
CHF million, except where indicated | | 31.12.15 | | 31.12.15 | | 31.12.14 | | 31.12.15 | | 31.12.15 | 31.12.14 |
Base capital (common equity tier 1 capital) | | 4.5 | | 4.5 | | 4.0 | | 9,567 | | 9,567 | 8,846 |
Buffer capital (common equity tier 1 capital and high-trigger loss-absorbing capital) | | 5.3 | | 15.0 | | 15.9 | | 11,252 | | 31,948 | 35,244 |
of which: effect of countercyclical buffer | | 0.2 | | 0.2 | | 0.1 | | 356 | | 356 | 322 |
Progressive buffer capital (low-trigger loss-absorbing capital) | | 2.8 | | 4.9 | | 4.7 | | 6,020 | | 10,325 | 10,451 |
Phase-out capital (tier 2 capital) | | | | 0.5 | | 0.9 | | | | 996 | 2,050 |
Total | | 12.6 | | 24.9 | | 25.6 | | 26,839 | | 52,837 | 56,591 |
1 The total capital ratio requirement of 12.6% is the current phase-in requirement according to the Swiss Capital Adequacy Ordinance. Prior to the implementation of the Swiss SRB framework, FINMA also defined a total capital ratio target for UBS AG consolidated of 14.4%, which will be effective until it is exceeded by the Swiss SRB phase-in capital requirement. 2 Swiss SRB CET1 capital exceeding the base capital requirement is allocated to the buffer capital. |
| | | | | | | | | | | |
Swiss SRB capital information - UBS AG (consolidated) | | | |
| | | | | | Phase-in | | Fully applied |
CHF million, except where indicated | | | | | | 31.12.15 | | 31.12.14 | | 31.12.15 | 31.12.14 |
Common equity tier 1 capital | | | | | | | | | | | |
Common equity tier 1 capital | | | | | | 41,516 | | 44,090 | | 32,042 | 30,805 |
Additional tier 1 capital | | | | | | | | | | | |
High-trigger loss-absorbing capital | | | | | | 0¹ | | 0² | | 1,252 | 0 |
Tier 1 capital | | | | | | 41,516 | | 44,090 | | 33,294 | 30,805 |
Tier 2 capital | | | | | | | | | | | |
Low-trigger loss-absorbing capital | | | | | | 10,325 | | 10,451 | | 10,325 | 10,451 |
Phase-out capital | | | | | | 996 | | 2,050 | | | |
Total tier 2 capital | | | | | | 11,321 | | 12,501 | | 10,325 | 10,451 |
Total capital | | | | | | 52,837 | | 56,591 | | 43,619 | 41,257 |
Common equity tier 1 capital ratio (%) | | | | | | 19.5 | | 19.9 | | 15.4 | 14.2 |
Tier 1 capital ratio (%) | | | | | | 19.5 | | 19.9 | | 16.0 | 14.2 |
Total capital ratio (%) | | | | | | 24.9 | | 25.6 | | 21.0 | 19.0 |
Risk-weighted assets | | | | | | 212,609 | | 221,150 | | 208,186 | 217,158 |
1 Includes additional tier 1 capital in the form of high-trigger loss-absorbing capital and hybrid instruments, which were entirely offset by required deductions for goodwill. 2 Includes additional tier 1 capital in the form of hybrid instruments, which was entirely offset by required deductions for goodwill. |
As of 31 December 2015, fully applied total capital of UBS AG (consolidated) was CHF 3.8 billion lower than for UBS Group AG (consolidated), reflecting CHF 4.9 billion lower AT1 capital and CHF 0.9 billion lower tier 2 capital, partly offset by CHF 2.0 billion higher CET1 capital.
The difference of CHF 2.0 billion in fully applied CET1 capital was primarily due to compensation-related regulatory capital accruals, liabilities and capital instruments which are reflected at the UBS Group AG level.
The difference of CHF 4.9 billion in fully applied AT1 capital relates to the issuances of AT1 capital notes by UBS Group AG in 2015, as well as CHF 1.0 billion of high-trigger loss-absorbing DCCP awards granted to eligible employees for the performance years 2015 and 2014.
The difference of CHF 0.9 billion in tier 2 capital relates to high-trigger loss-absorbing capital, in the form of 2012 and 2013 DCCP awards, held at UBS Group AG level.
Differences in capital between UBS Group AG (consolidated) and UBS AG (consolidated) related to employee compensation plans will reverse to the extent underlying services are performed by employees of, and are consequently charged to, UBS AG and its subsidiaries. Such reversal generally occurs over the service period of the employee compensation plans.
The difference in RWA between UBS Group AG (consolidated) and UBS AG (consolidated) was less than CHF 1.0 billion on both a phase-in and fully applied basis as of 31 December 2015.
Swiss SRB capital information (UBS Group AG vs UBS AG consolidated) |
As of 31.12.15 | | Phase-in | | Fully applied |
CHF million, except where indicated | | UBS Group AG (consolidated) | UBS AG (consolidated) | Differences | | UBS Group AG (consolidated) | UBS AG (consolidated) | Differences |
Common equity tier 1 capital | | | | | | | | |
Common equity tier 1 capital | | 40,378 | 41,516 | (1,138) | | 30,044 | 32,042 | (1,998) |
Additional tier 1 capital | | | | | | | | |
High-trigger loss-absorbing capital | | 3,828 | 0 | 3,828 | | 3,828 | 1,252 | 2,576 |
Low-trigger loss-absorbing capital | | 353 | 0 | 353 | | 2,326 | 0 | 2,326 |
Total additional tier 1 capital | | 4,181 | 0 | 4,181 | | 6,154 | 1,252 | 4,902 |
Tier 1 capital | | 44,559 | 41,516 | 3,043 | | 36,198 | 33,294 | 2,904 |
Tier 2 capital | | | | | | | | |
High-trigger loss-absorbing capital | | 912 | | 912 | | 912 | | 912 |
Low-trigger loss-absorbing capital | | 10,325 | 10,325 | 0 | | 10,325 | 10,325 | 0 |
Phase-out capital | | 996 | 996 | 0 | | | | |
Total tier 2 capital | | 12,233 | 11,321 | 912 | | 11,237 | 10,325 | 912 |
Total capital | | 56,792 | 52,837 | 3,955 | | 47,435 | 43,619 | 3,816 |
Common equity tier 1 capital ratio (%) | | 19.0 | 19.5 | (0.5) | | 14.5 | 15.4 | (0.9) |
Tier 1 capital ratio (%) | | 21.0 | 19.5 | 1.5 | | 17.4 | 16.0 | 1.4 |
Total capital ratio (%) | | 26.8 | 24.9 | 1.9 | | 22.9 | 21.0 | 1.9 |
Risk-weighted assets | | 212,302 | 212,609 | (307) | | 207,530 | 208,186 | (656) |
Risk, treasury and capital management
Capital management
Audited |
Reconciliation IFRS equity to Swiss SRB capital (UBS Group AG vs UBS AG consolidated) |
As of 31.12.15 | | Phase-in | | Fully applied |
CHF million | | UBS Group AG (consolidated) | UBS AG (consolidated) | Differences | | UBS Group AG (consolidated) | UBS AG (consolidated) | Differences |
Equity attributable to shareholders | | 55,313 | 55,248 | 65 | | 55,313 | 55,248 | 65 |
Equity attributable to preferred noteholders and other non-controlling interests | | 1,995 | 1,995 | 0 | | 1,995 | 1,995 | 0 |
Total IFRS equity | | 57,308 | 57,243 | 65 | | 57,308 | 57,243 | 65 |
Equity attributable to preferred noteholders and other non-controlling interests | | (1,995) | (1,995) | 0 | | (1,995) | (1,995) | 0 |
Defined benefit plans (before phase-in, as applicable) | | | | | | (50) | (50) | 0 |
Defined benefit plans, 40 % phase-in | | (20) | (20) | 0 | | | | |
Deferred tax assets recognized for tax loss carry-forwards (before phase-in, as applicable) | | | | | | (7,468) | (7,468) | 0 |
Deferred tax assets recognized for tax loss carry-forwards, 40% phase-in | | (2,988) | (2,988) | 0 | | | | |
Deferred tax assets on temporary differences, excess over threshold | | (702) | (657) | (45) | | (2,598) | (2,414) | (184) |
Goodwill, net of tax, less hybrid capital and loss-absorbing capital | | (2,618) | (3,339) | 721 | | (6,545) | (6,545) | 0 |
Intangible assets, net of tax | | (323) | (323) | 0 | | (323) | (323) | 0 |
Unrealized (gains) / losses from cash flow hedges, net of tax | | (1,638) | (1,638) | 0 | | (1,638) | (1,638) | 0 |
Compensation and own shares-related capital components (including share premium) | | (1,383) | | (1,383) | | (1,383) | | (1,383) |
Own credit related to financial liabilities designated at fair value and replacement values, net of tax | | (442) | (442) | 0 | | (442) | (442) | 0 |
Unrealized gains related to financial investments available-for-sale, net of tax | | (402) | (402) | 0 | | (402) | (402) | 0 |
Prudential valuation adjustments | | (83) | (83) | 0 | | (83) | (83) | 0 |
Consolidation scope | | (130) | (130) | 0 | | (130) | (130) | 0 |
Accruals for proposed dividends to shareholders | �� | (3,188) | (3,434) | 246 | | (3,188) | (3,434) | 246 |
Other | | (1,018) | (277) | (741) | | (1,018) | (277) | (741) |
Common equity tier 1 capital | | 40,378 | 41,516 | (1,138) | | 30,044 | 32,042 | (1,998) |
High-trigger loss-absorbing capital | | 3,828 | 1,252 | 2,576 | | 3,828 | 1,252 | 2,576 |
Low-trigger loss-absorbing capital | | 2,326 | | 2,326 | | 2,326 | | 2,326 |
Hybrid capital subject to phase-out | | 1,954 | 1,954 | 0 | | | | |
Goodwill, net of tax, offset against hybrid capital and loss-absorbing capital | | (3,927) | (3,206) | (721) | | | | |
Additional tier 1 capital | | 4,181 | 0 | 4,181 | | 6,154 | 1,252 | 4,902 |
Tier 1 capital | | 44,559 | 41,516 | 3,043 | | 36,198 | 33,294 | 2,904 |
Tier 2 capital | | 12,233 | 11,321 | 912 | | 11,237 | 10,325 | 912 |
Total capital | | 56,792 | 52,837 | 3,955 | | 47,435 | 43,619 | 3,816 |
▲
Leverage ratio information
Swiss SRB leverage ratio requirements and information (phase-in) – UBS AG (consolidated) |
| | Swiss SRB leverage ratio (%) | | Swiss SRB leverage ratio capital |
| | Requirement¹ | | Actual²˒³ | | Requirement | | Eligible²˒³ |
CHF million, except where indicated | | 31.12.15 | | 31.12.15 | 31.12.14 | | 31.12.15 | | 31.12.15 | 31.12.14 |
Base capital (common equity tier 1 capital) | | 1.1 | | 1.1 | 1.0 | | 9,769 | | 9,769 | 9,658 |
Buffer capital (common equity tier 1 capital and high-trigger loss-absorbing capital) | | 1.2 | | 3.5 | 3.4 | | 11,126 | | 31,747 | 34,432 |
Progressive buffer capital (low-trigger loss-absorbing capital) | | 0.7 | | 1.1 | 1.0 | | 6,146 | | 10,325 | 10,451 |
Total | | 3.0 | | 5.7 | 5.4 | | 27,041 | | 51,841 | 54,542 |
1 Requirements for base capital (24% of 4.5%), buffer capital (24% of 5.1%) and progressive buffer capital (24% of 2.8%). The total leverage ratio requirement of 3.0% is the current phase-in requirement according to the Swiss Capital Adequacy Ordinance. In addition, FINMA defined a total leverage ratio target of 3.5%, which will be effective until it is exceeded by the Swiss SRB phase-in requirement. 2 Swiss SRB CET1 capital exceeding the base capital requirement is allocated to the buffer capital. 3 The leverage ratio denominator (LRD) used to calculate the requirements is calculated in accordance with Swiss SRB rules. From 31 December 2015 onward, these are fully aligned to the BIS Basel III rules and the LRD is reported on a spot basis. Prior to the alignment to BIS rules, the LRD was calculated based on former FINMA rules and reported on a 3-month average basis. |
Consistent with UBS Group AG (consolidated), effective 31 December 2015, we apply the new requirement for the calculation of the Swiss SRB leverage ratio, which is based on the Swiss SRB numerator and the BIS LRD on a spot basis, in accordance with the FINMA Circular "Leverage ratio – banks."
As of 31 December 2015, the Swiss SRB leverage ratio of UBS AG (consolidated) was 0.4 percentage points and 0.5 percentage points lower than that of UBS Group AG (consolidated) on a fully applied and phase-in basis, respectively, mainly as CET1 capital including loss-absorbing capital of UBS AG (consolidated) was CHF 3.8 billion and CHF 4.0 billion lower on a fully applied and phase-in basis, respectively.
The difference in LRD between UBS Group AG (consolidated) and UBS AG (consolidated) was less than CHF 1 billion on both a phase-in and fully applied basis as of 31 December 2015.
Swiss SRB leverage ratio (UBS Group AG vs UBS AG consolidated) |
|
As of 31.12.15 | | | |
CHF million, except where indicated | UBS Group AG (consolidated) | UBS AG (consolidated) | Differences |
Total IFRS assets | 942,819 | 943,256 | (437) |
Difference between IFRS and regulatory scope of consolidation¹ | (16,763) | (16,822) | 59 |
Less derivative exposures and securities financing transactions² | (300,834) | (300,834) | 0 |
On-balance sheet exposures (excluding derivative exposures and securities financing transactions) | 625,222 | 625,601 | (379) |
Derivative exposures² | 128,866 | 128,866 | 0 |
Securities financing transactions² | 120,086 | 120,086 | 0 |
Off-balance sheet items | 41,132 | 41,211 | (79) |
Items deducted from Swiss SRB tier 1 capital, phase-in | (11,291) | (11,246) | (45) |
Total exposures (leverage ratio denominator), phase-in | 904,014 | 904,518 | (504) |
Additional items deducted from Swiss SRB tier 1 capital, fully applied | (6,407) | (6,268) | (139) |
Total exposures (leverage ratio denominator), fully applied | 897,607 | 898,251 | (644) |
| | | |
Phase-in | | | |
Common equity tier 1 capital | 40,378 | 41,516 | (1,138) |
Loss-absorbing capital | 15,418 | 10,325 | 5,093 |
Common equity tier 1 capital including loss-absorbing capital | 55,796 | 51,841 | 3,955 |
Swiss SRB leverage ratio (%) | 6.2 | 5.7 | 0.5 |
| | | |
Fully applied | | | |
Common equity tier 1 capital | 30,044 | 32,042 | (1,998) |
Loss-absorbing capital | 17,391 | 11,578 | 5,813 |
Common equity tier 1 capital including loss-absorbing capital | 47,435 | 43,619 | 3,816 |
Swiss SRB leverage ratio (%) | 5.3 | 4.9 | 0.4 |
1 Represents the difference between the IFRS and the regulatory scope of consolidation, which is the applicable scope for the LRD calculation. 2 Consists of positive replacement values, cash collateral receivables on derivative instruments, cash collateral on securities borrowed, reverse repurchase agreements, margin loans and prime brokerage receivables related to securities financing transactions in accordance with the regulatory scope of consolidation, which are presented separately under derivative exposures and securities financing transactions in this table. |
Risk, treasury and capital management
Capital management
Equity attribution framework
Pillar 3 | The equity attribution framework reflects our objectives of maintaining a strong capital base and managing performance by guiding each business toward activities that appropriately balance profit potential, risk and capital usage. This framework, which includes some forward-looking elements, enables us to integrate Group-wide capital management activities with those at a business division level and to calculate and assess return on attributed equity (RoAE) for each of our business divisions.
Tangible equity is attributed to our business divisions by applying a weighted-driver approach that combines fully applied Basel III capital requirements with internal models to determine the amount of capital required to cover each business division’s risk.
Risk-weighted assets (RWA) and leverage ratio denominator (LRD) usage are converted to their common equity tier 1 (CET1) equivalents based on capital ratios as targeted by industry peers. Risk-based capital (RBC) is converted to its CET1 equivalent based on a conversion factor that considers the amount of RBC exposure covered by loss-absorbing capital. In addition to tangible equity, we allocate equity to support goodwill and intangible assets as well as certain Basel III capital deduction items. Group items within Corporate Center – Services represents equity not allocated to the business divisions. This includes equity required to align total attributed equity with Group capital targets, as well as attributed equity for PaineWebber goodwill and intangible assets, for centrally held RBC items and for certain Basel III capital deduction items. The amount of equity attributed to all business divisions and Corporate Center corresponds to the amount we believe is required to support our businesses adequately, and it can differ from the Group’s actual equity during a given period. ▲
® Refer to the “Risk management and control” section of this report for more information on risk-based capital
Average total equity attributed to the business divisions and Corporate Center increased to CHF 44.6 billion in 2015 compared with CHF 39.9 billion in 2014. Since 1 January 2015, the equity attribution framework is based on fully applied Basel III capital requirements, rather than on phase-in requirements. As a result, a higher amount of equity is required to underpin certain Basel III capital deductions, primarily related to deferred tax assets. This led to an increase in average attributed equity for Group items within Corporate Center – Services. Attributed equity in Corporate Center – Non-core and Legacy Portfolio decreased, reflecting further RWA and LRD reductions.
Average equity attributable to UBS Group AG shareholders increased to CHF 52.4 billion in 2015 from CHF 49.7 billion in 2014. The difference between average equity attributable to UBS Group AG shareholders and average equity attributed to the business divisions and Corporate Center decreased to CHF 7.8 billion in 2015 compared with CHF 9.8 billion in 2014.
Pillar 3 | Effective from the first quarter of 2016, the weighting used for the attribution of tangible equity has been changed from 50% for RWA, 25% for LRD and 25% for RBC to an equal driver weighting of one third each. Moreover, to reflect the higher CET1 ratios of our industry peers, the CET1 ratio used for the RWA driver is increased from 10% to 11%. The CET1 leverage ratio used for the LRD driver remains unchanged at 3.75%. These changes will lead to moderate increases in the business divisions' attributed equity. Moreover, the equity required to align attributed equity with Group capital targets fully applies the proposed revisions to the Swiss TBTF framework, which is expected to lead to an increase in the average attributed equity for Group items within Corporate Center – Services. ▲
® Refer to the “Regulatory and legal developments” section of this report for more information on the proposed revisions to the Swiss TBTF framework
Pillar 3 |
Average attributed equity | | | | |
| | For the year ended |
CHF billion | | 31.12.15 | 31.12.14 | 31.12.13 |
Wealth Management | | 3.5 | 3.4 | 3.5 |
Wealth Management Americas | | 2.5 | 2.7 | 2.8 |
Personal & Corporate Banking | | 3.9 | 4.1 | 4.1 |
Asset Management | | 1.6 | 1.7 | 1.8 |
Investment Bank | | 7.3 | 7.6 | 8.0 |
Corporate Center | | 25.8 | 20.5 | 23.3 |
of which: Services | | 19.6 | 12.3 | 9.5 |
of which: Group items¹ | | 18.2 | 11.3 | 8.6 |
of which: Group ALM | | 3.3 | 3.2 | 3.1 |
of which: Non-core and Legacy Portfolio | | 2.9 | 4.9 | 10.8 |
Average equity attributed to the business divisions and Corporate Center | | 44.6 | 39.9 | 43.5 |
Difference | | 7.8 | 9.8 | 3.7 |
Average equity attributable to UBS Group AG shareholders | | 52.4 | 49.7 | 47.2 |
1 Beginning in 2015, Group items are shown within Corporate Center – Services. Prior periods have been restated. |
▲
Pillar 3 |
Return on attributed equity and return on equity¹ | | | | |
| | For the year ended |
In % | | 31.12.15 | 31.12.14 | 31.12.13 |
Wealth Management | | 77.4 | 67.9 | 64.2 |
Wealth Management Americas | | 29.0 | 33.6 | 30.9 |
Personal & Corporate Banking | | 41.9 | 36.7 | 35.6 |
Asset Management | | 36.5 | 27.5 | 32.0 |
Investment Bank | | 25.9 | (1.1) | 26.6 |
UBS Group | | 11.8 | 7.0 | 6.7 |
1 Return on attributed equity shown for the business divisions and return on equity attributable to UBS Group AG shareholders shown for UBS Group. Return on attributed equity for Corporate Center is not shown, as it is not meaningful. |
▲
Risk, treasury and capital management
UBS shares
UBS shares
UBS Group AG shares
Audited | As of 31 December 2015, total IFRS equity attributable to UBS Group AG shareholders amounted to CHF 55,313 million, represented by 3,849,731,535 shares issued. Shares issued increased by 132,603,211 shares in 2015 due to the issuance of 127,650,706 shares out of authorized share capital following private exchanges of UBS AG shares into UBS Group AG shares, and the successful completion of a court procedure under article 33 of the Swiss Stock Exchange Act (SESTA procedure) to cancel the remaining UBS AG shares that were held by UBS AG shareholders with a non-controlling interest, and the issuance of 4,952,505 shares out of conditional share capital upon exercise of employee share options.
Each share has a par value of CHF 0.10 and entitles the holder to one vote at the UBS Group AG shareholders’ meeting, if entered into the share register as having the right to vote, as well as a proportionate share of distributed dividends. As the Articles of Association of UBS Group AG indicate, there are no other classes of shares and no preferential rights for shareholders. ▲
UBS Group share information | | | | | |
| | As of or for the year ended | | % change from |
| | 31.12.15 | 31.12.14 | | 31.12.14 |
Shares issued | | 3,849,731,535 | 3,717,128,324 | | 4 |
Treasury shares | | 98,706,275 | 87,871,737 | | 12 |
Shares outstanding | | 3,751,025,260 | 3,629,256,587 | | 3 |
Basic earnings per share (CHF)¹ | | 1.68 | 0.93 | | 81 |
Diluted earnings per share (CHF)¹ | | 1.64 | 0.91 | | 80 |
Equity attributable to UBS Group AG shareholders (CHF million) | | 55,313 | 50,608 | | 9 |
Less: goodwill and intangible assets (CHF million)² | | 6,568 | 6,564 | | 0 |
Tangible equity attributable to UBS Group AG shareholders (CHF million) | | 48,745 | 44,044 | | 11 |
Total book value per share (CHF) | | 14.75 | 13.94 | | 6 |
Tangible book value per share (CHF) | | 13.00 | 12.14 | | 7 |
Share price (CHF) | | 19.52 | 17.09 | | 14 |
Market capitalization (CHF million)³ | | 75,147 | 63,526 | | 18 |
1 Refer to “Note 9 Earnings per share (EPS) and shares outstanding” in the “Consolidated financial statements” section of this report for more information on UBS Group AG (consolidated) EPS. 2 Goodwill and intangible assets used in the calculation of tangible equity attributable to UBS Group AG shareholders as of 31 December 2014 have been adjusted to reflect the non-controlling interests in UBS AG as of that date. 3 Market capitalization is calculated based on the total shares issued multiplied by the share price at period end. |
UBS AG shares
Audited | As of 31 December 2015, shares issued by UBS AG totaled 3,858,408,466 shares, of which 100% were held by UBS Group AG. Shares issued by UBS AG increased by 13,847,533 shares in 2015 due to the issuance of new UBS AG shares out of conditional share capital upon distribution of an optional share dividend in May 2015.
Following the successful completion of the SESTA procedure, all UBS AG shares that remained publicly held were canceled and UBS Group AG shares were delivered as compensation. ▲
UBS AG share information | | | | | |
| | As of | | % change from |
| | 31.12.15 | 31.12.14 | | 31.12.14 |
Shares issued | | 3,858,408,466 | 3,844,560,913 | | 0 |
Treasury shares | | 0 | 2,115,255 | | (100) |
Shares outstanding | | 3,858,408,466 | 3,842,445,658 | | 0 |
of which: held by UBS Group AG | | 3,858,408,466 | 3,716,910,207 | | 4 |
of which: held by shareholders with non-controlling interests | | 0 | 125,535,451 | | (100) |
Holding of UBS Group AG shares
We hold UBS Group AG own shares primarily to hedge share delivery obligations related to employee share and option participation plans.
In addition, the Investment Bank holds a limited number of own shares in its capacity as a liquidity provider to the equity index futures market and as a market-maker in UBS Group AG shares and derivatives on UBS Group AG shares. Moreover, to meet client demand, UBS has issued structured debt instruments, including securitized leverage products, linked to UBS Group AG shares, which are economically hedged by cash-settled derivatives and, to a limited extent, by own shares held by the Investment Bank.
As of 31 December 2015, we held 98,706,275 treasury shares, or 2.6% of shares issued, compared with 87,871,737, or 2.4% of shares issued, as of 31 December 2014.
As of 31 December 2015, total future share delivery obligations in relation to employee share-based compensation
awards were 138 million shares (31 December 2014: 131 million shares) taking the respective performance conditions into account. Share delivery obligations related to unvested and vested notional share awards, options and stock appreciation rights.
As of 31 December 2015, we held 98 million UBS Group AG treasury shares (31 December 2014: 88 million) which were available to satisfy the share delivery obligations. Additionally, 131 million UBS Group AG shares (31 December 2014: 136 million) to be issued out of conditional share capital were available to satisfy the share delivery obligation specifically related to options and stock appreciation rights. Treasury shares held or newly issued shares are delivered to employees at exercise or vesting.
The table below outlines the market purchases of UBS Group AG shares by Group Treasury. It does not include the activities of the Investment Bank.
Treasury share activities¹ |
| | Treasury shares purchased for employee share and option participation plans | | Total number of shares |
Month of purchase | | Number of shares | Average price in CHF | | Number of shares (Cumulative) | Average price in CHF |
January 2015 | | | | | | |
February 2015 | | | | | | |
March 2015 | | | | | | |
April 2015 | | | | | | |
May 2015 | | 49,175,526 | 17.61 | | 49,175,526 | 17.61 |
June 2015 | | | | | 49,175,526 | 17.61 |
July 2015 | | | | | 49,175,526 | 17.61 |
August 2015 | | | | | 49,175,526 | 17.61 |
September 2015 | | | | | 49,175,526 | 17.61 |
October 2015 | | | | | 49,175,526 | 17.61 |
November 2015 | | 1,000,000 | 19.34 | | 50,175,526 | 17.65 |
December 2015 | | 2,600,000 | 18.48 | | 52,775,526 | 17.69 |
1 This table excludes purchases for the purpose of hedging derivatives linked to UBS Group AG shares and for market making in UBS Group AG shares. The table also excludes UBS Group AG shares purchased by pension and retirement benefit funds for UBS employees, which are managed by a board of UBS management and employee representatives in accordance with Swiss law guidelines. UBS’s pension and other post-employment benefit funds purchased 1,544,438 UBS Group AG shares during the year and held 17,737,346 UBS Group AG shares as of 31 December 2015. |
Trading volumes | | | | |
| | For the year ended |
1,000 shares | | 31.12.15 | 31.12.14¹ | 31.12.13 |
SIX Swiss Exchange total | | 2,870,766 | 2,839,304 | 2,763,179 |
SIX Swiss Exchange daily average | | 11,437 | 11,403 | 11,053 |
NYSE total | | 102,069 | 88,792 | 98,382 |
NYSE daily average | | 405 | 354 | 390 |
Source: Reuters | | | | |
| | | | |
1 2014 data reflects UBS AG trading volumes up to 27 November 2014 and UBS Group AG trading volumes from 28 November 2014 onward. |
Risk, treasury and capital management
UBS shares
Listing of UBS shares
UBS Group AG shares are listed on the SIX Swiss Exchange (SIX) and on the New York Stock Exchange (NYSE). They are traded and settled as global registered shares. Global registered shares provide direct and equal ownership for all shareholders, irrespective of the country and stock exchange on which they are traded.
UBS AG shares were delisted from the NYSE on 17 January 2015 and from the SIX on 27 August 2015 following the successful completion of the SESTA procedure.
During 2015, the average daily trading volume of UBS Group AG shares was 11.4 million shares on the SIX and 0.4 million shares on the NYSE. The SIX is expected to remain the main venue for determining the movement in our share price due to the high volume traded on this exchange.
During the hours in which both the SIX and the NYSE are simultaneously open for trading (generally 3:30 p.m. to 5:30 p.m. Central European Time), price differences between these exchanges are likely to be arbitraged away by professional market-makers. Accordingly, the share price will typically be similar between the two exchanges when considering the prevailing US dollar / Swiss franc exchange rate. When the SIX is closed for trading, globally traded volumes will typically be lower. However, the specialist firm making a market in UBS Group AG shares on the NYSE is required to facilitate sufficient liquidity and maintain an orderly market in UBS Group AG shares throughout normal NYSE trading hours.

Ticker symbols UBS Group AG |
| | | |
Trading exchange | SIX/NYSE | Bloomberg | Reuters |
SIX Swiss Exchange | UBSG | UBSG VX | UBS VX |
New York Stock Exchange | UBSG | UBS UN | UBS.N |
| | | |
Security identification codes |
ISIN | | CH0244767585 |
Valoren | | 24 476 758 |
Cusip | | CINS H42097 10 7 |
Stock exchange prices¹ | | | | | | | | |
| | SIX Swiss Exchange | | New York Stock Exchange |
| | High (CHF) | Low (CHF) | Period end (CHF) | | High (USD) | Low (USD) | Period end (USD) |
| | | | | | | | |
2015 | | | | | | | | |
Fourth quarter 2015 | | 20.27 | 17.87 | 19.52 | | 20.69 | 18.19 | 19.37 |
December | | 20.14 | 17.87 | 19.52 | | 19.93 | 18.19 | 19.37 |
November | | 20.16 | 18.83 | 19.75 | | 20.44 | 18.70 | 19.16 |
October | | 20.27 | 18.09 | 19.78 | | 20.69 | 18.55 | 20.03 |
Third quarter 2015 | | 22.57 | 17.41 | 18.01 | | 23.19 | 17.97 | 18.52 |
September | | 20.54 | 17.41 | 18.01 | | 20.92 | 17.97 | 18.52 |
August | | 22.57 | 18.52 | 20.03 | | 23.18 | 19.96 | 20.69 |
July | | 22.30 | 19.40 | 22.25 | | 23.19 | 20.51 | 23.06 |
Second quarter 2015 | | 20.78 | 18.22 | 19.83 | | 22.16 | 19.01 | 21.20 |
June | | 20.73 | 19.28 | 19.83 | | 22.16 | 21.07 | 21.20 |
May | | 20.78 | 18.80 | 20.22 | | 22.00 | 20.07 | 21.58 |
April | | 19.54 | 18.22 | 18.86 | | 20.31 | 19.01 | 20.07 |
First quarter 2015 | | 18.59 | 13.58 | 18.32 | | 19.29 | 16.02 | 18.77 |
March | | 18.59 | 16.58 | 18.32 | | 19.29 | 17.14 | 18.77 |
February | | 16.78 | 15.21 | 16.75 | | 17.69 | 16.37 | 17.49 |
January | | 17.24 | 13.58 | 15.39 | | 17.46 | 16.02 | 16.68 |
| | | | | | | | |
2014 | | 19.10 | 13.95 | 17.09 | | 21.50 | 15.04 | 17.05 |
Fourth quarter 2014 | | 17.84 | 13.95 | 17.09 | | 18.22 | 15.04 | 17.05 |
Third quarter 2014 | | 16.93 | 15.20 | 16.66 | | 18.95 | 16.78 | 17.37 |
Second quarter 2014 | | 18.74 | 16.21 | 16.27 | | 21.15 | 18.22 | 18.32 |
First quarter 2014 | | 19.10 | 16.76 | 18.26 | | 21.50 | 18.49 | 20.72 |
| | | | | | | | |
2013 | | 19.60 | 14.09 | 16.92 | | 21.61 | 15.09 | 19.25 |
Fourth quarter 2013 | | 19.30 | 16.12 | 16.92 | | 21.61 | 17.94 | 19.25 |
Third quarter 2013 | | 19.60 | 15.62 | 18.50 | | 21.48 | 16.54 | 20.52 |
Second quarter 2013 | | 18.02 | 14.09 | 16.08 | | 18.70 | 15.09 | 16.95 |
First quarter 2013 | | 16.39 | 14.23 | 14.55 | | 17.65 | 15.11 | 15.39 |
| | | | | | | | |
2012 | | 15.62 | 9.69 | 14.27 | | 16.99 | 9.78 | 15.74 |
Fourth quarter 2012 | | 15.62 | 11.39 | 14.27 | | 16.99 | 12.32 | 15.74 |
Third quarter 2012 | | 12.60 | 9.69 | 11.45 | | 13.57 | 9.78 | 12.18 |
Second quarter 2012 | | 12.79 | 10.55 | 11.05 | | 14.15 | 10.96 | 11.71 |
First quarter 2012 | | 13.60 | 10.64 | 12.65 | | 14.77 | 11.17 | 14.02 |
| | | | | | | | |
2011 | | 19.13 | 9.34 | 11.18 | | 20.08 | 10.42 | 11.83 |
Fourth quarter 2011 | | 12.23 | 9.80 | 11.18 | | 14.21 | 10.47 | 11.83 |
Third quarter 2011 | | 15.75 | 9.34 | 10.54 | | 18.63 | 10.42 | 11.43 |
Second quarter 2011 | | 17.60 | 14.37 | 15.33 | | 20.03 | 17.20 | 18.26 |
First quarter 2011 | | 19.13 | 15.43 | 16.48 | | 20.08 | 16.11 | 18.05 |
| | | | | | | | |
2010 | | 18.60 | 13.31 | 15.35 | | 18.48 | 12.26 | 16.47 |
Fourth quarter 2010 | | 17.83 | 14.92 | 15.35 | | 18.48 | 14.99 | 16.47 |
Third quarter 2010 | | 18.53 | 13.94 | 16.68 | | 18.47 | 13.04 | 17.03 |
Second quarter 2010 | | 18.60 | 14.15 | 14.46 | | 17.75 | 12.26 | 13.22 |
First quarter 2010 | | 17.50 | 13.31 | 17.14 | | 16.84 | 12.40 | 16.28 |
1 Based on the share price of UBS AG until 27 November 2014, and of UBS Group AG from 28 November 2014 onward. | |
Corporate governance, responsibility and compensation
Audited information according to the Swiss law and applicable regulatory requirements and guidance Disclosures provided are in line with the requirements of article 663c para. 1 and 3 of the Swiss Code of Obligations (supplementary disclosures for companies whose shares are listed on a stock exchange: shareholdings) and the Ordinance against Excessive Compensation in Listed Stock Corporations (tables containing such information are marked as “Audited” throughout this section), as well as other applicable regulations and guidance. |
Information assured according to the Global Reporting Initiative (GRI) Content of the sections “UBS and Society” and “Our employees” has been reviewed by Ernst & Young Ltd (EY) against the Global Reporting Initiative (GRI) Sustainability Reporting Guidelines. This content has been prepared in accordance with the comprehensive option of GRI G4 as evidenced in the EY assurance report at www.ubs.com/gri. The assurance by EY also covered other relevant text and data on the website of UBS which is referenced in the GRI Content Index. |
Corporate governance, responsibility and compensation
Corporate governance
Corporate governance
Our corporate governance principles are designed to support our objective of sustainable profitability, as well as to create value and protect the interests of our shareholders and other stakeholders. We use the term “corporate governance” when referring to the organizational structure of the Group and operational practices of our management.
UBS Group AG is subject to, and compliant with, all relevant Swiss legal and regulatory requirements regarding corporate governance, including the SIX Swiss Exchange’s (SIX) Directive on Information Relating to Corporate Governance, as well as the standards established in the Swiss Code of Best Practice for Corporate Governance, including the appendix on executive compensation.
In addition, as a foreign company with shares listed on the New York Stock Exchange (NYSE), UBS Group AG is compliant with all relevant corporate governance standards applicable to foreign private issuers.
Based on article 716b of the Swiss Code of Obligations and articles 25 and 27 of the Articles of Association of UBS Group AG and UBS AG (Articles of Association), the Board of Directors (BoD) adopted the Organization Regulations of UBS Group AG and UBS AG (Organization Regulations), which constitute our primary corporate governance guidelines. The revised Organization Regulations are valid as of 1 January 2016. They primarily implement new governance framework responsibilities appropriate to the new holding structure, and define primary governance guidelines for UBS Group AG and its subsidiaries.
After the successful completion of the squeeze-out procedure in the third quarter of 2015, UBS Group AG became sole owner of all shares of UBS AG and, in August 2015, all UBS AG shares were delisted from the SIX Swiss Exchange. Consequently, UBS AG is no longer subject to the SIX Listing Rules requirement to publish information about corporate governance in this report.
However, information about UBS AG continues to be presented in response to US Securities and Exchange Commission regulations.
To the extent practicable, the governance structure of UBS Group AG mirrors that of UBS AG. The Articles of Association of both entities are substantially similar and the two entities are governed by a combined set of Organization Regulations. The discussion of corporate governance in this section, therefore, relates to both entities equally, except where specifically noted to be different. In this section, references to “our,” “we” and “us” relate to both UBS Group AG and UBS AG, unless otherwise indicated, and when we refer to corporate bodies or functions we mean those of both UBS Group AG and UBS AG.
® Refer to the Articles of Association and the Organization Regulations at www.ubs.com/governance for more information
Differences from corporate governance standards relevant to US-listed companies
According to the NYSE listing standards on corporate governance, foreign private issuers are required to disclose any significant ways in which their corporate governance practices differ from those required to be followed by domestic companies.
Performance evaluation of the BoD committees
All BoD committees perform a self-assessment of their activities and report back to the full BoD.
Responsibility of the Audit Committee with regard to independent auditors
The Audit Committee is responsible for the compensation, retention and oversight of the independent auditors, but not for their appointment. It assesses the performance and qualification of the external auditors and submits its proposal for appointment, reappointment or removal of the independent auditors to the full BoD. In line with the Swiss Code of Obligations, the BoD in turn brings its proposal to the shareholders for their vote at the Annual General Meeting (AGM).
Discussion of risk assessment and risk management policies by the Risk Committee
In accordance with our Organization Regulations, the Risk Committee, on behalf of the BoD, oversees our risk principles and risk capacity. The Risk Committee is responsible for monitoring our adherence to those risk principles and for monitoring whether business divisions and control units maintain appropriate systems of risk management and control.
Supervision of the internal audit function
The Chairman of the BoD (Chairman) and the Audit Committee share the supervisory responsibility and authority with respect to the internal audit function.
Responsibility of the Compensation Committee for performance evaluations of senior management
The Compensation Committee (formerly Human Resources and Compensation Committee), together with the BoD, proposes for shareholder approval at the AGM the maximum aggregate amount of compensation for the BoD, the maximum aggregate amount of fixed compensation for the Group Executive Board (GEB) and the aggregate amount of variable compensation for the GEB. In line with Swiss law, the shareholders elect the members of the Compensation Committee at the AGM.
Responsibility of the Governance and Nominating Committee for the evaluation of the Board of Directors
The BoD has direct responsibility and authority to evaluate its own performance, based on a pre-evaluation by the Governance and Nominating Committee.
Proxy statement reports of the Audit Committee and the Compensation Committee
NYSE listing standards would require the aforementioned committees to submit their reports directly to shareholders. However, under Swiss law, all our reports addressed to shareholders, including those from the aforementioned committees, are provided and approved by the BoD, which has ultimate responsibility vis-à-vis the shareholders.
Shareholders’ votes on equity compensation plans
Swiss law authorizes the BoD to approve compensation plans. Though Swiss law does not allocate such authority to shareholders, it requires that Swiss companies determine the nature and components of capital in their articles of association, and each increase in capital has to be submitted for shareholder approval. This means that shareholder approval is mandatory if equity-based compensation plans require an increase in capital. No shareholder approval is required if shares for such plans are purchased in the market.
® Refer to “Board of Directors” in this section for more information on the Board of Directors’ committees
® Refer to “Capital structure” in this section for more information on UBS Group AG's capital
Corporate governance, responsibility and compensation
Corporate governance
Group structure and shareholders
UBS Group legal entity structure
UBS Group AG is organized as an Aktiengesellschaft (AG), a stock corporation, pursuant to article 620ff. of the Swiss Code of Obligations. UBS Group AG is the ultimate parent company of the UBS Group (Group). As the holding company of the Group, UBS Group AG is a non-operating, financial holding company that has issued or guaranteed debt and provides capital to its subsidiaries as required.
UBS AG, a fully-owned subsidiary of UBS Group AG, and UBS Switzerland AG, a fully-owned subsidiary of UBS AG, are also organized as AGs pursuant to article 620ff. of the Swiss Code of Obligations.
Over the past two years, we have taken a series of measures to improve the resolvability of the Group in response to "too big to fail" requirements in Switzerland and other countries in which the Group operates.
After the successful completion of the squeeze-out procedure in the third quarter of 2015, UBS Group AG became the sole owner of all shares of UBS AG and is expected to directly acquire certain other Group companies over time. The Swiss-booked business of Wealth Management and Personal & Corporate Banking (formerly Retail & Corporate) were transferred to UBS Switzerland AG in mid-2015. In 2015, we also completed the implementation of a revised business and operating model for UBS Limited in the UK.
During 2015, we also established UBS Business Solutions AG as a direct subsidiary of UBS Group AG, to act as the Group service company, to which the ownership of the majority of our existing service subsidiaries will be transferred. We established a new subsidiary, UBS Americas Holding LLC, which we intend to designate as our intermediate holding company in the US under the Dodd-Frank Wall Street Reform and Consumer Protection Act. We also established a new subsidiary of UBS AG, UBS Asset Management AG, into which we expect to transfer the majority of the operating subsidiaries of Asset Management during 2016.
® Refer to the “The legal structure of UBS Group” section of this report for more information
Operational Group structure
As of 31 December 2015, the operational structure of the Group comprised Wealth Management, Wealth Management Americas, Personal & Corporate Banking (formerly Retail & Corporate), Asset Management (formerly Global Asset Management), and the Investment Bank, as well as Corporate Center with its units Corporate Center – Services, Corporate Center – Group Asset and Liability Management and Corporate Center – Non-core and Legacy Portfolio.
® Refer to the “Financial and operating performance” section and “Note 2 Segment reporting” in the “Consolidated financial statements” section of this report for more information
Listed and non-listed companies belonging to the Group
The Group includes a number of consolidated entities, of which only UBS Group AG has its shares listed on stock exchanges.
® Refer to the “Corporate information” section of this report for UBS Group AG and UBS AG
® Refer to “Note 30 Interests in subsidiaries and other entities” in the “Consolidated financial statements” section of this report for more information on the significant subsidiaries of the Group
Significant shareholders
As of 1 January 2016, the Federal Act on Financial Market Infrastructures and Market Conduct in Securities and Derivatives Trading of 19 June 2015 (Swiss Financial Market Infrastructure Act) replaced certain provisions of the Swiss Federal Act on Stock Exchanges and Securities Trading of 24 March 1995 as amended (Swiss Stock Exchange Act). Under the Swiss Financial Market Infrastructure Act, anyone holding shares in a company listed in Switzerland, or holding derivative rights related to shares of such a company, must notify the company and the SIX if the holding reaches, falls below or exceeds one of the following thresholds: 3, 5, 10, 15, 20, 25, 331⁄3, 50, or 662⁄3% of voting rights, regardless of whether or not such rights may be exercised. The detailed disclosure requirements and the methodology for calculating the thresholds are defined in the Swiss Financial Market Supervisory Authority Ordinance on Financial Market Infrastructure (FMIO-FINMA), which replaced certain provisions of the Swiss Financial Market Supervisory Authority Ordinance on Stock Exchanges and Securities Trading (SESTO-FINMA) as of 1 January 2016. In particular, the FMIO-FINMA sets forth that nominee companies that cannot autonomously decide how voting rights are exercised are not obligated to notify the company and SIX if they reach, exceed or fall below the threshold percentages.
In addition, pursuant to the Swiss Code of Obligations, we must disclose in the notes to our financial statements the identity of any shareholder with a holding of more than 5% of the total share capital of UBS Group AG.
According to disclosure notifications filed on 10 December 2014 with UBS Group AG and the SIX under the Swiss Stock Exchange Act and respective FINMA Ordinance, both as in force at that time, GIC Private Limited disclosed a holding of 7.07% of the total share capital of UBS Group AG. The beneficial owner of this holding is the Government of Singapore. On 10 December 2014, Norges Bank, Oslo, the Central Bank of Norway, disclosed a holding of 3.30%. On 15 January 2015, BlackRock Inc., New York, disclosed a holding of 4.89% and on 10 February 2016, MFS Investment Management, Boston, disclosed a holding of 3.05%. In accordance with the Swiss Stock Exchange Act and, as of 1 January 2016, the Swiss Financial Market Infrastructure Act, the aforementioned percentages were calculated in relation to the total share capital of UBS Group AG reflected in the Articles of Association at the time of the respective disclosure notification. Information on disclosures under the Swiss Stock Exchange Act and the Swiss Financial Market Infrastructure Act, respectively, is available on the SIX Disclosure Office website at www.six-exchange-regulation.com/en/home/publications/significant-shareholders.html.
According to the share register, the shareholders (acting in their own name or in their capacity as nominees for other investors or beneficial owners) listed in the table below were registered with 3% or more of the total share capital of UBS Group AG as of 31 December 2015.
Cross-shareholdings
We have no cross-shareholdings in excess of a reciprocal ownership of 5% of capital or voting rights with any other company.
Audited |
Shareholders registered in the UBS share register with 3% or more of the total share capital¹ |
% of share capital | 31.12.15 | 31.12.14 | 31.12.13 |
Chase Nominees Ltd., London | 9.14 | 9.05 | 11.73 |
GIC Private Limited, Singapore | 6.38 | 6.61 | 6.39 |
DTC (Cede & Co.), New York² | 6.14 | 5.76 | 5.89 |
Nortrust Nominees Ltd., London | 3.60 | 3.52 | 3.75 |
1 Numbers for the year 2013 refer to UBS AG. 2 DTC (Cede & Co.), New York, "The Depository Trust Company", is a US securities clearing organization. |
▲
Corporate governance, responsibility and compensation
Corporate governance
Capital structure
Issued ordinary share capital
As of 31 December 2014, UBS Group AG's share capital amounted to CHF 371,712,832, represented by 3,717,128,324 shares with a par value of CHF 0.10 each.
In 2015, the UBS Group AG’s Board of Directors (BoD) made use of the authorized capital created by decision of the shareholders in 2014, and increased the ordinary share capital of UBS Group AG by CHF 12,765,070.60 by means of contributions in kind in the form of UBS AG shares in connection with the acquisition of 100% ownership of UBS AG.
® Refer to the “The legal structure of UBS Group” section of this report for more information
UBS Group AG's issued share capital also increased by CHF 495,250.50 in 2015, as a result of issuance of shares out of conditional capital due to options exercised by employees.
At year-end 2015, 3,849,731,535 UBS Group AG shares were issued with a par value of CHF 0.10 each, leading to a share capital of CHF 384,973,153.50.
Issued share capital of UBS Group AG | | | |
| Share capital in CHF | Number of shares | Par value in CHF |
As of 31 December 2014 | 371,712,832 | 3,717,128,324 | 0.10 |
Issue of shares out of conditional capital due to employee options exercised in 2015 | 495,251 | 4,952,505 | 0.10 |
Issue of shares out of authorized capital related to the acquisition of 100% ownership of UBS AG | 12,765,071 | 127,650,706 | 0.10 |
As of 31 December 2015 | 384,973,154 | 3,849,731,535 | 0.10 |
Distribution of UBS shares | | | | | | |
As of 31 December 2015 | | Shareholders registered | | Shares registered |
Number of shares registered | | Number | % | | Number | % of shares issued |
1–100 | | 29,221 | 11.6 | | 1,648,134 | 0.0 |
101–1,000 | | 136,820 | 54.5 | | 63,725,129 | 1.7 |
1,001–10,000 | | 77,651 | 30.9 | | 216,755,778 | 5.6 |
10,001–100,000 | | 6,603 | 2.6 | | 153,005,195 | 4.0 |
100,001–1,000,000 | | 526 | 0.2 | | 150,958,478 | 3.9 |
1,000,001–5,000,000 | | 90 | 0.0 | | 196,661,505 | 5.1 |
5,000,001–38,497,315 (1%) | | 26 | 0.0 | | 301,464,993 | 7.8 |
1–2% | | 1 | 0.0 | | 41,946,308 | 1.1 |
2–3% | | 2 | 0.0 | | 177,165,956 | 4.6 |
3–4% | | 1 | 0.0 | | 138,540,340 | 3.6 |
4–5% | | 0 | 0.0 | | 0 | 0.0 |
Over 5% | | 3¹ | 0.0 | | 833,880,862 | 21.7 |
Total registered | | 250,944 | 100.0 | | 2,275,752,678² | 59.1 |
Unregistered³ | | | | | 1,573,978,857 | 40.9 |
Total shares issued | | | | | 3,849,731,535 | 100.0 |
1 On 31 December 2015, Chase Nominees Ltd., London, entered as a trustee / nominee, was registered with 9.14% of all UBS shares issued. However, according to the provisions of UBS Group AG, voting rights of trustees / nominees are limited to a maximum of 5% of all UBS shares issued. The US securities clearing organization DTC (Cede & Co.), New York, was registered with 6.14% of all UBS shares issued and is not subject to this 5% voting limit as a securities clearing organization. The same applies to the GIC Private Limited, Singapore, which was registered as beneficial owner with 6.38% of all UBS shares issued. 2 Of the total shares registered, 405,558,479 shares did not carry voting rights. 3 Shares not entered in the UBS share register as of 31 December 2015. |
Conditional share capital
At year-end 2015, the following conditional share capital was available to UBS Group AG's BoD:
At the Extraordinary General Meeting (EGM) held on 26 November 2014, the shareholders approved the increase of conditional capital to be issued through the voluntary or mandatory exercise of conversion rights and / or warrants to a maximum of CHF 38,000,000 represented by up to 380,000,000 fully paid registered shares with a nominal value of CHF 0.10 each. In 2015, the BoD has not made use of the allowance to issue such bonds or warrants.
At the same EGM, the shareholders also approved the increase of the conditional capital to be issued upon exercise of employees’ options. By 31 December 2015, options on 4,952,505 shares were exercised under the employee option plan with a total of 131,029,690 conditional capital shares being available at the end of 2015 to satisfy further exercises of options.
® Refer to article 4a of UBS Group AG’s Articles of Association for more information on the terms and conditions of the issue of shares out of existing conditional capital. The Articles of Association are available on our website at www.ubs.com/governance
Authorized share capital
UBS Group AG had no authorized capital available on 31 December 2015.
On 10 February 2015, UBS Group AG’s BoD increased the ordinary share capital of UBS Group AG out of authorized share capital by CHF 1,180,025 by means of a contribution in kind in the form of UBS AG shares acquired subsequent to the end of the exchange offer on a share-for-share basis via private exchanges on the same terms and conditions as the exchange offer. On the same basis, UBS Group AG’s BoD increased the ordinary share capital of UBS Group AG out of authorized share capital on 9 March 2015 and on 12 June 2015 by CHF 952,500 and CHF 1,750,000, respectively.
On 28 August 2015, UBS Group AG’s BoD increased the ordinary share capital of UBS Group AG out of authorized share capital by CHF 8,882,545.60 by means of a contribution in kind in the form of UBS AG shares. They corresponded to the shares held by the minority shareholders of UBS AG which were canceled following the Commercial Court of Zurich's declaration of their invalidity in accordance with the request of UBS Group AG pursuant to article 33 of the Swiss Stock Exchange Act (currently, article 137 of the Swiss Financial Market Infrastructure Act). As a result, holders of UBS AG shares were compensated through the delivery of the newly issued UBS Group AG shares on a share-for-share basis in accordance with the exchange ratio of the 2014 exchange offer. On the same date, the Articles of Association were amended to completely remove the provision on authorized capital.
Conditional capital of UBS Group AG | | | |
| Maximum number of shares to be issued | Year approved by Extraor- dinary General Meeting | % of shares issued |
| 31.12.15 | | 31.12.15 |
Employee equity participation plans | 131,029,690 | 2014 | 3.40% |
Conversion rights / warrants granted in connection with bonds | 380,000,000 | 2014 | 9.87% |
Total | 511,029,690 | | 13.27% |
Corporate governance, responsibility and compensation
Corporate governance
Shareholders, legal entities and nominees: type and geographical distribution |
| | | | | | | | | | | Shareholders registered |
As of 31 December 2015 | | | | | | | | | | | Number | % |
Individual shareholders | | | | | | | | | | | 245,294 | 97.7 |
Legal entities | | | | | | | | | | | 5,355 | 2.1 |
Nominees, fiduciaries | | | | | | | | | | | 295 | 0.1 |
Total registered shares | | | | | | | | | | | | |
Unregistered shares | | | | | | | | | | | | |
Total | | | | | | | | | | | 250,944 | 100.0 |
| | | | | | | | | | | | |
| | Individual shareholders | | Legal entities | | Nominees | | Total |
| | Number | % | | Number | % | | Number | % | | Number | % |
Americas | | 6,775 | 2.7 | | 197 | 0.1 | | 146 | 0.1 | | 7,118 | 2.8 |
of which: USA | | 5,961 | 2.4 | | 103 | 0.0 | | 135 | 0.1 | | 6,199 | 2.5 |
Asia Pacific | | 5,691 | 2.3 | | 168 | 0.1 | | 18 | 0.0 | | 5,877 | 2.3 |
Europe, Middle East and Africa | | 13,432 | 5.4 | | 275 | 0.1 | | 88 | 0.0 | | 13,795 | 5.5 |
of which: Germany | | 4,512 | 1.8 | | 26 | 0.0 | | 6 | 0.0 | | 4,544 | 1.8 |
of which: UK | | 4,877 | 1.9 | | 14 | 0.0 | | 7 | 0.0 | | 4,898 | 2.0 |
of which: Rest of Europe | | 3,807 | 1.5 | | 225 | 0.1 | | 75 | 0.0 | | 4,107 | 1.6 |
of which: Middle East and Africa | | 236 | 0.1 | | 10 | 0.0 | | 0 | 0.0 | | 246 | 0.1 |
Switzerland | | 219,396 | 87.4 | | 4,715 | 1.9 | | 43 | 0.0 | | 224,154 | 89.3 |
Total registered shares | | | | | | | | | | | | |
Unregistered shares | | | | | | | | | | | | |
Total | | 245,294 | 97.7 | | 5,355 | 2.1 | | 295 | 0.1 | | 250,944 | 100.0 |
Changes of shareholders’ equity and shares
In accordance with International Financial Reporting Standards, Group equity attributable to UBS Group AG shareholders amounted to CHF 55.3 billion as of 31 December 2015 (2014: CHF 50.6 billion) (for reference, equity attributable to UBS AG shareholders as of 31 December 2013 amounted to CHF 48.0 billion). UBS Group AG shareholders’ equity was represented by 3,849,731,535 issued shares as of 31 December 2015 (2014: 3,717,128,324 shares) (for reference, UBS AG shareholders’ equity in 2013: 3,842,002,069 shares).
® Refer to the “Statement of changes in equity” in the “Consolidated financial statements” section of this report for more information on changes in shareholders’ equity over the last three years
Ownership
Ownership of UBS Group AG shares is widely spread. The tables in this section provide information about the distribution of UBS Group AG shareholders by category and geographic location. This information relates only to registered shareholders and cannot be assumed to be representative of UBS Group AG’s entire investor base or the actual beneficial ownership. Only shareholders registered in the share register as “shareholders with voting rights” are entitled to exercise voting rights.
® Refer to “Shareholders’ participation rights” in this section for more information
As of 31 December 2015, 1,870,194,199 UBS Group AG shares carried voting rights, 405,558,479 shares were entered in the share register without voting rights and 1,573,978,857 shares were not registered. All shares were fully paid up and eligible for dividends. There are no preferential rights for shareholders, and no other classes of shares are issued by UBS Group AG.
At year-end 2015, we owned 98,706,275 UBS Group AG registered shares corresponding to 2.56% of the total share capital of UBS Group AG. At the same time, we had disposal positions relating to 222,146,535 voting rights of UBS Group AG, corresponding to 5.77% of the total voting rights of UBS Group AG. 5.55% thereof consisted of voting rights on shares deliverable in respect of employee awards. The calculation methodology for the disposal position is based on the FMIO-FINMA (formerly SESTO-FINMA), which sets forth that all future potential share delivery obligations irrespective of the contingent nature of the delivery must be taken into account.
| | | | | | | | | | |
| | | | | | | | | Shares registered |
| | | | | | | | | Number | % |
| | | | | | | | | 426,978,962 | 11.1 |
| | | | | | | | | 761,957,075 | 19.8 |
| | | | | | | | | 1,086,816,641 | 28.2 |
| | | | | | | | | 2,275,752,678 | 59.1 |
| | | | | | | | | 1,573,978,857 | 40.9 |
| | | | | | | | | 3,849,731,535 | 100.0 |
| | | | | | | | | | |
Individual shareholders | | Legal entities | | Nominees | | Total |
Number of shares | % | | Number of shares | % | | Number of shares | % | | Number of shares | % |
19,253,355 | 0.5 | | 52,576,724 | 1.4 | | 323,042,407 | 8.4 | | 394,872,486 | 10.3 |
17,436,861 | 0.5 | | 48,488,553 | 1.3 | | 322,827,025 | 8.4 | | 388,752,439 | 10.1 |
23,032,675 | 0.6 | | 321,847,156 | 8.4 | | 9,025,021 | 0.2 | | 353,904,852 | 9.2 |
41,515,370 | 1.1 | | 30,511,029 | 0.8 | | 735,670,963 | 19.1 | | 807,697,362 | 21.0 |
13,368,267 | 0.3 | | 274,041 | 0.0 | | 15,412,578 | 0.3 | | 29,054,886 | 0.7 |
18,638,367 | 0.5 | | 2,205,727 | 0.1 | | 577,682,051 | 15.0 | | 598,526,145 | 15.5 |
8,899,611 | 0.2 | | 27,621,991 | 0.7 | | 142,576,334 | 3.7 | | 179,097,936 | 4.7 |
609,125 | 0.0 | | 409,270 | 0.0 | | 0 | 0.0 | | 1,018,395 | 0.0 |
343,177,562 | 8.9 | | 357,022,166 | 9.3 | | 19,078,250 | 0.5 | | 719,277,978 | 18.7 |
426,978,962 | 11.1 | | 761,957,075 | 19.8 | | 1,086,816,641 | 28.2 | | 2,275,752,678 | 59.1 |
0 | | | 0 | | | 0 | | | 1,573,978,857 | 40.9 |
426,978,962 | 11.1 | | 761,957,075 | 19.8 | | 1,086,816,641 | 28.2 | | 3,849,731,535 | 100.0 |
Shares and participation certificates
We have only one unified class of UBS Group AG's shares issued in registered form. These shares are traded and settled as global registered shares. Each registered share has a par value of CHF 0.10 and carries one vote subject to the restrictions set out under “Transferability, voting rights and nominee registration.” Global registered shares provide direct and equal ownership for all shareholders, irrespective of the country and stock exchange on which they are traded. We have no participation certificates outstanding.
® Refer to “UBS shares” in the “Capital management” section of this report for more information
Corporate governance, responsibility and compensation
Corporate governance
Distributions to shareholders
The decision to pay a dividend and the amount of any dividend, depend on a variety of factors, including our profits and cash flow generation and on the maintenance of our targeted capital ratios.
At the AGM 2016, UBS’s BoD intends to propose to shareholders an ordinary dividend of CHF 0.60 per share, a 20% increase from the previous year's ordinary dividend payment, reflecting profit for the financial year 2015, and a special dividend of CHF 0.25 per share, reflecting a significant net upward revaluation of deferred tax assets in 2015.
The total dividend will be paid out of capital contribution reserves, subject to shareholder approval.
Transferability, voting rights and nominee registration
We do not apply any restrictions or limitations on the transferability of shares. Voting rights may be exercised without any restrictions by shareholders entered into the share register if they expressly render a declaration of beneficial ownership according to the provisions of the Articles of Association.
We have special provisions for the registration of fiduciaries and nominees. Fiduciaries and nominees are entered in the share register with voting rights up to a total of 5% of all issued UBS Group AG shares if they agree to disclose, upon our request,
beneficial owners holding 0.3% or more of all issued UBS Group AG shares. An exception to the 5% voting limit rule is in place for securities clearing organizations, such as The Depository Trust Company in New York.
® Refer to “Shareholders’ participation rights” in this section for more information
Convertible bonds and options
As of 31 December 2015, there were no contingent capital securities or convertible bonds outstanding requiring the issuance of new shares.
® Refer to the “Capital management” section of this report for more information on our outstanding capital instruments
As of 31 December 2015, there were 93,367,982 employee options outstanding, including stock appreciation rights. Options and stock appreciation rights equivalent to 18,189,195 shares were in-the-money and exercisable. Option-based compensation plans are sourced by either purchasing UBS Group AG shares in the market or issuing new shares out of conditional capital. As mentioned above, as of 31 December 2015, 131,029,690 unissued shares in conditional share capital were available for this purpose.
® Refer to “Conditional share capital” in this section for more information on outstanding options
Shareholders´ participation rights
We are committed to shareholder participation in our decision-making process. Around 250,000 shareholders are directly registered, some 150,000 US shareholders via nominee companies. Shareholders are regularly informed about our activities and performance, and are personally invited to the general meetings of shareholders.
® Refer to “Information policy” in this section for more information
Registered shareholders can access personalized services and important information related to share register entries and our general meetings of shareholders at www.ubs.com/shareholderportal. They can also enter their voting instructions electronically through the shareholder portal ahead of our general meetings of shareholders, and they can verify their voting instructions before and after the general meetings using cryptography. This method of encryption ensures that the voting instructions remain secret through the entire voting process. In addition, shareholders can order admission cards and register changes to their address details. The website also allows them to manage their subscriptions to shareholder-related publications and to communicate directly with UBS Shareholder Services via a secure channel. The shareholder portal is fully integrated into our website.
For UBS Group AG's Annual General Meeting (AGM) 2016, we intend to send to registered shareholders, who have explicitly applied for and accepted the terms of this specific procedure, an email notification informing them of the upcoming AGM and that their personalized AGM invitation and related documentation is available on the shareholder portal. These shareholders will not receive a separate invitation by ordinary mail.
Relations with shareholders
We fully subscribe to the principle of equal treatment of all shareholders, who range from large institutions to individual investors, and regularly inform them about Group developments.
The AGM offers shareholders the opportunity to raise any questions to the Board of Directors (BoD) and Group Executive Board (GEB), as well as to our internal and external auditors.
Voting rights, restrictions and representation
We place no restrictions on share ownership and voting rights. However, pursuant to general principles formulated by the BoD, nominee companies and trustees, who normally represent a large number of individual shareholders and may hold an unlimited number of shares, have voting rights limited to a maximum of 5% of all issued UBS Group AG shares in order to avoid the risk of unknown shareholders with large stakes being entered in the share register. Securities clearing organizations, such as The Depository Trust Company in New York, are not subject to this 5% voting limit.
In order to be recorded in the share register with voting rights, shareholders must confirm that they acquired UBS Group AG shares in their own name and for their own account. Nominee companies and trustees are required to sign an agreement confirming their willingness to disclose, upon our request, individual beneficial owners holding more than 0.3% of all issued UBS Group AG shares.
All shareholders registered with voting rights are entitled to participate in general meetings of shareholders. If they do not wish to attend in person, they can issue instructions to accept, reject or abstain on each individual item on the meeting agenda, either by giving instructions to an independent proxy elected by the UBS Group AG shareholders or by appointing another registered shareholder of their choice to vote on their behalf. Alternatively, registered shareholders can issue their voting instructions to the independent proxy electronically through our shareholder portal. Nominee companies normally submit the proxy material to the beneficial owners and transmit the collected votes to the independent proxy.
Statutory quorums
Motions, including the election and re-election of BoD members and the appointment of the auditors, are decided at a general meeting of shareholders by an absolute majority of the votes cast, excluding blank and invalid ballots. For the approval of certain specific issues, the Swiss Code of Obligations requires a positive vote from a two-thirds majority of the votes represented at a general meeting of shareholders, and from the absolute majority of the par value of shares represented at the meeting. Such issues include the creation of shares with privileged voting rights, the introduction of restrictions on the transferability of registered shares, conditional and authorized capital increases, and restrictions or exclusions of shareholders’ pre-emptive rights.
The Articles of Association also require a two-thirds majority of votes represented for approval of any change to provisions of the Articles regarding the number of BoD members and any decision to remove one quarter or more of the BoD members.
Votes and elections are normally conducted electronically to ascertain the exact number of votes cast. Voting by a show of hands remains possible if a clear majority is predictable. Shareholders representing at least 3% of the votes represented may request that a vote or election be carried out electronically or by written ballot. In order to allow shareholders to clearly express their views on all individual topics, each item on the agenda is put to a vote separately and BoD members are elected on a person-by-person basis.
Corporate governance, responsibility and compensation
Corporate governance
Convocation of general meetings of shareholders
The AGM must be held within six months of the close of the financial year (31 December) and normally takes place in early May. A personal invitation including a detailed agenda and explanation of each motion is made available to every registered shareholder at least 20 days ahead of the scheduled AGM. The meeting agenda is also published in the Swiss Official Gazette of Commerce and in selected Swiss newspapers, as well as on the Internet at www.ubs.com/agm.
Extraordinary General Meetings may be convened whenever the BoD or the auditors consider it necessary. Shareholders individually or jointly representing at least 10% of the share capital may, at any time including during an AGM, ask in writing for an Extraordinary General Meeting to be convened to address a specific issue they put forward.
Placing of items on the agenda
Pursuant to our Articles of Association, shareholders individually or jointly representing shares with an aggregate minimum par value of CHF 62,500 may submit proposals for matters to be placed on the agenda for consideration at the next AGM.
We publish the deadline for submitting such proposals in the Swiss Official Gazette of Commerce and on our website at www.ubs.com/agm. Requests for items to be placed on the agenda must include the actual motions to be put forward, together with a short explanation. The BoD formulates opinions on the proposals, which are published together with the motions.
Registrations in the share register
The general rules for entry with voting rights into our Swiss share register also apply before general meetings of shareholders. The same rules apply for our US transfer agent that operates the US share register for all UBS Group AG shares in a custodian account in the US. In order to determine the voting rights of each shareholder, our share register generally closes two business days before a shareholder meeting. Our independent proxy agent processes voting instructions from shareholders with voting power as long as technically possible, generally also until two business days before a shareholder meeting.
Board of Directors
The Board of Directors (BoD) of UBS Group AG and UBS AG, each under the leadership of the Chairman, consists of six to 12 members as per our Articles of Association (AoA). The BoD decides on the strategy of the Group upon recommendation of the Group Chief Executive Officer (Group CEO) and is responsible for the overall direction, supervision and control of the Group and its management, as well as for supervising compliance with applicable laws, rules and regulations. The BoD exercises oversight over UBS Group AG and its subsidiaries and is responsible for ensuring the establishment of a clear Group governance framework to ensure effective steering and supervision of the Group, taking into account the material risks to which UBS Group AG and its subsidiaries are exposed.
The BoD has ultimate responsibility for the success of the Group and for delivering sustainable shareholder value within a framework of prudent and effective controls, approves all financial statements for issue and appoints and removes all Group Executive Board (GEB) members.
Members of the Board of Directors
On 7 May 2015, Michel Demaré, David Sidwell, Reto Francioni, Ann F. Godbehere, Axel P. Lehmann, William G. Parrett, Isabelle Romy, Beatrice Weder di Mauro and Joseph Yam were re-elected as members of the BoD. Jes Staley, then Managing Partner at BlueMountain Capital Management LLC, was elected as a new member of the BoD, while Helmut Panke did not stand for re-election at the AGM 2015. Following their election, the BoD appointed Michel Demaré as Vice Chairman and David Sidwell as Senior Independent Director of UBS Group AG. At the same time, Axel A. Weber was re-elected Chairman of the Board
of Directors, and Ann F. Godbehere, Michel Demaré, Reto Francioni and Jes Staley were elected as members of the Compensation Committee. Additionally, ADB Altorfer Duss & Beilstein AG was elected independent proxy agent.
Following the announcement by Barclays Plc that Jes Staley would assume the role of CEO, UBS announced on 28 October 2015 that it had accepted his resignation from all his functions at UBS with immediate effect to avoid conflicts of interest. Moreover, on 3 November 2015, we announced various changes to our GEB and BoD, including the appointment of Axel P. Lehmann as Group Chief Operating Officer with effect from 1 January 2016. Consequently, he stepped down from the BoD and will not stand for re-election at the 2016 AGM. Axel P. Lehmann recused himself from the BoD meetings as of November 2015 due to his Group Executive Board nomination.
Our AoA limit the number of mandates that members of the BoD may hold outside the UBS Group. Article 31 of the AoA limits the maximum number of permitted mandates of members of the BoD to four board memberships in listed companies and five additional mandates in non-listed companies. Mandates in companies, which are controlled by us or which control us, are not subject to this limitation. In addition, members of the BoD may hold no more than 10 mandates at UBS's request and 10 mandates in associations, charitable organizations, foundations, trusts, and employee welfare foundations. No member of the BoD reaches the thresholds described in article 31 of the Articles of Association.
The following biographies provide information on the BoD members and the Group Company Secretary, including Axel P. Lehmann, as he was a member of the BoD as of 31 December 2015. As mentioned above, as of 1 January 2016 he joined the GEB. For reasons of transparency, the biographies include, in addition to information on mandates, information on memberships or other activities or functions, as required by the SIX Swiss Exchange Corporate Governance Directive.
All members of UBS Group AG's BoD are also members of UBS AG's BoD, and committee membership is the same for both entities.
Corporate governance, responsibility and compensation
Corporate governance


Axel A. Weber
German,
born 1957
UBS Group AG
Bahnhofstrasse 45
CH-8001 Zurich
Chairman of the Board of Directors / Chairperson of the Corporate Culture and Responsibility Committee / Chairperson of the Governance and Nominating Committee
Year of initial election to
UBS Group AG: 2014
Year of initial election to
UBS AG: 2012
Professional history and education
Axel A. Weber was elected to the Board of Directors (BoD) of UBS AG at the 2012 AGM and of UBS Group AG in November 2014. He is Chairman of the BoD of both UBS AG and UBS Group AG. He has chaired the Governance and Nominating Committee since 2012 and became Chairperson of the Corporate Culture and Responsibility Committee in 2013. Mr. Weber was president of the German Bundesbank between 2004 and 2011, during which time he also served as a member of the Governing Council of the European Central Bank, a member of the Board of Directors of the Bank for International Settlements, German governor of the International Monetary Fund, and as a member of the G7 and G20 Ministers and Governors. He was a member of the steering committees of the European Systemic Risk Board in 2011 and the Financial Stability Board from 2010 to 2011. On leave from the University of Cologne, he was a visiting professor at the University of Chicago Booth School of Business from 2011 to 2012. From 2002 to 2004, Mr. Weber served as a member of the German Council of Economic Experts. He was a professor of international economics and Director of the Center for Financial Research at the University of Cologne from 2001 to 2004, and a professor of monetary economics and Director of the Center for Financial Studies at the Goethe University in Frankfurt am Main from 1998 to 2001. From 1994 to 1998, he was a professor of economic theory at the University of Bonn. Mr. Weber holds a PhD in economics from the University of Siegen, where he also received his habilitation. He graduated with a master’s degree in economics at the University of Constance and holds honorary doctorates from the universities of Duisburg-Essen and Constance.
Other activities and functions
– Board member of the Swiss Bankers Association
– Member of the Board of Trustees of Avenir Suisse
– Advisory Board member Zukunft Finanzplatz
– Board member of the Swiss Finance Council
– Board member of the Institute of International Finance
– Board member of the International Monetary Conference
– Member of the European Financial Services Round Table
– Member of the European Banking Group
– Member of the International Advisory Panel, Monetary Authority of Singapore
– Board member of the Financial Services Professional Board, Kuala Lumpur
– Member of the Group of Thirty, Washington, DC
– Chairman of the DIW Berlin Board of Trustees
– Advisory Board member of the Department of Economics at the University of Zurich
Michel Demaré
Belgian,
born 1956
Syngenta International AG
Schwarzwaldallee 215
CH-4058 Basel
Independent Vice Chairman / member of the Audit Committee / member of the Compensation Committee / member of the Governance and Nominating Committee
Year of initial election to
UBS Group AG: 2014
Year of initial election to
UBS AG: 2009
Professional history and education
Michel Demaré was elected to the BoD of UBS AG at the 2009 AGM and of UBS Group AG in November 2014. In April 2010, he was appointed independent Vice Chairman. He has been a member of the Audit Committee since 2009 and the Governance and Nominating Committee since 2010. He became a member of the Compensation Committee in 2013. Mr. Demaré joined ABB in 2005 as Chief Financial Officer (CFO) and as a member of the Group Executive Committee. He stepped down from his function in ABB in January 2013. Between February and August 2008, he acted as the interim CEO of ABB. From September 2008 to March 2011, he combined his role as CFO with that of President of Global Markets. Mr. Demaré joined ABB from Baxter International Inc., where he was CFO Europe from 2002 to 2005. Prior to this, he spent 18 years at the Dow Chemical Company, holding various treasury and risk management positions in Belgium, France, the US and Switzerland. Between 1997 and 2002, Mr. Demaré was CFO of the Global Polyolefins and Elastomers division. He began his career as an officer in the multinational banking division of Continental Illinois National Bank of Chicago, and was based in Antwerp. Mr. Demaré graduated with an MBA from the Katholieke Universiteit Leuven, Belgium, and holds a degree in applied economics from the Université Catholique de Louvain, Belgium.
Other activities and functions
– Chairman of the Board of Syngenta
– Board member of Louis-Dreyfus Commodities Holdings BV
– Supervisory Board member of IMD, Lausanne
– Chairman of the Syngenta Foundation for Sustainable Agriculture
– Advisory Board member of the Department of Banking and Finance at the University of Zurich
– Advisory Board member of Zukunft Finanzplatz


David Sidwell
American (US) and British,
born 1953
UBS Group AG
Bahnhofstrasse 45
CH-8001 Zurich
Senior Independent Director / Chairperson of the Risk Committee / member of the Governance and Nominating Committee
Year of initial election to
UBS Group AG: 2014
Year of initial election to
UBS AG: 2008
Professional history and education
David Sidwell was elected to the BoD of UBS AG at the 2008 AGM and of UBS Group AG in November 2014. In April 2010, he was appointed Senior Independent Director. He has chaired the Risk Committee since 2008 and has been a member of the Governance and Nominating Committee since 2011. Mr. Sidwell was Executive Vice President and CFO of Morgan Stanley between 2004 and 2007. Before joining Morgan Stanley he worked for JPMorgan Chase & Co., where, in his 20 years of service, he held a number of different positions, including controller and, from 2000 to 2004, CFO of the Investment Bank. Prior to this, he was with Price Waterhouse in both London and New York. Mr. Sidwell graduated from Cambridge University and qualified as a chartered accountant with the Institute of Chartered Accountants in England and Wales.
Other activities and functions
– Director and Chairperson of the Risk Policy and Capital Committee of Fannie Mae, Washington, DC
– Senior advisor at Oliver Wyman, New York
– Board member of Chubb Limited
– Board member of GAVI Alliance
– Chairman of the Board of Village Care, New York
– Director of the National Council on Aging, Washington, DC
Reto Francioni
Swiss,
born 1955
UBS Group AG
Bahnhofstrasse 45
CH-8001 Zurich
Member of the Compensation Committee / member of the Corporate Culture and Responsibility Committee / member of the Risk Committee
Year of initial election to
UBS Group AG: 2014
Year of initial election to
UBS AG: 2013
Professional history and education
Reto Francioni was elected to the BoD of UBS AG at the 2013 AGM and of UBS Group AG in November 2014. He has been a member of the Corporate Culture and Responsibility Committee since 2013, the Compensation Committee since 2014 and the Risk Committee since 2015. He was CEO of Deutsche Börse AG from 2005 to 2015. Since 2006, he has been a professor of applied capital markets theory at the University of Basel. From 2002 to 2005, he was Chairman of the Supervisory Board and President of the SWX Group, Zurich. Mr. Francioni was co-CEO and Spokesman for the Board of Directors of Consors AG, Nuremberg, from 2000 to 2002. Between 1993 and 2000, he held various management positions at Deutsche Börse AG, including that of Deputy CEO from 1999 to 2000. From 1992 to 1993, he served in the corporate finance division of Hoffmann-La Roche, Basel. Prior to this, he was on the executive board of Association Tripartite Bourses for several years. From 1985 to 1988, he worked for the former Credit Suisse, holding positions in the equity sales and legal departments. He started his professional career in 1981 in the commerce division of Union Bank of Switzerland. Mr. Francioni completed his studies in law in 1981 and his PhD in 1987 at the University of Zurich.
Other activities and functions
– Board member of Francioni AG
– Board member Swiss International Air Lines
– Board member of MedTech Innovation Partners AG
Corporate governance, responsibility and compensation
Corporate governance


Ann F. Godbehere
Canadian and British,
born 1955
UBS Group AG
Bahnhofstrasse 45
CH-8001 Zurich
Chairperson of the Compensation Committee / member of the Audit Committee
Year of initial election to
UBS Group AG: 2014
Year of initial election to
UBS AG: 2009
Professional history and education
Ann F. Godbehere was elected to the BoD of UBS AG at the 2009 AGM and of UBS Group AG in November 2014. She has chaired the Compensation Committee since 2011 and has been a member of the Audit Committee since 2009. Ms. Godbehere was appointed CFO and Executive Director of Northern Rock in February 2008, serving in these roles during the initial phase of the business’s public ownership until the end of January 2009. Prior to this role, she served as CFO of Swiss Re Group from 2003 to 2007. Ms. Godbehere was CFO of its Property & Casualty division in Zurich for two years. Prior to this, she served as CFO of the Life & Health division in London for three years. From 1997 to 1998, she was CEO of Swiss Re Life & Health Canada and head of IT for Swiss Re in North America. Between 1996 and 1997, she was CFO of Swiss Re Life & Health North America. Ms. Godbehere is a certified general accountant and was made a fellow of the Chartered Professional Accountant Association in 2014 and fellow of the Certified General Accountant Association of Canada in 2003.
Other activities and functions
– Board member of Prudential plc (chairman of the audit committee)
– Board member of Rio Tinto plc (chairman of the audit committee)
– Board member of Rio Tinto Limited (chairman of the audit committee)
– Board member of British American Tobacco plc
William G. Parrett
American (US),
born 1945
UBS Group AG
Bahnhofstrasse 45
CH-8001 Zurich
Chairperson of the Audit Committee / member of the Compensation Committee / member of the Corporate Culture and Responsibility Committee
Year of initial election to
UBS Group AG: 2014
Year of initial election to
UBS AG: 2008
Professional history and education
William G. Parrett was elected to the BoD of UBS AG at the October 2008 Extraordinary General Meeting and of UBS Group AG in November 2014. He has chaired the Audit Committee since 2009, has been a member of the Corporate Culture and Responsibility Committee since 2012 and the Compensation Committee since 2015. Mr. Parrett served his entire career with Deloitte Touche Tohmatsu. He was CEO from 2003 until his retirement in 2007. Between 1999 and 2003, he was a Managing Partner of Deloitte & Touche USA LLP and served on Deloitte’s Global Executive Committee between 1999 and 2007. Mr. Parrett founded Deloitte’s US National Financial Services Industry Group in 1995 and its Global Financial Services Industry Group in 1997, both of which he led as Chairman. In his 40 years of experience in professional services, Mr. Parrett served public, private, governmental, and state-owned clients worldwide. Mr. Parrett has a bachelor’s degree in accounting from St. Francis College, New York, and is a certified public accountant (New York).
Other activities and functions
– Board member of the Eastman Kodak Company (chairman of audit committee)
– Board member of the Blackstone Group LP (chairman of audit committee and chairman of the conflicts committee)
– Board member of Thermo Fisher Scientific Inc. (chairman of audit committee)
– Member of the Committee on Capital Markets Regulation
– Member of the Carnegie Hall Board of Trustees
– Past Chairman of the Board of the United States Council for International Business
– Past Chairman of United Way Worldwide


Isabelle Romy
Swiss,
born 1965
Froriep
Bellerivestrasse 201
CH-8034 Zurich
Member of the Audit Committee / member of the Governance and Nominating Committee
Year of initial election to
UBS Group AG: 2014
Year of initial election to
UBS AG: 2012
Professional history and education
Isabelle Romy was elected to the BoD of UBS AG at the 2012 AGM and of UBS Group AG in November 2014. She has been a member of the Audit Committee and the Governance and Nominating Committee since 2012. Ms. Romy is a partner at Froriep, a large Swiss business law firm. From 1995 to 2012, she worked for another major Swiss law firm based in Zurich, where she was a partner from 2003 to 2012. Her legal practice includes litigation and arbitration in cross-border cases. Ms. Romy has been an associate professor at the University of Fribourg and at the Federal Institute of Technology in Lausanne (EPFL) since 1996. Between 2003 and 2008, she served as a deputy judge at the Swiss Federal Supreme Court. From 1999 to 2006, she was a member of the Ethics Commission at the EPFL. Ms. Romy earned her PhD in law (Dr. iur.) at the University of Lausanne in 1990 and has been a qualified attorney-at-law admitted to the bar since 1991. From 1992 to 1994, she was a visiting scholar at Boalt Hall School of Law, University of California, Berkeley, and completed her professorial thesis at the University of Fribourg in 1996.
Other activities and functions
– Vice Chairman of the Sanction Commission of SIX Swiss Exchange
– Member of the Fundraising Committee of the Swiss National Committee for UNICEF
Beatrice Weder di Mauro
Italian and Swiss,
born 1965
Johannes Gutenberg University Mainz
Jakob Welder-Weg 4
D-55099 Mainz
Member of the Audit Committee / member of the Risk Committee
Year of initial election to
UBS Group AG: 2014
Year of initial election to
UBS AG: 2012
Professional history and education
Beatrice Weder di Mauro was elected to the BoD of UBS AG at the 2012 AGM and of UBS Group AG in November 2014. She has been a member of the Audit Committee since 2012 and became a member of the Risk Committee in 2013. She has been a professor of economics, economic policy and international macroeconomics at the Johannes Gutenberg University of Mainz since 2001. Ms. Weder di Mauro was a member of the German Council of Economic Experts from 2004 to 2012. In 2010, she was a resident scholar at the International Monetary Fund (IMF) in Washington, DC, and, in 2006, a visiting scholar at the National Bureau of Economic Research, Cambridge, MA. She was an associate professor of economics at the University of Basel between 1998 and 2001 and a research fellow at the United Nations University in Tokyo from 1997 to 1998. Prior to this, she was an economist at the IMF in Washington, DC. Ms. Weder di Mauro earned her PhD in economics at the University of Basel in 1993 and received her habilitation there in 1999.
Other activities and functions
– Supervisory Board member of Robert Bosch GmbH, Stuttgart
– Member of the ETH Zurich Foundation Board of Trustees
– Economic Advisory Board member of Fraport AG
– Advisory Board member of Deloitte Germany
– Deputy Chairman of the University Council of the University of Mainz
– Member of the Senate of the Max Planck Society
Corporate governance, responsibility and compensation
Corporate governance


Joseph Yam
Chinese and Hong Kong citizen,
born 1948
UBS Group AG
Bahnhofstrasse 45
CH-8001 Zurich
Member of the Corporate Culture and Responsibility Committee / member of the Risk Committee
Year of initial election to
UBS Group AG: 2014
Year of initial election to
UBS AG: 2011
Professional history and education
Joseph Yam was elected to the BoD of UBS AG at the 2011 AGM and of UBS Group AG in November 2014. He has been a member of the Corporate Culture and Responsibility Committee and the Risk Committee since 2011. He is Executive Vice President of the China Society for Finance and Banking and in that capacity has served as an advisor to the People’s Bank of China since 2009. Mr. Yam was instrumental in the establishment of the Hong Kong Monetary Authority and served as Chief Executive from 1993 until his retirement in 2009. He began his career in Hong Kong as a statistician in 1971 and served the public for over 38 years. During his service, he occupied several positions such as Director of the Office of the Exchange Fund from 1991, Deputy Secretary for Monetary Affairs from 1985 and Principal Assistant Secretary for Monetary Affairs from 1982. Mr. Yam graduated from the University of Hong Kong in 1970 with first class honors in social sciences. He holds honorary doctorate degrees and professorships from a number of universities in Hong Kong and overseas.
Other activities and functions
– Board member of Johnson Electric Holdings Limited
– Board member of UnionPay International Co., Ltd.
– Board member of The Community Chest of Hong Kong
– International Advisory Council member of China Investment Corporation
– Distinguished Research Fellow at the Institute of Global Economics and Finance at the Chinese University of Hong Kong
Group Company Secretary
Luzius Cameron
Australian and Swiss,
born 1955
UBS Group AG
Bahnhofstrasse 45
CH-8001 Zurich
Group Company Secretary for UBS Group AG since 2014 and for UBS AG since 2005
Professional history and education
Luzius Cameron was appointed Group Company Secretary of UBS AG by the BoD for the first time in 2005 and of UBS Group AG in November 2014. He has been Company Secretary of UBS Switzerland AG and UBS Business Solutions AG since 2015. He is a Group Managing Director and was appointed to the former Group Managing Board in 2002. From 2002 to 2005, Mr. Cameron was the Director of Strategic Planning and New Business Development, Wealth Management USA. Prior to this role, he was Head of Group Strategic Analysis, and before that, Head of Corporate Business Analysis. Mr. Cameron joined Swiss Bank Corporation in 1989, where he started out in Corporate Controlling before assuming a number of senior roles at Warburg Dillon Read, including Chief of Staff to the Chief Operating Officer in London and Business Manager of the Global Rates Business in Zurich. From 1984 to 1989, he was a lecturer in astrophysics at the University of Basel. Between 1980 and 1989, he was a research analyst at the Institute of Astronomy at the University of Basel and European Southern Observatory. Mr. Cameron holds a PhD in astrophysics from the University of Basel.
Member of the Board of Directors
until 31 December 2015
Axel P. Lehmann
Swiss,
born 1959
UBS Group AG
Bahnhofstrasse 45
CH-8001 Zurich
Member of the Risk Committee until 31 December 2015
Year of initial election to
UBS Group AG: 2014
Year of initial election to
UBS AG: 2009
Professional history and education
Axel P. Lehmann became a member of the GEB and was appointed Group Chief Operating Officer of UBS Group AG and UBS AG in January 2016. He was a member of the BoD of UBS AG from 2009 to 2015 and of UBS Group AG from 2014 to 2015. During his entire tenure on the Board, he had been a member of the Risk Committee and, from 2011 to 2013, a member of the Governance and Nominating Committee. Mr. Lehmann became a member of Zurich Insurance Group’s (Zurich) Group Executive Committee in 2002, holding various management positions, including CEO for the European and North America businesses, and from 2008 to 2015 as Chief Risk Officer with additional responsibilities for Group IT, as Regional Chairman for Europe, Middle East and Africa and as Chairman for Farmers Group Inc. In 2001 he was appointed CEO for Northern, Central and Eastern Europe and Zurich Group Germany, having served as a member of the company's Group Management Board since 2000 with responsibility for group-wide business development functions. In 1996, he joined Zurich as a member of the Executive Committee of Zurich Switzerland and subsequently held various executive management and corporate development positions within Zurich Switzerland. Prior to joining Zurich, Mr. Lehmann was head of corporate planning and controlling at Swiss Life, project manager and Vice President of the Institute of Insurance Economics at the University of St. Gallen and visiting professor at Bocconi University in Milan. Mr. Lehmann holds a PhD and a master’s degree in business administration and economics from the University of St. Gallen. He is also a graduate of the Wharton Advanced Management Program and an honorary professor of business administration and service management at the University of St. Gallen.
Other activities and functions
– Chairman of the Global Agenda Council on the Global Financial System of WEF
– Chairman of the Board of the Institute of Insurance Economics of the University of St. Gallen
– Member of the International and Alumni Advisory Board of the University of St. Gallen
– Member of the Swiss-American Chamber of Commerce Chapter Doing Business in USA
Corporate governance, responsibility and compensation
Corporate governance
Elections and terms of office
The BoD proposes the individual nominated to be Chairman, who in turn is elected by shareholders at the AGM.
In addition, shareholders elect each member of the BoD individually, as well as the members of the Compensation Committee on an annual basis. The BoD in turn appoints one or more Vice Chairmen, a Senior Independent Director, the members of the BoD committees and their respective Chairpersons, and the Group Company Secretary.
As set out in the Organization Regulations, BoD members are normally expected to serve for a minimum of three years. No BoD member may serve for more than 10 consecutive terms of office or continue to serve beyond the AGM held in the calendar year following their 70th birthday. In exceptional circumstances, the BoD may extend both these limits.
Organizational principles and structure
Following each AGM, the BoD meets to appoint one or more Vice Chairmen, a Senior Independent Director, the BoD committee members, other than the Compensation Committee members who are elected by the shareholders, and their respective Chairpersons. At the same meeting, the BoD appoints a Group Company Secretary, who acts as secretary to the BoD and its committees.
According to the Articles of Association, the BoD meets as often as business requires, but must meet at least six times a year. During 2015, a total of 24 BoD meetings and calls were held, 13 of which were attended by GEB members. On average,
97% of BoD members were present at all BoD meetings. In addition to the BoD meetings attended by the GEB, the Group CEO partly attended most meetings of the BoD without GEB participation. The average duration of these meetings and calls was two hours. In 2015, for both UBS Group AG and UBS AG, the frequency and length of meetings were the same.
At every BoD meeting, each committee chairperson provides the BoD with an update on current activities of his or her committee as well as important committee issues.
At least once a year, the BoD reviews its own performance as well as the performance of each of its committees. This review is based on an assessment of the BoD under the auspices of the Governance and Nominating Committee, as well as on a self-assessment of the BoD committees, and seeks to determine whether the BoD and its committees are functioning effectively and efficiently. In 2014, the BoD committees performed a self-assessment and concluded that the BoD was operating effectively. At least every three years, the BoD assessments include an appraisal by an external expert. For 2015, such BoD assessments were conducted by a third party and will be completed in spring 2016.
The committees listed on the following pages assist the BoD in the performance of its responsibilities. These committees and their charters are described in the Organization Regulations, published at www.ubs.com/governance. Topics of common interest or affecting more than one committee were discussed at joint committees’ meetings. During 2015, seven joint committees’ meetings were held for UBS Group AG (the same number of meetings were also held for UBS AG).
Board and committee meetings in 2015¹ | | | | | | | |
| BoD²˒³˒⁴ | AC⁵ | CCRC⁶ | Comp Com⁷˒⁴ | GNC⁸ | RC⁹˒³˒⁴ | SC¹⁰ |
Total number of meetings | 24 | 20 | 5 | 8 | 8 | 14 | 6 |
Number of meetings with full attendance | 16 | 12 | 4 | 5 | 5 | 10 | 3 |
Number of meetings with one member absent | 8 | 8 | 1 | 3 | 3 | 3 | 3 |
Number of meetings with two or more members absent | 0 | 0 | 0 | 0 | 0 | 1 | 0 |
Overall average meeting attendance¹¹ | 97% | 92% | 95% | 91% | 91% | 93% | 83% |
Minimal attendance at one single meeting | 89% | 80% | 75% | 75% | 75% | 60% | 67% |
Legend: BoD = Board of Directors, AC = Audit Committee, CCRC = Corporate Culture and Responsibility Committee, Comp Com = Compensation Committee, GNC = Governance and Nominating Committee, RC = Risk Committee, SC = Special Committee |
1 Includes conference calls. 2 The BoD consisted of 11 members at the beginning of 2015 and 10 at the end of the year: Helmut Panke did not stand for re-election at the AGM on 7 May 2015, Jes Staley was newly elected at the AGM on 7 May 2015 and resigned at the end of October 2015, and Axel P. Lehmann stepped down from the BoD as of 31 December 2015 and joined the GEB on 1 January 2016. 3 Axel P. Lehmann recused himself from the BoD meetings as of November 2015 due to his GEB nomination. 4 Helmut Panke accepted the invitation to remain on the BoD in 2014 but did not stand for re-election at the AGM on 7 May 2015. Due to short-term meeting date changes he was unable to attend several meetings, but was nevertheless a very active member. 5 The Audit Committee consisted of the same five members at the beginning and at the end of 2015. 6 The Corporate Culture and Responsibility Committee consisted of the same four members at the beginning and at the end of 2015. 7 The Compensation Committee consisted of four members at the beginning and at the end of 2015. Two members of the Compensation Committee resigned during the year and were both replaced. 8 The Governance and Nominating Committee consisted of the same four members at the beginning and at the end of 2015. 9 The Risk Committee consisted of five members at the beginning of 2015 and five members at the end of the year including one change in the composition. 10 The Special Committee consisted of the same three members at the beginning and at the end of 2015. All meetings were ad hoc. 11 For UBS Group AG and UBS AG the same number of meetings were held. |
Audit Committee
EDTF | The Audit Committee consists of five BoD members, all of whom were determined by the BoD to be fully independent. The Audit Committee members, as a group, must have the necessary qualifications and skills to perform all of their duties and must, together, possess financial literacy and experience in banking and risk management. On 31 December 2015, William G. Parrett chaired the Audit Committee, with Michel Demaré, Ann F. Godbehere, Isabelle Romy and Beatrice Weder di Mauro as additional members.
The Audit Committee itself does not perform audits, but monitors the work of the external auditors, Ernst & Young Ltd (EY), who in turn are responsible for auditing UBS Group AG’s and UBS AG’s consolidated and standalone annual financial statements and for reviewing the quarterly financial statements.
The function of the Audit Committee is to serve as an independent and objective body with oversight of the following: (i) UBS Group AG’s, UBS AG’s and the Group’s accounting policies, financial reporting and disclosure controls and procedures, (ii) the quality, adequacy and scope of external audit, (iii) UBS Group AG’s, UBS AG’s and the Group’s compliance with financial reporting requirements, (iv) senior management’s approach to internal controls with respect to the production and integrity of the financial statements and disclosure of the financial performance and (v) the performance of Group Internal Audit in conjunction with the Chairman. For these purposes, the Audit Committee has the authority to meet with regulators and external bodies, in consultation with the Group CEO. Senior management is responsible for the preparation, presentation and integrity of the financial statements. ▲
The Audit Committee reviews the annual financial statements of both UBS Group and UBS AG and the quarterly financial statements of UBS Group AG as well as the consolidated annual report of the Group, as proposed by management, with the external auditors and Group Internal Audit in order to recommend their approval (including any adjustments the Audit Committee considers appropriate) to the BoD.
Periodically, and at least annually, the Audit Committee assesses the qualifications, expertise, effectiveness, independence and performance of the external auditors and their lead audit partner, in order to support the BoD in reaching a decision in relation to the appointment or dismissal of the external auditors and the rotation of the lead audit partner. The BoD then submits these proposals to the shareholders for approval at the AGM.
During 2015, the Audit Committee held seven meetings and 13 calls with a participation rate of 92%. On average the duration of each of the meetings and calls was approximately four and a half hours and one hour, respectively. In 2015, for both UBS Group AG and UBS AG, the frequency and length of meetings were the same. All meetings and calls of the Audit Committee were attended by the Group Chief Financial Officer and most of the meetings were attended by the Group CEO. In addition, the committee met once with the Swiss Financial Market Supervisory Authority (FINMA) and the chair of the committee met with the Federal Reserve Bank of New York (FRBNY) on a periodic basis.
The Audit Committee reports to the BoD about its discussions with our external auditors. Once a year, the lead representatives of our external auditors present their long-form report to the BoD, as required by FINMA.
All Audit Committee members have accounting or related financial management expertise and in compliance with the rules established pursuant to the US Sarbanes-Oxley Act of 2002, at least one member qualifies as a financial expert. The New York Stock Exchange (NYSE) listing standards on corporate governance set more stringent independence requirements for members of audit committees than for the other members of the BoD. Each of the five members of the Audit Committee is an external BoD member who, in addition to satisfying our independence criteria, does not receive, directly or indirectly, any consulting, advisory or compensatory fees from UBS Group AG other than in his or her capacity as a BoD member, does not hold, directly or indirectly, UBS Group AG shares in excess of 5% of the outstanding capital and (except as noted below) does not serve on the audit committees of more than two other public companies. The NYSE listing standards on corporate governance allow for an exemption for audit committee members to serve on more than three audit committees of public companies, provided that all BoD members determine that such simultaneous service does not impair the member’s ability to effectively serve on each committee and to fulfill his or her obligations.
Considering the credentials of William G. Parrett and Ann F. Godbehere, the BoD has granted this exemption in their cases.
Compensation Committee
EDTF | The Compensation Committee, formerly the Human Resources and Compensation Committee, is responsible, among other things, for the following functions: (i) supporting the BoD in its duties to set guidelines on compensation and benefits, (ii) approving the total compensation for the Chairman and the non-independent BoD members, (iii) establishing, together with the Chairman, financial and non-financial performance targets for the Group CEO and reviewing, upon the recommendation from the Group CEO, financial and non-financial performance targets for the other GEB members, (iv) evaluating, in consultation with the Chairman, the performance of the Group CEO in meeting agreed targets, as well as informing the BoD of the outcome of the performance assessments of the GEB members for approval by the BoD, (v) proposing, together with the Chairman, total individual compensation for the independent BoD members and Group CEO for approval by the BoD and (vi) proposing to the BoD for approval, upon recommendation by the Group CEO, the total individual compensation for GEB members. The Compensation Committee also reviews the compensation disclosures included in this report.
Corporate governance, responsibility and compensation
Corporate governance
The Compensation Committee comprises four independent BoD members and, as of 31 December 2015, Ann F. Godbehere chaired it with Michel Demaré, Reto Francioni and William G. Parrett as additional members. Jes Staley was a member of the committee from May to October 2015 and, after stepping down, he was succeeded by William G. Parrett.
Pillar 3 | During 2015, the Compensation Committee held seven meetings and one call with a participation rate of 91%. On average the duration of each of the meetings and the call was approximately 140 minutes. The meetings were conducted in the presence of external advisors, the Chairman and the Group CEO. In 2015, the frequency and length of meetings were the same for both UBS Group AG and UBS AG. The chair met once with FINMA and the UK Financial Conduct Authority (FCA) as well as with the Prudential Regulation Authority (PRA).▲▲
® Refer to “Our compensation governance framework” and “Total Reward Principles” in the “Compensation” section of this report for more information on the Compensation Committee’s decision-making procedures
Corporate Culture and Responsibility Committee
The Corporate Culture and Responsibility Committee supports the BoD in fulfilling its duty to safeguard and advance the Group’s reputation for responsible and sustainable conduct. Among other things, it reviews and assesses stakeholder concerns and expectations pertaining to the societal performance of UBS, and recommends appropriate actions to the BoD. The majority of the Corporate Culture and Responsibility Committee members must be independent. As of 31 December 2015, the Corporate Culture and Responsibility Committee was chaired by Axel A. Weber, with independent BoD members Reto Francioni, William G. Parrett and Joseph Yam as additional members. The Group CEO and the Global Head of UBS and Society are permanent guests of the Corporate Culture and Responsibility Committee, while the regional presidents attend two of the meetings as guests. During 2015, five meetings were held with a participation rate of 95%. On average the duration of each of the meetings was 80 minutes. In 2015, the frequency and length of meetings were the same for both UBS Group AG and UBS AG.
® Refer to the “UBS and Society” section of this report for more information
Governance and Nominating Committee
The Governance and Nominating Committee supports the BoD in fulfilling its duty to establish best practices in corporate governance across the Group, to conduct an annual assessment of the performance and effectiveness of the Chairman and of the Board as a whole (which includes an appraisal by an external expert at least every three years), to establish and maintain a process for appointing new BoD and GEB members (in the latter case, upon proposal by the Group CEO), and to manage the succession planning for all GEB members. The Governance and
Nominating Committee comprises three independent BoD members and, as of 31 December 2015, was chaired by Axel A. Weber, with Michel Demaré, Isabelle Romy and David Sidwell as additional members. During 2015, seven meetings and one call were held with a participation rate of 91%. On average the duration of each of the meetings and the call was 50 minutes. In 2015, the frequency and length of meetings were the same for both UBS Group AG and UBS AG. All meetings of the Governance and Nominating Committee were attended by the Group CEO.
Risk Committee
EDTF | The Risk Committee is responsible for overseeing and supporting the BoD in fulfilling its duty to supervise and set appropriate risk management and control principles in the following areas: (i) risk management and control, including credit, market, country, legal, compliance, operational and conduct risks, (ii) treasury and capital management, including funding, liquidity and equity attribution and (iii) balance sheet management. The Risk Committee considers the potential effects of the aforementioned risks on the Group’s reputation. For these purposes, the Risk Committee receives all relevant information from the GEB and has the authority to meet with regulators and external bodies in consultation with the Group CEO. As of 31 December 2015, the Risk Committee comprised five independent BoD members. David Sidwell chaired the Risk Committee with Reto Francioni, Axel P. Lehmann, Beatrice Weder di Mauro and Joseph Yam as additional members. Jes Staley was a member of the committee from May to October 2015 and, after stepping down, he was succeeded by Reto Francioni. Axel P. Lehmann recused himself from the Risk Committee meetings as of November 2015 due to his GEB nomination. During 2015, the Risk Committee held nine committee meetings and five calls with a participation rate of 93%. On average the duration of each of the meetings and calls was approximately 220 minutes. In 2015, the frequency and length of meetings were the same for both UBS Group AG and UBS AG. Usually, the Group CEO, the Group CFO, the Group CRO and the Group General Counsel attend the meetings and calls. The committee met once with FINMA and once with the FRBNY and the Connecticut Department of Banking. The chair met with the FCA and the PRA once and with the FRBNY on a periodic basis. ▲
Special Committee
The Special Committee is an ad-hoc committee with a standing composition and is called and held on an ad-hoc basis.
The Special Committee is composed of three independent BoD members and focuses on internal and regulatory investigations related to foreign exchange. As of 31 December 2015, David Sidwell chaired the Special Committee with Isabelle Romy and Joseph Yam as additional members. During 2015, one committee meeting and five telephone conferences were held with a participation of 83%. On average the duration of each of the telephone conferences and the meeting was approximately 50 minutes. In 2015, the frequency and length of meetings were the same for both UBS Group AG and UBS AG.
Roles and responsibilities of the Chairman of the Board of Directors
Axel A. Weber, the Chairman of the BoD, serves on the basis of a full-time employment contract.
The Chairman coordinates tasks within the BoD, calls BoD meetings and sets their agendas. Under the leadership of the Chairman, the BoD decides on the strategy of the Group on recommendations by the Group CEO, exercises ultimate supervision over management and appoints all GEB members.
The Chairman presides over all general meetings of shareholders, and works with the committee chairpersons to coordinate the work of all BoD committees. Together with the Group CEO, the Chairman is responsible for ensuring effective communication with shareholders and other stakeholders, including government officials, regulators and public organizations. This is in addition to establishing and maintaining a close working relationship with the Group CEO and other GEB members, and providing advice and support when appropriate. The Chairman met on a regular basis with core supervisory authorities, including quarterly meetings with FINMA, semi-annual meetings with the Swiss National Bank and the Federal Reserve Bank of New York / Connecticut Department of Banking, as well as annual meetings with the PRA and the FCA in the UK. Meetings with other supervisory authorities were scheduled on an ad hoc or needs-driven basis.
Roles and responsibilities of the Vice Chairmen and the Senior Independent Director
The BoD appoints one or more Vice Chairmen and a Senior Independent Director. If the BoD appoints more than one Vice Chairman, one of them must be independent. Michel Demaré has been appointed as Vice Chairman and David Sidwell has been appointed as Senior Independent Director. A Vice Chairman is required to lead the BoD in the absence of the Chairman and to provide support and advice to the Chairman. At least twice a year, the Senior Independent Director organizes and leads a meeting of the independent BoD members in the absence of the Chairman. In 2015, one independent BoD meeting was held for UBS Group AG and UBS AG with a participation of 100% and a duration of one hour. Another meeting was held in the first quarter of 2016. The Senior Independent Director relays to the Chairman any issues or concerns brought forth by the independent BoD members and acts as a point of contact for shareholders and stakeholders seeking to engage in discussions with an independent BoD member.
Important business connections of independent members of the Board of Directors
As a global financial services provider and a major Swiss bank, we enter into business relationships with many large companies, including some in which our BoD members assume management or independent board responsibilities. The Governance and Nominating Committee determines in each instance whether the nature of the Group’s business relationship with such a company might compromise our BoD members’ capacity to express independent judgment.
Our Organization Regulations require three-quarters of the BoD members to be independent. For this purpose, independence is determined in accordance with the FINMA circular 08/24 “Supervision and Internal Control,” the New York Stock Exchange rules, and the rules and regulations of other securities exchanges on which the UBS Group AG shares are listed, if any, applying the strictest standard.
In 2015, our BoD met the standards of the Organization Regulations for the percentage of directors that are considered independent under the criteria described above. Due to our Chairman’s full-time employment by UBS Group AG he is not considered independent.
All relationships and transactions with UBS Group AG’s independent BoD members are conducted in the ordinary course of business, and are on the same terms as those prevailing at the time for comparable transactions with non-affiliated persons. All relationships and transactions with BoD members’ associated companies are conducted at arm’s length.
® Refer to “Note 34 Related parties” in the “Consolidated financial statements” section of this report for more information
Corporate governance, responsibility and compensation
Corporate governance
Checks and balances: Board of Directors and Group Executive Board
We operate under a strict dual board structure, as mandated by Swiss banking law. The separation of responsibilities between the BoD and the GEB is clearly defined in the Organization Regulations. The BoD decides on the strategy of the Group on recommendation by the Group CEO, and supervises and monitors the business, whereas the GEB, headed by the Group CEO, has executive management responsibility. The functions of Chairman of the BoD and Group CEO are assigned to two different people, ensuring a separation of power. This structure establishes checks and balances and preserves the institutional independence of the BoD from the day-to-day management of the Group, for which responsibility is delegated to the GEB under the leadership of the Group CEO. No member of one board may simultaneously be a member of the other.
Supervision and control of the GEB remains with the BoD. The authorities and responsibilities of the two bodies are governed by the Articles of Association and the Organization Regulations, including the latter document’s “Annex B – Key approval authorities.”
® Refer to www.ubs.com/governance for more information on checks and balances for the Board of Directors and Group Executive Board
Information and control instruments vis-à-vis the Group Executive Board
The BoD is kept informed of the activities of the GEB in various ways, including minutes of GEB meetings being made available to the BoD. The Group CEO and other GEB members also regularly update the BoD on important issues at BoD meetings.
At BoD meetings, BoD members may request from BoD or GEB members any information about matters concerning the Group that they require to fulfill their duties. Outside meetings, BoD members may request information from other BoD and GEB members. Such requests must be approved by the Chairman.
Group Internal Audit independently, objectively and systematically assesses:
– the effectiveness of processes to define strategy and risk appetite as well as the overall adherence to the approved strategy,
– the effectiveness of governance processes, risk management and internal controls,
– the soundness of the risk and control culture,
– the effectiveness and sustainability of remediation activities,
– the reliability and integrity of financial and operational information, i.e., whether activities are properly, accurately and completely recorded, and the quality of underlying data and models, and
– the effectiveness to comply with legal, regulatory and statutory requirements, as well as with internal policies and contracts, i.e., assessing whether such requirements are met, and the adequacy of processes to sustainably meet them.
The internal audit organization has a functional reporting line to the Audit Committee in line with their responsibilities as set forth in our Organization Regulations. The Audit Committee annually assess and approves the appropriateness of Group Internal Audit’s annual audit plan and annual audit objectives and must be in regular contact with the Head Group Internal Audit. Group Internal Audit regularly informs the Chairman, the Audit Committee and the Risk Committee of the BoD about important issues. In addition, it provides the Audit Committee and the Chairman with an annual report summarizing the function’s activities and significant audit results.
® Refer to the “Risk management and control” section of this report for more information
Group Executive Board
We operate under a strict dual board structure, as mandated by Swiss banking law, and therefore, the Board of Directors (BoD) delegates the management of the business to the Group Executive Board (GEB).
Responsibilities, authorities and organizational principles of the Group Executive Board
Under the leadership of the Group CEO, the GEB has executive management responsibility for the steering of the Group and its business. It assumes overall responsibility for developing the Group and business division strategies and the implementation of approved strategies. The GEB constitutes itself as the risk council of the Group. In this function, the GEB has overall responsibility for establishing and supervising the implementation of risk management and control principles, as well as for managing the risk profile of the Group as a whole, as determined by the BoD and the Risk Committee. In 2015, the GEB held 22 meetings, including two ad-hoc calls, and two GEB offsite meetings. In 2015, the frequency of meetings for both UBS Group AG and UBS AG was the same.
® Refer to the Organization Regulations at www.ubs.com/governance for more information on the authorities of the Group Executive Board
Responsibilities and authorities of the Group Asset and Liability Management Committee
The Group Asset and Liability Management Committee (Group ALCO), established by the GEB, is responsible for supporting the GEB in its responsibility to promote the usage of the Group’s assets and liabilities in line with the Group’s strategy, regulatory commitments and the interests of shareholders and other stakeholders. Group ALCO proposes the framework for capital management, funding and liquidity risk and proposes limits and targets for the Group to the BoD for approval. It oversees the balance sheet management of the Group, its business divisions, and Corporate Center. The Organization Regulations additionally specify which powers of the GEB are delegated to the Group ALCO. In 2015, the Group ALCO held 10 meetings for UBS Group AG and UBS AG.
Management contracts
We have not entered into management contracts with any companies or natural persons that do not belong to the Group.
Members of the Group Executive Board
On 3 November 2015, we announced changes to our GEB, all effective as of 1 January 2016: Tom Naratil, formerly Group Financial Officer and Group Chief Operating Officer, was appointed President Wealth Management Americas and President UBS Americas, remaining a GEB member; Axel P. Lehmann stepped down from the BoD and joined the GEB as Group Chief Operating Officer; Kirt Gardner, formerly Chief Financial Officer of Wealth Management, joined the GEB and was appointed Group Chief Financial Officer; Christian Bluhm, formerly of FMS Wertmanagement, joined the GEB and was appointed Group Chief Risk Officer; Kathryn Shih, formerly Head Wealth Management for Asia Pacific joined the GEB and was appointed President UBS Asia Pacific; and Sabine Keller-Busse, Group Head Human Resources, joined the GEB. Philip J. Lofts and Chi-Won Yoon stepped down from the GEB at year-end 2015. Robert J. McCann assumed the role of Chairman UBS Americas and stepped down from the GEB.
In line with Swiss law, our Articles of Association (AoA) limit the number of mandates that members of the GEB may hold outside the UBS Group. Article 36 of the AoA limits the maximum number of permitted mandates of members of the GEB to one board membership in a listed company (other than UBS Group AG and UBS AG) and five additional mandates in non-listed companies. In addition, GEB members may hold no more than 10 mandates at the request of the company and eight mandates in associations, charitable organizations, foundations, trusts, and employee welfare foundations. No member of the GEB reaches the threshold described in article 36 of the Articles of Association.
The following biographies provide information on the GEB members as currently in office, and additionally, on those members whose service on the GEB ended as of 31 December 2015. For reasons of transparency, in addition to information on mandates, the biographies include memberships or other activities or functions, as required by the SIX Swiss Exchange Corporate Governance Directive.
All members of UBS Group AG's GEB are also members of UBS AG's GEB, with the exception of Mr. Gähwiler.
Corporate governance, responsibility and compensation
Corporate governance


Sergio P. Ermotti
Swiss,
born 1960
UBS Group AG
Bahnhofstrasse 45
CH-8001 Zurich
Group Chief Executive Officer
Year of initial appointment to UBS Group AG: 2014
Year of initial appointment to UBS AG: 2011
Professional history and education
Sergio P. Ermotti has been Group Chief Executive Officer of UBS AG since November 2011, having held the position of Group Chief Executive Officer on an interim basis since September 2011. He has been Group Chief Executive Officer for UBS Group AG since November 2014. Mr. Ermotti became a member of the GEB in April 2011 and was Chairman and CEO of UBS Group Europe, Middle East and Africa from April to November 2011. From 2007 to 2010, he was Group Deputy Chief Executive Officer at UniCredit, Milan, and was responsible for the strategic business areas of Corporate and Investment Banking, and Private Banking. He joined UniCredit in 2005 as Head of Markets & Investment Banking Division. Between 2001 and 2003, he worked at Merrill Lynch, serving as co-Head of Global Equity Markets and as a member of the Executive Management Committee for Global Markets & Investment Banking. He began his career with Merrill Lynch in 1987, and held various positions within equity derivatives and capital markets. Mr. Ermotti is a Swiss-certified banking expert and is a graduate of the Advanced Management Programme at Oxford University.
Other activities and functions
– Chairman of the Board of Directors of UBS Switzerland AG
– Chairman of the Board of Directors of UBS Business Solutions AG
– Chairman of the UBS Optimus Foundation Board
– Chairman of the Fondazione Ermotti, Lugano
– Board member of the Fondazione Lugano per il Polo Culturale, Lugano
– Board member of the Global Apprenticeship Network
– Board member of the Swiss-American Chamber of Commerce
– Member of the Institut International D’Etudes Bancaires
– Member of the Financial Services Forum
New GEB member
Christian Bluhm
German,
born 1969
UBS Group AG
Bahnhofstrasse 45
CH-8001 Zurich
Group Chief Risk Officer
as of 1 January 2016
Year of initial appointment to UBS Group AG and UBS AG: 2016
Professional history and education
Christian Bluhm became a member of the GEB and was appointed Group Chief Risk Officer of UBS Group AG and UBS AG in January 2016. He joined UBS from FMS Wertmanagement, where he had been Chief Risk & Financial Officer since 2010 and Spokesman of the Executive Board from 2012 to 2015. From 2004 to 2009 he worked for Credit Suisse where he was Managing Director responsible for Credit Risk Management in Switzerland and Private Banking worldwide. Mr. Bluhm was Head of Credit Portfolio Management until 2008 and then Head of Credit Risk Management Analytics & Instruments after the financial crisis in 2008. From 2001 to 2004 he worked for Hypovereinsbank in Munich in Group Credit Portfolio Management, heading a team that specialized in Structured Finance Analytics. Before starting his banking career with Deutsche Bank in Credit Risk Management in 1999 he worked as a post doctorate fellow at Cornell University in Ithaca and as a scientific assistant at the University of Greifswald. Mr. Bluhm holds a degree in mathematics and informatics from the University of Erlangen-Nuremberg and received his PhD in mathematics in 1996 from the same university.


Markus U. Diethelm
Swiss,
born 1957
UBS Group AG
Bahnhofstrasse 45
CH-8001 Zurich
Group General Counsel
Year of initial appointment to UBS Group AG: 2014
Year of initial appointment to UBS AG: 2008
Professional history and education
Markus U. Diethelm became a member of the GEB and was appointed Group General Counsel of UBS AG in September 2008. He has held the same position for UBS Group AG since November 2014. He has been an Executive Board member of UBS Business Solutions AG since 2015. From 1998 to 2008, he served as Group Chief Legal Officer at Swiss Re, and was appointed to the company’s Group Executive Board in 2007. Prior to this, he was with Los Angeles-based law firm Gibson, Dunn & Crutcher, and focused on corporate matters, securities transactions, litigation and regulatory investigations while working out of the firm’s Brussels and Paris offices. From 1989 to 1992, he practiced at Shearman & Sterling in New York, specializing in mergers and acquisitions. In 1988, he worked at Paul, Weiss, Rifkind, Wharton & Garrison in New York. After starting his career in 1983 with Bär & Karrer, he served from 1984 to 1985 as a law clerk at the District Court of Uster in Switzerland. Mr. Diethelm holds a law degree from the University of Zurich and a master’s degree and PhD from Stanford Law School. Mr. Diethelm is a qualified attorney-at-law admitted to the bar in Zurich, Geneva and in New York State.
Other activities and functions
– Board member of UBS Business Solutions AG
– Chairman of the Swiss-American Chamber of Commerce’s legal committee
– Member of the Swiss Advisory Council of the American Swiss Foundation
– Member of the Foundation Council of the UBS International Center of Economics in Society
– Member of the Conseil de Fondation du Musée International de la Croix-Rouge et du Croissant-Rouge
– Member of the Professional Ethics Commission of the Association of Swiss Corporate Lawyers
Lukas Gähwiler
Swiss,
born 1965
UBS Group AG
Bahnhofstrasse 45
CH-8001 Zurich
President Personal & Corporate Banking and President UBS Switzerland
Year of initial appointment to UBS Group AG: 2014
Year of initial appointment to UBS AG: 2010
Professional history and education
Lukas Gähwiler is a member of the GEB of UBS Group AG and was appointed President UBS Switzerland (formerly CEO of UBS Switzerland) in April 2010. In his role as President UBS Switzerland, he is responsible for all businesses – retail, wealth management, corporate and institutional, investment banking and asset management – in UBS’s home market. In addition, he was appointed President of the Executive Board of UBS Switzerland AG in May 2015. Since January 2012, he has also been President Personal & Corporate Banking (formerly CEO of Retail & Corporate). Between April 2010 and January 2012, he combined the position of CEO of UBS Switzerland with the role of co-CEO of UBS Wealth Management & Swiss Bank. From 2003 to 2010, he was Chief Credit Officer at Credit Suisse and was accountable for the worldwide credit business of Private Banking, including Commercial Banking in Switzerland. In 1998, Mr. Gähwiler was appointed Chief of Staff to the CEO of Credit Suisse’s Private and Corporate business unit and, prior to this, held various front-office positions in Switzerland and North America. He earned a bachelor’s degree in business administration from the University of Applied Sciences in St. Gallen. Mr. Gähwiler completed an MBA program in corporate finance at the International Bankers School in New York, as well as the Advanced Management Program at Harvard Business School.
Other activities and functions
– Foundation Board member of the UBS Pension Fund
– Member of the Foundation Council of the UBS International Center of Economics in Society
– Board member of Opernhaus Zürich AG
– Board member of economiesuisse
– Vice Chairman of the Board of the Zurich Chamber of Commerce
– Vice Chairman of the Swiss Finance Institute Foundation Board
– Second Vice President of the Board of the Zürcher Volkswirtschaftliche Gesellschaft
Corporate governance, responsibility and compensation
Corporate governance


New GEB member
Kirt Gardner
American (US),
born 1959
UBS Group AG
Bahnhofstrasse 45
CH-8001 Zurich
Group Chief Financial Officer as of 1 January 2016
Year of initial appointment to UBS Group AG and UBS AG: 2016
Professional history and education
Kirt Gardner became a member of the GEB and was appointed Group Chief Financial Officer of UBS Group AG and UBS AG in January 2016. He was CFO Wealth Management from 2013 to 2015. Prior to this, he held a number of leadership positions at Citigroup, including CFO and Head of Strategy within Global Transaction Services from 2010 to 2013, Head of Strategy, Planning and Risk Strategy for the Corporate and Institutional Division from 2006 to 2010 and Head of Global Strategy and Cost Management for the Consumer Bank from 2004 to 2006. Prior to this, he held the position of Global Head of Financial Services Strategy for BearingPoint, where he worked in Asia and New York for four years. From 1994 to 2000, he was Managing Director with Barents Group, working in the US, Asia, Latin America and Europe. Mr. Gardner holds a bachelor’s degree in economics from William’s College, a master’s degree from the University of Pennsylvania and an MBA in finance from Wharton School.
New GEB member
Sabine
Keller-Busse
German and Swiss,
born 1965
UBS Group AG
Bahnhofstrasse 45
CH-8001 Zurich
Group Head Human Resources
Year of initial appointment to UBS Group AG and UBS AG: 2016
Professional history and education
Sabine Keller-Busse became a member of the GEB in January 2016. She has been Group Head Human Resources since August 2014. Having joined UBS in 2010, she served as Chief Operating Officer UBS Switzerland until 2014. Prior to this, she led Credit Suisse’s Private Clients Region Zurich division for two years. From 1995 to 2008 Ms. Keller-Busse worked for McKinsey & Company, where she had been Senior Partner since 2001. She started her professional career at Siemens AG in a trainee program which she completed with a commercial diploma. Ms. Keller-Busse holds a master’s degree in business administration from the University of St. Gallen and received a PhD in business administration from the same university.
Other activities and functions
– Board member of SIX Group (Chairman of risk committee)
– Foundation Board member of the UBS Pension Fund


Ulrich Körner
German and Swiss,
born 1962
UBS Group AG
Bahnhofstrasse 45
CH-8001 Zurich
President Asset Management and President UBS Europe, Middle East and Africa
Year of initial appointment to UBS Group AG: 2014
Year of initial appointment to UBS AG: 2009
Professional history and education
Ulrich Körner became a member of the GEB in April 2009 and was appointed President Asset Management of UBS AG (formerly CEO Global Asset Management) in January 2014. He has held the same position for UBS Group AG since November 2014. He was Group Chief Operating Officer from 2009 to 2013. In addition, he was appointed President UBS Europe, Middle East and Africa (formerly CEO of UBS Group Europe, Middle East and Africa) in December 2011. In 1998, Mr. Körner joined Credit Suisse. He served as a member of the Credit Suisse Group Executive Board from 2003 to 2008, holding various management positions, including CFO and Chief Operating Officer. From 2006 to 2008, he was responsible for the entire Swiss client business as CEO Credit Suisse Switzerland. Mr. Körner received a PhD in business administration from the University of St. Gallen, and served for several years as an auditor at Price Waterhouse and as a management consultant at McKinsey & Company.
Other activities and functions
– Deputy Chairman of the Supervisory Board of UBS Deutschland AG
– Board member of OOO UBS Bank Russia
– Chairman of the Foundation Board of the UBS Pension Fund
– Chairman of the Widder Hotel, Zurich
– Vice President of the Board of Lyceum Alpinum Zuoz
– Member of the Financial Service Chapter Board of the Swiss-American Chamber of Commerce
– Advisory Board member of the Department of Banking and Finance at the University of Zurich
– Member of the business advisory council of the Laureus Foundation Switzerland
New GEB member
Axel P. Lehmann
Swiss,
born 1959
UBS Group AG
Bahnhofstrasse 45
CH-8001 Zurich
Group Chief Operating Officer as of 1 January 2016
Year of initial appointment to UBS Group AG and UBS AG: 2016
Professional history and education
Axel P. Lehmann became a member of the GEB and was appointed Group Chief Operating Officer of UBS Group AG and UBS AG in January 2016. He was a member of the BoD of UBS AG from 2009 to 2015 and of UBS Group AG from 2014 to 2015. During his entire tenure on the Board, he had been a member of the Risk Committee and, from 2011 to 2013, a member of the Governance and Nominating Committee. Mr. Lehmann became a member of Zurich Insurance Group's (Zurich) Group Executive Committee in 2002, holding various management positions, including CEO for the European and North America businesses, and from 2008 to 2015 as Chief Risk Officer with additional responsibilities for Group IT, as Regional Chairman for Europe, Middle East and Africa and Chairman for Farmers Group Inc. In 2001 he was appointed CEO for Northern, Central and Eastern Europe and Zurich Group Germany, having served as a member of the company's Group Management Board since 2000 with responsibility for group-wide business development functions. In 1996, he joined Zurich as a member of the Executive Committee of Zurich Switzerland and subsequently held various executive management and corporate development positions within Zurich Switzerland. Prior to joining Zurich, Mr. Lehmann was head of corporate planning and controlling at Swiss Life, project manager and Vice President of the Institute of Insurance Economics at the University of St. Gallen and a visiting professor at Bocconi University in Milan. Mr. Lehmann holds a PhD and a master’s degree in business administration and economics from the University of St. Gallen. He is also a graduate of the Wharton Advanced Management Program and an honorary professor of business administration and service management at the University of St. Gallen.
Other activities and functions
– Chairman of the Global Agenda Council on the Global Financial System of WEF
– Chairman of the Board of the Institute of Insurance Economics at the University of St. Gallen
– Member of the International and Alumni Advisory Board at the University of St. Gallen
– Member of the Swiss-American Chamber of Commerce Chapter Doing Business in USA
Corporate governance, responsibility and compensation
Corporate governance


Tom Naratil
American (US),
born 1961
UBS AG
1200 Harbor Boulevard
Weehawken, NJ 07086 USA
Group Chief Financial Officer and Group Chief Operating Officer until 31 December 2015
President Wealth Management Americas and President UBS Americas as of 1 January 2016
Year of initial appointment to UBS Group AG: 2014
Year of initial appointment to UBS AG: 2011
Professional history and education
Tom Naratil became President Wealth Management Americas and President UBS Americas in January 2016. He has been President of the Executive Board of UBS Business Solutions AG since 2015. He became a member of the GEB in June 2011 and was Group CFO of UBS AG from 2011 to 2015. He held the same position for UBS Group AG from 2014 to 2015. In addition to the role of Group CFO, he was Group Chief Operating Officer from 2014 to 2015. He served as CFO and Chief Risk Officer of Wealth Management Americas from 2009 until his appointment as Group CFO in 2011. Before 2009, he held various senior management positions within UBS, including heading the Auction Rate Securities Solutions Group during the financial crisis in 2008. He was named Global Head of Marketing, Segment & Client Development in 2007, Global Head of Market Strategy & Development in 2005, and Director of Banking and Transactional Solutions, Wealth Management USA, in 2002. During this time, he was a member of the Group Managing Board. He joined Paine Webber Incorporated in 1983, and after the merger with UBS became Director of the Investment Products Group. Mr. Naratil holds an MBA in economics from New York University and a Bachelor of Arts in history from Yale University.
Other activities and functions
– Chairman of UBS Americas Holding LLC
– Board member of UBS Switzerland AG
– Board member of UBS Business Solutions AG
– Board member of the American Swiss Foundation
– Board Member of the Clearing House Supervisory Board
– Board of Consultors for the College of Nursing at Villanova University
Andrea Orcel
Italian,
born 1963
UBS Group AG
Bahnhofstrasse 45
CH-8001 Zurich
President Investment Bank
Year of initial appointment to UBS Group AG: 2014
Year of initial appointment to UBS AG: 2012
Professional history and education
Andrea Orcel became a member of the GEB in July 2012 and was appointed President Investment Bank of UBS AG (formerly CEO Investment Bank) in November 2012. He has held the same position for UBS Group AG since November 2014. Since December 2014, he has additionally taken on the position as Chief Executive for UBS Limited and UBS AG London Branch. He had been appointed co-CEO of the Investment Bank in July 2012. He joined UBS from Bank of America Merrill Lynch, where he had been Executive Chairman since 2009, President of Emerging Markets (excluding Asia) since 2010 and CEO of European Card Services since 2011. Prior to the acquisition of Merrill Lynch by Bank of America, Mr. Orcel was a member of Merrill Lynch’s global management committee and Head of Global Origination, which combined Investment Banking and Capital Markets. He held a number of other leadership positions, including President of Global Markets & Investment Banking for Europe, Middle East and Africa (EMEA) and Head of EMEA Origination beginning in 2004. Between 2003 and 2007, he led the Global Financial Institutions Group, of which he had been part since joining Merrill Lynch in 1992. Prior to this, he worked at Goldman Sachs and the Boston Consulting Group. Mr. Orcel holds an MBA from INSEAD and a degree in economics and commerce, summa cum laude, from the University of Rome.
Other activities and functions
– Board member UBS Limited


New GEB member
Kathryn Shih
British,
born 1958
UBS AG
2 International Finance Centre
8 Finance Street
Central, Hong Kong
President UBS Asia Pacific as of 1 January 2016
Year of initial appointment to UBS Group AG and UBS AG: 2016
Professional history and education
Kathryn Shih became a member of the GEB of UBS Group AG and UBS AG and was appointed President UBS Asia Pacific in January 2016. She has been Head Wealth Management Asia Pacific since 2002. She was CEO of UBS Hong Kong from 2003 to 2008. Prior to this, she held various leadership positions in Wealth Management Asia Pacific. She has been with the firm for nearly 30 years, since joining Swiss Bank Corporation in 1987 as a client advisor and then serving as Head Private Banking from 1994 to 1998. In the 1980s Ms. Shih worked for Citibank in the Consumer Services Group and as an executive trainee with PCI Capital Asia Ltd. She conferred as a Certified Private Wealth Professional by the Private Wealth Management Association, Hong Kong in 2015 and as a Certified Financial Planner from the Institute of Financial Planners, Hong Kong in 2001 and completed the Advanced Executive Program at Northwestern University in 1999. Ms. Shih holds a bachelor’s degree of arts from Indiana University and a master’s degree in business management from the Asian Institute of Management in the Philippines.
Other activities and functions
– Member of the Banking Advisory Committee, Hong Kong
Jürg Zeltner
Swiss,
born 1967
UBS Group AG
Bahnhofstrasse 45
CH-8001 Zurich
President Wealth Management
Year of initial appointment to UBS Group AG: 2014
Year of initial appointment to UBS AG: 2009
Professional history and education
Jürg Zeltner became a member of the GEB in February 2009 and is President of Wealth Management of UBS AG (formerly CEO of UBS Wealth Management). He has held the same position for UBS Group AG since November 2014. Between February 2009 and January 2012, he served as co-CEO of UBS Wealth Management & Swiss Bank. In November 2007, he was appointed as Head of Wealth Management North, East & Central Europe. From 2005 to 2007, he was CEO of UBS Deutschland, Frankfurt, and, prior to this, he held various management positions in the former Wealth Management division of UBS. Between 1987 and 1998, he was with Swiss Bank Corporation in various roles within the Private and Corporate Client division in Berne, New York and Zurich. Mr. Zeltner holds a diploma in business administration from the College of Higher Vocational Education in Berne and is a graduate of the Advanced Management Program at Harvard Business School.
Other activities and functions
– Board member of the German-Swiss Chamber of Commerce
Corporate governance, responsibility and compensation
Corporate governance
Members of the Group Executive Board
until 31 December 2015
Philip J. Lofts
British,
born 1962
UBS AG
677 Washington Boulevard
Stamford, CT 06901 USA
Group Chief Risk Officer until 31 December 2015
Year of initial appointment to UBS Group AG: 2014
Year of initial appointment to UBS AG: 2008
Professional history and education
Philip J. Lofts became a member of the GEB in 2008 and was re-appointed Group Chief Risk Officer of UBS AG in December 2011, after having served in the same role from 2008 to 2010. He held the same position for UBS Group AG from November 2014 to December 2015. He decided to step down from his current role and the GEB at the end of December 2015. He has been an Executive Board member of UBS Business Solutions AG since 2015. He was CEO of UBS Group Americas from January to November 2011. Mr. Lofts, who began his career with UBS more than 25 years ago, became Group Risk Chief Operating Officer in 2008 after having served as Group Chief Credit Officer for three years. Prior to this, Mr. Lofts worked for the Investment Bank in a number of business and risk control positions in Europe, Asia Pacific and the US. Mr. Lofts joined Union Bank of Switzerland in 1984 as a credit analyst and was appointed Head of Structured Finance in Japan in 1996. Mr. Lofts successfully completed his A-levels at Cranbrook School. From 1981 to 1984, he was a trainee at Charterhouse Japhet plc, a merchant bank, which was acquired by the Royal Bank of Scotland in 1985.
Other activities and functions
– Board member of UBS Switzerland AG
– Board member of UBS Business Solutions AG
Robert J. McCann
American (US) and Irish,
born 1958
UBS AG
1200 Harbor Boulevard
Weehawken, NJ 07086 USA
President Wealth Management Americas and President UBS Americas until 31 December 2015
Year of initial appointment to UBS Group AG: 2014
Year of initial appointment to UBS AG: 2009
Professional history and education
Robert J. McCann became a member of the GEB in October 2009 and was President Wealth Management Americas of UBS AG (formerly CEO of Wealth Management Americas) from 2009 to 2015. He held the same position for UBS Group AG from 2014 to 2015. At the end of December 2015, he stepped down from the GEB and was named Chairman UBS Americas as of January 2016. He was President UBS Americas from 2011 to 2015 (formerly CEO of UBS Group Americas). From 2003 to 2009, he worked for Merrill Lynch as Vice Chairman and President of the Global Wealth Management Group. In 2003, he served as Vice Chairman of Distribution and Marketing for AXA Financial. He began his career with Merrill Lynch in 1982, working in various positions in capital markets and research. From 2001 to 2003, he was Head of Global Securities Research and Economics. In 2000, he was appointed Chief Operating Officer of Global Markets and Investment Banking. From 1998 to 2000, he was Global Head of Global Institutional Debt and Equity Sales. Mr. McCann graduated with a bachelor’s degree in economics from Bethany College, West Virginia, and holds an MBA from Texas Christian University.
Other activities and functions
– Member of the UBS Optimus Foundation Board
– Vice Chairman of the Bethany College Board of Trustees
– Member of the Committee Encouraging Corporate Philanthropy
– Board member of the American Ireland Fund
– Board member of the Catholic Charities of the Archdiocese of New York
– Advisory Board member for the Billie Jean King Leadership Initiative
Chi-Won Yoon
Korean,
born 1959
UBS AG
2 International Finance Centre
8 Finance Street
Central, Hong Kong
President UBS Asia Pacific until 31 December 2015
Year of initial appointment to UBS Group AG: 2014
Year of initial appointment to UBS AG: 2009
Professional history and education
Chi-Won Yoon was appointed President UBS Asia Pacific of UBS AG (formerly CEO of UBS Group Asia Pacific) in April 2012 and was a member of the GEB from June 2009 to December 2015. He held the same position for UBS Group AG from November 2014 to December 2015. He decided to step down from his current role and the GEB at the end of December 2015. He held the position of co-Chairman and co-CEO of UBS Group Asia Pacific from November 2010 to March 2012. From June 2009 to November 2010, he served as sole Chairman and CEO of UBS AG, Asia Pacific. In a previous role, Mr. Yoon served as Head of UBS’s securities business in Asia Pacific: Asia Equities, which he oversaw from 2004; and Asia Pacific Fixed Income, Currencies and Commodities, which he led from 2009. He joined the firm in 1997, serving as Head of Equity Derivatives. Mr. Yoon began his career in financial services in 1986, working at Merrill Lynch in New York and Lehman Brothers in New York and Hong Kong. Before embarking on a Wall Street career, he worked as an electrical engineer in satellite communications. In 1982, Mr. Yoon earned a bachelor’s degree in electrical engineering from the Massachusetts Institute of Technology (MIT), and a master’s degree in management from MIT’s Sloan School of Management in 1986.
Other activities and functions
– Board member of UBS Securities Co. Ltd
– Chairman of the Asian Executive Board for the MIT Sloan School of Management
– Advisory Board member of the MIT Center for Finance and Policy
Corporate governance, responsibility and compensation
Corporate governance
Change of control and defense measures
We refrain from restrictions regarding change of control and defense measures that would hinder developments initiated in, or supported by, the financial markets. We also do not have any specific defenses in place to prevent hostile takeovers.
Duty to make an offer
According to the Swiss Financial Market Infrastructure Act (which replaced certain provisions of the Swiss Stock Exchange Act as of 1 January 2016), an investor who has acquired more than 331/3% of all voting rights of a company listed in Switzerland (directly, indirectly or in concert with third parties), whether they are exercisable or not, is required to submit a takeover offer for all listed shares outstanding. We have not elected to change or opt out of this rule.
Clauses on change of control
Neither the employment agreement with the Chairman of the BoD, nor any employment contracts with the GEB members or employees holding key functions within the company (Group Managing Directors), contain change of control clauses.
All employment contracts with GEB members stipulate a notice period of six months. During the notice period, GEB members are entitled to their salaries and the continuation of existing employment benefits and may be eligible to be considered for a discretionary performance award based on their contribution during the time worked.
In case of a change of control, we may, at our discretion, accelerate the vesting of and / or relax applicable forfeiture provisions of employees’ awards, and defer lapse date of options or stock appreciation rights.
Auditors
Audit is an integral part of corporate governance. While safeguarding their independence, the external auditors closely coordinate their work with Group Internal Audit. The Audit Committee, and ultimately the Board of Directors (BoD), supervises the effectiveness of audit work.
® Refer to “Board of Directors” in this section for more information on the Audit Committee
External independent auditors
At the Annual General Meeting (AGM) of shareholders in 2015, Ernst & Young Ltd (EY) were re-elected as auditors for the Group for a one-year term of office. EY assume virtually all auditing functions according to laws, regulatory requests and the Articles of Association. Beginning 2015, the EY lead partner in charge of the Group financial audit is Marie-Laure Delarue and her incumbency is limited to five years. The co-signing partner for the financial statement audit is Troy J. Butner. He will be succeeded in 2016 by Ira S. Fitlin, with an incumbency limit of seven years. Beginning 2015, Patrick Schwaller is the Lead Auditor to the Swiss Financial Market Supervisory Authority (FINMA) and his incumbency is limited to six years due to prior audit service to UBS in another role. The co-signing partner for the FINMA audit has been Marc Ryser since 2012, with an incumbency limit of seven years.
Special auditor for capital increase
At the AGM on 7 May 2015, BDO AG was re-appointed as special auditor for a three-year term of office. The special auditors provide audit opinions independently from the auditors in connection with capital increases.
Fees paid to external independent auditors
The fees (including expenses) paid to our auditors EY are set forth in the table below. In addition, EY received CHF 29.3 million in 2015 (CHF 29.7 million in 2014) for services performed on behalf of our investment funds, many of which have independent fund boards or trustees.
Audit work includes all services necessary to perform the audit for the Group in accordance with applicable laws and generally accepted auditing standards, as well as other assurance services that conventionally only the auditor can provide. These include statutory and regulatory audits, attest services, and the review of documents to be filed with regulatory bodies. The additional services classified as audit in 2015 included several engagements for which EY were mandated at the request of FINMA.
Fees paid to external independent auditors | | |
| | |
UBS Group AG and its subsidiaries (including UBS AG) paid the following fees (including expenses) to its external independent auditors. |
| | |
CHF thousand | 31.12.15 | 31.12.14 |
| | |
Audit | | |
Global audit fees | 45,516 | 47,450 |
Additional services classified as audit (services required by law or statute, including work of a non-recurring nature mandated by regulators) | 14,191 | 14,374 |
Total audit | 59,707¹ | 61,824 |
|
Non-audit | | |
Audit-related fees | 8,684 | 7,133 |
of which: assurance and attest services | 3,327 | 3,205 |
of which: control and performance reports | 5,260 | 3,840 |
of which: consultation concerning financial accounting and reporting standards | 96 | 87 |
Tax services | 3,088 | 1,083 |
Other | 1,102 | 1,573 |
Total non-audit | 12,874¹ | 9,789 |
1 Of the total audit and non-audit fees of CHF 72,581 thousand for UBS Group AG (consolidated), CHF 71,766 thousand relates to UBS AG (consolidated). |
Corporate governance, responsibility and compensation
Corporate governance
Audit-related work comprises assurance and related services that are traditionally performed by the auditor, such as attest services related to financial reporting, internal control reviews, performance standard reviews, and consultation concerning financial accounting and reporting standards.
Tax work involves services performed by professional staff in EY’s tax division, and includes tax compliance and tax consultation with respect to our own affairs.
”Other” services are permitted services which include technical IT security control reviews and assessments.
Pre-approval procedures
To ensure EY’s independence, all services provided by them have to be pre-approved by the Audit Committee. A pre-approval may be granted either for a specific mandate, or in the form of a blanket pre-approval authorizing a limited and well-defined type and amount of services.
The Audit Committee has delegated pre-approval authority to its Chairperson, and the Group Chief Financial Officer (Group CFO) submits all proposals for services by EY to the Chairperson of the Audit Committee for approval, unless there is a blanket pre-approval in place. At each quarterly meeting, the Audit Committee is informed of the approvals granted by its Chairperson and of services authorized under blanket pre-approvals.
Group Internal Audit
With 355 personnel worldwide as of 31 December 2015, Group Internal Audit (GIA) performs the internal auditing function for the Group. It is an independent and objective function that supports both the Group, in achieving its defined
strategic, operational, financial and compliance objectives, and the BoD, supported by its committees, in discharging their governance responsibilities. GIA provides assurance by assessing the reliability of financial and operational information, as well as the effectiveness of processes to comply with legal, regulatory and statutory requirements. All reports with key issues are provided to the Group CEO, GEB members responsible for the business divisions, and other responsible management. In addition, the Chairman, the Audit Committee and the Risk Committee of the BoD are regularly informed about important issues. GIA further assures the closure and successful remediation of issues, irrespective of the function that identified them, including those that are self-identified by management (first line of defense) or are raised by control functions (second line of defense), GIA (third line of defense), external auditors and regulators. GIA cooperates closely with internal and external legal advisors and risk control units on investigations into major control issues.
To maximize its independence from management, the Head of GIA, James P. Oates, reports directly to the Chairman of the BoD as well as to the Audit Committee. In their assessment, GIA is quantitatively and qualitatively well-resourced to perform its function. The role, position, responsibilities and accountability of GIA are set out in our Organization Regulations, in particular in the Charter for Group Internal Audit, published at www.ubs.com/governance. GIA has unrestricted access to all accounts, books, records, systems, premises and personnel, and must be provided with all information and data needed to fulfill its auditing duties. The Audit Committee may order special audits to be conducted. Other BoD members, committees or the Group CEO may request such audits with the approval of the Audit Committee.
Coordination and close cooperation with the external auditors enhance the efficiency of GIA’s work.
Information policy
We provide regular information to our shareholders and to the financial community.
Financial reports for UBS Group AG will be published as follows
First quarter 2016 | 3 May 2016 |
Second quarter 2016 | 29 July 2016 |
Third quarter 2016 | 1 November 2016 |
The Annual General Meeting of shareholders of UBS Group AG will take place as follows
2016 | 10 May 2016 |
2017 | 4 May 2017 |
| |
® Refer to the corporate calendar at www.ubs.com/investors for future financial report publication and other key dates, including UBS AG's financial report publication dates
We meet with institutional investors worldwide throughout the year and regularly hold results presentations, attend and present at investor conferences and, from time to time, host investor days. When possible, investor meetings are hosted by senior management and are always attended by members of our Investor Relations team. We use various technologies such as webcasting, audio links and cross-location video conferencing to widen our audience and maintain contact with shareholders around the world.
Registered shareholders may opt to receive a physical copy of our annual report or our annual review, which reflects on specific initiatives and achievements of the Group and provides an overview of the Group’s activities during the year as well as key financial information. For the first, second and third quarter of the year, shareholders have the option to receive a brief mailed update on the Group’s quarterly financial performance. Shareholders can also request UBS Group AG’s complete financial reports, produced for the first, second and third quarter and for the full year.
We make our publications available to all shareholders simultaneously to ensure they have equal access to our financial information.
Shareholders can help us achieve our environmental ambitions by opting to read our financial publications electronically through our Investor Relations website rather than receiving printed copies. In addition, shareholders can change their subscription preferences at any time using our shareholder portal (www.ubs.com/shareholderportal).
® Refer to www.ubs.com/investors for a complete set of published reporting documents and a selection of senior management industry conference presentations
® Refer to the “Information sources” section of this report for more information
Financial disclosure principles
We fully support the notion of transparency and consistent and informative disclosure. We aim to communicate our strategy and results in a manner that allows stakeholders to gain a good understanding of how our Group works, what our growth prospects are and the risks our businesses and our strategy entail. We assess feedback from analysts and investors on a regular basis and, where appropriate, reflect this in our disclosures. To continue achieving these goals, we apply the following principles in our financial reporting and disclosure:
– Transparency that enhances the understanding of economic drivers and builds trust and credibility
– Consistency within each reporting period and between reporting periods
– Simplicity that allows readers to gain a good understanding of the performance of our businesses
– Relevance by focusing not only on what is required by regulation or statute but also on what is relevant to our stakeholders
– Best practice that leads to improved standards
Corporate governance, responsibility and compensation
Corporate governance
We endorse the work of the Enhanced Disclosure Task Force (EDTF) and our financial reports contain disclosures aligned with the recommendations issued by the EDTF on 29 October 2012 in its report “Enhancing the Risk Disclosures of Banks.” Consistent with our financial reporting and disclosure principles, we regard the enhancement of disclosures as an ongoing commitment.
® Refer to the “Risk, treasury and capital management” section of this report for more information on the EDTF recommendations
Financial reporting policies
We report our Group’s results at the end of every quarter, including a breakdown of results by business division and disclosures or key developments relating to risk management and control, capital, liquidity and funding management. As of the fourth quarter of 2015, we have replaced the publication of a fourth-quarter financial report with the publication of an expanded quarterly earnings release. For the first three quarters of the fiscal year, we will continue to supplement the quarterly earnings release with the quarterly financial report for UBS Group AG published on the same day.
UBS Group AG’s and UBS AG’s consolidated financial statements are prepared in accordance with International Financial Reporting Standards as issued by the International Accounting Standards Board.
® Refer to “Note 1 Summary of significant accounting policies” in the “Consolidated financial statements” section of this report for more information on the basis of accounting
We are committed to maintaining the transparency of our reported results and to permit analysts and investors to make meaningful comparisons with prior periods. If there is a major reorganization of our business divisions, or if changes to accounting standards or interpretations lead to a material change in the Group’s reported results, our results are restated for previous periods as required by applicable accounting standards. These restatements show how our results would have been reported on the new basis and provide clear explanations of all relevant changes.
US disclosure requirements
As a foreign private issuer, we must file reports and other information, including certain financial reports, with the US Securities and Exchange Commission (SEC) under the US federal securities laws. We file an annual report on Form 20-F, and furnish our quarterly financial reports and other material information under cover of Form 6-K to the SEC. These reports are available at www.ubs.com/investors and on the SEC’s website at www.sec.gov.
An evaluation was carried out under the supervision of management, including the Group CEO and Group CFO, on the effectiveness of our disclosure controls and procedures (as defined in Rule 13a–15e) under the US Securities Exchange Act of 1934. Based on that evaluation, the Group CEO and Group CFO concluded that our disclosure controls and procedures were effective as of 31 December 2015. No significant changes have been made to our internal controls or to other factors that could significantly affect these controls subsequent to the date of their evaluation.
® Refer to the “Consolidated financial statements” section of this report for more information
UBS and Society
EDTF | We aim to be a leader in sustainability in the financial industry. This requires us to focus on the long term and to work to provide consistent returns to our stakeholders. It also requires us to promote the common good by being proactive, purposeful and accountable. Our key program in this regard is UBS and Society – a cross-divisional umbrella platform covering all our activities and capabilities in sustainable investing and philanthropy, environmental and human rights policies that govern client and supplier relationships, managing our own environmental footprint, as well as our firm's community investment. In 2015, we made good progress in advancing the ambitious goals we pursue through UBS and Society.
We want to maximize our performance to generate long-term, sustainable and measurable benefits for our clients, shareholders and communities. Moreover, we are constantly looking for more environmentally sound and socially responsible ways to do business. Our concept of stewardship encompasses more than just our clients’ assets, it means taking care of what we leave behind for future generations. This is not measured by financial performance alone, but also by performance relating to the environment, good governance, our social impact and other key components of sustainability and resilience. To this end, we aim to:
– make sustainability the everyday standard across the firm,
– channel a growing portion of investable client assets through innovative financial mechanisms to address societal challenges,
– make sustainable performance part of every client conversation,
– train employees on sustainability,
– create a credible sustainability approach,
– measure the impact of our community investment activities, and
– support the transition to a low-carbon economy through our comprehensive climate change strategy.
We are implementing the UBS and Society program through three pillars: how we do business, how we support our clients and how we support our communities. ▲
® Refer to www.ubs.com/ubsandsociety for more information

Corporate governance, responsibility and compensation
UBS and Society
How we do business
Living up to our principles and standards contributes to the wider goal of developing societies sustainably. As a global firm, we recognize our responsibility to go beyond the norm, lead the debate on important societal topics, and contribute to the setting of standards and collaboration in and beyond our industry.
Governance
EDTF | We have firmly embedded the responsibility for setting the firm’s values and standards at the highest level, to help drive our obligations to stakeholders and our corporate responsibility and sustainability agenda. All Board of Directors (BoD) committees monitor our business performance in the context of creating sustainable value. Our BoD’s Corporate Culture and Responsibility Committee (CCRC) supports the BoD in its duties to safeguard and advance the Group’s reputation for responsible and sustainable conduct and also reviews stakeholder concerns and expectations pertaining to the societal performance of UBS and to the development of its corporate culture. The CCRC reviews the strategic direction taken by UBS on corporate responsibility and sustainability, as well as the implementation of our commitments in these areas. The CCRC consists of four members. In 2015, Axel A. Weber, Chairman of the Board of Directors, chaired the CCRC. The Group Chief Executive Officer (Group CEO) and the Global Head of UBS and Society, are permanent guests of the committee, while the regional presidents attended two of the five CCRC meetings as guests. ▲
® Refer to the Organization Regulations of UBS at www.ubs.com/governance for the charter of the CCRC
® Refer to the 2016 GRI objectives of UBS at www.ubs.com/sustainability
Key principles & policies
EDTF | The Code of Conduct and Ethics (Code), the document that sets out the principles and standards for our firm, clearly emphasizes that these principles and standards apply to all aspects of our business and the way we engage with our stakeholders. The Code aims to foster an ethical culture where responsible behavior becomes second nature. In 2014, the CCRC initiated an in-depth review of our Code, which was conducted together with the Group Executive Board (GEB) and the BoD. The revised Code was published in March 2015. The CCRC reviews the policies and guidelines of UBS pertaining to corporate culture and corporate responsibility to confirm that these are relevant and up to date.
® Refer to the UBS Code of Conduct and Ethics at www.ubs.com/code for more information
The Code incorporates all components of our UBS and Society program. The scope, principles and responsibilities and structure of UBS and Society are set out in more detail in our UBS and Society policy, which governs UBS's interaction with society and the environment, and will supersede our environmental and human rights policy in 2016. The Global Head of UBS and Society leads the execution and further development of the UBS and Society program and is also UBS's senior representative for sustainability issues.
In 2015, we established the UBS and Society Operating Committee to oversee and coordinate the execution of the UBS and Society program at GEB level. The committee is chaired by the Wealth Management and Asia Pacific Presidents, who are also the GEB sponsors of the program. The Global Environmental & Social Risk Committee, also at GEB level, defines the environmental and social risk (ESR) framework and independent controls that align UBS's ESR appetite with the UBS and Society program. It is chaired by the Group Chief Risk Officer, who is responsible for the development and implementation of principles and appropriate independent control frameworks for ESR within UBS.
The business divisions are responsible for developing and executing the UBS and Society program and annual objectives related to client relationship, product development, investment management, distribution and risk management. Corporate Center is responsible for annual objectives related to in-house environmental and responsible supply chain management. Objectives related to Community Affairs are developed and executed at regional level, within the global framework of the UBS and Society program. ▲
® Refer to www.ubs.com/code for more information
External commitments and stakeholder relations
EDTF | As a global firm, we embrace our responsibility to lead the debate on important societal topics as evidenced, for instance, by the UBS climate change study launched in January 2016. We also contribute to setting the standards and promoting international collaboration across industries. These contributions are part of our efforts to advance in areas that are already mandated by governments and regulators, as well as in areas that are still largely voluntary, but nonetheless significantly strengthen our sustainability and corporate responsibility agenda.
In 2015, in support of international efforts leading into the Paris Climate Change conference, UBS signed the World Economic Forum's open letter from CEOs to world leaders urging climate action, the European Financial Services Round Table's statement in support of a strong, ambitious response to climate change, and joined RE100, a global initiative which encourages multinational companies to make a commitment to using 100% renewable power, with a defined time frame for reaching that goal.
EDTF |
Environmental and social risk assessments |
| | | | For the year ended | | % change from |
| | GRI¹ | | 31.12.15 | 31.12.14 | 31.12.13 | | 31.12.14 |
Cases referred for assessment² | | FS2 | | 2,192 | 1,812 | 1,716 | | 21 |
by region | | | | | | | | |
Americas | | FS2 | | 295 | 354 | 367 | | (17) |
Asia Pacific | | FS2 | | 520 | 317 | 296 | | 64 |
Europe, Middle East and Africa | | FS2 | | 257 | 297 | 373 | | (13) |
Switzerland | | FS2 | | 1,120 | 844 | 680 | | 33 |
by business division | | | | | | | | |
Wealth Management | | FS2 | | 396 | 291 | 298 | | 36 |
Wealth Management Americas | | FS2 | | 20 | 21 | 46 | | (5) |
Personal and Corporate Banking | | FS2 | | 980 | 749 | 598 | | 31 |
Asset Management | | FS2 | | 0 | 7 | 14 | | (100) |
Investment Bank | | FS2 | | 776 | 654 | 657 | | 19 |
Corporate Center³ | | FS2 | | 20 | 90 | 103 | | (78) |
1 Global Reporting Initiative (see also www.globalreporting.org). FS stands for the Performance Indicators defined in the GRI Financial Services Sector Supplement. 2 Transactions and onboarding requests referred to and assessed by environmental and social risk function. 3 Relates to procurement / sourcing of products and services. |
▲
Beyond our engagement in many significant external organizations and initiatives, we also regularly engage with our stakeholders through other formal and informal channels and on a wide range of topics. Our relationship with stakeholders is multi-faceted and includes interactions with large groups, regular communications with representatives from a particular group, as well as personal interaction with clients and investors.
Each year we conduct the UBS Materiality Assessment (as defined by the Global Reporting Initiative (GRI)) to capture the views of our stakeholders on the topics they regard as relevant to our firm. The assessment is drawn from assorted formal and informal monitoring tools we employ, from our dialog with stakeholders and from relevant studies and reports. We also undertake targeted surveys of stakeholder groups, with the findings included in the Materiality Assessment, including a major survey of students globally in 2015. The results of the assessment are captured in a GRI-based materiality matrix. This matrix distills the views of the stakeholders with whom we interact and it covers 24 topics, the top three being "conduct and culture," "financial stability and resilience" and "client protection." ▲
® Refer to www.ubs.com/materiality for the UBS 2015 GRI-based materiality matrix and for more information on our stakeholder relations and topics
Management of environmental and social risks
EDTF | We use an environmental and social risk (ESR) framework to identify and manage potential adverse effects on the environment and human rights, as well as the associated environmental and social risks our clients' and our own assets are exposed to. Our comprehensive ESR standards are aligned with the UBS and Society program; they govern client and supplier relationships and are enforced firm-wide.
We apply the ESR policy framework to all our activities. We have set ESR standards in product development, investments, financing and for supply chain management decisions. As part of our due diligence process, we engage with clients and suppliers to better understand their processes and policies and to explore how any environmental and social risks may be mitigated. We avoid transactions, products, services, activities or suppliers if they are associated with material environmental and social risks that cannot be properly assessed. Our ESR standards include the stipulation of controversial activities and other areas of concern we will not engage in, or will only engage in under stringent criteria, as outlined below. We will not do business with a counterparty or an issuer who we judge is not addressing environmental or social issues in an appropriate and responsible manner.

Corporate governance, responsibility and compensation
UBS and Society
In 2015, in support of international efforts to enable a transition to a low-carbon world, we strengthened our ESR standards related to coal. We only support transactions of companies operating coal-fired power plants if they have a strategy to reduce coal exposure or adhere to the strict greenhouse gas emission standards recommended by leading international agencies. Moreover, we do not support certain coal-mining companies and significantly limit lending and capital raising provided to the coal-mining sector.
Our standard risk, compliance and operations processes involve procedures and tools for identifying, assessing and monitoring environmental and social risks. This includes client onboarding, transaction due diligence, product development and investment decision processes, own operations, supply chain management and portfolio reviews. These processes are geared toward identifying clients, transactions or suppliers potentially in breach of our standards, or otherwise subject to significant environmental and human rights controversies. Advanced data analytics on companies associated with such risks is integrated into the web-based compliance tool we use before we enter into a client or supplier relationship, or a transaction. The systematic nature of this tool significantly enhances our ability to identify potential risk. In 2015, 2,192 referrals were assessed by our environmental and social risk unit, of which 73 were rejected or not pursued, and 371 were approved with qualifications.
At portfolio level, we regularly review sensitive sectors and activities prone to bearing environmental and social risks. We assess client exposure and revenue in such sectors and attempt to benchmark the portfolio quality against regional and or sector averages. Such portfolio reviews give us an accurate aggregated exposure profile and an enhanced insight into our transaction and client onboarding processes. The outcomes of these reviews allow us to explore ways to improve the future portfolio profile along a range of risk parameters. As an example, in 2015, we reviewed potential climate change impacts on our energy and real estate loan portfolios using stress testing and portfolio analysis methodologies. ▲
® Refer to www.ubs.com/esr for the complete definition of our standards and specific assessment criteria
Our own operations and supply chain
Since 1999, we have managed our environmental program through an Environmental Management System in accordance with ISO 14001. In addition, our greenhouse gas (GHG) emissions data is externally verified by SGS on the basis of ISO 14064 standards. We set quantitative targets to reduce UBS's Group-wide CO 2 emissions and the environmental impact of our operations. In support of our commitment to RE100, we have committed to sourcing 100% of the firm's electricity from renewable sources by 2020. This will reduce its GHG footprint by 75% by 2020 compared with 2004 levels.
Environmental programs include investments in sustainable real estate and efficient information technology, energy and water efficiency, paper and waste reduction and recycling, the use of environmentally friendly products (such as renewable energy or recycled paper), business travel and employee commuting. We aim to reduce negative environmental and social effects of the goods and services UBS purchases and we engage with suppliers to promote responsible practices.
Environmental targets and performance in our operations¹ |
| GRI² | 2015 | Target 2016 | Baseline | % change from baseline | Progress / Achievement⁸ | 2014 | 2013 |
Total net greenhouse gas emissions (GHG footprint) in t CO2e³ | EN15-17 | 169,006 | –50% | 360,501⁴ | –53.1 | l | 181,066⁹ | 193,872⁹ |
Energy consumption in GWh | EN3 | 668 | –10% | 774⁵ | –13.7 | l | 707⁹ | 758⁹ |
Share of renewable electricity | EN3 | 54.0% | 100%⁶ | 43.6%⁴ | 23.9 | l | 52.0%⁹ | 51.6%⁹ |
GHG offsetting (business air travel) in t CO2e | EN18 | 73,592 | 100% | 0⁴ | 100 | l | 75,305 | 72,612 |
Paper consumption in kg per FTE⁷ | EN1 | 119 | –5% | 122⁵ | –2.3 | l | 121 | 121 |
Share of recycled and FSC paper | EN2 | 83.6% | 60% | 55.8%⁵ | 49.7 | l | 61.8% | 57.6% |
Waste in kg per FTE⁷ | EN23 | 203 | –5% | 232⁵ | –12.3 | l | 213 | 214 |
Waste recycling ratio | EN23 | 52.8% | 60% | 53.9%⁵ | –2.0 | l | 54.6%⁹ | 55.3% |
Water consumption in m m3 | EN8 | 0.96 | –5% | 1.22⁵ | –21.9 | l | 1.08 | 1.09 |
Legend: CO2e = CO2 equivalents; FTE = full-time employee; GWh = giga watt hour; kWh = kilo watt hour; km = kilometer; kg = kilogram; m m3 = million cubic meter; t = tonne 1 Detailed environmental indicators are available on the internet www.ubs.com/environment. Reporting period 2015 (1 July 2014 - 30 June 2015). 2 Related to Global Reporting Initiative (see also www.globalreporting.org). EN stands for the environmental performance indicators as defined in the GRI. 3 GHG footprint equals gross GHG emissions minus GHG reductions from renewable energy and GHG offsets (gross GHG emissions include: direct GHG emissions by UBS; indirect GHG emissions associated with the generation of imported / purchased electricity (grid average emission factor), heat or steam and other indirect GHG emissions associated with business travel, paper consumption and waste disposal). 4 Baseline year 2004. 5 Baseline year 2012. 6 Target year 2020. 7 FTEs are calculated on an average basis including FTEs which were employed through third parties on short-term contracts. 8 Green: on track / amber: behind schedule. 9 2013 and 2014 data was restated due to updated consumption data of an additional co-location (colo) datacenter and minor changes in methodology. |

In 2015, we further reduced UBS’s GHG emissions by 6.7%, or 6.6% per full-time employee, year on year, which means a total reduction of 53% from baseline year 2004. We have thus surpassed our original target of a 50% reduction of GHG emissions by 2016. We achieved this strong performance by adopting energy efficiency measures and increasing the proportion of renewable energy. Emissions, such as from business travel by air, that cannot be reduced by other means are offset.
In 2015, we reduced our energy consumption by more than 13% compared with 2012, thus outperforming our target of a 10% reduction by 2016. We are reducing our use of carbon-intensive energy by replacing fossil-fueled heating infrastructure, where feasible. In 2015, we purchased 54% of UBS's worldwide electricity consumption from renewable sources.
We are committed to further reducing UBS's environmental footprint and are on track to reach most of our 2016 targets compared with 2012 as the baseline.
The responsible supply chain management (RSCM) principles embed UBS’s ethics and values in our interactions with our suppliers, contractors and service partners. We apply an RSCM framework to identify, assess and monitor supplier practices with regard to human and labor rights, the environment, health and safety, and anti-corruption principles. In 2015, remediation measures were requested for 44% of suppliers of newly-sourced goods or services with potentially high impacts to improve their adherence to UBS’s RSCM standards.
® Refer to www.ubs.com/environment for more information on our environmental management
® Refer to www.ubs.com/rscm for more information on our RSCM
Training and raising awareness
EDTF | Awareness and expertise play an important role in implementing our goals. We promote our employees' understanding of the goals and actions of UBS and Society through a wide range of training and awareness-raising activities, as well as performance management. Through these activities we ensure that our employees understand their responsibilities in complying with our policies and the importance of our societal commitments. General information is published on our UBS and Society intranet and Internet sites. In 2015, we continued training and raising employee awareness by embracing the Code. All employees have to confirm annually that they have read UBS’s key documents and policies, including the Code. Employees were also informed of the firm’s corporate responsibility and sustainability strategy and activities through other training and awareness-raising activities. We developed a new mandatory conduct and culture training module, which includes a comprehensive section on UBS and Society. The training was rolled out to all employees in December 2015. ▲
Ratings and recognitions
EDTF | Our performance and success in the area of sustainability is reflected in important external ratings, rankings and recognitions. We received "Industry Leader, Gold Class distinction" for our excellent sustainability performance in 2015, as determined by our score in RobecoSAM’s annual Corporate Sustainability Assessment. RobecoSAM, together with S&P Dow Jones Indices, also publishes the Dow Jones Sustainability Indices (DJSI), the most widely recognized sustainability rating.
As our key achievement in 2015, our firm took over the leadership position in the Diversified Financials industry group of the DJSI. The DJSI evaluates companies' sustainability practices and recognizes the best performers. The Industry Group Leader report for UBS cites our support to clients and communities and our integration of societal and financial performance. It also pointed to our work to build UBS's capital strength, improve efficiency and effectiveness, and strengthen risk management through our UBS and Society program.
With 100 disclosure points, we also achieved a top result in the CDP organization’s assessment for our efforts in reducing carbon emissions and mitigating the business risks of climate change.
Asset Management's efforts in integrating environmental, social and governance issues into its investment practices have been recognized with strong results in the Principles for Responsible Investment's annual reporting and assessment process. Asset Management was awarded at least an A in half of the categories on which it was assessed, most notably achieving an A+ for the main category, Overarching Approach. The Overarching Approach measures an organization’s overall approach to responsible investment, including governance, responsible investment policy, objectives and targets, the resources allocated to responsible investment and the approach to collaboration on responsible investment and public policy-related issues.
Corporate governance, responsibility and compensation
UBS and Society
Asset Management also improved on its strong 2014 ranking in the Global Real Estate Sustainability Benchmark (GRESB) report. In the 2015 GRESB report, the majority of Asset Management's participating real estate funds, managed by Global Real Estate, ranked in the first quartile of their respective peer groups and nine funds were awarded Green Star (top ranking) status.
The UBS Optimus Foundation and its partner Last Mile Health were among a select group of organizations honored at the prestigious Clinton Global Citizen Awards 2015 for their work in tackling the recent Ebola outbreak in West Africa. ▲
How we support our clients
Our clients increasingly care about societal issues and want financial advice as well as the right products in order to use their resources to address them. Many of our clients look to us for support in this regard. As a global firm and the world’s largest wealth manager, we are well placed to provide it. We have, in fact, made it our goal to include sustainable performance in every client conversation.
Sustainable investments
As of 31 December 2015, sustainable investments increased to CHF 934 billion from CHF 577 billion at the end of 2014, representing 35% of our total invested assets compared with 21% in 2014. While this increase is primarily attributable to reporting process enhancements for norms-based screening investments (controversial weapons exclusions) and Asset Management's responsible property investment strategy, invested assets also generally increased in our other sustainable investment classes, including integration, exclusionary screening, impact investing, and third-party. Major increases in absolute terms were observed among our institutional clients, in particular for screened mandates.
We are committed to testing novel financial solutions across our firm. One recent, innovative development in the area of sustainable investing includes the emergence and growth of green bonds. In 2015, Wealth Management Americas contributed to this important development by acting as distributor for the World Bank's first market-linked green bonds for investors in the US.
Moreover, as of 31 December 2015, we held green bonds in the amount of CHF 320 million in our high-quality liquid assets portfolio under the management of Corporate Center – Group Asset and Liability Management.
Other examples also demonstrate that we have the financial expertise, networks and access to capital to build or support niche financial products as proofs of concept that can be replicated and scaled up. Key 2015 examples for this approach include a Wealth Management-sponsored social investment fund in the UK that enables sophisticated investors to invest in a tax efficient way in social enterprises that are helping to tackle poverty, and the launch of a UBS investment mandate for Swiss charitable foundations.
Sustainable investments ¹ | | | | | | | | |
| | | | For the year ended | | % change from |
CHF billion, except where indicated | | GRI² | | 31.12.15 | 31.12.14 | 31.12.13 | | 31.12.14 |
UBS total invested assets | | | | 2,689 | 2,734 | 2,390 | | (2) |
Core SI products and mandates | | | | | | | | |
Integration³ | | FS11 | | 3.37 | 2.62 | 2.18 | | 28 |
Integration / RPI⁴ | | FS11 | | 49.06 | 34.66⁵ | 30.70⁵ | | 42¹⁰ |
Impact investing⁶ | | FS11 | | 0.76 | | | | |
Exclusionary screening⁷ | | FS11 | | 79.20 | 68.60 | 56.09 | | 15 |
Third-party⁸ | | FS11 | | 6.06 | 4.34 | 3.70 | | 40¹⁰ |
Norms-based screening⁹ | | FS11 | | 795.07 | 466.52 | 444.62 | | 70¹⁰ |
Total Sustainable investments | | FS11 | | 933.53 | 576.73 | 537.30 | | 62¹⁰ |
SI proportion of total invested assets (%) | | FS11 | | 34.72 | 21.09 | 22.48 | | |
1 All figures are based on the level of knowledge as of January 2016. 2 FS stands for the Performance Indicators defined in the Global Reporting Initiative Financial Services Sector Supplement. 3 Applies to the active selection of companies, focusing on how a company’s strategies, processes and products impact its financial success, the environment and society. This includes best-in-class, thematic investments or the systematic and explicit inclusion of environmental, social and governance (ESG) factors into traditional financial analysis. 4 UBS Asset Management Responsible Property Investment (RPI) strategy. 5 Invested assets, subject to RPI strategy in 2013 and 2014 were restated. 6 Impact investments are targeted investments with a financial return and a clear social and/or environmental return objective. No data available for 2013 and 2014. 7 Includes customized screening services (single or multiple exclusion criteria). 8 SI products from third-party providers applying either integration and/or exclusionary screening. 9 Reporting scope expanded in 2015 to include all actively managed discretionary segregated mandates. Duplication with other SI categories were subtracted to avoid double counting. 10 Due to changes in reporting scopes, data comparability is limited. |

Investment advisory and products
We define sustainable investing (SI) as a set of investment strategies (exclusion; integration; impact investing) that incorporate material environmental, social and governance (ESG) considerations into investment decisions. SI strategies usually seek to reach one or several of the following objectives: i) align investments with personal values; ii) reduce portfolio risk / return characteristics; and iii) achieve a positive environmental or social impact alongside financial returns.
Our wealth management businesses and Asset Management offer SI products and services for wealth management and institutional clients. Our teams provide thought leadership, advice and sustainable portfolio management, such as mandate solutions and separately managed accounts. We also offer impact investing products and arrange platforms, roundtables and networking events for our clients to exchange ideas and gather know-how. UBS Portfolio Screening Services are mainly offered to ultra high net worth clients to align their portfolios with their values by assessing portfolios along specific sustainability criteria.
In 2015, we launched an investment mandate solution with SI focus for our Swiss core affluent and high net worth clients. UBS Investment Management Mandate Switzerland with SI focus has been constructed primarily investing in instruments with a high sustainability rating. The investment strategy it follows is in line with the UBS House View and is thereby focused on financial performance, as well as considering environmental, social and governance factors. In parallel to our SI offering enhancement in Wealth Management, we also conducted extensive training on the topic of “SI for Wealth Management clients” to further bolster the expertise of our client advisors and product experts.
Asset Management offers a range of SI funds that combine material sustainability factors with a rigorous fundamental investment process. We apply the concept of shared value, according to which companies pursue sustainability practices and not only create value for the shareholder, but also for a wider range of stakeholders. Our investment themes include renewable energy, environmental stewardship, social integration, healthcare, resource efficiency, and demographics. We also manage seven exchange-traded funds (ETFs) that track MSCI’s Socially Responsible Equity Indices (MSCI SRI) and that are listed on the Deutsche Börse (Xetra), SIX Swiss Exchange, London Stock Exchange and Borsa Italiana. In 2015, we launched the world’s first ESG Fixed Income ETF, the Barclays MSCI US Liquid Corporates Sustainable UCITS ETF, which tracks an index jointly developed by Barclays and MSCI.
In 2015, Asset Management won a very competitive and cutting-edge mandate with a large Dutch Pension Fund to craft a global impact equities portfolio with measureable social impact. As this has not been done before, Asset Management is partnering with leading-edge academics on a multi-year research and development effort to develop scientifically based and easy–to-understand social impact metrics that describe how the portfolio is contributing to solving important social themes, while minimizing the negative impact on the environment and society. The themes include climate change, water, health and food security. Once developed and vetted, these social impact metrics will help influence our investment strategies.
® Refer to www.ubs.com/sustainableinvesting for more information
Corporate and personal banking clients financing and advisory
We provide capital-raising and strategic advisory services globally to companies offering products that make a positive contribution to climate change mitigation and adaptation, including those in the solar, wind, hydro, energy efficiency, waste and biofuels, and transport sectors. For clients that contribute to climate change mitigation and adaptation, the Investment Bank provided equity or debt capital market services in 2015 (total deal value CHF 10 billion) or acted as financial advisor (total deal value CHF 35 billion).
We invest in Swiss corporations by supporting Swiss small and medium-sized enterprises (SME) in their energy-saving efforts. As promoted by the Swiss Energy Agency's SME model, clients benefit from the agency's “energy check-up for SMEs” at reduced costs and are granted UBS cash premiums for committing to an energy reduction plan within the scheme. Until the end of 2014, the Swiss Energy Agency recorded double the target for UBS SMEs in their overall energy savings which is equivalent to the energy consumption of approximately 400 single-family homes. UBS clients saved more than 1,800 t / CO2 per annum by the end of 2014. In addition, the UBS environmental bonus, launched in 2015, supports corporate clients when upgrading to more environmentally friendly commercial vehicles. Swiss private clients continue to benefit from the UBS "eco" mortgage when building energy-efficient homes. Our commitment as a financial partner in the energy transition in Switzerland continues by our sponsorship of the Swiss Energy and Climate Summit.
Corporate governance, responsibility and compensation
UBS and Society
Research
In response to increasing client demand for integrating sustainability issues into fundamental investment analysis and advisory processes, we research the impact of ESG issues on various sectors and companies. Our specialized teams regularly publish research on topics that we believe will shape our future. Our experience and sector knowledge help us determine what is material by raising questions about the effects of ESG issues on the competitive landscape in the global sectors we cover, as well as about how companies are affected in relative terms.
In 2015, our Chief Investment Office Wealth Management (CIO) published a series of reports on SI commencing in March, with an overarching publication on the topic "Adding value(s) to investing." This publication set out the why, what and how of SI, highlighting reasons and motivations to become involved in it, presenting three SI strategies, and advising on how to implement them in portfolios. Following on from this, CIO also published a report focused on integration and exclusion which also set out to dispel a common myth that SI must lead to financial underperformance. In September 2015, CIO responded directly to a major global development pertaining to sustainability, the adoption by the UN General Assembly of the Sustainable Development Goals (SDG). CIO published a report spotlighting a number of actionable, sustainability-themed investment ideas well-suited to pursuing the SDG. Sustainability-themed investment ideas were also comprehensively covered in the CIO publication "Years Ahead". For example, CIO outlined areas such as "emerging market healthcare" and "clean air and carbon reduction."
CIO regularly translates key societal and environmental concerns into investment themes as part of its Longer Term Investments series and Wealth Management's global Research-based Advice (RbA). One important example in 2015 was oncology, with the investment theme identifying companies that develop new treatments for cancer. Wealth Management also raised USD 340 million for the initial close of a UBS oncology impact investing collaboration with MPM Capital. More broadly, in 2015, RbA featured Performance Plus, which signifies our conviction that success cannot be measured by financial performance alone, but also by performance relating to the environment, good governance, our social impact and other key components of sustainability and resilience.
For our sustainability-specific strategies in Asset Management, we have developed a leading-edge database of fundamental sustainability data at the company and industry group level that is used alongside valuation data from our analysts to rank the investment universe on both fundamental and sustainability attractiveness. The database mirrors the approach taken by the Sustainability Accounting Standards Board in building its Materiality Matrix™. We believe that this database gives us a significant proprietary edge in the incorporation of fundamental, material sustainability data in the investment process. This Sustainability key performance indicator database is instrumental in ensuring that both valuation and sustainability factors are taken into account simultaneously and that both receive equal weighting in the decision-making process.
Voting rights
We believe that voting rights have economic value and should be treated accordingly. Where Asset Management has been given the discretion to vote on behalf of our clients, we will exercise our delegated fiduciary responsibility by voting in the manner we believe will be most favorable to the value of their investments. In the 12-month period ended 31 December 2015, we voted on 87,348 individual resolutions at 8,654 shareholder meetings, for clients that provided us with voting discretion according to Asset Management's corporate governance principles.
Philanthropy
As one of the first banks offering philanthropy services to clients, our commitment goes back many years. It is a commitment that is continually reaffirmed, reinforced and expanded. We have decided to strengthen and grow our capacity and capabilities in the field of philanthropy to better support our clients in achieving their philanthropic aspirations through innovative solutions. Building on our track record and experience, we have established a global team of in-house experts offering a one-stop professional approach to all aspects of philanthropy, strategic charitable giving and values-based investing. We support clients as they develop their own philanthropic approach by offering them access to a wide range of sustainable philanthropic engagement options across regions and sectors.
The 2015 UBS Global Philanthropy Forum drew a record 150 clients and prospects to St. Moritz, Switzerland, for two days of interactive discussion and exchange around the theme "Daring to innovate." Many of the Forum discussions centered on the phase of "convulsive change" that the world is currently undergoing.
Wealth Management Americas Philanthropic Services convened a one-day client discussion on innovation in the field of autism. The event brought together 30 accomplished experts and families impacted by autism who have the means to make a difference. Following the event, our clients invested in each other's initiatives in response to autism and signed a collective Unity Statement to unify multiple organizations and leaders around this cause.
® Refer to www.ubs.com/sustainableinvesting for more information
Optimus Foundation
2015 was an outstanding year for the UBS Optimus Foundation (Optimus). Despite the challenging economic environment, donations rose to an all-time high of CHF 57 million, including a UBS contribution of CHF 11 million, which multiplied donations from clients and employees. This allowed us to approve more than CHF 60 million in grants to our partners who are working to improve the lives and futures of children around the globe.
UBS is unique in the financial industry because it has a foundation with the philanthropic expertise and offering to help clients achieve their philanthropic goals. As part of UBS, Optimus is also business-minded in its approach to philanthropy and assesses projects with the same rigor that UBS applies to traditional financial investments. Even the best concepts need the right guidance, and Optimus never assumes a project will work just because it seems like the obvious solution. The foundation challenges assumptions rigorously to ensure they live up to its strict standards. Optimus looks for projects where it can add value and that can be scaled to make a fundamental difference to the maximum number of children's lives.
Clients see the benefits of our brand of entrepreneurial philanthropy. With its start-up mentality, Optimus is able to act fast and adapt swiftly, while relying on the global coverage and backing from UBS's expertise and resources. It means that the foundation challenges conventional wisdom and learns from failure. This enables the foundation to identify scalable, transformative projects with proven track records that have the greatest potential to produce sustainable results. In short, Optimus brings more of the money to where it can do the most good. The foundation monitors projects and measures their results, so it can demonstrate to clients exactly where their donations go and what they achieve. As UBS covers all of the foundation's administrative costs, 100% of clients' donations go to the philanthropic projects it supports.
® Refer to www.ubs.com/optimus for more information
How we support our communities
UBS has a responsibility towards our local communities. We know that our long-term success depends on the health and prosperity of the communities in which we operate. Our longstanding global program of community investment focuses on addressing real need by developing skills through our support for education and entrepreneurship. We achieve impact through a combination of strategic funding and employee volunteering.
Our approach is founded on building sustainable and successful partnerships with non-profit organizations and social enterprises to ensure we make a lasting impact. We engage beyond just financial support – UBS employees are key to the success of our community program. By providing diverse opportunities for our employees to volunteer their time and skills in support of our community partners, we seek to align our community program with our core business. We encourage employees to support our local communities by:
– Facilitating employee volunteering with local charitable partners
– Offering employees up to two days a year to volunteer
– Matching fundraising endeavors and employee donations to charities
Community investment 2015
In 2014 and 2015, we enhanced our focus on measuring the impact of our program by using the London Benchmarking Group's standard model for measuring and reporting on our community investment globally. This allows us to effectively evaluate and focus our program.
In 2015, we strengthened our global program and strategic focus on education and entrepreneurship through the enhancement of existing and new partnerships in our local communities. In 2015, UBS made direct cash contributions totaling CHF 27.4 million. 91% of UBS's strategic donations were made in the areas of education and entrepreneurship. 27% of our employees volunteered, a 26% increase compared with 2014.
Additionally, UBS contributed a total of CHF 37.5 million to its affiliated foundations in Switzerland, to the UBS Optimus Foundation and to the UBS Anniversary Education Initiative.
Corporate governance, responsibility and compensation
UBS and Society
Community investment 2015 highlights
Our global program benefited over 100,000 young people and entrepreneurs across all of the regions in which we operate. Examples of our investments include:
– Americas: UBS Americas launched two major initiatives in 2015: Project Entrepreneur, a three-year partnership with Rent the Runway Foundation to grow the pipeline of female founders who are building economically impactful companies; and The TalentED Project, a three-year partnership with Tennessee College Access and Success Network and Discovery Education to help increase the number of low-income, first-generation students going to and graduating from competitive four-year colleges.
– EMEA: We helped launch the Stepping Stones Fund with the City of London Corporation's charity, City Bridge Trust to provide targeted support to social enterprises seeking to increase their impact through social investment. UBS employee volunteers helped coach, assess and then select the grant winners. The first round of funding saw 17 organizations share just over GBP 700,000 to improve their social outcomes with the aim of reaching thousands of beneficiaries.
– Switzerland: In Switzerland, UBS continues to support our longstanding charity partner Young Enterprise Switzerland's Company program. More than 4,000 young students founded and ran real-life companies for a year. UBS supports the national final with volunteers and financial means. UBS has also strongly increased engagement for social entrepreneurs in the country by providing mentoring and supporting respective platforms.
– Asia Pacific: UBS partnered with Yayasan Emmanuel in Indonesia to support international school teachers to raise the capacity of local elementary school teaching up to international standards. The program engages teachers in a process of experiential learning and reflection, ultimately benefiting school pupils by improving teacher quality.
® Refer to www.ubs.com/community for more information

Our employees
Competitive strength in the financial services industry is greatly influenced by the ability, expertise and commitment of a firm's employees. In light of this, we endeavor to attract, enable, develop and engage the best people with the right skills, a responsible mindset and diverse backgrounds. We invest in our employees and seek to ensure that we have effective leadership and human resource practices in place, as well as the structures, technology and training necessary for our employees to deliver on our strategy and meet our clients' needs. These elements, working together, help create sustainable value for all of our stakeholders.
Our approach
We continue to work hard to further strengthen our corporate culture, as we are convinced that the right strategy and a strong, cohesive culture drive excellent performance. First introduced in 2013, the three keys to success – our Pillars, Principles and Behaviors – are the foundation of our strategy and culture. Our Pillars are: building capital strength, improving efficiency and effectiveness, and sharpening risk management. They are the basis of our business strategy and everything we do. Our Principles: client focus, excellence and sustainable performance define what we stand for as a firm and guide our daily work. Of particular importance in how we manage our workforce and how our employees interact are the firm's Behaviors: integrity, collaboration and challenge. These expectations influence our entire people management approach, from whom we hire to how we manage, develop, compensate and support our employees. In 2015, the three keys were embedded into every human resource process at the firm, thus better aligning the way in which we manage our people with the culture that we want to have.
Our workforce
Our overall workforce number remained relatively stable in 2015. As of 31 December 2015, we employed 60,099 people (on a full-time equivalent basis), 56 fewer than a year earlier. In 2015, our employees worked in 54 countries, with approximately 35% of our staff employed in Switzerland, 35% in the Americas, 17% in Europe, Middle East and Africa, and 13% in Asia Pacific. Additionally, our employees worked in 897 office locations, spoke more than 130 languages and were citizens of 135 countries. Our workforce spans four generations, with an average age of 41 and an average length of employment at UBS of nine years. In Switzerland, more than 48% of employees have worked at UBS for more than 10 years.
A mobile workforce helps us better utilize our employees' know-how and increases collaboration across teams, functions and divisions. Many inter-divisional or regional role changes are informal, short-term arrangements to meet specific project needs. However, we formally transferred 1,125 employees between business divisions and 574 employees to roles in other regions in 2015. In relation to average overall headcount, employee turnover was 14.6% in 2015, compared with 13.4% in 2014. Employee-initiated turnover was 9.0% compared with 8.5% in 2014.

Corporate governance, responsibility and compensation
Our employees
Personnel by region |
| | As of | | % change from |
Full-time equivalents | | 31.12.15 | 31.12.14 | 31.12.13 | | 31.12.14 |
Americas | | 20,816 | 20,951 | 21,317 | | (1) |
of which: USA | | 19,897 | 19,715 | 20,037 | | 1 |
Asia Pacific | | 7,539 | 7,385 | 7,116 | | 2 |
Europe, Middle East and Africa | | 10,505 | 10,254 | 10,052 | | 2 |
of which: UK | | 5,373 | 5,425 | 5,595 | | (1) |
of which: Rest of Europe | | 4,957 | 4,663 | 4,303 | | 6 |
of which: Middle East and Africa | | 176 | 166 | 153 | | 6 |
Switzerland | | 21,238 | 21,564 | 21,720 | | (2) |
Total | | 60,099 | 60,155 | 60,205 | | 0 |
Personnel by business division and Corporate Center unit¹ |
| | As of | | % change from |
Full-time equivalents | | 31.12.15 | 31.12.14 | 31.12.13 | | 31.12.14 |
Wealth Management | | 10,239 | 10,337 | 9,988 | | (1) |
Wealth Management Americas | | 13,611 | 13,322 | 13,545 | | 2 |
Personal & Corporate Banking | | 5,058 | 5,206 | 5,209 | | (3) |
Asset Management | | 2,277 | 2,323 | 2,217 | | (2) |
Investment Bank | | 5,243 | 5,194 | 5,165 | | 1 |
Corporate Center | | 23,671 | 23,773 | 24,082 | | 0 |
of which: Services | | 23,470 | 23,517 | 23,747 | | 0 |
of which: Group ALM | | 125 | 120 | 113 | | 4 |
of which: Non-core and Legacy Portfolio | | 77 | 137 | 222 | | (44) |
Total² | | 60,099 | 60,155 | 60,205 | | 0 |
1 Comparative figures in this table may differ from those originally published in quarterly and annual reports due to adjustments following organizational changes. Refer to the “Recent developments” section of our third quarter 2015 report for more information on personnel allocations from Corporate Center – Services to business divisions and other Corporate Center units. 2 Represents information for UBS Group AG (consolidated). As of 31 December 2015, UBS AG (consolidated) employed 58,131 full-time equivalent personnel. The difference comprises 4 full-time equivalents in Wealth Management and 1,964 full-time equivalents in Corporate Center – Services. |
Attracting and recruiting talent
We are committed to developing our existing employees' skills while hiring the best available talent, as required, to sustain and grow our core businesses. In 2015, 34% of all open positions were filled by internal candidates. We also hired 8,988 external candidates across the firm, with Wealth Management hiring 328 client advisors and Wealth Management Americas hiring 389 financial advisors.
In 2015, we further integrated the UBS House View on Leadership, explicit expectations for what good leadership looks like at UBS, and the Principles and Behaviors into our recruitment processes. We also want to hire talented women at all levels, especially within middle and senior management. Therefore, we further strengthened our recruitment procedures in 2015 to help ensure that qualified female candidates are fully considered for open roles.
Employees in nearshore or offshore locations comprised a larger percentage of our global workforce in 2015 than in 2014. In particular, the growth of our Business Solution Centers resulted in significant recruiting activities in Nashville (US), Pune (India), and Shanghai (China), as well as in Krakow and Wroclaw (Poland). We expect those hiring trends to continue in 2016.
Hiring and training a pipeline of young talent is a priority for us. In 2015, 475 university graduates were hired into one of our undergraduate or MBA graduate talent programs, along with 820 interns. Both groups bring new perspectives and skills to our global teams and comprise a continuous source of high-quality talent. In Switzerland, this was the third consecutive year in which we increased the number of new apprentices in conjunction with the UBS Education Initiative, hiring a total of 296 apprentices for business and information technology roles. We also recruited 193 trainees into our Bank Entry Program for high school graduates in Switzerland.
In 2015, we continued to promote the firm's offerings through online and social media channels, strengthening our one-brand approach on LinkedIn through a global UBS company page and an employees and alumni group. We also engaged with students and young professionals through UBS Careers on Facebook, Google+ and Twitter, and shared UBS stories on our corporate YouTube channel and our UBS Careers blog. In addition, we maintained our presence on Glassdoor and launched an Instagram channel.
For the second consecutive year, Working Mother magazine named UBS among the top 100 US companies for our leadership in establishing policies, programs and a corporate culture that supports working mothers. We were also ranked in the global top 40 in Universum’s 2015 World’s Most Attractive Employers list. In Universum's 2015 Ideal Employer survey in Switzerland, the firm was ranked in the top five overall, and the number one financial services firm among both business graduates and experienced professionals. In the UK, UBS was recognized as a Top 30 Employer for the second consecutive year by Working Families. In Asia Pacific, among other honors, UBS was ranked number 29 in the top 100 graduate employers in APAC by Universum.
® Refer to www.ubs.com/careers for more information and to follow the UBS Careers Blog
® Refer to www.ubs.com/awards for information on UBS’s rankings as an employer
Developing and managing our talent
We value the skill, commitment and experience of our workforce and endeavor to offer career development opportunities to employees at all levels. Our talent pipeline is growing, as we are focusing on identifying and developing talent early in a career. We strongly believe in promoting from within, and, in 2015, more than 150 management meetings took place across the firm to review and expand our business talent pipelines. The focus for 2015 was, and remains in 2016, on increasing the diversity of our pipeline and internal mobility, as well as further improving our talent management tools and processes.
Leadership development and training
Our leaders are expected to be change agents and ambassadors for the firm's strategy and culture. In 2015, we again brought together the firm's top 300 leaders at our Senior Leadership Experience (SLE). This is the pinnacle of our integrated leadership development program and a key way for our leaders to advance our strategic and cultural priorities. This year's conference was also an "innovation lab," using the ideas and experience of people across the firm to make headway on a number of key strategic challenges. The SLE and related initiatives, such as the new Senior Leadership Program for managing directors developed with the International Institute for Management Development, help to ensure our leaders are aligned with the firm's strategy, the three keys to success, and our expectations for them.
Beyond these strategic initiatives, our educational offerings in 2015 comprised leadership and key talent development activities, business and client education, and role-specific education for all employees. For example, our longstanding 12-month ED Accelerate program targets top-talent executive directors in all business divisions. It aims to build the firm's leadership pipeline and accelerate participants' readiness for more senior roles. Likewise, high-potential directors and associate directors are invited to Ascent, a 12-month key talent program featuring intense, collaborative projects that find solutions to sponsors' real-time business challenges.
The firm maintains an eLearning portfolio with more than 5,100 courses on a wide range of topics, including financial markets, management, business, risk, compliance, personal skill development and information technology. In 2015, our permanent employees, not including external staff, participated in approximately 754,000 development activities, an average of 12.2 trainings per employee or 2.4 training days. All staff, including external personnel, participate in mandatory training on topics such as operational and conduct risk, money laundering prevention, risk culture and information security. These courses are valuable learning experiences that also help us meet our regulatory commitments.
Innovations in client advisor training
In 2012, UBS defined a set of expectations for its client advisors that developed into a formal certification program. In doing so, we became the first Swiss bank whose diploma holders could place Swiss Certified Client Advisor on their business cards. Since then, more than 3,500 UBS client advisors in the private clients, wealth management Switzerland and corporate and institutional clients businesses have successfully completed the program. In October 2015, UBS, Credit Suisse and the Banques Cantonales Latines agreed on a joint certification standard for client advisors in Switzerland based on UBS's client advisor certification.
Strong advisory skills are a business imperative. Therefore, client-facing employees have numerous opportunities to broaden their capabilities. As examples, all client advisors in Wealth Management must earn a Wealth Management Diploma. High-performing and senior client-facing employees are nominated for the Master in Wealth Management, a strategic partnership between UBS and Rochester-Bern Executive Programs. Our Wealth Planning Analyst program in the US develops the knowledge and skills of future financial advisors through a two-year, apprenticeship-type training program.
Corporate governance, responsibility and compensation
Our employees
Gender distribution by employee category¹ | | | | | | | | | |
| Officers (Director and above) | | Officers (other officers) | | Employees | | Total |
Headcount as of 31.12.15 | Number | % | | Number | % | | Number | % | | Number | % |
Male | 18,186 | 78 | | 12,027 | 60 | | 7,753 | 42 | | 37,966 | 62 |
Female | 5,249 | 22 | | 7,936 | 40 | | 10,534 | 58 | | 23,719 | 38 |
Total | 23,435 | 100 | | 19,963 | 100 | | 18,287 | 100 | | 61,685 | 100 |
1 Calculated on the basis that a person (working full time or part time) is considered one headcount in this table only. This accounts for the total UBS employee number of 61,685 as of 31 December 2015, which excludes staff from UBS Card Center, Hotel Seepark Thun, Wolfsberg and Hotel Widder. |
Managing performance
We know that personal accountability, effective performance management and sound compensation practices are critical for our success as a firm. We therefore strive to ensure that our performance management practices are robust and centered on elements that impact our long-term profitability and our culture: namely, performance and behavior.
At the beginning of every year, the firm's business goals are translated into individual performance and behavior goals, strengthening the alignment between corporate and employee priorities. Employees and managers are also encouraged to discuss achievements, development and career goals throughout the year. This feedback enables employees to achieve challenging goals, to be effective in their roles and to grow in their careers while helping managers support employees in reaching their full potential.
Our year-end review process measures not only what was achieved, but also how those results were achieved. Since 2013, we have specified the behaviors we expect and have embedded them into performance evaluations. In 2015, we introduced separate ratings for goals and behaviors to further emphasize the importance of integrity, collaboration and challenge in daily business activities, as well as transparency in our management and reward processes. Both goal and behavior ratings factor into development, reward and promotion decisions.
Helping employees understand and appropriately manage all types of risk continued to be an important part of our management processes in 2015. Measurable risk objectives were again required for all employees, and those in key risk-taker roles were subject to additional performance review measures. For those employees, at least one independent person in a control function was required to review and provide constructive feedback on their understanding and management of risk in their daily work. This multi-rater approach, focusing on the what and how of performance, can give us a broad perspective on various aspects of individual performance and reduce risk.
Building diversity and inclusion
Our global workforce is already diverse in many aspects and we consider this a competitive strength. We are committed to further increasing diversity and ensuring an inclusive workplace, because both are key to achieving our goals. Diversity is both a cultural and a business imperative. Having a global workforce with wide diversity in age, gender, background, experience, education and other factors helps us achieve our business strategy now and in the future, because we strongly believe that:
– diverse teams better understand and relate to the needs of our clients
– an inclusive work environment attracts high-quality people and helps engage them over the long term
– diversity of background, thought, opinion and experience drives better decision making, innovation and leadership
We focused the majority of our efforts in 2015 on gender diversity. Across UBS, women occupy almost a quarter of our management roles. For years, our firm-wide gender balance has remained stable. We have the aspiration to increase the ratio of women in management roles to one third. We know this will take time. Like many firms, we face a particular challenge in retaining women at the mid-point of their careers. We continue to develop technology solutions, training, career support and human resource policies and processes that over time will help us increase the number of women who choose to build long-term careers with us.
All our human resource policies and processes underscore our commitment to a diverse and inclusive workplace with equal opportunities for all employees. As part of this, each business division delivers on business-specific action plans. In addition, we sponsor numerous internal and external initiatives in each region, with a particular focus on education, coaching and mentoring.
Strengthening diversity in Wealth Management
In 2015, Wealth Management focused on improving its representation of women, supporting employee health and creating a more inclusive working environment, with the aim to be the globally recognized employer of choice for women in the industry. Senior management is fully committed to improving gender balance, sponsoring and participating in a range of new programs supporting the education and professional advancement of women in Wealth Management. Examples of these activities are an individualized fast track program, a sponsorship program for senior women and an educational program for women who want to build their personal finance skills.
At employee level, we promote inclusion and cross-firm collaboration through the sponsorship of numerous initiatives such as our annual Diversity Week in the UK. Employee networks in all regions sponsor numerous networking and educational events on topics related to gender, culture, life stage, sexual orientation, and other aspects of diversity. In 2015, we had 30 employee networks globally, with more than 17,500 members.

Reward
We seek to closely align our reward structure with the strategic priorities, principles, and behaviors that help build and protect the firm’s reputation. As such, our approach to reward has a strong focus on conduct as well as sound risk and management practices.
We offer fixed compensation that is appropriately linked to a flexible variable compensation policy. Variable compensation is a discretionary element that fluctuates year to year. Variable compensation may comprise a shorter-term immediate cash performance award and a longer-term deferred performance award, which includes provisions that put a significant portion of employees' total variable compensation at risk of forfeiture for several years. It is based on individual, team, business division, and Group performance, within the context of the markets in which we operate. Overall, total reward includes base salary, role-based allowances as appropriate, pension contributions and other benefits in accordance with local requirements and market practices. Total reward may also include a shorter- and longer-term performance award to support our focus on the firm's sustained profitability.
Our approach recognizes the need to compensate individuals for their performance within the context of market conditions, a fast-changing commercial environment, evolving regulatory requirements, and behaviors such as integrity, collaboration and challenge. It takes into account base salaries, discretionary performance awards and benefits according to the firm's Total Reward Principles, which aim to:
– attract and engage a talented, diverse workforce
– foster effective performance management
– align reward with sustainable performance
– support appropriate and controlled risk taking
Corporate governance, responsibility and compensation
Our employees
Employee share ownership
Employee share ownership is encouraged and enabled in a variety of ways. One example is our share purchase plan, Equity Plus. This is a voluntary equity-based program that enables eligible employees to purchase UBS shares at market price and receive one free matching share for every three shares purchased. Shares purchased under the Equity Plus Plan are generally blocked from sale for up to three years from the time of purchase. Matching shares vest in three years, provided the employee continues to work at UBS and retains the purchased shares. Another example is the Equity Ownership Plan (EOP), which is a mandatory compensation deferral plan for all employees with total compensation greater than CHF / USD 300,000. The plan links the vesting of EOP awards with a return on equity over a two- to five-year time horizon, which helps align employees' long-term objectives with those of our shareholders. The plan includes provisions that enable the forfeiture of some, or all, of the unvested deferred award if the employee commits certain harmful acts.
As of 31 December 2015, current employees held an estimated 6% of UBS shares outstanding (including approximately 4% in unvested/blocked actual and notional shares from our compensation programs). These figures are based on all known shareholdings from employee participation plans, personal holdings and individual retirement plans. At the end of 2015, an estimated 39% of all employees held UBS shares.
® Refer to the "Compensation" section of this report for more information
Our responsibility as an employer
We strive to be a responsible employer and to provide a supportive work environment for our employees. In this respect, the application of our Principles and Behaviors is an important part of how we manage our global workforce. All employees are offered a comprehensive array of market-competitive benefits that can include insurance, pension, retirement and personal leave. In many cases, our available benefits go beyond what is required by law or market practice. For example, we offer all employees up to two days each year to volunteer in their local communities. We also support flexible working arrangements in our major locations. In Switzerland, this includes telecommuting, part-time, job-sharing and partial retirement options. In the UK and the US, part-time, job-sharing and telecommuting opportunities may be available.
Efficiency, flexibility and leading-edge collaboration tools are important to our businesses and staff, and we have undertaken several initiatives in recent years to improve our workplaces. For example, in 2010 we introduced UBS Workplace Now in Switzerland with a dual aim: to reduce unoccupied office space, and to use mobility to increase flexibility and efficiency. In late 2015, the program was expanded to other locations and we now have approximately 11,500 staff using the new workplaces, which feature shared desks, informal areas for ad hoc meetings and private work rooms.
At different life stages, employees may need specialized support, and we offer resources to help navigate a wide range of issues. For example, our human resource policies help ensure that employees are able to take parental leave upon the birth or adoption of a child and then continue with their careers at UBS upon their return. Parental leave entitlement is governed by local legislation, and it varies by country. UBS meets the statutory parental leave requirements in all locations, and in most locations we exceed them. We also offer employee assistance programs in a number of locations, including the UK, the US, Switzerland, Hong Kong, Singapore and Japan. These programs include specialist support and counseling for stress, illness, personal conflict, finances, bereavement, mental health, elderly care and other work-life challenges. In a number of locations, employees can access company-provided or subsidized health services, child care and fitness options.
Having a supportive work environment is especially important if organizational restructuring adversely affect teams or individual employees. To this end, we have redeployment and outplacement programs in every region to provide assistance in such cases. In the US, we provide career transition support, in addition to severance pay and health benefits, to eligible employees. In Switzerland, our COACH program helps affected employees find new roles either within UBS or outside the firm. Swiss employees participate in a social plan that sets terms for redundancies, internal hiring, job transfers and severance.
Our Code of Conduct and Ethics is the basis for the policies, guidelines and procedures that help us manage our workforce. It includes a commitment to support the health and safety of employees and external staff.
® Refer to www.ubs.com/healthandsafety for more information on our commitment to health and safety
Resolving workplace issues
We recognize that workplace issues may sometimes arise, and we are committed to addressing them in a timely and effective manner. We have established procedures in every region to resolve work-related grievances and complaints. Employees who have concerns about work-related matters are encouraged to speak with their direct line manager or an HR representative. They are also asked to promptly report any conduct by employees, consultants, clients or service providers that may constitute a breach of laws, regulations, rules, policies or procedures. We have a global whistleblowing policy and procedures (including a dedicated website and telephone hotline) for submitting, investigating and handling reports confidentially. Our policies prohibit adverse action against employees acting in good faith and we make the relevant information available to all employees online, in our employee handbooks, and on our global whistleblowing intranet site.
Employee representation
As part of our commitment to being a responsible employer, we maintain an open dialog with all of our employee representation groups in Europe. Established in 2002, the UBS Employee Forum for Europe includes representatives from 12 countries. It facilitates open dialog on pan-European issues that may affect our regional performance, prospects or operations. Country-level forums address topics such as health and safety, changes to workplace conditions, pensions, collective redundancies and business transfers. For example, in Switzerland, elected Employee Representation Committee members meet with senior management at the annual salary negotiations for Swiss employees below director level and represent employee interests on specific topics. The UK Employee Forum focuses on economic, financial and social activities concerning UK employees. Collectively, the UBS Employee Forum, including the Employee Representation Committee and UK Employee Forum, represents approximately 52% of our global workforce.
Corporate governance, responsibility and compensation
Compensation
Compensation
Dear shareholders,
Pillar 3 | The firm delivered excellent performance in 2015, against the backdrop of a challenging market environment. Our compensation decisions reflect our commitment to deliver competitive compensation for excellent performance while balancing returns to our investors and meeting global regulatory capital requirements.
We have consistently applied our compensation philosophy over the past five years to appropriately reward outstanding performance in order to attract, motivate and retain the very best talent. The approach we take to compensation supports the firm's commitment to sustained longer-term profitability, a strong capital position, and aligns compensation with investors’ interests.
2015 performance
In 2015, despite a volatile and uncertain market, we delivered strong net profit attributable to UBS Group AG shareholders of CHF 6.2 billion, a 79% increase compared with a year earlier, and our adjusted1 Group profit before tax more than doubled to CHF 5.6 billion.
The firm's strong capital position was increased further while return on tangible equity exceeded the Group's target for the year.
As a result, the Board of Directors (BoD) intends to propose to shareholders at the Annual General Meeting (AGM) 2016 an increase in the ordinary dividend of 20% compared with 2014, as well as a special dividend of CHF 0.25 per share. Including the proposed dividends for financial year 2015, we will have returned CHF 7.5 billion to shareholders since the acceleration of our strategy in 2012.
2015 performance award and expenses
The firm’s total performance award pool for 2015 was CHF 3.5 billion, an increase of 14% compared with the prior year. Determination of the performance award pool was based on a range of performance metrics, including risk-adjusted profitability and capital strength. The performance award pool also reflects the reduced impact on our results of expenses for provisions relating to litigation, regulatory and similar matters.
The Group Executive Board (GEB) performance award pool, including the Group CEO, was CHF 71.25 million. As a percentage of the adjusted Group profit before tax, the GEB performance award pool was 1.3%, well below the cap of 2.5%.
Compensation for each GEB member is based on a comprehensive assessment of their quantitative, qualitative and relative competitive performance. Awards for 2015 reflect the outstanding performance of the GEB, including the Group CEO, in the context of excellent overall Group performance, and our ambition to align our compensation to appropriate external performance benchmarks.
2015 compensation framework
Our compensation framework has remained largely unchanged since 2012. However, to better align with the market, we have reduced deferral rates for performance awards for those employees at the lower end of the deferral scale thus increasing the proportion of cash compensation awarded to these individuals.
Further, regulatory developments have driven several local adjustments of our compensation practices. For instance, we changed role-based allowances, where applicable, to grant blocked shares instead of shares subject to vesting. This structural shift was required to comply with feedback received from European authorities, and led to an acceleration of the amortization of the compensation expense relating to deferred compensation.
1 Refer to “Group performance” in the “Financial and operating performance” section of the Annual Report 2015 for more information on adjusted results
The firm's compensation vehicles (i.e., the form of performance awards and the related deferral approach) are designed to reinforce appropriate risk-taking and reward longer-term performance. Compared with our peers, we believe UBS has greater alignment with our investors, as we place a greater proportion of variable compensation subject to longer deferral periods in the firm's own equity and debt instruments. For 2015, on average across the firm, 38% of performance awards were deferred, and for the Group CEO and other GEB members on average 86% of their performance awards were deferred for up to five years. Our compensation structure, including the use of debt instruments, allows us to pay competitively, while also supporting our capital requirements. As of 31 December 2015, CHF 1.9 billion of the Deferred Contingent Capital Plan (DCCP) was included in our eligible capital, making up 0.9% of our total capital ratio.
Looking ahead, we will remain abreast of the evolving competitive and regulatory landscape and will adapt our compensation framework and practices where required.
Performance management and culture
In 2015, we strengthened our emphasis on values to support cultural change within the firm. Therefore, we not only take into account what was achieved, but also how the objectives were achieved. This means that an employee's behavior forms an integral part of their overall performance evaluation. These performance and behavior assessments have influenced both promotion and compensation decisions.
Management also continues to drive cultural change by setting a clear tone from the top and by applying a consistent approach throughout the firm. We reinforced our Code of Conduct and Ethics and we do not tolerate misconduct. We enhanced mandatory training in risk and conduct matters, and we continued to encourage our employees to speak up and report any concerns under our whistleblowing procedures.
We are confident that through good leadership and responsible performance management and compensation processes, underpinned with regular training programs, we will continue to reinforce a culture of accountability, and thereby provide added value to our shareholders.
Annual General Meeting 2016
At the AGM 2016, we will ask shareholders to vote on:
– The maximum aggregate amount of compensation for the BoD for the period from AGM 2016 to AGM 2017;
– The maximum aggregate amount of fixed compensation for the GEB for 2017; and,

Ann F. Godbehere
Chair of the Compensation Committee of the Board of Directors
– The aggregate amount of variable compensation for the GEB for 2015;
– Further, we will ask our shareholders for an advisory vote on the Compensation Report outlining our compensation strategy and principles, governance and practice. ▲
The Board of Directors and I thank you for the encouraging shareholder support at the 2015 AGM and for sharing your views on our compensation practices during the year. On the following pages you will find more information about our 2015 compensation approach. We will seek your support on compensation matters at our AGM on 10 May 2016.

Ann F. Godbehere
Chair of the Compensation Committee of
the Board of Directors
Corporate governance, responsibility and compensation
Compensation
2015 Total Reward Principles
Our compensation philosophy is to align the interests of our employees with those of our clients and investors. Our Total Reward Principles underpin our approach to compensation by establishing a framework that balances performance with prudent risk taking. Furthermore, our framework builds on our guiding principles of client focus, excellence and sustainable performance.
Total Reward Principles
Pillar 3 | Our compensation structure is aligned with our strategic priorities. Employees are encouraged to create sustainable value and profitability, and to build a strong client franchise. We reward behavior that helps to build and protect the firm’s reputation. As such, our approach to compensation has a strong focus on conduct as well as on sound risk and management practices. We strive for excellence and sustainable performance in everything we do, and all employees are encouraged to achieve the highest standards of performance.
Compensation for all employees is based on individual, team, business division and Group performance, within the context of the markets in which we operate. The Total Reward Principles establish the framework for determining our performance award pool, and guide the allocation and appropriate delivery mechanisms of compensation to employees, including deferred compensation programs.
Our Total Reward Principles govern the compensation approach and processes across all locations and entities. ▲
The Total Reward Principles establish a framework for managing performance and integrating risk control. They also specify how we structure compensation and provide necessary funding for our performance award pool. These principles and compensation framework apply to all employees globally, but may vary in certain locations due to local laws and regulations.
The table below highlights the range of factors that influence our judgment with respect to the performance award pool, and its allocation and delivery to employees.
The Board of Directors (BoD) has the ultimate responsibility for approving and overseeing the compensation strategy proposed by the Compensation Committee of the Board of Directors, which determines compensation related matters in accordance with the principles set forth in the Articles of Association.
Corporate governance, responsibility and compensation
Compensation
2015 performance and compensation funding
Our excellent performance in 2015 reflects our successful execution and disciplined risk and resource management in a very challenging environment. Net profit attributable to UBS Group AG shareholders increased to CHF 6.2 billion, up 79% compared with 2014. In determining the performance award pool, we endeavor to maintain a balanced allocation of profit between shareholders and employees. The performance award pool for 2015 was CHF 3.5 billion. Compared with 2014, the pool increased 14% while profitability increased strongly by 79%.
Our performance in 2015
In 2015, we were faced with exceptional levels of volatility, a challenging macroeconomic outlook, escalating geopolitical tension and a continued reduction in the risk appetite of our clients. Throughout the year, we stayed close to our clients, helping them to navigate the volatility in the markets. Despite these headwinds, we delivered net profit of CHF 6.2 billion, a 79% increase compared with 2014, and adjusted profit before tax that more than doubled to CHF 5.6 billion. We generated an adjusted return on tangible equity of 13.7%, above our target of approximately 10%. We continued to further strengthen our capital position and improve our leverage ratio, and we ended the year with a fully applied common equity tier 1 (CET1) capital ratio of 14.5%, up 110 basis points from the end of 2014, the highest in our peer group of large global banks. At the end of the year, our fully applied Swiss systemically relevant bank (SRB) leverage ratio1 was 5.3%, up approximately 120 basis points. We also tightly managed costs, with net cost reductions in Corporate Center of CHF 1.1 billion delivered since the end of 2013.
The continued dedication and hard work of our employees enabled us to provide superior advice and service to our clients and to deliver on our commitment to grow profitability. Our Board of Directors intends to propose an ordinary dividend of CHF 0.60 per share, up 20% compared with 2014, reflecting our strong operating performance, as well as a special dividend of CHF 0.25 per share, reflecting a significant net upward revaluation of deferred tax assets in 2015. The total dividend represents a 13% increase on the total capital returned for 2014 and a payout ratio of 52%2 of reported net profit.
Our business divisions delivered strong results in 2015. Our Wealth Management business delivered its highest adjusted pre-tax profit since 2008 at CHF 2.8 billion. Recurring income grew by 3% due to higher net interest income and recurring net fee income, as we made progress on strategic initiatives to grow mandate penetration, and banking and lending products. Management took significant steps to optimize the balance sheet and the quality of assets under management, which impacted reported net new money. Adjusted for these effects, net new money was CHF 22.8 billion, reflecting an annual growth rate of 2.3%, which was below our targeted range of 3–5%. Net new money was negatively impacted by significant client deleveraging caused by difficult market conditions in the second half of the year, as well as cross-border outflows.
1 From 31 December 2015 onwards, the Swiss SRB leverage ratio denominator calculation is fully aligned with the BIS Basel III rules. Prior-period figures are calculated in accordance with former Swiss SRB rules and are therefore not fully comparable. Refer to the “Capital management” section of the Annual Report 2015 for more information. 2 Total dividend per share as a percentage of diluted earnings per share.

Wealth Management Americas delivered good underlying performance and made excellent progress on its strategic objectives. Recurring income increased 5% on a US dollar basis, as net interest and recurring net fee income rose, reflecting our success in growing our banking and lending services and increasing managed accounts. Adjusted pre-tax profit decreased 15% on a US dollar basis, primarily due to higher provisions for litigation, regulatory and similar matters and higher legal fees. Net new money was USD 21.4 billion, driven by advisors who have been with the firm for more than one year as well as new recruits, leading to an annual growth rate of 2.1%.
Personal & Corporate Banking delivered its best adjusted profit before tax since 2010, up 7% compared with 2014, and once again achieved its annual targets. Net new business volume growth for personal banking was 2.4% and we attracted a record number of new clients for the second consecutive year.
Asset Management progressed towards its medium-term goal, with a 20% increase in adjusted pre-tax profit compared with 2014, driven by higher net management fees. The business division’s adjusted cost / income ratio improved from 73.2% to 69.6%. Excluding money market flows, net new money outflows were CHF 0.7 billion, impacted by CHF 33 billion of outflows, largely from lower-margin products, driven by client liquidity needs in difficult market conditions.
Importantly, the inflows achieved were materially higher in margin than outflows, which are expected to result in a net positive effect on our revenues in 2016.
The Investment Bank delivered an adjusted profit before tax of CHF 2.3 billion compared with CHF 162 million in the prior year. Results were driven by growth in revenues in Investor Client Services as well as a significant decrease in provisions for litigation, regulatory and similar matters. The Investment Bank generated an adjusted return on attributed equity of 31%, well above its target of greater than 15%. The business also maintained strict discipline on resource utilization, reducing its leverage ratio denominator (LRD) by 7%1 and risk-weighted assets (RWA) by 6%. International Financing Review awarded the Investment Bank the “Bank of the Year” accolade, highlighting the recognition of our innovative and sustainable operating model and demonstrating the success of the Investment Bank’s strategic direction embarked upon 3 years ago.
Corporate Center reported an adjusted loss before tax of CHF 2.6 billion compared with a loss of CHF 2.9 billion in the prior year, as a significant reduction in negative revenues was partly offset by a higher net charge for litigation, regulatory and similar matters. RWA in Corporate Center – Non-core and Legacy Portfolio was CHF 31 billion at year-end. The LRD in Corporate Center – Non-core and Legacy Portfolio was CHF 46 billion or just 5% of the Group's total LRD.
1 From 31 December 2015 onwards, the Swiss SRB LRD calculation is fully aligned with the BIS Basel III rules. Prior-period figures are calculated in accordance with former Swiss SRB rules and are therefore not fully comparable. Refer to the “Capital management” section of the Annual Report 2015 for more information.
Corporate governance, responsibility and compensation
Compensation
Performance award pool funding
Pillar 3 | Our compensation funding framework is based on business performance, which we measure on multiple dimensions. We assess Group performance and also consider performance relative to the industry, general market competitiveness, progress against our strategic initiatives, including RWA and balance sheet efficiency, delivery of cost efficiencies, and capital accretion. We look at the firm’s risk profile and culture, the extent to which operational risks and audit issues have been identified and resolved, and the success of risk reduction initiatives. In addition, we use a number of criteria including achievement against a set of targets for our business divisions and Corporate Center, listed in the chart below.
EDTF | Certain risk-related objectives are common across all business divisions and Corporate Center, and include adherence to risk investment guidelines, Group risk policies, value-at-risk limits, and the avoidance of significant operational risk events.
Each business division’s performance award pool is initially accrued as a percentage of profit before performance award, which is risk adjusted by factoring in a risk capital charge. In the determination of the final pool, we also consider progress against our strategic initiatives, quality of earnings, affordability and market positioning. Business division performance is adjusted for items which do not represent underlying performance, including gains or losses related to divestments or sales of real estate, restructuring expenses, and gains or losses on own credit.
Our compensation philosophy strives to encourage appropriate risk taking and to protect our talented employee base. To achieve this, as performance increases, we reduce our overall performance award accrual percentage. In strong performance years, this results in an increased proportion of contribution before compensation being available to be delivered to shareholders and prevents excessive compensation. In contrast, if performance declines, the performance award pool will generally decrease. However, we may increase the accrual rate to provide us with the flexibility to make adequate provisions to retain key employees. p▲
1 Refer to the “Our strategy” section of the Annual Report 2015 for more information. 2 Based on US dollars. 3 Expectation.
Performance award funding process – illustrative overview
The chart below illustrates the performance award pool funding process.
Corporate governance, responsibility and compensation
Compensation
2015 performance award pool and expenses
The performance award pool, which includes all discretionary performance-based variable awards for 2015, was CHF 3.5 billion, an increase of 14% compared with 2014.
Performance award expenses for 2015 increased 14% to CHF 3.2 billion. This increase reflects (a) the increase in the performance award pool, (b) higher expenses due to the change in the compensation deferral structure and modification in local compensation practices due to developments in regulatory requirements, and (c) expenses related to the amortization of awards from prior years. The “Performance award expenses” chart on this page compares the performance award pool with performance award expenses.
2015 compensation for the Group CEO and the other GEB members
Group Executive Board (GEB) performance awards are at the discretion of the Board of Directors (BoD) based on the assessment of quantitative and qualitative performance measures and, in aggregate, subject to shareholder approval. The overall aggregate performance award pool for the GEB, including the Group CEO, was CHF 71.25 million for 2015. This is reflective of excellent performance and also the fact that, in recent years, the compensation of the most senior members of the Group has, appropriately, been impacted the most, as the firm addressed legacy matters from its past. Base salaries for the GEB and the Group CEO remain unchanged compared with 2014.
Base salary, role-based allowance, pensions and benefits
Each GEB member receives a fixed base salary, which is reviewed annually by the Compensation Committee. Since the Group CEO’s appointment in 2011, his annual base salary has remained unchanged at CHF 2.5 million. Other GEB members receive a salary of CHF 1.5 million (or local currency equivalent). This level has remained unchanged since 2011.
One GEB member is considered a UK Material Risk Taker (MRT) and receives a role-based allowance in addition to his base salary. This allowance reflects the market value of this specific role and is only paid while the GEB member is considered an MRT. Such an allowance represents a shift in the compensation mix between fixed and variable compensation and does not represent an increase in total compensation. The allowance consists of a blocked UBS share award, which is granted annually.
Pension contributions and benefits for GEB members are in line with local practices for other employees. No enhanced or supplementary pension contributions are made for GEB members.
At the AGM, shareholders are required to approve the maximum aggregate amount of fixed compensation for the members of the GEB for the following financial year.
® Refer to the “Our compensation model for employees other than GEB members” for more information on MRTs
Employment contracts
The employment contracts of the GEB members do not include severance terms, sometimes referred to as golden parachutes, or supplementary pension plan contributions. All employment contracts for GEB members are subject to a notice period of six months. If a GEB member leaves the firm before the end of a performance year, he or she may be considered for a discretionary performance award based on their contribution during that performance year in line with the approach outlined in this report. Such awards are at the full discretion of the BoD, which may decide not to grant any awards.
® Refer to the “Our compensation governance framework” section of this report for more information on the shareholders’ vote on the GEB compensation
Corporate governance, responsibility and compensation
Compensation
Overview of GEB compensation determination process
The compensation for GEB members, including the Group CEO, is governed by a rigorous process with oversight by the Compensation Committee and the BoD. The illustration below shows how compensation for GEB members, including the Group CEO, is determined.

1 Refer to the “Overview of the quantitative and qualitative measures – balanced scorecard" chart for more information.
How we set variable performance award levels for our Group CEO and other GEB members – performance assessment
Pillar 3 | Annual performance awards for the Group CEO and other GEB members are at the full discretion of the BoD and, in aggregate, subject to shareholder approval at the AGM.
Our performance assessment is based on a balanced scorecard, which allows us to assess an individual’s performance against a number of quantitative and qualitative key performance indicators (KPIs).
The quantitative measures for the Group CEO are based on overall Group performance. For other GEB members, they are based on both Group performance and the performance of the relevant business division and / or region. The GEB members who lead Group control functions, or who are solely regional Presidents, are assessed on the performance of the Group and the functions / regions they oversee.
Quantitative measures include business division financial, regional, and functional measures, and account for 65% of the assessment. Qualitative measures account for 35% of the assessment and are the same for all GEB members, including the Group CEO. The table on the following page provides an overview of the quantitative and qualitative KPIs on which the balanced scorecard is based. The weighting between Group, business division, regional, and functional KPIs varies depending on a GEB member’s role. A significant weight is given to Group KPIs for all GEB members.
The degree to which an individual has achieved these quantitative measures, coupled with an assessment of performance against qualitative measures, provides an overall rating. This is the starting point for determining a GEB member’s annual performance award. This approach is not intended to be mechanical, as the Compensation Committee can exercise its judgment with respect to achievement to reflect relative performance versus prior year, versus strategic plan and versus competitors.
The Compensation Committee’s recommendations are then reviewed, and must be approved, by the BoD. The Compensation Committee, and then the full BoD, follow a similar process in setting the compensation for the Group CEO.
While the BoD retains full discretion in determining the variable compensation levels for the Group CEO and other GEB members, the total amount of the awards may not exceed the aggregate cap of 2.5% of adjusted Group profit before tax. Additionally individual GEB and Group CEO’s variable compensation should not exceed the specified individual compensation caps (as described later in this section).
The final aggregated performance award for the GEB, including the Group CEO, for a financial year is subject to shareholder approval at the following AGM. The individual variable performance awards for each GEB member will only be confirmed following shareholder approval at the AGM. ▲
Corporate governance, responsibility and compensation
Compensation
Pillar 3 | Overview of the quantitative and qualitative measures – balanced scorecard
Benchmarking against peers
When recommending performance awards for the Group CEO and the other GEB members, the Compensation Committee reviews the respective total compensation for each role against the broader market and also a group of peer companies selected for the comparability of their size, business and geographic mix, and the extent to which they compete against us for talent. The Compensation Committee also considers the strategies, practices, pay levels and regulatory environment of our peers. Overall, total compensation for a GEB member's specific role is targeted to align with market competitive pay of the role for market competitive performance.
The Compensation Committee annually reviews and approves the core peer group for executive compensation. As of 2015, the core peer group consists of: Bank of America, Barclays, BlackRock, BNP Paribas, Citigroup, Credit Suisse, Deutsche Bank, Goldman Sachs, HSBC, JP Morgan Chase, Julius Baer, Morgan Stanley and Standard Chartered. This group is broadened for the purposes of business division benchmarking and for the review of specific roles, as appropriate.
Comparability assessment against main peers
Benchmarking ensures that our executives´ compensation is appropriate relative to our industry peer group. The key benchmarking criteria are summarized in the table below:
Corporate governance, responsibility and compensation
Compensation
2015 Deferred performance awards
Pillar 3 | For each GEB member, at least 80% of the performance award is deferred, meaning a maximum of 20% of the GEB member’s overall performance award can be paid out in the form of immediate cash, subject to a cap of CHF / USD 1 million (or local currency equivalent). Any amount above this cap is granted in notional shares under the Equity Ownership Plan (EOP). For UK Material Risk Takers (MRTs), 50% of any immediate cash is delivered in vested shares, which are blocked for six months as required by regulators.
For performance year 2015, a minimum of 50% of the overall performance award is granted under the EOP, which vests in three equal installments from year 3 to 5, subject to performance conditions being met. As noted above, for the GEB member who is considered an MRT, each EOP installment vesting on 1 March of years 3 to 5 will be subject to additional blocking for a further six months.
The remaining 30% of the overall performance award is granted under the Deferred Contingent Capital Plan (DCCP). Under the DCCP, GEB members are awarded notional additional tier 1 (AT1) instruments that vest in year 5, with discretionary annual interest payments. The DCCP awards have contributed to the loss-absorbing capital of the Group. In addition to a phase-in common equity tier 1 capital ratio trigger of 10%, DCCP awards granted to GEB members are subject to a further performance condition. If the firm does not achieve an adjusted Group profit before tax for any year during the vesting period, GEB members forfeit 20% of the award for each loss-making year. This means that 100% of the award is subject to risk of forfeiture in addition to the capital ratio trigger. For GEB members, the average 2015 award vests in 4.4 years (in line with 2014). Our compensation plans have no upward leverage, such as multiplier factors, and therefore do not encourage excessive risk-taking.
The Compensation Committee has determined that performance conditions for all GEB members’ awards due to vest in March 2016 have been satisfied. Hence such awards will vest in full, based on the performance conditions having been met.▲
® Refer to the “Our deferred variable compensation plans for 2015” section in this report for more information
® Refer to the “Our compensation model for employees other than GEB members” section in this report for more information on MRTs
® Refer to the “Vesting of outstanding awards granted in prior years impacted by performance conditions” section in this report for more information
Share ownership requirements: aligning GEB members’ interests with those of our shareholders
In addition to our compensation framework, which includes EOP and DCCP, our share ownership policy requires the Group CEO to hold a minimum of 500,000 UBS shares and other GEB members to hold a minimum of 350,000 UBS shares. These shareholdings must be built up within five years from the date a GEB member is appointed and must be retained for as long as the GEB member remains in office. The number of UBS shares held by each GEB member is determined by adding any vested or unvested shares to privately held shares. GEB members are not permitted to sell their UBS shares until the above mentioned thresholds have been reached. At the end of 2015, all GEB members had met the required share ownership level.
Caps on the GEB performance award pool
The total potential GEB performance award pool is capped at 2.5% of the adjusted Group profit before tax. This links overall GEB compensation to the firm’s profitability. As the Group’s adjusted profit before tax for 2015 was CHF 5.6 billion, the GEB 2015 performance award pool was capped at CHF 141 million.
The actual total GEB performance award pool for 2015 was CHF 71.3 million (CHF 58 million in 2014). The performance award pool as a percentage of adjusted Group profit before tax reduced to 1.3% compared with 2.1% in 2014, well below the cap of 2.5%.
In line with the individual compensation caps introduced in 2013 on the proportion of fixed pay to variable pay for all GEB members, the Group CEO’s performance award is capped at five times his base salary. Performance awards of other GEB members are capped at seven times their base salaries. For 2015, performance awards for GEB members and the Group CEO were, on average, 3.7 times their base salaries. The entirety of each GEB member’s performance award that is deferred is subject to performance conditions.
Pillar 3 | 2015 compensation framework for GEB members
Up to 20% of the annual performance award is paid in the form of immediate cash and at least 80% will be deferred for up to five years, with at least 50% granted under the Equity Ownership Plan (EOP) and the remaining 30% under the Deferred Contingent Capital Plan (DCCP). The framework remains the same as for 2014. The chart below is an illustrative example.
Corporate governance, responsibility and compensation
Compensation
2015 compensation for the Group Chief Executive Officer
The performance awards for the Group CEO, Sergio P. Ermotti, and each member of the GEB are based on the achievement of both quantitative and qualitative performance targets as described earlier in this section. These targets were set to reflect the strategic priorities determined by the Chairman and the BoD, including risk-adjusted profitability, our capital position and return on tangible equity, as well as a range of qualitative measures to assess the quality and sustainability of the business.
In line with the previous year Mr. Ermotti’s performance assessment was weighted 65% on quantitative performance based on Group financial performance, and weighted 35% based on qualitative measures.
The table on the following page summarizes the metrics utilized by the BoD to assess Mr. Ermotti’s performance as Group CEO for 2015.
The BoD recognized that under Mr. Ermotti's strong stewardship, the Group financial performance for 2015 was excellent as outlined in the “Performance and compensation funding” section of this report. Adjusted return on tangible equity was 13.7%, above the target for 2015 of approximately 10%. The BoD considered Mr. Ermotti’s active leadership to successfully manage the ambitious capital strategy for 2015. All major capital measures surpassed the targets set for the Group CEO for 2015 on a fully applied basis, including the common equity tier 1 (CET1) capital ratio of 14.5% (significantly above the target of at least 13%), the Swiss SRB leverage ratio of 5.3%, and RWA of CHF 208 billion compared with the target of less than CHF 215 billion. Further, these all represent significant improvements on last year. The firm's capital position continues to compare favorably to peers, which has been underscored by recent upgrades from rating agencies. Achieving the return and capital targets enables the firm to fulfill its commitment to return at least 50% of its net profit to shareholders.
Mr. Ermotti's stewardship in a challenging market environment was key to supporting each business division to deliver good results for the year. Wealth Management delivered its highest adjusted pre-tax profit since 2008 and recurring income grew by 3% due to higher net interest income and recurring net fee income, including progress on strategic initiatives and banking/lending products. Wealth Management Americas had a good underlying performance and made excellent progress on its strategic objectives. Personal & Corporate Banking delivered its best adjusted profit before tax since 2010. Asset Management progressed towards its medium-term goal, growing adjusted pre-tax profit by 20% compared with 2014 due to higher net management fees. Our Investment Bank delivered an adjusted profit before tax of CHF 2.3 billion and generated an adjusted return on attributed equity of 31%, well above its target of greater than 15%. Further, significant progress has also been achieved in the continued wind-down of the Corporate Center – Non-core and Legacy Portfolio, and in particular the leverage ratio denominator was significantly reduced, with a CHF 47 billion or 51% reduction in the balance during the year, significantly ahead of the business plan.
The BoD also acknowledged the strong qualitative performance that Mr. Ermotti demonstrated. His focus on execution of our well-defined strategy has made these results possible.
Mr. Ermotti continued to set the highest standards and a clear tone from the top regarding the risk and control environment. His initiatives to build a strong risk management culture including operational risk management, a robust compliance function and a comprehensive end-to-end control environment are essential in ensuring the firm’s sustainable success.
The BoD considered the significant progress made in the organization’s cultural journey under Mr. Ermotti’s leadership. He continued to pursue culture as a key priority. The Principles and Behaviors have become embedded in the way the firm does business and an integral part of the firm’s talent management, promotion and compensation considerations.
Beyond the results and capital position, the BoD also recognized Mr. Ermotti's drive to deliver on key strategic initiatives, including the successful go-live of UBS Switzerland AG and the implementation of a more self-sufficient business model for UBS Limited. Moreover, Mr. Ermotti successfully implemented a smooth transition to strategically realign his Group Executive Board.
Reflecting Mr. Ermotti's execution of the strategy over the past several years, as well as his overall achievements in 2015, the BoD approved the proposal by the Compensation Committee (subject to shareholder approval as part of the aggregate GEB 2015 variable compensation) to grant a performance award of CHF 11.5 million, bringing his total compensation for the year (excluding benefits and contributions to his retirement benefit plan) to CHF 14.0 million. The performance award will be delivered with 91% deferred under EOP and DCCP over 5 years subject to achieving performance thresholds and other forfeiture provisions. The remaining 9% will be delivered in immediate cash.
® Refer to the “Our deferred variable compensation plans for 2015” section of this report for more information on about the terms of our deferred variable compensation plans

1 Quantitative measures and target levels were based on internal performance objectives in our 2015 Operating Plan. 2 Adjusted Group profit before tax excluding certain charges for provisions for litigation, regulatory and similar matters. 3 Swiss SRB leverage ratio, fully applied, as of 31 December 2015, based on the former Swiss SRB rules, which were applicable at time of 2015 planning. On the basis of the new Swiss SRB rules the leverage ratio as of 31 December 2015 is 5.3%. Refer to the “Capital management” section of the Annual Report 2015 for more information. 4 The qualitative measures used to assess the effectiveness of the Group CEO are outlined in detail in the table "Overview of the quantitative and qualitative measures – balanced scorecard" in this report. ▲
Corporate governance, responsibility and compensation
Compensation
Total compensation for GEB members for the performance years 2015 and 2014
The table below shows the total compensation for GEB members for the performance years 2015 and 2014. At the AGM 2016, shareholders will vote on the overall 2015 total variable compensation.
Audited | Pillar 3 |
Total compensation for GEB members |
CHF, except where indicated¹ | | | | | | |
Name, function | For the year | Base salary² | Contribution to retirement benefits plan³ | Benefits⁴ | Total fixed compensation | Immediate cash⁵ | Annual performance award under EOP⁶ | Annual performance award under DCCP⁷ | Total variable compensa- tion | Total fixed and vari- able com- pensation⁸ |
Sergio P. Ermotti, Group CEO (highest-paid) | 2015 | 2,500,000 | 261,181 | 50,080 | 2,811,261 | 1,000,000 | 7,050,000 | 3,450,000 | 11,500,000 | 14,311,261 |
Sergio P. Ermotti, Group CEO (highest-paid) | 2014 | 2,500,000 | 202,822 | 60,525 | 2,763,347 | 0 | 5,880,000 | 2,520,000 | 8,400,000 | 11,163,347 |
Aggregate of all GEB members who were in office at the end of the year⁹ | 2015 | 19,138,288 | 1,407,042 | 1,614,998 | 22,160,327 | 9,745,110 | 40,129,890 | 21,375,000 | 71,250,000 | 93,410,328 |
2014 | 19,090,186 | 1,343,168 | 1,224,633 | 21,657,987 | 8,423,177 | 32,459,299 | 17,521,060 | 58,403,535 | 80,061,523 |
Aggregate of all GEB members who stepped down during the year¹⁰ | 2015 | 0 | 0 | 0 | 0 | 0 | 0 | 0 | 0 | 0 |
2014 | 0 | 0 | 0 | 0 | 0 | 0 | 0 | 0 | 0 |
1 Local currencies are converted into CHF using the exchange rates as detailed in “Note 36 Currency translation rates” in the “Consolidated financial statements" section of the Annual Report 2015 or the performance award currency exchange rate. 2 Includes role-based allowances that have been made in line with market practice in response to the EU Capital Requirements Directive of 2013 (CRD IV). 3 This figure contains the portion related to the employer’s contribution to the statutory pension scheme. 4 Benefits are all valued at market price. 5 Due to applicable UK Prudential Regulation Authority remuneration code, the immediate cash includes blocked shares for one GEB member. For 2014, the entire performance award for the Group CEO was deferred. 6 For EOP awards for the performance year 2015, the number of shares to be allocated at grant in May 2016 is determined by dividing the amount by CHF 14.98 or USD 15.09, the average closing share price of UBS shares over the last ten trading days in February 2016. For EOP awards for the performance year 2014, the number of shares allocated in May 2015 was determined by dividing the amount by CHF 16.50 and USD 17.41, the average closing share price of UBS shares over the last ten trading days in February 2015. 7 DCCP awards for 2015 to be granted in May 2016, are due to vest in March 2021. DCCP awards for 2014, granted in May 2015, are due to vest in March 2020. The amounts reflect the amount of the notional additional tier 1 (AT1) instrument excluding future notional interest. For DCCP awards for the performance year 2015, the notional interest rate is set at 7.35% for awards denominated in USD and 4.15% for awards denominated in CHF. For DCCP awards for the performance year 2014, the notional interest rate was set at 7.125% for awards denominated in USD and 4.000% for awards denominated in CHF. 8 This figure excludes the portion related to the legally required employer’s social security contributions for 2015 and 2014, which are estimated at grant for CHF 4,132,667 and CHF 3,689,582 respectively, of which CHF 898,596 and CHF 704,077 respectively for the highest-paid GEB member. The legally required employee’s social security contributions are included in the amounts shown in the table above, as appropriate. 9 10 GEB members were in office on 31 December 2015 and on 31 December 2014, respectively. 10 During the years of 2015 and 2014 no GEB members stepped down. |
▲▲
Pillar 3 |
Fixed and variable compensation for GEB members¹ |
| | Total for the year ended 2015 | | Not deferred | | Deferred² | | Total for the Year ended 2014 |
CHF in million, except where indicated | | Amount | % | | Amount | % | | Amount | % | | Amount |
Total compensation | | | | | | | | | | | |
Amount³ | | 90 | 100% | | 29 | 32% | | 62 | 68% | | 77 |
Number of beneficiaries | | 10 | | | | | | | | | 10 |
Fixed compensation³˒⁴ | | 19 | 21% | | 19 | 100% | | 0 | 0% | | 19 |
Cash-based | | 17 | 18% | | 17 | 100% | | 0 | 0% | | 17 |
Equity -based | | 3 | 3% | | 3 | 100% | | 0 | 0% | | 3 |
Variable compensation | | 71 | 79% | | 10 | 14% | | 62 | 86% | | 58 |
Immediate cash⁵ | | 10 | 11% | | 10 | 100% | | 0 | 0% | | 8 |
Equity Ownership Plan (EOP) | | 40 | 44% | | 0 | 0% | | 40 | 100% | | 32 |
Deferred Contingent Capital Plan (DCCP) | | 21 | 24% | | 0 | 0% | | 21 | 100% | | 18 |
1 The figures refer to all GEB members in office in 2015. 2 This is based on the specific plan vesting and reflects the total award value at grant which may differ from the accounting expenses. 3 Excludes benefits and employer's contribution to retirement benefits plan. 4 Includes base salary and role-based allowances, rounded to the nearest million. 5 Includes allocation of vested but blocked shares, in line with UK Prudential Regulation Authority remuneration code. |
▲
2015 compensation for the Board of Directors
Members of the Board of Directors (BoD) receive fixed fees for their services, 50% of which must be used to purchase blocked UBS shares. The members may elect to purchase blocked UBS shares using up to 100% of their fees. BoD members do not receive variable compensation. This reinforces their focus on long-term strategy, supervision and governance, and helps them remain independent of the firm’s senior management. The Chairman, as a non-independent BoD member, receives a cash payment, UBS blocked shares and benefits.
Chairman of the BoD
Under the leadership of the Chairman, Axel A. Weber, the BoD determines the strategy of the Group on recommendations by the Group CEO, exercises ultimate supervision over management and appoints all GEB members.
The Chairman presides over all general meetings of shareholders, and works with the committee chairpersons to coordinate the work of all BoD committees. Together with the Group CEO, the Chairman is responsible for ensuring effective communication with shareholders and other stakeholders, including government officials, regulators and public organizations. This is in addition to establishing and maintaining a close working relationship with the Group CEO and other GEB members, and providing advice and support when appropriate, including continuing to support the firm's cultural change as a key priority on the basis of our Principles and Behaviors.
The Chairman's total compensation is contractually capped at CHF 5.7 million, excluding benefits and pension fund contributions. His total compensation for 2015 consisted of a cash payment of CHF 3.5 million and a share component of CHF 2.2 million delivered in 146,862 UBS shares blocked from distribution for four years (at a share price of CHF 14.98). Accordingly, his total reward, including benefits and pension fund contributions for his service as Chairman for the full year of 2015, was CHF 6,034,141.
The share component ensures that the Chairman’s pay is aligned with the longer-term performance of the firm. The Chairman’s employment agreement does not provide for severance terms, or supplementary contributions to pension plans. Benefits for the Chairman are in line with local practices for UBS employees. The Compensation Committee approves the Chairman’s compensation annually, taking into consideration fee and / or compensation levels for comparable roles outside the firm.
Independent BoD members
With the exception of the Chairman, all BoD members are deemed to be independent directors and receive a fixed base fee of CHF 325,000 per annum. In addition to the base fee, independent BoD members receive fees known as committee retainers that reflect their services on the firm’s various board committees. The Senior Independent Director and the Vice Chairman of the BoD each receives an additional retainer of CHF 250,000. As noted above, independent BoD members are required to use a minimum of 50% of their fees to purchase UBS shares that are blocked for four years. However, they may elect to use up to 100% of their fees to purchase blocked UBS shares. In all cases, the number of shares that independent BoD members are entitled to receive is calculated with a discount of 15% below the average market price over the last 10 trading days in February. In accordance with their roles, independent BoD members do not receive performance awards, severance payments or benefits. The chart on the following page provides details and additional information on the remuneration framework for independent BoD members.
Base fees, committee retainers and any other payments to be received by independent BoD members are subject to an annual review with a proposal being submitted by the Chairman of the BoD to the Compensation Committee, which in turn submits a recommendation to the BoD for approval. The BoD proposes at each AGM for shareholder approval the aggregate amount of BoD remuneration, including compensation of the Chairman, that applies until the subsequent AGM.
The table “Remuneration details and additional information for independent BoD members” shows the remuneration by independent BoD member for the period from AGM 2015 to AGM 2016. The fixed base fees have remained unchanged compared with the period 2014/15, and have been broadly flat since 1998.
In accordance with BoD compensation practice, one BoD member chose to use 100% of the fees, less applicable deductions, to purchase blocked UBS shares.
Corporate governance, responsibility and compensation
Compensation
2015 / 2016 Remuneration framework for independent BoD members
CHF, except where indicated
Fees including retainers for Committee chair / membership, and / or specific roles, are paid per annum. At least 50% of the total amounts must be used to purchase shares which are blocked for four years.
Audited |
Total payments to BoD members | | |
CHF, except where indicated | For the year | Total¹ |
Aggregate of all BoD members | 2015 | 12,778,308 |
2014 | 13,039,851 |
1 This figure includes social security contributions paid by the BoD members, but excludes the portion related to the legally required social security contributions paid by UBS, which for 2015 are estimated at grant at CHF 653,272 and for 2014 at CHF 623,790. |
▲
Audited |
Compensation details and additional information for non-independent BoD members |
CHF, except where indicated |
Name, function¹ | For the year | Base salary | Annual share award² | Benefits³ | Contributions to retirement benefit plans⁴ | Total⁵ |
Axel A. Weber, Chairman | 2015 | 3,500,000 | 2,200,000 | 72,959 | 261,181 | 6,034,141 |
2014 | 3,000,000 | 2,566,672 | 113,109 | 260,070 | 5,939,851 |
1 Axel A. Weber was the only non-independent member in office on 31 December 2015 and on 31 December 2014, respectively. 2 These shares are blocked for four years. 3 Benefits are all valued at market price. 4 This figure contains the portion related to UBS’s contribution to the statutory pension scheme. 5 This figure excludes the portion related to the legally required social security contributions paid by UBS, which for 2015 are estimated at grant at CHF 368,257 and for 2014 at CHF 363,488. The legally required social security contributions paid by the non-independent BoD members are included in the amounts shown in the table above, as appropriate. |
▲
Audited |
Remuneration details and additional information for independent BoD members |
CHF, except where indicated |
Name, function¹ | Audit Committee | Compensation Committee | Corporate Culture and Responsibility Committee | Governance and Nominating Committee | Risk Committee | For the period AGM to AGM | Base fee | Committee retainer(s) | Additional payments² | Total³ | Share percentage⁴ | Number of shares⁵˒⁶ |
Michel Demaré, Vice Chairman | M | M | | M | | 2015/2016 | 325,000 | 400,000 | 250,000 | 975,000 | 50 | 38,295 |
M | M | | M | | 2014/2015 | 325,000 | 400,000 | 250,000 | 975,000 | 50 | 34,746 |
David Sidwell, Senior Independent Director | | | | M | C | 2015/2016 | 325,000 | 500,000 | 250,000 | 1,075,000 | 50 | 42,223 |
| | | M | C | 2014/2015 | 325,000 | 500,000 | 250,000 | 1,075,000 | 50 | 38,310 |
Reto Francioni, member | | M | M | | M | 2015/2016 | 325,000 | 255,000 | | 580,000 | 50 | 22,780 |
| M | M | | | 2014/2015 | 325,000 | 150,000 | | 475,000 | 50 | 16,928 |
Ann F. Godbehere, member | M | C | | | | 2015/2016 | 325,000 | 500,000 | | 825,000 | 50 | 32,403 |
M | C | | | | 2014/2015 | 325,000 | 500,000 | | 825,000 | 50 | 29,401 |
Axel P. Lehmann, member | | | | | M | 2015/2016 | 210,347 | 129,444 | | 339,792 | 100 | 25,217 |
| | | | M | 2014/2015 | 325,000 | 200,000 | | 525,000 | 100 | 35,388 |
Helmut Panke, former member | | | | | | 2015/2016 | – | – | | – | – | – |
| M | | | M | 2014/2015 | 325,000 | 300,000 | | 625,000 | 50 | 22,273 |
William G. Parrett, member | C | M | M | | | 2015/2016 | 325,000 | 402,500 | | 727,500 | 50 | 28,574 |
C | | M | | | 2014/2015 | 325,000 | 350,000 | | 675,000 | 50 | 24,055 |
Isabelle Romy, member | M | | | M | | 2015/2016 | 325,000 | 300,000 | | 625,000 | 50 | 24,548 |
M | | | M | | 2014/2015 | 325,000 | 300,000 | | 625,000 | 50 | 22,273 |
Jes Staley, former member | | M | | | M | 2015/2016 | 154,375 | 142,500 | | 296,875 | 0 | 0 |
| | | | | 2014/2015 | – | – | | – | – | – |
Beatrice Weder di Mauro, member | M | | | | M | 2015/2016 | 325,000 | 400,000 | | 725,000 | 50 | 28,476 |
M | | | | M | 2014/2015 | 325,000 | 400,000 | | 725,000 | 50 | 25,837 |
Joseph Yam, member | | | M | | M | 2015/2016 | 325,000 | 250,000 | | 575,000 | 50 | 22,584 |
| | M | | M | 2014/2015 | 325,000 | 250,000 | | 575,000 | 50 | 20,491 |
Total 2015/2016 | | | | | | | | | | 6,744,167 | | |
Total 2014/2015 | | | | | | | | | | 7,100,000 | | |
Legend: C = Chairperson of the respective Committee, M = Member of the respective Committee | |
1 There were nine independent BoD members in office on 31 December 2015. Jes Staley was elected at the AGM on 7 May 2015 and stepped down on 28 October 2015. Helmut Panke did not stand for re-election at the AGM on 7 May 2015. Reto Francioni was appointed as a Risk Committee member on 29 October 2015 and William G. Parrett was appointed as a Compensation Committee member on 29 October 2015 due to the vacancies opened by Jes Staley's resignation. Axel P. Lehmann stepped down as BoD member on 31 December 2015. Jes Staley, Reto Francioni, William G. Parrett and Axel P. Lehmann were remunerated pro rata temporis for 2015. There were 10 independent BoD members in office on 31 December 2014. Rainer-Marc Frey did not stand for re-election at the AGM on 7 May 2014. 2 This payments are associated with the Vice Chairman or the Senior Independent Director function. 3 This figure excludes UBS’s portion related to the legally required social security contributions which for the period from the AGM 2015 to the AGM 2016 are estimated at grant to CHF 285,015 and which for the period from the AGM 2014 to the AGM 2015 were estimated at grant to CHF 260,302. The legally required social security contributions paid by the independent BoD members are included in the amounts shown in the table above, as appropriate. 4 Fees are paid 50% in cash and 50% in blocked UBS shares. However, independent BoD members can elect to have 100% of their remuneration paid in blocked UBS shares. 5 For 2015, UBS shares, valued at CHF 14.98 (average price of UBS shares at SIX Swiss Exchange over the last 10 trading days of February 2016), were granted with a price discount of 15% for a new value of CHF 12.73. These shares are blocked for four years. For 2014, UBS shares, valued at CHF 16.50 (average price of UBS shares at SIX Swiss Exchange over the last 10 trading days of February 2015), were granted with a price discount of 15% for a new value of CHF 14.03. These shares are blocked for four years. 6 Number of shares is reduced in case of the 100% election to deduct social security contributions. All remuneration payments are subject to social security contributions / withholding tax. |
▲
Corporate governance, responsibility and compensation
Compensation
Our compensation governance framework
The Compensation Committee is a committee of the Board of Directors (BoD) and consists of four independent BoD members who are elected annually by shareholders at the Annual General Meeting (AGM).
Pillar 3 | Compensation Committee
As determined in the Articles of Association and the Organization Regulations of the firm, the Compensation Committee serves as the supervisory body for our human resources and compensation policies. The Compensation Committee ensures that we have appropriate governance and oversight of our compensation process and practices, that we have strong alignment between pay and performance, and that our compensation system does not encourage inappropriate or excessive risk-taking.
Among its other responsibilities, the Compensation Committee, on behalf of the BoD:
– reviews our Total Reward Principles
– reviews and approves the design of the compensation framework annually, including compensation programs and plans
– reviews performance award funding throughout the year and proposes the final performance award pool to the BoD for approval
– together with the Group CEO, reviews performance targets, performance assessment and proposes base salaries and annual performance awards for other GEB members to the BoD, which approves the total compensation of each GEB member
– together with the Chairman of the BoD, establishes performance targets, evaluates performance and proposes the compensation for the Group CEO to the BoD
– approves the total compensation for the Chairman of the BoD
– together with the Chairman, proposes the total individual compensation for independent BoD members for approval by the BoD
– proposes, together with the BoD, the maximum aggregate amounts of compensation for the BoD and for the GEB, to be submitted for approval by shareholders at the AGM
– reviews the Compensation Report and approves any material public disclosures of compensation matters
The Compensation Committee meets at least four times a year. In 2015, the Compensation Committee held seven meetings and one conference call. All meetings were fully attended, with the exception of two meetings and the conference call where one member was absent. The Chairman of the BoD and the Group CEO were present at all meetings except during discussions related to their own compensation. The Chairperson of the Compensation Committee may also invite other executives to join the meeting in an advisory capacity. No individual is allowed to attend meetings during which specific decisions are made about his or her own compensation. Such decisions are at the discretion of the Compensation Committee and the BoD.
Following the meetings, the Chairperson of the Compensation Committee reports to the BoD on the activities of the Compensation Committee and the matters discussed. In addition, where necessary, the Chairperson submits proposals for approval by the full BoD. The minutes of Compensation Committee meetings are made available to all members of the BoD.
On 31 December 2015, the Compensation Committee members were Ann F. Godbehere, who chairs the committee, Michel Demaré, Reto Francioni and William G. Parrett who joined the Compensation Committee as of 29 October 2015, after Jes Staley’s resignation from the BoD. Former Compensation Committee member Helmut Panke retired at the AGM on 7 May 2015. ▲
External advisors
Pillar 3 | The Compensation Committee may retain external advisors to support it in fulfilling its duties. In 2015, HCM International Ltd. provided impartial independent advice on compensation matters. The company holds no other mandates with the firm. The compensation consulting firm Towers Watson continued to provide the Compensation Committee with data on market trends and benchmarks, including in relation to GEB and BoD compensation. Various subsidiaries of Towers Watson provide similar data to Human Resources in relation to compensation for employees below BoD and GEB level. Towers Watson holds no other compensation-related mandates with the firm. ▲
The Risk Committee’s role in compensation
EDTF | We are engaged in a risk management business and our success depends on prudent risk-taking. We will not tolerate inappropriate behavior that can harm the firm, its reputation or the interests of our various stakeholders. The Risk Committee, a committee of the BoD, works closely with the Compensation Committee to ensure our approach to compensation reflects proper risk management and control. The Risk Committee supervises and sets appropriate risk management and control principles and receives regular briefings on how risk is factored into the compensation process. It also monitors Group Risk Control’s involvement in compensation and reviews risk-related aspects of the compensation process.▲
® Refer to our corporate governance website at www.ubs.com/governance for more information
Compensation Committee 2015 / 2016 key activities and timeline
This table provides an overview of the key Compensation Committee scheduled activities from AGM 2015 to AGM 2016.

Corporate governance, responsibility and compensation
Compensation
Shareholder engagement and say-on-pay votes at the AGM
The BoD and the Compensation Committee are committed to maintaining an ongoing dialogue with our shareholders to ascertain their perspectives on developments and trends in compensation and corporate governance matters. In this context, we implemented the annual advisory vote on the Compensation Report in 2009 to provide shareholders with the opportunity to express their views on our compensation framework.
In line with the Swiss Ordinance against Excessive Compensation in Listed Stock Corporations, and similar to last year, we will again seek binding shareholder approval of the aggregate compensation for the GEB and aggregate remuneration for the BoD.
The say-on-pay requirements provided for in the Articles of Association (AoA) were approved at the AGM 2014.
The BoD believes that prospective approval of the fixed remuneration for the BoD and the GEB provides the firm and its governing bodies with the certainty needed to operate effectively. Furthermore, retrospective approval of the GEB’s variable compensation awards aligns total compensation for the GEB to performance and contribution, and to developments in the market place and across peers. The combination of the binding votes on compensation and the advisory vote on the compensation framework reflects our full commitment to ensuring that our shareholders have a true say-on-pay.
® Refer to the sidebar “Provisions of the Articles of Association in relation to compensation” at the end of this section for more information.
Say-on-pay – Compensation-related votes at the AGM 2015
The table provides an overview of the compensation-related agenda items at AGM 2015 and respective outcomes.

1 Local currencies are converted into CHF using the exchange rates as detailed in “Note 36 Currency translation rates” in the “Financial information” section of UBS Group AG Annual Report 2014. 2 This figure excludes the portion related to the legally required employer’s social security contributions. 3 10 GEB members were in office on 31 December 2014.
AGM 2015 say-on-pay votes
At the AGM 2015, shareholders approved a maximum aggregate remuneration of CHF 14,000,000 for the BoD for the period from the AGM 2015 to the AGM 2016. This aggregate maximum amount includes the compensation for the Chairman and fees for independent BoD members, and was proposed on the assumption that the number of BoD members and each individual’s committee and committee chair responsibilities remain unchanged for the specified period. A reserve was also included in the total amount of CHF 700,000 to take into account potential changes in BoD committee compositions. The maximum amount excludes the firm’s portion related to the legally required social security and the value of the discount on the share price due to the four year blocking period. For the period from the AGM 2015 to the AGM 2016, an aggregate amount of CHF 12,778,308 was paid to the Chairman and all independent BoD members. The difference when compared to the maximum amount approved by the shareholders at the AGM 2015 was due to the actual amount of benefits and contributions made to the retirement benefits plan for the Chairman, and also as a result of one independent BoD member having received his fees pro-rata after stepping down during the year. The reserve was not utilized.
At the AGM 2015, shareholders approved an aggregate amount of variable compensation of CHF 58,403,535 for the members of the GEB for the financial year 2014. This amount was granted in May 2015.
Shareholders also approved the aggregate amount of fixed compensation of CHF 25,000,000 for the members of the GEB for the financial year 2016. The final spend will be disclosed in the 2016 Compensation Report.
AGM 2016 say-on-pay votes
For 2016 AGM say-on-pay votes, the BoD will propose the agenda items to shareholders based on the same approach as for 2015 AGM. Further details on the agenda items and the respective amounts will be set out in the AGM 2016 invitation.
Overview of aggregate GEB variable compensation 2014 -20151
1 Refer to the footnotes in the table "Total compensation for GEB members" for more information.
2016 Say-on-Pay— Time-based delineation of BoD / GEB compensation, subject to shareholder approval
The following chart shows the prospective and retrospective elements of the say-on-pay votes approach.
Corporate governance, responsibility and compensation
Compensation
Our compensation model for employees other than GEB members
The typical elements of an employee’s total reward are fixed compensation, a discretionary performance award, and pension contributions and benefits. The performance award may comprise a shorter-term immediate cash performance award and a longer-term deferred performance award. This mix encourages appropriate risk taking and behaviors that lead to sustainable performance.
Base salary
Pillar 3 | Employees’ fixed compensation reflects their skills, role, and experience, as well as local market practices. Fixed compensation generally consists of a base salary and, if applicable, a role-based allowance. Base salaries are usually paid monthly or fortnightly. We offer our employees competitive base salaries, although salary levels will vary greatly between functions and locations. Since 2011, salary increases have been limited. With effect from March 2016, total base salaries increased by CHF 104 million, or 1.7%. Such increases will continue to be paid to those employees who were promoted, those with scarce or in-demand skillsets, or those who delivered a very strong performance or took on increased responsibilities.
As a firm, we focus on total compensation. For example, 2015 performance award pools take account of salary increases granted earlier in the year. We will continue to review salaries and performance awards in light of market developments, performance, affordability and our commitment to deliver sustainable returns to our shareholders.
In addition to a base salary and as part of fixed compensation, some regulated employees may receive a role-based allowance as described in the UK Material Risk Takers section of this report. Such allowance represents a shift in the compensation mix between fixed and variable compensation and does not represent an increase in total compensation. ▲
Pensions, benefits, and employee share purchase program
Pillar 3 | We offer certain benefits to our employees such as health insurance and retirement benefits. While these benefits may vary depending on the employee’s location, they aim to be competitive in each of the markets in which we operate. Pension contributions and pension plans vary across locations and countries in accordance with local requirements and market practice. However, pension plan rules in any one location are generally the same for all employees, including management.
The Equity Plus Plan is our employee share purchase program. It allows employees below the rank of managing director to contribute up to 30% of their base salary and / or up to 35% of their performance award (up to CHF / USD 20,000 annually) toward the purchase of UBS shares. Eligible employees may purchase UBS shares at market price and receive one matching share for every three shares purchased through the program. The matching shares vest after three years, subject to continued employment with the firm and provided that the purchased shares have been retained for the entire holding period. p
® Refer to “Note 28 Pension and other post-employment benefit plans” in the “Consolidated financial statements” section of the Annual Report 2015 for more information on the major post-employment benefit plans established in Switzerland and other countries
Performance award
Pillar 3 | Most of our employees are eligible for an annual discretionary performance award. The level of the award depends on the firm’s overall performance, the employee’s business division performance, the individual’s performance and behaviors reflecting their overall contributions. The award is at the complete discretion of the firm. To link pay with performance, the key performance indicators used to measure our progress in executing our strategy are taken into account when determining the size of each divisional performance award pool. They are also used as a basis for setting specific performance conditions for vesting of certain deferred compensation plan grants.
In addition to the firm’s principles around Client focus, Excellence and Sustainable performance, on an individual level, behaviors related to Integrity, Collaboration and Challenge are part of the performance management approach. Therefore, when assessing performance, we not only take into account what was achieved, but also how the objectives were achieved. ▲
Benchmarking
Pillar 3 | Because of the diversity of our businesses, the companies we use as benchmarks depends on the respective business division and location, as well as the nature of the positions involved. For certain businesses or positions, we may take into account practices at other major international banks, other large Swiss private banks, private equity firms, hedge funds and non-financial firms. Furthermore, we also benchmark employee compensation internally for comparable roles within and across business divisions and locations. ▲
Deferral of performance awards
Pillar 3 | Our goal is to focus our employees on delivering sustainable profitability for the firm. In practice, this means that employees with the highest levels of compensation have a higher effective deferral rate. If an employee’s total compensation exceeds CHF / USD 300,000, a significant part of their performance award will be deferred for up to five years.
The deferral increases at higher marginal rates in line with the value of the performance award, with the lowest deferral rate set at 30% of the performance award, down from 40% for 2014, and the highest rate at 75%. In addition, the portion paid out in immediate cash is capped at CHF / USD 1 million (or equivalent). Amounts in excess of the cash cap are deferred in notional shares under the Equity Ownership Plan (EOP). The effective deferral rate therefore depends on the value of the performance award and the value of total compensation.
Of the deferred annual performance award, at least 60% is deferred in UBS notional shares under the EOP and up to 40% is deferred in notional instruments under the Deferred Contingent Capital Plan (DCCP). Asset Management employees receive at least 75% of their deferred performance awards in notional funds under the EOP and up to 25% under the DCCP. The average deferral period for deferred employee awards below GEB level was 3.5 years for 2015. ▲
® Refer to the “Our deferred variable compensation plans for 2015” section of this report for more information about the terms of our deferred variable compensation plans, including the forfeiture provisions to which they are subject, and the terms applicable to Asset Management employees
® Refer to “Note 29 Equity participation and other compensation plans�� in the “Consolidated financial statements” section of the Annual Report 2015 for more information on specific local plans with deferral provisions that differ from those described here
Corporate governance, responsibility and compensation
Compensation
Other variable compensation components
Pillar 3 | To support hiring and retention, particularly at senior levels, we may offer certain other compensation components. These include:
– Replacement payments to compensate employees for deferred awards forfeited as a result of joining the firm. Such payments are industry practice and are often necessary to attract senior candidates who generally have a significant portion of their awards deferred at their current employer and where continued employment is required to avoid forfeiture.
– Retention payments made to key employees to induce them to stay, particularly during critical periods for the firm.
– On a very limited basis, guarantees may be required to attract individuals with certain skills and experience. These awards, which are fixed incentives to which our standard deferral applies, are limited to the first full year of employment.
– Award grants to employees hired late in the year to replace performance awards that they would have earned at their previous employer, but have been foregone by joining the firm. These awards are structured with the same level of deferral as for employees at a similar level at UBS. In addition, in very exceptional cases, candidates may be offered sign-on payments to increase the chances of them accepting an offer.
These other variable compensation payments are subject to a comprehensive governance process. Authorization and responsibility are dependent on the level and / or type of payments, up to the BoD Compensation Committee.
Further, severance payments are made to employees in redundancy cases. These are governed by location-specific severance policies. We offer severance terms which comply with the applicable local laws (legally obligated severance). In certain locations, we may provide severance packages that are negotiated with our local social partners that go beyond these minimum legal requirements (standard severance). In addition, we may make severance payments that exceed legally obligated or standard severance payments (supplemental severance) where we believe that they are aligned with market practice and appropriate under the circumstances. Under no circumstances are severance payments made to members of the GEB. ▲
Sign-on payments, replacement payments, severance payments and guarantees |
| Total 2015 | Of which expenses recognized in 2015³ | Of which expenses to be recognized in 2016 and later | Total 2014 | Number of beneficiaries |
CHF million, except where indicated | | | | | 2015 | 2014⁴ |
Total sign-on payments¹ | 21 | 11 | 10 | 20 | 114 | 162 |
of which GEB members | 0 | 0 | 0 | 0 | 0 | 0 |
of which Key Risk Takers² | 11 | 5 | 5 | 4 | 14 | 5 |
Total replacement payments | 85 | 11 | 75 | 81 | 252 | 275 |
of which GEB members | 0 | 0 | 0 | 0 | 0 | 0 |
of which Key Risk Takers² | 44 | 5 | 39 | 27 | 27 | 17 |
Total guarantees | 44 | 15 | 29 | 47 | 35 | 54 |
of which GEB members | 0 | 0 | 0 | 0 | 0 | 0 |
of which Key Risk Takers² | 29 | 8 | 21 | 18 | 13 | 6 |
Total severance payments¹˒³ | 166 | 164 | 2 | 176 | 1,850 | 1,667 |
of which GEB members | 0 | 0 | 0 | 0 | 0 | 0 |
of which Key Risk Takers² | 2 | 2 | 0 | 3 | 6 | 2 |
1 GEB members are not eligible for sign-on or severance payments. 2 Expenses for Key Risk Takers are full-year amounts for individuals in office on 31 December 2015. Key Risk Takers include employees with a total compensation exceeding CHF / USD 2.5 million (Highly-Paid Employees). 3 Severance payments include legally obligated and standard severance, as well as supplemental severance payments of CHF 8 million. 4 Expenses before post-vesting transfer restrictions. |
Compensation for financial advisors in Wealth Management Americas
Pillar 3 | In line with market practice for US wealth management businesses, the compensation for Financial Advisors in Wealth Management Americas is based on production payout and awards. Production payout, paid monthly, is primarily based on compensable revenue. Advisors may also qualify for year-end awards, which are deferred for between 6 and 10 years. The awards are based on strategic performance measures which include production, length of service with the firm, and net new money generated. Production payout rates and awards may be reduced if financial advisors make repeated or significant transaction errors and / or demonstrate negligence or carelessness or otherwise fail to comply with the firm’s rules, standards, practices and policies and / or applicable law. ▲
Key Risk Takers
Pillar 3 | Key Risk Takers (KRTs) are globally defined as those employees who, by the nature of their role, have been determined to materially set, commit or control significant amounts of the firm’s resources and / or exert significant influence over its risk profile. This includes employees who work in front-office roles, logistics and control functions. Identifying KRTs is part of the Risk Control framework and an important element in ensuring we incentivize only appropriate risk-taking. For 2015, we had 669 individuals classified as KRTs, including all 10 GEB members. This group also includes employees with a total compensation exceeding CHF / USD 2.5 million (Highly-Paid Employees) if they had not already been identified as KRTs during the performance year.
KRTs identified at any point in time in the performance year are subject to a performance evaluation by the control functions. The vesting of their deferred awards is contingent on meeting Group and / or divisional performance conditions. Like all other employees, KRTs are also subject to forfeiture or reduction of the deferred portion of their compensation if they commit harmful acts.
All KRTs are subject to the mandatory deferral of at least 50% of their performance award regardless of whether or not the deferral threshold has been met. This is in order to comply with regulatory requirements.
Group Managing Directors (GMDs) receive part of their annual performance award under the EOP and the DCCP, with the vesting of their EOP awards contingent on the same performance conditions to which KRTs are subject.▲
Pillar 3 |
Fixed and variable compensation for Key Risk Takers¹ |
| | Total for the year ended 2015 | | Not deferred | | Deferred² | | Total for the year ended 2014³ |
CHF million, except where indicated | | Amount | % | | Amount | % | | Amount | % | | Amount |
Total compensation | | | | | | | | | | | |
Amount⁴ | | 1,413 | 100% | | 655 | 46% | | 758 | 54% | | 1,178 |
Number of beneficiaries | | 659 | | | | | | | | | 615 |
Fixed compensation⁴˒⁵ | | 398 | 28% | | 398 | 100% | | 0 | 0% | | 351 |
Cash-based | | 376 | 27% | | 376 | 100% | | 0 | 0% | | 323 |
Equity-based | | 22 | 2% | | 22 | 100% | | 0 | 0% | | 28 |
Variable compensation | | 1,015 | 72% | | 280 | 28% | | 735 | 72% | | 827 |
Immediate cash⁶ | | 280 | 20% | | 280 | 100% | | 0 | 0% | | 217 |
Equity Ownership Plan (EOP) | | 462 | 33% | | 0 | 0% | | 462 | 100% | | 383 |
Deferred Contingent Capital Plan (DCCP) | | 273 | 19% | | 0 | 0% | | 273 | 100% | | 227 |
1 Includes employees with a total compensation exceeding CHF / USD 2.5 million (Highly Paid Employees), excluding GEB members who were in office on 31 December 2015. 2 This is based on the specific plan vesting and reflects the total value at grant which may differ from the accounting expenses. 3 2014 figures as reported in our Annual Report 2014. EOP number includes CHF 13 million blocked shares. 4 Excludes benefits and employer's contribution to retirement benefits plan. 5 Includes base salary and role-based allowances. 6 Includes allocation of vested but blocked shares, in line with UK Prudential Regulation Authority remuneration code. |
▲
Corporate governance, responsibility and compensation
Compensation
UK Material Risk Takers
In accordance with guidance issued by the UK Prudential Regulation Authority (PRA) and Financial Conduct Authority (FCA), for 2015, we identified a group of 571 employees, consisting of senior management, risk takers, staff engaged in control functions and any employee receiving total remuneration that takes them into the same remuneration bracket as these groups and whose professional activities have a material impact on the firm’s risk profile, as so-called UK Material Risk Takers (MRTs). Due to specific PRA requirements, 50% of performance awards for MRTs that are paid out immediately are delivered in UBS shares, which are blocked for six months. In addition, any notional shares granted to MRTs under the EOP for their performance in 2015 will be subject to an additional six-month post vest blocking period. From 2015 onwards, performance awards granted to MRTs are also subject to clawback provisions for a period of up to seven years from date of grant. The clawback provisions stipulate that the firm can require the repayment of any discretionary performance award (both the immediate and deferred element) if the employee contributes substantially to the Group incurring significant financial losses or to a significant downward restatement of the Group’s or a business division’s results, or engages in misconduct and / or fails to take expected actions which contributed to significant reputational harm to the Group.
In line with market practice, MRTs may receive a role-based allowance in addition to their base salary. This allowance reflects the market value of a specific role and, unlike salary, is only paid as long as the employee is in such a role. Importantly, this allowance represents a shift in the compensation mix between fixed and variable compensation and does not represent an increase in total compensation.
With respect to 2015, the allowance consisted of an immediate cash portion along with a blocked UBS share award, if applicable. In 2014, the equity portion consisted of vesting shares instead of blocked shares. The 2015 approach is a structural change based on feedback from the European Banking Authority (EBA) and the PRA.
Other EU-based employees who are subject to regulation have similar compensation structures in order to comply with EBA and local requirements.
Control functions and Group Internal Audit
Pillar 3 | To monitor risk effectively, our control functions, Risk Control (including Compliance), Finance and Legal, must be independent. To support this, their compensation is determined independently from the revenue producers that they oversee, supervise or support. Their performance award pool is not based on the performance of these businesses, but instead reflects the performance of the firm as a whole. In addition, we consider other factors such as how well the function has performed, together with our market positioning. Decisions regarding individual compensation for the senior managers of the control functions are made by the function heads and approved by the Group CEO. Decisions regarding individual compensation within Group Internal Audit (GIA) are made by the Head of GIA and approved by the Chairman. Total compensation for the Head of GIA is approved by the Compensation Committee in consultation with the Audit Committee. ▲
Our deferred variable compensation plans for 2015
To ensure our employees’ and stakeholders’ interests are aligned and that compensation is appropriately linked to longer-term sustainable performance, all variable compensation plans require a significant part of performance awards above a total compensation threshold to be deferred in UBS notional shares and UBS notional instruments for up to five years. For the population with total compensation greater than CHF/USD 300,000, 51% of the overall performance award is deferred. All of these plans include forfeiture provisions and performance conditions.
Equity Ownership Plan
Pillar 3 | The Equity Ownership Plan (EOP) is a mandatory deferral plan for all employees with total compensation greater than CHF / USD 300,000. These employees receive at least 60% of their deferred performance award under the EOP in notional shares, which are eligible for reinvested dividend equivalents. For 2015, over 5,000 employees received EOP awards. EOP awards are granted annually.
The plan includes provisions that enable the firm to trigger forfeiture of some, or all, of the unvested deferred portion if an employee commits certain harmful acts or in most cases where employment has been terminated.
EOP awards granted to Asset Management employees have a different vesting schedule and deferral mix, as shown in the table below, and are granted as cash-settled notional funds.
The vesting of an EOP award granted to GEB members, Group Managing Directors (GMDs) and Key Risk Takers (including Highly-Paid Employees) depends on meeting both Group and divisional performance thresholds. Group performance is measured by the average adjusted Group return on tangible equity (RoTE) over the performance period. Divisional performance is measured by the average adjusted divisional return on attributed equity (RoAE). For Corporate Center employees, it is measured by the average of the RoAE for all business divisions excluding Corporate Center (operating businesses RoAE). By linking the vesting of EOP awards with minimum return on equity thresholds over a two to five-year time horizon, we focus our employees on developing and managing the business in a way that delivers sustainable returns. We believe that Group RoTE provides a more consistent basis to measure performance than the Group’s return on shareholders’ equity (RoE), which includes goodwill and intangibles.
At Group level, the performance condition minimum threshold of RoTE is set at 8%. The intent of performance thresholds is to ensure that our senior employees are incentivized towards sustainable performance, without having to earn their awards twice.
Overview of our deferred variable compensation plans
Corporate governance, responsibility and compensation
Compensation
If the average adjusted Group RoTE achieved is equal to or above the minimum 8% threshold, the EOP award will vest in full, subject to the relevant business divisional threshold also being met. If the average adjusted Group RoTE is 0% or negative, the installment will be fully forfeited for the entire firm regardless of any division’s individual performance. If the average adjusted Group RoTE falls between 0% and 8%, the award will vest on a linear basis between 0% and 100%, again subject to the relevant business divisional threshold being met.
The purpose of the business divisional threshold is to reduce the amount of the EOP award that vests for any business division that does not meet its minimum performance threshold. Therefore, if the business divisional RoAE threshold (see table on the next page) is met, no adjustment is made to the EOP award. If, however, the RoAE falls below the minimum threshold but is above 0% for any business division, the award will be partially forfeited. The extent of the forfeiture depends on how much the actual RoAE falls below the threshold for that business division, and can be up to 40%. If the actual RoAE for a business division is 0% or negative, the installment will be fully forfeited for that business division. The Compensation Committee assesses the achievement of the performance conditions. The chart on the following page shows how we determine the percentage vesting.▲
1 Refer to the “Our strategy” section of the Annual Report 2015 for details.
Performance condition for EOP awards granted in February 2016 |
| Installment vesting after | Applicable performance period |
GEB | 3 years | 2016, 2017 and 2018 |
4 years | 2017, 2018 and 2019 |
5 years | 2018, 2019 and 2020 |
GMDs, Key Risk Takers (including Highly-Paid Employees) | 2 years | 2016 and 2017 |
3 years | 2016, 2017 and 2018 |
| | |
Group RoTE threshold |
Group adjusted RoTE threshold | | ≥8% |
| | |
| | |
Business divisional RoAE thresholds |
Wealth Management | | ≥50% |
Wealth Management Americas | | ≥25% |
Personal & Corporate Banking | | ≥20% |
Asset Management | | ≥25% |
Investment Bank | | ≥15% |
Corporate Center¹ | | ≥25% |
1 For Corporate Center employees, operating businesses RoAE threshold. |
EOP performance conditions for GEB members, GMDs and Key Risk Takers (including Highly-Paid Employees)

Corporate governance, responsibility and compensation
Compensation
Deferred Contingent Capital Plan
Pillar 3 | The Deferred Contingent Capital Plan (DCCP) is a mandatory deferral plan for all employees with total compensation greater than CHF / USD 300,000. These employees receive up to 40% of their deferred performance award under the DCCP, with the exception of Asset Management employees, who receive up to 25%, and GEB members who receive up to 37.5% of their deferred performance awards under the plan. DCCP awards are granted annually. For 2015, over 5,000 employees received DCCP awards.
Employees are awarded notional additional tier 1 (AT1) instruments, which can be settled either in the form of a cash payment or a perpetual, marketable AT1 instrument, at the discretion of the firm. Prior to grant, employees were able to elect to have their 2015 DCCP awards denominated in either Swiss francs or US dollars.
Awards vest in full after five years, unless there is a trigger event. Awards granted under the DCCP forfeit if our phase-in common equity tier 1 capital ratio falls below 10% for GEB members and 7% for all other employees. In addition, awards are also forfeited if a viability event occurs, that is, if FINMA provides a written notice to the firm that the DCCP awards must be written down to prevent an insolvency, bankruptcy or failure of UBS, or if the firm receives a commitment of extraordinary support from the public sector that is necessary to prevent such an event. As an additional performance condition, if the firm does not achieve an adjusted Group profit before tax for any year during the vesting period, GEB members forfeit 20% of their award for each loss-making year.
The plan includes provisions that enable the firm to trigger forfeiture of some, or all, of the unvested deferred portion if an employee commits certain harmful acts or in most cases where employment has been terminated.
Under the DCCP, employees may receive discretionary annual interest payments. The notional interest rate for grants in 2016 is 7.35% for awards denominated in US dollars and 4.15% for awards denominated in Swiss francs. These interest rates are based on the current market rates for such AT1 instruments. Such interest will be paid out annually subject to review and confirmation by the firm.
As part of our compensation framework, DCCP awards support competitive pay while also contributing to the firm’s capital position. The following table illustrates the impact of DCCP on our AT1 and Tier 2 capital as well as on our total capital ratio.▲
® Refer to the “Supplemental information” section of this report for more information on performance awards, performance awards expenses and total personnel expenses in 2015, as well as past awards
Impact of the Deferred Contingent Capital Plan on our capital ratio |
CHF million, except where indicated | 31.12.15 | 31.12.14 | 31.12.13 |
Deferred Contingent Capital Plan (DCCP) | 1,903 | 1,413 | 955 |
of which additional tier 1 capital | 991 | 467 | 0 |
of which Tier 2 capital | 912 | 946 | 955 |
| | | |
Total capital ratio - fully applied (%) | 22.9 | 18.9 | 15.4 |
of which DCCP (%) | 0.9 | 0.7 | 0.4 |
Supplemental information
Performance awards granted for the 2015 performance year
The “Total variable compensation” table below shows the amount of variable compensation awarded to employees for the performance year 2015, together with the number of beneficiaries for each type of award granted. We define variable compensation as the discretionary, performance-based award pool for the given year. In the case of deferred awards, the final amount paid to an employee depends on performance conditions and consideration of relevant forfeiture provisions. The deferred share award amount is based on the market value of these awards on the date of grant.
The “Deferred compensation” table on the next page shows the current economic value of unvested outstanding deferred variable compensation awards subject to ex-post adjustments.
For share-based plans, the economic value is determined based on the closing share price on 30 December 2015. For notional funds, it is determined using the latest available market price for the underlying funds at year-end 2015, and for deferred cash plans, it is determined based on the outstanding amount of cash owed to award recipients. All awards made under our deferred variable compensation plans listed in the “Deferred compensation” table on the next page are subject to ex-post adjustments, whether implicitly, through exposure to share price movements, or explicitly, for example, through forfeitures instigated by the firm.
® Refer to “Note 29 Equity participation and other compensation plans” in the “Consolidated financial statements” section of the Annual Report 2015 for more information
Pillar 3 |
Total variable compensation¹ |
| | Expenses | | Expenses deferred to future periods | | Adjustments² | | Total | | Number of beneficiaries |
CHF million, except where indicated | | 2015 | 2014 | | 2015 | 2014 | | 2015 | 2014 | | 2015 | 2014 | | 2015 | 2014 |
Cash performance awards | | 2,073 | 1,822 | | 0 | 0 | | (1) | (4) | | 2,072 | 1,818 | | 46,272 | 46,298 |
Deferred Contingent Capital Plan | | 172 | 155 | | 343 | 312 | | 0 | 0 | | 514 | 467 | | 5,432 | 5,248 |
UBS share plans | | 261 | 215 | | 524 | 459 | | 63 | 44 | | 848 | 718 | | 5,036 | 4,897 |
Equity Ownership Plan – notional funds | | 28 | 24 | | 34 | 36 | | 0 | 0 | | 63 | 60 | | 438 | 397 |
Total performance award pool | | 2,535 | 2,216 | | 900 | 807 | | 62 | 40 | | 3,497 | 3,063 | | 46,311 | 46,305 |
| | | | | | | | | | | | | | | |
| | Expenses | | Expenses deferred to future periods | | Adjustments² | | Total | | |
CHF million, except where indicated | | 2015 | 2014 | | 2015 | 2014 | | 2015 | 2014 | | 2015 | 2014 | | | |
Total variable compensation – other³ | | 184 | 260 | | 248 | 307 | | (160)⁴ | (121)⁴ | | 271 | 446 | | | |
| | | | | | | | | | | | | | | |
| | Expenses | | Expenses deferred to future periods | | Adjustments² | | Total | | Number of beneficiaries |
CHF million, except where indicated | | 2015 | 2014 | | 2015 | 2014 | | 2015 | 2014 | | 2015 | 2014 | | 2015 | 2014 |
Total WMA financial advisor compensation⁵ | | 2,673 | 2,539 | | 1,716 | 754 | | 0 | 14 | | 4,389 | 3,307 | | 7,038 | 6,997 |
1 Expenses under “Total variable compensation – other” and “Total WMA financial advisor compensation” are not part of UBS’s performance award pool. 2 Adjustments relating to post-vesting transfer restrictions and other adjustments. 3 Replacement payments and retention plan payments including the 2012 Special Plan Award Program. 4 Included in expenses deferred to future periods is an amount of CHF 160 million (prior year CHF 121 million) relating to future interest on the DCCP. As the amount recognized as performance award represents the present value of the award at the date granted to the employee, this interest amount is adjusted out in the analysis. 5 Financial advisor compensation consists of grid-based compensation based directly on compensable revenues generated by financial advisors and supplemental compensation calculated based on financial advisor productivity, firm tenure and other variables. It also includes charges related to compensation commitments with financial advisors entered into at the time of recruitment, which are subject to vesting requirements. |
p
Corporate governance, responsibility and compensation
Compensation
Performance award expenses in the 2015 performance year
Performance award expenses include all immediate expenses related to 2015 compensation awards and expenses deferred to 2015 related to awards made in prior years. The chart “Amortization of deferred compensation” shows the amount at the end of 2015 of unrecognized awards to be amortized in subsequent years. This was CHF 1.6 billion for 2014 and CHF 1.7 billion for 2015.
Pillar 3 | The table below shows the value of actual ex-post explicit and implicit adjustments to outstanding deferred compensation in the financial year 2015. Ex-post adjustments occur after an award has been granted. Ex-post explicit adjustments occur when we adjust compensation by forfeiting deferred awards. Ex-post implicit adjustments are unrelated to any action taken by the firm and occur as a result of share price movements that impact the value of an award. The total value of ex-post explicit adjustments made to UBS shares in 2015, based on the approximately 7 million shares forfeited during 2015, is a reduction of CHF 146 million. The total value of ex-post explicit adjustments made to UBS options and share-settled stock appreciation rights (SARs) in 2015, based on the approximately 0.1 million options / SARs forfeited during 2015, is a reduction in value of CHF 1 million. The size of implicit adjustments is mainly due to an increase in the share price. However, the share price as of year-end means that many of the options previously granted remain out of the money. Hence, the majority of outstanding option awards had no intrinsic value at the end of 2015. ▲

Pillar 3 |
Deferred compensation¹˒² | | | | | |
CHF million, except where indicated | Relating to awards for 2015 | Relating to awards for prior years³ | Total | of which exposed to ex-post adjustments | Total deferred compen- sation year end 2014 |
Deferred Contingent Capital Plan | 514 | 1,397 | 1,911 | 100% | 1,424 |
Equity Ownership Plan | 848 | 2,672 | 3,520 | 100% | 3,476 |
Equity Ownership Plan – notional funds | 63 | 393 | 455 | 100% | 498 |
Discontinued deferred compensation plans⁴ | 0 | 19 | 19 | 100% | 260 |
Total | 1,424 | 4,481 | 5,905 | | 5,658 |
1 This is based on specific plan vesting and reflects the economic value of the outstanding awards, which may differ from the accounting expenses. 2 Refer to "Note 29 Equity participation and other compensation plans" in the "Consolidated financial statements" section of the Annual Report 2015 for more information. 3 This takes into account the ex-post implicit adjustments, given the share price movements since grant. 4 Cash Balance Plan (CBP), Senior Executive Equity Ownership Plan (SEEOP), Performance Equity Plan (PEP), Incentive Performance Plan (IPP), Deferred Cash Plan (DCP). |
▲
Pillar 3 |
Ex-post explicit and implicit adjustments to deferred compensation in 2015¹ |
| | Ex-post explicit adjustments⁴ | | Ex-post implicit adjustments to unvested awards⁵ |
CHF million | | 31.12.15 | 31.12.14 | | 31.12.15 | 31.12.14 |
UBS notional bonds (DCCP) | | (53) | (42) | | | |
UBS shares (EOP, IPP, PEP, SEEOP)² | | (146) | (121) | | 412 | 218 |
UBS options (KESOP) and SARs (KESAP)² | | (1) | (1) | | | |
UBS notional funds (EOP)³ | | (6) | (3) | | 3 | 16 |
1 Compensation (performance awards and other variable compensation) relating to awards for previous performance years. 2 IPP, PEP, SEEOP, Key Employee Appreciation Rights Plan (KESAP) and Key Employee Stock Option Plan (KESOP) are discontinued deferred compensation plans. 3 Awards granted under this plan are cash-settled and 100% susceptible to ex-post implicit adjustments. 4 Ex-post explicit adjustments are calculated as units forfeited during the year, valued at the share price on 30 December 2015 (CHF 19.52) and on 30 December 2014 (CHF 17.09) for UBS shares and valued with the fair value at grant for UBS options. For the notional funds awarded to Asset Management employees under the EOP, this represents the forfeiture credits recognized in 2015 and 2014. For DCCP the fair value at grant of the forfeited awards during the year is reflected. 5 Ex-post implicit adjustments for UBS shares are calculated based on the difference between the weighted average grant date fair value and the share price at year end. The amount for notional funds is calculated using the mark-to-market change during 2015 and 2014. |
▲
Total personnel expenses for 2015
As of 31 December 2015, there were 60,099 employees (on a full-time equivalent basis). The table “Personnel expenses” below shows our total personnel expenses for 2015. It includes salaries, pension contributions and other personnel costs, social security contributions and variable compensation. Variable compensation includes discretionary cash performance awards paid in 2016 for the 2015 performance year, the amortization of unvested deferred awards granted in previous years and the cost of deferred awards granted to employees who are eligible for retirement in the context of the compensation framework at the date of grant.
The performance award pool reflects the value of discretionary performance awards granted relating to the 2015 performance year, including awards that are paid out immediately and those that are deferred. To determine our variable compensation expenses, the following adjustments are required in order to reconcile the performance award pool to the accounting expenses recognized in the Group’s financial statements prepared in accordance with IFRS:
– reduction for the unrecognized future amortization (including accounting adjustments) of unvested deferred awards granted in 2016 for the performance year 2015
– addition for the 2015 amortization of unvested deferred awards granted in prior years
As a large part of compensation consists of deferred awards, the amortization of unvested deferred awards granted in prior years forms a significant part of the IFRS accounting expenses in both 2014 and 2015.
® Refer to “Note 29 Equity participation and other compensation plans” in the “Consolidated financial statements” section of the Annual Report 2015 for more information
Pillar 3 |
Personnel expenses | | | | | | |
| | Expenses |
CHF million | | Relating to awards for 2015 | Relating to awards for prior years | Total 2015 | 2014 | 2013 |
Salaries¹ | | 6,282 | 0 | 6,282 | 6,269 | 6,268 |
Cash performance awards | | 2,073 | (94) | 1,980 | 1,714 | 1,912 |
Deferred Contingent Capital Plan | | 172 | 258 | 429 | 349 | 248 |
Deferred cash plans | | 0 | 12 | 12 | 12 | 55 |
UBS share plans | | 261 | 461 | 722 | 680 | 692 |
UBS share option plans | | 0 | 0 | 0 | 0 | 0 |
Equity Ownership Plan - notional funds | | 28 | 38 | 67 | 65 | 79 |
Total variable compensation - performance award² | | 2,535 | 675 | 3,210 | 2,820 | 2,986 |
of which: guarantees for new hire | | 15 | 23 | 38 | 48 | 76 |
Variable compensation - other² | | 184 | 162 | 346 | 466 | 288 |
of which: replacement payments³ | | 11 | 65 | 76 | 81 | 78 |
of which: forfeiture credits | | 0 | (86) | (86) | (70) | (146) |
of which: severance payments⁴ | | 157 | 0 | 157 | 162 | 114 |
of which: retention plan and other payments | | 15 | 183 | 198 | 292 | 242 |
Contractors | | 365 | 0 | 365 | 234 | 190 |
Social security | | 785 | 35 | 820 | 791 | 792 |
Pension and other post-employment benefit plans⁵ | | 808 | 0 | 808 | 711 | 887 |
Wealth Management Americas: financial advisor compensation²˒⁶ | | 2,673 | 879 | 3,552 | 3,385 | 3,140 |
Other personnel expenses | | 579 | 21 | 600 | 605 | 631 |
Total personnel expenses⁷ | | 14,209 | 1,772 | 15,981 | 15,280 | 15,182 |
1 Includes role-based allowances. 2 Refer to “Note 29 Equity participation and other compensation plans” in the “Consolidated financial statements” section of the Annual Report 2015 for more information. 3 Replacement payments are payments made to compensate employees for deferred awards forfeited as a result of joining UBS. This table includes the expenses recognized in the financial year (mainly the amortization of the award). 4 Includes legally obligated and standard severance payments. 5 2015 included credits of CHF 24 million related to changes to retiree benefit plans in the US. 2014 included credits of CHF 41 million related to changes to retiree benefit plans in the US. Refer to “Note 28 Pension and other post-employment benefit plans” of the “Consolidated financial statements” section of the Annual Report 2015 for more information. 6 Financial advisor compensation consists of grid-based compensation based directly on compensable revenues generated by financial advisors and supplemental compensation calculated based on financial advisor productivity, firm tenure, assets and other variables. It also includes charges related to compensation commitments with financial advisors entered into at the time of recruitment which are subject to vesting requirements. 7 Includes net restructuring expenses of CHF 460 million, CHF 327 million and CHF 156 million for the years ended 31 December 2015, 31 December 2014 and 31 December 2013, respectively. Refer to “Note 32 Changes in organization and disposals” in the “Consolidated financial statements” section of the Annual Report 2015 for more information. |
▲
Corporate governance, responsibility and compensation
Compensation
Vesting of outstanding awards granted in prior years subject to performance conditions
The table below shows the extent to which the performance conditions of awards granted in prior years have been met and the percentage of the award which vests in 2016.
Discontinued deferred compensation plans
The table below lists discontinued compensation plans that have outstanding balances as of 31 December 2015 or which were retired during 2015. The firm has not granted any options since 2009. The strike price for stock options awarded under prior compensation plans has not been reset.
® Refer to “Note 29 Equity participation and other compensation plans” in the “Consolidated financial statements” section of our Annual Report 2015 for more information

Corporate governance, responsibility and compensation
Compensation
List of tables
Audited |
Share and option ownership / entitlements of GEB members¹ |
Name, function | on 31 December | Number of unvested shares / at risk² | Number of vested shares | Total number of shares | Potentially conferred voting rights in % | Number of options³ | Potentially conferred voting rights in %⁴ |
Sergio P. Ermotti, Group Chief Executive Officer | 2015 | 947,964 | 155,736 | 1,103,700 | 0.059 | 0 | 0.000 |
2014 | 670,935 | 97,589 | 768,524 | 0.039 | 0 | 0.000 |
Markus U. Diethelm, Group General Counsel | 2015 | 447,694 | 61,797 | 509,491 | 0.027 | 0 | 0.000 |
2014 | 528,973 | 0 | 528,973 | 0.027 | 0 | 0.000 |
Lukas Gähwiler, President Personal & Corporate Banking and President UBS Switzerland | 2015 | 558,657 | 1,515 | 560,172 | 0.030 | 0 | 0.000 |
2014 | 522,769 | 1,052 | 523,821 | 0.027 | 0 | 0.000 |
Ulrich Körner, President Asset Management and President UBS EMEA | 2015 | 642,813 | 95,597 | 738,410 | 0.039 | 0 | 0.000 |
2014 | 713,051 | 292,519 | 1,005,570 | 0.051 | 0 | 0.000 |
Philip J. Lofts, Group Chief Risk Officer | 2015 | 540,288 | 247,929 | 788,217 | 0.042 | 277,082 | 0.015 |
2014 | 611,479 | 204,346 | 815,825 | 0.042 | 394,172 | 0.020 |
Robert J. McCann, President Wealth Management Americas and President UBS Americas | 2015 | 1,010,805 | 0 | 1,010,805 | 0.054 | 0 | 0.000 |
2014 | 983,028 | 62,901 | 1,045,929 | 0.053 | 0 | 0.000 |
Tom Naratil, Group Chief Financial Officer and Group Chief Operating Officer | 2015 | 598,172 | 310,054 | 908,226 | 0.049 | 555,115 | 0.030 |
2014 | 523,751 | 288,151 | 811,902 | 0.041 | 721,125 | 0.037 |
Andrea Orcel, President Investment Bank | 2015 | 933,686 | 117,646 | 1,051,332 | 0.056 | 0 | 0.000 |
2014 | 915,399 | 408,296 | 1,323,695 | 0.068 | 0 | 0.000 |
Chi-Won Yoon, President UBS Asia Pacific | 2015 | 383,164 | 683,994 | 1,067,158 | 0.057 | 483,210 | 0.026 |
2014 | 492,093 | 507,602 | 999,695 | 0.051 | 515,180 | 0.026 |
Jürg Zeltner, President Wealth Management | 2015 | 683,767 | 3,721 | 687,488 | 0.037 | 86,279 | 0.005 |
2014 | 675,211 | 0 | 675,211 | 0.034 | 108,121 | 0.006 |
Total | 2015 | 6,747,010 | 1,677,989 | 8,424,999 | 0.450 | 1,401,686 | 0.075 |
2014 | 6,636,689 | 1,862,456 | 8,499,145 | 0.434 | 1,738,598 | 0.089 |
1 This table includes all vested and unvested shares and options of GEB members, including those held by related parties. 2 Includes shares granted under variable compensation plans with forfeiture provisions. The actual number of shares vesting in the future will be calculated under the terms of the plans. Refer to the “Our deferred variable compensation plans for 2015” section in this report for more information on the plans. 3 Refer to “Note 29 Equity participation and other compensation plans” in the “Consolidated financial statements” section of the Annual Report 2015 for more information. 4 No conversion rights are outstanding. |
▲
Audited |
Total of all vested and unvested shares of GEB members¹˒² |
| | Total | | of which vested | | of which vesting |
| | | | | | 2016 | 2017 | 2018 | 2019 | 2020 |
Shares on 31 December 2015 | | 8,424,999 | | 1,677,989 | | 1,148,988 | 1,561,296 | 2,004,014 | 1,314,398 | 718,314 |
| | | | | | | | | | |
| | | | | | 2015 | 2016 | 2017 | 2018 | 2019 |
Shares on 31 December 2014 | | 8,499,145 | | 1,862,456 | | 2,112,409 | 1,148,988 | 1,538,703 | 1,263,098 | 573,491 |
1 Includes shares held by related parties. 2 Includes shares granted under variable compensation plans with forfeiture provisions. The actual number of shares vesting in the future will be calculated under the terms of the plans. Refer to the “Our deferred variable compensation plans for 2015” section in this report for more information on the plans. |
▲
Corporate governance, responsibility and compensation
Compensation
Audited |
Number of shares of BoD members¹ |
Name, function | on 31 December | Number of shares held | Voting rights in % |
Axel A. Weber, Chairman | 2015 | 488,889 | 0.026 |
2014 | 333,333 | 0.017 |
Michel Demaré, Vice Chairman | 2015 | 215,992 | 0.012 |
2014 | 181,246 | 0.009 |
David Sidwell, Senior Independent Director | 2015 | 163,317 | 0.009 |
2014 | 185,181 | 0.009 |
Reto Francioni, member | 2015 | 28,787 | 0.002 |
2014 | 11,859 | 0.001 |
Ann F. Godbehere, member | 2015 | 169,054 | 0.009 |
2014 | 139,653 | 0.007 |
Axel P. Lehmann, member | 2015 | 252,761 | 0.014 |
2014 | 217,373 | 0.011 |
Helmut Panke, former member² | 2015 | – | – |
2014 | 182,009 | 0.009 |
William G. Parrett, member | 2015 | 104,271 | 0.006 |
2014 | 100,019 | 0.005 |
Isabelle Romy, member | 2015 | 66,490 | 0.004 |
2014 | 44,217 | 0.002 |
Beatrice Weder di Mauro, member | 2015 | 71,261 | 0.004 |
2014 | 45,424 | 0.002 |
Joseph Yam, member | 2015 | 87,354 | 0.005 |
2014 | 66,863 | 0.003 |
Total | 2015 | 1,648,176 | 0.088 |
2014 | 1,507,177 | 0.077 |
1 This table includes blocked and unblocked shares held by BoD members, including those held by related parties. No options were granted in 2015 and 2014. 2 Helmut Panke did not stand for re-election at the AGM on 7 May 2015. |
p
Audited |
Total of all blocked and unblocked shares of BoD members¹ |
| | Total | | of which unblocked | | of which blocked until |
| | | | | | 2016 | 2017 | 2018 | 2019 |
Shares on 31 December 2015 | | 1,648,176 | | 211,748 | | 232,917 | 384,118 | 416,408 | 402,985 |
| | | | | | | | | |
| | | | | | 2015 | 2016 | 2017 | 2018 |
Shares on 31 December 2014 | | 1,507,177 | | 228,189 | | 172,868 | 261,377 | 408,570 | 436,173 |
1 Includes shares held by related parties. |
▲
Audited |
Vested and unvested options of GEB members¹ |
| | | | | | | | | | | | | | |
on 31 December | Total number of options² | Number of options³ | Year of grant | Vesting date | Expiry date | Strike price | | on 31 December | Total number of options² | Number of options³ | Year of grant | Vesting date | Expiry date | Strike price |
| | | | | | | | | | | | | | |
Philip J. Lofts, Group Chief Risk Officer | | | | | | | | |
2015 | 277,082 | 117,227 | 2006 | 01.03.2009 | 28.02.2016 | CHF 72.57 | | | | 8,880 | 2007 | 01.03.2010 | 28.02.2017 | CHF 67.00 |
| | 85,256 | 2007 | 01.03.2010 | 28.02.2017 | CHF 73.67 | | | | 42,628 | 2008 | 01.03.2011 | 28.02.2018 | CHF 32.45 |
| | 74,599 | 2008 | 01.03.2011 | 28.02.2018 | CHF 35.66 | | | | 350,000 | 2009 | 01.03.2012 | 27.02.2019 | CHF 11.35 |
2014 | 394,172 | 117,090 | 2005 | 01.03.2008 | 28.02.2015 | CHF 52.32 | | | | | | | | |
| | 117,227 | 2006 | 01.03.2009 | 28.02.2016 | CHF 72.57 | | Jürg Zeltner, President Wealth Management |
| | 85,256 | 2007 | 01.03.2010 | 28.02.2017 | CHF 73.67 | | 2015 | 86,279 | 7,106 | 2006 | 01.03.2007 | 28.02.2016 | CHF 65.97 |
| | 74,599 | 2008 | 01.03.2011 | 28.02.2018 | CHF 35.66 | | | | 7,103 | 2006 | 01.03.2008 | 28.02.2016 | CHF 65.97 |
| | | | | | | | | | 7,103 | 2006 | 01.03.2009 | 28.02.2016 | CHF 65.97 |
Tom Naratil, Group Chief Financial Officer and Group Chief Operating Officer | | | | 110 | 2006 | 03.03.2008 | 03.03.2016 | CHF 65.91 |
2015 | 555,115 | 142,198 | 2006 | 01.03.2009 | 28.02.2016 | CHF 72.57 | | | | 242 | 2006 | 09.06.2008 | 09.06.2016 | CHF 61.84 |
| | 131,277 | 2007 | 01.03.2010 | 28.02.2017 | CHF 73.67 | | | | 230 | 2006 | 08.09.2008 | 08.09.2016 | CHF 65.76 |
| | 181,640 | 2008 | 01.03.2011 | 28.02.2018 | CHF 35.66 | | | | 221 | 2006 | 08.12.2008 | 08.12.2016 | CHF 67.63 |
| | 100,000 | 2009 | 01.03.2012 | 27.02.2019 | CHF 11.35 | | | | 7,105 | 2007 | 01.03.2008 | 28.02.2017 | CHF 67.00 |
2014 | 721,125 | 166,010 | 2005 | 01.03.2008 | 28.02.2015 | USD 44.81 | | | | 7,105 | 2007 | 01.03.2009 | 28.02.2017 | CHF 67.00 |
| | 142,198 | 2006 | 01.03.2009 | 28.02.2016 | CHF 72.57 | | | | 7,103 | 2007 | 01.03.2010 | 28.02.2017 | CHF 67.00 |
| | 131,277 | 2007 | 01.03.2010 | 28.02.2017 | CHF 73.67 | | | | 223 | 2007 | 02.03.2009 | 02.03.2017 | CHF 67.08 |
| | 181,640 | 2008 | 01.03.2011 | 28.02.2018 | CHF 35.66 | | | | 42,628 | 2008 | 01.03.2011 | 28.02.2018 | CHF 35.66 |
| | 100,000 | 2009 | 01.03.2012 | 27.02.2019 | CHF 11.35 | | 2014 | 108,121 | 7,106 | 2005 | 01.03.2006 | 28.02.2015 | CHF 47.58 |
| | | | | | | | | | 7,103 | 2005 | 01.03.2007 | 28.02.2015 | CHF 47.58 |
Chi-Won Yoon, President UBS Asia Pacific | | | | 7,103 | 2005 | 01.03.2008 | 28.02.2015 | CHF 47.58 |
2015 | 483,210 | 21,316 | 2006 | 01.03.2007 | 28.02.2016 | CHF 65.97 | | | | 93 | 2005 | 04.03.2007 | 04.03.2015 | CHF 47.89 |
| | 21,314 | 2006 | 01.03.2008 | 28.02.2016 | CHF 65.97 | | | | 161 | 2005 | 06.06.2007 | 06.06.2015 | CHF 45.97 |
| | 21,311 | 2006 | 01.03.2009 | 28.02.2016 | CHF 65.97 | | | | 149 | 2005 | 09.09.2007 | 09.09.2015 | CHF 50.47 |
| | 8,881 | 2007 | 01.03.2008 | 28.02.2017 | CHF 67.00 | | | | 127 | 2005 | 05.12.2007 | 05.12.2015 | CHF 59.03 |
| | 8,880 | 2007 | 01.03.2009 | 28.02.2017 | CHF 67.00 | | | | 7,106 | 2006 | 01.03.2007 | 28.02.2016 | CHF 65.97 |
| | 8,880 | 2007 | 01.03.2010 | 28.02.2017 | CHF 67.00 | | | | 7,103 | 2006 | 01.03.2008 | 28.02.2016 | CHF 65.97 |
| | 42,628 | 2008 | 01.03.2011 | 28.02.2018 | CHF 32.45 | | | | 7,103 | 2006 | 01.03.2009 | 28.02.2016 | CHF 65.97 |
| | 350,000 | 2009 | 01.03.2012 | 27.02.2019 | CHF 11.35 | | | | 110 | 2006 | 03.03.2008 | 03.03.2016 | CHF 65.91 |
2014 | 515,180 | 10,659 | 2005 | 01.03.2006 | 28.02.2015 | CHF 47.58 | | | | 242 | 2006 | 09.06.2008 | 09.06.2016 | CHF 61.84 |
| | 10,657 | 2005 | 01.03.2007 | 28.02.2015 | CHF 47.58 | | | | 230 | 2006 | 08.09.2008 | 08.09.2016 | CHF 65.76 |
| | 10,654 | 2005 | 01.03.2008 | 28.02.2015 | CHF 47.58 | | | | 221 | 2006 | 08.12.2008 | 08.12.2016 | CHF 67.63 |
| | 21,316 | 2006 | 01.03.2007 | 28.02.2016 | CHF 65.97 | | | | 7,105 | 2007 | 01.03.2008 | 28.02.2017 | CHF 67.00 |
| | 21,314 | 2006 | 01.03.2008 | 28.02.2016 | CHF 65.97 | | | | 7,105 | 2007 | 01.03.2009 | 28.02.2017 | CHF 67.00 |
| | 21,311 | 2006 | 01.03.2009 | 28.02.2016 | CHF 65.97 | | | | 7,103 | 2007 | 01.03.2010 | 28.02.2017 | CHF 67.00 |
| | 8,881 | 2007 | 01.03.2008 | 28.02.2017 | CHF 67.00 | | | | 223 | 2007 | 02.03.2009 | 02.03.2017 | CHF 67.08 |
| | 8,880 | 2007 | 01.03.2009 | 28.02.2017 | CHF 67.00 | | | | 42,628 | 2008 | 01.03.2011 | 28.02.2018 | CHF 35.66 |
1 This table includes all options of GEB members, including those held by related parties. Sergio P. Ermotti, Markus U. Diethelm, Lukas Gähwiler, Ulrich Körner, Robert J. McCann and Andrea Orcel did not hold any options on 31 December 2014 and 31 December 2015, respectively. 2 No conversion rights are outstanding. 3 Refer to "Note 29 Equity participation and other compensation plans" in the "Consolidated financial statements" section of the Annual Report 2015 for more information. |
| | | | | | | | | | | | | | |
▲
Corporate governance, responsibility and compensation
Compensation
Audited |
Loans granted to GEB members1
In line with article 38 of our Articles of Association, GEB members may be granted loans, fixed advances and mortgages. Such loans are made in the ordinary course of business on substantially the same terms as those granted to other employees, including interest rates and collateral, and neither involve more than the normal risk of collectability nor contain any other unfavorable features for the firm. The total amount of such loans shall not exceed CHF 20 million per GEB member.
CHF, except where indicated² | | |
Name, function | on 31 December | Loans³ |
Ulrich Körner, President Asset Management and President UBS EMEA (highest loan in 2015) | 2015 | 10,621,777 |
Ulrich Körner, President Asset Management and President UBS EMEA (highest loan in 2014) | 2014 | 7,600,000 |
Aggregate of all GEB members | 2015 | 29,032,017 |
2014 | 26,281,207 |
1 No loans have been granted to related parties of the GEB members at conditions not customary in the market. 2 Local currencies are converted into CHF using the exchange rates as detailed in “Note 36 Currency translation rates” in the “Consolidated financial statements” section of the Annual Report 2015. 3 All loans granted are secured loans. |
▲
Audited |
Loans granted to BoD members1
In line with article 33 of our Articles of Association, loans to independent BoD members are made in the ordinary course of business at general market conditions. The Chairman, as a non-independent member may receive a loan in the ordinary course of business on substantially the same terms as those granted to employees, including interest rates and collateral, and neither involve more than the normal risk of collectability nor contain any other unfavorable features for the firm. The total amount of such loans shall not exceed CHF 20 million per BoD member.
CHF, except where indicated² | | |
| on 31 December | Loans³˒⁴ |
Aggregate of all BoD members | 2015 | 3,604,950 |
2014 | 1,100,000 |
1 No loans have been granted to related parties of the BoD members at conditions not customary in the market. 2 Local currencies are converted into CHF using the exchange rates as detailed in “Note 36 Currency translation rates” in the “Consolidated financial statements” section of the Annual Report 2015. 3 All loans granted are secured loans. 4 CHF 600,000 for Reto Francioni and CHF 3,004,950 for William G. Parrett in 2015 and CHF 1,100,000 for Reto Francioni in 2014. |
▲
Audited |
Compensation paid to former BoD and GEB members¹ |
CHF, except where indicated² | | | | |
| For the year | Compensation | Benefits | Total |
Former BoD members | 2015 | 0 | 0 | 0 |
2014 | 0 | 0 | 0 |
Aggregate of all former GEB members³ | 2015 | 435,448 | 39,999 | 475,447 |
2014 | 0 | 37,714 | 37,714 |
Aggregate of all former BoD and GEB members | 2015 | 435,448 | 39,999 | 475,447 |
2014 | 0 | 37,714 | 37,714 |
1 Compensation or remuneration that is connected with the former members' activity on the BoD or GEB or that is not at market conditions. 2 Local currencies are converted into CHF using the exchange rates as detailed in “Note 36 Currency translation rates” in the “Consolidated financial statements” section of the Annual Report 2015. 3 Includes payments in 2015 to two former GEB members and a payment in 2014 to one former GEB member. |
p
Provisions of the Articles of Association in relation to compensation
Under the say-on-pay provisions in Switzerland, shareholders of Swiss-listed companies have significant influence over board and management compensation. This is achieved by means of an annual binding say-on-pay vote and through additional provisions in the Articles of Association (AoA). The Group’s revised AoA were approved at the AGM 2014 and include the following provisions related to compensation:
Say-on-pay: The AGM shall approve the proposals of the BoD in relation to the maximum aggregate amount of compensation of the BoD for the period until the next AGM, the maximum aggregate amount of fixed compensation of the GEB for the following financial year and the aggregate amount of variable compensation of the GEB for the preceding financial year. The BoD may submit for approval deviating or additional proposals. In the event the AGM does not approve a proposal the BoD shall determine, taking into account all relevant factors, an aggregate amount or partial amounts for subsequent approval by shareholders.
Principles of compensation: compensation of the BoD comprises a base remuneration and may comprise other compensation elements and benefits. Compensation of the GEB consists of fixed and variable compensation elements. Variable compensation elements depend on quantitative and qualitative performance measures as determined by the BoD. Remuneration of the BoD and compensation of the GEB may be paid or granted in the form of cash, shares, financial instruments or units, in kind or in the form of benefits. The BoD determines the key features such as grant, vesting, exercise and forfeiture conditions and applicable harmful acts provisions.
Additional amount for GEB members hired after the vote on the aggregate amount of compensation by the AGM: for the compensation of GEB members who will be appointed after the approval of compensation by the AGM, and to the extent that the aggregate amount of compensation as approved does not suffice, an amount of up to 40% of the average of total annual compensation paid or granted to the GEB during the previous three years is available without further approval of the AGM.
® Refer to our corporate governance website at www.ubs.com/governance
Corporate governance, responsibility and compensation
Compensation

Consolidated financial statements
Consolidated financial statements
Table of contents
Consolidated financial statements
Introduction and accounting principles
This section of the Annual Report consists of:
– the audited consolidated financial statements of UBS Group AG for 2015, prepared in accordance with International Financial Reporting Standards (IFRS) as issued by the International Accounting Standards Board (IASB); and
– the audited consolidated financial statements of UBS AG for 2015, prepared in accordance with IFRS as issued by the IASB
The significant accounting policies applied in the preparation of the UBS Group AG consolidated financial statements are described in Note 1 to the financial statements. Except where otherwise explicitly stated in these financial statements, all financial information is in Swiss francs (CHF) and presented on a consolidated basis under IFRS, and all references to UBS refer to the consolidated UBS Group and not to UBS Group AG on a standalone basis.
The significant accounting policies applied in the preparation of the UBS AG consolidated financial statements are described in Note 1 to the financial statements. Except where otherwise explicitly stated in these financial statements, all financial information is in Swiss francs (CHF) and presented on a consolidated basis under IFRS, and all references to UBS AG refer to UBS AG (consolidated) and not to UBS AG (standalone).
All references to 2015, 2014 and 2013 refer to the financial years ended 31 December 2015, 2014 and 2013, respectively.
The consolidated financial statements of UBS Group AG and UBS AG were audited by Ernst & Young Ltd.
Refer to “Critical accounting policies” within the “Financial and operating performance” section of this report for more information on critical accounting policies as defined by SEC requirements.
UBS Group AG consolidated financial statements
Management’s report on internal control over financial reporting
Management’s responsibility for internal control over financial reporting
The Board of Directors and management of UBS Group AG (UBS) are responsible for establishing and maintaining adequate internal control over financial reporting. UBS’s internal control over financial reporting is designed to provide reasonable assurance regarding the preparation and fair presentation of published financial statements in accordance with IFRS as issued by the IASB.
UBS’s internal control over financial reporting includes those policies and procedures that:
– Pertain to the maintenance of records that, in reasonable detail, accurately and fairly reflect transactions and dispositions of assets;
– Provide reasonable assurance that transactions are recorded as necessary to permit preparation and fair presentation of financial statements, and that receipts and expenditures of the company are being made only in accordance with authorizations of UBS management; and
– Provide reasonable assurance regarding prevention or timely detection of unauthorized acquisition, use or disposition of the company’s assets that could have a material effect on the financial statements.
Because of its inherent limitations, internal control over financial reporting may not prevent or detect misstatements. Also, projections of any evaluation of effectiveness to future periods are subject to the risk that controls may become inadequate because of changes in conditions, or that the degree of compliance with the policies or procedures may deteriorate.
Management’s assessment of internal control over financial reporting as of 31 December 2015
UBS management has assessed the effectiveness of UBS’s internal control over financial reporting as of 31 December 2015 based on the criteria set forth by the Committee of Sponsoring Organizations of the Treadway Commission (COSO) in Internal Control Integrated Framework (2013 Framework). Based on this assessment, management believes that, as of 31 December 2015, UBS’s internal control over financial reporting was effective.
The effectiveness of UBS’s internal control over financial reporting as of 31 December 2015 has been audited by Ernst & Young Ltd, UBS’s independent registered public accounting firm, as stated in their report appearing on pages 394 to 395, which expresses an unqualified opinion on the effectiveness of UBS’s internal control over financial reporting as of 31 December 2015.
Consolidated financial statements
UBS Group AG consolidated financial statements

Consolidated financial statements
UBS Group AG consolidated financial statements

Consolidated financial statements
UBS Group AG consolidated financial statements
Audited |
Income statement | | | | | | | | |
| | | | For the year ended | | % change from |
CHF million, except per share data | | Note | | 31.12.15 | 31.12.14 | 31.12.13 | | 31.12.14 |
Interest income | | 3 | | 13,177 | 13,194 | 13,137 | | 0 |
Interest expense | | 3 | | (6,445) | (6,639) | (7,351) | | (3) |
Net interest income | | 3 | | 6,732 | 6,555 | 5,786 | | 3 |
Credit loss (expense) / recovery | | 12 | | (117) | (78) | (50) | | 50 |
Net interest income after credit loss expense | | | | 6,615 | 6,477 | 5,736 | | 2 |
Net fee and commission income | | 4 | | 17,140 | 17,076 | 16,287 | | 0 |
Net trading income | | 3 | | 5,742 | 3,842 | 5,130 | | 49 |
Other income | | 5 | | 1,107 | 632 | 580 | | 75 |
Total operating income | | | | 30,605 | 28,027 | 27,732 | | 9 |
Personnel expenses | | 6 | | 15,981 | 15,280 | 15,182 | | 5 |
General and administrative expenses | | 7 | | 8,107 | 9,387 | 8,380 | | (14) |
Depreciation and impairment of property, equipment and software | | 16 | | 920 | 817 | 816 | | 13 |
Amortization and impairment of intangible assets | | 17 | | 107 | 83 | 83 | | 29 |
Total operating expenses | | | | 25,116 | 25,567 | 24,461 | | (2) |
Operating profit / (loss) before tax | | | | 5,489 | 2,461 | 3,272 | | 123 |
Tax expense / (benefit) | | 8 | | (898) | (1,180) | (110) | | (24) |
Net profit / (loss) | | | | 6,386 | 3,640 | 3,381 | | 75 |
Net profit / (loss) attributable to preferred noteholders | | | | | 142 | 204 | | (100) |
Net profit / (loss) attributable to non-controlling interests | | | | 183 | 32 | 5 | | 472 |
Net profit / (loss) attributable to UBS Group AG shareholders | | | | 6,203 | 3,466 | 3,172 | | 79 |
| | | | | | | | |
Earnings per share (CHF) | | | | | | | | |
Basic | | 9 | | 1.68 | 0.93 | 0.84 | | 81 |
Diluted | | 9 | | 1.64 | 0.91 | 0.83 | | 80 |
▲
Statement of comprehensive income | | | | |
| | For the year ended |
CHF million | | 31.12.15 | 31.12.14 | 31.12.13 |
| | | | |
Comprehensive income attributable to UBS Group AG shareholders | | | | |
Net profit / (loss) | | 6,203 | 3,466 | 3,172 |
| | | | |
Other comprehensive income that may be reclassified to the income statement | | | | |
Foreign currency translation | | | | |
Foreign currency translation movements, before tax | | (140) | 1,800 | (440) |
Foreign exchange amounts reclassified to the income statement from equity | | (90) | 2 | (36) |
Income tax relating to foreign currency translation movements | | (2) | (7) | 5 |
Subtotal foreign currency translation, net of tax | | (231) | 1,795 | (471) |
Financial investments available-for-sale | | | | |
Net unrealized gains / (losses) on financial investments available-for-sale, before tax | | 175 | 335 | (57) |
Impairment charges reclassified to the income statement from equity | | 1 | 75 | 41 |
Realized gains reclassified to the income statement from equity | | (292) | (243) | (265) |
Realized losses reclassified to the income statement from equity | | 44 | 25 | 56 |
Income tax relating to net unrealized gains / (losses) on financial investments available-for-sale | | 8 | (51) | 71 |
Subtotal financial investments available-for-sale, net of tax | | (63) | 141 | (154) |
Cash flow hedges | | | | |
Effective portion of changes in fair value of derivative instruments designated as cash flow hedges, before tax | | 544 | 2,068 | (652) |
Net realized (gains) / losses reclassified to the income statement from equity | | (1,182) | (1,185) | (1,261) |
Income tax relating to cash flow hedges | | 128 | (195) | 393 |
Subtotal cash flow hedges, net of tax | | (509) | 689 | (1,520) |
Total other comprehensive income that may be reclassified to the income statement, net of tax | | (804) | 2,625 | (2,145) |
| | | | |
Other comprehensive income that will not be reclassified to the income statement | | | | |
Defined benefit plans | | | | |
Gains / (losses) on defined benefit plans, before tax | | 316 | (1,410) | 1,178 |
Income tax relating to defined benefit plans | | (18) | 238 | (239) |
Subtotal defined benefit plans, net of tax | | 298 | (1,172) | 939 |
Property revaluation surplus | | | | |
Gains on property revaluation, before tax | | 0 | 0 | 0 |
Net (gains) / losses reclassified to retained earnings | | 0 | 0 | (6) |
Income tax relating to gains on property revaluation | | 0 | 0 | 0 |
Subtotal changes in property revaluation surplus, net of tax | | 0 | 0 | (6) |
Total other comprehensive income that will not be reclassified to the income statement, net of tax | | 298 | (1,172) | 933 |
| | | | |
Total other comprehensive income | | (506) | 1,453 | (1,211) |
Total comprehensive income attributable to UBS Group AG shareholders | | 5,698 | 4,920 | 1,961 |
| | | | |
Table continues on the next page. | | | | |
Consolidated financial statements
UBS Group AG consolidated financial statements
Statement of comprehensive income (continued) | | | | |
| | | | |
Table continued from previous page. | | | | |
| | For the year ended |
CHF million | | 31.12.15 | 31.12.14 | 31.12.13 |
| | | | |
Comprehensive income attributable to preferred noteholders | | | | |
Net profit / (loss) | | | 142 | 204 |
| | | | |
Other comprehensive income that will not be reclassified to the income statement | | | | |
Foreign currency translation movements, before tax | | | 80 | 355 |
Income tax relating to foreign currency translation movements | | | 0 | 0 |
Subtotal foreign currency translation, net of tax | | | 80 | 355 |
Total other comprehensive income that will not be reclassified to the income statement, net of tax | | | 80 | 355 |
Total comprehensive income attributable to preferred noteholders | | | 221 | 559 |
| | | | |
Comprehensive income attributable to non-controlling interests | | | | |
Net profit / (loss) | | 183 | 32 | 5 |
| | | | |
Other comprehensive income that may be reclassified to the income statement | | | | |
Other comprehensive income that may be reclassified to the income statement, before tax | | (12) | 5 | 0 |
Income tax relating to other comprehensive income that may be reclassified to the income statement | | 2 | (2) | 0 |
Total other comprehensive income that may be reclassified to the income statement, net of tax | | (10) | 3 | 0 |
| | | | |
Other comprehensive income that will not be reclassified to the income statement | | | | |
Foreign currency translation movements, before tax | | (95) | 80 | (1) |
Income tax relating to foreign currency translation movements | | 0 | 0 | 0 |
Subtotal foreign currency translation, net of tax | | (95) | 80 | (1) |
Gains / (losses) on defined benefit plans, before tax | | 6 | (44) | 0 |
Income tax relating to defined benefit plans | | (1) | 8 | 0 |
Subtotal defined benefit plans, net of tax | | 5 | (36) | 0 |
Total other comprehensive income that will not be reclassified to the income statement, net of tax | | (90) | 44 | (1) |
| | | | |
Total other comprehensive income | | (99) | 47 | (1) |
Total comprehensive income attributable to non-controlling interests | | 83 | 79 | 4 |
| | | | |
Total comprehensive income | | | | |
Net profit / (loss) | | 6,386 | 3,640 | 3,381 |
Other comprehensive income | | (605) | 1,580 | (857) |
of which: other comprehensive income that may be reclassified to the income statement | | (814) | 2,628 | (2,145) |
of which: other comprehensive income that will not be reclassified to the income statement | | 208 | (1,048) | 1,288 |
Total comprehensive income | | 5,781 | 5,220 | 2,524 |
Balance sheet | | | | | | | |
| | | | | | | % change from |
CHF million | | Note | | 31.12.15 | 31.12.14 | | 31.12.14 |
| | | | | | | |
Assets | | | | | | | |
Cash and balances with central banks | | | | 91,306 | 104,073 | | (12) |
Due from banks | | 10, 12 | | 11,948 | 13,334 | | (10) |
Cash collateral on securities borrowed | | 11, 26 | | 25,584 | 24,063 | | 6 |
Reverse repurchase agreements | | 11, 26 | | 67,893 | 68,414 | | (1) |
Trading portfolio assets | | 13, 24 | | 124,035 | 138,156 | | (10) |
of which: assets pledged as collateral which may be sold or repledged by counterparties | | 25 | | 51,943 | 56,018 | | (7) |
Positive replacement values | | 14, 24, 26 | | 167,435 | 256,978 | | (35) |
Cash collateral receivables on derivative instruments | | 11, 26 | | 23,763 | 30,979 | | (23) |
Financial assets designated at fair value | | 24, 26, 27 | | 6,146 | 4,951 | | 24 |
Loans | | 10, 12 | | 311,954 | 315,757 | | (1) |
Financial investments available-for-sale | | 15, 24 | | 62,543 | 57,159 | | 9 |
Investments in associates | | 30 | | 954 | 927 | | 3 |
Property, equipment and software | | 16 | | 7,695 | 6,854 | | 12 |
Goodwill and intangible assets | | 17 | | 6,568 | 6,785 | | (3) |
Deferred tax assets | | 8 | | 12,835 | 11,060 | | 16 |
Other assets | | 18 | | 22,160 | 22,988 | | (4) |
Total assets | | | | 942,819 | 1,062,478 | | (11) |
| | | | | | | |
Liabilities | | | | | | | |
Due to banks | | 19 | | 11,836 | 10,492 | | 13 |
Cash collateral on securities lent | | 11, 26 | | 8,029 | 9,180 | | (13) |
Repurchase agreements | | 11, 26 | | 9,653 | 11,818 | | (18) |
Trading portfolio liabilities | | 13, 24 | | 29,137 | 27,958 | | 4 |
Negative replacement values | | 14, 24, 26 | | 162,430 | 254,101 | | (36) |
Cash collateral payables on derivative instruments | | 11, 26 | | 38,282 | 42,372 | | (10) |
Financial liabilities designated at fair value | | 20, 24, 26 | | 62,995 | 75,297 | | (16) |
Due to customers | | 19 | | 390,185 | 410,207 | | (5) |
Debt issued | | 21 | | 93,147 | 91,207 | | 2 |
Provisions | | 22 | | 4,164 | 4,366 | | (5) |
Other liabilities | | 8, 23 | | 75,652 | 71,112 | | 6 |
Total liabilities | | | | 885,511 | 1,008,110 | | (12) |
| | | | | | | |
Equity | | | | | | | |
Share capital | | | | 385 | 372 | | 3 |
Share premium | | | | 31,164 | 32,590 | | (4) |
Treasury shares | | | | (1,693) | (1,393) | | 22 |
Retained earnings | | | | 29,504 | 22,134 | | 33 |
Other comprehensive income recognized directly in equity, net of tax | | | | (4,047) | (3,093) | | 31 |
Equity attributable to UBS Group AG shareholders | | | | 55,313 | 50,608 | | 9 |
Equity attributable to non-controlling interests | | | | 1,995 | 3,760 | | (47) |
Total equity | | | | 57,308 | 54,368 | | 5 |
Total liabilities and equity | | | | 942,819 | 1,062,478 | | (11) |
Consolidated financial statements
UBS Group AG consolidated financial statements
Statement of changes in equity | | | | |
CHF million | Share capital | Share premium | Treasury shares | Retained earnings |
Balance as of 1 January 2013 | 384 | 33,862 | (1,071) | 16,491 |
Issuance of share capital | 1 | | | |
Acquisition of treasury shares | | | (846) | |
Disposal of treasury shares | | | 887 | |
Treasury share gains / (losses) and net premium / (discount) on own equity derivative activity | | 203 | | |
Premium on shares issued and warrants exercised | | 30 | | |
Employee share and share option plans | | 305 | | |
Tax (expense) / benefit recognized in share premium | | 91 | | |
Dividends | | (564)² | | |
Equity classified as obligation to purchase own shares | | (9) | | |
Preferred notes | | | | |
New consolidations and other increases / (decreases) | | | | 6 |
Deconsolidations and other decreases | | (11) | | |
Total comprehensive income for the year | | | | 4,111 |
of which: Net profit / (loss) | | | | 3,172 |
of which: Other comprehensive income that may be reclassified to the income statement, net of tax | | | | |
of which: Other comprehensive income that will not be reclassified to the income statement, net of tax – defined benefit plans | | | | 939 |
of which: Other comprehensive income that will not be reclassified to the income statement, net of tax – foreign currency translation | | | | |
Balance as of 31 December 2013 | 384 | 33,906 | (1,031) | 20,608 |
Issuance of share capital | 0 | | | |
Acquisition of treasury shares | | | (918) | |
Disposal of treasury shares | | | 519 | |
Treasury share gains / (losses) and net premium / (discount) on own equity derivative activity | | 24 | | |
Premium on shares issued and warrants exercised | | 3 | | |
Employee share and share option plans | | 619 | | |
Tax (expense) / benefit recognized in share premium | | 3 | | |
Dividends | | (938)² | | |
Equity classified as obligation to purchase own shares | | 45 | | |
Preferred notes | | | | |
New consolidations and other increases / (decreases) | | | | |
Deconsolidations and other decreases | | | | |
Total comprehensive income for the year | | | | 2,295 |
of which: Net profit / (loss) | | | | 3,466 |
of which: Other comprehensive income that may be reclassified to the income statement, net of tax | | | | |
of which: Other comprehensive income that will not be reclassified to the income statement, net of tax - defined benefit plans | | | | (1,172) |
of which: Other comprehensive income that will not be reclassified to the income statement, net of tax – foreign currency translation | | | | |
Changes to legal structure / reorganization: Effect of establishment of UBS Group AG | (37) | (3,078) | | (2,219) |
Changes to legal structure / reorganization: Increase in UBS Group AG’s ownership interest in UBS AG | 24 | 2,006 | 37 | 1,449 |
Balance as of 31 December 2014 | 372 | 32,590 | (1,393) | 22,134 |
| | | | | | | |
Other comprehensive income recognized directly in equity, net of tax¹ | of which: Foreign currency translation | of which: Financial invest- ments avail- able-for-sale | of which: Cash flow hedges | Total equity attributable to UBS Group AG shareholders | Preferred noteholders | Non-controlling interests | Total equity |
(3,715) | (6,954) | 249 | 2,983 | 45,949 | 3,109 | 42 | 49,100 |
| | | | 1 | | | 1 |
| | | | (846) | | | (846) |
| | | | 887 | | | 887 |
| | | | 203 | | | 203 |
| | | | 30 | | | 30 |
| | | | 305 | | | 305 |
| | | | 91 | | | 91 |
| | | | (564) | (204) | (6) | (773) |
| | | | (9) | | | (9) |
| | | | 0 | (1,572) | | (1,572) |
| | | | 6 | | | 6 |
| | | | (11) | 0 | | (11) |
(2,151) | (471) | (154) | (1,520) | 1,961 | 559 | 4 | 2,524 |
| | | | 3,172 | 204 | 5 | 3,381 |
(2,145) | (471) | (154) | (1,520) | (2,145) | | | (2,145) |
| | | | 939 | | | 939 |
| | | | 0 | 355 | (1) | 355 |
(5,866) | (7,425) | 95 | 1,463 | 48,002 | 1,893 | 41 | 49,936 |
| | | | 0 | | | 0 |
| | | | (918) | | | (918) |
| | | | 519 | | | 519 |
| | | | 24 | | | 24 |
| | | | 3 | | | 3 |
| | | | 619 | | | 619 |
| | | | 3 | | | 3 |
| | | | (938) | (142) | (4) | (1,084) |
| | | | 45 | | | 45 |
| | | | 0 | 1 | | 1 |
| | | | 0 | | 1 | 1 |
| | | | 0 | | | 0 |
2,625 | 1,795 | 141 | 689 | 4,920 | 221 | 79 | 5,220 |
| | | | 3,466 | 142 | 32 | 3,640 |
2,625 | 1,795 | 141 | 689 | 2,625 | | 3 | 2,628 |
| | | | (1,172) | | (36) | (1,208) |
| | | | 0 | 80 | 80 | 160 |
366 | 593 | (25) | (203) | (4,968) | (1,974) | 6,942 | 0 |
(218) | (369) | 16 | 135 | 3,299 | | (3,299) | 0 |
(3,093) | (5,406) | 228 | 2,084 | 50,608 | 0 | 3,760 | 54,368 |
Consolidated financial statements
UBS Group AG consolidated financial statements
Statement of changes in equity (continued) | | | | |
CHF million | Share capital | Share premium | Treasury shares | Retained earnings |
Balance as of 31 December 2014 | 372 | 32,590 | (1,393) | 22,134 |
Issuance of share capital | 0 | | | |
Acquisition of treasury shares | | | (1,538) | |
Disposal of treasury shares | | | 1,275 | |
Treasury share gains / (losses) and net premium / (discount) on own equity derivative activity | | (40) | | |
Premium on shares issued and warrants exercised | | 33 | | |
Employee share and share option plans | | 302 | | |
Tax (expense) / benefit recognized in share premium | | 9 | | |
Dividends | | (2,760)² | | |
Equity classified as obligation to purchase own shares | | 1 | | |
Preferred notes | | | | |
New consolidations and other increases / (decreases) | | | | |
Deconsolidations and other decreases | | | | |
Total comprehensive income for the year | | | | 6,502 |
of which: Net profit / (loss) | | | | 6,203 |
of which: Other comprehensive income that may be reclassified to the income statement, net of tax | | | | |
of which: Other comprehensive income that will not be reclassified to the income statement, net of tax – defined benefit plans | | | | 298 |
of which: Other comprehensive income that will not be reclassified to the income statement, net of tax – foreign currency translation | | | | |
Changes to legal structure / reorganization: Increase in UBS Group AG’s ownership interest in UBS AG | 13 | 1,029 | (37) | 868 |
Balance as of 31 December 2015 | 385 | 31,164 | (1,693) | 29,504 |
1 Excludes defined benefit plans that are recorded directly in retained earnings. 2 Reflects the payment out of the capital contribution reserve of UBS Group AG (2014 and 2013 UBS AG) of CHF 0.75 (2014: CHF 0.25, 2013: CHF 0.15) per CHF 0.10 par value share. |
| | | | | | | |
Other comprehensive income recognized directly in equity, net of tax¹ | of which: Foreign currency translation | of which: Financial invest- ments avail- able-for-sale | of which: Cash flow hedges | Total equity attributable to UBS Group AG shareholders | Preferred noteholders | Non-controlling interests | Total equity |
(3,093) | (5,406) | 228 | 2,084 | 50,608 | | 3,760 | 54,368 |
| | | | 0 | | | 0 |
| | | | (1,538) | | | (1,538) |
| | | | 1,275 | | | 1,275 |
| | | | (40) | | | (40) |
| | | | 33 | | | 33 |
| | | | 302 | | | 302 |
| | | | 9 | | | 9 |
| | | | (2,760) | | (124) | (2,884) |
| | | | 1 | | | 1 |
| | | | 0 | | | 0 |
| | | | 0 | | 1 | 1 |
| | | | 0 | | (1) | (1) |
(804) | (231) | (63) | (509) | 5,698 | | 83 | 5,781 |
| | | | 6,203 | | 183 | 6,386 |
(804) | (231) | (63) | (509) | (804) | | (10) | (814) |
| | | | 298 | | 5 | 304 |
| | | | 0 | | (95) | (95) |
(150) | (220) | 7 | 63 | 1,724 | | (1,724) | 0 |
(4,047) | (5,857) | 172 | 1,638 | 55,313 | | 1,995 | 57,308 |
| | | | | | | |
Consolidated financial statements
UBS Group AG consolidated financial statements
UBS Group AG shares issued and treasury shares held | | | | |
| | For the year ended |
Number of shares | | 31.12.15 | | 31.12.14¹ |
| | | | |
Shares issued | | | | |
Balance at the beginning of the year | | 3,717,128,324 | | |
Issuance of shares | | 132,603,211 | | 3,717,128,324 |
Balance at the end of the year | | 3,849,731,535 | | 3,717,128,324 |
| | | | |
Treasury shares² | | | | |
Balance at the beginning of the year | | 87,871,737 | | 73,800,252 |
Acquisitions | | 89,594,586 | | 49,271,831 |
Disposals | | (78,760,048) | | (35,200,346) |
Balance at the end of the year | | 98,706,275 | | 87,871,737 |
1 UBS Group AG was incorporated on 10 June 2014 as a wholly owned subsidiary of UBS AG with a share capital of CHF 100,000 divided into 1,000,000 shares. 2 Comparative information represents movements in UBS AG treasury shares up to 27 November 2014 and movements in UBS Group AG treasury shares starting with 28 November 2014. On 28 November 2014, all UBS AG treasury shares were exchanged for UBS Group AG treasury shares. |
Conditional share capital
As of 31 December 2015, 131,029,690 additional UBS Group AG shares could have been issued to fund UBS’s employee share option programs.
Additional conditional capital up to a maximum number of 380,000,000 UBS Group AG shares was available as of 31 December 2015 for conversion rights and warrants granted in connection with the issuance of bonds or similar financial instruments.
Statement of cash flows | | | | |
| | For the year ended |
CHF million | | 31.12.15¹ | 31.12.14¹ | 31.12.13¹ |
| | | | |
Cash flow from / (used in) operating activities | | | | |
Net profit / (loss) | | 6,386 | 3,640 | 3,381 |
Adjustments to reconcile net profit to cash flow from / (used in) operating activities | | | | |
Non-cash items included in net profit and other adjustments: | | | | |
Depreciation and impairment of property, equipment and software | | 920 | 817 | 816 |
Amortization and impairment of intangible assets | | 107 | 83 | 83 |
Credit loss expense / (recovery) | | 117 | 78 | 50 |
Share of net profits of associates | | (169) | (94) | (49) |
Deferred tax expense / (benefit) | | (1,613) | (1,635) | (545) |
Net loss / (gain) from investing activities | | (934) | (227) | (522) |
Net loss / (gain) from financing activities | | (1,451) | 2,135 | 3,988 |
Other net adjustments | | 3,686 | (7,250) | 5,326 |
Net change in operating assets and liabilities: | | | | |
Due from / to banks | | 1,763 | (1,235) | (7,551) |
Cash collateral on securities borrowed and reverse repurchase agreements | | (2,712) | 32,262 | 43,754 |
Cash collateral on securities lent and repurchase agreements | | (2,909) | (3,698) | (23,659) |
Trading portfolio, replacement values and financial assets designated at fair value | | 5,505 | (2,880) | 43,944 |
Cash collateral on derivative instruments | | 3,285 | (7,301) | (22,412) |
Loans | | 1,386 | (20,427) | (7,108) |
Due to customers | | (18,404) | 8,804 | 19,195 |
Other assets, provisions and other liabilities | | 8,696 | 4,734 | (3,935) |
Income taxes paid, net of refunds | | (551) | (600) | (382) |
Net cash flow from / (used in) operating activities | | 3,109 | 7,205 | 54,374 |
| | | | |
Cash flow from / (used in) investing activities | | | | |
Purchase of subsidiaries, associates and intangible assets | | (13) | (18) | (49) |
Disposal of subsidiaries, associates and intangible assets² | | 477 | 70 | 136 |
Purchase of property, equipment and software | | (1,841) | (1,915) | (1,236) |
Disposal of property, equipment and software | | 542 | 350 | 639 |
Net (investment in) / divestment of financial investments available-for-sale³ | | (7,605) | 4,108 | 5,966 |
Net cash flow from / (used in) investing activities | | (8,441) | 2,596 | 5,457 |
| | | | |
Table continues on the next page. | | | | |
Consolidated financial statements
UBS Group AG consolidated financial statements
Statement of cash flows (continued) |
| | | | |
Table continued from previous page. | | | | |
| | For the year ended |
CHF million | | 31.12.15¹ | 31.12.14¹ | 31.12.13¹ |
| | | | |
Cash flow from / (used in) financing activities | | | | |
Net short-term debt issued / (repaid) | | (6,404) | (2,921) | (4,290) |
Net movements in treasury shares and own equity derivative activity | | (845) | (694) | (341) |
Capital issuance | | 0 | 0 | 1 |
Distributions paid on UBS shares | | (2,760) | (938) | (564) |
Issuance of long-term debt, including financial liabilities designated at fair value | | 47,790 | 40,982 | 28,014 |
Repayment of long-term debt, including financial liabilities designated at fair value | | (44,221) | (34,210) | (68,954) |
Net changes of non-controlling interests and preferred notes | | (156) | (113) | (1,421) |
Net cash flow from / (used in) financing activities | | (6,595) | 2,108 | (47,555) |
| | | | |
Effects of exchange rate differences on cash and cash equivalents | | (1,742) | 8,522 | (2,705) |
Net increase / (decrease) in cash and cash equivalents | | (13,670) | 20,430 | 9,569 |
Cash and cash equivalents at the beginning of the year | | 116,715 | 96,284 | 86,715 |
Cash and cash equivalents at the end of the year | | 103,044 | 116,715 | 96,284 |
| | | | |
Cash and cash equivalents comprise: | | | | |
Cash and balances with central banks | | 91,306 | 104,073 | 80,879 |
Due from banks | | 10,814 | 11,772 | 11,117 |
Money market paper⁴ | | 924 | 869 | 4,288 |
Total⁵ | | 103,044 | 116,715 | 96,284 |
| | | | |
Additional information | | | | |
Net cash flow from / (used in) operating activities include: | | | | |
Cash received as interest | | 11,144 | 11,321 | 12,148 |
Cash paid as interest | | 5,270 | 5,360 | 7,176 |
Cash received as dividends on equity investments, investment funds and associates⁶ | | 2,120 | 1,961 | 1,421 |
1 In 2015, UBS refined its definition of cash and cash equivalents to exclude cash collateral receivables on derivatives with bank counterparties. Prior periods were restated. Refer to Note 1b for more information. 2 Includes dividends received from associates. 3 Includes gross cash inflows from sales and maturities (CHF 93,584 million for the year ended 31 December 2015, CHF 140,438 million for the year ended 31 December 2014, CHF 153,887 million for the year ended 31 December 2013) and gross cash outflows from purchases of (CHF 101,189 million for the year ended 31 December 2015, CHF 136,330 million for the year ended 31 December 2014, CHF 147,921 million for the year ended 31 December 2013). 4 Money market paper is included in the balance sheet under Trading portfolio assets (31 December 2015: CHF 795 million, 31 December 2014: CHF 835 million, 31 December 2013: CHF 1,716 million) and Financial investments available-for-sale (31 December 2015: CHF 129 million, 31 December 2014: CHF 34 million, 31 December 2013: CHF 2,571 million). 5 CHF 3,963 million, CHF 4,178 million and CHF 4,534 million of cash and cash equivalents (mainly reflected in Due from banks) were restricted as of 31 December 2015, 31 December 2014 and 31 December 2013, respectively. Refer to Note 25 for more information. 6 Includes dividends received from associates (2015: CHF 114 million, 2014: CHF 54 million, 2013: CHF 69 million) reported within cash flow from / (used in) investing activities. |
Notes to the UBS Group AG consolidated financial statements
Note 1 Summary of significant accounting policies
a) Significant accounting policies
Pillar 3 | UBS Group AG was established in 2014 as the holding company of the Group and in 2015 it increased its ownership interest in UBS AG to 100%, following the successful completion of the procedure under article 33 of the Swiss Stock Exchange Act (SESTA procedure). Refer to Note 32 for more information.
The significant accounting policies applied in the preparation of the consolidated financial statements (the “Financial Statements”) of UBS Group AG and its subsidiaries (“UBS” or the “Group”) are described in this note. These policies have been applied consistently in all years presented unless otherwise stated.
The consolidated financial statements of UBS Group AG were prepared as a continuation of the consolidated financial statements of UBS AG, applying the same accounting policies under International Financial Reporting Standards (IFRS). The comparative information for 2013 reflects the consolidated financial statements of UBS AG, as previously published, except for certain voluntary changes in accounting policy and presentation that are unrelated to the establishment of UBS Group AG. ▲
1) Basis of accounting
UBS provides a broad range of financial services including: advisory services, underwriting, financing, market-making, asset management and brokerage on a global level, and retail banking in Switzerland. The Group was formed on 29 June 1998 when Swiss Bank Corporation and Union Bank of Switzerland merged.
The Financial Statements are prepared in accordance with IFRS as issued by the International Accounting Standards Board (IASB), and are presented in Swiss francs (CHF), the currency of Switzerland, where UBS Group AG is incorporated. On 10 March 2016, the Financial Statements were authorized for issue by the Board of Directors. The Financial Statements are prepared using uniform accounting policies for similar transactions and other events. Intercompany transactions and balances have been eliminated.
Disclosures incorporated in the “Risk, treasury and capital management” section of this Annual Report, which form part of these Financial Statements, are marked as audited. These disclosures relate to requirements under IFRS 7 Financial Instruments: Disclosures and IAS 1 Presentation of Financial Statements and are not repeated in the “Financial information – consolidated financial statements” section.
2) Use of estimates
Preparation of these Financial Statements under IFRS requires management to make estimates and assumptions that affect reported amounts of assets, liabilities, income and expenses and disclosure of contingent assets and liabilities. These estimates and assumptions are based on the best available information. Actual results in the future could differ from such estimates and such differences may be material to the Financial Statements. Estimates are reviewed regularly and revisions are recognized in the period in which they occur.
The following notes to the Financial Statements contain information about those areas of estimation uncertainty considered to require critical judgment and have the most significant effect on the amounts recognized in the Financial Statements: Note 8 Income taxes, Note 12 Allowances and provisions for credit losses, Note 17 Goodwill and intangible assets, Note 22 Provisions and contingent liabilities, Note 24 Fair value measurement, Note 28 Pension and other post-employment benefit plans, Note 29 Equity participation and other compensation plans and Note 30 Interests in subsidiaries and other entities.
3) Subsidiaries and structured entities
Pillar 3 | The Financial Statements comprise those of the parent company (UBS Group AG) and its subsidiaries, including controlled structured entities (SEs), presented as a single economic entity. Equity attributable to non-controlling interests is presented on the consolidated balance sheet within Equity, separately from Equity attributable to UBS Group AG shareholders.
UBS controls an entity when it has power over the relevant activities of the entity, exposure to variable returns and the ability to use its power to affect its returns.
Where an entity is governed by voting rights, control is generally indicated by a direct shareholding of more than one-half of the voting rights.
Consolidated financial statements
Notes to the UBS Group AG consolidated financial statements
Note 1 Summary of significant accounting policies (continued)
In other cases, the assessment of control is more complex and requires greater use of judgment. Where UBS has an interest in an entity that absorbs variability, UBS considers whether it has power over the entity that allows it to affect the variability of its returns. Consideration is given to all facts and circumstances to determine whether the Group has power over another entity, that is, the current ability to direct the relevant activities of an entity when decisions about those activities need to be made. Factors such as the purpose and design of the entity, rights held through contractual arrangements such as call rights, put rights or liquidation rights, as well as potential decision-making rights are all considered in this assessment. Where the Group has power over the relevant activities, a further assessment is made to determine whether, through that power, it has the ability to affect its own returns – that is, assessing whether power is held in a principal or agent capacity. Consideration is given to (i) the scope of decision-making authority, (ii) rights held by other parties, including removal or other participating rights and (iii) exposure to variability, including remuneration, relative to total variability of the entity as well as whether that exposure is different from other investors. If, after review of these factors, UBS concludes that it can exercise its power to affect its own returns, the entity is consolidated.
Subsidiaries, including SEs, are consolidated from the date control is obtained and are deconsolidated from the date control ceases. Control, or the lack thereof, is reassessed if facts and circumstances indicate that there is a change to one or more of the elements needed to establish that control is present. ▲
® Refer to Note 30 for more information on subsidiaries and structured entities
Structured entities (SEs)
SEs are entities that have been designed so that voting or similar rights are not the dominant factor in deciding who controls the entity, such as when voting rights relate only to administrative tasks and the relevant activities are directed by means of contractual arrangements. Such entities generally have a narrow and well-defined objective and include those historically referred to as special purpose entities (SPEs) and some investment funds. UBS assesses whether an entity is an SE by considering the nature of the activities of the entity as well as the substance of voting or similar rights afforded to other parties, including investors and independent boards or directors. UBS considers rights such as the ability to liquidate the entity or remove the decision maker to be similar to voting rights when the holder has the substantive ability to exercise such rights without cause. In the absence of such rights or in cases where the existence of such rights cannot be fully established, the entity is considered to be an SE.
The Group sponsors the formation of SEs and interacts with non-sponsored SEs for a variety of reasons including allowing clients to obtain or be exposed to particular risk profiles, to provide funding or to sell or purchase credit risk. Many SEs are established as bankruptcy remote, meaning that only the assets in the SE are available for the benefit of the SE’s investors and such investors have no other recourse to UBS. UBS is deemed to be the sponsor of an SE when it is involved in its creation, establishment and promotion and facilitates its ongoing success through the transfer of assets or the provision of explicit or implicit financial, operational or other support. Where the Group acts purely as an advisor, administrator or placement agent for an SE created by a third-party entity, it is not considered to be sponsored by UBS.
Pillar 3 | Each individual entity is assessed for consolidation in line with the consolidation principles described above, considering the nature and scope of UBS involvement. ▲ As the nature and extent of UBS involvement is unique to each entity, there is no uniform consolidation outcome by entity – certain entities within a class are consolidated and others are not. When UBS does not consolidate an SE but has an interest in an SE or has sponsored an SE, additional disclosures are provided in Note 30 on the nature of these interests and sponsorship activities. Pillar 3 | The classes of SEs UBS is involved with include the following:
– Securitization structured entities are established to issue securities to investors that are backed by assets held by the SE and whereby (i) significant credit risk associated with the securitized exposures has been transferred to third parties and (ii) there is more than one risk position or tranche issued by the securitization vehicle in line with the Basel III securitization definition. All securitization entities are classified as SEs. ▲
– Client investment structured entities are established predominantly for clients to invest in specific assets or risk exposures through purchasing notes issued by the SE, predominantly on a fixed-term basis. The SE may source assets via a transfer from UBS or through an external market transaction. In some cases, UBS may enter into derivatives with the SE to either align the cash flows of the entity with the investor’s intended investment objective or to introduce other desired risk exposures. In certain cases, UBS may have interests in a third-party sponsored SE to hedge specific risks or participate in asset-backed financing.
– Investment fund structured entities have a collective investment objective, are managed by an investment manager and are either passively managed, such that any decision-making does not have a substantive effect on variability, or are actively managed and investors or their governing bodies do not have substantive voting or similar rights. UBS creates and sponsors a large number of funds in which it may have an interest through the receipt of variable management fees and / or a direct investment. In addition, UBS has interests in a number of funds created and sponsored by third parties, including exchange-traded funds and hedge funds, to hedge issued structured products.
Note 1 Summary of significant accounting policies (continued)
Business combinations
Business combinations are accounted for using the acquisition method. As of the acquisition date, UBS recognizes the identifiable assets acquired and the liabilities assumed at their acquisition-date fair values. For each business combination, UBS measures the non-controlling interests in the acquiree either at fair value or at their proportionate share of the acquiree’s identifiable net assets. Generally, non-controlling interests are present ownership interests that entitle their holders to a proportionate share of the net assets of the acquiree in the event of liquidation.
The cost of an acquisition is the aggregate of the assets transferred, the liabilities owed to former owners of the acquiree, and the equity instruments issued, measured at acquisition-date fair values. Acquisition-related costs are expensed as incurred. Any contingent consideration that may be transferred by UBS is recognized at fair value as of the date of acquisition.
If the contingent consideration is classified as an asset or liability, subsequent changes in the fair value of the contingent consideration are recognized in the income statement. If the contingent consideration is classified as equity, it is not remeasured and its subsequent settlement is accounted for within Equity. Any excess of the aggregate of the consideration transferred and the amount recognized for non-controlling interests over the net identifiable assets acquired and liabilities assumed is considered goodwill and is recognized as a separate asset on the balance sheet, initially measured at cost. If the fair value of the net assets of the subsidiary acquired exceeds the aggregate of the consideration transferred and the amount recognized for non-controlling interests, the difference is recognized in the income statement on the acquisition date.
® Refer to Note 31 for more information on business combinations
4) Associates and joint ventures
Investments in entities in which UBS has significant influence, but not control, over the financial and operating policies of the entity are classified as investments in associates and accounted for under the equity method of accounting. Normally, significant influence is indicated when UBS owns between 20% and 50% of a company’s voting rights. Investments in associates are initially recognized at cost, and the carrying amount is increased or decreased after the date of acquisition to recognize the Group’s share of the investee’s net profit or loss (including net profit or loss recognized directly in equity). Interests in joint ventures are also accounted for under the equity method of accounting. A joint venture is subject to a contractual agreement between UBS and one or more third parties, which establishes joint control over the relevant activities and provides rights to the net assets of the entity. Interests in joint ventures are classified as Investments in associates.
If the reporting date of an associate or joint venture is different than UBS’s reporting date, the most recently available financial statements of the associate or joint venture are used to apply the equity method. Adjustments are made for effects of significant transactions or events that may occur between that date and the UBS reporting date.
Investments in associates and interests in joint ventures are classified as held for sale if their carrying amount will be recovered principally through a sale transaction rather than through continuing use. Refer to item 29 for more information.
® Refer to Note 30 for more information on associates and joint ventures
5) Recognition and derecognition of financial instruments
UBS recognizes financial instruments on its balance sheet when the Group becomes a party to the contractual provisions of the instruments, provided the recognition criteria are satisfied. UBS also acts in a trustee or other fiduciary capacity, which results in the holding or placing of assets on behalf of individuals, trusts, retirement benefit plans and other institutions. Unless the recognition criteria are satisfied, these assets and the related income are excluded from UBS’s Financial Statements, as they are not assets of UBS.
Pillar 3 | Financial assets
UBS enters into certain transactions where it transfers financial assets recognized on its balance sheet but retains either all or a portion of the risks and rewards of the transferred financial assets. If all or substantially all of the risks and rewards are retained, the transferred financial assets are not derecognized from the balance sheet. Transactions where transfers of financial assets result in UBS retaining all or substantially all risks and rewards include securities lending and repurchase transactions described under items 13 and 14. They also include transactions where financial assets are sold to a third party together with a total return swap that results in UBS retaining all or substantially all risks and rewards of the transferred assets. These types of transactions are accounted for as secured financing transactions.
In transactions where substantially all of the risks and rewards of ownership of a financial asset are neither retained nor transferred, UBS derecognizes the financial asset if control over the asset is surrendered. The rights and obligations retained following the transfer are recognized separately as assets and liabilities, respectively. In transfers where control over the financial asset is retained, the Group continues to recognize the asset to the extent of its continuing involvement, determined by the extent to which it is exposed to changes in the value of the transferred asset following the transfer. Examples of such transactions include written put options, acquired call options, or other instruments linked to the performance of the transferred asset.
Consolidated financial statements
Notes to the UBS Group AG consolidated financial statements
Note 1 Summary of significant accounting policies (continued)
For the purposes of the Group’s disclosures of transferred financial assets, a financial asset is typically considered to have been transferred when the Group a) transfers the contractual rights to receive the cash flows of the financial asset or b) retains the contractual rights to receive the cash flows of that asset, but assumes a contractual obligation to pay the cash flows to one or more entities.
Where financial assets have been pledged as collateral or in similar arrangements, they are considered to have been transferred if the counterparty has received the contractual right to the cash flows of the pledged assets, as may be evidenced, for example, by the counterparty’s right to sell or repledge the assets. Where the counterparty to the pledged financial assets has not received the contractual right to the cash flows, the assets are considered pledged, but not transferred.
® Refer to Note 25b and 25c for more information on transferred financial assets
Financial liabilities
UBS derecognizes a financial liability from its balance sheet when it is extinguished, such as when the obligation specified in the contract is discharged, cancelled or has expired. When an existing financial liability is exchanged for a new one from the same lender on substantially different terms, or the terms of an existing liability are substantially modified, such an exchange or modification is treated as the derecognition of the original liability and the recognition of a new liability with any difference in the respective carrying amounts being recognized in the income statement. ▲
6) Determination of fair value
Fair value is the price that would be received for the sale of an asset or paid to transfer a liability in an orderly transaction between market participants in the principal market (or most advantageous market, in the absence of a principal market) as of
the measurement date..
® Refer to Note 24 for more information on fair value measurement
7) Trading portfolio assets and liabilities
Non-derivative financial assets and liabilities are classified at acquisition as held for trading and presented in the trading portfolio if they are a) acquired or incurred principally for the purpose of selling or repurchasing in the near term, or b) part of a portfolio of identified financial instruments that are managed together and for which there is evidence of a recent actual pattern of short-term profit-taking.
The trading portfolio includes non-derivative financial instruments (including those with embedded derivatives) and commodities. Financial instruments that are considered derivatives in their entirety generally are presented on the balance sheet as Positive replacement values or Negative replacement values. Refer to item 15 for more information. The trading portfolio includes recognized assets and liabilities relating to proprietary, hedging and client-related business.
Trading portfolio assets include debt instruments (including those in the form of securities, money market paper and traded corporate and bank loans), equity instruments, assets held under unit-linked contracts and precious metals and other commodities owned by the Group (long positions). Trading portfolio liabilities include obligations to deliver financial instruments such as debt and equity instruments which the Group has sold to third parties but does not own (short positions).
Assets and liabilities in the trading portfolio are measured at fair value. Gains and losses realized on disposal or redemption of these assets and liabilities and unrealized gains and losses from changes in the fair value of these assets and liabilities are reported as Net trading income. Interest and dividend income and expense on these assets and liabilities are included in Interest income or Interest expense.
The Group uses settlement date accounting when recognizing assets and liabilities in the trading portfolio. From the date a purchase transaction is entered into (trade date) until settlement date, UBS recognizes any unrealized profits and losses arising from changes in fair value in Net trading income. The corresponding receivable or payable is presented on the balance sheet as a Positive replacement value or Negative replacement value. On settlement date, the resulting financial asset is recognized on the balance sheet at the fair value of the consideration given or received, plus or minus the change in fair value of the contract since the trade date. From the trade date of a sales transaction, unrealized profits and losses are no longer recognized and, on settlement date, the asset is derecognized.
Trading portfolio assets transferred to external parties that do not qualify for derecognition (refer to item 5 for more information) and where the transferee has obtained the right to sell or repledge the assets continue to be classified on the UBS balance sheet as Trading portfolio assets but are identified as Assets pledged as collateral which may be sold or repledged by counterparties. Such assets continue to be measured at fair value.
® Refer to Note 13 and 24 for more information on trading portfolio assets and liabilities
Note 1 Summary of significant accounting policies (continued)
8) Financial assets and financial liabilities designated at fair value through profit or loss
A financial instrument may be designated at fair value through profit or loss only upon initial recognition and this designation cannot be changed subsequently. Financial assets and financial liabilities designated at fair value are presented on separate lines on the face of the balance sheet. The fair value option can be applied only if one of the following criteria is met:
– the financial instrument is a hybrid instrument that includes a substantive embedded derivative;
– the financial instrument is part of a portfolio that is risk managed on a fair value basis and reported to senior management on that basis or
– the application of the fair value option eliminates or significantly reduces an accounting mismatch that would otherwise arise.
UBS has used the fair value option to designate most of its issued hybrid debt instruments as financial liabilities designated at fair value through profit or loss, on the basis that such financial instruments include embedded derivatives and / or are managed on a fair value basis. Such hybrid debt instruments predominantly include the following:
– Equity-linked bonds or notes: linked to a single stock, a basket of stocks or an equity index;
– Credit-linked bonds or notes: linked to the performance (coupon and / or redemption amount) of single names (such as a company or a country) or a basket of reference entities and
– Rates-linked bonds or notes: linked to a reference interest rate, interest rate spread or formula.
The fair value option is also applied to certain loans and loan commitments, otherwise accounted for at amortized cost, which are hedged predominantly with credit derivatives. The application of the fair value option to the loans and loan commitments reduces an accounting mismatch, as the credit derivatives are accounted for as derivative instruments at fair value through profit or loss. Similarly, UBS has applied the fair value option to certain structured loans and reverse repurchase and securities borrowing agreements which are part of portfolios managed on a fair value basis.
The fair value option is applied to assets held to hedge deferred cash-settled employee compensation awards, in order to reduce an accounting mismatch that would otherwise arise due to the liability being measured on a fair value basis.
Fair value changes related to financial instruments designated at fair value through profit or loss are recognized in Net trading income. Interest income and interest expense on financial assets and liabilities designated at fair value through profit or loss are recognized in Interest income on financial assets designated at fair value or Interest expense on financial liabilities designated at fair value, respectively.
UBS applies the same recognition and derecognition principles to financial instruments designated at fair value as to financial instruments in the trading portfolio. Refer to items 5 and 7 for more information.
® Refer to Notes 3, 20, 24e and 27d for more information on financial assets and liabilities designated at fair value
9) Financial investments classified as available-for-sale
Financial investments classified as available-for-sale are non-derivative financial assets that are not classified as held for trading, designated at fair value through profit or loss, or loans and receivables. They are recognized on a settlement date basis.
Financial investments classified as available-for-sale include: (a) debt securities held as part of a large multi-currency portfolio of unencumbered, high-quality assets managed centrally by Corporate Center – Group Asset and Liability Management, a majority of which is short-term, (b) strategic equity investments, (c) certain investments in real estate funds, (d) certain equity instruments including private equity investments, and (e) debt instruments and non-performing loans acquired in the secondary market.
Financial investments that are classified as available-for-sale are recognized initially at fair value less transaction costs and are measured subsequently at fair value. Unrealized gains and losses are reported in Other comprehensive income within Equity, net of applicable income taxes, until such investments are sold, collected or otherwise disposed of, or until any such investment is determined to be impaired. Unrealized gains before tax are presented separately from unrealized losses before tax in Note 15.
For monetary instruments (such as debt securities), foreign exchange translation gains and losses determined by reference to the amortized cost basis of the instruments are recognized in Net trading income. Foreign exchange translation gains and losses related to other changes in fair value are recognized in Other comprehensive income within Equity. Foreign exchange translation gains and losses associated with non-monetary instruments (such as equity securities) are part of the overall fair value change of the instruments and are recognized in Other comprehensive income within Equity.
Interest and dividend income on financial investments classified as available-for-sale are included in Interest and dividend income from financial investments available-for-sale. Interest income is determined by reference to the instrument’s amortized cost basis using the effective interest rate (EIR).
On disposal of an investment, any related accumulated unrealized gains or losses included in Equity are reclassified to the income statement and reported in Other income. Gains or losses on disposal are determined using the average cost method.
Consolidated financial statements
Notes to the UBS Group AG consolidated financial statements
Note 1 Summary of significant accounting policies (continued)
At each balance sheet date, UBS assesses whether indicators of impairment are present for an available-for-sale investment. An available-for-sale investment is impaired when there is objective evidence that, as a result of one or more events that occurred after the initial recognition of the investment, the estimated future cash flows from the investment have decreased. A significant or prolonged decline in the fair value of an available-for-sale equity instrument below its original cost is considered objective evidence of impairment. In the event of a significant decline in fair value below its original cost (20%) or a prolonged decline (six months), an impairment is recorded unless facts and circumstances clearly indicate that the decline in value, on its own, is not evidence of an impairment.
For debt investments, objective evidence of impairment includes significant financial difficulty of the issuer or counterparty, default or delinquency in interest or principal payments, or it becoming probable that the borrower will enter bankruptcy or financial reorganization. If an available-for-sale financial investment is determined to be impaired, the related cumulative net unrealized loss previously recognized in Other comprehensive income within Equity is reclassified to the income statement within Other income. For equity instruments, any further loss is recognized directly in the income statement, whereas for debt instruments, any further loss is recognized in the income statement only if there is additional objective evidence of impairment. After an impairment of an equity instrument that is classified as available-for-sale, increases in the fair value are reported in Other comprehensive income within Equity. Subsequent increases in the fair value of debt instruments up to an amount that equals their amortized cost in original currency are recognized in Other income, provided that the fair value increase is related to an event occurring after the impairment loss was recorded. Increases in excess of that amount are reported in Other comprehensive income within Equity.
UBS applies the same recognition and derecognition principles to financial assets classified as available-for-sale as to financial instruments in the trading portfolio (refer to items 5 and 7 for more information), except that unrealized gains and losses between trade date and settlement date are recognized in Other comprehensive income within Equity rather than in the income statement.
® Refer to Note 15 and 24 for more information on financial investments available-for-sale
10) Loans and receivables
Loans and receivables are non-derivative financial assets with fixed or determinable payments that are not quoted in an active market, not classified as held for trading, not designated at fair value through profit and loss or classified as available-for-sale, and are not assets for which the Group may not recover substantially all of its initial net investment other than because of credit deterioration. Financial assets classified as loans and receivables include:
– originated loans where funding is provided directly to the borrower;
– participation in a loan from another lender and purchased loans; and
– securities which were classified as loans and receivables at acquisition date, such as municipal auction rate securities in the Corporate Center – Non-core and Legacy Portfolio (refer to Note 27c for more information).
Loans and receivables are recognized when UBS becomes a party to the contractual provisions of the instrument, which is when funding is advanced to borrowers. They are recorded initially at fair value, based on the amount provided to originate or purchase the assets, together with any transaction costs directly attributable to the acquisition. Subsequently, they are measured at amortized cost using the EIR method, less allowances for credit losses. Refer to item 11 for information on allowances for credit losses and to Note 27a for an overview of the financial assets classified as loans and receivables.
Interest on loans and receivables is included in Interest earned on loans and advances and is recognized on an accrual basis. Upfront fees and direct costs relating to loan origination, refinancing or restructuring as well as to loan commitments are generally deferred and amortized to Interest earned on loans and advances over the life of the loan using the EIR method. For loan commitments that are not expected to result in a loan being advanced, the fees are recognized in Net fee and commission income over the commitment period. For loan syndication fees where UBS does not retain a portion of the syndicated loan, or where UBS does retain a portion of the syndicated loan at the same effective yield for comparable risk as other participants, fees are credited to Net fee and commission income when the services have been provided.
Presentation of receivables from central banks
Deposits with central banks that are available on demand are presented on the balance sheet as Cash and balances with central banks. All longer-dated receivables with central banks are presented under Due from banks.
Note 1 Summary of significant accounting policies (continued)
Financial assets reclassified to loans and receivables
When a financial asset is reclassified from held for trading to loans and receivables, the financial asset is reclassified at its fair value on the date of reclassification. Any gain or loss recognized in the income statement before reclassification is not reversed. The fair value of a financial asset on the date of reclassification becomes its cost basis going forward. In 2008 and 2009, UBS determined that certain financial assets classified as held for trading were no longer held for the purpose of selling or repurchasing in the near term and that the Group had the intention and ability to hold these assets for the foreseeable future, considered to be a period of approximately twelve months from the reclassification. Therefore, these assets were reclassified from held for trading to loans and receivables.
® Refer to Note 27c for more information on reclassified assets
Renegotiated loans
A renegotiated or restructured loan is a loan for which the terms have been modified or for which additional collateral has been requested that was not contemplated in the original contract.
Typical key features of terms and conditions granted through renegotiation to avoid default include special interest rates, postponement of interest or amortization payments, modification of the schedule of repayments or amendment of loan maturity. There is no change in the EIR following a renegotiation.
If a loan is renegotiated with preferential conditions (i.e., new or modified terms and conditions are agreed which do not meet the normal market criteria for the quality of the obligor and the type of loan), the position is still classified as non-performing and is rated as being in counterparty default. It will remain so until the loan is collected or written off and will be assessed for impairment on an individual basis.
If a loan is renegotiated on a non-preferential basis (e.g., additional collateral is provided by the client, or new terms and conditions are agreed which meet the normal market criteria for the quality of the obligor and the type of loan), the loan will be re-rated using the Group’s regular rating scale. In these circumstances, the loan is removed from impaired status and included in the collective assessment of loan loss allowances, unless an indication of impairment exists, in which case the loan is assessed for impairment on an individual basis. For the purposes of measuring credit losses within the collective loan loss assessment, these loans are not segregated from other loans which have not been renegotiated. Management regularly reviews all loans to ensure that all criteria according to the loan agreement continue to be met and that future payments are likely to occur. Refer to item 11 for more information on allowances and provisions for credit losses.
A restructuring of a loan could lead to a fundamental change in the terms and conditions of a loan, resulting in the original loan being derecognized and a new loan being recognized.
If a loan is derecognized in these circumstances, the new loan is measured at fair value at initial recognition. Any allowance taken to date against the original loan is derecognized and is not attributed to the new loan. Consequently, the new loan is assessed for impairment on an individual basis. If the loan is not impaired, the loan is included within the general collective loan assessment for the purpose of measuring credit losses.
11) Allowances and provisions for credit losses
EDTF | An allowance or provision for credit losses is established if there is objective evidence that the Group will be unable to collect all amounts due (or the equivalent thereof) on a claim, based on the original contractual terms due to credit deterioration of the issuer or counterparty. A claim means a loan or receivable carried at amortized cost, or a commitment such as a letter of credit, a guarantee, or another similar instrument. Objective evidence of impairment includes significant financial difficulty of the issuer or counterparty, default or delinquency in interest or principal payments, or a likelihood that the borrower will enter bankruptcy or financial reorganization.
An allowance for credit losses is reported as a reduction of the carrying value of a claim on the balance sheet. For an off-balance-sheet item, such as a commitment, a provision for credit loss is reported in Provisions. Changes to allowances and provisions for credit losses are recognized as Credit loss expense / recovery.
Allowances and provisions for credit losses are evaluated at both a counterparty-specific level and collectively based on the following principles:
Counterparty-specific: A loan is considered impaired when management determines that it is probable that the Group will not be able to collect all amounts due (or the equivalent value thereof) based on the original contractual terms. Individual credit exposures are evaluated based on the borrower’s overall financial condition, resources and payment record, the prospects of support from contractual guarantors and, where applicable, the realizable value of any collateral. The estimated recoverable amount is the present value, calculated using the claim’s original EIR, of expected future cash flows including amounts that may result from restructuring or the liquidation of collateral. If a loan has a variable interest rate, the discount rate used for calculating the recoverable amount is the current EIR. Impairment is measured and allowances for credit losses are established based on the difference between the carrying amount and the estimated recoverable amount. Upon impairment, the accrual of interest income based on the original terms of the loan is discontinued. The increase in the present value of the impaired loan due to the passage of time is reported as Interest income.
Consolidated financial statements
Notes to the UBS Group AG consolidated financial statements
Note 1 Summary of significant accounting policies (continued)
All impaired loans are reviewed and analyzed at least annually. Any subsequent changes to the amounts and timing of the expected future cash flows compared with prior estimates result in a change in the allowance for credit losses and are charged or credited to Credit loss expense / recovery. An allowance for impairment is reversed only when the credit quality has improved to such an extent that there is reasonable assurance of timely collection of principal and interest in accordance with the original contractual terms of the claim, or the equivalent value thereof. A write-off is made when all or part of a claim is deemed uncollectible or forgiven. Write-offs reduce the principal amount of a claim and are charged against previously established allowances for credit losses or, if no allowance has been established previously, directly to Credit loss expense / recovery. Recoveries, in part or in full, of amounts previously written off are credited to Credit loss expense / recovery.
A loan is classified as non-performing when the payment of interest, principal or fees is overdue by more than 90 days, when insolvency proceedings have commenced, or when obligations have been restructured on preferential terms. Loans are evaluated individually for impairment when amounts have been overdue by more than 90 days, or if other objective evidence indicates that a loan may be impaired.
Collectively: All loans for which no impairment is identified at a counterparty-specific level are grouped on the basis of the Group’s internal credit grading system that considers credit risk characteristics such as asset type, industry, geographical location, collateral type, past-due status and other relevant factors, to collectively assess whether impairment exists within a portfolio. Future cash flows for a group of financial assets that are collectively evaluated for impairment are estimated on the basis of historical loss experience for assets with credit risk characteristics similar to those in the group. Historical loss experience is adjusted on the basis of current observable data to reflect the effects of current conditions of the group of financial assets on which the historical loss experience is based and to remove the effects of conditions in the historical period that do not exist currently in the portfolio. Estimates of changes in future cash flows for the group of financial assets reflect, and are directionally consistent with, changes in related observable data from year to year. The methodology and assumptions used for estimating future cash flows for the group of financial assets are reviewed regularly to reduce any differences between loss estimated and actual loss experience. Allowances for collective impairment assessments are recognized as Credit loss expense / recovery and result in an offset to the aggregated loan position. As the allowance cannot be allocated to individual loans, the loans are not considered to be impaired and interest is accrued on each loan according to its contractual terms. If objective evidence becomes available that indicates that an individual financial asset is impaired, it is removed from the group of financial assets assessed for impairment on a collective basis and is assessed separately as a counterparty-specific claim.▲
Reclassified securities and similar acquired securities carried at amortized cost: Estimated cash flows associated with financial assets reclassified from the held for trading category to loans and receivables in accordance with the requirements in item 10 and other similar assets acquired subsequently are reviewed periodically. Adverse revisions in cash flow estimates related to credit events are recognized in the income statement as Credit loss expense / recovery. For a reclassified loan, a change in expectation regarding the recoverability of the security and its future cash receipts requires an adjustment to the EIR on the loan from the date of change (refer to Note 27c for more information).
® Refer to Note 12 for more information on allowances and provisions for credit losses
12) Securitization structures set up by UBS
Pillar 3 | UBS securitizes certain financial assets, generally selling Trading portfolio assets to SEs that issue securities to investors. UBS applies the policies set out in item 3 in determining whether the respective SE must be consolidated and those set out in item 5 in determining whether derecognition of transferred financial assets is appropriate. The following statements mainly apply to transfers of financial assets that qualify for derecognition.
Gains or losses related to the sale of Trading portfolio assets involving a securitization are recognized when the derecognition criteria are satisfied; the resulting gain or loss is included in Net trading income.
Interests in the securitized financial assets may be retained in the form of senior or subordinated tranches, interest-only strips or other residual interests (retained interests). Retained interests are primarily recorded in Trading portfolio assets and are carried at fair value. Synthetic securitization structures typically involve derivative financial instruments for which the principles set out in item 15 apply.
Note 1 Summary of significant accounting policies (continued)
UBS acts as structurer and placement agent in various mortgage-backed securities (MBS) and other asset-backed securities (ABS) securitizations. In such capacity, UBS may purchase collateral on its own behalf or on behalf of clients during the period prior to securitization. UBS then typically sells the collateral into designated trusts upon closing of the securitization. In other securitizations, UBS may only provide financing to a designated trust in order to fund the purchase of collateral by the trust prior to securitization. Furthermore, UBS underwrites the offerings to investors, earning fees for its placement and structuring services. Consistent with the valuation of similar inventory, fair value of retained tranches is initially and subsequently determined using market price quotations where available or internal pricing models that utilize variables such as yield curves, prepayment speeds, default rates, loss severity, interest rate volatilities and spreads. Where possible, assumptions based on observable transactions are used to determine the fair value of retained interests, but for some interests substantially no observable information is available. ▲
® Refer to Note 30c for more information on the Group’s involvement with securitization vehicles
13) Securities borrowing and lending
Securities borrowing and securities lending transactions are generally entered into on a collateralized basis. In such transactions, UBS typically borrows or lends equity and debt securities in exchange for securities or cash collateral. Additionally, UBS borrows securities from its clients’ custody accounts in exchange for a fee. The transactions are normally conducted under standard agreements employed by financial market participants and are undertaken with counterparties subject to UBS’s normal credit risk control processes. UBS monitors on a daily basis the market value of the securities received or delivered and requests or provides additional collateral or returns or recalls surplus collateral in accordance with the underlying agreements.
Cash collateral received is recognized with a corresponding obligation to return it (Cash collateral on securities lent) and cash collateral delivered is derecognized and a corresponding receivable reflecting UBS’s right to receive it back is recorded (Cash collateral on securities borrowed). The securities which have been transferred are not recognized on, or derecognized from, the balance sheet unless the risks and rewards of ownership are also transferred. Refer to item 5 for more information. UBS-owned securities transferred to a borrower that is granted the right to sell or repledge those transferred securities are presented on the balance sheet as Trading portfolio assets, of which: assets pledged as collateral which may be sold or repledged by counterparties. Securities received in a borrowing transaction are disclosed as off-balance-sheet items if UBS has the right to resell or repledge them, with additional disclosure provided for securities that UBS has actually resold or repledged. The sale of securities which is settled by delivering securities received in a borrowing transaction generally triggers the recognition of a trading liability (short sale). Where securities are either received or delivered in lieu of cash (securities-for-securities transactions), neither the securities received or delivered nor the obligation to return or right to receive the securities are recognized on the balance sheet, as derecognition criteria are not met. Refer to item 5 for more information.
Interest is recognized in the income statement on an accrual basis and is recorded as Interest income or Interest expense. Interest income includes interest earned on securities borrowing, and negative interest, including fees, on securities lending. Interest expense includes interest on securities lent and negative interest, including fees, on securities borrowing.
® Refer to Notes 11, 25 and 26 for more information on securities borrowing and lending
14) Repurchase and reverse repurchase transactions
Securities purchased under agreements to resell (Reverse repurchase agreements) and securities sold under agreements to repurchase (Repurchase agreements) are treated as collateralized financing transactions. Nearly all reverse repurchase and repurchase agreements involve debt instruments, such as bonds, notes or money market paper. The transactions are normally conducted under standard agreements employed by financial market participants and are undertaken with counterparties subject to UBS’s normal credit risk control processes. UBS monitors on a daily basis the market value of the securities received or delivered and requests or provides additional collateral or returns or recalls surplus collateral in accordance with the underlying agreements.
In a reverse repurchase agreement, the cash delivered is derecognized and a corresponding receivable, including accrued interest, is recorded in the balance sheet line Reverse repurchase agreements, representing UBS’s right to receive the cash back. Similarly, in a repurchase agreement, the cash received is recognized and a corresponding obligation, including accrued interest, is recorded in the balance sheet line Repurchase agreements. Securities received under reverse repurchase agreements and securities delivered under repurchase agreements are not recognized on or derecognized from the balance sheet, unless the risks and rewards of ownership are transferred. UBS-owned securities transferred to a recipient who is granted the right to resell or repledge them are presented on the balance sheet as Trading portfolio assets, of which: assets
pledged as collateral which may be sold or repledged by counterparties. Securities received in reverse repurchase agreements are disclosed as off-balance-sheet items if UBS has the right to resell or repledge them, with additional disclosure provided for securities that UBS has actually resold or repledged (refer to Note 25d for more information). Additionally, the sale of securities which is settled by delivering securities received in reverse repurchase transactions generally triggers the recognition of a trading liability (short sale).
Consolidated financial statements
Notes to the UBS Group AG consolidated financial statements
Note 1 Summary of significant accounting policies (continued)
Interest is recognized in the income statement on an accrual basis and is recorded as Interest income or Interest expense. Interest income includes interest earned on reverse repurchase agreements and negative interest on repurchase agreements. Interest expense includes interest on repurchase agreements and negative interest on reverse repurchase agreements.
The Group generally offsets reverse repurchase agreements and repurchase agreements with the same counterparty, maturity, currency and Central Securities Depository (CSD) in accordance with the relevant accounting requirements. Refer to item 35 for more information.
® Refer to Notes 11, 25 and 26 for more information on repurchase and reverse repurchase transactions
15) Derivative instruments and hedge accounting
Derivative instruments that UBS enters into are initially recognized, and remain carried, at fair value. Fair value changes are generally recognized in the income statement unless and to the extent they are designated in hedge relationships which require recognition of the effective portion of such changes within other comprehensive income.
Derivative instruments are generally reported on the balance sheet as Positive replacement values or Negative replacement values. Exchange-traded derivatives that economically settle on a daily basis, and certain OTC derivatives that in substance net settle on a daily basis, are classified as Cash collateral receivables on derivative instruments or Cash collateral payables on derivative instruments. Products that receive this treatment include futures contracts, 100% daily margined exchange-traded options and interest rate swaps transacted with the London Clearing House. Changes in the fair value of derivative instruments are recorded in Net trading income, unless the derivatives are designated and effective as hedging instruments in certain types of hedge accounting relationships.
® Refer to Note 14 for more information on derivative instruments and hedge accounting
Hedge accounting
The Group uses derivative instruments as part of its risk management activities to manage exposures particularly to interest rate and foreign currency risks, including exposures arising from forecast transactions. If derivative and non-derivative instruments meet certain criteria specified below, they may be designated as hedging instruments in hedges of the change in fair value of recognized assets or liabilities (fair value hedges), hedges of the variability in future cash flows attributable to a recognized asset or liability or highly probable forecast transactions (cash flow hedges) or hedges of a net investment in a foreign operation (net investment hedges).
At the time a financial instrument is designated in a hedge relationship, the Group formally documents the relationship between the hedging instrument(s) and hedged item(s), including the risk management objectives and strategy in undertaking the hedge transaction and the methods that will be used to assess the effectiveness of the hedging relationship. Accordingly, the Group assesses, both at the inception of the hedge and on an ongoing basis, whether the hedging instruments, primarily derivatives, have been “highly effective” in offsetting changes in the fair value or cash flows associated with the designated risk of the hedged items. A hedge is considered highly effective if the following criteria are met: (i) at inception of the hedge and throughout its life, the hedge is expected to be highly effective in achieving offsetting changes in fair value or cash flows attributable to the hedged risk and (ii) actual results of the hedge are within a range of 80% to 125%. In the case of hedging forecast transactions, the transaction must have a high probability of occurring and must present an exposure to variations in cash flows that could ultimately affect the reported net profit or loss. The Group discontinues hedge accounting voluntarily, or when the Group determines that a hedging instrument is not, or has ceased to be, highly effective as a hedge, when the derivative expires or is sold, terminated or exercised, when the hedged item matures, is sold or repaid or when forecast transactions are no longer deemed highly probable.
Hedge ineffectiveness represents the amount by which the changes in the fair value of the hedging instrument differ from changes in the fair value of the hedged item attributable to the hedged risk, or the amount by which changes in the present value of future cash flows of the hedging instrument exceed changes in the present value of expected cash flows of the hedged item. Such ineffectiveness is recorded in current period earnings in Net trading income. Interest income and expense on derivatives designated as hedging instruments in effective hedge relationships is included in Interest income.
Fair value hedges
For qualifying fair value hedges, the change in the fair value of the hedging instrument is recognized in the income statement along with the change in the fair value of the hedged item that is attributable to the hedged risk. In fair value hedges of interest rate risk, the fair value change of the hedged item attributable to the hedged risk is reflected in the carrying value of the hedged item. If the hedge accounting relationship is terminated for reasons other than the derecognition of the hedged item, the difference between the carrying value of the hedged item at that point and the value at which it would have been carried had the hedge never existed (the unamortized fair value adjustment) is amortized to the income statement over the remaining term to maturity of the hedged item.
Note 1 Summary of significant accounting policies (continued)
For a portfolio hedge of interest rate risk, the equivalent change in fair value is reflected within Other assets or Other liabilities. If the hedge relationship is terminated for reasons other than the derecognition of the hedged item, the amount included in Other assets or Other liabilities is amortized to the income statement over the remaining term to maturity of the hedged items.
Cash flow hedges
Fair value gains or losses associated with the effective portion of derivatives designated as cash flow hedges for cash flow repricing risk are recognized initially in Other comprehensive income within Equity. When the hedged forecast cash flows affect profit or loss, the associated gains or losses on the hedging derivatives are reclassified from Equity to the income statement.
If a cash flow hedge of forecasted transactions is no longer considered effective, or if the hedge relationship is terminated, the cumulative gains or losses on the hedging derivatives previously reported in Equity remain there until the committed or forecasted transactions occur and affect profit or loss. If the forecasted transactions are no longer expected to occur, the deferred gains or losses are reclassified immediately to the income statement.
Hedges of net investments in foreign operations
Hedges of net investments in foreign operations are accounted for similarly to cash flow hedges. Gains or losses on the hedging instrument relating to the effective portion of the hedge are recognized directly in Equity (and presented in the statement of changes in equity and statement of comprehensive income under Foreign currency translation), while any gains or losses relating to the ineffective and / or undesignated portion (for example, the interest element of a forward contract) are recognized in the income statement. Upon disposal or partial disposal of the foreign operation, the cumulative value of any such gains or losses associated with the entity, and recognized directly in Equity, is reclassified to the income statement.
Economic hedges that do not qualify for hedge accounting
Derivative instruments that are transacted as economic hedges but do not qualify for hedge accounting are treated in the same way as derivative instruments used for trading purposes (i.e., realized and unrealized gains and losses are recognized in Net trading income), except for the forward points on certain short duration foreign exchange contracts, which are reported in Net interest income.
® Refer to Note 14 for more information on economic hedges
Embedded derivatives
Derivatives may be embedded in other financial instruments (host contracts). For example, they could be represented by the conversion feature embedded in a convertible bond. Such hybrid instruments arise predominantly from the issuance of certain structured debt instruments. An embedded derivative is generally required to be separated from the host contract and accounted for as a standalone derivative instrument at fair value through profit or loss if: (i) the host contract is not carried at fair value with changes in fair value reported in the income statement, (ii) the economic characteristics and risks of the embedded derivative are not closely related to the economic characteristics and risks of the host contract and (iii) the terms of the embedded derivative would meet the definition of a standalone derivative were they contained in a separate contract. Bifurcated embedded derivatives are presented on the same balance sheet line as the host contract, and are shown in Note 27a in the Held for trading category, reflecting the measurement and recognition principles applied.
Typically, UBS applies the fair value option to hybrid instruments (refer to item 8 for more information), in which case bifurcation of an embedded derivative component is not required.
16) Loan commitments
Loan commitments are defined amounts (unutilized credit lines or undrawn portions of credit lines) against which clients can borrow money under defined terms and conditions.
Loan commitments that can be cancelled at any time by UBS at its discretion, according to their general terms and conditions, are not recognized on the balance sheet and are not included in the off-balance-sheet disclosures. Upon a loan drawdown by the counterparty, the amount of the loan is accounted for in accordance with Loans and receivables. Refer to item 10 for more information.
Consolidated financial statements
Notes to the UBS Group AG consolidated financial statements
Note 1 Summary of significant accounting policies (continued)
Irrevocable loan commitments (where UBS has no right to withdraw the loan commitment once communicated to the beneficiary, or which are revocable only due to automatic cancellation upon deterioration in a borrower’s creditworthiness) are classified into the following categories:
– derivative loan commitments, being loan commitments that can be settled net in cash or by delivering or issuing another financial instrument, or loan commitments for which there is a past practice of selling those loans resulting from similar loan commitments before or shortly after origination;
– loan commitments designated at fair value through profit and loss (refer to item 8 for more information) and
– all other loan commitments. These are not recorded in the balance sheet, but a provision is recognized if it is probable that a loss has been incurred and a reliable estimate of the amount of the obligation can be made. Other loan commitments include irrevocable forward starting reverse repurchase and irrevocable securities borrowing agreements. Any change in the liability relating to these other loan commitments is recorded in the income statement in Credit loss expense / recovery. Refer to items 11 and 27 for more information.
17) Financial guarantee contracts
Financial guarantee contracts are contracts that require the issuer to make specified payments to reimburse the holder for an incurred loss because a specified debtor fails to make payments when due in accordance with the terms of a specified debt instrument. UBS issues such financial guarantees to banks, financial institutions and other parties on behalf of clients to secure loans, overdrafts and other banking facilities.
Certain written financial guarantees that are managed on a fair value basis are designated at fair value through profit or loss. Refer to item 8 for more information. Financial guarantees that are not managed on a fair value basis are initially recognized in the financial statements at fair value. Subsequent to initial recognition, these financial guarantees are measured at the higher of the amount initially recognized less cumulative amortization, and to the extent a payment under the guarantee has become probable, the present value of the expected payment. Any change in the liability relating to probable expected payments resulting from guarantees is recorded in the income statement in Credit loss expense / recovery.
18) Cash and cash equivalents
For the purposes of the statement of cash flows, cash and cash equivalents comprise balances with an original maturity of three months or less including cash, money market paper and balances with central and other banks.
19) Physical commodities
Physical commodities (precious metals, base metals and other commodities) held by UBS as a result of its broker-trader activities are accounted for at fair value less costs to sell and recognized within Trading portfolio assets. Changes in fair value less costs to sell are recorded in Net trading income.
20) Property, equipment and software
Property, equipment and software includes own-used properties, leasehold improvements, information technology hardware, externally purchased and internally generated software and communication and other similar equipment. All Property, equipment and software is carried at cost (which includes capitalized interest from associated borrowings, where applicable), less accumulated depreciation and impairment losses, and is reviewed periodically for impairment.
® Refer to Note 16 for more information on property and equipment
Leasehold improvements
Leasehold improvements are investments made to customize buildings and offices occupied under operating lease contracts to make them suitable for their intended purpose. The present value of estimated reinstatement costs required to bring a leased property back into its original condition at the end of the lease is capitalized as part of total leasehold improvements with a corresponding liability recognized to reflect the obligation incurred.
Note 1 Summary of significant accounting policies (continued)
Reinstatement costs are recognized in the income statement through depreciation of the capitalized leasehold improvements over their estimated useful lives and the resulting liability is extinguished as cash payments are made.
Property held for sale
Where UBS has decided to sell non-current assets such as property or equipment and the sale of these assets is highly probable to occur within 12 months, these assets are classified as non-current assets held for sale and are reclassified to Other assets. Upon classification as held for sale, they are no longer depreciated and are carried at the lower of book value or fair value less cost to sell.
Software
Software development costs are capitalized only when the costs can be measured reliably and it is probable that future economic benefits will arise.
Estimated useful life of property, equipment and software
An asset within property, equipment and software is depreciated on a straight-line basis over its estimated useful life. Depreciation of an asset within property, equipment and software begins when it is available for use; that is, when it is in the location and condition necessary for it to be capable of operating in the manner intended by management.
Estimated useful life of property, equipment and software
Properties, excluding land | Not exceeding 67 years |
Leasehold improvements | Residual lease term |
Other machines and equipment | Not exceeding 10 years |
IT hardware and communication equipment | Not exceeding 5 years |
Software | Not exceeding 10 years |
21) Goodwill and intangible assets
Goodwill represents the excess of the cost of an acquisition over the fair value of the Group’s share of net identifiable assets of the acquired entity at the date of acquisition. Goodwill is not amortized. It is tested annually for impairment and, additionally, when an indication of impairment exists at the end of each reporting period. For goodwill impairment testing purposes, UBS considers the segments reported in Note 2a as separate cash-generating units, since this is the level at which the performance of investments is reviewed and assessed by management. The recoverable amount of a segment is determined on the basis of its value-in-use.
Intangible assets are comprised of separately identifiable intangible items arising from business combinations and certain purchased trademarks and similar items. Intangible assets are recognized at cost. The cost of an intangible asset acquired in a business combination is its fair value at the date of acquisition. Intangible assets with a definite useful life are amortized using the straight-line method over their estimated useful life, generally not exceeding 20 years. Intangible assets with an indefinite useful life are not amortized. In nearly all cases, identified intangible assets have a definite useful life. At each balance sheet date, intangible assets are reviewed for indications of impairment. If such indications exist, the intangible assets are analyzed to assess whether their carrying amount is fully recoverable. An impairment loss is recognized if the carrying amount exceeds the recoverable amount.
Intangible assets are classified into two categories: (i) infrastructure and (ii) customer relationships, contractual rights and other. Infrastructure consists of a branch network intangible asset recognized in connection with the acquisition of PaineWebber Group, Inc. Client relationships, contractual rights and other includes mainly intangible assets for client relationships, non-compete agreements, favorable contracts, trademarks and trade names acquired in business combinations.
® Refer to Note 17 for more information on goodwill and intangible assets
22) Income taxes
Income tax payable on profits is recognized as an expense based on the applicable tax laws in each jurisdiction in the period in which profits arise. The tax effects of income tax losses available for carry forward are recognized as a deferred tax asset if it is probable that future taxable profit (based on profit forecast assumptions) will be available against which those losses can be utilized.
Deferred tax assets are recognized for temporary differences that will result in deductible amounts in future periods, but only to the extent that it is probable that sufficient taxable profits will be available against which these differences can be utilized. Deferred tax liabilities are recognized for temporary differences between the carrying amounts of assets and liabilities in the balance sheet that reflect the expectation that certain items will give rise to taxable income in future periods. Deferred tax assets and liabilities are measured at the tax rates that are expected to apply in the period in which the asset will be realized or the liability will be settled.
Deferred and current tax assets and liabilities are offset when they arise from the same tax reporting group, they relate to the same tax authority, the legal right to offset exists, and they are intended to be settled net or realized simultaneously.
Consolidated financial statements
Notes to the UBS Group AG consolidated financial statements
Note 1 Summary of significant accounting policies (continued)
Current and deferred taxes are recognized as income tax benefit or expense in the income statement except for current and deferred taxes recognized (i) upon the acquisition of a subsidiary, (ii) for unrealized gains or losses on financial investments that are classified as available-for-sale, for changes in fair value of derivative instruments designated as cash flow hedges, for remeasurements of defined benefit plans, and for certain foreign currency translations of foreign operations, and (iii) for gains and losses on the sale of treasury shares. Deferred taxes recognized in a business combination (point (i)) are considered when determining goodwill. Amounts relating to points (ii) and (iii) are recognized in Other comprehensive income within Equity.
® Refer to Note 8 for more information on income taxes
23) Debt issued
Debt issued is carried at amortized cost. In cases where there is a legal mechanism for write-down or conversion into equity (as is the case for instance with senior unsecured debt issued by the Group that is subject to write-down or conversion under resolution authority granted to FINMA under Swiss law) this is not part of the contractual terms, and, therefore, it does not affect the amortized cost accounting treatment applied to these instruments. If the debt were to be written down or converted into equity in a future period, this would result in the full or partial derecognition of the financial liabilities, with the difference between the carrying value of the debt written down or converted into equity and the fair value of any equity shares issued recognized in the income statement.
In cases where, as part of the Group’s risk management activity, fair value hedge accounting is applied to fixed-rate debt instruments carried at amortized cost, their carrying amount is adjusted for changes in fair value related to the hedged exposure. Refer to item 15 for more information on hedge accounting. In most cases, structured notes issued are designated at fair value through profit or loss using the fair value option, on the basis that they are managed on a fair value basis, that the structured notes contain an embedded derivative, or both. Refer to item 8 for more information on the fair value option. The fair value option is not applied to certain structured notes that contain embedded derivatives that reference foreign exchange rates and / or precious metal prices. For these instruments, the embedded derivative component is measured on a fair value basis and the related underlying debt host component is measured on an amortized cost basis, with both components presented together within Debt issued. Refer to item 15 for more information on embedded derivatives.
Debt issued and subsequently repurchased in relation to market-making or other activities is treated as redeemed. A gain or loss on redemption (depending on whether the repurchase price of the bond is lower or higher than its carrying value) is recorded in Other income. A subsequent sale of own bonds in the market is treated as a reissuance of debt. Interest expense on debt instruments measured at amortized cost is included in Interest on debt issued.
® Refer to Note 21 for more information on debt issued
24) Pension and other post-employment benefit plans
UBS sponsors a number of post-employment benefit plans for its employees worldwide, which include defined benefit and defined contribution pension plans, and other post-employment benefits such as medical and life insurance benefits that are payable after the completion of employment. The major defined benefit pension plans are located in Switzerland, the UK, the US and Germany.
® Refer to Note 28 for more information on pension and other post-employment benefit plans
Defined benefit pension plans
Defined benefit pension plans specify an amount of benefit that an employee will receive, which is usually dependent on one or more factors such as age, years of service and compensation. The defined benefit liability recognized in the balance sheet is the present value of the defined benefit obligation less the fair value of the plan assets at the balance sheet date. If the fair value of the plan assets is higher than the present value of the defined benefit obligation, the recognition of the resulting net defined benefit asset is limited to the present value of economic benefits available in the form of refunds from the plan or reductions in future contributions to the plan. UBS applies the projected unit credit method to determine the present value of its defined benefit obligations, the related current service cost and, where applicable, past service cost. These amounts, which take into account the specific features of each plan, including risk sharing between the employee and employer, are calculated periodically by independent qualified actuaries.
Defined contribution plans
A defined contribution plan is a pension plan under which UBS pays fixed contributions into a separate entity from which post-employment and other benefits are paid. UBS has no legal or constructive obligation to pay further contributions if the plan does not hold sufficient assets to pay employees the benefits relating to employee service in the current and prior periods. UBS’s contributions are expensed when the employees have rendered services in exchange for such contributions. This is generally in the year of contribution. Prepaid contributions are recognized as an asset to the extent that a cash refund or a reduction in future payments is available.
Other post-retirement benefits
UBS also provides post-retirement medical and life insurance benefits to certain retirees in the US and the UK. The expected costs of these benefits are recognized over the period of employment using the same accounting methodology used for defined benefit pension plans.
Note 1 Summary of significant accounting policies (continued)
25) Equity participation and other compensation plans
Equity participation plans
UBS has established several equity participation plans which include mandatory, discretionary and voluntary plans. UBS recognizes the fair value of awards granted under these plans, determined at the date of grant, as compensation expense, over the period during which the employee is required to provide services in order to earn the award.
If the employee is not required to provide future services, such as for awards granted to employees who are retirement eligible, including those employees who meet full career retirement criteria, compensation expense is recognized on or prior to the grant date. Such awards may remain forfeitable until the legal vesting date if certain non-vesting conditions are not met. Forfeiture events resulting from breach of a non-vesting condition do not result in a reversal of compensation expense.
If future service is required, compensation expense is recognized over that future period. For awards that are delivered in tranches, each tranche is considered a separate award and amortized separately. Plans may contain provisions that shorten the required service period due to achievement of retirement eligibility or upon termination due to redundancy. In such instances, compensation expense is recognized over the period from grant date to the retirement eligibility or redundancy date. Forfeiture of these awards that occurs during the service period results in a reversal of compensation expense.
Awards settled in UBS shares are classified as equity settled. The fair value of an equity-settled award is determined at the date of grant and is not subsequently remeasured, unless its terms are modified such that the fair value immediately after modification exceeds the fair value immediately prior to modification. Any increase in fair value resulting from a modification is recognized as compensation expense, either over the remaining service period or, for vested awards, immediately.
Cash-settled awards are classified as liabilities and are remeasured to fair value at each balance sheet date as long as the award is outstanding. Changes in fair value are reflected in compensation expense and, on a cumulative basis, no compensation expense is recognized for awards that expire worthless or remain unexercised.
® Refer to Note 29 for more information on equity participation plans
Other compensation plans
UBS has established other fixed and variable deferred compensation plans, the values of which are not linked to UBS’s own equity. Deferred cash compensation plans are either mandatory or discretionary plans and include awards based on a notional cash amount, where ultimate payout is fixed or may vary based on achievement of performance conditions or the value of specified underlying assets. Compensation expense is recognized over the period that the employee is required to provide services to earn the award. If the employee is not required to provide future services, such as for awards granted to employees who are retirement eligible, including those employees who meet full career retirement criteria, compensation expense is recognized on or prior to the grant date. The amount recognized during the service period is based on an estimate of the amount expected to be paid out under the plan, such that cumulative expense recognized ultimately equals the cash distributed to employees. For awards in the form of alternative investment vehicles or similar structures, which provide employees with a payout based on the value of specified underlying assets, the initial value is based on the fair value at the grant date of the underlying assets (e.g., money market funds, UBS and non-UBS mutual funds and other UBS-sponsored funds). These awards are remeasured at each reporting date based on the fair value of the underlying assets until the award is distributed. Changes in value are recognized proportionately to the elapsed service period. Forfeiture of these awards results in the reversal of compensation expense.
® Refer to Note 29 for more information on other compensation plans
26) Amounts due under unit-linked investment contracts
Financial liabilities from unit-linked investment contracts are presented as Other liabilities on the balance sheet. These contracts allow investors to invest in a pool of assets through issued investment units. The unit holders receive all rewards and bear all risks associated with the reference asset pool. The financial liability represents the amounts due to unit holders and is equal to the fair value of the reference asset pool. Assets held under unit-linked investment contracts are presented as Trading portfolio assets.
® Refer to Notes 13 and 23 for more information on unit-linked investment contracts
27) Provisions
Provisions are liabilities of uncertain timing or amount, and are recognized when UBS has a present obligation as a result of a past event, it is probable that an outflow of resources will be required to settle the obligation, and a reliable estimate of the amount of the obligation can be made.
The majority of UBS’s provisions relate to litigation, regulatory and similar matters, restructuring, employee benefits, real estate and loan commitments and guarantees. Provisions that are similar in nature are aggregated to form a class, while the remaining provisions, including those of less significant amounts are presented under Other provisions. Provisions are presented separately on the balance sheet and, when they are no longer considered uncertain in timing or amount, are reclassified to Other liabilities – Other.
Consolidated financial statements
Notes to the UBS Group AG consolidated financial statements
Note 1 Summary of significant accounting policies (continued)
The Group recognizes provisions for litigation, regulatory and similar matters when, in the opinion of management after seeking legal advice, it is more likely than not that the Group has a present legal or constructive obligation as a result of past events, it is probable that an outflow of resources will be required, and the amount can be reliably estimated. Where these factors are otherwise satisfied, a provision may be established for claims that have not yet been asserted against the Group, but are nevertheless expected to be, based on the Group’s experience with similar asserted claims.
Restructuring provisions are recognized when a detailed and formal restructuring plan has been approved and a valid expectation has been raised that the restructuring will be carried out, either through commencement of the plan or announcements to affected employees.
Provisions are recognized for lease contracts if the unavoidable costs of a contract exceed the benefits expected to be received under it (onerous lease contracts). For example, this may occur when a significant portion of a leased property is expected to be vacant for an extended period.
Provisions for employee benefits are recognized mainly in respect of service anniversaries and sabbatical leave.
Provisions are recognized at the best estimate of the consideration required to settle the present obligation at the balance sheet date. Such estimates are based on all available information and are revised over time as more information becomes available. If the effect of the time value of money is material, provisions are discounted and measured at the present value of the expenditure expected to settle or discharge the obligation, using a rate that reflects the current market assessments of the time value of money and the risks specific to the obligation.
A provision is not recognized when UBS has a present obligation that has arisen from past events but it is not probable that an outflow of resources will be required to settle it, or a sufficiently reliable estimate of the amount of the obligation cannot be made. Instead, a contingent liability is disclosed, unless the likelihood of an outflow of resources is remote. Contingent liabilities are also disclosed for possible obligations that arise from past events whose existence will be confirmed only by uncertain future events not wholly within the control of UBS.
® Refer to Note 22 for more information on provisions
28) Equity, treasury shares and contracts on UBS Group AG shares
Non-controlling interests and preferred noteholders
Net profit and Equity are presented including non-controlling interests and preferred noteholders. Net profit is split into Net profit attributable to UBS Group AG shareholders, Net profit attributable to non-controlling interests and Net profit attributable to preferred noteholders. Equity is split into Equity attributable to UBS Group AG shareholders, Equity attributable to non-controlling interests and Equity attributable to preferred noteholders.
UBS Group AG shares held (treasury shares)
UBS Group AG shares held by the Group are presented in Equity as Treasury shares at their acquisition cost, which includes transaction costs. Treasury shares are deducted from Equity until they are cancelled or reissued. The difference between the proceeds from sales of treasury shares and their weighted average cost (net of tax, if any) is reported as Share premium.
Net cash settlement contracts
Contracts on UBS Group AG shares that require net cash settlement, or provide the counterparty or UBS with a settlement option which includes a choice of settling net in cash, are classified as held for trading, with changes in fair value reported in the income statement as Net trading income.
Contracts with mandatory gross physical settlement
UBS issues contracts with mandatory gross physical settlement in UBS Group AG shares where a fixed amount of shares is exchanged against a fixed amount of cash or another financial asset.
Written put options and forward share purchase contracts with gross physical settlement, including contracts where gross physical settlement is a settlement alternative, result in the recognition of a financial liability booked against Equity. The financial liability is subsequently accreted, using the EIR method, over the life of the contract to the nominal purchase obligation with the amount recognized in Interest expense. Upon settlement of the contract, the liability is derecognized against the consideration paid, and the amount of equity originally recognized as a liability is reclassified within Equity to Treasury shares. The premium received for writing such put options is recognized directly in Share premium.
All other contracts with mandatory gross physical settlement in UBS Group AG shares are presented in Equity as Share premium and accounted for at cost, which is added to or deducted from Equity as appropriate. Upon settlement of such contracts, the difference between the proceeds received and their cost (net of tax, if any) is reported as Share premium.
Note 1 Summary of significant accounting policies (continued)
Preferred notes issued to non-consolidated preferred securities entities
UBS issued subordinated notes (that is, the preferred notes) to certain non-consolidated entities that issued preferred securities. UBS AG has fully and unconditionally guaranteed all contractual payments on the preferred securities. UBS’s obligations under these guarantees are subordinated to the full prior payment of the deposit liabilities of UBS AG and all other liabilities of UBS AG. The preferred notes do not contain a contractual obligation to deliver cash and, therefore, they are classified as equity instruments.
Prior to the share-for-share exchange that took place in 2014, the preferred notes were presented as Equity attributable to preferred noteholders on the consolidated balance sheet and statement of changes in equity of UBS AG. Distributions on these preferred notes were presented as Net profit attributable to preferred noteholders in the consolidated income statement and statement of comprehensive income. Following the share-for-share exchange, these preferred notes are presented as Equity attributable to non-controlling interests on the consolidated balance sheet and statement of changes in equity of UBS Group AG. Future distributions on these preferred notes will be presented as Net profit attributable to non-controlling interests in the consolidated income statement and statement of comprehensive income.
29) Non-current assets and disposal groups held for sale
UBS classifies individual non-current assets and disposal groups as held for sale if such assets or disposal groups are available for immediate sale in their present condition subject to terms that are usual and customary for sales of such assets or disposal groups and their sale is considered highly probable. For a sale to be highly probable, management must be committed to a plan to sell such assets and must be actively looking for a buyer. Furthermore, the assets must be actively marketed at a reasonable sales price in relation to their fair value and the sale must be expected to be completed within one year. Assets held for sale and disposal groups are measured at the lower of their carrying amount and fair value less costs to sell and are presented in Other assets and Other liabilities. Non-current assets and liabilities of subsidiaries are classified as held for sale if their carrying amount will be recovered principally through a sale transaction rather than through continuing use.
® Refer to Notes 18 and 23 for more information on non-current assets and disposal groups held for sale
30) Leasing
UBS enters into lease contracts, or contracts that include lease components, predominantly of premises and equipment, and primarily as lessee. Leases that transfer substantially all the risks and rewards, but not necessarily legal title in the underlying assets, are classified as finance leases. All other leases are classified as operating leases.
Assets leased pursuant to finance leases are recognized on the balance sheet as Property and equipment and are depreciated over the lesser of the useful life of the asset or the lease term, with corresponding amounts payable included in Due to banks / customers. Finance charges payable are recognized in Net interest income over the period of the lease based on the interest rate implicit in the lease on the basis of a constant yield.
Lease contracts classified as operating leases where UBS is the lessee are disclosed in Note 33. These contracts include non-cancellable long-term leases of office buildings in most UBS locations. Operating lease rentals payable are recognized as an expense on a straight-line basis over the lease term, which commences with control of the physical use of the property. Lease incentives are treated as a reduction of rental expense and are recognized on a consistent basis over the lease term.
Where UBS acts as lessor under a finance lease, a receivable is recognized in Loans at an amount equal to the present value of the aggregate of the minimum lease payments plus any unguaranteed residual value that UBS expects to recover at the end of the lease term. Initial direct costs are also included in the initial measurement of the lease receivable. Lease payments received during the lease term are allocated to repayment of the outstanding receivable and interest income to reflect a constant periodic rate of return on UBS’s net investment using the interest rate implicit in the lease. UBS reviews the estimated unguaranteed residual value annually and if the estimated residual value to be realized is less than the amount assumed at lease inception, a loss is recognized for the expected shortfall.
Certain arrangements do not take the legal form of a lease but convey a right to use an asset in return for a payment or series of payments. For such arrangements, UBS determines at the inception of the arrangement whether the fulfillment of the arrangement is dependent on the use of a specific asset or assets and, if so, the arrangement is accounted for as a lease.
® Refer to Note 33 for more information on operating leases and finance leases
Consolidated financial statements
Notes to the UBS Group AG consolidated financial statements
Note 1 Summary of significant accounting policies (continued)
31) Fee income
UBS earns fee income from a diverse range of services it provides to its clients. Fee income can be divided into two broad categories: fees earned from services that are provided over a certain period of time (for example, investment fund fees, portfolio management and advisory fees) and fees earned from providing transaction-type services (for example, underwriting fees, corporate finance fees and brokerage fees). Fees earned from services that are provided over a certain period of time are recognized ratably over the service period, with the exception of performance-linked fees or fee components with specific performance criteria. Such fees are recognized when the performance criteria are fulfilled and when collectability is reasonably assured. Fees earned from providing transaction-type services are recognized when the service has been completed. Generally, fees are presented in the income statement in line with the balance sheet classification of the underlying instruments.
With respect to loan commitment fees on lending arrangements where there is an initial expectation that the facility will be drawn down, such fees are deferred until the loan is drawn down and are then recognized as an adjustment to the effective yield over the life of the loan. If the commitment expires and the loan is not drawn down, the fees are recognized as revenue when the commitment expires. Where the initial expectation is that the facility is unlikely to be drawn down, the loan commitment fees are recognized on a straight-line basis over the commitment period. If, in such cases, the facility is ultimately drawn down, the unamortized component of the loan commitment fees is amortized as an adjustment to the effective yield over the life of the loan.
® Refer to Note 4 for more information on net fee and commission income
32) Foreign currency translation
Transactions denominated in foreign currency are translated into the functional currency of the reporting unit at the spot exchange rate on the date of the transaction. At the balance sheet date, all monetary assets and liabilities denominated in foreign currency are translated to the functional currency using the closing exchange rate. Non-monetary items measured at historical cost are translated at the exchange rate on the date of the transaction. Foreign currency translation differences on financial investments classified as available-for-sale are generally recorded directly in Equity until the asset is sold or becomes impaired. However, translation differences on available-for-sale monetary financial investments are reported in Net trading income, along with all other foreign currency translation differences on monetary assets and liabilities.
Upon consolidation, assets and liabilities of foreign operations are translated into Swiss francs (CHF), UBS’s presentation currency, at the closing exchange rate on the balance sheet date, and income and expense items are translated at the average rate for the period. The resulting foreign currency translation differences attributable to UBS Group AG shareholders are recognized directly in Foreign currency translation within Equity which forms part of Total equity attributable to UBS Group AG shareholders, whereas the foreign currency translation differences attributable to non-controlling interests are shown within Equity attributable to non-controlling interests.
When a foreign operation is disposed or partially disposed of, the cumulative amount in Foreign currency translation within Equity related to that foreign operation is reclassified to the income statement as part of the gain or loss on disposal. When UBS disposes of a portion of its interest in a subsidiary that includes a foreign operation but retains control, the related portion of the cumulative currency translation balance is reclassified to Equity attributable to non-controlling interests. When UBS disposes of a portion of its investment in an associate or joint venture that includes a foreign operation while retaining significant influence or joint control, the related portion of the cumulative currency translation balance is reclassified to the income statement.
® Refer to Note 36 for more information on currency translation rates
33) Earnings per share (EPS)
Basic EPS are calculated by dividing the net profit or loss for the period attributable to ordinary shareholders by the weighted average number of ordinary shares outstanding during the period.
Diluted EPS are calculated using the same method as for basic EPS and adjusting the net profit or loss for the period attributable to ordinary shareholders and the weighted average number of ordinary shares outstanding to reflect the potential dilution that could occur if options, warrants, convertible debt securities or other contracts to issue ordinary shares were converted or exercised into ordinary shares.
® Refer to Note 9 for more information on EPS
34) Segment reporting
UBS‘s businesses are organized globally into five business divisions: Wealth Management, Wealth Management Americas, Personal & Corporate Banking, Asset Management and the Investment Bank, supported by the Corporate Center. The five business divisions qualify as reportable segments for the purpose of segment reporting and, together with the Corporate Center and its components, reflect the management structure of the Group. Additionally, the non-core activities and legacy positions formerly in the Investment Bank are managed and reported as a separate reportable segment within the Corporate Center as Non-core and Legacy Portfolio. Financial information about the five business divisions and the Corporate Center (with its components) is presented separately in internal management reports to the Group Executive Board, which is considered the “chief operating decision maker” within the context of IFRS 8 Operating Segments.
Note 1 Summary of significant accounting policies (continued)
UBS’s internal accounting policies, which include management accounting policies and service level agreements, determine the revenues and expenses directly attributable to each reportable segment. Internal charges and transfer pricing adjustments are reflected in operating results of the reportable segments. Transactions between the reportable segments are carried out at internally agreed rates and are also reflected in the operating results of the reportable segments. Revenue-sharing agreements are used to allocate external client revenues to reportable segments where several reportable segments are involved in the value-creation chain. Commissions are credited to the reportable segments based on the corresponding client relationship. Net interest income is generally allocated to the reportable segments based on their balance sheet positions. Interest income earned from managing UBS’s consolidated equity is allocated to the reportable segments based on average attributed equity. Own credit gains and losses on financial liabilities designated at fair value are excluded from the measurement of performance of the business divisions, are considered reconciling differences to UBS Group results and are reported collectively under Corporate Center – Group Asset and Liability Management (Group ALM).
Assets and liabilities of the reportable segments are funded through and invested with Corporate Center – Group Asset and Liability Management, and the net interest margin is reflected in the results of each reportable segment. Total intersegment revenues for the Group are immaterial as the majority of the revenues are allocated across the segments by means of revenue-sharing agreements.
Segment balance sheet assets are based on a third-party view and do not include intercompany balances. This view is in line with internal reporting to management. Certain assets managed centrally by Corporate Center – Services and Corporate Center – Group Asset and Liability Management (including property and equipment and certain financial assets) may be allocated to the segments on a basis different to that which the corresponding costs and / or revenues are allocated. For example, certain assets that are reported in Corporate Center – Services or Corporate Center – Group Asset and Liability Management may be retained on the balance sheets of these components of Corporate Center notwithstanding that the costs and / or revenues associated with these assets may be entirely or partially allocated to the segments. Similarly, certain assets are reported in the business divisions, whereas the corresponding costs and / or revenues are entirely or partially allocated to Corporate Center – Services and Corporate Center – Group Asset and Liability Management.
For the purpose of segment reporting under IFRS 8, non-current assets consist of investments in associates and joint ventures, goodwill, other intangible assets and property, equipment and software.
® Refer to Note 2 for more information on segment reporting
35) Netting
UBS nets financial assets and liabilities on its balance sheet if it has the unconditional and legally enforceable right to set-off the recognized amounts, both in the normal course of business and in the event of default, bankruptcy or insolvency of the entity and all of the counterparties, and intends either to settle on a net basis, or to realize the asset and settle the liability simultaneously. Netted positions include, for example, over-the-counter interest rate swaps transacted with the London Clearing House, netted by currency and across maturity dates, and repurchase and reverse repurchase transactions entered into with both the London Clearing House and the Fixed Income Clearing Corporation, netted by counterparty, currency, central securities depository and maturity, as well as transactions with various other counterparties, exchanges and clearing houses.
In assessing whether the Group intends to either settle on a net basis, or to realize the asset and settle the liability simultaneously, emphasis is placed on the effectiveness of operational settlement mechanics in eliminating substantially all credit and liquidity exposure between the counterparties. This condition precludes offsetting on the balance sheet for substantial amounts of the Group’s financial assets and liabilities, even though they may be subject to enforceable netting arrangements. For derivative contracts, balance sheet offsetting is generally only permitted in circumstances in which a market settlement mechanism exists via an exchange or clearing house that effectively accomplishes net settlement through a daily cash margining process. For repurchase arrangements and securities financings, balance sheet offsetting may be permitted only to the extent that the settlement mechanism eliminates or results in insignificant credit and liquidity risk.
® Refer to Note 26 for more information on offsetting financial assets and financial liabilities
36) Negative interest
Negative interest income arising on a financial asset does not meet the definition of interest income and therefore negative interest on financial assets and negative interest on financial liabilities is presented within Interest expense and Interest income respectively.
® Refer to Note 3 for more information on interest income and interest expense
Consolidated financial statements
Notes to the UBS Group AG consolidated financial statements
Note 1 Summary of significant accounting policies (continued)
b) Changes in accounting policies, comparability and other adjustments
Statement of cash flows – definition of cash and cash equivalents
In 2015, UBS refined its definition of cash and cash equivalents presented in the statement of cash flows to exclude cash collateral receivables on derivative instruments with bank counterparties. The refined definition is consistent with the treatment of these receivables in UBS’s liquidity and funding management framework and with liquidity and funding regulations, which became effective in 2015, and is considered to result in the presentation of more relevant information.
Comparative period information was restated accordingly. As a result, cash and cash equivalents as of 31 December 2014, 31 December 2013 and 31 December 2012 were reduced by CHF 10,265 million, CHF 8,982 million and CHF 12,393 million, respectively. On a restated basis, cash flow from operating activities for the year ended 31 December 2014 decreased by CHF 1,195 million (2013: increase by CHF 3,415 million) and the gain from effects of exchange rate differences on cash and cash equivalents decreased by CHF 89 million for the same period (2013: loss from currency effects increased by CHF 3 million).
Review of actuarial assumptions used in calculating defined benefit obligations
UBS regularly reviews the actuarial assumptions used in calculating its defined benefit obligations to determine their continuing relevance.
In 2015, UBS carried out a methodology review of the actuarial assumptions used in calculating its defined benefit obligation for its Swiss pension plan. As a result, UBS enhanced its methodology for estimating the discount rate by improving the construction of the yield curve where the market for long tenor maturities of Swiss high-quality corporate bonds was not sufficiently deep. Furthermore, UBS refined its approach to estimating the rate of salary increases, the rate of interest credit on retirement savings, the employee turnover rate, the rate of employee disabilities and the rate of marriage. These improvements in estimates resulted in a total net decrease in the defined benefit obligation (DBO) of the Swiss pension plan of CHF 2.1 billion, of which CHF 1.0 billion related to demographic assumptions and CHF 1.0 billion related to financial assumptions, and a corresponding increase in Other comprehensive income.
Furthermore, UBS enhanced methodologies and refined approaches used to estimate various actuarial assumptions for its UK and other pension plans. These improvements in estimates resulted in a total net decrease in the DBO of the UK pension plan of CHF 0.2 billion, of which CHF 0.1 billion related to demographic assumptions and CHF 0.1 billion related to financial assumptions, and a corresponding increase in Other comprehensive income.
Valuation methodology for the own credit component of financial liabilities designated at fair value
In 2015, UBS made enhancements to its valuation methodology for the own credit component of fair value of financial liabilities designated at fair value. Prior to the fourth quarter of 2015, own credit was estimated using a funds transfer pricing curve (FTP), which was derived by discounting UBS new issuance senior debt curve spreads, with the discount primarily reflecting the differences between the spreads in the senior unsecured debt market for UBS debt and the levels at which UBS medium-term notes (MTN) were issued. A decline in long-dated UBS MTN issuance volumes, following UBS’s business transformation, resulted in a reduction in the observable market data available to benchmark the FTP. From the fourth quarter of 2015 onwards, own credit is estimated using an own credit adjustment curve (OCA), which incorporates more observable market data, including market-observed secondary prices for UBS senior debt, UBS credit default swap (CDS) spreads and senior debt curves of UBS’s peers.
Note 1 Summary of significant accounting policies (continued)
This change in accounting estimate was finalized in the fourth quarter of 2015, following a multi-period implementation project to develop an enhanced fair value approach supported by related infrastructure enhancements. The change was implemented on a prospective basis in the fourth quarter of 2015 and resulted in a gain of CHF 260 million on a total carrying amount of CHF 63 billion in financial liabilities designated at fair value.
Additionally, UBS will early adopt the own credit presentation requirements of IFRS 9 in the first quarter of 2016. No restatement of prior periods is required. Under IFRS 9, changes in the fair value of financial liabilities designated at fair value through profit and loss related to own credit will be recognized in Other comprehensive income and will not be reclassified to the income statement. UBS will adopt the other requirements of IFRS 9 (classification and measurement, impairment and hedge accounting) as of the mandatory effective date in 2018.
Global Asset Management renamed Asset Management
During 2015, the business division Global Asset Management was renamed Asset Management. This change is reflected throughout this report.
Retail & Corporate renamed Personal & Corporate Banking
Effective 2016, the business division Retail & Corporate has been renamed Personal & Corporate Banking. This change is reflected throughout this report.
New structure of the Corporate Center
As of 1 January 2015, Corporate Center – Core Functions was reorganized into two new units, Corporate Center – Services and Corporate Center – Group Asset and Liability Management (Group ALM). Therefore, UBS now reports: (i) Corporate Center – Services, (ii) Corporate Center – Group ALM and (iii) Corporate Center – Non-Core and Legacy Portfolio separately, which enhances the transparency on Corporate Center activities.
Group ALM is responsible for centrally managing the Group’s liquidity and funding position, as well as providing other balance sheet and capital management services to the Group. Most of the income generated and expenses incurred by Group ALM from these activities continues to be allocated to the business divisions and other Corporate Center units. Additional transparency on revenue allocations from Group ALM to business divisions and other Corporate Center units is provided in Note 2. Own credit gains and losses on financial liabilities designated at fair value are presented in Group ALM.
Corporate Center – Services includes the Group’s central control functions and all logistics and support functions serving the business divisions and other Corporate Center units. Most of the expenses of Corporate Center – Services are allocated to the business divisions and other Corporate Center units.
® Refer to Note 2 for more information
Service and personnel allocations from Corporate Center –Services to business divisions and other Corporate Center units
In 2015, UBS revised the presentation of service allocations from Corporate Center – Services to the business divisions and other Corporate Center units to better reflect the economic relation-ship between them. These cost allocations were previously presented within the Personnel expenses, General and administrative expenses and Depreciation and impairment of property, equipment and software line items and are newly presented in the Services (to) / from business divisions and Corporate Center line items. Prior-period information was restated to reflect this change. This change in presentation did not affect total operating expenses or performance before tax of the business divisions and Corporate Center units for any period presented. Similarly, personnel of Corporate Center – Services are no longer allocated to the business divisions and other Corporate Center units. Prior-period information was restated accordingly.
® Refer to Note 2 for more information
Change in segment reporting related to fair value gains and losses on certain internal funding transactions
Consistent with changes in the manner in which operating segment performance is assessed, beginning in 2015, UBS has applied fair value accounting for certain internal funding trans-actions between Corporate Center – Group ALM and the Investment Bank and Corporate Center – Non-core and Legacy Portfolio rather than applying amortized cost accounting. This treatment better aligns with the mark-to-market basis on which these internal transactions are risk managed within the Investment Bank and Corporate Center – Non-core and Legacy Portfolio. The terms of the funding transactions remain otherwise unchanged. Prior periods have been restated to reflect this change. As a result, Investment Bank operating income and performance before tax decreased by CHF 37 million for the year ended 31 December 2014 and by CHF 162 million for the year ended 31 December 2013, with offsetting increases in Corporate Center. This change did not affect the Group’s total operating income or net profit for any period presented.
® Refer to Note 2 for more information
Consolidated financial statements
Notes to the UBS Group AG consolidated financial statements
Note 1 Summary of significant accounting policies (continued)
c) International Financial Reporting Standards and Interpretations to be adopted in 2016 and later and other adjustments
IFRS 9, Financial Instruments
In July 2014, the IASB published the final version of IFRS 9, Financial Instruments. The standard reflects the classification and measurement, impairment and hedge accounting phases of the IASB’s project to replace IAS 39, Financial Instruments: Recognition and Measurement.
The standard requires all financial assets, except equity instruments, to be classified at fair value through profit or loss, fair value through other comprehensive income (OCI) or amortized cost on the basis of the entity’s business model for managing the financial assets and the contractual cash flow characteristics of the financial asset. If a financial asset meets the criteria to be measured at amortized cost or at fair value through OCI, it can be designated at fair value through profit or loss under the fair value option if doing so would significantly reduce or eliminate an accounting mismatch. Equity instruments that are not held for trading may be accounted for at fair value through OCI, with no subsequent reclassification of realized gains or losses to the income statement, while all other equity instruments will be accounted for at fair value through profit or loss.
The accounting guidance for financial liabilities is unchanged with one exception: any gain or loss arising out of a financial liability designated at fair value through profit or loss that is attributable to changes in the credit risk of that liability (own credit) is presented in OCI and not recognized in the income statement. There is no subsequent reclassification of realized gains or losses on own credit from OCI to the income statement.
In addition, the standard introduces a forward-looking expected credit loss impairment model, replacing the incurred loss model of IAS 39. IFRS 9 also incorporates a reformed approach to hedge accounting that introduces substantial changes to hedge effectiveness and eligibility requirements as well as new disclosures. The standard does not explicitly address macro hedge accounting strategies.
The mandatory effective date of the new standard is 1 January 2018, with earlier adoption permitted. Adoption of the IFRS 9 hedge accounting requirements is optional, pending the completion by the IASB of its project on macro hedge accounting strategies.
UBS will adopt the own credit presentation changes in the first quarter of 2016 and is currently assessing the impact of the other requirements of IFRS 9 on its financial statements.
IFRS 15, Revenue from Contracts with Customers
In May 2014, the IASB issued IFRS 15, Revenue from Contracts with Customers, which establishes principles for revenue recognition that apply to all contracts with customers. The standard requires an entity to recognize revenue as goods or services are transferred to the customer in an amount that reflects the consideration to which the entity expects to be entitled to in exchange for those goods or services. It also establishes a cohesive set of disclosure requirements regarding information about the nature, amount, timing and uncertainty of revenue and cash flows from contracts with customers. The standard is effective for UBS reporting periods beginning on 1 January 2018, with early adoption permitted. Entities can choose to apply the standard retrospectively or use a modified approach in the year of adoption. UBS is currently assessing the impact of the new standard on its financial statements.
IFRS 16, Leases
In January 2016, the IASB issued IFRS 16, Leases. The standard substantially changes the accounting by lessees as operating leases previously accounted for as off-balance sheet financing arrangements will be recognized as on-balance sheet liabilities with a corresponding right of use asset also being recorded. The standard replaces IAS 17, Leases and is effective for UBS from 1 January 2019. Early application is permitted for companies that also apply IFRS 15, Revenue from Contracts with Customers. UBS is currently assessing the impact of the new standard on its financial statements. The Group's undiscounted minimum lease payments for operating leases are disclosed in Note 33.
Note 1 Summary of significant accounting policies (continued)
Amendments to IFRS 11, Joint Arrangements; IAS 16, Property, Plant and Equipment and IAS 38, Intangible Assets
In May 2014, the IASB issued amendments to IFRS 11, Joint Arrangements, IAS 16, Property, Plant and Equipment and IAS 38, Intangible Assets. The standard is effective for UBS reporting periods beginning on 1 January 2016. The amendments will have no material impact on the Group’s financial statements. UBS’s joint arrangements are immaterial, both individually and in aggregate (refer to Note 30), and UBS does not use revenue-based depreciation methodologies, which the amendments to IAS 16 and IAS 38 prohibit.
Annual Improvements to IFRSs 2012 – 2014 Cycle
In September 2014, the IASB issued Annual Improvements to IFRSs 2012 – 2014 Cycle that resulted in amendments to four IFRSs (IFRS 5, Non-current asset held for sale and discontinued operations, IFRS 7, Financial Instruments Disclosures, IAS 19, Employee Benefits and IAS 34, Interim Financial Reporting). Generally, the amendments are effective for UBS on 1 January 2016. UBS expects that the adoption of these amendments will not have a material impact on its financial statements.
Amendments to IAS 1, Presentation of Financial Statements
In December 2014, the IASB issued amendments to IAS 1 to further encourage companies to apply professional judgment in determining what information to disclose in their financial statements and in determining where and in what order information is presented in the financial disclosures. The amendments have a mandatory effective date of 1 January 2016 for the Group. The adoption of these amendments will not have a material impact on the Group’s financial statements.
Amendments to IAS 12, Income Taxes
In January 2016, the IASB issued narrow scope amendments to IAS 12, Income Taxes, clarifying how to account for deferred tax assets related to debt instruments measured at fair value. Entities are required to apply the amendments for annual periods beginning on or after 1 January 2017. UBS expects that the adoption of these amendments will not have a material impact on its financial statements.
Amendments to IAS 7, Statement of Cash Flows
In January 2016, the IASB issued amendments to IAS 7, Statement of Cash Flows, which inter-alia requires companies to provide information about changes in their financial liabilities arising from financing activities, including changes from cash flows and non-cash changes (such as foreign exchange gains or losses). Entities are required to apply the amendments for annual periods beginning on or after 1 January 2017.
Consolidated financial statements
Notes to the UBS Group AG consolidated financial statements
Note 2a Segment reporting
The operational structure of the Group is comprised of the Corporate Center and five business divisions: Wealth Management, Wealth Management Americas, Personal & Corporate Banking, Asset Management and the Investment Bank.
Wealth Management
Wealth Management provides comprehensive financial services to wealthy private clients around the world, with the exception of those served by Wealth Management Americas. UBS is a global firm with global capabilities, and its clients benefit from a full spectrum of resources, including wealth planning, investment management solutions and corporate finance advice, banking and lending solutions, as well as a wide range of specific offerings. Wealth Management’s guided architecture model gives clients access to a wide range of products from the world's leading third-party institutions that complement its own products.
Wealth Management Americas
Wealth Management Americas is one of the leading wealth managers in the Americas in terms of financial advisor productivity and invested assets. Its business includes UBS’s domestic US and Canadian wealth management businesses, as well as international business booked in the US. It provides a fully integrated set of wealth management solutions designed to address the needs of ultra high net worth and high net worth clients.
Personal & Corporate Banking
Personal & Corporate Banking provides comprehensive financial products and services to UBS's private, corporate and institutional clients in Switzerland, maintaining a leading position in these segments and embedding its offering in a multi-channel approach. The business is a central element of UBS’s universal bank delivery model in Switzerland, supporting other business divisions by referring clients and growing the wealth of the firm's private clients so they can be transferred to Wealth Management. Personal & Corporate Banking leverages the cross-selling potential of UBS's asset-gathering and investment bank businesses, and manages a substantial part of UBS’s Swiss infrastructure and banking products platform.
Asset Management
Asset Management is a large-scale global asset manager. It offers investment capabilities and investment styles across all major traditional and alternative asset classes to institutions, wholesale intermediaries and wealth management clients around the world.
Investment Bank
The Investment Bank provides corporate, institutional and wealth management clients with expert advice, innovative solutions, execution and comprehensive access to international capital markets. It offers advisory services and provides in-depth cross-asset research, along with access to equities, foreign exchange, precious metals and selected rates and credit markets, through its business units, Corporate Client Solutions and Investor Client Services. The Investment Bank is an active participant in capital markets flow activities, including sales, trading and market-making across a range of securities.
Corporate Center
Corporate Center is comprised of Services, Group Asset and Liability Management (Group ALM) and Non-core and Legacy Portfolio. Services includes the Group’s control functions such as finance, risk control (including compliance) and legal. In addition, it provides all logistics and support services, including operations, information technology, human resources, regulatory relations and strategic initiatives, communications and branding, corporate services, physical security, information security as well as outsourcing, nearshoring and offshoring. Group ALM is responsible for centrally managing the Group’s liquidity and funding position, as well as providing other balance sheet and capital management services to the Group. Non-core and Legacy Portfolio is comprised of the non-core businesses and legacy positions that were part of the Investment Bank prior to its restructuring.
Note 2a Segment reporting (continued)
| | Wealth Management | | Wealth Management Americas | | Personal & Corporate Banking | | Asset Management | | Investment Bank | | Corporate Center | | UBS |
CHF million | | | | | | | | | | | | Services | Group ALM | Non-core and Legacy Portfolio | | |
| | | | | | | | | | | | | | | | |
For the year ended 31 December 2015 | | | | | | | | | | | | |
Net interest income | | 1,825 | | 1,067 | | 1,890 | | (34) | | 1,573 | | (340) | 795 | (44) | | 6,732 |
Non-interest income | | 5,859 | | 6,213 | | 1,603 | | 2,077 | | 7,526 | | 435 | 356 | (79) | | 23,990 |
Allocations from Corporate Center Group ALM to business divisions and other CC units | | 471 | | 104 | | 421 | | 15 | | (211) | | 145 | (876) | (71) | | 0 |
Income¹˒² | | 8,155 | | 7,384 | | 3,913 | | 2,057 | | 8,889 | | 241 | 277 | (195) | | 30,722 |
Credit loss (expense) / recovery | | 0 | | (4) | | (37) | | 0 | | (68) | | 0 | 0 | (8) | | (117) |
Total operating income | | 8,155 | | 7,381 | | 3,877 | | 2,057 | | 8,821 | | 241 | 277 | (203) | | 30,605 |
Personnel expenses | | 2,532 | | 4,579 | | 873 | | 729 | | 3,220 | | 3,903 | 30 | 116 | | 15,981 |
General and administrative expenses | | 637 | | 822 | | 264 | | 232 | | 841 | | 4,483 | 21 | 807 | | 8,107 |
Services (to) / from other business divisions and Corporate Center | | 2,289 | | 1,209 | | 1,077 | | 502 | | 2,817 | | (8,215) | (56) | 378 | | 0 |
of which: services from CC Services | | 2,209 | | 1,193 | | 1,180 | | 523 | | 2,731 | | (8,245) | 95 | 314 | | 0 |
Depreciation and impairment of property, equipment and software | | 5 | | 3 | | 17 | | 2 | | 26 | | 868 | 0 | 0 | | 920 |
Amortization and impairment of intangible assets³ | | 3 | | 51 | | 0 | | 8 | | 24 | | 21 | 0 | 0 | | 107 |
Total operating expenses⁴ | | 5,465 | | 6,663 | | 2,231 | | 1,474 | | 6,929 | | 1,059 | (5) | 1,301 | | 25,116 |
Operating profit / (loss) before tax | | 2,689 | | 718 | | 1,646 | | 584 | | 1,892 | | (818) | 282 | (1,503) | | 5,489 |
Tax expense / (benefit) | | | | | | | | | | | | | | | | (898) |
Net profit / (loss) | | | | | | | | | | | | | | | | 6,386 |
Additional Information | | | | | | | | | | | | | | | | |
Total assets | | 119,850 | | 60,993 | | 141,164 | | 12,874 | | 253,486 | | 22,566 | 237,517 | 94,369 | | 942,819 |
Additions to non-current assets | | 6 | | 4 | | 14 | | 1 | | 18 | | 1,851 | 0 | 1 | | 1,895 |
1 Impairments of financial investments available-for-sale for the year ended 31 December 2015 totaled CHF 1 million, of which CHF 1 million was incurred in Wealth Management. 2 Refer to Note 24 for more information on own credit in Corporate Center Group ALM. 3 Refer to Note 17 for more information. 4 Refer to Note 32 for information on restructuring expenses. |
Consolidated financial statements
Notes to the UBS Group AG consolidated financial statements
Note 2a Segment reporting (continued) 1
| | Wealth Management | | Wealth Management Americas | | Personal & Corporate Banking | | Asset Management | | Investment Bank | | Corporate Center | | UBS |
CHF million | | | | | | | | | | | | Services | Group ALM | Non-core and Legacy Portfolio | | |
| | | | | | | | | | | | | | | | |
For the year ended 31 December 2014 | | | | | | | | | | | | | | |
Net interest income | | 1,693 | | 864 | | 1,801 | | (39) | | 1,583 | | (338) | 816 | 174 | | 6,555 |
Non-interest income | | 5,726 | | 6,004 | | 1,575 | | 1,914 | | 6,823 | | 158 | 307 | (956) | | 21,550 |
Allocations from Corporate Center Group ALM to business divisions and other CC units | | 481 | | 116 | | 461 | | 27 | | (100) | | 217 | (1,120) | (82) | | 0 |
Income²˒³ | | 7,902 | | 6,984 | | 3,836 | | 1,902 | | 8,306 | | 37 | 2 | (863) | | 28,105 |
Credit loss (expense) / recovery | | (1) | | 15 | | (95) | | 0 | | 2 | | 0 | 0 | 2 | | (78) |
Total operating income | | 7,901 | | 6,998 | | 3,741 | | 1,902 | | 8,308 | | 37 | 2 | (862) | | 28,027 |
Personnel expenses | | 2,467 | | 4,363 | | 850 | | 643 | | 2,964 | | 3,843 | 26 | 124 | | 15,280 |
General and administrative expenses | | 918 | | 550 | | 293 | | 305 | | 2,671 | | 4,123 | 21 | 507 | | 9,387 |
Services (to) / from other business divisions and Corporate Center | | 2,180 | | 1,137 | | 1,074 | | 478 | | 2,711 | | (8,046) | (47) | 513 | | 0 |
of which: services from CC Services | | 2,122 | | 1,121 | | 1,196 | | 495 | | 2,658 | | (8,084) | 82 | 411 | | 0 |
Depreciation and impairment of property, equipment and software | | 4 | | 0 | | 17 | | 2 | | 32 | | 762 | 0 | 0 | | 817 |
Amortization and impairment of intangible assets⁴ | | 5 | | 48 | | 0 | | 9 | | 15 | | 6 | 0 | 0 | | 83 |
Total operating expenses⁵ | | 5,574 | | 6,099 | | 2,235 | | 1,435 | | 8,392 | | 688 | 0 | 1,144 | | 25,567 |
Operating profit / (loss) before tax | | 2,326 | | 900 | | 1,506 | | 467 | | (84) | | (652) | 2 | (2,005) | | 2,461 |
Tax expense / (benefit) | | | | | | | | | | | | | | | | (1,180) |
Net profit / (loss) | | | | | | | | | | | | | | | | 3,640 |
Additional Information | | | | | | | | | | | | | | | | |
Total assets | | 127,588 | | 56,026 | | 143,711 | | 15,207 | | 292,347 | | 19,871 | 237,902 | 169,826 | | 1,062,478 |
Additions to non-current assets | | 7 | | 6 | | 9 | | 2 | | 7 | | 1,677 | 0 | 0 | | 1,708 |
1 Figures in this table may differ from those originally published in quarterly and annual reports due to adjustments following organizational changes, restatements due to the retrospective adoption of new accounting standards or changes in accounting policies, and events after the reporting period. Refer to Note 1b for more information. 2 Impairments of financial investments available-for-sale for the year ended 31 December 2014 totaled CHF 76 million, of which CHF 49 million were incurred in the Investment Bank and CHF 23 million were incurred in Corporate Center Non-core and Legacy Portfolio. 3 Refer to Note 24 for more information on own credit in Corporate Center Group ALM. 4 Refer to Note 17 for more information. 5 Refer to Note 32 for information on restructuring expenses. |
Note 2a Segment reporting (continued) 1
| | Wealth Management | | Wealth Management Americas | | Personal & Corporate Banking | | Asset Management | | Investment Bank | | Corporate Center | | UBS |
CHF million | | | | | | | | | | | | Services | Group ALM | Non-core and Legacy Portfolio | | |
| | | | | | | | | | | | | | | | |
For the year ended 31 December 2013 | | | | | | | | | | | | |
Net interest income | | 1,568 | | 742 | | 1,822 | | (44) | | 1,102 | | (388) | 624 | 359 | | 5,786 |
Non-interest income | | 5,519 | | 5,629 | | 1,556 | | 1,954 | | 7,552 | | 347 | (544) | (18) | | 21,997 |
Allocations from Corporate Center Group ALM to business divisions and other CC units | | 486 | | 193 | | 396 | | 23 | | (217) | | 218 | (921) | (179) | | 0 |
Income²˒³ | | 7,573 | | 6,565 | | 3,774 | | 1,935 | | 8,436 | | 178 | (841) | 163 | | 27,782 |
Credit loss (expense) / recovery | | (10) | | (27) | | (18) | | 0 | | 2 | | 0 | 0 | 3 | | (50) |
Total operating income | | 7,563 | | 6,538 | | 3,756 | | 1,935 | | 8,438 | | 178 | (841) | 166 | | 27,732 |
Personnel expenses | | 2,433 | | 4,102 | | 843 | | 609 | | 2,899 | | 4,065 | 26 | 205 | | 15,182 |
General and administrative expenses | | 708 | | 383 | | 297 | | 218 | | 843 | | 4,249 | 14 | 1,668 | | 8,380 |
Services (to) / from other business divisions and Corporate Center | | 2,165 | | 1,145 | | 1,140 | | 521 | | 2,517 | | (8,276) | 3 | 785 | | 0 |
of which: services from CC Services | | 2,074 | | 1,127 | | 1,301 | | 535 | | 2,487 | | (8,304) | 87 | 693 | | 0 |
Depreciation and impairment of property, equipment and software | | 3 | | 0 | | 19 | | 4 | | 28 | | 761 | 0 | 0 | | 816 |
Amortization and impairment of intangible assets⁴ | | 7 | | 49 | | 0 | | 8 | | 13 | | 4 | 0 | 2 | | 83 |
Total operating expenses⁵ | | 5,316 | | 5,680 | | 2,298 | | 1,359 | | 6,300 | | 804 | 43 | 2,660 | | 24,461 |
Operating profit / (loss) before tax | | 2,247 | | 858 | | 1,458 | | 576 | | 2,138 | | (626) | (884) | (2,494) | | 3,272 |
Tax expense / (benefit) | | | | | | | | | | | | | | | | (110) |
Net profit / (loss) | | | | | | | | | | | | | | | | 3,381 |
Additional Information | | | | | | | | | | | | | | | | |
Total assets | | 109,758 | | 45,491 | | 141,369 | | 14,223 | | 239,971 | | 17,203 | 230,204 | 215,135 | | 1,013,355 |
Additions to non-current assets | | 5 | | 1 | | 17 | | 1 | | 81 | | 1,236 | 0 | 0 | | 1,341 |
1 Figures in this table may differ from those originally published in quarterly and annual reports due to adjustments following organizational changes, restatements due to the retrospective adoption of new accounting standards or changes in accounting policies, and events after the reporting period. Refer to Note 1b for more information. 2 Impairments of financial investments available-for-sale for the year ended 31 December 2013 totaled CHF 41 million, of which CHF 10 million was incurred in Wealth Management, CHF 20 million was incurred in the Investment Bank and CHF 8 million was incurred in Corporate Center – Non-core and Legacy Portfolio. 3 Refer to Note 24 for more information on own credit in Corporate Center – Group ALM. 4 Refer to Note 17 for more information. 5 Refer to Note 32 for information on restructuring expenses. |
Consolidated financial statements
Notes to the UBS Group AG consolidated financial statements
Note 2b Segment reporting by geographic location
The operating regions shown in the table below correspond to the regional management structure of the Group. The allocation of operating income to these regions reflects, and is consistent with, the basis on which the business is managed and its performance evaluated. These allocations involve assumptions and judgments that management considers to be reasonable, and may be refined to reflect changes in estimates or management structure. The main principles of the allocation methodology are that client revenues are attributed to the domicile of the client and trading and portfolio management revenues are attributed to the country where the risk is managed. This revenue attribution is consistent with the mandate of the country and regional Presidents. Certain revenues, such as those related to Corporate Center – Non-core and Legacy Portfolio, are managed at a Group level. These revenues are included in the Global line.
The geographic analysis of non-current assets is based on the location of the entity in which the assets are recorded.
For the year ended 31 December 2015 | | | | | | |
| | Total operating income | | Total non-current assets |
| | CHF billion | Share % | | CHF billion | Share % |
Americas | | 11.3 | 37 | | 7.1 | 47 |
of which: USA | | 10.7 | 35 | | 6.7 | 44 |
Asia Pacific | | 5.0 | 16 | | 0.5 | 3 |
Europe, Middle East and Africa | | 6.8 | 22 | | 1.7 | 11 |
Switzerland | | 7.1 | 23 | | 5.9 | 39 |
Global | | 0.5 | 2 | | 0.0 | 0 |
Total | | 30.6 | 100 | | 15.2 | 100 |
| | | | | | |
For the year ended 31 December 2014 | | | | | | |
| | Total operating income | | Total non-current assets |
| | CHF billion | Share % | | CHF billion | Share % |
Americas | | 10.7 | 38 | | 7.0 | 48 |
of which: USA | | 10.1 | 36 | | 6.6 | 45 |
Asia Pacific | | 4.6 | 16 | | 0.4 | 3 |
Europe, Middle East and Africa | | 6.8 | 24 | | 1.5 | 10 |
Switzerland | | 6.8 | 24 | | 5.6 | 38 |
Global | | (0.9) | (3) | | 0.0 | 0 |
Total | | 28.0 | 100 | | 14.6 | 100 |
| | | | | | |
For the year ended 31 December 2013 | | | | | | |
| | Total operating income | | Total non-current assets |
| | CHF billion | Share % | | CHF billion | Share % |
Americas | | 10.2 | 37 | | 6.1 | 46 |
of which: USA | | 9.6 | 35 | | 5.6 | 43 |
Asia Pacific | | 4.5 | 16 | | 0.4 | 3 |
Europe, Middle East and Africa | | 6.6 | 24 | | 1.5 | 11 |
Switzerland | | 6.8 | 25 | | 5.3 | 40 |
Global | | (0.4) | (1) | | 0.0 | 0 |
Total | | 27.7 | 100 | | 13.1 | 100 |
Income statement notes
Note 3 Net interest and trading income
| | For the year ended | | % change from |
CHF million | | 31.12.15 | 31.12.14 | 31.12.13 | | 31.12.14 |
| | | | | | |
Net interest and trading income | | | | | | |
Net interest income | | 6,732 | 6,555 | 5,786 | | 3 |
Net trading income | | 5,742 | 3,842 | 5,130 | | 49 |
Total net interest and trading income | | 12,474 | 10,397 | 10,915 | | 20 |
Wealth Management | | 3,034 | 2,845 | 2,868 | | 7 |
Wealth Management Americas | | 1,537 | 1,352 | 1,323 | | 14 |
Personal & Corporate Banking | | 2,613 | 2,536 | 2,485 | | 3 |
Asset Management | | (5) | 0 | 9 | | |
Investment Bank | | 5,186 | 4,517 | 4,852 | | 15 |
of which: Corporate Client Solutions | | 1,001 | 1,030 | 1,146 | | (3) |
of which: Investor Client Services | | 4,185 | 3,487 | 3,707 | | 20 |
Corporate Center | | 110 | (854) | (622) | | |
of which: Services | | (3) | 34 | (166) | | |
of which: Group ALM | | 426 | 16 | (535) | | |
of which: own credit on financial liabilities designated at fair value¹ | | 553 | 292 | (283) | | 89 |
of which: Non-core and Legacy Portfolio | | (313) | (904) | 79 | | (65) |
Total net interest and trading income | | 12,474 | 10,397 | 10,915 | | 20 |
| | | | | | |
Net interest income | | | | | | |
Interest income | | | | | | |
Interest earned on loans and advances² | | 8,625 | 8,722 | 8,686 | | (1) |
Interest earned on securities financing transactions³ | | 896 | 752 | 852 | | 19 |
Interest and dividend income from trading portfolio | | 3,071 | 3,196 | 2,913 | | (4) |
Interest income on financial assets designated at fair value | | 194 | 208 | 364 | | (7) |
Interest and dividend income from financial investments available-for-sale | | 391 | 315 | 322 | | 24 |
Total | | 13,177 | 13,194 | 13,137 | | 0 |
Interest expense | | | | | | |
Interest on amounts due to banks and customers | | 476 | 708 | 893 | | (33) |
Interest on securities financing transactions⁴ | | 976 | 827 | 829 | | 18 |
Interest expense from trading portfolio⁵ | | 1,670 | 1,804 | 1,846 | | (7) |
Interest on financial liabilities designated at fair value | | 730 | 919 | 1,197 | | (21) |
Interest on debt issued | | 2,592 | 2,382 | 2,586 | | 9 |
Total | | 6,445 | 6,639 | 7,351 | | (3) |
Net interest income | | 6,732 | 6,555 | 5,786 | | 3 |
Net trading income | | | | | | |
Investment Bank Corporate Client Solutions | | 321 | 276 | 425 | | 16 |
Investment Bank Investor Client Services | | 3,494 | 2,760 | 3,541 | | 27 |
Other business divisions and Corporate Center | | 1,928 | 807 | 1,164 | | 139 |
Net trading income | | 5,742 | 3,842 | 5,130 | | 49 |
of which: net gains / (losses) from financial assets designated at fair value | | (127) | (89) | 99 | | 43 |
of which: net gains / (losses) from financial liabilities designated at fair value¹˒⁶ | | 3,701 | (2,380) | (2,056) | | |
1 Refer to Note 24 for more information on own credit. 2 Includes interest income on impaired loans and advances of CHF 16 million for 2015, CHF 15 million for 2014 and CHF 15 million for 2013. 3 Includes interest income on securities borrowed and reverse repurchase agreements and negative interest, including fees, on securities lent and repurchase agreements. 4 Includes interest expense on securities lent and repurchase agreements and negative interest, including fees, on securities borrowed and reverse repurchase agreements. 5 Includes expense related to dividend payment obligations on trading liabilities. 6 Excludes fair value changes of hedges related to financial liabilities designated at fair value and foreign currency translation effects arising from translating foreign currency transactions into the respective functional currency, both of which are reported within net trading income. |
Consolidated financial statements
Notes to the UBS Group AG consolidated financial statements
Note 4 Net fee and commission income
| | For the year ended | | % change from |
CHF million | | 31.12.15 | 31.12.14 | 31.12.13 | | 31.12.14 |
Underwriting fees | | 1,246 | 1,470 | 1,374 | | (15) |
of which: equity underwriting fees | | 836 | 947 | 850 | | (12) |
of which: debt underwriting fees | | 410 | 522 | 524 | | (21) |
M&A and corporate finance fees | | 737 | 731 | 613 | | 1 |
Brokerage fees | | 3,930 | 3,918 | 4,035 | | 0 |
Investment fund fees | | 3,567 | 3,717 | 3,803 | | (4) |
Portfolio management and advisory fees | | 7,858 | 7,343 | 6,625 | | 7 |
Other | | 1,678 | 1,760 | 1,725 | | (5) |
Total fee and commission income | | 19,016 | 18,940 | 18,176 | | 0 |
Brokerage fees paid | | 869 | 818 | 839 | | 6 |
Other | | 1,007 | 1,045 | 1,050 | | (4) |
Total fee and commission expense | | 1,876 | 1,863 | 1,889 | | 1 |
Net fee and commission income | | 17,140 | 17,076 | 16,287 | | 0 |
of which: net brokerage fees | | 3,060 | 3,100 | 3,196 | | (1) |
| | For the year ended | | % change from |
CHF million | | 31.12.15 | 31.12.14 | 31.12.13 | | 31.12.14 |
Associates and subsidiaries | | | | | | |
Net gains / (losses) from disposals of subsidiaries¹ | | 264² | 56 | 111 | | 371 |
Net gains / (losses) from disposals of investments in associates | | 0 | 69 | 0 | | (100) |
Share of net profits of associates | | 169 | 94 | 49 | | 80 |
Total | | 433 | 219 | 160 | | 98 |
Financial investments available-for-sale | | | | | | |
Net gains / (losses) from disposals | | 252 | 219 | 209 | | 15 |
Impairment charges | | (1) | (76) | (41) | | (99) |
Total | | 251 | 143 | 168 | | 76 |
Net income from properties (excluding net gains / (losses) from disposals)³ | | 28 | 30 | 35 | | (7) |
Net gains / (losses) from investment properties⁴ | | (1) | 2 | (16) | | |
Net gains / (losses) from disposals of properties held for sale | | 378 | 44 | 291 | | 759 |
Net gains / (losses) from disposals of loans and receivables | | 26 | 39 | 53 | | (33) |
Other | | (8)⁵ | 155 | (111) | | |
Total other income | | 1,107 | 632 | 580 | | 75 |
1 Includes foreign exchange gains / (losses) reclassified from other comprehensive income related to disposed or dormant subsidiaries. 2 Includes a net gain on sale of subsidiaries of CHF 113 million in Wealth Management and a net gain on sale of subsidiaries of CHF 56 million in Asset Management. Refer to Note 32 for more information. 3 Includes net rent received from third parties and net operating expenses. 4 Includes unrealized and realized gains / (losses) from investment properties and foreclosed assets. 5 Includes a net gain on sale of businesses of CHF 56 million in Wealth Management. Refer to Note 32 for more information. |
Note 6 Personnel expenses
| | For the year ended | | % change from |
CHF million | | 31.12.15 | 31.12.14 | 31.12.13 | | 31.12.14 |
Salaries¹ | | 6,282 | 6,269 | 6,268 | | 0 |
Variable compensation – performance awards² | | 3,210 | 2,820 | 2,986 | | 14 |
of which: guarantees for new hires | | 38 | 48 | 76 | | (21) |
Variable compensation – other² | | 346 | 466 | 288 | | (26) |
of which: replacement payments³ | | 76 | 81 | 78 | | (6) |
of which: forfeiture credits | | (86) | (70) | (146) | | 23 |
of which: severance payments⁴ | | 157 | 162 | 114 | | (3) |
of which: retention plan and other payments | | 198 | 292 | 242 | | (32) |
Contractors | | 365 | 234 | 190 | | 56 |
Social security | | 820 | 791 | 792 | | 4 |
Pension and other post-employment benefit plans⁵ | | 808 | 711 | 887 | | 14 |
Wealth Management Americas: Financial advisor compensation²˒⁶ | | 3,552 | 3,385 | 3,140 | | 5 |
Other personnel expenses | | 600 | 605 | 631 | | (1) |
Total personnel expenses⁷ | | 15,981 | 15,280 | 15,182 | | 5 |
1 Includes role-based allowances. 2 Refer to Note 29 for more information. 3 Replacement payments are payments made to compensate employees for deferred awards forfeited as a result of joining UBS. 4 Includes legally obligated and standard severance payments. 5 Refer to Note 28 for more information. 6 Financial advisor compensation consists of grid-based compensation based directly on compensable revenues generated by financial advisors and supplemental compensation calculated based on financial advisor productivity, firm tenure, assets and other variables. It also includes expenses related to compensation commitments with financial advisors entered into at the time of recruitment which are subject to vesting requirements. 7 Includes net restructuring expenses of CHF 460 million, CHF 327 million and CHF 156 million for the years ended 31 December 2015, 31 December 2014 and 31 December 2013, respectively. Refer to Note 32 for more information. |
Note 7 General and administrative expenses
| | For the year ended | | % change from |
CHF million | | 31.12.15 | 31.12.14 | 31.12.13 | | 31.12.14 |
Occupancy | | 930 | 1,005 | 1,044 | | (7) |
Rent and maintenance of IT and other equipment | | 510 | 479 | 458 | | 6 |
Communication and market data services | | 611 | 608 | 609 | | 0 |
Administration | | 718 | 610 | 638 | | 18 |
Marketing and public relations | | 486 | 468 | 478 | | 4 |
Travel and entertainment | | 460 | 458 | 451 | | 0 |
Professional fees | | 1,354 | 1,306 | 1,032 | | 4 |
Outsourcing of IT and other services | | 1,743 | 1,603 | 1,340 | | 9 |
Provisions for litigation, regulatory and similar matters¹ | | 1,087 | 2,594 | 1,701 | | (58) |
Other | | 208 | 256 | 628 | | (19) |
Total general and administrative expenses² | | 8,107 | 9,387 | 8,380 | | (14) |
1 Reflects the net increase in provisions for litigation, regulatory and similar matters recognized in the income statement. Refer to Note 22 for more information. Also includes recoveries from third parties of CHF 10 million, CHF 10 million and CHF 15 million for the years ended 31 December 2015, 31 December 2014 and 31 December 2013, respectively. 2 Includes net restructuring expenses of CHF 761 million, CHF 319 million and CHF 548 million for the years ended 31 December 2015, 31 December 2014 and 31 December 2013, respectively. Refer to Note 32 for more information. |
Consolidated financial statements
Notes to the UBS Group AG consolidated financial statements
| | For the year ended |
CHF million | | 31.12.15 | 31.12.14 | 31.12.13 |
| | | | |
Tax expense / (benefit) | | | | |
Swiss | | | | |
Current | | 239 | 46 | 93 |
Deferred | | 330 | 1,348 | 455 |
Non-Swiss | | | | |
Current | | 476 | 409 | 342 |
Deferred | | (1,943) | (2,983) | (1,000) |
Total income tax expense / (benefit) | | (898) | (1,180) | (110) |
Income tax expense / (benefit)
The Swiss current tax expense of CHF 239 million related to taxable profits against which no losses were available to offset, mainly earned by Swiss subsidiaries. The Swiss deferred tax expense of CHF 330 million mainly reflected a net decrease of deferred tax assets previously recognized in relation to tax losses carried forward, partially offset by an increase in recognized deferred tax assets related to temporary differences.
The non-Swiss current tax expense of CHF 476 million related to taxable profits earned by non-Swiss subsidiaries and branches, against which no losses were available to offset. The non-Swiss net deferred tax benefit of CHF 1,943 million was primarily due to an increase in US deferred tax assets, reflecting updated profit forecasts and an extension of the relevant taxable profit forecast period used in valuing deferred tax assets. Based on the performance of its businesses and the accuracy of historical forecasts, UBS extended the deferred tax asset forecast period for US taxable profits to seven years from six. In addition, UBS considers other factors in evaluating the recoverability of its deferred tax assets, including the remaining tax loss carry-forward period, and its confidence level in assessing the probability of taxable profit beyond the current forecast period. Estimating future profitability is inherently subjective and is particularly sensitive to future economic, market and other conditions which are difficult to predict.
| | For the year ended |
CHF million | | 31.12.15 | 31.12.14 | 31.12.13 |
Operating profit / (loss) before tax | | 5,489 | 2,461 | 3,272 |
of which: Swiss | | 3,753 | 1,173 | 3,323 |
of which: Non-Swiss | | 1,736 | 1,288 | (51) |
Income taxes at Swiss tax rate of 21% | | 1,153 | 517 | 687 |
Increase / (decrease) resulting from: | | | | |
Non-Swiss tax rates differing from Swiss tax rate | | (73) | 70 | (305) |
Tax effects of losses not recognized | | 107 | 325 | 58 |
Previously unrecognized tax losses now utilized | | (107) | (285) | (419) |
Non-taxable and lower taxed income | | (297) | (384) | (624) |
Non-deductible expenses and additional taxable income | | 541 | 1,069 | 1,245 |
Adjustments related to prior years - current tax | | 29 | 5 | (32) |
Adjustments related to prior years - deferred tax | | (48) | (9) | 6 |
Change in deferred tax valuation allowances | | (2,419) | (2,373) | (859) |
Adjustments to deferred tax balances arising from changes in tax rates | | 190 | (183) | 107 |
Other items | | 27 | 69 | 28 |
Income tax expense / (benefit) | | (898) | (1,180) | (110) |
Note 8 Income taxes (continued)
The components of operating profit before tax, and the differences between income tax expense reflected in the financial statements and the amounts calculated at the Swiss tax rate, are provided in the table on the previous page and explained below.
Non-Swiss tax rates differing from Swiss tax rate
To the extent that Group profits or losses arise outside Switzerland, the applicable local tax rate may differ from the Swiss tax rate. This item reflects, for such profits or losses, an adjustment from the tax expense/benefit that would arise at the Swiss tax rate and the tax expense/benefit that would arise at the applicable local tax rate. If an entity generates a profit, a tax expense arises where the local tax rate is in excess of the Swiss tax rate and a tax benefit arises where the local tax rate is below the Swiss tax rate. Conversely, if an entity incurs a loss, a tax benefit arises where the local tax rate is in excess of the Swiss tax rate and a tax expense arises where the local tax rate is less than the Swiss tax rate.
Tax effects of losses not recognized
This item relates to tax losses of entities arising in the year, which are not recognized as deferred tax assets. Consequently, no tax benefit arises in relation to those losses. Therefore, the tax benefit calculated by applying the local tax rate to those losses as described above is reversed.
Previously unrecognized tax losses now utilized
This item relates to taxable profits of the year, which are offset by tax losses of previous years, for which no deferred tax assets were previously recorded. Consequently, no current tax or deferred tax expense arises in relation to those taxable profits. Therefore, the tax expense calculated by applying the local rate on those profits is reversed.
Non-taxable and lower taxed income
This item relates to profits for the year, which are either permanently not taxable or are taxable, but at a lower rate of tax than the local tax rate. It also includes any permanent deductions made for tax purposes, which are not reflected in the accounts, thereby effectively ensuring that profits covered by the deduction are not taxable.
Non-deductible expenses and additional taxable income
This item mainly relates to income for the year, which is imputed for tax purposes for an entity, but is not included in its operating profit. In addition, it includes expenses for the year which are permanently non-deductible.
Adjustments related to prior years – current tax
This item relates to adjustments to current tax expenses for prior years, for example, if the tax payable for a year agreed with the tax authorities is expected to differ from the amount previously reflected in the accounts.
Adjustments related to prior years – deferred tax
This item relates to adjustments to deferred tax positions recognized in prior years, for example, if a tax loss for a year is fully recognized and the amount of the tax loss agreed with the tax authorities is expected to differ from the amount previously recognized as deferred tax assets in the accounts.
Consolidated financial statements
Notes to the UBS Group AG consolidated financial statements
Note 8 Income taxes (continued)
Change in deferred tax valuation allowances
This item includes revaluations of deferred tax assets previously recognized resulting from reassessments of expected future taxable profits. It also includes changes in temporary differences in the year, for which deferred tax is not recognized. The amount in the year mainly relates to the upward revaluation of deferred tax assets.
Adjustments to deferred tax balances arising from changes in tax rates
This item relates to re-measurements of deferred tax assets and liabilities recognized due to changes in tax rates. These have the effect of changing the future tax saving that is expected from tax losses or deductible tax differences and therefore the amount of deferred tax assets recognized or, alternatively, changing the tax cost of additional taxable income from taxable temporary differences and therefore the deferred tax liability.
Other items
Other items include other differences between profit or losses at the local tax rate and the actual local tax expense or benefit, including increases in provisions for uncertain positions in relation to the current year, interest accruals for such provisions in relation to prior years and other items.
Tax recognized in equity
Certain tax expenses and benefits were recognized directly in equity. These included a tax benefit of CHF 131 million related to cash flow hedges (2014: expense of CHF 196 million), a tax benefit of CHF 8 million related to financial investments classified as available-for-sale (2014: expense of CHF 52 million), a tax expense of CHF 1 million related to foreign currency translation gains and losses (2014: expense of CHF 7 million) and a tax expense of CHF 19 million related to defined benefit plans (2014: benefit of CHF 246 million) recognized in other comprehensive income. In addition, they included a tax benefit of CHF 9 million recognized in share premium (2014: benefit of CHF 3 million). Furthermore, there were net foreign currency translation movements related to the effects of exchange rate changes on tax assets and liabilities denominated in currencies other than Swiss francs.
Deferred tax assets and liabilities
The Group has deferred tax assets related to tax loss carry-forwards and other items as shown in the table below. As of 31 December 2015, deferred tax assets of CHF 2,094 million (CHF 1,378 million as of 31 December 2014) were recognized by entities which incurred losses in either the current or preceding year.
The valuation allowance reflects deferred tax assets which were not recognized because it was not considered probable that future taxable profits will be available to utilize the related tax loss carry-forwards and deductible temporary differences.
CHF million | | | 31.12.15 | | | | 31.12.14 | |
Deferred tax assets¹ | | Gross | Valuation allowance | Recognized | | Gross | Valuation allowance | Recognized |
Tax loss carry-forwards | | 25,471 | (18,378) | 7,093 | | 29,727 | (22,271) | 7,456 |
Temporary differences | | 7,026 | (1,284) | 5,742 | | 4,869 | (1,264) | 3,605 |
of which: related to compensation and benefits | | 1,576 | (267) | 1,310 | | 1,424 | (317) | 1,107 |
of which: related to trading assets | | 1,116 | (77) | 1,038 | | 1,459 | (61) | 1,398 |
of which: related to investments in subsidiaries and goodwill | | 2,310 | 0 | 2,310 | | 0 | 0 | 0 |
of which: other | | 2,023 | (940) | 1,084 | | 1,986 | (886) | 1,100 |
Total deferred tax assets | | 32,497 | (19,661) | 12,835 | | 34,596 | (23,535) | 11,060 |
| | | | | | | | |
Deferred tax liabilities | | | | | | | | |
Goodwill and intangible assets | | | | 28 | | | | 32 |
Financial investments | | | | 1 | | | | 13 |
Investments in associates and other | | | | 27 | | | | 35 |
Total deferred tax liabilities | | | | 56 | | | | 80 |
1 Less deferred tax liabilities as applicable. |
Note 8 Income taxes (continued)
As of 31 December 2015, tax loss carry-forwards totaling CHF 56,973 million (31 December 2014: CHF 68,869 million), which are not recognized as deferred tax assets, were available to be offset against future taxable profits. These tax losses expire as outlined in the table below.
Unrecognized tax loss carry-forwards | | |
CHF million | 31.12.15 | 31.12.14 |
Within 1 year | 3,727 | 9,341 |
From 2 to 5 years | 33 | 43 |
From 6 to 10 years | 753 | 613 |
From 11 to 20 years | 34,833 | 39,899 |
No expiry | 17,627 | 18,973 |
Total | 56,973 | 68,869 |
In general, Swiss tax losses can be carried forward for seven years, US federal tax losses for 20 years and UK and Jersey tax losses for an unlimited period.
The Group recognizes deferred tax liabilities on undistributed earnings of subsidiaries except to the extent that those earnings are indefinitely invested. As of 31 December 2015, no such earnings were considered indefinitely invested.
Consolidated financial statements
Notes to the UBS Group AG consolidated financial statements
Note 9 Earnings per share (EPS) and shares outstanding
| | As of or for the year ended | | % change from |
| | 31.12.15 | 31.12.14 | 31.12.13 | | 31.12.14 |
| | | | | | |
Basic earnings (CHF million) | | | | | | |
Net profit / (loss) attributable to UBS Group AG shareholders | | 6,203 | 3,466 | 3,172 | | 79 |
| | | | | | |
Diluted earnings (CHF million) | | | | | | |
Net profit / (loss) attributable to UBS Group AG shareholders | | 6,203 | 3,466 | 3,172 | | 79 |
Less: (profit) / loss on UBS Group AG equity derivative contracts | | 0 | 0 | 0 | | |
Net profit / (loss) attributable to UBS Group AG shareholders for diluted EPS | | 6,203 | 3,466 | 3,172 | | 79 |
| | | | | | |
Weighted average shares outstanding | | | | | | |
Weighted average shares outstanding for basic EPS | | 3,690,375,879 | 3,720,188,713 | 3,763,076,788 | | (1) |
Effect of dilutive potential shares resulting from notional shares, in-the-money options and warrants outstanding | | 90,898,386 | 85,325,322 | 81,111,217 | | 7 |
Weighted average shares outstanding for diluted EPS | | 3,781,274,265 | 3,805,514,035 | 3,844,188,005 | | (1) |
| | | | | | |
Earnings per share (CHF) | | | | | | |
Basic | | 1.68 | 0.93 | 0.84 | | 81 |
Diluted | | 1.64 | 0.91 | 0.83 | | 80 |
| | | | | | |
Shares outstanding¹ | | | | | | |
Shares issued | | 3,849,731,535 | 3,717,128,324 | 3,842,002,069 | | 4 |
Treasury shares | | 98,706,275 | 87,871,737 | 73,800,252 | | 12 |
Shares outstanding | | 3,751,025,260 | 3,629,256,587 | 3,768,201,817 | | 3 |
Exchangeable shares | | 0 | 0 | 246,042 | | |
Shares outstanding for EPS | | 3,751,025,260 | 3,629,256,587 | 3,768,447,859 | | 3 |
1 As UBS Group AG is considered to be the continuation of UBS AG, UBS AG share information is presented for the comparative period as of 31 December 2013. |
The table below outlines the potential shares which could dilute basic earnings per share in the future, but were not dilutive for the periods presented.
| | | | % change from |
Number of shares | | 31.12.15 | 31.12.14 | 31.12.13 | | 31.12.14 |
| | | | | | |
Potentially dilutive instruments | | | | | | |
Employee share-based compensation awards | | 67,766,835 | 94,335,120 | 117,623,624 | | (28) |
Other equity derivative contracts | | 6,061,848 | 6,728,173 | 16,517,384 | | (10) |
Total | | 73,828,683 | 101,063,293 | 134,141,008 | | (27) |
|
Balance sheet notes: assets
Note 10 Due from banks and loans (held at amortized cost)
CHF million | 31.12.15 | 31.12.14 |
| | |
By type of exposure | | |
Due from banks, gross | 11,951 | 13,347 |
of which: due from central banks | 1,035 | 648 |
Allowance for credit losses | (3) | (13) |
Due from banks, net | 11,948 | 13,334 |
Loans, gross | | |
Residential mortgages | 141,608 | 142,380 |
Commercial mortgages | 21,509 | 22,368 |
Lombard loans | 107,084 | 108,230 |
Other loans¹ | 38,552 | 38,925 |
Finance lease receivables² | 1,083 | 1,101 |
Securities³ | 2,807 | 3,448 |
Subtotal | 312,643 | 316,452 |
Allowance for credit losses | (689) | (695) |
Loans, net | 311,954 | 315,757 |
Total due from banks and loans, net⁴ | 323,902 | 329,091 |
1 Includes corporate loans. 2 Refer to Note 33 for more information. 3 Includes securities reclassified from held for trading. Refer to Note 1a item 10 and Note 27 for more information. 4 Refer to “Maximum exposure to credit risk” in the “Risk management and control” section of this report for information on collateral and credit enhancements. |
Consolidated financial statements
Notes to the UBS Group AG consolidated financial statements
EDTF | Note 11 Cash collateral on securities borrowed and lent, reverse repurchase and repurchase agreements, and derivative instruments
The Group enters into collateralized reverse repurchase and repurchase agreements, securities borrowing and securities lending transactions and derivative transactions that may result in credit exposure in the event that the counterparty to the transaction is unable to fulfill its contractual obligations. The Group manages credit risk associated with these activities by monitoring counterparty credit exposure and collateral values on a daily basis and requiring additional collateral to be deposited with or returned to the Group when deemed necessary.
® Refer to Note 26 for more information on offsetting between financial assets and financial liabilities
Balance sheet assets | | | | | | | | |
| | 31.12.15 | | 31.12.14 |
CHF million | | Cash collateral on securities borrowed | Reverse repurchase agreements | Cash collateral receivables on derivative instruments | | Cash collateral on securities borrowed | Reverse repurchase agreements | Cash collateral receivables on derivative instruments |
By counterparty | | | | | | | | |
Banks | | 8,658 | 12,903 | 6,037 | | 10,517 | 13,746 | 10,265 |
Customers | | 16,925 | 54,991 | 17,727 | | 13,546 | 54,668 | 20,713 |
Total | | 25,584 | 67,893 | 23,763 | | 24,063 | 68,414 | 30,979 |
Balance sheet liabilities | | | | | | | | |
| | 31.12.15 | | 31.12.14 |
CHF million | | Cash collateral on securities lent | Repurchase agreements | Cash collateral payables on derivative instruments | | Cash collateral on securities lent | Repurchase agreements | Cash collateral payables on derivative instruments |
By counterparty | | | | | | | | |
Banks | | 7,078 | 5,637 | 17,041 | | 7,041 | 5,174 | 20,895 |
Customers | | 951 | 4,016 | 21,241 | | 2,138 | 6,644 | 21,477 |
Total | | 8,029 | 9,653 | 38,282 | | 9,180 | 11,818 | 42,372 |
▲
EDTF | Note 12 Allowances and provisions for credit losses
CHF million | | | | | | |
| | | | | | |
By movement | Specific allowances | Collective allowances | Total allowances | Provisions¹ | Total 31.12.15 | Total 31.12.14 |
Balance at the beginning of the year | 704 | 8 | 711 | 23 | 735 | 750 |
Write-offs / usage of provisions | (162) | (2) | (164) | 0 | (164) | (154) |
Recoveries | 48 | 0 | 48 | 0 | 48 | 29 |
Increase / (decrease) recognized in the income statement | 114 | 0 | 114 | 2 | 117 | 78 |
Reclassifications | (9) | 0 | (9) | 9 | 0 | 0 |
Foreign currency translation | (11) | 0 | (11) | 0 | (11) | 21 |
Other | 2 | 0 | 2 | 0 | 2 | 11 |
Balance at the end of the year | 686 | 6 | 692 | 35 | 727 | 735 |
1 Represents provisions for loan commitments and guarantees. Refer to Note 22 for more information. Refer to the "Financial and operating performance" section of this report for the maximum irrevocable amount of loan commitments and guarantees. |
| | | | | | |
By balance sheet line | Specific allowances | Collective allowances | Total allowances | Provisions | Total 31.12.15 | Total 31.12.14 |
Due from banks | 3 | 0 | 3 | | 3 | 13 |
Loans | 683 | 6 | 689 | | 689 | 695 |
Cash collateral on securities borrowed | 0 | 0 | 0 | | 0 | 4 |
Provisions¹ | �� | | | 35 | 35 | 23 |
Balance at the end of the year | 686 | 6 | 692 | 35 | 727 | 735 |
1 Represents provisions for loan commitments and guarantees. |
▲
Consolidated financial statements
Notes to the UBS Group AG consolidated financial statements
Note 13 Trading portfolio
CHF million | 31.12.15 | 31.12.14 |
| | |
Trading portfolio assets by issuer type¹ | | |
Debt instruments | | |
Government and government agencies | 18,768 | 16,625 |
of which: Switzerland | 119 | 293 |
of which: USA | 6,050 | 3,816 |
of which: United Kingdom | 3,915 | 2,103 |
of which: Australia | 1,649 | 2,307 |
of which: Sweden | 1,274 | 191 |
of which: Singapore | 1,259 | 822 |
of which: Germany | 796 | 1,280 |
Banks | 2,691 | 4,342 |
Corporates and other | 19,431 | 24,252 |
Total debt instruments | 40,890 | 45,219 |
Equity instruments | 63,984 | 69,763 |
Financial assets for unit-linked investment contracts | 15,519 | 17,410 |
Financial assets held for trading | 120,393 | 132,392 |
Precious metals and other physical commodities | 3,642 | 5,764 |
Total trading portfolio assets | 124,035 | 138,156 |
| | |
Trading portfolio liabilities by issuer type¹ | | |
Debt instruments | | |
Government and government agencies | 7,257 | 8,716 |
of which: Switzerland | 50 | 232 |
of which: USA | 2,754 | 2,987 |
of which: France | 915 | 1,259 |
of which: Italy | 838 | 569 |
of which: Australia | 798 | 1,087 |
of which: Japan | 725 | 810 |
of which: Germany | 510 | 335 |
Banks | 782 | 743 |
Corporates and other | 2,014 | 2,591 |
Total debt instruments | 10,053 | 12,050 |
Equity instruments | 19,084 | 15,908 |
Total trading portfolio liabilities | 29,137 | 27,958 |
1 Refer to Note 24e for more information on product type and fair value hierarchy categorization. |
Note 14 Derivative instruments and hedge accounting
EDTF | Pillar 3 | Derivatives: overview
A derivative is a financial instrument, the value of which is derived from the value of one or more variables (underlyings). Underlyings may be indices, foreign currency exchange or interest rates, or the value of shares, commodities, bonds or other financial instruments. A derivative commonly requires little or no initial net investment by either counterparty to the trade.
The majority of derivative contracts are negotiated with respect to notional amounts, tenor, price and settlement mechanisms, as is customary with other financial instruments.
Over-the-counter (OTC) derivative contracts are usually traded under a standardized International Swaps and Derivatives Association (ISDA) master agreement between UBS and its counterparties. Terms are negotiated directly with counterparties and the contracts will have industry-standard settlement mechanisms prescribed by ISDA. The industry continues to promote the use of central counterparties (CCPs) to clear OTC trades. The trend toward CCP clearing and settlement will generally facilitate the reduction of systemic credit exposures.
Other derivative contracts are standardized in terms of their amounts and settlement dates, and are bought and sold on regulated exchanges. These are commonly referred to as exchange-traded derivatives (ETD) contracts. Exchanges offer the benefits of pricing transparency, standardized daily settlement of changes in value, and consequently reduced credit risk.
For presentation purposes, the Group is subject to the IFRS netting provisions for derivative contracts. Derivative instruments are measured at fair value and generally classified as Positive replacement values and Negative replacement values on the face of the balance sheet. However, ETD which are economically settled on a daily basis and certain OTC derivatives which are in substance net settled on a daily basis are classified as Cash collateral receivables on derivative instruments or Cash collateral payables on derivative instruments. Changes in the replacement values of derivatives are recorded in Net trading income, unless the derivatives are designated and effective as hedging instruments in certain types of hedge accounting relationships.
® Refer to Note 1a item 15 for more information
Valuation principles and techniques applied in the measurement of derivative instruments are discussed in Note 24. Positive replacement values represent the estimated amount the Group would receive if the derivative contract were sold on the balance sheet date. Negative replacement values indicate the estimated amount the Group would pay to transfer its obligations in respect of the underlying contract, were it required or entitled to do so on the balance sheet date.
Derivatives embedded in other financial instruments are not included in the table “Derivative instruments” within this Note. Bifurcated embedded derivatives are presented on the same balance sheet line as the host contract. In cases where UBS applies the fair value option to hybrid instruments, bifurcation of an embedded derivative component is not required and as such, this component is also not included in the table “Derivative instruments.”
® Refer to Notes 20 and 24 for more information ▲▲
EDTF | Pillar 3 | Types of derivative instruments
The Group uses various derivative financial instruments for both trading and hedging purposes. Through the use of the products listed below, the Group is engaged in extensive high-volume market-making and client facilitation trading referred to as the flow business.
The main types of derivative instruments used by the Group are:
– Swaps: Swaps are transactions in which two parties exchange cash flows on a specified notional amount for a predetermined period. Cross-currency swaps involve the exchange of interest payments based on two different currency notional amounts and reference interest rates and generally also entail exchange of notional amounts at the start or end of the contract. Most cross-currency swaps are traded in the OTC market.
– Forwards and futures: Forwards and futures are contractual obligations to buy or sell financial instruments or commodities on a future date at a specified price. Forward contracts are tailor-made agreements that are transacted between counterparties in the OTC market, whereas futures are standardized contracts transacted on regulated exchanges.
– Options and warrants: Options and warrants are contractual agreements under which, typically, the seller (writer) grants the purchaser the right, but not the obligation, either to buy (call option), or to sell (put option) at, or before, a set date, a specified quantity of a financial instrument or commodity at a predetermined price. The purchaser pays a premium to the seller for this right. Options involving more complex payment structures are also transacted. Options may be traded in the OTC market, or on a regulated exchange, and may be traded in the form of a security (warrant).
Consolidated financial statements
Notes to the UBS Group AG consolidated financial statements
Note 14 Derivative instruments and hedge accounting (continued)
The main derivative product types used by the Group are:
– Interest rate contracts: Interest rate products include interest rate swaps, forward rate agreements, swaptions and caps and floors.
– Credit derivative contracts: Credit default swaps (CDSs) are the most common form of a credit derivative, under which the party buying protection makes one or more payments to the party selling protection in exchange for an undertaking by the seller to make a payment to the buyer following the occurrence of a contractually defined credit event with respect to a specified third-party credit entity. Settlement following a credit event may be a net cash amount, or cash in return for physical delivery of one or more obligations of the credit entity, and is made regardless of whether the protection buyer has actually suffered a loss. After a credit event and settlement, the contract is generally terminated. More information on credit derivatives is included in a separate section on the following pages. Total return swaps (TRSs) are structured with one party making payments based on a set rate, either fixed or variable, plus any negative changes in fair value of an underlying asset, and the other party making payments based on the return of the asset, which includes both income it generates and any positive changes in its fair value.
– Foreign exchange contracts: Foreign exchange contracts include spot, forward and cross-currency swaps and options and warrants. Forward purchase and sale currency contracts are typically executed to meet client needs and for trading and hedging purposes.
– Equity / index contracts: The Group uses equity derivatives linked to single names, indices and baskets of single names and indices. The indices used may be based on a standard market index, or may be defined by UBS. The product types traded include vanilla listed derivatives, both options and futures, total return swaps, forwards and exotic OTC contracts.
– Commodities contracts: The Group has an established commodity derivatives trading business, which includes the commodity index and structured commodities business. The index and structured business are client facilitation businesses trading exchange-traded funds, OTC swaps and options on commodity indices and individual underlying commodities. The underlying indices cover third-party and UBS owned indices such as the UBS Bloomberg Constant Maturity Commodity Index and the Bloomberg Commodity Indices. All of the trading is cash-settled with no physical delivery of the underlying. The Group also has an established precious metals business in both flow and non-vanilla OTC products incorporating both physical and non-physical trading. The flow business is investor led and products include ETD, vanilla and certain non-vanilla OTC. The vanilla OTC are in forwards, swaps and options. ▲▲
Measurement techniques applied to determine the fair value of each derivative product type are described in Note 24.
EDTF | Pillar 3 | Risks of derivative instruments
Derivative instruments are transacted in many trading portfolios, which generally include several types of instruments, not just derivatives. The market risk of derivatives is predominantly managed and controlled as an integral part of the market risk of these portfolios. The Group’s approach to market risk is described in the audited sections of the “Risk management and control” section of this report.
Derivative instruments are transacted with many different counterparties, most of whom are also counterparties for other types of business. The credit risk of derivatives is managed and controlled in the context of the Group’s overall credit exposure to its counterparties. The Group’s approach to credit risk is described in the audited portions of Credit risk in the “Risk management and control” section of this report. It should be noted that, although the positive replacement values shown on the balance sheet can be an important component of the Group’s credit exposure, the positive replacement values for a counterparty are rarely an adequate reflection of the Group’s credit exposure in its derivatives business with that counterparty. This is generally the case because, on the one hand, replacement values can increase over time (potential future exposure), while on the other hand, exposure may be mitigated by entering into master netting agreements and bilateral collateral arrangements. Both the exposure measures used internally by the Group to control credit risk and the capital requirements imposed by regulators reflect these additional factors.
The replacement values presented on UBS’s balance sheet include netting in accordance with IFRS requirements (refer to Note 1a item 35), which is generally more restrictive than netting in accordance with Swiss federal banking law. Swiss federal banking law netting is generally based on close-out netting arrangements that are enforceable in case of insolvency.
® Refer to Note 26 for more information on the values of positive and negative replacement values after consideration of netting potential allowed under enforceable netting arrangements ▲▲
Note 14 Derivative instruments and hedge accounting (continued)
EDTF | Pillar 3 | Derivative instruments¹
| | 31.12.15 | | 31.12.14 |
CHF billion | | Total PRV² | Notional values related to PRVs³ | Total NRV⁴ | Notional values related to NRVs³ | Other notional values³˒⁵ | | Total PRV² | Notional values related to PRVs³ | Total NRV⁴ | Notional values related to NRVs³ | Other notional values³˒⁵ |
Interest rate contracts | | | | | | | | | | | | |
Over-the-counter (OTC) contracts | | | | | | | | | | | | |
Forward contracts⁶ | | 0.1 | 48.6 | 0.2 | 51.9 | 2,351.4 | | 0.1 | 49.0 | 0.2 | 55.9 | 2,622.8 |
Swaps | | 57.0 | 840.1 | 48.2 | 782.0 | 5,904.7 | | 91.8 | 1,323.4 | 83.7 | 1,233.4 | 10,244.3 |
Options | | 17.3 | 581.7 | 19.1 | 549.8 | | | 31.7 | 799.8 | 33.9 | 790.3 | |
Exchange-traded contracts | | | | | | | | | | | | |
Futures | | | | | | 346.0 | | | | | | 446.0 |
Options | | 0.0 | 22.7 | 0.0 | 15.5 | 169.4 | | 0.0 | 15.7 | 0.0 | 4.9 | 134.7 |
Agency transactions⁷ | | 0.1 | | 0.1 | | | | 0.1 | | 0.1 | | |
Total | | 74.5 | 1,493.1 | 67.6 | 1,399.3 | 8,771.4 | | 123.7 | 2,187.9 | 117.9 | 2,084.5 | 13,447.7 |
Credit derivative contracts | | | | | | | | | | | | |
Over-the-counter (OTC) contracts | | | | | | | | | | | | |
Credit default swaps | | 6.1 | 152.7 | 6.0 | 165.7 | | | 11.1 | 238.1 | 11.3 | 245.8 | |
Total return swaps | | 0.6 | 5.0 | 0.6 | 4.1 | | | 0.4 | 3.8 | 0.4 | 5.1 | |
Options and warrants | | 0.0 | 4.2 | 0.0 | 0.1 | | | 0.0 | 6.5 | 0.0 | 1.6 | |
Total | | 6.7 | 161.9 | 6.7 | 169.8 | | | 11.5 | 248.4 | 11.7 | 252.4 | |
Foreign exchange contracts | | | | | | | | | | | | |
Over-the-counter (OTC) contracts | | | | | | | | | | | | |
Forward contracts | | 17.8 | 727.6 | 16.6 | 673.9 | | | 20.6 | 817.6 | 19.2 | 741.4 | |
Interest and currency swaps | | 38.3 | 1,429.9 | 37.6 | 1,330.1 | | | 62.2 | 1,626.3 | 62.3 | 1,554.0 | |
Options | | 9.5 | 496.8 | 9.3 | 478.0 | | | 15.6 | 667.3 | 16.0 | 601.4 | |
Exchange-traded contracts | | | | | | | | | | | | |
Futures | | | | | | 8.1 | | | | | | 14.8 |
Options | | 0.0 | 3.4 | 0.0 | 4.6 | | | 0.0 | 4.9 | 0.1 | 3.7 | |
Agency transactions⁷ | | 0.0 | | 0.0 | | | | 0.0 | | 0.0 | | |
Total | | 65.7 | 2,657.7 | 63.5 | 2,486.6 | 8.1 | | 98.4 | 3,116.2 | 97.6 | 2,900.5 | 14.8 |
Equity / index contracts | | | | | | | | | | | | |
Over-the-counter (OTC) contracts | | | | | | | | | | | | |
Forward contracts | | 0.0 | 0.0 | 0.0 | 0.0 | | | 0.1 | 0.1 | 0.0 | 0.1 | |
Swaps | | 2.9 | 64.1 | 4.3 | 87.0 | | | 3.4 | 58.5 | 4.7 | 70.0 | |
Options | | 4.8 | 59.1 | 6.7 | 92.6 | | | 6.4 | 71.7 | 8.9 | 115.4 | |
Exchange-traded contracts | | | | | | | | | | | | |
Futures | | | | | | 30.0 | | | | | | 27.9 |
Options | | 4.3 | 107.2 | 5.2 | 126.0 | 13.4 | | 4.8 | 109.4 | 4.8 | 124.2 | 10.1 |
Agency transactions⁷ | | 5.0 | | 4.9 | | | | 4.9 | | 4.8 | | |
Total | | 16.9 | 230.3 | 21.2 | 305.6 | 43.3 | | 19.5 | 239.6 | 23.3 | 309.6 | 38.0 |
Table continues on the next page.
Consolidated financial statements
Notes to the UBS Group AG consolidated financial statements
Note 14 Derivative instruments and hedge accounting (continued)
Derivative instruments¹ (continued)
Table continued from the previous page.
| | 31.12.15 | | 31.12.14 |
CHF billion | | Total PRV² | Notional values related to PRVs³ | Total NRV⁴ | Notional values related to NRVs³ | Other notional values³˒⁵ | | Total PRV² | Notional values related to PRVs³ | Total NRV⁴ | Notional values related to NRVs³ | Other notional values³˒⁵ |
Commodity contracts | | | | | | | | | | | | |
Over-the-counter (OTC) contracts | | | | | | | | | | | | |
Forward contracts | | 0.3 | 2.8 | 0.3 | 2.3 | | | 0.3 | 4.6 | 0.3 | 4.4 | |
Swaps | | 0.7 | 9.9 | 0.5 | 9.4 | | | 0.9 | 13.8 | 0.5 | 7.9 | |
Options | | 0.9 | 11.8 | 0.6 | 7.5 | | | 0.9 | 12.5 | 0.7 | 9.8 | |
Exchange-traded contracts | | | | | | | | | | | | |
Futures | | | | | | 8.2 | | | | | | 7.3 |
Forward contracts | | 0.0 | 4.4 | 0.2 | 3.7 | | | 0.0 | 6.5 | 0.1 | 5.3 | |
Options | | 0.0 | 1.0 | 0.1 | 1.9 | 0.1 | | 0.0 | 0.8 | 0.1 | 3.7 | 0.1 |
Agency transactions⁷ | | 1.5 | | 1.5 | | | | 1.4 | | 1.4 | | |
Total | | 3.4 | 30.0 | 3.2 | 24.6 | 8.3 | | 3.6 | 38.1 | 3.2 | 31.1 | 7.3 |
Unsettled purchases of non-derivative financial investments⁸ | | 0.1 | 9.6 | 0.2 | 16.7 | | | 0.1 | 11.4 | 0.2 | 12.9 | |
Unsettled sales of non-derivative financial investments⁸ | | 0.2 | 20.1 | 0.1 | 6.4 | | | 0.2 | 16.1 | 0.1 | 9.1 | |
Total derivative instruments, based on IFRS netting⁹ | | 167.4 | 4,602.7 | 162.4 | 4,409.0 | 8,831.1 | | 257.0 | 5,857.8 | 254.1 | 5,600.2 | 13,507.9 |
1 Bifurcated embedded derivatives are presented on the same balance sheet lines as their host contracts and are excluded from this table. As of 31 December 2015, these derivatives amounted to a PRV of CHF 0.1 billion (related notional values of CHF 0.6 billion) and an NRV of CHF 0.2 billion (related notional values of CHF 3.4 billion). As of 31 December 2014, these derivatives amounted to a PRV of CHF 0.3 billion (related notional values of CHF 6.5 billion) and an NRV of CHF 0.3 billion (related notional values of CHF 7.8 billion). 2 PRV: Positive replacement value. 3 In cases where replacement values are presented on a net basis on the balance sheet, the respective notional values of the netted replacement values are still presented on a gross basis. 4 NRV: Negative replacement value. 5 Other notional values relate to derivatives which are cleared through either a central clearing counterparty or an exchange. The fair value of these derivatives is presented on the balance sheet net of the corresponding cash margin under Cash collateral receivables on derivative instruments and Cash collateral payables on derivative instruments and was not material for the periods presented. 6 Negative replacement values as of 31 December 2015 include CHF 0.1 billion related to derivative loan commitments (31 December 2014: CHF 0.0 billion). No notional amounts related to these replacement values are included the table. The maximum irrevocable amount related to these commitments was CHF 15.8 billion as of 31 December 2015 (31 December 2014: CHF 4.5 billion). 7 Notional values of exchange-traded agency transactions and OTC cleared transactions entered into on behalf of clients are not disclosed due to their significantly different risk profile. 8 Changes in the fair value of purchased and sold non-derivative financial investments between trade date and settlement date are recognized as replacement values. 9 Refer to Note 26 for more information on netting arrangements. |
▲▲
EDTF | The notional amount of a derivative is generally the quantity of the underlying instrument on which the derivative contract is based and is the reference against which changes in the value of the derivative are measured. Notional values, in themselves, are generally not a direct indication of the values which are exchanged between parties, and are therefore not a direct measure of risk or financial exposure, but are viewed as an indication of the scale of the different types of derivatives entered into by the Group.
The maturity profile of OTC interest rate contracts held as of 31 December 2015, based on notional values, was: approximately 53% (31 December 2014: 45%) mature within one year, 29% (31 December 2014: 34%) within one to five years and 18% (31 December 2014: 22%) after five years. Notional values of interest rate contracts cleared with a clearing house that qualify for IFRS balance sheet netting are presented under other notional values and are categorized into maturity buckets on the basis of contractual maturities of the cleared underlying derivative contracts. ▲
EDTF | Derivatives transacted for trading purposes
Most of the Group’s derivative transactions relate to sales and trading activities. Sales activities include the structuring and marketing of derivative products to customers to enable them to take, transfer, modify, or reduce current or expected risks. Trading activities include market-making to directly support the facilitation and execution of client activity. Market-making involves quoting bid and offer prices to other market participants with the intention of generating revenues based on spread and volume.
Credit derivatives
UBS is an active dealer in the fixed income market, including CDS and related products, with respect to a large number of issuers’ securities. The primary purpose of these activities is for the benefit of UBS’s clients through market-making activities and for the ongoing hedging of trading book exposures.
.
Note 14 Derivative instruments and hedge accounting (continued)
Market-making activity, which is undertaken within the Investment Bank, consists of buying and selling single-name CDS, index CDS, loan CDS and related referenced cash instruments to facilitate client trading activity. UBS also actively utilizes CDS to economically hedge specific counterparty credit risks in its accrual and traded loan portfolios (including off-balance sheet loan commitments) with the aim of reducing concentrations in individual names, sectors or specific portfolios.
In addition, UBS actively utilizes CDS to economically hedge specific counterparty credit risks in its OTC derivative portfolios including financial instruments which are designated at fair value through profit or loss.
The tables below provide further details on credit protection bought and sold, including replacement and notional value information by instrument type and counterparty type. The value of protection bought and sold is not, in isolation, a measure of UBS’s credit risk. Counterparty relationships are viewed in terms of the total outstanding credit risk, which relates to other instruments in addition to CDS, and in connection with collateral arrangements in place. On a notional value basis, credit protection bought and sold as of 31 December 2015 matures in a range of approximately 22% (31 December 2014: 27%) within one year, approximately 68% (31 December 2014: 64%) within one to five years and approximately 10% (31 December 2014: 8%) after five years. p
EDTF |
Credit derivatives by type of instrument |
| | Protection bought | | Protection sold |
CHF billion | | Fair value: PRV | Fair value: NRV | Notional values | | Fair value: PRV | Fair value: NRV | Notional values |
Single-name credit default swaps | | 3.1 | 1.9 | 115.5 | | 1.9 | 2.9 | 105.1 |
Multi-name index linked credit default swaps | | 0.3 | 0.6 | 48.0 | | 0.6 | 0.5 | 45.6 |
Multi-name other credit default swaps | | 0.1 | 0.1 | 2.4 | | 0.0 | 0.1 | 1.8 |
Total rate of return swaps | | 0.5 | 0.2 | 6.3 | | 0.1 | 0.4 | 2.8 |
Options and warrants | | 0.0 | 0.0 | 4.2 | | 0.0 | 0.0 | 0.1 |
Total 31 December 2015 | | 4.0 | 2.8 | 176.4 | | 2.6 | 3.9 | 155.3 |
of which: credit derivatives related to economic hedges | | 2.7 | 2.4 | 152.8 | | 2.2 | 2.5 | 132.8 |
of which: credit derivatives related to market-making | | 1.4 | 0.4 | 23.6 | | 0.4 | 1.3 | 22.5 |
| | | | | | | | |
| | Protection bought | | Protection sold |
CHF billion | | Fair value: PRV | Fair value: NRV | Notional values | | Fair value: PRV | Fair value: NRV | Notional values |
Single-name credit default swaps | | 5.9 | 4.0 | 173.3 | | 3.0 | 5.6 | 148.8 |
Multi-name index linked credit default swaps | | 0.4 | 0.9 | 72.8 | | 1.7 | 0.5 | 80.7 |
Multi-name other credit default swaps | | 0.1 | 0.3 | 4.8 | | 0.0 | 0.1 | 3.4 |
Total rate of return swaps | | 0.1 | 0.3 | 5.4 | | 0.3 | 0.2 | 3.5 |
Options and warrants | | 0.0 | 0.0 | 6.5 | | 0.0 | 0.0 | 1.6 |
Total 31 December 2014 | | 6.5 | 5.4 | 262.8 | | 5.0 | 6.3 | 238.0 |
of which: credit derivatives related to economic hedges | | 3.2 | 5.0 | 245.5 | | 4.6 | 3.0 | 220.5 |
of which: credit derivatives related to market-making | | 3.3 | 0.4 | 17.3 | | 0.5 | 3.3 | 17.4 |
▲
Consolidated financial statements
Notes to the UBS Group AG consolidated financial statements
Note 14 Derivative instruments and hedge accounting (continued)
EDTF |
Credit derivatives by counterparty | | |
| | Protection bought | | Protection sold |
CHF billion | | Fair value: PRV | Fair value: NRV | Notional values | | Fair value: PRV | Fair value: NRV | Notional values |
Broker-dealers | | 0.8 | 0.3 | 27.3 | | 0.2 | 0.6 | 19.5 |
Banks | | 1.9 | 1.3 | 78.0 | | 1.2 | 1.6 | 68.3 |
Central clearing counterparties | | 0.4 | 0.8 | 55.3 | | 0.9 | 0.9 | 58.9 |
Other | | 0.8 | 0.4 | 15.8 | | 0.3 | 0.8 | 8.7 |
Total 31 December 2015 | | 4.0 | 2.8 | 176.4 | | 2.6 | 3.9 | 155.3 |
| | | | | | | | |
| | Protection bought | | Protection sold |
CHF billion | | Fair value: PRV | Fair value: NRV | Notional values | | Fair value: PRV | Fair value: NRV | Notional values |
Broker-dealers | | 1.4 | 0.5 | 32.8 | | 0.3 | 1.1 | 23.5 |
Banks | | 4.0 | 2.9 | 156.4 | | 2.6 | 4.4 | 144.3 |
Central clearing counterparties | | 0.2 | 1.1 | 53.2 | | 1.3 | 0.3 | 56.7 |
Other | | 0.9 | 0.9 | 20.4 | | 0.8 | 0.5 | 13.5 |
Total 31 December 2014 | | 6.5 | 5.4 | 262.8 | | 5.0 | 6.3 | 238.0 |
▲
EDTF | Pillar 3 | UBS’s CDS trades are documented using industry standard forms of documentation or equivalent terms documented in a bespoke agreement. The agreements that govern CDS generally do not contain recourse provisions that would enable UBS to recover from third parties any amounts paid out by UBS.
The types of credit events that would require UBS to perform under a CDS contract are subject to agreement between the parties at the time of the transaction. However, nearly all transactions are traded using credit events that are applicable under certain market conventions based on the type of reference entity to which the transaction relates. Applicable credit events by market conventions include bankruptcy, failure to pay, restructuring, obligation acceleration and repudiation / moratorium.
Contingent collateral features of derivative liabilities
Certain derivative payables contain contingent collateral or termination features triggered upon a downgrade of the published credit rating of the Group in the normal course of business. Based on UBS’s credit ratings as of 31 December 2015, contractual outflows related to OTC derivative transactions of approximately CHF 0.2 billion, CHF 1.6 billion and CHF 1.9 billion would have been required in the event of a one-notch, two-notch and three-notch reduction in long-term credit ratings, respectively. In evaluating UBS’s liquidity requirements, UBS considers additional collateral or termination payments that would be required in the event of a reduction in UBS’s long-term credit ratings, and a corresponding reduction in short-term ratings. ▲▲
EDTF | Derivatives transacted for hedging purposes
Derivatives used for structural hedging
The Group enters into derivative transactions for the purposes of hedging risks inherent in assets, liabilities and forecast transactions. The accounting treatment of hedge transactions varies according to the nature of the instrument hedged and whether the hedge qualifies as such for accounting purposes.
Derivative transactions that qualify and are designated as hedges for accounting purposes are described under the corresponding headings in this Note (fair value hedges, cash flow hedges and hedges of net investments in foreign operations). The Group’s accounting policies for derivatives designated and accounted for as hedging instruments are explained in Note 1a item 15, where terms used in the following sections are explained.
The Group has also entered into various hedging strategies utilizing derivatives for which hedge accounting has not been applied. These include interest rate swaps and other interest rate derivatives (e.g., futures) for day-to-day economic interest rate risk management purposes. In addition, the Group has used equity futures, options and, to a lesser extent, swaps for economic hedging in a variety of equity trading strategies to offset underlying equity and equity volatility exposure. The Group has also entered into CDS that provide economic hedges for credit risk exposures (refer to the credit derivatives section of this Note). Fair value changes of derivatives that are part of economic relationships, but do not qualify for hedge accounting treatment, are reported in Net trading income, except for the forward points on certain short duration foreign exchange contracts, which are reported in Net interest income.
Note 14 Derivative instruments and hedge accounting (continued)
Fair value hedges: interest rate risk related to debt instruments
The Group’s fair value hedges principally consist of interest rate swaps that are used to protect against changes in the fair value of fixed-rate debt instruments, such as non-structured fixed-rate bonds, covered bonds and subordinated debt, due to movements in market interest rates. The fair values of outstanding interest rate derivatives designated as fair value hedges were assets of CHF 1,656 million and liabilities of CHF 11 million as of 31 December 2015 and assets of CHF 2,236 million and liabilities of CHF 37 million as of 31 December 2014.
EDTF |
Fair value hedges of interest rate risk | | | | |
| | For the year ended |
CHF million | | 31.12.15 | 31.12.14 | 31.12.13 |
Gains / (losses) on hedging instruments | | 554 | 1,113 | (1,123) |
Gains / (losses) on hedged items attributable to the hedged risk | | (552) | (1,111) | 1,116 |
Net gains / (losses) representing ineffective portions of fair value hedges | | 2 | 2 | (7) |
▲
Fair value hedges: portfolio interest rate risk related to loans
The Group also applies fair value hedge accounting to mortgage loan portfolio interest rate risk. The change in fair value of the hedged items is recorded separately from the hedged item and is included within Other assets on the balance sheet. The fair values of outstanding interest rate derivatives designated for these hedges as of 31 December 2015 were assets of CHF 7 million and liabilities of CHF 327 million (31 December 2014: liabilities of CHF 256 million).
EDTF |
Fair value hedge of portfolio of interest rate risk | | | | |
| | For the year ended |
CHF million | | 31.12.15 | 31.12.14 | 31.12.13 |
Gains / (losses) on hedging instruments | | (176) | (694) | 636 |
Gains / (losses) on hedged items attributable to the hedged risk | | 147 | 676 | (625) |
Net gains / (losses) representing ineffective portions of fair value hedges | | (29) | (18) | 11 |
▲
Cash flow hedges of forecasted transactions
The Group is exposed to variability in future interest cash flows on non-trading financial assets and liabilities that bear interest at variable rates or are expected to be refinanced or reinvested in the future. The amounts and timing of future cash flows, representing both principal and interest flows, are projected based on contractual terms and other relevant factors including estimates of prepayments and defaults. The aggregate principal balances and interest cash flows across all portfolios over time form the basis for identifying the non-trading interest rate risk of the Group, which is hedged with interest rate swaps, the maximum maturity of which is 13 years. The table on the following page shows forecasted principal balances on which expected interest cash flows arise as of 31 December 2015. Amounts shown represent, by time bucket, average assets and liabilities subject to forecasted cash flows designated as hedged items in cash flow hedge accounting relationships.
As of 31 December 2015, the fair values of outstanding derivatives designated as cash flow hedges of forecasted transactions were CHF 2,176 million assets and CHF 195 million liabilities (31 December 2014: CHF 4,521 million assets and CHF 1,262 million liabilities).
In 2015, a gain of CHF 150 million was recognized in Net trading income due to hedge ineffectiveness, compared with a gain of CHF 87 million in 2014 and a loss of CHF 80 million in 2013.
Consolidated financial statements
Notes to the UBS Group AG consolidated financial statements
Note 14 Derivative instruments and hedge accounting (continued)
EDTF |
Principal balances subject to cash flow forecasts | | | | | |
CHF billion | Within 1 year | 1–3 years | 3–5 years | 5–10 years | Over 10 years |
Assets | 61 | 81 | 48 | 54 | 1 |
Liabilities | 4 | 7 | 3 | 3 | 0 |
Net balance | 57 | 74 | 45 | 51 | 1 |
▲
Hedges of net investments in foreign operations
The Group applies hedge accounting for certain net investments in foreign operations. As of 31 December 2015, the positive replacement values and negative replacement values of FX derivatives (mainly FX swaps) designated as hedging instruments in net investment hedge accounting relationships were CHF 170 million and CHF 79 million, respectively (31 December 2014: positive replacement values of CHF 158 million and negative replacement values of CHF 305 million). As of 31 December 2015, the underlying hedged structural exposures in several currencies amounted to CHF 5.5 billion (31 December 2014: CHF 8.0 billion).
Hedges of structural FX exposures in currencies other than the US dollar may be comprised of two jointly designated derivatives as the foreign currency risk may be hedged against the US dollar first and then converted into Swiss francs, the presentation currency of the Group, as part of a separate FX derivative transaction. The aggregated notional amount of designated hedging derivatives as of 31 December 2015 was CHF 11.2 billion in total (31 December 2014: CHF 14.7 billion) including CHF 5.6 billion notional values related to US dollar versus Swiss franc swaps and CHF 5.6 billion notional values related to derivatives hedging foreign currencies (other than the US dollar) versus the US dollar. The effective portion of gains and losses of these FX swaps is transferred directly to OCI to offset foreign currency translation (FCT) gains and losses on the net investments in foreign branches and subsidiaries. As such, these FX swaps hedge the structural FX exposure resulting in the accumulation of FCT on the level of individual foreign branches and subsidiaries and hence on the total FCT OCI of the Group.
UBS designates certain non-derivative foreign currency financial assets and liabilities of foreign branches or subsidiaries as hedging instruments in net investment hedge accounting arrangements. The FX translation difference recorded in FCT OCI of the non-derivative hedging instrument of one foreign entity offsets the structural FX exposure of another foreign entity. Therefore, the aggregated FCT OCI of the Group is unchanged from this hedge designation. As of 31 December 2015, the nominal amount of non-derivative financial assets and liabilities designated as hedging instruments in such net investment hedges was CHF 3.1 billion and CHF 3.1 billion, respectively (31 December 2014: CHF 14.3 billion non-derivative financial assets and CHF 14.3 billion non-derivative financial liabilities).
Ineffectiveness of hedges of net investments in foreign operations was not material in 2015, 2014 and 2013.
Undiscounted cash flows
The table below provides undiscounted cash flows of all derivative instruments designated in hedge accounting relationships. Interest rate swap cash flows include cash inflows and cash outflows of all interest rate swaps designated in hedge accounting relationships, which are either assets or liabilities of UBS as of 31 December 2015. The table includes derivatives traded on an exchange or through a clearing house where the change in fair value is settled each day, either in fact or in substance, through cash payment of variation margin. ▲
EDTF |
Derivatives designated in hedge accounting relationships (undiscounted cash flows) |
CHF billion | On demand | Due within 1 month | Due between 1 and 3 months | Due between 3 and 12 months | Due between 1 and 5 years | Due after 5 years | Total |
Interest rate swaps¹ | | | | | | | |
Cash inflows | 0 | 0 | 0 | 2 | 4 | 2 | 8 |
Cash outflows | 0 | 0 | 0 | 1 | 3 | 1 | 5 |
FX swaps / forwards | | | | | | | |
Cash inflows | 0 | 7 | 3 | 0 | 0 | 0 | 10 |
Cash outflows | 0 | 7 | 3 | 0 | 0 | 0 | 10 |
Net cash flows | 0 | 0 | 0 | 1 | 2 | 0 | 3 |
1 The table includes gross cash inflows and cash outflows of all interest rate swaps designated in hedge accounting relationships, which are either assets or liabilities of UBS as of 31 December 2015. |
▲
Note 15 Financial investments available-for-sale
CHF million | 31.12.15 | 31.12.14 |
| | |
Financial investments available-for-sale by issuer type¹ | | |
Debt instruments | | |
Government and government agencies | 47,245 | 45,334 |
of which: Switzerland | 702 | 43 |
of which: USA | 21,424 | 17,219 |
of which: Germany | 8,583 | 10,145 |
of which: France | 3,566 | 5,351 |
of which: Netherlands | 2,934 | 2,528 |
of which: United Kingdom | 2,782 | 2,348 |
Banks | 12,268 | 8,490 |
Corporates and other | 2,385 | 2,670 |
Total debt instruments | 61,898 | 56,494 |
Equity instruments | 645 | 664 |
Total financial investments available-for-sale | 62,543 | 57,159 |
Unrealized gains – before tax | 462 | 430 |
Unrealized (losses) – before tax | (171) | (64) |
Net unrealized gains / (losses) – before tax | 291 | 365 |
Net unrealized gains / (losses) – after tax | 167 | 238 |
1 Refer to Note 24e for more information on product type and fair value hierarchy categorization. |
Consolidated financial statements
Notes to the UBS Group AG consolidated financial statements
Note 16 Property, equipment and software
At historical cost less accumulated depreciation |
CHF million | Own-used properties | Leasehold improvements | IT hardware and communication | Internally generated software | Purchased software | Other machines and equipment | Projects in progress | 31.12.15 | 31.12.14 |
Historical cost | | | | | | | | | |
Balance at the beginning of the year | 7,756 | 3,060 | 2,377 | 1,525 | 536 | 847 | 1,341 | 17,442 | 16,136 |
Additions | 68 | 50 | 264 | 26 | 85 | 28 | 1,331 | 1,853 | 1,690 |
Disposals / write-offs¹ | (181) | (87) | (747) | (54) | (209) | (27) | 0 | (1,306) | (518) |
Reclassifications | 221 | 197 | 22 | 888 | 9 | 27 | (1,394) | (32)⁶ | (359) |
Foreign currency translation | 0 | (37) | (39) | (9) | (9) | (8) | (7) | (109) | 493 |
Balance at the end of the year | 7,863 | 3,183 | 1,878 | 2,375 | 412 | 866 | 1,270 | 17,847 | 17,442 |
Accumulated depreciation | | | | | | | | | |
Balance at the beginning of the year | 4,365 | 2,120 | 1,976 | 1,089 | 452 | 592 | 0 | 10,593 | 10,140 |
Depreciation | 161 | 181 | 228 | 230 | 41 | 62 | 0 | 903 | 799 |
Impairment² | 2 | 10 | 1 | 3 | 0 | 1 | 0 | 18 | 19 |
Disposals / write-offs¹ | (157) | (78) | (744) | (46) | (209) | (26) | 0 | (1,260) | (474) |
Reclassifications | (11) | 2 | (2) | 0 | 2 | (14) | 0 | (23)⁶ | (217) |
Foreign currency translation | (3) | (25) | (35) | (1) | (8) | (6) | 0 | (78) | 326 |
Balance at the end of the year | 4,356 | 2,211 | 1,425 | 1,275 | 276 | 609 | 0 | 10,153 | 10,593 |
Net book value at the end of the year³˒⁴ | 3,506 | 973 | 453 | 1,100 | 135 | 257 | 1,270⁵ | 7,695 | 6,849⁷ |
1 Includes write-offs of fully depreciated assets. 2 Impairment charges recorded in 2015 relate to assets for which the recoverable amount was determined based on value-in-use (recoverable amount of the impaired assets: CHF 0 million Leasehold improvements, CHF 2 million Internally generated software). 3 As of 31 December 2015, contractual commitments to purchase property in the future amounted to approximately CHF 0.6 billion. 4 Includes CHF 47 million related to leased assets, mainly IT hardware and communication. 5 Includes CHF 928 million related to Internally generated software, CHF 86 million related to Own-used properties and CHF 257 million related to Leasehold improvements. 6 Reflects reclassifications to Properties held-for-sale (CHF 9 million on a net basis) reported within Other assets. 7 Excludes investment properties of CHF 5 million. |
Note 17 Goodwill and intangible assets
Introduction
UBS performs an impairment test on its goodwill assets on an annual basis, or when indicators of impairment exist. UBS considers the segments, as reported in Note 2, as separate cash-generating units (CGU). The impairment test is performed for each segment to which goodwill is allocated by comparing the recoverable amount, based on its value-in-use, to the carrying amount of the respective segment. An impairment charge is recognized if the carrying amount exceeds the recoverable amount. As of 31 December 2015, total goodwill recognized on the balance sheet was CHF 6.2 billion, of which CHF 1.3 billion, CHF 3.5 billion and CHF 1.4 billion was carried by Wealth Management, Wealth Management Americas and Asset Management, respectively. Based on the impairment testing methodology described below, UBS concluded that the goodwill balances as of 31 December 2015 allocated to these segments remain recoverable and thus were not impaired.
Methodology for goodwill impairment testing
The recoverable amounts are determined using a discounted cash flow model, which has been adapted to use inputs that consider features of the banking business and its regulatory environment. The recoverable amount of a segment is the sum of the discounted earnings attributable to shareholders from the first three forecasted years and the terminal value. The terminal value, which covers all periods beyond the third year, is calculated on the basis of the forecast of third-year profit, the discount rate and the long-term growth rate and is adjusted for the effect of the capital assumed to be needed to support the perpetual growth implied by the long-term growth rate.
The carrying amount for each segment is determined by reference to the Group’s equity attribution framework. Within this framework, which is described in the “Capital management” section of this report, the Board of Directors (BoD) attributes equity to the businesses after considering their risk exposure, risk-weighted assets and leverage ratio denominator usage, goodwill and intangible assets. The total amount of equity attributed to the business divisions can differ from the Group’s actual equity during a given period. The framework is primarily used for purposes of measuring the performance of the businesses and includes certain management assumptions. Attributed equity equals the capital that a segment requires to conduct its business and is considered an appropriate starting point from which to determine the carrying value of the segments. The attributed equity methodology is aligned with the business planning process, the inputs from which are used in calculating the recoverable amounts of the respective CGU.
® Refer to the “Capital management” section of this report for more information on the equity attribution framework
Assumptions
Valuation parameters used within the Group’s impairment test model are linked to external market information, where applicable. The model used to determine the recoverable amount is most sensitive to changes in the forecast earnings available to shareholders in years one to three, to changes in the discount rates, and to changes in the long-term growth rate. The applied long-term growth rate is based on long-term economic growth rates for different regions worldwide. Earnings available to shareholders are estimated based on forecast results, which are part of the business plan approved by the BoD.
The discount rates are determined by applying a capital-asset-pricing-model-based approach, as well as considering quantitative and qualitative inputs from both internal and external analysts and the view of management. The discount rates were unchanged between 2014 and 2015.
Key assumptions used to determine the recoverable amounts of each segment are tested for sensitivity by applying a reasonably possible change to those assumptions. Forecast earnings available to shareholders were changed by 10%, the discount rates were changed by 1.0 percentage point and the long-term growth rates were changed by 0.5 percentage point. Under all scenarios, the recoverable amounts for each segment exceeded the respective carrying amount, such that the reasonably possible changes in key assumptions would not result in impairment.
If the estimated earnings and other assumptions in future periods deviate from the current outlook, the value of goodwill may become impaired in the future, giving rise to losses in the income statement. Recognition of any impairment of goodwill would reduce IFRS equity and net profit. It would not impact cash flows and, as goodwill is required to be deducted from capital under the Basel capital framework, no impact would be expected on the Group total capital ratios.
Consolidated financial statements
Notes to the UBS Group AG consolidated financial statements
Note 17 Goodwill and intangible assets (continued)
Discount and growth rates | | | | | | |
| | Discount rates | | Growth rates |
In % | | 31.12.15 | 31.12.14 | | 31.12.15 | 31.12.14 |
Wealth Management | | 9.0 | 9.0 | | 1.7 | 1.7 |
Wealth Management Americas | | 9.0 | 9.0 | | 2.4 | 2.4 |
Investment Bank | | 11.0 | 11.0 | | 2.4 | 2.4 |
Asset Management | | 9.0 | 9.0 | | 2.4 | 2.4 |
| | Goodwill | | Intangible assets | | | |
CHF million | | Total | | Infrastructure | Customer relationships, contractual rights and other | Total | | 31.12.15 | 31.12.14 |
Historical cost | | | | | | | | | |
Balance at the beginning of the year | | 6,368 | | 756 | 833 | 1,589 | | 7,957 | 7,283 |
Additions | | | | | 30 | 30 | | 30 | 17 |
Disposals | | (30) | | | (1) | (1) | | (32) | (1) |
Write-offs | | | | | (20) | (20) | | (20) | 0 |
Foreign currency translation | | (97) | | 5 | (22) | (16) | | (114) | 657 |
Balance at the end of the year | | 6,240 | | 761 | 820 | 1,581 | | 7,821 | 7,957 |
Accumulated amortization and impairment | | | | | | | | | |
Balance at the beginning of the year | | 0 | | 536 | 635 | 1,171 | | 1,171 | 990 |
Amortization | | | | 37 | 57 | 94 | | 94 | 80 |
Impairment¹ | | | | | 13 | 13 | | 13 | 2 |
Disposals | | | | | (1) | (1) | | (1) | 0 |
Write-offs | | | | | (20) | (20) | | (20) | 0 |
Foreign currency translation | | | | 5 | (10) | (5) | | (5) | 99 |
Balance at the end of the year | | 0 | | 578 | 675 | 1,253 | | 1,253 | 1,171 |
Net book value at the end of the year | | 6,240 | | 183 | 145 | 328 | | 6,568 | 6,785 |
1 Impairment charges recorded in 2015 and 2014 relate to assets for which the recoverable amount was determined based on value-in-use (recoverable amount of the impaired assets: CHF 4 million for 2015 and CHF 3 million for 2014). |
The table below presents the disclosure of goodwill and intangible assets by segment for the year ended 31 December 2015.
CHF million | | Wealth Management | | Wealth Management Americas | | Investment Bank | | Asset Management | | Corporate Center – Services | | Total |
Goodwill | | | | | | | | | | | | |
Balance at the beginning of the year | | 1,359 | | 3,490 | | 44 | | 1,476 | | | | 6,368 |
Additions | | | | | | | | | | | | 0 |
Disposals | | (7) | | | | | | (23) | | | | (30) |
Impairment | | | | | | | | | | | | 0 |
Foreign currency translation | | (40) | | 25 | | (14) | | (68) | | | | (97) |
Balance at the end of the year | | 1,312 | | 3,514 | | 29 | | 1,385 | | | | 6,240 |
Intangible assets | | | | | | | | | | | | |
Balance at the beginning of the year | | 45 | | 246 | | 84 | | 17 | | 25 | | 417 |
Additions / transfers | | | | 4 | | 0 | | | | 25 | | 30 |
Disposals | | | | | | 0 | | | | | | 0 |
Amortization | | (3) | | (51) | | (13) | | (5) | | (21) | | (94) |
Impairment | | | | | | (11) | | (2) | | | | (13) |
Foreign currency translation | | (4) | | 0 | | (6) | | (1) | | | | (12) |
Balance at the end of the year | | 38 | | 199 | | 53 | | 8 | | 30 | | 328 |
Note 17 Goodwill and intangible assets (continued)
The estimated, aggregated amortization expenses for intangible assets are as follows:
CHF million | Intangible assets |
Estimated, aggregated amortization expenses for: | |
2016 | 93 |
2017 | 66 |
2018 | 56 |
2019 | 45 |
2020 | 37 |
Thereafter | 23 |
Not amortized due to indefinite useful life | 9 |
Total | 328 |
CHF million | 31.12.15 | 31.12.14 |
Prime brokerage receivables¹ | 11,341 | 12,534 |
Recruitment loans to financial advisors | 3,184 | 2,909 |
Other loans to financial advisors | 418 | 372 |
Bail deposit² | 1,221 | 1,323 |
Accrued interest income | 462 | 453 |
Accrued income – other | 844 | 1,009 |
Prepaid expenses | 1,033 | 1,027 |
Net defined benefit pension and post-employment assets³ | 50 | 0 |
Settlement and clearing accounts | 402 | 617 |
VAT and other tax receivables | 398 | 272 |
Properties and other non-current assets held for sale | 134 | 236 |
Assets of disposal group held for sale⁴ | 279 | 0 |
Other | 2,393 | 2,236 |
Total other assets | 22,160 | 22,988 |
1 Prime brokerage services include clearance, settlement, custody, financing and portfolio reporting services for corporate clients trading across multiple asset classes. Prime brokerage receivables are mainly comprised of margin lending receivables. 2 Refer to item 1 in Note 22b for more information. 3 Refer to Note 28 for more information. 4 Refer to Note 32 for more information. |
Consolidated financial statements
Notes to the UBS Group AG consolidated financial statements
Balance sheet notes: liabilities
Note 19 Due to banks and customers
CHF million | 31.12.15 | 31.12.14 |
Due to banks | 11,836 | 10,492 |
Due to customers: demand deposits | 172,778 | 186,745 |
Due to customers: time deposits | 49,421 | 52,269 |
Due to customers: fiduciary deposits | 6,139 | 14,766 |
Due to customers: retail savings / deposits | 161,848 | 156,427 |
Total due to customers | 390,185 | 410,207 |
Total due to banks and customers | 402,021 | 420,699 |
Note 20 Financial liabilities designated at fair value
CHF million | 31.12.15 | 31.12.14 |
Non-structured fixed-rate bonds | 4,098 | 4,488 |
of which: issued by UBS AG with original maturity greater than one year¹˒² | 3,542 | 3,616 |
Structured debt instruments issued | | |
Equity-linked³ | 30,965 | 37,725 |
Credit-linked | 3,652 | 4,645 |
Rates-linked⁴ | 16,587 | 19,380 |
Other | 1,231 | 2,138 |
Total structured debt instruments issued | 52,436 | 63,888 |
of which: issued by UBS AG with original maturity greater than one year¹˒⁵ | 36,539 | 45,851 |
Structured over-the-counter debt instruments | | |
Equity-linked³ | 2,885 | 2,508 |
Other | 2,608 | 3,154 |
Total structured over-the-counter debt instruments | 5,493 | 5,662 |
of which: issued by UBS AG with original maturity greater than one year¹˒⁶ | 4,497 | 3,691 |
Repurchase agreements | 849 | 1,167 |
Loan commitments and guarantees⁷ | 119 | 93 |
Total | 62,995 | 75,297 |
of which: life-to-date own credit (gain) / loss | (287) | 302 |
1 Issued by UBS AG (standalone). Based on original contractual maturity without considering any early redemption features. 2 100% of the balance as of 31 December 2015 was unsecured. 3 Includes investment fund unit-linked instruments issued. 4 Includes non-structured rates-linked debt instruments issued. 5 More than 98% of the balance as of 31 December 2015 was unsecured. 6 More than 35% of the balance as of 31 December 2015 was unsecured. 7 Loan commitments recognized as “Financial liabilities designated at fair value” until drawn and recognized as loans. See Note 1a item 8 for additional information. |
As of 31 December 2015, the contractual redemption amount at maturity of Financial liabilities designated at fair value through profit or loss was CHF 0.1 billion higher than the carrying value. As of 31 December 2014, the contractual redemption amount at maturity of such liabilities was CHF 0.7 billion lower than the carrying value.
The table on the following page shows the residual contractual maturity of the carrying value of financial liabilities designated at fair value, split between fixed-rate and floating-rate instruments based on the contractual terms and does not consider any early redemption features. Interest rate ranges for future interest payments related to these financial liabilities designated at fair value have not been included in the table on the following page as a majority of these liabilities are structured products, and therefore the future interest payments are highly dependent upon the embedded derivative and prevailing market conditions at the time each interest payment is made.
® Refer to Note 27b for maturity information on an undiscounted cash flow basis
Note 20 Financial liabilities designated at fair value (continued)
Contractual maturity of carrying value | | | | | | |
CHF million | 2016 | 2017 | 2018 | 2019 | 2020 | 2021-2025 | Thereafter | Total 31.12.15 | Total 31.12.14 |
UBS AG¹ | | | | | | | | | |
Non-subordinated debt | | | | | | | | | |
Fixed-rate | 2,873 | 1,912 | 776 | 279 | 302 | 1,623 | 2,938 | 10,702 | 12,891 |
Floating-rate | 23,148 | 5,314 | 3,559 | 2,839 | 3,286 | 2,838 | 8,839 | 49,824 | 58,643 |
Subtotal | 26,021 | 7,226 | 4,335 | 3,118 | 3,588 | 4,461 | 11,777 | 60,526 | 71,535 |
Other subsidiaries² | | | | | | | | | |
Non-subordinated debt | | | | | | | | | |
Fixed-rate | 29 | 58 | 179 | 17 | 34 | 164 | 513 | 993 | 1,473 |
Floating-rate | 260 | 484 | 188 | 122 | 127 | 178 | 116 | 1,475 | 2,289 |
Subtotal | 288 | 542 | 367 | 139 | 161 | 342 | 629 | 2,469 | 3,762 |
Total | 26,310 | 7,768 | 4,702 | 3,257 | 3,749 | 4,803 | 12,406 | 62,995 | 75,297 |
1 Comprises instruments issued by UBS AG (standalone). 2 Comprises instruments issued by subsidiaries of UBS AG. |
Note 21 Debt issued held at amortized cost
CHF million | 31.12.15 | 31.12.14 |
Certificates of deposit | 11,967 | 16,591 |
Commercial paper | 3,824 | 4,841 |
Other short-term debt | 5,424 | 5,931 |
Short-term debt¹ | 21,215 | 27,363 |
Non-structured fixed-rate bonds | 31,240 | 24,582 |
of which: issued by UBS AG with original maturity greater than one year² | 31,078 | 24,433 |
Senior unsecured debt that will contribute to total loss-absorbing capacity³ | 5,633 | 0 |
Covered bonds | 8,490 | 13,614 |
Subordinated debt | 17,763 | 16,123 |
of which: high-trigger loss-absorbing additional tier 1 perpetual capital notes | 2,837 | 0 |
of which: low-trigger loss-absorbing additional tier 1 perpetual capital notes | 2,326 | 0 |
of which: phase-out additional tier 1 capital | 0 | 1,197 |
of which: low-trigger loss-absorbing tier 2 capital | 10,346 | 10,464 |
of which: phase-out tier 2 capital | 2,254 | 4,462 |
Debt issued through the central bond institutions of the Swiss regional or cantonal banks | 8,237 | 8,029 |
Other long-term debt | 570 | 1,495 |
of which: issued by UBS AG with original maturity greater than one year² | 278 | 861 |
Long-term debt⁴ | 71,932 | 63,844 |
Total debt issued held at amortized cost⁵ | 93,147 | 91,207 |
1 Debt with an original maturity of less than one year. 2 Issued by UBS AG (standalone). Based on original contractual maturity without considering any early redemption features. 100% of the balance as of 31 December 2015 was unsecured. 3 Issued by UBS Group Funding (Jersey) Ltd., a funding subsidiary directly held and guaranteed by UBS Group AG. 4 Debt with original maturity greater than or equal to one year. 5 Net of bifurcated embedded derivatives with a net negative fair value of CHF 130 million as of 31 December 2015 (31 December 2014: net negative fair value of CHF 25 million). |
The Group uses interest rate and foreign exchange derivatives to manage the risks inherent in certain debt instruments held at amortized cost. In certain cases, the Group applies hedge accounting for interest rate risk as discussed in Note 1a item 15 and Note 14. As a result of applying hedge accounting, the carrying value of debt issued increased by CHF 1,037 million and by CHF 1,703 million as of 31 December 2015 and 2014, respectively, reflecting changes in fair value due to interest rate movements.
Consolidated financial statements
Notes to the UBS Group AG consolidated financial statements
Note 21 Debt issued held at amortized cost (continued)
Subordinated debt consists of unsecured debt obligations that are contractually subordinated in right of payment to all other present and future non-subordinated obligations of the respective issuing entity. All of the subordinated debt instruments outstanding as of 31 December 2015 pay a fixed rate of interest.
The table below shows the residual contractual maturity of the carrying value of debt issued, split between fixed-rate and floating-rate based on the contractual terms and does not consider any early redemption features. The effects from interest rate swaps, which are used to hedge various fixed-rate debt issuances by changing the repricing characteristics into those similar to floating-rate debt, are also not considered in the table below.
® Refer to Note 27b for maturity information on an undiscounted cash flow basis
Contractual maturity dates of carrying value | | | | | | | |
CHF million, except where indicated | 2016 | 2017 | 2018 | 2019 | 2020 | 2021-2025 | Thereafter | Total 31.12.15 | Total 31.12.14 |
UBS Group AG¹ | | | | | | | | | |
Subordinated debt | | | | | | | | | |
Fixed-rate | 0 | 0 | 0 | 0 | 0 | 0 | 5,163 | 5,163 | 0 |
Interest rates (range in %) | | | | | | | 5.8-7.1 | | |
Subtotal | 0 | 0 | 0 | 0 | 0 | 0 | 5,163 | 5,163 | 0 |
UBS AG² | | | | | | | | | |
Non-subordinated debt | | | | | | | | | |
Fixed-rate | 13,064 | 6,334 | 8,004 | 4,036 | 4,340 | 4,375 | 0 | 40,153 | 59,327 |
Interest rates (range in %) | 0-6.4 | 0-5.9 | 0-6.6 | 2.4-4.0 | 0-4.9 | 1.3-4.0 | | | |
Floating-rate | 10,014 | 3,721 | 963 | 939 | 239 | 0 | 2,031 | 17,907 | 11,296 |
Subordinated debt | | | | | | | | | |
Fixed-rate | 918 | 414 | 0 | 0 | 0 | 8,772 | 2,497 | 12,600 | 16,123 |
Interest rates (range in %) | 3.1-5.9 | 4.1-7.4 | | | | 4.8-8.8 | 4.8-7.8 | | |
Subtotal | 23,996 | 10,468 | 8,967 | 4,974 | 4,579 | 13,147 | 4,528 | 70,659 | 86,746 |
Other subsidiaries³ | | | | | | | | | |
Non-subordinated debt | | | | | | | | | |
Fixed-rate | 3,936 | 728 | 791 | 742 | 2,219 | 7,433 | 1,171 | 17,020 | 4,460 |
Interest rates (range in %) | 0-8.3 | 0.3-8.1 | 0.4-3.7 | 0.5-2.9 | 0.1-3 | 0-4.1 | 0.4-2.8 | | |
Floating-rate | 0 | 0 | 8 | 0 | 297 | 0 | 0 | 306 | 1 |
Subtotal | 3,936 | 728 | 799 | 742 | 2,516 | 7,434 | 1,171 | 17,325 | 4,462 |
Total | 27,932 | 11,196 | 9,766 | 5,717 | 7,095 | 20,581 | 10,861 | 93,147 | 91,207 |
1 Comprises debt issued by UBS Group AG (standalone). 2 Comprises debt issued by UBS AG (standalone). 3 Comprises debt issued by other direct subsidiaries of UBS Group AG and by subsidiaries of UBS AG. |
Note 22 Provisions and contingent liabilities
a) Provisions | | | | | | | | | |
CHF million | Operational risks¹ | Litigation, regulatory and similar matters² | Restruc- turing | Loan com- mitments and guarantees | Real estate | Employee benefits⁵ | Other | Total 31.12.15 | Total 31.12.14 |
Balance at the beginning of the year | 50 | 3,053 | 647 | 23 | 153 | 215 | 224 | 4,366 | 2,971 |
Increase in provisions recognized in the income statement | 43 | 1,263 | 361 | 6 | 27 | 7 | 71 | 1,778 | 3,308 |
Release of provisions recognized in the income statement | (7) | (166) | (102) | (3) | (1) | (18) | (40) | (337) | (528) |
Provisions used in conformity with designated purpose | (37) | (1,174) | (287) | 0 | (28) | (1) | (133) | (1,660) | (1,659) |
Capitalized reinstatement costs | 0 | 0 | 0 | 0 | 5 | 0 | 0 | 5 | 0 |
Reclassifications | 0 | 0 | 0 | 9 | 0 | 0 | 0 | 9 | 8 |
Foreign currency translation / unwind of discount | (1) | 7 | 5 | 0 | 2 | (5) | (3) | 3 | 266 |
Balance at the end of the year | 47 | 2,983 | 624³ | 35 | 157⁴ | 198 | 120 | 4,164 | 4,366 |
1 Comprises provisions for losses resulting from security risks and transaction processing risks. 2 Comprises provisions for losses resulting from legal, liability and compliance risks. 3 Includes personnel related restructuring provisions of CHF 110 million as of 31 December 2015 (31 December 2014: CHF 116 million) and provisions for onerous lease contracts of CHF 514 million as of 31 December 2015 (31 December 2014: CHF 530 million). 4 Includes reinstatement costs for leasehold improvements of CHF 95 million as of 31 December 2015 (31 December 2014: CHF 98 million) and provisions for onerous lease contracts of CHF 62 million as of 31 December 2015 (31 December 2014: CHF 55 million). 5 Includes provisions for sabbatical and anniversary awards as well as provisions for severance which are not part of restructuring provisions. |
Restructuring provisions primarily relate to onerous lease contracts and severance payments. The utilization of onerous lease provisions is driven by the maturities of the underlying lease contracts. Severance-related provisions are utilized within a short time period, usually within six months, but potential changes in amount may be triggered when natural staff attrition reduces the number of people affected by a restructuring and therefore the estimated costs.
Information on provisions and contingent liabilities in respect of Litigation, regulatory and similar matters, as a class, is included in Note 22b. There are no material contingent liabilities associated with the other classes of provisions.
Consolidated financial statements
Notes to the UBS Group AG consolidated financial statements
Note 22 Provisions and contingent liabilities (continued)
EDTF | b) Litigation, regulatory and similar matters
The Group operates in a legal and regulatory environment that exposes it to significant litigation and similar risks arising from disputes and regulatory proceedings. As a result, UBS (which for purposes of this Note may refer to UBS Group AG and / or one or more of its subsidiaries, as applicable) is involved in various disputes and legal proceedings, including litigation, arbitration, and regulatory and criminal investigations.
Such matters are subject to many uncertainties and the outcome is often difficult to predict, particularly in the earlier stages of a case. There are also situations where the Group may enter into a settlement agreement. This may occur in order to avoid the expense, management distraction or reputational implications of continuing to contest liability, even for those matters for which the Group believes it should be exonerated. The uncertainties inherent in all such matters affect the amount and timing of any potential outflows for both matters with respect to which provisions have been established and other contingent liabilities. The Group makes provisions for such matters brought against it when, in the opinion of management after seeking legal advice, it is more likely than not that the Group has a present legal or constructive obligation as a result of past events, it is probable that an outflow of resources will be required, and the amount can be reliably estimated. Where these factors are otherwise satisfied, a provision may be established for claims that have not yet been asserted against the Group, but are nevertheless expected to be, based on the Group’s experience with similar asserted claims. If any of those conditions is not met, such matters result in contingent liabilities. If the amount of an obligation cannot be reliably estimated, a liability exists that is not recognized even if an outflow of resources is probable. Accordingly, no provision is established even if the potential outflow of resources with respect to select matters could be significant.
Specific litigation, regulatory and other matters are described below, including all such matters that management considers to be material and others that management believes to be of significance due to potential financial, reputational and other effects. The amount of damages claimed, the size of a transaction or other information is provided where available and appropriate in order to assist users in considering the magnitude of potential exposures.
In the case of certain matters below, we state that we have established a provision, and for the other matters, we make no such statement. When we make this statement and we expect disclosure of the amount of a provision to prejudice seriously our position with other parties in the matter, because it would reveal what UBS believes to be the probable and reliably estimable outflow, we do not disclose that amount. In some cases, we are subject to confidentiality obligations that preclude such disclosure. With respect to the matters for which we do not state whether we have established a provision, either (a) we have not established a provision, in which case the matter is treated as a contingent liability under the applicable accounting standard or (b) we have established a provision but expect disclosure of that fact to prejudice seriously our position with other parties in the matter because it would reveal the fact that UBS believes an outflow of resources to be probable and reliably estimable.
With respect to certain litigation, regulatory and similar matters for which we have established provisions, we are able to estimate the expected timing of outflows. However, the aggregate amount of the expected outflows for those matters for which we are able to estimate expected timing is immaterial relative to our current and expected levels of liquidity over the relevant time periods.
Note 22 Provisions and contingent liabilities (continued)
The aggregate amount provisioned for litigation, regulatory and similar matters as a class is disclosed in Note 22a above. It is not practicable to provide an aggregate estimate of liability for our litigation, regulatory and similar matters as a class of contingent liabilities. Doing so would require us to provide speculative legal assessments as to claims and proceedings that involve unique fact patterns or novel legal theories, which have not yet been initiated or are at early stages of adjudication, or as to which alleged damages have not been quantified by the claimants. Although we therefore cannot provide a numerical estimate of the future losses that could arise from litigation, regulatory and similar matters, we believe that the aggregate amount of possible future losses from this class that are more than remote substantially exceeds the level of current provisions. Litigation, regulatory and similar matters may also result in non-monetary penalties and consequences. For example, the non-prosecution agreement (NPA) described in paragraph 5 of this Note, which we entered into with the US Department of Justice (DOJ), Criminal Division, Fraud Section in connection with our submissions of benchmark interest rates, including, among others, the British Bankers’ Association London Interbank Offered Rate (LIBOR), was terminated by the DOJ based on its determination that we had committed a US crime in relation to foreign exchange matters. As a consequence, UBS AG has pleaded guilty to one count of wire fraud for conduct in the LIBOR matter, and has agreed to pay a USD 203 million fine and accept a three-year term of probation. A guilty plea to, or conviction of, a crime (including as a result of termination of the NPA) could have material consequences for UBS. Resolution of regulatory proceedings may require us to obtain waivers of regulatory disqualifications to maintain certain operations, may entitle regulatory authorities to limit, suspend or terminate licenses and regulatory authorizations and may permit financial market utilities to limit, suspend or terminate our participation in such utilities. Failure to obtain such waivers, or any limitation, suspension or termination of licenses, authorizations or participations, could have material consequences for UBS.
The risk of loss associated with litigation, regulatory and similar matters is a component of operational risk for purposes of determining our capital requirements. Information concerning our capital requirements and the calculation of operational risk for this purpose is included in the “Capital management” section of this report.
EDTF |
Provisions for litigation, regulatory and similar matters by business division and Corporate Center unit¹ |
CHF million | Wealth Manage- ment | Wealth Manage- ment Americas | Personal & Corporate Banking | Asset Manage- ment | Investment Bank | CC – Services | CC – Group ALM | CC – Non-core and Legacy Portfolio | Total 31.12.15 | Total 31.12.14 |
Balance at the beginning of the year | 188 | 209 | 92 | 53 | 1,258 | 312 | 0 | 941 | 3,053 | 1,622 |
Increase in provisions recognized in the income statement | 114 | 372 | 0 | 0 | 17 | 15 | 0 | 744 | 1,263 | 2,941 |
Release of provisions recognized in the income statement | (10) | (19) | (3) | (3) | (15) | (1) | 0 | (115) | (166) | (395) |
Provisions used in conformity with designated purpose | (36) | (110) | (5) | (33) | (675) | (13) | 0 | (302) | (1,174) | (1,286) |
Reclassifications | 0 | 0 | 0 | 0 | 0 | 0 | 0 | 0 | 0 | (2) |
Foreign currency translation / unwind of discount | (12) | 7 | (2) | (1) | 0 | (3) | 0 | 18 | 7 | 172 |
Balance at the end of the year | 245 | 459 | 83 | 16 | 585 | 310 | 0 | 1,284 | 2,983 | 3,053 |
1 Provisions, if any, for the matters described in this Note are recorded in Wealth Management (item 3), Wealth Management Americas (item 4), Corporate Center – Services (item 7) and Corporate Center – Non-core and Legacy Portfolio (items 2 and 8). Provisions, if any, for the matters described in this Note in items 1 and 6 are allocated between Wealth Management and Personal & Corporate Banking, and provisions, if any, for the matters described in this Note in item 5 are allocated between the Investment Bank, Corporate Center – Services and Corporate Center – Non-core and Legacy Portfolio. |
▲
Consolidated financial statements
Notes to the UBS Group AG consolidated financial statements
Note 22 Provisions and contingent liabilities (continued)
1. Inquiries regarding cross-border wealth management businesses
Tax and regulatory authorities in a number of countries have made inquiries, served requests for information or examined employees located in their respective jurisdictions relating to the cross-border wealth management services provided by UBS and other financial institutions. It is possible that implementation of automatic tax information exchange and other measures relating to cross-border provision of financial services could give rise to further inquiries in the future.
As a result of investigations in France, in 2013, UBS (France) S.A. and UBS AG were put under formal examination (“mise en examen”) for complicity in having illicitly solicited clients on French territory, and were declared witness with legal assistance (“témoin assisté”) regarding the laundering of proceeds of tax fraud and of banking and financial solicitation by unauthorized persons. In 2014, UBS AG was placed under formal examination with respect to the potential charges of laundering of proceeds of tax fraud, and the investigating judges ordered UBS to provide bail (“caution”) of EUR 1.1 billion. UBS AG appealed the determination of the bail amount, but both the appeal court (“Cour d’Appel”) and the French Supreme Court (“Cour de Cassation”) upheld the bail amount and rejected the appeal in full in late 2014. UBS AG has filed and has had accepted a petition to the European Court of Human Rights to challenge various aspects of the French court’s decision. In September 2015, the former CEO of UBS Wealth Management was placed under formal examination in connection with these proceedings. In addition, the investigating judges have sought to issue arrest warrants against three Swiss-based former employees of UBS AG who did not appear when summoned by the investigating judge. In February 2016, the investigating judge notified UBS that he does not intend to conduct further investigation. This notification commences a period in which the prosecutor may file a request for a judge to issue formal charges.
In March 2015, UBS (France) S.A. was placed under formal examination for complicity regarding the laundering of proceeds of tax fraud and of banking and financial solicitation by unauthorized persons for the years 2004 until 2008 and declared witness with legal assistance for the years 2009 to 2012. A bail of EUR 40 million was imposed, and was reduced by the Court of Appeals in May 2015 to EUR 10 million. Separately, in 2013, the French banking supervisory authority’s disciplinary commission reprimanded UBS (France) S.A. for having had insufficiencies in its control and compliance framework around its cross-border activities and know your customer obligations. It imposed a penalty of EUR 10 million, which was paid.
UBS AG has been notified by the Brussels public prosecutor’s office that it is investigating various aspects of UBS’s cross-border business.
In January 2015, UBS received inquiries from the US Attorney’s Office for the Eastern District of New York and from the US Securities and Exchange Commission (SEC), which are investigating potential sales to US persons of bearer bonds and other unregistered securities in possible violation of the Tax Equity and Fiscal Responsibility Act of 1982 (TEFRA) and the registration requirements of the US securities laws. UBS is cooperating with the authorities in these investigations.
UBS has, and reportedly numerous other financial institutions have, received inquiries from authorities concerning accounts relating to the Fédération Internationale de Football Association (FIFA) and other constituent soccer associations and related persons and entities. UBS is cooperating with authorities in these inquiries.
Our balance sheet at 31 December 2015 reflected provisions with respect to matters described in this item 1 in an amount that UBS believes to be appropriate under the applicable accounting standard. As in the case of other matters for which we have established provisions, the future outflow of resources in respect of such matters cannot be determined with certainty based on currently available information, and accordingly may ultimately prove to be substantially greater (or may be less) than the provision that we have recognized.
2. Claims related to sales of residential mortgage-backed securities and mortgages
From 2002 through 2007, prior to the crisis in the US residential loan market, UBS was a substantial issuer and underwriter of US residential mortgage-backed securities (RMBS) and was a purchaser and seller of US residential mortgages. A subsidiary of UBS, UBS Real Estate Securities Inc. (UBS RESI), acquired pools of residential mortgage loans from originators and (through an affiliate) deposited them into securitization trusts. In this manner, from 2004 through 2007, UBS RESI sponsored approximately USD 80 billion in RMBS, based on the original principal balances of the securities issued.
UBS RESI also sold pools of loans acquired from originators to third-party purchasers. These whole loan sales during the period 2004 through 2007 totaled approximately USD 19 billion in original principal balance.
We were not a significant originator of US residential loans. A subsidiary of UBS originated approximately USD 1.5 billion in US residential mortgage loans during the period in which it was active from 2006 to 2008, and securitized less than half of these loans.
Note 22 Provisions and contingent liabilities (continued)
RMBS-related lawsuits concerning disclosures: UBS is named as a defendant relating to its role as underwriter and issuer of RMBS in lawsuits related to approximately USD 6.2 billion in original face amount of RMBS underwritten or issued by UBS. Of the USD 6.2 billion in original face amount of RMBS that remains at issue in these cases, approximately USD 3.2 billion was issued in offerings in which a UBS subsidiary transferred underlying loans (the majority of which were purchased from third-party originators) into a securitization trust and made representations and warranties about those loans (UBS-sponsored RMBS). The remaining USD 3 billion of RMBS to which these cases relate was issued by third parties in securitizations in which UBS acted as underwriter (third-party RMBS).
In connection with certain of these lawsuits, UBS has indemnification rights against surviving third-party issuers or originators for losses or liabilities incurred by UBS, but UBS cannot predict the extent to which it will succeed in enforcing those rights.
UBS is a defendant in two lawsuits brought by the National Credit Union Administration (NCUA), as conservator for certain failed credit unions, asserting misstatements and omissions in the offering documents for RMBS purchased by the credit unions. Both lawsuits were filed in US District Courts, one in the District of Kansas and the other in the Southern District of New York (SDNY). The original principal balance at issue in the Kansas case is approximately USD 1.15 billion and the original principal balance at issue in the SDNY case is approximately USD 400 million. In February 2016, UBS made an offer of judgment to NCUA in the SDNY case, which NCUA has accepted, pursuant to which UBS will pay USD 33 million plus an amount of prejudgment interest that will be determined by the court and reasonable attorneys’ fees. Once these amounts are determined and judgment is entered, the SDNY case will end. Prejudgment interest and attorneys’ fees are expected to significantly increase the total amount to be paid in the SDNY case.
Lawsuits related to contractual representations and warranties concerning mortgages and RMBS: When UBS acted as an RMBS sponsor or mortgage seller, we generally made certain representations relating to the characteristics of the underlying loans. In the event of a material breach of these representations, we were in certain circumstances contractually obligated to repurchase the loans to which the representations related or to indemnify certain parties against losses. UBS has received demands to repurchase US residential mortgage loans as to which UBS made certain representations at the time the loans were transferred to the securitization trust aggregating approximately USD 4.1 billion in original principal balance. Of this amount, UBS considers claims relating to approximately USD 2 billion in original principal balance to be resolved, including claims barred by the statute of limitations. Substantially all of the remaining claims are in litigation, including the matters described in the next paragraph. UBS believes that new demands to repurchase US residential mortgage loans are time-barred under a decision rendered by the New York Court of Appeals.
In 2012, certain RMBS trusts filed an action (Trustee Suit) in the SDNY seeking to enforce UBS RESI’s obligation to repurchase loans in the collateral pools for three RMBS securitizations (Transactions) with an original principal balance of approximately USD 2 billion, for which Assured Guaranty Municipal Corp. (Assured Guaranty), a financial guaranty insurance company, had previously demanded repurchase. In January 2015, the court rejected plaintiffs’ efforts to seek damages for all loans purportedly in breach of representations and warranties in any of the three Transactions and limited plaintiffs to pursuing claims based solely on alleged breaches for loans identified in the complaint or other breaches that plaintiffs can establish were independently discovered by UBS. In February 2015, the court denied plaintiffs’ motion seeking reconsideration of its ruling. With respect to the loans subject to the Trustee Suit that were originated by institutions still in existence, UBS intends to enforce its indemnity rights against those institutions. Trial is currently scheduled for April 2016.
We also have tolling agreements with certain institutional purchasers of RMBS concerning their potential claims related to substantial purchases of UBS-sponsored or third-party RMBS.
Consolidated financial statements
Notes to the UBS Group AG consolidated financial statements
Note 22 Provisions and contingent liabilities (continued)
Provision for claims related to sales of residential mortgage-backed securities and mortgages |
USD million | 31.12.15 | 31.12.14 |
Balance at the beginning of the year | 849 | 817 |
Increase in provision recognized in the income statement | 662 | 239 |
Release of provision recognized in the income statement | (94) | (120) |
Provision used in conformity with designated purpose | (199) | (87) |
Balance at the end of the year | 1,218 | 849 |
Mortgage-related regulatory matters: In 2014, UBS received a subpoena from the US Attorney’s Office for the Eastern District of New York issued pursuant to the Financial Institutions Reform, Recovery and Enforcement Act of 1989 (FIRREA), which seeks documents and information related to UBS’s RMBS business from 2005 through 2007. In September 2015, the Eastern District of New York identified a number of transactions that are currently the focus of their inquiry, as to which we are providing additional information. UBS continues to respond to the FIRREA subpoena and to subpoenas from the New York State Attorney General (NYAG) relating to its RMBS business. In addition, UBS has also been responding to inquiries from both the Special Inspector General for the Troubled Asset Relief Program (SIGTARP) (who is working in conjunction with the US Attorney’s Office for Connecticut and the DOJ) and the SEC relating to trading practices in connection with purchases and sales of mortgage-backed securities in the secondary market from 2009 through the present. We are cooperating with the authorities in these matters. Numerous other banks reportedly are responding to similar inquiries from these authorities.
As reflected in the table “Provision for claims related to sales of residential mortgage-backed securities and mortgages,” our balance sheet at 31 December 2015 reflected a provision of USD 1,218 million with respect to matters described in this item 2. As in the case of other matters for which we have established provisions, the future outflow of resources in respect of this matter cannot be determined with certainty based on currently available information, and accordingly may ultimately prove to be substantially greater (or may be less) than the provision that we have recognized.
Note 22 Provisions and contingent liabilities (continued)
3. Madoff
In relation to the Bernard L. Madoff Investment Securities LLC (BMIS) investment fraud, UBS AG, UBS (Luxembourg) SA and certain other UBS subsidiaries have been subject to inquiries by a number of regulators, including the Swiss Financial Market Supervisory Authority (FINMA) and the Luxembourg Commission de Surveillance du Secteur Financier (CSSF). Those inquiries concerned two third-party funds established under Luxembourg law, substantially all assets of which were with BMIS, as well as certain funds established in offshore jurisdictions with either direct or indirect exposure to BMIS. These funds now face severe losses, and the Luxembourg funds are in liquidation. The last reported net asset value of the two Luxembourg funds before revelation of the Madoff scheme was approximately USD 1.7 billion in the aggregate, although that figure likely includes fictitious profit reported by BMIS. The documentation establishing both funds identifies UBS entities in various roles including custodian, administrator, manager, distributor and promoter, and indicates that UBS employees serve as board members. UBS (Luxembourg) SA and certain other UBS subsidiaries are responding to inquiries by Luxembourg investigating authorities, without, however, being named as parties in those investigations. In 2009 and 2010, the liquidators of the two Luxembourg funds filed claims on behalf of the funds against UBS entities, non-UBS entities and certain individuals including current and former UBS employees. The amounts claimed are approximately EUR 890 million and EUR 305 million, respectively. The liquidators have filed supplementary claims for amounts that the funds may possibly be held liable to pay the BMIS Trustee. These amounts claimed by the liquidator are approximately EUR 564 million and EUR 370 million, respectively. In addition, a large number of alleged beneficiaries have filed claims against UBS entities (and non-UBS entities) for purported losses relating to the Madoff scheme. The majority of these cases are pending in Luxembourg, where appeals were filed by the claimants against the 2010 decisions of the court in which the claims in a number of test cases were held to be inadmissible. In July 2014, the Luxembourg Court of Appeal dismissed one test appeal in its entirety, which decision was appealed by the investor. In July 2015, the Luxembourg Supreme Court found in favor of UBS and dismissed the investor’s appeal. In the US, the BMIS Trustee filed claims in 2010 against UBS entities, among others, in relation to the two Luxembourg funds and one of the offshore funds. The total amount claimed against all defendants in these actions was not less than USD 2 billion. Following a motion by UBS, in 2011, the SDNY dismissed all of the BMIS Trustee’s claims other than claims for recovery of fraudulent conveyances and preference payments that were allegedly transferred to UBS on the ground that the BMIS Trustee lacks standing to bring such claims. In 2013, the Second Circuit affirmed the District Court’s decision and, in June 2014, the US Supreme Court denied the BMIS Trustee’s petition seeking review of the Second Circuit ruling. In December 2014, several claims, including a purported class action, were filed in the US by BMIS customers against UBS entities, asserting claims similar to the ones made by the BMIS Trustee, seeking unspecified damages. One claim was voluntarily withdrawn by the plaintiff. In July 2015, following a motion by UBS, the SDNY dismissed the two remaining claims on the basis that the New York courts did not have jurisdiction to hear the claims against the UBS entities. In Germany, certain clients of UBS are exposed to Madoff-managed positions through third-party funds and funds administered by UBS entities in Germany. A small number of claims have been filed with respect to such funds. In January 2015, a court of appeal reversed a lower court decision in favor of UBS in one such case and ordered UBS to pay EUR 49 million, plus interest (approximately EUR 15.3 million). UBS filed an application for leave to appeal the decision. That application was rejected by the German Federal Supreme Court in December 2015, meaning that the Court of Appeal’s decision is final.
Consolidated financial statements
Notes to the UBS Group AG consolidated financial statements
Note 22 Provisions and contingent liabilities (continued)
4. Puerto Rico
Declines since August 2013 in the market prices of Puerto Rico municipal bonds and of closed-end funds (the funds) that are sole-managed and co-managed by UBS Trust Company of Puerto Rico and distributed by UBS Financial Services Incorporated of Puerto Rico (UBS PR) have led to multiple regulatory inquiries, as well as customer complaints and arbitrations with aggregate claimed damages of USD 1.6 billion, of which claims with aggregate claimed damages of approximately USD 374 million have been resolved through settlements or arbitration. The claims are filed by clients in Puerto Rico who own the funds or Puerto Rico municipal bonds and / or who used their UBS account assets as collateral for UBS non-purpose loans; customer complaint and arbitration allegations include fraud, misrepresentation and unsuitability of the funds and of the loans. A shareholder derivative action was filed in 2014 against various UBS entities and current and certain former directors of the funds, alleging hundreds of millions in losses in the funds. In 2015, defendants’ motion to dismiss was denied. Defendants are seeking leave to appeal that ruling to the Puerto Rico Supreme Court. In 2014, a federal class action complaint also was filed against various UBS entities, certain members of UBS PR senior management, and the co-manager of certain of the funds seeking damages for investor losses in the funds during the period from May 2008 through May 2014. Defendants have moved to dismiss that complaint. In March 2015, a class action was filed in Puerto Rico state court against UBS PR seeking equitable relief in the form of a stay of any effort by UBS PR to collect on non-purpose loans it acquired from UBS Bank USA in December 2013 based on plaintiffs’ allegation that the loans are not valid.
In 2014, UBS reached a settlement with the Office of the Commissioner of Financial Institutions for the Commonwealth of Puerto Rico (OCFI) in connection with OCFI’s examination of UBS’s operations from January 2006 through September 2013. Pursuant to the settlement, UBS contributed USD 3.5 million to an investor education fund, offered USD 1.68 million in restitution to certain investors and, among other things, committed to undertake an additional review of certain client accounts to determine if additional restitution would be appropriate. That review resulted in an additional USD 2.1 million in restitution being offered to certain investors.
In September 2015, the SEC and the Financial Industry Regulatory Authority (FINRA) announced settlements with UBS PR of their separate investigations stemming from the 2013 market events. Without admitting or denying the findings in either matter, UBS PR agreed in the SEC settlement to pay USD 15 million (which includes USD 1.18 million in disgorgement, a civil penalty of USD 13.63 million and pre-judgment interest), and USD 18.5 million in the FINRA matter (which includes up to USD 11 million in restitution to 165 UBS PR customers and a civil penalty of USD 7.5 million). The SEC settlement involves a charge against UBS PR of failing to supervise the activities of a former financial advisor who had recommended the impermissible investment of non-purpose loan proceeds into the UBS PR closed-end funds, in violation of firm policy and the customer loan agreements. In the FINRA settlement, UBS PR is alleged to have failed to supervise certain customer accounts which were both more than 75% invested in UBS PR closed-end funds and leveraged against those positions. We also understand that the DOJ is conducting a criminal inquiry into the impermissible reinvestment of non-purpose loan proceeds. We are cooperating with the authorities in this inquiry.
In 2011, a purported derivative action was filed on behalf of the Employee Retirement System of the Commonwealth of Puerto Rico (System) against over 40 defendants, including UBS PR and other consultants and underwriters, trustees of the System, and the President and Board of the Government Development Bank of Puerto Rico. The plaintiffs alleged that defendants violated their purported fiduciary duties and contractual obligations in connection with the issuance and underwriting of approximately USD 3 billion of bonds by the System in 2008 and sought damages of over USD 800 million. UBS is named in connection with its underwriting and consulting services. In 2013, the case was dismissed by the Puerto Rico Court of First Instance on the grounds that plaintiffs did not have standing to bring the claim, but that dismissal was subsequently overturned on appeal. Defendants have renewed their motion to dismiss the complaint on grounds not addressed when the court issued its prior ruling.
Also, in 2013, an SEC Administrative Law Judge dismissed a case brought by the SEC against two UBS executives, finding no violations. The charges had stemmed from the SEC’s investigation of UBS’s sale of closed-end funds in 2008 and 2009, which UBS settled in 2012. Beginning in 2012, two federal class action complaints, which were subsequently consolidated, were filed against various UBS entities, certain of the funds, and certain members of UBS PR senior management, seeking damages for investor losses in the funds during the period from January 2008 through May 2012 based on allegations similar to those in the SEC action. A motion for class certification was denied without prejudice to the right to refile the motion after limited discovery, and that motion has since been refiled.
Note 22 Provisions and contingent liabilities (continued)
In June 2015 Puerto Rico’s Governor stated that the Commonwealth is unable to meet its obligations. In addition, certain agencies and public corporations of the Commonwealth have held discussions with their creditors to restructure their outstanding debt, and certain agencies and public corporations of the Commonwealth have defaulted on certain interest payments that were due in August 2015 and January 2016. The United States Supreme Court has agreed to hear Puerto Rico’s appeal of a US District Court’s invalidation of the Puerto Rico Public Corporations Debt Enforcement and Recovery Act (the Act), under which Puerto Rico’s public corporations would be permitted to effect a mandatory restructuring of their respective debts with a specified creditor vote that would be binding on all applicable creditors, once approved by a court or, alternatively, under a court-supervised bankruptcy type restructuring. The foregoing events, any further defaults by the Commonwealth or its agencies and public corporations on (or any debt restructurings proposed by them with respect to) their outstanding debt, a Supreme Court decision upholding the Act (or sending it back to the District Court for further proceedings) and any further actions taken by Puerto Rico’s public corporations under the Act, as well as any market reactions to any of the foregoing, may increase the number of claims against UBS concerning Puerto Rico securities as well as potential damages sought.
Our balance sheet at 31 December 2015 reflected provisions with respect to matters described in this item 4 in amounts that UBS believes to be appropriate under the applicable accounting standard. As in the case of other matters for which we have established provisions, the future outflow of resources in respect of such matters cannot be determined with certainty based on currently available information, and accordingly may ultimately prove to be substantially greater (or may be less) than the provisions that we have recognized.
5. Foreign exchange, LIBOR, and benchmark rates, and other trading practices
Foreign exchange-related regulatory matters: Following an initial media report in 2013 of widespread irregularities in the foreign exchange markets, UBS immediately commenced an internal review of its foreign exchange business, which includes our precious metals and related structured products businesses. Since then, various authorities have commenced investigations concerning possible manipulation of foreign exchange markets, including FINMA, the Swiss Competition Commission (WEKO), the DOJ, the SEC, the US Commodity Futures Trading Commission (CFTC), the Board of Governors of the Federal Reserve System (Federal Reserve Board), the UK Financial Conduct Authority (FCA) (to which certain responsibilities of the UK Financial Services Authority (FSA) have passed), the UK Serious Fraud Office (SFO), the Australian Securities and Investments Commission (ASIC), the Hong Kong Monetary Authority (HKMA), the Korea Fair Trade Commission (KFTC) and the Brazil Competition Authority (CADE). In addition, WEKO is, and a number of other authorities reportedly are, investigating potential manipulation of precious metals prices. UBS has taken and will take appropriate action with respect to certain personnel as a result of its ongoing review.
In 2014, UBS reached settlements with the FCA and the CFTC in connection with their foreign exchange investigations, and FINMA issued an order concluding its formal proceedings with respect to UBS relating to its foreign exchange and precious metals businesses. UBS has paid a total of approximately CHF 774 million to these authorities, including GBP 234 million in fines to the FCA, USD 290 million in fines to the CFTC, and CHF 134 million to FINMA representing confiscation of costs avoided and profits. In May 2015, the Federal Reserve Board and the Connecticut Department of Banking issued an Order to Cease and Desist and Order of Assessment of a Civil Monetary Penalty Issued upon Consent (Federal Reserve Order) to UBS AG. As part of the Federal Reserve Order, UBS AG paid a USD 342 million civil monetary penalty.
Consolidated financial statements
Notes to the UBS Group AG consolidated financial statements
Note 22 Provisions and contingent liabilities (continued)
In May 2015, the DOJ’s Criminal Division (Criminal Division) terminated the December 2012 Non-Prosecution Agreement (NPA) with UBS AG related to UBS’s submissions of benchmark interest rates. As a result, UBS AG entered into a plea agreement with the Criminal Division pursuant to which UBS AG agreed to and did plead guilty to a one-count criminal information filed in the US District Court for the District of Connecticut charging UBS AG with one count of wire fraud in violation of 18 USC Sections 1343 and 2. Under the plea agreement, UBS AG agreed to a sentence that includes a USD 203 million fine and a three-year term of probation. The criminal information charges that between approximately 2001 and 2010, UBS AG engaged in a scheme to defraud counterparties to interest rate derivatives transactions by manipulating benchmark interest rates, including Yen LIBOR. Sentencing is currently scheduled for 9 May 2016. The Criminal Division terminated the NPA based on its determination, in its sole discretion, that certain UBS AG employees committed criminal conduct that violated the NPA, including fraudulent and deceptive currency trading and sales practices in conducting certain foreign exchange market transactions with clients and collusion with other participants in certain foreign exchange markets.
We have ongoing obligations to cooperate with these authorities and to undertake certain remediation, including actions to improve processes and controls.
UBS has been granted conditional immunity by the Antitrust Division of the DOJ (Antitrust Division) from prosecution for EUR / USD collusion and entered into a non-prosecution agreement covering other currency pairs. As a result, UBS AG will not be subject to prosecutions, fines or other sanctions for antitrust law violations by the Antitrust Division, subject to UBS AG’s continuing cooperation. However, the conditional immunity grant does not bar government agencies from asserting other claims and imposing sanctions against UBS AG, as evidenced by the settlements and ongoing investigations referred to above. UBS has also been granted conditional leniency by authorities in certain jurisdictions, including WEKO, in connection with potential competition law violations relating to precious metals, and as a result, will not be subject to prosecutions, fines or other sanctions for antitrust or competition law violations in those jurisdictions, subject to UBS AG’s continuing cooperation.
In October 2015, UBS AG settled charges with the SEC relating to structured notes issued by UBS AG that were linked to the UBS V10 Currency Index with Volatility Cap.
Investigations relating to foreign exchange and precious metals matters by numerous authorities, including the CFTC, remain ongoing notwithstanding these resolutions.
Foreign exchange-related civil litigation: Putative class actions have been filed since November 2013 in US federal courts and in other jurisdictions against UBS and other banks on behalf of putative classes of persons who engaged in foreign currency transactions with any of the defendant banks. They allege collusion by the defendants and assert claims under the antitrust laws and for unjust enrichment. In 2015, additional putative class actions were filed in federal court in New York against UBS and other banks on behalf of a putative class of persons who entered into or held any foreign exchange futures contracts and options on foreign exchange futures contracts since 1 January 2003. The complaints assert claims under the Commodity Exchange Act (CEA) and the US antitrust laws. In July 2015, a consolidated complaint was filed on behalf of both putative classes of persons covered by the US federal court class actions described above. UBS has entered into a settlement agreement that would resolve all of these US federal court class actions. The agreement, which has been preliminarily approved by the court and is subject to final court approval, requires, among other things, that UBS pay an aggregate of USD 141 million and provide cooperation to the settlement classes.
Note 22 Provisions and contingent liabilities (continued)
In June 2015, a putative class action was filed in federal court in New York against UBS and other banks on behalf of participants, beneficiaries, and named fiduciaries of plans qualified under the Employee Retirement Income Security Act of 1974 (ERISA) for whom a defendant bank provided foreign currency exchange transactional services, exercised discretionary authority or discretionary control over management of such ERISA plan, or authorized or permitted the execution of any foreign currency exchange transactional services involving such plan’s assets. The complaint asserts claims under ERISA.
In 2015, UBS was added to putative class actions pending against other banks in federal court in New York and other jurisdictions on behalf of putative classes of persons who bought or sold physical precious metals and various precious metal products and derivatives. The complaints in these lawsuits assert claims under the antitrust laws and the CEA, and other claims.
LIBOR and other benchmark-related regulatory matters: Numerous government agencies, including the SEC, the CFTC, the DOJ, the FCA, the SFO, the Monetary Authority of Singapore (MAS), the HKMA, FINMA, the various state attorneys general in the US, and competition authorities in various jurisdictions have conducted or are continuing to conduct investigations regarding submissions with respect to LIBOR and other benchmark rates. These investigations focus on whether there were improper attempts by UBS, among others, either acting on our own or together with others, to manipulate LIBOR and other benchmark rates at certain times.
In 2012, UBS reached settlements with the FSA, the CFTC and the Criminal Division of the DOJ in connection with their investigations of benchmark interest rates. At the same time, FINMA issued an order concluding its formal proceedings with respect to UBS relating to benchmark interest rates. UBS has paid a total of approximately CHF 1.4 billion in fines and disgorgement – including GBP 160 million in fines to the FSA, USD 700 million in fines to the CFTC, USD 500 million in fines to the DOJ, and CHF 59 million in disgorgement to FINMA. UBS Securities Japan Co. Ltd. (UBSSJ) entered into a plea agreement with the DOJ under which it entered a plea to one count of wire fraud relating to the manipulation of certain benchmark interest rates, including Yen LIBOR. UBS entered into an NPA with the DOJ, which (along with the plea agreement) covered conduct beyond the scope of the conditional leniency / immunity grants described below, required UBS to pay the USD 500 million fine to the DOJ after the sentencing of UBSSJ, and provided that any criminal penalties imposed on UBSSJ at sentencing be deducted from the USD 500 million fine. Under the NPA, we agreed, among other things, that for two years from 18 December 2012 UBS would not commit any US crime, and we would advise DOJ of any potentially criminal conduct by UBS or any of its employees relating to violations of US laws concerning fraud or securities and commodities markets. The term of the NPA was extended by one year to 18 December 2015. In May 2015, the Criminal Division terminated the NPA based on its determination, in its sole discretion, that certain UBS AG employees committed criminal conduct that violated the NPA. As a result, UBS entered into a plea agreement with the DOJ under which it entered a guilty plea to one count of wire fraud relating to the manipulation of certain benchmark interest rates, including Yen LIBOR, and agreed to pay a fine of USD 203 million and accept a three-year term of probation. Sentencing is currently scheduled for 9 May 2016.
In 2014, UBS reached a settlement with the European Commission (EC) regarding its investigation of bid-ask spreads in connection with Swiss franc interest rate derivatives and paid a EUR 12.7 million fine, which was reduced to this level based in part on UBS’s cooperation with the EC. The MAS, HKMA and the Japan Financial Services Agency have also resolved investigations of UBS (and in some cases, other banks). We have ongoing obligations to cooperate with the authorities with whom we have reached resolutions and to undertake certain remediation with respect to benchmark interest rate submissions.
Investigations by the CFTC, ASIC and other governmental authorities remain ongoing notwithstanding these resolutions.
Consolidated financial statements
Notes to the UBS Group AG consolidated financial statements
Note 22 Provisions and contingent liabilities (continued)
UBS has been granted conditional leniency or conditional immunity from authorities in certain jurisdictions, including the Antitrust Division of the DOJ, WEKO and the EC, in connection with potential antitrust or competition law violations related to submissions for Yen LIBOR and Euroyen TIBOR. WEKO has also granted UBS conditional immunity in connection with potential competition law violations related to submissions for CHF LIBOR and certain transactions related to CHF LIBOR. As a result of these conditional grants, we will not be subject to prosecutions, fines or other sanctions for antitrust or competition law violations in the jurisdictions where we have conditional immunity or leniency in connection with the matters covered by the conditional grants, subject to our continuing cooperation. However, the conditional leniency and conditional immunity grants we have received do not bar government agencies from asserting other claims and imposing sanctions against us, as evidenced by the settlements and ongoing investigations referred to above. In addition, as a result of the conditional leniency agreement with the DOJ, we are eligible for a limit on liability to actual rather than treble damages, were damages to be awarded in any civil antitrust action under US law based on conduct covered by the agreement and for relief from potential joint and several liability in connection with such civil antitrust action, subject to our satisfying the DOJ and the court presiding over the civil litigation of our cooperation. The conditional leniency and conditional immunity grants do not otherwise affect the ability of private parties to assert civil claims against us.
LIBOR and other benchmark-related civil litigation: A number of putative class actions and other actions are pending in, or expected to be transferred to, the federal courts in New York against UBS and numerous other banks on behalf of parties who transacted in certain interest rate benchmark-based derivatives. Also pending are actions asserting losses related to various products whose interest rate was linked to USD LIBOR, including adjustable rate mortgages, preferred and debt securities, bonds pledged as collateral, loans, depository accounts, investments and other interest-bearing instruments. All of the complaints allege manipulation, through various means, of various benchmark interest rates, including USD LIBOR, Euroyen TIBOR, Yen LIBOR, EURIBOR, CHF LIBOR, GBP LIBOR or USD ISDAFIX rates and seek unspecified compensatory and other damages under varying legal theories. In 2013, the court in the USD action dismissed the federal antitrust and racketeering claims of certain USD LIBOR plaintiffs and a portion of their claims brought under the CEA and state common law. Plaintiffs have appealed the dismissal, and the appeal remains pending. In 2014, the court in one of the Euroyen TIBOR lawsuits dismissed certain of the plaintiff’s claims, including federal antitrust claims. In 2015, the same court dismissed plaintiff's federal racketeering claims and affirmed its previous dismissal of plaintiff's antitrust claims. UBS and other defendants in other lawsuits including those related to EURIBOR, CHF LIBOR and GBP LIBOR have filed motions to dismiss.
Since September 2014, putative class actions have been filed in federal court in New York and New Jersey against UBS and other financial institutions, among others, on behalf of parties who entered into interest rate derivative transactions linked to ISDAFIX. The complaints, which have since been consolidated into an amended complaint, allege that the defendants conspired to manipulate ISDAFIX rates from 1 January 2006 through January 2014, in violation of US antitrust laws and the CEA, among other theories, and seeks unspecified compensatory damages, including treble damages. UBS and other defendants have filed a motion to dismiss, which remains pending.
Government bonds: Putative class actions have been filed in US federal courts against UBS and other banks on behalf of persons who participated in markets for US Treasury securities since 2007. The complaints generally allege that the banks colluded with respect to and manipulated prices of US Treasury securities sold at auction. They assert claims under the antitrust laws and the CEA and for unjust enrichment. The cases have been consolidated in the SDNY. Following filing of these complaints, UBS and reportedly other banks have received requests for information from various authorities regarding US Treasury securities and other government bond trading practices.
With respect to additional matters and jurisdictions not encompassed by the settlements and order referred to above, our balance sheet at 31 December 2015 reflected a provision in an amount that UBS believes to be appropriate under the applicable accounting standard. As in the case of other matters for which we have established provisions, the future outflow of resources in respect of such matters cannot be determined with certainty based on currently available information, and accordingly may ultimately prove to be substantially greater (or may be less) than the provision that we have recognized.
Note 22 Provisions and contingent liabilities (continued)
6. Swiss retrocessions
The Federal Supreme Court of Switzerland ruled in 2012, in a test case against UBS, that distribution fees paid to a firm for distributing third party and intra-group investment funds and structured products must be disclosed and surrendered to clients who have entered into a discretionary mandate agreement with the firm, absent a valid waiver.
FINMA has issued a supervisory note to all Swiss banks in response to the Supreme Court decision. The note sets forth the measures Swiss banks are to adopt, which include informing all affected clients about the Supreme Court decision and directing them to an internal bank contact for further details. UBS has met the FINMA requirements and has notified all potentially affected clients.
The Supreme Court decision has resulted, and may continue to result, in a number of client requests for UBS to disclose and potentially surrender retrocessions. Client requests are assessed on a case-by-case basis. Considerations taken into account when assessing these cases include, among others, the existence of a discretionary mandate and whether or not the client documentation contained a valid waiver with respect to distribution fees.
Our balance sheet at 31 December 2015 reflected a provision with respect to matters described in this item 6 in an amount that UBS believes to be appropriate under the applicable accounting standard. The ultimate exposure will depend on client requests and the resolution thereof, factors that are difficult to predict and assess. Hence, as in the case of other matters for which we have established provisions, the future outflow of resources in respect of such matters cannot be determined with certainty based on currently available information, and accordingly may ultimately prove to be substantially greater (or may be less) than the provision that we have recognized.
7. Banco UBS Pactual tax indemnity
Pursuant to the 2009 sale of Banco UBS Pactual S.A. (Pactual) by UBS to BTG Investments, LP (BTG), BTG has submitted contractual indemnification claims that UBS estimates amount to approximately BRL 2.4 billion, including interest and penalties, which is net of liabilities retained by BTG. The claims pertain principally to several tax assessments issued by the Brazilian tax authorities against Pactual relating to the period from December 2006 through March 2009, when UBS owned Pactual. The majority of these assessments relate to the deductibility of goodwill amortization in connection with UBS’s 2006 acquisition of Pactual and payments made to Pactual employees through various profit-sharing plans. These assessments are being challenged in administrative and judicial proceedings. In May 2015, the administrative court issued a decision that was largely in favor of the tax authority with respect to the goodwill amortization assessment. This decision has been appealed.
8. Matters relating to the CDS market
In 2013, the EC issued a Statement of Objections against 13 credit default swap (CDS) dealers including UBS, as well as data service provider Markit and the International Swaps and Derivatives Association (ISDA). The Statement of Objections broadly alleges that the dealers infringed European Union antitrust rules by colluding to prevent exchanges from entering the credit derivatives market between 2006 and 2009. In December 2015, the EC issued a statement that it had decided to close its investigation against all 13 dealers, including UBS. The EC’s investigation regarding Markit and ISDA is ongoing. Since mid-2009, the Antitrust Division of the DOJ has also been investigating whether multiple dealers, including UBS, conspired with each other and with Markit to restrain competition in the markets for CDS trading, clearing and other services. In 2014, putative class action plaintiffs filed consolidated amended complaints in the SDNY against 12 dealers, including UBS, as well as Markit and ISDA, alleging violations of the US Sherman Antitrust Act and common law. Plaintiffs allege that the defendants unlawfully conspired to restrain competition in and / or monopolize the market for CDS trading in the US in order to protect the dealers’ profits from trading CDS in the over-the-counter market. In September 2015, UBS and the other defendants entered into settlement agreements to resolve the litigation, pursuant to which UBS has paid USD 75 million out of a total settlement amount paid by all defendants of approximately USD 1.865 billion. The agreements have received preliminary court approval but are subject to final court approval. ▲
Consolidated financial statements
Notes to the UBS Group AG consolidated financial statements
Note 23 Other liabilities
CHF million | 31.12.15 | 31.12.14 |
Prime brokerage payables¹ | 45,306 | 38,633 |
Amounts due under unit-linked investment contracts | 15,718 | 17,643 |
Compensation-related liabilities | 6,839 | 6,732 |
of which: accrued expenses | 2,885 | 2,633 |
of which: deferred contingent capital plans | 1,181 | 794 |
of which: other deferred compensation plans | 2,038 | 1,931 |
of which: net defined benefit pension and post-employment liabilities² | 736 | 1,374 |
Third-party interest in consolidated investment funds | 536 | 648 |
Settlement and clearing accounts | 894 | 1,054 |
Current and deferred tax liabilities³ | 819 | 643 |
VAT and other tax payables | 447 | 422 |
Deferred income | 210 | 259 |
Accrued interest expenses | 1,431 | 1,327 |
Other accrued expenses | 2,500 | 2,473 |
Liabilities of disposal group held for sale⁴ | 235 | 0 |
Other | 718 | 1,279 |
Total other liabilities | 75,652 | 71,112 |
1 Prime brokerage services include clearance, settlement, custody, financing and portfolio reporting services for corporate clients trading across multiple asset classes. Prime brokerage payables are mainly comprised of client securities financing and deposits. 2 Refer to Note 28 for more information. 3 Refer to Note 8 for more information. 4 Refer to Note 32 for more information. |
Additional information
Note 24 Fair value measurement
This Note provides fair value measurement information for both financial and non-financial instruments and is structured as follows:
a) Valuation principles
b) Valuation governance
c) Valuation techniques
d) Valuation adjustments
e) Fair value measurements and classification within the fair value hierarchy
f) Transfers between Level 1 and Level 2 in the fair value
hierarchy
g) Movements of Level 3 instruments
h) Valuation of assets and liabilities classified as Level 3
i) Sensitivity of fair value measurements to changes in
unobservable input assumptions
j) Financial instruments not measured at fair value
Pillar 3 | a) Valuation principles
Fair value is defined as the price that would be received for the sale of an asset or paid to transfer a liability in an orderly transaction between market participants in the principal market (or most advantageous market, in the absence of a principal market) as of the measurement date. In measuring fair value, the Group utilizes various valuation approaches and applies a hierarchy for prices and inputs that maximizes the use of observable market data, if available.
All financial and non-financial assets and liabilities measured or disclosed at fair value are categorized into one of three fair value hierarchy levels. In certain cases, the inputs used to measure fair value may fall within different levels of the fair value hierarchy. For disclosure purposes, the level in the hierarchy within which the instrument is classified in its entirety is based on the lowest level input that is significant to the position’s fair value measurement:
– Level 1 – quoted prices (unadjusted) in active markets for identical assets and liabilities;
– Level 2 – valuation techniques for which all significant inputs are, or are based on, observable market data or
– Level 3 – valuation techniques for which significant inputs are not based on observable market data.
If available, fair values are determined using quoted prices in active markets for identical assets or liabilities. An active market is one in which transactions for the asset or liability take place with sufficient frequency and volume to provide pricing data on an ongoing basis. Assets and liabilities that are quoted and traded in an active market are valued at the currently quoted price multiplied by the number of units of the instrument held.
Where the market for a financial instrument or non-financial asset or liability is not active, fair value is established using a valuation technique, including pricing models. Valuation techniques involve the use of estimates, the extent of which depends on the complexity of the instrument and the availability of market-based data. Valuation adjustments may be made to allow for additional factors including model, liquidity, credit and funding risks, which are not explicitly captured within the valuation technique, but which would nevertheless be considered by market participants when establishing a price. The limitations inherent in a particular valuation technique are considered in the determination of an asset or liability’s classification within the fair value hierarchy.
Many cash instruments and over-the-counter (OTC) derivative contracts have bid and offer prices that can be observed in the marketplace. Bid prices reflect the highest price that a party is willing to pay for an asset. Offer prices represent the lowest price that a party is willing to accept for an asset. In general, long positions are measured at a bid price and short positions at an offer price, reflecting the prices at which the instruments could be transferred under normal market conditions. Offsetting positions in the same financial instrument are marked at the mid-price within the bid-offer spread.
Generally, the unit of account for a financial instrument is the individual instrument, and UBS applies valuation adjustments at an individual instrument level, consistent with that unit of account. However, if certain conditions are met, UBS may estimate the fair value of a portfolio of financial assets and liabilities with substantially similar and offsetting risk exposures on the basis of the net open risks.
For transactions where the valuation technique used to measure fair value requires significant inputs that are not based on observable market data, the financial instrument is initially recognized at the transaction price. This initial recognition amount may differ from the fair value obtained using the valuation technique. Any such difference is deferred and not recognized in the income statement and referred to as deferred day-1 profit or loss.
® Refer to Note 24d for more information ▲
Consolidated financial statements
Notes to the UBS Group AG consolidated financial statements
Note 24 Fair value measurement (continued)
Pillar 3 | b) Valuation governance
UBS’s fair value measurement and model governance framework includes numerous controls and other procedural safeguards that are intended to maximize the quality of fair value measurements reported in the financial statements. New products and valuation techniques must be reviewed and approved by key stakeholders from risk and finance control functions. Responsibility for the ongoing measurement of financial and non-financial instruments at fair value resides with the business divisions. In carrying out their valuation responsibilities, the businesses are required to consider the availability and quality of external market data and to provide justification and rationale for their fair value estimates.
The fair value estimates provided by the businesses are validated by risk and finance control functions, which are independent of the business divisions. Independent price verification is performed by finance through benchmarking the business divisions’ fair value estimates with observable market prices and other independent sources. Controls and governance are in place to ensure the quality of third-party pricing sources where used. For instruments where valuation models are used to determine fair value, independent valuation and model control groups within finance and risk evaluate UBS's models on a regular basis, including valuation and model input parameters as well as pricing. As a result of the valuation controls employed, valuation adjustments may be made to the business divisions’ estimates of fair value to align with independent market data and the relevant accounting standard.
® Refer to Note 24d for more information ▲
Pillar 3 | c) Valuation techniques
Valuation techniques are used to value positions for which a market price is not available from market sources. This includes certain less liquid debt and equity instruments, certain exchange-traded derivatives and all derivatives transacted in the OTC market. UBS uses widely recognized valuation techniques for determining the fair value of financial and non-financial instruments that are not actively traded and quoted. The most frequently applied valuation techniques include discounted value of expected cash flows, relative value and option pricing methodologies.
Discounted value of expected cash flows is a valuation technique that measures fair value using estimated expected future cash flows from assets or liabilities and then discounts these cash flows using a discount rate or discount margin that reflects the credit and / or funding spreads required by the market for instruments with similar risk and liquidity profiles to produce a present value. When using such valuation techniques, expected future cash flows are estimated using an observed or implied market price for the future cash flows or by using industry standard cash flow projection models. The discount factors within the calculation are generated using industry standard yield curve modeling techniques and models.
Relative value models measure fair value based on the market prices of equivalent or comparable assets or liabilities, making adjustments for differences between the characteristics of the observed instrument and the instrument being valued.
Option pricing models incorporate assumptions regarding the behavior of future price movements of an underlying referenced asset or assets to generate a probability-weighted future expected payoff for the option. The resulting probability-weighted expected payoff is then discounted using discount factors generated from industry standard yield curve modeling techniques and models. The option pricing model may be implemented using a closed-form analytical formula or other mathematical techniques (e.g., binomial tree or Monte Carlo simulation).
Where available, valuation techniques use market-observable assumptions and inputs. If such data is not available, inputs may be derived by reference to similar assets in active markets, from recent prices for comparable transactions or from other observable market data. In such cases, the inputs selected are based on historical experience and practice for similar or analogous instruments, derivation of input levels based on similar products with observable price levels and knowledge of current market conditions and valuation approaches.
For more complex instruments and instruments not traded in an active market, fair values may be estimated using a combination of observed transaction prices, consensus pricing services and relevant quotes. Consideration is given to the nature of the quotes (e.g., indicative or firm) and the relationship of recently evidenced market activity to the prices provided by consensus pricing services. UBS also uses internally developed models, which are typically based on valuation methods and techniques recognized as standard within the industry.
Note 24 Fair value measurement (continued)
Assumptions and inputs used in valuation techniques include benchmark interest rate curves, credit and funding spreads used in estimating discount rates, bond and equity prices, equity index prices, foreign exchange rates, levels of market volatility and correlation. Refer to Notes 24e and 24h for more information. The discount curves used by the Group incorporate the funding and credit characteristics of the instruments to which they are applied. ▲
Pillar 3 | d) Valuation adjustments
The output of a valuation technique is always an estimate of a fair value that cannot be measured with complete certainty. As a result, valuations are adjusted, where appropriate and when such factors would be considered by market participants in estimating fair value, to reflect close-out costs, credit exposure, model-driven valuation uncertainty, funding costs and benefits, trading restrictions and other factors. Valuation adjustments are an important component of fair value for assets and liabilities that are measured using valuation techniques. Such adjustments are applied to reflect uncertainties within the fair value measurement process, to adjust for an identified model simplification or to incorporate an aspect of fair value that requires an overall portfolio assessment rather than an evaluation based on an individual instrument level characteristic.
The major classes of valuation adjustments are discussed in further detail below.
Day-1 reserves
For new transactions where the valuation technique used to measure fair value requires significant inputs that are not based on observable market data, the financial instrument is initially recognized at the transaction price. The transaction price may differ from the fair value obtained using a valuation technique where any such difference is deferred and not initially recognized in the income statement. These day-1 profit or loss reserves are reflected, where appropriate, as valuation adjustments.
The table below summarizes the changes in deferred day-1 profit or loss reserves during the respective period. Amounts deferred are released and gains or losses are recorded in Net trading income when pricing of equivalent products or the underlying parameters become observable or when the transaction is closed out.
Deferred day-1 profit or loss | |
| | For the year ended |
CHF million | | 31.12.15 | 31.12.14 | 31.12.13 |
Balance at the beginning of the year | | 480 | 486 | 474 |
Profit / (loss) deferred on new transactions | | 268 | 344 | 694 |
(Profit) / loss recognized in the income statement | | (321) | (384) | (653) |
Foreign currency translation | | (6) | 35 | (29) |
Balance at the end of the year | | 421 | 480 | 486 |
Consolidated financial statements
Notes to the UBS Group AG consolidated financial statements
Note 24 Fair value measurement (continued)
Own credit adjustments on financial liabilities designated at fair value
In addition to considering the valuation of the derivative risk component, the valuation of fair value option liabilities also requires consideration of the funded component and specifically the own credit component of fair value. Own credit risk is reflected in the valuation of our fair value option liabilities where this component is considered relevant for valuation purposes by our counterparties and other market participants. On the other hand, own credit risk is not reflected in the valuation of our liabilities that are fully collateralized or for other obligations for which it is established market practice not to include an own credit component.
In 2015, UBS made enhancements to the valuation methodology for the own credit component of fair value of financial liabilities designated at fair value. Prior to the fourth quarter of 2015, own credit was estimated using a funds transfer pricing curve (FTP), which was derived by discounting UBS new issuance senior debt curve spreads, with the discount primarily reflecting the differences between the spreads in the senior unsecured debt market for UBS debt and the levels at which UBS medium-term notes (MTN) were issued. A decline in long-dated UBS MTN issuance volumes, following UBS’s business transformation, resulted in a reduction in the observable market data available to benchmark the FTP. From the fourth quarter of 2015 onwards, own credit is estimated using an own credit adjustment curve (OCA), which incorporates more observable market data, including market-observed secondary prices for UBS senior debt, UBS credit default swap (CDS) spreads and senior debt curves of peers. This change in accounting estimate was finalized in the fourth quarter of 2015, following a multi-period implementation project to develop an enhanced fair value approach supported by related infrastructure enhancements. The change was implemented on a prospective basis in the fourth quarter of 2015 and resulted in a gain of CHF 260 million on a total carrying amount of CHF 63 billion in financial liabilities designated at fair value.
OCA is generally a Level 2 pricing input. However, certain long-dated exposures that are beyond the tenors that are actively traded are classified as Level 3.
The effects of own credit adjustments related to financial liabilities designated at fair value (predominantly issued structured products) are summarized in the table below.
Life-to-date amounts reflect the cumulative change since initial recognition. The change in own credit for the period consists of changes in fair value that are attributable to the change in UBS’s credit spreads, as well as the effect of changes in fair values attributable to factors other than credit spreads, such as redemptions, effects from time decay and changes in interest and other market rates. ▲
Own credit adjustments on financial liabilities designated at fair value | | | | |
| | As of or for the year ended |
CHF million | | 31.12.15 | 31.12.14 | 31.12.13 |
Gain / (loss) for the year ended | | 553 | 292 | (283) |
Life-to-date gain / (loss) | | 287 | (302) | (577) |
Note 24 Fair value measurement (continued)
Credit valuation adjustments
In order to measure the fair value of OTC derivative instruments, including funded derivative instruments which are classified as Financial assets designated at fair value, credit valuation adjustments (CVA) are necessary to reflect the credit risk of the counterparty inherent in these instruments. This amount represents the estimated fair value of protection required to hedge the counterparty credit risk of such instruments. A CVA is determined for each counterparty, considering all exposures to that counterparty, and is dependent on the expected future value of exposures, default probabilities and recovery rates, applicable collateral or netting arrangements, break clauses and other contractual factors.
Funding valuation adjustments
Funding valuation adjustments (FVA) reflect the costs and benefits of funding associated with uncollateralized and partially collateralized derivative receivables and payables and are calculated as the valuation impact from moving the discounting of the uncollateralized derivative cash flows from LIBOR to OCA using the CVA framework.
In the fourth quarter of 2015, as mentioned above, UBS replaced the FTP curve with the OCA curve for purposes of valuing its liabilities carried at fair value. As applied to the FVA associated with uncollateralized and partially collateralized derivative payables, the change resulted in a charge to the income statement of CHF 40 million.
An FVA is also applied to collateralized derivative assets in cases where the collateral cannot be sold or repledged.
Debit valuation adjustments
A debit valuation adjustment (DVA) is estimated to incorporate own credit in the valuation of derivatives, effectively consistent with the CVA framework. DVA is determined for each counterparty, considering all exposures with that counterparty and taking into account collateral netting agreements, expected future mark-to-market movements and UBS’s credit default spreads. Upon the implementation of FVA in the second half of 2014, UBS reversed DVA to the extent it overlapped with FVA.
Other valuation adjustments
Instruments that are measured as part of a portfolio of combined long and short positions are valued at mid-market levels to ensure consistent valuation of the long and short component risks. A liquidity valuation adjustment is then made to the overall net long or short exposure to move the fair value to bid or offer as appropriate, reflecting current levels of market liquidity. The bid-offer spreads used in the calculation of this valuation adjustment are obtained from market transactions and other relevant sources and are updated periodically.
Uncertainties associated with the use of model-based valuations are incorporated into the measurement of fair value through the use of model reserves. These reserves reflect the amounts that the Group estimates should be deducted from valuations produced directly by models to incorporate uncertainties in the relevant modeling assumptions, in the model and market inputs used, or in the calibration of the model output to adjust for known model deficiencies. In arriving at these estimates, the Group considers a range of market practices, including how it believes market participants would assess these uncertainties. Model reserves are reassessed periodically in light of data from market transactions, consensus pricing services and other relevant sources.
Valuation adjustments on financial instruments | | | |
| | As of |
Life-to-date gain / (loss), CHF billion | | 31.12.15 | 31.12.14 |
Credit valuation adjustments¹ | | (0.3) | (0.5) |
Funding valuation adjustments | | (0.2) | (0.1) |
Debit valuation adjustments | | 0.0 | 0.0 |
Other valuation adjustments | | (0.8) | (0.9) |
of which: liquidity | | (0.5) | (0.5) |
of which: model uncertainty | | (0.3) | (0.4) |
1 Amounts do not include reserves against defaulted counterparties. |
Consolidated financial statements
Notes to the UBS Group AG consolidated financial statements
Note 24 Fair value measurement (continued)
e) Fair value measurements and classification within the fair value hierarchy
The fair value hierarchy classification of financial and non-financial assets and liabilities measured at fair value is summarized in the table below. The narrative that follows describes the significant valuation inputs and assumptions for each class of assets and liabilities measured at fair value, the valuation techniques, where applicable, used in measuring their fair value, and the factors determining their classification within the fair value hierarchy.
Determination of fair values from quoted market prices or valuation techniques¹ |
| | 31.12.15 | | 31.12.14 |
CHF billion | | Level 1 | Level 2 | Level 3 | Total | | Level 1 | Level 2 | Level 3 | Total |
| | | | | | | | | | |
Assets measured at fair value on a recurring basis | | | | | | | | | | |
| | | | | | | | | | |
Financial assets held for trading² | | 96.4 | 21.9 | 2.1 | 120.4 | | 101.7 | 27.2 | 3.5 | 132.4 |
of which: | | | | | | | | | | |
Government bills / bonds | | 12.9 | 3.3 | 0.0 | 16.2 | | 8.8 | 4.7 | 0.0 | 13.6 |
Corporate bonds and municipal bonds, including bonds issued by financial institutions | | 0.2 | 8.1 | 0.7 | 9.0 | | 0.6 | 11.0 | 1.4 | 12.9 |
Loans | | 0.0 | 1.8 | 0.8 | 2.6 | | 0.0 | 2.2 | 1.1 | 3.2 |
Investment fund units | | 6.1 | 5.7 | 0.2 | 11.9 | | 6.7 | 6.4 | 0.3 | 13.4 |
Asset-backed securities | | 0.0 | 1.0 | 0.2 | 1.2 | | 0.0 | 1.5 | 0.6 | 2.1 |
Equity instruments | | 62.4 | 1.5 | 0.1 | 64.0 | | 68.8 | 0.8 | 0.1 | 69.8 |
Financial assets for unit-linked investment contracts | | 14.8 | 0.7 | 0.1 | 15.5 | | 16.8 | 0.6 | 0.1 | 17.4 |
| | | | | | | | | | |
Positive replacement values | | 0.5 | 164.0 | 2.9 | 167.4 | | 1.0 | 251.6 | 4.4 | 257.0 |
of which: | | | | | | | | | | |
Interest rate contracts | | 0.0 | 74.4 | 0.1 | 74.5 | | 0.0 | 123.4 | 0.2 | 123.7 |
Credit derivative contracts | | 0.0 | 5.4 | 1.3 | 6.7 | | 0.0 | 9.8 | 1.7 | 11.5 |
Foreign exchange contracts | | 0.3 | 64.9 | 0.5 | 65.7 | | 0.7 | 97.0 | 0.6 | 98.4 |
Equity / index contracts | | 0.0 | 15.9 | 1.0 | 16.9 | | 0.0 | 17.7 | 1.9 | 19.5 |
Commodity contracts | | 0.0 | 3.4 | 0.0 | 3.4 | | 0.0 | 3.6 | 0.0 | 3.6 |
| | | | | | | | | | |
Financial assets designated at fair value | | 0.2 | 2.7 | 3.3 | 6.1 | | 0.1 | 1.3 | 3.5 | 5.0 |
of which: | | | | | | | | | | |
Loans (including structured loans) | | 0.0 | 2.3 | 1.7 | 4.0 | | 0.0 | 0.8 | 1.0 | 1.7 |
Structured reverse repurchase and securities borrowing agreements | | 0.0 | 0.0 | 1.5 | 1.6 | | 0.0 | 0.1 | 2.4 | 2.5 |
Other | | 0.2 | 0.3 | 0.1 | 0.6 | | 0.1 | 0.5 | 0.1 | 0.7 |
| | | | | | | | | | |
Financial investments available-for-sale | | 34.2 | 27.7 | 0.7 | 62.5 | | 32.7 | 23.9 | 0.6 | 57.2 |
of which: | | | | | | | | | | |
Government bills / bonds | | 31.1 | 2.0 | 0.0 | 33.1 | | 30.3 | 2.8 | 0.0 | 33.1 |
Corporate bonds and municipal bonds, including bonds issued by financial institutions | | 3.0 | 22.2 | 0.0 | 25.2 | | 2.2 | 16.9 | 0.0 | 19.1 |
Investment fund units | | 0.0 | 0.1 | 0.1 | 0.2 | | 0.0 | 0.1 | 0.2 | 0.3 |
Asset-backed securities | | 0.0 | 3.4 | 0.0 | 3.4 | | 0.0 | 4.0 | 0.0 | 4.0 |
Equity instruments | | 0.1 | 0.0 | 0.5 | 0.6 | | 0.2 | 0.1 | 0.4 | 0.7 |
| | | | | | | | | | |
Non-financial assets | | | | | | | | | | |
Precious metals and other physical commodities | | 3.7 | 0.0 | 0.0 | 3.7 | | 5.8 | 0.0 | 0.0 | 5.8 |
| | | | | | | | | | |
Assets measured at fair value on a non-recurring basis | | | | | | | | | | |
Other assets³ | | 0.3 | 0.1 | 0.1 | 0.4 | | 0.0 | 0.1 | 0.2 | 0.2 |
Total assets measured at fair value | | 135.2 | 216.4 | 9.0 | 360.6 | | 141.4 | 304.0 | 12.2 | 457.5 |
Note 24 Fair value measurement (continued)
Determination of fair values from quoted market prices or valuation techniques¹ (continued) |
| | 31.12.15 | | 31.12.14 |
CHF billion | | Level 1 | Level 2 | Level 3 | Total | | Level 1 | Level 2 | Level 3 | Total |
| | | | | | | | | | |
Liabilities measured at fair value on a recurring basis | | | | | | | | | | |
| | | | | | | | | | |
Trading portfolio liabilities | | 25.5 | 3.5 | 0.2 | 29.1 | | 23.9 | 3.9 | 0.1 | 28.0 |
of which: | | | | | | | | | | |
Government bills / bonds | | 6.0 | 0.8 | 0.0 | 6.8 | | 7.0 | 1.2 | 0.0 | 8.2 |
Corporate bonds and municipal bonds, including bonds issued by financial institutions | | 0.0 | 2.4 | 0.1 | 2.5 | | 0.1 | 2.4 | 0.1 | 2.6 |
Investment fund units | | 0.7 | 0.1 | 0.0 | 0.7 | | 1.1 | 0.1 | 0.0 | 1.2 |
Asset-backed securities | | 0.0 | 0.0 | 0.0 | 0.0 | | 0.0 | 0.0 | 0.0 | 0.0 |
Equity instruments | | 18.8 | 0.2 | 0.0 | 19.1 | | 15.7 | 0.1 | 0.0 | 15.9 |
| | | | | | | | | | |
Negative replacement values | | 0.6 | 158.5 | 3.3 | 162.4 | | 1.1 | 248.1 | 5.0 | 254.1 |
of which: | | | | | | | | | | |
Interest rate contracts | | 0.0 | 67.2 | 0.3 | 67.6 | | 0.0 | 117.3 | 0.6 | 117.9 |
Credit derivative contracts | | 0.0 | 5.4 | 1.3 | 6.7 | | 0.0 | 10.0 | 1.7 | 11.7 |
Foreign exchange contracts | | 0.3 | 63.0 | 0.2 | 63.5 | | 0.7 | 96.6 | 0.3 | 97.6 |
Equity / index contracts | | 0.0 | 19.7 | 1.4 | 21.2 | | 0.0 | 20.9 | 2.4 | 23.3 |
Commodity contracts | | 0.0 | 3.2 | 0.0 | 3.2 | | 0.0 | 3.2 | 0.0 | 3.2 |
| | | | | | | | | | |
Financial liabilities designated at fair value | | 0.0 | 52.3 | 10.7 | 63.0 | | 0.0 | 63.4 | 11.9 | 75.3 |
of which: | | | | | | | | | | |
Non-structured fixed-rate bonds | | 0.0 | 1.5 | 2.6 | 4.1 | | 0.0 | 2.3 | 2.2 | 4.5 |
Structured debt instruments issued | | 0.0 | 45.7 | 6.7 | 52.4 | | 0.0 | 56.6 | 7.3 | 63.9 |
Structured over-the-counter debt instruments | | 0.0 | 4.7 | 0.8 | 5.5 | | 0.0 | 4.1 | 1.5 | 5.7 |
Structured repurchase agreements | | 0.0 | 0.3 | 0.6 | 0.8 | | 0.0 | 0.3 | 0.9 | 1.2 |
Loan commitments and guarantees | | 0.0 | 0.1 | 0.0 | 0.1 | | 0.0 | 0.1 | 0.0 | 0.1 |
| | | | | | | | | | |
Other liabilities – amounts due under unit-linked investment contracts | | 0.0 | 15.7 | 0.0 | 15.7 | | 0.0 | 17.6 | 0.0 | 17.6 |
| | | | | | | | | | |
Liabilities measured at fair value on a non-recurring basis | | | | | | | | | | |
Other liabilities³ | | 0.0 | 0.2 | 0.0 | 0.2 | | 0.0 | 0.0 | 0.0 | 0.0 |
Total liabilities measured at fair value | | 26.1 | 230.3 | 14.1 | 270.5 | | 25.0 | 333.0 | 17.0 | 375.0 |
1 Bifurcated embedded derivatives are presented on the same balance sheet lines as their host contracts and are excluded from this table. As of 31 December 2015, net bifurcated embedded derivative liabilities held at fair value, totaling CHF 0.1 billion (of which CHF 0.1 billion were net Level 2 assets and CHF 0.2 billion net Level 2 liabilities) were recognized on the balance sheet within Debt issued. As of 31 December 2014, net bifurcated embedded derivative liabilities held at fair value, totaling CHF 0.0 billion (of which CHF 0.3 billion were net Level 2 assets and CHF 0.3 billion net Level 2 liabilities) were recognized on the balance sheet within Debt issued. 2 Financial assets held for trading do not include precious metals and other physical commodities. 3 Other assets and other liabilities primarily consist of assets held for sale as well as assets and liabilities of a disposal group held for sale, which are measured at the lower of their net carrying amount or fair value less costs to sell. Refer to Note 32 for more information on the disposal group held for sale. |
Consolidated financial statements
Notes to the UBS Group AG consolidated financial statements
Note 24 Fair value measurement (continued)
Financial assets and liabilities held for trading, financial assets designated at fair value and financial investments classified as available-for-sale
Government bills and bonds
Government bills and bonds include fixed-rate, floating-rate and inflation-linked bills and bonds issued by sovereign governments, as well as interest and principal strips based on these bonds. Such instruments are generally traded in active markets and prices can be obtained directly from these markets, resulting in classification as Level 1, while the remaining positions are classified as Level 2. Instruments that cannot be priced directly using active market data are valued using discounted cash flow valuation techniques that incorporate market data for similar government instruments converted into yield curves. These yield curves are used to project future index levels, and to discount expected future cash flows. The main inputs to valuation techniques for these instruments are bond prices and inputs to estimate the future index levels for floating or inflation index-linked instruments. Instruments classified as Level 3 are limited and are generally classified as such due to the requirement to extrapolate yield curve inputs outside the range of active market trading.
Corporate and municipal bonds
Corporate bonds include senior, junior and subordinated debt issued by corporate entities. Municipal bonds are issued by state and local governments. While most instruments are standard fixed or floating-rate securities, some may have more complex coupon or embedded option features. Corporate and municipal bonds are generally valued using prices obtained directly from the market. In cases where no directly comparable price is available, instruments may be valued using yields derived from other securities by the same issuer or benchmarked against similar securities, adjusted for seniority, maturity and liquidity. Instruments that cannot be priced directly using active market data are valued using discounted cash flow valuation techniques incorporating the credit spread of the issuer, which may be derived from other issuances or CDS data for the issuer, estimated with reference to other equivalent issuer price observations or from credit modeling techniques. Corporate bonds are typically classified as Level 2 because, although market data is readily available, there is often insufficient third-party trading transaction data to justify an active market and corresponding Level 1 classification. Municipal bonds are generally classified as Level 1 or Level 2 depending on the depth of trading activity behind price sources. Level 3 instruments have no suitable price available and also cannot be referenced to other securities issued by the same issuer. Therefore, these instruments are measured based on price levels for similar issuers adjusted for relative tenor and issuer quality.
Convertible bonds are generally valued using prices obtained directly from market sources. In cases where no directly comparable price is available, issuances may be priced using a convertible bond model, which values the embedded equity option and debt components and discounts these amounts using a curve that incorporates the credit spread of the issuer. Although market data is readily available, convertible bonds are typically classified as Level 2 because there is insufficient third-party trading transaction data to justify a Level 1 classification.
Pillar 3 | Traded loans and loans designated at fair value
Traded loans and loans designated at fair value are valued directly using market prices that reflect recent transactions or quoted dealer prices where available. For illiquid loans where no market price data are available, alternative valuation techniques are used, which include relative value benchmarking using pricing derived from debt instruments in comparable entities or different products in the same entity. The corporate lending portfolio is valued using either directly observed market prices typically from consensus providers, or by using a credit default swap valuation technique, which requires inputs for credit spreads, credit recovery rates and interest rates. Even though price data are generally available for these instruments, corporate loans typically do not satisfy Level 1 classification criteria insofar as the price data may not be directly observable, and moreover the market for these instruments is not actively traded. Instruments with suitably deep and liquid price data available will be classified as Level 2, while any positions requiring the use of valuation techniques or for which the price sources have insufficient trading depth are classified as Level 3. Recently originated commercial real estate loans that are classified as Level 3 are measured using a securitization approach based on rating agency guidelines.
Included within loans are various contingent lending transactions for which valuations are dependent on actuarial mortality levels and actuarial life insurance policy lapse rates. Mortality and lapse rate assumptions are based on external actuarial estimations for large homogeneous pools, and contingencies are derived from a range relative to the actuarially expected amount. In addition, the pricing technique uses volatility of mortality as an input. ▲
Note 24 Fair value measurement (continued)
Investment fund units
Investment fund units are predominantly exchange-traded, with readily available quoted prices in liquid markets. Where market prices are not available, fair value may be measured using net asset values (NAV), taking into account any restrictions imposed upon redemption. Listed units are classified as Level 1, provided there is sufficient trading to justify active market classification, while other positions are classified as Level 2. Positions where NAV is not available or which are not redeemable at the measurement date or in the near future are classified as Level 3.
Pillar 3 | Asset-backed securities: residential mortgage-backed securities (RMBS), commercial mortgage-backed securities (CMBS), other asset-backed securities (ABS) and collateralized debt obligations (CDO)
RMBS, CMBS, ABS and CDO are instruments generally issued through the process of securitization of underlying interest-bearing assets. The underlying collateral for RMBS is residential mortgages, for CMBS, commercial mortgages, for ABS, other assets such as credit card, car or student loans and leases, and for CDO, other securitized positions of RMBS, CMBS or ABS. The market for these securities is not active, and therefore a variety of valuation techniques are used to measure fair value. For more liquid securities, trade data or quoted prices may be obtained periodically for the instrument held, and the valuation process will use this trade and price data, updated for movements in market levels between the time of trading and the time of valuation. Less liquid instruments are measured using discounted expected cash flows incorporating price data for instruments or indices with similar risk profiles. Expected cash flow estimation involves the modeling of the expected collateral cash flows using input assumptions derived from proprietary models, fundamental analysis and / or market research based on management’s quantitative and qualitative assessment of current and future economic conditions. The expected collateral cash flows estimated are then converted into the securities’ projected performance under such conditions based on the credit enhancement and subordination terms of the securitization. Expected cash flow schedules are discounted using a rate or discount margin that reflects the discount levels required by the market for instruments with similar risk and liquidity profiles. Inputs to discounted expected cash flow techniques include asset prepayment rates, discount margin or discount yields, asset default rates and asset loss on default severity, which may in turn be estimated using more fundamental loan and economic drivers such as, but not limited to, loan-to-value data, house price appreciation, foreclosure costs, rental income levels, void periods and employment rates. RMBS, CMBS and ABS are generally classified as Level 2. However, if significant inputs are unobservable, or if market or fundamental data are not available for instruments or collateral with a sufficiently similar risk profile to the positions held, they are classified as Level 3.
Equity instruments
The majority of equity securities are actively traded on public stock exchanges where quoted prices are readily and regularly available, resulting in their classification as Level 1. Units held in hedge funds are also classified as equity instruments. Fair value for these units is measured based on their published NAV, taking into account any restrictions imposed upon the redemption. These units are classified as Level 2, except for positions where published NAV is not available or which are not redeemable at the measurement date or in the near future, in which case they are classified as Level 3.
Unlisted equity holdings, including private equity positions, are initially marked at their transaction price and are revalued to the extent reliable evidence of price movements becomes available or the position is deemed to be impaired. ▲
Financial assets underlying unit-linked investment contracts
Unit-linked investment contracts allow investors to invest in a pool of assets through issued investment units. The unit holders are exposed to all risks and rewards associated with the reference asset pool. Assets held under unit-linked investment contracts are presented as Trading portfolio assets. The majority of assets are listed on exchanges and are classified as Level 1 if actively traded, or Level 2 if trading is not active. However, instruments for which prices are not readily available are classified as Level 3.
Structured (reverse) repurchase agreements
Structured (reverse) repurchase agreements designated at fair value are measured using discounted expected cash flow techniques. The discount rate applied is based on funding curves that are specific to the collateral eligibility terms for the contract in question. Collateral terms for these positions are not standard and therefore funding spread levels used for valuation purposes cannot be observed in the market. As a result, these positions are mostly classified as Level 3.
Consolidated financial statements
Notes to the UBS Group AG consolidated financial statements
Note 24 Fair value measurement (continued)
Replacement values
The curves used for discounting expected cash flows in the valuation of collateralized derivatives reflect the funding terms associated with the relevant collateral arrangement for the instrument being valued. These collateral arrangements differ across counterparties with respect to the eligible currency and interest terms of the collateral. The majority of collateralized derivatives are measured using a discount curve that is based on funding rates derived from overnight interest in the cheapest eligible currency for the respective counterparty collateral agreement.
Uncollateralized and partially collateralized derivatives are discounted using the LIBOR (or equivalent) curve for the currency of the instrument. As described in Note 24d, the fair value of uncollateralized and partially collateralized derivatives is then adjusted by CVA, DVA and FVA as applicable, to reflect an estimation of the impact of counterparty credit risk, UBS’s own credit risk and funding costs and benefits.
Interest rate contracts
Interest rate swap contracts include interest rate swaps, basis swaps, cross-currency swaps, inflation swaps and interest rate forwards, often referred to as forward-rate agreements (FRA). These products are valued by estimating future interest cash flows and discounting those cash flows using a rate that reflects the appropriate funding rate for the position being measured. The yield curves used to estimate future index levels and discount rates are generated using market standard yield curve models using interest rates associated with current market activity. The key inputs to the models are interest rate swap rates, FRA rates, short-term interest rate futures prices, basis swap spreads and inflation swap rates. In most cases, the standard market contracts that form the inputs for yield curve models are traded in active and observable markets, resulting in the majority of these financial instruments being classified as Level 2.
Interest rate option contracts include caps and floors, swaptions, swaps with complex payoff profiles and other more complex interest rate options. These contracts are valued using various market standard option models, using inputs that include interest rate yield curves, inflation curves, volatilities and correlations. The volatility and correlation inputs within the models are implied from market data based on market observed prices for standard option instruments trading within the market. Option models used to value more exotic products have a number of model parameter inputs that require calibration to enable the exotic model to price standard option instruments to the price levels observed in the market. Although these inputs cannot be directly observed, they are generally treated as Level 2, as the calibration process enables the model output to be validated to active market levels. Models calibrated in this way are then used to revalue the portfolio of both standard options as well as more exotic products. In most cases, there are active and observable markets for the standard market instruments that form the inputs for yield curve models as well as the financial instruments from which volatility and correlation inputs are derived, resulting in the majority of these products being classified as Level 2. Within interest rate option contracts, exotic options for which appropriate volatility or correlation input levels cannot be implied from observable market data are classified as Level 3. These options are valued using volatility and correlation levels derived from non-market sources.
Interest rate swap and option contracts are classified as Level 3 when the maturity of the contract exceeds the term for which standard market quotes are observable for a significant input parameter. Such positions are valued by extrapolation from the last observable point using standard assumptions or by reference to another observable comparable input parameter to represent a suitable proxy for that portion of the term.
Balance guaranteed swaps (BGS) are interest rate or currency swaps that have a notional schedule based on a securitization vehicle, requiring the valuation to incorporate an adjustment for the unknown future variability of the notional schedule. Inputs to value BGS are those used to value the standard market risk on the swap and those used to estimate the notional schedule of the underlying securitization pool (i.e., prepayment, default and interest rates). BGS are classified as Level 3, as the correlation between unscheduled notional changes and the underlying market risk of the BGS does not have an active market and cannot be observed.
Note 24 Fair value measurement (continued)
Credit derivative contracts
Credit derivative contracts based on a single credit name include credit default swaps (CDS) based on corporate and sovereign single names, CDS on loans and certain total return swaps (TRS). These contracts are valued by estimating future default probabilities using industry standard models based on market credit spreads, upfront pricing points and implied recovery rates. These default and recovery assumptions are used to generate future expected cash flows that are then discounted using market standard discounted cash flow models and a discount rate that reflects the appropriate funding rate for that portion of the portfolio. TRS and certain single-name CDS contracts for which a derivative-based credit spread is not directly available are valued using a credit spread derived from the price of the cash bond that is referenced in the credit derivative, adjusted for any funding differences between the cash and synthetic product. Loan CDS for which a credit spread cannot be observed directly may be valued, where possible, using the corporate debt curve for the entity, adjusted for differences between loan and debt default definitions and recovery rate assumptions. Inputs to the valuation models used to value single-name and loan CDS include single-name credit spreads and upfront pricing points, recovery rates and funding curves. In addition, corporate bond prices are used as inputs to the valuation model for TRS and certain single-name or loan CDS as described. Many single-name credit default swaps are classified as Level 2 because the credit spreads and recovery rates used to value these contracts are actively traded and observable market data are available. Where the underlying reference name is not actively traded, these contracts are classified as Level 3.
Credit derivative contracts based on a portfolio of credit names include credit default swaps on a credit index, credit default swaps based on a bespoke portfolio or first to default swaps (FTD). The valuation of these contracts is similar to that described above for single-name CDS and includes an estimation of future default probabilities using industry standard models based on market credit spreads, upfront pricing points and implied recovery rates. These default and recovery assumptions are used to generate future expected cash flows that are then discounted using market standard discounted cash flow models based on an estimation of the funding rate for that portion of the portfolio. Tranche products and FTD are valued using industry standard models that, in addition to default and recovery assumptions as above, incorporate implied correlations to be applied to the credits within the portfolio in order to apportion the expected credit loss at a portfolio level across the different tranches or names within the overall structure. These correlation assumptions are derived from prices of actively traded index tranches or other FTD baskets. Inputs to the valuation models used for all portfolio credit default swaps include single-name or index credit spreads and upfront pricing points, recovery rates and funding curves. In addition, models used for tranche and FTD products have implied credit correlations as inputs. Credit derivative contracts based on a portfolio of credit names are classified as Level 2 when credit spreads and recovery rates are determined from actively traded observable market data, and when the correlation data used to value bespoke and index tranches are based on actively traded index tranche instruments. These correlation data undergo a mapping process that takes into account both the relative tranche attachment / detachment points in the overall capital structure of the portfolio and portfolio composition. Where the mapping process requires extrapolation beyond the range of available and active market data, the position is classified as Level 3. This relates to a small number of index and all bespoke tranche contracts. FTD are classified as Level 3 as the correlations between specific names in the FTD portfolio are not actively traded. Also classified as Level 3 are several older credit index positions, referred to as off-the-run indices, due to the lack of any active market for the index credit spread.
Credit derivative contracts on securitized products have an underlying reference asset that is a securitized product (RMBS, CMBS, ABS or CDO) and include credit default swaps and certain TRS. These credit default swaps (typically referred to as pay-as-you-go (PAYG) CDS) and TRS are valued using a similar valuation technique to the underlying security (by reference to equivalent securities trading in the market, or through cash flow estimation and discounted cash flow techniques as described in the Asset-backed securities section above), with an adjustment made to reflect the funding differences between cash and synthetic form. Inputs to the PAYG CDS and TRS are those used to value the underlying security (prepayment rates, default rates, loss severity, discount margin / rate and other inputs) and those used to capture the funding basis differential between cash and synthetic form. The classification of PAYG CDS and these TRS follow the characteristics of the underlying security and are therefore distributed across Level 2 and Level 3.
Consolidated financial statements
Notes to the UBS Group AG consolidated financial statements
Note 24 Fair value measurement (continued)
Foreign exchange (FX) contracts
Open spot FX contracts are valued using the FX spot rate observed in the market. Forward FX contracts are valued using the FX spot rate adjusted for forward pricing points observed from standard market-based sources. As the markets for both FX spot and FX forward pricing points are both actively traded and observable, FX contracts are generally classified as Level 2.
OTC FX option contracts include standard call and put options, options with multiple exercise dates, path-dependent options, options with averaging features, options with discontinuous pay-off characteristics and options on a number of underlying FX rates. OTC FX option contracts are valued using market standard option valuation models. The models used for shorter-dated options (i.e., maturities of five years or less) tend to be different than those used for longer-dated options because the models needed for longer-dated OTC FX contracts require additional consideration of interest rate and FX rate interdependency. Inputs to the option valuation models include spot FX rates, FX forward points, FX volatilities, interest rate yield curves, interest rate volatilities and correlations. The inputs for volatility and correlation are implied through the calibration of observed prices for standard option contracts trading within the market.
As inputs are derived mostly from standard market contracts traded in active and observable markets, a significant proportion of OTC FX option contracts are classified as Level 2. OTC FX option contracts classified as Level 3 include long-dated FX exotic option contracts for which there is no active market from which to derive volatility or correlation inputs. The inputs used to value these OTC FX option contracts are calculated using consensus pricing services without an underlying principal market, historical asset prices or by extrapolation.
Cross-currency balance guaranteed swaps are classified as foreign exchange contracts. Details of the fair value classification can be found under the interest rate contracts section above.
Equity / index contracts
Equity / index contracts include equity forward contracts and equity option contracts. Equity forward contracts have a single stock or index underlying and are valued using market standard models. The key inputs to the models are stock prices, estimated dividend rates and equity funding rates (which are implied from prices of forward contracts observed in the market). Estimated cash flows are then discounted using market standard discounted cash flow models using a rate that reflects the appropriate funding rate for that portion of the portfolio. As inputs are derived mostly from standard market contracts traded in active and observable markets, a significant proportion of equity forward contracts are classified as Level 2. Positions classified as Level 3 have no market data available for the instrument maturity and are valued by some form of extrapolation of available data, use of historical dividend data, or use of data for a related equity.
Equity option contracts include market standard single or basket stock or index call and put options as well as equity option contracts with more complex features including option contracts with multiple or continuous exercise dates, option contracts for which the payoff is based on the relative or average performance of components of a basket, option contracts with discontinuous payoff profiles, path-dependent options and option contracts with a payoff calculated directly upon equity features other than price (i.e., dividend rates, volatility or correlation). Equity option contracts are valued using market standard models that estimate the equity forward level as described above for equity forward contracts and incorporate inputs for stock volatility and for correlation between stocks within a basket. The probability-weighted expected option payoff generated is then discounted using market standard discounted cash flow models using a rate that reflects the appropriate funding rate for that portion of the portfolio. Positions for which inputs are derived from standard market contracts traded in active and observable markets are classified as Level 2. Level 3 positions are those for which volatility, forward or correlation inputs are not observable and are therefore valued using extrapolation of available data, historical dividend, correlation or volatility data, or the equivalent data for a related equity.
Commodity derivative contracts
Commodity derivative contracts include forward, swap and option contracts on individual commodities and on commodity indices. Commodity forward and swap contracts are measured using market standard models that use market forward levels on standard instruments. Commodity option contracts are measured using market standard option models that estimate the commodity forward level as described above for commodity forward and swap contracts, incorporating inputs for the volatility of the underlying index or commodity. The option model produces a probability-weighted expected option payoff that is then discounted using market standard discounted cash flow models using a rate that reflects the appropriate funding rate for that portion of the portfolio. For commodity options on baskets of commodities or bespoke commodity indices, the valuation technique also incorporates inputs for the correlation between different commodities or commodity indices. Individual commodity contracts are typically classified as Level 2 because active forward and volatility market data are available.
Note 24 Fair value measurement (continued)
Financial liabilities designated at fair value
Structured and OTC debt instruments issued
Structured debt instruments issued are comprised of medium-term notes (MTNs), which are held at fair value under the fair value option. These MTNs are tailored specifically to the holder’s risk or investment appetite with structured coupons or payoffs. The risk management and the valuation approaches for these MTNs are closely aligned to the equivalent derivatives business and the underlying risk, and the valuation techniques used for this component are the same as the relevant valuation techniques described above. For example, equity-linked notes should be referenced to equity / index contracts and credit-linked notes should be referenced to credit derivative contacts.
Other liabilities – amounts due under unit-linked investment contracts
Unit-linked investment contracts allow investors to invest in a pool of assets through issued investment units. The unit holders are exposed to all risks and rewards associated with the reference asset pool. The financial liability represents the amounts due to unit holders and is equal to the fair value of the reference asset pool. The fair values of investment contract liabilities are determined by reference to the fair value of the corresponding assets. The liabilities themselves are not actively traded, but are mainly referenced to instruments that are and are therefore classified as Level 2.
f) Transfers between Level 1 and Level 2 in the fair value hierarchy
The amounts provided below reflect transfers between Level 1 and Level 2 for instruments that were held for the entire reporting period.
Assets totaling approximately CHF 0.6 billion, which were mainly comprised of financial investments classified as available-for-sale, primarily corporate and municipal bonds, and financial assets held for trading, were transferred from Level 2 to Level 1 during 2015, generally due to increased levels of trading activity observed within the market. Transfers of financial liabilities from Level 2 to Level 1 during 2015 were not significant.
Assets totaling approximately CHF 0.8 billion, which were mainly comprised of financial assets held for trading, primarily equity instruments and government bills/bonds, and financial investments classified as available-for-sale, mainly corporate and municipal bonds, were transferred from Level 1 to Level 2 during 2015, generally due to diminished levels of trading activity observed within the market. Transfers of financial liabilities from Level 1 to Level 2 during 2015 were not significant.
Consolidated financial statements
Notes to the UBS Group AG consolidated financial statements
Note 24 Fair value measurement (continued)
g) Movements of Level 3 instruments
Significant changes in Level 3 instruments
The table on the following pages presents additional information about Level 3 assets and liabilities measured at fair value on a recurring basis. Level 3 assets and liabilities may be hedged with instruments classified as Level 1 or Level 2 in the fair value hierarchy, and, as a result, realized and unrealized gains and losses included in the table may not include the effect of related hedging activity. Further, the realized and unrealized gains and losses presented within the table are not limited solely to those arising from Level 3 inputs, as valuations are generally derived from both observable and unobservable parameters.
Assets and liabilities transferred into or out of Level 3 are presented as if those assets or liabilities had been transferred at the beginning of the year.
As of 31 December 2015, financial instruments measured with valuation techniques using significant non-market-observable inputs (Level 3) were mainly comprised of:
– loans (including structured loans);
– structured reverse repurchase and securities borrowing agreements;
– credit derivative contracts;
– equity / index contracts;
– non-structured fixed-rate bonds and
– structured debt instruments issued (equity and credit-linked).
Significant movements in Level 3 instruments during the year ended 31 December 2015 were as follows.
Financial assets held for trading
Financial assets held for trading decreased to CHF 2.1 billion from CHF 3.5 billion during the year. Issuances of CHF 5.4 billion and purchases of CHF 0.7 billion, mainly comprised of loans and corporate bonds, respectively, were more than offset by sales of CHF 7.6 billion, also primarily comprised of loans and corporate bonds. Transfers into Level 3 during the year amounted to CHF 0.9 billion and were mainly comprised of equity instruments and investment fund units due to decreased observability of the respective equity volatility inputs. Transfers out of Level 3 amounted to CHF 0.5 billion and were primarily comprised of loans, reflecting increased observability of the respective credit spread inputs.
Financial assets designated at fair value
Financial assets designated at fair value decreased to CHF 3.3 billion from CHF 3.5 billion during the year, mainly reflecting settlements of CHF 1.3 billion, partly offset by issuances of CHF 0.8 billion. Transfers into and out of Level 3 amounted to CHF 0.8 billion and CHF 0.4 billion, respectively.
Financial investments classified as available-for-sale
Financial investments classified as available-for-sale increased to CHF 0.7 billion from CHF 0.6 billion during the year, primarily due to purchases totaling CHF 0.1 billion.
Note 24 Fair value measurement (continued)
Positive replacement values
Positive replacement values decreased to CHF 2.9 billion from CHF 4.4 billion during the year, primarily due to settlements of CHF 2.9 billion, primarily related to credit derivative contracts and equity / index contracts, partly offset by issuances totaling CHF 1.7 billion, also primarily related to credit derivative contracts and equity / index contracts. Transfers into Level 3, totaling CHF 0.7 billion, were mainly comprised of interest rate contracts and equity / index contracts and primarily resulted from changes in the correlation between the portfolios held and the representative market portfolio used to independently verify market data. Transfers out of Level 3, totaling CHF 0.5 billion, were mainly comprised of equity / index contracts and also primarily related to changes in the correlation between the portfolio held and the representative market portfolio used to independently verify market data.
Negative replacement values
Negative replacement values decreased to CHF 3.3 billion from CHF 5.0 billion during the year. Settlements and issuances amounted to CHF 2.2 billion and CHF 1.0 billion, respectively, and were primarily comprised of equity / index contracts. Transfers into and out of Level 3 both amounted to CHF 0.5 billion, and primarily related to changes in the availability of the respective observable equity volatility and credit spread inputs.
Financial liabilities designated at fair value
Financial liabilities designated at fair value decreased to CHF 10.7 billion from CHF 11.9 billion during the year. Issuances of CHF 6.1 billion, primarily comprised of structured debt instruments issued and structured over-the-counter debt instruments, were more than offset by settlements of CHF 6.7 billion, also primarily comprised of structured debt instruments issued and structured over-the-counter debt instruments. Transfers into Level 3, totaling CHF 1.3 billion, were primarily comprised of equity and credit-linked structured debt instruments issued, and mainly related to a reduction in the observable equity volatility inputs and from changes in the respective credit spreads used to determine the fair value of the embedded options in these structures. Transfers out of Level 3, totaling CHF 2.2 billion, were also mainly comprised of equity- and credit-linked structured debt instruments issued, and mainly related to changes in the observable equity volatility inputs and from changes in the respective credit spreads used to determine the fair value of the embedded options in these structures.
Consolidated financial statements
Notes to the UBS Group AG consolidated financial statements
Note 24 Fair value measurement (continued)
Movements of Level 3 instruments | | | | | | | | |
| | Total gains / losses included in comprehensive income | | | | | | | |
CHF billion | Balance as of 31 Decem- ber 2013 | Net interest income, net trading income and other income | of which: related to Level 3 instruments held at the end of the reporting period | Other comprehensive income | Purchases | Sales | Issuances | Settlements | Transfers into Level 3 | Transfers out of Level 3 | Foreign currency trans- lation |
| | | | | | | | | | | |
Financial assets held for trading | 4.3 | (1.6) | (0.9) | | 1.4 | (6.5) | 5.2 | 0.0 | 1.0 | (0.5) | 0.1 |
of which: | | | | | | | | | | | |
Corporate bonds and municipal bonds, including bonds issued by financial institutions | 1.7 | (0.1) | (0.1) | | 0.9 | (1.2) | 0.0 | 0.0 | 0.2 | (0.2) | 0.1 |
Loans | 1.0 | (1.4) | (0.8) | | 0.2 | (4.1) | 5.2 | 0.0 | 0.2 | (0.1) | 0.1 |
Asset-backed securities | 1.0 | 0.0 | 0.0 | | 0.1 | (0.7) | 0.0 | 0.0 | 0.5 | (0.3) | 0.0 |
Other | 0.6 | (0.1) | 0.0 | | 0.2 | (0.5) | 0.0 | 0.0 | 0.1 | 0.0 | 0.0 |
| | | | | | | | | | | |
Financial assets designated at fair value | 4.4 | (0.8) | (0.3) | | 0.0 | 0.0 | 1.3 | (1.2) | 0.0 | (0.3) | 0.2 |
of which: | | | | | | | | | | | |
Loans (including structured loans) | 1.1 | (0.3) | (0.2) | | 0.0 | 0.0 | 0.6 | (0.2) | 0.0 | (0.3) | 0.0 |
Structured reverse repurchase and securities borrowing agreements | 3.1 | (0.5) | 0.0 | | 0.0 | 0.0 | 0.7 | (1.0) | 0.0 | 0.0 | 0.1 |
Other | 0.2 | 0.0 | 0.0 | | 0.0 | 0.0 | 0.0 | 0.0 | 0.0 | 0.0 | 0.0 |
| | | | | | | | | | | |
Financial investments available-for-sale | 0.8 | 0.0 | 0.0 | 0.0 | 0.1 | (0.2) | 0.0 | 0.0 | 0.0 | 0.0 | 0.0 |
| | | | | | | | | | | |
Positive replacement values | 5.5 | 1.1 | 0.0 | | 0.0 | 0.0 | 2.6 | (5.1) | 1.1 | (0.5) | (0.2) |
of which: | | | | | | | | | | | |
Credit derivative contracts | 3.0 | 0.3 | (0.8) | | 0.0 | 0.0 | 1.1 | (3.2) | 0.5 | (0.2) | 0.1 |
Foreign exchange contracts | 0.9 | 0.1 | 0.1 | | 0.0 | 0.0 | 0.1 | (0.2) | 0.0 | (0.1) | (0.3) |
Equity / index contracts | 1.2 | 0.6 | 0.5 | | 0.0 | 0.0 | 1.3 | (1.3) | 0.3 | (0.2) | 0.0 |
Other | 0.3 | 0.0 | 0.1 | | 0.0 | 0.0 | 0.2 | (0.4) | 0.3 | (0.1) | 0.0 |
| | | | | | | | | | | |
Negative replacement values | 4.4 | 0.7 | (0.6) | | 0.0 | 0.0 | 2.5 | (3.7) | 1.4 | (0.5) | 0.2 |
of which: | | | | | | | | | | | |
Credit derivative contracts | 2.0 | 0.1 | (1.2) | | 0.0 | 0.0 | 1.0 | (2.4) | 1.0 | (0.2) | 0.3 |
Foreign exchange contracts | 0.5 | 0.0 | 0.0 | | 0.0 | 0.0 | 0.0 | 0.0 | 0.0 | (0.1) | 0.0 |
Equity / index contracts | 1.5 | 0.4 | 0.4 | | 0.0 | 0.0 | 1.5 | (1.2) | 0.3 | (0.1) | 0.0 |
Other | 0.5 | 0.2 | 0.3 | | 0.0 | 0.0 | 0.0 | (0.1) | 0.1 | 0.0 | (0.1) |
| | | | | | | | | | | |
Financial liabilities designated at fair value | 12.1 | 0.5 | 1.3 | | 0.0 | 0.0 | 7.4 | (7.4) | 2.0 | (3.2) | 0.5 |
of which: | | | | | | | | | | | |
Non-structured fixed-rate bonds | 1.2 | 0.4 | 0.3 | | 0.0 | 0.0 | 1.9 | (1.4) | 0.4 | (0.4) | 0.1 |
Structured debt instruments issued | 7.9 | 0.9 | 0.4 | | 0.0 | 0.0 | 3.7 | (4.2) | 1.2 | (2.6) | 0.4 |
Structured over-the-counter debt instruments | 1.8 | (0.4) | (0.1) | | 0.0 | 0.0 | 1.4 | (1.5) | 0.4 | (0.2) | 0.0 |
Structured repurchase agreements | 1.2 | (0.3) | 0.7 | | 0.0 | 0.0 | 0.5 | (0.4) | 0.0 | 0.0 | 0.0 |
1 Total Level 3 assets as of 31 December 2015 were CHF 9.0 billion (31 December 2014: CHF 12.2 billion). Total Level 3 liabilities as of 31 December 2015 were CHF 14.1 billion (31 December 2014: CHF 17.0 billion). |
| | | | | | | | | | | | |
| | Total gains / losses included in comprehensive income | | | | | | | | |
| Balance as of 31 Decem- ber 2014 | Net interest income, net trading income and other income | of which: related to Level 3 instruments held at the end of the reporting period | Other comprehensive income | Purchases | Sales | Issuances | Settlements | Transfers into Level 3 | Transfers out of Level 3 | Foreign currency trans- lation | Balance as of 31 Decem- ber 2015¹ |
| | | | | | | | | | | | |
| 3.5 | (0.2) | (0.4) | | 0.7 | (7.6) | 5.4 | 0.0 | 0.9 | (0.5) | (0.1) | 2.1 |
| | | | | | | | | | | | |
| 1.4 | 0.0 | 0.0 | | 0.5 | (1.0) | 0.0 | 0.0 | 0.1 | (0.1) | (0.1) | 0.7 |
| 1.1 | (0.1) | (0.3) | | 0.1 | (5.5) | 5.4 | 0.0 | 0.2 | (0.3) | 0.0 | 0.8 |
| 0.6 | 0.0 | 0.0 | | 0.1 | (0.6) | 0.0 | 0.0 | 0.2 | (0.1) | 0.0 | 0.2 |
| 0.5 | (0.1) | (0.1) | | 0.1 | (0.5) | 0.0 | 0.0 | 0.4 | 0.0 | 0.0 | 0.4 |
| | | | | | | | | | | | |
| 3.5 | 0.0 | 0.0 | | 0.0 | 0.0 | 0.8 | (1.3) | 0.8 | (0.4) | (0.1) | 3.3 |
| | | | | | | | | | | | |
| 1.0 | (0.1) | (0.1) | | 0.0 | 0.0 | 0.7 | (0.2) | 0.8 | (0.4) | 0.0 | 1.7 |
| 2.4 | 0.1 | 0.1 | | 0.0 | 0.0 | 0.1 | (1.0) | 0.0 | 0.0 | (0.1) | 1.5 |
| 0.1 | 0.0 | 0.0 | | 0.0 | 0.0 | 0.0 | 0.0 | 0.0 | 0.0 | 0.0 | 0.1 |
| | | | | | | | | | | | |
| 0.6 | 0.0 | 0.0 | 0.0 | 0.1 | (0.1) | 0.0 | 0.0 | 0.0 | 0.0 | 0.0 | 0.7 |
| | | | | | | | | | | | |
| 4.4 | (0.4) | (0.1) | | 0.0 | (0.1) | 1.7 | (2.9) | 0.7 | (0.5) | (0.1) | 2.9 |
| | | | | | | | | | | | |
| 1.7 | (0.1) | 0.2 | | 0.0 | 0.0 | 0.9 | (1.1) | 0.1 | (0.1) | (0.1) | 1.3 |
| 0.6 | (0.1) | 0.0 | | 0.0 | 0.0 | 0.1 | (0.1) | 0.0 | 0.0 | 0.0 | 0.5 |
| 1.9 | 0.0 | (0.3) | | 0.0 | (0.1) | 0.7 | (1.4) | 0.2 | (0.3) | 0.0 | 1.0 |
| 0.3 | (0.1) | (0.1) | | 0.0 | 0.0 | 0.0 | (0.3) | 0.4 | (0.1) | 0.0 | 0.1 |
| | | | | | | | | | | | |
| 5.0 | (0.4) | 0.0 | | 0.0 | 0.0 | 1.0 | (2.2) | 0.5 | (0.5) | (0.1) | 3.3 |
| | | | | | | | | | | | |
| 1.7 | 0.3 | 0.6 | | 0.0 | 0.0 | 0.0 | (0.9) | 0.3 | (0.1) | 0.0 | 1.3 |
| 0.3 | 0.0 | (0.1) | | 0.0 | 0.0 | 0.0 | (0.1) | 0.0 | 0.0 | 0.0 | 0.2 |
| 2.4 | (0.4) | (0.5) | | 0.0 | 0.0 | 0.9 | (1.2) | 0.1 | (0.4) | (0.1) | 1.4 |
| 0.6 | (0.2) | (0.1) | | 0.0 | 0.0 | 0.1 | 0.0 | 0.1 | 0.0 | (0.1) | 0.3 |
| | | | | | | | | | | | |
| 11.9 | 0.6 | 0.0 | | 0.0 | 0.0 | 6.1 | (6.7) | 1.3 | (2.2) | (0.3) | 10.7 |
| | | | | | | | | | | | |
| 2.2 | (0.1) | 0.0 | | 0.0 | 0.0 | 1.1 | (0.2) | 0.1 | (0.4) | 0.0 | 2.6 |
| 7.3 | 0.5 | 0.1 | | 0.0 | 0.0 | 3.8 | (4.2) | 1.3 | (1.9) | (0.2) | 6.7 |
| 1.5 | 0.2 | (0.1) | | 0.0 | 0.0 | 1.2 | (2.0) | 0.0 | 0.0 | (0.1) | 0.8 |
| 0.9 | 0.0 | 0.0 | | 0.0 | 0.0 | 0.0 | (0.3) | 0.0 | 0.0 | 0.0 | 0.6 |
| | | | | | | | | | | | |
Consolidated financial statements
Notes to the UBS Group AG consolidated financial statements
Note 24 Fair value measurement (continued)
h) Valuation of assets and liabilities classified as Level 3
The table on the following pages presents the assets and liabilities recognized at fair value and classified as Level 3, together with the valuation techniques used to measure fair value, the significant inputs used in the valuation technique that are considered unobservable and a range of values for those unobservable inputs.
The range of values represents the highest and lowest level input used in the valuation techniques. Therefore, the range does not reflect the level of uncertainty regarding a particular input, but rather the different underlying characteristics of the relevant assets and liabilities. The ranges will therefore vary from period to period and parameter to parameter based on characteristics of the instruments held at each balance sheet
date. Further, the ranges of unobservable inputs may differ across other financial institutions due to the diversity of the products in each firm’s inventory.
Significant unobservable inputs in Level 3 positions
This section discusses the significant unobservable inputs identified in the table on the following pages and assesses the potential effect that a change in each unobservable input in isolation may have on a fair value measurement, including information to facilitate an understanding of factors that give rise to the input ranges shown. Relationships between observable and unobservable inputs have not been included in the summary below.
Pillar 3 |
Valuation techniques and inputs used in the fair value measurement of Level 3 assets and liabilities |
| Fair value | | | | Significant unobservable input(s)¹ | Range of inputs |
| Assets | | Liabilities | | Valuation technique(s) | | 31.12.15 | | 31.12.14 | |
CHF billion | 31.12.15 | 31.12.14 | | 31.12.15 | 31.12.14 | | | low | high | | low | high | unit¹ |
Financial assets held for trading / Trading portfolio liabilities, Financial assets / liabilities designated at fair value and Financial investments available-for-sale | | | | | | | | | | | | | | | |
Corporate bonds and municipal bonds, including bonds issued by financial institutions | 0.7 | 1.4 | | 0.1 | 0.1 | | Relative value to market comparable | | Bond price equivalent | 0 | 134 | | 8 | 144 | points |
Traded loans, loans designated at fair value, loan commitments and guarantees | 2.6 | 2.2 | | 0.0 | 0.0 | | Relative value to market comparable | | Loan price equivalent | 65 | 100 | | 80 | 101 | points |
| | | | | | | Discounted expected cash flows | | Credit spread | 30 | 252 | | 37 | 138 | basis points |
| | | | | | | Market comparable and securitization model | | Discount margin / spread | 1 | 14 | | 0 | 13 | % |
| | | | | | | Mortality dependent cash flow | | Volatility of mortality² | | | | 270 | 280 | % |
Investment fund units³ | 0.3 | 0.5 | | 0.0 | 0.0 | | Relative value to market comparable | | Net asset value | | | | | | |
Asset-backed securities | 0.2 | 0.6 | | 0.0 | 0.0 | | Discounted cash flow projection | | Constant prepayment rate | 0 | 18 | | 0 | 18 | % |
| | | | | | | | | Discount margin / spread | 0 | 12 | | 0 | 22 | % |
| | | | | | | Relative value to market comparable | | Bond price equivalent | 1 | 92 | | 0 | 102 | points |
Equity instruments³ | 0.6 | 0.5 | | 0.0 | 0.0 | | Relative value to market comparable | | Price | | | | | | |
Structured (reverse) repurchase agreements | 1.5 | 2.4 | | 0.6 | 0.9 | | Discounted expected cash flows | | Funding spread | 18 | 183 | | 10 | 163 | basis points |
Financial assets for unit-linked investment contracts³ | 0.1 | 0.1 | | | | | Relative value to market comparable | | Price | | | | | | |
Structured debt instruments and non-structured fixed-rate bonds⁴ | | | | 10.1 | 11.0 | | | | | | | | | | |
Note 24 Fair value measurement (continued)
Valuation techniques and inputs used in the fair value measurement of Level 3 assets and liabilities (continued) |
| Fair value | | | | Significant unobservable input(s)¹ | Range of inputs |
| Assets | | Liabilities | | Valuation technique(s) | | 31.12.15 | | 31.12.14 | |
CHF billion | 31.12.15 | 31.12.14 | | 31.12.15 | 31.12.14 | | | low | high | | low | high | unit¹ |
Replacement values | | | | | | | | | | | | | | | |
Interest rate contracts | 0.1 | 0.2 | | 0.3 | 0.6 | | Option model | | Volatility of interest rates | 16 | 130 | | 13 | 94 | % |
| | | | | | | | | Rate-to-rate correlation | 84 | 94 | | 84 | 94 | % |
| | | | | | | | | Intra-curve correlation | 36 | 94 | | 50 | 94 | % |
| | | | | | | Discounted expected cash flows | | Constant prepayment rate | 0 | 3 | | 0 | 3 | % |
Credit derivative contracts | 1.3 | 1.7 | | 1.3 | 1.7 | | Discounted expected cash flow based on modeled defaults and recoveries | | Credit spreads | 1 | 1,163 | | 0 | 963 | basis points |
| | | | | | | | | Upfront price points | 8 | 25 | | 15 | 83 | % |
| | | | | | | | | Recovery rates | 0 | 95 | | 0 | 95 | % |
| | | | | | | | | Credit index correlation | 10 | 85 | | 10 | 85 | % |
| | | | | | | | | Discount margin / spread | 1 | 72 | | 0 | 32 | % |
| | | | | | | | | Credit pair correlation | 57 | 94 | | 57 | 94 | % |
| | | | | | | Discounted cash flow projection on underlying bond | | Constant prepayment rate | 0 | 15 | | 1 | 16 | % |
| | | | | | | | | Constant default rate | 0 | 9 | | 0 | 9 | % |
| | | | | | | | | Loss severity | 0 | 100 | | 0 | 100 | % |
| | | | | | | | | Discount margin / spread | 1 | 15 | | 1 | 33 | % |
| | | | | | | | | Bond price equivalent | 0 | 104 | | 12 | 100 | points |
Foreign exchange contracts | 0.5 | 0.6 | | 0.2 | 0.3 | | Option model | | Rate-to-FX correlation | (57) | 60 | | (57) | 60 | % |
| | | | | | | | | FX-to-FX correlation | (70) | 80 | | (70) | 80 | % |
| | | | | | | Discounted expected cash flows | | Constant prepayment rate² | | | | 0 | 13 | % |
Equity / index contracts | 1.0 | 1.9 | | 1.4 | 2.4 | | Option model | | Equity dividend yields | 0 | 57 | | 0 | 15 | % |
| | | | | | | | | Volatility of equity stocks, equity and other indices | 0 | 143 | | 1 | 130 | % |
| | | | | | | | | Equity-to-FX correlation | (44) | 82 | | (55) | 84 | % |
| | | | | | | | | Equity-to-equity correlation | 3 | 99 | | 18 | 99 | % |
Non-financial assets³˒⁵ | 0.1 | 0.2 | | | | | Relative value to market comparable | | Price | | | | | | |
| | | | | | | Discounted cash flow projection | | Projection of cost and income related to the particular property | | | | | | |
| | | | | | | | | Discount rate | | | | | | |
| | | | | | | | | Assessment of the particular property's condition | | | | | | |
1 The ranges of significant unobservable inputs are represented in points, percentages and basis points. Points are a percentage of par. For example, 100 points would be 100% of par. 2 The range of inputs is not disclosed as of 31 December 2015 because this unobservable input parameter was not significant to the respective valuation technique as of that date. 3 The range of inputs is not disclosed due to the dispersion of possible values given the diverse nature of the investments. 4 Valuation techniques, significant unobservable inputs and the respective input ranges for structured debt instruments and non-structured fixed-rate bonds are the same as the equivalent derivative or structured financing instruments presented elsewhere in this table. 5 Non-financial assets include other assets which primarily consist of assets held for sale. |
▲
Consolidated financial statements
Notes to the UBS Group AG consolidated financial statements
Note 24 Fair value measurement (continued)
Bond price equivalent: Where market prices are not available for a bond, fair value is measured by comparison with observable pricing data from similar instruments. Factors considered when selecting comparable instruments include credit quality, maturity and industry of the issuer. Fair value may be measured either by a direct price comparison or by conversion of an instrument price into a yield (either as an outright yield or as a spread to LIBOR). Bond prices are expressed as points of the nominal, where 100 represents a fair value equal to the nominal value (i.e., par).
For corporate and municipal bonds, the range of 0–134 points represents the range of prices from reference issuances used in determining fair value. Bonds priced at 0 are distressed to the point that no recovery is expected, while prices significantly in excess of 100 or par relate to inflation-linked or structured issuances that pay a coupon in excess of the market benchmark as of the measurement date. The weighted average price is approximately 94 points, with a majority of positions concentrated around this price.
For asset-backed securities, the bond price range of 1–92 points represents the range of prices for reference securities used in determining fair value. An instrument priced at 0 is not expected to pay any principal or interest, while an instrument priced close to 100 points is expected to be repaid in full as well as pay a yield close to the market yield. The weighted average price for Level 3 assets within this portion of the Level 3 portfolio is 72 points.
For credit derivatives, the bond price range of 0–104 points represents the range of prices used for reference instruments that are typically converted to an equivalent yield or credit spread as part of the valuation process. The range is comparable to that for corporate and asset-backed issuances described above.
Loan price equivalent: Where market prices are not available for a traded loan, fair value is measured by comparison with observable pricing data for similar instruments. Factors considered when selecting comparable instruments include industry segment, collateral quality, maturity and issuer-specific covenants. Fair value may be measured either by a direct price comparison or by conversion of an instrument price into a yield. The range of 65–100 points represents the range of prices derived from reference issuances of a similar credit quality used in measuring fair value for loans classified as Level 3. Loans priced at 0 are distressed to the point that no recovery is expected, while a current price of 100 represents a loan that is expected to be repaid in full. The weighted average is approximately 93 points.
Credit spread: Valuation models for many credit derivatives require an input for the credit spread, which is a reflection of the credit quality of the associated referenced underlying. The credit spread of a particular security is quoted in relation to the yield on a benchmark security or reference rate, typically either US Treasury or LIBOR, and is generally expressed in terms of basis points. An increase / (decrease) in credit spread will increase / (decrease) the value of credit protection offered by CDS and other credit derivative products. The income statement impact from such changes depends on the nature and direction of the positions held. Credit spreads may be negative where the asset is more creditworthy than the benchmark against which the spread is calculated. A wider credit spread represents decreasing creditworthiness. The ranges of 30–252 basis points in loans and 1–1163 basis points in credit derivatives represents a diverse set of underlyings, with the lower end of the range representing credits of the highest quality (e.g., approximating the risk of LIBOR) and the upper end of the range representing greater levels of credit risk.
Constant prepayment rate: A prepayment rate represents the amount of unscheduled principal repayment for a pool of loans. The prepayment estimate is based on a number of factors, such as historical prepayment rates for repaid and existing loans with similar characteristics and the future economic outlook, considering factors including, but not limited to, future interest rates. In general, a significant increase / (decrease) in this unobservable input in isolation would result in a significantly higher / (lower) fair value for bonds trading at a discount. For bonds trading at a premium the reverse would apply, with a decrease in fair value when the constant prepayment rate increases. However, in certain cases the effect of a change in prepayment speed on instrument price is more complicated and depends on both the precise terms of the securitization and the position of the instrument within the securitization capital structure.
For asset-backed securities, the range of 0–18% represents inputs across various classes of asset-backed securities. Securities with an input of 0% typically reflect no current prepayment behavior with respect to the underlying collateral, and with no expectation of this changing in the immediate future, while the high range of 18% relates to securities that are currently experiencing high prepayments. Different classes of asset-backed securities typically show different ranges of prepayment characteristics depending on a combination of factors, including the borrowers’ ability to refinance, prevailing refinancing rates, and the quality or characteristics of the underlying loan collateral pools. The weighted average constant prepayment rate for the portfolio is 5.0%.
Note 24 Fair value measurement (continued)
For credit derivatives, the range of 0–15% represents the input assumption for credit derivatives on asset-backed securities. The range is driven in a similar manner to that for asset-backed securities.
For interest rate contracts, the range of 0–3% represents the prepayment assumptions on securitizations underlying the BGS portfolio.
Constant default rate (CDR): The CDR represents the percentage of outstanding principal balances in the pool that are projected to default and liquidate and is the annualized rate of default for a group of mortgages or loans. The CDR estimate is based on a number of factors, such as collateral delinquency rates in the pool and the future economic outlook. In general, a significant increase / (decrease) in this unobservable input in isolation would result in significantly lower / (higher) cash flows for the deal (and thus lower / (higher) valuations). However, different instruments within the capital structure can react differently to changes in the CDR rate. Generally, subordinated bonds will decrease in value as CDR increases, but for well protected senior bonds an increase in CDR may cause an increase in price. In addition, the presence of a guarantor wrap on the collateral pool of a security may result in notes at the junior end of the capital structure experiencing a price increase with an increase in the default rate.
The range of 0–9% for credit derivatives represents the expected default percentage across the individual instruments’ underlying collateral pools.
Loss severity / recovery rate: The projected loss severity / recovery rate reflects the estimated loss that will be realized given expected defaults. Loss severity is generally applied to collateral within asset-backed securities while the recovery rate is the analogous pricing input for corporate or sovereign credits. Recovery is the reverse of loss severity, so a 100% recovery rate is the equivalent of a 0% loss severity. Increases in loss severity levels / decreases in recovery rates will result in lower expected cash flows into the structure upon the default of the instruments. In general, a significant decrease / (increase) in the loss severity in isolation would result in significantly higher / (lower) fair value for the respective asset-backed securities. The impact of a change in recovery rate on a credit derivative position will depend on whether credit protection has been bought or sold.
Loss severity is ultimately driven by the value recoverable from collateral held after foreclosure occurs relative to the loan principal and possibly unpaid interest accrued at that point. For credit derivatives, the loss severity range of 0–100% applies to derivatives on asset-backed securities. The recovery rate range of 0–95% represents a wide range of expected recovery levels on credit derivative contracts within the Level 3 portfolio.
Discount margin (DM) spread: The DM spread represents the discount rates used to present value cash flows of an asset to reflect the market return required for uncertainty in the estimated cash flows. DM spreads are a rate or rates applied on top of a floating index (e.g., LIBOR) to discount expected cash flows. Generally, a decrease / (increase) in the unobservable input in isolation would result in a significantly higher / (lower) fair value.
The different ranges represent the different discount rates across loans (1–14%), asset-backed securities (0–12%) and credit derivatives (1–72%). The high end of the range relates to securities that are priced very low within the market relative to the expected cash flow schedule. This indicates that the market is pricing an increased risk of credit loss into the security that is greater than what is being captured by the expected cash flow generation process. The low ends of the ranges are typical of funding rates on better quality instruments. For asset-backed securities the weighted average DM is 2.7% and for loans the average effective DM is 2.4%.
Equity dividend yields: The derivation of a forward price for an individual stock or index is important for measuring fair value for forward or swap contracts and for measuring fair value using option pricing models. The relationship between the current stock price and the forward price is based on a combination of expected future dividend levels and payment timings, and, to a lesser extent, the relevant funding rates applicable to the stock in question. Dividend yields are generally expressed as an annualized percentage of the share price with the lowest limit of 0% representing a stock that is not expected to pay any dividend. The dividend yield and timing represents the most significant parameter in determining fair value for instruments that are sensitive to an equity forward price. The range of 0–57% reflects the expected range of dividend rates for the portfolio.
Volatility: Volatility measures the variability of future prices for a particular instrument and is generally expressed as a percentage, where a higher number reflects a more volatile instrument for which future price movements are more likely to occur. The minimum level of volatility is 0% and there is no theoretical maximum. Volatility is a key input into option models, where it is used to derive a probability-based distribution of future prices for the underlying instrument. The effect of volatility on individual positions within the portfolio is driven primarily by whether the option contract is a long or short position. In most cases, the fair value of an option increases as a result of an increase in volatility and is reduced by a decrease in volatility. Generally, volatility used in the measurement of fair value is derived from active market option prices (referred to as implied volatility). A key feature of implied volatility is the volatility “smile” or “skew,” which represents the effect of pricing options of different option strikes at different implied volatility levels.
Consolidated financial statements
Notes to the UBS Group AG consolidated financial statements
Note 24 Fair value measurement (continued)
– Volatility of interest rates – the range of 16–130% reflects the range of unobservable volatilities across different currencies and related underlying interest rate levels. Volatilities of low interest rates tend to be much higher than volatilities of high interest rates. In addition, different currencies may have significantly different implied volatilities.
– Volatility of equity stocks, equity and other indices – the range of 1–143% reflects the range of underlying stock volatilities.
Correlation: Correlation measures the inter-relationship between the movements of two variables. It is expressed as a percentage between -100% and +100%, where +100% represents perfectly correlated variables (meaning a movement of one variable is associated with a movement of the other variable in the same direction), and -100% implies the variables are inversely correlated (meaning a movement of one variable is associated with a movement of the other variable in the opposite direction). The effect of correlation on the measurement of fair value depends on the specific terms of the instruments being valued, due to the range of different payoff features within such instruments.
– Rate-to-rate correlation – the correlation between interest rates of two separate currencies. The range of 84–94% results from the different pairs of currency involved.
– Intra-curve correlation – the correlation between different tenor points of the same yield curve. Correlations are typically fairly high, as reflected by the range of 36–94%.
– Credit index correlation of 10–85% reflects the implied correlation derived from different indices across different parts of the benchmark index capital structure. The input is particularly important for bespoke and Level 3 index tranches.
– Credit pair correlation is particularly important for first to default credit structures. The range of 57–94% reflects the difference between credits with low correlation and similar highly correlated credits.
– Rate-to-FX correlation – captures the correlation between interest rates and FX rates. The range for the portfolio is (57)–60%, which represents the relationship between interest rates and foreign exchange levels. The signage on such correlations depends on the quotation basis of the underlying FX rate (e.g., EUR / USD and USD / EUR correlations to the same interest rate will have opposite signs).
– FX-to-FX correlation is particularly important for complex options that incorporate different FX rates in the projected payoff. The range of (70)–80% reflects the underlying characteristics across the main FX pairs to which UBS has exposure.
– Equity-to-FX correlation is important for equity options based on a currency different than the currency of the underlying stock. The range of (44)–82% represents the range of the relationship between underlying stock and foreign exchange volatilities.
– Equity-to-equity correlation is particularly important for complex options that incorporate, in some manner, different equities in the projected payoff. The closer the correlation is to 100%, the more related one equity is to another. For example, equities with a very high correlation could be from different parts of the same corporate structure. The range of 3–99% reflects this.
Funding spread: Structured financing transactions are valued using synthetic funding curves that best represent the assets that are pledged as collateral for the transactions. They are not representative of where UBS can fund itself on an unsecured basis, but provide an estimate of where UBS can source and deploy secured funding with counterparties for a given type of collateral. The funding spreads are expressed in terms of basis points over or under LIBOR, and if funding spreads widen this increases the impact of discounting. The range of 18–183 basis points for both structured repurchase agreements and structured reverse repurchase agreements represents the range of asset funding curves, where wider spreads are due to a reduction in liquidity of underlying collateral for funding purposes.
A small proportion of structured debt instruments and non-structured fixed-rate bonds within financial liabilities designated at fair value had an exposure to funding spreads that was longer in duration than the actively traded market. Such positions are within the range of 18–183 basis points reported above.
Upfront price points: These are a component in the price quotation of credit derivative contracts, whereby the overall fair value price level is split between the credit spread (as described above) and a component that is quoted and settled upfront on transacting a new contract. This latter component is referred to as upfront price points and represents the difference between the credit spread paid as protection premium on a current contract versus a small number of standard contracts defined by the market. Distressed credit names frequently trade and quote CDS protection only in upfront points rather than as a running credit spread. An increase / (decrease) in upfront points will increase / (decrease) the value of credit protection offered by CDS and other credit derivative products. The effect of increases or decreases in upfront price points depends on the nature and direction of the positions held. Upfront price points may be negative where a contract is quoting for a narrower premium than the market standard, but are generally positive, reflecting an increase in credit premium required by the market as creditworthiness deteriorates. The range of 8–25% within the table represents the variety of current market credit spread levels relative to the benchmarks used as a quotation basis. Upfront points of 25% represent a distressed credit.
Note 24 Fair value measurement (continued)
i) Sensitivity of fair value measurements to changes in unobservable input assumptions
The table below summarizes those financial assets and liabilities classified as Level 3 for which a change in one or more of the unobservable inputs to reflect reasonably possible alternative assumptions would change fair value significantly, and the estimated effect thereof. As of 31 December 2015, the total favorable and unfavorable effects of changing one or more of the unobservable inputs to reflect reasonably possible alternative assumptions for financial instruments classified as Level 3 were CHF 0.8 billion and CHF 0.6 billion, respectively (31 December 2014: CHF 1.0 billion and CHF 0.8 billion, respectively).
The table shown presents the favorable and unfavorable effects for each class of financial assets and liabilities for which the potential change in fair value is considered significant. The sensitivity data presented represent an estimation of valuation uncertainty based on reasonably possible alternative values for Level 3 inputs at the balance sheet date and do not represent the estimated effect of stress scenarios. Typically, these financial assets and liabilities are sensitive to a combination of inputs from Levels 1–3. Although well-defined interdependencies may exist between Levels 1–2 and Level 3 parameters (e.g., between interest rates, which are generally Level 1 or Level 2, and prepayments, which are generally Level 3), these have not been incorporated in the table. Further, direct inter-relationships between the Level 3 parameters discussed below are not a significant element of the valuation uncertainty.
Sensitivity data are estimated using a number of techniques including the estimation of price dispersion among different market participants, variation in modeling approaches and reasonably possible changes to assumptions used within the fair value measurement process. The sensitivity ranges are not always symmetrical around the fair values as the inputs used in valuations are not always precisely in the middle of the favorable and unfavorable range.
Sensitivity data are determined at a product or parameter level and then aggregated assuming no diversification benefit. The calculated sensitivity is applied to both the outright position and any related Level 3 hedge. The main interdependencies across different Level 3 products to a single unobservable input parameter have been included in the basis of netting exposures within the calculation. Aggregation without allowing for diversification involves the simple summation of individual results with the total sensitivity, therefore representing the impact of all unobservable inputs which, if moved to a reasonably possible favorable or unfavorable level at the same time, would result in a significant change in the valuation. Diversification would incorporate estimated correlations across different sensitivity results and, as such, would result in an overall sensitivity that would be less than the sum of the individual component sensitivities. The Group believes that, while there are diversification benefits within the portfolios representing these sensitivity numbers, they are not significant to this analysis.
Sensitivity of fair value measurements to changes in unobservable input assumptions | | | |
| | 31.12.15 | | 31.12.14 |
CHF million | | Favorable changes¹ | Unfavorable changes¹ | | Favorable changes¹ | Unfavorable changes¹ |
Government bills / bonds | | 0 | (1) | | 10 | (1) |
Corporate bonds and municipal bonds, including bonds issued by financial institutions | | 24 | (25) | | 33 | (41) |
Traded loans, loans designated at fair value, loan commitments and guarantees | | 88 | (28) | | 103 | (63) |
Asset-backed securities | | 7 | (6) | | 16 | (12) |
Equity instruments | | 166 | (74) | | 105 | (42) |
Interest rate derivative contracts, net | | 107 | (67) | | 106 | (58) |
Credit derivative contracts, net | | 174 | (196) | | 248 | (277) |
Foreign exchange derivative contracts, net | | 33 | (28) | | 35 | (32) |
Equity / index derivative contracts, net | | 61 | (57) | | 82 | (83) |
Structured debt instruments issued and non-structured fixed-rate bonds | | 136 | (146) | | 202 | (199) |
Other | | 14 | (13) | | 23 | (17) |
Total | | 809 | (640) | | 965 | (824) |
1 Of the total favorable changes, CHF 164 million as of 31 December 2015 (31 December 2014: CHF 116 million) related to financial investments available-for-sale. Of the total unfavorable changes, CHF 71 million as of 31 December 2015 (31 December 2014: CHF 56 million) related to financial investments available-for-sale. |
Consolidated financial statements
Notes to the UBS Group AG consolidated financial statements
Note 24 Fair value measurement (continued)
j) Financial instruments not measured at fair value
The table below provides the estimated fair values of financial instruments not measured at fair value.
Financial instruments not measured at fair value | | | | | | | | | | |
| | 31.12.15 | | 31.12.14 |
| | Carrying value | | Fair value | | Carrying value | | Fair value |
CHF billion | | Total | | Total | Level 1 | Level 2 | Level 3 | | Total | | Total | Level 1 | Level 2 | Level 3 |
Assets | | | | | | | | | | | | | | |
Cash and balances with central banks | | 91.3 | | 91.3 | 91.3 | 0.0 | 0.0 | | 104.1 | | 104.1 | 104.1 | 0.0 | 0.0 |
Due from banks | | 11.9 | | 11.9 | 11.5 | 0.5 | 0.0 | | 13.3 | | 13.3 | 12.6 | 0.7 | 0.0 |
Cash collateral on securities borrowed | | 25.6 | | 25.6 | 0.0 | 25.6 | 0.0 | | 24.1 | | 24.1 | 0.0 | 24.1 | 0.0 |
Reverse repurchase agreements | | 67.9 | | 67.9 | 0.0 | 65.8 | 2.1 | | 68.4 | | 68.4 | 0.0 | 66.5 | 2.0 |
Cash collateral receivables on derivative instruments | | 23.8 | | 23.8 | 0.0 | 23.8 | 0.0 | | 31.0 | | 31.0 | 0.0 | 31.0 | 0.0 |
Loans | | 312.0 | | 314.1 | 0.0 | 170.2 | 143.9 | | 315.8 | | 318.3 | 0.0 | 186.4 | 131.9 |
Other assets | | 20.0 | | 20.0 | 0.0 | 20.0 | 0.0 | | 21.3 | | 21.1 | 0.0 | 21.1 | 0.0 |
Liabilities | | | | | | | | | | | | | | |
Due to banks | | 11.8 | | 11.8 | 10.4 | 1.4 | 0.0 | | 10.5 | | 10.5 | 9.6 | 0.9 | 0.0 |
Cash collateral on securities lent | | 8.0 | | 8.0 | 0.0 | 8.0 | 0.0 | | 9.2 | | 9.2 | 0.0 | 9.2 | 0.0 |
Repurchase agreements | | 9.7 | | 9.7 | 0.0 | 9.6 | 0.0 | | 11.8 | | 11.8 | 0.0 | 11.6 | 0.2 |
Cash collateral payables on derivative instruments | | 38.3 | | 38.3 | 0.0 | 38.3 | 0.0 | | 42.4 | | 42.4 | 0.0 | 42.4 | 0.0 |
Due to customers | | 390.2 | | 390.2 | 0.0 | 390.2 | 0.0 | | 410.2 | | 410.2 | 0.0 | 410.2 | 0.0 |
Debt issued | | 93.0 | | 95.5 | 0.0 | 89.5 | 6.0 | | 91.2 | | 94.3 | 0.0 | 88.5 | 5.8 |
Other liabilities | | 51.4 | | 51.4 | 0.0 | 51.4 | 0.0 | | 45.4 | | 45.4 | 0.0 | 45.4 | 0.0 |
Guarantees / Loan commitments | | | | | | | | | | | | | | |
Guarantees¹ | | 0.0 | | (0.1) | 0.0 | 0.0 | (0.1) | | 0.0 | | (0.1) | 0.0 | 0.0 | (0.1) |
Loan commitments | | 0.0 | | 0.0 | 0.0 | 0.0 | 0.0 | | 0.0 | | 0.0 | 0.0 | 0.0 | 0.0 |
1 The carrying value of guarantees represented a liability of CHF 0.0 billion as of 31 December 2015 (31 December 2014: CHF 0.0 billion). The estimated fair value of guarantees represented an asset of CHF 0.1 billion as of 31 December 2015 (31 December 2014: CHF 0.1 billion). |
Note 24 Fair value measurement (continued)
The fair values included in the table on the previous page were calculated for disclosure purposes only. The fair value valuation techniques and assumptions described below relate only to the fair value of UBS’s financial instruments not measured at fair value. Other institutions may use different methods and assumptions for their fair value estimation, and therefore such fair value disclosures cannot necessarily be compared from one financial institution to another. The following principles were applied when determining fair value estimates for financial instruments not measured at fair value:
– For financial instruments with remaining maturities greater than three months, the fair value was determined from quoted market prices, if available.
– Where quoted market prices were not available, the fair values were estimated by discounting contractual cash flows using current market interest rates or appropriate yield curves for instruments with similar credit risk and maturity. These estimates generally include adjustments for counterparty credit risk or UBS’s own credit.
– For short-term financial instruments with remaining maturities of three months or less, the carrying amount, which is net of credit loss allowances, is generally considered a reasonable estimate of fair value. The following financial instruments not measured at fair value had remaining maturities of three months or less as of 31 December 2015: 100% of cash and balances with central banks, 96% of amounts due from banks, 100% of cash collateral on securities borrowed, 87% of reverse repurchase agreements, 100% of cash collateral receivables on derivatives, 51% of loans, 88% of amounts due to banks, 87% of cash collateral on securities lent, 96% of repurchase agreements, 100% of cash collateral payable on derivatives, 99% of amount due to customers and 16% of debt issued.
– The fair value estimates for repurchase and reverse repurchase agreements with variable and fixed interest rates, for all maturities, include the valuation of the interest rate component of these instruments. Credit and debit valuation adjustments have not been included in the valuation due to the short-term nature of these instruments.
– The estimated fair values of off-balance sheet financial instruments are based on market prices for similar facilities and guarantees. Where this information is not available, fair value is estimated using discounted cash flow analysis.
Consolidated financial statements
Notes to the UBS Group AG consolidated financial statements
Note 25 Restricted and transferred financial assets
This Note provides information on restricted financial assets (Note 25a), transfers of financial assets (Note 25b and 25c) and financial assets which are received as collateral with the right to resell or repledge these assets (Note 25d).
EDTF | Pillar 3 | a) Restricted financial assets
Restricted financial assets consist of assets pledged as collateral against an existing liability or contingent liability and other assets that are otherwise explicitly restricted such that they cannot be used to secure funding.
Financial assets are mainly pledged as collateral in securities lending transactions, in repurchase transactions, against loans from Swiss mortgage institutions and in connection with the issuance of covered bonds. The Group generally enters into repurchase and securities lending arrangements under standard market agreements, with a market-based haircut applied to the collateral, which results in the associated liabilities having a carrying value below the carrying value of the assets. Pledged mortgage loans serve as collateral for existing liabilities against Swiss central mortgage institutions and for existing covered bond issuances of CHF 16,727 million as of 31 December 2015 (31 December 2014: CHF 21,644 million).
Other restricted financial assets include assets protected under client asset segregation rules, assets held by the Group’s insurance entities to back related liabilities to the policy holders, assets held in certain jurisdictions to comply with explicit minimum local asset maintenance requirements and assets held in consolidated bankruptcy remote entities such as certain investment funds and other structured entities. The carrying value of the liabilities associated with these other restricted financial assets is generally equal to the carrying value of the assets, with the exception of assets held to comply with local asset maintenance requirements for which the associated liabilities are greater.
UBS Group AG and its subsidiaries are generally not subject to significant restrictions that would prevent the transfer of dividends and capital within the Group. However, certain regulated subsidiaries are required to maintain capital and / or liquidity to comply with local regulations and may be subject to prudential limitations by regulators that limit the amount of funds that they can distribute or otherwise transfer. Non-regulated subsidiaries are generally not subject to such requirements and transfer restrictions. However, restrictions can also be the result of different legal, regulatory, contractual, entity or country-specific arrangements and / or requirements. ▲▲
EDTF |
Restricted financial assets | | | |
CHF million | | 31.12.15 | 31.12.14 |
Financial assets pledged as collateral | | | |
Trading portfolio assets | | 57,023 | 61,304 |
of which: assets pledged as collateral which may be sold or repledged by counterparties | | 51,943 | 56,018 |
Loans | | 24,980 | 27,973 |
of which: mortgage loans¹ | | 24,980 | 27,973 |
Financial investments available-for-sale | | 632 | 2,868 |
of which: assets pledged as collateral which may be sold or repledged by counterparties | | 6 | 2,662 |
Total financial assets pledged as collateral² | | 82,635 | 92,144 |
| | | |
Other restricted financial assets | | | |
Due from banks | | 3,285 | 3,511 |
Reverse repurchase agreements | | 1,099 | 1,896 |
Trading portfolio assets | | 24,388 | 25,567 |
Cash collateral receivables on derivative instruments | | 7,104 | 6,135 |
Financial assets designated at fair value | | 337 | 458 |
Financial investments available-for-sale | | 502 | 1,209 |
Other | | 480 | 221 |
Total other restricted financial assets | | 37,196 | 38,997 |
Total financial assets pledged and other restricted financial assets | | 119,830 | 131,142 |
1 These pledged mortgage loans serve as collateral for existing liabilities against Swiss central mortgage institutions and for existing covered bond issuances. Of these pledged mortgage loans, approximately CHF 4.4 billion for 31 December 2015 (31 December 2014: approximately CHF 4.5 billion) could be withdrawn or used for future liabilities or covered bond issuances without breaching existing collateral requirements. 2 Does not include assets placed with central banks related to undrawn credit lines and for payment, clearing and settlement purposes (31 December 2015: CHF 4.9 billion, 31 December 2014: CHF 6.1 billion). |
p
Note 25 Restricted and transferred financial assets (continued)
EDTF | b) Transferred financial assets that are not derecognized in their entirety
The table below presents information for financial assets, which have been transferred but are subject to continued recognition in full, as well as recognized liabilities associated with those transferred assets.
EDTF |
Transferred financial assets subject to continued recognition in full |
CHF million | | 31.12.15 | | 31.12.14 |
| | Carrying value of transferred assets | Carrying value of associated liabilities recognized on-balance sheet | | Carrying value of transferred assets | Carrying value of associated liabilities recognized on-balance sheet |
Trading portfolio assets transferred which may be sold or repledged by counterparties | | 51,943 | 13,146 | | 56,018 | 18,289 |
relating to securities lending and repurchase agreements in exchange for cash received | | 13,406 | 13,146 | | 19,366 | 18,147 |
relating to securities lending agreements in exchange for securities received | | 37,097 | 0 | | 35,557 | 0 |
relating to other financial asset transfers | | 1,440 | 0 | | 1,095 | 142 |
Financial investments available-for-sale transferred which may be sold or repledged by counterparties | | 6 | 6 | | 2,662 | 2,584 |
Total financial assets transferred | | 51,950 | 13,152 | | 58,680 | 20,873 |
▲
Transactions in which financial assets are transferred, but continue to be recognized in their entirety on UBS’s balance sheet include securities lending and repurchase agreements as well as other financial asset transfers. Repurchase and securities lending arrangements are, for the most part, conducted under standard market agreements, and are undertaken with counterparties subject to UBS’s normal credit risk control processes.
® Refer to Note 1a items 13 and 14 for more information on repurchase agreements and securities lending agreements
As of 31 December 2015, approximately a quarter of the transferred financial assets were trading portfolio assets transferred in exchange for cash, in which case the associated recognized liability represents the amount to be repaid to counterparties. For securities lending and repurchase agreements, a haircut between 0% and 15% is generally applied to the collateral, which results in associated liabilities having a carrying value below the carrying value of the transferred assets. The counterparties to the associated liabilities presented in the table above have full recourse to UBS.
In securities lending arrangements entered into in exchange for the receipt of other securities as collateral, neither the securities received nor the obligation to return them are recognized on UBS’s balance sheet, as the risks and rewards of ownership are not transferred to UBS. In cases where such financial assets received are subsequently sold or repledged in another transaction, this is not considered to be a transfer of financial assets.
Other financial asset transfers primarily include securities transferred to collateralize derivative transactions, for which the carrying value of associated liabilities is not provided in the table above because those replacement values are managed on a portfolio basis across counterparties and product types, and therefore is not a direct relationship between the specific collateral pledged and the associated liability.
Transferred assets other than trading portfolio assets and financial investments available-for-sale which may be sold or repledged by counterparties were not material as of 31 December 2015 and as of 31 December 2014.
Transferred financial assets that are not subject to derecognition in full, but which remain on the balance sheet to the extent of the Group’s continuing involvement, were not material as of 31 December 2015 and as of 31 December 2014. ▲
Consolidated financial statements
Notes to the UBS Group AG consolidated financial statements
Note 25 Restricted and transferred financial assets (continued)
EDTF | c) Transferred financial assets that are derecognized in their entirety with continuing involvement
Continuing involvement in a transferred and fully derecognized financial asset may result from contractual provisions in the transfer agreement or in a separate agreement with the counterparty or a third party entered into in connection with the transfer. The table below provides information on the Group’s continuing involvement in transferred and fully derecognized financial assets.
EDTF |
Transferred financial assets that are derecognized in their entirety with continuing involvement |
CHF million | | 31.12.15 |
| | | Carrying amount of continuing involvement | Fair value of continuing involvement | Gain / (loss) recognized at the date of transfer of the financial assets² | | Gain / (loss) from continuing involvement in transferred and derecognized financial assets |
| | Balance sheet line item | | For the year ended 31.12.15 | Life-to-date 31.12.15 |
Type of continuing involvement | | | | | | |
Purchased and retained interest in securitization structures | | Trading portfolio assets / Replacement values¹ | 15 | 15 | 8 | | 16 | (1,566) |
Total | | | 15 | 15 | 8 | | 16 | (1,566) |
| | | | | | | | |
CHF million | | 31.12.14 |
| | | Carrying amount of continuing involvement | Fair value of continuing involvement | Gain / (loss) recognized at the date of transfer of the financial assets | | Gain / (loss) from continuing involvement in transferred and derecognized financial assets |
| | Balance sheet line item | | For the year ended 31.12.14 | Life-to-date 31.12.14 |
Type of continuing involvement | | | | | | |
Purchased and retained interest in securitization structures | | Trading portfolio assets / Replacement values¹ | (22) | (22) | 22 | | 13 | (1,582) |
Total | | | (22) | (22) | 22 | | 13 | (1,582) |
1 As of 31 December 2015, total purchased and retained interest in securitization structures consisted of trading portfolio assets of CHF 37 million and negative replacement values of CHF 22 million. As of 31 December 2014, total purchased and retained interest in securitization structures consisted of trading portfolio assets of CHF 29 million and negative replacement values of CHF 51 million. 2 Represents gains / (losses) recognized on the date of transfer during the respective reporting period. |
▲
Purchased and retained interests in securitization vehicles
In cases where UBS has transferred assets into securitization vehicles and retained or purchased interests therein, UBS has a continuing involvement in those transferred assets. The majority of the retained continuing involvement securitization positions held in the trading portfolio are collateralized debt obligations, US commercial mortgage-backed securities and residential mortgage-backed securities. As a result of losses incurred in previous years, the majority of these continuing involvement positions had a carrying amount of zero as of 31 December 2015. As of 31 December 2015, the maximum exposure to loss related to purchased and retained interests in securitization structures was CHF 55 million compared with CHF 48 million as of 31 December 2014, both mainly related to trading portfolio assets. Undiscounted cash outflows of CHF 41 million may be payable to the transferee in future periods as a consequence of holding the purchased and retained interests. The earliest period in which payment may be required is less than one month. Life-to-date losses presented in the table above only relate to retained interests held as of 31 December 2015. ▲
Note 25 Restricted and transferred financial assets (continued)
d) Off-balance-sheet assets received
EDTF | The table below presents assets received from third parties that can be sold or repledged, that are not recognized on the balance sheet, but that are held as collateral, including amounts that have been sold or repledged. ▲
EDTF |
Off-balance-sheet assets received | | |
CHF million | 31.12.15 | 31.12.14 |
Fair value of assets received which can be sold or repledged | 401,511 | 388,855 |
received as collateral under reverse repurchase, securities borrowing and lending arrangements, derivative transactions and other transactions¹ | 393,839 | 383,354 |
received in unsecured borrowings | 7,672 | 5,502 |
thereof sold or repledged² | 286,757 | 271,963 |
in connection with financing activities | 241,992 | 227,515 |
to satisfy commitments under short sale transactions | 29,137 | 27,958 |
in connection with derivative and other transactions¹ | 15,628 | 16,491 |
1 Includes securities received as initial margin from its clients that UBS is required to remit to CCPs, brokers and deposit banks through its exchange-traded derivative (ETD) clearing and execution services. 2 Does not include off-balance sheet securities (31 December 2015: CHF 47.3 billion, 31 December 2014: CHF 37.6 billion) placed with central banks related to undrawn credit lines and for payment, clearing and settlement purposes for which there are no associated liabilities or contingent liabilities. |
▲
Note 26 Offsetting financial assets and financial liabilities EDTF | Pillar 3 | UBS enters into netting agreements with counterpar-ties to manage the credit risks associated primarily with repurchase and reverse repurchase transactions, securities borrowing and lending, and over-the-counter (OTC) and exchange-traded derivatives (ETD). These netting agreements and similar arrangements generally enable the counterparties to set-off liabilities against available assets received in the ordinary course of business and / or in the event that the counterparty to the transaction is unable to fulfill its contractual obligations. The right of set-off is a legal right to settle or otherwise eliminate all or a portion of an amount due by applying an amount receivable from the same counterparty against it, thus reducing credit exposure. ▲▲
The table on the following page provides a summary of financial assets subject to offsetting, enforceable master netting arrangements and similar agreements, as well as financial collateral received to mitigate credit exposures for these financial assets. The gross financial assets of the Group that are subject to offsetting, enforceable netting arrangements and similar agreements are reconciled to the net amounts presented within the associated balance sheet line, after giving effect to financial liabilities with the same counterparties that have been offset on the balance sheet and other financial assets not subject to an enforceable netting arrangement or similar agreement. Further, related amounts for financial liabilities and collateral received that are not offset on the balance sheet are shown to arrive at financial assets after consideration of netting potential.
The Group engages in a variety of counterparty credit mitigation strategies in addition to netting and collateral arrangements. Therefore, the net amounts presented in the tables on the next pages do not purport to represent the Group’s actual credit exposure.
Consolidated financial statements
Notes to the UBS Group AG consolidated financial statements
Note 26 Offsetting financial assets and financial liabilities (continued) Financial assets subject to offsetting, enforceable master netting arrangements and similar agreements |
| 31.12.15 |
| Assets subject to netting arrangements | | | | | |
| Netting recognized on the balance sheet | | Netting potential not recognized on the balance sheet³ | | Assets not subject to netting arrangements⁴ | | Total assets |
CHF billion | Gross assets before netting | Netting with gross liabilities² | Net assets recognized on the balance sheet | | Financial liabilities | Collateral received | Assets after consid- eration of netting potential | | Assets recognized on the balance sheet | | Total assets after consid- eration of netting potential | Total assets recognized on the balance sheet |
Cash collateral on securities borrowed | 23.9 | 0.0 | 23.9 | | (3.1) | (20.9) | 0.0 | | 1.6 | | 1.6 | 25.6 |
Reverse repurchase agreements | 117.9 | (62.1) | 55.8 | | (4.4) | (51.4) | 0.0 | | 12.1 | | 12.1 | 67.9 |
Positive replacement values | 161.9 | (2.5) | 159.3 | | (123.0) | (25.5) | 10.8 | | 8.1 | | 18.9 | 167.4 |
Cash collateral receivables on derivative instruments¹ | 85.9 | (66.3) | 19.6 | | (10.9) | (1.5) | 7.2 | | 4.1 | | 11.3 | 23.8 |
Financial assets designated at fair value | 2.4 | 0.0 | 2.4 | | 0.0 | (1.8) | 0.6 | | 3.7 | | 4.4 | 6.1 |
Total assets | 392.1 | (131.0) | 261.1 | | (141.3) | (101.1) | 18.7 | | 29.7 | | 48.4 | 290.8 |
| | | | | | | | | | | | |
| 31.12.14 |
| Assets subject to netting arrangements | | | | | |
| Netting recognized on the balance sheet | | Netting potential not recognized on the balance sheet³ | | Assets not subject to netting arrangements⁴ | | Total assets |
CHF billion | Gross assets before netting | Netting with gross liabilities² | Net assets recognized on the balance sheet | | Financial liabilities | Collateral received | Assets after consid- eration of netting potential | | Assets recognized on the balance sheet | | Total assets after consid- eration of netting potential | Total assets recognized on the balance sheet |
Cash collateral on securities borrowed | 22.7 | 0.0 | 22.7 | | (1.9) | (20.8) | 0.0 | | 1.4 | | 1.4 | 24.1 |
Reverse repurchase agreements | 99.2 | (42.8) | 56.4 | | (3.4) | (52.8) | 0.1 | | 12.1 | | 12.2 | 68.4 |
Positive replacement values | 249.9 | (3.1) | 246.8 | | (198.7) | (30.8) | 17.3 | | 10.1 | | 27.4 | 257.0 |
Cash collateral receivables on derivative instruments¹ | 245.7 | (218.4) | 27.4 | | (18.8) | (1.6) | 7.0 | | 3.6 | | 10.6 | 31.0 |
Financial assets designated at fair value | 3.1 | 0.0 | 3.1 | | 0.0 | (3.0) | 0.1 | | 1.9 | | 2.0 | 5.0 |
Total assets | 620.5 | (264.2) | 356.3 | | (222.9) | (108.9) | 24.5 | | 29.1 | | 53.6 | 385.4 |
1 The net amount of Cash collateral receivables on derivative instruments recognized on the balance sheet includes certain OTC derivatives which are in substance net settled on a daily basis under IAS 32, and ETD which are economically settled on a daily basis. In addition, this balance includes OTC and ETD cash collateral balances which correspond with the cash portion of collateral pledged, reflected on the Negative replacement values line in the table presented on the following page. 2 The logic of the table results in amounts presented in the “Netting with gross liabilities” column corresponding directly to the amounts presented in the “Netting with gross assets”column in the liabilities table presented on the following page. 3 For the purpose of this disclosure, the amounts of financial instruments and cash collateral presented have been capped by the relevant netting agreement so as not to exceed the net amount of financial assets presented on the balance sheet; i.e., over-collateralization, where it exists, is not reflected in the table. 4 Includes assets not subject to enforceable netting arrangements and other out-of-scope items. |
Note 26 Offsetting financial assets and financial liabilities (continued) The table below provides a summary of financial liabilities subject to offsetting, enforceable master netting arrangements and similar agreements, as well as financial collateral pledged to mitigate credit exposures for these financial liabilities. The gross financial liabilities of UBS that are subject to offsetting, enforceable netting arrangements and similar agreements are reconciled to the net amounts presented within the associated balance sheet line, after giving effect to financial assets with the same counterparties that have been offset on the balance sheet and other financial liabilities not subject to an enforceable netting arrangement or similar agreement. Further, related amounts for financial assets and collateral pledged that are not offset on the balance sheet are shown to arrive at financial liabilities after consideration of netting potential.
Financial liabilities subject to offsetting, enforceable master netting arrangements and similar agreements |
| 31.12.15 |
| Liabilities subject to netting arrangements | | | | | |
| Netting recognized on the balance sheet | | Netting potential not recognized on the balance sheet³ | | Liabilities not subject to netting arrangements⁴ | | Total liabilities |
CHF billion | Gross liabilities before netting | Netting with gross assets² | Net liabilities recognized on the balance sheet | | Financial assets | Collateral pledged | Liabilities after consid- eration of netting potential | | Liabilities recognized on the balance sheet | | Total liabilities after consid- eration of netting potential | Total liabilities recognized on the balance sheet |
Cash collateral on securities lent | 7.9 | 0.0 | 7.9 | | (3.1) | (4.8) | 0.0 | | 0.1 | | 0.1 | 8.0 |
Repurchase agreements | 69.0 | (62.1) | 6.9 | | (4.4) | (2.5) | 0.0 | | 2.8 | | 2.8 | 9.7 |
Negative replacement values | 154.2 | (2.5) | 151.7 | | (123.0) | (17.4) | 11.3 | | 10.7 | | 22.1 | 162.4 |
Cash collateral payables on derivative instruments¹ | 99.9 | (66.3) | 33.6 | | (19.0) | (2.5) | 12.1 | | 4.7 | | 16.8 | 38.3 |
Financial liabilities designated at fair value | 3.9 | 0.0 | 3.9 | | 0.0 | (0.7) | 3.1 | | 59.1 | | 62.3 | 63.0 |
Total liabilities | 334.9 | (131.0) | 203.9 | | (149.4) | (28.0) | 26.5 | | 77.4 | | 104.0 | 281.4 |
| | | | | | | | | | | | |
| 31.12.14 |
| Liabilities subject to netting arrangements | | | | | |
| Netting recognized on the balance sheet | | Netting potential not recognized on the balance sheet³ | | Liabilities not subject to netting arrangements⁴ | | Total liabilities |
CHF billion | Gross liabilities before netting | Netting with gross assets² | Net liabilities recognized on the balance sheet | | Financial assets | Collateral pledged | Liabilities after consid- eration of netting potential | | Liabilities recognized on the balance sheet | | Total liabilities after consid- eration of netting potential | Total liabilities recognized on the balance sheet |
Cash collateral on securities lent | 8.4 | 0.0 | 8.4 | | (1.9) | (6.5) | 0.0 | | 0.7 | | 0.8 | 9.2 |
Repurchase agreements | 51.5 | (42.8) | 8.7 | | (3.4) | (5.2) | 0.0 | | 3.2 | | 3.2 | 11.8 |
Negative replacement values | 243.3 | (3.1) | 240.2 | | (198.7) | (21.8) | 19.7 | | 13.9 | | 33.5 | 254.1 |
Cash collateral payables on derivative instruments¹ | 256.1 | (218.4) | 37.7 | | (25.1) | (2.3) | 10.3 | | 4.6 | | 14.9 | 42.4 |
Financial liabilities designated at fair value | 3.8 | 0.0 | 3.8 | | 0.0 | (1.4) | 2.4 | | 71.5 | | 73.9 | 75.3 |
Total liabilities | 563.1 | (264.2) | 298.8 | | (229.2) | (37.3) | 32.4 | | 93.9 | | 126.3 | 392.8 |
1 The net amount of Cash collateral payables on derivative instruments recognized on the balance sheet includes certain OTC derivatives which are in substance net settled on a daily basis under IAS 32, and ETD which are economically settled on a daily basis. In addition, this balance includes OTC and ETD cash collateral balances which correspond with the cash portion of collateral received, reflected on the Positive replacement values line in the table presented on the previous page. 2 The logic of the table results in amounts presented in the “Netting with gross assets” column corresponding directly to the amounts presented in the “Netting with gross liabilities” column in the assets table presented on the previous page. 3 For the purpose of this disclosure, the amounts of financial instruments and cash collateral presented have been capped by the relevant netting agreement so as not to exceed the net amount of financial liabilities presented on the balance sheet; i.e., over-collateralization, where it exists, is not reflected in the table. 4 Includes liabilities not subject to enforceable netting arrangements and other out-of-scope items. |
Consolidated financial statements
Notes to the UBS Group AG consolidated financial statements
Note 27 Financial assets and liabilities – additional information a) Measurement categories of financial assets and liabilities
The table below provides information about the carrying amounts of individual classes of financial instruments within the measurement categories of financial assets and liabilities as defined in IAS 39 Financial Instruments: Recognition and Measurement. Only those assets and liabilities that are
financial instruments as defined in IAS 32 Financial Instruments: Presentation are included in the table below, which causes certain balances to differ from those presented on the balance sheet.
® Refer to Note 24 for more information on how the fair value of financial instruments is determined
Measurement categories of financial assets and financial liabilities |
CHF million | 31.12.15 | 31.12.14 |
| | |
Financial assets¹ | | |
Held for trading | | |
Trading portfolio assets | 120,393 | 132,392 |
of which: assets pledged as collateral which may be sold or repledged by counterparties | 51,943 | 56,018 |
Debt issued² | 106 | 283 |
Positive replacement values | 167,435 | 256,978 |
Total | 287,934 | 389,653 |
Fair value through profit or loss | | |
Financial assets designated at fair value | 6,146 | 4,951 |
Financial assets at amortized cost | | |
Cash and balances with central banks | 91,306 | 104,073 |
Due from banks | 11,948 | 13,334 |
Cash collateral on securities borrowed | 25,584 | 24,063 |
Reverse repurchase agreements | 67,893 | 68,414 |
Cash collateral receivables on derivative instruments | 23,763 | 30,979 |
Loans³ | 311,954 | 315,757 |
Other assets | 20,048 | 21,251 |
Total | 552,496 | 577,872 |
Available-for-sale | | |
Financial investments available-for-sale | 62,543 | 57,159 |
Total financial assets | 909,119 | 1,029,634 |
| | |
Financial liabilities | | |
Held for trading | | |
Trading portfolio liabilities | 29,137 | 27,958 |
Debt issued² | 236 | 308 |
Negative replacement values | 162,430 | 254,101 |
Total | 191,803 | 282,367 |
Fair value through profit or loss, other | | |
Financial liabilities designated at fair value | 62,995 | 75,297 |
Amounts due under unit-linked investment contracts | 15,718 | 17,643 |
Total | 78,713 | 92,940 |
Financial liabilities at amortized cost | | |
Due to banks | 11,836 | 10,492 |
Cash collateral on securities lent | 8,029 | 9,180 |
Repurchase agreements | 9,653 | 11,818 |
Cash collateral payables on derivative instruments | 38,282 | 42,372 |
Due to customers | 390,185 | 410,207 |
Debt issued | 93,018 | 91,183 |
Other liabilities | 51,384 | 45,414 |
Total | 602,387 | 620,665 |
Total financial liabilities | 872,903 | 995,972 |
1 As of 31 December 2015, CHF 123 billion of Loans, CHF 0 billion of Due from banks, CHF 1 billion of Reverse repurchase agreements, CHF 30 billion of Financial investments available-for-sale and CHF 3 billion of Financial assets designated at fair value are expected to be recovered or settled after 12 months. As of 31 December 2014, CHF 119 billion of Loans, CHF 0 billion of Due from banks, CHF 1 billion of Reverse repurchase agreements, CHF 35 billion of Financial investments available-for-sale and CHF 4 billion of Financial assets designated at fair value are expected to be recovered or settled after 12 months. 2 Represents the embedded derivative component of structured debt issued for which the fair value option has not been applied and which is presented within Debt issued on the balance sheet. 3 Includes finance lease receivables of CHF 1.1 billion as of 31 December 2015 (31 December 2014: CHF 1.1 billion). Refer to Notes 10 and 33 for more information. |
Note 27 Financial assets and liabilities – additional information (continued) b) Maturity analysis of financial liabilities
The contractual maturities for non-derivative and non-trading financial liabilities as of 31 December 2015 are based on the earliest date on which UBS could be contractually required to pay. The total amounts that contractually mature in each time-band are also shown for 31 December 2014. Derivative positions and trading liabilities, predominantly made up of short sale transactions, are assigned to the column Due within 1 month, as this provides a conservative reflection of the nature of these trading activities. The contractual maturities may extend over significantly longer periods.
Maturity analysis of financial liabilities¹ |
CHF billion | Due within 1 month | Due between 1 and 3 months | Due between 3 and 12 months | Due between 1 and 5 years | Due after 5 years | Total |
| | | | | | |
Financial liabilities recognized on balance sheet² | | | | | | |
Due to banks | 8.1 | 2.4 | 1.1 | 0.3 | 0.0 | 11.8 |
Cash collateral on securities lent | 5.7 | 1.3 | 1.0 | | | 8.0 |
Repurchase agreements | 7.9 | 1.4 | 0.2 | 0.1 | 0.2 | 9.7 |
Trading portfolio liabilities³˒⁴ | 29.1 | | | | | 29.1 |
Negative replacement values³ | 162.4 | | | | | 162.4 |
Cash collateral payables on derivative instruments | 38.3 | | | | | 38.3 |
Financial liabilities designated at fair value⁵ | 15.2 | 15.9 | 13.1 | 11.9 | 12.0 | 68.1 |
Due to customers | 371.8 | 13.1 | 4.6 | 0.5 | 0.1 | 390.2 |
Debt issued | 5.7 | 10.2 | 16.5 | 40.8 | 32.3 | 105.4 |
Other liabilities | 66.0 | | | | | 66.0 |
Total 31.12.15 | 710.3 | 44.3 | 36.4 | 53.6 | 44.6 | 889.2 |
Total 31.12.14 | 811.0 | 48.4 | 39.4 | 60.9 | 49.8 | 1,009.5 |
| | | | | | |
Guarantees, commitments and forward starting transactions⁶ |
Loan commitments | 55.7 | 0.2 | 0.2 | 0.0 | | 56.1 |
Guarantees | 15.9 | 0.0 | 0.0 | 0.1 | 0.0 | 16.0 |
Forward starting transactions | | | | | | |
Reverse repurchase agreements | 6.6 | | | | | 6.6 |
Securities borrowing agreements | 0.0 | | | | | 0.0 |
Total 31.12.15 | 78.1 | 0.2 | 0.2 | 0.1 | 0.0 | 78.7 |
Total 31.12.14 | 78.3 | 0.1 | 0.2 | 0.2 | 0.0 | 78.8 |
1 Non-financial liabilities such as deferred income, deferred tax liabilities, provisions and liabilities on employee compensation plans are not included in this analysis. 2 Except for trading portfolio liabilities and negative replacement values (see footnote 3), the amounts presented generally represent undiscounted cash flows of future interest and principal payments. 3 Carrying value is fair value. Management believes that this best represents the cash flows that would have to be paid if these positions had to be settled or closed out. Refer to Note 14 for undiscounted cash flows of derivatives designated in hedge accounting relationships. 4 Contractual maturities of trading portfolio liabilities are: CHF 27.2 billion due within one month (2014: CHF 26.7 billion), CHF 1.2 billion due between one month and one year (2014: CHF 1.3 billion), and CHF 0.8 billion due between 1 and 5 years (2014: CHF 0 billion). 5 Future interest payments on variable rate liabilities are determined by reference to the applicable interest rate prevailing as of the reporting date. Future principal payments which are variable are determined by reference to the conditions existing at the reporting date. 6 Comprises the maximum irrevocable amount of guarantees, commitments and forward starting transactions. |
Consolidated financial statements
Notes to the UBS Group AG consolidated financial statements
Note 27 Financial assets and liabilities – additional information (continued) c) Reclassification of financial assets
In 2008 and 2009, certain financial assets were reclassified from Trading portfolio assets to Loans. On their reclassification date, these assets had fair values of CHF 26 billion and CHF 0.6 billion, respectively.
The reclassification of financial assets reflected UBS’s change in intent and ability to hold these financial assets for the foreseeable future rather than for trading in the near term. The financial assets were reclassified using their fair value on the date of the reclassification, which became their new cost basis at that date.
As of 31 December 2015, the carrying value of the remaining reclassified financial assets, which were entirely comprised of municipal auction rate securities, was CHF 0.2 billion (31 December 2014: CHF 0.7 billion), which was equal to the fair value of these assets.
The overall impact on operating profit before tax from reclassifed financial assets for the year ended 31 December 2015 was a profit of CHF 23 million (2014: CHF 84 million). If the financial assets had not been reclassified, the impact on operating profit before tax for the year ended 31 December 2015 would have been a profit of less than CHF 10 million.
d) Maximum exposure to credit risk of financial assets designated at fair value
Financial assets designated at fair value totaled CHF 6,146 million as of 31 December 2015 (31 December 2014: CHF 4,951 million). Maximum exposure to credit risk from financial assets designated at fair value was CHF 5.6 billion as of 31 December 2015 (31 December 2014: CHF 4.3 billion). The exposure related to structured loans and reverse repurchase and securities borrowing agreements was mitigated by securities collateral of CHF 3.5 billion as of 31 December 2015 (31 December 2014: CHF 3.3 billion).
The maximum exposure to credit risk of loans, but not structured loans, is generally mitigated by credit derivatives or similar instruments. Information regarding these instruments and the exposure which they mitigate is provided in the table below on a notional basis.
Investment fund units designated at fair value do not have a direct exposure to credit risk.
® Refer to Note 24 for more information on financial assets designated at fair value, and to “Maximum exposure to credit risk” in the “Risk management and control” section of this report for more information on collateral related to financial assets designated at fair value
Notional amounts of loans designated at fair value and related credit derivatives |
CHF million | 31.12.15 | 31.12.14 |
Loans – notional amount | 687 | 667 |
Credit derivatives related to loans – notional amount¹ | 630 | 644 |
Credit derivatives related to loans – fair value¹ | 4 | 1 |
1 Credit derivatives contracts include credit default swaps, total return swaps and similar instruments. |
The table below provides the effect on the fair values of loans from changes in credit risk for the periods presented and cumulatively since inception. Similarly, the change in fair value of credit derivatives and similar instruments which are used to hedge these loans is also provided.
Changes in fair value of loans and related credit derivatives attributable to changes in credit risk |
| | For the year ended | | Cumulative from inception until the year ended |
CHF million | | 31.12.15 | 31.12.14 | | 31.12.15 | 31.12.14 |
Changes in fair value of loans designated at fair value, attributable to changes in credit risk¹ | | (3) | (3) | | (4) | (2) |
Changes in fair value of credit derivatives and similar instruments which mitigate the maximum exposure to credit risk of loans designated at fair value¹ | | 3 | 3 | | 4 | 1 |
1 Current and cumulative changes in the fair value of loans designated at fair value, attributable to changes in their credit risk, are only calculated for those loans outstanding at balance sheet date. Current and cumulative changes in the fair value of credit derivatives hedging such loans include all the derivatives which have been used to mitigate credit risk of these loans since designation at fair value. For loans reported under the fair value option, changes in fair value due to changes in the credit standing of the borrower are calculated using counterparty credit information obtained from independent market sources. |
Note 28 Pension and other post-employment benefit plans
The table below provides information relating to pension costs for defined benefit plans and defined contribution plans. These costs are part of Personnel expenses.
Income statement – expenses related to pension and other post-employment benefit plans |
CHF million | 31.12.15 | 31.12.14 | 31.12.13 |
Net periodic pension cost for defined benefit plans | 569 | 467 | 651 |
of which: related to major pension plans¹ | 546 | 508 | 638 |
of which: Swiss plan | 515 | 458 | 555 |
of which: UK plan | 18 | 17 | 24 |
of which: other plans | 12 | 33 | 58 |
of which: related to post-retirement medical and life insurance plans² | 4 | (36) | (11) |
of which: UK plan | 1 | 2 | 2 |
of which: US plans | 2 | (37) | (12) |
of which: related to remaining plans and other costs³ | 19 | (5) | 24 |
Pension cost for defined contribution plans⁴ | 239 | 244 | 236 |
of which: UK | 86 | 91 | 91 |
of which: US | 100 | 91 | 91 |
of which: other countries | 53 | 62 | 54 |
Total pension and other post-employment benefit plan expenses⁵ | 808 | 711 | 887 |
1 Refer to Note 28a for more information. 2 Refer to Note 28b for more information. 3 Other costs include differences between actual and estimated performance award accruals and net accrued pension costs related to restructuring. 4 Refer to Note 28c for more information. 5 Refer to Note 6. |
The table below provides information relating to amounts recognized in other comprehensive income for defined benefit plans.
Other comprehensive income – gains / (losses) on pension and other post-employment benefit plans |
CHF million | 31.12.15 | 31.12.14 | 31.12.13 |
Major pension plans¹ | 339 | (1,456) | 1,168 |
of which: Swiss plan | 58 | (1,032) | 1,119 |
of which: UK plan | 317 | (168) | (65) |
of which: other plans | (35) | (256) | 115 |
Post-retirement medical and life insurance plans² | (3) | (5) | 3 |
of which: UK plan | 6 | (3) | 2 |
of which: US plans | (9) | (2) | 1 |
Remaining plans | (14) | 7 | 7 |
Gains / (losses) recognized in other comprehensive income, before tax | 322 | (1,454) | 1,178 |
Tax (expense) / benefit relating to defined benefit plans recognized in other comprehensive income | (19) | 247 | (239) |
Gains / (losses) recognized in other comprehensive income, net of tax³ | 303 | (1,208) | 939 |
of which: gains / (losses) recognized in other comprehensive income attributable to UBS Group AG shareholders | 298 | (1,172) | |
of which: gains / (losses) recognized in other comprehensive income attributable to non-controlling interests | 5 | (36) | |
1 Refer to Note 28a for more information. 2 Refer to Note 28b for more information. 3 Refer to the "Statement of comprehensive income". |
Consolidated financial statements
Notes to the UBS Group AG consolidated financial statements
Note 28 Pension and other post-employment benefit plans (continued)
The tables below provide information on UBS’s assets and liabilities with respect to pension and post-employment benefit plans. These are recognized on the balance sheet within Other assets and Other liabilities.
Balance sheet – net defined benefit pension and post-employment asset |
CHF million | 31.12.15 | 31.12.14 |
Major pension plans¹ | 50 | 0 |
of which: Swiss plan | 0 | 0 |
of which: UK plan | 50 | 0 |
of which: other plans | 0 | 0 |
Post-retirement medical and life insurance plans | 0 | 0 |
of which: UK plan | 0 | 0 |
of which: US plans | 0 | 0 |
Remaining plans | 0 | 0 |
Total net defined benefit pension and post-employment asset² | 50 | 0 |
1 Refer to Note 28a for more information. 2 Refer to Note 18. |
| | |
Balance sheet – net defined benefit pension and post-employment liability |
CHF million | 31.12.15 | 31.12.14 |
Major pension plans¹ | 622 | 1,256 |
of which: Swiss plan | 0 | 25 |
of which: UK plan | 0 | 568 |
of which: other plans² | 622 | 664 |
Post-retirement medical and life insurance plans³ | 84 | 85 |
of which: UK plan | 25 | 32 |
of which: US plans | 59 | 53 |
Remaining plans | 30 | 32 |
Total net defined benefit pension and post-employment liability⁴ | 736 | 1,374 |
1 Refer to Note 28a for more information. 2 Liability consists of: CHF 315 million related to US plans and CHF 307 million related to German plans (31 December 2014: CHF 297 million related to US plans and CHF 367 million related to German plans). 3 Refer to Note 28b for more information. 4 Refer to Note 23. |
Note 28 Pension and other post-employment benefit plans (continued)
a) Defined benefit pension plans
UBS has established defined benefit pension plans for its employees in various locations, with the major plans located in Switzerland, the UK, the US and Germany. Independent actuarial valuations for the plans in these countries are performed as required.
The overall investment policy and strategy for UBS’s defined benefit pension plans is guided by the objective of achieving an investment return which, together with contributions, ensures that there will be sufficient assets to pay pension benefits as they fall due while also mitigating the various risks of the plans. For the plans with assets (i.e., funded plans), the investment strategies for the plans are managed under local laws and regulations in each jurisdiction. The actual asset allocation is determined by the governance body with reference to the prevailing current and expected economic and market conditions and in consideration of specific asset class risk in the risk profile. Within this framework, UBS ensures that the fiduciaries consider how the asset investment strategy correlates with the maturity profile of the plan liabilities and the respective potential impact on the funded status of the plans, including potential short-term liquidity requirements.
The defined benefit obligation for all of UBS’s defined benefit pension plans is directly impacted by changes in yields of high-quality corporate bonds in the respective country in which the plan is held, as the applicable discount rate used to determine the defined benefit obligation is based on these yields. For the funded plans, the pension assets are invested in a diversified portfolio of financial assets including real estate, bonds, investment funds and cash across geographic regions to ensure a balance of risk and return to the extent allowed under local pension laws. The market value of these financial assets is not fully correlated to changes in high-quality corporate bond yields. This results in volatility in the net asset / liability position for each plan. Specific asset-liability matching strategies for each pension plan are independently determined by the responsible governance body in each country. The net asset / liability volatility for each plan is dependent on the specific financial assets chosen by each plan’s fiduciaries. For certain pension plans, a liability-driven investment approach is applied to a portion of the plan assets to reduce potential volatility.
Swiss pension plan
The Swiss pension plan covers employees of UBS AG and employees of companies having close economic or financial ties with UBS and exceeds the minimum benefit requirements under Swiss pension law.
Contributions to the pension plan are paid by the employer and the employees. The Swiss pension plan allows employees a choice with regard to the level of contributions paid by them. Employee contributions are calculated as a percentage of the contributory salary and are deducted monthly. The percentages deducted from salary depend on age and choice of contribution category and vary between 1% and 13.5% of contributory base salary and between 0% and 9% of contributory variable compensation. Depending on the age of the employee, UBS pays a contribution that ranges between 6.5% and 27.5% of contributory base salary and between 3.6% and 9% of contributory variable compensation. UBS also pays risk contributions which are used to finance benefits paid out in the event of death and disability, as well as to finance bridging pensions.
The plan benefits include retirement benefits and disability, death and survivor pensions. The pension plan offers to members at the normal retirement age of 64 a choice between a lifetime pension with or without full restitution and a partial or full lump sum payment. Members can draw early retirement benefits starting from the age of 58. Since 2015, employees have the possibility to make additional purchases of benefits to fund early retirement benefits (Plan 58+).
The payable pension amount is a result of the conversion rate applied on the accumulated balance of the individual plan participant’s pension account at the retirement date. The accumulated balance of each individual plan participant’s pension account is based on credited vested benefits transferred from previous employers, purchases of benefits and the employee and employer contributions that have been made to the pension account of each individual plan participant, as well as the interest accrued on the accumulated balance. The interest rate accrued is defined annually by the Pension Foundation Board.
Although the Swiss pension plan is based on a defined contribution promise under Swiss pension law, it is accounted for as a defined benefit plan under IAS 19, primarily because of the obligation to accrue interest on the pension accounts and the payment of lifetime pensions. The actuarial assumptions used for the Swiss pension plan are based on the Swiss economic environment.
® Refer to Note 1a item 24 for a description of the accounting policy for defined benefit pension plans
Consolidated financial statements
Notes to the UBS Group AG consolidated financial statements
Note 28 Pension and other post-employment benefit plans (continued)
The Swiss pension plan is governed by the Pension Foundation Board as required by Swiss pension law and the responsibilities of this board are defined by Swiss pension law and by the plan rules. According to Swiss pension law, a temporary limited underfunding is permitted. However, should an underfunded situation occur, the Pension Foundation Board is required to take the necessary measures to ensure that full funding can be expected to be restored within a maximum period of ten years. Under Swiss pension law, if a Swiss pension plan became significantly underfunded on a Swiss pension law basis, then additional employer and employee contributions could be required. In these situations, the risk is shared between employer and employees, and the employer is not legally obliged to cover more than 50% of the additional contributions required. The Swiss pension plan has a technical funding ratio under Swiss pension law of 123.3% as of 31 December 2015 (31 December 2014: 123.7%).
The investment strategy of the Swiss plan is implemented based on a multi-level investment and risk management process and is in line with Swiss pension law, including the rules and regulations relating to diversification of plan assets. These rules, among others, specify restrictions to the composition of plan assets, e.g., there is a limit of 50% for investments in equities. The investment strategy of the Swiss plan is aligned to the defined risk budget set out by the Pension Foundation Board. The risk budget is determined based on regularly performed asset and liability management analyses. In order to implement the risk budget, the Swiss plan may use direct investments, investment funds and derivatives. To mitigate foreign currency risk, a specific currency hedging strategy was implemented. The Pension Foundation Board strives for a medium- and long-term balance between assets and liabilities. Under IAS 19, volatility arises in the Swiss pension plan net asset / liability because the fair value of the plan assets is not directly correlated to movements in the value of the plan’s defined benefit obligation in the short-term.
As of 31 December 2015, the Swiss pension plan was in a surplus situation on an International Financial Reporting Standards (IFRS) measurement basis, as the fair value of plan assets exceeded the defined benefit obligation by CHF 1,283 million (31 December 2014: deficit of CHF 25 million). However, a surplus can only be recognized on the balance sheet to the extent that it does not exceed the estimated future economic benefit, which equals the difference between the present value of the estimated future net service cost and the present value of the estimated future employer contributions. The maximum future economic benefit is highly variable based on changes in the discount rate. As of 31 December 2015, the estimated future economic benefit was zero and hence, no net defined benefit asset was recognized on the balance sheet. The difference of CHF 1,283 million between the pension plan surplus and the estimated future economic benefit, the so-called asset ceiling effect, was recognized in other comprehensive income.
The employer contributions expected to be made to the Swiss pension plan in 2016 are estimated to be CHF 474 million.
Non-Swiss pension plans
The non-Swiss locations of UBS offer various defined benefit pension plans in accordance with local regulations and practices. The non-Swiss locations with major defined benefit plans are the UK, the US and Germany. Defined benefit pension plans in other locations are not material to the financial results of UBS and hence not separately disclosed.
The non-Swiss plans provide benefits in the event of retirement, death or disability. The level of benefits provided depends on the specific rate of benefit accrual and the level of employee compensation. UBS’s general principle is to ensure that the plans are appropriately funded under local pension regulations in each country and this is the primary driver for determining when additional contributions are required. Similar to the Swiss pension plan, volatility arises in the net asset / liability position of the non-Swiss plans because the fair value of the respective plans’ assets are not directly correlated to movements in the value of the plans’ defined benefit obligations.
The funding policy for these plans is consistent with local government regulations and tax requirements, and actuarial assumptions used are based on the local economic environment.
® Refer to Note 1a item 24 for a description of the accounting policy for defined benefit pension plans
UK
The UK plan is a career-average revalued earnings scheme, and benefits increase automatically based on UK price inflation. Normal retirement age for participants in the UK plan is 60. On 1 July 2013, UBS closed the UK defined benefit pension plan for future service. After that date, UBS no longer recognized current service costs for this plan. Plan participants who were active employees under the defined benefit plan were eligible to become participants of the defined contribution plan for any service after the plan was closed for future service.
Note 28 Pension and other post-employment benefit plans (continued)
The responsibility for governance of the UK plan lies jointly with the Pension Trustee Board, which is required under local pension laws, and UBS. The employer contributions to the pension fund included regular contributions and specific deficit-funding contributions until the date of the closure for future service and thereafter only reflected agreed-upon deficit-funding contributions. The deficit-funding contributions are determined based on the most recent actuarial valuation, which is conducted based on assumptions agreed by the Pension Trustee Board and UBS. In the event of an underfunding, UBS must agree to a deficit recovery plan with the Pension Trustee Board within statutory deadlines. In 2015, UBS made a deficit-funding contribution of CHF 316 million (2014: CHF 75 million).
The plan assets are invested in a diversified portfolio of financial assets. A liability-driven investment approach is applied as a portion of the plan assets are invested in inflation-indexed bonds which provide a partial hedge against price inflation. If price inflation increases, the defined benefit obligation will likely increase more significantly than any change in the fair value of plan assets, which would result in an increase in the net defined benefit liability. Plan rules and local pension legislation cap the level of inflationary increase that can be applied to plan benefits.
As the plan is obligated to provide guaranteed lifetime pension benefits to plan participants upon retirement, increases in life expectancy will result in an increase in the plan’s liabilities. This is particularly significant in the UK plan, where inflationary increases result in higher sensitivity to changes in life expectancy.
As of 31 December 2015, the UK plan was in a surplus situation on an IFRS measurement basis, as the fair value of plan assets exceeded the defined benefit obligation by CHF 50 million. This surplus was recognized on the UBS balance sheet, as UBS has a right to a refund with regards to the UK plan.
No employer contributions are expected to be made to the UK defined benefit plan in 2016.
US
There are two distinct major defined benefit pension plans in the US. Normal retirement age for participants in the US plans is 65. The plans are closed to new entrants, who instead can participate in defined contribution plans.
One of the major defined benefit pension plans is a contribution-based plan in which each participant accrues a percentage of salary in a pension account. The pension account is credited annually with interest based on a rate that is linked to the average yield on one-year US government bonds. For the other major defined benefit pension plan, retirement benefits accrue based on the career-average earnings of each individual plan participant. Upon retirement, the plans allow participants a choice between a lump sum payment and a lifetime pension.
Both of these defined benefit pension plans have fiduciaries as required under local state pension laws. The fiduciaries, along with UBS, are jointly responsible for governance of the plans. Actuarial valuations are regularly completed for the plans, and UBS has historically elected to make contributions to the plans in order to maintain a funded ratio of at least 80%, as calculated under local pension regulations. The annual employer contributions are equal to the present value of benefits accrued each year plus a rolling amortization of any prior underfunding. If the employer contributes more than the minimum or the plan has assets exceeding the liabilities, the excess can be used to offset minimum funding requirements.
The plan assets for both plans are invested in a diversified portfolio of financial assets. Each pension plan’s fiduciaries are responsible for the investment decisions with respect to the plan assets. A liability-driven investment approach is applied for one of the US plans to support the volatility management in the net asset / liability position. Derivative instruments may also be employed to manage volatility, including, but not limited to, interest rate futures, equity futures and swaps, including credit default swaps and interest rate swaps.
In 2015, the US pension plan rules were amended such that former UBS employees with vested benefits in the US defined benefit pension plans have the option to receive a lump sum payment (or early annuity payments) instead of a lifetime pension commencing at retirement age. This resulted in a reduction in the defined benefit obligation of CHF 24 million and a corresponding gain recognized in the income statement in 2015, of which CHF 21 million was recorded in Wealth Management Americas.
In 2013, UBS offered a one-time option to former UBS employees with vested benefits in the US defined benefit pension plans to receive a lump sum payment (or early annuity payments) instead of a lifetime pension. This resulted in a reduction in the defined benefit obligation of CHF 196 million, a reduction of fair value of plan assets of CHF 216 million and a charge to the income statement of CHF 20 million in 2013.
The employer contributions expected to be made to the US defined benefit plans in 2016 are estimated to be CHF 43 million.
Consolidated financial statements
Notes to the UBS Group AG consolidated financial statements
Note 28 Pension and other post-employment benefit plans (continued)
Germany
There are two different defined benefit pension plans in Germany and both are contribution-based plans. No plan assets are set aside to fund these plans and benefits are directly paid by UBS. Normal retirement age for the participants in the German plans is 65. Within the larger of the two pension plans, each participant accrues a percentage of salary in a pension account. On an annual basis the accumulated account balance of the plan participant is credited with guaranteed interest at a rate of 5%. The other plan is a deferred compensation plan in which amounts are accrued annually based on employee elections. For this deferred compensation plan, the accumulated account balance is credited on an annual basis with a guaranteed interest rate of 4% for amounts accrued after 2009. Both German plans are regulated under German pension law, under which the responsibility to pay pension benefits when they are due rests entirely with UBS. For the German plans, a portion of the pension payments is directly increased in line with price inflation.
The employer contributions expected to be made to the German plans in 2016 are estimated to be CHF 8 million.
The table on the following pages provides an analysis of the movement in the net asset / liability recognized on the balance sheet for defined benefit pension plans from the beginning to the end of the year, as well as an analysis of amounts recognized in net profit and in other comprehensive income.
In 2015, disclosures within this Note have been expanded to separately present UK plan information, which was previously included within “Non-Swiss” plans. Consequently, the US and German plans are now shown together within “Other”. Comparative information was adjusted accordingly.
Note 28 Pension and other post-employment benefit plans (continued)
Defined benefit pension plans | | | | | | | | | | |
CHF million | | Swiss | | UK | | Other | | Total |
For the year ended | | 31.12.15 | 31.12.14 | | 31.12.15 | 31.12.14 | | 31.12.15 | 31.12.14 | | 31.12.15 | 31.12.14 |
Defined benefit obligation at the beginning of the year | | 23,956 | 20,738 | | 3,949 | 3,355 | | 1,693 | 1,315 | | 29,598 | 25,408 |
Current service cost | | 589 | 496 | | 0 | 0 | | 10 | 10 | | 599 | 506 |
Interest expense | | 270 | 465 | | 137 | 158 | | 57 | 59 | | 463 | 682 |
Plan participant contributions | | 205 | 202 | | 0 | 0 | | 0 | 0 | | 205 | 202 |
Remeasurements of defined benefit obligation | | (1,231) | 3,120 | | (441) | 349 | | (8) | 270 | | (1,681) | 3,739 |
of which: actuarial (gains) / losses arising from changes in demographic assumptions | | (1,038) | 66 | | (122) | (15) | | 34 | 85 | | (1,125) | 136 |
of which: actuarial (gains) / losses arising from changes in financial assumptions | | (237) | 2,705 | | (201) | 489 | | (71) | 180 | | (509) | 3,374 |
of which: experience (gains) / losses¹ | | 44 | 349 | | (119) | (126) | | 28 | 6 | | (47) | 228 |
Past service cost related to plan amendments | | 0 | 0 | | 0 | 0 | | (24) | 0 | | (24) | 0 |
Curtailments | | (81) | (54) | | 0 | 0 | | 0 | 0 | | (81) | (54) |
Benefit payments | | (1,071) | (1,045) | | (128) | (91) | | (83) | (81) | | (1,283) | (1,218) |
Termination benefits | | 1 | 34 | | 0 | 0 | | 0 | 0 | | 1 | 34 |
Foreign currency translation | | 0 | 0 | | (166) | 178 | | (26) | 119 | | (192) | 297 |
Defined benefit obligation at the end of the year | | 22,636 | 23,956 | | 3,350 | 3,949 | | 1,619 | 1,693 | | 27,605 | 29,598 |
of which: amounts owing to active members | | 10,359 | 11,480 | | 255 | 312 | | 267 | 312 | | 10,881 | 12,104 |
of which: amounts owing to deferred members | | 0 | 0 | | 1,864 | 2,211 | | 523 | 545 | | 2,388 | 2,756 |
of which: amounts owing to retirees | | 12,278 | 12,477 | | 1,230 | 1,425 | | 829 | 836 | | 14,336 | 14,738 |
Fair value of plan assets at the beginning of the year | | 23,931 | 22,498 | | 3,381 | 2,922 | | 1,029 | 845 | | 28,341 | 26,266 |
Return on plan assets excluding amounts included in interest income | | 109 | 1,262 | | (124) | 181 | | (44) | 14 | | (59) | 1,457 |
Interest income | | 273 | 513 | | 118 | 141 | | 39 | 43 | | 430 | 697 |
Employer contributions – excluding termination benefits | | 482 | 478 | | 316 | 75 | | 57 | 107 | | 855 | 659 |
Employer contributions – termination benefits | | 1 | 34 | | 0 | 0 | | 0 | 0 | | 1 | 34 |
Plan participant contributions | | 205 | 202 | | 0 | 0 | | 0 | 0 | | 205 | 202 |
Benefit payments | | (1,071) | (1,045) | | (128) | (91) | | (83) | (81) | | (1,283) | (1,218) |
Administration expenses, taxes and premiums paid | | (10) | (10) | | 0 | 0 | | (8) | (6) | | (18) | (16) |
Payments related to plan amendments | | 0 | 0 | | 0 | 0 | | 0 | 0 | | 0 | 0 |
Foreign currency translation | | 0 | 0 | | (163) | 154 | | 7 | 107 | | (156) | 261 |
Fair value of plan assets at the end of the year | | 23,919 | 23,931 | | 3,400 | 3,381 | | 997 | 1,029 | | 28,316 | 28,341 |
Asset ceiling effect | | 1,283 | 0 | | 0 | 0 | | 0 | 0 | | 1,283 | 0 |
Net defined benefit asset / (liability) | | 0 | (25) | | 50 | (568) | | (622) | (664) | | (572) | (1,256) |
| | | | | | | | | | | | |
Movement in the net asset / (liability) recognized on the balance sheet |
Net asset / (liability) recognized on the balance sheet at the beginning of the year | | (25) | 952 | | (568) | (433) | | (664) | (470) | | (1,256) | 50 |
Net periodic pension cost | | (515) | (458) | | (18) | (17) | | (12) | (33) | | (546) | (508) |
Amounts recognized in other comprehensive income | | 58 | (1,032) | | 317 | (168) | | (35) | (256) | | 339 | (1,456) |
Employer contributions – excluding termination benefits | | 482 | 478 | | 316 | 75 | | 57 | 107 | | 855 | 659 |
Employer contributions – termination benefits | | 1 | 34 | | 0 | 0 | | 0 | 0 | | 1 | 34 |
Foreign currency translation | | 0 | 0 | | 3 | (24) | | 33 | (12) | | 36 | (36) |
Net asset / (liability) recognized on the balance sheet at the end of the year | | 0 | (25) | | 50 | (568) | | (622) | (664) | | (572) | (1,256) |
| | | | | | | | | | | | |
Funded and unfunded plans | | | | | | | | | | | | |
Defined benefit obligation from funded plans | | 22,636 | 23,956 | | 3,350 | 3,949 | | 1,288 | 1,301 | | 27,274 | 29,205 |
Defined benefit obligation from unfunded plans | | 0 | 0 | | 0 | 0 | | 331 | 392 | | 331 | 392 |
Plan assets | | 23,919 | 23,931 | | 3,400 | 3,381 | | 997 | 1,029 | | 28,316 | 28,341 |
Surplus / (deficit) | | 1,283 | (25) | | 50 | (568) | | (622) | (664) | | 711 | (1,256) |
Asset ceiling effect | | 1,283 | 0 | | 0 | 0 | | 0 | 0 | | 1,283 | 0 |
Net defined benefit asset / (liability) | | 0 | (25) | | 50 | (568) | | (622) | (664) | | (572) | (1,256) |
1 Experience (gains) / losses are a component of actuarial remeasurements of the defined benefit obligation which reflect the effects of differences between the previous actuarial assumptions and what has actually occurred. |
Consolidated financial statements
Notes to the UBS Group AG consolidated financial statements
Note 28 Pension and other post-employment benefit plans (continued)
Analysis of amounts recognized in net profit | | | | | | |
CHF million | | Swiss | | UK | | Other | | Total |
For the year ended | | 31.12.15 | 31.12.14 | | 31.12.15 | 31.12.14 | | 31.12.15 | 31.12.14 | | 31.12.15 | 31.12.14 |
Current service cost | | 589 | 496 | | 0 | 0 | | 10 | 10 | | 599 | 506 |
Interest expense related to defined benefit obligation | | 270 | 465 | | 137 | 158 | | 57 | 59 | | 463 | 682 |
Interest income related to plan assets | | (273) | (513) | | (118) | (141) | | (39) | (43) | | (430) | (697) |
Interest expense on asset ceiling effect | | 0 | 19 | | 0 | 0 | | 0 | 0 | | 0 | 19 |
Administration expenses, taxes and premiums paid | | 10 | 10 | | 0 | 0 | | 8 | 6 | | 18 | 16 |
Plan amendments | | 0 | 0 | | 0 | 0 | | (24) | 0 | | (24) | 0 |
Curtailments | | (81) | (54) | | 0 | 0 | | 0 | 0 | | (81) | (54) |
Termination benefits | | 1 | 34 | | 0 | 0 | | 0 | 0 | | 1 | 34 |
Net periodic pension cost | | 515 | 458 | | 18 | 17 | | 12 | 33 | | 546 | 508 |
| | | | | | | | | | | | |
Analysis of amounts recognized in other comprehensive income | | | | | | |
CHF million | | Swiss | | UK | | Other | | Total |
For the year ended | | 31.12.15 | 31.12.14 | | 31.12.15 | 31.12.14 | | 31.12.15 | 31.12.14 | | 31.12.15 | 31.12.14 |
Remeasurement of defined benefit obligation | | 1,231 | (3,120) | | 441 | (349) | | 8 | (270) | | 1,681 | (3,739) |
Return on plan assets excluding amounts included in interest income | | 109 | 1,262 | | (124) | 181 | | (44) | 14 | | (59) | 1,457 |
Asset ceiling effect excluding interest expense on asset ceiling effect | | (1,283) | 808 | | 0 | 0 | | 0 | 0 | | (1,283) | 808 |
Interest expense on asset ceiling effect | | 0 | 19 | | 0 | 0 | | 0 | 0 | | 0 | 19 |
Total gains / (losses) recognized in other comprehensive income, before tax | | 58 | (1,032) | | 317 | (168) | | (35) | (256) | | 339 | (1,456) |
of which: gains / (losses) recognized in other comprehensive income attributable to UBS Group AG shareholders | | 53 | (995) | | 315 | (170) | | (35) | (246) | | 333 | (1,412) |
of which: gains / (losses) recognized in other comprehensive income attributable to non-controlling interests | | 5 | (36) | | 2 | 2 | | 0 | (10) | | 7 | (44) |
The table below provides information on the duration of the defined benefit pension obligations and the distribution of the timing of benefit payments.
| | Swiss | | UK | | Other¹ |
| | 31.12.15 | 31.12.14 | | 31.12.15 | 31.12.14 | | 31.12.15 | 31.12.14 |
Duration of the defined benefit obligation (in years) | | 15.1 | 16.7 | | 19.7 | 20.2 | | 11.3 | 12.5 |
Maturity analysis of benefits expected to be paid | | | | | | | | | |
CHF million | | | | | | | | | |
Benefits expected to be paid within 12 months | | 1,146 | 1,033 | | 80 | 81 | | 92 | 85 |
Benefits expected to be paid between 1 to 3 years | | 2,218 | 2,023 | | 177 | 173 | | 185 | 171 |
Benefits expected to be paid between 3 to 6 years | | 3,403 | 3,035 | | 338 | 322 | | 291 | 274 |
Benefits expected to be paid between 6 to 11 years | | 5,526 | 5,394 | | 785 | 768 | | 509 | 485 |
Benefits expected to be paid between 11 to 16 years | | 5,173 | 5,571 | | 981 | 997 | | 510 | 513 |
Benefits expected to be paid in more than 16 years | | 18,892 | 26,613 | | 7,348 | 7,926 | | 1,172 | 1,363 |
1 The duration of the defined benefit obligation represents a weighted average across other plans. |
Note 28 Pension and other post-employment benefit plans (continued)
UBS regularly reviews the actuarial assumptions used in calculating its defined benefit obligations to determine their continuing relevance.
In 2015, UBS carried out a methodology review of the actuarial assumptions used in calculating its defined benefit obligation for its Swiss pension plan. As a result, UBS enhanced its methodology for estimating the discount rate by improving the construction of the yield curve where the market for long tenor maturities of Swiss high-quality corporate bonds was not sufficiently deep. Furthermore, UBS refined its approach to estimating the rate of salary increases, the rate of interest credit on retirement savings, the employee turnover rate, the rate of employee disabilities and the rate of marriage. These improvements in estimates resulted in a total net decrease in the defined benefit obligation (DBO) of the Swiss pension plan of CHF 2,055 million, of which CHF 1,038 million related to demographic assumptions and CHF 1,017 million related to financial assumptions. Out of the total of CHF 2,055 million, CHF 2,002 million was attributable to UBS Group AG shareholders and CHF 53 million was attributable to non-controlling interests. These reductions in the DBO from improvements in estimates were partly offset by market-driven discount rate changes, resulting in an overall downward remeasurement of the Swiss plan DBO of CHF 1,231 million, which was recognized in other comprehensive income.
Furthermore, UBS enhanced methodologies and refined approaches used to estimate various actuarial assumptions for its UK and other pension plans. These improvements in estimates resulted in a total net decrease in the DBO of the UK pension plan of CHF 192 million, of which CHF 122 million related to demographic assumptions and CHF 71 million related to financial assumptions. Out of the total of CHF 192 million, CHF 188 million was attributable to UBS Group AG shareholders and CHF 4 million was attributable to non-controlling interests. In addition, mainly market-driven discount rate changes reduced the DBO further, resulting in an overall downward remeasurement of the UK plan DBO of CHF 441 million, which was recognized in other comprehensive income.
The tables below show the principal actuarial assumptions used in calculating the defined benefit obligations.
| | Swiss | | UK | | Other¹ |
| | 31.12.15 | 31.12.14 | | 31.12.15 | 31.12.14 | | 31.12.15 | 31.12.14 |
Principal actuarial assumptions used (%) | | | | | | | | | |
Assumptions used to determine defined benefit obligations at the end of the year | | | | | | | | | |
Discount rate | | 1.09 | 1.15 | | 3.90 | 3.69 | | 4.01 | 3.60 |
Rate of salary increase | | 1.75 | 2.40 | | 0.00 | 0.00 | | 2.89 | 3.01 |
Rate of pension increase | | 0.00 | 0.00 | | 3.02 | 3.08 | | 1.50 | 1.75 |
Rate of interest credit on retirement savings | | 1.09 | 1.40 | | 0.00 | 0.00 | | 1.48 | 1.13 |
1 Represents weighted average assumptions across other plans. |
Mortality tables and life expectancies for major plans | | | |
| | | Life expectancy at age 65 for a male member currently |
| | | aged 65 | | aged 45 |
Country | Mortality table | | 31.12.15 | 31.12.14 | | 31.12.15 | 31.12.14 |
Switzerland | BVG 2010 G | | 21.5 | 21.4 | | 23.2 | 23.2 |
UK | S2PA CMI_2015, with projections¹ | | 23.9 | 24.4 | | 25.6 | 27.2 |
US | RP2014 WCHA, with MP2015 projection scale² | | 23.0 | 21.7 | | 24.5 | 23.4 |
Germany | Dr. K. Heubeck 2005 G | | 20.0 | 19.9 | | 22.6 | 22.5 |
| | | | | | | |
| | | Life expectancy at age 65 for a female member currently |
| | | aged 65 | | aged 45 |
Country | Mortality table | | 31.12.15 | 31.12.14 | | 31.12.15 | 31.12.14 |
Switzerland | BVG 2010 G | | 24.0 | 23.9 | | 25.7 | 25.6 |
UK | S2PA CMI_2015, with projections¹ | | 25.8 | 25.7 | | 28.0 | 28.0 |
US | RP2014 WCHA, with MP2015 projection scale² | | 24.6 | 23.9 | | 26.2 | 25.6 |
Germany | Dr. K. Heubeck 2005 G | | 24.1 | 23.9 | | 26.6 | 26.5 |
1 In 2014 the mortality table S1NA_L CMI 2014 G, with projections was used. 2 In 2014 the mortality table RP2014 G, with MP2014 projection scale was used. |
Consolidated financial statements
Notes to the UBS Group AG consolidated financial statements
Note 28 Pension and other post-employment benefit plans (continued)
Volatility arises in the defined benefit obligation for each of the pension plans due to the following actuarial assumptions applied in the measurement of the defined benefit obligation:
– Discount rate: the discount rate is based on the yield of high-quality corporate bonds of the market in the respective pension plan country. Consequently, a decrease in the yield of high-quality corporate bonds will increase the defined benefit obligation of the pension plans. Conversely, an increase in the yield of high-quality corporate bonds will decrease the defined benefit obligation of the pension plans.
– Rate of salary increase: an increase in the salary of plan participants will generally increase the defined benefit obligation, specifically for the Swiss and German plans. For the UK plan, as the plan is closed for future service, UBS employees no longer accrue future service benefits and thus salary increases have no impact on the defined benefit obligation. For the US plans, only a small percentage of the total population continues to accrue benefits for future service, therefore the impact of a salary increase on the defined benefit obligation is minimal.
– Rate of pension increase: for the Swiss plan, there is no automatic indexing of pensions. Any increase would be decided by the Pension Foundation Board. Similarly, for the US plans, there is no automatic indexing of pensions. For the UK plan, pensions are automatically indexed to price inflation as per plan rules and local pension legislation. Similarly, the German defined benefit pension plans are automatically indexed and a portion of the pensions are directly increased by price inflation. An increase in price inflation in the UK and Germany will increase the respective plan’s defined benefit obligation.
– Rate of interest credit on retirement savings: the Swiss plan and one of the plans in the US have retirement saving balances that are increased annually by an interest credit rate. For these plans, an increase in the interest credit rate would increase the respective plan’s defined benefit obligation.
– Life expectancy: for most of UBS’s defined benefit pension plans, the respective plan is obligated to provide guaranteed lifetime pension benefits. The defined benefit obligation for all plans is calculated using an underlying best estimate of the life expectancy of plan participants. An increase in the life expectancy of plan participants will increase the plan’s defined benefit obligation.
The table below presents a sensitivity analysis for each significant actuarial assumption showing how the defined benefit obligation would be affected by changes in the relevant actuarial assumption that were reasonably possible at the balance sheet date. Unforeseen circumstances may arise, which could result in variations that are outside the range of alternatives deemed reasonably possible. This sensitivity analysis applies to the defined benefit obligation only and not to the net asset / liability in its entirety. Caution should be used in extrapolating the sensitivities below to the overall impact on the defined benefit obligation, as the sensitivities may not be linear.
Sensitivity analysis of significant actuarial assumptions¹ |
| | Swiss plan: increase / (decrease) in defined benefit obligation | | UK plan: increase / (decrease) in defined benefit obligation | | Other plans: increase / (decrease) in defined benefit obligation |
CHF million | | 31.12.15 | 31.12.14 | | 31.12.15 | 31.12.14 | | 31.12.15 | 31.12.14 |
Discount rate | | | | | | | | | |
Increase by 50 basis points | | (1,416) | (1,688) | | (308) | (372) | | (84) | (98) |
Decrease by 50 basis points | | 1,609 | 1,936 | | 354 | 428 | | 92 | 108 |
Rate of salary increase | | | | | | | | | |
Increase by 50 basis points | | 82 | 210 | | –² | –² | | 1 | 2 |
Decrease by 50 basis points | | (86) | (198) | | –² | –² | | (1) | (2) |
Rate of pension increase | | | | | | | | | |
Increase by 50 basis points | | 1,163 | 1,315 | | 343 | 414 | | 6 | 8 |
Decrease by 50 basis points | | –³ | –³ | | (300) | (363) | | (5) | (7) |
Rate of interest credit on retirement savings | | | | | | | | | |
Increase by 50 basis points | | 263 | 334 | | –⁴ | –⁴ | | 8 | 9 |
Decrease by 50 basis points | | (249) | (315) | | –⁴ | –⁴ | | (8) | (8) |
Life expectancy | | | | | | | | | |
Increase in longevity by one additional year | | 719 | 755 | | 97 | 135 | | 42 | 45 |
1 The sensitivity analyses are based on a change in one assumption while holding all other assumptions constant, so that interdependencies between the assumptions are excluded. 2 As the plan is closed for future service, a change in assumption is not applicable. 3 As the assumed rate of pension increase was 0% as of 31 December 2015 and as of 31 December 2014, a downward change in assumption is not applicable. 4 As the plan does not provide interest credits on retirement savings, a change in assumption is not applicable. |
Note 28 Pension and other post-employment benefit plans (continued)
The table below provides information on the composition and fair value of plan assets of the Swiss pension plan, the UK pension plan and the other pension plans.
Composition and fair value of plan assets |
| | | | | | | | | | | | | | |
Swiss plan | | | | | | | | | | | | | | |
| | 31.12.15 | | 31.12.14 |
| | Fair value | | Plan asset allocation % | | Fair value | | Plan asset allocation % |
CHF million | | Quoted in an active market | Other | | Total | | | | Quoted in an active market | Other | | Total | | |
Cash and cash equivalents | | 517 | 0 | | 517 | | 2 | | 829 | 0 | | 829 | | 3 |
Real estate / property | | | | | | | | | | | | | | |
Domestic | | 0 | 2,647 | | 2,647 | | 11 | | 0 | 2,582 | | 2,582 | | 11 |
Investment funds | | | | | | | | | | | | | | |
Equity | | | | | | | | | | | | | | |
Domestic | | 699 | 0 | | 699 | | 3 | | 798 | 0 | | 798 | | 3 |
Foreign | | 6,948 | 1,085 | | 8,033 | | 34 | | 6,245 | 994 | | 7,239 | | 30 |
Bonds¹ | | | | | | | | | | | | | | |
Domestic, AAA to BBB– | | 2,112 | 0 | | 2,112 | | 9 | | 2,591 | 0 | | 2,591 | | 11 |
Foreign, AAA to BBB– | | 6,109 | 0 | | 6,109 | | 26 | | 6,418 | 0 | | 6,418 | | 27 |
Foreign, below BBB– | | 1,056 | 0 | | 1,056 | | 4 | | 104 | 0 | | 104 | | 0 |
Real estate | | | | | | | | | | | | | | |
Foreign | | 0 | 63 | | 63 | | 0 | | 0 | 104 | | 104 | | 0 |
Other | | 1,064 | 1,605 | | 2,669 | | 11 | | 2,513 | 736 | | 3,249 | | 14 |
Other investments | | 0 | 15 | | 15 | | 0 | | 0 | 17 | | 17 | | 0 |
Total | | 18,505 | 5,414 | | 23,919 | | 100 | | 19,499 | 4,432 | | 23,931 | | 100 |
| | | | | | | | | | | | | | |
| | | | | 31.12.15 | | | | | | | 31.12.14 | | |
Total fair value of plan assets | | 23,919 | | | | | | | 23,931 | | |
of which: | | | | | | | | | | | |
Bank accounts at UBS and UBS debt instruments | | 522 | | | | | | | 385 | | |
UBS shares | | 38 | | | | | | | 38 | | |
Securities lent to UBS² | | 962 | | | | | | | 921 | | |
Property occupied by UBS | | 82 | | | | | | | 87 | | |
Derivative financial instruments, counterparty UBS² | | (170) | | | | | | | (357) | | |
Structured products, counterparty UBS | | 0 | | | | | | | 42 | | |
1 The bond credit ratings are primarily based on Standard and Poor’s credit ratings. Ratings AAA to BBB– and below BBB– represent investment grade and non-investment grade ratings, respectively. In cases where credit ratings from other rating agencies were used, these were converted to the equivalent rating in the Standard & Poor's rating classification. 2 Securities lent to UBS and derivative financial instruments are presented gross of any collateral. Net of collateral, derivative financial instruments amounted to CHF (90) million as of 31 December 2015 (31 December 2014: CHF (123) million). Securities lent to UBS were fully covered by collateral as of 31 December 2015 and 31 December 2014. |
Consolidated financial statements
Notes to the UBS Group AG consolidated financial statements
Note 28 Pension and other post-employment benefit plans (continued)
Composition and fair value of plan assets (continued) |
| | | | | | | | | | | | | | |
UK plan | | | | | | | | | | | | | | |
| | 31.12.15 | | 31.12.14 |
| | Fair value | | Plan asset allocation % | | Fair value | | Plan asset allocation % |
CHF million | | Quoted in an active market | Other | | Total | | | | Quoted in an active market | Other | | Total | | |
Cash and cash equivalents | | 426 | 0 | | 426 | | 13 | | 192 | 0 | | 192 | | 6 |
Investment funds | | | | | | | | | | | | | | |
Equity | | | | | | | | | | | | | | |
Domestic | | 98 | 0 | | 98 | | 3 | | 122 | 0 | | 122 | | 4 |
Foreign | | 1,080 | 0 | | 1,080 | | 32 | | 1,042 | 0 | | 1,042 | | 31 |
Bonds¹ | | | | | | | | | | | | | | |
Domestic, AAA to BBB– | | 1,305 | 0 | | 1,305 | | 38 | | 1,344 | 0 | | 1,344 | | 40 |
Domestic, below BBB– | | 53 | 0 | | 53 | | 2 | | 179 | 0 | | 179 | | 5 |
Foreign, AAA to BBB– | | 189 | 0 | | 189 | | 6 | | 91 | 0 | | 91 | | 3 |
Foreign, below BBB– | | 31 | 0 | | 31 | | 1 | | 153 | 0 | | 153 | | 5 |
Real estate | | | | | | | | | | | | | | |
Domestic | | 46 | 68 | | 115 | | 3 | | 43 | 99 | �� | 142 | | 4 |
Other | | (32) | 123 | | 91 | | 3 | | (33) | 139 | | 106 | | 3 |
Other investments | | 6 | 7 | | 13 | | 0 | | 0 | 10 | | 10 | | 0 |
Total fair value of plan assets | | 3,202 | 198 | | 3,400 | | 100 | | 3,133 | 248 | | 3,381 | | 100 |
1 The bond credit ratings are primarily based on Standard and Poor’s credit ratings. Ratings AAA to BBB– and below BBB– represent investment grade and non-investment grade ratings, respectively. In cases where credit ratings from other rating agencies were used, these were converted to the equivalent rating in the Standard & Poor's rating classification. |
Note 28 Pension and other post-employment benefit plans (continued)
Composition and fair value of plan assets (continued) |
| | | | | | | | | | | | | | |
Other plans | | | | | | | | | | | | | | |
| | 31.12.15 | | 31.12.14 |
| | Fair value | | Weighted average plan asset allocation % | | Fair value | | Weighted average plan asset allocation % |
CHF million | | Quoted in an active market | Other | | Total | | | | Quoted in an active market | Other | | Total | | |
Cash and cash equivalents | | 52 | 0 | | 52 | | 5 | | 32 | 0 | | 32 | | 3 |
Bonds¹ | | | | | | | | | | | | | | |
Domestic, AAA to BBB– | | 56 | 0 | | 56 | | 6 | | 104 | 0 | | 104 | | 10 |
Domestic, below BBB– | | 60 | 0 | | 60 | | 6 | | 10 | 0 | | 10 | | 1 |
Foreign, AAA to BBB– | | 17 | 0 | | 17 | | 2 | | 24 | 0 | | 24 | | 2 |
Foreign, below BBB– | | 6 | 0 | | 6 | | 1 | | 3 | 0 | | 3 | | 0 |
Private equity | | 0 | 0 | | 0 | | 0 | | 0 | 0 | | 0 | | 0 |
Investment funds | | | | | | | | | | | | | | |
Equity | | | | | | | | | | | | | | |
Domestic | | 240 | 0 | | 240 | | 24 | | 250 | 0 | | 250 | | 24 |
Foreign | | 240 | 0 | | 240 | | 24 | | 258 | 0 | | 258 | | 25 |
Bonds¹ | | | | | | | | | | | | | | |
Domestic, AAA to BBB– | | 134 | 0 | | 134 | | 13 | | 142 | 0 | | 142 | | 14 |
Domestic, below BBB– | | 13 | 0 | | 13 | | 1 | | 13 | 0 | | 13 | | 1 |
Foreign, AAA to BBB– | | 31 | 0 | | 31 | | 3 | | 32 | 0 | | 32 | | 3 |
Foreign, below BBB– | | 3 | 0 | | 3 | | 0 | | 4 | 0 | | 4 | | 0 |
Real estate | | | | | | | | | | | | | | |
Domestic | | 0 | 12 | | 12 | | 1 | | 0 | 13 | | 13 | | 1 |
Other | | 56 | 42 | | 98 | | 10 | | 66 | 39 | | 105 | | 10 |
Insurance contracts | | 0 | 17 | | 17 | | 2 | | 0 | 17 | | 17 | | 2 |
Asset-backed securities | | 14 | 0 | | 14 | | 1 | | 17 | 0 | | 17 | | 2 |
Other investments | | 5 | 0 | | 5 | | 0 | | 5 | 0 | | 5 | | 0 |
Total fair value of plan assets | | 926 | 70 | | 997 | | 100 | | 961 | 68 | | 1,029 | | 100 |
1 The bond credit ratings are primarily based on Standard and Poor’s credit ratings. Ratings AAA to BBB– and below BBB– represent investment grade and non-investment grade ratings, respectively. In cases where credit ratings from other rating agencies were used, these were converted to the equivalent rating in the Standard & Poor's rating classification. |
Consolidated financial statements
Notes to the UBS Group AG consolidated financial statements
Note 28 Pension and other post-employment benefit plans (continued)
b) Post-retirement medical and life insurance plans
In the US and in the UK, UBS offers post-retirement medical benefits that contribute to the health care coverage of certain employees and their beneficiaries after retirement.
The UK post-retirement medical plan is closed to new entrants. In the US, in addition to post-retirement medical benefits, UBS also provides post-retirement life insurance benefits to certain employees. The post-retirement medical benefits in the UK and the US cover all types of medical expenses including, but not limited to, the cost of doctor visits, hospitalization, surgery and pharmaceuticals. These plans are not pre-funded plans and costs are recognized as incurred. In the US, the retirees also contribute to the cost of the post-retirement medical benefits.
In 2014, UBS announced changes to the US post-retirement medical plans in relation to a reduction or elimination of the subsidy provided for medical benefits. This change reduced the post-retirement benefit obligation by CHF 33 million, resulting in a corresponding gain recognized in the income statement in 2014.
Further in 2014, UBS announced changes to the US post-retirement life insurance plans in relation to an elimination of the US post-retirement life insurance policy. This change reduced the post-retirement benefit obligation by CHF 8 million, resulting in a corresponding gain recognized in the income statement in 2014.
The employer contributions expected to be made to the post-retirement medical and life insurance plans in 2016 are estimated to be CHF 6 million.
The table on the following page provides an analysis of the net asset / liability recognized on the balance sheet for post-retirement medical and life insurance plans from the beginning to the end of the year, as well as an analysis of amounts recognized in net profit and in other comprehensive income.
In 2015, disclosures within this Note have been expanded to separately present UK post-retirement medical plan information, which was previously presented together with the US post-retirement medical plans. Comparative information was adjusted accordingly.
Note 28 Pension and other post-employment benefit plans (continued)
Post-retirement medical and life insurance plans | | | | | | | | | |
CHF million | | UK | | US | | Total |
For the year ended | | 31.12.15 | 31.12.14 | | 31.12.15 | 31.12.14 | | 31.12.15 | 31.12.14 |
Post-retirement benefit obligation at the beginning of the year | | 32 | 28 | | 53 | 87 | | 85 | 114 |
Current service cost | | 0 | 0 | | 0 | 0 | | 0 | 0 |
Interest expense | | 1 | 1 | | 2 | 3 | | 3 | 5 |
Plan participant contributions | | 0 | 0 | | 2 | 2 | | 2 | 2 |
Remeasurements of post-retirement benefit obligation | | (6) | 3 | | 9 | 2 | | 3 | 5 |
of which: actuarial (gains) / losses arising from changes in demographic assumptions | | 2 | 0 | | 2 | 4 | | 4 | 4 |
of which: actuarial (gains) / losses arising from changes in financial assumptions | | (1) | 4 | | (2) | 5 | | (3) | 8 |
of which: experience (gains) / losses¹ | | (7) | 0 | | 9 | (7) | | 2 | (7) |
Past service cost related to plan amendments | | 0 | 0 | | 0 | (41) | | 0 | (41) |
Benefit payments² | | (1) | (2) | | (8) | (9) | | (10) | (10) |
Foreign currency translation | | (2) | 1 | | 1 | 8 | | (1) | 10 |
Post-retirement benefit obligation at the end of the year | | 25 | 32 | | 59 | 53 | | 84 | 85 |
of which: amounts owing to active members | | 5 | 12 | | 0 | 0 | | 5 | 12 |
of which: amounts owing to deferred members | | 0 | 0 | | 0 | 0 | | 0 | 0 |
of which: amounts owing to retirees | | 20 | 21 | | 59 | 53 | | 79 | 74 |
Fair value of plan assets at the end of the year | | 0 | 0 | | 0 | 0 | | 0 | 0 |
Net post-retirement benefit asset / (liability) | | (25) | (32) | | (59) | (53) | | (84) | (85) |
| | | | | | | | | |
Analysis of amounts recognized in net profit | | | | | | | | | |
Current service cost | | 0 | 0 | | 0 | 0 | | 0 | 0 |
Interest expense related to post-retirement benefit obligation | | 1 | 1 | | 2 | 3 | | 3 | 5 |
Past service cost related to plan amendments | | 0 | 0 | | 0 | (41) | | 0 | (41) |
Net periodic cost | | 1 | 2 | | 2 | (37) | | 4 | (36) |
| | | | | | | | | |
Analysis of gains / (losses) recognized in other comprehensive income | | | | | | | | | |
Remeasurement of post-retirement benefit obligation | | 6 | (3) | | (9) | (2) | | (3) | (5) |
Total gains / (losses) recognized in other comprehensive income, before tax | | 6 | (3) | | (9) | (2) | | (3) | (5) |
of which: gains / (losses) recognized in other comprehensive income attributable to UBS Group AG shareholders | | 6 | (3) | | (9) | (2) | | (3) | (5) |
of which: gains / (losses) recognized in other comprehensive income attributable to non-controlling interests | | 0 | 0 | | 0 | 0 | | 0 | 0 |
1 Experience (gains) / losses are a component of actuarial remeasurements of the post-retirement benefit obligation which reflect the effects of differences between the previous actuarial assumptions and what has actually occurred. 2 Benefit payments are funded by employer contributions and plan participant contributions. |
Consolidated financial statements
Notes to the UBS Group AG consolidated financial statements
Note 28 Pension and other post-employment benefit plans (continued)
The post-retirement benefit obligation is determined by using the assumed average health care cost trend rate, the discount rate and the life expectancy. On a country-by-country basis, the same discount rate is used for the calculation of the post-retirement benefit obligation from medical and life insurance plans as for the defined benefit obligations arising from pension plans.
UBS regularly reviews the actuarial assumptions used in calculating its post-retirement benefit obligations to determine their continuing relevance. In 2015, UBS enhanced methodologies and refined approaches used to estimate various actuarial assumptions. These improvements in estimates resulted in a net increase in the post-retirement benefit obligation.
The discount rate and the assumed average health care cost trend rates are presented in the table below. The basis for life expectancy assumptions is the same as provided for defined benefit pension plans in Note 28a.
Principal weighted average actuarial assumptions used (%)¹ | | | | | | | | |
Assumptions used to determine post-retirement benefit obligations at the end of the year | | UK | | US |
For the year ended | | 31.12.15 | | 31.12.14 | | 31.12.15 | | 31.12.14 |
Discount rate | | 3.90 | | 3.69 | | 4.23 | | 3.93 |
Average health care cost trend rate – initial | | 5.10 | | 5.50 | | 6.75 | | 7.00 |
Average health care cost trend rate – ultimate | | 5.10 | | 5.50 | | 5.00 | | 5.00 |
1 The assumptions for life expectancies are provided within Note 28a. |
Volatility arises in the post-retirement benefit obligation for each of the post-retirement medical and life insurance plans due to the following actuarial assumptions applied in the measurement of the post-retirement benefit obligation:
– Discount rate: similar as for defined benefit pension plans, a decrease in the yield of high-quality corporate bonds will increase the post-retirement benefit obligation for these plans. Conversely, an increase in the yield of high-quality corporate bonds will decrease the post-retirement benefit obligation for these plans.
– Average health care cost trend rate: an increase in health care costs would generally increase the post-retirement benefit obligation.
– Life expectancy: as some plan participants have lifetime benefits under these plans, an increase in life expectancy would increase the post-retirement benefit obligation.
The table below presents a sensitivity analysis for each significant actuarial assumption showing how the post-retirement benefit obligation would have been affected by changes in the relevant actuarial assumption that were reasonably possible at the balance sheet date.
Sensitivity analysis of significant actuarial assumptions¹ |
| | Increase / (decrease) in post-retirement benefit obligation |
| | UK | | US |
CHF million | | 31.12.15 | 31.12.14 | | 31.12.15 | 31.12.14 |
Discount rate | | | | | | |
Increase by 50 basis points | | (1) | (2) | | (3) | (2) |
Decrease by 50 basis points | | 2 | 2 | | 3 | 2 |
Average health care cost trend rate | | | | | | |
Increase by 100 basis points | | 3 | 4 | | 1 | (1) |
Decrease by 100 basis points | | (3) | (4) | | (1) | 1 |
Life expectancy | | | | | | |
Increase in longevity by one additional year | | 2 | 2 | | 5 | 5 |
1 The sensitivity analyses are based on a change in one assumption while holding all other assumptions constant, so that interdependencies between the assumptions are excluded. |
c) Defined contribution plans
UBS sponsors a number of defined contribution plans in locations outside of Switzerland. The locations with significant defined contribution plans are the UK and the US. Certain plans permit employees to make contributions and earn matching or other contributions from UBS. The employer contributions to these plans are recognized as an expense which, for the years ended 31 December 2015, 2014 and 2013, amounted to CHF 239 million, CHF 244 million and CHF 236 million, respectively.
Note 28 Pension and other post-employment benefit plans (continued)
d) Related party disclosure
UBS is the principal provider of banking services for the pension fund of UBS in Switzerland. In this function, UBS is engaged to execute most of the pension fund’s banking activities. These activities can include, but are not limited to, trading and securities lending and borrowing. The non-Swiss UBS pension funds do not have a similar banking relationship with UBS.
In 2008, UBS sold certain bank-occupied properties to the Swiss pension fund. Simultaneously, UBS and the Swiss pension fund entered into lease-back arrangements for some of the properties with 25-year lease terms and two renewal options for 10 years each. During 2009, UBS renegotiated one of the lease contracts, which reduced UBS’s remaining lease commitment. In 2013, after the first five years, the early break options for most of the leases were not exercised, which resulted in an increase in the minimum commitment for an additional five years. As of 31 December 2015, the minimum commitment toward the Swiss pension fund under the related leases is approximately CHF 11 million (31 December 2014: CHF 14 million).
The following amounts have been received or paid by UBS from and to the pension funds in respect of these banking activities and arrangements.
Related party disclosure |
| | For the year ended |
CHF million | | 31.12.15 | 31.12.14 | 31.12.13 |
Received by UBS | | | | |
Fees | | 33 | 33 | 33 |
Paid by UBS | | | | |
Rent | | 5 | 6 | 8 |
Interest | | (1) | 0 | 1 |
Dividends and capital repayments | | 14 | 4 | 2 |
The transaction volumes in UBS shares and UBS debt instruments are as follows.
Transaction volumes – UBS shares and UBS debt instruments |
| | For the year ended |
| | 31.12.15 | 31.12.14 |
Financial instruments bought by pension funds | | | |
UBS shares¹ (in thousands of shares) | | 1,544 | 2,092 |
UBS debt instruments (par values in CHF million) | | 3 | 4 |
Financial instruments sold by pension funds or matured | | | |
UBS shares¹ (in thousands of shares) | | 2,255 | 1,735 |
UBS debt instruments (par values in CHF million) | | 4 | 4 |
1 Represents purchases / sales of UBS AG shares up to 28 November 2014 and purchases / sales of UBS Group AG shares thereafter. Refer to Note 32 for more information. |
UBS defined contribution pension funds held 15,782,722 UBS Group AG shares with a fair value of CHF 306 million as of 31 December 2015 (31 December 2014: 16,253,804 UBS Group AG shares with a fair value of CHF 276 million).
More information on the fair value of the plan assets of the defined benefit pension plans are disclosed in Note 28a.
Consolidated financial statements
Notes to the UBS Group AG consolidated financial statements
Note 29 Equity participation and other compensation plans The UBS Group operates several equity participation and other compensation plans to align the interests of executives, managers and staff with the interests of shareholders. Some plans (e.g., Equity Plus and Equity Ownership Plan) are granted to eligible employees in approximately 50 countries and are designed to meet the legal, tax and regulatory requirements of each country in which they are offered. Certain plans are used in specific countries, business areas (e.g., awards granted within Wealth Management Americas), or are only offered to members of the Group Executive Board (GEB). The UBS Group operates compensation plans on a mandatory, discretionary and voluntary basis. The explanations below provide a general description of the terms of the most significant plans offered by the Group which relate to the performance year 2015 (awards granted in 2016) and those from prior years that were partly expensed in 2015.
® Refer to Note 1a item 25 for a description of the accounting policy related to equity participation and other compensation plans
Mandatory share-based compensation plans
Equity Ownership Plan (EOP): Select employees receive a portion of their annual performance-related compensation above a certain threshold in the form of an EOP award in UBS shares, notional shares or UBS performance shares (notional shares that are subject to performance conditions). From February 2014 onwards, only notional shares and UBS performance shares have been granted. Since 2011, performance shares have been granted to EOP participants who are Key Risk-Takers, Group Managing Directors (GMD) or employees whose incentive awards exceed a certain threshold, and since 2013 to GEB members. For performance shares granted in respect of the performance years 2012 and thereafter, the performance conditions are based on the Group return on tangible equity and the divisional return on attributed equity (for Corporate Center participants, the return on attributed equity of the Group excluding Corporate Center). Awards issued outside the normal performance year cycle, such as replacement awards or sign-on awards, may be offered in deferred cash under the EOP plan rules.
Awards in UBS shares allow for voting and dividend rights during the vesting period, whereas notional and performance shares represent a promise to receive UBS shares at vesting and do not carry voting rights during the vesting period. Notional and performance shares granted before February 2014 have no rights to dividends, whereas for awards granted since February 2014 employees are entitled to receive a dividend equivalent that may be paid in notional shares and / or cash, and which will vest on the same terms and conditions as the award. Awards granted in the form of UBS shares, notional shares and performance shares are settled by delivering UBS shares at vesting, except in countries where this is not permitted for legal or tax reasons. EOP awards granted until 2012 generally vested in three equal increments over a three-year vesting period and awards granted since March 2013 generally vest in equal increments in years two and three following grant. The awards are generally forfeitable upon, among other circumstances, voluntary termination of employment with UBS. Compensation expense is recognized in the performance year if the employee meets the retirement eligibility requirements at the date of grant. Otherwise, compensation expense is recognized from the grant date to the earlier of the vesting date or the retirement eligibility date of the employee, on a tiered basis.
Senior Executive Equity Ownership Plan (SEEOP): Up to 2012 (performance year 2011), GEB members and selected senior executives received a portion of their mandatory deferral in UBS shares or notional shares, which vest in one-fifth increments over a five-year vesting period and are forfeitable if certain conditions are not met. Awards granted in 2011 and 2012 are subject to the same performance conditions as performance shares granted under the EOP. They will only vest in full if the participant’s business division is profitable (for Corporate Center participants, the Group as a whole must be profitable) in the financial year preceding scheduled vesting. Awards granted under SEEOP are settled by delivering UBS shares at vesting. Compensation expense is recognized on the same basis as for share-settled EOP awards. No new SEEOP awards were granted since 2012. From 2013 (performance year 2012), GEB members have received EOP performance awards.
Incentive Performance Plan (IPP): In 2010, GEB members and certain other senior employees received part of their annual incentive in the form of performance shares granted under the IPP. Each performance share granted was a contingent right to receive between one and three UBS shares at vesting, depending on the achievement of share price targets. Vesting was subject to continued employment with UBS and certain other conditions. The IPP awards vested in March 2015. Compensation expense was recognized on a tiered basis from the grant date to the earlier of the vesting date or the retirement eligibility date of the employee. IPP was a one-time plan granted in 2010 only.
Note 29 Equity participation and other compensation plans (continued) Performance Equity Plan (PEP): In 2012 GEB members received part of their annual incentive in the form of performance shares granted under the PEP. Each performance share was a contingent right to receive between zero and two UBS shares at vesting, depending on the achievement of Economic Profit (EP) and Total Shareholder Return (TSR) targets. Vesting was subject to continued employment with UBS and certain other conditions. The last PEP awards vested in March 2015. Compensation expense was recognized on a tiered basis from the grant date to the earlier of the vesting date or the retirement eligibility date of the employee. No PEP awards were granted after 2012.
Special Plan Award Program for the Investment Bank 2012 (SPAP): In April 2012, certain Managing Directors and Group Managing Directors of the Investment Bank were granted an award of UBS shares which vested in 2015. Vesting was subject to performance conditions, continued employment with the firm and certain other conditions. Compensation expense was recognized from the grant date to the earlier of the vesting date or the retirement eligibility date of the employee.
Role-based allowances (RBA): In line with market practice, in certain countries, employees are entitled to receive a role-based allowance in addition to their base salary. This allowance reflects the market value of a specific role and is only paid as long as the employee is within such a role. The allowance is generally paid in cash and above a threshold it is granted in blocked shares. Such shares will be unblocked in equal instalments after two and three years. The compensation expense is recognized in the year of grant.
Mandatory deferred cash compensation plans
Deferred Contingent Capital Plan (DCCP): The DCCP is a mandatory performance award deferral plan for all employees whose total compensation exceeds a certain threshold. For awards granted up to January 2015, employees received part of their annual incentive in the form of notional bonds, which are a right to receive a cash payment at vesting. For awards granted for the performance years 2014 and 2015, employees have been awarded notional additional tier 1 (AT1) instruments, which at the discretion of UBS can either be settled in the form of a cash payment or a perpetual, marketable AT1 instrument. Awards vest in full after five years, subject to there being no trigger event. Awards granted under the DCCP forfeit if UBS’s phase-in common equity tier 1 capital ratio falls below 10% for GEB members and 7% for all other employees. In addition, awards are also forfeited if a viability event occurs, that is, if FINMA provides a written notice to UBS that the DCCP awards must be written down to prevent an insolvency, bankruptcy or failure of UBS, or if UBS receives a commitment of extraordinary support from the public sector that is necessary to prevent such an event. For GEB members, an additional performance condition applies. If UBS does not achieve an adjusted profit before tax for any year during the vesting period, GEB members forfeit 20% of their award for each loss-making year. For awards granted up to January 2015, interest on the awards is paid annually for performance years in which the firm generates an adjusted profit before tax. For awards granted since February 2015 interest payments are discretionary. The awards are subject to standard forfeiture and harmful acts provisions, including voluntary termination of employment with UBS. Compensation expense is recognized in the performance year if the employee meets the retirement eligibility requirements at the date of grant. Otherwise, compensation expense is recognized ratably from the grant date to the earlier of the vesting date or the retirement eligibility date of the employee.
Long-Term Deferred Retention Senior Incentive Scheme (LTDRSIS): Awards granted under the LTDRSIS are granted to employees in Australia and represent a profit share amount based on the profitability of the Australian business. Awards vest after three years and include an arrangement which allows for unpaid installments to be reduced if the business has a loss during the calendar year preceding vesting. The awards are generally forfeitable upon voluntary termination of employment with UBS. Compensation expense is recognized in the performance year if the employee meets the retirement eligibility requirements at the date of the grant. Otherwise, compensation expense is recognized ratably from the grant date to the earlier of the vesting date or the retirement eligibility date of the employee. 2014 was the last year awards were granted under LTDRSIS.
Asset Management Equity Ownership Plan: In order to align their compensation with the performance of the funds they manage, Asset Management employees who receive EOP awards receive them in the form of cash-settled notional funds. The amount depends on the value of the relevant underlying Asset Management funds at the time of vesting. The awards are generally forfeitable upon, among other circumstances, voluntary termination of employment with UBS. Compensation expense is recognized in the performance year if the employee meets the retirement eligibility requirements at the date of grant. Otherwise, compensation expense is recognized from the grant date to the earlier of the vesting date or the retirement eligibility date of the employee, on a tiered basis.
Wealth Management Americas financial advisor compensation
Financial advisor compensation plans generally provide for cash payments and deferred awards that are formula driven and fluctuate in proportion to the level of business activity.
Consolidated financial statements
Notes to the UBS Group AG consolidated financial statements
Note 29 Equity participation and other compensation plans (continued) UBS also may enter into compensation commitments with certain new financial advisors primarily as a recruitment incentive and to incentivize certain eligible active financial advisors to achieve specified revenue production and other performance thresholds. The compensation may be earned and paid to the employee during a period of continued employment and may be forfeited under certain circumstances.
GrowthPlus is a program for selected financial advisors whose revenue production and length of service exceeds defined thresholds from 2010 through 2017. Compensation arrangements were granted in 2010, 2011 and 2015, with potential arrangements to be granted in 2018. The awards vest ratably over seven years from grant with the exception of the 2018 arrangement, which vests over five years.
PartnerPlus is a mandatory deferred cash compensation plan for certain eligible financial advisors. Awards (UBS company contributions) are based on a predefined formula during the performance year. Participants are also allowed to voluntarily contribute additional amounts otherwise payable during the year, up to a certain percentage of their pay, which are vested upon contribution. Company contributions and voluntary contributions are credited with interest in accordance with the terms of the plan. Rather than being credited with interest, a participant may elect to have voluntary contributions, along with vested company contributions, credited with notional earnings based on the performance of various mutual funds. Company contributions and interest on both company and voluntary contributions ratably vest in 20% increments six to ten years following grant date. Company contributions and interest / notional earnings on both company and voluntary contributions are forfeitable under certain circumstances. Compensation expense for awards is recognized in the performance year if the employee meets the qualifying separation eligibility requirements at the date of grant. Otherwise, compensation expense for awards is recognized ratably commencing in the performance year to the earlier of the vesting date or the qualifying separation eligibility date of the employee. Compensation expense for voluntary contributions is recognized in the year of deferral.
Discretionary share-based compensation plans
Key Employee Stock Appreciation Rights Plan (KESAP) and Key Employee Stock Option Plan (KESOP): Until 2009, key and high potential employees were granted discretionary share-settled stock appreciation rights (SARs) or UBS options with a strike price not less than the fair market value of a UBS share on the date the SAR or option was granted. A SAR gives employees the right to receive a number of UBS shares equal to the value of any appreciation in the market price of a UBS share between the grant date and the exercise date. One option gives the right to acquire one registered UBS share at the option’s strike price. SARs and options are settled by delivering UBS shares, except in countries where this is not permitted for legal reasons. These awards are generally forfeitable upon termination of employment with UBS. Compensation expense is recognized from the grant date to the earlier of the vesting date or the retirement eligibility date of the employee. No options or SARs awards have been granted since 2009.
Voluntary share-based compensation plans
Equity Plus Plan (Equity Plus): Equity Plus is a voluntary plan that provides eligible employees with the opportunity to purchase UBS shares at market value and receive, at no additional cost, one free notional UBS share for every three shares purchased, up to a maximum annual limit. Share purchases may be made annually from the performance award and / or monthly through regular deductions from salary. If the shares purchased are held for three years, and in general if the employee remains in employment, the notional UBS shares vest. For notional UBS shares granted from April 2014 onwards, employees are entitled to receive a dividend equivalent which may be paid in either notional shares and / or cash. Prior to 2010, instead of notional shares participants received two UBS options for each share they purchased under this plan. The options had a strike price equal to the fair market value of a UBS share on the grant date, a two-year vesting period and generally expired ten years from the grant date. The options are forfeitable in certain circumstances and are settled by delivering UBS shares, except in countries where this is not permitted for legal reasons. Compensation expense for Equity Plus is recognized from the grant date to the earlier of the vesting date or the retirement eligibility date of the employee.
Share delivery obligations
As of 31 December 2015, total future share delivery obligations in relation to employee share-based compensation awards were 138 million shares (31 December 2014: 131 million shares), taking the respective performance conditions into account. Share delivery obligations related to unvested and vested notional share awards, options and stock appreciation rights.
Note 29 Equity participation and other compensation plans (continued) As of 31 December 2015, UBS held 98 million UBS Group AG treasury shares (31 December 2014: 88 million) which were available to satisfy the share delivery obligations. Additionally, 131 million UBS Group AG shares (31 December 2014: 136 million) to be issued out of conditional share capital were available to satisfy the share delivery obligation specifically related to options and stock appreciation rights. Treasury shares held or newly issued shares are delivered to employees at exercise or vesting.
b) Effect on the income statement
Effect on the income statement for the financial year and future periods
The following table summarizes the compensation expenses recognized for the year ended 31 December 2015 and deferred compensation expenses that will be recognized as an expense in the income statements of 2016 and later. The deferred compensation expenses in the table also include vested and non-vested awards granted mainly in February 2016, which relate to the performance year 2015.
Personnel expenses – Recognized and deferred¹ | | | | |
| | Personnel expenses for the year ended 2015 | | Personnel expenses deferred to 2016 and later |
CHF million | | Expenses relating to awards for 2015 | Expenses relating to awards for prior years | Total | | Relating to awards for 2015 | Relating to awards for prior years | Total |
Performance awards | | | | | | | | |
Cash performance awards | | 2,073 | (94) | 1,980 | | 0 | 0 | 0 |
Deferred Contingent Capital Plan (DCCP) | | 172 | 258 | 429 | | 343 | 446 | 789 |
Deferred cash plans (DCP and other cash plans) | | 0 | 12 | 12 | | 0 | 3 | 3 |
Equity Ownership Plan (EOP / SEEOP) – UBS shares | | 261 | 461 | 722 | | 524 | 338 | 861 |
Incentive Performance Plan (IPP) | | 0 | 0 | 0 | | 0 | 0 | 0 |
Total UBS share plans | | 261 | 461 | 722 | | 524 | 338 | 861 |
Equity Ownership Plan (EOP) – notional funds | | 28 | 38 | 67 | | 34 | 35 | 69 |
Total performance awards | | 2,535 | 675 | 3,210 | | 900 | 822 | 1,722 |
Variable compensation | | | | | | | | |
Variable compensation – other | | 184 | 162 | 346² | | 248³ | 293⁴ | 541 |
Financial advisor compensation – cash payments | | 2,460 | 0 | 2,460 | | 0 | 0 | 0 |
Compensation commitments with recruited financial advisors | | 43 | 692 | 735 | | 940 | 1,899 | 2,839 |
GrowthPlus and other deferral plans | | 132 | 142 | 275 | | 710 | 456 | 1,166 |
UBS share plans | | 37 | 45 | 82 | | 66 | 115 | 182 |
Wealth Management Americas: Financial advisor compensation⁵ | | 2,673 | 879 | 3,552 | | 1,716 | 2,470 | 4,186 |
Total | | 5,391 | 1,716 | 7,108 | | 2,864 | 3,585 | 6,449 |
1 Total share-based personnel expenses recognized for the year ended 31 December 2015 were CHF 1,028 million and were comprised of UBS share plans of CHF 807 million, Equity Ownership Plan - notional funds of CHF 67 million, related social security costs of CHF 56 million and other compensation plans (reported within Variable compensation – other) of CHF 98 million. 2 Includes replacement payments of CHF 76 million (of which CHF 65 million related to prior years), forfeiture credits of CHF 86 million (all related to prior years), severance payments of CHF 157 million (all related to 2015) and retention plan and other payments of CHF 198 million (of which CHF 183 million related to prior years). 3 Includes DCCP interest expense of CHF 160 million for DCCP awards 2015 (granted in 2016). 4 Includes DCCP interest expense of CHF 200 million for DCCP awards 2014, 2013 and 2012 (granted in 2015, 2014 and 2013). 5 Financial advisor compensation consists of grid-based compensation based directly on compensable revenues generated by financial advisors and supplemental compensation calculated based on financial advisor productivity, firm tenure, assets and other variables. It also includes charges related to compensation commitments with financial advisors entered into at the time of recruitment which are subject to vesting requirements. Amounts reflected as deferred expenses represent the maximum deferred exposure as of the balance sheet date. |
Consolidated financial statements
Notes to the UBS Group AG consolidated financial statements
Note 29 Equity participation and other compensation plans (continued) Personnel expenses – Recognized and deferred¹ | | | | | |
| | Personnel expenses for the year ended 2014 | | Personnel expenses deferred to 2015 and later |
CHF million | | Expenses relating to awards for 2014 | Expenses relating to awards for prior years | Total | | Relating to awards for 2014 | Relating to awards for prior years | Total |
Performance awards | | | | | | | | |
Cash performance awards | | 1,822 | (108) | 1,714 | | 0 | 0 | 0 |
Deferred Contingent Capital Plan (DCCP) | | 155 | 194 | 349 | | 312 | 386 | 698 |
Deferred cash plans (DCP and other cash plans) | | 0 | 12 | 12 | | 0 | 8 | 8 |
Equity Ownership Plan (EOP / SEEOP) – UBS shares | | 215 | 444 | 659 | | 459 | 367 | 826 |
Incentive Performance Plan (IPP) | | 0 | 21 | 21 | | 0 | 0 | 0 |
Total UBS share plans | | 215 | 465 | 680 | | 459 | 367 | 826 |
Equity Ownership Plan (EOP) – notional funds | | 24 | 41 | 65 | | 36 | 33 | 69 |
Total performance awards | | 2,216 | 604 | 2,820 | | 807 | 794 | 1,601 |
Variable compensation | | | | | | | | |
Variable compensation – other | | 260 | 206 | 466² | | 307³ | 340⁴ | 647 |
Financial advisor compensation – cash payments | | 2,396 | 0 | 2,396 | | 0 | 0 | 0 |
Compensation commitments with recruited financial advisors | | 39 | 636 | 675 | | 524 | 2,058 | 2,582 |
GrowthPlus and other deferral plans | | 81 | 153 | 234 | | 189 | 528 | 717 |
UBS share plans | | 23 | 57 | 80 | | 41 | 143 | 184 |
Wealth Management Americas: Financial advisor compensation⁵ | | 2,539 | 846 | 3,385 | | 754 | 2,729 | 3,483 |
Total | | 5,015 | 1,656 | 6,671 | | 1,868 | 3,863 | 5,731 |
1 Total share-based personnel expenses recognized for the year ended 31 December 2014 were CHF 999 million and were comprised of UBS share plans of CHF 800 million, Equity Ownership Plan - notional funds of CHF 65 million, related social security costs of CHF 41 million and other compensation plans (reported within Variable compensation – other) of CHF 93 million. 2 Includes replacement payments of CHF 81 million (of which CHF 70 million related to prior years), forfeiture credits of CHF 70 million (all related to prior years), severance payments of CHF 162 million (all related to 2014) and retention plan and other payments of CHF 292 million (of which CHF 206 million related to prior years). 3 Includes DCCP interest expense of CHF 121 million for DCCP awards 2014 (granted in 2015). 4 Includes DCCP interest expense of CHF 161 million for DCCP awards 2013 and 2012 (granted in 2014 and 2013). 5 Financial advisor compensation consists of grid-based compensation based directly on compensable revenues generated by financial advisors and supplemental compensation calculated based on financial advisor productivity, firm tenure, assets and other variables. It also includes charges related to compensation commitments with financial advisors entered into at the time of recruitment which are subject to vesting requirements. Amounts reflected as deferred expenses represent the maximum deferred exposure as of the balance sheet date. |
During 2015 and 2014, UBS accelerated the recognition of expenses for certain deferred compensation arrangements relating to employees that were affected by restructuring programs. Based on the redundancy provisions of the plan rules, these employees retain their deferred compensation awards. However, as the employees are not required to provide future service, compensation expense relating to these awards was accelerated to the termination date based on the shortened service period. The amounts accelerated and recognized relating to share-based payment awards in 2015 and 2014 were CHF 9 million and CHF 38 million respectively, and the amounts related to deferred cash awards were CHF 10 million and CHF 29 million, respectively.
UBS also shortened the service period for certain employees in accordance with the mutually agreed termination provisions of their deferred compensation awards. Expense recognition was accelerated to the termination date. The amounts accelerated and recognized relating to share-based payment awards in 2015 and 2014 were CHF 6 million and CHF 11 million, respectively, and the amounts related to deferred cash awards were CHF 11 million and CHF 8 million, respectively.
Note 29 Equity participation and other compensation plans (continued) Personnel expenses – Recognized and deferred | | | | | |
| | Personnel expenses for the year ended 2013 | | Personnel expenses deferred to 2014 and later |
CHF million | | Expenses relating to awards for 2013 | Expenses relating to awards for prior years | Total | | Relating to awards for 2013 | Relating to awards for prior years | Total |
Performance awards | | | | | | | | |
Cash performance awards | | 1,942 | (30) | 1,912 | | 0 | 0 | 0 |
Deferred Contingent Capital Plan (DCCP) | | 152 | 96 | 248 | | 348 | 230 | 578 |
Deferred cash plans (DCP and other cash plans) | | 2 | 53 | 55 | | 7 | 12 | 19 |
Equity Ownership Plan (EOP / SEEOP) – UBS shares | | 190 | 466 | 656 | | 520 | 307 | 827 |
Performance Equity Plan (PEP) | | 0 | 3 | 3 | | 0 | 0 | 0 |
Incentive Performance Plan (IPP) | | 0 | 33 | 33 | | 0 | 21 | 21 |
Total UBS share plans | | 190 | 502 | 692 | | 520 | 328 | 848 |
Equity Ownership Plan (EOP) – notional funds | | 19 | 60 | 79 | | 37 | 36 | 73 |
Total performance awards | | 2,305 | 681 | 2,986 | | 912 | 606 | 1,518 |
Variable compensation | | | | | | | | |
Variable compensation – other | | 152 | 136 | 288² | | 340³ | 398⁴ | 738 |
Financial advisor compensation – cash payments | | 2,219 | 0 | 2,219 | | 0 | 0 | 0 |
Compensation commitments with recruited financial advisors | | 33 | 605 | 638 | | 440 | 2,098 | 2,538 |
GrowthPlus and other deferral plans | | 62 | 132 | 194 | | 107 | 564 | 671 |
UBS share plans | | 20 | 69 | 89 | | 45 | 165 | 210 |
Wealth Management Americas: Financial advisor compensation⁵ | | 2,334 | 806 | 3,140 | | 592 | 2,827 | 3,419 |
Total | | 4,791 | 1,623 | 6,414 | | 1,844 | 3,831 | 5,675 |
1 Total share-based personnel expenses recognized for the year ended 31 December 2013 were CHF 1.042 million and were comprised of UBS share plans of CHF 787 million, Equity Ownership Plan - notional funds of CHF 79 million, related social security costs of CHF 65 million and other compensation plans (reported within Variable compensation – other) of CHF 111 million. 2 Includes replacement payments of CHF 78 million (of which CHF 72 million related to prior years), forfeiture credits of CHF 146 million (all related to prior years), severance payments of CHF 114 million (all related to 2013) and retention plan and other payments of CHF 242 million (of which CHF 210 million related to prior years). 3 Includes DCCP interest expense of CHF 101 million for DCCP awards 2013 (granted in 2014). 4 Includes DCCP interest expense of CHF 109 million for DCCP awards 2012 (granted in 2013). 5 Financial advisor compensation consists of grid-based compensation based directly on compensable revenues generated by financial advisors and supplemental compensation calculated based on financial advisor productivity, firm tenure, assets and other variables. It also includes charges related to compensation commitments with financial advisors entered into at the time of recruitment which are subject to vesting requirements. Amounts reflected as deferred expenses represent the maximum deferred exposure as of the balance sheet date. |
Additional disclosures on mandatory, discretionary and voluntary share-based compensation plans (including notional funds granted under EOP)
The total share-based personnel expenses recognized for the years ended 31 December 2015, 2014 and 2013 were CHF 1,028 million, CHF 999 million and CHF 1,042 million, respectively. This includes the current period expense, amortization and related social security costs for awards issued in prior periods and performance year expensing for awards granted to retirement-eligible employees where the terms of the awards do not require the employee to provide future services.
The total compensation expenses for non-vested share-based awards granted up to 31 December 2015 relating to prior years to be recognized in future periods is CHF 553 million and will be recognized as personnel expenses over a weighted average period of 1.9 years. This includes UBS share plans, the Equity Ownership Plan (notional funds), other variable compensation and the Equity Plus Plan. Total deferred compensation amounts included in the 2015 table differ from this amount as the deferred compensation amounts also include non-vested awards granted in February 2016 related to the performance year 2015.
Actual payments to participants in cash-settled share-based plans, including amounts granted as notional funds issued under the EOP, for the years ended 31 December 2015 and 2014 were CHF 98 million and CHF 90 million, respectively. The total carrying amount of the liability related to these plans was CHF 170 million as of 31 December 2015 and CHF 143 million as of 31 December 2014.
Consolidated financial statements
Notes to the UBS Group AG consolidated financial statements
Note 29 Equity participation and other compensation plans (continued) c) Movements during the year
UBS share and performance share awards
Movements in UBS share and notional share awards were as follows:
UBS share awards | | | | |
| Number of shares 2015 | Weighted average grant date fair value (CHF) | Number of shares 2014 | Weighted average grant date fair value (CHF) |
Outstanding, at the beginning of the year | 168,778,334 | 15 | 186,633,491 | 15 |
Shares awarded during the year | 66,444,272 | 16 | 58,925,185 | 18 |
Distributions during the year | (84,411,907) | 14 | (69,921,325) | 16 |
Forfeited during the year | (6,625,596) | 16 | (6,859,017) | 16 |
Outstanding, at the end of the year | 144,185,104 | 17 | 168,778,334 | 15 |
of which: shares vested for accounting purposes | 58,920,339 | | 48,749,489 | |
The fair value of shares that became legally vested and were distributed (i.e., all restrictions were fulfilled) during the years ended 2015 and 2014 was CHF 1,443 million and CHF 1,269 million, respectively.
Movements in performance shares granted under the IPP are as follows:
Incentive Performance Plan | | |
| 2015 |
| Number of performance shares | Weighted average fair value of IPP performance shares at grant date (CHF)¹ |
Forfeitable, at the beginning of the year | 12,742,168 | 22 |
Vested during the year | (12,017,543)² | 22 |
Forfeited during the year | (673,468) | 22 |
Forfeitable, at the end of the year | 51,157³ | 22 |
of which: performance shares vested for accounting purposes | 51,157 | |
|
| 2014 |
Forfeitable, at the beginning of the year | 13,151,023 | 22 |
Vested during the year | (240,064) | 22 |
Forfeited during the year | (168,791) | 22 |
Forfeitable, at the end of the year | 12,742,168³ | 22 |
of which: performance shares vested for accounting purposes | 12,742,168 | |
1 The weighted average fair value takes into account the applicable performance conditions and the range of possible outcomes. 2 The corresponding number of UBS shares distributed in 2015 was 12,017,543. In 2014 it amounted to 240,064. 3 As of 31 December 2015 and 31 December 2014, the number of deliverable UBS shares was equal to the number of forfeitable performance shares. |
Note 29 Equity participation and other compensation plans (continued) Movements in performance shares granted under the PEP are as follows:
Performance Equity Plan | | |
| 2015 |
| Number of performance shares | Weighted average fair value of PEP performance shares at grant date (CHF)¹ |
Forfeitable, at the beginning of the year | 767,531 | 13 |
Vested during the year | (337,718)² | 13 |
Forfeited during the year | (429,813) | 13 |
Forfeitable, at the end of the year | 0³ | |
of which: performance shares vested for accounting purposes | 0 | |
| | |
| 2014 |
Forfeitable, at the beginning of the year | 1,380,958 | 16 |
Vested during the year | (613,427) | 19 |
Forfeited during the year | 0 | 19 |
Forfeitable, at the end of the year | 767,531³ | 13 |
of which: performance shares vested for accounting purposes | 767,531 | |
1 The weighted average fair value takes into account the applicable performance conditions and the range of possible outcomes. 2 The corresponding number of UBS shares distributed in 2015 was 337,718. In 2014 it amounted to 245,371. 3 As of 31 December 2015, the number of deliverable UBS shares was zero as the remaining awards vested in 2015. As of 31 December 2014, the number of deliverable UBS shares was 337,714 based on the applicable performance conditions. |
UBS option awards
Movements in option awards were as follows:
UBS option awards |
| Number of options 2015 | Weighted average exercise price (CHF)¹ | Number of options 2014 | Weighted average exercise price (CHF)¹ |
Outstanding, at the beginning of the year | 108,396,107 | 45 | 133,170,139 | 45 |
Exercised during the year | (2,971,211) | 13 | (1,498,620) | 13 |
Forfeited during the year | (113,015) | 47 | (71,376) | 41 |
Expired unexercised | (24,463,664) | 48 | (23,204,036) | 48 |
Outstanding, at the end of the year | 80,848,217 | 45 | 108,396,107 | 45 |
Exercisable, at the end of the year | 80,848,217 | 45 | 108,396,107 | 45 |
1 Some of the options in this table have exercise prices denominated in USD which have been converted into CHF at the year-end spot exchange rate for the purposes of this table. |
The following table provides additional information about option exercises and intrinsic values:
For the year ended | 31.12.15 | 31.12.14 |
Weighted average share price of options exercised (CHF) | 19 | 18 |
Intrinsic value of options exercised during the year (CHF million) | 19.5 | 8.0 |
Consolidated financial statements
Notes to the UBS Group AG consolidated financial statements
Note 29 Equity participation and other compensation plans (continued) The following table provides additional information about options outstanding and options exercisable as of 31 December 2015:
| | Options outstanding | | Options exercisable |
Range of exercise prices | | Number of options outstanding | Weighted average exercise price (CHF / USD) | Aggregate intrinsic value (CHF / USD million) | Weighted average remaining contractual term (years) | | Number of options exercisable | Weighted average exercise price (CHF / USD) | Aggregate intrinsic value (CHF / USD million) | Weighted average remaining contractual term (years) |
| | | | | | | | | | |
CHF Awards | | | | | | | | | | |
10.21–15.00 | | 8,373,024 | 11.37 | 68.3 | 2.9 | | 8,373,024 | 11.37 | 68.3 | 2.9 |
15.01–25.00 | | 7,947,669 | 19.09 | 12.5 | 2.9 | | 7,947,669 | 19.09 | 12.5 | 2.9 |
25.01–35.00 | | 23,259,254 | 31.48 | 0.0 | 2.0 | | 23,259,254 | 31.48 | 0.0 | 2.0 |
35.01–45.00 | | 1,525,691 | 35.67 | 0.0 | 2.0 | | 1,525,691 | 35.67 | 0.0 | 2.0 |
45.01–55.00 | | 1,724,376 | 53.65 | 0.0 | 1.7 | | 1,724,376 | 53.65 | 0.0 | 1.7 |
55.01–65.00 | | 3,363,167 | 60.14 | 0.0 | 1.1 | | 3,363,167 | 60.14 | 0.0 | 1.1 |
65.01–75.00 | | 34,646,511 | 67.52 | 0.0 | 0.7 | | 34,646,511 | 67.52 | 0.0 | 0.7 |
10.21–75.00 | | 80,839,692 | | 80.8 | | | 80,839,692 | | 80.8 | |
| | | | | | | | | | |
USD Awards | | | | | | | | | | |
36.91–45.00 | | 0 | 0.00 | 0.0 | 0.0 | | 0 | 0.00 | 0.0 | 0.0 |
45.01–55.00 | | 8,525 | 50.30 | 0.0 | 0.1 | | 8,525 | 50.30 | 0.0 | 0.1 |
36.91–55.00 | | 8,525 | | 0.0 | | | 8,525 | | 0.0 | |
UBS SAR awards
Movements in SAR awards were as follows:
UBS SARs awards | | | | |
| Number of SARs 2015 | Weighted average exercise price (CHF) | Number of SARs 2014 | Weighted average exercise price (CHF) |
Outstanding, at the beginning of the year | 17,689,089 | 12 | 21,444,016 | 12 |
Exercised during the year | (4,917,534) | 11 | (3,575,927) | 11 |
Forfeited during the year | (14,500) | 12 | (14,500) | 14 |
Expired unexercised | (237,290) | 12 | (164,500) | 12 |
Outstanding, at the end of the year | 12,519,765 | 12 | 17,689,089 | 12 |
Exercisable, at the end of the year | 12,519,765 | 12 | 17,689,089 | 12 |
The following table provides additional information about SARs exercises and intrinsic values:
For the year ended | 31.12.15 | 31.12.14 |
Weighted average share price of SARs exercised (CHF) | 19 | 18 |
Intrinsic value of SARs exercised during the year (CHF million) | 38.9 | 22.8 |
Note 29 Equity participation and other compensation plans (continued) The following table provides additional information about SARs outstanding as of 31 December 2015:
| | SARs outstanding | | SARs exercisable |
Range of exercise prices | | Number of SARs outstanding | Weighted average exercise price (CHF) | Aggregate intrinsic value (CHF million) | Weighted average remaining contractual term (years) | | Number of SARs exercisable | Weighted average exercise price (CHF) | Aggregate intrinsic value (CHF million) | Weighted average remaining contractual term (years) |
| | | | | | | | | | |
CHF | | | | | | | | | | |
9.35–12.50 | | 12,161,765 | 11.34 | 99.5 | 0.4 | | 12,161,765 | 11.34 | 99.5 | 0.4 |
12.51–15.00 | | 4,000 | 14.22 | 0.0 | 3.5 | | 4,000 | 14.22 | 0.0 | 3.5 |
15.01–17.50 | | 42,000 | 16.80 | 0.1 | 3.4 | | 42,000 | 16.80 | 0.1 | 3.4 |
17.51–20.00 | | 312,000 | 19.25 | 0.1 | 3.7 | | 312,000 | 19.25 | 0.1 | 3.7 |
9.35–20.00 | | 12,519,765 | | 99.7 | | | 12,519,765 | | 99.7 | |
UBS share awards
UBS measures compensation expense based on the average market price of the UBS share on the grant date as quoted on the SIX Swiss Exchange, taking into consideration post-vesting sale and hedge restrictions, non-vesting conditions and market conditions, where applicable. The fair value of the share awards subject to post-vesting sale and hedge restrictions is discounted based upon the duration of the post-vesting restriction and is referenced to the cost of purchasing an at-the-money European put option for the term of the transfer restriction. The weighted average discount for share and performance share awards granted during 2015 is approximately 16.7% (2014: 12.9%) of the market price of the UBS share. The grant date fair value of notional UBS shares without dividend entitlements also includes a deduction for the present value of future expected dividends to be paid between the grant date and distribution.
UBS options and SARs awards
The fair values of options and SARs have been determined using a standard closed-formula option valuation model. The expected term of each instrument is calculated based on historical employee exercise behavior patterns, taking into account the share price, strike price, vesting period and the contractual life of the instrument. The term structure of volatility is derived from the implied volatilities of traded UBS options in combination with the observed long-term historical share price volatility. Expected future dividends are derived from traded UBS options or from the historical dividend pattern. No options or SARs have been granted since 2009.
Consolidated financial statements
Notes to the UBS Group AG consolidated financial statements
Note 30 Interests in subsidiaries and other entities a) Interests in subsidiaries
UBS defines its significant subsidiaries as those entities that, either individually or in aggregate, contribute significantly to the Group’s financial position or results of operations, based on a number of criteria, including the subsidiaries’ equity and their contribution to the Group’s total assets and profit and loss before tax, in accordance with the requirements set by IFRS 12, Swiss regulations and the regulations of the US Securities and Exchange Commission (SEC).
Individually significant subsidiaries
The two tables below list the Group’s individually significant subsidiaries as of 31 December 2015. Unless otherwise stated, the subsidiaries listed below have share capital consisting solely of ordinary shares, which are held fully by the Group, and the proportion of ownership interest held is equal to the voting rights held by the Group. The country where the respective registered office is located is also generally the principal place of business.
Pillar 3 |
Subsidiaries of UBS Group AG as of 31 December 2015 |
Company | Registered office | | Share capital in million | Equity interest accumulated in % |
UBS AG | Zurich and Basel, Switzerland | | CHF | 385.8 | 100.0 |
UBS Business Solutions AG | Zurich, Switzerland | | CHF | 1.0 | 100.0 |
UBS Group Funding (Jersey) Ltd. | St. Helier, Jersey | | CHF | 0.0 | 100.0 |
▲
Pillar 3 |
Individually significant subsidiaries of UBS AG as of 31 December 2015 |
Company | Registered office | Primary business division | Share capital in million | Equity interest accumulated in % |
UBS Americas Holding LLC | Wilmington, Delaware, USA | Corporate Center | USD | 1,200.0¹ | 100.0 |
UBS Bank USA | Salt Lake City, Utah, USA | Wealth Management Americas | USD | 0.0 | 100.0 |
UBS Financial Services Inc. | Wilmington, Delaware, USA | Wealth Management Americas | USD | 0.0 | 100.0 |
UBS Limited | London, United Kingdom | Investment Bank | GBP | 226.6 | 100.0 |
UBS Securities LLC | Wilmington, Delaware, USA | Investment Bank | USD | 1,283.1² | 100.0 |
UBS Switzerland AG | Zurich, Switzerland | Personal & Corporate Banking | CHF | 10.0 | 100.0 |
1 Comprised of common share capital of USD 1,000 and non-voting preferred share capital of USD 1,200,000,000. 2 Comprised of common share capital of USD 100,000 and non-voting preferred share capital of USD 1,283,000,000. |
▲
In 2015, UBS Group AG increased its ownership interest in UBS AG to 100% following the successful completion of the procedure under article 33 of the Swiss Stock Exchange Act (SESTA procedure). In addition, UBS Business Solutions AG was established as a direct subsidiary of UBS Group AG, to act as the Group service company.
Also in 2015, UBS transferred its Personal & Corporate Banking and Wealth Management business booked in Switzerland from UBS AG to UBS Switzerland AG, a newly formed bank subsidiary.
® Refer to Note 32 for more information
UBS Americas Holding LLC, UBS Limited and UBS Switzerland AG are fully held by UBS AG. UBS Bank USA, UBS Financial Services Inc. and UBS Securities LLC are fully held, directly or indirectly, by UBS Americas Holding LLC.
Note 30 Interests in subsidiaries and other entities (continued) Other subsidiaries
The table below lists other subsidiaries of UBS AG that are not individually significant but that contribute to the Group’s total assets and aggregated profit before tax thresholds and are thereby disclosed in accordance with the requirements set by the SEC.
Other subsidiaries of UBS AG as of 31 December 2015 | | | | |
Company | Registered office | Primary business division | Share capital in million | Equity interest accumulated in % |
Topcard Service AG | Glattbrugg, Switzerland | Personal & Corporate Banking | CHF | 0.2 | 100.0 |
UBS (Italia) SpA | Milan, Italy | Wealth Management | EUR | 95.0 | 100.0 |
UBS (Luxembourg) S.A. | Luxembourg, Luxembourg | Wealth Management | CHF | 150.0 | 100.0 |
UBS Americas Inc. | Wilmington, Delaware, USA | Corporate Center | USD | 0.0 | 100.0 |
UBS Asset Management (Americas) Inc. | Wilmington, Delaware, USA | Asset Management | USD | 0.0 | 100.0 |
UBS Asset Management (Australia) Ltd | Sydney, Australia | Asset Management | AUD | 20.1¹ | 100.0 |
UBS Asset Management (Deutschland) GmbH | Frankfurt, Germany | Asset Management | EUR | 7.7 | 100.0 |
UBS Asset Management (Hong Kong) Limited | Hong Kong, Hong Kong | Asset Management | HKD | 150.0 | 100.0 |
UBS Asset Management (Japan) Ltd | Tokyo, Japan | Asset Management | JPY | 2,200.0 | 100.0 |
UBS Asset Management (Singapore) Ltd | Singapore, Singapore | Asset Management | SGD | 4.0 | 100.0 |
UBS Asset Management (UK) Ltd | London, United Kingdom | Asset Management | GBP | 125.0 | 100.0 |
UBS Asset Management AG | Zurich, Switzerland | Asset Management | CHF | 0.1 | 100.0 |
UBS Australia Holdings Pty Ltd | Sydney, Australia | Investment Bank | AUD | 46.7 | 100.0 |
UBS Bank, S.A. | Madrid, Spain | Wealth Management | EUR | 97.2 | 100.0 |
UBS Beteiligungs-GmbH & Co. KG | Frankfurt, Germany | Wealth Management | EUR | 568.8 | 100.0 |
UBS Card Center AG | Glattbrugg, Switzerland | Personal & Corporate Banking | CHF | 0.1 | 100.0 |
UBS Credit Corp. | Wilmington, Delaware, USA | Wealth Management Americas | USD | 0.0 | 100.0 |
UBS Deutschland AG | Frankfurt, Germany | Wealth Management | EUR | 176.0 | 100.0 |
UBS Fund Advisor, L.L.C. | Wilmington, Delaware, USA | Wealth Management Americas | USD | 0.0 | 100.0 |
UBS Fund Mangement (Luxembourg) S.A. | Luxembourg, Luxembourg | Asset Management | EUR | 13.0 | 100.0 |
UBS Fund Mangement (Switzerland) AG | Basel, Switzerland | Asset Management | CHF | 1.0 | 100.0 |
UBS Hedge Fund Solutions LLC | Wilmington, Delaware, USA | Asset Management | USD | 0.1 | 100.0 |
UBS Italia SIM SpA | Milan, Italy | Investment Bank | EUR | 15.1 | 100.0 |
UBS O'Connor LLC | Dover, Delaware, USA | Asset Management | USD | 1.0 | 100.0 |
UBS Real Estate Securities Inc. | Wilmington, Delaware, USA | Investment Bank | USD | 0.0 | 100.0 |
UBS Realty Investors LLC | Boston, Massachusetts, USA | Asset Management | USD | 9.0 | 100.0 |
UBS Securities (Thailand) Ltd | Bangkok, Thailand | Investment Bank | THB | 500.0 | 100.0 |
UBS Securities Australia Ltd | Sydney, Australia | Investment Bank | AUD | 0.3¹ | 100.0 |
UBS Securities Canada Inc. | Toronto, Canada | Investment Bank | CAD | 10.0 | 100.0 |
UBS Securities España Sociedad de Valores SA | Madrid, Spain | Investment Bank | EUR | 15.0 | 100.0 |
UBS Securities India Private Limited | Mumbai, India | Investment Bank | INR | 140.0 | 100.0 |
UBS Securities Japan Co., Ltd. | Tokyo, Japan | Investment Bank | JPY | 46,450.0 | 100.0 |
UBS Securities Pte. Ltd. | Singapore, Singapore | Investment Bank | SGD | 420.4 | 100.0 |
UBS Services LLC | Wilmington, Delaware, USA | Corporate Center | USD | 0.0 | 100.0 |
UBS South Africa (Proprietary) Limited | Sandton, South Africa | Investment Bank | ZAR | 0.0 | 100.0 |
UBS Trust Company of Puerto Rico | Hato Rey, Puerto Rico | Wealth Management Americas | USD | 0.1 | 100.0 |
UBS UK Properties Limited | London, United Kingdom | Corporate Center | GBP | 132.0 | 100.0 |
1 Includes a nominal amount relating to redeemable preference shares. |
Consolidated financial statements
Notes to the UBS Group AG consolidated financial statements
Note 30 Interests in subsidiaries and other entities (continued) Changes in consolidation scope
During 2015, a number of subsidiaries were incorporated in order to improve the resolvability of the Group in response to too big to fail requirements, namely UBS Business Solutions AG, UBS Americas Holding LLC, UBS Switzerland AG and UBS Asset Management AG. UBS Fund Services (Cayman) Ltd and a few smaller subsidiaries of Asset Management were removed from the scope of consolidation as part of the sale of the Alternative Fund Services business.
Non-controlling interests
As of 31 December 2015, non-controlling interests mainly comprised preferred notes issued by UBS AG. Apart from this, non-controlling interests were not material to the Group. As of 31 December 2014, UBS Group AG recognized equity attributable to non-controlling interests in relation to the 3.32% of UBS AG shares held by non-controlling shareholders.
® Refer to the “Statement of changes in equity” and Note 32 for more information
As of 31 December 2015 and 31 December 2014, there were no significant restrictions on UBS’s ability to access or use the assets and settle the liabilities of the Group resulting from protective rights of non-controlling interests.
Consolidated structured entities
UBS consolidates a structured entity (SE) if it has power over the relevant activities of the entity, exposure to variable returns and the ability to use its power to affect its returns. Consolidated SEs include certain investment funds, securitization vehicles and client investment vehicles. UBS has no individually significant subsidiaries that are SEs.
Investment fund SEs are generally consolidated when the Group’s aggregate exposure combined with its decision making rights indicate the ability to use such power in a principal capacity. Typically the Group will have decision making rights as fund manager, earning a management fee, and will provide seed capital at the inception of the fund or hold a significant percentage of the fund units. Where other investors do not have the substantive ability to remove UBS as decision maker, the Group is deemed to have control and therefore consolidates the fund.
Securitization SEs are generally consolidated when the Group holds a significant percentage of the asset backed securities issued by the SE and has the power to remove without cause the servicer of the asset portfolio.
Client investment SEs are generally consolidated when the Group has a substantive liquidation right over the SE or a decision right over the assets held by the SE and has exposure to variable returns through derivatives traded with the SE or holding notes issued by the SE.
In 2015 and 2014, the Group has not entered into any contractual obligation that could require the Group to provide financial support to consolidated SEs. In addition, the Group did not provide support, financial or otherwise, to a consolidated SE when the Group was not contractually obligated to do so, nor has the Group an intention to do so in the future. Further, the Group did not provide support, financial or otherwise, to a previously unconsolidated SE that resulted in the Group controlling the SE during the reporting period.
Note 30 Interests in subsidiaries and other entities (continued) Pillar 3 | b) Interests in associates and joint ventures
As of 31 December 2015 and 2014, no associate or joint venture was individually material to the Group. In addition, there were no significant restrictions on the ability of associates or joint ventures to transfer funds to UBS Group AG or its subsidiaries in the form of cash dividends or to repay loans or advances made. There were no quoted market prices for any associates or joint ventures of the Group. ▲
Pillar 3 |
Investments in associates and joint ventures | | |
CHF million | 31.12.15 | 31.12.14 |
Carrying amount at the beginning of the year | 927 | 842 |
Additions | 12 | 1 |
Disposals | (2) | (2) |
Share of comprehensive income | 151 | 103 |
of which: share of net profit¹˒² | 169 | 94 |
of which: share of other comprehensive income³ | (18) | 9 |
Dividends received | (114) | (54) |
Foreign currency translation | (20) | 38 |
Carrying amount at the end of the year | 954 | 927 |
of which: associates | 925 | 900 |
of which: UBS Securities Co. Limited, Beijing⁴ | 411 | 404 |
of which: SIX Group AG, Zurich⁵ | 413 | 406 |
of which: other associates | 102 | 90 |
of which: joint ventures | 29 | 27 |
1 For 2015, consists of CHF 158 million from associates and CHF 11 million from joint ventures. For 2014, consists of CHF 83 million from associates and CHF 11 million from joint ventures. 2 In 2015, the SIX Group sold its stake in STOXX Ltd and Indexium Ltd. The UBS share of the resulting gain on sale was CHF 81 million. 3 For 2015, consists of CHF (18) million from associates and CHF 0 million from joint ventures. For 2014, consists of CHF 8 million from associates and CHF 0 million from joint ventures. 4 During 2015, UBS AG's equity interest increased to 24.99% (20.0% as of 31 December 2014). 5 UBS AG's equity interest amounts to 17.3%. UBS AG is represented on the Board of Directors. |
▲
Consolidated financial statements
Notes to the UBS Group AG consolidated financial statements
Note 30 Interests in subsidiaries and other entities (continued) Pillar 3 | c) Interests in unconsolidated structured entities
During 2015, the Group sponsored the creation of various SEs and interacted with a number of non-sponsored SEs, including securitization vehicles, client vehicles as well as certain investment funds, which UBS did not consolidate as of 31 December 2015 because it did not control these entities.
® Refer to Note 1a item 3 for more information on the nature, purpose, activities and financing structure of these entities
The table below presents the Group’s interests in and maximum exposure to loss from unconsolidated SEs as of 31 December 2015. In addition, the total assets held by the SEs in which UBS had an interest as of 31 December 2015 are provided, except for investment funds sponsored by third parties, for which the carrying value of UBS’s interest as of 31 December 2015 has been disclosed. ▲
Interests in unconsolidated structured entities | | |
| | 31.12.15 |
CHF million, except where indicated | | Securitization vehicles | Client vehicles | Investment funds | Total | Maximum exposure to loss¹ |
Trading portfolio assets | | 1,060 | 463 | 6,102 | 7,624 | 7,624 |
Positive replacement values | | 41 | 101 | 57 | 200 | 200 |
Financial assets designated at fair value | | | 97² | 95 | 191 | 1,730 |
Loans | | 0 | 0 | 101 | 101 | 101 |
Financial investments available-for-sale | | | 3,396 | 102 | 3,498 | 3,498 |
Other assets | | 0 | 45² | 0 | 45 | 937 |
Total assets | | 1,101³ | 4,102 | 6,457 | 11,660 | |
Negative replacement values | | 30⁴ | 631 | 0 | 661 | 19 |
Total liabilities | | 30⁵ | 631 | 0 | 661 | |
Assets held by the unconsolidated structured entities in which UBS had an interest (CHF billion) | | 141⁶ | 43⁷ | 320⁸ | | |
| | | | | | |
| | 31.12.14 |
CHF million, except where indicated | | Securitization vehicles | Client vehicles | Investment funds | Total | Maximum exposure to loss¹ |
Trading portfolio assets | | 1,955 | 676 | 8,079 | 10,711 | 10,711 |
Positive replacement values | | 26 | 83 | 2 | 111 | 111 |
Financial assets designated at fair value | | | 115² | 102 | 217 | 2,422 |
Loans | | 466 | 40 | 206 | 712 | 712 |
Financial investments available-for-sale | | | 4,029 | 94 | 4,123 | 4,123 |
Other assets | | | 52² | | 52 | 1,248 |
Total assets | | 2,447³ | 4,996 | 8,482 | 15,925 | |
Negative replacement values | | 245⁴ | 27 | 75 | 347 | 21 |
Total liabilities | | 245⁵ | 27 | 75 | 347 | |
Assets held by the unconsolidated structured entities in which UBS had an interest (CHF billion) | | 355⁶ | 113⁷ | 304⁸ | | |
1 For purposes of this disclosure, maximum exposure to loss amounts do not consider the risk-reducing effects of collateral or other credit enhancements. 2 Represents the carrying value of loan commitments, both designated at fair value and held at amortized cost. The maximum exposure to loss for these instruments is equal to the notional amount. 3 As of 31 December 2015, CHF 0.9 billion of the CHF 1.1 billion was held in Corporate Center - Non-core and Legacy Portfolio. As of 31 December 2014, CHF 2.2 billion of the CHF 2.4 billion was held in Corporate Center - Non-core and Legacy Portfolio. 4 Comprised of credit default swap (CDS) liabilities and other swap liabilities. The maximum exposure to loss for CDS is equal to the sum of the negative carrying value and the notional amount. For other swap liabilities, no maximum exposure to loss is reported. 5 Entirely held in Corporate Center - Non-core and Legacy Portfolio. 6 Represents principal amount outstanding. 7 Represents the market value of total assets. 8 Represents the net asset value of the investment funds sponsored by UBS (31 December 2015: CHF 310 billion, 31 December 2014: CHF 296 billion) and the carrying value of UBS's interests in the investment funds not sponsored by UBS (31 December 2015: CHF 10 billion, 31 December 2014: CHF 8 billion). |
Note 30 Interests in subsidiaries and other entities (continued) Pillar 3 | The Group retains or purchases interests in unconsolidated SEs in the form of direct investments, financing, guarantees, letters of credit, derivatives and through management contracts.
For retained interests, the Group’s maximum exposure to loss is generally equal to the carrying value of the Group’s interest in the SE, with the exception of guarantees, letters of credit and credit derivatives for which the contract’s notional amount, adjusted for losses already incurred, represents the maximum loss that the Group is exposed to. In addition, the current fair value of derivative swap instruments with a positive replacement value only, such as total return swaps, is presented as UBS’s maximum exposure to loss. Risk exposure for these swap instruments could change over time with market movements.
The maximum exposure to loss disclosed in the table on the previous page does not reflect the Group’s risk management activities, including effects from financial instruments that the Group may utilize to economically hedge the risks inherent in the unconsolidated SE or the risk-reducing effects of collateral or other credit enhancements.
In 2015 and 2014, the Group did not provide support, financial or otherwise, to an unconsolidated SE when the Group was not contractually obligated to do so, nor has the Group an intention to do so in the future.
In 2015 and 2014, income and expenses from interests in unconsolidated SEs primarily resulted from mark-to-market movements recognized in net trading income, which have generally been hedged with other financial instruments, as well as fee and commission income received from UBS sponsored funds.
Interests in securitization vehicles
As of 31 December 2015 and 31 December 2014, the Group retained interests in various securitization vehicles. As of 31 December 2015, a majority of our interests in securitization vehicles related to a portfolio of credit default swap (CDS) positions referencing asset-backed securities (ABS), which are held within Corporate Center - Non-core and Legacy Portfolio. The Investment Bank also retained interests in securitization vehicles related to financing, underwriting, secondary market and derivative trading activities.
In some cases the Group may be required to absorb losses from an unconsolidated SE before other parties because the Group’s interest is subordinated to others in the ownership structure. An overview of the Group’s interests in unconsolidated securitization vehicles and the relative ranking and external credit rating of those interests as of 31 December 2015 and 31 December 2014 is presented in the table on the following page. ▲
The numbers outlined in that table differ from the securitization positions presented in the “UBS Group AG consolidated supplemental disclosures required under Basel III Pillar 3 regulations” section of this report, primarily due to: (i) exclusion from the table on the following page of synthetic securitizations transacted with entities that are not SEs and transactions in which the Group did not have an interest because it did not absorb any risk, (ii) a different measurement basis in certain cases (e.g., IFRS carrying value within the table above compared with net exposure amount at default for Basel III Pillar 3 disclosures) and (iii) different classification of vehicles viewed as sponsored by the Group versus sponsored by third parties.
® Refer to Note 1a items 3 and 12 for more information on when the Group is viewed as the sponsor of an SE and for the Group’s accounting policies regarding securitization vehicles established by UBS
® Refer to the “UBS Group AG consolidated supplemental disclosures required under Basel III Pillar 3 regulations” section of this report for more information on securitization exposures
Interests in client vehicles
As of 31 December 2015 and 31 December 2014, the Group retained interests in client vehicles sponsored by the Group and third parties that relate to financing and derivative activities and to hedge structured product offerings. Included within these investments are securities guaranteed by US government agencies.
Interests in investment funds
The Group holds interests in a number of investment funds, primarily resulting from seed investments or to hedge structured product offerings. In addition to the interests disclosed in the table on the previous page, the Group manages the assets of various pooled investment funds and receives fees that are based, in whole or part, on the net asset value of the fund and / or the performance of the fund. The specific fee structure is determined based on various market factors and considers the nature of the fund, the jurisdiction of incorporation as well as fee schedules negotiated with clients. These fee contracts represent an interest in the fund as they align the Group’s exposure to investors, providing a variable return that is based on the performance of the entity. Depending on the structure of the fund, these fees may be collected directly from the fund assets and / or from the investors. Any amounts due are collected on a regular basis and are generally backed by the assets of the fund. The Group did not have any material exposure to loss from these interests as of 31 December 2015 or as of 31 December 2014.
Consolidated financial statements
Notes to the UBS Group AG consolidated financial statements
Note 30 Interests in subsidiaries and other entities (continued) Pillar 3 |
Interests in unconsolidated securitization vehicles¹ | | | |
| | 31.12.15 |
CHF million, except where indicated | | Residential mortgage- backed securities | Commercial mortgage- backed securities | Other asset-backed securities² | Re-securiti- zation³ | Total |
Sponsored by UBS | | | | | | |
Interests in senior tranches | | 0 | 54 | 0 | 13 | 66 |
of which: rated investment grade | | | 54 | 0 | | 54 |
of which: defaulted | | | | | 13 | 13 |
Interests in mezzanine tranches | | 3 | 7 | 0 | 0 | 10 |
of which: rated investment grade | | | 7 | | | 7 |
of which: rated sub-investment grade | | 2 | | | | 2 |
of which: defaulted | | 1 | | | | 1 |
Total | | 3 | 61 | 0 | 13 | 77 |
of which: Trading portfolio assets | | 3 | 61 | 0 | 13 | 77 |
Total assets held by the vehicles in which UBS had an interest (CHF billion) | | 0 | 28 | 0 | 1 | 29 |
| | | | | | |
Not sponsored by UBS | | | | | | |
Interests in senior tranches | | 284 | 66 | 383 | 140 | 873 |
of which: rated investment grade | | 284 | 65 | 383 | 140 | 872 |
Interests in mezzanine tranches | | 61 | 17 | 17 | 0 | 95 |
of which: rated investment grade | | 58 | 17 | 17 | 0 | 92 |
of which: defaulted | | 3 | | | | 3 |
Interests in junior tranches | | 11 | 3 | 0 | 0 | 14 |
of which: rated investment grade | | 11 | 0 | | | 11 |
of which: not rated | | 0 | 3 | | | 3 |
Total | | 356 | 86 | 400 | 140 | 983 |
of which: Trading portfolio assets | | 356 | 86 | 400 | 140 | 983 |
Total assets held by the vehicles in which UBS had an interest (CHF billion) | | 64 | 37 | 6 | 2 | 109 |
1 This table excludes derivative transactions with securitization vehicles. 2 Includes credit card, car and student loan structures. 3 Includes collateralized debt obligations. |
▲
Note 30 Interests in subsidiaries and other entities (continued) Interests in unconsolidated securitization vehicles¹ (continued) | | | |
| | 31.12.14 |
CHF million, except where indicated | | Residential mortgage- backed securities | Commercial mortgage- backed securities | Other asset-backed securities² | Re-securiti- zation³ | Total |
Sponsored by UBS | | | | | | |
Interests in senior tranches | | 0 | 59 | 1 | 389 | 450 |
of which: rated investment grade | | 0 | 59 | 1 | 381 | 442 |
of which: defaulted | | | | | 8 | 8 |
Interests in mezzanine tranches | | 1 | 16 | 0 | 6 | 22 |
of which: rated investment grade | | | 7 | | 6 | 13 |
of which: defaulted | | 1 | 1 | | | 2 |
of which: not rated | | | 8 | | | 8 |
Total | | 1 | 75 | 1 | 395 | 472 |
of which: Trading portfolio assets | | 1 | 75 | 1 | 14 | 91 |
of which: Loans | | | | | 381 | 381 |
Total assets held by the vehicles in which UBS had an interest (CHF billion) | | 1 | 14 | 3 | 2 | 20 |
| | | | | | |
Not sponsored by UBS | | | | | | |
Interests in senior tranches | | 376 | 293 | 454 | 207 | 1,329 |
of which: rated investment grade | | 369 | 286 | 452 | 205 | 1,313 |
of which: rated sub-investment grade | | 6 | 6 | 2 | 1 | 15 |
Interests in mezzanine tranches | | 154 | 143 | 172 | 62 | 531 |
of which: rated investment grade | | 134 | 105 | 164 | 54 | 457 |
of which: rated sub-investment grade | | 15 | 37 | 8 | 8 | 69 |
of which: defaulted | | 5 | 1 | | 0 | 5 |
Interests in junior tranches | | 68 | 18 | 1 | 2 | 89 |
of which: rated investment grade | | 56 | 11 | | | 67 |
of which: rated sub-investment grade | | 4 | 6 | | | 10 |
of which: defaulted | | 0 | 0 | 1 | | 1 |
of which: not rated | | 8 | 1 | | 2 | 11 |
Total | | 598 | 453 | 627 | 271 | 1,949 |
of which: Trading portfolio assets | | 598 | 453 | 588 | 225 | 1,865 |
of which: Loans | | | 0 | 39 | 46 | 85 |
Total assets held by the vehicles in which UBS had an interest (CHF billion) | | 115 | 115 | 88 | 12 | 331 |
1 This table excludes derivative transactions with securitization vehicles. 2 Includes credit card, car and student loan structures. 3 Includes collateralized debt obligations. |
Consolidated financial statements
Notes to the UBS Group AG consolidated financial statements
Note 30 Interests in subsidiaries and other entities (continued) Sponsored unconsolidated structured entities in which UBS did not have an interest
For several sponsored SEs, no interest was held by the Group as of 31 December 2015 or as of 31 December 2014. However, during the respective reporting period the Group transferred assets, provided services and held instruments that did not qualify as an interest in these sponsored SEs, and accordingly earned income or incurred expenses from these entities. The table below presents the income earned and expenses incurred directly from these entities during 2015 and 2014 as well as corresponding asset information. The table does not include income earned and expenses incurred from risk management activities, including income and expenses from financial instruments that the Group may utilize to economically hedge instruments transacted with the unconsolidated SEs.
Sponsored unconsolidated structured entities in which UBS did not have an interest at year end¹ | |
| As of or for the year ended |
| 31.12.15 |
CHF million, except where indicated | Securitization vehicles | Client vehicles | Investment funds | Total |
Net interest income | 2 | (11) | 0 | (10) |
Net fee and commission income | 0 | 0 | 57 | 57 |
Net trading income | 18 | 208 | 48 | 274 |
Total income | 20 | 197 | 104 | 321 |
Asset information (CHF billion) | 8² | 1³ | 12⁴ | |
| | | | |
| As of or for the year ended |
| 31.12.14 |
CHF million, except where indicated | Securitization vehicles | Client vehicles | Investment funds | Total |
Net interest income | 6 | (51) | | (44) |
Net fee and commission income | | | 54 | 54 |
Net trading income | 63 | (158) | 10 | (85) |
Total income | 69 | (208) | 64 | (75) |
Asset information (CHF billion) | 4² | 1³ | 14⁴ | |
1 These tables exclude profit attributable to non-controlling interests of CHF 77 million for the year ended 31 December 2015 and CHF 142 million of profit attributable to preferred noteholders for the year ended 31 December 2014. 2 Represents the amount of assets transferred to the respective securitization vehicles. Of the total amount transferred, CHF 3 billion was transferred by UBS (31 December 2014: CHF 1 billion) and CHF 5 billion was transferred by third parties (31 December 2014: CHF 3 billion). 3 Represents total assets transferred to the respective client vehicles. Of the total amount transferred, CHF 1 billion was transferred by UBS (31 December 2014: CHF 1 billion) and CHF 1 billion was transferred by third parties (31 December 2014: CHF 1 billion). 4 Represents the total net asset value of the respective investment funds. |
Note 30 Interests in subsidiaries and other entities (continued) During 2015 and 2014, the Group primarily earned fees and recognized net trading income from sponsored SEs in which UBS did not hold an interest. The majority of the fee income arose from investment funds that are sponsored and administrated by the Group, but managed by third parties. As the Group does not provide any active management services, UBS was not exposed to risk from the performance of these entities and was therefore deemed not to have an interest in them.
In certain structures, the fees receivable for administrative purposes may be collected directly from the investors and have therefore not been included in the table above.
In addition, the Group incurred net trading income from mark-to-market movements arising primarily from derivatives, such as interest rate swaps and credit derivatives, in which the Group purchases protection, and financial liabilities designated at fair value, which do not qualify as interests because the Group does not absorb variability from the performance of the entity. The net income reported does not reflect economic hedges or other mitigating effects from the Group’s risk management activities.
During 2015, UBS and third parties transferred assets totaling CHF 9 billion (2014: CHF 6 billion) into sponsored securitization and client vehicles created in 2015. For sponsored investment funds, transfers arose during the period as investors invested and redeemed positions, thereby changing the overall size of the funds, which, when combined with market movements, resulted in a total closing net asset value of CHF 12 billion (31 December 2014: CHF 14 billion).
Note 31 Business combinations In 2015 and 2014, UBS did not complete any significant business combinations.
Consolidated financial statements
Notes to the UBS Group AG consolidated financial statements
Note 32 Changes in organization and disposals
Measures to improve the resolvability of the Group in response to too big to fail requirements in Switzerland and other countries in which the Group operates
In December 2014, UBS Group AG completed an exchange offer for the shares of UBS AG and established UBS Group AG as the holding company for UBS Group. During 2015, UBS Group AG filed and completed a court procedure under article 33 of the Swiss Stock Exchange Act (SESTA procedure) resulting in the cancellation of the shares of the remaining minority shareholders of UBS AG. As a result, UBS Group AG now owns 100% of the outstanding shares of UBS AG.
In June 2015, UBS transferred its Personal & Corporate Banking and Wealth Management business booked in Switzerland from UBS AG to UBS Switzerland AG.
In the second quarter of 2015, UBS also completed the implementation of a more self-sufficient business and operating model for UBS Limited, its investment banking subsidiary in the UK, under which UBS Limited bears and retains a larger proportion of the risk and reward in its business activities.
In the third quarter, UBS established UBS Business Solutions AG as a direct subsidiary of UBS Group AG to act as the Group service company. The purpose of the service company structure is to improve the resolvability of the Group by enabling to maintain operational continuity of critical services should a recovery or resolution event occur.
Also during 2015, UBS AG established a new subsidiary, UBS Americas Holding LLC, which UBS intends to designate as its intermediate holding company for its US subsidiaries prior to the 1 July 2016 deadline under new rules for foreign banks in the US pursuant to the Dodd-Frank Wall Street Reform and Consumer Protection Act (Dodd-Frank). During the third quarter of 2015, UBS AG contributed its equity participation in the principal US operating subsidiaries to UBS Americas Holding LLC to meet the requirement under Dodd-Frank that the intermediate holding company own all of our US operations, except branches of UBS AG.
Lastly, UBS also established UBS Asset Management AG, a new subsidiary of UBS AG, in 2015.
Sale of subsidiaries and businesses
In 2015, UBS sold its Alternative Fund Services (AFS) business to Mitsubishi UFJ Financial Group Investor Services. The Asset Management Investment Fund Services business, which provides fund administration for traditional mutual funds, was not included in the sale. Upon completion of the sale, UBS recognized a gain on sale of CHF 56 million and reclassified an associated net foreign currency translation gain of CHF 119 million from Other comprehensive income to the Income statement.
Also during 2015, UBS completed the sale of certain subsidiaries and businesses within Wealth Management, which resulted in the recognition of a combined gain of CHF 197 million.
Finally, in 2015, UBS agreed to sell certain businesses within Wealth Management and these sales are expected to close in 2016 subject to customary closing conditions. As of 31 December 2015, the assets and liabilities of these subsidiaries and businesses were presented as a disposal group held-for-sale within Other assets and Other liabilities and amounted to CHF 279 million and CHF 235 million, respectively. UBS recognized a loss of CHF 28 million in 2015 related to these sales.
Restructuring expenses
Restructuring expenses arise from programs that materially change either the scope of business undertaken by the Group or the manner in which such business is conducted. Restructuring expenses are temporary costs that are necessary to effect such programs and include items such as severance and other personnel-related expenses, duplicate headcount costs, impairment and accelerated depreciation of assets, contract termination costs, consulting fees, and related infrastructure and system costs. These costs are presented in the income statement according to the underlying nature of the expense. As the costs associated with restructuring programs are temporary in nature, and in order to provide a more thorough understanding of business performance, such costs are separately presented in this Note.
Note 32 Changes in organization and disposals Net restructuring expenses by business division and Corporate Center unit | | | | |
| | For the year ended |
CHF million | | 31.12.15 | 31.12.14 | 31.12.13 |
Wealth Management | | 323 | 185 | 178 |
Wealth Management Americas | | 137 | 55 | 59 |
Personal & Corporate Banking | | 101 | 64 | 54 |
Asset Management | | 82 | 50 | 43 |
Investment Bank | | 396 | 261 | 210 |
Corporate Center | | 196 | 61 | 229 |
of which: Services | | 140 | 30 | (6) |
of which: Non-core and Legacy Portfolio | | 56 | 31 | 235 |
Total net restructuring expenses | | 1,235 | 677 | 772 |
of which: personnel expenses | | 460 | 327 | 156 |
of which: general and administrative expenses | | 761 | 319 | 548 |
of which: depreciation and impairment of property, equipment and software | | 12 | 29 | 68 |
of which: amortization and impairment of intangible assets | | 2 | 2 | 0 |
Net restructuring expenses by personnel expense category | | | | |
| | For the year ended |
CHF million | | 31.12.15 | 31.12.14 | 31.12.13 |
Salaries | | 312 | 145 | 65 |
Variable compensation – performance awards | | 38 | 35 | (15) |
Variable compensation – other | | 108 | 138 | 88 |
Contractors | | 46 | 28 | 3 |
Social security | | 5 | 4 | 5 |
Pension and other post-employment benefit plans | | (65) | (29) | 8 |
Other personnel expenses | | 15 | 6 | 3 |
Total net restructuring expenses: personnel expenses | | 460 | 327 | 156 |
Net restructuring expenses by general and administrative expense category | | | | |
| | For the year ended |
CHF million | | 31.12.15 | 31.12.14 | 31.12.13 |
Occupancy | | 109 | 49 | 35 |
Rent and maintenance of IT and other equipment | | 31 | 23 | 8 |
Administration | | 6 | 3 | 2 |
Travel and entertainment | | 17 | 11 | 4 |
Professional fees | | 187 | 148 | 76 |
Outsourcing of IT and other services | | 316 | 82 | 59 |
Other¹ | | 95 | 2 | 364 |
Total net restructuring expenses: general and administrative expenses | | 761 | 319 | 548 |
1 Mainly comprised of onerous real estate lease contracts. |
Consolidated financial statements
Notes to the UBS Group AG consolidated financial statements
Note 33 Operating leases and finance leases Information on lease contracts classified as operating leases where UBS is the lessee is provided in Note 33a and information on finance leases where UBS acts as a lessor is provided in Note 33b.
a) Operating lease commitments
As of 31 December 2015, UBS was obligated under a number of non-cancellable operating leases for premises and equipment used primarily for banking purposes. The significant premises leases usually include renewal options and escalation clauses in line with general office rental market conditions, as well as rent adjustments based on price indices. However, the lease agreements do not contain contingent rent payment clauses and purchase options, nor do they impose any restrictions on UBS’s ability to pay dividends, engage in debt financing transactions or enter into further lease agreements.
CHF million | 31.12.15 |
Expenses for operating leases to be recognized in: | |
2016 | 746 |
2017 | 688 |
2018 | 563 |
2019 | 479 |
2020 | 415 |
2021 and thereafter | 1,869 |
Subtotal commitments for minimum payments under operating leases | 4,759 |
Less: Sublease rental income commitments | 348 |
Net commitments for minimum payments under operating leases | 4,411 |
CHF million | 31.12.15 | 31.12.14 | 31.12.13 |
Gross operating lease expense recognized in the income statement | 743 | 759 | 792 |
Sublease rental income | 70 | 73 | 74 |
Net operating lease expense recognized in the income statement | 673 | 686 | 718 |
b) Finance lease receivables
UBS leases a variety of assets to third parties under finance leases, such as commercial vehicles, production lines, medical equipment, construction equipment and aircrafts. At the end of the respective leases, assets may be sold to third parties or be leased further. Lessees may participate in any sales proceeds achieved. Leasing charges cover the cost of the assets less their residual value as well as financing costs.
As of 31 December 2015, unguaranteed residual values of CHF 167 million had been accrued, and the accumulated allowance for uncollectible minimum lease payments receivable amounted to CHF 10 million. No contingent rents were received in 2015.
Lease receivables | | | | |
CHF million | | 31.12.15 |
| | Total minimum lease payments | Unearned finance income | Present value |
2016 | | 341 | 23 | 318 |
2017–2020 | | 651 | 38 | 613 |
thereafter | | 158 | 6 | 152 |
Total | | 1,150 | 67 | 1,083 |
UBS defines related parties as associates (entities which are significantly influenced by UBS), post-employment benefit plans for the benefit of UBS employees, key management personnel, close family members of key management personnel and entities which are, directly or indirectly, controlled or jointly controlled by key management personnel or their close family members. Key management personnel is defined as members of the Board of Directors (BoD) and Group Executive Board (GEB).
a) Remuneration of key management personnel
The non-independent members of the BoD have top management employment contracts and receive pension benefits upon retirement. Total remuneration of the non-independent members of the BoD and GEB members, including those who stepped down during 2015, is provided in the table below.
Remuneration of key management personnel | | | |
CHF million | 31.12.15 | 31.12.14 | 31.12.13 |
Base salaries and other cash payments | 23¹ | 22¹ | 19 |
Incentive awards – cash² | 10 | 8 | 10 |
Annual incentive award under DCCP | 21 | 18 | 19 |
Employer's contributions to retirement benefit plans | 2 | 2 | 2 |
Benefits in kind, fringe benefits (at market value) | 2 | 1 | 2 |
Equity-based compensation³ | 42 | 35 | 38 |
Total | 99 | 86 | 89 |
1 Includes role-based allowances that have been made in line with with market practice in response to the EU Capital Requirements Directive of 2013 (CRD IV). 2 Includes immediate and deferred cash. 3 Expenses for shares granted is measured at grant date and allocated over the vesting period, generally for 5 years. In 2015, 2014 and 2013, equity-based compensation was entirely comprised of EOP awards. |
The independent members of the BoD do not have employment or service contracts with UBS, and thus are not entitled to benefits upon termination of their service on the BoD. Payments to these individuals for their services as external board members amounted to CHF 6.7 million in 2015, CHF 7.1 million in 2014 and CHF 7.6 million in 2013.
b) Equity holdings of key management personnel
| 31.12.15 | 31.12.14 |
Number of stock options from equity participation plans held by non-independent members of the BoD and the GEB members¹ | 1,401,686 | 1,738,598 |
Number of shares held by members of the BoD, GEB and parties closely linked to them² | 3,326,165 | 3,716,957 |
1 Refer to Note 29 for more information. 2 Excludes shares granted under variable compensation plans with forfeiture provisions. |
Of the share totals above, 95,597 shares were held by close family members of key management personnel on 31 December 2015 and 31 December 2014. No shares were held by entities that are directly or indirectly controlled or jointly controlled by key management personnel or their close family members on 31 December 2015 and 31 December 2014. Refer to Note 29 for more information. As of 31 December 2015, no member of the BoD or GEB was the beneficial owner of more than 1% of UBS Group AG’s shares.
Consolidated financial statements
Notes to the UBS Group AG consolidated financial statements
Note 34 Related parties (continued) c) Loans, advances and mortgages to key management personnel
Non-independent members of the BoD and GEB members have been granted loans, fixed advances and mortgages on the same terms and conditions that are available to other employees, which are based on terms and conditions granted to third parties but are adjusted for differing credit risk. Independent BoD members are granted loans and mortgages under general market conditions.
Movements in the loan, advances and mortgage balances are as follows.
Loans, advances and mortgages to key management personnel¹ | | |
CHF million | 2015 | 2014 |
Balance at the beginning of the year | 27 | 20 |
Additions | 6 | 10 |
Reductions | (1) | (3) |
Balance at the end of the year | 33 | 27 |
1 Loans are granted by UBS AG. All loans are secured loans. |
d) Other related party transactions with entities controlled by key management personnel
In 2015, UBS did not enter into transactions with entities which are directly or indirectly controlled or jointly controlled by UBS’s key management personnel or their close family members. In 2014, UBS entered into transactions with Immo Heudorf AG (Switzerland).
Other related party transactions | | |
CHF million | 2015 | 2014 |
Balance at the beginning of the year | 0 | 10 |
Additions | 0 | 0 |
Reductions | 0 | 10 |
Balance at the end of the year¹ | 0 | 0 |
1 Comprised of loans. |
In 2014 and 2015, entities controlled by key management personnel did not sell goods or provide services to UBS, and therefore did not receive any fees from UBS. Furthermore, UBS did not provide services to such entities in both 2014 and 2015, and therefore also did not receive any fees.
Note 34 Related parties (continued) e) Transactions with associates and joint ventures
Loans and outstanding receivables to associates and joint ventures |
CHF million | | 2015 | 2014 |
Carrying value at the beginning of the year | | 552 | 288 |
Additions | | 9 | 313 |
Reductions | | (85) | (1) |
Impairment | | 0 | (51) |
Foreign currency translation | | 0 | 3 |
Carrying value at the end of the year | | 476 | 552 |
of which: unsecured loans | | 464 | 539 |
includes allowances for credit losses | | 1 | 1 |
| | | |
| | | |
Other transactions with associates and joint ventures |
| | As of or for the year ended |
CHF million | | 31.12.15 | 31.12.14 |
Payments to associates and joint ventures for goods and services received | | 149 | 169 |
Fees received for services provided to associates and joint ventures | | 7 | 1 |
Commitments and contingent liabilities to associates and joint ventures | | 4 | 2 |
® Refer to Note 30 for an overview of investments in associates and joint ventures
Consolidated financial statements
Notes to the UBS Group AG consolidated financial statements
Note 35 Invested assets and net new money
Invested assets
Invested assets include all client assets managed by or deposited with UBS for investment purposes. Invested assets include managed fund assets, managed institutional assets, discretionary and advisory wealth management portfolios, fiduciary deposits, time deposits, savings accounts and wealth management securities or brokerage accounts. All assets held for purely transactional purposes and custody-only assets, including corporate client assets held for cash management and transactional purposes, are excluded from invested assets as the Group only administers the assets and does not offer advice on how the assets should be invested. Also excluded are non-bankable assets (e.g., art collections) and deposits from third-party banks for funding or trading purposes.
Discretionary assets are defined as client assets that UBS decides how to invest. Other invested assets are those where the client ultimately decides how the assets are invested. When a single product is created in one business division and sold in another, it is counted in both the business division that manages the investment and the one that distributes it. This results in double counting within UBS total invested assets, as both business divisions are independently providing a service to their respective clients, and both add value and generate revenue.
Net new money
Net new money in a reporting period is the amount of invested assets that are entrusted to UBS by new and existing clients, less those withdrawn by existing clients and clients who terminated their relationship with UBS.
Net new money is calculated using the direct method, under which inflows and outflows to / from invested assets are determined at the client level based on transactions. Interest and dividend income from invested assets are not counted as net new money inflows. Market and currency movements as well as fees, commissions and interest on loans charged are excluded from net new money, as are the effects resulting from any acquisition or divestment of a UBS subsidiary or business. Reclassifications between invested assets and custody-only assets as a result of a change in the service level delivered are generally treated as net new money flows; however, where such change in service level directly results from a new externally-imposed regulation, the one-time net effect of the implementation is reported as an asset reclassification without net new money impact.
The Investment Bank does not track invested assets and net new money. However, when a client is transferred from the Investment Bank to another business division, this produces net new money even though client assets were already with UBS. There were no such transfers between the Investment Bank and other business divisions in 2015 and 2014.
Invested assets and net new money |
| | For the year ended |
CHF billion | | 31.12.15 | 31.12.14 |
Fund assets managed by UBS | | 282 | 270 |
Discretionary assets | | 830 | 854 |
Other invested assets | | 1,577 | 1,610 |
Total invested assets¹ | | 2,689 | 2,734 |
of which: double count | | 185 | 173 |
Net new money¹ | | 27.7 | 58.9 |
1 Includes double counts. |
Development of invested assets |
| | For the year ended |
CHF billion | | 31.12.15 | 31.12.14 |
Total invested assets at the beginning of the year¹ | | 2,734 | 2,390 |
Net new money | | 28 | 59 |
Market movements² | | (24) | 115 |
Foreign currency translation | | (31) | 173 |
Other effects | | (16) | (3) |
of which: acquisitions / (divestments) | | (16) | 0 |
Total invested assets at the end of the year¹ | | 2,689 | 2,734 |
1 Includes double counts. 2 Includes interest and dividend income. |
Note 36 Currency translation rates
The following table shows the rates of the main currencies used to translate the financial information of foreign operations into Swiss francs.
| | Spot rate | | Average rate¹ |
| | As of | | For the year ended |
| | 31.12.15 | 31.12.14 | | 31.12.15 | 31.12.14 | 31.12.13 |
1 USD | | 1.00 | 0.99 | | 0.97 | 0.92 | 0.92 |
1 EUR | | 1.09 | 1.20 | | 1.06 | 1.21 | 1.23 |
1 GBP | | 1.48 | 1.55 | | 1.47 | 1.51 | 1.45 |
100 JPY | | 0.83 | 0.83 | | 0.80 | 0.86 | 0.95 |
1 Monthly income statement items of foreign operations with a functional currency other than the Swiss franc are translated with month-end rates into Swiss francs. Disclosed average rates for a year represent an average of 12 month-end rates, weighted according to the income and expense volumes of all foreign operations of the Group with the same functional currency for each month. Weighted average rates for individual business divisions may deviate from the weighted average rates for the Group. |
EDTF | Note 37 Events after the reporting period
There have been no material events after the reporting period which would require disclosure in or adjustment to the 31 December 2015 Financial Statements.
Consolidated financial statements
Notes to the UBS Group AG consolidated financial statements
Note 38 Swiss GAAP requirements
The consolidated financial statements of UBS Group AG are prepared in accordance with International Financial Reporting Standards (IFRS). The Swiss Financial Market Supervisory Authority (FINMA) requires financial groups that present their financial statements under IFRS to provide a narrative explanation of the main differences between IFRS and Swiss GAAP (FINMA Circular 2015 / 1 and the Banking Ordinance). Included in this Note are the significant differences in the recognition and measurement between IFRS and the provisions of the Banking Ordinance and the guidelines of FINMA governing true and fair view financial statement reporting pursuant to Article 25 through Article 42 of the Banking Ordinance.
1. Consolidation
Under IFRS, all entities that are controlled by the holding entity are consolidated.
Under Swiss GAAP, controlled entities that are deemed immaterial to the group or that are held temporarily only are exempt from consolidation, but instead are recorded as participations or financial investments.
2. Financial investments classified as available-for-sale
Under IFRS, financial investments classified as available-for-sale are carried at fair value. Changes in fair value are recorded directly in equity until an investment is sold, collected or otherwise disposed of, or until an investment is determined to be impaired. At the time an available-for-sale investment is determined to be impaired, the cumulative unrealized loss previously recognized in equity is included in net profit or loss for the period. On disposal of a financial investment classified as available-for-sale, the cumulative unrealized gain or loss previously recognized in equity is reclassified to the income statement.
Under Swiss GAAP, classification and measurement of financial investments designated as available-for-sale depends on the nature of the investment. Equity instruments with no permanent holding intent, as well as debt instruments, are classified as Financial investments and measured at the lower of (amortized) cost or market value. Market value adjustments up to the original cost amount and realized gains or losses upon disposal of the investment are recorded in the income statement as Other income from ordinary activities. Equity instruments with a permanent holding intent are classified as participations in Investments in subsidiaries and other participations and measured at cost less impairment. Impairment losses are recorded in the income statement as Impairment of investments in subsidiaries and other participations. Reversal of impairments up to the original cost amount as well as realized gains or losses upon disposal of the investment are recorded as Extraordinary income / Extraordinary expenses in the income statement.
3. Cash flow hedges
Under IFRS, when hedge accounting is applied, the fair value gain or loss on the effective portion of the derivative designated as a cash flow hedge is recognized in equity. When the hedged cash flows materialize, the accumulated unrealized gain or loss is reclassified to the income statement.
Under Swiss GAAP, the effective portion of the fair value change of the derivative instrument used to hedge cash flow exposures is deferred on the balance sheet as Other assets or Other liabilities. The deferred amounts are released to the income statement when the hedged cash flows materialize.
4. Fair value option
Under IFRS, UBS applies the fair value option to certain financial assets and financial liabilities not held for trading. Instruments for which the fair value option is applied are accounted for at fair value with changes in fair value reflected in Net trading income. The fair value option is applied primarily to structured debt instruments, certain non-structured debt instruments, structured reverse repurchase and repurchase agreements and securities borrowing agreements, certain structured and non-structured loans as well as loan commitments.
Under Swiss GAAP, the fair value option can only be applied to structured debt instruments that consist of a debt host contract and one or more embedded derivatives that do not relate to own equity. Furthermore, changes in fair value attributable to changes in unrealized own credit are not recognized in the income statement and the balance sheet.
Note 38 Swiss GAAP requirements (continued)
5. Goodwill and intangible assets
Under IFRS, goodwill acquired in a business combination is not amortized but tested annually for impairment. Intangible assets with an indefinite useful life are also not amortized but tested annually for impairment.
Under Swiss GAAP, goodwill and intangible assets with indefinite useful lives are amortized over a period not exceeding five years, unless a longer useful life, which may not exceed 10 years, can be justified.
6. Pension and other post-employment benefit plans
Swiss GAAP permits the use of IFRS or Swiss accounting standards for pension and other post-employment benefit plans, with the election made on a plan-by-plan basis.
UBS has elected to apply IFRS (IAS 19) for the non-Swiss defined benefit plans in UBS AG standalone financial statements and Swiss GAAP (FER 16) for the Swiss pension plan in the UBS AG and the UBS Switzerland AG standalone financial statements. The requirements of Swiss GAAP are better aligned with the specific nature of Swiss pension plans, which are hybrid in that they combine elements of defined contribution and defined benefit plans, but are treated as defined benefit plans under IFRS. Key differences between Swiss GAAP and IFRS include the treatment of dynamic elements, such as future salary increases and future interest credits on retirement savings, which are not considered under the static method used in accordance with Swiss GAAP. Also, the discount rate used to determine the defined benefit obligation in accordance with IFRS is based on the yield of high-quality corporate bonds of the market in the respective pension plan country. The discount rate used in accordance with Swiss GAAP, i.e., the technical interest rate, is determined by the Pension Foundation Board based on the expected returns of the Board’s investment strategy.
For defined benefit plans, IFRS requires the full defined benefit obligation net of the plan assets to be recorded on the balance sheet, with changes resulting from remeasurements recognized directly in equity. However, for plans for which IFRS is elected, Swiss GAAP requires that changes due to remeasurements are recognized in the income statement.
Swiss GAAP requires that employer contributions to the pension fund are recognized as personnel expenses in the income statement. Further, Swiss GAAP requires an assessment as to whether, based on the financial statements of the pension fund prepared in accordance with Swiss accounting standards (FER 26), an economic benefit to, or obligation of, the employer arises from the pension fund and is recognized in the balance sheet when conditions are met. Conditions for recording a pension asset or liability would be met if, for example, an employer contribution reserve is available or the employer is required to contribute to the reduction of a pension deficit (on a FER 26 basis).
7. Netting of replacement values
Under IFRS, replacement values and related cash collateral are reported on a gross basis unless the restrictive IFRS netting requirements are met: i) existence of master netting agreements and related collateral arrangements that are unconditional and legally enforceable, both in the normal course of business and in the event of default, bankruptcy or insolvency of UBS and its counterparties, and ii) UBS’s intention to either settle on a net basis or to realize the asset and settle the liability simultaneously.
Under Swiss GAAP, replacement values and related cash collateral are generally reported on a net basis, provided the master netting and the related collateral agreements are legally enforceable in the event of default, bankruptcy or insolvency of UBS's counterparties.
8. Negative interest
Under IFRS, negative interest income arising on a financial asset does not meet the definition of interest income and, therefore, negative interest on financial assets and negative interest on financial liabilities is presented within interest expense and interest income, respectively.
Under Swiss GAAP, negative interest on financial assets is presented within interest income and negative interest on financial liabilities is presented within interest expense.
9. Extraordinary income and expense
Certain non-recurring and non-operating income and expense items, such as realized gains or losses from the disposal of participations, fixed and intangible assets, as well as reversals of impairments of participations and fixed assets, are classified as extraordinary items under Swiss GAAP. This distinction is not available under IFRS.
10. Other presentational differences
Under IFRS, financial statements are comprised of an Income statement, Statement of comprehensive income, Balance sheet, Statement of changes in equity, Statement of cash flows and Notes to the financial statements. Under Swiss GAAP, the concept of other comprehensive income does not exist and consequently no Statement of comprehensive income is required. In addition, various other presentational differences exist. ▲
Consolidated financial statements
UBS AG consolidated financial information
UBS AG consolidated financial information
This section contains key figures for UBS AG (consolidated), as well as a comparison of selected financial and capital information between UBS Group AG (consolidated) and UBS AG (consolidated).
Comparison UBS Group AG (consolidated) vs UBS AG (consolidated)
The accounting policies applied under International Financial Reporting Standards (IFRS) to both UBS Group AG and UBS AG consolidated financial statements are identical. However, there are certain scope and presentation differences which relate to:
– Assets, liabilities, operating income, operating expenses and operating profit before tax relating to UBS Group AG and its directly held subsidiaries, including UBS Business Solutions AG, are reflected in the consolidated financial statements of UBS Group AG but not of UBS AG. UBS AG’s assets, liabilities, operating income, and operating expenses related to transactions with UBS Group AG and its directly held subsidiaries are not subject to elimination in the UBS AG consolidated financial statements, but are eliminated in the UBS Group AG consolidated financial statements.
– Total equity of UBS Group AG consolidated includes non-controlling interests (NCI) in UBS AG as of 31 December 2014. Most of the difference in equity attributable to shareholders between the consolidated equity of UBS Group AG and UBS AG as of 31 December 2014 related to these non-controlling interests. Net profit attributable to minority shareholders of UBS AG was presented as net profit attributable to NCI in the consolidated income statement of UBS Group AG.
– Preferred notes issued by UBS AG are presented in the consolidated UBS Group AG balance sheet as equity attributable to NCI, while in the consolidated UBS AG balance sheet, these preferred notes are required to be presented as equity attributable to preferred noteholders.
– Fully applied total capital of UBS AG (consolidated) was lower than for UBS Group AG (consolidated) as of 31 December 2015, reflecting lower AT1 capital and lower tier 2 capital, partly offset by higher CET1 capital. The difference in CET1 capital was primarily due to compensation-related regulatory capital accruals, liabilities and capital instruments which are reflected at the UBS Group AG level. The difference in AT1 capital relates to issuances of AT1 capital notes by UBS Group AG in 2015, as well as to deferred contingent capital plan (DCCP) awards granted for the performance years 2014 and 2015. The difference in tier 2 capital relates to DCCP awards for performance years 2012 and 2013, held at the UBS Group AG level.
® Refer to the “Capital management” section of this report for more information on differences in capital information between UBS Group AG (consolidated) and UBS AG (consolidated)
UBS AG (consolidated) key figures | | | | |
| | As of or for the year ended |
CHF million, except where indicated | | 31.12.15 | 31.12.14 | 31.12.13 |
| | | | |
Results | | | | |
Operating income | | 30,605 | 28,026 | 27,732 |
Operating expenses | | 25,198 | 25,557 | 24,461 |
Operating profit / (loss) before tax | | 5,407 | 2,469 | 3,272 |
Net profit / (loss) attributable to UBS AG shareholders | | 6,235 | 3,502 | 3,172 |
| | | | |
Key performance indicators¹ | | | | |
Profitability | | | | |
Return on tangible equity (%) | | 13.5 | 8.2 | 8.0 |
Return on assets, gross (%) | | 3.1 | 2.8 | 2.5 |
Cost / income ratio (%) | | 82.0 | 90.9 | 88.0 |
Growth | | | | |
Net profit growth (%) | | 78.0 | 10.4 | |
Net new money growth for combined wealth management businesses (%)² | | 2.2 | 2.5 | 3.4 |
Resources | | | | |
Common equity tier 1 capital ratio (%, fully applied)³ | | 15.4 | 14.2 | 12.8 |
Leverage ratio (phase-in, %)⁴ | | 5.7 | 5.4 | 4.7 |
| | | | |
Additional information | | | | |
Profitability | | | | |
Return on equity (RoE) (%) | | 11.7 | 7.0 | 6.7 |
Return on risk-weighted assets, gross (%)⁵ | | 14.1 | 12.4 | 11.4 |
Resources | | | | |
Total assets | | 943,256 | 1,062,327 | 1,013,355 |
Equity attributable to UBS AG shareholders | | 55,248 | 52,108 | 48,002 |
Common equity tier 1 capital (fully applied)³ | | 32,042 | 30,805 | 28,908 |
Common equity tier 1 capital (phase-in)³ | | 41,516 | 44,090 | 42,179 |
Risk-weighted assets (fully applied)³ | | 208,186 | 217,158 | 225,153 |
Risk-weighted assets (phase-in)³ | | 212,609 | 221,150 | 228,557 |
Common equity tier 1 capital ratio (%, phase-in)³ | | 19.5 | 19.9 | 18.5 |
Total capital ratio (%) (fully applied)³ | | 21.0 | 19.0 | 15.4 |
Total capital ratio (%) (phase-in)³ | | 24.9 | 25.6 | 22.2 |
Leverage ratio (fully applied, %)⁴ | | 4.9 | 4.1 | 3.4 |
Leverage ratio denominator (fully applied)⁴ | | 898,251 | 999,124 | 1,015,306 |
Leverage ratio denominator (phase-in)⁴ | | 904,518 | 1,006,001 | 1,022,924 |
Other | | | | |
Invested assets (CHF billion)⁶ | | 2,689 | 2,734 | 2,390 |
Personnel (full-time equivalents) | | 58,131 | 60,155 | 60,205 |
1 Refer to the "Measurement of performance" section of this report for the definitions of our key performance indicators. 2 Based on adjusted net new money, which excludes the negative effect on net new money in 2015 of CHF 9.9 billion from our balance sheet and capital optimization program.�� 3 Based on the Basel III framework as applicable for systemically relevant banks (SRBs). Refer to the “Capital management” section of this report for more information. 4 Calculated in accordance with Swiss SRB rules. From 31 December 2015 onward, the Swiss SRB leverage ratio denominator calculation is fully aligned with the BIS Basel III rules. Prior-period figures are calculated in accordance with former Swiss SRB rules and are therefore not fully comparable. Refer to the "Capital management" section of this report for more information. 5 Based on phase-in risk-weighted assets. 6 Includes invested assets for Personal & Corporate Banking. |
Consolidated financial statements
UBS AG consolidated financial information
Comparison UBS Group AG (consolidated) versus UBS AG (consolidated) |
| | As of or for the year ended 31.12.15 | | As of or for the year ended 31.12.14 |
CHF million, except where indicated | | UBS Group AG (consolidated) | UBS AG (consolidated) | Difference (absolute) | Difference (%) | | UBS Group AG (consolidated) | UBS AG (consolidated) | Difference (absolute) | Difference (%) |
| | | | | | | | | | |
Income statement | | | | | | | | | | |
Operating income | | 30,605 | 30,605 | 0 | 0 | | 28,027 | 28,026 | 1 | 0 |
Operating expenses | | 25,116 | 25,198 | (82) | 0 | | 25,567 | 25,557 | 10 | 0 |
Operating profit / (loss) before tax | | 5,489 | 5,407 | 82 | 2 | | 2,461 | 2,469 | (8) | 0 |
of which: Wealth Management | | 2,689 | 2,676 | 13 | 0 | | 2,326 | 2,326 | 0 | 0 |
of which: Wealth Management Americas | | 718 | 692 | 26 | 4 | | 900 | 900 | 0 | 0 |
of which: Personal & Corporate Banking | | 1,646 | 1,646 | 0 | 0 | | 1,506 | 1,506 | 0 | 0 |
of which: Asset Management | | 584 | 583 | 1 | 0 | | 467 | 467 | 0 | 0 |
of which: Investment Bank | | 1,892 | 1,852 | 40 | 2 | | (84) | (84) | 0 | 0 |
of which: Corporate Center | | (2,040) | (2,042) | 2 | 0 | | (2,655) | (2,646) | (9) | 0 |
of which: Services | | (818) | (822) | 4 | 0 | | (652) | (643) | (9) | 1 |
of which: Group ALM | | 282 | 281 | 1 | 0 | | 2 | 2 | 0 | 0 |
of which: Non-core and Legacy Portfolio | | (1,503) | (1,501) | (2) | 0 | | (2,005) | (2,005) | 0 | 0 |
Net profit / (loss) | | 6,386 | 6,314 | 72 | 1 | | 3,640 | 3,649 | (9) | 0 |
of which: net profit / (loss) attributable to shareholders | | 6,203 | 6,235 | (32) | (1) | | 3,466 | 3,502 | (36) | (1) |
of which: net profit / (loss) attributable to preferred noteholders | | | 77 | (77) | | | 142 | 142 | 0 | 0 |
of which: net profit / (loss) attributable to non-controlling interests | | 183 | 3 | 180 | | | 32 | 5 | 27 | 540 |
| | | | | | | | | | |
Statement of comprehensive income | | | | | | | | | | |
Other comprehensive income | | (605) | (606) | 1 | 0 | | 1,580 | 1,580 | 0 | 0 |
of which: attributable to shareholders | | (506) | (545) | 39 | (7) | | 1,453 | 1,459 | (6) | 0 |
of which: attributable to preferred noteholders | | | (59) | 59 | | | 80 | 119 | (39) | (33) |
of which: attributable to non-controlling interests | | (99) | (2) | (97) | | | 47 | 3 | 44 | |
Total comprehensive income | | 5,781 | 5,709 | 72 | 1 | | 5,220 | 5,229 | (9) | 0 |
of which: attributable to shareholders | | 5,698 | 5,690 | 8 | 0 | | 4,920 | 4,961 | (41) | (1) |
of which: attributable to preferred noteholders | | | 18 | (18) | | | 221 | 260 | (39) | (15) |
of which: attributable to non-controlling interests | | 83 | 1 | 82 | | | 79 | 7 | 72 | |
| | | | | | | | | | |
Balance sheet | | | | | | | | | | |
Total assets | | 942,819 | 943,256 | (437) | 0 | | 1,062,478 | 1,062,327 | 151 | 0 |
Total liabilities | | 885,511 | 886,013 | (502) | 0 | | 1,008,110 | 1,008,162 | (52) | 0 |
Total equity | | 57,308 | 57,243 | 65 | 0 | | 54,368 | 54,165 | 203 | 0 |
of which: equity attributable to shareholders | | 55,313 | 55,248 | 65 | 0 | | 50,608 | 52,108 | (1,500) | (3) |
of which: equity attributable to preferred noteholders | | | 1,954 | (1,954) | | | | 2,013 | (2,013) | |
of which: equity attributable to non-controlling interests | | 1,995 | 41 | 1,954 | | | 3,760 | 45 | 3,715 | |
| | | | | | | | | | |
Capital information (fully applied) | | | | | | | | | | |
Common equity tier 1 capital | | 30,044 | 32,042 | (1,998) | (6) | | 28,941 | 30,805 | (1,864) | (6) |
Additional tier 1 capital | | 6,154 | 1,252 | 4,902 | | | 467 | 0 | 467 | |
Tier 2 capital | | 11,237 | 10,325 | 912 | 9 | | 11,398 | 10,451 | 947 | 9 |
Total capital | | 47,435 | 43,619 | 3,816 | 9 | | 40,806 | 41,257 | (451) | (1) |
Risk-weighted assets | | 207,530 | 208,186 | (656) | 0 | | 216,462 | 217,158 | (696) | 0 |
Common equity tier 1 capital ratio (%) | | 14.5 | 15.4 | (0.9) | | | 13.4 | 14.2 | (0.8) | |
Total capital ratio (%) | | 22.9 | 21.0 | 1.9 | | | 18.9 | 19.0 | (0.1) | |
Leverage ratio denominator | | 897,607 | 898,251 | (644) | 0 | | 997,822 | 999,124 | (1,302) | 0 |
Leverage ratio (%) | | 5.3 | 4.9 | 0.4 | | | 4.1 | 4.1 | 0.0 | |
UBS AG consolidated financial statements
Management’s report on internal control over financial reporting
Management’s responsibility for internal control over financial reporting
The Board of Directors and management of UBS AG are responsible for establishing and maintaining adequate internal control over financial reporting. UBS AG’s internal control over financial reporting is designed to provide reasonable assurance regarding the preparation and fair presentation of published financial statements in accordance with IFRS as issued by the IASB.
UBS AG’s internal control over financial reporting includes those policies and procedures that:
– Pertain to the maintenance of records that, in reasonable detail, accurately and fairly reflect transactions and dispositions of assets;
– Provide reasonable assurance that transactions are recorded as necessary to permit preparation and fair presentation of financial statements, and that receipts and expenditures of the company are being made only in accordance with authorizations of UBS AG management; and
– Provide reasonable assurance regarding prevention or timely detection of unauthorized acquisition, use or disposition of the company’s assets that could have a material effect on the financial statements.
Because of its inherent limitations, internal control over financial reporting may not prevent or detect misstatements. Also, projections of any evaluation of effectiveness to future periods are subject to the risk that controls may become inadequate because of changes in conditions, or that the degree of compliance with the policies or procedures may deteriorate.
Management’s assessment of internal control over financial reporting as of 31 December 2015
UBS AG management has assessed the effectiveness of UBS AG’s internal control over financial reporting as of 31 December 2015 based on the criteria set forth by the Committee of Sponsoring Organizations of the Treadway Commission (COSO) in Internal Control Integrated Framework (2013 Framework). Based on this assessment, management believes that, as of 31 December 2015, UBS AG’s internal control over financial reporting was effective.
The effectiveness of UBS AG’s internal control over financial reporting as of 31 December 2015 has been audited by Ernst & Young Ltd, UBS AG’s independent registered public accounting firm, as stated in their report appearing on pages 564 to 565, which expresses an unqualified opinion on the effectiveness of UBS AG’s internal control over financial reporting as of 31 December 2015.
Consolidated financial statements
UBS AG consolidated financial statements

Consolidated financial statements
UBS AG consolidated financial statements

Consolidated financial statements
UBS AG consolidated financial statements
Audited |
Income statement | | | | | | | | |
| | | | For the year ended | | % change from |
CHF million, except per share data | | Note | | 31.12.15 | 31.12.14 | 31.12.13 | | 31.12.14 |
Interest income | | 3 | | 13,178 | 13,194 | 13,137 | | 0 |
Interest expense | | 3 | | (6,449) | (6,639) | (7,351) | | (3) |
Net interest income | | 3 | | 6,729 | 6,555 | 5,786 | | 3 |
Credit loss (expense) / recovery | | 12 | | (117) | (78) | (50) | | 50 |
Net interest income after credit loss expense | | | | 6,612 | 6,477 | 5,736 | | 2 |
Net fee and commission income | | 4 | | 17,184 | 17,076 | 16,287 | | 1 |
Net trading income | | 3 | | 5,696 | 3,841 | 5,130 | | 48 |
Other income | | 5 | | 1,112 | 632 | 580 | | 76 |
Total operating income | | | | 30,605 | 28,026 | 27,732 | | 9 |
Personnel expenses | | 6 | | 15,954 | 15,280 | 15,182 | | 4 |
General and administrative expenses | | 7 | | 8,219 | 9,377 | 8,380 | | (12) |
Depreciation and impairment of property, equipment and software | | 16 | | 918 | 817 | 816 | | 12 |
Amortization and impairment of intangible assets | | 17 | | 107 | 83 | 83 | | 29 |
Total operating expenses | | | | 25,198 | 25,557 | 24,461 | | (1) |
Operating profit / (loss) before tax | | | | 5,407 | 2,469 | 3,272 | | 119 |
Tax expense / (benefit) | | 8 | | (908) | (1,180) | (110) | | (23) |
Net profit / (loss) | | | | 6,314 | 3,649 | 3,381 | | 73 |
Net profit / (loss) attributable to preferred noteholders | | | | 77 | 142 | 204 | | (46) |
Net profit / (loss) attributable to non-controlling interests | | | | 3 | 5 | 5 | | (40) |
Net profit / (loss) attributable to UBS AG shareholders | | | | 6,235 | 3,502 | 3,172 | | 78 |
Statement of comprehensive income | | | | |
| | For the year ended |
CHF million | | 31.12.15 | 31.12.14 | 31.12.13 |
| | | | |
Comprehensive income attributable to UBS AG shareholders | | | | |
Net profit / (loss) | | 6,235 | 3,502 | 3,172 |
| | | | |
Other comprehensive income that may be reclassified to the income statement | | | | |
Foreign currency translation | | | | |
Foreign currency translation movements, before tax | | (174) | 1,839 | (440) |
Foreign exchange amounts reclassified to the income statement from equity | | (90) | 2 | (36) |
Income tax relating to foreign currency translation movements | | (1) | (7) | 5 |
Subtotal foreign currency translation, net of tax | | (266) | 1,834 | (471) |
Financial investments available-for-sale | | | | |
Net unrealized gains / (losses) on financial investments available-for-sale, before tax | | 180 | 335 | (57) |
Impairment charges reclassified to the income statement from equity | | 1 | 76 | 41 |
Realized gains reclassified to the income statement from equity | | (298) | (244) | (265) |
Realized losses reclassified to the income statement from equity | | 45 | 25 | 56 |
Income tax relating to net unrealized gains / (losses) on financial investments available-for-sale | | 8 | (52) | 71 |
Subtotal financial investments available-for-sale, net of tax | | (64) | 140 | (154) |
Cash flow hedges | | | | |
Effective portion of changes in fair value of derivative instruments designated as cash flow hedges, before tax | | 550 | 2,086 | (652) |
Net realized (gains) / losses reclassified to the income statement from equity | | (1,199) | (1,197) | (1,261) |
Income tax relating to cash flow hedges | | 131 | (196) | 393 |
Subtotal cash flow hedges, net of tax | | (518) | 693 | (1,520) |
Total other comprehensive income that may be reclassified to the income statement, net of tax | | (848) | 2,667 | (2,145) |
| | | | |
Other comprehensive income that will not be reclassified to the income statement | | | | |
Defined benefit plans | | | | |
Gains / (losses) on defined benefit plans, before tax | | 322 | (1,454) | 1,178 |
Income tax relating to defined benefit plans | | (19) | 247 | (239) |
Subtotal defined benefit plans, net of tax | | 304 | (1,208) | 939 |
Property revaluation surplus | | | | |
Gains on property revaluation, before tax | | 0 | 0 | 0 |
Net (gains) / losses reclassified to retained earnings | | 0 | 0 | (6) |
Income tax relating to gains on property revaluation | | 0 | 0 | 0 |
Subtotal changes in property revaluation surplus, net of tax | | 0 | 0 | (6) |
Total other comprehensive income that will not be reclassified to the income statement, net of tax | | 304 | (1,208) | 933 |
| | | | |
Total other comprehensive income | | (545) | 1,459 | (1,211) |
Total comprehensive income attributable to UBS AG shareholders | | 5,690 | 4,961 | 1,961 |
| | | | |
Table continues on the next page. | | | | |
Consolidated financial statements
UBS AG consolidated financial statements
Statement of comprehensive income (continued) | | | | |
| | | | |
Table continued from previous page. | | | | |
| | For the year ended |
CHF million | | 31.12.15 | 31.12.14 | 31.12.13 |
| | | | |
Comprehensive income attributable to preferred noteholders | | | | |
Net profit / (loss) | | 77 | 142 | 204 |
| | | | |
Other comprehensive income that will not be reclassified to the income statement | | | | |
Foreign currency translation movements, before tax | | (59) | 119 | 355 |
Income tax relating to foreign currency translation movements | | 0 | 0 | 0 |
Subtotal foreign currency translation, net of tax | | (59) | 119 | 355 |
Total other comprehensive income that will not be reclassified to the income statement, net of tax | | (59) | 119 | 355 |
Total comprehensive income attributable to preferred noteholders | | 18 | 260 | 559 |
| | | | |
Comprehensive income attributable to non-controlling interests | | | | |
Net profit / (loss) | | 3 | 5 | 5 |
| | | | |
Other comprehensive income that will not be reclassified to the income statement | | | | |
Foreign currency translation movements, before tax | | (2) | 3 | (1) |
Income tax relating to foreign currency translation movements | | 0 | 0 | 0 |
Subtotal foreign currency translation, net of tax | | (2) | 3 | (1) |
Total other comprehensive income that will not be reclassified to the income statement, net of tax | | (2) | 3 | (1) |
Total comprehensive income attributable to non-controlling interests | | 1 | 7 | 4 |
| | | | |
Total comprehensive income | | | | |
Net profit / (loss) | | 6,314 | 3,649 | 3,381 |
Other comprehensive income | | (606) | 1,580 | (857) |
of which: other comprehensive income that may be reclassified to the income statement | | (848) | 2,667 | (2,145) |
of which: other comprehensive income that will not be reclassified to the income statement | | 243 | (1,087) | 1,288 |
Total comprehensive income | | 5,709 | 5,229 | 2,524 |
Balance sheet | | | | | | | |
| | | | | | | % change from |
CHF million | | Note | | 31.12.15 | 31.12.14 | | 31.12.14 |
| | | | | | | |
Assets | | | | | | | |
Cash and balances with central banks | | | | 91,306 | 104,073 | | (12) |
Due from banks | | 10, 12 | | 11,866 | 13,334 | | (11) |
Cash collateral on securities borrowed | | 11, 26 | | 25,584 | 24,063 | | 6 |
Reverse repurchase agreements | | 11, 26 | | 67,893 | 68,414 | | (1) |
Trading portfolio assets | | 13, 24 | | 124,047 | 138,156 | | (10) |
of which: assets pledged as collateral which may be sold or repledged by counterparties | | 25 | | 51,943 | 56,018 | | (7) |
Positive replacement values | | 14, 24, 26 | | 167,435 | 256,978 | | (35) |
Cash collateral receivables on derivative instruments | | 11, 26 | | 23,763 | 30,979 | | (23) |
Financial assets designated at fair value | | 24, 26, 27 | | 5,808 | 4,493 | | 29 |
Loans | | 10, 12 | | 312,723 | 315,984 | | (1) |
Financial investments available-for-sale | | 15, 24 | | 62,543 | 57,159 | | 9 |
Investments in associates | | 30 | | 954 | 927 | | 3 |
Property, equipment and software | | 16 | | 7,683 | 6,854 | | 12 |
Goodwill and intangible assets | | 17 | | 6,568 | 6,785 | | (3) |
Deferred tax assets | | 8 | | 12,833 | 11,060 | | 16 |
Other assets | | 18 | | 22,249 | 23,069 | | (4) |
Total assets | | | | 943,256 | 1,062,327 | | (11) |
| | | | | | | |
Liabilities | | | | | | | |
Due to banks | | 19 | | 11,836 | 10,492 | | 13 |
Cash collateral on securities lent | | 11, 26 | | 8,029 | 9,180 | | (13) |
Repurchase agreements | | 11, 26 | | 9,653 | 11,818 | | (18) |
Trading portfolio liabilities | | 13, 24 | | 29,137 | 27,958 | | 4 |
Negative replacement values | | 14, 24, 26 | | 162,430 | 254,101 | | (36) |
Cash collateral payables on derivative instruments | | 11, 26 | | 38,282 | 42,372 | | (10) |
Financial liabilities designated at fair value | | 20, 24, 26 | | 62,995 | 75,297 | | (16) |
Due to customers | | 19 | | 402,522 | 410,979 | | (2) |
Debt issued | | 21 | | 82,359 | 91,207 | | (10) |
Provisions | | 22 | | 4,163 | 4,366 | | (5) |
Other liabilities | | 8, 23 | | 74,606 | 70,392 | | 6 |
Total liabilities | | | | 886,013 | 1,008,162 | | (12) |
| | | | | | | |
Equity | | | | | | | |
Share capital | | | | 386 | 384 | | 1 |
Share premium | | | | 29,477 | 32,057 | | (8) |
Treasury shares | | | | 0 | (37) | | (100) |
Retained earnings | | | | 29,433 | 22,902 | | 29 |
Other comprehensive income recognized directly in equity, net of tax | | | | (4,047) | (3,199) | | 27 |
Equity attributable to UBS AG shareholders | | | | 55,248 | 52,108 | | 6 |
Equity attributable to preferred noteholders | | | | 1,954 | 2,013 | | (3) |
Equity attributable to non-controlling interests | | | | 41 | 45 | | (9) |
Total equity | | | | 57,243 | 54,165 | | 6 |
Total liabilities and equity | | | | 943,256 | 1,062,327 | | (11) |
Consolidated financial statements
UBS AG consolidated financial statements
Statement of changes in equity | | | | |
CHF million | Share capital | Share premium | Treasury shares | Retained earnings |
Balance as of 1 January 2013 | 384 | 33,862 | (1,071) | 16,491 |
Issuance of share capital | 1 | | | |
Acquisition of treasury shares | | | (846) | |
Disposal of treasury shares | | | 887 | |
Treasury share gains / (losses) and net premium / (discount) on own equity derivative activity | | 203 | | |
Premium on shares issued and warrants exercised | | 30 | | |
Employee share and share option plans | | 305 | | |
Tax (expense) / benefit recognized in share premium | | 91 | | |
Dividends | | (564)² | | |
Equity classified as obligation to purchase own shares | | (9) | | |
Preferred notes | | | | |
New consolidations and other increases / (decreases) | | | | 6 |
Deconsolidations and other decreases | | (11) | | |
Total comprehensive income for the year | | | | 4,111 |
of which: Net profit / (loss) | | | | 3,172 |
of which: Other comprehensive income that may be reclassified to the income statement, net of tax | | | | |
of which: Other comprehensive income that will not be reclassified to the income statement, net of tax – defined benefit plans | | | | 939 |
of which: Other comprehensive income that will not be reclassified to the income statement, net of tax – foreign currency translation | | | | |
Balance as of 31 December 2013 | 384 | 33,906 | (1,031) | 20,608 |
Issuance of share capital | 0 | | | |
Acquisition of treasury shares | | | (953) | |
Disposal of treasury shares | | | 1,946 | |
Treasury share gains / (losses) and net premium / (discount) on own equity derivative activity | | 24 | | |
Premium on shares issued and warrants exercised | | 802 | | |
Employee share and share option plans | | (1,785) | | |
Tax (expense) / benefit recognized in share premium | | 3 | | |
Dividends | | (938)² | | |
Equity classified as obligation to purchase own shares | | 46 | | |
Preferred notes | | | | |
New consolidations and other increases / (decreases) | | | | |
Deconsolidations and other decreases | | | | |
Total comprehensive income for the year | | | | 2,294 |
of which: Net profit / (loss) | | | | 3,502 |
of which: Other comprehensive income that may be reclassified to the income statement, net of tax | | | | |
of which: Other comprehensive income that will not be reclassified to the income statement, net of tax - defined benefit plans | | | | (1,208) |
of which: Other comprehensive income that will not be reclassified to the income statement, net of tax – foreign currency translation | | | | |
| | | | | | | |
Other comprehensive income recognized directly in equity, net of tax¹ | of which: Foreign currency translation | of which: Financial invest- ments avail- able-for-sale | of which: Cash flow hedges | Total equity attributable to UBS AG shareholders | Preferred noteholders | Non-controlling interests | Total equity |
(3,715) | (6,954) | 249 | 2,983 | 45,949 | 3,109 | 42 | 49,100 |
| | | | 1 | | | 1 |
| | | | (846) | | | (846) |
| | | | 887 | | | 887 |
| | | | 203 | | | 203 |
| | | | 30 | | | 30 |
| | | | 305 | | | 305 |
| | | | 91 | | | 91 |
| | | | (564) | (204) | (6) | (773) |
| | | | (9) | | | (9) |
| | | | 0 | (1,572) | | (1,572) |
| | | | 6 | | | 6 |
| | | | (11) | 0 | | (11) |
(2,151) | (471) | (154) | (1,520) | 1,961 | 559 | 4 | 2,524 |
| | | | 3,172 | 204 | 5 | 3,381 |
(2,145) | (471) | (154) | (1,520) | (2,145) | | | (2,145) |
| | | | 939 | | | 939 |
| | | | 0 | 355 | (1) | 355 |
(5,866) | (7,425) | 95 | 1,463 | 48,002 | 1,893 | 41 | 49,936 |
| | | | 0 | | | 0 |
| | | | (953) | | | (953) |
| | | | 1,946 | | | 1,946 |
| | | | 24 | | | 24 |
| | | | 802 | | | 802 |
| | | | (1,785) | | | (1,785) |
| | | | 3 | | | 3 |
| | | | (938) | (142) | (4) | (1,084) |
| | | | 46 | | | 46 |
| | | | 0 | 1 | | 1 |
| | | | 0 | | 1 | 1 |
| | | | 0 | | | 0 |
2,667 | 1,834 | 140 | 693 | 4,961 | 260 | 7 | 5,229 |
| | | | 3,502 | 142 | 5 | 3,649 |
2,667 | 1,834 | 140 | 693 | 2,667 | | | 2,667 |
| | | | (1,208) | | | (1,208) |
| | | | 0 | 119 | 3 | 121 |
Consolidated financial statements
UBS AG consolidated financial statements
Statement of changes in equity (continued) | | | | |
CHF million | Share capital | Share premium | Treasury shares | Retained earnings |
Balance as of 31 December 2014 | 384 | 32,057 | (37) | 22,902 |
Issuance of share capital | 1 | | | |
Acquisition of treasury shares | | | (292) | |
Disposal of treasury shares | | | 328 | |
Treasury share gains / (losses) and net premium / (discount) on own equity derivative activity | | 42 | | |
Premium on shares issued and warrants exercised | | 290 | | |
Employee share and share option plans | | (6) | | |
Tax (expense) / benefit recognized in share premium | | 9 | | |
Dividends | | (2,914)² | | (8) |
Equity classified as obligation to purchase own shares | | 0 | | |
Preferred notes | | | | |
New consolidations and other increases / (decreases) | | | | |
Deconsolidations and other decreases | | | | |
Total comprehensive income for the year | | | | 6,538 |
of which: Net profit / (loss) | | | | 6,235 |
of which: Other comprehensive income that may be reclassified to the income statement, net of tax | | | | |
of which: Other comprehensive income that will not be reclassified to the income statement, net of tax – defined benefit plans | | | | 304 |
of which: Other comprehensive income that will not be reclassified to the income statement, net of tax – foreign currency translation | | | | |
Balance as of 31 December 2015 | 386 | 29,477 | 0 | 29,433 |
1 Excludes defined benefit plans that are recorded directly in retained earnings. 2 Reflects the payment out of the capital contribution reserve of UBS AG of CHF 0.75 (2014: CHF 0.25, 2013: CHF 0.15) per CHF 0.10 par value share. |
| | | | | | | |
Other comprehensive income recognized directly in equity, net of tax¹ | of which: Foreign currency translation | of which: Financial invest- ments avail- able-for-sale | of which: Cash flow hedges | Total equity attributable to UBS AG shareholders | Preferred noteholders | Non-controlling interests | Total equity |
(3,199) | (5,591) | 236 | 2,156 | 52,108 | 2,013 | 45 | 54,165 |
| | | | 1 | | | 1 |
| | | | (292) | | | (292) |
| | | | 328 | | | 328 |
| | | | 42 | | | 42 |
| | | | 290 | | | 290 |
| | | | (6) | | | (6) |
| | | | 9 | | | 9 |
| | | | (2,922) | (77) | (5) | (3,004) |
| | | | 0 | | | 0 |
| | | | 0 | 1 | | 1 |
| | | | 0 | | | 0 |
| | | | 0 | | (1) | (1) |
(848) | (266) | (64) | (518) | 5,690 | 18 | 1 | 5,709 |
| | | | 6,235 | 77 | 3 | 6,314 |
(848) | (266) | (64) | (518) | (848) | | | (848) |
| | | | 304 | | | 304 |
| | | | 0 | (59) | (2) | (61) |
(4,047) | (5,857) | 172 | 1,638 | 55,248 | 1,954 | 41 | 57,243 |
| | | | | | | |
Consolidated financial statements
UBS AG consolidated financial statements
UBS AG shares issued and treasury shares held
As of 31 December 2015, shares issued by UBS AG totaled 3,858,408,466 (31 December 2014: 3,844,560,913 shares).
As of 1 January 2015, UBS AG held 2,115,255 treasury shares, which were exchanged with UBS Group AG shares in 2015. No treasury shares were held as of 31 December 2015.
® Refer to the “UBS shares” section of this report for more information
Conditional share capital
As of 31 December 2015, UBS AG's share capital could have been increased through the issuance of 136,200,312 shares upon exercise of employee options.
Additional conditional capital up to a maximum number of 380,000,000 shares was available as of 31 December 2015 for conversion rights and warrants granted in connection with the issuance of bonds or similar financial instruments.
Furthermore, UBS AG's share capital could have been increased by a maximum of 36,152,447 shares as of 31 December 2015 through the exercise of options granted in connection with the cash or title dividend distributed in 2015.
Statement of cash flows | | | | |
| | For the year ended |
CHF million | | 31.12.15¹ | 31.12.14¹ | 31.12.13¹ |
| | | | |
Cash flow from / (used in) operating activities | | | | |
Net profit / (loss) | | 6,314 | 3,649 | 3,381 |
Adjustments to reconcile net profit to cash flow from / (used in) operating activities | | | | |
Non-cash items included in net profit and other adjustments: | | | | |
Depreciation and impairment of property, equipment and software | | 918 | 817 | 816 |
Amortization and impairment of intangible assets | | 107 | 83 | 83 |
Credit loss expense / (recovery) | | 117 | 78 | 50 |
Share of net profits of associates | | (169) | (94) | (49) |
Deferred tax expense / (benefit) | | (1,614) | (1,635) | (545) |
Net loss / (gain) from investing activities | | (934) | (227) | (522) |
Net loss / (gain) from financing activities | | (1,654) | 2,135 | 3,988 |
Other net adjustments | | 3,628 | (7,250) | 5,326 |
Net change in operating assets and liabilities: | | | | |
Due from / to banks | | 1,768 | (1,235) | (7,551) |
Cash collateral on securities borrowed and reverse repurchase agreements | | (2,712) | 32,262 | 43,754 |
Cash collateral on securities lent and repurchase agreements | | (2,909) | (3,698) | (23,659) |
Trading portfolio, replacement values and financial assets designated at fair value | | 5,407 | (2,879) | 43,944 |
Cash collateral on derivative instruments | | 3,285 | (7,301) | (22,412) |
Loans | | 841 | (20,427) | (7,108) |
Due to customers | | (17,362) | 8,803 | 19,195 |
Other assets, provisions and other liabilities | | 7,516 | 4,751 | (3,935) |
Income taxes paid, net of refunds | | (551) | (600) | (382) |
Net cash flow from / (used in) operating activities | | 1,997 | 7,231 | 54,374 |
| | | | |
Cash flow from / (used in) investing activities | | | | |
Purchase of subsidiaries, associates and intangible assets | | (13) | (18) | (49) |
Disposal of subsidiaries, associates and intangible assets² | | 477 | 70 | 136 |
Purchase of property, equipment and software | | (1,841) | (1,915) | (1,236) |
Disposal of property, equipment and software | | 547 | 350 | 639 |
Net (investment in) / divestment of financial investments available-for-sale³ | | (7,605) | 4,108 | 5,966 |
Net cash flow from / (used in) investing activities | | (8,434) | 2,596 | 5,457 |
Table continues on the next page.
Consolidated financial statements
UBS AG consolidated financial statements
Statement of cash flows (continued) |
| | | | |
Table continued from previous page. | | | | |
| | For the year ended |
CHF million | | 31.12.15¹ | 31.12.14¹ | 31.12.13¹ |
| | | | |
Cash flow from / (used in) financing activities | | | | |
Net short-term debt issued / (repaid) | | (6,404) | (2,921) | (4,290) |
Net movements in treasury shares and own equity derivative activity | | 0 | (719) | (341) |
Capital issuance | | 0 | 0 | 1 |
Distributions paid on UBS AG shares | | (2,626) | (938) | (564) |
Issuance of long-term debt, including financial liabilities designated at fair value | | 47,790 | 40,982 | 28,014 |
Repayment of long-term debt, including financial liabilities designated at fair value | | (44,221) | (34,210) | (68,954) |
Dividends paid and repayments of preferred notes | | (108) | (110) | (1,415) |
Net changes of non-controlling interests | | (5) | (3) | (6) |
Net cash flow from / (used in) financing activities | | (5,573) | 2,081 | (47,555) |
| | | | |
Effects of exchange rate differences on cash and cash equivalents | | (1,742) | 8,522 | (2,705) |
Net increase / (decrease) in cash and cash equivalents | | (13,753) | 20,430 | 9,569 |
Cash and cash equivalents at the beginning of the year | | 116,715 | 96,284 | 86,715 |
Cash and cash equivalents at the end of the year | | 102,962 | 116,715 | 96,284 |
| | | | |
Cash and cash equivalents comprise: | | | | |
Cash and balances with central banks | | 91,306 | 104,073 | 80,879 |
Due from banks | | 10,732 | 11,772 | 11,117 |
Money market paper⁴ | | 924 | 869 | 4,288 |
Total⁵ | | 102,962 | 116,715 | 96,284 |
| | | | |
Additional information | | | | |
Net cash flow from / (used in) operating activities include: | | | | |
Cash received as interest | | 11,144 | 11,321 | 12,148 |
Cash paid as interest | | 5,267 | 5,360 | 7,176 |
Cash received as dividends on equity investments, investment funds and associates⁶ | | 2,120 | 1,961 | 1,421 |
1 In 2015, UBS AG refined its definition of cash and cash equivalents to exclude cash collateral receivables on derivatives with bank counterparties. Prior periods were restated. Refer to Note 1b for more information. 2 Includes dividends received from associates. 3 Includes gross cash inflows from sales and maturities (CHF 93,584 million for the year ended 31 December 2015, CHF 140,438 million for the year ended 31 December 2014, CHF 153,887 million for the year ended 31 December 2013) and gross cash outflows from purchases of (CHF 101,189 million for the year ended 31 December 2015, CHF 136,330 million for the year ended 31 December 2014, CHF 147,921 million for the year ended 31 December 2013). 4 Money market paper is included in the balance sheet under Trading portfolio assets (31 December 2015: CHF 795 million, 31 December 2014: CHF 835 million, 31 December 2013: CHF 1,716 million) and Financial investments available-for-sale (31 December 2015: CHF 129 million, 31 December 2014: CHF 34 million, 31 December 2013: CHF 2,571 million). 5 CHF 3,963 million, CHF 4,178 million and CHF 4,534 million of cash and cash equivalents (mainly reflected in Due from banks) were restricted as of 31 December 2015, 31 December 2014 and 31 December 2013, respectively. Refer to Note 25 for more information. 6 Includes dividends received from associates (2015: CHF 114 million, 2014: CHF 54 million, 2013: CHF 69 million) reported within cash flow from / (used in) investing activities. |
Notes to the UBS AG consolidated financial statements
Note 1 Summary of significant accounting policies
a) Significant accounting policies
The significant accounting policies applied in the preparation of the consolidated financial statements (the “Financial Statements”) of UBS AG and its subsidiaries (“UBS AG”) are described in this note. These policies have been applied consistently in all years presented unless otherwise stated.
1) Basis of accounting
UBS AG provides a broad range of financial services including: advisory services, underwriting, financing, market-making, asset management and brokerage on a global level, and retail banking in Switzerland. UBS AG was formed on 29 June 1998 when Swiss Bank Corporation and Union Bank of Switzerland merged. UBS Group AG was established in 2014 as the holding company of the Group and in 2015 it increased its ownership interest in UBS AG to 100%, following the successful completion of the procedure under article 33 of the Swiss Stock Exchange Act (SESTA procedure). Refer to Note 32 for more information.
The Financial Statements are prepared in accordance with IFRS as issued by the International Accounting Standards Board (IASB), and are presented in Swiss francs (CHF), the currency of Switzerland, where UBS AG is incorporated. On 10 March 2016, the Financial Statements were authorized for issue by the Board of Directors. The Financial Statements are prepared using uniform accounting policies for similar transactions and other events. Intercompany transactions and balances have been eliminated.
Disclosures incorporated in the “Risk, treasury and capital management” section of this Annual Report, which form part of these Financial Statements, are marked as audited. These disclosures relate to requirements under IFRS 7 Financial Instruments: Disclosures and IAS 1 Presentation of Financial Statements and are not repeated in the “Financial information – consolidated financial statements” section.
2) Use of estimates
Preparation of these Financial Statements under IFRS requires management to make estimates and assumptions that affect reported amounts of assets, liabilities, income and expenses and disclosure of contingent assets and liabilities. These estimates and assumptions are based on the best available information. Actual results in the future could differ from such estimates and such differences may be material to the Financial Statements. Estimates are reviewed regularly and revisions are recognized in the period in which they occur.
The following notes to the Financial Statements contain information about those areas of estimation uncertainty considered to require critical judgment and have the most significant effect on the amounts recognized in the Financial Statements: Note 8 Income taxes, Note 12 Allowances and provisions for credit losses, Note 17 Goodwill and intangible assets, Note 22 Provisions and contingent liabilities, Note 24 Fair value measurement, Note 28 Pension and other post-employment benefit plans, Note 29 Equity participation and other compensation plans and Note 30 Interests in subsidiaries and other entities.
3) Subsidiaries and structured entities
The Financial Statements comprise those of UBS AG and its subsidiaries, including controlled structured entities (SEs), presented as a single economic entity. Equity attributable to non-controlling interests is presented on the consolidated balance sheet within Equity, separately from Equity attributable to UBS AG shareholders.
UBS AG controls an entity when it has power over the relevant activities of the entity, exposure to variable returns and the ability to use its power to affect its returns.
Where an entity is governed by voting rights, control is generally indicated by a direct shareholding of more than one-half of the voting rights.
Consolidated financial statements
Notes to the UBS AG consolidated financial statements
Note 1 Summary of significant accounting policies (continued)
In other cases, the assessment of control is more complex and requires greater use of judgment. Where UBS AG has an interest in an entity that absorbs variability, UBS AG considers whether it has power over the entity that allows it to affect the variability of its returns. Consideration is given to all facts and circumstances to determine whether UBS AG has power over another entity, that is, the current ability to direct the relevant activities of an entity when decisions about those activities need to be made. Factors such as the purpose and design of the entity, rights held through contractual arrangements such as call rights, put rights or liquidation rights, as well as potential decision-making rights are all considered in this assessment. Where UBS AG has power over the relevant activities, a further assessment is made to determine whether, through that power, it has the ability to affect its own returns – that is, assessing whether power is held in a principal or agent capacity. Consideration is given to (i) the scope of decision-making authority, (ii) rights held by other parties, including removal or other participating rights and (iii) exposure to variability, including remuneration, relative to total variability of the entity as well as whether that exposure is different from other investors. If, after review of these factors, UBS AG concludes that it can exercise its power to affect its own returns, the entity is consolidated.
Subsidiaries, including SEs, are consolidated from the date control is obtained and are deconsolidated from the date control ceases. Control, or the lack thereof, is reassessed if facts and circumstances indicate that there is a change to one or more of the elements needed to establish that control is present.
® Refer to Note 30 for more information on subsidiaries and structured entities
Structured entities (SEs)
SEs are entities that have been designed so that voting or similar rights are not the dominant factor in deciding who controls the entity, such as when voting rights relate only to administrative tasks and the relevant activities are directed by means of contractual arrangements. Such entities generally have a narrow and well-defined objective and include those historically referred to as special purpose entities (SPEs) and some investment funds. UBS AG assesses whether an entity is an SE by considering the nature of the activities of the entity as well as the substance of voting or similar rights afforded to other parties, including investors and independent boards or directors. UBS AG considers rights such as the ability to liquidate the entity or remove the decision maker to be similar to voting rights when the holder has the substantive ability to exercise such rights without cause. In the absence of such rights or in cases where the existence of such rights cannot be fully established, the entity is considered to be an SE.
UBS AG sponsors the formation of SEs and interacts with non-sponsored SEs for a variety of reasons including allowing clients to obtain or be exposed to particular risk profiles, to provide funding or to sell or purchase credit risk. Many SEs are established as bankruptcy remote, meaning that only the assets in the SE are available for the benefit of the SE’s investors and such investors have no other recourse to UBS AG. UBS AG is deemed to be the sponsor of an SE when it is involved in its creation, establishment and promotion and facilitates its ongoing success through the transfer of assets or the provision of explicit or implicit financial, operational or other support. Where UBS AG acts purely as an advisor, administrator or placement agent for an SE created by a third-party entity, it is not considered to be sponsored by UBS AG.
Each individual entity is assessed for consolidation in line with the consolidation principles described above, considering the nature and scope of UBS AG’s involvement. As the nature and extent of UBS AG’s involvement is unique to each entity, there is no uniform consolidation outcome by entity – certain entities within a class are consolidated and others are not. When UBS AG does not consolidate an SE but has an interest in an SE or has sponsored an SE, additional disclosures are provided in Note 30 on the nature of these interests and sponsorship activities. The classes of SEs UBS AG is involved with include the following:
– Securitization structured entities are established to issue securities to investors that are backed by assets held by the SE and whereby (i) significant credit risk associated with the securitized exposures has been transferred to third parties and (ii) there is more than one risk position or tranche issued by the securitization vehicle in line with the Basel III securitization definition. All securitization entities are classified as SEs.
– Client investment structured entities are established predominantly for clients to invest in specific assets or risk exposures through purchasing notes issued by the SE, predominantly on a fixed-term basis. The SE may source assets via a transfer from UBS AG or through an external market transaction. In some cases, UBS AG may enter into derivatives with the SE to either align the cash flows of the entity with the investor’s intended investment objective or to introduce other desired risk exposures. In certain cases, UBS AG may have interests in a third-party sponsored SE to hedge specific risks or participate in asset-backed financing.
– Investment fund structured entities have a collective investment objective, are managed by an investment manager and are either passively managed, such that any decision-making does not have a substantive effect on variability, or are actively managed and investors or their governing bodies do not have substantive voting or similar rights. UBS creates and sponsors a large number of funds in which it may have an interest through the receipt of variable management fees and / or a direct investment. In addition, UBS AG has interests in a number of funds created and sponsored by third parties, including exchange-traded funds and hedge funds, to hedge issued structured products.
Note 1 Summary of significant accounting policies (continued)
Business combinations
Business combinations are accounted for using the acquisition method. As of the acquisition date, UBS AG recognizes the identifiable assets acquired and the liabilities assumed at their acquisition-date fair values. For each business combination, UBS AG measures the non-controlling interests in the acquiree either at fair value or at their proportionate share of the acquiree’s identifiable net assets. Generally, non-controlling interests are present ownership interests that entitle their holders to a proportionate share of the net assets of the acquiree in the event of liquidation.
The cost of an acquisition is the aggregate of the assets transferred, the liabilities owed to former owners of the acquiree, and the equity instruments issued, measured at acquisition-date fair values. Acquisition-related costs are expensed as incurred. Any contingent consideration that may be transferred by UBS AG is recognized at fair value as of the date of acquisition.
If the contingent consideration is classified as an asset or liability, subsequent changes in the fair value of the contingent consideration are recognized in the income statement. If the contingent consideration is classified as equity, it is not remeasured and its subsequent settlement is accounted for within Equity. Any excess of the aggregate of the consideration transferred and the amount recognized for non-controlling interests over the net identifiable assets acquired and liabilities assumed is considered goodwill and is recognized as a separate asset on the balance sheet, initially measured at cost. If the fair value of the net assets of the subsidiary acquired exceeds the aggregate of the consideration transferred and the amount recognized for non-controlling interests, the difference is recognized in the income statement on the acquisition date.
® Refer to Note 31 for more information on business combinations
4) Associates and joint ventures
Investments in entities in which UBS AG has significant influence, but not control, over the financial and operating policies of the entity are classified as investments in associates and accounted for under the equity method of accounting. Normally, significant influence is indicated when UBS AG owns between 20% and 50% of a company’s voting rights. Investments in associates are initially recognized at cost, and the carrying amount is increased or decreased after the date of acquisition to recognize UBS AG’s share of the investee’s net profit or loss (including net profit or loss recognized directly in equity). Interests in joint ventures are also accounted for under the equity method of accounting. A joint venture is subject to a contractual agreement between UBS AG and one or more third parties, which establishes joint control over the relevant activities and provides rights to the net assets of the entity. Interests in joint ventures are classified as Investments in associates.
If the reporting date of an associate or joint venture is different than UBS AG’s reporting date, the most recently available financial statements of the associate or joint venture are used to apply the equity method. Adjustments are made for effects of significant transactions or events that may occur between that date and UBS AG’s reporting date.
Investments in associates and interests in joint ventures are classified as held for sale if their carrying amount will be recovered principally through a sale transaction rather than through continuing use. Refer to item 29 for more information.
® Refer to Note 30 for more information on associates and joint ventures
5) Recognition and derecognition of financial instruments
UBS AG recognizes financial instruments on its balance sheet when UBS AG becomes a party to the contractual provisions of the instruments, provided the recognition criteria are met. UBS AG also acts in a trustee or other fiduciary capacity, which results in the holding or placing of assets on behalf of individuals, trusts, retirement benefit plans and other institutions. Unless the recognition criteria are satisfied, these assets and the related income are excluded from UBS AG’s Financial Statements, as they are not assets of UBS AG.
Financial assets
UBS AG enters into certain transactions where it transfers financial assets recognized on its balance sheet but retains either all or a portion of the risks and rewards of the transferred financial assets. If all or substantially all of the risks and rewards are retained, the transferred financial assets are not derecognized from the balance sheet. Transactions where transfers of financial assets result in UBS AG retaining all or substantially all risks and rewards include securities lending and repurchase transactions described under items 13 and 14. They also include transactions where financial assets are sold to a third party together with a total return swap that results in UBS AG retaining all or substantially all risks and rewards of the transferred assets. These types of transactions are accounted for as secured financing transactions.
In transactions where substantially all of the risks and rewards of ownership of a financial asset are neither retained nor transferred, UBS AG derecognizes the financial asset if control over the asset is surrendered. The rights and obligations retained following the transfer are recognized separately as assets and liabilities, respectively. In transfers where control over the financial asset is retained, UBS AG continues to recognize the asset to the extent of its continuing involvement, determined by the extent to which it is exposed to changes in the value of the transferred asset following the transfer. Examples of such transactions include written put options, acquired call options, or other instruments linked to the performance of the transferred asset.
Consolidated financial statements
Notes to the UBS AG consolidated financial statements
Note 1 Summary of significant accounting policies (continued)
For the purposes of UBS AG’s disclosures of transferred financial assets, a financial asset is typically considered to have been transferred when UBS AG a) transfers the contractual rights to receive the cash flows of the financial asset or b) retains the contractual rights to receive the cash flows of that asset, but assumes a contractual obligation to pay the cash flows to one or more entities.
Where financial assets have been pledged as collateral or in similar arrangements, they are considered to have been transferred if the counterparty has received the contractual right to the cash flows of the pledged assets, as may be evidenced, for example, by the counterparty’s right to sell or repledge the assets. Where the counterparty to the pledged financial assets has not received the contractual right to the cash flows, the assets are considered pledged, but not transferred.
® Refer to Note 25b and 25c for more information on transferred financial assets
Financial liabilities
UBS AG derecognizes a financial liability from its balance sheet when it is extinguished, such as when the obligation specified in the contract is discharged, cancelled or has expired. When an existing financial liability is exchanged for a new one from the same lender on substantially different terms, or the terms of an existing liability are substantially modified, such an exchange or modification is treated as the derecognition of the original liability and the recognition of a new liability with any difference in the respective carrying amounts being recognized in the income statement.
6) Determination of fair value
Fair value is the price that would be received for the sale of an asset or paid to transfer a liability in an orderly transaction between market participants in the principal market (or most advantageous market, in the absence of a principal market) as of
the measurement date.
® Refer to Note 24 for more information on fair value measurement
7) Trading portfolio assets and liabilities
Non-derivative financial assets and liabilities are classified at acquisition as held for trading and presented in the trading portfolio if they are a) acquired or incurred principally for the purpose of selling or repurchasing in the near term, or b) part of a portfolio of identified financial instruments that are managed together and for which there is evidence of a recent actual pattern of short-term profit-taking.
The trading portfolio includes non-derivative financial instruments (including those with embedded derivatives) and commodities. Financial instruments that are considered derivatives in their entirety generally are presented on the balance sheet as Positive replacement values or Negative replacement values. Refer to item 15 for more information. The trading portfolio includes recognized assets and liabilities relating to proprietary, hedging and client-related business.
Trading portfolio assets include debt instruments (including those in the form of securities, money market paper and traded corporate and bank loans), equity instruments, assets held under unit-linked contracts and precious metals and other commodities owned by UBS AG (long positions). Trading portfolio liabilities include obligations to deliver financial instruments such as debt and equity instruments which UBS AG has sold to third parties but does not own (short positions).
Assets and liabilities in the trading portfolio are measured at fair value. Gains and losses realized on disposal or redemption of these assets and liabilities and unrealized gains and losses from changes in the fair value of these assets and liabilities are reported as Net trading income. Interest and dividend income and expense on these assets and liabilities are included in Interest income or Interest expense.
UBS AG uses settlement date accounting when recognizing assets and liabilities in the trading portfolio. From the date a purchase transaction is entered into (trade date) until settlement date, UBS AG recognizes any unrealized profits and losses arising from changes in fair value in Net trading income. The corresponding receivable or payable is presented on the balance sheet as a Positive replacement value or Negative replacement value. On settlement date, the resulting financial asset is recognized on the balance sheet at the fair value of the consideration given or received, plus or minus the change in fair value of the contract since the trade date. From the trade date of a sales transaction, unrealized profits and losses are no longer recognized and, on settlement date, the asset is derecognized.
Trading portfolio assets transferred to external parties that do not qualify for derecognition (refer to item 5 for more information) and where the transferee has obtained the right to sell or repledge the assets continue to be classified on the UBS AG balance sheet as Trading portfolio assets but are identified as Assets pledged as collateral which may be sold or repledged by counterparties. Such assets continue to be measured at fair value.
® Refer to Note 13 and 24 for more information on trading portfolio assets and liabilities.
Note 1 Summary of significant accounting policies (continued)
8) Financial assets and financial liabilities designated at fair value through profit or loss
A financial instrument may be designated at fair value through profit or loss only upon initial recognition and this designation cannot be changed subsequently. Financial assets and financial liabilities designated at fair value are presented on separate lines on the face of the balance sheet. The fair value option can be applied only if one of the following criteria is met:
– the financial instrument is a hybrid instrument that includes a substantive embedded derivative;
– the financial instrument is part of a portfolio that is risk managed on a fair value basis and reported to senior management on that basis or
– the application of the fair value option eliminates or significantly reduces an accounting mismatch that would otherwise arise.
UBS AG has used the fair value option to designate most of its issued hybrid debt instruments as financial liabilities designated at fair value through profit or loss, on the basis that such financial instruments include embedded derivatives and / or are managed on a fair value basis. Such hybrid debt instruments predominantly include the following:
– Equity-linked bonds or notes: linked to a single stock, a basket of stocks or an equity index;
– Credit-linked bonds or notes: linked to the performance (coupon and / or redemption amount) of single names (such as a company or a country) or a basket of reference entities and
– Rates-linked bonds or notes: linked to a reference interest rate, interest rate spread or formula.
The fair value option is also applied to certain loans and loan commitments, otherwise accounted for at amortized cost, which are hedged predominantly with credit derivatives. The application of the fair value option to the loans and loan commitments reduces an accounting mismatch, as the credit derivatives are accounted for as derivative instruments at fair value through profit or loss. Similarly, UBS AG has applied the fair value option to certain structured loans and reverse repurchase and securities borrowing agreements which are part of portfolios managed on a fair value basis.
The fair value option is applied to assets held to hedge deferred cash-settled employee compensation awards, in order to reduce an accounting mismatch that would otherwise arise due to the liability being measured on a fair value basis.
Fair value changes related to financial instruments designated at fair value through profit or loss are recognized in Net trading income. Interest income and interest expense on financial assets and liabilities designated at fair value through profit or loss are recognized in Interest income on financial assets designated at fair value or Interest expense on financial liabilities designated at fair value, respectively.
UBS AG applies the same recognition and derecognition principles to financial instruments designated at fair value as to financial instruments in the trading portfolio. Refer to items 5 and 7 for more information.
® Refer to Notes 3, 20, 24e and 27d for more information on financial assets and liabilities designated at fair value
9) Financial investments classified as available-for-sale
Financial investments classified as available-for-sale are non-derivative financial assets that are not classified as held for trading, designated at fair value through profit or loss, or loans and receivables. They are recognized on a settlement date basis.
Financial investments classified as available-for-sale include: (a) debt securities held as part of a large multi-currency portfolio of unencumbered, high-quality assets managed centrally by Corporate Center – Group Asset and Liability Management, a majority of which is short-term, (b) strategic equity investments, (c) certain investments in real estate funds, (d) certain equity instruments including private equity investments, and (e) debt instruments and non-performing loans acquired in the secondary market.
Financial investments that are classified as available-for-sale are recognized initially at fair value less transaction costs and are measured subsequently at fair value. Unrealized gains and losses are reported in Other comprehensive income within Equity, net of applicable income taxes, until such investments are sold, collected or otherwise disposed of, or until any such investment is determined to be impaired. Unrealized gains before tax are presented separately from unrealized losses before tax in Note 15.
For monetary instruments (such as debt securities), foreign exchange translation gains and losses determined by reference to the amortized cost basis of the instruments are recognized in Net trading income. Foreign exchange translation gains and losses related to other changes in fair value are recognized in Other comprehensive income within Equity. Foreign exchange translation gains and losses associated with non-monetary instruments (such as equity securities) are part of the overall fair value change of the instruments and are recognized in Other comprehensive income within Equity.
Interest and dividend income on financial investments classified as available-for-sale are included in Interest and dividend income from financial investments available-for-sale. Interest income is determined by reference to the instrument’s amortized cost basis using the effective interest rate (EIR).
On disposal of an investment, any related accumulated unrealized gains or losses included in Equity are reclassified to the income statement and reported in Other income. Gains or losses on disposal are determined using the average cost method.
Consolidated financial statements
Notes to the UBS AG consolidated financial statements
Note 1 Summary of significant accounting policies (continued)
At each balance sheet date, UBS AG assesses whether indicators of impairment are present for an available-for-sale investment. An available-for-sale investment is impaired when there is objective evidence that, as a result of one or more events that occurred after the initial recognition of the investment, the estimated future cash flows from the investment have decreased. A significant or prolonged decline in the fair value of an available-for-sale equity instrument below its original cost is considered objective evidence of impairment. In the event of a significant decline in fair value below its original cost (20%) or a prolonged decline (six months), an impairment is recorded unless facts and circumstances clearly indicate that the decline in value, on its own, is not evidence of an impairment.
For debt investments, objective evidence of impairment includes significant financial difficulty of the issuer or counterparty, default or delinquency in interest or principal payments, or it becoming probable that the borrower will enter bankruptcy or financial reorganization. If an available-for-sale financial investment is determined to be impaired, the related cumulative net unrealized loss previously recognized in Other comprehensive income within Equity is reclassified to the income statement within Other income. For equity instruments, any further loss is recognized directly in the income statement, whereas for debt instruments, any further loss is recognized in the income statement only if there is additional objective evidence of impairment. After an impairment of an equity instrument that is classified as available-for-sale, increases in the fair value are reported in Other comprehensive income within Equity. Subsequent increases in the fair value of debt instruments up to an amount that equals their amortized cost in original currency are recognized in Other income, provided that the fair value increase is related to an event occurring after the impairment loss was recorded. Increases in excess of that amount are reported in Other comprehensive income within Equity.
UBS AG applies the same recognition and derecognition principles to financial assets classified as available-for-sale as to financial instruments in the trading portfolio (refer to items 5 and 7 for more information), except that unrealized gains and losses between trade date and settlement date are recognized in Other comprehensive income within Equity rather than in the income statement.
® Refer to Note 15 and 24 for more information on financial investments available-for-sale
10) Loans and receivables
Loans and receivables are non-derivative financial assets with fixed or determinable payments that are not quoted in an active market, not classified as held for trading, not designated at fair value through profit and loss or classified as available-for-sale, and are not assets for which UBS AG may not recover substantially all of its initial net investment other than because of credit deterioration. Financial assets classified as loans and receivables include:
– originated loans where funding is provided directly to the borrower;
– participation in a loan from another lender and purchased loans; and
– securities which were classified as loans and receivables at acquisition date, such as municipal auction rate securities in the Corporate Center – Non-core and Legacy Portfolio (refer to Note 27c for more information).
Loans and receivables are recognized when UBS AG becomes a party to the contractual provisions of the instrument, which is when funding is advanced to borrowers. They are recorded initially at fair value, based on the amount provided to originate or purchase the assets, together with any transaction costs directly attributable to the acquisition. Subsequently, they are measured at amortized cost using the EIR method, less allowances for credit losses. Refer to item 11 for information on allowances for credit losses and to Note 27a for an overview of the financial assets classified as loans and receivables.
Interest on loans and receivables is included in Interest earned on loans and advances and is recognized on an accrual basis. Upfront fees and direct costs relating to loan origination, refinancing or restructuring as well as to loan commitments are generally deferred and amortized to Interest earned on loans and advances over the life of the loan using the EIR method. For loan commitments that are not expected to result in a loan being advanced, the fees are recognized in Net fee and commission income over the commitment period. For loan syndication fees where UBS AG does not retain a portion of the syndicated loan, or where UBS AG does retain a portion of the syndicated loan at the same effective yield for comparable risk as other participants, fees are credited to Net fee and commission income when the services have been provided.
Presentation of receivables from central banks
Deposits with central banks that are available on demand are presented on the balance sheet as Cash and balances with central banks. All longer-dated receivables with central banks are presented under Due from banks.
Note 1 Summary of significant accounting policies (continued)
Financial assets reclassified to loans and receivables
When a financial asset is reclassified from held for trading to loans and receivables, the financial asset is reclassified at its fair value on the date of reclassification. Any gain or loss recognized in the income statement before reclassification is not reversed. The fair value of a financial asset on the date of reclassification becomes its cost basis going forward. In 2008 and 2009, UBS AG determined that certain financial assets classified as held for trading were no longer held for the purpose of selling or repurchasing in the near term and that UBS AG had the intention and ability to hold these assets for the foreseeable future, considered to be a period of approximately twelve months from the reclassification. Therefore, these assets were reclassified from held for trading to loans and receivables.
® Refer to Note 27c for more information on reclassified assets
Renegotiated loans
A renegotiated or restructured loan is a loan for which the terms have been modified or for which additional collateral has been requested that was not contemplated in the original contract.
Typical key features of terms and conditions granted through renegotiation to avoid default include special interest rates, postponement of interest or amortization payments, modification of the schedule of repayments or amendment of loan maturity. There is no change in the EIR following a renegotiation.
If a loan is renegotiated with preferential conditions (i.e., new or modified terms and conditions are agreed which do not meet the normal market criteria for the quality of the obligor and the type of loan), the position is still classified as non-performing and is rated as being in counterparty default. It will remain so until the loan is collected or written off and will be assessed for impairment on an individual basis.
If a loan is renegotiated on a non-preferential basis (e.g., additional collateral is provided by the client, or new terms and conditions are agreed which meet the normal market criteria, for the quality of the obligor and the type of loan), the loan will be re-rated using UBS AG’s regular rating scale. In these circumstances, the loan is removed from impaired status and included in the collective assessment of loan loss allowances, unless an indication of impairment exists, in which case the loan is assessed for impairment on an individual basis. For the purposes of measuring credit losses within the collective loan loss assessment, these loans are not segregated from other loans which have not been renegotiated. Management regularly reviews all loans to ensure that all criteria according to the loan agreement continue to be met and that future payments are likely to occur. Refer to item 11 for more information on allowances and provisions for credit losses.
A restructuring of a loan could lead to a fundamental change in the terms and conditions of a loan, resulting in the original loan being derecognized and a new loan being recognized.
If a loan is derecognized in these circumstances, the new loan is measured at fair value at initial recognition. Any allowance taken to date against the original loan is derecognized and is not attributed to the new loan. Consequently, the new loan is assessed for impairment on an individual basis. If the loan is not impaired, the loan is included within the general collective loan assessment for the purpose of measuring credit losses.
11) Allowances and provisions for credit losses
An allowance or provision for credit losses is established if there is objective evidence that UBS AG will be unable to collect all amounts due (or the equivalent thereof) on a claim, based on the original contractual terms due to credit deterioration of the issuer or counterparty. A claim means a loan or receivable carried at amortized cost, or a commitment such as a letter of credit, a guarantee, or another similar instrument. Objective evidence of impairment includes significant financial difficulty of the issuer or counterparty, default or delinquency in interest or principal payments, or a likelihood that the borrower will enter bankruptcy or financial reorganization.
An allowance for credit losses is reported as a reduction of the carrying value of a claim on the balance sheet. For an off-balance-sheet item, such as a commitment, a provision for credit loss is reported in Provisions. Changes to allowances and provisions for credit losses are recognized as Credit loss expense / recovery.
Allowances and provisions for credit losses are evaluated at both a counterparty-specific level and collectively based on the following principles:
Counterparty-specific: A loan is considered impaired when management determines that it is probable that UBS AG will not be able to collect all amounts due (or the equivalent value thereof) based on the original contractual terms. Individual credit exposures are evaluated based on the borrower’s overall financial condition, resources and payment record, the prospects of support from contractual guarantors and, where applicable, the realizable value of any collateral. The estimated recoverable amount is the present value, calculated using the claim’s original EIR, of expected future cash flows including amounts that may result from restructuring or the liquidation of collateral. If a loan has a variable interest rate, the discount rate used for calculating the recoverable amount is the current EIR. Impairment is measured and allowances for credit losses are established based on the difference between the carrying amount and the estimated recoverable amount. Upon impairment, the accrual of interest income based on the original terms of the loan is discontinued. The increase in the present value of the impaired loan due to the passage of time is reported as Interest income.
Consolidated financial statements
Notes to the UBS AG consolidated financial statements
Note 1 Summary of significant accounting policies (continued)
All impaired loans are reviewed and analyzed at least annually. Any subsequent changes to the amounts and timing of the expected future cash flows compared with prior estimates result in a change in the allowance for credit losses and are charged or credited to Credit loss expense / recovery. An allowance for impairment is reversed only when the credit quality has improved to such an extent that there is reasonable assurance of timely collection of principal and interest in accordance with the original contractual terms of the claim, or the equivalent value thereof. A write-off is made when all or part of a claim is deemed uncollectible or forgiven. Write-offs reduce the principal amount of a claim and are charged against previously established allowances for credit losses or, if no allowance has been established previously, directly to Credit loss expense / recovery. Recoveries, in part or in full, of amounts previously written off are credited to Credit loss expense / recovery.
A loan is classified as non-performing when the payment of interest, principal or fees is overdue by more than 90 days, when insolvency proceedings have commenced, or when obligations have been restructured on preferential terms. Loans are evaluated individually for impairment when amounts have been overdue by more than 90 days, or if other objective evidence indicates that a loan may be impaired.
Collectively: All loans for which no impairment is identified at a counterparty-specific level are grouped on the basis of UBS AG’s internal credit grading system that considers credit risk characteristics such as asset type, industry, geographical location, collateral type, past-due status and other relevant factors, to collectively assess whether impairment exists within a portfolio. Future cash flows for a group of financial assets that are collectively evaluated for impairment are estimated on the basis of historical loss experience for assets with credit risk characteristics similar to those in the group. Historical loss experience is adjusted on the basis of current observable data to reflect the effects of current conditions of the group of financial assets on which the historical loss experience is based and to remove the effects of conditions in the historical period that do not exist currently in the portfolio. Estimates of changes in future cash flows for the group of financial assets reflect, and are directionally consistent with, changes in related observable data from year to year. The methodology and assumptions used for estimating future cash flows for the group of financial assets are reviewed regularly to reduce any differences between loss estimated and actual loss experience. Allowances for collective impairment assessments are recognized as Credit loss expense / recovery and result in an offset to the aggregated loan position. As the allowance cannot be allocated to individual loans, the loans are not considered to be impaired and interest is accrued on each loan according to its contractual terms. If objective evidence becomes available that indicates that an individual financial asset is impaired, it is removed from the group of financial assets assessed for impairment on a collective basis and is assessed separately as a counterparty-specific claim.
Reclassified securities and similar acquired securities carried at amortized cost: Estimated cash flows associated with financial assets reclassified from the held for trading category to loans and receivables in accordance with the requirements in item 10 and other similar assets acquired subsequently are reviewed periodically. Adverse revisions in cash flow estimates related to credit events are recognized in the income statement as Credit loss expense / recovery. For a reclassified loan, a change in expectation regarding the recoverability of the security and its future cash receipts requires an adjustment to the EIR on the loan from the date of change (refer to Note 27c for more information).
® Refer to Note 12 for more information on allowances and provisions for credit losses
12) Securitization structures set up by UBS AG
UBS AG securitizes certain financial assets, generally selling Trading portfolio assets to SEs that issue securities to investors. UBS AG applies the policies set out in item 3 in determining whether the respective SE must be consolidated and those set out in item 5 in determining whether derecognition of transferred financial assets is appropriate. The following statements mainly apply to transfers of financial assets that qualify for derecognition.
Gains or losses related to the sale of Trading portfolio assets involving a securitization are recognized when the derecognition criteria are satisfied; the resulting gain or loss is included in Net trading income.
Interests in the securitized financial assets may be retained in the form of senior or subordinated tranches, interest-only strips or other residual interests (retained interests). Retained interests are primarily recorded in Trading portfolio assets and are carried at fair value. Synthetic securitization structures typically involve derivative financial instruments for which the principles set out in item 15 apply.
Note 1 Summary of significant accounting policies (continued)
UBS AG acts as structurer and placement agent in various mortgage-backed securities (MBS) and other asset-backed securities (ABS) securitizations. In such capacity, UBS AG may purchase collateral on its own behalf or on behalf of clients during the period prior to securitization. UBS AG then typically sells the collateral into designated trusts upon closing of the securitization. In other securitizations, UBS AG may only provide financing to a designated trust in order to fund the purchase of collateral by the trust prior to securitization. Furthermore, UBS AG underwrites the offerings to investors, earning fees for its placement and structuring services. Consistent with the valuation of similar inventory, fair value of retained tranches is initially and subsequently determined using market price quotations where available or internal pricing models that utilize variables such as yield curves, prepayment speeds, default rates, loss severity, interest rate volatilities and spreads. Where possible, assumptions based on observable transactions are used to determine the fair value of retained interests, but for some interests substantially no observable information is available.
® Refer to Note 30c for more information on the UBS AG’s involvement with securitization vehicles
13) Securities borrowing and lending
Securities borrowing and securities lending transactions are generally entered into on a collateralized basis. In such transactions, UBS AG typically borrows or lends equity and debt securities in exchange for securities or cash collateral. Additionally, UBS AG borrows securities from its clients’ custody accounts in exchange for a fee. The transactions are normally conducted under standard agreements employed by financial market participants and are undertaken with counterparties subject to UBS AG’s normal credit risk control processes. UBS AG monitors on a daily basis the market value of the securities received or delivered and requests or provides additional collateral or returns or recalls surplus collateral in accordance with the underlying agreements.
Cash collateral received is recognized with a corresponding obligation to return it (Cash collateral on securities lent) and cash collateral delivered is derecognized and a corresponding receivable reflecting UBS AG’s right to receive it back is recorded (Cash collateral on securities borrowed). The securities which have been transferred are not recognized on, or derecognized from, the balance sheet unless the risks and rewards of ownership are also transferred. Refer to item 5 for more information. UBS AG-owned securities transferred to a borrower that is granted the right to sell or repledge those transferred securities are presented on the balance sheet as Trading portfolio assets, of which: assets pledged as collateral which may be sold or repledged by counterparties. Securities received in a borrowing transaction are disclosed as off-balance-sheet items if UBS AG has the right to resell or repledge them, with additional disclosure provided for securities that UBS AG has actually resold or repledged. The sale of securities which is settled by delivering securities received in a borrowing transaction generally triggers the recognition of a trading liability (short sale). Where securities are either received or delivered in lieu of cash (securities-for-securities transactions), neither the securities received or delivered nor the obligation to return or right to receive the securities are recognized on the balance sheet, as derecognition criteria are not met. Refer to item 5 for more information.
Interest is recognized in the income statement on an accrual basis and is recorded as Interest income or Interest expense. Interest income includes interest earned on securities borrowing, and negative interest, including fees, on securities lending. Interest expense includes interest on securities lent and negative interest, including fees, on securities borrowing.
® Refer to Notes 11, 25 and 26 for more information on securities borrowing and lending
14) Repurchase and reverse repurchase transactions
Securities purchased under agreements to resell (Reverse repurchase agreements) and securities sold under agreements to repurchase (Repurchase agreements) are treated as collateralized financing transactions. Nearly all reverse repurchase and repurchase agreements involve debt instruments, such as bonds, notes or money market paper. The transactions are normally conducted under standard agreements employed by financial market participants and are undertaken with counterparties subject to UBS AG’s normal credit risk control processes. UBS AG monitors on a daily basis the market value of the securities received or delivered and requests or provides additional collateral or returns or recalls surplus collateral in accordance with the underlying agreements.
In a reverse repurchase agreement, the cash delivered is derecognized and a corresponding receivable, including accrued interest, is recorded in the balance sheet line Reverse repurchase agreements, representing UBS AG’s right to receive the cash back. Similarly, in a repurchase agreement, the cash received is recognized and a corresponding obligation, including accrued interest, is recorded in the balance sheet line Repurchase agreements. Securities received under reverse repurchase agreements and securities delivered under repurchase agreements are not recognized on or derecognized from the balance sheet, unless the risks and rewards of ownership are transferred. UBS AG-owned securities transferred to a recipient who is granted the right to resell or repledge them are presented on the balance sheet as Trading portfolio assets, of which: assets
pledged as collateral which may be sold or repledged by counterparties. Securities received in reverse repurchase agreements are disclosed as off-balance-sheet items if UBS AG has the right to resell or repledge them, with additional disclosure provided for securities that UBS AG has actually resold or repledged (refer to Note 25d for more information). Additionally, the sale of securities which is settled by delivering securities received in reverse repurchase transactions generally triggers the recognition of a trading liability (short sale).
Consolidated financial statements
Notes to the UBS AG consolidated financial statements
Note 1 Summary of significant accounting policies (continued)
Interest is recognized in the income statement on an accrual basis and is recorded as Interest income or Interest expense. Interest income includes interest earned on reverse repurchase agreements and negative interest on repurchase agreements. Interest expense includes interest on repurchase agreements and negative interest on reverse repurchase agreements.
UBS AG generally offsets reverse repurchase agreements and repurchase agreements with the same counterparty, maturity, currency and Central Securities Depository (CSD) in accordance with the relevant accounting requirements. Refer to item 35 for more information.
® Refer to Notes 11, 25 and 26 for more information on repurchase and reverse repurchase transactions
15) Derivative instruments and hedge accounting
Derivative instruments that UBS AG enters into are initially recognized, and remain carried, at fair value. Fair value changes are generally recognized in the income statement unless and to the extent they are designated in hedge relationships which require recognition of the effective portion of such changes within other comprehensive income.
Derivative instruments are generally reported on the balance sheet as Positive replacement values or Negative replacement values. Exchange-traded derivatives that economically settle on a daily basis, and certain OTC derivatives that in substance net settle on a daily basis, are classified as Cash collateral receivables on derivative instruments or Cash collateral payables on derivative instruments. Products that receive this treatment include futures contracts, 100% daily margined exchange-traded options and interest rate swaps transacted with the London Clearing House. Changes in the fair value of derivative instruments are recorded in Net trading income, unless the derivatives are designated and effective as hedging instruments in certain types of hedge accounting relationships.
® Refer to Note 14 for more information on derivative instruments and hedge accounting
Hedge accounting
UBS AG uses derivative instruments as part of its risk management activities to manage exposures particularly to interest rate and foreign currency risks, including exposures arising from forecast transactions. If derivative and non-derivative instruments meet certain criteria specified below, they may be designated as hedging instruments in hedges of the change in fair value of recognized assets or liabilities (fair value hedges), hedges of the variability in future cash flows attributable to a recognized asset or liability or highly probable forecast transactions (cash flow hedges) or hedges of a net investment in a foreign operation (net investment hedges).
At the time a financial instrument is designated in a hedge relationship, UBS AG formally documents the relationship between the hedging instrument(s) and hedged item(s), including the risk management objectives and strategy in undertaking the hedge transaction and the methods that will be used to assess the effectiveness of the hedging relationship. Accordingly, UBS AG assesses, both at the inception of the hedge and on an ongoing basis, whether the hedging instruments, primarily derivatives, have been “highly effective” in offsetting changes in the fair value or cash flows associated with the designated risk of the hedged items. A hedge is considered highly effective if the following criteria are met: (i) at inception of the hedge and throughout its life, the hedge is expected to be highly effective in achieving offsetting changes in fair value or cash flows attributable to the hedged risk and (ii) actual results of the hedge are within a range of 80% to 125%. In the case of hedging forecast transactions, the transaction must have a high probability of occurring and must present an exposure to variations in cash flows that could ultimately affect the reported net profit or loss. UBS AG discontinues hedge accounting voluntarily, or when UBS AG determines that a hedging instrument is not, or has ceased to be, highly effective as a hedge, when the derivative expires or is sold, terminated or exercised, when the hedged item matures, is sold or repaid or when forecast transactions are no longer deemed highly probable.
Hedge ineffectiveness represents the amount by which the changes in the fair value of the hedging instrument differ from changes in the fair value of the hedged item attributable to the hedged risk, or the amount by which changes in the present value of future cash flows of the hedging instrument exceed changes in the present value of expected cash flows of the hedged item. Such ineffectiveness is recorded in current period earnings in Net trading income. Interest income and expense on derivatives designated as hedging instruments in effective hedge relationships is included in Interest income.
Fair value hedges
For qualifying fair value hedges, the change in the fair value of the hedging instrument is recognized in the income statement along with the change in the fair value of the hedged item that is attributable to the hedged risk. In fair value hedges of interest rate risk, the fair value change of the hedged item attributable to the hedged risk is reflected in the carrying value of the hedged item. If the hedge accounting relationship is terminated for reasons other than the derecognition of the hedged item, the difference between the carrying value of the hedged item at that point and the value at which it would have been carried had the hedge never existed (the unamortized fair value adjustment) is amortized to the income statement over the remaining term to maturity of the hedged item.
Note 1 Summary of significant accounting policies (continued)
For a portfolio hedge of interest rate risk, the equivalent change in fair value is reflected within Other assets or Other liabilities. If the hedge relationship is terminated for reasons other than the derecognition of the hedged item, the amount included in Other assets or Other liabilities is amortized to the income statement over the remaining term to maturity of the hedged items.
Cash flow hedges
Fair value gains or losses associated with the effective portion of derivatives designated as cash flow hedges for cash flow repricing risk are recognized initially in Other comprehensive income within Equity. When the hedged forecast cash flows affect profit or loss, the associated gains or losses on the hedging derivatives are reclassified from Equity to the income statement.
If a cash flow hedge of forecasted transactions is no longer considered effective, or if the hedge relationship is terminated, the cumulative gains or losses on the hedging derivatives previously reported in Equity remain there until the committed or forecasted transactions occur and affect profit or loss. If the forecasted transactions are no longer expected to occur, the deferred gains or losses are reclassified immediately to the income statement.
Hedges of net investments in foreign operations
Hedges of net investments in foreign operations are accounted for similarly to cash flow hedges. Gains or losses on the hedging instrument relating to the effective portion of the hedge are recognized directly in Equity (and presented in the statement of changes in equity and statement of comprehensive income under Foreign currency translation), while any gains or losses relating to the ineffective and / or undesignated portion (for example, the interest element of a forward contract) are recognized in the income statement. Upon disposal or partial disposal of the foreign operation, the cumulative value of any such gains or losses associated with the entity, and recognized directly in Equity, is reclassified to the income statement.
Economic hedges that do not qualify for hedge accounting
Derivative instruments that are transacted as economic hedges but do not qualify for hedge accounting are treated in the same way as derivative instruments used for trading purposes (i.e., realized and unrealized gains and losses are recognized in Net trading income), except for the forward points on certain short duration foreign exchange contracts, which are reported in Net interest income.
® Refer to Note 14 for more information on economic hedges
Embedded derivatives
Derivatives may be embedded in other financial instruments (host contracts). For example, they could be represented by the conversion feature embedded in a convertible bond. Such hybrid instruments arise predominantly from the issuance of certain structured debt instruments. An embedded derivative is generally required to be separated from the host contract and accounted for as a standalone derivative instrument at fair value through profit or loss if: (i) the host contract is not carried at fair value with changes in fair value reported in the income statement, (ii) the economic characteristics and risks of the embedded derivative are not closely related to the economic characteristics and risks of the host contract and (iii) the terms of the embedded derivative would meet the definition of a standalone derivative were they contained in a separate contract. Bifurcated embedded derivatives are presented on the same balance sheet line as the host contract, and are shown in Note 27a in the Held for trading category, reflecting the measurement and recognition principles applied.
Typically, UBS AG applies the fair value option to hybrid instruments (refer to item 8 for more information), in which case bifurcation of an embedded derivative component is not required.
16) Loan commitments
Loan commitments are defined amounts (unutilized credit lines or undrawn portions of credit lines) against which clients can borrow money under defined terms and conditions.
Loan commitments that can be cancelled at any time by UBS AG at its discretion, according to their general terms and conditions, are not recognized on the balance sheet and are not included in the off-balance-sheet disclosures. Upon a loan drawdown by the counterparty, the amount of the loan is accounted for in accordance with Loans and receivables. Refer to item 10 for more information.
Consolidated financial statements
Notes to the UBS AG consolidated financial statements
Note 1 Summary of significant accounting policies (continued)
Irrevocable loan commitments (where UBS AG has no right to withdraw the loan commitment once communicated to the beneficiary, or which are revocable only due to automatic cancellation upon deterioration in a borrower’s creditworthiness) are classified into the following categories:
– derivative loan commitments, being loan commitments that can be settled net in cash or by delivering or issuing another financial instrument, or loan commitments for which there is a past practice of selling those loans resulting from similar loan commitments before or shortly after origination;
– loan commitments designated at fair value through profit and loss (refer to item 8 for more information) and
– all other loan commitments. These are not recorded in the balance sheet, but a provision is recognized if it is probable that a loss has been incurred and a reliable estimate of the amount of the obligation can be made. Other loan commitments include irrevocable forward starting reverse repurchase and irrevocable securities borrowing agreements. Any change in the liability relating to these other loan commitments is recorded in the income statement in Credit loss expense / recovery. Refer to items 11 and 27 for more information.
17) Financial guarantee contracts
Financial guarantee contracts are contracts that require the issuer to make specified payments to reimburse the holder for an incurred loss because a specified debtor fails to make payments when due in accordance with the terms of a specified debt instrument. UBS AG issues such financial guarantees to banks, financial institutions and other parties on behalf of clients to secure loans, overdrafts and other banking facilities.
Certain written financial guarantees that are managed on a fair value basis are designated at fair value through profit or loss. Refer to item 8 for more information. Financial guarantees that are not managed on a fair value basis are initially recognized in the financial statements at fair value. Subsequent to initial recognition, these financial guarantees are measured at the higher of the amount initially recognized less cumulative amortization, and to the extent a payment under the guarantee has become probable, the present value of the expected payment. Any change in the liability relating to probable expected payments resulting from guarantees is recorded in the income statement in Credit loss expense / recovery.
18) Cash and cash equivalents
For the purposes of the statement of cash flows, cash and cash equivalents comprise balances with an original maturity of three months or less including cash, money market paper and balances with central and other banks.
19) Physical commodities
Physical commodities (precious metals, base metals and other commodities) held by UBS AG as a result of its broker-trader activities are accounted for at fair value less costs to sell and recognized within Trading portfolio assets. Changes in fair value less costs to sell are recorded in Net trading income.
20) Property, equipment and software
Property, equipment and software includes own-used properties, leasehold improvements, information technology hardware, externally purchased and internally generated software and communication and other similar equipment. All Property, equipment and software is carried at cost (which includes capitalized interest from associated borrowings, where applicable), less accumulated depreciation and impairment losses, and is reviewed periodically for impairment.
® Refer to Note 16 for more information on property and equipment
Leasehold improvements
Leasehold improvements are investments made to customize buildings and offices occupied under operating lease contracts to make them suitable for their intended purpose. The present value of estimated reinstatement costs required to bring a leased property back into its original condition at the end of the lease is capitalized as part of total leasehold improvements with a corresponding liability recognized to reflect the obligation incurred.
Note 1 Summary of significant accounting policies (continued)
Reinstatement costs are recognized in the income statement through depreciation of the capitalized leasehold improvements over their estimated useful lives and the resulting liability is extinguished as cash payments are made.
Property held for sale
Where UBS AG has decided to sell non-current assets such as property or equipment and the sale of these assets is highly probable to occur within 12 months, these assets are classified as non-current assets held for sale and are reclassified to Other assets. Upon classification as held for sale, they are no longer depreciated and are carried at the lower of book value or fair value less cost to sell.
Software
Software development costs are capitalized only when the costs can be measured reliably and it is probable that future economic benefits will arise.
Estimated useful life of property, equipment and software
An asset within property, equipment and software is depreciated on a straight-line basis over its estimated useful life. Depreciation of an asset within property, equipment and software begins when it is available for use; that is, when it is in the location and condition necessary for it to be capable of operating in the manner intended by management.
Estimated useful life of property, equipment and software
Properties, excluding land | Not exceeding 67 years |
Leasehold improvements | Residual lease term |
Other machines and equipment | Not exceeding 10 years |
IT hardware and communication equipment | Not exceeding 5 years |
Software | Not exceeding 10 years |
21) Goodwill and intangible assets
Goodwill represents the excess of the cost of an acquisition over the fair value of UBS AG’s share of net identifiable assets of the acquired entity at the date of acquisition. Goodwill is not amortized. It is tested annually for impairment and, additionally, when an indication of impairment exists at the end of each reporting period. For goodwill impairment testing purposes, UBS AG considers the segments reported in Note 2a as separate cash-generating units, since this is the level at which the performance of investments is reviewed and assessed by management. The recoverable amount of a segment is determined on the basis of its value-in-use.
Intangible assets are comprised of separately identifiable intangible items arising from business combinations and certain purchased trademarks and similar items. Intangible assets are recognized at cost. The cost of an intangible asset acquired in a business combination is its fair value at the date of acquisition. Intangible assets with a definite useful life are amortized using the straight-line method over their estimated useful life, generally not exceeding 20 years. Intangible assets with an indefinite useful life are not amortized. In nearly all cases, identified intangible assets have a definite useful life. At each balance sheet date, intangible assets are reviewed for indications of impairment. If such indications exist, the intangible assets are analyzed to assess whether their carrying amount is fully recoverable. An impairment loss is recognized if the carrying amount exceeds the recoverable amount.
Intangible assets are classified into two categories: (i) infrastructure and (ii) customer relationships, contractual rights and other. Infrastructure consists of a branch network intangible asset recognized in connection with the acquisition of PaineWebber Group, Inc. Client relationships, contractual rights and other includes mainly intangible assets for client relationships, non-compete agreements, favorable contracts, trademarks and trade names acquired in business combinations.
® Refer to Note 17 for more information on goodwill and intangible assets
22) Income taxes
Income tax payable on profits is recognized as an expense based on the applicable tax laws in each jurisdiction in the period in which profits arise. The tax effects of income tax losses available for carry forward are recognized as a deferred tax asset if it is probable that future taxable profit (based on profit forecast assumptions) will be available against which those losses can be utilized.
Deferred tax assets are recognized for temporary differences that will result in deductible amounts in future periods, but only to the extent that it is probable that sufficient taxable profits will be available against which these differences can be utilized. Deferred tax liabilities are recognized for temporary differences between the carrying amounts of assets and liabilities in the balance sheet that reflect the expectation that certain items will give rise to taxable income in future periods. Deferred tax assets and liabilities are measured at the tax rates that are expected to apply in the period in which the asset will be realized or the liability will be settled.
Deferred and current tax assets and liabilities are offset when they arise from the same tax reporting group, they relate to the same tax authority, the legal right to offset exists, and they are intended to be settled net or realized simultaneously.
Consolidated financial statements
Notes to the UBS AG consolidated financial statements
Note 1 Summary of significant accounting policies (continued)
Current and deferred taxes are recognized as income tax benefit or expense in the income statement except for current and deferred taxes recognized (i) upon the acquisition of a subsidiary, (ii) for unrealized gains or losses on financial investments that are classified as available-for-sale, for changes in fair value of derivative instruments designated as cash flow hedges, for remeasurements of defined benefit plans, and for certain foreign currency translations of foreign operations, and (iii) for gains and losses on the sale of treasury shares. Deferred taxes recognized in a business combination (point (i)) are considered when determining goodwill. Amounts relating to points (ii) and (iii) are recognized in Other comprehensive income within Equity.
® Refer to Note 8 for more information on income taxes
23) Debt issued
Debt issued is carried at amortized cost. In cases where there is a legal mechanism for write-down or conversion into equity (as is the case for instance with senior unsecured debt issued by UBS AG that is subject to write-down or conversion under resolution authority granted to FINMA under Swiss law) this is not part of the contractual terms, and, therefore, it does not affect the amortized cost accounting treatment applied to these instruments. If the debt were to be written down or converted into equity in a future period, this would result in the full or partial derecognition of the financial liabilities, with the difference between the carrying value of the debt written down or converted into equity and the fair value of any equity shares issued recognized in the income statement.
In cases where, as part of UBS AG’s risk management activity, fair value hedge accounting is applied to fixed-rate debt instruments carried at amortized cost, their carrying amount is adjusted for changes in fair value related to the hedged exposure. Refer to item 15 for more information on hedge accounting. In most cases, structured notes issued are designated at fair value through profit or loss using the fair value option, on the basis that they are managed on a fair value basis, that the structured notes contain an embedded derivative, or both. Refer to item 8 for more information on the fair value option. The fair value option is not applied to certain structured notes that contain embedded derivatives that reference foreign exchange rates and / or precious metal prices. For these instruments, the embedded derivative component is measured on a fair value basis and the related underlying debt host component is measured on an amortized cost basis, with both components presented together within Debt issued. Refer to item 15 for more information on embedded derivatives.
Debt issued and subsequently repurchased in relation to market-making or other activities is treated as redeemed. A gain or loss on redemption (depending on whether the repurchase price of the bond is lower or higher than its carrying value) is recorded in Other income. A subsequent sale of own bonds in the market is treated as a reissuance of debt. Interest expense on debt instruments measured at amortized cost is included in Interest on debt issued.
® Refer to Note 21 for more information on debt issued
24) Pension and other post-employment benefit plans
UBS AG sponsors a number of post-employment benefit plans for its employees worldwide, which include defined benefit and defined contribution pension plans, and other post-employment benefits such as medical and life insurance benefits that are payable after the completion of employment. The major defined benefit pension plans are located in Switzerland, the UK, the US and Germany.
® Refer to Note 28 for more information on pension and other post-employment benefit plans
Defined benefit pension plans
Defined benefit pension plans specify an amount of benefit that an employee will receive, which is usually dependent on one or more factors such as age, years of service and compensation. The defined benefit liability recognized in the balance sheet is the present value of the defined benefit obligation less the fair value of the plan assets at the balance sheet date. If the fair value of the plan assets is higher than the present value of the defined benefit obligation, the recognition of the resulting net defined benefit asset is limited to the present value of economic benefits available in the form of refunds from the plan or reductions in future contributions to the plan. UBS AG applies the projected unit credit method to determine the present value of its defined benefit obligations, the related current service cost and, where applicable, past service cost. These amounts, which take into account the specific features of each plan, including risk sharing between the employee and employer, are calculated periodically by independent qualified actuaries.
Defined contribution plans
A defined contribution plan is a pension plan under which UBS AG pays fixed contributions into a separate entity from which post-employment and other benefits are paid. UBS AG has no legal or constructive obligation to pay further contributions if the plan does not hold sufficient assets to pay employees the benefits relating to employee service in the current and prior periods. UBS AG’s contributions are expensed when the employees have rendered services in exchange for such contributions. This is generally in the year of contribution. Prepaid contributions are recognized as an asset to the extent that a cash refund or a reduction in future payments is available.
Other post-retirement benefits
UBS AG also provides post-retirement medical and life insurance benefits to certain retirees in the US and the UK. The expected costs of these benefits are recognized over the period of employment using the same accounting methodology used for defined benefit pension plans.
Note 1 Summary of significant accounting policies (continued)
25) Equity participation and other compensation plans
Transfer of deferred compensation plans
As part of the Group reorganization in 2014, UBS Group AG assumed obligations of UBS AG as grantor in connection with certain outstanding awards under employee share, option, notional fund and deferred cash compensation plans. This section separately describes the accounting policies applied to these plans during the periods prior to and post the Group reorganization and transfer of deferred compensation plans.
Periods prior to the Group reorganization and transfer of deferred compensation plans
Equity participation plans
UBS AG has established several equity participation plans which include mandatory, discretionary and voluntary plans. UBS AG recognizes the fair value of awards granted under these plans, determined at the date of grant, as compensation expense, over the period during which the employee is required to provide services in order to earn the award.
If the employee is not required to provide future services, such as for awards granted to employees who are retirement eligible, including those employees who meet full career retirement criteria, compensation expense is recognized on or prior to the grant date. Such awards may remain forfeitable until the legal vesting date if certain non-vesting conditions are not met. Forfeiture events resulting from breach of a non-vesting condition do not result in a reversal of compensation expense.
If future service is required, compensation expense is recognized over that future period. For awards that are delivered in tranches, each tranche is considered a separate award and amortized separately. Plans may contain provisions that shorten the required service period due to achievement of retirement eligibility or upon termination due to redundancy. In such instances, compensation expense is recognized over the period from grant date to the retirement eligibility or redundancy date. Forfeiture of these awards that occurs during the service period results in a reversal of compensation expense.
Awards settled in UBS AG shares or options are classified as equity settled. The fair value of an equity-settled award is determined at the date of grant and is not subsequently remeasured, unless its terms are modified such that the fair value immediately after modification exceeds the fair value immediately prior to modification. Any increase in fair value resulting from a modification is recognized as compensation expense, either over the remaining service period or, for vested awards, immediately.
Cash-settled awards are classified as liabilities and are remeasured to fair value at each balance sheet date as long as the award is outstanding. Changes in fair value are reflected in compensation expense and, on a cumulative basis, no compensation expense is recognized for awards that expire worthless or remain unexercised.
® Refer to Note 29 for more information on equity participation plans
Other compensation plans
UBS AG has established other fixed and variable deferred compensation plans, the values of which are not linked to UBS AG’s own equity. Deferred cash compensation plans are either mandatory or discretionary plans and include awards based on a notional cash amount, where ultimate payout is fixed or may vary based on achievement of performance conditions or the value of specified underlying assets. Compensation expense is recognized over the period that the employee is required to provide services to earn the award. If the employee is not required to provide future services, such as for awards granted to employees who are retirement eligible, including those employees who meet full career retirement criteria, compensation expense is recognized on or prior to the grant date. The amount recognized during the service period is based on an estimate of the amount expected to be paid out under the plan, such that cumulative expense recognized ultimately equals the cash distributed to employees. For awards in the form of alternative investment vehicles or similar structures, which provide employees with a payout based on the value of specified underlying assets, the initial value is based on the fair value at the grant date of the underlying assets (e.g., money market funds, UBS and non-UBS mutual funds and other UBS-sponsored funds). These awards are remeasured at each reporting date based on the fair value of the underlying assets until the award is distributed. Changes in value are recognized proportionately to the elapsed service period. Forfeiture of these awards results in the reversal of compensation expense.
® Refer to Note 29 for more information on other compensation plans
Periods post the Group reorganization and transfer of deferred compensation plans
Equity participation plans
UBS Group AG has established, and maintains the obligation to settle, several equity participation plans which are granted to employees of UBS AG. UBS Group AG’s equity participation plans include mandatory, discretionary and voluntary plans. UBS AG recognizes the fair value of awards granted to its employees, determined at the grant date, over the period that the employee is required to provide services in order to earn the award.
Consolidated financial statements
Notes to the UBS AG consolidated financial statements
Note 1 Summary of significant accounting policies (continued)
If the employee is not required to provide future services, such as for awards granted to employees who are retirement eligible, including those employees who meet full career retirement criteria, compensation expense is recognized on or prior to the grant date. Such awards may remain forfeitable until the legal vesting date if certain non-vesting conditions are not met. Forfeiture events resulting from breach of a non-vesting condition do not result in a reversal of compensation expense.
If future service is required, compensation expense is recognized over that future period. For awards that are delivered in tranches, each tranche is considered a separate award and amortized separately. Plans may contain provisions that shorten the required service period due to achievement of retirement eligibility or upon termination due to redundancy. In such instances, compensation expense is recognized over the period from grant date to the retirement eligibility or redundancy date. Forfeiture of these awards that occurs during the service period results in a reversal of compensation expense.
UBS AG has no obligation to settle the awards and therefore awards over UBS Group AG shares are classified as equity settled share-based payment transactions. The fair value of an equity-settled award is determined at the date of grant and is not subsequently remeasured, unless its terms are modified such that the fair value immediately after modification exceeds the fair value immediately prior to modification. Any increase in fair value resulting from a modification is recognized as compensation expense, either over the remaining service period or, for vested awards, immediately.
® Refer to Note 29 for more information on equity participation plans
Other compensation plans
UBS Group AG has established other fixed and variable deferred compensation plans, the values of which are not linked to UBS Group AG’s or UBS AG’s own equity. Deferred cash compensation plans are either mandatory or discretionary plans and include awards based on a notional cash amount, where ultimate payout is fixed or may vary based on achievement of performance conditions or the value of specified underlying assets. Compensation expense is recognized over the period that the employee is required to provide services to earn the award. If the employee is not required to provide future services, such as for awards granted to employees who are retirement eligible, including those employees who meet full career retirement criteria, compensation expense is recognized on or prior to the grant date. The amount recognized during the service period is based on an estimate of the amount expected to be paid out under the plan, such that cumulative expense recognized ultimately equals the cash distributed to employees. For awards in the form of alternative investment vehicles or similar structures, which provide employees with a payout based on the value of specified underlying assets, the initial value is based on the fair value of the underlying assets (e.g., money market funds, UBS and non-UBS mutual funds and other UBS-sponsored funds). These awards are remeasured at each reporting date based on the fair value of the underlying assets until the award is distributed. Changes in value are recognized proportionately to the elapsed service period. Forfeiture of these awards results in the reversal of compensation expense.
® Refer to Note 29 for more information on other compensation plans
26) Amounts due under unit-linked investment contracts
Financial liabilities from unit-linked investment contracts are presented as Other liabilities on the balance sheet. These contracts allow investors to invest in a pool of assets through issued investment units. The unit holders receive all rewards and bear all risks associated with the reference asset pool. The financial liability represents the amounts due to unit holders and is equal to the fair value of the reference asset pool. Assets held under unit-linked investment contracts are presented as Trading portfolio assets.
® Refer to Notes 13 and 23 for more information on unit-linked investment contracts
27) Provisions
Provisions are liabilities of uncertain timing or amount, and are recognized when UBS AG has a present obligation as a result of a past event, it is probable that an outflow of resources will be required to settle the obligation, and a reliable estimate of the amount of the obligation can be made.
The majority of UBS AG’s provisions relate to litigation, regulatory and similar matters, restructuring, employee benefits, real estate and loan commitments and guarantees. Provisions that are similar in nature are aggregated to form a class, while the remaining provisions, including those of less significant amounts are presented under Other provisions. Provisions are presented separately on the balance sheet and, when they are no longer considered uncertain in timing or amount, are reclassified to Other liabilities – Other.
Note 1 Summary of significant accounting policies (continued)
UBS AG recognizes provisions for litigation, regulatory and similar matters when, in the opinion of management after seeking legal advice, it is more likely than not that UBS AG has a present legal or constructive obligation as a result of past events, it is probable that an outflow of resources will be required, and the amount can be reliably estimated. Where these factors are otherwise satisfied, a provision may be established for claims that have not yet been asserted against UBS AG, but are nevertheless expected to be, based on the experience of UBS AG with similar asserted claims.
Restructuring provisions are recognized when a detailed and formal restructuring plan has been approved and a valid expectation has been raised that the restructuring will be carried out, either through commencement of the plan or announcements to affected employees.
Provisions are recognized for lease contracts if the unavoidable costs of a contract exceed the benefits expected to be received under it (onerous lease contracts). For example, this may occur when a significant portion of a leased property is expected to be vacant for an extended period.
Provisions for employee benefits are recognized mainly in respect of service anniversaries and sabbatical leave.
Provisions are recognized at the best estimate of the consideration required to settle the present obligation at the balance sheet date. Such estimates are based on all available information and are revised over time as more information becomes available. If the effect of the time value of money is material, provisions are discounted and measured at the present value of the expenditure expected to settle or discharge the obligation, using a rate that reflects the current market assessments of the time value of money and the risks specific to the obligation.
A provision is not recognized when UBS AG has a present obligation that has arisen from past events but it is not probable that an outflow of resources will be required to settle it, or a sufficiently reliable estimate of the amount of the obligation cannot be made. Instead, a contingent liability is disclosed, unless the likelihood of an outflow of resources is remote. Contingent liabilities are also disclosed for possible obligations that arise from past events whose existence will be confirmed only by uncertain future events not wholly within the control of UBS AG.
® Refer to Note 22 for more information on provisions
28) Equity, treasury shares and contracts on UBS AG shares
Non-controlling interests and preferred noteholders
Net profit and Equity are presented including non-controlling interests and preferred noteholders. Net profit is split into Net profit attributable to UBS AG shareholders, Net profit attributable to non-controlling interests and Net profit attributable to preferred noteholders. Equity is split into Equity attributable to UBS AG shareholders, Equity attributable to non-controlling interests and Equity attributable to preferred noteholders.
UBS AG shares held (treasury shares)
UBS AG shares held by UBS AG are presented in Equity as Treasury shares at their acquisition cost, which includes transaction costs. Treasury shares are deducted from Equity until they are cancelled or reissued. The difference between the proceeds from sales of treasury shares and their weighted average cost (net of tax, if any) is reported as Share premium.
Preferred notes issued to non-consolidated preferred securities entities
UBS AG issued subordinated notes (that is, the preferred notes) to certain non-consolidated entities that issued preferred securities. UBS AG has fully and unconditionally guaranteed all contractual payments on the preferred securities. UBS AG’s obligations under these guarantees are subordinated to the full prior payment of the deposit liabilities of UBS AG and all other liabilities of UBS AG. The preferred notes do not contain a contractual obligation to deliver cash and, therefore, they are classified as equity instruments. They are presented as Equity attributable to preferred noteholders on the consolidated balance sheet and statement of changes in equity. Distributions on these preferred notes are presented as Net profit attributable to preferred noteholders in the consolidated income statement and statement of comprehensive income.
Net cash settlement contracts
Prior to the share-for-share exchange, UBS AG issued contracts on own shares that required net cash settlement, or provided the counterparty or UBS AG with a settlement option which included a choice of settling net in cash. These contracts were classified as held for trading, with changes in fair value reported in the income statement as Net trading income.
Following the share-for-share exchange, these contracts continue to be accounted for in the same manner, however, they are no longer classified as contracts on own shares.
Consolidated financial statements
Notes to the UBS AG consolidated financial statements
Note 1 Summary of significant accounting policies (continued)
29) Non-current assets and disposal groups held for sale
UBS AG classifies individual non-current assets and disposal groups as held for sale if such assets or disposal groups are available for immediate sale in their present condition subject to terms that are usual and customary for sales of such assets or disposal groups and their sale is considered highly probable. For a sale to be highly probable, management must be committed to a plan to sell such assets and must be actively looking for a buyer. Furthermore, the assets must be actively marketed at a reasonable sales price in relation to their fair value and the sale must be expected to be completed within one year. Assets held for sale and disposal groups are measured at the lower of their carrying amount and fair value less costs to sell and are presented in Other assets and Other liabilities. Non-current assets and liabilities of subsidiaries are classified as held for sale if their carrying amount will be recovered principally through a sale transaction rather than through continuing use.
® Refer to Notes 18 and 23 for more information on non-current assets and disposal groups held for sale
30) Leasing
UBS AG enters into lease contracts, or contracts that include lease components, predominantly of premises and equipment, and primarily as lessee. Leases that transfer substantially all the risks and rewards, but not necessarily legal title in the underlying assets, are classified as finance leases. All other leases are classified as operating leases.
Assets leased pursuant to finance leases are recognized on the balance sheet as Property and equipment and are depreciated over the lesser of the useful life of the asset or the lease term, with corresponding amounts payable included in Due to banks / customers. Finance charges payable are recognized in Net interest income over the period of the lease based on the interest rate implicit in the lease on the basis of a constant yield.
Lease contracts classified as operating leases where UBS AG is the lessee are disclosed in Note 33. These contracts include non-cancellable long-term leases of office buildings in most UBS AG locations. Operating lease rentals payable are recognized as an expense on a straight-line basis over the lease term, which commences with control of the physical use of the property. Lease incentives are treated as a reduction of rental expense and are recognized on a consistent basis over the lease term.
Where UBS AG acts as lessor under a finance lease, a receivable is recognized in Loans at an amount equal to the present value of the aggregate of the minimum lease payments plus any unguaranteed residual value that UBS AG expects to recover at the end of the lease term. Initial direct costs are also included in the initial measurement of the lease receivable. Lease payments received during the lease term are allocated to repayment of the outstanding receivable and interest income to reflect a constant periodic rate of return on UBS AG’s net investment using the interest rate implicit in the lease. UBS AG reviews the estimated unguaranteed residual value annually and if the estimated residual value to be realized is less than the amount assumed at lease inception, a loss is recognized for the expected shortfall.
Certain arrangements do not take the legal form of a lease but convey a right to use an asset in return for a payment or series of payments. For such arrangements, UBS AG determines at the inception of the arrangement whether the fulfillment of the arrangement is dependent on the use of a specific asset or assets and, if so, the arrangement is accounted for as a lease.
® Refer to Note 33 for more information on operating leases and finance leases
31) Fee income
UBS AG earns fee income from a diverse range of services it provides to its clients. Fee income can be divided into two broad categories: fees earned from services that are provided over a certain period of time (for example, investment fund fees, portfolio management and advisory fees) and fees earned from providing transaction-type services (for example, underwriting fees, corporate finance fees and brokerage fees). Fees earned from services that are provided over a certain period of time are recognized ratably over the service period, with the exception of performance-linked fees or fee components with specific performance criteria. Such fees are recognized when the performance criteria are fulfilled and when collectability is reasonably assured. Fees earned from providing transaction-type services are recognized when the service has been completed. Generally, fees are presented in the income statement in line with the balance sheet classification of the underlying instruments.
Note 1 Summary of significant accounting policies (continued)
With respect to loan commitment fees on lending arrangements where there is an initial expectation that the facility will be drawn down, such fees are deferred until the loan is drawn down and are then recognized as an adjustment to the effective yield over the life of the loan. If the commitment expires and the loan is not drawn down, the fees are recognized as revenue when the commitment expires. Where the initial expectation is that the facility is unlikely to be drawn down, the loan commitment fees are recognized on a straight-line basis over the commitment period. If, in such cases, the facility is ultimately drawn down, the unamortized component of the loan commitment fees is amortized as an adjustment to the effective yield over the life of the loan.
® Refer to Note 4 for more information on net fee and commission income
32) Foreign currency translation
Transactions denominated in foreign currency are translated into the functional currency of the reporting unit at the spot exchange rate on the date of the transaction. At the balance sheet date, all monetary assets and liabilities denominated in foreign currency are translated to the functional currency using the closing exchange rate. Non-monetary items measured at historical cost are translated at the exchange rate on the date of the transaction. Foreign currency translation differences on financial investments classified as available-for-sale are generally recorded directly in Equity until the asset is sold or becomes impaired. However, translation differences on available-for-sale monetary financial investments are reported in Net trading income, along with all other foreign currency translation differences on monetary assets and liabilities.
Upon consolidation, assets and liabilities of foreign operations are translated into Swiss francs (CHF), UBS AG’s presentation currency, at the closing exchange rate on the balance sheet date, and income and expense items are translated at the average rate for the period. The resulting foreign currency translation differences attributable to UBS AG shareholders are recognized directly in Foreign currency translation within Equity which forms part of Total equity attributable to UBS AG shareholders, whereas the foreign currency translation differences attributable to non-controlling interests are shown within Equity attributable to non-controlling interests.
When a foreign operation is disposed or partially disposed of, the cumulative amount in Foreign currency translation within Equity related to that foreign operation is reclassified to the income statement as part of the gain or loss on disposal. When UBS AG disposes of a portion of its interest in a subsidiary that includes a foreign operation but retains control, the related portion of the cumulative currency translation balance is reclassified to Equity attributable to non-controlling interests. When UBS AG disposes of a portion of its investment in an associate or joint venture that includes a foreign operation while retaining significant influence or joint control, the related portion of the cumulative currency translation balance is reclassified to the income statement.
® Refer to Note 36 for more information on currency translation rates
33) Earnings per share (EPS)
During 2015, UBS AG shares were delisted from the SIX and the NYSE. As of 31 December 2015, 100% of UBS AG's issued shares were held by UBS Group AG and therefore were not publicly traded. Accordingly, earnings per share information is not provided for UBS AG.
34) Segment reporting
UBS AG’s businesses are organized globally into five business divisions: Wealth Management, Wealth Management Americas, Personal & Corporate Banking, Asset Management and the Investment Bank, supported by the Corporate Center. The five business divisions qualify as reportable segments for the purpose of segment reporting and, together with the Corporate Center and its components, reflect the management structure of UBS AG. Additionally, the non-core activities and legacy positions formerly in the Investment Bank are managed and reported as a separate reportable segment within the Corporate Center as Non-core and Legacy Portfolio. Financial information about the five business divisions and the Corporate Center (with its components) is presented separately in internal management reports to the Group Executive Board, which is considered the “chief operating decision maker” within the context of IFRS 8 Operating Segments.
Consolidated financial statements
Notes to the UBS AG consolidated financial statements
Note 1 Summary of significant accounting policies (continued)
UBS AG’s internal accounting policies, which include management accounting policies and service level agreements, determine the revenues and expenses directly attributable to each reportable segment. Internal charges and transfer pricing adjustments are reflected in operating results of the reportable segments. Transactions between the reportable segments are carried out at internally agreed rates and are also reflected in the operating results of the reportable segments. Revenue-sharing agreements are used to allocate external client revenues to reportable segments where several reportable segments are involved in the value-creation chain. Commissions are credited to the reportable segments based on the corresponding client relationship. Net interest income is generally allocated to the reportable segments based on their balance sheet positions. Interest income earned from managing UBS AG’s consolidated equity is allocated to the reportable segments based on average attributed equity. Own credit gains and losses on financial liabilities designated at fair value are excluded from the measurement of performance of the business divisions, are considered reconciling differences to UBS AG results and are reported collectively under Corporate Center – Group Asset and Liability Management (Group ALM).
Assets and liabilities of the reportable segments are funded through and invested with Corporate Center – Group Asset and Liability Management, and the net interest margin is reflected in the results of each reportable segment. Total intersegment revenues for UBS AG are immaterial as the majority of the revenues are allocated across the segments by means of revenue-sharing agreements.
Segment balance sheet assets are based on a third-party view and do not include intercompany balances. This view is in line with internal reporting to management. Certain assets managed centrally by Corporate Center – Services and Corporate Center – Group Asset and Liability Management (including property and equipment and certain financial assets) may be allocated to the segments on a basis different to that which the corresponding costs and / or revenues are allocated. For example, certain assets that are reported in Corporate Center – Services or Corporate Center – Group Asset and Liability Management may be retained on the balance sheets of these components of Corporate Center notwithstanding that the costs and / or revenues associated with these assets may be entirely or partially allocated to the segments. Similarly, certain assets are reported in the business divisions, whereas the corresponding costs and / or revenues are entirely or partially allocated to Corporate Center – Services and Corporate Center – Group Asset and Liability Management.
For the purpose of segment reporting under IFRS 8, non-current assets consist of investments in associates and joint ventures, goodwill, other intangible assets and property, equipment and software.
® Refer to Note 2 for more information on segment reporting
35) Netting
UBS AG nets financial assets and liabilities on its balance sheet if it has the unconditional and legally enforceable right to set-off the recognized amounts, both in the normal course of business and in the event of default, bankruptcy or insolvency of the entity and all of the counterparties, and intends either to settle on a net basis, or to realize the asset and settle the liability simultaneously. Netted positions include, for example, over-the-counter interest rate swaps transacted with the London Clearing House, netted by currency and across maturity dates, and repurchase and reverse repurchase transactions entered into with both the London Clearing House and the Fixed Income Clearing Corporation, netted by counterparty, currency, central securities depository and maturity, as well as transactions with various other counterparties, exchanges and clearing houses.
In assessing whether UBS AG intends to either settle on a net basis, or to realize the asset and settle the liability simultaneously, emphasis is placed on the effectiveness of operational settlement mechanics in eliminating substantially all credit and liquidity exposure between the counterparties. This condition precludes offsetting on the balance sheet for substantial amounts of UBS AG’s financial assets and liabilities, even though they may be subject to enforceable netting arrangements. For derivative contracts, balance sheet offsetting is generally only permitted in circumstances in which a market settlement mechanism exists via an exchange or clearing house that effectively accomplishes net settlement through a daily cash margining process. For repurchase arrangements and securities financings, balance sheet offsetting may be permitted only to the extent that the settlement mechanism eliminates or results in insignificant credit and liquidity risk.
® Refer to Note 26 for more information on offsetting financial assets and financial liabilities
36) Negative interest
Negative interest income arising on a financial asset does not meet the definition of interest income and therefore negative interest on financial assets and negative interest on financial liabilities is presented within Interest expense and Interest income respectively.
® Refer to Note 3 for more information on interest income and interest expense
Note 1 Summary of significant accounting policies (continued)
b) Changes in accounting policies, comparability and other adjustments
Statement of cash flows – definition of cash and cash equivalents
In 2015, UBS AG refined its definition of cash and cash equivalents presented in the statement of cash flows to exclude cash collateral receivables on derivative instruments with bank counterparties. The refined definition is consistent with the treatment of these receivables in UBS AG’s liquidity and funding management framework and with liquidity and funding regulations, which became effective in 2015, and is considered to result in the presentation of more relevant information.
Comparative period information was restated accordingly. As a result, cash and cash equivalents as of 31 December 2014, 31 December 2013 and 31 December 2012 were reduced by CHF 10,265 million, CHF 8,982 million and CHF 12,393 million, respectively. On a restated basis, cash flow from operating activities for the year ended 31 December 2014 decreased by CHF 1,195 million (2013: increase by CHF 3,415 million) and the gain from effects of exchange rate differences on cash and cash equivalents decreased by CHF 89 million for the same period (2013: loss from currency effects increased by CHF 3 million).
Review of actuarial assumptions used in calculating defined benefit obligations
UBS AG regularly reviews the actuarial assumptions used in calculating its defined benefit obligations to determine their continuing relevance.
In 2015, UBS AG carried out a methodology review of the actuarial assumptions used in calculating its defined benefit obligation for its Swiss pension plan. As a result, UBS AG enhanced its methodology for estimating the discount rate by improving the construction of the yield curve where the market for long tenor maturities of Swiss high-quality corporate bonds was not sufficiently deep. Furthermore, UBS AG refined its approach to estimating the rate of salary increases, the rate of interest credit on retirement savings, the employee turnover rate, the rate of employee disabilities and the rate of marriage. These improvements in estimates resulted in a total net decrease in the defined benefit obligation (DBO) of the Swiss pension plan of CHF 2.1 billion, of which CHF 1.0 billion related to demographic assumptions and CHF 1.0 billion related to financial assumptions, and a corresponding increase in Other comprehensive income.
Furthermore, UBS AG enhanced methodologies and refined approaches used to estimate various actuarial assumptions for its UK and other pension plans. These improvements in estimates resulted in a total net decrease in the DBO of the UK pension plan of CHF 0.2 billion, of which CHF 0.1 billion related to demographic assumptions and CHF 0.1 billion related to financial assumptions, and a corresponding increase in Other comprehensive income.
Valuation methodology for the own credit component of financial liabilities designated at fair value
In 2015, UBS AG made enhancements to its valuation methodology for the own credit component of fair value of financial liabilities designated at fair value. Prior to the fourth quarter of 2015, own credit was estimated using a funds transfer pricing curve (FTP), which was derived by discounting UBS Group AG (consolidated) new issuance senior debt curve spreads, with the discount primarily reflecting the differences between the spreads in the senior unsecured debt market for UBS Group AG (consolidated) debt and the levels at which UBS Group AG (consolidated) medium-term notes (MTN) were issued. A decline in long-dated UBS Group AG (consolidated) MTN issuance volumes, following UBS Group AG’s (consolidated) business transformation, resulted in a reduction in the observable market data available to benchmark the FTP. From the fourth quarter of 2015 onwards, own credit is estimated using an own credit adjustment curve (OCA), which incorporates more observable market data, including market-observed secondary prices for UBS Group AG (consolidated) senior debt, UBS Group AG (consolidated) credit default swap (CDS) spreads and senior debt curves of peers. This change in accounting estimate was finalized in the fourth quarter of 2015, following a multi-period implementation project to develop an enhanced fair value approach supported by related infrastructure enhancements. The change was implemented on a prospective basis in the fourth quarter of 2015 and resulted in a gain of CHF 260 million on a total carrying amount of CHF 63 billion in financial liabilities designated at fair value.
Consolidated financial statements
Notes to the UBS AG consolidated financial statements
Note 1 Summary of significant accounting policies (continued)
Additionally, UBS AG will early adopt the own credit presentation requirements of IFRS 9 in the first quarter of 2016. No restatement of prior periods is required. Under IFRS 9, changes in the fair value of financial liabilities designated at fair value through profit and loss related to own credit will be recognized in Other comprehensive income and will not be reclassified to the income statement. UBS AG will adopt the other requirements of IFRS 9 (classification and measurement, impairment and hedge accounting) as of the mandatory effective date in 2018.
Global Asset Management renamed Asset Management
During 2015, the business division Global Asset Management was renamed Asset Management. This change is reflected throughout this report.
Retail & Corporate renamed Personal & Corporate Banking
Effective 2016, the business division Retail & Corporate has been renamed Personal & Corporate Banking. This change is reflected throughout this report.
New structure of the Corporate Center
As of 1 January 2015, Corporate Center – Core Functions was reorganized into two new units, Corporate Center – Services and Corporate Center – Group Asset and Liability Management (Group ALM). Therefore, UBS AG now reports: (i) Corporate Center – Services, (ii) Corporate Center – Group ALM and (iii) Corporate Center – Non-Core and Legacy Portfolio separately, which enhances the transparency on Corporate Center activities.
Group ALM is responsible for centrally managing UBS AG’s liquidity and funding position, as well as providing other balance sheet and capital management services to UBS AG. Most of the income generated and expenses incurred by Group ALM from these activities continues to be allocated to the business divisions and other Corporate Center units. Additional transparency on revenue allocations from Group ALM to business divisions and other Corporate Center units is provided in Note 2. Own credit gains and losses on financial liabilities designated at fair value are presented in Group ALM.
Corporate Center – Services includes UBS AG’s central control functions and all logistics and support functions serving the business divisions and other Corporate Center units. Most of the expenses of Corporate Center – Services are allocated to the business divisions and other Corporate Center units.
® Refer to Note 2 for more information
Service and personnel allocations from Corporate Center –Services to business divisions and other Corporate Center units
In 2015, UBS AG revised the presentation of service allocations from Corporate Center – Services to the business divisions and other Corporate Center units to better reflect the economic relation-ship between them. These cost allocations were previously presented within the Personnel expenses, General and administrative expenses and Depreciation and impairment of property, equipment and software line items and are newly presented in the Services (to) / from business divisions and Corporate Center line items. Prior-period information was restated to reflect this change. This change in presentation did not affect total operating expenses or performance before tax of the business divisions and Corporate Center units for any period presented. Similarly, personnel of Corporate Center – Services are no longer allocated to the business divisions and other Corporate Center units. Prior-period information was restated accordingly.
® Refer to Note 2 for more information
Change in segment reporting related to fair value gains and losses on certain internal funding transactions
Consistent with changes in the manner in which operating segment performance is assessed, beginning in 2015, UBS AG has applied fair value accounting for certain internal funding transactions between Corporate Center – Group ALM and the Investment Bank and Corporate Center – Non-core and Legacy Portfolio rather than applying amortized cost accounting. This treatment better aligns with the mark-to-market basis on which these internal transactions are risk managed within the Investment Bank and Corporate Center – Non-core and Legacy Portfolio. The terms of the funding transactions remain otherwise unchanged. Prior periods have been restated to reflect this change. As a result, Investment Bank operating income and performance before tax decreased by CHF 37 million for the year ended 31 December 2014 and by CHF 162 million for the year ended 31 December 2013, with offsetting increases in Corporate Center. This change did not affect UBS AG’s total operating income or net profit for any period presented.
® Refer to Note 2 for more information
Note 1 Summary of significant accounting policies (continued)
c) International Financial Reporting Standards and Interpretations to be adopted in 2016 and later and other adjustments
IFRS 9, Financial Instruments
In July 2014, the IASB published the final version of IFRS 9, Financial Instruments. The standard reflects the classification and measurement, impairment and hedge accounting phases of the IASB’s project to replace IAS 39, Financial Instruments: Recognition and Measurement.
The standard requires all financial assets, except equity instruments, to be classified at fair value through profit or loss, fair value through other comprehensive income (OCI) or amortized cost on the basis of the entity’s business model for managing the financial assets and the contractual cash flow characteristics of the financial asset. If a financial asset meets the criteria to be measured at amortized cost or at fair value through OCI, it can be designated at fair value through profit or loss under the fair value option if doing so would significantly reduce or eliminate an accounting mismatch. Equity instruments that are not held for trading may be accounted for at fair value through OCI, with no subsequent reclassification of realized gains or losses to the income statement, while all other equity instruments will be accounted for at fair value through profit or loss.
The accounting guidance for financial liabilities is unchanged with one exception: any gain or loss arising out of a financial liability designated at fair value through profit or loss that is attributable to changes in the credit risk of that liability (own credit) is presented in OCI and not recognized in the income statement. There is no subsequent reclassification of realized gains or losses on own credit from OCI to the income statement.
In addition, the standard introduces a forward-looking expected credit loss impairment model, replacing the incurred loss model of IAS 39. IFRS 9 also incorporates a reformed approach to hedge accounting that introduces substantial changes to hedge effectiveness and eligibility requirements as well as new disclosures. The standard does not explicitly address macro hedge accounting strategies.
The mandatory effective date of the new standard is 1 January 2018, with earlier adoption permitted. Adoption of the IFRS 9 hedge accounting requirements is optional, pending the completion by the IASB of its project on macro hedge accounting strategies.
UBS AG will adopt the own credit presentation changes in the first quarter of 2016 and is currently assessing the impact of the other requirements of IFRS 9 on its financial statements.
IFRS 15, Revenue from Contracts with Customers
In May 2014, the IASB issued IFRS 15, Revenue from Contracts with Customers, which establishes principles for revenue recognition that apply to all contracts with customers. The standard requires an entity to recognize revenue as goods or services are transferred to the customer in an amount that reflects the consideration to which the entity expects to be entitled to in exchange for those goods or services. It also establishes a cohesive set of disclosure requirements regarding information about the nature, amount, timing and uncertainty of revenue and cash flows from contracts with customers. The standard is effective for UBS AG reporting periods beginning on 1 January 2018, with early adoption permitted. Entities can choose to apply the standard retrospectively or use a modified approach in the year of adoption. UBS AG is currently assessing the impact of the new standard on its financial statements.
IFRS 16, Leases
In January 2016, the IASB issued IFRS 16, Leases. The standard substantially changes the accounting by lessees as operating leases previously accounted for as off-balance sheet financing arrangements will be recognized as on-balance sheet liabilities with a corresponding right of use asset also being recorded. The standard replaces IAS 17, Leases and is effective for UBS AG from 1 January 2019. Early application is permitted for companies that also apply IFRS 15, Revenue from Contracts with Customers. UBS AG is currently assessing the impact of the new standard on its financial statements. UBS AG's undiscounted minimum lease payments for operating leases are disclosed in Note 33.
Consolidated financial statements
Notes to the UBS AG consolidated financial statements
Note 1 Summary of significant accounting policies (continued)
Amendments to IFRS 11, Joint Arrangements; IAS 16, Property, Plant and Equipment and IAS 38, Intangible Assets
In May 2014, the IASB issued amendments to IFRS 11, Joint Arrangements, IAS 16, Property, Plant and Equipment and IAS 38, Intangible Assets. The standard is effective for UBS AG reporting periods beginning on 1 January 2016. The amendments will have no material impact on UBS AG’s financial statements. UBS AG’s joint arrangements are immaterial, both individually and in aggregate (refer to Note 30), and UBS AG does not use revenue-based depreciation methodologies, which the amendments to IAS 16 and IAS 38 prohibit.
Annual Improvements to IFRSs 2012 – 2014 Cycle
In September 2014, the IASB issued Annual Improvements to IFRSs 2012 – 2014 Cycle that resulted in amendments to four IFRSs (IFRS 5, Non-current asset held for sale and discontinued operations, IFRS 7, Financial Instruments Disclosures, IAS 19, Employee Benefits and IAS 34, Interim Financial Reporting). Generally, the amendments are effective for UBS AG on 1 January 2016. UBS AG expects that the adoption of these amendments will not have a material impact on its financial statements.
Amendments to IAS 1, Presentation of Financial Statements
In December 2014, the IASB issued amendments to IAS 1 to further encourage companies to apply professional judgment in determining what information to disclose in their financial statements and in determining where and in what order information is presented in the financial disclosures. The amendments have a mandatory effective date of 1 January 2016 for UBS AG. The adoption of these amendments will not have a material impact on the financial statements.
Amendments to IAS 12, Income Taxes:
In January 2016, the IASB issued narrow scope amendments to IAS 12, Income Taxes, clarifying how to account for deferred tax assets related to debt instruments measured at fair value. Entities are required to apply the amendments for annual periods beginning on or after 1 January 2017. UBS AG expects that the adoption of these amendments will not have a material impact on its financial statements.
Amendments to IAS 7, Statement of Cash Flows
In January 2016, the IASB issued amendments to IAS 7, Statement of Cash Flows, which inter-alia requires companies to provide information about changes in their financial liabilities arising from financing activities, including changes from cash flows and non-cash changes (such as foreign exchange gains or losses). Entities are required to apply the amendments for annual periods beginning on or after 1 January 2017.
Note 2a Segment reporting
The operational structure of UBS AG is comprised of the Corporate Center and five business divisions: Wealth Management, Wealth Management Americas, Personal & Corporate Banking, Asset Management and the Investment Bank.
Wealth Management
Wealth Management provides comprehensive financial services to wealthy private clients around the world, with the exception of those served by Wealth Management Americas. UBS AG is a global firm with global capabilities, and its clients benefit from a full spectrum of resources, including wealth planning, investment management solutions and corporate finance advice, banking and lending solutions, as well as a wide range of specific offerings. Wealth Management’s guided architecture model gives clients access to a wide range of products from the world's leading third-party institutions that complement its own products.
Wealth Management Americas
Wealth Management Americas is one of the leading wealth managers in the Americas in terms of financial advisor productivity and invested assets. Its business includes UBS AG’s domestic US and Canadian wealth management businesses, as well as international business booked in the US. It provides a fully integrated set of wealth management solutions designed to address the needs of ultra high net worth and high net worth clients.
Personal & Corporate Banking
Personal & Corporate Banking provides comprehensive financial products and services to UBS AG's private, corporate and institutional clients in Switzerland, maintaining a leading position in these segments and embedding its offering in a multi-channel approach. The business is a central element of UBS AG’s universal bank delivery model in Switzerland, supporting other business divisions by referring clients and growing the wealth of the firm's private clients so they can be transferred to Wealth Management. Personal & Corporate Banking leverages the cross-selling potential of UBS AG's asset-gathering and investment bank businesses, and manages a substantial part of UBS AG’s Swiss infrastructure and banking products platform.
Asset Management
Asset Management is a large-scale global asset manager. It offers investment capabilities and investment styles across all major traditional and alternative asset classes to institutions, wholesale intermediaries and wealth management clients around the world.
Investment Bank
The Investment Bank provides corporate, institutional and wealth management clients with expert advice, innovative solutions, execution and comprehensive access to international capital markets. It offers advisory services and provides in-depth cross-asset research, along with access to equities, foreign exchange, precious metals and selected rates and credit markets, through its business units, Corporate Client Solutions and Investor Client Services. The Investment Bank is an active participant in capital markets flow activities, including sales, trading and market-making across a range of securities.
Corporate Center
Corporate Center is comprised of Services, Group Asset and Liability Management (Group ALM) and Non-core and Legacy Portfolio. Services includes UBS AG’s control functions such as finance, risk control (including compliance) and legal. In addition, it provides all logistics and support services, including operations, information technology, human resources, regulatory relations and strategic initiatives, communications and branding, corporate services, physical security, information security as well as outsourcing, nearshoring and offshoring. Group ALM is responsible for centrally managing UBS AG’s liquidity and funding position, as well as providing other central internal balance sheet and capital management services. Non-core and Legacy Portfolio is comprised of the non-core businesses and legacy positions that were part of the Investment Bank prior to its restructuring.
Consolidated financial statements
Notes to the UBS AG consolidated financial statements
Note 2a Segment reporting (continued)
| | Wealth Management | | Wealth Management Americas | | Personal & Corporate Banking | | Asset Management | | Investment Bank | | Corporate Center | | UBS |
CHF million | | | | | | | | | | | | Services | Group ALM | Non-core and Legacy Portfolio | | |
| | | | | | | | | | | | | | | | |
For the year ended 31 December 2015 | | | | | | | | | | | | |
Net interest income | | 1,825 | | 1,067 | | 1,890 | | (34) | | 1,573 | | (337) | 789 | (44) | | 6,729 |
Non-interest income | | 5,859 | | 6,213 | | 1,603 | | 2,077 | | 7,525 | | 434 | 361 | (79) | | 23,993 |
Allocations from Corporate Center Group ALM to business divisions and other CC units | | 471 | | 104 | | 421 | | 15 | | (211) | | 145 | (876) | (71) | | 0 |
Income¹˒² | | 8,155 | | 7,384 | | 3,913 | | 2,057 | | 8,889 | | 243 | 275 | (195) | | 30,721 |
Credit loss (expense) / recovery | | 0 | | (4) | | (37) | | 0 | | (68) | | 0 | 0 | (8) | | (117) |
Total operating income | | 8,155 | | 7,381 | | 3,876 | | 2,057 | | 8,821 | | 243 | 275 | (203) | | 30,605 |
Personnel expenses | | 2,532 | | 4,579 | | 873 | | 729 | | 3,220 | | 3,875 | 30 | 116 | | 15,954 |
General and administrative expenses | | 650 | | 848 | | 264 | | 233 | | 882 | | 4,517 | 20 | 805 | | 8,219 |
Services (to) / from other business divisions and Corporate Center | | 2,289 | | 1,209 | | 1,077 | | 502 | | 2,816 | | (8,214) | (56) | 378 | | 0 |
of which: services from CC Services | | 2,209 | | 1,193 | | 1,180 | | 523 | | 2,730 | | (8,243) | 95 | 314 | | 0 |
Depreciation and impairment of property, equipment and software | | 5 | | 3 | | 17 | | 2 | | 26 | | 866 | 0 | 0 | | 918 |
Amortization and impairment of intangible assets³ | | 3 | | 51 | | 0 | | 8 | | 24 | | 21 | 0 | 0 | | 107 |
Total operating expenses⁴ | | 5,478 | | 6,689 | | 2,231 | | 1,475 | | 6,969 | | 1,065 | (6) | 1,298 | | 25,198 |
Operating profit / (loss) before tax | | 2,676 | | 692 | | 1,646 | | 583 | | 1,852 | | (822) | 281 | (1,501) | | 5,407 |
Tax expense / (benefit) | | | | | | | | | | | | | | | | (908) |
Net profit / (loss) | | | | | | | | | | | | | | | | 6,314 |
Additional Information | | | | | | | | | | | | | | | | |
Total assets | | 119,850 | | 60,993 | | 141,174 | | 12,874 | | 253,571 | | 22,866 | 237,560 | 94,369 | | 943,256 |
Additions to non-current assets | | 6 | | 4 | | 14 | | 1 | | 18 | | 1,844 | 0 | 1 | | 1,888 |
1 Impairments of financial investments available-for-sale for the year ended 31 December 2015 totaled CHF 1 million, of which CHF 1 million was incurred in Wealth Management. 2 Refer to Note 24 for more information on own credit in Corporate Center Group ALM. 3 Refer to Note 17 for more information. 4 Refer to Note 32 for information on restructuring expenses. |
Note 2a Segment reporting (continued) 1
| | Wealth Management | | Wealth Management Americas | | Personal & Corporate Banking | | Asset Management | | Investment Bank | | Corporate Center | | UBS |
CHF million | | | | | | | | | | | | Services | Group ALM | Non-core and Legacy Portfolio | | |
| | | | | | | | | | | | | | | | |
For the year ended 31 December 2014 | | | | | | | | | | | | | | |
Net interest income | | 1,693 | | 864 | | 1,801 | | (39) | | 1,583 | | (338) | 816 | 174 | | 6,555 |
Non-interest income | | 5,726 | | 6,004 | | 1,575 | | 1,914 | | 6,823 | | 157 | 307 | (956) | | 21,549 |
Allocations from Corporate Center Group ALM to business divisions and other CC units | | 481 | | 116 | | 461 | | 27 | | (100) | | 217 | (1,120) | (82) | | 0 |
Income²˒³ | | 7,902 | | 6,984 | | 3,836 | | 1,902 | | 8,306 | | 35 | 2 | (863) | | 28,104 |
Credit loss (expense) / recovery | | (1) | | 15 | | (95) | | 0 | | 2 | | 0 | 0 | 2 | | (78) |
Total operating income | | 7,901 | | 6,998 | | 3,741 | | 1,902 | | 8,308 | | 35 | 2 | (862) | | 28,026 |
Personnel expenses | | 2,467 | | 4,363 | | 850 | | 643 | | 2,964 | | 3,843 | 26 | 124 | | 15,280 |
General and administrative expenses | | 918 | | 550 | | 293 | | 305 | | 2,671 | | 4,113 | 21 | 507 | | 9,377 |
Services (to) / from other business divisions and Corporate Center | | 2,180 | | 1,137 | | 1,074 | | 478 | | 2,711 | | (8,046) | (47) | 513 | | 0 |
of which: services from CC Services | | 2,122 | | 1,121 | | 1,196 | | 495 | | 2,658 | | (8,084) | 82 | 411 | | 0 |
Depreciation and impairment of property, equipment and software | | 4 | | 0 | | 17 | | 2 | | 32 | | 762 | 0 | 0 | | 817 |
Amortization and impairment of intangible assets⁴ | | 5 | | 48 | | 0 | | 9 | | 15 | | 6 | 0 | 0 | | 83 |
Total operating expenses⁵ | | 5,574 | | 6,099 | | 2,235 | | 1,435 | | 8,392 | | 679 | 0 | 1,144 | | 25,557 |
Operating profit / (loss) before tax | | 2,326 | | 900 | | 1,506 | | 467 | | (84) | | (643) | 2 | (2,005) | | 2,469 |
Tax expense / (benefit) | | | | | | | | | | | | | | | | (1,180) |
Net profit / (loss) | | | | | | | | | | | | | | | | 3,649 |
Additional Information | | | | | | | | | | | | | | | | |
Total assets | | 127,588 | | 56,026 | | 143,711 | | 15,207 | | 292,347 | | 19,720 | 237,901 | 169,826 | | 1,062,327 |
Additions to non-current assets | | 7 | | 6 | | 9 | | 2 | | 7 | | 1,677 | 0 | 0 | | 1,708 |
1 Figures in this table may differ from those originally published in quarterly and annual reports due to adjustments following organizational changes, restatements due to the retrospective adoption of new accounting standards or changes in accounting policies, and events after the reporting period. Refer to Note 1b for more information. 2 Impairments of financial investments available-for-sale for the year ended 31 December 2014 totaled CHF 76 million, of which CHF 49 million were incurred in the Investment Bank and CHF 23 million were incurred in Corporate Center Non-core and Legacy Portfolio. 3 Refer to Note 24 for more information on own credit in Corporate Center Group ALM. 4 Refer to Note 17 for more information. 5 Refer to Note 32 for information on restructuring expenses. |
Consolidated financial statements
Notes to the UBS AG consolidated financial statements
Note 2a Segment reporting (continued) 1
| | Wealth Management | | Wealth Management Americas | | Personal & Corporate Banking | | Asset Management | | Investment Bank | | Corporate Center | | UBS |
CHF million | | | | | | | | | | | | Services | Group ALM | Non-core and Legacy Portfolio | | |
| | | | | | | | | | | | | | | | |
For the year ended 31 December 2013 | | | | | | | | | | | | |
Net interest income | | 1,568 | | 742 | | 1,822 | | (44) | | 1,102 | | (388) | 624 | 359 | | 5,786 |
Non-interest income | | 5,519 | | 5,629 | | 1,556 | | 1,954 | | 7,552 | | 347 | (544) | (18) | | 21,997 |
Allocations from Corporate Center Group ALM to business divisions and other CC units | | 486 | | 193 | | 396 | | 23 | | (217) | | 218 | (921) | (179) | | 0 |
Income²˒³ | | 7,573 | | 6,565 | | 3,774 | | 1,935 | | 8,436 | | 178 | (841) | 163 | | 27,782 |
Credit loss (expense) / recovery | | (10) | | (27) | | (18) | | 0 | | 2 | | 0 | 0 | 3 | | (50) |
Total operating income | | 7,563 | | 6,538 | | 3,756 | | 1,935 | | 8,438 | | 178 | (841) | 166 | | 27,732 |
Personnel expenses | | 2,433 | | 4,102 | | 843 | | 609 | | 2,899 | | 4,065 | 26 | 205 | | 15,182 |
General and administrative expenses | | 708 | | 383 | | 297 | | 218 | | 843 | | 4,249 | 14 | 1,668 | | 8,380 |
Services (to) / from other business divisions and Corporate Center | | 2,165 | | 1,145 | | 1,140 | | 521 | | 2,517 | | (8,276) | 3 | 785 | | 0 |
of which: services from CC Services | | 2,074 | | 1,127 | | 1,301 | | 535 | | 2,487 | | (8,304) | 87 | 693 | | 0 |
Depreciation and impairment of property, equipment and software | | 3 | | 0 | | 19 | | 4 | | 28 | | 761 | 0 | 0 | | 816 |
Amortization and impairment of intangible assets⁴ | | 7 | | 49 | | 0 | | 8 | | 13 | | 4 | 0 | 2 | | 83 |
Total operating expenses⁵ | | 5,316 | | 5,680 | | 2,298 | | 1,359 | | 6,300 | | 804 | 43 | 2,660 | | 24,461 |
Operating profit / (loss) before tax | | 2,247 | | 858 | | 1,458 | | 576 | | 2,138 | | (626) | (884) | (2,494) | | 3,272 |
Tax expense / (benefit) | | | | | | | | | | | | | | | | (110) |
Net profit / (loss) | | | | | | | | | | | | | | | | 3,381 |
Additional Information | | | | | | | | | | | | | | | | |
Total assets | | 109,758 | | 45,491 | | 141,369 | | 14,223 | | 239,971 | | 17,203 | 230,204 | 215,135 | | 1,013,355 |
Additions to non-current assets | | 5 | | 1 | | 17 | | 1 | | 81 | | 1,236 | 0 | 0 | | 1,341 |
1 Figures in this table may differ from those originally published in quarterly and annual reports due to adjustments following organizational changes, restatements due to the retrospective adoption of new accounting standards or changes in accounting policies, and events after the reporting period. Refer to Note 1b for more information. 2 Impairments of financial investments available-for-sale for the year ended 31 December 2013 totaled CHF 41 million, of which CHF 10 million was incurred in Wealth Management, CHF 20 million was incurred in the Investment Bank and CHF 8 million was incurred in Corporate Center – Non-core and Legacy Portfolio. 3 Refer to Note 24 for more information on own credit in Corporate Center – Group ALM. 4 Refer to Note 17 for more information. 5 Refer to Note 32 for information on restructuring expenses. |
Note 2b Segment reporting by geographic location
The operating regions shown in the table below correspond to the regional management structure of UBS AG. The allocation of operating income to these regions reflects, and is consistent with, the basis on which the business is managed and its performance evaluated. These allocations involve assumptions and judgments that management considers to be reasonable, and may be refined to reflect changes in estimates or management structure. The main principles of the allocation methodology are that client revenues are attributed to the domicile of the client and trading and portfolio management revenues are attributed to the country where the risk is managed. This revenue attribution is consistent with the mandate of the country and regional Presidents. Certain revenues, such as those related to Corporate Center – Non-core and Legacy Portfolio, are managed at a global level. These revenues are included in the Global line.
The geographic analysis of non-current assets is based on the location of the entity in which the assets are recorded.
For the year ended 31 December 2015 | | | | | | |
| | Total operating income | | Total non-current assets |
| | CHF billion | Share % | | CHF billion | Share % |
Americas | | 11.3 | 37 | | 7.1 | 47 |
of which: USA | | 10.7 | 35 | | 6.7 | 44 |
Asia Pacific | | 5.0 | 16 | | 0.5 | 3 |
Europe, Middle East and Africa | | 6.8 | 22 | | 1.7 | 11 |
Switzerland | | 7.1 | 23 | | 5.9 | 39 |
Global | | 0.5 | 2 | | 0.0 | 0 |
Total | | 30.6 | 100 | | 15.2 | 100 |
| | | | | | |
For the year ended 31 December 2014 | | | | | | |
| | Total operating income | | Total non-current assets |
| | CHF billion | Share % | | CHF billion | Share % |
Americas | | 10.7 | 38 | | 7.0 | 48 |
of which: USA | | 10.1 | 36 | | 6.6 | 45 |
Asia Pacific | | 4.6 | 16 | | 0.4 | 3 |
Europe, Middle East and Africa | | 6.8 | 24 | | 1.5 | 10 |
Switzerland | | 6.8 | 24 | | 5.6 | 38 |
Global | | (0.9) | (3) | | 0.0 | 0 |
Total | | 28.0 | 100 | | 14.6 | 100 |
| | | | | | |
For the year ended 31 December 2013 | | | | | | |
| | Total operating income | | Total non-current assets |
| | CHF billion | Share % | | CHF billion | Share % |
Americas | | 10.2 | 37 | | 6.1 | 46 |
of which: USA | | 9.6 | 35 | | 5.6 | 43 |
Asia Pacific | | 4.5 | 16 | | 0.4 | 3 |
Europe, Middle East and Africa | | 6.6 | 24 | | 1.5 | 11 |
Switzerland | | 6.8 | 25 | | 5.3 | 40 |
Global | | (0.4) | (1) | | 0.0 | 0 |
Total | | 27.7 | 100 | | 13.1 | 100 |
Consolidated financial statements
Notes to the UBS AG consolidated financial statements
Income statement notes
Note 3 Net interest and trading income
| | For the year ended | | % change from |
CHF million | | 31.12.15 | 31.12.14 | 31.12.13 | | 31.12.14 |
| | | | | | |
Net interest and trading income | | | | | | |
Net interest income | | 6,729 | 6,555 | 5,786 | | 3 |
Net trading income | | 5,696 | 3,841 | 5,130 | | 48 |
Total net interest and trading income | | 12,425 | 10,396 | 10,915 | | 20 |
Wealth Management | | 3,034 | 2,845 | 2,868 | | 7 |
Wealth Management Americas | | 1,537 | 1,352 | 1,323 | | 14 |
Personal & Corporate Banking | | 2,613 | 2,536 | 2,485 | | 3 |
Asset Management | | (5) | 0 | 9 | | |
Investment Bank | | 5,186 | 4,517 | 4,852 | | 15 |
of which: Corporate Client Solutions | | 1,001 | 1,030 | 1,146 | | (3) |
of which: Investor Client Services | | 4,185 | 3,487 | 3,707 | | 20 |
Corporate Center | | 61 | (855) | (622) | | |
of which: Services | | (1) | 33 | (166) | | |
of which: Group ALM | | 375 | 16 | (535) | | |
of which: own credit on financial liabilities designated at fair value¹ | | 553 | 292 | (283) | | 89 |
of which: Non-core and Legacy Portfolio | | (313) | (904) | 79 | | (65) |
Total net interest and trading income | | 12,425 | 10,396 | 10,915 | | 20 |
| | | | | | |
Net interest income | | | | | | |
Interest income | | | | | | |
Interest earned on loans and advances² | | 8,626 | 8,722 | 8,686 | | (1) |
Interest earned on securities financing transactions³ | | 896 | 752 | 852 | | 19 |
Interest and dividend income from trading portfolio | | 3,071 | 3,196 | 2,913 | | (4) |
Interest income on financial assets designated at fair value | | 194 | 208 | 364 | | (7) |
Interest and dividend income from financial investments available-for-sale | | 391 | 315 | 322 | | 24 |
Total | | 13,178 | 13,194 | 13,137 | | 0 |
Interest expense | | | | | | |
Interest on amounts due to banks and customers | | 774 | 708 | 893 | | 9 |
Interest on securities financing transactions⁴ | | 976 | 827 | 829 | | 18 |
Interest expense from trading portfolio⁵ | | 1,670 | 1,804 | 1,846 | | (7) |
Interest on financial liabilities designated at fair value | | 730 | 919 | 1,197 | | (21) |
Interest on debt issued | | 2,299 | 2,382 | 2,586 | | (3) |
Total | | 6,449 | 6,639 | 7,351 | | (3) |
Net interest income | | 6,729 | 6,555 | 5,786 | | 3 |
Net trading income | | | | | | |
Investment Bank Corporate Client Solutions | | 321 | 276 | 425 | | 16 |
Investment Bank Investor Client Services | | 3,494 | 2,760 | 3,541 | | 27 |
Other business divisions and Corporate Center | | 1,882 | 806 | 1,164 | | 133 |
Net trading income | | 5,696 | 3,841 | 5,130 | | 48 |
of which: net gains / (losses) from financial assets designated at fair value | | (119) | (81) | 99 | | 47 |
of which: net gains / (losses) from financial liabilities designated at fair value¹˒⁶ | | 3,701 | (2,380) | (2,056) | | |
1 Refer to Note 24 for more information on own credit. 2 Includes interest income on impaired loans and advances of CHF 16 million for 2015, CHF 15 million for 2014 and CHF 15 million for 2013. 3 Includes interest income on securities borrowed and reverse repurchase agreements and negative interest, including fees, on securities lent and repurchase agreements. 4 Includes interest expense on securities lent and repurchase agreements and negative interest, including fees, on securities borrowed and reverse repurchase agreements. 5 Includes expense related to dividend payment obligations on trading liabilities. 6 Excludes fair value changes of hedges related to financial liabilities designated at fair value and foreign currency translation effects arising from translating foreign currency transactions into the respective functional currency, both of which are reported within net trading income. |
Note 4 Net fee and commission income
| | For the year ended | | % change from |
CHF million | | 31.12.15 | 31.12.14 | 31.12.13 | | 31.12.14 |
Underwriting fees | | 1,290 | 1,470 | 1,374 | | (12) |
of which: equity underwriting fees | | 836 | 947 | 850 | | (12) |
of which: debt underwriting fees | | 455 | 522 | 524 | | (13) |
M&A and corporate finance fees | | 737 | 731 | 613 | | 1 |
Brokerage fees | | 3,930 | 3,918 | 4,035 | | 0 |
Investment fund fees | | 3,567 | 3,717 | 3,803 | | (4) |
Portfolio management and advisory fees | | 7,858 | 7,343 | 6,625 | | 7 |
Other | | 1,678 | 1,760 | 1,725 | | (5) |
Total fee and commission income | | 19,060 | 18,940 | 18,176 | | 1 |
Brokerage fees paid | | 869 | 818 | 839 | | 6 |
Other | | 1,007 | 1,045 | 1,050 | | (4) |
Total fee and commission expense | | 1,876 | 1,863 | 1,889 | | 1 |
Net fee and commission income | | 17,184 | 17,076 | 16,287 | | 1 |
of which: net brokerage fees | | 3,060 | 3,100 | 3,196 | | (1) |
| | For the year ended | | % change from |
CHF million | | 31.12.15 | 31.12.14 | 31.12.13 | | 31.12.14 |
Associates and subsidiaries | | | | | | |
Net gains / (losses) from disposals of subsidiaries¹ | | 264² | 56 | 111 | | 371 |
Net gains / (losses) from disposals of investments in associates | | 0 | 69 | 0 | | (100) |
Share of net profits of associates | | 169 | 94 | 49 | | 80 |
Total | | 433 | 219 | 160 | | 98 |
Financial investments available-for-sale | | | | | | |
Net gains / (losses) from disposals | | 252 | 219 | 209 | | 15 |
Impairment charges | | (1) | (76) | (41) | | (99) |
Total | | 251 | 143 | 168 | | 76 |
Net income from properties (excluding net gains / (losses) from disposals)³ | | 28 | 30 | 35 | | (7) |
Net gains / (losses) from investment properties⁴ | | (1) | 2 | (16) | | |
Net gains / (losses) from disposals of properties held for sale | | 378 | 44 | 291 | | 759 |
Net gains / (losses) from disposals of loans and receivables | | 26 | 39 | 53 | | (33) |
Other | | (4)⁵ | 155 | (111) | | |
Total other income | | 1,112 | 632 | 580 | | 76 |
1 Includes foreign exchange gains / (losses) reclassified from other comprehensive income related to disposed or dormant subsidiaries. 2 Includes a net gain on sale of subsidiaries of CHF 113 million in Wealth Management and a net gain on sale of subsidiaries of CHF 56 million in Asset Management. Refer to Note 32 for more information. 3 Includes net rent received from third parties and net operating expenses. 4 Includes unrealized and realized gains / (losses) from investment properties and foreclosed assets. 5 Includes a net gain on sale of businesses of CHF 56 million in Wealth Management. Refer to Note 32 for more information. |
Consolidated financial statements
Notes to the UBS AG consolidated financial statements
Note 6 Personnel expenses
| | For the year ended | | % change from |
CHF million | | 31.12.15 | 31.12.14 | 31.12.13 | | 31.12.14 |
Salaries¹ | | 6,260 | 6,269 | 6,268 | | 0 |
Variable compensation – performance awards² | | 3,209 | 2,820 | 2,986 | | 14 |
of which: guarantees for new hires | | 38 | 48 | 76 | | (21) |
Variable compensation – other² | | 346 | 466 | 288 | | (26) |
of which: replacement payments³ | | 76 | 81 | 78 | | (6) |
of which: forfeiture credits | | (86) | (70) | (146) | | 23 |
of which: severance payments⁴ | | 157 | 162 | 114 | | (3) |
of which: retention plan and other payments | | 198 | 292 | 242 | | (32) |
Contractors | | 365 | 234 | 190 | | 56 |
Social security | | 817 | 791 | 792 | | 3 |
Pension and other post-employment benefit plans⁵ | | 807 | 711 | 887 | | 14 |
Wealth Management Americas: Financial advisor compensation²˒⁶ | | 3,552 | 3,385 | 3,140 | | 5 |
Other personnel expenses | | 597 | 605 | 631 | | (1) |
Total personnel expenses⁷ | | 15,954 | 15,280 | 15,182 | | 4 |
1 Includes role-based allowances. 2 Refer to Note 29 for more information. 3 Replacement payments are payments made to compensate employees for deferred awards forfeited as a result of joining UBS. 4 Includes legally obligated and standard severance payments. 5 Refer to Note 28 for more information. 6 Financial advisor compensation consists of grid-based compensation based directly on compensable revenues generated by financial advisors and supplemental compensation calculated based on financial advisor productivity, firm tenure, assets and other variables. It also includes expenses related to compensation commitments with financial advisors entered into at the time of recruitment which are subject to vesting requirements. 7 Includes net restructuring expenses of CHF 458 million, CHF 327 million and CHF 156 million for the years ended 31 December 2015, 31 December 2014 and 31 December 2013, respectively. Refer to Note 32 for more information. |
Note 7 General and administrative expenses
| | For the year ended | | % change from |
CHF million | | 31.12.15 | 31.12.14 | 31.12.13 | | 31.12.14 |
Occupancy | | 928 | 1,005 | 1,044 | | (8) |
Rent and maintenance of IT and other equipment | | 510 | 479 | 458 | | 6 |
Communication and market data services | | 610 | 608 | 609 | | 0 |
Administration | | 855 | 608 | 638 | | 41 |
Marketing and public relations | | 484 | 468 | 478 | | 3 |
Travel and entertainment | | 456 | 458 | 451 | | 0 |
Professional fees | | 1,351 | 1,306 | 1,032 | | 3 |
Outsourcing of IT and other services | | 1,742 | 1,603 | 1,340 | | 9 |
Provisions for litigation, regulatory and similar matters¹ | | 1,087 | 2,594 | 1,701 | | (58) |
Other | | 195 | 248 | 628 | | (21) |
Total general and administrative expenses² | | 8,219 | 9,377 | 8,380 | | (12) |
1 Reflects the net increase in provisions for litigation, regulatory and similar matters recognized in the income statement. Refer to Note 22 for more information. Also includes recoveries from third parties of CHF 10 million, CHF 10 million and CHF 15 million for the years ended 31 December 2015, 31 December 2014 and 31 December 2013, respectively. 2 Includes net restructuring expenses of CHF 760 million, CHF 319 million and CHF 548 million for the years ended 31 December 2015, 31 December 2014 and 31 December 2013, respectively. Refer to Note 32 for more information. |
| | For the year ended |
CHF million | | 31.12.15 | 31.12.14 | 31.12.13 |
| | | | |
Tax expense / (benefit) | | | | |
Swiss | | | | |
Current | | 230 | 46 | 93 |
Deferred | | 329 | 1,348 | 455 |
Non-Swiss | | | | |
Current | | 476 | 409 | 342 |
Deferred | | (1,943) | (2,983) | (1,000) |
Total income tax expense / (benefit) | | (908) | (1,180) | (110) |
Income tax expense / (benefit)
The Swiss current tax expense of CHF 230 million related to taxable profits against which no losses were available to offset, mainly earned by Swiss subsidiaries. The Swiss deferred tax expense of CHF 329 million mainly reflected a net decrease of deferred tax assets previously recognized in relation to tax losses carried forward, partially offset by an increase in recognized deferred tax assets related to temporary differences.
The non-Swiss current tax expense of CHF 476 million related to taxable profits earned by non-Swiss subsidiaries and branches, against which no losses were available to offset. The non-Swiss net deferred tax benefit of CHF 1,943 million was primarily due to an increase in US deferred tax assets, reflecting updated profit forecasts and an extension of the relevant taxable profit forecast period used in valuing deferred tax assets. Based on the performance of its businesses and the accuracy of historical forecasts, UBS AG extended the deferred tax asset forecast period for US taxable profits to seven years from six. In addition, UBS AG considers other factors in evaluating the recoverability of its deferred tax assets, including the remaining tax loss carry-forward period, and its confidence level in assessing the probability of taxable profit beyond the current forecast period. Estimating future profitability is inherently subjective and is particularly sensitive to future economic, market and other conditions which are difficult to predict.
| | For the year ended |
CHF million | | 31.12.15 | 31.12.14 | 31.12.13 |
Operating profit / (loss) before tax | | 5,407 | 2,469 | 3,272 |
of which: Swiss | | 3,665 | 1,181 | 3,323 |
of which: Non-Swiss | | 1,742 | 1,288 | (51) |
Income taxes at Swiss tax rate of 21% | | 1,135 | 519 | 687 |
Increase / (decrease) resulting from: | | | | |
Non-Swiss tax rates differing from Swiss tax rate | | (69) | 68 | (305) |
Tax effects of losses not recognized | | 107 | 325 | 58 |
Previously unrecognized tax losses now utilized | | (107) | (285) | (419) |
Non-taxable and lower taxed income | | (273) | (384) | (624) |
Non-deductible expenses and additional taxable income | | 519 | 1,069 | 1,245 |
Adjustments related to prior years - current tax | | 29 | 5 | (32) |
Adjustments related to prior years - deferred tax | | (48) | (9) | 6 |
Change in deferred tax valuation allowances | | (2,419) | (2,373) | (859) |
Adjustments to deferred tax balances arising from changes in tax rates | | 191 | (183) | 107 |
Other items | | 26 | 69 | 28 |
Income tax expense / (benefit) | | (908) | (1,180) | (110) |
Consolidated financial statements
Notes to the UBS AG consolidated financial statements
Note 8 Income taxes (continued)
The components of operating profit before tax, and the differences between income tax expense reflected in the financial statements and the amounts calculated at the Swiss tax rate, are provided in the table on the previous page and explained below.
Non-Swiss tax rates differing from Swiss tax rate
To the extent that UBS AG profits or losses arise outside Switzerland, the applicable local tax rate may differ from the Swiss tax rate. This item reflects, for such profits or losses, an adjustment from the tax expense/benefit that would arise at the Swiss tax rate and the tax expense/benefit that would arise at the applicable local tax rate. If an entity generates a profit, a tax expense arises where the local tax rate is in excess of the Swiss tax rate and a tax benefit arises where the local tax rate is below the Swiss tax rate. Conversely, if an entity incurs a loss, a tax benefit arises where the local tax rate is in excess of the Swiss tax rate and a tax expense arises where the local tax rate is less than the Swiss tax rate.
Tax effects of losses not recognized
This item relates to tax losses of entities arising in the year, which are not recognized as deferred tax assets. Consequently, no tax benefit arises in relation to those losses. Therefore, the tax benefit calculated by applying the local tax rate to those losses as described above is reversed.
Previously unrecognized tax losses now utilized
This item relates to taxable profits of the year, which are offset by tax losses of previous years, for which no deferred tax assets were previously recorded. Consequently, no current tax or deferred tax expense arises in relation to those taxable profits. Therefore, the tax expense calculated by applying the local rate on those profits is reversed.
Non-taxable and lower taxed income
This item relates to profits for the year, which are either permanently not taxable or are taxable, but at a lower rate of tax than the local tax rate. It also includes any permanent deductions made for tax purposes, which are not reflected in the accounts, thereby effectively ensuring that profits covered by the deduction are not taxable.
Non-deductible expenses and additional taxable income
This item mainly relates to income for the year, which is imputed for tax purposes for an entity, but is not included in its operating profit. In addition, it includes expenses for the year which are permanently non-deductible.
Adjustments related to prior years – current tax
This item relates to adjustments to current tax expenses for prior years, for example, if the tax payable for a year agreed with the tax authorities is expected to differ from the amount previously reflected in the accounts.
Adjustments related to prior years – deferred tax
This item relates to adjustments to deferred tax positions recognized in prior years, for example, if a tax loss for a year is fully recognized and the amount of the tax loss agreed with the tax authorities is expected to differ from the amount previously recognized as deferred tax assets in the accounts.
Note 8 Income taxes (continued)
Change in deferred tax valuation allowances
This item includes revaluations of deferred tax assets previously recognized resulting from reassessments of expected future taxable profits. It also includes changes in temporary differences in the year, for which deferred tax is not recognized. The amount in the year mainly relates to the upward revaluation of deferred tax assets.
Adjustments to deferred tax balances arising from changes in tax rates
This item relates to re-measurements of deferred tax assets and liabilities recognized due to changes in tax rates. These have the effect of changing the future tax saving that is expected from tax losses or deductible tax differences and therefore the amount of deferred tax assets recognized or, alternatively, changing the tax cost of additional taxable income from taxable temporary differences and therefore the deferred tax liability.
Other items
Other items include other differences between profit or losses at the local tax rate and the actual local tax expense or benefit, including increases in provisions for uncertain positions in relation to the current year, interest accruals for such provisions in relation to prior years and other items.
Tax recognized in equity
Certain tax expenses and benefits were recognized directly in equity. These included a tax benefit of CHF 131 million related to cash flow hedges (2014: expense of CHF 196 million), a tax benefit of CHF 8 million related to financial investments classified as available-for-sale (2014: expense of CHF 52 million), a tax expense of CHF 1 million related to foreign currency translation gains and losses (2014: expense of CHF 7 million) and a tax expense of CHF 19 million related to defined benefit plans (2014: benefit of CHF 246 million) recognized in other comprehensive income. In addition, they included a tax benefit of CHF 9 million recognized in share premium (2014: benefit of CHF 3 million). Furthermore, there were net foreign currency translation movements related to the effects of exchange rate changes on tax assets and liabilities denominated in currencies other than Swiss francs.
Deferred tax assets and liabilities
UBS AG has deferred tax assets related to tax loss carry-forwards and other items as shown in the table below. As of 31 December 2015, deferred tax assets of CHF 2,094 million (CHF 1,378 million as of 31 December 2014) were recognized by entities which incurred losses in either the current or preceding year.
The valuation allowance reflects deferred tax assets which were not recognized because it was not considered probable that future taxable profits will be available to utilize the related tax loss carry-forwards and deductible temporary differences.
CHF million | | | 31.12.15 | | | | 31.12.14 | |
Deferred tax assets¹ | | Gross | Valuation allowance | Recognized | | Gross | Valuation allowance | Recognized |
Tax loss carry-forwards | | 25,471 | (18,378) | 7,093 | | 29,727 | (22,271) | 7,456 |
Temporary differences | | 7,023 | (1,284) | 5,739 | | 4,869 | (1,264) | 3,605 |
of which: related to compensation and benefits | | 1,576 | (267) | 1,310 | | 1,424 | (317) | 1,107 |
of which: related to trading assets | | 1,116 | (77) | 1,038 | | 1,459 | (61) | 1,398 |
of which: related to investments in subsidiaries and goodwill | | 2,310 | 0 | 2,310 | | 0 | 0 | 0 |
of which: other | | 2,021 | (940) | 1,081 | | 1,986 | (886) | 1,100 |
Total deferred tax assets | | 32,494 | (19,661) | 12,833 | | 34,596 | (23,535) | 11,060 |
| | | | | | | | |
Deferred tax liabilities | | | | | | | | |
Goodwill and intangible assets | | | | 28 | | | | 32 |
Financial investments | | | | 1 | | | | 13 |
Investments in associates and other | | | | 27 | | | | 35 |
Total deferred tax liabilities | | | | 56 | | | | 80 |
1 Less deferred tax liabilities as applicable. |
Consolidated financial statements
Notes to the UBS AG consolidated financial statements
Note 8 Income taxes (continued)
As of 31 December 2015, tax loss carry-forwards totaling CHF 56,973 million (31 December 2014: CHF 68,869 million), which are not recognized as deferred tax assets, were available to be offset against future taxable profits. These tax losses expire as outlined in the table below.
Unrecognized tax loss carry-forwards | | |
CHF million | 31.12.15 | 31.12.14 |
Within 1 year | 3,727 | 9,341 |
From 2 to 5 years | 33 | 43 |
From 6 to 10 years | 753 | 613 |
From 11 to 20 years | 34,833 | 39,899 |
No expiry | 17,627 | 18,973 |
Total | 56,973 | 68,869 |
In general, Swiss tax losses can be carried forward for seven years, US federal tax losses for 20 years and UK and Jersey tax losses for an unlimited period.
UBS AG recognizes deferred tax liabilities on undistributed earnings of subsidiaries except to the extent that those earnings are indefinitely invested. As of 31 December 2015, no such earnings were considered indefinitely invested.
Note 9 Earnings per share (EPS) and shares outstanding
During 2015, UBS AG shares were delisted from the SIX and the NYSE. As of 31 December 2015, 100% of UBS AG's issued shares were held by UBS Group AG and therefore were not publicly traded. Accordingly, earnings per share information is not provided for UBS AG.
Balance sheet notes: assets
Note 10 Due from banks and loans (held at amortized cost)
CHF million | 31.12.15 | 31.12.14 |
| | |
By type of exposure | | |
Due from banks, gross | 11,869 | 13,347 |
of which: due from central banks | 1,035 | 648 |
Allowance for credit losses | (3) | (13) |
Due from banks, net | 11,866 | 13,334 |
Loans, gross | | |
Residential mortgages | 141,608 | 142,380 |
Commercial mortgages | 21,509 | 22,368 |
Lombard loans | 107,084 | 108,230 |
Other loans¹ | 39,321 | 39,152 |
Finance lease receivables² | 1,083 | 1,101 |
Securities³ | 2,807 | 3,448 |
Subtotal | 313,413 | 316,679 |
Allowance for credit losses | (689) | (695) |
Loans, net | 312,723 | 315,984 |
Total due from banks and loans, net⁴ | 324,590 | 329,317 |
1 Includes corporate loans. 2 Refer to Note 33 for more information. 3 Includes securities reclassified from held for trading. Refer to Note 1a item 10 and Note 27 for more information. 4 Refer to “Maximum exposure to credit risk” in the “Risk management and control” section of this report for information on collateral and credit enhancements. |
Consolidated financial statements
Notes to the UBS AG consolidated financial statements
Note 11 Cash collateral on securities borrowed and lent, reverse repurchase and repurchase agreements, and derivative instruments
UBS AG enters into collateralized reverse repurchase and repurchase agreements, securities borrowing and securities lending transactions and derivative transactions that may result in credit exposure in the event that the counterparty to the transaction is unable to fulfill its contractual obligations. UBS AG manages credit risk associated with these activities by monitoring counterparty credit exposure and collateral values on a daily basis and requiring additional collateral to be deposited with or returned to UBS AG when deemed necessary.
® Refer to Note 26 for more information on offsetting between financial assets and financial liabilities
Balance sheet assets | | | | | | | | |
| | 31.12.15 | | 31.12.14 |
CHF million | | Cash collateral on securities borrowed | Reverse repurchase agreements | Cash collateral receivables on derivative instruments | | Cash collateral on securities borrowed | Reverse repurchase agreements | Cash collateral receivables on derivative instruments |
By counterparty | | | | | | | | |
Banks | | 8,658 | 12,903 | 6,037 | | 10,517 | 13,746 | 10,265 |
Customers | | 16,925 | 54,991 | 17,727 | | 13,546 | 54,668 | 20,713 |
Total | | 25,584 | 67,893 | 23,763 | | 24,063 | 68,414 | 30,979 |
Balance sheet liabilities | | | | | | | | |
| | 31.12.15 | | 31.12.14 |
CHF million | | Cash collateral on securities lent | Repurchase agreements | Cash collateral payables on derivative instruments | | Cash collateral on securities lent | Repurchase agreements | Cash collateral payables on derivative instruments |
By counterparty | | | | | | | | |
Banks | | 7,078 | 5,637 | 17,041 | | 7,041 | 5,174 | 20,895 |
Customers | | 951 | 4,016 | 21,241 | | 2,138 | 6,644 | 21,477 |
Total | | 8,029 | 9,653 | 38,282 | | 9,180 | 11,818 | 42,372 |
Note 12 Allowances and provisions for credit losses
CHF million | | | | | | |
| | | | | | |
By movement | Specific allowances | Collective allowances | Total allowances | Provisions¹ | Total 31.12.15 | Total 31.12.14 |
Balance at the beginning of the year | 704 | 8 | 711 | 23 | 735 | 750 |
Write-offs / usage of provisions | (162) | (2) | (164) | 0 | (164) | (154) |
Recoveries | 48 | 0 | 48 | 0 | 48 | 29 |
Increase / (decrease) recognized in the income statement | 114 | 0 | 114 | 2 | 117 | 78 |
Reclassifications | (9) | 0 | (9) | 9 | 0 | 0 |
Foreign currency translation | (11) | 0 | (11) | 0 | (11) | 21 |
Other | 2 | 0 | 2 | 0 | 2 | 11 |
Balance at the end of the year | 686 | 6 | 692 | 35 | 727 | 735 |
1 Represents provisions for loan commitments and guarantees. Refer to Note 22 for more information. Refer to the "Financial and operating performance" section of this report for the maximum irrevocable amount of loan commitments and guarantees. |
| | | | | | |
By balance sheet line | Specific allowances | Collective allowances | Total allowances | Provisions | Total 31.12.15 | Total 31.12.14 |
Due from banks | 3 | 0 | 3 | | 3 | 13 |
Loans | 683 | 6 | 689 | | 689 | 695 |
Cash collateral on securities borrowed | 0 | 0 | 0 | | 0 | 4 |
Provisions¹ | | | | 35 | 35 | 23 |
Balance at the end of the year | 686 | 6 | 692 | 35 | 727 | 735 |
1 Represents provisions for loan commitments and guarantees. |
Consolidated financial statements
Notes to the UBS AG consolidated financial statements
Note 13 Trading portfolio
CHF million | 31.12.15 | 31.12.14 |
| | |
Trading portfolio assets by issuer type¹ | | |
Debt instruments | | |
Government and government agencies | 18,768 | 16,625 |
of which: Switzerland | 119 | 293 |
of which: USA | 6,050 | 3,816 |
of which: United Kingdom | 3,915 | 2,103 |
of which: Australia | 1,649 | 2,307 |
of which: Sweden | 1,274 | 191 |
of which: Singapore | 1,259 | 822 |
of which: Germany | 796 | 1,280 |
Banks | 2,691 | 4,342 |
Corporates and other | 19,443 | 24,252 |
Total debt instruments | 40,902 | 45,219 |
Equity instruments | 63,984 | 69,763 |
Financial assets for unit-linked investment contracts | 15,519 | 17,410 |
Financial assets held for trading | 120,405 | 132,392 |
Precious metals and other physical commodities | 3,642 | 5,764 |
Total trading portfolio assets | 124,047 | 138,156 |
| | |
Trading portfolio liabilities by issuer type¹ | | |
Debt instruments | | |
Government and government agencies | 7,257 | 8,716 |
of which: Switzerland | 50 | 232 |
of which: USA | 2,754 | 2,987 |
of which: France | 915 | 1,259 |
of which: Italy | 838 | 569 |
of which: Australia | 798 | 1,087 |
of which: Japan | 725 | 810 |
of which: Germany | 510 | 335 |
Banks | 782 | 743 |
Corporates and other | 2,014 | 2,591 |
Total debt instruments | 10,053 | 12,050 |
Equity instruments | 19,084 | 15,908 |
Total trading portfolio liabilities | 29,137 | 27,958 |
1 Refer to Note 24e for more information on product type and fair value hierarchy categorization. |
Note 14 Derivative instruments and hedge accounting
Derivatives: overview
A derivative is a financial instrument, the value of which is derived from the value of one or more variables (underlyings). Underlyings may be indices, foreign currency exchange or interest rates, or the value of shares, commodities, bonds or other financial instruments. A derivative commonly requires little or no initial net investment by either counterparty to the trade.
The majority of derivative contracts are negotiated with respect to notional amounts, tenor, price and settlement mechanisms, as is customary with other financial instruments.
Over-the-counter (OTC) derivative contracts are usually traded under a standardized International Swaps and Derivatives Association (ISDA) master agreement between UBS AG and its counterparties. Terms are negotiated directly with counterparties and the contracts will have industry-standard settlement mechanisms prescribed by ISDA. The industry continues to promote the use of central counterparties (CCP) to clear OTC trades. The trend toward CCP clearing and settlement will generally facilitate the reduction of systemic credit exposures.
Other derivative contracts are standardized in terms of their amounts and settlement dates, and are bought and sold on regulated exchanges. These are commonly referred to as exchange-traded derivatives (ETD) contracts. Exchanges offer the benefits of pricing transparency, standardized daily settlement of changes in value, and consequently reduced credit risk.
For presentation purposes, UBS AG is subject to the IFRS netting provisions for derivative contracts. Derivative instruments are measured at fair value and generally classified as Positive replacement values and Negative replacement values on the face of the balance sheet. However, ETD which are economically settled on a daily basis and certain OTC derivatives which are in substance net settled on a daily basis are classified as Cash collateral receivables on derivative instruments or Cash collateral payables on derivative instruments. Changes in the replacement values of derivatives are recorded in Net trading income, unless the derivatives are designated and effective as hedging instruments in certain types of hedge accounting relationships.
® Refer to Note 1a item 15 for more information
Valuation principles and techniques applied in the measurement of derivative instruments are discussed in Note 24. Positive replacement values represent the estimated amount UBS AG would receive if the derivative contract were sold on the balance sheet date. Negative replacement values indicate the estimated amount UBS AG would pay to transfer its obligations in respect of the underlying contract, were it required or entitled to do so on the balance sheet date.
Derivatives embedded in other financial instruments are not included in the table “Derivative instruments” within this Note. Bifurcated embedded derivatives are presented on the same balance sheet line as the host contract. In cases where UBS AG applies the fair value option to hybrid instruments, bifurcation of an embedded derivative component is not required and as such, this component is also not included in the table “Derivative instruments.”
® Refer to Notes 20 and 24 for more information
Types of derivative instruments
UBS AG uses the following derivative financial instruments for both trading and hedging purposes. Through the use of the products listed below, UBS AG is engaged in extensive high-volume market-making and client facilitation trading referred to as the flow business.
The main types of derivative instruments used by UBS AG are:
– Swaps: Swaps are transactions in which two parties exchange cash flows on a specified notional amount for a predetermined period. Cross-currency swaps involve the exchange of interest payments based on two different currency notional amounts and reference interest rates and generally also entail exchange of notional amounts at the start or end of the contract. Most cross-currency swaps are traded in the OTC market.
– Forwards and futures: Forwards and futures are contractual obligations to buy or sell financial instruments or commodities on a future date at a specified price. Forward contracts are tailor-made agreements that are transacted between counterparties in the OTC market, whereas futures are standardized contracts transacted on regulated exchanges.
– Options and warrants: Options and warrants are contractual agreements under which, typically, the seller (writer) grants the purchaser the right, but not the obligation, either to buy (call option), or to sell (put option) at, or before, a set date, a specified quantity of a financial instrument or commodity at a predetermined price. The purchaser pays a premium to the seller for this right. Options involving more complex payment structures are also transacted. Options may be traded in the OTC market, or on a regulated exchange, and may be traded in the form of a security (warrant).
Consolidated financial statements
Notes to the UBS AG consolidated financial statements
Note 14 Derivative instruments and hedge accounting (continued)
The main derivative product types used by UBS AG are:
– Interest rate contracts: Interest rate products include interest rate swaps, forward rate agreements, swaptions and caps and floors.
– Credit derivative contracts: Credit default swaps (CDS) are the most common form of a credit derivative, under which the party buying protection makes one or more payments to the party selling protection in exchange for an undertaking by the seller to make a payment to the buyer following the occurrence of a contractually defined credit event with respect to a specified third-party credit entity. Settlement following a credit event may be a net cash amount, or cash in return for physical delivery of one or more obligations of the credit entity, and is made regardless of whether the protection buyer has actually suffered a loss. After a credit event and settlement, the contract is generally terminated. More information on credit derivatives is included in a separate section on the following pages. Total return swaps (TRS) are structured with one party making payments based on a set rate, either fixed or variable, plus any negative changes in fair value of an underlying asset, and the other party making payments based on the return of the asset, which includes both income it generates and any positive changes in its fair value.
– Foreign exchange contracts: Foreign exchange contracts include spot, forward and cross-currency swaps and options and warrants. Forward purchase and sale currency contracts are typically executed to meet client needs and for trading and hedging purposes.
– Equity / index contracts: UBS AG uses equity derivatives linked to single names, indices and baskets of single names and indices. The indices used may be based on a standard market index, or may be defined by UBS AG. The product types traded include vanilla listed derivatives, both options and futures, total return swaps, forwards and exotic OTC contracts.
– Commodities contracts: UBS AG has an established commodity derivatives trading business, which includes the commodity index and structured commodities business. The index and structured business are client facilitation businesses trading exchange-traded funds, OTC swaps and options on commodity indices and individual underlying commodities. The underlying indices cover third-party and UBS AG owned indices such as the UBS Bloomberg Constant Maturity Commodity Index and the Bloomberg Commodity Indices. All of the trading is cash-settled with no physical delivery of the underlying. UBS AG also has an established precious metals business in both flow and non-vanilla OTC products incorporating both physical and non-physical trading. The flow business is investor led and products include ETD, vanilla and certain non-vanilla OTC. The vanilla OTC are in forwards, swaps and options.
Measurement techniques applied to determine the fair value of each derivative product type are described in Note 24.
Risks of derivative instruments
Derivative instruments are transacted in many trading portfolios, which generally include several types of instruments, not just derivatives. The market risk of derivatives is predominantly managed and controlled as an integral part of the market risk of these portfolios. UBS AG’s approach to market risk is described in the audited sections of the “Risk management and control” section of this report.
Derivative instruments are transacted with many different counterparties, most of whom are also counterparties for other types of business. The credit risk of derivatives is managed and controlled in the context of UBS AG’s overall credit exposure to its counterparties. UBS AG’s approach to credit risk is described in the audited portions of Credit risk in the “Risk management and control” section of this report. It should be noted that, although the positive replacement values shown on the balance sheet can be an important component of UBS AG’s credit exposure, the positive replacement values for a counterparty are rarely an adequate reflection of UBS AG’s credit exposure in its derivatives business with that counterparty. This is generally the case because, on the one hand, replacement values can increase over time (potential future exposure), while on the other hand, exposure may be mitigated by entering into master netting agreements and bilateral collateral arrangements. Both the exposure measures used internally by UBS AG to control credit risk and the capital requirements imposed by regulators reflect these additional factors.
The replacement values presented on UBS AG’s balance sheet include netting in accordance with IFRS requirements (refer to Note 1a item 35), which is generally more restrictive than netting in accordance with Swiss federal banking law. Swiss federal banking law netting is generally based on close-out netting arrangements that are enforceable in case of insolvency.
® Refer to Note 26 for more information on the values of positive and negative replacement values after consideration of netting potential allowed under enforceable netting arrangements
Note 14 Derivative instruments and hedge accounting (continued)
| | 31.12.15 | | 31.12.14 |
CHF billion | | Total PRV² | Notional values related to PRVs³ | Total NRV⁴ | Notional values related to NRVs³ | Other notional values³˒⁵ | | Total PRV² | Notional values related to PRVs³ | Total NRV⁴ | Notional values related to NRVs³ | Other notional values³˒⁵ |
Interest rate contracts | | | | | | | | | | | | |
Over-the-counter (OTC) contracts | | | | | | | | | | | | |
Forward contracts⁶ | | 0.1 | 48.6 | 0.2 | 51.9 | 2,351.4 | | 0.1 | 49.0 | 0.2 | 55.9 | 2,622.8 |
Swaps | | 57.0 | 840.1 | 48.2 | 782.0 | 5,904.7 | | 91.8 | 1,323.4 | 83.7 | 1,233.4 | 10,244.3 |
Options | | 17.3 | 581.7 | 19.1 | 549.8 | | | 31.7 | 799.8 | 33.9 | 790.3 | |
Exchange-traded contracts | | | | | | | | | | | | |
Futures | | | | | | 346.0 | | | | | | 446.0 |
Options | | 0.0 | 22.7 | 0.0 | 15.5 | 169.4 | | 0.0 | 15.7 | 0.0 | 4.9 | 134.7 |
Agency transactions⁷ | | 0.1 | | 0.1 | | | | 0.1 | | 0.1 | | |
Total | | 74.5 | 1,493.1 | 67.6 | 1,399.3 | 8,771.4 | | 123.7 | 2,187.9 | 117.9 | 2,084.5 | 13,447.7 |
Credit derivative contracts | | | | | | | | | | | | |
Over-the-counter (OTC) contracts | | | | | | | | | | | | |
Credit default swaps | | 6.1 | 152.7 | 6.0 | 165.7 | | | 11.1 | 238.1 | 11.3 | 245.8 | |
Total return swaps | | 0.6 | 5.0 | 0.6 | 4.1 | | | 0.4 | 3.8 | 0.4 | 5.1 | |
Options and warrants | | 0.0 | 4.2 | 0.0 | 0.1 | | | 0.0 | 6.5 | 0.0 | 1.6 | |
Total | | 6.7 | 161.9 | 6.7 | 169.8 | | | 11.5 | 248.4 | 11.7 | 252.4 | |
Foreign exchange contracts | | | | | | | | | | | | |
Over-the-counter (OTC) contracts | | | | | | | | | | | | |
Forward contracts | | 17.8 | 727.6 | 16.6 | 673.9 | | | 20.6 | 817.6 | 19.2 | 741.4 | |
Interest and currency swaps | | 38.3 | 1,429.9 | 37.6 | 1,330.1 | | | 62.2 | 1,626.3 | 62.3 | 1,554.0 | |
Options | | 9.5 | 496.8 | 9.3 | 478.0 | | | 15.6 | 667.3 | 16.0 | 601.4 | |
Exchange-traded contracts | | | | | | | | | | | | |
Futures | | | | | | 8.1 | | | | | | 14.8 |
Options | | 0.0 | 3.4 | 0.0 | 4.6 | | | 0.0 | 4.9 | 0.1 | 3.7 | |
Agency transactions⁷ | | 0.0 | | 0.0 | | | | 0.0 | | 0.0 | | |
Total | | 65.7 | 2,657.7 | 63.5 | 2,486.6 | 8.1 | | 98.4 | 3,116.2 | 97.6 | 2,900.5 | 14.8 |
Equity / index contracts | | | | | | | | | | | | |
Over-the-counter (OTC) contracts | | | | | | | | | | | | |
Forward contracts | | 0.0 | 0.0 | 0.0 | 0.0 | | | 0.1 | 0.1 | 0.0 | 0.1 | |
Swaps | | 2.9 | 64.1 | 4.3 | 87.0 | | | 3.4 | 58.5 | 4.7 | 70.0 | |
Options | | 4.8 | 59.1 | 6.7 | 92.6 | | | 6.4 | 71.7 | 8.9 | 115.4 | |
Exchange-traded contracts | | | | | | | | | | | | |
Futures | | | | | | 30.0 | | | | | | 27.9 |
Options | | 4.3 | 107.2 | 5.2 | 126.0 | 13.4 | | 4.8 | 109.4 | 4.8 | 124.2 | 10.1 |
Agency transactions⁷ | | 5.0 | | 4.9 | | | | 4.9 | | 4.8 | | |
Total | | 16.9 | 230.3 | 21.2 | 305.6 | 43.3 | | 19.5 | 239.6 | 23.3 | 309.6 | 38.0 |
Table continues on the next page.
Consolidated financial statements
Notes to the UBS AG consolidated financial statements
Note 14 Derivative instruments and hedge accounting (continued)
Derivative instruments¹ (continued)
Table continued from the previous page.
| | 31.12.15 | | 31.12.14 |
CHF billion | | Total PRV² | Notional values related to PRVs³ | Total NRV⁴ | Notional values related to NRVs³ | Other notional values³˒⁵ | | Total PRV² | Notional values related to PRVs³ | Total NRV⁴ | Notional values related to NRVs³ | Other notional values³˒⁵ |
Commodity contracts | | | | | | | | | | | | |
Over-the-counter (OTC) contracts | | | | | | | | | | | | |
Forward contracts | | 0.3 | 2.8 | 0.3 | 2.3 | | | 0.3 | 4.6 | 0.3 | 4.4 | |
Swaps | | 0.7 | 9.9 | 0.5 | 9.4 | | | 0.9 | 13.8 | 0.5 | 7.9 | |
Options | | 0.9 | 11.8 | 0.6 | 7.5 | | | 0.9 | 12.5 | 0.7 | 9.8 | |
Exchange-traded contracts | | | | | | | | | | | | |
Futures | | | | | | 8.2 | | | | | | 7.3 |
Forward contracts | | 0.0 | 4.4 | 0.2 | 3.7 | | | 0.0 | 6.5 | 0.1 | 5.3 | |
Options | | 0.0 | 1.0 | 0.1 | 1.9 | 0.1 | | 0.0 | 0.8 | 0.1 | 3.7 | 0.1 |
Agency transactions⁷ | | 1.5 | | 1.5 | | | | 1.4 | | 1.4 | | |
Total | | 3.4 | 30.0 | 3.2 | 24.6 | 8.3 | | 3.6 | 38.1 | 3.2 | 31.1 | 7.3 |
Unsettled purchases of non-derivative financial investments⁸ | | 0.1 | 9.6 | 0.2 | 16.7 | | | 0.1 | 11.4 | 0.2 | 12.9 | |
Unsettled sales of non-derivative financial investments⁸ | | 0.2 | 20.1 | 0.1 | 6.4 | | | 0.2 | 16.1 | 0.1 | 9.1 | |
Total derivative instruments, based on IFRS netting⁹ | | 167.4 | 4,602.7 | 162.4 | 4,409.0 | 8,831.1 | | 257.0 | 5,857.8 | 254.1 | 5,600.2 | 13,507.9 |
1 Bifurcated embedded derivatives are presented on the same balance sheet lines as their host contracts and are excluded from this table. As of 31 December 2015, these derivatives amounted to a PRV of CHF 0.1 billion (related notional values of CHF 0.6 billion) and an NRV of CHF 0.2 billion (related notional values of CHF 3.4 billion). As of 31 December 2014, these derivatives amounted to a PRV of CHF 0.3 billion (related notional values of CHF 6.5 billion) and an NRV of CHF 0.3 billion (related notional values of CHF 7.8 billion). 2 PRV: Positive replacement value. 3 In cases where replacement values are presented on a net basis on the balance sheet, the respective notional values of the netted replacement values are still presented on a gross basis. 4 NRV: Negative replacement value. 5 Other notional values relate to derivatives which are cleared through either a central clearing counterparty or an exchange. The fair value of these derivatives is presented on the balance sheet net of the corresponding cash margin under Cash collateral receivables on derivative instruments and Cash collateral payables on derivative instruments and was not material for the periods presented. 6 Negative replacement values as of 31 December 2015 include CHF 0.1 billion related to derivative loan commitments (31 December 2014: CHF 0.0 billion). No notional amounts related to these replacement values are included the table. The maximum irrevocable amount related to these commitments was CHF 15.8 billion as of 31 December 2015 (31 December 2014: CHF 4.5 billion). 7 Notional values of exchange-traded agency transactions and OTC cleared transactions entered into on behalf of clients are not disclosed due to their significantly different risk profile. 8 Changes in the fair value of purchased and sold non-derivative financial investments between trade date and settlement date are recognized as replacement values. 9 Refer to Note 26 for more information on netting arrangements. |
The notional amount of a derivative is generally the quantity of the underlying instrument on which the derivative contract is based and is the reference against which changes in the value of the derivative are measured. Notional values, in themselves, are generally not a direct indication of the values which are exchanged between parties, and are therefore not a direct measure of risk or financial exposure, but are viewed as an indication of the scale of the different types of derivatives entered into by UBS AG.
The maturity profile of OTC interest rate contracts held as of 31 December 2015, based on notional values, was: approximately 53% (31 December 2014: 45%) mature within one year, 29% (31 December 2014: 34%) within one to five years and 18% (31 December 2014: 22%) after five years. Notional values of interest rate contracts cleared with a clearing house that qualify for IFRS balance sheet netting are presented under other notional values and are categorized into maturity buckets on the basis of contractual maturities of the cleared underlying derivative contracts.
Derivatives transacted for trading purposes
Most of UBS AG’s derivative transactions relate to sales and trading activities. Sales activities include the structuring and marketing of derivative products to customers to enable them to take, transfer, modify, or reduce current or expected risks. Trading activities include market-making to directly support the facilitation and execution of client activity. Market-making involves quoting bid and offer prices to other market participants with the intention of generating revenues based on spread and volume.
Credit derivatives
UBS AG is an active dealer in the fixed income market, including CDS and related products, with respect to a large number of issuers’ securities. The primary purpose of these activities is for the benefit of UBS AG’s clients through market-making activities and for the ongoing hedging of trading book exposures.
Note 14 Derivative instruments and hedge accounting (continued)
Market-making activity, which is undertaken within the Investment Bank, consists of buying and selling single-name CDS, index CDS, loan CDS and related referenced cash instruments to facilitate client trading activity. UBS AG also actively utilizes CDS to economically hedge specific counterparty credit risks in its accrual and traded loan portfolios (including off-balance sheet loan commitments) with the aim of reducing concentrations in individual names, sectors or specific portfolios.
In addition, UBS AG actively utilizes CDS to economically hedge specific counterparty credit risks in its OTC derivative portfolios including financial instruments which are designated at fair value through profit or loss.
The tables below provide further details on credit protection bought and sold, including replacement and notional value information by instrument type and counterparty type. The value of protection bought and sold is not, in isolation, a measure of UBS AG’s credit risk. Counterparty relationships are viewed in terms of the total outstanding credit risk, which relates to other instruments in addition to CDS, and in connection with collateral arrangements in place. On a notional value basis, credit protection bought and sold as of 31 December 2015 matures in a range of approximately 22% (31 December 2014: 27%) within one year, approximately 68% (31 December 2014: 64%) within one to five years and approximately 10% (31 December 2014: 8%) after five years.
Credit derivatives by type of instrument |
| | Protection bought | | Protection sold |
CHF billion | | Fair value: PRV | Fair value: NRV | Notional values | | Fair value: PRV | Fair value: NRV | Notional values |
Single-name credit default swaps | | 3.1 | 1.9 | 115.5 | | 1.9 | 2.9 | 105.1 |
Multi-name index linked credit default swaps | | 0.3 | 0.6 | 48.0 | | 0.6 | 0.5 | 45.6 |
Multi-name other credit default swaps | | 0.1 | 0.1 | 2.4 | | 0.0 | 0.1 | 1.8 |
Total rate of return swaps | | 0.5 | 0.2 | 6.3 | | 0.1 | 0.4 | 2.8 |
Options and warrants | | 0.0 | 0.0 | 4.2 | | 0.0 | 0.0 | 0.1 |
Total 31 December 2015 | | 4.0 | 2.8 | 176.4 | | 2.6 | 3.9 | 155.3 |
of which: credit derivatives related to economic hedges | | 2.7 | 2.4 | 152.8 | | 2.2 | 2.5 | 132.8 |
of which: credit derivatives related to market-making | | 1.4 | 0.4 | 23.6 | | 0.4 | 1.3 | 22.5 |
| | | | | | | | |
| | Protection bought | | Protection sold |
CHF billion | | Fair value: PRV | Fair value: NRV | Notional values | | Fair value: PRV | Fair value: NRV | Notional values |
Single-name credit default swaps | | 5.9 | 4.0 | 173.3 | | 3.0 | 5.6 | 148.8 |
Multi-name index linked credit default swaps | | 0.4 | 0.9 | 72.8 | | 1.7 | 0.5 | 80.7 |
Multi-name other credit default swaps | | 0.1 | 0.3 | 4.8 | | 0.0 | 0.1 | 3.4 |
Total rate of return swaps | | 0.1 | 0.3 | 5.4 | | 0.3 | 0.2 | 3.5 |
Options and warrants | | 0.0 | 0.0 | 6.5 | | 0.0 | 0.0 | 1.6 |
Total 31 December 2014 | | 6.5 | 5.4 | 262.8 | | 5.0 | 6.3 | 238.0 |
of which: credit derivatives related to economic hedges | | 3.2 | 5.0 | 245.5 | | 4.6 | 3.0 | 220.5 |
of which: credit derivatives related to market-making | | 3.3 | 0.4 | 17.3 | | 0.5 | 3.3 | 17.4 |
Consolidated financial statements
Notes to the UBS AG consolidated financial statements
Note 14 Derivative instruments and hedge accounting (continued)
Credit derivatives by counterparty | | |
| | Protection bought | | Protection sold |
CHF billion | | Fair value: PRV | Fair value: NRV | Notional values | | Fair value: PRV | Fair value: NRV | Notional values |
Broker-dealers | | 0.8 | 0.3 | 27.3 | | 0.2 | 0.6 | 19.5 |
Banks | | 1.9 | 1.3 | 78.0 | | 1.2 | 1.6 | 68.3 |
Central clearing counterparties | | 0.4 | 0.8 | 55.3 | | 0.9 | 0.9 | 58.9 |
Other | | 0.8 | 0.4 | 15.8 | | 0.3 | 0.8 | 8.7 |
Total 31 December 2015 | | 4.0 | 2.8 | 176.4 | | 2.6 | 3.9 | 155.3 |
| | | | | | | | |
| | Protection bought | | Protection sold |
CHF billion | | Fair value: PRV | Fair value: NRV | Notional values | | Fair value: PRV | Fair value: NRV | Notional values |
Broker-dealers | | 1.4 | 0.5 | 32.8 | | 0.3 | 1.1 | 23.5 |
Banks | | 4.0 | 2.9 | 156.4 | | 2.6 | 4.4 | 144.3 |
Central clearing counterparties | | 0.2 | 1.1 | 53.2 | | 1.3 | 0.3 | 56.7 |
Other | | 0.9 | 0.9 | 20.4 | | 0.8 | 0.5 | 13.5 |
Total 31 December 2014 | | 6.5 | 5.4 | 262.8 | | 5.0 | 6.3 | 238.0 |
UBS AG’s CDS trades are documented using industry standard forms of documentation or equivalent terms documented in a bespoke agreement. The agreements that govern CDS generally do not contain recourse provisions that would enable UBS AG to recover from third parties any amounts paid out by UBS AG.
The types of credit events that would require UBS AG to perform under a CDS contract are subject to agreement between the parties at the time of the transaction. However, nearly all transactions are traded using credit events that are applicable under certain market conventions based on the type of reference entity to which the transaction relates. Applicable credit events by market conventions include bankruptcy, failure to pay, restructuring, obligation acceleration and repudiation / moratorium.
Contingent collateral features of derivative liabilities
Certain derivative payables contain contingent collateral or termination features triggered upon a downgrade of the published credit rating of UBS AG in the normal course of business. Based on UBS AG’s credit ratings as of 31 December 2015, contractual outflows related to OTC derivative transactions of approximately CHF 0.2 billion, CHF 1.6 billion and CHF 1.9 billion would have been required in the event of a one-notch, two-notch and three-notch reduction in long-term credit ratings, respectively. In evaluating UBS AG’s liquidity requirements, UBS AG considers additional collateral or termination payments that would be required in the event of a reduction in UBS AG’s long-term credit ratings, and a corresponding reduction in short-term ratings.
Derivatives transacted for hedging purposes
Derivatives used for structural hedging
UBS AG enters into derivative transactions for the purposes of hedging risks inherent in assets, liabilities and forecast transactions. The accounting treatment of hedge transactions varies according to the nature of the instrument hedged and whether the hedge qualifies as such for accounting purposes.
Derivative transactions that qualify and are designated as hedges for accounting purposes are described under the corresponding headings in this Note (fair value hedges, cash flow hedges and hedges of net investments in foreign operations). UBS AG's accounting policies for derivatives designated and accounted for as hedging instruments are explained in Note 1a item 15, where terms used in the following sections are explained.
UBS AG has also entered into various hedging strategies utilizing derivatives for which hedge accounting has not been applied. These include interest rate swaps and other interest rate derivatives (e.g., futures) for day-to-day economic interest rate risk management purposes. In addition, UBS AG has used equity futures, options and, to a lesser extent, swaps for economic hedging in a variety of equity trading strategies to offset underlying equity and equity volatility exposure. UBS AG has also entered into CDS that provide economic hedges for credit risk exposures (refer to the credit derivatives section of this Note). Fair value changes of derivatives that are part of economic relationships, but do not qualify for hedge accounting treatment, are reported in Net trading income, except for the forward points on certain short duration foreign exchange contracts, which are reported in Net interest income.
Note 14 Derivative instruments and hedge accounting (continued)
Fair value hedges: interest rate risk related to debt instruments
UBS AG’s fair value hedges principally consist of interest rate swaps that are used to protect against changes in the fair value of fixed-rate debt instruments, such as non-structured fixed-rate bonds, covered bonds and subordinated debt, due to movements in market interest rates. The fair values of outstanding interest rate derivatives designated as fair value hedges were assets of CHF 1,656 million and liabilities of CHF 11 million as of 31 December 2015 and assets of CHF 2,236 million and liabilities of CHF 37 million as of 31 December 2014.
Fair value hedges of interest rate risk | | | | |
| | For the year ended |
CHF million | | 31.12.15 | 31.12.14 | 31.12.13 |
Gains / (losses) on hedging instruments | | 554 | 1,113 | (1,123) |
Gains / (losses) on hedged items attributable to the hedged risk | | (552) | (1,111) | 1,116 |
Net gains / (losses) representing ineffective portions of fair value hedges | | 2 | 2 | (7) |
Fair value hedges: portfolio interest rate risk related to loans
UBS AG also applies fair value hedge accounting to mortgage loan portfolio interest rate risk. The change in fair value of the hedged items is recorded separately from the hedged item and is included within Other assets on the balance sheet. The fair values of outstanding interest rate derivatives designated for these hedges as of 31 December 2015 were assets of CHF 7 million and liabilities of CHF 327 million (31 December 2014: liabilities of CHF 256 million).
Fair value hedge of portfolio of interest rate risk | | | | |
| | For the year ended |
CHF million | | 31.12.15 | 31.12.14 | 31.12.13 |
Gains / (losses) on hedging instruments | | (176) | (694) | 636 |
Gains / (losses) on hedged items attributable to the hedged risk | | 147 | 676 | (625) |
Net gains / (losses) representing ineffective portions of fair value hedges | | (29) | (18) | 11 |
Cash flow hedges of forecasted transactions
UBS AG is exposed to variability in future interest cash flows on non-trading financial assets and liabilities that bear interest at variable rates or are expected to be refinanced or reinvested in the future. The amounts and timing of future cash flows, representing both principal and interest flows, are projected based on contractual terms and other relevant factors including estimates of prepayments and defaults. The aggregate principal balances and interest cash flows across all portfolios over time form the basis for identifying the non-trading interest rate risk of UBS AG, which is hedged with interest rate swaps, the maximum maturity of which is 13 years. The table on the following page shows forecasted principal balances on which expected interest cash flows arise as of 31 December 2015. Amounts shown represent, by time bucket, average assets and liabilities subject to forecasted cash flows designated as hedged items in cash flow hedge accounting relationships.
As of 31 December 2015, the fair values of outstanding derivatives designated as cash flow hedges of forecasted transactions were CHF 2,176 million assets and CHF 195 million liabilities (31 December 2014: CHF 4,521 million assets and CHF 1,262 million liabilities).
In 2015, a gain of CHF 150 million was recognized in Net trading income due to hedge ineffectiveness, compared with a gain of CHF 87 million in 2014 and a loss of CHF 80 million in 2013.
Consolidated financial statements
Notes to the UBS AG consolidated financial statements
Note 14 Derivative instruments and hedge accounting (continued)
Principal balances subject to cash flow forecasts | | | | | |
CHF billion | Within 1 year | 1–3 years | 3–5 years | 5–10 years | Over 10 years |
Assets | 61 | 81 | 48 | 54 | 1 |
Liabilities | 4 | 7 | 3 | 3 | 0 |
Net balance | 57 | 74 | 45 | 51 | 1 |
Hedges of net investments in foreign operations
UBS AG applies hedge accounting for certain net investments in foreign operations. As of 31 December 2015, the positive replacement values and negative replacement values of FX derivatives (mainly FX swaps) designated as hedging instruments in net investment hedge accounting relationships were CHF 170 million and CHF 79 million, respectively (31 December 2014: positive replacement values of CHF 158 million and negative replacement values of CHF 305 million). As of 31 December 2015, the underlying hedged structural exposures in several currencies amounted to CHF 5.5 billion (31 December 2014: CHF 8.0 billion).
Hedges of structural FX exposures in currencies other than the US dollar may be comprised of two jointly designated derivatives as the foreign currency risk may be hedged against the US dollar first and then converted into Swiss francs, the presentation currency of UBS AG, as part of a separate FX derivative transaction. The aggregated notional amount of designated hedging derivatives as of 31 December 2015 was CHF 11.2 billion in total (31 December 2014: CHF 14.7 billion) including CHF 5.6 billion notional values related to US dollar versus Swiss franc swaps and CHF 5.6 billion notional values related to derivatives hedging foreign currencies (other than the US dollar) versus the US dollar. The effective portion of gains and losses of these FX swaps is transferred directly to OCI to offset foreign currency translation (FCT) gains and losses on the net investments in foreign branches and subsidiaries. As such, these FX swaps hedge the structural FX exposure resulting in the accumulation of FCT on the level of individual foreign branches and subsidiaries and hence on the total FCT OCI of UBS AG.
UBS AG designates certain non-derivative foreign currency financial assets and liabilities of foreign branches or subsidiaries as hedging instruments in net investment hedge accounting arrangements. The FX translation difference recorded in FCT OCI of the non-derivative hedging instrument of one foreign entity offsets the structural FX exposure of another foreign entity. Therefore, the aggregated FCT OCI of UBS AG is unchanged from this hedge designation. As of 31 December 2015, the nominal amount of non-derivative financial assets and liabilities designated as hedging instruments in such net investment hedges was CHF 3.1 billion and CHF 3.1 billion, respectively (31 December 2014: CHF 14.3 billion non-derivative financial assets and CHF 14.3 billion non-derivative financial liabilities).
Ineffectiveness of hedges of net investments in foreign operations was not material in 2015, 2014 and 2013.
Undiscounted cash flows
The table below provides undiscounted cash flows of all derivative instruments designated in hedge accounting relationships. Interest rate swap cash flows include cash inflows and cash outflows of all interest rate swaps designated in hedge accounting relationships, which are either assets or liabilities of UBS AG as of 31 December 2015. The table includes derivatives traded on an exchange or through a clearing house where the change in fair value is settled each day, either in fact or in substance, through cash payment of variation margin.
Derivatives designated in hedge accounting relationships (undiscounted cash flows) |
CHF billion | On demand | Due within 1 month | Due between 1 and 3 months | Due between 3 and 12 months | Due between 1 and 5 years | Due after 5 years | Total |
Interest rate swaps¹ | | | | | | | |
Cash inflows | 0 | 0 | 0 | 2 | 4 | 2 | 8 |
Cash outflows | 0 | 0 | 0 | 1 | 3 | 1 | 5 |
FX swaps / forwards | | | | | | | |
Cash inflows | 0 | 7 | 3 | 0 | 0 | 0 | 10 |
Cash outflows | 0 | 7 | 3 | 0 | 0 | 0 | 10 |
Net cash flows | 0 | 0 | 0 | 1 | 2 | 0 | 3 |
1 The table includes gross cash inflows and cash outflows of all interest rate swaps designated in hedge accounting relationships, which are either assets or liabilities of UBS as of 31 December 2015. |
Note 15 Financial investments available-for-sale
CHF million | 31.12.15 | 31.12.14 |
| | |
Financial investments available-for-sale by issuer type¹ | | |
Debt instruments | | |
Government and government agencies | 47,245 | 45,334 |
of which: Switzerland | 702 | 43 |
of which: USA | 21,424 | 17,219 |
of which: Germany | 8,583 | 10,145 |
of which: France | 3,566 | 5,351 |
of which: Netherlands | 2,934 | 2,528 |
of which: United Kingdom | 2,782 | 2,348 |
Banks | 12,268 | 8,490 |
Corporates and other | 2,385 | 2,670 |
Total debt instruments | 61,898 | 56,494 |
Equity instruments | 645 | 664 |
Total financial investments available-for-sale | 62,543 | 57,159 |
Unrealized gains – before tax | 462 | 430 |
Unrealized (losses) – before tax | (171) | (64) |
Net unrealized gains / (losses) – before tax | 291 | 365 |
Net unrealized gains / (losses) – after tax | 167 | 238 |
1 Refer to Note 24e for more information on product type and fair value hierarchy categorization. |
Consolidated financial statements
Notes to the UBS AG consolidated financial statements
Note 16 Property, equipment and software
At historical cost less accumulated depreciation |
CHF million | Own-used properties | Leasehold improvements | IT hardware and communication | Internally generated software | Purchased software | Other machines and equipment | Projects in progress | 31.12.15 | 31.12.14 |
Historical cost | | | | | | | | | |
Balance at the beginning of the year | 7,756 | 3,060 | 2,377 | 1,525 | 536 | 847 | 1,341 | 17,442 | 16,136 |
Additions | 68 | 47 | 262 | 26 | 85 | 26 | 1,331 | 1,846 | 1,690 |
Disposals / write-offs¹ | (181) | (97) | (750) | (54) | (210) | (30) | 0 | (1,322) | (518) |
Reclassifications | 220 | 194 | 21 | 888 | 9 | 27 | (1,394) | (35)⁶ | (359) |
Foreign currency translation | 0 | (36) | (39) | (9) | (9) | (8) | (7) | (108) | 493 |
Balance at the end of the year | 7,863 | 3,169 | 1,872 | 2,375 | 411 | 862 | 1,270 | 17,823 | 17,442 |
Accumulated depreciation | | | | | | | | | |
Balance at the beginning of the year | 4,365 | 2,120 | 1,976 | 1,089 | 452 | 592 | 0 | 10,593 | 10,140 |
Depreciation | 161 | 180 | 227 | 230 | 41 | 62 | 0 | 901 | 799 |
Impairment² | 2 | 10 | 1 | 3 | 0 | 1 | 0 | 18 | 19 |
Disposals / write-offs¹ | (157) | (81) | (748) | (46) | (209) | (29) | 0 | (1,270) | (474) |
Reclassifications | (11) | 1 | (2) | 0 | 2 | (14) | 0 | (25)⁶ | (217) |
Foreign currency translation | (3) | (25) | (35) | (1) | (8) | (6) | 0 | (77) | 326 |
Balance at the end of the year | 4,356 | 2,206 | 1,420 | 1,275 | 276 | 606 | 0 | 10,140 | 10,593 |
Net book value at the end of the year³˒⁴ | 3,506 | 963 | 452 | 1,100 | 135 | 256 | 1,270⁵ | 7,683 | 6,849⁷ |
1 Includes write-offs of fully depreciated assets. 2 Impairment charges recorded in 2015 relate to assets for which the recoverable amount was determined based on value-in-use (recoverable amount of the impaired assets: CHF 0 million Leasehold improvements, CHF 2 million Internally generated software). 3 As of 31 December 2015, contractual commitments to purchase property in the future amounted to approximately CHF 0.6 billion. 4 Includes CHF 47 million related to leased assets, mainly IT hardware and communication. 5 Includes CHF 928 million related to Internally generated software, CHF 86 million related to Own-used properties and CHF 257 million related to Leasehold improvements. 6 Reflects reclassifications to Properties held-for-sale (CHF 11 million on a net basis) reported within Other assets. 7 Excludes investment properties of CHF 5 million. |
Note 17 Goodwill and intangible assets
Introduction
UBS AG performs an impairment test on its goodwill assets on an annual basis, or when indicators of impairment exist. UBS AG considers the segments, as reported in Note 2, as separate cash-generating units (CGU). The impairment test is performed for each segment to which goodwill is allocated by comparing the recoverable amount, based on its value-in-use, to the carrying amount of the respective segment. An impairment charge is recognized if the carrying amount exceeds the recoverable amount. As of 31 December 2015, total goodwill recognized on the balance sheet was CHF 6.2 billion, of which CHF 1.3 billion, CHF 3.5 billion and CHF 1.4 billion was carried by Wealth Management, Wealth Management Americas and Asset Management, respectively. Based on the impairment testing methodology described below, UBS AG concluded that the goodwill balances as of 31 December 2015 allocated to these segments remain recoverable and thus were not impaired.
Methodology for goodwill impairment testing
The recoverable amounts are determined using a discounted cash flow model, which has been adapted to use inputs that consider features of the banking business and its regulatory environment. The recoverable amount of a segment is the sum of the discounted earnings attributable to shareholders from the first three forecasted years and the terminal value. The terminal value, which covers all periods beyond the third year, is calculated on the basis of the forecast of third-year profit, the discount rate and the long-term growth rate and is adjusted for the effect of the capital assumed to be needed to support the perpetual growth implied by the long-term growth rate.
The carrying amount for each segment is determined by reference to the Group’s equity attribution framework. Within this framework, which is described in the “Capital management” section of this report, the Board of Directors (BoD) attributes equity to the businesses after considering their risk exposure, risk-weighted assets and leverage ratio denominator usage, goodwill and intangible assets. The total amount of equity attributed to the business divisions can differ from UBS AG’s actual equity during a given period. The framework is primarily used for purposes of measuring the performance of the businesses and includes certain management assumptions. Attributed equity equals the capital that a segment requires to conduct its business and is considered an appropriate starting point from which to determine the carrying value of the segments. The attributed equity methodology is aligned with the business planning process, the inputs from which are used in calculating the recoverable amounts of the respective CGU.
® Refer to the “Capital management” section of this report for more information on the equity attribution framework
Assumptions
Valuation parameters used within UBS AG’s impairment test model are linked to external market information, where applicable. The model used to determine the recoverable amount is most sensitive to changes in the forecast earnings available to shareholders in years one to three, to changes in the discount rates, and to changes in the long-term growth rate. The applied long-term growth rate is based on long-term economic growth rates for different regions worldwide. Earnings available to shareholders are estimated based on forecast results, which are part of the business plan approved by the BoD.
The discount rates are determined by applying a capital-asset-pricing-model-based approach, as well as considering quantitative and qualitative inputs from both internal and external analysts and the view of management. The discount rates were unchanged between 2014 and 2015.
Key assumptions used to determine the recoverable amounts of each segment are tested for sensitivity by applying a reasonably possible change to those assumptions. Forecast earnings available to shareholders were changed by 10%, the discount rates were changed by 1.0 percentage point and the long-term growth rates were changed by 0.5 percentage point. Under all scenarios, the recoverable amounts for each segment exceeded the respective carrying amount, such that the reasonably possible changes in key assumptions would not result in impairment.
If the estimated earnings and other assumptions in future periods deviate from the current outlook, the value of goodwill may become impaired in the future, giving rise to losses in the income statement. Recognition of any impairment of goodwill would reduce IFRS equity and net profit. It would not impact cash flows and, as goodwill is required to be deducted from capital under the Basel capital framework, no impact would be expected on UBS AG's total capital ratios.
Consolidated financial statements
Notes to the UBS AG consolidated financial statements
Note 17 Goodwill and intangible assets (continued)
Discount and growth rates | | | | | | |
| | Discount rates | | Growth rates |
In % | | 31.12.15 | 31.12.14 | | 31.12.15 | 31.12.14 |
Wealth Management | | 9.0 | 9.0 | | 1.7 | 1.7 |
Wealth Management Americas | | 9.0 | 9.0 | | 2.4 | 2.4 |
Investment Bank | | 11.0 | 11.0 | | 2.4 | 2.4 |
Asset Management | | 9.0 | 9.0 | | 2.4 | 2.4 |
| | Goodwill | | Intangible assets | | | |
CHF million | | Total | | Infrastructure | Customer relationships, contractual rights and other | Total | | 31.12.15 | 31.12.14 |
Historical cost | | | | | | | | | |
Balance at the beginning of the year | | 6,368 | | 756 | 833 | 1,589 | | 7,957 | 7,283 |
Additions | | | | | 30 | 30 | | 30 | 17 |
Disposals | | (30) | | | (1) | (1) | | (32) | (1) |
Write-offs | | | | | (20) | (20) | | (20) | 0 |
Foreign currency translation | | (97) | | 5 | (22) | (16) | | (114) | 657 |
Balance at the end of the year | | 6,240 | | 761 | 820 | 1,581 | | 7,821 | 7,957 |
Accumulated amortization and impairment | | | | | | | | | |
Balance at the beginning of the year | | 0 | | 536 | 635 | 1,171 | | 1,171 | 990 |
Amortization | | | | 37 | 57 | 94 | | 94 | 80 |
Impairment¹ | | | | | 13 | 13 | | 13 | 2 |
Disposals | | | | | (1) | (1) | | (1) | 0 |
Write-offs | | | | | (20) | (20) | | (20) | 0 |
Foreign currency translation | | | | 5 | (10) | (5) | | (5) | 99 |
Balance at the end of the year | | 0 | | 578 | 675 | 1,253 | | 1,253 | 1,171 |
Net book value at the end of the year | | 6,240 | | 183 | 145 | 328 | | 6,568 | 6,785 |
1 Impairment charges recorded in 2015 and 2014 relate to assets for which the recoverable amount was determined based on value-in-use (recoverable amount of the impaired assets: CHF 4 million for 2015 and CHF 3 million for 2014). |
The table below presents the disclosure of goodwill and intangible assets by segment for the year ended 31 December 2015.
CHF million | | Wealth Management | | Wealth Management Americas | | Investment Bank | | Asset Management | | Corporate Center – Services | | Total |
Goodwill | | | | | | | | | | | | |
Balance at the beginning of the year | | 1,359 | | 3,490 | | 44 | | 1,476 | | | | 6,368 |
Additions | | | | | | | | | | | | 0 |
Disposals | | (7) | | | | | | (23) | | | | (30) |
Impairment | | | | | | | | | | | | 0 |
Foreign currency translation | | (40) | | 25 | | (14) | | (68) | | | | (97) |
Balance at the end of the year | | 1,312 | | 3,514 | | 29 | | 1,385 | | | | 6,240 |
Intangible assets | | | | | | | | | | | | |
Balance at the beginning of the year | | 45 | | 246 | | 84 | | 17 | | 25 | | 417 |
Additions / transfers | | | | 4 | | 0 | | | | 25 | | 30 |
Disposals | | | | | | 0 | | | | | | 0 |
Amortization | | (3) | | (51) | | (13) | | (5) | | (21) | | (94) |
Impairment | | | | | | (11) | | (2) | | | | (13) |
Foreign currency translation | | (4) | | 0 | | (6) | | (1) | | | | (12) |
Balance at the end of the year | | 38 | | 199 | | 53 | | 8 | | 30 | | 328 |
Note 17 Goodwill and intangible assets (continued)
The estimated, aggregated amortization expenses for intangible assets are as follows:
CHF million | Intangible assets |
Estimated, aggregated amortization expenses for: | |
2016 | 93 |
2017 | 66 |
2018 | 56 |
2019 | 45 |
2020 | 37 |
Thereafter | 23 |
Not amortized due to indefinite useful life | 9 |
Total | 328 |
CHF million | 31.12.15 | 31.12.14 |
Prime brokerage receivables¹ | 11,341 | 12,534 |
Recruitment loans to financial advisors | 3,184 | 2,909 |
Other loans to financial advisors | 418 | 372 |
Bail deposit² | 1,221 | 1,323 |
Accrued interest income | 462 | 453 |
Accrued income – other | 844 | 1,009 |
Prepaid expenses | 1,032 | 1,027 |
Net defined benefit pension and post-employment assets³ | 50 | 0 |
Settlement and clearing accounts | 402 | 616 |
VAT and other tax receivables | 397 | 272 |
Properties and other non-current assets held for sale | 134 | 236 |
Assets of disposal group held for sale⁴ | 279 | 0 |
Other | 2,485 | 2,317 |
Total other assets | 22,249 | 23,069 |
1 Prime brokerage services include clearance, settlement, custody, financing and portfolio reporting services for corporate clients trading across multiple asset classes. Prime brokerage receivables are mainly comprised of margin lending receivables. 2 Refer to item 1 in Note 22b for more information. 3 Refer to Note 28 for more information. 4 Refer to Note 32 for more information. |
Consolidated financial statements
Notes to the UBS AG consolidated financial statements
Balance sheet notes: liabilities
Note 19 Due to banks and customers
CHF million | 31.12.15 | 31.12.14 |
Due to banks | 11,836 | 10,492 |
Due to customers: demand deposits | 174,262 | 187,516 |
Due to customers: time deposits | 60,274 | 52,269 |
Due to customers: fiduciary deposits | 6,139 | 14,766 |
Due to customers: retail savings / deposits | 161,848 | 156,427 |
Total due to customers | 402,522 | 410,979 |
Total due to banks and customers | 414,358 | 421,471 |
Note 20 Financial liabilities designated at fair value
CHF million | 31.12.15 | 31.12.14 |
Non-structured fixed-rate bonds | 4,098 | 4,488 |
of which: issued by UBS AG with original maturity greater than one year¹˒² | 3,542 | 3,616 |
Structured debt instruments issued | | |
Equity-linked³ | 30,965 | 37,725 |
Credit-linked | 3,652 | 4,645 |
Rates-linked⁴ | 16,587 | 19,380 |
Other | 1,231 | 2,138 |
Total structured debt instruments issued | 52,436 | 63,888 |
of which: issued by UBS AG with original maturity greater than one year¹˒⁵ | 36,539 | 45,851 |
Structured over-the-counter debt instruments | | |
Equity-linked³ | 2,885 | 2,508 |
Other | 2,608 | 3,154 |
Total structured over-the-counter debt instruments | 5,493 | 5,662 |
of which: issued by UBS AG with original maturity greater than one year¹˒⁶ | 4,497 | 3,691 |
Repurchase agreements | 849 | 1,167 |
Loan commitments and guarantees⁷ | 119 | 93 |
Total | 62,995 | 75,297 |
of which: life-to-date own credit (gain) / loss | (287) | 302 |
1 Issued by UBS AG (standalone). Based on original contractual maturity without considering any early redemption features. 2 100% of the balance as of 31 December 2015 was unsecured. 3 Includes investment fund unit-linked instruments issued. 4 Includes non-structured rates-linked debt instruments issued. 5 More than 98% of the balance as of 31 December 2015 was unsecured. 6 More than 35% of the balance as of 31 December 2015 was unsecured. 7 Loan commitments recognized as “Financial liabilities designated at fair value” until drawn and recognized as loans. See Note 1a item 8 for additional information. |
As of 31 December 2015, the contractual redemption amount at maturity of Financial liabilities designated at fair value through profit or loss was CHF 0.1 billion higher than the carrying value. As of 31 December 2014, the contractual redemption amount at maturity of such liabilities was CHF 0.7 billion lower than the carrying value.
The table on the following page shows the residual contractual maturity of the carrying value of financial liabilities designated at fair value, split between fixed-rate and floating-rate instruments based on the contractual terms and does not consider any early redemption features. Interest rate ranges for future interest payments related to these financial liabilities designated at fair value have not been included in the table on the following page as a majority of these liabilities are structured products, and therefore the future interest payments are highly dependent upon the embedded derivative and prevailing market conditions at the time each interest payment is made.
® Refer to Note 27b for maturity information on an undiscounted cash flow basis
Note 20 Financial liabilities designated at fair value (continued)
Contractual maturity of carrying value | | | | | | |
CHF million | 2016 | 2017 | 2018 | 2019 | 2020 | 2021-2025 | Thereafter | Total 31.12.15 | Total 31.12.14 |
UBS AG¹ | | | | | | | | | |
Non-subordinated debt | | | | | | | | | |
Fixed-rate | 2,873 | 1,912 | 776 | 279 | 302 | 1,623 | 2,938 | 10,702 | 12,891 |
Floating-rate | 23,148 | 5,314 | 3,559 | 2,839 | 3,286 | 2,838 | 8,839 | 49,824 | 58,643 |
Subtotal | 26,021 | 7,226 | 4,335 | 3,118 | 3,588 | 4,461 | 11,777 | 60,526 | 71,535 |
Other subsidiaries² | | | | | | | | | |
Non-subordinated debt | | | | | | | | | |
Fixed-rate | 29 | 58 | 179 | 17 | 34 | 164 | 513 | 993 | 1,473 |
Floating-rate | 260 | 484 | 188 | 122 | 127 | 178 | 116 | 1,475 | 2,289 |
Subtotal | 288 | 542 | 367 | 139 | 161 | 342 | 629 | 2,469 | 3,762 |
Total | 26,310 | 7,768 | 4,702 | 3,257 | 3,749 | 4,803 | 12,406 | 62,995 | 75,297 |
1 Comprises instruments issued by UBS AG (standalone). 2 Comprises instruments issued by subsidiaries of UBS AG. |
Note 21 Debt issued held at amortized cost
CHF million | 31.12.15 | 31.12.14 |
Certificates of deposit | 11,967 | 16,591 |
Commercial paper | 3,824 | 4,841 |
Other short-term debt | 5,424 | 5,931 |
Short-term debt¹ | 21,215 | 27,363 |
Non-structured fixed-rate bonds | 31,240 | 24,582 |
of which: issued by UBS AG with original maturity greater than one year² | 31,078 | 24,433 |
Covered bonds | 8,490 | 13,614 |
Subordinated debt | 12,600 | 16,123 |
of which: phase-out additional tier 1 capital | 0 | 1,197 |
of which: low-trigger loss-absorbing tier 2 capital | 10,346 | 10,464 |
of which: phase-out tier 2 capital | 2,254 | 4,462 |
Debt issued through the central bond institutions of the Swiss regional or cantonal banks | 8,237 | 8,029 |
Other long-term debt | 577 | 1,495 |
of which: issued by UBS AG with original maturity greater than one year² | 278 | 861 |
Long-term debt³ | 61,144 | 63,844 |
Total debt issued held at amortized cost⁴ | 82,359 | 91,207 |
1 Debt with an original maturity of less than one year. 2 Issued by UBS AG (standalone). Based on original contractual maturity without considering any early redemption features. 100% of the balance as of 31 December 2015 was unsecured. 3 Debt with original maturity greater than or equal to one year. 4 Net of bifurcated embedded derivatives with a net negative fair value of CHF 130 million as of 31 December 2015 (31 December 2014: net negative fair value of CHF 25 million). |
UBS AG uses interest rate and foreign exchange derivatives to manage the risks inherent in certain debt instruments held at amortized cost. In certain cases, UBS AG applies hedge accounting for interest rate risk as discussed in Note 1a item 15 and Note 14. As a result of applying hedge accounting, the carrying value of debt issued increased by CHF 1,024 million and by CHF 1,703 million as of 31 December 2015 and 2014, respectively, reflecting changes in fair value due to interest rate movements.
Consolidated financial statements
Notes to the UBS AG consolidated financial statements
Note 21 Debt issued held at amortized cost (continued)
Subordinated debt consists of unsecured debt obligations that are contractually subordinated in right of payment to all other present and future non-subordinated obligations of the respective issuing entity. All of the subordinated debt instruments outstanding as of 31 December 2015 pay a fixed rate of interest.
The table below shows the residual contractual maturity of the carrying value of debt issued, split between fixed-rate and floating-rate based on the contractual terms and does not consider any early redemption features. The effects from interest rate swaps, which are used to hedge various fixed-rate debt issuances by changing the repricing characteristics into those similar to floating-rate debt, are also not considered in the table below.
® Refer to Note 27b for maturity information on an undiscounted cash flow basis
Contractual maturity dates of carrying value | | | | | | | |
CHF million, except where indicated | 2016 | 2017 | 2018 | 2019 | 2020 | 2021-2025 | Thereafter | Total 31.12.15 | Total 31.12.14 |
UBS AG¹ | | | | | | | | | |
Non-subordinated debt | | | | | | | | | |
Fixed-rate | 13,064 | 6,334 | 8,004 | 4,036 | 4,340 | 4,375 | 0 | 40,153 | 59,327 |
Interest rates (range in %) | 0-6.4 | 0-5.9 | 0-6.6 | 2.4-4.0 | 0-4.9 | 1.3-4.0 | | | |
Floating-rate | 10,014 | 3,721 | 963 | 939 | 239 | 0 | 2,031 | 17,907 | 11,296 |
Subordinated debt | | | | | | | | | |
Fixed-rate | 918 | 414 | 0 | 0 | 0 | 8,772 | 2,497 | 12,600 | 16,123 |
Interest rates (range in %) | 3.1-5.9 | 4.1-7.4 | | | | 4.8-8.8 | 4.8-7.8 | | |
Subtotal | 23,996 | 10,468 | 8,967 | 4,974 | 4,579 | 13,147 | 4,528 | 70,659 | 86,746 |
Subsidiaries² | | | | | | | | | |
Non-subordinated debt | | | | | | | | | |
Fixed-rate | 3,936 | 728 | 791 | 742 | 732 | 3,592 | 1,171 | 11,692 | 4,460 |
Interest rates (range in %) | 0-8.3 | 0.3-8.1 | 0.4-3.7 | 0.5-2.9 | 0.1-2.8 | 0-3.4 | 0.4-2.8 | | |
Floating-rate | 0 | 0 | 7 | 0 | 0 | 0 | 0 | 8 | 1 |
Subtotal | 3,936 | 728 | 798 | 742 | 732 | 3,593 | 1,171 | 11,700 | 4,462 |
Total | 27,932 | 11,196 | 9,765 | 5,717 | 5,311 | 16,740 | 5,699 | 82,359 | 91,207 |
1 Comprises debt issued by UBS AG (standalone). 2 Comprises debt issued by subsidiaries of UBS AG. |
Note 22 Provisions and contingent liabilities
a) Provisions | | | | | | | | | |
CHF million | Operational risks¹ | Litigation, regulatory and similar matters² | Restruc- turing | Loan com- mitments and guarantees | Real estate | Employee benefits⁵ | Other | Total 31.12.15 | Total 31.12.14 |
Balance at the beginning of the year | 50 | 3,053 | 647 | 23 | 153 | 215 | 224 | 4,366 | 2,971 |
Increase in provisions recognized in the income statement | 43 | 1,263 | 361 | 6 | 27 | 7 | 71 | 1,778 | 3,308 |
Release of provisions recognized in the income statement | (7) | (166) | (102) | (3) | (1) | (18) | (40) | (337) | (528) |
Provisions used in conformity with designated purpose | (37) | (1,174) | (287) | 0 | (28) | (1) | (133) | (1,660) | (1,659) |
Capitalized reinstatement costs | 0 | 0 | 0 | 0 | 5 | 0 | 0 | 5 | 0 |
Reclassifications | 0 | 0 | 0 | 9 | 0 | 0 | 0 | 9 | 8 |
Foreign currency translation / unwind of discount | (1) | 7 | 5 | 0 | 2 | (5) | (3) | 3 | 266 |
Balance at the end of the year | 47 | 2,983 | 624³ | 35 | 157⁴ | 198 | 120 | 4,163 | 4,366 |
1 Comprises provisions for losses resulting from security risks and transaction processing risks. 2 Comprises provisions for losses resulting from legal, liability and compliance risks. 3 Includes personnel related restructuring provisions of CHF 110 million as of 31 December 2015 (31 December 2014: CHF 116 million) and provisions for onerous lease contracts of CHF 514 million as of 31 December 2015 (31 December 2014: CHF 530 million). 4 Includes reinstatement costs for leasehold improvements of CHF 94 million as of 31 December 2015 (31 December 2014: CHF 98 million) and provisions for onerous lease contracts of CHF 62 million as of 31 December 2015 (31 December 2014: CHF 55 million). 5 Includes provisions for sabbatical and anniversary awards as well as provisions for severance which are not part of restructuring provisions. |
Restructuring provisions primarily relate to onerous lease contracts and severance payments. The utilization of onerous lease provisions is driven by the maturities of the underlying lease contracts. Severance-related provisions are utilized within a short time period, usually within six months, but potential changes in amount may be triggered when natural staff attrition reduces the number of people affected by a restructuring and therefore the estimated costs.
Information on provisions and contingent liabilities in respect of Litigation, regulatory and similar matters, as a class, is included in Note 22b. There are no material contingent liabilities associated with the other classes of provisions.
Consolidated financial statements
Notes to the UBS AG consolidated financial statements
Note 22 Provisions and contingent liabilities (continued)
b) Litigation, regulatory and similar matters
UBS operates in a legal and regulatory environment that exposes it to significant litigation and similar risks arising from disputes and regulatory proceedings. As a result, UBS (which for purposes of this Note may refer to UBS AG and / or one or more of its subsidiaries, as applicable) is involved in various disputes and legal proceedings, including litigation, arbitration, and regulatory and criminal investigations.
Such matters are subject to many uncertainties and the outcome is often difficult to predict, particularly in the earlier stages of a case. There are also situations where UBS may enter into a settlement agreement. This may occur in order to avoid the expense, management distraction or reputational implications of continuing to contest liability, even for those matters for which UBS believes it should be exonerated. The uncertainties inherent in all such matters affect the amount and timing of any potential outflows for both matters with respect to which provisions have been established and other contingent liabilities. UBS makes provisions for such matters brought against it when, in the opinion of management after seeking legal advice, it is more likely than not that UBS has a present legal or constructive obligation as a result of past events, it is probable that an outflow of resources will be required, and the amount can be reliably estimated. Where these factors are otherwise satisfied, a provision may be established for claims that have not yet been asserted against UBS, but are nevertheless expected to be, based on UBS’s experience with similar asserted claims. If any of those conditions is not met, such matters result in contingent liabilities. If the amount of an obligation cannot be reliably estimated, a liability exists that is not recognized even if an outflow of resources is probable. Accordingly, no provision is established even if the potential outflow of resources with respect to select matters could be significant.
Specific litigation, regulatory and other matters are described below, including all such matters that management considers to be material and others that management believes to be of significance due to potential financial, reputational and other effects. The amount of damages claimed, the size of a transaction or other information is provided where available and appropriate in order to assist users in considering the magnitude of potential exposures.
In the case of certain matters below, we state that we have established a provision, and for the other matters, we make no such statement. When we make this statement and we expect disclosure of the amount of a provision to prejudice seriously our position with other parties in the matter, because it would reveal what UBS believes to be the probable and reliably estimable outflow, we do not disclose that amount. In some cases, we are subject to confidentiality obligations that preclude such disclosure. With respect to the matters for which we do not state whether we have established a provision, either (a) we have not established a provision, in which case the matter is treated as a contingent liability under the applicable accounting standard or (b) we have established a provision but expect disclosure of that fact to prejudice seriously our position with other parties in the matter because it would reveal the fact that UBS believes an outflow of resources to be probable and reliably estimable.
With respect to certain litigation, regulatory and similar matters for which we have established provisions, we are able to estimate the expected timing of outflows. However, the aggregate amount of the expected outflows for those matters for which we are able to estimate expected timing is immaterial relative to our current and expected levels of liquidity over the relevant time periods.
Note 22 Provisions and contingent liabilities (continued)
The aggregate amount provisioned for litigation, regulatory and similar matters as a class is disclosed in Note 22a above. It is not practicable to provide an aggregate estimate of liability for our litigation, regulatory and similar matters as a class of contingent liabilities. Doing so would require us to provide speculative legal assessments as to claims and proceedings that involve unique fact patterns or novel legal theories, which have not yet been initiated or are at early stages of adjudication, or as to which alleged damages have not been quantified by the claimants. Although we therefore cannot provide a numerical estimate of the future losses that could arise from litigation, regulatory and similar matters, we believe that the aggregate amount of possible future losses from this class that are more than remote substantially exceeds the level of current provisions. Litigation, regulatory and similar matters may also result in non-monetary penalties and consequences. For example, the non-prosecution agreement (NPA) described in paragraph 5 of this Note, which we entered into with the US Department of Justice (DOJ), Criminal Division, Fraud Section in connection with our submissions of benchmark interest rates, including, among others, the British Bankers’ Association London Interbank Offered Rate (LIBOR), was terminated by the DOJ based on its determination that we had committed a US crime in relation to foreign exchange matters. As a consequence, UBS AG has pleaded guilty to one count of wire fraud for conduct in the LIBOR matter, and has agreed to pay a USD 203 million fine and accept a three-year term of probation. A guilty plea to, or conviction of, a crime (including as a result of termination of the NPA) could have material consequences for UBS. Resolution of regulatory proceedings may require us to obtain waivers of regulatory disqualifications to maintain certain operations, may entitle regulatory authorities to limit, suspend or terminate licenses and regulatory authorizations and may permit financial market utilities to limit, suspend or terminate our participation in such utilities. Failure to obtain such waivers, or any limitation, suspension or termination of licenses, authorizations or participations, could have material consequences for UBS.
The risk of loss associated with litigation, regulatory and similar matters is a component of operational risk for purposes of determining our capital requirements. Information concerning our capital requirements and the calculation of operational risk for this purpose is included in the “Capital management” section of this report.
Provisions for litigation, regulatory and similar matters by business division and Corporate Center unit¹ |
CHF million | Wealth Manage- ment | Wealth Manage- ment Americas | Personal & Corporate Banking | Asset Manage- ment | Investment Bank | CC – Services | CC – Group ALM | CC – Non-core and Legacy Portfolio | Total 31.12.15 | Total 31.12.14 |
Balance at the beginning of the year | 188 | 209 | 92 | 53 | 1,258 | 312 | 0 | 941 | 3,053 | 1,622 |
Increase in provisions recognized in the income statement | 114 | 372 | 0 | 0 | 17 | 15 | 0 | 744 | 1,263 | 2,941 |
Release of provisions recognized in the income statement | (10) | (19) | (3) | (3) | (15) | (1) | 0 | (115) | (166) | (395) |
Provisions used in conformity with designated purpose | (36) | (110) | (5) | (33) | (675) | (13) | 0 | (302) | (1,174) | (1,286) |
Reclassifications | 0 | 0 | 0 | 0 | 0 | 0 | 0 | 0 | 0 | (2) |
Foreign currency translation / unwind of discount | (12) | 7 | (2) | (1) | 0 | (3) | 0 | 18 | 7 | 172 |
Balance at the end of the year | 245 | 459 | 83 | 16 | 585 | 310 | 0 | 1,284 | 2,983 | 3,053 |
1 Provisions, if any, for the matters described in this Note are recorded in Wealth Management (item 3), Wealth Management Americas (item 4), Corporate Center – Services (item 7) and Corporate Center – Non-core and Legacy Portfolio (items 2 and 8). Provisions, if any, for the matters described in this Note in items 1 and 6 are allocated between Wealth Management and Personal & Corporate Banking, and provisions, if any, for the matters described in this Note in item 5 are allocated between the Investment Bank, Corporate Center – Services and Corporate Center – Non-core and Legacy Portfolio. |
Consolidated financial statements
Notes to the UBS AG consolidated financial statements
Note 22 Provisions and contingent liabilities (continued)
1. Inquiries regarding cross-border wealth management businesses
Tax and regulatory authorities in a number of countries have made inquiries, served requests for information or examined employees located in their respective jurisdictions relating to the cross-border wealth management services provided by UBS and other financial institutions. It is possible that implementation of automatic tax information exchange and other measures relating to cross-border provision of financial services could give rise to further inquiries in the future.
As a result of investigations in France, in 2013, UBS (France) S.A. and UBS AG were put under formal examination (“mise en examen”) for complicity in having illicitly solicited clients on French territory, and were declared witness with legal assistance (“témoin assisté”) regarding the laundering of proceeds of tax fraud and of banking and financial solicitation by unauthorized persons. In 2014, UBS AG was placed under formal examination with respect to the potential charges of laundering of proceeds of tax fraud, and the investigating judges ordered UBS to provide bail (“caution”) of EUR 1.1 billion. UBS AG appealed the determination of the bail amount, but both the appeal court (“Cour d’Appel”) and the French Supreme Court (“Cour de Cassation”) upheld the bail amount and rejected the appeal in full in late 2014. UBS AG has filed and has had accepted a petition to the European Court of Human Rights to challenge various aspects of the French court’s decision. In September 2015, the former CEO of UBS Wealth Management was placed under formal examination in connection with these proceedings. In addition, the investigating judges have sought to issue arrest warrants against three Swiss-based former employees of UBS AG who did not appear when summoned by the investigating judge. In February 2016, the investigating judge notified UBS that he does not intend to conduct further investigation. This notification commences a period in which the prosecutor may file a request for a judge to issue formal charges.
In March 2015, UBS (France) S.A. was placed under formal examination for complicity regarding the laundering of proceeds of tax fraud and of banking and financial solicitation by unauthorized persons for the years 2004 until 2008 and declared witness with legal assistance for the years 2009 to 2012. A bail of EUR 40 million was imposed, and was reduced by the Court of Appeals in May 2015 to EUR 10 million. Separately, in 2013, the French banking supervisory authority’s disciplinary commission reprimanded UBS (France) S.A. for having had insufficiencies in its control and compliance framework around its cross-border activities and know your customer obligations. It imposed a penalty of EUR 10 million, which was paid.
UBS AG has been notified by the Brussels public prosecutor’s office that it is investigating various aspects of UBS’s cross-border business.
In January 2015, UBS received inquiries from the US Attorney’s Office for the Eastern District of New York and from the US Securities and Exchange Commission (SEC), which are investigating potential sales to US persons of bearer bonds and other unregistered securities in possible violation of the Tax Equity and Fiscal Responsibility Act of 1982 (TEFRA) and the registration requirements of the US securities laws. UBS is cooperating with the authorities in these investigations.
UBS has, and reportedly numerous other financial institutions have, received inquiries from authorities concerning accounts relating to the Fédération Internationale de Football Association (FIFA) and other constituent soccer associations and related persons and entities. UBS is cooperating with authorities in these inquiries.
Our balance sheet at 31 December 2015 reflected provisions with respect to matters described in this item 1 in an amount that UBS believes to be appropriate under the applicable accounting standard. As in the case of other matters for which we have established provisions, the future outflow of resources in respect of such matters cannot be determined with certainty based on currently available information, and accordingly may ultimately prove to be substantially greater (or may be less) than the provision that we have recognized.
2. Claims related to sales of residential mortgage-backed securities and mortgages
From 2002 through 2007, prior to the crisis in the US residential loan market, UBS was a substantial issuer and underwriter of US residential mortgage-backed securities (RMBS) and was a purchaser and seller of US residential mortgages. A subsidiary of UBS, UBS Real Estate Securities Inc. (UBS RESI), acquired pools of residential mortgage loans from originators and (through an affiliate) deposited them into securitization trusts. In this manner, from 2004 through 2007, UBS RESI sponsored approximately USD 80 billion in RMBS, based on the original principal balances of the securities issued.
UBS RESI also sold pools of loans acquired from originators to third-party purchasers. These whole loan sales during the period 2004 through 2007 totaled approximately USD 19 billion in original principal balance.
We were not a significant originator of US residential loans. A subsidiary of UBS originated approximately USD 1.5 billion in US residential mortgage loans during the period in which it was active from 2006 to 2008, and securitized less than half of these loans.
Note 22 Provisions and contingent liabilities (continued)
RMBS-related lawsuits concerning disclosures: UBS is named as a defendant relating to its role as underwriter and issuer of RMBS in lawsuits related to approximately USD 6.2 billion in original face amount of RMBS underwritten or issued by UBS. Of the USD 6.2 billion in original face amount of RMBS that remains at issue in these cases, approximately USD 3.2 billion was issued in offerings in which a UBS subsidiary transferred underlying loans (the majority of which were purchased from third-party originators) into a securitization trust and made representations and warranties about those loans (UBS-sponsored RMBS). The remaining USD 3 billion of RMBS to which these cases relate was issued by third parties in securitizations in which UBS acted as underwriter (third-party RMBS).
In connection with certain of these lawsuits, UBS has indemnification rights against surviving third-party issuers or originators for losses or liabilities incurred by UBS, but UBS cannot predict the extent to which it will succeed in enforcing those rights.
UBS is a defendant in two lawsuits brought by the National Credit Union Administration (NCUA), as conservator for certain failed credit unions, asserting misstatements and omissions in the offering documents for RMBS purchased by the credit unions. Both lawsuits were filed in US District Courts, one in the District of Kansas and the other in the Southern District of New York (SDNY). The original principal balance at issue in the Kansas case is approximately USD 1.15 billion and the original principal balance at issue in the SDNY case is approximately USD 400 million. In February 2016, UBS made an offer of judgment to NCUA in the SDNY case, which NCUA has accepted, pursuant to which UBS will pay USD 33 million plus an amount of prejudgment interest that will be determined by the court and reasonable attorneys’ fees. Once these amounts are determined and judgment is entered, the SDNY case will end. Prejudgment interest and attorneys’ fees are expected to significantly increase the total amount to be paid in the SDNY case.
Lawsuits related to contractual representations and warranties concerning mortgages and RMBS: When UBS acted as an RMBS sponsor or mortgage seller, we generally made certain representations relating to the characteristics of the underlying loans. In the event of a material breach of these representations, we were in certain circumstances contractually obligated to repurchase the loans to which the representations related or to indemnify certain parties against losses. UBS has received demands to repurchase US residential mortgage loans as to which UBS made certain representations at the time the loans were transferred to the securitization trust aggregating approximately USD 4.1 billion in original principal balance. Of this amount, UBS considers claims relating to approximately USD 2 billion in original principal balance to be resolved, including claims barred by the statute of limitations. Substantially all of the remaining claims are in litigation, including the matters described in the next paragraph. UBS believes that new demands to repurchase US residential mortgage loans are time-barred under a decision rendered by the New York Court of Appeals.
In 2012, certain RMBS trusts filed an action (Trustee Suit) in the SDNY seeking to enforce UBS RESI’s obligation to repurchase loans in the collateral pools for three RMBS securitizations (Transactions) with an original principal balance of approximately USD 2 billion, for which Assured Guaranty Municipal Corp. (Assured Guaranty), a financial guaranty insurance company, had previously demanded repurchase. In January 2015, the court rejected plaintiffs’ efforts to seek damages for all loans purportedly in breach of representations and warranties in any of the three Transactions and limited plaintiffs to pursuing claims based solely on alleged breaches for loans identified in the complaint or other breaches that plaintiffs can establish were independently discovered by UBS. In February 2015, the court denied plaintiffs’ motion seeking reconsideration of its ruling. With respect to the loans subject to the Trustee Suit that were originated by institutions still in existence, UBS intends to enforce its indemnity rights against those institutions. Trial is currently scheduled for April 2016.
We also have tolling agreements with certain institutional purchasers of RMBS concerning their potential claims related to substantial purchases of UBS-sponsored or third-party RMBS.
Consolidated financial statements
Notes to the UBS AG consolidated financial statements
Note 22 Provisions and contingent liabilities (continued)
Provision for claims related to sales of residential mortgage-backed securities and mortgages |
USD million | 31.12.15 | 31.12.14 |
Balance at the beginning of the year | 849 | 817 |
Increase in provision recognized in the income statement | 662 | 239 |
Release of provision recognized in the income statement | (94) | (120) |
Provision used in conformity with designated purpose | (199) | (87) |
Balance at the end of the year | 1,218 | 849 |
Mortgage-related regulatory matters: In 2014, UBS received a subpoena from the US Attorney’s Office for the Eastern District of New York issued pursuant to the Financial Institutions Reform, Recovery and Enforcement Act of 1989 (FIRREA), which seeks documents and information related to UBS’s RMBS business from 2005 through 2007. In September 2015, the Eastern District of New York identified a number of transactions that are currently the focus of their inquiry, as to which we are providing additional information. UBS continues to respond to the FIRREA subpoena and to subpoenas from the New York State Attorney General (NYAG) relating to its RMBS business. In addition, UBS has also been responding to inquiries from both the Special Inspector General for the Troubled Asset Relief Program (SIGTARP) (who is working in conjunction with the US Attorney’s Office for Connecticut and the DOJ) and the SEC relating to trading practices in connection with purchases and sales of mortgage-backed securities in the secondary market from 2009 through the present. We are cooperating with the authorities in these matters. Numerous other banks reportedly are responding to similar inquiries from these authorities.
As reflected in the table “Provision for claims related to sales of residential mortgage-backed securities and mortgages,” our balance sheet at 31 December 2015 reflected a provision of USD 1,218 million with respect to matters described in this item 2. As in the case of other matters for which we have established provisions, the future outflow of resources in respect of this matter cannot be determined with certainty based on currently available information, and accordingly may ultimately prove to be substantially greater (or may be less) than the provision that we have recognized.
Note 22 Provisions and contingent liabilities (continued)
3. Madoff
In relation to the Bernard L. Madoff Investment Securities LLC (BMIS) investment fraud, UBS AG, UBS (Luxembourg) SA and certain other UBS subsidiaries have been subject to inquiries by a number of regulators, including the Swiss Financial Market Supervisory Authority (FINMA) and the Luxembourg Commission de Surveillance du Secteur Financier (CSSF). Those inquiries concerned two third-party funds established under Luxembourg law, substantially all assets of which were with BMIS, as well as certain funds established in offshore jurisdictions with either direct or indirect exposure to BMIS. These funds now face severe losses, and the Luxembourg funds are in liquidation. The last reported net asset value of the two Luxembourg funds before revelation of the Madoff scheme was approximately USD 1.7 billion in the aggregate, although that figure likely includes fictitious profit reported by BMIS. The documentation establishing both funds identifies UBS entities in various roles including custodian, administrator, manager, distributor and promoter, and indicates that UBS employees serve as board members. UBS (Luxembourg) SA and certain other UBS subsidiaries are responding to inquiries by Luxembourg investigating authorities, without, however, being named as parties in those investigations. In 2009 and 2010, the liquidators of the two Luxembourg funds filed claims on behalf of the funds against UBS entities, non-UBS entities and certain individuals including current and former UBS employees. The amounts claimed are approximately EUR 890 million and EUR 305 million, respectively. The liquidators have filed supplementary claims for amounts that the funds may possibly be held liable to pay the BMIS Trustee. These amounts claimed by the liquidator are approximately EUR 564 million and EUR 370 million, respectively. In addition, a large number of alleged beneficiaries have filed claims against UBS entities (and non-UBS entities) for purported losses relating to the Madoff scheme. The majority of these cases are pending in Luxembourg, where appeals were filed by the claimants against the 2010 decisions of the court in which the claims in a number of test cases were held to be inadmissible. In July 2014, the Luxembourg Court of Appeal dismissed one test appeal in its entirety, which decision was appealed by the investor. In July 2015, the Luxembourg Supreme Court found in favor of UBS and dismissed the investor’s appeal. In the US, the BMIS Trustee filed claims in 2010 against UBS entities, among others, in relation to the two Luxembourg funds and one of the offshore funds. The total amount claimed against all defendants in these actions was not less than USD 2 billion. Following a motion by UBS, in 2011, the SDNY dismissed all of the BMIS Trustee’s claims other than claims for recovery of fraudulent conveyances and preference payments that were allegedly transferred to UBS on the ground that the BMIS Trustee lacks standing to bring such claims. In 2013, the Second Circuit affirmed the District Court’s decision and, in June 2014, the US Supreme Court denied the BMIS Trustee’s petition seeking review of the Second Circuit ruling. In December 2014, several claims, including a purported class action, were filed in the US by BMIS customers against UBS entities, asserting claims similar to the ones made by the BMIS Trustee, seeking unspecified damages. One claim was voluntarily withdrawn by the plaintiff. In July 2015, following a motion by UBS, the SDNY dismissed the two remaining claims on the basis that the New York courts did not have jurisdiction to hear the claims against the UBS entities. In Germany, certain clients of UBS are exposed to Madoff-managed positions through third-party funds and funds administered by UBS entities in Germany. A small number of claims have been filed with respect to such funds. In January 2015, a court of appeal reversed a lower court decision in favor of UBS in one such case and ordered UBS to pay EUR 49 million, plus interest (approximately EUR 15.3 million). UBS filed an application for leave to appeal the decision. That application was rejected by the German Federal Supreme Court in December 2015, meaning that the Court of Appeal’s decision is final.
Consolidated financial statements
Notes to the UBS AG consolidated financial statements
Note 22 Provisions and contingent liabilities (continued)
4. Puerto Rico
Declines since August 2013 in the market prices of Puerto Rico municipal bonds and of closed-end funds (the funds) that are sole-managed and co-managed by UBS Trust Company of Puerto Rico and distributed by UBS Financial Services Incorporated of Puerto Rico (UBS PR) have led to multiple regulatory inquiries, as well as customer complaints and arbitrations with aggregate claimed damages of USD 1.6 billion, of which claims with aggregate claimed damages of approximately USD 374 million have been resolved through settlements or arbitration. The claims are filed by clients in Puerto Rico who own the funds or Puerto Rico municipal bonds and / or who used their UBS account assets as collateral for UBS non-purpose loans; customer complaint and arbitration allegations include fraud, misrepresentation and unsuitability of the funds and of the loans. A shareholder derivative action was filed in 2014 against various UBS entities and current and certain former directors of the funds, alleging hundreds of millions in losses in the funds. In 2015, defendants’ motion to dismiss was denied. Defendants are seeking leave to appeal that ruling to the Puerto Rico Supreme Court. In 2014, a federal class action complaint also was filed against various UBS entities, certain members of UBS PR senior management, and the co-manager of certain of the funds seeking damages for investor losses in the funds during the period from May 2008 through May 2014. Defendants have moved to dismiss that complaint. In March 2015, a class action was filed in Puerto Rico state court against UBS PR seeking equitable relief in the form of a stay of any effort by UBS PR to collect on non-purpose loans it acquired from UBS Bank USA in December 2013 based on plaintiffs’ allegation that the loans are not valid.
In 2014, UBS reached a settlement with the Office of the Commissioner of Financial Institutions for the Commonwealth of Puerto Rico (OCFI) in connection with OCFI’s examination of UBS’s operations from January 2006 through September 2013. Pursuant to the settlement, UBS contributed USD 3.5 million to an investor education fund, offered USD 1.68 million in restitution to certain investors and, among other things, committed to undertake an additional review of certain client accounts to determine if additional restitution would be appropriate. That review resulted in an additional USD 2.1 million in restitution being offered to certain investors.
In September 2015, the SEC and the Financial Industry Regulatory Authority (FINRA) announced settlements with UBS PR of their separate investigations stemming from the 2013 market events. Without admitting or denying the findings in either matter, UBS PR agreed in the SEC settlement to pay USD 15 million (which includes USD 1.18 million in disgorgement, a civil penalty of USD 13.63 million and pre-judgment interest), and USD 18.5 million in the FINRA matter (which includes up to USD 11 million in restitution to 165 UBS PR customers and a civil penalty of USD 7.5 million). The SEC settlement involves a charge against UBS PR of failing to supervise the activities of a former financial advisor who had recommended the impermissible investment of non-purpose loan proceeds into the UBS PR closed-end funds, in violation of firm policy and the customer loan agreements. In the FINRA settlement, UBS PR is alleged to have failed to supervise certain customer accounts which were both more than 75% invested in UBS PR closed-end funds and leveraged against those positions. We also understand that the DOJ is conducting a criminal inquiry into the impermissible reinvestment of non-purpose loan proceeds. We are cooperating with the authorities in this inquiry.
In 2011, a purported derivative action was filed on behalf of the Employee Retirement System of the Commonwealth of Puerto Rico (System) against over 40 defendants, including UBS PR and other consultants and underwriters, trustees of the System, and the President and Board of the Government Development Bank of Puerto Rico. The plaintiffs alleged that defendants violated their purported fiduciary duties and contractual obligations in connection with the issuance and underwriting of approximately USD 3 billion of bonds by the System in 2008 and sought damages of over USD 800 million. UBS is named in connection with its underwriting and consulting services. In 2013, the case was dismissed by the Puerto Rico Court of First Instance on the grounds that plaintiffs did not have standing to bring the claim, but that dismissal was subsequently overturned on appeal. Defendants have renewed their motion to dismiss the complaint on grounds not addressed when the court issued its prior ruling.
Also, in 2013, an SEC Administrative Law Judge dismissed a case brought by the SEC against two UBS executives, finding no violations. The charges had stemmed from the SEC’s investigation of UBS’s sale of closed-end funds in 2008 and 2009, which UBS settled in 2012. Beginning in 2012, two federal class action complaints, which were subsequently consolidated, were filed against various UBS entities, certain of the funds, and certain members of UBS PR senior management, seeking damages for investor losses in the funds during the period from January 2008 through May 2012 based on allegations similar to those in the SEC action. A motion for class certification was denied without prejudice to the right to refile the motion after limited discovery, and that motion has since been refiled.
Note 22 Provisions and contingent liabilities (continued)
In June 2015 Puerto Rico’s Governor stated that the Commonwealth is unable to meet its obligations. In addition, certain agencies and public corporations of the Commonwealth have held discussions with their creditors to restructure their outstanding debt, and certain agencies and public corporations of the Commonwealth have defaulted on certain interest payments that were due in August 2015 and January 2016. The United States Supreme Court has agreed to hear Puerto Rico’s appeal of a US District Court’s invalidation of the Puerto Rico Public Corporations Debt Enforcement and Recovery Act (the Act), under which Puerto Rico’s public corporations would be permitted to effect a mandatory restructuring of their respective debts with a specified creditor vote that would be binding on all applicable creditors, once approved by a court or, alternatively, under a court-supervised bankruptcy type restructuring. The foregoing events, any further defaults by the Commonwealth or its agencies and public corporations on (or any debt restructurings proposed by them with respect to) their outstanding debt, a Supreme Court decision upholding the Act (or sending it back to the District Court for further proceedings) and any further actions taken by Puerto Rico’s public corporations under the Act, as well as any market reactions to any of the foregoing, may increase the number of claims against UBS concerning Puerto Rico securities as well as potential damages sought.
Our balance sheet at 31 December 2015 reflected provisions with respect to matters described in this item 4 in amounts that UBS believes to be appropriate under the applicable accounting standard. As in the case of other matters for which we have established provisions, the future outflow of resources in respect of such matters cannot be determined with certainty based on currently available information, and accordingly may ultimately prove to be substantially greater (or may be less) than the provisions that we have recognized.
5. Foreign exchange, LIBOR, and benchmark rates, and other trading practices
Foreign exchange-related regulatory matters: Following an initial media report in 2013 of widespread irregularities in the foreign exchange markets, UBS immediately commenced an internal review of its foreign exchange business, which includes our precious metals and related structured products businesses. Since then, various authorities have commenced investigations concerning possible manipulation of foreign exchange markets, including FINMA, the Swiss Competition Commission (WEKO), the DOJ, the SEC, the US Commodity Futures Trading Commission (CFTC), the Board of Governors of the Federal Reserve System (Federal Reserve Board), the UK Financial Conduct Authority (FCA) (to which certain responsibilities of the UK Financial Services Authority (FSA) have passed), the UK Serious Fraud Office (SFO), the Australian Securities and Investments Commission (ASIC), the Hong Kong Monetary Authority (HKMA), the Korea Fair Trade Commission (KFTC) and the Brazil Competition Authority (CADE). In addition, WEKO is, and a number of other authorities reportedly are, investigating potential manipulation of precious metals prices. UBS has taken and will take appropriate action with respect to certain personnel as a result of its ongoing review.
In 2014, UBS reached settlements with the FCA and the CFTC in connection with their foreign exchange investigations, and FINMA issued an order concluding its formal proceedings with respect to UBS relating to its foreign exchange and precious metals businesses. UBS has paid a total of approximately CHF 774 million to these authorities, including GBP 234 million in fines to the FCA, USD 290 million in fines to the CFTC, and CHF 134 million to FINMA representing confiscation of costs avoided and profits. In May 2015, the Federal Reserve Board and the Connecticut Department of Banking issued an Order to Cease and Desist and Order of Assessment of a Civil Monetary Penalty Issued upon Consent (Federal Reserve Order) to UBS AG. As part of the Federal Reserve Order, UBS AG paid a USD 342 million civil monetary penalty.
Consolidated financial statements
Notes to the UBS AG consolidated financial statements
Note 22 Provisions and contingent liabilities (continued)
In May 2015, the DOJ’s Criminal Division (Criminal Division) terminated the December 2012 Non-Prosecution Agreement (NPA) with UBS AG related to UBS’s submissions of benchmark interest rates. As a result, UBS AG entered into a plea agreement with the Criminal Division pursuant to which UBS AG agreed to and did plead guilty to a one-count criminal information filed in the US District Court for the District of Connecticut charging UBS AG with one count of wire fraud in violation of 18 USC Sections 1343 and 2. Under the plea agreement, UBS AG agreed to a sentence that includes a USD 203 million fine and a three-year term of probation. The criminal information charges that between approximately 2001 and 2010, UBS AG engaged in a scheme to defraud counterparties to interest rate derivatives transactions by manipulating benchmark interest rates, including Yen LIBOR. Sentencing is currently scheduled for 9 May 2016. The Criminal Division terminated the NPA based on its determination, in its sole discretion, that certain UBS AG employees committed criminal conduct that violated the NPA, including fraudulent and deceptive currency trading and sales practices in conducting certain foreign exchange market transactions with clients and collusion with other participants in certain foreign exchange markets.
We have ongoing obligations to cooperate with these authorities and to undertake certain remediation, including actions to improve processes and controls.
UBS has been granted conditional immunity by the Antitrust Division of the DOJ (Antitrust Division) from prosecution for EUR / USD collusion and entered into a non-prosecution agreement covering other currency pairs. As a result, UBS AG will not be subject to prosecutions, fines or other sanctions for antitrust law violations by the Antitrust Division, subject to UBS AG’s continuing cooperation. However, the conditional immunity grant does not bar government agencies from asserting other claims and imposing sanctions against UBS AG, as evidenced by the settlements and ongoing investigations referred to above. UBS has also been granted conditional leniency by authorities in certain jurisdictions, including WEKO, in connection with potential competition law violations relating to precious metals, and as a result, will not be subject to prosecutions, fines or other sanctions for antitrust or competition law violations in those jurisdictions, subject to UBS AG’s continuing cooperation.
In October 2015, UBS AG settled charges with the SEC relating to structured notes issued by UBS AG that were linked to the UBS V10 Currency Index with Volatility Cap.
Investigations relating to foreign exchange and precious metals matters by numerous authorities, including the CFTC, remain ongoing notwithstanding these resolutions.
Foreign exchange-related civil litigation: Putative class actions have been filed since November 2013 in US federal courts and in other jurisdictions against UBS and other banks on behalf of putative classes of persons who engaged in foreign currency transactions with any of the defendant banks. They allege collusion by the defendants and assert claims under the antitrust laws and for unjust enrichment. In 2015, additional putative class actions were filed in federal court in New York against UBS and other banks on behalf of a putative class of persons who entered into or held any foreign exchange futures contracts and options on foreign exchange futures contracts since 1 January 2003. The complaints assert claims under the Commodity Exchange Act (CEA) and the US antitrust laws. In July 2015, a consolidated complaint was filed on behalf of both putative classes of persons covered by the US federal court class actions described above. UBS has entered into a settlement agreement that would resolve all of these US federal court class actions. The agreement, which has been preliminarily approved by the court and is subject to final court approval, requires, among other things, that UBS pay an aggregate of USD 141 million and provide cooperation to the settlement classes.
Note 22 Provisions and contingent liabilities (continued)
In June 2015, a putative class action was filed in federal court in New York against UBS and other banks on behalf of participants, beneficiaries, and named fiduciaries of plans qualified under the Employee Retirement Income Security Act of 1974 (ERISA) for whom a defendant bank provided foreign currency exchange transactional services, exercised discretionary authority or discretionary control over management of such ERISA plan, or authorized or permitted the execution of any foreign currency exchange transactional services involving such plan’s assets. The complaint asserts claims under ERISA.
In 2015, UBS was added to putative class actions pending against other banks in federal court in New York and other jurisdictions on behalf of putative classes of persons who bought or sold physical precious metals and various precious metal products and derivatives. The complaints in these lawsuits assert claims under the antitrust laws and the CEA, and other claims.
LIBOR and other benchmark-related regulatory matters: Numerous government agencies, including the SEC, the CFTC, the DOJ, the FCA, the SFO, the Monetary Authority of Singapore (MAS), the HKMA, FINMA, the various state attorneys general in the US, and competition authorities in various jurisdictions have conducted or are continuing to conduct investigations regarding submissions with respect to LIBOR and other benchmark rates. These investigations focus on whether there were improper attempts by UBS, among others, either acting on our own or together with others, to manipulate LIBOR and other benchmark rates at certain times.
In 2012, UBS reached settlements with the FSA, the CFTC and the Criminal Division of the DOJ in connection with their investigations of benchmark interest rates. At the same time, FINMA issued an order concluding its formal proceedings with respect to UBS relating to benchmark interest rates. UBS has paid a total of approximately CHF 1.4 billion in fines and disgorgement – including GBP 160 million in fines to the FSA, USD 700 million in fines to the CFTC, USD 500 million in fines to the DOJ, and CHF 59 million in disgorgement to FINMA. UBS Securities Japan Co. Ltd. (UBSSJ) entered into a plea agreement with the DOJ under which it entered a plea to one count of wire fraud relating to the manipulation of certain benchmark interest rates, including Yen LIBOR. UBS entered into an NPA with the DOJ, which (along with the plea agreement) covered conduct beyond the scope of the conditional leniency / immunity grants described below, required UBS to pay the USD 500 million fine to the DOJ after the sentencing of UBSSJ, and provided that any criminal penalties imposed on UBSSJ at sentencing be deducted from the USD 500 million fine. Under the NPA, we agreed, among other things, that for two years from 18 December 2012 UBS would not commit any US crime, and we would advise DOJ of any potentially criminal conduct by UBS or any of its employees relating to violations of US laws concerning fraud or securities and commodities markets. The term of the NPA was extended by one year to 18 December 2015. In May 2015, the Criminal Division terminated the NPA based on its determination, in its sole discretion, that certain UBS AG employees committed criminal conduct that violated the NPA. As a result, UBS entered into a plea agreement with the DOJ under which it entered a guilty plea to one count of wire fraud relating to the manipulation of certain benchmark interest rates, including Yen LIBOR, and agreed to pay a fine of USD 203 million and accept a three-year term of probation. Sentencing is currently scheduled for 9 May 2016.
In 2014, UBS reached a settlement with the European Commission (EC) regarding its investigation of bid-ask spreads in connection with Swiss franc interest rate derivatives and paid a EUR 12.7 million fine, which was reduced to this level based in part on UBS’s cooperation with the EC. The MAS, HKMA and the Japan Financial Services Agency have also resolved investigations of UBS (and in some cases, other banks). We have ongoing obligations to cooperate with the authorities with whom we have reached resolutions and to undertake certain remediation with respect to benchmark interest rate submissions.
Investigations by the CFTC, ASIC and other governmental authorities remain ongoing notwithstanding these resolutions.
Consolidated financial statements
Notes to the UBS AG consolidated financial statements
Note 22 Provisions and contingent liabilities (continued)
UBS has been granted conditional leniency or conditional immunity from authorities in certain jurisdictions, including the Antitrust Division of the DOJ, WEKO and the EC, in connection with potential antitrust or competition law violations related to submissions for Yen LIBOR and Euroyen TIBOR. WEKO has also granted UBS conditional immunity in connection with potential competition law violations related to submissions for CHF LIBOR and certain transactions related to CHF LIBOR. As a result of these conditional grants, we will not be subject to prosecutions, fines or other sanctions for antitrust or competition law violations in the jurisdictions where we have conditional immunity or leniency in connection with the matters covered by the conditional grants, subject to our continuing cooperation. However, the conditional leniency and conditional immunity grants we have received do not bar government agencies from asserting other claims and imposing sanctions against us, as evidenced by the settlements and ongoing investigations referred to above. In addition, as a result of the conditional leniency agreement with the DOJ, we are eligible for a limit on liability to actual rather than treble damages, were damages to be awarded in any civil antitrust action under US law based on conduct covered by the agreement and for relief from potential joint and several liability in connection with such civil antitrust action, subject to our satisfying the DOJ and the court presiding over the civil litigation of our cooperation. The conditional leniency and conditional immunity grants do not otherwise affect the ability of private parties to assert civil claims against us.
LIBOR and other benchmark-related civil litigation: A number of putative class actions and other actions are pending in, or expected to be transferred to, the federal courts in New York against UBS and numerous other banks on behalf of parties who transacted in certain interest rate benchmark-based derivatives. Also pending are actions asserting losses related to various products whose interest rate was linked to USD LIBOR, including adjustable rate mortgages, preferred and debt securities, bonds pledged as collateral, loans, depository accounts, investments and other interest-bearing instruments. All of the complaints allege manipulation, through various means, of various benchmark interest rates, including USD LIBOR, Euroyen TIBOR, Yen LIBOR, EURIBOR, CHF LIBOR, GBP LIBOR or USD ISDAFIX rates and seek unspecified compensatory and other damages under varying legal theories. In 2013, the court in the USD action dismissed the federal antitrust and racketeering claims of certain USD LIBOR plaintiffs and a portion of their claims brought under the CEA and state common law. Plaintiffs have appealed the dismissal, and the appeal remains pending. In 2014, the court in one of the Euroyen TIBOR lawsuits dismissed certain of the plaintiff’s claims, including federal antitrust claims. In 2015, the same court dismissed plaintiff's federal racketeering claims and affirmed its previous dismissal of plaintiff's antitrust claims. UBS and other defendants in other lawsuits including those related to EURIBOR, CHF LIBOR and GBP LIBOR have filed motions to dismiss.
Since September 2014, putative class actions have been filed in federal court in New York and New Jersey against UBS and other financial institutions, among others, on behalf of parties who entered into interest rate derivative transactions linked to ISDAFIX. The complaints, which have since been consolidated into an amended complaint, allege that the defendants conspired to manipulate ISDAFIX rates from 1 January 2006 through January 2014, in violation of US antitrust laws and the CEA, among other theories, and seeks unspecified compensatory damages, including treble damages. UBS and other defendants have filed a motion to dismiss, which remains pending.
Government bonds: Putative class actions have been filed in US federal courts against UBS and other banks on behalf of persons who participated in markets for US Treasury securities since 2007. The complaints generally allege that the banks colluded with respect to and manipulated prices of US Treasury securities sold at auction. They assert claims under the antitrust laws and the CEA and for unjust enrichment. The cases have been consolidated in the SDNY. Following filing of these complaints, UBS and reportedly other banks have received requests for information from various authorities regarding US Treasury securities and other government bond trading practices.
With respect to additional matters and jurisdictions not encompassed by the settlements and order referred to above, our balance sheet at 31 December 2015 reflected a provision in an amount that UBS believes to be appropriate under the applicable accounting standard. As in the case of other matters for which we have established provisions, the future outflow of resources in respect of such matters cannot be determined with certainty based on currently available information, and accordingly may ultimately prove to be substantially greater (or may be less) than the provision that we have recognized.
Note 22 Provisions and contingent liabilities (continued)
6. Swiss retrocessions
The Federal Supreme Court of Switzerland ruled in 2012, in a test case against UBS, that distribution fees paid to a firm for distributing third party and intra-group investment funds and structured products must be disclosed and surrendered to clients who have entered into a discretionary mandate agreement with the firm, absent a valid waiver.
FINMA has issued a supervisory note to all Swiss banks in response to the Supreme Court decision. The note sets forth the measures Swiss banks are to adopt, which include informing all affected clients about the Supreme Court decision and directing them to an internal bank contact for further details. UBS has met the FINMA requirements and has notified all potentially affected clients.
The Supreme Court decision has resulted, and may continue to result, in a number of client requests for UBS to disclose and potentially surrender retrocessions. Client requests are assessed on a case-by-case basis. Considerations taken into account when assessing these cases include, among others, the existence of a discretionary mandate and whether or not the client documentation contained a valid waiver with respect to distribution fees.
Our balance sheet at 31 December 2015 reflected a provision with respect to matters described in this item 6 in an amount that UBS believes to be appropriate under the applicable accounting standard. The ultimate exposure will depend on client requests and the resolution thereof, factors that are difficult to predict and assess. Hence, as in the case of other matters for which we have established provisions, the future outflow of resources in respect of such matters cannot be determined with certainty based on currently available information, and accordingly may ultimately prove to be substantially greater (or may be less) than the provision that we have recognized.
7. Banco UBS Pactual tax indemnity
Pursuant to the 2009 sale of Banco UBS Pactual S.A. (Pactual) by UBS to BTG Investments, LP (BTG), BTG has submitted contractual indemnification claims that UBS estimates amount to approximately BRL 2.4 billion, including interest and penalties, which is net of liabilities retained by BTG. The claims pertain principally to several tax assessments issued by the Brazilian tax authorities against Pactual relating to the period from December 2006 through March 2009, when UBS owned Pactual. The majority of these assessments relate to the deductibility of goodwill amortization in connection with UBS’s 2006 acquisition of Pactual and payments made to Pactual employees through various profit-sharing plans. These assessments are being challenged in administrative and judicial proceedings. In May 2015, the administrative court issued a decision that was largely in favor of the tax authority with respect to the goodwill amortization assessment. This decision has been appealed.
8. Matters relating to the CDS market
In 2013, the EC issued a Statement of Objections against 13 credit default swap (CDS) dealers including UBS, as well as data service provider Markit and the International Swaps and Derivatives Association (ISDA). The Statement of Objections broadly alleges that the dealers infringed European Union antitrust rules by colluding to prevent exchanges from entering the credit derivatives market between 2006 and 2009. In December 2015, the EC issued a statement that it had decided to close its investigation against all 13 dealers, including UBS. The EC’s investigation regarding Markit and ISDA is ongoing. Since mid-2009, the Antitrust Division of the DOJ has also been investigating whether multiple dealers, including UBS, conspired with each other and with Markit to restrain competition in the markets for CDS trading, clearing and other services. In 2014, putative class action plaintiffs filed consolidated amended complaints in the SDNY against 12 dealers, including UBS, as well as Markit and ISDA, alleging violations of the US Sherman Antitrust Act and common law. Plaintiffs allege that the defendants unlawfully conspired to restrain competition in and / or monopolize the market for CDS trading in the US in order to protect the dealers’ profits from trading CDS in the over-the-counter market. In September 2015, UBS and the other defendants entered into settlement agreements to resolve the litigation, pursuant to which UBS has paid USD 75 million out of a total settlement amount paid by all defendants of approximately USD 1.865 billion. The agreements have received preliminary court approval but are subject to final court approval.
Consolidated financial statements
Notes to the UBS AG consolidated financial statements
Note 23 Other liabilities
CHF million | 31.12.15 | 31.12.14 |
Prime brokerage payables¹ | 45,306 | 38,633 |
Amounts due under unit-linked investment contracts | 15,718 | 17,643 |
Compensation-related liabilities | 5,122 | 5,414 |
of which: accrued expenses | 2,827 | 2,583 |
of which: other deferred compensation plans | 1,559 | 1,457 |
of which: net defined benefit pension and post-employment liabilities² | 736 | 1,374 |
Third-party interest in consolidated investment funds | 594 | 707 |
Settlement and clearing accounts | 893 | 1,054 |
Current and deferred tax liabilities³ | 810 | 642 |
VAT and other tax payables | 446 | 420 |
Deferred income | 210 | 259 |
Accrued interest expenses | 1,438 | 1,327 |
Other accrued expenses | 2,492 | 2,472 |
Liabilities of disposal group held for sale⁴ | 235 | 0 |
Other | 1,343 | 1,820 |
Total other liabilities | 74,606 | 70,392 |
1 Prime brokerage services include clearance, settlement, custody, financing and portfolio reporting services for corporate clients trading across multiple asset classes. Prime brokerage payables are mainly comprised of client securities financing and deposits. 2 Refer to Note 28 for more information. 3 Refer to Note 8 for more information. 4 Refer to Note 32 for more information. |
Additional information
Note 24 Fair value measurement
This Note provides fair value measurement information for both financial and non-financial instruments and is structured as follows:
a) Valuation principles
b) Valuation governance
c) Valuation techniques
d) Valuation adjustments
e) Fair value measurements and classification within the fair value hierarchy
f) Transfers between Level 1 and Level 2 in the fair value hierarchy
g) Movements of Level 3 instruments
h) Valuation of assets and liabilities classified as Level 3
i) Sensitivity of fair value measurements to changes in unobservable input assumptions
j) Financial instruments not measured at fair value
Fair value is defined as the price that would be received for the sale of an asset or paid to transfer a liability in an orderly transaction between market participants in the principal market (or most advantageous market, in the absence of a principal market) as of the measurement date. In measuring fair value, UBS AG utilizes various valuation approaches and applies a hierarchy for prices and inputs that maximizes the use of observable market data, if available.
All financial and non-financial assets and liabilities measured or disclosed at fair value are categorized into one of three fair value hierarchy levels. In certain cases, the inputs used to measure fair value may fall within different levels of the fair value hierarchy. For disclosure purposes, the level in the hierarchy within which the instrument is classified in its entirety is based on the lowest level input that is significant to the position’s fair value measurement:
– Level 1 – quoted prices (unadjusted) in active markets for identical assets and liabilities;
– Level 2 – valuation techniques for which all significant inputs are, or are based on, observable market data or
– Level 3 – valuation techniques for which significant inputs are not based on observable market data.
If available, fair values are determined using quoted prices in active markets for identical assets or liabilities. An active market is one in which transactions for the asset or liability take place with sufficient frequency and volume to provide pricing data on an ongoing basis. Assets and liabilities that are quoted and traded in an active market are valued at the currently quoted price multiplied by the number of units of the instrument held.
Where the market for a financial instrument or non-financial asset or liability is not active, fair value is established using a valuation technique, including pricing models. Valuation techniques involve the use of estimates, the extent of which depends on the complexity of the instrument and the availability of market-based data. Valuation adjustments may be made to allow for additional factors including model, liquidity, credit and funding risks, which are not explicitly captured within the valuation technique, but which would nevertheless be considered by market participants when establishing a price. The limitations inherent in a particular valuation technique are considered in the determination of an asset or liability’s classification within the fair value hierarchy.
Many cash instruments and over-the-counter (OTC) derivative contracts have bid and offer prices that can be observed in the marketplace. Bid prices reflect the highest price that a party is willing to pay for an asset. Offer prices represent the lowest price that a party is willing to accept for an asset. In general, long positions are measured at a bid price and short positions at an offer price, reflecting the prices at which the instruments could be transferred under normal market conditions. Offsetting positions in the same financial instrument are marked at the mid-price within the bid-offer spread.
Generally, the unit of account for a financial instrument is the individual instrument, and UBS applies valuation adjustments at an individual instrument level, consistent with that unit of account. However, if certain conditions are met, UBS may estimate the fair value of a portfolio of financial assets and liabilities with substantially similar and offsetting risk exposures on the basis of the net open risks.
For transactions where the valuation technique used to measure fair value requires significant inputs that are not based on observable market data, the financial instrument is initially recognized at the transaction price. This initial recognition amount may differ from the fair value obtained using the valuation technique. Any such difference is deferred and not recognized in the income statement and referred to as deferred day-1 profit or loss.
® Refer to Note 24d for more information
Consolidated financial statements
Notes to the UBS AG consolidated financial statements
Note 24 Fair value measurement (continued)
UBS AG’s fair value measurement and model governance framework includes numerous controls and other procedural safeguards that are intended to maximize the quality of fair value measurements reported in the financial statements. New products and valuation techniques must be reviewed and approved by key stakeholders from risk and finance control functions. Responsibility for the ongoing measurement of financial and non-financial instruments at fair value resides with the business divisions. In carrying out their valuation responsibilities, the businesses are required to consider the availability and quality of external market data and to provide justification and rationale for their fair value estimates.
The fair value estimates provided by the businesses are validated by risk and finance control functions, which are independent of the business divisions. Independent price verification is performed by finance through benchmarking the business divisions’ fair value estimates with observable market prices and other independent sources. Controls and governance are in place to ensure the quality of third-party pricing sources where used. For instruments where valuation models are used to determine fair value, independent valuation and model control groups within finance and risk evaluate UBS AG's models on a regular basis, including valuation and model input parameters as well as pricing. As a result of the valuation controls employed, valuation adjustments may be made to the business divisions’ estimates of fair value to align with independent market data and the relevant accounting standard.
® Refer to Note 24d for more information
Valuation techniques are used to value positions for which a market price is not available from market sources. This includes certain less liquid debt and equity instruments, certain exchange-traded derivatives and all derivatives transacted in the OTC market. UBS AG uses widely recognized valuation techniques for determining the fair value of financial and non-financial instruments that are not actively traded and quoted. The most frequently applied valuation techniques include discounted value of expected cash flows, relative value and option pricing methodologies.
Discounted value of expected cash flows is a valuation technique that measures fair value using estimated expected future cash flows from assets or liabilities and then discounts these cash flows using a discount rate or discount margin that reflects the credit and / or funding spreads required by the market for instruments with similar risk and liquidity profiles to produce a present value. When using such valuation techniques, expected future cash flows are estimated using an observed or implied market price for the future cash flows or by using industry standard cash flow projection models. The discount factors within the calculation are generated using industry standard yield curve modeling techniques and models.
Relative value models measure fair value based on the market prices of equivalent or comparable assets or liabilities, making adjustments for differences between the characteristics of the observed instrument and the instrument being valued.
Option pricing models incorporate assumptions regarding the behavior of future price movements of an underlying referenced asset or assets to generate a probability-weighted future expected payoff for the option. The resulting probability-weighted expected payoff is then discounted using discount factors generated from industry standard yield curve modeling techniques and models. The option pricing model may be implemented using a closed-form analytical formula or other mathematical techniques (e.g., binomial tree or Monte Carlo simulation).
Where available, valuation techniques use market-observable assumptions and inputs. If such data is not available, inputs may be derived by reference to similar assets in active markets, from recent prices for comparable transactions or from other observable market data. In such cases, the inputs selected are based on historical experience and practice for similar or analogous instruments, derivation of input levels based on similar products with observable price levels and knowledge of current market conditions and valuation approaches.
For more complex instruments and instruments not traded in an active market, fair values may be estimated using a combination of observed transaction prices, consensus pricing services and relevant quotes. Consideration is given to the nature of the quotes (e.g., indicative or firm) and the relationship of recently evidenced market activity to the prices provided by consensus pricing services. UBS AG also uses internally developed models, which are typically based on valuation methods and techniques recognized as standard within the industry.
Note 24 Fair value measurement (continued)
Assumptions and inputs used in valuation techniques include benchmark interest rate curves, credit and funding spreads used in estimating discount rates, bond and equity prices, equity index prices, foreign exchange rates, levels of market volatility and correlation. Refer to Notes 24e and 24h for more information. The discount curves used by UBS AG incorporate the funding and credit characteristics of the instruments to which they are applied.
The output of a valuation technique is always an estimate of a fair value that cannot be measured with complete certainty. As a result, valuations are adjusted, where appropriate and when such factors would be considered by market participants in estimating fair value, to reflect close-out costs, credit exposure, model-driven valuation uncertainty, funding costs and benefits, trading restrictions and other factors. Valuation adjustments are an important component of fair value for assets and liabilities that are measured using valuation techniques. Such adjustments are applied to reflect uncertainties within the fair value measurement process, to adjust for an identified model simplification or to incorporate an aspect of fair value that requires an overall portfolio assessment rather than an evaluation based on an individual instrument level characteristic.
The major classes of valuation adjustments are discussed in further detail below.
Day-1 reserves
For new transactions where the valuation technique used to measure fair value requires significant inputs that are not based on observable market data, the financial instrument is initially recognized at the transaction price. The transaction price may differ from the fair value obtained using a valuation technique where any such difference is deferred and not initially recognized in the income statement. These day-1 profit or loss reserves are reflected, where appropriate, as valuation adjustments.
The table below summarizes the changes in deferred day-1 profit or loss reserves during the respective period. Amounts deferred are released and gains or losses are recorded in Net trading income when pricing of equivalent products or the underlying parameters become observable or when the transaction is closed out.
Deferred day-1 profit or loss | |
| | For the year ended |
CHF million | | 31.12.15 | 31.12.14 | 31.12.13 |
Balance at the beginning of the year | | 480 | 486 | 474 |
Profit / (loss) deferred on new transactions | | 268 | 344 | 694 |
(Profit) / loss recognized in the income statement | | (321) | (384) | (653) |
Foreign currency translation | | (6) | 35 | (29) |
Balance at the end of the year | | 421 | 480 | 486 |
Consolidated financial statements
Notes to the UBS AG consolidated financial statements
Note 24 Fair value measurement (continued)
Own credit adjustments on financial liabilities designated at fair value
In addition to considering the valuation of the derivative risk component, the valuation of fair value option liabilities also requires consideration of the funded component and specifically the own credit component of fair value. Own credit risk is reflected in the valuation of our fair value option liabilities where this component is considered relevant for valuation purposes by our counterparties and other market participants. On the other hand, own credit risk is not reflected in the valuation of our liabilities that are fully collateralized or for other obligations for which it is established market practice not to include an own credit component.
In 2015, UBS AG made enhancements to the valuation methodology for the own credit component of fair value of financial liabilities designated at fair value. Prior to the fourth quarter of 2015, own credit was estimated using a funds transfer pricing curve (FTP), which was derived by discounting UBS Group AG (consolidated) new issuance senior debt curve spreads, with the discount primarily reflecting the differences between the spreads in the senior unsecured debt market for UBS Group AG (consolidated) debt and the levels at which UBS Group AG (consolidated) medium-term notes (MTN) were issued. A decline in long-dated UBS Group AG (consolidated) MTN issuance volumes, following UBS Group AG’s (consolidated) business transformation, resulted in a reduction in the observable market data available to benchmark the FTP. From the fourth quarter of 2015 onwards, own credit is estimated using an own credit adjustment curve (OCA), which incorporates more observable market data, including market-observed secondary prices for UBS Group AG (consolidated) senior debt, UBS Group AG (consolidated) credit default swap (CDS) spreads and senior debt curves of peers. This change in accounting estimate was finalized in the fourth quarter of 2015, following a multi-period implementation project to develop an enhanced fair value approach supported by related infrastructure enhancements. The change was implemented on a prospective basis in the fourth quarter of 2015 and resulted in a gain of CHF 260 million on a total carrying amount of CHF 63 billion in financial liabilities designated at fair value.
OCA is generally a Level 2 pricing input. However, certain long-dated exposures that are beyond the tenors that are actively traded are classified as Level 3.
The effects of own credit adjustments related to financial liabilities designated at fair value (predominantly issued structured products) are summarized in the table below.
Life-to-date amounts reflect the cumulative change since initial recognition. The change in own credit for the period consists of changes in fair value that are attributable to the change in UBS AG’s credit spreads, as well as the effect of changes in fair values attributable to factors other than credit spreads, such as redemptions, effects from time decay and changes in interest and other market rates.
Own credit adjustments on financial liabilities designated at fair value | | | | |
| | As of or for the year ended |
CHF million | | 31.12.15 | 31.12.14 | 31.12.13 |
Gain / (loss) for the year ended | | 553 | 292 | (283) |
Life-to-date gain / (loss) | | 287 | (302) | (577) |
Note 24 Fair value measurement (continued)
Credit valuation adjustments
In order to measure the fair value of OTC derivative instruments, including funded derivative instruments which are classified as Financial assets designated at fair value, credit valuation adjustments (CVA) are necessary to reflect the credit risk of the counterparty inherent in these instruments. This amount represents the estimated fair value of protection required to hedge the counterparty credit risk of such instruments. A CVA is determined for each counterparty, considering all exposures to that counterparty, and is dependent on the expected future value of exposures, default probabilities and recovery rates, applicable collateral or netting arrangements, break clauses and other contractual factors.
Funding valuation adjustments
Funding valuation adjustments (FVA) reflect the costs and benefits of funding associated with uncollateralized and partially collateralized derivative receivables and payables and are calculated as the valuation impact from moving the discounting of the uncollateralized derivative cash flows from LIBOR to OCA using the CVA framework.
In the fourth quarter of 2015, as mentioned above, UBS AG replaced the FTP curve with the OCA curve for purposes of valuing its liabilities carried at fair value. As applied to the FVA associated with uncollateralized and partially collateralized derivative payables, the change resulted in a charge to the income statement of CHF 40 million.
An FVA is also applied to collateralized derivative assets in cases where the collateral cannot be sold or repledged.
Debit valuation adjustments
A debit valuation adjustment (DVA) is estimated to incorporate own credit in the valuation of derivatives, effectively consistent with the CVA framework. DVA is determined for each counterparty, considering all exposures with that counterparty and taking into account collateral netting agreements, expected future mark-to-market movements and UBS AG’s credit default spreads. Upon the implementation of FVA in the second half of 2014, UBS AG reversed DVA to the extent it overlapped with FVA.
Other valuation adjustments
Instruments that are measured as part of a portfolio of combined long and short positions are valued at mid-market levels to ensure consistent valuation of the long and short component risks. A liquidity valuation adjustment is then made to the overall net long or short exposure to move the fair value to bid or offer as appropriate, reflecting current levels of market liquidity. The bid-offer spreads used in the calculation of this valuation adjustment are obtained from market transactions and other relevant sources and are updated periodically.
Uncertainties associated with the use of model-based valuations are incorporated into the measurement of fair value through the use of model reserves. These reserves reflect the amounts that UBS AG estimates should be deducted from valuations produced directly by models to incorporate uncertainties in the relevant modeling assumptions, in the model and market inputs used, or in the calibration of the model output to adjust for known model deficiencies. In arriving at these estimates, UBS AG considers a range of market practices, including how it believes market participants would assess these uncertainties. Model reserves are reassessed periodically in light of data from market transactions, consensus pricing services and other relevant sources.
Valuation adjustments on financial instruments | | | |
| | As of |
Life-to-date gain / (loss), CHF billion | | 31.12.15 | 31.12.14 |
Credit valuation adjustments¹ | | (0.3) | (0.5) |
Funding valuation adjustments | | (0.2) | (0.1) |
Debit valuation adjustments | | 0.0 | 0.0 |
Other valuation adjustments | | (0.8) | (0.9) |
of which: liquidity | | (0.5) | (0.5) |
of which: model uncertainty | | (0.3) | (0.4) |
1 Amounts do not include reserves against defaulted counterparties. |
Consolidated financial statements
Notes to the UBS AG consolidated financial statements
Note 24 Fair value measurement (continued)
e) Fair value measurements and classification within the fair value hierarchy
The fair value hierarchy classification of financial and non-financial assets and liabilities measured at fair value is summarized in the table below. The narrative that follows describes the significant valuation inputs and assumptions for each class of assets and liabilities measured at fair value, the valuation techniques, where applicable, used in measuring their fair value, and the factors determining their classification within the fair value hierarchy.
Determination of fair values from quoted market prices or valuation techniques¹ |
| | 31.12.15 | | 31.12.14 |
CHF billion | | Level 1 | Level 2 | Level 3 | Total | | Level 1 | Level 2 | Level 3 | Total |
| | | | | | | | | | |
Assets measured at fair value on a recurring basis | | | | | | | | | | |
| | | | | | | | | | |
Financial assets held for trading² | | 96.4 | 21.9 | 2.1 | 120.4 | | 101.7 | 27.2 | 3.5 | 132.4 |
of which: | | | | | | | | | | |
Government bills / bonds | | 12.9 | 3.3 | 0.0 | 16.2 | | 8.8 | 4.7 | 0.0 | 13.6 |
Corporate bonds and municipal bonds, including bonds issued by financial institutions | | 0.2 | 8.1 | 0.7 | 9.0 | | 0.6 | 11.0 | 1.4 | 12.9 |
Loans | | 0.0 | 1.8 | 0.8 | 2.6 | | 0.0 | 2.2 | 1.1 | 3.2 |
Investment fund units | | 6.1 | 5.7 | 0.2 | 11.9 | | 6.7 | 6.4 | 0.3 | 13.4 |
Asset-backed securities | | 0.0 | 1.0 | 0.2 | 1.2 | | 0.0 | 1.5 | 0.6 | 2.1 |
Equity instruments | | 62.4 | 1.5 | 0.1 | 64.0 | | 68.8 | 0.8 | 0.1 | 69.8 |
Financial assets for unit-linked investment contracts | | 14.8 | 0.7 | 0.1 | 15.5 | | 16.8 | 0.6 | 0.1 | 17.4 |
| | | | | | | | | | |
Positive replacement values | | 0.5 | 164.0 | 2.9 | 167.4 | | 1.0 | 251.6 | 4.4 | 257.0 |
of which: | | | | | | | | | | |
Interest rate contracts | | 0.0 | 74.4 | 0.1 | 74.5 | | 0.0 | 123.4 | 0.2 | 123.7 |
Credit derivative contracts | | 0.0 | 5.4 | 1.3 | 6.7 | | 0.0 | 9.8 | 1.7 | 11.5 |
Foreign exchange contracts | | 0.3 | 64.9 | 0.5 | 65.7 | | 0.7 | 97.0 | 0.6 | 98.4 |
Equity / index contracts | | 0.0 | 15.9 | 1.0 | 16.9 | | 0.0 | 17.7 | 1.9 | 19.5 |
Commodity contracts | | 0.0 | 3.4 | 0.0 | 3.4 | | 0.0 | 3.6 | 0.0 | 3.6 |
| | | | | | | | | | |
Financial assets designated at fair value | | 0.2 | 2.3 | 3.3 | 5.8 | | 0.1 | 0.9 | 3.5 | 4.5 |
of which: | | | | | | | | | | |
Loans (including structured loans) | | 0.0 | 2.3 | 1.7 | 4.0 | | 0.0 | 0.8 | 1.0 | 1.7 |
Structured reverse repurchase and securities borrowing agreements | | 0.0 | 0.0 | 1.5 | 1.6 | | 0.0 | 0.1 | 2.4 | 2.5 |
Other | | 0.2 | 0.0 | 0.1 | 0.3 | | 0.1 | 0.0 | 0.1 | 0.3 |
| | | | | | | | | | |
Financial investments available-for-sale | | 34.2 | 27.7 | 0.7 | 62.5 | | 32.7 | 23.9 | 0.6 | 57.2 |
of which: | | | | | | | | | | |
Government bills / bonds | | 31.1 | 2.0 | 0.0 | 33.1 | | 30.3 | 2.8 | 0.0 | 33.1 |
Corporate bonds and municipal bonds, including bonds issued by financial institutions | | 3.0 | 22.2 | 0.0 | 25.2 | | 2.2 | 16.9 | 0.0 | 19.1 |
Investment fund units | | 0.0 | 0.1 | 0.1 | 0.2 | | 0.0 | 0.1 | 0.2 | 0.3 |
Asset-backed securities | | 0.0 | 3.4 | 0.0 | 3.4 | | 0.0 | 4.0 | 0.0 | 4.0 |
Equity instruments | | 0.1 | 0.0 | 0.5 | 0.6 | | 0.2 | 0.1 | 0.4 | 0.7 |
| | | | | | | | | | |
Non-financial assets | | | | | | | | | | |
Precious metals and other physical commodities | | 3.7 | 0.0 | 0.0 | 3.7 | | 5.8 | 0.0 | 0.0 | 5.8 |
| | | | | | | | | | |
Assets measured at fair value on a non-recurring basis | | | | | | | | | | |
Other assets³ | | 0.3 | 0.1 | 0.1 | 0.4 | | 0.0 | 0.1 | 0.2 | 0.2 |
Total assets measured at fair value | | 135.2 | 216.0 | 9.0 | 360.3 | | 141.4 | 303.5 | 12.2 | 457.1 |
Note 24 Fair value measurement (continued)
Determination of fair values from quoted market prices or valuation techniques¹ (continued) |
| | 31.12.15 | | 31.12.14 |
CHF billion | | Level 1 | Level 2 | Level 3 | Total | | Level 1 | Level 2 | Level 3 | Total |
| | | | | | | | | | |
Liabilities measured at fair value on a recurring basis | | | | | | | | | | |
| | | | | | | | | | |
Trading portfolio liabilities | | 25.5 | 3.5 | 0.2 | 29.1 | | 23.9 | 3.9 | 0.1 | 28.0 |
of which: | | | | | | | | | | |
Government bills / bonds | | 6.0 | 0.8 | 0.0 | 6.8 | | 7.0 | 1.2 | 0.0 | 8.2 |
Corporate bonds and municipal bonds, including bonds issued by financial institutions | | 0.0 | 2.4 | 0.1 | 2.5 | | 0.1 | 2.4 | 0.1 | 2.6 |
Investment fund units | | 0.7 | 0.1 | 0.0 | 0.7 | | 1.1 | 0.1 | 0.0 | 1.2 |
Asset-backed securities | | 0.0 | 0.0 | 0.0 | 0.0 | | 0.0 | 0.0 | 0.0 | 0.0 |
Equity instruments | | 18.8 | 0.2 | 0.0 | 19.1 | | 15.7 | 0.1 | 0.0 | 15.9 |
| | | | | | | | | | |
Negative replacement values | | 0.6 | 158.5 | 3.3 | 162.4 | | 1.1 | 248.1 | 5.0 | 254.1 |
of which: | | | | | | | | | | |
Interest rate contracts | | 0.0 | 67.2 | 0.3 | 67.6 | | 0.0 | 117.3 | 0.6 | 117.9 |
Credit derivative contracts | | 0.0 | 5.4 | 1.3 | 6.7 | | 0.0 | 10.0 | 1.7 | 11.7 |
Foreign exchange contracts | | 0.3 | 63.0 | 0.2 | 63.5 | | 0.7 | 96.6 | 0.3 | 97.6 |
Equity / index contracts | | 0.0 | 19.7 | 1.4 | 21.2 | | 0.0 | 20.9 | 2.4 | 23.3 |
Commodity contracts | | 0.0 | 3.2 | 0.0 | 3.2 | | 0.0 | 3.2 | 0.0 | 3.2 |
| | | | | | | | | | |
Financial liabilities designated at fair value | | 0.0 | 52.3 | 10.7 | 63.0 | | 0.0 | 63.4 | 11.9 | 75.3 |
of which: | | | | | | | | | | |
Non-structured fixed-rate bonds | | 0.0 | 1.5 | 2.6 | 4.1 | | 0.0 | 2.3 | 2.2 | 4.5 |
Structured debt instruments issued | | 0.0 | 45.7 | 6.7 | 52.4 | | 0.0 | 56.6 | 7.3 | 63.9 |
Structured over-the-counter debt instruments | | 0.0 | 4.7 | 0.8 | 5.5 | | 0.0 | 4.1 | 1.5 | 5.7 |
Structured repurchase agreements | | 0.0 | 0.3 | 0.6 | 0.8 | | 0.0 | 0.3 | 0.9 | 1.2 |
Loan commitments and guarantees | | 0.0 | 0.1 | 0.0 | 0.1 | | 0.0 | 0.1 | 0.0 | 0.1 |
| | | | | | | | | | |
Other liabilities – amounts due under unit-linked investment contracts | | 0.0 | 15.7 | 0.0 | 15.7 | | 0.0 | 17.6 | 0.0 | 17.6 |
| | | | | | | | | | |
Liabilities measured at fair value on a non-recurring basis | | | | | | | | | | |
Other liabilities³ | | 0.0 | 0.2 | 0.0 | 0.2 | | 0.0 | 0.0 | 0.0 | 0.0 |
Total liabilities measured at fair value | | 26.1 | 230.3 | 14.1 | 270.5 | | 25.0 | 333.0 | 17.0 | 375.0 |
1 Bifurcated embedded derivatives are presented on the same balance sheet lines as their host contracts and are excluded from this table. As of 31 December 2015, net bifurcated embedded derivative liabilities held at fair value, totaling CHF 0.1 billion (of which CHF 0.1 billion were net Level 2 assets and CHF 0.2 billion net Level 2 liabilities) were recognized on the balance sheet within Debt issued. As of 31 December 2014, net bifurcated embedded derivative liabilities held at fair value, totaling CHF 0.0 billion (of which CHF 0.3 billion were net Level 2 assets and CHF 0.3 billion net Level 2 liabilities) were recognized on the balance sheet within Debt issued. 2 Financial assets held for trading do not include precious metals and other physical commodities. 3 Other assets and other liabilities primarily consist of assets held for sale as well as assets and liabilities of a disposal group held for sale, which are measured at the lower of their net carrying amount or fair value less costs to sell. Refer to Note 32 for more information on the disposal group held for sale. |
Consolidated financial statements
Notes to the UBS AG consolidated financial statements
Note 24 Fair value measurement (continued)
Financial assets and liabilities held for trading, financial assets designated at fair value and financial investments classified as available-for-sale
Government bills and bonds
Government bills and bonds include fixed-rate, floating-rate and inflation-linked bills and bonds issued by sovereign governments, as well as interest and principal strips based on these bonds. Such instruments are generally traded in active markets and prices can be obtained directly from these markets, resulting in classification as Level 1, while the remaining positions are classified as Level 2. Instruments that cannot be priced directly using active market data are valued using discounted cash flow valuation techniques that incorporate market data for similar government instruments converted into yield curves. These yield curves are used to project future index levels, and to discount expected future cash flows. The main inputs to valuation techniques for these instruments are bond prices and inputs to estimate the future index levels for floating or inflation index-linked instruments. Instruments classified as Level 3 are limited and are generally classified as such due to the requirement to extrapolate yield curve inputs outside the range of active market trading.
Corporate and municipal bonds
Corporate bonds include senior, junior and subordinated debt issued by corporate entities. Municipal bonds are issued by state and local governments. While most instruments are standard fixed or floating-rate securities, some may have more complex coupon or embedded option features. Corporate and municipal bonds are generally valued using prices obtained directly from the market. In cases where no directly comparable price is available, instruments may be valued using yields derived from other securities by the same issuer or benchmarked against similar securities, adjusted for seniority, maturity and liquidity. Instruments that cannot be priced directly using active market data are valued using discounted cash flow valuation techniques incorporating the credit spread of the issuer, which may be derived from other issuances or CDS data for the issuer, estimated with reference to other equivalent issuer price observations or from credit modeling techniques. Corporate bonds are typically classified as Level 2 because, although market data is readily available, there is often insufficient third-party trading transaction data to justify an active market and corresponding Level 1 classification. Municipal bonds are generally classified as Level 1 or Level 2 depending on the depth of trading activity behind price sources. Level 3 instruments have no suitable price available and also cannot be referenced to other securities issued by the same issuer. Therefore, these instruments are measured based on price levels for similar issuers adjusted for relative tenor and issuer quality.
Convertible bonds are generally valued using prices obtained directly from market sources. In cases where no directly comparable price is available, issuances may be priced using a convertible bond model, which values the embedded equity option and debt components and discounts these amounts using a curve that incorporates the credit spread of the issuer. Although market data is readily available, convertible bonds are typically classified as Level 2 because there is insufficient third-party trading transaction data to justify a Level 1 classification.
Traded loans and loans designated at fair value
Traded loans and loans designated at fair value are valued directly using market prices that reflect recent transactions or quoted dealer prices where available. For illiquid loans where no market price data are available, alternative valuation techniques are used, which include relative value benchmarking using pricing derived from debt instruments in comparable entities or different products in the same entity. The corporate lending portfolio is valued using either directly observed market prices typically from consensus providers, or by using a credit default swap valuation technique, which requires inputs for credit spreads, credit recovery rates and interest rates. Even though price data are generally available for these instruments, corporate loans typically do not satisfy Level 1 classification criteria insofar as the price data may not be directly observable, and moreover the market for these instruments is not actively traded. Instruments with suitably deep and liquid price data available will be classified as Level 2, while any positions requiring the use of valuation techniques or for which the price sources have insufficient trading depth are classified as Level 3. Recently originated commercial real estate loans that are classified as Level 3 are measured using a securitization approach based on rating agency guidelines.
Included within loans are various contingent lending transactions for which valuations are dependent on actuarial mortality levels and actuarial life insurance policy lapse rates. Mortality and lapse rate assumptions are based on external actuarial estimations for large homogeneous pools, and contingencies are derived from a range relative to the actuarially expected amount. In addition, the pricing technique uses volatility of mortality as an input.
Note 24 Fair value measurement (continued)
Investment fund units
Investment fund units are predominantly exchange-traded, with readily available quoted prices in liquid markets. Where market prices are not available, fair value may be measured using net asset values (NAV), taking into account any restrictions imposed upon redemption. Listed units are classified as Level 1, provided there is sufficient trading to justify active market classification, while other positions are classified as Level 2. Positions where NAV is not available or which are not redeemable at the measurement date or in the near future are classified as Level 3.
Asset-backed securities: residential mortgage-backed securities (RMBS), commercial mortgage-backed securities (CMBS), other asset-backed securities (ABS) and collateralized debt obligations (CDO)
RMBS, CMBS, ABS and CDO are instruments generally issued through the process of securitization of underlying interest-bearing assets. The underlying collateral for RMBS is residential mortgages, for CMBS, commercial mortgages, for ABS, other assets such as credit card, car or student loans and leases, and for CDO, other securitized positions of RMBS, CMBS or ABS. The market for these securities is not active, and therefore a variety of valuation techniques are used to measure fair value. For more liquid securities, trade data or quoted prices may be obtained periodically for the instrument held, and the valuation process will use this trade and price data, updated for movements in market levels between the time of trading and the time of valuation. Less liquid instruments are measured using discounted expected cash flows incorporating price data for instruments or indices with similar risk profiles. Expected cash flow estimation involves the modeling of the expected collateral cash flows using input assumptions derived from proprietary models, fundamental analysis and / or market research based on management’s quantitative and qualitative assessment of current and future economic conditions. The expected collateral cash flows estimated are then converted into the securities’ projected performance under such conditions based on the credit enhancement and subordination terms of the securitization. Expected cash flow schedules are discounted using a rate or discount margin that reflects the discount levels required by the market for instruments with similar risk and liquidity profiles. Inputs to discounted expected cash flow techniques include asset prepayment rates, discount margin or discount yields, asset default rates and asset loss on default severity, which may in turn be estimated using more fundamental loan and economic drivers such as, but not limited to, loan-to-value data, house price appreciation, foreclosure costs, rental income levels, void periods and employment rates. RMBS, CMBS and ABS are generally classified as Level 2. However, if significant inputs are unobservable, or if market or fundamental data are not available for instruments or collateral with a sufficiently similar risk profile to the positions held, they are classified as Level 3.
Equity instruments
The majority of equity securities are actively traded on public stock exchanges where quoted prices are readily and regularly available, resulting in their classification as Level 1. Units held in hedge funds are also classified as equity instruments. Fair value for these units is measured based on their published NAV, taking into account any restrictions imposed upon the redemption. These units are classified as Level 2, except for positions where published NAV is not available or which are not redeemable at the measurement date or in the near future, in which case they are classified as Level 3.
Unlisted equity holdings, including private equity positions, are initially marked at their transaction price and are revalued to the extent reliable evidence of price movements becomes available or the position is deemed to be impaired.
Financial assets underlying unit-linked investment contracts
Unit-linked investment contracts allow investors to invest in a pool of assets through issued investment units. The unit holders are exposed to all risks and rewards associated with the reference asset pool. Assets held under unit-linked investment contracts are presented as Trading portfolio assets. The majority of assets are listed on exchanges and are classified as Level 1 if actively traded, or Level 2 if trading is not active. However, instruments for which prices are not readily available are classified as Level 3.
Structured (reverse) repurchase agreements
Structured (reverse) repurchase agreements designated at fair value are measured using discounted expected cash flow techniques. The discount rate applied is based on funding curves that are specific to the collateral eligibility terms for the contract in question. Collateral terms for these positions are not standard and therefore funding spread levels used for valuation purposes cannot be observed in the market. As a result, these positions are mostly classified as Level 3.
Consolidated financial statements
Notes to the UBS AG consolidated financial statements
Note 24 Fair value measurement (continued)
Replacement values
The curves used for discounting expected cash flows in the valuation of collateralized derivatives reflect the funding terms associated with the relevant collateral arrangement for the instrument being valued. These collateral arrangements differ across counterparties with respect to the eligible currency and interest terms of the collateral. The majority of collateralized derivatives are measured using a discount curve that is based on funding rates derived from overnight interest in the cheapest eligible currency for the respective counterparty collateral agreement.
Uncollateralized and partially collateralized derivatives are discounted using the LIBOR (or equivalent) curve for the currency of the instrument. As described in Note 24d, the fair value of uncollateralized and partially collateralized derivatives is then adjusted by CVA, DVA and FVA as applicable, to reflect an estimation of the impact of counterparty credit risk, UBS AG’s own credit risk and funding costs and benefits.
Interest rate contracts
Interest rate swap contracts include interest rate swaps, basis swaps, cross-currency swaps, inflation swaps and interest rate forwards, often referred to as forward-rate agreements (FRA). These products are valued by estimating future interest cash flows and discounting those cash flows using a rate that reflects the appropriate funding rate for the position being measured. The yield curves used to estimate future index levels and discount rates are generated using market standard yield curve models using interest rates associated with current market activity. The key inputs to the models are interest rate swap rates, FRA rates, short-term interest rate futures prices, basis swap spreads and inflation swap rates. In most cases, the standard market contracts that form the inputs for yield curve models are traded in active and observable markets, resulting in the majority of these financial instruments being classified as Level 2.
Interest rate option contracts include caps and floors, swaptions, swaps with complex payoff profiles and other more complex interest rate options. These contracts are valued using various market standard option models, using inputs that include interest rate yield curves, inflation curves, volatilities and correlations. The volatility and correlation inputs within the models are implied from market data based on market observed prices for standard option instruments trading within the market. Option models used to value more exotic products have a number of model parameter inputs that require calibration to enable the exotic model to price standard option instruments to the price levels observed in the market. Although these inputs cannot be directly observed, they are generally treated as Level 2, as the calibration process enables the model output to be validated to active market levels. Models calibrated in this way are then used to revalue the portfolio of both standard options as well as more exotic products. In most cases, there are active and observable markets for the standard market instruments that form the inputs for yield curve models as well as the financial instruments from which volatility and correlation inputs are derived, resulting in the majority of these products being classified as Level 2. Within interest rate option contracts, exotic options for which appropriate volatility or correlation input levels cannot be implied from observable market data are classified as Level 3. These options are valued using volatility and correlation levels derived from non-market sources.
Interest rate swap and option contracts are classified as Level 3 when the maturity of the contract exceeds the term for which standard market quotes are observable for a significant input parameter. Such positions are valued by extrapolation from the last observable point using standard assumptions or by reference to another observable comparable input parameter to represent a suitable proxy for that portion of the term.
Balance guaranteed swaps (BGS) are interest rate or currency swaps that have a notional schedule based on a securitization vehicle, requiring the valuation to incorporate an adjustment for the unknown future variability of the notional schedule. Inputs to value BGS are those used to value the standard market risk on the swap and those used to estimate the notional schedule of the underlying securitization pool (i.e., prepayment, default and interest rates). BGS are classified as Level 3, as the correlation between unscheduled notional changes and the underlying market risk of the BGS does not have an active market and cannot be observed.
Note 24 Fair value measurement (continued)
Credit derivative contracts
Credit derivative contracts based on a single credit name include credit default swaps (CDS) based on corporate and sovereign single names, CDS on loans and certain total return swaps (TRS). These contracts are valued by estimating future default probabilities using industry standard models based on market credit spreads, upfront pricing points and implied recovery rates. These default and recovery assumptions are used to generate future expected cash flows that are then discounted using market standard discounted cash flow models and a discount rate that reflects the appropriate funding rate for that portion of the portfolio. TRS and certain single-name CDS contracts for which a derivative-based credit spread is not directly available are valued using a credit spread derived from the price of the cash bond that is referenced in the credit derivative, adjusted for any funding differences between the cash and synthetic product. Loan CDS for which a credit spread cannot be observed directly may be valued, where possible, using the corporate debt curve for the entity, adjusted for differences between loan and debt default definitions and recovery rate assumptions. Inputs to the valuation models used to value single-name and loan CDS include single-name credit spreads and upfront pricing points, recovery rates and funding curves. In addition, corporate bond prices are used as inputs to the valuation model for TRS and certain single-name or loan CDS as described. Many single-name credit default swaps are classified as Level 2 because the credit spreads and recovery rates used to value these contracts are actively traded and observable market data are available. Where the underlying reference name is not actively traded, these contracts are classified as Level 3.
Credit derivative contracts based on a portfolio of credit names include credit default swaps on a credit index, credit default swaps based on a bespoke portfolio or first to default swaps (FTD). The valuation of these contracts is similar to that described above for single-name CDS and includes an estimation of future default probabilities using industry standard models based on market credit spreads, upfront pricing points and implied recovery rates. These default and recovery assumptions are used to generate future expected cash flows that are then discounted using market standard discounted cash flow models based on an estimation of the funding rate for that portion of the portfolio. Tranche products and FTD are valued using industry standard models that, in addition to default and recovery assumptions as above, incorporate implied correlations to be applied to the credits within the portfolio in order to apportion the expected credit loss at a portfolio level across the different tranches or names within the overall structure. These correlation assumptions are derived from prices of actively traded index tranches or other FTD baskets. Inputs to the valuation models used for all portfolio credit default swaps include single-name or index credit spreads and upfront pricing points, recovery rates and funding curves. In addition, models used for tranche and FTD products have implied credit correlations as inputs. Credit derivative contracts based on a portfolio of credit names are classified as Level 2 when credit spreads and recovery rates are determined from actively traded observable market data, and when the correlation data used to value bespoke and index tranches are based on actively traded index tranche instruments. These correlation data undergo a mapping process that takes into account both the relative tranche attachment / detachment points in the overall capital structure of the portfolio and portfolio composition. Where the mapping process requires extrapolation beyond the range of available and active market data, the position is classified as Level 3. This relates to a small number of index and all bespoke tranche contracts. FTD are classified as Level 3 as the correlations between specific names in the FTD portfolio are not actively traded. Also classified as Level 3 are several older credit index positions, referred to as off-the-run indices, due to the lack of any active market for the index credit spread.
Credit derivative contracts on securitized products have an underlying reference asset that is a securitized product (RMBS, CMBS, ABS or CDO) and include credit default swaps and certain TRS. These credit default swaps (typically referred to as pay-as-you-go (PAYG) CDS) and TRS are valued using a similar valuation technique to the underlying security (by reference to equivalent securities trading in the market, or through cash flow estimation and discounted cash flow techniques as described in the Asset-backed securities section above), with an adjustment made to reflect the funding differences between cash and synthetic form. Inputs to the PAYG CDS and TRS are those used to value the underlying security (prepayment rates, default rates, loss severity, discount margin / rate and other inputs) and those used to capture the funding basis differential between cash and synthetic form. The classification of PAYG CDS and these TRS follow the characteristics of the underlying security and are therefore distributed across Level 2 and Level 3.
Consolidated financial statements
Notes to the UBS AG consolidated financial statements
Note 24 Fair value measurement (continued)
Foreign exchange (FX) contracts
Open spot FX contracts are valued using the FX spot rate observed in the market. Forward FX contracts are valued using the FX spot rate adjusted for forward pricing points observed from standard market-based sources. As the markets for both FX spot and FX forward pricing points are both actively traded and observable, FX contracts are generally classified as Level 2.
OTC FX option contracts include standard call and put options, options with multiple exercise dates, path-dependent options, options with averaging features, options with discontinuous pay-off characteristics and options on a number of underlying FX rates. OTC FX option contracts are valued using market standard option valuation models. The models used for shorter-dated options (i.e., maturities of five years or less) tend to be different than those used for longer-dated options because the models needed for longer-dated OTC FX contracts require additional consideration of interest rate and FX rate interdependency. Inputs to the option valuation models include spot FX rates, FX forward points, FX volatilities, interest rate yield curves, interest rate volatilities and correlations. The inputs for volatility and correlation are implied through the calibration of observed prices for standard option contracts trading within the market.
As inputs are derived mostly from standard market contracts traded in active and observable markets, a significant proportion of OTC FX option contracts are classified as Level 2. OTC FX option contracts classified as Level 3 include long-dated FX exotic option contracts for which there is no active market from which to derive volatility or correlation inputs. The inputs used to value these OTC FX option contracts are calculated using consensus pricing services without an underlying principal market, historical asset prices or by extrapolation.
Cross-currency balance guaranteed swaps are classified as foreign exchange contracts. Details of the fair value classification can be found under the interest rate contracts section above.
Equity / index contracts
Equity / index contracts include equity forward contracts and equity option contracts. Equity forward contracts have a single stock or index underlying and are valued using market standard models. The key inputs to the models are stock prices, estimated dividend rates and equity funding rates (which are implied from prices of forward contracts observed in the market). Estimated cash flows are then discounted using market standard discounted cash flow models using a rate that reflects the appropriate funding rate for that portion of the portfolio. As inputs are derived mostly from standard market contracts traded in active and observable markets, a significant proportion of equity forward contracts are classified as Level 2. Positions classified as Level 3 have no market data available for the instrument maturity and are valued by some form of extrapolation of available data, use of historical dividend data, or use of data for a related equity.
Equity option contracts include market standard single or basket stock or index call and put options as well as equity option contracts with more complex features including option contracts with multiple or continuous exercise dates, option contracts for which the payoff is based on the relative or average performance of components of a basket, option contracts with discontinuous payoff profiles, path-dependent options and option contracts with a payoff calculated directly upon equity features other than price (i.e., dividend rates, volatility or correlation). Equity option contracts are valued using market standard models that estimate the equity forward level as described above for equity forward contracts and incorporate inputs for stock volatility and for correlation between stocks within a basket. The probability-weighted expected option payoff generated is then discounted using market standard discounted cash flow models using a rate that reflects the appropriate funding rate for that portion of the portfolio. Positions for which inputs are derived from standard market contracts traded in active and observable markets are classified as Level 2. Level 3 positions are those for which volatility, forward or correlation inputs are not observable and are therefore valued using extrapolation of available data, historical dividend, correlation or volatility data, or the equivalent data for a related equity.
Commodity derivative contracts
Commodity derivative contracts include forward, swap and option contracts on individual commodities and on commodity indices. Commodity forward and swap contracts are measured using market standard models that use market forward levels on standard instruments. Commodity option contracts are measured using market standard option models that estimate the commodity forward level as described above for commodity forward and swap contracts, incorporating inputs for the volatility of the underlying index or commodity. The option model produces a probability-weighted expected option payoff that is then discounted using market standard discounted cash flow models using a rate that reflects the appropriate funding rate for that portion of the portfolio. For commodity options on baskets of commodities or bespoke commodity indices, the valuation technique also incorporates inputs for the correlation between different commodities or commodity indices. Individual commodity contracts are typically classified as Level 2 because active forward and volatility market data are available.
Note 24 Fair value measurement (continued)
Financial liabilities designated at fair value
Structured and OTC debt instruments issued
Structured debt instruments issued are comprised of medium-term notes (MTNs), which are held at fair value under the fair value option. These MTNs are tailored specifically to the holder’s risk or investment appetite with structured coupons or payoffs. The risk management and the valuation approaches for these MTNs are closely aligned to the equivalent derivatives business and the underlying risk, and the valuation techniques used for this component are the same as the relevant valuation techniques described above. For example, equity-linked notes should be referenced to equity / index contracts and credit-linked notes should be referenced to credit derivative contacts.
Other liabilities – amounts due under unit-linked investment contracts
Unit-linked investment contracts allow investors to invest in a pool of assets through issued investment units. The unit holders are exposed to all risks and rewards associated with the reference asset pool. The financial liability represents the amounts due to unit holders and is equal to the fair value of the reference asset pool. The fair values of investment contract liabilities are determined by reference to the fair value of the corresponding assets. The liabilities themselves are not actively traded, but are mainly referenced to instruments that are and are therefore classified as Level 2.
f) Transfers between Level 1 and Level 2 in the fair value hierarchy
The amounts provided below reflect transfers between Level 1 and Level 2 for instruments that were held for the entire reporting period.
Assets totaling approximately CHF 0.6 billion, which were mainly comprised of financial investments classified as available-for-sale, primarily corporate and municipal bonds, and financial assets held for trading, were transferred from Level 2 to Level 1 during 2015, generally due to increased levels of trading activity observed within the market. Transfers of financial liabilities from Level 2 to Level 1 during 2015 were not significant.
Assets totaling approximately CHF 0.8 billion, which were mainly comprised of financial assets held for trading, primarily equity instruments and government bills/bonds, and financial investments classified as available-for-sale, mainly corporate and municipal bonds, were transferred from Level 1 to Level 2 during 2015, generally due to diminished levels of trading activity observed within the market. Transfers of financial liabilities from Level 1 to Level 2 during 2015 were not significant.
Consolidated financial statements
Notes to the UBS AG consolidated financial statements
Note 24 Fair value measurement (continued)
g) Movements of Level 3 instruments
Significant changes in Level 3 instruments
The table on the following pages presents additional information about Level 3 assets and liabilities measured at fair value on a recurring basis. Level 3 assets and liabilities may be hedged with instruments classified as Level 1 or Level 2 in the fair value hierarchy, and, as a result, realized and unrealized gains and losses included in the table may not include the effect of related hedging activity. Further, the realized and unrealized gains and losses presented within the table are not limited solely to those arising from Level 3 inputs, as valuations are generally derived from both observable and unobservable parameters.
Assets and liabilities transferred into or out of Level 3 are presented as if those assets or liabilities had been transferred at the beginning of the year.
As of 31 December 2015, financial instruments measured with valuation techniques using significant non-market-observable inputs (Level 3) were mainly comprised of:
– loans (including structured loans);
– structured reverse repurchase and securities borrowing agreements;
– credit derivative contracts;
– equity / index contracts;
– non-structured fixed-rate bonds and
– structured debt instruments issued (equity and credit-linked).
Significant movements in Level 3 instruments during the year ended 31 December 2015 were as follows.
Financial assets held for trading
Financial assets held for trading decreased to CHF 2.1 billion from CHF 3.5 billion during the year. Issuances of CHF 5.4 billion and purchases of CHF 0.7 billion, mainly comprised of loans and corporate bonds, respectively, were more than offset by sales of CHF 7.6 billion, also primarily comprised of loans and corporate bonds. Transfers into Level 3 during the year amounted to CHF 0.9 billion and were mainly comprised of equity instruments and investment fund units due to decreased observability of the respective equity volatility inputs. Transfers out of Level 3 amounted to CHF 0.5 billion and were primarily comprised of loans, reflecting increased observability of the respective credit spread inputs.
Financial assets designated at fair value
Financial assets designated at fair value decreased to CHF 3.3 billion from CHF 3.5 billion during the year, mainly reflecting settlements of CHF 1.3 billion, partly offset by issuances of CHF 0.8 billion. Transfers into and out of Level 3 amounted to CHF 0.8 billion and CHF 0.4 billion, respectively.
Financial investments classified as available-for-sale
Financial investments classified as available-for-sale increased to CHF 0.7 billion from CHF 0.6 billion during the year, primarily due to purchases totaling CHF 0.1 billion.
Note 24 Fair value measurement (continued)
Positive replacement values
Positive replacement values decreased to CHF 2.9 billion from CHF 4.4 billion during the year, primarily due to settlements of CHF 2.9 billion, primarily related to credit derivative contracts and equity / index contracts, partly offset by issuances totaling CHF 1.7 billion, also primarily related to credit derivative contracts and equity / index contracts. Transfers into Level 3, totaling CHF 0.7 billion, were mainly comprised of interest rate contracts and equity / index contracts and primarily resulted from changes in the correlation between the portfolios held and the representative market portfolio used to independently verify market data. Transfers out of Level 3, totaling CHF 0.5 billion, were mainly comprised of equity / index contracts and also primarily related to changes in the correlation between the portfolio held and the representative market portfolio used to independently verify market data.
Negative replacement values
Negative replacement values decreased to CHF 3.3 billion from CHF 5.0 billion during the year. Settlements and issuances amounted to CHF 2.2 billion and CHF 1.0 billion, respectively, and were primarily comprised of equity / index contracts. Transfers into and out of Level 3 both amounted to CHF 0.5 billion, and primarily related to changes in the availability of the respective observable equity volatility and credit spread inputs.
Financial liabilities designated at fair value
Financial liabilities designated at fair value decreased to CHF 10.7 billion from CHF 11.9 billion during the year. Issuances of CHF 6.1 billion, primarily comprised of structured debt instruments issued and structured over-the-counter debt instruments, were more than offset by settlements of CHF 6.7 billion, also primarily comprised of structured debt instruments issued and structured over-the-counter debt instruments. Transfers into Level 3, totaling CHF 1.3 billion, were primarily comprised of equity and credit-linked structured debt instruments issued, and mainly related to a reduction in the observable equity volatility inputs and from changes in the respective credit spreads used to determine the fair value of the embedded options in these structures. Transfers out of Level 3, totaling CHF 2.2 billion, were also mainly comprised of equity- and credit-linked structured debt instruments issued, and mainly related to changes in the observable equity volatility inputs and from changes in the respective credit spreads used to determine the fair value of the embedded options in these structures.
Consolidated financial statements
Notes to the UBS AG consolidated financial statements
Note 24 Fair value measurement (continued)
Movements of Level 3 instruments | | | | | | | | |
| | Total gains / losses included in comprehensive income | | | | | | | |
CHF billion | Balance as of 31 Decem- ber 2013 | Net interest income, net trading income and other income | of which: related to Level 3 instruments held at the end of the reporting period | Other comprehensive income | Purchases | Sales | Issuances | Settlements | Transfers into Level 3 | Transfers out of Level 3 | Foreign currency trans- lation |
| | | | | | | | | | | |
Financial assets held for trading | 4.3 | (1.6) | (0.9) | | 1.4 | (6.5) | 5.2 | 0.0 | 1.0 | (0.5) | 0.1 |
of which: | | | | | | | | | | | |
Corporate bonds and municipal bonds, including bonds issued by financial institutions | 1.7 | (0.1) | (0.1) | | 0.9 | (1.2) | 0.0 | 0.0 | 0.2 | (0.2) | 0.1 |
Loans | 1.0 | (1.4) | (0.8) | | 0.2 | (4.1) | 5.2 | 0.0 | 0.2 | (0.1) | 0.1 |
Asset-backed securities | 1.0 | 0.0 | 0.0 | | 0.1 | (0.7) | 0.0 | 0.0 | 0.5 | (0.3) | 0.0 |
Other | 0.6 | (0.1) | 0.0 | | 0.2 | (0.5) | 0.0 | 0.0 | 0.1 | 0.0 | 0.0 |
| | | | | | | | | | | |
Financial assets designated at fair value | 4.4 | (0.8) | (0.3) | | 0.0 | 0.0 | 1.3 | (1.2) | 0.0 | (0.3) | 0.2 |
of which: | | | | | | | | | | | |
Loans (including structured loans) | 1.1 | (0.3) | (0.2) | | 0.0 | 0.0 | 0.6 | (0.2) | 0.0 | (0.3) | 0.0 |
Structured reverse repurchase and securities borrowing agreements | 3.1 | (0.5) | 0.0 | | 0.0 | 0.0 | 0.7 | (1.0) | 0.0 | 0.0 | 0.1 |
Other | 0.2 | 0.0 | 0.0 | | 0.0 | 0.0 | 0.0 | 0.0 | 0.0 | 0.0 | 0.0 |
| | | | | | | | | | | |
Financial investments available-for-sale | 0.8 | 0.0 | 0.0 | 0.0 | 0.1 | (0.2) | 0.0 | 0.0 | 0.0 | 0.0 | 0.0 |
| | | | | | | | | | | |
Positive replacement values | 5.5 | 1.1 | 0.0 | | 0.0 | 0.0 | 2.6 | (5.1) | 1.1 | (0.5) | (0.2) |
of which: | | | | | | | | | | | |
Credit derivative contracts | 3.0 | 0.3 | (0.8) | | 0.0 | 0.0 | 1.1 | (3.2) | 0.5 | (0.2) | 0.1 |
Foreign exchange contracts | 0.9 | 0.1 | 0.1 | | 0.0 | 0.0 | 0.1 | (0.2) | 0.0 | (0.1) | (0.3) |
Equity / index contracts | 1.2 | 0.6 | 0.5 | | 0.0 | 0.0 | 1.3 | (1.3) | 0.3 | (0.2) | 0.0 |
Other | 0.3 | 0.0 | 0.1 | | 0.0 | 0.0 | 0.2 | (0.4) | 0.3 | (0.1) | 0.0 |
| | | | | | | | | | | |
Negative replacement values | 4.4 | 0.7 | (0.6) | | 0.0 | 0.0 | 2.5 | (3.7) | 1.4 | (0.5) | 0.2 |
of which: | | | | | | | | | | | |
Credit derivative contracts | 2.0 | 0.1 | (1.2) | | 0.0 | 0.0 | 1.0 | (2.4) | 1.0 | (0.2) | 0.3 |
Foreign exchange contracts | 0.5 | 0.0 | 0.0 | | 0.0 | 0.0 | 0.0 | 0.0 | 0.0 | (0.1) | 0.0 |
Equity / index contracts | 1.5 | 0.4 | 0.4 | | 0.0 | 0.0 | 1.5 | (1.2) | 0.3 | (0.1) | 0.0 |
Other | 0.5 | 0.2 | 0.3 | | 0.0 | 0.0 | 0.0 | (0.1) | 0.1 | 0.0 | (0.1) |
| | | | | | | | | | | |
Financial liabilities designated at fair value | 12.1 | 0.5 | 1.3 | | 0.0 | 0.0 | 7.4 | (7.4) | 2.0 | (3.2) | 0.5 |
of which: | | | | | | | | | | | |
Non-structured fixed-rate bonds | 1.2 | 0.4 | 0.3 | | 0.0 | 0.0 | 1.9 | (1.4) | 0.4 | (0.4) | 0.1 |
Structured debt instruments issued | 7.9 | 0.9 | 0.4 | | 0.0 | 0.0 | 3.7 | (4.2) | 1.2 | (2.6) | 0.4 |
Structured over-the-counter debt instruments | 1.8 | (0.4) | (0.1) | | 0.0 | 0.0 | 1.4 | (1.5) | 0.4 | (0.2) | 0.0 |
Structured repurchase agreements | 1.2 | (0.3) | 0.7 | | 0.0 | 0.0 | 0.5 | (0.4) | 0.0 | 0.0 | 0.0 |
1 Total Level 3 assets as of 31 December 2015 were CHF 9.0 billion (31 December 2014: CHF 12.2 billion). Total Level 3 liabilities as of 31 December 2015 were CHF 14.1 billion (31 December 2014: CHF 17.0 billion). |
| | | | | | | | | | | | |
| | Total gains / losses included in comprehensive income | | | | | | | | |
| Balance as of 31 Decem- ber 2014 | Net interest income, net trading income and other income | of which: related to Level 3 instruments held at the end of the reporting period | Other comprehensive income | Purchases | Sales | Issuances | Settlements | Transfers into Level 3 | Transfers out of Level 3 | Foreign currency trans- lation | Balance as of 31 Decem- ber 2015¹ |
| | | | | | | | | | | | |
| 3.5 | (0.2) | (0.4) | | 0.7 | (7.6) | 5.4 | 0.0 | 0.9 | (0.5) | (0.1) | 2.1 |
| | | | | | | | | | | | |
| 1.4 | 0.0 | 0.0 | | 0.5 | (1.0) | 0.0 | 0.0 | 0.1 | (0.1) | (0.1) | 0.7 |
| 1.1 | (0.1) | (0.3) | | 0.1 | (5.5) | 5.4 | 0.0 | 0.2 | (0.3) | 0.0 | 0.8 |
| 0.6 | 0.0 | 0.0 | | 0.1 | (0.6) | 0.0 | 0.0 | 0.2 | (0.1) | 0.0 | 0.2 |
| 0.5 | (0.1) | (0.1) | | 0.1 | (0.5) | 0.0 | 0.0 | 0.4 | 0.0 | 0.0 | 0.4 |
| | | | | | | | | | | | |
| 3.5 | 0.0 | 0.0 | | 0.0 | 0.0 | 0.8 | (1.3) | 0.8 | (0.4) | (0.1) | 3.3 |
| | | | | | | | | | | | |
| 1.0 | (0.1) | (0.1) | | 0.0 | 0.0 | 0.7 | (0.2) | 0.8 | (0.4) | 0.0 | 1.7 |
| 2.4 | 0.1 | 0.1 | | 0.0 | 0.0 | 0.1 | (1.0) | 0.0 | 0.0 | (0.1) | 1.5 |
| 0.1 | 0.0 | 0.0 | | 0.0 | 0.0 | 0.0 | 0.0 | 0.0 | 0.0 | 0.0 | 0.1 |
| | | | | | | | | | | | |
| 0.6 | 0.0 | 0.0 | 0.0 | 0.1 | (0.1) | 0.0 | 0.0 | 0.0 | 0.0 | 0.0 | 0.7 |
| | | | | | | | | | | | |
| 4.4 | (0.4) | (0.1) | | 0.0 | (0.1) | 1.7 | (2.9) | 0.7 | (0.5) | (0.1) | 2.9 |
| | | | | | | | | | | | |
| 1.7 | (0.1) | 0.2 | | 0.0 | 0.0 | 0.9 | (1.1) | 0.1 | (0.1) | (0.1) | 1.3 |
| 0.6 | (0.1) | 0.0 | | 0.0 | 0.0 | 0.1 | (0.1) | 0.0 | 0.0 | 0.0 | 0.5 |
| 1.9 | 0.0 | (0.3) | | 0.0 | (0.1) | 0.7 | (1.4) | 0.2 | (0.3) | 0.0 | 1.0 |
| 0.3 | (0.1) | (0.1) | | 0.0 | 0.0 | 0.0 | (0.3) | 0.4 | (0.1) | 0.0 | 0.1 |
| | | | | | | | | | | | |
| 5.0 | (0.4) | 0.0 | | 0.0 | 0.0 | 1.0 | (2.2) | 0.5 | (0.5) | (0.1) | 3.3 |
| | | | | | | | | | | | |
| 1.7 | 0.3 | 0.6 | | 0.0 | 0.0 | 0.0 | (0.9) | 0.3 | (0.1) | 0.0 | 1.3 |
| 0.3 | 0.0 | (0.1) | | 0.0 | 0.0 | 0.0 | (0.1) | 0.0 | 0.0 | 0.0 | 0.2 |
| 2.4 | (0.4) | (0.5) | | 0.0 | 0.0 | 0.9 | (1.2) | 0.1 | (0.4) | (0.1) | 1.4 |
| 0.6 | (0.2) | (0.1) | | 0.0 | 0.0 | 0.1 | 0.0 | 0.1 | 0.0 | (0.1) | 0.3 |
| | | | | | | | | | | | |
| 11.9 | 0.6 | 0.0 | | 0.0 | 0.0 | 6.1 | (6.7) | 1.3 | (2.2) | (0.3) | 10.7 |
| | | | | | | | | | | | |
| 2.2 | (0.1) | 0.0 | | 0.0 | 0.0 | 1.1 | (0.2) | 0.1 | (0.4) | 0.0 | 2.6 |
| 7.3 | 0.5 | 0.1 | | 0.0 | 0.0 | 3.8 | (4.2) | 1.3 | (1.9) | (0.2) | 6.7 |
| 1.5 | 0.2 | (0.1) | | 0.0 | 0.0 | 1.2 | (2.0) | 0.0 | 0.0 | (0.1) | 0.8 |
| 0.9 | 0.0 | 0.0 | | 0.0 | 0.0 | 0.0 | (0.3) | 0.0 | 0.0 | 0.0 | 0.6 |
| | | | | | | | | | | | |
Consolidated financial statements
Notes to the UBS AG consolidated financial statements
Note 24 Fair value measurement (continued)
h) Valuation of assets and liabilities classified as Level 3
The table on the following pages presents the assets and liabilities recognized at fair value and classified as Level 3, together with the valuation techniques used to measure fair value, the significant inputs used in the valuation technique that are considered unobservable and a range of values for those unobservable inputs.
The range of values represents the highest and lowest level input used in the valuation techniques. Therefore, the range does not reflect the level of uncertainty regarding a particular input, but rather the different underlying characteristics of the relevant assets and liabilities. The ranges will therefore vary from period to period and parameter to parameter based on characteristics of the instruments held at each balance sheet
date. Further, the ranges of unobservable inputs may differ across other financial institutions due to the diversity of the products in each firm’s inventory.
Significant unobservable inputs in Level 3 positions
This section discusses the significant unobservable inputs identified in the table on the following pages and assesses the potential effect that a change in each unobservable input in isolation may have on a fair value measurement, including information to facilitate an understanding of factors that give rise to the input ranges shown. Relationships between observable and unobservable inputs have not been included in the summary below.
Valuation techniques and inputs used in the fair value measurement of Level 3 assets and liabilities |
| Fair value | | | | Significant unobservable input(s)¹ | Range of inputs |
| Assets | | Liabilities | | Valuation technique(s) | | 31.12.15 | | 31.12.14 | |
CHF billion | 31.12.15 | 31.12.14 | | 31.12.15 | 31.12.14 | | | low | high | | low | high | unit¹ |
Financial assets held for trading / Trading portfolio liabilities, Financial assets / liabilities designated at fair value and Financial investments available-for-sale | | | | | | | | | | | | | | | |
Corporate bonds and municipal bonds, including bonds issued by financial institutions | 0.7 | 1.4 | | 0.1 | 0.1 | | Relative value to market comparable | | Bond price equivalent | 0 | 134 | | 8 | 144 | points |
Traded loans, loans designated at fair value, loan commitments and guarantees | 2.6 | 2.2 | | 0.0 | 0.0 | | Relative value to market comparable | | Loan price equivalent | 65 | 100 | | 80 | 101 | points |
| | | | | | | Discounted expected cash flows | | Credit spread | 30 | 252 | | 37 | 138 | basis points |
| | | | | | | Market comparable and securitization model | | Discount margin / spread | 1 | 14 | | 0 | 13 | % |
| | | | | | | Mortality dependent cash flow | | Volatility of mortality² | | | | 270 | 280 | % |
Investment fund units³ | 0.3 | 0.5 | | 0.0 | 0.0 | | Relative value to market comparable | | Net asset value | | | | | | |
Asset-backed securities | 0.2 | 0.6 | | 0.0 | 0.0 | | Discounted cash flow projection | | Constant prepayment rate | 0 | 18 | | 0 | 18 | % |
| | | | | | | | | Discount margin / spread | 0 | 12 | | 0 | 22 | % |
| | | | | | | Relative value to market comparable | | Bond price equivalent | 1 | 92 | | 0 | 102 | points |
Equity instruments³ | 0.6 | 0.5 | | 0.0 | 0.0 | | Relative value to market comparable | | Price | | | | | | |
Structured (reverse) repurchase agreements | 1.5 | 2.4 | | 0.6 | 0.9 | | Discounted expected cash flows | | Funding spread | 18 | 183 | | 10 | 163 | basis points |
Financial assets for unit-linked investment contracts³ | 0.1 | 0.1 | | | | | Relative value to market comparable | | Price | | | | | | |
Structured debt instruments and non-structured fixed-rate bonds⁴ | | | | 10.1 | 11.0 | | | | | | | | | | |
Note 24 Fair value measurement (continued)
Valuation techniques and inputs used in the fair value measurement of Level 3 assets and liabilities (continued) |
| Fair value | | | | Significant unobservable input(s)¹ | Range of inputs |
| Assets | | Liabilities | | Valuation technique(s) | | 31.12.15 | | 31.12.14 | |
CHF billion | 31.12.15 | 31.12.14 | | 31.12.15 | 31.12.14 | | | low | high | | low | high | unit¹ |
Replacement values | | | | | | | | | | | | | | | |
Interest rate contracts | 0.1 | 0.2 | | 0.3 | 0.6 | | Option model | | Volatility of interest rates | 16 | 130 | | 13 | 94 | % |
| | | | | | | | | Rate-to-rate correlation | 84 | 94 | | 84 | 94 | % |
| | | | | | | | | Intra-curve correlation | 36 | 94 | | 50 | 94 | % |
| | | | | | | Discounted expected cash flows | | Constant prepayment rate | 0 | 3 | | 0 | 3 | % |
Credit derivative contracts | 1.3 | 1.7 | | 1.3 | 1.7 | | Discounted expected cash flow based on modeled defaults and recoveries | | Credit spreads | 1 | 1,163 | | 0 | 963 | basis points |
| | | | | | | | | Upfront price points | 8 | 25 | | 15 | 83 | % |
| | | | | | | | | Recovery rates | 0 | 95 | | 0 | 95 | % |
| | | | | | | | | Credit index correlation | 10 | 85 | | 10 | 85 | % |
| | | | | | | | | Discount margin / spread | 1 | 72 | | 0 | 32 | % |
| | | | | | | | | Credit pair correlation | 57 | 94 | | 57 | 94 | % |
| | | | | | | Discounted cash flow projection on underlying bond | | Constant prepayment rate | 0 | 15 | | 1 | 16 | % |
| | | | | | | | | Constant default rate | 0 | 9 | | 0 | 9 | % |
| | | | | | | | | Loss severity | 0 | 100 | | 0 | 100 | % |
| | | | | | | | | Discount margin / spread | 1 | 15 | | 1 | 33 | % |
| | | | | | | | | Bond price equivalent | 0 | 104 | | 12 | 100 | points |
Foreign exchange contracts | 0.5 | 0.6 | | 0.2 | 0.3 | | Option model | | Rate-to-FX correlation | (57) | 60 | | (57) | 60 | % |
| | | | | | | | | FX-to-FX correlation | (70) | 80 | | (70) | 80 | % |
| | | | | | | Discounted expected cash flows | | Constant prepayment rate² | | | | 0 | 13 | % |
Equity / index contracts | 1.0 | 1.9 | | 1.4 | 2.4 | | Option model | | Equity dividend yields | 0 | 57 | | 0 | 15 | % |
| | | | | | | | | Volatility of equity stocks, equity and other indices | 0 | 143 | | 1 | 130 | % |
| | | | | | | | | Equity-to-FX correlation | (44) | 82 | | (55) | 84 | % |
| | | | | | | | | Equity-to-equity correlation | 3 | 99 | | 18 | 99 | % |
Non-financial assets³˒⁵ | 0.1 | 0.2 | | | | | Relative value to market comparable | | Price | | | | | | |
| | | | | | | Discounted cash flow projection | | Projection of cost and income related to the particular property | | | | | | |
| | | | | | | | | Discount rate | | | | | | |
| | | | | | | | | Assessment of the particular property's condition | | | | | | |
1 The ranges of significant unobservable inputs are represented in points, percentages and basis points. Points are a percentage of par. For example, 100 points would be 100% of par. 2 The range of inputs is not disclosed as of 31 December 2015 because this unobservable input parameter was not significant to the respective valuation technique as of that date. 3 The range of inputs is not disclosed due to the dispersion of possible values given the diverse nature of the investments. 4 Valuation techniques, significant unobservable inputs and the respective input ranges for structured debt instruments and non-structured fixed-rate bonds are the same as the equivalent derivative or structured financing instruments presented elsewhere in this table. 5 Non-financial assets include other assets which primarily consist of assets held for sale. |
Consolidated financial statements
Notes to the UBS AG consolidated financial statements
Note 24 Fair value measurement (continued)
Bond price equivalent: Where market prices are not available for a bond, fair value is measured by comparison with observable pricing data from similar instruments. Factors considered when selecting comparable instruments include credit quality, maturity and industry of the issuer. Fair value may be measured either by a direct price comparison or by conversion of an instrument price into a yield (either as an outright yield or as a spread to LIBOR). Bond prices are expressed as points of the nominal, where 100 represents a fair value equal to the nominal value (i.e., par).
For corporate and municipal bonds, the range of 0–134 points represents the range of prices from reference issuances used in determining fair value. Bonds priced at 0 are distressed to the point that no recovery is expected, while prices significantly in excess of 100 or par relate to inflation-linked or structured issuances that pay a coupon in excess of the market benchmark as of the measurement date. The weighted average price is approximately 94 points, with a majority of positions concentrated around this price.
For asset-backed securities, the bond price range of 1–92 points represents the range of prices for reference securities used in determining fair value. An instrument priced at 0 is not expected to pay any principal or interest, while an instrument priced close to 100 points is expected to be repaid in full as well as pay a yield close to the market yield. The weighted average price for Level 3 assets within this portion of the Level 3 portfolio is 72 points.
For credit derivatives, the bond price range of 0–104 points represents the range of prices used for reference instruments that are typically converted to an equivalent yield or credit spread as part of the valuation process. The range is comparable to that for corporate and asset-backed issuances described above.
Loan price equivalent: Where market prices are not available for a traded loan, fair value is measured by comparison with observable pricing data for similar instruments. Factors considered when selecting comparable instruments include industry segment, collateral quality, maturity and issuer-specific covenants. Fair value may be measured either by a direct price comparison or by conversion of an instrument price into a yield. The range of 65–100 points represents the range of prices derived from reference issuances of a similar credit quality used in measuring fair value for loans classified as Level 3. Loans priced at 0 are distressed to the point that no recovery is expected, while a current price of 100 represents a loan that is expected to be repaid in full. The weighted average is approximately 93 points.
Credit spread: Valuation models for many credit derivatives require an input for the credit spread, which is a reflection of the credit quality of the associated referenced underlying. The credit spread of a particular security is quoted in relation to the yield on a benchmark security or reference rate, typically either US Treasury or LIBOR, and is generally expressed in terms of basis points. An increase / (decrease) in credit spread will increase / (decrease) the value of credit protection offered by CDS and other credit derivative products. The income statement impact from such changes depends on the nature and direction of the positions held. Credit spreads may be negative where the asset is more creditworthy than the benchmark against which the spread is calculated. A wider credit spread represents decreasing creditworthiness. The ranges of 30–252 basis points in loans and 1–1163 basis points in credit derivatives represents a diverse set of underlyings, with the lower end of the range representing credits of the highest quality (e.g., approximating the risk of LIBOR) and the upper end of the range representing greater levels of credit risk.
Constant prepayment rate: A prepayment rate represents the amount of unscheduled principal repayment for a pool of loans. The prepayment estimate is based on a number of factors, such as historical prepayment rates for repaid and existing loans with similar characteristics and the future economic outlook, considering factors including, but not limited to, future interest rates. In general, a significant increase / (decrease) in this unobservable input in isolation would result in a significantly higher / (lower) fair value for bonds trading at a discount. For bonds trading at a premium the reverse would apply, with a decrease in fair value when the constant prepayment rate increases. However, in certain cases the effect of a change in prepayment speed on instrument price is more complicated and depends on both the precise terms of the securitization and the position of the instrument within the securitization capital structure.
For asset-backed securities, the range of 0–18% represents inputs across various classes of asset-backed securities. Securities with an input of 0% typically reflect no current prepayment behavior with respect to the underlying collateral, and with no expectation of this changing in the immediate future, while the high range of 18% relates to securities that are currently experiencing high prepayments. Different classes of asset-backed securities typically show different ranges of prepayment characteristics depending on a combination of factors, including the borrowers’ ability to refinance, prevailing refinancing rates, and the quality or characteristics of the underlying loan collateral pools. The weighted average constant prepayment rate for the portfolio is 5.0%.
Note 24 Fair value measurement (continued)
For credit derivatives, the range of 0–15% represents the input assumption for credit derivatives on asset-backed securities. The range is driven in a similar manner to that for asset-backed securities.
For interest rate contracts, the range of 0–3% represents the prepayment assumptions on securitizations underlying the BGS portfolio.
Constant default rate (CDR): The CDR represents the percentage of outstanding principal balances in the pool that are projected to default and liquidate and is the annualized rate of default for a group of mortgages or loans. The CDR estimate is based on a number of factors, such as collateral delinquency rates in the pool and the future economic outlook. In general, a significant increase / (decrease) in this unobservable input in isolation would result in significantly lower / (higher) cash flows for the deal (and thus lower / (higher) valuations). However, different instruments within the capital structure can react differently to changes in the CDR rate. Generally, subordinated bonds will decrease in value as CDR increases, but for well protected senior bonds an increase in CDR may cause an increase in price. In addition, the presence of a guarantor wrap on the collateral pool of a security may result in notes at the junior end of the capital structure experiencing a price increase with an increase in the default rate.
The range of 0–9% for credit derivatives represents the expected default percentage across the individual instruments’ underlying collateral pools.
Loss severity / recovery rate: The projected loss severity / recovery rate reflects the estimated loss that will be realized given expected defaults. Loss severity is generally applied to collateral within asset-backed securities while the recovery rate is the analogous pricing input for corporate or sovereign credits. Recovery is the reverse of loss severity, so a 100% recovery rate is the equivalent of a 0% loss severity. Increases in loss severity levels / decreases in recovery rates will result in lower expected cash flows into the structure upon the default of the instruments. In general, a significant decrease / (increase) in the loss severity in isolation would result in significantly higher / (lower) fair value for the respective asset-backed securities. The impact of a change in recovery rate on a credit derivative position will depend on whether credit protection has been bought or sold.
Loss severity is ultimately driven by the value recoverable from collateral held after foreclosure occurs relative to the loan principal and possibly unpaid interest accrued at that point. For credit derivatives, the loss severity range of 0–100% applies to derivatives on asset-backed securities. The recovery rate range of 0–95% represents a wide range of expected recovery levels on credit derivative contracts within the Level 3 portfolio.
Discount margin (DM) spread: The DM spread represents the discount rates used to present value cash flows of an asset to reflect the market return required for uncertainty in the estimated cash flows. DM spreads are a rate or rates applied on top of a floating index (e.g., LIBOR) to discount expected cash flows. Generally, a decrease / (increase) in the unobservable input in isolation would result in a significantly higher / (lower) fair value.
The different ranges represent the different discount rates across loans (1–14%), asset-backed securities (0–12%) and credit derivatives (1–72%). The high end of the range relates to securities that are priced very low within the market relative to the expected cash flow schedule. This indicates that the market is pricing an increased risk of credit loss into the security that is greater than what is being captured by the expected cash flow generation process. The low ends of the ranges are typical of funding rates on better quality instruments. For asset-backed securities the weighted average DM is 2.7% and for loans the average effective DM is 2.4%.
Equity dividend yields: The derivation of a forward price for an individual stock or index is important for measuring fair value for forward or swap contracts and for measuring fair value using option pricing models. The relationship between the current stock price and the forward price is based on a combination of expected future dividend levels and payment timings, and, to a lesser extent, the relevant funding rates applicable to the stock in question. Dividend yields are generally expressed as an annualized percentage of the share price with the lowest limit of 0% representing a stock that is not expected to pay any dividend. The dividend yield and timing represents the most significant parameter in determining fair value for instruments that are sensitive to an equity forward price. The range of 0–57% reflects the expected range of dividend rates for the portfolio.
Volatility: Volatility measures the variability of future prices for a particular instrument and is generally expressed as a percentage, where a higher number reflects a more volatile instrument for which future price movements are more likely to occur. The minimum level of volatility is 0% and there is no theoretical maximum. Volatility is a key input into option models, where it is used to derive a probability-based distribution of future prices for the underlying instrument. The effect of volatility on individual positions within the portfolio is driven primarily by whether the option contract is a long or short position. In most cases, the fair value of an option increases as a result of an increase in volatility and is reduced by a decrease in volatility. Generally, volatility used in the measurement of fair value is derived from active market option prices (referred to as implied volatility). A key feature of implied volatility is the volatility “smile” or “skew,” which represents the effect of pricing options of different option strikes at different implied volatility levels.
Consolidated financial statements
Notes to the UBS AG consolidated financial statements
Note 24 Fair value measurement (continued)
– Volatility of interest rates – the range of 16–130% reflects the range of unobservable volatilities across different currencies and related underlying interest rate levels. Volatilities of low interest rates tend to be much higher than volatilities of high interest rates. In addition, different currencies may have significantly different implied volatilities.
– Volatility of equity stocks, equity and other indices – the range of 1–143% reflects the range of underlying stock volatilities.
Correlation: Correlation measures the inter-relationship between the movements of two variables. It is expressed as a percentage between -100% and +100%, where +100% represents perfectly correlated variables (meaning a movement of one variable is associated with a movement of the other variable in the same direction), and -100% implies the variables are inversely correlated (meaning a movement of one variable is associated with a movement of the other variable in the opposite direction). The effect of correlation on the measurement of fair value depends on the specific terms of the instruments being valued, due to the range of different payoff features within such instruments.
– Rate-to-rate correlation – the correlation between interest rates of two separate currencies. The range of 84–94% results from the different pairs of currency involved.
– Intra-curve correlation – the correlation between different tenor points of the same yield curve. Correlations are typically fairly high, as reflected by the range of 36–94%.
– Credit index correlation of 10–85% reflects the implied correlation derived from different indices across different parts of the benchmark index capital structure. The input is particularly important for bespoke and Level 3 index tranches.
– Credit pair correlation is particularly important for first to default credit structures. The range of 57–94% reflects the difference between credits with low correlation and similar highly correlated credits.
– Rate-to-FX correlation – captures the correlation between interest rates and FX rates. The range for the portfolio is (57)–60%, which represents the relationship between interest rates and foreign exchange levels. The signage on such correlations depends on the quotation basis of the underlying FX rate (e.g., EUR / USD and USD / EUR correlations to the same interest rate will have opposite signs).
– FX-to-FX correlation is particularly important for complex options that incorporate different FX rates in the projected payoff. The range of (70)–80% reflects the underlying characteristics across the main FX pairs to which UBS AG has exposure.
– Equity-to-FX correlation is important for equity options based on a currency different than the currency of the underlying stock. The range of (44)–82% represents the range of the relationship between underlying stock and foreign exchange volatilities.
– Equity-to-equity correlation is particularly important for complex options that incorporate, in some manner, different equities in the projected payoff. The closer the correlation is to 100%, the more related one equity is to another. For example, equities with a very high correlation could be from different parts of the same corporate structure. The range of 3–99% reflects this.
Funding spread: Structured financing transactions are valued using synthetic funding curves that best represent the assets that are pledged as collateral for the transactions. They are not representative of where UBS AG can fund itself on an unsecured basis, but provide an estimate of where UBS AG can source and deploy secured funding with counterparties for a given type of collateral. The funding spreads are expressed in terms of basis points over or under LIBOR, and if funding spreads widen this increases the impact of discounting. The range of 18–183 basis points for both structured repurchase agreements and structured reverse repurchase agreements represents the range of asset funding curves, where wider spreads are due to a reduction in liquidity of underlying collateral for funding purposes.
A small proportion of structured debt instruments and non-structured fixed-rate bonds within financial liabilities designated at fair value had an exposure to funding spreads that was longer in duration than the actively traded market. Such positions are within the range of 18–183 basis points reported above.
Upfront price points: These are a component in the price quotation of credit derivative contracts, whereby the overall fair value price level is split between the credit spread (as described above) and a component that is quoted and settled upfront on transacting a new contract. This latter component is referred to as upfront price points and represents the difference between the credit spread paid as protection premium on a current contract versus a small number of standard contracts defined by the market. Distressed credit names frequently trade and quote CDS protection only in upfront points rather than as a running credit spread. An increase / (decrease) in upfront points will increase / (decrease) the value of credit protection offered by CDS and other credit derivative products. The effect of increases or decreases in upfront price points depends on the nature and direction of the positions held. Upfront price points may be negative where a contract is quoting for a narrower premium than the market standard, but are generally positive, reflecting an increase in credit premium required by the market as creditworthiness deteriorates. The range of 8–25% within the table represents the variety of current market credit spread levels relative to the benchmarks used as a quotation basis. Upfront points of 25% represent a distressed credit.
Note 24 Fair value measurement (continued)
i) Sensitivity of fair value measurements to changes in unobservable input assumptions
The table below summarizes those financial assets and liabilities classified as Level 3 for which a change in one or more of the unobservable inputs to reflect reasonably possible alternative assumptions would change fair value significantly, and the estimated effect thereof. As of 31 December 2015, the total favorable and unfavorable effects of changing one or more of the unobservable inputs to reflect reasonably possible alternative assumptions for financial instruments classified as Level 3 were CHF 0.8 billion and CHF 0.6 billion, respectively (31 December 2014: CHF 1.0 billion and CHF 0.8 billion, respectively).
The table shown presents the favorable and unfavorable effects for each class of financial assets and liabilities for which the potential change in fair value is considered significant. The sensitivity data presented represent an estimation of valuation uncertainty based on reasonably possible alternative values for Level 3 inputs at the balance sheet date and do not represent the estimated effect of stress scenarios. Typically, these financial assets and liabilities are sensitive to a combination of inputs from Levels 1–3. Although well-defined interdependencies may exist between Levels 1–2 and Level 3 parameters (e.g., between interest rates, which are generally Level 1 or Level 2, and prepayments, which are generally Level 3), these have not been incorporated in the table. Further, direct inter-relationships between the Level 3 parameters discussed below are not a significant element of the valuation uncertainty.
Sensitivity data are estimated using a number of techniques including the estimation of price dispersion among different market participants, variation in modeling approaches and reasonably possible changes to assumptions used within the fair value measurement process. The sensitivity ranges are not always symmetrical around the fair values as the inputs used in valuations are not always precisely in the middle of the favorable and unfavorable range.
Sensitivity data are determined at a product or parameter level and then aggregated assuming no diversification benefit. The calculated sensitivity is applied to both the outright position and any related Level 3 hedge. The main interdependencies across different Level 3 products to a single unobservable input parameter have been included in the basis of netting exposures within the calculation. Aggregation without allowing for diversification involves the simple summation of individual results with the total sensitivity, therefore representing the impact of all unobservable inputs which, if moved to a reasonably possible favorable or unfavorable level at the same time, would result in a significant change in the valuation. Diversification would incorporate estimated correlations across different sensitivity results and, as such, would result in an overall sensitivity that would be less than the sum of the individual component sensitivities. UBS AG believes that, while there are diversification benefits within the portfolios representing these sensitivity numbers, they are not significant to this analysis.
Sensitivity of fair value measurements to changes in unobservable input assumptions | | | |
| | 31.12.15 | | 31.12.14 |
CHF million | | Favorable changes¹ | Unfavorable changes¹ | | Favorable changes¹ | Unfavorable changes¹ |
Government bills / bonds | | 0 | (1) | | 10 | (1) |
Corporate bonds and municipal bonds, including bonds issued by financial institutions | | 24 | (25) | | 33 | (41) |
Traded loans, loans designated at fair value, loan commitments and guarantees | | 88 | (28) | | 103 | (63) |
Asset-backed securities | | 7 | (6) | | 16 | (12) |
Equity instruments | | 166 | (74) | | 105 | (42) |
Interest rate derivative contracts, net | | 107 | (67) | | 106 | (58) |
Credit derivative contracts, net | | 174 | (196) | | 248 | (277) |
Foreign exchange derivative contracts, net | | 33 | (28) | | 35 | (32) |
Equity / index derivative contracts, net | | 61 | (57) | | 82 | (83) |
Structured debt instruments issued and non-structured fixed-rate bonds | | 136 | (146) | | 202 | (199) |
Other | | 14 | (13) | | 23 | (17) |
Total | | 809 | (640) | | 965 | (824) |
1 Of the total favorable changes, CHF 164 million as of 31 December 2015 (31 December 2014: CHF 116 million) related to financial investments available-for-sale. Of the total unfavorable changes, CHF 71 million as of 31 December 2015 (31 December 2014: CHF 56 million) related to financial investments available-for-sale. |
Consolidated financial statements
Notes to the UBS AG consolidated financial statements
Note 24 Fair value measurement (continued)
j) Financial instruments not measured at fair value
The table below provides the estimated fair values of financial instruments not measured at fair value.
Financial instruments not measured at fair value | | | | | | | | | | |
| | 31.12.15 | | 31.12.14 |
| | Carrying value | | Fair value | | Carrying value | | Fair value |
CHF billion | | Total | | Total | Level 1 | Level 2 | Level 3 | | Total | | Total | Level 1 | Level 2 | Level 3 |
Assets | | | | | | | | | | | | | | |
Cash and balances with central banks | | 91.3 | | 91.3 | 91.3 | 0.0 | 0.0 | | 104.1 | | 104.1 | 104.1 | 0.0 | 0.0 |
Due from banks | | 11.9 | | 11.9 | 11.4 | 0.5 | 0.0 | | 13.3 | | 13.3 | 12.6 | 0.7 | 0.0 |
Cash collateral on securities borrowed | | 25.6 | | 25.6 | 0.0 | 25.6 | 0.0 | | 24.1 | | 24.1 | 0.0 | 24.1 | 0.0 |
Reverse repurchase agreements | | 67.9 | | 67.9 | 0.0 | 65.8 | 2.1 | | 68.4 | | 68.4 | 0.0 | 66.5 | 2.0 |
Cash collateral receivables on derivative instruments | | 23.8 | | 23.8 | 0.0 | 23.8 | 0.0 | | 31.0 | | 31.0 | 0.0 | 31.0 | 0.0 |
Loans | | 312.7 | | 314.9 | 0.0 | 170.9 | 143.9 | | 316.0 | | 318.6 | 0.0 | 186.6 | 131.9 |
Other assets | | 20.1 | | 20.1 | 0.0 | 20.1 | 0.0 | | 21.3 | | 21.2 | 0.0 | 21.2 | 0.0 |
Liabilities | | | | | | | | | | | | | | |
Due to banks | | 11.8 | | 11.8 | 10.4 | 1.4 | 0.0 | | 10.5 | | 10.5 | 9.6 | 0.9 | 0.0 |
Cash collateral on securities lent | | 8.0 | | 8.0 | 0.0 | 8.0 | 0.0 | | 9.2 | | 9.2 | 0.0 | 9.2 | 0.0 |
Repurchase agreements | | 9.7 | | 9.7 | 0.0 | 9.6 | 0.0 | | 11.8 | | 11.8 | 0.0 | 11.6 | 0.2 |
Cash collateral payables on derivative instruments | | 38.3 | | 38.3 | 0.0 | 38.3 | 0.0 | | 42.4 | | 42.4 | 0.0 | 42.4 | 0.0 |
Due to customers | | 402.5 | | 402.8 | 0.0 | 402.8 | 0.0 | | 411.0 | | 411.0 | 0.0 | 411.0 | 0.0 |
Debt issued | | 82.2 | | 84.4 | 0.0 | 78.4 | 6.0 | | 91.2 | | 94.3 | 0.0 | 88.5 | 5.8 |
Other liabilities | | 52.1 | | 52.1 | 0.0 | 52.1 | 0.0 | | 46.0 | | 46.0 | 0.0 | 46.0 | 0.0 |
Guarantees / Loan commitments | | | | | | | | | | | | | | |
Guarantees¹ | | 0.0 | | (0.1) | 0.0 | 0.0 | (0.1) | | 0.0 | | (0.1) | 0.0 | 0.0 | (0.1) |
Loan commitments | | 0.0 | | 0.0 | 0.0 | 0.0 | 0.0 | | 0.0 | | 0.0 | 0.0 | 0.0 | 0.0 |
1 The carrying value of guarantees represented a liability of CHF 0.0 billion as of 31 December 2015 (31 December 2014: CHF 0.0 billion). The estimated fair value of guarantees represented an asset of CHF 0.1 billion as of 31 December 2015 (31 December 2014: CHF 0.1 billion). |
Note 24 Fair value measurement (continued)
The fair values included in the table on the previous page were calculated for disclosure purposes only. The fair value valuation techniques and assumptions described below relate only to the fair value of UBS AG’s financial instruments not measured at fair value. Other institutions may use different methods and assumptions for their fair value estimation, and therefore such fair value disclosures cannot necessarily be compared from one financial institution to another. The following principles were applied when determining fair value estimates for financial instruments not measured at fair value:
– For financial instruments with remaining maturities greater than three months, the fair value was determined from quoted market prices, if available.
– Where quoted market prices were not available, the fair values were estimated by discounting contractual cash flows using current market interest rates or appropriate yield curves for instruments with similar credit risk and maturity. These estimates generally include adjustments for counterparty credit risk or UBS AG’s own credit.
– For short-term financial instruments with remaining maturities of three months or less, the carrying amount, which is net of credit loss allowances, is generally considered a reasonable estimate of fair value. The following financial instruments not measured at fair value had remaining maturities of three months or less as of 31 December 2015: 100% of cash and balances with central banks, 96% of amounts due from banks, 100% of cash collateral on securities borrowed, 87% of reverse repurchase agreements, 100% of cash collateral receivables on derivatives, 52% of loans, 88% of amounts due to banks, 87% of cash collateral on securities lent, 96% of repurchase agreements, 100% of cash collateral payable on derivatives, 96% of amount due to customers and 18% of debt issued.
– The fair value estimates for repurchase and reverse repurchase agreements with variable and fixed interest rates, for all maturities, include the valuation of the interest rate component of these instruments. Credit and debit valuation adjustments have not been included in the valuation due to the short-term nature of these instruments.
– The estimated fair values of off-balance sheet financial instruments are based on market prices for similar facilities and guarantees. Where this information is not available, fair value is estimated using discounted cash flow analysis.
Consolidated financial statements
Notes to the UBS AG consolidated financial statements
Note 25 Restricted and transferred financial assets
This Note provides information on restricted financial assets (Note 25a), transfers of financial assets (Note 25b and 25c) and financial assets which are received as collateral with the right to resell or repledge these assets (Note 25d).
a) Restricted financial assets
Restricted financial assets consist of assets pledged as collateral against an existing liability or contingent liability and other assets that are otherwise explicitly restricted such that they cannot be used to secure funding.
Financial assets are mainly pledged as collateral in securities lending transactions, in repurchase transactions, against loans from Swiss mortgage institutions and in connection with the issuance of covered bonds. UBS AG generally enters into repurchase and securities lending arrangements under standard market agreements, with a market-based haircut applied to the collateral, which results in the associated liabilities having a carrying value below the carrying value of the assets. Pledged mortgage loans serve as collateral for existing liabilities against Swiss central mortgage institutions and for existing covered bond issuances of CHF 16,727 million as of 31 December 2015 (31 December 2014: CHF 21,644 million).
Other restricted financial assets include assets protected under client asset segregation rules, assets held by UBS AG’s insurance entities to back related liabilities to the policy holders, assets held in certain jurisdictions to comply with explicit minimum local asset maintenance requirements and assets held in consolidated bankruptcy remote entities such as certain investment funds and other structured entities. The carrying value of the liabilities associated with these other restricted financial assets is generally equal to the carrying value of the assets, with the exception of assets held to comply with local asset maintenance requirements for which the associated liabilities are greater.
UBS AG and its subsidiaries are generally not subject to significant restrictions that would prevent the transfer of dividends and capital between UBS AG and its subsidiaries. However, certain regulated subsidiaries are required to maintain capital and / or liquidity to comply with local regulations and may be subject to prudential limitations by regulators that limit the amount of funds that they can distribute or otherwise transfer. Non-regulated subsidiaries are generally not subject to such requirements and transfer restrictions. However, restrictions can also be the result of different legal, regulatory, contractual, entity or country-specific arrangements and / or requirements.
Restricted financial assets | | | |
CHF million | | 31.12.15 | 31.12.14 |
Financial assets pledged as collateral | | | |
Trading portfolio assets | | 57,024 | 61,304 |
of which: assets pledged as collateral which may be sold or repledged by counterparties | | 51,943 | 56,018 |
Loans | | 24,980 | 27,973 |
of which: mortgage loans¹ | | 24,980 | 27,973 |
Financial investments available-for-sale | | 632 | 2,868 |
of which: assets pledged as collateral which may be sold or repledged by counterparties | | 6 | 2,662 |
Total financial assets pledged as collateral² | | 82,636 | 92,144 |
| | | |
Other restricted financial assets | | | |
Due from banks | | 3,285 | 3,511 |
Reverse repurchase agreements | | 1,099 | 1,896 |
Trading portfolio assets | | 24,388 | 25,567 |
Cash collateral receivables on derivative instruments | | 7,104 | 6,135 |
Financial investments available-for-sale | | 502 | 1,209 |
Other | | 480 | 679 |
Total other restricted financial assets | | 36,858 | 38,997 |
Total financial assets pledged and other restricted financial assets | | 119,494 | 131,142 |
1 These pledged mortgage loans serve as collateral for existing liabilities against Swiss central mortgage institutions and for existing covered bond issuances. Of these pledged mortgage loans, approximately CHF 4.4 billion for 31 December 2015 (31 December 2014: approximately CHF 4.5 billion) could be withdrawn or used for future liabilities or covered bond issuances without breaching existing collateral requirements. 2 Does not include assets placed with central banks related to undrawn credit lines and for payment, clearing and settlement purposes (31 December 2015: CHF 4.9 billion, 31 December 2014: CHF 6.1 billion). |
Note 25 Restricted and transferred financial assets (continued)
b) Transferred financial assets that are not derecognized in their entirety
The table below presents information for financial assets, which have been transferred but are subject to continued recognition in full, as well as recognized liabilities associated with those transferred assets.
Transferred financial assets subject to continued recognition in full |
CHF million | | 31.12.15 | | 31.12.14 |
| | Carrying value of transferred assets | Carrying value of associated liabilities recognized on-balance sheet | | Carrying value of transferred assets | Carrying value of associated liabilities recognized on-balance sheet |
Trading portfolio assets transferred which may be sold or repledged by counterparties | | 51,943 | 13,146 | | 56,018 | 18,289 |
relating to securities lending and repurchase agreements in exchange for cash received | | 13,406 | 13,146 | | 19,366 | 18,147 |
relating to securities lending agreements in exchange for securities received | | 37,097 | 0 | | 35,557 | 0 |
relating to other financial asset transfers | | 1,440 | 0 | | 1,095 | 142 |
Financial investments available-for-sale transferred which may be sold or repledged by counterparties | | 6 | 6 | | 2,662 | 2,584 |
Total financial assets transferred | | 51,950 | 13,152 | | 58,680 | 20,873 |
Transactions in which financial assets are transferred, but continue to be recognized in their entirety on UBS AG’s balance sheet include securities lending and repurchase agreements as well as other financial asset transfers. Repurchase and securities lending arrangements are, for the most part, conducted under standard market agreements, and are undertaken with counterparties subject to UBS AG’s normal credit risk control processes.
® Refer to Note 1a items 13 and 14 for more information on repurchase agreements and securities lending agreements
As of 31 December 2015, approximately a quarter of the transferred financial assets were trading portfolio assets transferred in exchange for cash, in which case the associated recognized liability represents the amount to be repaid to counterparties. For securities lending and repurchase agreements, a haircut between 0% and 15% is generally applied to the collateral, which results in associated liabilities having a carrying value below the carrying value of the transferred assets. The counterparties to the associated liabilities presented in the table above have full recourse to UBS AG.
In securities lending arrangements entered into in exchange for the receipt of other securities as collateral, neither the securities received nor the obligation to return them are recognized on UBS AG’s balance sheet, as the risks and rewards of ownership are not transferred to UBS AG. In cases where such financial assets received are subsequently sold or repledged in another transaction, this is not considered to be a transfer of financial assets.
Other financial asset transfers primarily include securities transferred to collateralize derivative transactions, for which the carrying value of associated liabilities is not provided in the table above because those replacement values are managed on a portfolio basis across counterparties and product types, and therefore is not a direct relationship between the specific collateral pledged and the associated liability.
Transferred assets other than trading portfolio assets and financial investments available-for-sale which may be sold or repledged by counterparties were not material as of 31 December 2015 and as of 31 December 2014.
Transferred financial assets that are not subject to derecognition in full, but which remain on the balance sheet to the extent of UBS AG’s continuing involvement, were not material as of 31 December 2015 and as of 31 December 2014.
Consolidated financial statements
Notes to the UBS AG consolidated financial statements
Note 25 Restricted and transferred financial assets (continued)
c) Transferred financial assets that are derecognized in their entirety with continuing involvement
Continuing involvement in a transferred and fully derecognized financial asset may result from contractual provisions in the transfer agreement or in a separate agreement with the counterparty or a third party entered into in connection with the transfer. The table below provides information on UBS AG’s continuing involvement in transferred and fully derecognized financial assets.
Transferred financial assets that are derecognized in their entirety with continuing involvement |
CHF million | | 31.12.15 |
| | | Carrying amount of continuing involvement | Fair value of continuing involvement | Gain / (loss) recognized at the date of transfer of the financial assets² | | Gain / (loss) from continuing involvement in transferred and derecognized financial assets |
| | Balance sheet line item | | For the year ended 31.12.15 | Life-to-date 31.12.15 |
Type of continuing involvement | | | | | | |
Purchased and retained interest in securitization structures | | Trading portfolio assets / Replacement values¹ | 15 | 15 | 8 | | 16 | (1,566) |
Total | | | 15 | 15 | 8 | | 16 | (1,566) |
| | | | | | | | |
CHF million | | 31.12.14 |
| | | Carrying amount of continuing involvement | Fair value of continuing involvement | Gain / (loss) recognized at the date of transfer of the financial assets | | Gain / (loss) from continuing involvement in transferred and derecognized financial assets |
| | Balance sheet line item | | For the year ended 31.12.14 | Life-to-date 31.12.14 |
Type of continuing involvement | | | | | | |
Purchased and retained interest in securitization structures | | Trading portfolio assets / Replacement values¹ | (22) | (22) | 22 | | 13 | (1,582) |
Total | | | (22) | (22) | 22 | | 13 | (1,582) |
1 As of 31 December 2015, total purchased and retained interest in securitization structures consisted of trading portfolio assets of CHF 37 million and negative replacement values of CHF 22 million. As of 31 December 2014, total purchased and retained interest in securitization structures consisted of trading portfolio assets of CHF 29 million and negative replacement values of CHF 51 million. 2 Represents gains / (losses) recognized on the date of transfer during the respective reporting period. |
Purchased and retained interests in securitization vehicles
In cases where UBS AG has transferred assets into securitization vehicles and retained or purchased interests therein, UBS AG has a continuing involvement in those transferred assets. The majority of the retained continuing involvement securitization positions held in the trading portfolio are collateralized debt obligations, US commercial mortgage-backed securities and residential mortgage-backed securities. As a result of losses incurred in previous years, the majority of these continuing involvement positions had a carrying amount of zero as of 31 December 2015. As of 31 December 2015, the maximum exposure to loss related to purchased and retained interests in securitization structures was CHF 55 million compared with CHF 48 million as of 31 December 2014, both mainly related to trading portfolio assets. Undiscounted cash outflows of CHF 41 million may be payable to the transferee in future periods as a consequence of holding the purchased and retained interests. The earliest period in which payment may be required is less than one month. Life-to-date losses presented in the table above only relate to retained interests held as of 31 December 2015.
Note 25 Restricted and transferred financial assets (continued)
d) Off-balance-sheet assets received
The table below presents assets received from third parties that can be sold or repledged, that are not recognized on the balance sheet, but that are held as collateral, including amounts that have been sold or repledged.
Off-balance-sheet assets received | | |
CHF million | 31.12.15 | 31.12.14 |
Fair value of assets received which can be sold or repledged | 401,511 | 388,855 |
received as collateral under reverse repurchase, securities borrowing and lending arrangements, derivative transactions and other transactions¹ | 393,839 | 383,354 |
received in unsecured borrowings | 7,672 | 5,502 |
thereof sold or repledged² | 286,757 | 271,963 |
in connection with financing activities | 241,992 | 227,515 |
to satisfy commitments under short sale transactions | 29,137 | 27,958 |
in connection with derivative and other transactions¹ | 15,628 | 16,491 |
1 Includes securities received as initial margin from its clients that UBS AG is required to remit to CCPs, brokers and deposit banks through its exchange-traded derivative (ETD) clearing and execution services. 2 Does not include off-balance sheet securities (31 December 2015: CHF 47.3 billion, 31 December 2014: CHF 37.6 billion) placed with central banks related to undrawn credit lines and for payment, clearing and settlement purposes for which there are no associated liabilities or contingent liabilities. |
Note 26 Offsetting financial assets and financial liabilities
UBS AG enters into netting agreements with counterparties to manage the credit risks associated primarily with repurchase and reverse repurchase transactions, securities borrowing and lending, and over-the-counter (OTC) and exchange-traded derivatives (ETD). These netting agreements and similar arrangements generally enable the counterparties to set-off liabilities against available assets received in the ordinary course of business and / or in the event that the counterparty to the transaction is unable to fulfill its contractual obligations. The right of set-off is a legal right to settle or otherwise eliminate all or a portion of an amount due by applying an amount receivable from the same counterparty against it, thus reducing credit exposure.
The table on the following page provides a summary of financial assets subject to offsetting, enforceable master netting arrangements and similar agreements, as well as financial collateral received to mitigate credit exposures for these financial assets. The gross financial assets of UBS AG that are subject to offsetting, enforceable netting arrangements and similar agreements are reconciled to the net amounts presented within the associated balance sheet line, after giving effect to financial liabilities with the same counterparties that have been offset on the balance sheet and other financial assets not subject to an enforceable netting arrangement or similar agreement. Further, related amounts for financial liabilities and collateral received that are not offset on the balance sheet are shown to arrive at financial assets after consideration of netting potential.
UBS AG engages in a variety of counterparty credit mitigation strategies in addition to netting and collateral arrangements. Therefore, the net amounts presented in the tables on the next pages do not purport to represent UBS AG’s actual credit exposure.
Consolidated financial statements
Notes to the UBS AG consolidated financial statements
Note 26 Offsetting financial assets and financial liabilities (continued)
Financial assets subject to offsetting, enforceable master netting arrangements and similar agreements |
| 31.12.15 |
| Assets subject to netting arrangements | | | | | |
| Netting recognized on the balance sheet | | Netting potential not recognized on the balance sheet³ | | Assets not subject to netting arrangements⁴ | | Total assets |
CHF billion | Gross assets before netting | Netting with gross liabilities² | Net assets recognized on the balance sheet | | Financial liabilities | Collateral received | Assets after consid- eration of netting potential | | Assets recognized on the balance sheet | | Total assets after consid- eration of netting potential | Total assets recognized on the balance sheet |
Cash collateral on securities borrowed | 23.9 | 0.0 | 23.9 | | (3.1) | (20.9) | 0.0 | | 1.6 | | 1.6 | 25.6 |
Reverse repurchase agreements | 117.9 | (62.1) | 55.8 | | (4.4) | (51.4) | 0.0 | | 12.1 | | 12.1 | 67.9 |
Positive replacement values | 161.9 | (2.5) | 159.3 | | (123.0) | (25.5) | 10.8 | | 8.1 | | 18.9 | 167.4 |
Cash collateral receivables on derivative instruments¹ | 85.9 | (66.3) | 19.6 | | (10.9) | (1.5) | 7.2 | | 4.1 | | 11.3 | 23.8 |
Financial assets designated at fair value | 2.4 | 0.0 | 2.4 | | 0.0 | (1.8) | 0.6 | | 3.4 | | 4.0 | 5.8 |
Total assets | 392.1 | (131.0) | 261.1 | | (141.3) | (101.1) | 18.7 | | 29.3 | | 48.0 | 290.5 |
| | | | | | | | | | | | |
| 31.12.14 |
| Assets subject to netting arrangements | | | | | |
| Netting recognized on the balance sheet | | Netting potential not recognized on the balance sheet³ | | Assets not subject to netting arrangements⁴ | | Total assets |
CHF billion | Gross assets before netting | Netting with gross liabilities² | Net assets recognized on the balance sheet | | Financial liabilities | Collateral received | Assets after consid- eration of netting potential | | Assets recognized on the balance sheet | | Total assets after consid- eration of netting potential | Total assets recognized on the balance sheet |
Cash collateral on securities borrowed | 22.7 | 0.0 | 22.7 | | (1.9) | (20.8) | 0.0 | | 1.4 | | 1.4 | 24.1 |
Reverse repurchase agreements | 99.2 | (42.8) | 56.4 | | (3.4) | (52.8) | 0.1 | | 12.1 | | 12.2 | 68.4 |
Positive replacement values | 249.9 | (3.1) | 246.8 | | (198.7) | (30.8) | 17.3 | | 10.1 | | 27.4 | 257.0 |
Cash collateral receivables on derivative instruments¹ | 245.7 | (218.4) | 27.4 | | (18.8) | (1.6) | 7.0 | | 3.6 | | 10.6 | 31.0 |
Financial assets designated at fair value | 3.1 | 0.0 | 3.1 | | 0.0 | (3.0) | 0.1 | | 1.4 | | 1.5 | 4.5 |
Total assets | 620.5 | (264.2) | 356.3 | | (222.9) | (108.9) | 24.5 | | 28.6 | | 53.1 | 384.9 |
1 The net amount of Cash collateral receivables on derivative instruments recognized on the balance sheet includes certain OTC derivatives which are in substance net settled on a daily basis under IAS 32, and ETD which are economically settled on a daily basis. In addition, this balance includes OTC and ETD cash collateral balances which correspond with the cash portion of collateral pledged, reflected on the Negative replacement values line in the table presented on the following page. 2 The logic of the table results in amounts presented in the “Netting with gross liabilities” column corresponding directly to the amounts presented in the “Netting with gross assets”column in the liabilities table presented on the following page. 3 For the purpose of this disclosure, the amounts of financial instruments and cash collateral presented have been capped by the relevant netting agreement so as not to exceed the net amount of financial assets presented on the balance sheet; i.e., over-collateralization, where it exists, is not reflected in the table. 4 Includes assets not subject to enforceable netting arrangements and other out-of-scope items. |
Note 26 Offsetting financial assets and financial liabilities (continued)
The table below provides a summary of financial liabilities subject to offsetting, enforceable master netting arrangements and similar agreements, as well as financial collateral pledged to mitigate credit exposures for these financial liabilities. The gross financial liabilities of UBS AG that are subject to offsetting, enforceable netting arrangements and similar agreements are reconciled to the net amounts presented within the associated balance sheet line, after giving effect to financial assets with the same counterparties that have been offset on the balance sheet and other financial liabilities not subject to an enforceable netting arrangement or similar agreement. Further, related amounts for financial assets and collateral pledged that are not offset on the balance sheet are shown to arrive at financial liabilities after consideration of netting potential.
Financial liabilities subject to offsetting, enforceable master netting arrangements and similar agreements |
| 31.12.15 |
| Liabilities subject to netting arrangements | | | | | |
| Netting recognized on the balance sheet | | Netting potential not recognized on the balance sheet³ | | Liabilities not subject to netting arrangements⁴ | | Total liabilities |
CHF billion | Gross liabilities before netting | Netting with gross assets² | Net liabilities recognized on the balance sheet | | Financial assets | Collateral pledged | Liabilities after consid- eration of netting potential | | Liabilities recognized on the balance sheet | | Total liabilities after consid- eration of netting potential | Total liabilities recognized on the balance sheet |
Cash collateral on securities lent | 7.9 | 0.0 | 7.9 | | (3.1) | (4.8) | 0.0 | | 0.1 | | 0.1 | 8.0 |
Repurchase agreements | 69.0 | (62.1) | 6.9 | | (4.4) | (2.5) | 0.0 | | 2.8 | | 2.8 | 9.7 |
Negative replacement values | 154.2 | (2.5) | 151.7 | | (123.0) | (17.4) | 11.3 | | 10.7 | | 22.1 | 162.4 |
Cash collateral payables on derivative instruments¹ | 99.9 | (66.3) | 33.6 | | (19.0) | (2.5) | 12.1 | | 4.7 | | 16.8 | 38.3 |
Financial liabilities designated at fair value | 3.9 | 0.0 | 3.9 | | 0.0 | (0.7) | 3.1 | | 59.1 | | 62.3 | 63.0 |
Total liabilities | 334.9 | (131.0) | 203.9 | | (149.4) | (28.0) | 26.5 | | 77.4 | | 104.0 | 281.4 |
| | | | | | | | | | | | |
| 31.12.14 |
| Liabilities subject to netting arrangements | | | | | |
| Netting recognized on the balance sheet | | Netting potential not recognized on the balance sheet³ | | Liabilities not subject to netting arrangements⁴ | | Total liabilities |
CHF billion | Gross liabilities before netting | Netting with gross assets² | Net liabilities recognized on the balance sheet | | Financial assets | Collateral pledged | Liabilities after consid- eration of netting potential | | Liabilities recognized on the balance sheet | | Total liabilities after consid- eration of netting potential | Total liabilities recognized on the balance sheet |
Cash collateral on securities lent | 8.4 | 0.0 | 8.4 | | (1.9) | (6.5) | 0.0 | | 0.7 | | 0.8 | 9.2 |
Repurchase agreements | 51.5 | (42.8) | 8.7 | | (3.4) | (5.2) | 0.0 | | 3.2 | | 3.2 | 11.8 |
Negative replacement values | 243.3 | (3.1) | 240.2 | | (198.7) | (21.8) | 19.7 | | 13.9 | | 33.5 | 254.1 |
Cash collateral payables on derivative instruments¹ | 256.1 | (218.4) | 37.7 | | (25.1) | (2.3) | 10.3 | | 4.6 | | 14.9 | 42.4 |
Financial liabilities designated at fair value | 3.8 | 0.0 | 3.8 | | 0.0 | (1.4) | 2.4 | | 71.5 | | 73.9 | 75.3 |
Total liabilities | 563.1 | (264.2) | 298.8 | | (229.2) | (37.3) | 32.4 | | 93.9 | | 126.3 | 392.8 |
1 The net amount of Cash collateral payables on derivative instruments recognized on the balance sheet includes certain OTC derivatives which are in substance net settled on a daily basis under IAS 32, and ETD which are economically settled on a daily basis. In addition, this balance includes OTC and ETD cash collateral balances which correspond with the cash portion of collateral received, reflected on the Positive replacement values line in the table presented on the previous page. 2 The logic of the table results in amounts presented in the “Netting with gross assets” column corresponding directly to the amounts presented in the “Netting with gross liabilities” column in the assets table presented on the previous page. 3 For the purpose of this disclosure, the amounts of financial instruments and cash collateral presented have been capped by the relevant netting agreement so as not to exceed the net amount of financial liabilities presented on the balance sheet; i.e., over-collateralization, where it exists, is not reflected in the table. 4 Includes liabilities not subject to enforceable netting arrangements and other out-of-scope items. |
Consolidated financial statements
Notes to the UBS AG consolidated financial statements
Note 27 Financial assets and liabilities – additional information
a) Measurement categories of financial assets and liabilities
The table below provides information about the carrying amounts of individual classes of financial instruments within the measurement categories of financial assets and liabilities as defined in IAS 39 Financial Instruments: Recognition and Measurement. Only those assets and liabilities that are
financial instruments as defined in IAS 32 Financial Instruments: Presentation are included in the table below, which causes certain balances to differ from those presented on the balance sheet.
® Refer to Note 24 for more information on how the fair value of financial instruments is determined
Measurement categories of financial assets and financial liabilities |
CHF million | 31.12.15 | 31.12.14 |
| | |
Financial assets¹ | | |
Held for trading | | |
Trading portfolio assets | 120,405 | 132,392 |
of which: assets pledged as collateral which may be sold or repledged by counterparties | 51,943 | 56,018 |
Debt issued² | 106 | 283 |
Positive replacement values | 167,435 | 256,978 |
Total | 287,946 | 389,653 |
Fair value through profit or loss | | |
Financial assets designated at fair value | 5,808 | 4,493 |
Financial assets at amortized cost | | |
Cash and balances with central banks | 91,306 | 104,073 |
Due from banks | 11,866 | 13,334 |
Cash collateral on securities borrowed | 25,584 | 24,063 |
Reverse repurchase agreements | 67,893 | 68,414 |
Cash collateral receivables on derivative instruments | 23,763 | 30,979 |
Loans³ | 312,723 | 315,984 |
Other assets | 20,139 | 21,332 |
Total | 553,275 | 578,179 |
Available-for-sale | | |
Financial investments available-for-sale | 62,543 | 57,159 |
Total financial assets | 909,572 | 1,029,483 |
| | |
Financial liabilities | | |
Held for trading | | |
Trading portfolio liabilities | 29,137 | 27,958 |
Debt issued² | 236 | 308 |
Negative replacement values | 162,430 | 254,101 |
Total | 191,803 | 282,367 |
Fair value through profit or loss, other | | |
Financial liabilities designated at fair value | 62,995 | 75,297 |
Amounts due under unit-linked investment contracts | 15,718 | 17,643 |
Total | 78,713 | 92,940 |
Financial liabilities at amortized cost | | |
Due to banks | 11,836 | 10,492 |
Cash collateral on securities lent | 8,029 | 9,180 |
Repurchase agreements | 9,653 | 11,818 |
Cash collateral payables on derivative instruments | 38,282 | 42,372 |
Due to customers | 402,522 | 410,979 |
Debt issued | 82,230 | 91,183 |
Other liabilities | 52,065 | 46,013 |
Total | 604,617 | 622,036 |
Total financial liabilities | 875,133 | 997,343 |
1 As of 31 December 2015, CHF 123 billion of Loans, CHF 0 billion of Due from banks, CHF 1 billion of Reverse repurchase agreements, CHF 30 billion of Financial investments available-for-sale and CHF 3 billion of Financial assets designated at fair value are expected to be recovered or settled after 12 months. As of 31 December 2014, CHF 119 billion of Loans, CHF 0 billion of Due from banks, CHF 1 billion of Reverse repurchase agreements, CHF 35 billion of Financial investments available-for-sale and CHF 4 billion of Financial assets designated at fair value are expected to be recovered or settled after 12 months. 2 Represents the embedded derivative component of structured debt issued for which the fair value option has not been applied and which is presented within Debt issued on the balance sheet. 3 Includes finance lease receivables of CHF 1.1 billion as of 31 December 2015 (31 December 2014: CHF 1.1 billion). Refer to Notes 10 and 33 for more information. |
Note 27 Financial assets and liabilities – additional information (continued)
b) Maturity analysis of financial liabilities
The contractual maturities for non-derivative and non-trading financial liabilities as of 31 December 2015 are based on the earliest date on which UBS could be contractually required to pay. The total amounts that contractually mature in each time-band are also shown for 31 December 2014. Derivative positions and trading liabilities, predominantly made up of short sale transactions, are assigned to the column Due within 1 month, as this provides a conservative reflection of the nature of these trading activities. The contractual maturities may extend over significantly longer periods.
Maturity analysis of financial liabilities¹ |
CHF billion | Due within 1 month | Due between 1 and 3 months | Due between 3 and 12 months | Due between 1 and 5 years | Due after 5 years | Total |
| | | | | | |
Financial liabilities recognized on balance sheet² | | | | | | |
Due to banks | 8.1 | 2.4 | 1.1 | 0.3 | 0.0 | 11.8 |
Cash collateral on securities lent | 5.7 | 1.3 | 1.0 | | | 8.0 |
Repurchase agreements | 7.9 | 1.4 | 0.2 | 0.1 | 0.2 | 9.7 |
Trading portfolio liabilities³˒⁴ | 29.1 | | | | | 29.1 |
Negative replacement values³ | 162.4 | | | | | 162.4 |
Cash collateral payables on derivative instruments | 38.3 | | | | | 38.3 |
Financial liabilities designated at fair value⁵ | 15.2 | 15.9 | 13.1 | 11.9 | 12.0 | 68.1 |
Due to customers | 373.3 | 13.4 | 4.8 | 4.1 | 9.7 | 405.3 |
Debt issued | 5.7 | 9.9 | 16.3 | 36.6 | 22.7 | 91.2 |
Other liabilities | 66.7 | | | | | 66.7 |
Total 31.12.15 | 712.5 | 44.3 | 36.4 | 53.0 | 44.6 | 890.7 |
Total 31.12.14 | 812.3 | 48.4 | 39.4 | 60.9 | 49.8 | 1,010.9 |
| | | | | | |
Guarantees, commitments and forward starting transactions⁶ |
Loan commitments | 55.7 | 0.2 | 0.2 | 0.0 | | 56.1 |
Guarantees | 15.9 | 0.0 | 0.0 | 0.1 | 0.0 | 16.0 |
Forward starting transactions | | | | | | |
Reverse repurchase agreements | 6.6 | | | | | 6.6 |
Securities borrowing agreements | 0.0 | | | | | 0.0 |
Total 31.12.15 | 78.1 | 0.2 | 0.2 | 0.1 | 0.0 | 78.7 |
Total 31.12.14 | 78.3 | 0.1 | 0.2 | 0.2 | 0.0 | 78.8 |
1 Non-financial liabilities such as deferred income, deferred tax liabilities, provisions and liabilities on employee compensation plans are not included in this analysis. 2 Except for trading portfolio liabilities and negative replacement values (see footnote 3), the amounts presented generally represent undiscounted cash flows of future interest and principal payments. 3 Carrying value is fair value. Management believes that this best represents the cash flows that would have to be paid if these positions had to be settled or closed out. Refer to Note 14 for undiscounted cash flows of derivatives designated in hedge accounting relationships. 4 Contractual maturities of trading portfolio liabilities are: CHF 27.2 billion due within one month (2014: CHF 26.7 billion), CHF 1.2 billion due between one month and one year (2014: CHF 1.3 billion), and CHF 0.8 billion due between 1 and 5 years (2014: CHF 0 billion). 5 Future interest payments on variable rate liabilities are determined by reference to the applicable interest rate prevailing as of the reporting date. Future principal payments which are variable are determined by reference to the conditions existing at the reporting date. 6 Comprises the maximum irrevocable amount of guarantees, commitments and forward starting transactions. |
Consolidated financial statements
Notes to the UBS AG consolidated financial statements
Note 27 Financial assets and liabilities – additional information (continued)
c) Reclassification of financial assets
In 2008 and 2009, certain financial assets were reclassified from Trading portfolio assets to Loans. On their reclassification date, these assets had fair values of CHF 26 billion and CHF 0.6 billion, respectively.
The reclassification of financial assets reflected UBS’s change in intent and ability to hold these financial assets for the foreseeable future rather than for trading in the near term. The financial assets were reclassified using their fair value on the date of the reclassification, which became their new cost basis at that date.
As of 31 December 2015, the carrying value of the remaining reclassified financial assets, which were entirely comprised of municipal auction rate securities, was CHF 0.2 billion (31 December 2014: CHF 0.7 billion), which was equal to the fair value of these assets.
The overall impact on operating profit before tax from reclassifed financial assets for the year ended 31 December 2015 was a profit of CHF 23 million (2014: CHF 84 million). If the financial assets had not been reclassified, the impact on operating profit before tax for the year ended 31 December 2015 would have been a profit of less than CHF 10 million.
d) Maximum exposure to credit risk of financial assets designated at fair value
Financial assets designated at fair value totaled CHF 5,808 million as of 31 December 2015 (31 December 2014: CHF 4,493 million). Maximum exposure to credit risk from financial assets designated at fair value was CHF 5.6 billion as of 31 December 2015 (31 December 2014: CHF 4.3 billion). The exposure related to structured loans and reverse repurchase and securities borrowing agreements was mitigated by securities collateral of CHF 3.5 billion as of 31 December 2015 (31 December 2014: CHF 3.3 billion).
The maximum exposure to credit risk of loans, but not structured loans, is generally mitigated by credit derivatives or similar instruments. Information regarding these instruments and the exposure which they mitigate is provided in the table below on a notional basis.
Investment fund units designated at fair value do not have a direct exposure to credit risk.
® Refer to Note 24 for more information on financial assets designated at fair value, and to “Maximum exposure to credit risk” in the “Risk management and control” section of this report for more information on collateral related to financial assets designated at fair value
Notional amounts of loans designated at fair value and related credit derivatives |
CHF million | 31.12.15 | 31.12.14 |
Loans – notional amount | 687 | 667 |
Credit derivatives related to loans – notional amount¹ | 630 | 644 |
Credit derivatives related to loans – fair value¹ | 4 | 1 |
1 Credit derivatives contracts include credit default swaps, total return swaps and similar instruments. |
The table below provides the effect on the fair values of loans from changes in credit risk for the periods presented and cumulatively since inception. Similarly, the change in fair value of credit derivatives and similar instruments which are used to hedge these loans is also provided.
Changes in fair value of loans and related credit derivatives attributable to changes in credit risk |
| | For the year ended | | Cumulative from inception until the year ended |
CHF million | | 31.12.15 | 31.12.14 | | 31.12.15 | 31.12.14 |
Changes in fair value of loans designated at fair value, attributable to changes in credit risk¹ | | (3) | (3) | | (4) | (2) |
Changes in fair value of credit derivatives and similar instruments which mitigate the maximum exposure to credit risk of loans designated at fair value¹ | | 3 | 3 | | 4 | 1 |
1 Current and cumulative changes in the fair value of loans designated at fair value, attributable to changes in their credit risk, are only calculated for those loans outstanding at balance sheet date. Current and cumulative changes in the fair value of credit derivatives hedging such loans include all the derivatives which have been used to mitigate credit risk of these loans since designation at fair value. For loans reported under the fair value option, changes in fair value due to changes in the credit standing of the borrower are calculated using counterparty credit information obtained from independent market sources. |
Note 28 Pension and other post-employment benefit plans
The table below provides information relating to pension costs for defined benefit plans and defined contribution plans. These costs are part of Personnel expenses.
Income statement – expenses related to pension and other post-employment benefit plans |
CHF million | 31.12.15 | 31.12.14 | 31.12.13 |
Net periodic pension cost for defined benefit plans | 569 | 467 | 651 |
of which: related to major pension plans¹ | 546 | 508 | 638 |
of which: Swiss plan | 515 | 458 | 555 |
of which: UK plan | 18 | 17 | 24 |
of which: other plans | 12 | 33 | 58 |
of which: related to post-retirement medical and life insurance plans² | 4 | (36) | (11) |
of which: UK plan | 1 | 2 | 2 |
of which: US plans | 2 | (37) | (12) |
of which: related to remaining plans and other costs³ | 19 | (5) | 24 |
Pension cost for defined contribution plans⁴ | 239 | 244 | 236 |
of which: UK | 86 | 91 | 91 |
of which: US | 100 | 91 | 91 |
of which: other countries | 53 | 62 | 54 |
Total pension and other post-employment benefit plan expenses⁵ | 808 | 711 | 887 |
1 Refer to Note 28a for more information. 2 Refer to Note 28b for more information. 3 Other costs include differences between actual and estimated performance award accruals and net accrued pension costs related to restructuring. 4 Refer to Note 28c for more information. 5 Refer to Note 6. |
The table below provides information relating to amounts recognized in other comprehensive income for defined benefit plans.
Other comprehensive income – gains / (losses) on pension and other post-employment benefit plans |
CHF million | 31.12.15 | 31.12.14 | 31.12.13 |
Major pension plans¹ | 339 | (1,456) | 1,168 |
of which: Swiss plan | 58 | (1,032) | 1,119 |
of which: UK plan | 317 | (168) | (65) |
of which: other plans | (35) | (256) | 115 |
Post-retirement medical and life insurance plans² | (3) | (5) | 3 |
of which: UK plan | 6 | (3) | 2 |
of which: US plans | (9) | (2) | 1 |
Remaining plans | (14) | 7 | 7 |
Gains / (losses) recognized in other comprehensive income, before tax | 322 | (1,454) | 1,178 |
Tax (expense) / benefit relating to defined benefit plans recognized in other comprehensive income | (19) | 247 | (239) |
Gains / (losses) recognized in other comprehensive income, net of tax³ | 303 | (1,208) | 939 |
1 Refer to Note 28a for more information. 2 Refer to Note 28b for more information. 3 Refer to the "Statement of comprehensive income". |
Consolidated financial statements
Notes to the UBS AG consolidated financial statements
Note 28 Pension and other post-employment benefit plans (continued)
The tables below provide information on UBS AG’s assets and liabilities with respect to pension and post-employment benefit plans. These are recognized on the balance sheet within Other assets and Other liabilities.
Balance sheet – net defined benefit pension and post-employment asset |
CHF million | 31.12.15 | 31.12.14 |
Major pension plans¹ | 50 | 0 |
of which: Swiss plan | 0 | 0 |
of which: UK plan | 50 | 0 |
of which: other plans | 0 | 0 |
Post-retirement medical and life insurance plans | 0 | 0 |
of which: UK plan | 0 | 0 |
of which: US plans | 0 | 0 |
Remaining plans | 0 | 0 |
Total net defined benefit pension and post-employment asset² | 50 | 0 |
1 Refer to Note 28a for more information. 2 Refer to Note 18. |
| | |
Balance sheet – net defined benefit pension and post-employment liability |
CHF million | 31.12.15 | 31.12.14 |
Major pension plans¹ | 622 | 1,256 |
of which: Swiss plan | 0 | 25 |
of which: UK plan | 0 | 568 |
of which: other plans² | 622 | 664 |
Post-retirement medical and life insurance plans³ | 84 | 85 |
of which: UK plan | 25 | 32 |
of which: US plans | 59 | 53 |
Remaining plans | 30 | 32 |
Total net defined benefit pension and post-employment liability⁴ | 736 | 1,374 |
1 Refer to Note 28a for more information. 2 Liability consists of: CHF 315 million related to US plans and CHF 307 million related to German plans (31 December 2014: CHF 297 million related to US plans and CHF 367 million related to German plans). 3 Refer to Note 28b for more information. 4 Refer to Note 23. |
Note 28 Pension and other post-employment benefit plans (continued)
a) Defined benefit pension plans
UBS AG has established defined benefit pension plans for its employees in various locations, with the major plans located in Switzerland, the UK, the US and Germany. Independent actuarial valuations for the plans in these countries are performed as required.
The overall investment policy and strategy for UBS AG’s defined benefit pension plans is guided by the objective of achieving an investment return which, together with contributions, ensures that there will be sufficient assets to pay pension benefits as they fall due while also mitigating the various risks of the plans. For the plans with assets (i.e., funded plans), the investment strategies for the plans are managed under local laws and regulations in each jurisdiction. The actual asset allocation is determined by the governance body with reference to the prevailing current and expected economic and market conditions and in consideration of specific asset class risk in the risk profile. Within this framework, UBS AG ensures that the fiduciaries consider how the asset investment strategy correlates with the maturity profile of the plan liabilities and the respective potential impact on the funded status of the plans, including potential short-term liquidity requirements.
The defined benefit obligation for all of UBS AG’s defined benefit pension plans is directly impacted by changes in yields of high-quality corporate bonds in the respective country in which the plan is held, as the applicable discount rate used to determine the defined benefit obligation is based on these yields. For the funded plans, the pension assets are invested in a diversified portfolio of financial assets including real estate, bonds, investment funds and cash across geographic regions to ensure a balance of risk and return to the extent allowed under local pension laws. The market value of these financial assets is not fully correlated to changes in high-quality corporate bond yields. This results in volatility in the net asset / liability position for each plan. Specific asset-liability matching strategies for each pension plan are independently determined by the responsible governance body in each country. The net asset / liability volatility for each plan is dependent on the specific financial assets chosen by each plan’s fiduciaries. For certain pension plans, a liability-driven investment approach is applied to a portion of the plan assets to reduce potential volatility.
Swiss pension plan
The Swiss pension plan covers employees of UBS AG and employees of companies having close economic or financial ties with UBS AG and exceeds the minimum benefit requirements under Swiss pension law.
Contributions to the pension plan are paid by the employer and the employees. The Swiss pension plan allows employees a choice with regard to the level of contributions paid by them. Employee contributions are calculated as a percentage of the contributory salary and are deducted monthly. The percentages deducted from salary depend on age and choice of contribution category and vary between 1% and 13.5% of contributory base salary and between 0% and 9% of contributory variable compensation. Depending on the age of the employee, UBS AG pays a contribution that ranges between 6.5% and 27.5% of contributory base salary and between 3.6% and 9% of contributory variable compensation. UBS AG also pays risk contributions which are used to finance benefits paid out in the event of death and disability, as well as to finance bridging pensions.
The plan benefits include retirement benefits and disability, death and survivor pensions. The pension plan offers to members at the normal retirement age of 64 a choice between a lifetime pension with or without full restitution and a partial or full lump sum payment. Members can draw early retirement benefits starting from the age of 58. Since 2015, employees have the possibility to make additional purchases of benefits to fund early retirement benefits (Plan 58+).
The payable pension amount is a result of the conversion rate applied on the accumulated balance of the individual plan participant’s pension account at the retirement date. The accumulated balance of each individual plan participant’s pension account is based on credited vested benefits transferred from previous employers, purchases of benefits and the employee and employer contributions that have been made to the pension account of each individual plan participant, as well as the interest accrued on the accumulated balance. The interest rate accrued is defined annually by the Pension Foundation Board.
Although the Swiss pension plan is based on a defined contribution promise under Swiss pension law, it is accounted for as a defined benefit plan under IAS 19, primarily because of the obligation to accrue interest on the pension accounts and the payment of lifetime pensions. The actuarial assumptions used for the Swiss pension plan are based on the Swiss economic environment.
® Refer to Note 1a item 24 for a description of the accounting policy for defined benefit pension plans
Consolidated financial statements
Notes to the UBS AG consolidated financial statements
Note 28 Pension and other post-employment benefit plans (continued)
The Swiss pension plan is governed by the Pension Foundation Board as required by Swiss pension law and the responsibilities of this board are defined by Swiss pension law and by the plan rules. According to Swiss pension law, a temporary limited underfunding is permitted. However, should an underfunded situation occur, the Pension Foundation Board is required to take the necessary measures to ensure that full funding can be expected to be restored within a maximum period of ten years. Under Swiss pension law, if a Swiss pension plan became significantly underfunded on a Swiss pension law basis, then additional employer and employee contributions could be required. In these situations, the risk is shared between employer and employees, and the employer is not legally obliged to cover more than 50% of the additional contributions required. The Swiss pension plan has a technical funding ratio under Swiss pension law of 123.3% as of 31 December 2015 (31 December 2014: 123.7%).
The investment strategy of the Swiss plan is implemented based on a multi-level investment and risk management process and is in line with Swiss pension law, including the rules and regulations relating to diversification of plan assets. These rules, among others, specify restrictions to the composition of plan assets, e.g., there is a limit of 50% for investments in equities. The investment strategy of the Swiss plan is aligned to the defined risk budget set out by the Pension Foundation Board. The risk budget is determined based on regularly performed asset and liability management analyses. In order to implement the risk budget, the Swiss plan may use direct investments, investment funds and derivatives. To mitigate foreign currency risk, a specific currency hedging strategy was implemented. The Pension Foundation Board strives for a medium- and long-term balance between assets and liabilities. Under IAS 19, volatility arises in the Swiss pension plan net asset / liability because the fair value of the plan assets is not directly correlated to movements in the value of the plan’s defined benefit obligation in the short-term.
As of 31 December 2015, the Swiss pension plan was in a surplus situation on an International Financial Reporting Standards (IFRS) measurement basis, as the fair value of plan assets exceeded the defined benefit obligation by CHF 1,283 million (31 December 2014: deficit of CHF 25 million). However, a surplus can only be recognized on the balance sheet to the extent that it does not exceed the estimated future economic benefit, which equals the difference between the present value of the estimated future net service cost and the present value of the estimated future employer contributions. The maximum future economic benefit is highly variable based on changes in the discount rate. As of 31 December 2015, the estimated future economic benefit was zero and hence, no net defined benefit asset was recognized on the balance sheet. The difference of CHF 1,283 million between the pension plan surplus and the estimated future economic benefit, the so-called asset ceiling effect, was recognized in other comprehensive income.
The employer contributions expected to be made to the Swiss pension plan in 2016 are estimated to be CHF 474 million.
Non-Swiss pension plans
The non-Swiss locations of UBS AG offer various defined benefit pension plans in accordance with local regulations and practices. The non-Swiss locations with major defined benefit plans are the UK, the US and Germany. Defined benefit pension plans in other locations are not material to the financial results of UBS AG and hence not separately disclosed.
The non-Swiss plans provide benefits in the event of retirement, death or disability. The level of benefits provided depends on the specific rate of benefit accrual and the level of employee compensation. UBS AG’s general principle is to ensure that the plans are appropriately funded under local pension regulations in each country and this is the primary driver for determining when additional contributions are required. Similar to the Swiss pension plan, volatility arises in the net asset / liability position of the non-Swiss plans because the fair value of the respective plans’ assets are not directly correlated to movements in the value of the plans’ defined benefit obligations.
The funding policy for these plans is consistent with local government regulations and tax requirements, and actuarial assumptions used are based on the local economic environment.
® Refer to Note 1a item 24 for a description of the accounting policy for defined benefit pension plans
UK
The UK plan is a career-average revalued earnings scheme, and benefits increase automatically based on UK price inflation. Normal retirement age for participants in the UK plan is 60. On 1 July 2013, UBS AG closed the UK defined benefit pension plan for future service. After that date, UBS AG no longer recognized current service costs for this plan. Plan participants who were active employees under the defined benefit plan were eligible to become participants of the defined contribution plan for any service after the plan was closed for future service.
Note 28 Pension and other post-employment benefit plans (continued)
The responsibility for governance of the UK plan lies jointly with the Pension Trustee Board, which is required under local pension laws, and UBS AG. The employer contributions to the pension fund included regular contributions and specific deficit-funding contributions until the date of the closure for future service and thereafter only reflected agreed-upon deficit-funding contributions. The deficit-funding contributions are determined based on the most recent actuarial valuation, which is conducted based on assumptions agreed by the Pension Trustee Board and UBS AG. In the event of an underfunding, UBS AG must agree to a deficit recovery plan with the Pension Trustee Board within statutory deadlines. In 2015, UBS AG made a deficit-funding contribution of CHF 316 million (2014: CHF 75 million).
The plan assets are invested in a diversified portfolio of financial assets. A liability-driven investment approach is applied as a portion of the plan assets are invested in inflation-indexed bonds which provide a partial hedge against price inflation. If price inflation increases, the defined benefit obligation will likely increase more significantly than any change in the fair value of plan assets, which would result in an increase in the net defined benefit liability. Plan rules and local pension legislation cap the level of inflationary increase that can be applied to plan benefits.
As the plan is obligated to provide guaranteed lifetime pension benefits to plan participants upon retirement, increases in life expectancy will result in an increase in the plan’s liabilities. This is particularly significant in the UK plan, where inflationary increases result in higher sensitivity to changes in life expectancy.
As of 31 December 2015, the UK plan was in a surplus situation on an IFRS measurement basis, as the fair value of plan assets exceeded the defined benefit obligation by CHF 50 million. This surplus was recognized on the UBS AG balance sheet, as UBS AG has a right to a refund with regards to the UK plan.
No employer contributions are expected to be made to the UK defined benefit plan in 2016.
US
There are two distinct major defined benefit pension plans in the US. Normal retirement age for participants in the US plans is 65. The plans are closed to new entrants, who instead can participate in defined contribution plans.
One of the major defined benefit pension plans is a contribution-based plan in which each participant accrues a percentage of salary in a pension account. The pension account is credited annually with interest based on a rate that is linked to the average yield on one-year US government bonds. For the other major defined benefit pension plan, retirement benefits accrue based on the career-average earnings of each individual plan participant. Upon retirement, the plans allow participants a choice between a lump sum payment and a lifetime pension.
Both of these defined benefit pension plans have fiduciaries as required under local state pension laws. The fiduciaries, along with UBS AG, are jointly responsible for governance of the plans. Actuarial valuations are regularly completed for the plans, and UBS AG has historically elected to make contributions to the plans in order to maintain a funded ratio of at least 80%, as calculated under local pension regulations. The annual employer contributions are equal to the present value of benefits accrued each year plus a rolling amortization of any prior underfunding. If the employer contributes more than the minimum or the plan has assets exceeding the liabilities, the excess can be used to offset minimum funding requirements.
The plan assets for both plans are invested in a diversified portfolio of financial assets. Each pension plan’s fiduciaries are responsible for the investment decisions with respect to the plan assets. A liability-driven investment approach is applied for one of the US plans to support the volatility management in the net asset / liability position. Derivative instruments may also be employed to manage volatility, including, but not limited to, interest rate futures, equity futures and swaps, including credit default swaps and interest rate swaps.
In 2015, the US pension plan rules were amended such that former UBS AG employees with vested benefits in the US defined benefit pension plans have the option to receive a lump sum payment (or early annuity payments) instead of a lifetime pension commencing at retirement age. This resulted in a reduction in the defined benefit obligation of CHF 24 million and a corresponding gain recognized in the income statement in 2015, of which CHF 21 million was recorded in Wealth Management Americas.
In 2013, UBS AG offered a one-time option to former UBS AG employees with vested benefits in the US defined benefit pension plans to receive a lump sum payment (or early annuity payments) instead of a lifetime pension. This resulted in a reduction in the defined benefit obligation of CHF 196 million, a reduction of fair value of plan assets of CHF 216 million and a charge to the income statement of CHF 20 million in 2013.
The employer contributions expected to be made to the US defined benefit plans in 2016 are estimated to be CHF 43 million.
Consolidated financial statements
Notes to the UBS AG consolidated financial statements
Note 28 Pension and other post-employment benefit plans (continued)
Germany
There are two different defined benefit pension plans in Germany and both are contribution-based plans. No plan assets are set aside to fund these plans and benefits are directly paid by UBS AG. Normal retirement age for the participants in the German plans is 65. Within the larger of the two pension plans, each participant accrues a percentage of salary in a pension account. On an annual basis the accumulated account balance of the plan participant is credited with guaranteed interest at a rate of 5%. The other plan is a deferred compensation plan in which amounts are accrued annually based on employee elections. For this deferred compensation plan, the accumulated account balance is credited on an annual basis with a guaranteed interest rate of 4% for amounts accrued after 2009. Both German plans are regulated under German pension law, under which the responsibility to pay pension benefits when they are due rests entirely with UBS AG. For the German plans, a portion of the pension payments is directly increased in line with price inflation.
The employer contributions expected to be made to the German plans in 2016 are estimated to be CHF 8 million.
The table on the following pages provides an analysis of the movement in the net asset / liability recognized on the balance sheet for defined benefit pension plans from the beginning to the end of the year, as well as an analysis of amounts recognized in net profit and in other comprehensive income.
In 2015, disclosures within this Note have been expanded to separately present UK plan information, which was previously included within “Non-Swiss” plans. Consequently, the US and German plans are now shown together within “Other”. Comparative information was adjusted accordingly.
Note 28 Pension and other post-employment benefit plans (continued)
Defined benefit pension plans | | | | | | | | | | |
CHF million | | Swiss | | UK | | Other | | Total |
For the year ended | | 31.12.15 | 31.12.14 | | 31.12.15 | 31.12.14 | | 31.12.15 | 31.12.14 | | 31.12.15 | 31.12.14 |
Defined benefit obligation at the beginning of the year | | 23,956 | 20,738 | | 3,949 | 3,355 | | 1,693 | 1,315 | | 29,598 | 25,408 |
Current service cost | | 589 | 496 | | 0 | 0 | | 10 | 10 | | 599 | 506 |
Interest expense | | 270 | 465 | | 137 | 158 | | 57 | 59 | | 463 | 682 |
Plan participant contributions | | 205 | 202 | | 0 | 0 | | 0 | 0 | | 205 | 202 |
Remeasurements of defined benefit obligation | | (1,231) | 3,120 | | (441) | 349 | | (8) | 270 | | (1,681) | 3,739 |
of which: actuarial (gains) / losses arising from changes in demographic assumptions | | (1,038) | 66 | | (122) | (15) | | 34 | 85 | | (1,125) | 136 |
of which: actuarial (gains) / losses arising from changes in financial assumptions | | (237) | 2,705 | | (201) | 489 | | (71) | 180 | | (509) | 3,374 |
of which: experience (gains) / losses¹ | | 44 | 349 | | (119) | (126) | | 28 | 6 | | (47) | 228 |
Past service cost related to plan amendments | | 0 | 0 | | 0 | 0 | | (24) | 0 | | (24) | 0 |
Curtailments | | (81) | (54) | | 0 | 0 | | 0 | 0 | | (81) | (54) |
Benefit payments | | (1,071) | (1,045) | | (128) | (91) | | (83) | (81) | | (1,283) | (1,218) |
Termination benefits | | 1 | 34 | | 0 | 0 | | 0 | 0 | | 1 | 34 |
Foreign currency translation | | 0 | 0 | | (166) | 178 | | (26) | 119 | | (192) | 297 |
Defined benefit obligation at the end of the year | | 22,636 | 23,956 | | 3,350 | 3,949 | | 1,619 | 1,693 | | 27,605 | 29,598 |
of which: amounts owing to active members | | 10,359 | 11,480 | | 255 | 312 | | 267 | 312 | | 10,881 | 12,104 |
of which: amounts owing to deferred members | | 0 | 0 | | 1,864 | 2,211 | | 523 | 545 | | 2,388 | 2,756 |
of which: amounts owing to retirees | | 12,278 | 12,477 | | 1,230 | 1,425 | | 829 | 836 | | 14,336 | 14,738 |
Fair value of plan assets at the beginning of the year | | 23,931 | 22,498 | | 3,381 | 2,922 | | 1,029 | 845 | | 28,341 | 26,266 |
Return on plan assets excluding amounts included in interest income | | 109 | 1,262 | | (124) | 181 | | (44) | 14 | | (59) | 1,457 |
Interest income | | 273 | 513 | | 118 | 141 | | 39 | 43 | | 430 | 697 |
Employer contributions – excluding termination benefits | | 482 | 478 | | 316 | 75 | | 57 | 107 | | 855 | 659 |
Employer contributions – termination benefits | | 1 | 34 | | 0 | 0 | | 0 | 0 | | 1 | 34 |
Plan participant contributions | | 205 | 202 | | 0 | 0 | | 0 | 0 | | 205 | 202 |
Benefit payments | | (1,071) | (1,045) | | (128) | (91) | | (83) | (81) | | (1,283) | (1,218) |
Administration expenses, taxes and premiums paid | | (10) | (10) | | 0 | 0 | | (8) | (6) | | (18) | (16) |
Payments related to plan amendments | | 0 | 0 | | 0 | 0 | | 0 | 0 | | 0 | 0 |
Foreign currency translation | | 0 | 0 | | (163) | 154 | | 7 | 107 | | (156) | 261 |
Fair value of plan assets at the end of the year | | 23,919 | 23,931 | | 3,400 | 3,381 | | 997 | 1,029 | | 28,316 | 28,341 |
Asset ceiling effect | | 1,283 | 0 | | 0 | 0 | | 0 | 0 | | 1,283 | 0 |
Net defined benefit asset / (liability) | | 0 | (25) | | 50 | (568) | | (622) | (664) | | (572) | (1,256) |
| | | | | | | | | | | | |
Movement in the net asset / (liability) recognized on the balance sheet |
Net asset / (liability) recognized on the balance sheet at the beginning of the year | | (25) | 952 | | (568) | (433) | | (664) | (470) | | (1,256) | 50 |
Net periodic pension cost | | (515) | (458) | | (18) | (17) | | (12) | (33) | | (546) | (508) |
Amounts recognized in other comprehensive income | | 58 | (1,032) | | 317 | (168) | | (35) | (256) | | 339 | (1,456) |
Employer contributions – excluding termination benefits | | 482 | 478 | | 316 | 75 | | 57 | 107 | | 855 | 659 |
Employer contributions – termination benefits | | 1 | 34 | | 0 | 0 | | 0 | 0 | | 1 | 34 |
Foreign currency translation | | 0 | 0 | | 3 | (24) | | 33 | (12) | | 36 | (36) |
Net asset / (liability) recognized on the balance sheet at the end of the year | | 0 | (25) | | 50 | (568) | | (622) | (664) | | (572) | (1,256) |
| | | | | | | | | | | | |
Funded and unfunded plans | | | | | | | | | | | | |
Defined benefit obligation from funded plans | | 22,636 | 23,956 | | 3,350 | 3,949 | | 1,288 | 1,301 | | 27,274 | 29,205 |
Defined benefit obligation from unfunded plans | | 0 | 0 | | 0 | 0 | | 331 | 392 | | 331 | 392 |
Plan assets | | 23,919 | 23,931 | | 3,400 | 3,381 | | 997 | 1,029 | | 28,316 | 28,341 |
Surplus / (deficit) | | 1,283 | (25) | | 50 | (568) | | (622) | (664) | | 711 | (1,256) |
Asset ceiling effect | | 1,283 | 0 | | 0 | 0 | | 0 | 0 | | 1,283 | 0 |
Net defined benefit asset / (liability) | | 0 | (25) | | 50 | (568) | | (622) | (664) | | (572) | (1,256) |
1 Experience (gains) / losses are a component of actuarial remeasurements of the defined benefit obligation which reflect the effects of differences between the previous actuarial assumptions and what has actually occurred. |
Consolidated financial statements
Notes to the UBS AG consolidated financial statements
Note 28 Pension and other post-employment benefit plans (continued)
Analysis of amounts recognized in net profit | | | | | | |
CHF million | | Swiss | | UK | | Other | | Total |
For the year ended | | 31.12.15 | 31.12.14 | | 31.12.15 | 31.12.14 | | 31.12.15 | 31.12.14 | | 31.12.15 | 31.12.14 |
Current service cost | | 589 | 496 | | 0 | 0 | | 10 | 10 | | 599 | 506 |
Interest expense related to defined benefit obligation | | 270 | 465 | | 137 | 158 | | 57 | 59 | | 463 | 682 |
Interest income related to plan assets | | (273) | (513) | | (118) | (141) | | (39) | (43) | | (430) | (697) |
Interest expense on asset ceiling effect | | 0 | 19 | | 0 | 0 | | 0 | 0 | | 0 | 19 |
Administration expenses, taxes and premiums paid | | 10 | 10 | | 0 | 0 | | 8 | 6 | | 18 | 16 |
Plan amendments | | 0 | 0 | �� | 0 | 0 | | (24) | 0 | | (24) | 0 |
Curtailments | | (81) | (54) | | 0 | 0 | | 0 | 0 | | (81) | (54) |
Termination benefits | | 1 | 34 | | 0 | 0 | | 0 | 0 | | 1 | 34 |
Net periodic pension cost | | 515 | 458 | | 18 | 17 | | 12 | 33 | | 546 | 508 |
| | | | | | | | | | | | |
Analysis of amounts recognized in other comprehensive income | | | | | | |
CHF million | | Swiss | | UK | | Other | | Total |
For the year ended | | 31.12.15 | 31.12.14 | | 31.12.15 | 31.12.14 | | 31.12.15 | 31.12.14 | | 31.12.15 | 31.12.14 |
Remeasurement of defined benefit obligation | | 1,231 | (3,120) | | 441 | (349) | | 8 | (270) | | 1,681 | (3,739) |
Return on plan assets excluding amounts included in interest income | | 109 | 1,262 | | (124) | 181 | | (44) | 14 | | (59) | 1,457 |
Asset ceiling effect excluding interest expense on asset ceiling effect | | (1,283) | 808 | | 0 | 0 | | 0 | 0 | | (1,283) | 808 |
Interest expense on asset ceiling effect | | 0 | 19 | | 0 | 0 | | 0 | 0 | | 0 | 19 |
Total gains / (losses) recognized in other comprehensive income, before tax | | 58 | (1,032) | | 317 | (168) | | (35) | (256) | | 339 | (1,456) |
The table below provides information on the duration of the defined benefit pension obligations and the distribution of the timing of benefit payments.
| | Swiss | | UK | | Other¹ |
| | 31.12.15 | 31.12.14 | | 31.12.15 | 31.12.14 | | 31.12.15 | 31.12.14 |
Duration of the defined benefit obligation (in years) | | 15.1 | 16.7 | | 19.7 | 20.2 | | 11.3 | 12.5 |
Maturity analysis of benefits expected to be paid | | | | | | | | | |
CHF million | | | | | | | | | |
Benefits expected to be paid within 12 months | | 1,146 | 1,033 | | 80 | 81 | | 92 | 85 |
Benefits expected to be paid between 1 to 3 years | | 2,218 | 2,023 | | 177 | 173 | | 185 | 171 |
Benefits expected to be paid between 3 to 6 years | | 3,403 | 3,035 | | 338 | 322 | | 291 | 274 |
Benefits expected to be paid between 6 to 11 years | | 5,526 | 5,394 | | 785 | 768 | | 509 | 485 |
Benefits expected to be paid between 11 to 16 years | | 5,173 | 5,571 | | 981 | 997 | | 510 | 513 |
Benefits expected to be paid in more than 16 years | | 18,892 | 26,613 | | 7,348 | 7,926 | | 1,172 | 1,363 |
1 The duration of the defined benefit obligation represents a weighted average across other plans. |
Note 28 Pension and other post-employment benefit plans (continued)
UBS AG regularly reviews the actuarial assumptions used in calculating its defined benefit obligations to determine their continuing relevance.
In 2015, UBS AG carried out a methodology review of the actuarial assumptions used in calculating its defined benefit obligation for its Swiss pension plan. As a result, UBS AG enhanced its methodology for estimating the discount rate by improving the construction of the yield curve where the market for long tenor maturities of Swiss high-quality corporate bonds was not sufficiently deep. Furthermore, UBS AG refined its approach to estimating the rate of salary increases, the rate of interest credit on retirement savings, the employee turnover rate, the rate of employee disabilities and the rate of marriage. These improvements in estimates resulted in a total net decrease in the defined benefit obligation (DBO) of the Swiss pension plan of CHF 2,055 million, of which CHF 1,038 million related to demographic assumptions and CHF 1,017 million related to financial assumptions. These reductions in the DBO from improvements in estimates were partly offset by market-driven discount rate changes, resulting in an overall downward remeasurement of the Swiss plan DBO of CHF 1,231 million, which was recognized in other comprehensive income.
Furthermore, UBS AG enhanced methodologies and refined approaches used to estimate various actuarial assumptions for its UK and other pension plans. These improvements in estimates resulted in a total net decrease in the DBO of the UK pension plan of CHF 192 million, of which CHF 122 million related to demographic assumptions and CHF 71 million related to financial assumptions. In addition, mainly market-driven discount rate changes reduced the DBO further, resulting in an overall downward remeasurement of the UK plan DBO of CHF 441 million, which was recognized in other comprehensive income.
The tables below show the principal actuarial assumptions used in calculating the defined benefit obligations.
| | Swiss | | UK | | Other¹ |
| | 31.12.15 | 31.12.14 | | 31.12.15 | 31.12.14 | | 31.12.15 | 31.12.14 |
Principal actuarial assumptions used (%) | | | | | | | | | |
Assumptions used to determine defined benefit obligations at the end of the year | | | | | | | | | |
Discount rate | | 1.09 | 1.15 | | 3.90 | 3.69 | | 4.01 | 3.60 |
Rate of salary increase | | 1.75 | 2.40 | | 0.00 | 0.00 | | 2.89 | 3.01 |
Rate of pension increase | | 0.00 | 0.00 | | 3.02 | 3.08 | | 1.50 | 1.75 |
Rate of interest credit on retirement savings | | 1.09 | 1.40 | | 0.00 | 0.00 | | 1.48 | 1.13 |
1 Represents weighted average assumptions across other plans. |
Mortality tables and life expectancies for major plans | | | |
| | | Life expectancy at age 65 for a male member currently |
| | | aged 65 | | aged 45 |
Country | Mortality table | | 31.12.15 | 31.12.14 | | 31.12.15 | 31.12.14 |
Switzerland | BVG 2010 G | | 21.5 | 21.4 | | 23.2 | 23.2 |
UK | S2PA CMI_2015, with projections¹ | | 23.9 | 24.4 | | 25.6 | 27.2 |
US | RP2014 WCHA, with MP2015 projection scale² | | 23.0 | 21.7 | | 24.5 | 23.4 |
Germany | Dr. K. Heubeck 2005 G | | 20.0 | 19.9 | | 22.6 | 22.5 |
| | | | | | | |
| | | Life expectancy at age 65 for a female member currently |
| | | aged 65 | | aged 45 |
Country | Mortality table | | 31.12.15 | 31.12.14 | | 31.12.15 | 31.12.14 |
Switzerland | BVG 2010 G | | 24.0 | 23.9 | | 25.7 | 25.6 |
UK | S2PA CMI_2015, with projections¹ | | 25.8 | 25.7 | | 28.0 | 28.0 |
US | RP2014 WCHA, with MP2015 projection scale² | | 24.6 | 23.9 | | 26.2 | 25.6 |
Germany | Dr. K. Heubeck 2005 G | | 24.1 | 23.9 | | 26.6 | 26.5 |
1 In 2014 the mortality table S1NA_L CMI 2014 G, with projections was used. 2 In 2014 the mortality table RP2014 G, with MP2014 projection scale was used. |
Consolidated financial statements
Notes to the UBS AG consolidated financial statements
Note 28 Pension and other post-employment benefit plans (continued)
Volatility arises in the defined benefit obligation for each of the pension plans due to the following actuarial assumptions applied in the measurement of the defined benefit obligation:
– Discount rate: the discount rate is based on the yield of high-quality corporate bonds of the market in the respective pension plan country. Consequently, a decrease in the yield of high-quality corporate bonds will increase the defined benefit obligation of the pension plans. Conversely, an increase in the yield of high-quality corporate bonds will decrease the defined benefit obligation of the pension plans.
– Rate of salary increase: an increase in the salary of plan participants will generally increase the defined benefit obligation, specifically for the Swiss and German plans. For the UK plan, as the plan is closed for future service, UBS AG employees no longer accrue future service benefits and thus salary increases have no impact on the defined benefit obligation. For the US plans, only a small percentage of the total population continues to accrue benefits for future service, therefore the impact of a salary increase on the defined benefit obligation is minimal.
– Rate of pension increase: for the Swiss plan, there is no automatic indexing of pensions. Any increase would be decided by the Pension Foundation Board. Similarly, for the US plans, there is no automatic indexing of pensions. For the UK plan, pensions are automatically indexed to price inflation as per plan rules and local pension legislation. Similarly, the German defined benefit pension plans are automatically indexed and a portion of the pensions are directly increased by price inflation. An increase in price inflation in the UK and Germany will increase the respective plan’s defined benefit obligation.
– Rate of interest credit on retirement savings: the Swiss plan and one of the plans in the US have retirement saving balances that are increased annually by an interest credit rate. For these plans, an increase in the interest credit rate would increase the respective plan’s defined benefit obligation.
– Life expectancy: for most of UBS AG’s defined benefit pension plans, the respective plan is obligated to provide guaranteed lifetime pension benefits. The defined benefit obligation for all plans is calculated using an underlying best estimate of the life expectancy of plan participants. An increase in the life expectancy of plan participants will increase the plan’s defined benefit obligation.
The table below presents a sensitivity analysis for each significant actuarial assumption showing how the defined benefit obligation would be affected by changes in the relevant actuarial assumption that were reasonably possible at the balance sheet date. Unforeseen circumstances may arise, which could result in variations that are outside the range of alternatives deemed reasonably possible. This sensitivity analysis applies to the defined benefit obligation only and not to the net asset / liability in its entirety. Caution should be used in extrapolating the sensitivities below to the overall impact on the defined benefit obligation, as the sensitivities may not be linear.
Sensitivity analysis of significant actuarial assumptions¹ |
| | Swiss plan: increase / (decrease) in defined benefit obligation | | UK plan: increase / (decrease) in defined benefit obligation | | Other plans: increase / (decrease) in defined benefit obligation |
CHF million | | 31.12.15 | 31.12.14 | | 31.12.15 | 31.12.14 | | 31.12.15 | 31.12.14 |
Discount rate | | | | | | | | | |
Increase by 50 basis points | | (1,416) | (1,688) | | (308) | (372) | | (84) | (98) |
Decrease by 50 basis points | | 1,609 | 1,936 | | 354 | 428 | | 92 | 108 |
Rate of salary increase | | | | | | | | | |
Increase by 50 basis points | | 82 | 210 | | –² | –² | | 1 | 2 |
Decrease by 50 basis points | | (86) | (198) | | –² | –² | | (1) | (2) |
Rate of pension increase | | | | | | | | | |
Increase by 50 basis points | | 1,163 | 1,315 | | 343 | 414 | | 6 | 8 |
Decrease by 50 basis points | | –³ | –³ | | (300) | (363) | | (5) | (7) |
Rate of interest credit on retirement savings | | | | | | | | | |
Increase by 50 basis points | | 263 | 334 | | –⁴ | –⁴ | | 8 | 9 |
Decrease by 50 basis points | | (249) | (315) | | –⁴ | –⁴ | | (8) | (8) |
Life expectancy | | | | | | | | | |
Increase in longevity by one additional year | | 719 | 755 | | 97 | 135 | | 42 | 45 |
1 The sensitivity analyses are based on a change in one assumption while holding all other assumptions constant, so that interdependencies between the assumptions are excluded. 2 As the plan is closed for future service, a change in assumption is not applicable. 3 As the assumed rate of pension increase was 0% as of 31 December 2015 and as of 31 December 2014, a downward change in assumption is not applicable. 4 As the plan does not provide interest credits on retirement savings, a change in assumption is not applicable. |
Note 28 Pension and other post-employment benefit plans (continued)
The table below provides information on the composition and fair value of plan assets of the Swiss pension plan, the UK pension plan and the other pension plans.
Composition and fair value of plan assets |
| | | | | | | | | | | | | | |
Swiss plan | | | | | | | | | | | | | | |
| | 31.12.15 | | 31.12.14 |
| | Fair value | | Plan asset allocation % | | Fair value | | Plan asset allocation % |
CHF million | | Quoted in an active market | Other | | Total | | | | Quoted in an active market | Other | | Total | | |
Cash and cash equivalents | | 517 | 0 | | 517 | | 2 | | 829 | 0 | | 829 | | 3 |
Real estate / property | | | | | | | | | | | | | | |
Domestic | | 0 | 2,647 | | 2,647 | | 11 | | 0 | 2,582 | | 2,582 | | 11 |
Investment funds | | | | | | | | | | | | | | |
Equity | | | | | | | | | | | | | | |
Domestic | | 699 | 0 | | 699 | | 3 | | 798 | 0 | | 798 | | 3 |
Foreign | | 6,948 | 1,085 | | 8,033 | | 34 | | 6,245 | 994 | | 7,239 | | 30 |
Bonds¹ | | | | | | | | | | | | | | |
Domestic, AAA to BBB– | | 2,112 | 0 | | 2,112 | | 9 | | 2,591 | 0 | | 2,591 | | 11 |
Foreign, AAA to BBB– | | 6,109 | 0 | | 6,109 | | 26 | | 6,418 | 0 | | 6,418 | | 27 |
Foreign, below BBB– | | 1,056 | 0 | | 1,056 | | 4 | | 104 | 0 | | 104 | | 0 |
Real estate | | | | | | | | | | | | | | |
Foreign | | 0 | 63 | | 63 | | 0 | | 0 | 104 | | 104 | | 0 |
Other | | 1,064 | 1,605 | | 2,669 | | 11 | | 2,513 | 736 | | 3,249 | | 14 |
Other investments | | 0 | 15 | | 15 | | 0 | | 0 | 17 | | 17 | | 0 |
Total | | 18,505 | 5,414 | | 23,919 | | 100 | | 19,499 | 4,432 | | 23,931 | | 100 |
| | | | | | | | | | | | | | |
| | | | | 31.12.15 | | | | | | | 31.12.14 | | |
Total fair value of plan assets | | 23,919 | | | | | | | 23,931 | | |
of which: | | | | | | | | | | | |
Bank accounts at UBS AG and UBS AG debt instruments | | 522 | | | | | | | 385 | | |
UBS Group AG shares | | 38 | | | | | | | 38 | | |
Securities lent to UBS AG² | | 962 | | | | | | | 921 | | |
Property occupied by UBS AG | | 82 | | | | | | | 87 | | |
Derivative financial instruments, counterparty UBS AG² | | (170) | | | | | | | (357) | | |
Structured products, counterparty UBS AG | | 0 | | | | | | | 42 | | |
1 The bond credit ratings are primarily based on Standard and Poor’s credit ratings. Ratings AAA to BBB– and below BBB– represent investment grade and non-investment grade ratings, respectively. In cases where credit ratings from other rating agencies were used, these were converted to the equivalent rating in the Standard & Poor's rating classification. 2 Securities lent to UBS AG and derivative financial instruments are presented gross of any collateral. Net of collateral, derivative financial instruments amounted to CHF (90) million as of 31 December 2015 (31 December 2014: CHF (123) million). Securities lent to UBS AG were fully covered by collateral as of 31 December 2015 and 31 December 2014. |
Consolidated financial statements
Notes to the UBS AG consolidated financial statements
Note 28 Pension and other post-employment benefit plans (continued)
Composition and fair value of plan assets (continued) |
| | | | | | | | | | | | | | |
UK plan | | | | | | | | | | | | | | |
| | 31.12.15 | | 31.12.14 |
| | Fair value | | Plan asset allocation % | | Fair value | | Plan asset allocation % |
CHF million | | Quoted in an active market | Other | | Total | | | | Quoted in an active market | Other | | Total | | |
Cash and cash equivalents | | 426 | 0 | | 426 | | 13 | | 192 | 0 | | 192 | | 6 |
Investment funds | | | | | | | | | | | | | | |
Equity | | | | | | | | | | | | | | |
Domestic | | 98 | 0 | | 98 | | 3 | | 122 | 0 | | 122 | | 4 |
Foreign | | 1,080 | 0 | | 1,080 | | 32 | | 1,042 | 0 | | 1,042 | | 31 |
Bonds¹ | | | | | | | | | | | | | | |
Domestic, AAA to BBB– | | 1,305 | 0 | | 1,305 | | 38 | | 1,344 | 0 | | 1,344 | | 40 |
Domestic, below BBB– | | 53 | 0 | | 53 | | 2 | | 179 | 0 | | 179 | | 5 |
Foreign, AAA to BBB– | | 189 | 0 | | 189 | | 6 | | 91 | 0 | | 91 | | 3 |
Foreign, below BBB– | | 31 | 0 | | 31 | | 1 | | 153 | 0 | | 153 | | 5 |
Real estate | | | | | | | | | | | | | | |
Domestic | | 46 | 68 | | 115 | | 3 | | 43 | 99 | | 142 | | 4 |
Other | | (32) | 123 | | 91 | | 3 | | (33) | 139 | | 106 | | 3 |
Other investments | | 6 | 7 | | 13 | | 0 | | 0 | 10 | | 10 | | 0 |
Total fair value of plan assets | | 3,202 | 198 | | 3,400 | | 100 | | 3,133 | 248 | | 3,381 | | 100 |
1 The bond credit ratings are primarily based on Standard and Poor’s credit ratings. Ratings AAA to BBB– and below BBB– represent investment grade and non-investment grade ratings, respectively. In cases where credit ratings from other rating agencies were used, these were converted to the equivalent rating in the Standard & Poor's rating classification. |
Note 28 Pension and other post-employment benefit plans (continued)
Composition and fair value of plan assets (continued) |
| | | | | | | | | | | | | | |
Other plans | | | | | | | | | | | | | | |
| | 31.12.15 | | 31.12.14 |
| | Fair value | | Weighted average plan asset allocation % | | Fair value | | Weighted average plan asset allocation % |
CHF million | | Quoted in an active market | Other | | Total | | | | Quoted in an active market | Other | | Total | | |
Cash and cash equivalents | | 52 | 0 | | 52 | | 5 | | 32 | 0 | | 32 | | 3 |
Bonds¹ | | | | | | | | | | | | | | |
Domestic, AAA to BBB– | | 56 | 0 | | 56 | | 6 | | 104 | 0 | | 104 | | 10 |
Domestic, below BBB– | | 60 | 0 | | 60 | | 6 | | 10 | 0 | | 10 | | 1 |
Foreign, AAA to BBB– | | 17 | 0 | | 17 | | 2 | | 24 | 0 | | 24 | | 2 |
Foreign, below BBB– | | 6 | 0 | | 6 | | 1 | | 3 | 0 | | 3 | | 0 |
Private equity | | 0 | 0 | | 0 | | 0 | | 0 | 0 | | 0 | | 0 |
Investment funds | | | | | | | | | | | | | | |
Equity | | | | | | | | | | | | | | |
Domestic | | 240 | 0 | | 240 | | 24 | | 250 | 0 | | 250 | | 24 |
Foreign | | 240 | 0 | | 240 | | 24 | | 258 | 0 | | 258 | | 25 |
Bonds¹ | | | | | | | | | | | | | | |
Domestic, AAA to BBB– | | 134 | 0 | | 134 | | 13 | | 142 | 0 | | 142 | | 14 |
Domestic, below BBB– | | 13 | 0 | | 13 | | 1 | | 13 | 0 | | 13 | | 1 |
Foreign, AAA to BBB– | | 31 | 0 | | 31 | | 3 | | 32 | 0 | | 32 | | 3 |
Foreign, below BBB– | | 3 | 0 | | 3 | | 0 | | 4 | 0 | | 4 | | 0 |
Real estate | | | | | | | | | | | | | | |
Domestic | | 0 | 12 | | 12 | | 1 | | 0 | 13 | | 13 | | 1 |
Other | | 56 | 42 | | 98 | | 10 | | 66 | 39 | | 105 | | 10 |
Insurance contracts | | 0 | 17 | | 17 | | 2 | | 0 | 17 | | 17 | | 2 |
Asset-backed securities | | 14 | 0 | | 14 | | 1 | | 17 | 0 | | 17 | | 2 |
Other investments | | 5 | 0 | | 5 | | 0 | | 5 | 0 | | 5 | | 0 |
Total fair value of plan assets | | 926 | 70 | | 997 | | 100 | | 961 | 68 | | 1,029 | | 100 |
1 The bond credit ratings are primarily based on Standard and Poor’s credit ratings. Ratings AAA to BBB– and below BBB– represent investment grade and non-investment grade ratings, respectively. In cases where credit ratings from other rating agencies were used, these were converted to the equivalent rating in the Standard & Poor's rating classification. |
Consolidated financial statements
Notes to the UBS AG consolidated financial statements
Note 28 Pension and other post-employment benefit plans (continued)
b) Post-retirement medical and life insurance plans
In the US and in the UK, UBS AG offers post-retirement medical benefits that contribute to the health care coverage of certain employees and their beneficiaries after retirement.
The UK post-retirement medical plan is closed to new entrants. In the US, in addition to post-retirement medical benefits, UBS AG also provides post-retirement life insurance benefits to certain employees. The post-retirement medical benefits in the UK and the US cover all types of medical expenses including, but not limited to, the cost of doctor visits, hospitalization, surgery and pharmaceuticals. These plans are not pre-funded plans and costs are recognized as incurred. In the US, the retirees also contribute to the cost of the post-retirement medical benefits.
In 2014, UBS AG announced changes to the US post-retirement medical plans in relation to a reduction or elimination of the subsidy provided for medical benefits. This change reduced the post-retirement benefit obligation by CHF 33 million, resulting in a corresponding gain recognized in the income statement in 2014.
Further in 2014, UBS AG announced changes to the US post-retirement life insurance plans in relation to an elimination of the US post-retirement life insurance policy. This change reduced the post-retirement benefit obligation by CHF 8 million, resulting in a corresponding gain recognized in the income statement in 2014.
The employer contributions expected to be made to the post-retirement medical and life insurance plans in 2016 are estimated to be CHF 6 million.
The table on the following page provides an analysis of the net asset / liability recognized on the balance sheet for post-retirement medical and life insurance plans from the beginning to the end of the year, as well as an analysis of amounts recognized in net profit and in other comprehensive income.
In 2015, disclosures within this Note have been expanded to separately present UK post-retirement medical plan information, which was previously presented together with the US post-retirement medical plans. Comparative information was adjusted accordingly.
Note 28 Pension and other post-employment benefit plans (continued)
Post-retirement medical and life insurance plans | | | | | | | | | |
CHF million | | UK | | US | | Total |
For the year ended | | 31.12.15 | 31.12.14 | | 31.12.15 | 31.12.14 | | 31.12.15 | 31.12.14 |
Post-retirement benefit obligation at the beginning of the year | | 32 | 28 | | 53 | 87 | | 85 | 114 |
Current service cost | | 0 | 0 | | 0 | 0 | | 0 | 0 |
Interest expense | | 1 | 1 | | 2 | 3 | | 3 | 5 |
Plan participant contributions | | 0 | 0 | | 2 | 2 | | 2 | 2 |
Remeasurements of post-retirement benefit obligation | | (6) | 3 | | 9 | 2 | | 3 | 5 |
of which: actuarial (gains) / losses arising from changes in demographic assumptions | | 2 | 0 | | 2 | 4 | | 4 | 4 |
of which: actuarial (gains) / losses arising from changes in financial assumptions | | (1) | 4 | | (2) | 5 | | (3) | 8 |
of which: experience (gains) / losses¹ | | (7) | 0 | | 9 | (7) | | 2 | (7) |
Past service cost related to plan amendments | | 0 | 0 | | 0 | (41) | | 0 | (41) |
Benefit payments² | | (1) | (2) | | (8) | (9) | | (10) | (10) |
Foreign currency translation | | (2) | 1 | | 1 | 8 | | (1) | 10 |
Post-retirement benefit obligation at the end of the year | | 25 | 32 | | 59 | 53 | | 84 | 85 |
of which: amounts owing to active members | | 5 | 12 | | 0 | 0 | | 5 | 12 |
of which: amounts owing to deferred members | | 0 | 0 | | 0 | 0 | | 0 | 0 |
of which: amounts owing to retirees | | 20 | 21 | | 59 | 53 | | 79 | 74 |
Fair value of plan assets at the end of the year | | 0 | 0 | | 0 | 0 | | 0 | 0 |
Net post-retirement benefit asset / (liability) | | (25) | (32) | | (59) | (53) | | (84) | (85) |
| | | | | | | | | |
Analysis of amounts recognized in net profit | | | | | | | | | |
Current service cost | | 0 | 0 | | 0 | 0 | | 0 | 0 |
Interest expense related to post-retirement benefit obligation | | 1 | 1 | | 2 | 3 | | 3 | 5 |
Past service cost related to plan amendments | | 0 | 0 | | 0 | (41) | | 0 | (41) |
Net periodic cost | | 1 | 2 | | 2 | (37) | | 4 | (36) |
| | | | | | | | | |
Analysis of gains / (losses) recognized in other comprehensive income | | | | | | | | | |
Remeasurement of post-retirement benefit obligation | | 6 | (3) | | (9) | (2) | | (3) | (5) |
Total gains / (losses) recognized in other comprehensive income, before tax | | 6 | (3) | | (9) | (2) | | (3) | (5) |
1 Experience (gains) / losses are a component of actuarial remeasurements of the post-retirement benefit obligation which reflect the effects of differences between the previous actuarial assumptions and what has actually occurred. 2 Benefit payments are funded by employer contributions and plan participant contributions. |
Consolidated financial statements
Notes to the UBS AG consolidated financial statements
Note 28 Pension and other post-employment benefit plans (continued)
The post-retirement benefit obligation is determined by using the assumed average health care cost trend rate, the discount rate and the life expectancy. On a country-by-country basis, the same discount rate is used for the calculation of the post-retirement benefit obligation from medical and life insurance plans as for the defined benefit obligations arising from pension plans.
UBS AG regularly reviews the actuarial assumptions used in calculating its post-retirement benefit obligations to determine their continuing relevance. In 2015, UBS AG enhanced methodologies and refined approaches used to estimate various actuarial assumptions. These improvements in estimates resulted in a net increase in the post-retirement benefit obligation.
The discount rate and the assumed average health care cost trend rates are presented in the table below. The basis for life expectancy assumptions is the same as provided for defined benefit pension plans in Note 28a.
Principal weighted average actuarial assumptions used (%)¹ | | | | | | | | |
Assumptions used to determine post-retirement benefit obligations at the end of the year | | UK | | US |
For the year ended | | 31.12.15 | | 31.12.14 | | 31.12.15 | | 31.12.14 |
Discount rate | | 3.90 | | 3.69 | | 4.23 | | 3.93 |
Average health care cost trend rate – initial | | 5.10 | | 5.50 | | 6.75 | | 7.00 |
Average health care cost trend rate – ultimate | | 5.10 | | 5.50 | | 5.00 | | 5.00 |
1 The assumptions for life expectancies are provided within Note 28a. |
Volatility arises in the post-retirement benefit obligation for each of the post-retirement medical and life insurance plans due to the following actuarial assumptions applied in the measurement of the post-retirement benefit obligation:
– Discount rate: similar as for defined benefit pension plans, a decrease in the yield of high-quality corporate bonds will increase the post-retirement benefit obligation for these plans. Conversely, an increase in the yield of high-quality corporate bonds will decrease the post-retirement benefit obligation for these plans.
– Average health care cost trend rate: an increase in health care costs would generally increase the post-retirement benefit obligation.
– Life expectancy: as some plan participants have lifetime benefits under these plans, an increase in life expectancy would increase the post-retirement benefit obligation.
The table below presents a sensitivity analysis for each significant actuarial assumption showing how the post-retirement benefit obligation would have been affected by changes in the relevant actuarial assumption that were reasonably possible at the balance sheet date.
Sensitivity analysis of significant actuarial assumptions¹ |
| | Increase / (decrease) in post-retirement benefit obligation |
| | UK | | US |
CHF million | | 31.12.15 | 31.12.14 | | 31.12.15 | 31.12.14 |
Discount rate | | | | | | |
Increase by 50 basis points | | (1) | (2) | | (3) | (2) |
Decrease by 50 basis points | | 2 | 2 | | 3 | 2 |
Average health care cost trend rate | | | | | | |
Increase by 100 basis points | | 3 | 4 | | 1 | (1) |
Decrease by 100 basis points | | (3) | (4) | | (1) | 1 |
Life expectancy | | | | | | |
Increase in longevity by one additional year | | 2 | 2 | | 5 | 5 |
1 The sensitivity analyses are based on a change in one assumption while holding all other assumptions constant, so that interdependencies between the assumptions are excluded. |
c) Defined contribution plans
UBS AG sponsors a number of defined contribution plans in locations outside of Switzerland. The locations with significant defined contribution plans are the UK and the US. Certain plans permit employees to make contributions and earn matching or other contributions from UBS AG. The employer contributions to these plans are recognized as an expense which, for the years ended 31 December 2015, 2014 and 2013, amounted to CHF 239 million, CHF 244 million and CHF 236 million, respectively.
Note 28 Pension and other post-employment benefit plans (continued)
d) Related party disclosure
UBS AG is the principal provider of banking services for the pension fund of UBS AG in Switzerland. In this function, UBS AG is engaged to execute most of the pension fund’s banking activities. These activities can include, but are not limited to, trading and securities lending and borrowing. The non-Swiss UBS AG pension funds do not have a similar banking relationship with UBS AG.
In 2008, UBS AG sold certain bank-occupied properties to the Swiss pension fund. Simultaneously, UBS AG and the Swiss pension fund entered into lease-back arrangements for some of the properties with 25-year lease terms and two renewal options for 10 years each. During 2009, UBS AG renegotiated one of the lease contracts, which reduced UBS AG’s remaining lease commitment. In 2013, after the first five years, the early break options for most of the leases were not exercised, which resulted in an increase in the minimum commitment for an additional five years. As of 31 December 2015, the minimum commitment toward the Swiss pension fund under the related leases is approximately CHF 11 million (31 December 2014: CHF 14 million).
The following amounts have been received or paid by UBS AG from and to the pension funds in respect of these banking activities and arrangements.
Related party disclosure |
| | For the year ended |
CHF million | | 31.12.15 | 31.12.14 | 31.12.13 |
Received by UBS AG | | | | |
Fees | | 33 | 33 | 33 |
Paid by UBS AG | | | | |
Rent | | 5 | 6 | 8 |
Interest | | (1) | 0 | 1 |
Dividends and capital repayments | | 14 | 4 | 2 |
The transaction volumes in UBS shares and UBS AG debt instruments are as follows.
Transaction volumes – UBS shares and UBS AG debt instruments |
| | For the year ended |
| | 31.12.15 | 31.12.14 |
Financial instruments bought by pension funds | | | |
UBS shares¹ (in thousands of shares) | | 1,544 | 2,092 |
UBS AG debt instruments (par values in CHF million) | | 3 | 4 |
Financial instruments sold by pension funds or matured | | | |
UBS shares¹ (in thousands of shares) | | 2,255 | 1,735 |
UBS AG debt instruments (par values in CHF million) | | 4 | 4 |
1 Represents purchases / sales of UBS AG shares up to 28 November 2014 and purchases / sales of UBS Group AG shares thereafter. Refer to Note 32 for more information. |
UBS AG defined contribution pension funds held 15,782,722 UBS Group AG shares with a fair value of CHF 306 million as of 31 December 2015 (31 December 2014: 16,253,804 UBS Group AG shares with a fair value of CHF 276 million).
More information on the fair value of the plan assets of the defined benefit pension plans are disclosed in Note 28a.
Consolidated financial statements
Notes to the UBS AG consolidated financial statements
Note 29 Equity participation and other compensation plans
The UBS Group operates several equity participation and other compensation plans to align the interests of executives, managers and staff with the interests of shareholders. Some plans (e.g., Equity Plus and Equity Ownership Plan) are granted to eligible employees in approximately 50 countries and are designed to meet the legal, tax and regulatory requirements of each country in which they are offered. Certain plans are used in specific countries, business areas (e.g., awards granted within Wealth Management Americas), or are only offered to members of the Group Executive Board (GEB). The UBS Group operates compensation plans on a mandatory, discretionary and voluntary basis. The explanations below provide a general description of the terms of the most significant plans offered by the Group which relate to the performance year 2015 (awards granted in 2016) and those from prior years that were partly expensed in 2015.
® Refer to Note 1a item 25 for a description of the accounting policy related to equity participation and other compensation plans
Transfer of deferred compensation plans
As part of the Group reorganization in 2014, UBS Group AG assumed obligations of UBS AG as grantor in connection with certain outstanding awards under employee share, option, notional fund and deferred cash compensation plans. As a result of the transfer, UBS Group AG assumed all responsibilities and rights associated with the grantor role for the plans from UBS AG, including the right of recharge to its subsidiaries employing the personnel. Obligations relating to deferred compensation plans which are required to be, and have been, granted by employing and / or sponsoring subsidiaries have not been assumed by UBS Group AG and will continue on this basis. Furthermore, obligations related to other compensation awards, such as defined benefit pension plans and other local awards, have not been assumed by UBS Group AG and are retained by the relevant employing and / or sponsoring subsidiaries. For the purpose of this Note, references to shares, performance shares, notional shares and options refer to UBS Group AG instruments for the period after the transfer and to UBS AG instruments for the period before the transfer.
The tables within this Note outline the effects from equity participation and other compensation plans on the UBS AG income statement, as well as the movements in UBS share and notional share awards retained by UBS AG.
Mandatory share-based compensation plans
Equity Ownership Plan (EOP): Select employees receive a portion of their annual performance-related compensation above a certain threshold in the form of an EOP award in UBS shares, notional shares or UBS performance shares (notional shares that are subject to performance conditions). From February 2014 onwards, only notional shares and UBS performance shares have been granted. Since 2011, performance shares have been granted to EOP participants who are Key Risk-Takers, Group Managing Directors (GMD) or employees whose incentive awards exceed a certain threshold, and since 2013 to GEB members. For performance shares granted in respect of the performance years 2012 and thereafter, the performance conditions are based on the Group return on tangible equity and the divisional return on attributed equity (for Corporate Center participants, the return on attributed equity of the Group excluding Corporate Center). Awards issued outside the normal performance year cycle, such as replacement awards or sign-on awards, may be offered in deferred cash under the EOP plan rules.
Awards in UBS shares allow for voting and dividend rights during the vesting period, whereas notional and performance shares represent a promise to receive UBS shares at vesting and do not carry voting rights during the vesting period. Notional and performance shares granted before February 2014 have no rights to dividends, whereas for awards granted since February 2014 employees are entitled to receive a dividend equivalent that may be paid in notional shares and / or cash, and which will vest on the same terms and conditions as the award. Awards granted in the form of UBS shares, notional shares and performance shares are settled by delivering UBS shares at vesting, except in countries where this is not permitted for legal or tax reasons. EOP awards granted until 2012 generally vested in three equal increments over a three-year vesting period and awards granted since March 2013 generally vest in equal increments in years two and three following grant. The awards are generally forfeitable upon, among other circumstances, voluntary termination of employment with UBS AG. Compensation expense is recognized in the performance year if the employee meets the retirement eligibility requirements at the date of grant. Otherwise, compensation expense is recognized from the grant date to the earlier of the vesting date or the retirement eligibility date of the employee, on a tiered basis.
Senior Executive Equity Ownership Plan (SEEOP): Up to 2012 (performance year 2011), GEB members and selected senior executives received a portion of their mandatory deferral in UBS shares or notional shares, which vest in one-fifth increments over a five-year vesting period and are forfeitable if certain conditions are not met. Awards granted in 2011 and 2012 are subject to the same performance conditions as performance shares granted under the EOP. They will only vest in full if the participant’s business division is profitable (for Corporate Center participants, the Group as a whole must be profitable) in the financial year preceding scheduled vesting. Awards granted under SEEOP are settled by delivering UBS shares at vesting. Compensation expense is recognized on the same basis as for share-settled EOP awards. No new SEEOP awards were granted since 2012. From 2013 (performance year 2012), GEB members have received EOP performance awards.
Note 29 Equity participation and other compensation plans (continued)
Incentive Performance Plan (IPP): In 2010, GEB members and certain other senior employees received part of their annual incentive in the form of performance shares granted under the IPP. Each performance share granted was a contingent right to receive between one and three UBS shares at vesting, depending on the achievement of share price targets. Vesting was subject to continued employment with UBS AG and certain other conditions. The IPP awards vested in March 2015. Compensation expense was recognized on a tiered basis from the grant date to the earlier of the vesting date or the retirement eligibility date of the employee. IPP was a one-time plan granted in 2010 only.
Performance Equity Plan (PEP): In 2012 GEB members received part of their annual incentive in the form of performance shares granted under the PEP. Each performance share was a contingent right to receive between zero and two UBS shares at vesting, depending on the achievement of Economic Profit (EP) and Total Shareholder Return (TSR) targets. Vesting was subject to continued employment with UBS AG and certain other conditions. The last PEP awards vested in March 2015. Compensation expense was recognized on a tiered basis from the grant date to the earlier of the vesting date or the retirement eligibility date of the employee. No PEP awards were granted after 2012.
Special Plan Award Program for the Investment Bank 2012 (SPAP): In April 2012, certain Managing Directors and Group Managing Directors of the Investment Bank were granted an award of UBS shares which vested in 2015. Vesting was subject to performance conditions, continued employment with the firm and certain other conditions. Compensation expense was recognized from the grant date to the earlier of the vesting date or the retirement eligibility date of the employee.
Role-based allowances (RBA): In line with market practice, in certain countries, employees are entitled to receive a role-based allowance in addition to their base salary. This allowance reflects the market value of a specific role and is only paid as long as the employee is within such a role. The allowance is generally paid in cash and above a threshold it is granted in blocked shares. Such shares will be unblocked in equal instalments after two and three years. The compensation expense is recognized in the year of grant.
Mandatory deferred cash compensation plans
Deferred Contingent Capital Plan (DCCP): The DCCP is a mandatory performance award deferral plan for all employees whose total compensation exceeds a certain threshold. For awards granted up to January 2015, employees received part of their annual incentive in the form of notional bonds, which are a right to receive a cash payment at vesting. For awards granted for the performance years 2014 and 2015, employees have been awarded notional additional tier 1 (AT1) instruments, which at the discretion of UBS Group AG (consolidated) can either be settled in the form of a cash payment or a perpetual, marketable AT1 instrument. Awards vest in full after five years, subject to there being no trigger event. Awards granted under the DCCP forfeit if UBS Group AG’s consolidated phase-in common equity tier 1 capital ratio falls below 10% for GEB members and 7% for all other employees. In addition, awards are also forfeited if a viability event occurs, that is, if FINMA provides a written notice to UBS Group AG that the DCCP awards must be written down to prevent an insolvency, bankruptcy or failure of UBS Group AG (consolidated), or if UBS Group AG (consolidated) receives a commitment of extraordinary support from the public sector that is necessary to prevent such an event. For GEB members, an additional performance condition applies. If UBS Group AG (consolidated) does not achieve an adjusted profit before tax for any year during the vesting period, GEB members forfeit 20% of their award for each loss-making year. For awards granted up to January 2015, interest on the awards is paid annually for performance years in which the firm generates an adjusted profit before tax. For awards granted since February 2015 interest payments are discretionary. The awards are subject to standard forfeiture and harmful acts provisions, including voluntary termination of employment with UBS AG. Compensation expense is recognized in the performance year if the employee meets the retirement eligibility requirements at the date of grant. Otherwise, compensation expense is recognized ratably from the grant date to the earlier of the vesting date or the retirement eligibility date of the employee.
Long-Term Deferred Retention Senior Incentive Scheme (LTDRSIS): Awards granted under the LTDRSIS are granted to employees in Australia and represent a profit share amount based on the profitability of the Australian business. Awards vest after three years and include an arrangement which allows for unpaid installments to be reduced if the business has a loss during the calendar year preceding vesting. The awards are generally forfeitable upon voluntary termination of employment with UBS AG. Compensation expense is recognized in the performance year if the employee meets the retirement eligibility requirements at the date of the grant. Otherwise, compensation expense is recognized ratably from the grant date to the earlier of the vesting date or the retirement eligibility date of the employee. 2014 was the last year awards were granted under LTDRSIS.
Asset Management Equity Ownership Plan: In order to align their compensation with the performance of the funds they manage, Asset Management employees who receive EOP awards receive them in the form of cash-settled notional funds. The amount depends on the value of the relevant underlying Asset Management funds at the time of vesting. The awards are generally forfeitable upon, among other circumstances, voluntary termination of employment with UBS AG. Compensation expense is recognized in the performance year if the employee meets the retirement eligibility requirements at the date of grant. Otherwise, compensation expense is recognized from the grant date to the earlier of the vesting date or the retirement eligibility date of the employee, on a tiered basis.
Consolidated financial statements
Notes to the UBS AG consolidated financial statements
Note 29 Equity participation and other compensation plans (continued)
Wealth Management Americas financial advisor compensation
Financial advisor compensation plans generally provide for cash payments and deferred awards that are formula driven and fluctuate in proportion to the level of business activity.
UBS AG also may enter into compensation commitments with certain new financial advisors primarily as a recruitment incentive and to incentivize certain eligible active financial advisors to achieve specified revenue production and other performance thresholds. The compensation may be earned and paid to the employee during a period of continued employment and may be forfeited under certain circumstances.
GrowthPlus is a program for selected financial advisors whose revenue production and length of service exceeds defined thresholds from 2010 through 2017. Compensation arrangements were granted in 2010, 2011 and 2015, with potential arrangements to be granted in 2018. The awards vest ratably over seven years from grant with the exception of the 2018 arrangement, which vests over five years.
PartnerPlus is a mandatory deferred cash compensation plan for certain eligible financial advisors. Awards (UBS AG company contributions) are based on a predefined formula during the performance year. Participants are also allowed to voluntarily contribute additional amounts otherwise payable during the year, up to a certain percentage of their pay, which are vested upon contribution. Company contributions and voluntary contributions are credited with interest in accordance with the terms of the plan. Rather than being credited with interest, a participant may elect to have voluntary contributions, along with vested company contributions, credited with notional earnings based on the performance of various mutual funds. Company contributions and interest on both company and voluntary contributions ratably vest in 20% increments six to ten years following grant date. Company contributions and interest / notional earnings on both company and voluntary contributions are forfeitable under certain circumstances. Compensation expense for awards is recognized in the performance year if the employee meets the qualifying separation eligibility requirements at the date of grant. Otherwise, compensation expense for awards is recognized ratably commencing in the performance year to the earlier of the vesting date or the qualifying separation eligibility date of the employee. Compensation expense for voluntary contributions is recognized in the year of deferral.
Discretionary share-based compensation plans
Key Employee Stock Appreciation Rights Plan (KESAP) and Key Employee Stock Option Plan (KESOP): Until 2009, key and high potential employees were granted discretionary share-settled stock appreciation rights (SARs) or UBS options with a strike price not less than the fair market value of a UBS share on the date the SAR or option was granted. A SAR gives employees the right to receive a number of UBS shares equal to the value of any appreciation in the market price of a UBS share between the grant date and the exercise date. One option gives the right to acquire one registered UBS share at the option’s strike price. SARs and options are settled by delivering UBS shares, except in countries where this is not permitted for legal reasons. These awards are generally forfeitable upon termination of employment with UBS AG. Compensation expense is recognized from the grant date to the earlier of the vesting date or the retirement eligibility date of the employee. No options or SARs awards have been granted since 2009.
Voluntary share-based compensation plans
Equity Plus Plan (Equity Plus): Equity Plus is a voluntary plan that provides eligible employees with the opportunity to purchase UBS shares at market value and receive, at no additional cost, one free notional UBS share for every three shares purchased, up to a maximum annual limit. Share purchases may be made annually from the performance award and / or monthly through regular deductions from salary. If the shares purchased are held for three years, and in general if the employee remains in employment, the notional UBS shares vest. For notional UBS shares granted from April 2014 onwards, employees are entitled to receive a dividend equivalent which may be paid in either notional shares and / or cash. Prior to 2010, instead of notional shares participants received two UBS options for each share they purchased under this plan. The options had a strike price equal to the fair market value of a UBS share on the grant date, a two-year vesting period and generally expired ten years from the grant date. The options are forfeitable in certain circumstances and are settled by delivering UBS shares, except in countries where this is not permitted for legal reasons. Compensation expense for Equity Plus is recognized from the grant date to the earlier of the vesting date or the retirement eligibility date of the employee.
Note 29 Equity participation and other compensation plans (continued)
b) Effect on the income statement
Effect on the income statement for the financial year and future periods
The following table summarizes the compensation expenses recognized for the year ended 31 December 2015 and deferred compensation expenses that will be recognized as an expense in the income statements of 2016 and later. The deferred compensation expenses in the table also include vested and non-vested awards granted mainly in February 2016, which relate to the performance year 2015.
Personnel expenses – Recognized and deferred¹ | | | | |
| | Personnel expenses for the year ended 2015 | | Personnel expenses deferred to 2016 and later |
CHF million | | Expenses relating to awards for 2015 | Expenses relating to awards for prior years | Total | | Relating to awards for 2015 | Relating to awards for prior years | Total |
Performance awards | | | | | | | | |
Cash performance awards | | 2,073 | (94) | 1,980 | | 0 | 0 | 0 |
Deferred Contingent Capital Plan (DCCP) | | 172 | 258 | 429 | | 343 | 446 | 789 |
Deferred cash plans (DCP and other cash plans) | | 0 | 12 | 12 | | 0 | 3 | 3 |
Equity Ownership Plan (EOP / SEEOP) – UBS shares | | 261 | 461 | 722 | | 524 | 338 | 861 |
Incentive Performance Plan (IPP) | | 0 | 0 | 0 | | 0 | 0 | 0 |
Total UBS share plans | | 261 | 461 | 722 | | 524 | 338 | 861 |
Equity Ownership Plan (EOP) – notional funds | | 28 | 38 | 67 | | 34 | 35 | 69 |
Total performance awards | | 2,535 | 675 | 3,210 | | 900 | 822 | 1,722 |
Variable compensation | | | | | | | | |
Variable compensation – other | | 184 | 162 | 346² | | 248³ | 293⁴ | 541 |
Financial advisor compensation – cash payments | | 2,460 | 0 | 2,460 | | 0 | 0 | 0 |
Compensation commitments with recruited financial advisors | | 43 | 692 | 735 | | 940 | 1,899 | 2,839 |
GrowthPlus and other deferral plans | | 132 | 142 | 275 | | 710 | 456 | 1,166 |
UBS share plans | | 37 | 45 | 82 | | 66 | 115 | 182 |
Wealth Management Americas: Financial advisor compensation⁵ | | 2,673 | 879 | 3,552 | | 1,716 | 2,470 | 4,186 |
Total | | 5,391 | 1,716 | 7,108 | | 2,864 | 3,585 | 6,449 |
1 Total share-based personnel expenses recognized for the year ended 31 December 2015 were CHF 1,028 million and were comprised of UBS share plans of CHF 807 million, Equity Ownership Plan - notional funds of CHF 67 million, related social security costs of CHF 56 million and other compensation plans (reported within Variable compensation – other) of CHF 98 million. 2 Includes replacement payments of CHF 76 million (of which CHF 65 million related to prior years), forfeiture credits of CHF 86 million (all related to prior years), severance payments of CHF 157 million (all related to 2015) and retention plan and other payments of CHF 198 million (of which CHF 183 million related to prior years). 3 Includes DCCP interest expense of CHF 160 million for DCCP awards 2015 (granted in 2016). 4 Includes DCCP interest expense of CHF 200 million for DCCP awards 2014, 2013 and 2012 (granted in 2015, 2014 and 2013). 5 Financial advisor compensation consists of grid-based compensation based directly on compensable revenues generated by financial advisors and supplemental compensation calculated based on financial advisor productivity, firm tenure, assets and other variables. It also includes charges related to compensation commitments with financial advisors entered into at the time of recruitment which are subject to vesting requirements. Amounts reflected as deferred expenses represent the maximum deferred exposure as of the balance sheet date. |
Consolidated financial statements
Notes to the UBS AG consolidated financial statements
Note 29 Equity participation and other compensation plans (continued)
Personnel expenses – Recognized and deferred¹ | | | | | |
| | Personnel expenses for the year ended 2014 | | Personnel expenses deferred to 2015 and later |
CHF million | | Expenses relating to awards for 2014 | Expenses relating to awards for prior years | Total | | Relating to awards for 2014 | Relating to awards for prior years | Total |
Performance awards | | | | | | | | |
Cash performance awards | | 1,822 | (108) | 1,714 | | 0 | 0 | 0 |
Deferred Contingent Capital Plan (DCCP) | | 155 | 194 | 349 | | 312 | 386 | 698 |
Deferred cash plans (DCP and other cash plans) | | 0 | 12 | 12 | | 0 | 8 | 8 |
Equity Ownership Plan (EOP / SEEOP) – UBS shares | | 215 | 444 | 659 | | 459 | 367 | 826 |
Incentive Performance Plan (IPP) | | 0 | 21 | 21 | | 0 | 0 | 0 |
Total UBS share plans | | 215 | 465 | 680 | | 459 | 367 | 826 |
Equity Ownership Plan (EOP) – notional funds | | 24 | 41 | 65 | | 36 | 33 | 69 |
Total performance awards | | 2,216 | 604 | 2,820 | | 807 | 794 | 1,601 |
Variable compensation | | | | | | | | |
Variable compensation – other | | 260 | 206 | 466² | | 307³ | 340⁴ | 647 |
Financial advisor compensation – cash payments | | 2,396 | 0 | 2,396 | | 0 | 0 | 0 |
Compensation commitments with recruited financial advisors | | 39 | 636 | 675 | | 524 | 2,058 | 2,582 |
GrowthPlus and other deferral plans | | 81 | 153 | 234 | | 189 | 528 | 717 |
UBS share plans | | 23 | 57 | 80 | | 41 | 143 | 184 |
Wealth Management Americas: Financial advisor compensation⁵ | | 2,539 | 846 | 3,385 | | 754 | 2,729 | 3,483 |
Total | | 5,015 | 1,656 | 6,671 | | 1,868 | 3,863 | 5,731 |
1 Total share-based personnel expenses recognized for the year ended 31 December 2014 were CHF 999 million and were comprised of UBS share plans of CHF 800 million, Equity Ownership Plan - notional funds of CHF 65 million, related social security costs of CHF 41 million and other compensation plans (reported within Variable compensation – other) of CHF 93 million. 2 Includes replacement payments of CHF 81 million (of which CHF 70 million related to prior years), forfeiture credits of CHF 70 million (all related to prior years), severance payments of CHF 162 million (all related to 2014) and retention plan and other payments of CHF 292 million (of which CHF 206 million related to prior years). 3 Includes DCCP interest expense of CHF 121 million for DCCP awards 2014 (granted in 2015). 4 Includes DCCP interest expense of CHF 161 million for DCCP awards 2013 and 2012 (granted in 2014 and 2013). 5 Financial advisor compensation consists of grid-based compensation based directly on compensable revenues generated by financial advisors and supplemental compensation calculated based on financial advisor productivity, firm tenure, assets and other variables. It also includes charges related to compensation commitments with financial advisors entered into at the time of recruitment which are subject to vesting requirements. Amounts reflected as deferred expenses represent the maximum deferred exposure as of the balance sheet date. |
During 2015 and 2014, UBS AG accelerated the recognition of expenses for certain deferred compensation arrangements relating to employees that were affected by restructuring programs. Based on the redundancy provisions of the plan rules, these employees retain their deferred compensation awards. However, as the employees are not required to provide future service, compensation expense relating to these awards was accelerated to the termination date based on the shortened service period. The amounts accelerated and recognized relating to share-based payment awards in 2015 and 2014 were CHF 9 million and CHF 38 million respectively, and the amounts related to deferred cash awards were CHF 10 million and CHF 29 million, respectively.
UBS AG also shortened the service period for certain employees in accordance with the mutually agreed termination provisions of their deferred compensation awards. Expense recognition was accelerated to the termination date. The amounts accelerated and recognized relating to share-based payment awards in 2015 and 2014 were CHF 6 million and CHF 11 million, respectively, and the amounts related to deferred cash awards were CHF 11 million and CHF 8 million, respectively.
Note 29 Equity participation and other compensation plans (continued)
Personnel expenses – Recognized and deferred | | | | | |
| | Personnel expenses for the year ended 2013 | | Personnel expenses deferred to 2014 and later |
CHF million | | Expenses relating to awards for 2013 | Expenses relating to awards for prior years | Total | | Relating to awards for 2013 | Relating to awards for prior years | Total |
Performance awards | | | | | | | | |
Cash performance awards | | 1,942 | (30) | 1,912 | | 0 | 0 | 0 |
Deferred Contingent Capital Plan (DCCP) | | 152 | 96 | 248 | | 348 | 230 | 578 |
Deferred cash plans (DCP and other cash plans) | | 2 | 53 | 55 | | 7 | 12 | 19 |
Equity Ownership Plan (EOP / SEEOP) – UBS shares | | 190 | 466 | 656 | | 520 | 307 | 827 |
Performance Equity Plan (PEP) | | 0 | 3 | 3 | | 0 | 0 | 0 |
Incentive Performance Plan (IPP) | | 0 | 33 | 33 | | 0 | 21 | 21 |
Total UBS share plans | | 190 | 502 | 692 | | 520 | 328 | 848 |
Equity Ownership Plan (EOP) – notional funds | | 19 | 60 | 79 | | 37 | 36 | 73 |
Total performance awards | | 2,305 | 681 | 2,986 | | 912 | 606 | 1,518 |
Variable compensation | | | | | | | | |
Variable compensation – other | | 152 | 136 | 288² | | 340³ | 398⁴ | 738 |
Financial advisor compensation – cash payments | | 2,219 | 0 | 2,219 | | 0 | 0 | 0 |
Compensation commitments with recruited financial advisors | | 33 | 605 | 638 | | 440 | 2,098 | 2,538 |
GrowthPlus and other deferral plans | | 62 | 132 | 194 | | 107 | 564 | 671 |
UBS share plans | | 20 | 69 | 89 | | 45 | 165 | 210 |
Wealth Management Americas: Financial advisor compensation⁵ | | 2,334 | 806 | 3,140 | | 592 | 2,827 | 3,419 |
Total | | 4,791 | 1,623 | 6,414 | | 1,844 | 3,831 | 5,675 |
1 Total share-based personnel expenses recognized for the year ended 31 December 2013 were CHF 1.042 million and were comprised of UBS share plans of CHF 787 million, Equity Ownership Plan - notional funds of CHF 79 million, related social security costs of CHF 65 million and other compensation plans (reported within Variable compensation – other) of CHF 111 million. 2 Includes replacement payments of CHF 78 million (of which CHF 72 million related to prior years), forfeiture credits of CHF 146 million (all related to prior years), severance payments of CHF 114 million (all related to 2013) and retention plan and other payments of CHF 242 million (of which CHF 210 million related to prior years). 3 Includes DCCP interest expense of CHF 101 million for DCCP awards 2013 (granted in 2014). 4 Includes DCCP interest expense of CHF 109 million for DCCP awards 2012 (granted in 2013). 5 Financial advisor compensation consists of grid-based compensation based directly on compensable revenues generated by financial advisors and supplemental compensation calculated based on financial advisor productivity, firm tenure, assets and other variables. It also includes charges related to compensation commitments with financial advisors entered into at the time of recruitment which are subject to vesting requirements. Amounts reflected as deferred expenses represent the maximum deferred exposure as of the balance sheet date. |
Additional disclosures on mandatory, discretionary and voluntary share-based compensation plans (including notional funds granted under EOP)
The total share-based personnel expenses recognized for the years ended 31 December 2015, 2014 and 2013 were CHF 1,028 million, CHF 999 million and CHF 1,042 million, respectively. This includes the current period expense, amortization and related social security costs for awards issued in prior periods and performance year expensing for awards granted to retirement-eligible employees where the terms of the awards do not require the employee to provide future services.
The total compensation expenses for non-vested share-based awards granted up to 31 December 2015 relating to prior years to be recognized in future periods is CHF 553 million and will be recognized as personnel expenses over a weighted average period of 1.9 years. This includes UBS share plans, the Equity Ownership Plan (notional funds), other variable compensation and the Equity Plus Plan. Total deferred compensation amounts included in the 2015 table differ from this amount as the deferred compensation amounts also include non-vested awards granted in February 2016 related to the performance year 2015.
Actual payments to participants in cash-settled share-based plans, including amounts granted as notional funds issued under the EOP, for the years ended 31 December 2015 and 2014 were CHF 98 million and CHF 90 million, respectively. The total carrying amount of the liability related to these plans was CHF 170 million as of 31 December 2015 and CHF 143 million as of 31 December 2014.
Consolidated financial statements
Notes to the UBS AG consolidated financial statements
Note 29 Equity participation and other compensation plans (continued)
c) Movements during the year
UBS share and performance share awards
Movements in UBS share and notional share awards were as follows:
UBS share awards | | | | |
| Number of shares 2015 | Weighted average grant date fair value (CHF) | Number of shares 2014 | Weighted average grant date fair value (CHF) |
Outstanding, at the beginning of the year | 467,848 | 15 | 186,633,491 | 15 |
Shares awarded during the year | 259,334 | 17 | 56,851,628 | 18 |
Distributions during the year | (279,415) | 15 | (69,921,325) | 16 |
Forfeited during the year | (20,323) | 19 | (6,859,017) | 16 |
Transfer to UBS Group AG | | | (166,704,777) | 15 |
Outstanding, at the end of the year | 427,443 | 18 | 467,848 | 15 |
of which: shares vested for accounting purposes | 138,908 | | 26,946 | |
The fair value of shares that became legally vested and were distributed (i.e., all restrictions were fulfilled) during the years ended 2015 and 2014 was CHF 1,443 million and CHF 1,269 million, respectively.
d) Valuation
UBS share awards
UBS AG measures compensation expense based on the average market price of the UBS share on the grant date as quoted on the SIX Swiss Exchange, taking into consideration post-vesting sale and hedge restrictions, non-vesting conditions and market conditions, where applicable. The fair value of the share awards subject to post-vesting sale and hedge restrictions is discounted based upon the duration of the post-vesting restriction and is referenced to the cost of purchasing an at-the-money European put option for the term of the transfer restriction. The weighted average discount for share and performance share awards granted during 2015 is approximately 16.7% (2014: 12.9%) of the market price of the UBS share. The grant date fair value of notional UBS shares without dividend entitlements also includes a deduction for the present value of future expected dividends to be paid between the grant date and distribution.
Note 30 Interests in subsidiaries and other entities
a) Interests in subsidiaries
UBS AG defines its significant subsidiaries as those entities that, either individually or in aggregate, contribute significantly to UBS AG’s financial position or results of operations, based on a number of criteria, including the subsidiaries’ equity and their contribution to UBS AG’s total assets and profit and loss before tax, in accordance with the requirements set by IFRS 12, Swiss regulations and the regulations of the US Securities and Exchange Commission (SEC).
Individually significant subsidiaries
The table below lists UBS AG’s individually significant subsidiaries as of 31 December 2015. Unless otherwise stated, the subsidiaries listed below have share capital consisting solely of ordinary shares, which are held fully by UBS AG, and the proportion of ownership interest held is equal to the voting rights held by UBS AG. The country where the respective registered office is located is also generally the principal place of business.
Individually significant subsidiaries as of 31 December 2015 |
Company | Registered office | Primary business division | Share capital in million | Equity interest accumulated in % |
UBS Americas Holding LLC | Wilmington, Delaware, USA | Corporate Center | USD | 1,200.0¹ | 100.0 |
UBS Bank USA | Salt Lake City, Utah, USA | Wealth Management Americas | USD | 0.0 | 100.0 |
UBS Financial Services Inc. | Wilmington, Delaware, USA | Wealth Management Americas | USD | 0.0 | 100.0 |
UBS Limited | London, United Kingdom | Investment Bank | GBP | 226.6 | 100.0 |
UBS Securities LLC | Wilmington, Delaware, USA | Investment Bank | USD | 1,283.1² | 100.0 |
UBS Switzerland AG | Zurich, Switzerland | Personal & Corporate Banking | CHF | 10.0 | 100.0 |
1 Comprised of common share capital of USD 1,000 and non-voting preferred share capital of USD 1,200,000,000. 2 Comprised of common share capital of USD 100,000 and non-voting preferred share capital of USD 1,283,000,000. |
In 2015, UBS transferred its Personal & Corporate Banking and Wealth Management business booked in Switzerland from UBS AG to UBS Switzerland AG, a newly formed bank subsidiary.
® Refer to Note 32 for more information
UBS Americas Holding LLC, UBS Limited and UBS Switzerland AG are fully held by UBS AG. UBS Bank USA, UBS Financial Services Inc. and UBS Securities LLC are fully held, directly or indirectly, by UBS Americas Holding LLC.
Consolidated financial statements
Notes to the UBS AG consolidated financial statements
Note 30 Interests in subsidiaries and other entities (continued)
Other subsidiaries
The table below lists other subsidiaries that are not individually significant but that contribute to UBS AG’s total assets and aggregated profit before tax thresholds and are thereby disclosed in accordance with the requirements set by the SEC.
Other subsidiaries as of 31 December 2015 | | | | |
Company | Registered office | Primary business division | Share capital in million | Equity interest accumulated in % |
Topcard Service AG | Glattbrugg, Switzerland | Personal & Corporate Banking | CHF | 0.2 | 100.0 |
UBS (Italia) SpA | Milan, Italy | Wealth Management | EUR | 95.0 | 100.0 |
UBS (Luxembourg) S.A. | Luxembourg, Luxembourg | Wealth Management | CHF | 150.0 | 100.0 |
UBS Americas Inc. | Wilmington, Delaware, USA | Corporate Center | USD | 0.0 | 100.0 |
UBS Asset Management (Americas) Inc. | Wilmington, Delaware, USA | Asset Management | USD | 0.0 | 100.0 |
UBS Asset Management (Australia) Ltd | Sydney, Australia | Asset Management | AUD | 20.1¹ | 100.0 |
UBS Asset Management (Deutschland) GmbH | Frankfurt, Germany | Asset Management | EUR | 7.7 | 100.0 |
UBS Asset Management (Hong Kong) Limited | Hong Kong, Hong Kong | Asset Management | HKD | 150.0 | 100.0 |
UBS Asset Management (Japan) Ltd | Tokyo, Japan | Asset Management | JPY | 2,200.0 | 100.0 |
UBS Asset Management (Singapore) Ltd | Singapore, Singapore | Asset Management | SGD | 4.0 | 100.0 |
UBS Asset Management (UK) Ltd | London, United Kingdom | Asset Management | GBP | 125.0 | 100.0 |
UBS Asset Management AG | Zurich, Switzerland | Asset Management | CHF | 0.1 | 100.0 |
UBS Australia Holdings Pty Ltd | Sydney, Australia | Investment Bank | AUD | 46.7 | 100.0 |
UBS Bank, S.A. | Madrid, Spain | Wealth Management | EUR | 97.2 | 100.0 |
UBS Beteiligungs-GmbH & Co. KG | Frankfurt, Germany | Wealth Management | EUR | 568.8 | 100.0 |
UBS Card Center AG | Glattbrugg, Switzerland | Personal & Corporate Banking | CHF | 0.1 | 100.0 |
UBS Credit Corp. | Wilmington, Delaware, USA | Wealth Management Americas | USD | 0.0 | 100.0 |
UBS Deutschland AG | Frankfurt, Germany | Wealth Management | EUR | 176.0 | 100.0 |
UBS Fund Advisor, L.L.C. | Wilmington, Delaware, USA | Wealth Management Americas | USD | 0.0 | 100.0 |
UBS Fund Mangement (Luxembourg) S.A. | Luxembourg, Luxembourg | Asset Management | EUR | 13.0 | 100.0 |
UBS Fund Mangement (Switzerland) AG | Basel, Switzerland | Asset Management | CHF | 1.0 | 100.0 |
UBS Hedge Fund Solutions LLC | Wilmington, Delaware, USA | Asset Management | USD | 0.1 | 100.0 |
UBS Italia SIM SpA | Milan, Italy | Investment Bank | EUR | 15.1 | 100.0 |
UBS O'Connor LLC | Dover, Delaware, USA | Asset Management | USD | 1.0 | 100.0 |
UBS Real Estate Securities Inc. | Wilmington, Delaware, USA | Investment Bank | USD | 0.0 | 100.0 |
UBS Realty Investors LLC | Boston, Massachusetts, USA | Asset Management | USD | 9.0 | 100.0 |
UBS Securities (Thailand) Ltd | Bangkok, Thailand | Investment Bank | THB | 500.0 | 100.0 |
UBS Securities Australia Ltd | Sydney, Australia | Investment Bank | AUD | 0.3¹ | 100.0 |
UBS Securities Canada Inc. | Toronto, Canada | Investment Bank | CAD | 10.0 | 100.0 |
UBS Securities España Sociedad de Valores SA | Madrid, Spain | Investment Bank | EUR | 15.0 | 100.0 |
UBS Securities India Private Limited | Mumbai, India | Investment Bank | INR | 140.0 | 100.0 |
UBS Securities Japan Co., Ltd. | Tokyo, Japan | Investment Bank | JPY | 46,450.0 | 100.0 |
UBS Securities Pte. Ltd. | Singapore, Singapore | Investment Bank | SGD | 420.4 | 100.0 |
UBS Services LLC | Wilmington, Delaware, USA | Corporate Center | USD | 0.0 | 100.0 |
UBS South Africa (Proprietary) Limited | Sandton, South Africa | Investment Bank | ZAR | 0.0 | 100.0 |
UBS Trust Company of Puerto Rico | Hato Rey, Puerto Rico | Wealth Management Americas | USD | 0.1 | 100.0 |
UBS UK Properties Limited | London, United Kingdom | Corporate Center | GBP | 132.0 | 100.0 |
1 Includes a nominal amount relating to redeemable preference shares. |
Note 30 Interests in subsidiaries and other entities (continued)
Changes in consolidation scope
During 2015, a number of subsidiaries were incorporated in order to improve the resolvability of UBS AG in response to too big to fail requirements, namely UBS Americas Holding LLC, UBS Switzerland AG and UBS Asset Management AG. UBS Fund Services (Cayman) Ltd and a few smaller subsidiaries of Asset Management were removed from the scope of consolidation as part of the sale of the Alternative Fund Services business.
Non-controlling interests
As of 31 December 2015 and 31 December 2014, non-controlling interests were not material to UBS AG. In addition, as of these dates there were no significant restrictions on UBS AG’s ability to access or use the assets and settle the liabilities of subsidiaries resulting from protective rights of non-controlling interests.
® Refer to the “Statement of changes in equity” for more information
Consolidated structured entities
UBS AG consolidates a structured entity (SE) if it has power over the relevant activities of the entity, exposure to variable returns and the ability to use its power to affect its returns. Consolidated SEs include certain investment funds, securitization vehicles and client investment vehicles. UBS AG has no individually significant subsidiaries that are SEs.
Investment fund SEs are generally consolidated when UBS AG’s aggregate exposure combined with its decision making rights indicate the ability to use such power in a principal capacity. Typically UBS AG will have decision making rights as fund manager, earning a management fee, and will provide seed capital at the inception of the fund or hold a significant percentage of the fund units. Where other investors do not have the substantive ability to remove UBS AG as decision maker, UBS AG is deemed to have control and therefore consolidates the fund.
Securitization SEs are generally consolidated when UBS AG holds a significant percentage of the asset backed securities issued by the SE and has the power to remove without cause the servicer of the asset portfolio.
Client investment SEs are generally consolidated when UBS AG has a substantive liquidation right over the SE or a decision right over the assets held by the SE and has exposure to variable returns through derivatives traded with the SE or holding notes issued by the SE.
In 2015 and 2014, UBS AG has not entered into any contractual obligation that could require UBS AG to provide financial support to consolidated SEs. In addition, UBS AG did not provide support, financial or otherwise, to a consolidated SE when UBS AG was not contractually obligated to do so, nor has UBS AG an intention to do so in the future. Further, UBS AG did not provide support, financial or otherwise, to a previously unconsolidated SE that resulted in UBS AG controlling the SE during the reporting period.
Consolidated financial statements
Notes to the UBS AG consolidated financial statements
Note 30 Interests in subsidiaries and other entities (continued)
b) Interests in associates and joint ventures
As of 31 December 2015 and 2014, no associate or joint venture was individually material to UBS AG. In addition, there were no significant restrictions on the ability of associates or joint ventures to transfer funds to UBS AG or its subsidiaries in the form of cash dividends or to repay loans or advances made. There were no quoted market prices for any associates or joint ventures of UBS AG.
Investments in associates and joint ventures | | |
CHF million | 31.12.15 | 31.12.14 |
Carrying amount at the beginning of the year | 927 | 842 |
Additions | 12 | 1 |
Disposals | (2) | (2) |
Share of comprehensive income | 151 | 103 |
of which: share of net profit¹˒² | 169 | 94 |
of which: share of other comprehensive income³ | (18) | 9 |
Dividends received | (114) | (54) |
Foreign currency translation | (20) | 38 |
Carrying amount at the end of the year | 954 | 927 |
of which: associates | 925 | 900 |
of which: UBS Securities Co. Limited, Beijing⁴ | 411 | 404 |
of which: SIX Group AG, Zurich⁵ | 413 | 406 |
of which: other associates | 102 | 90 |
of which: joint ventures | 29 | 27 |
1 For 2015, consists of CHF 158 million from associates and CHF 11 million from joint ventures. For 2014, consists of CHF 83 million from associates and CHF 11 million from joint ventures. 2 In 2015, the SIX Group sold its stake in STOXX Ltd and Indexium Ltd. The UBS share of the resulting gain on sale was CHF 81 million. 3 For 2015, consists of CHF (18) million from associates and CHF 0 million from joint ventures. For 2014, consists of CHF 8 million from associates and CHF 0 million from joint ventures. 4 During 2015, UBS AG's equity interest increased to 24.99% (20.0% as of 31 December 2014). 5 UBS AG's equity interest amounts to 17.3%. UBS AG is represented on the Board of Directors. |
Note 30 Interests in subsidiaries and other entities (continued)
c) Interests in unconsolidated structured entities
During 2015, UBS AG sponsored the creation of various SEs and interacted with a number of non-sponsored SEs, including securitization vehicles, client vehicles as well as certain investment funds, which UBS AG did not consolidate as of 31 December 2015 because it did not control these entities.
® Refer to Note 1a item 3 for more information on the nature, purpose, activities and financing structure of these entities
The table below presents UBS AG's interests in and maximum exposure to loss from unconsolidated SEs as of 31 December 2015. In addition, the total assets held by the SEs in which UBS AG had an interest as of 31 December 2015 are provided, except for investment funds sponsored by third parties, for which the carrying value of UBS AG’s interest as of 31 December 2015 has been disclosed.
Interests in unconsolidated structured entities | | |
| | 31.12.15 |
CHF million, except where indicated | | Securitization vehicles | Client vehicles | Investment funds | Total | Maximum exposure to loss¹ |
Trading portfolio assets | | 1,060 | 463 | 6,102 | 7,624 | 7,624 |
Positive replacement values | | 41 | 101 | 57 | 200 | 200 |
Financial assets designated at fair value | | | 97² | | 97 | 1,636 |
Loans | | 0 | 0 | 101 | 101 | 101 |
Financial investments available-for-sale | | | 3,396 | 102 | 3,498 | 3,498 |
Other assets | | 0 | 45² | 0 | 45 | 937 |
Total assets | | 1,101³ | 4,102 | 6,362 | 11,565 | |
Negative replacement values | | 30⁴ | 631 | 0 | 661 | 19 |
Total liabilities | | 30⁵ | 631 | 0 | 661 | |
Assets held by the unconsolidated structured entities in which UBS AG had an interest (CHF billion) | | 141⁶ | 43⁷ | 320⁸ | | |
| | | | | | |
| | 31.12.14 |
CHF million, except where indicated | | Securitization vehicles | Client vehicles | Investment funds | Total | Maximum exposure to loss¹ |
Trading portfolio assets | | 1,955 | 676 | 8,079 | 10,711 | 10,711 |
Positive replacement values | | 26 | 83 | 2 | 111 | 111 |
Financial assets designated at fair value | | | 115² | 102 | 217 | 2,422 |
Loans | | 466 | 40 | 206 | 712 | 712 |
Financial investments available-for-sale | | | 4,029 | 94 | 4,123 | 4,123 |
Other assets | | | 52² | | 52 | 1,248 |
Total assets | | 2,447³ | 4,996 | 8,482 | 15,925 | |
Negative replacement values | | 245⁴ | 27 | 75 | 347 | 21 |
Total liabilities | | 245⁵ | 27 | 75 | 347 | |
Assets held by the unconsolidated structured entities in which UBS AG had an interest (CHF billion) | | 355⁶ | 113⁷ | 304⁸ | | |
1 For purposes of this disclosure, maximum exposure to loss amounts do not consider the risk-reducing effects of collateral or other credit enhancements. 2 Represents the carrying value of loan commitments, both designated at fair value and held at amortized cost. The maximum exposure to loss for these instruments is equal to the notional amount. 3 As of 31 December 2015, CHF 0.9 billion of the CHF 1.1 billion was held in Corporate Center - Non-core and Legacy Portfolio. As of 31 December 2014, CHF 2.2 billion of the CHF 2.4 billion was held in Corporate Center - Non-core and Legacy Portfolio. 4 Comprised of credit default swap (CDS) liabilities and other swap liabilities. The maximum exposure to loss for CDS is equal to the sum of the negative carrying value and the notional amount. For other swap liabilities, no maximum exposure to loss is reported. 5 Entirely held in Corporate Center - Non-core and Legacy Portfolio. 6 Represents principal amount outstanding. 7 Represents the market value of total assets. 8 Represents the net asset value of the investment funds sponsored by UBS AG (31 December 2015: CHF 310 billion, 31 December 2014: CHF 296 billion) and the carrying value of UBS AG's interests in the investment funds not sponsored by UBS (31 December 2015: CHF 10 billion, 31 December 2014: CHF 8 billion). |
Consolidated financial statements
Notes to the UBS AG consolidated financial statements
Note 30 Interests in subsidiaries and other entities (continued)
UBS AG retains or purchases interests in unconsolidated SEs in the form of direct investments, financing, guarantees, letters of credit, derivatives and through management contracts.
For retained interests, UBS AG's maximum exposure to loss is generally equal to the carrying value of UBS AG's interest in the SE, with the exception of guarantees, letters of credit and credit derivatives for which the contract’s notional amount, adjusted for losses already incurred, represents the maximum loss that UBS AG is exposed to. In addition, the current fair value of derivative swap instruments with a positive replacement value only, such as total return swaps, is presented as UBS AG’s maximum exposure to loss. Risk exposure for these swap instruments could change over time with market movements.
The maximum exposure to loss disclosed in the table on the previous page does not reflect UBS AG's risk management activities, including effects from financial instruments that UBS AG may utilize to economically hedge the risks inherent in the unconsolidated SE or the risk-reducing effects of collateral or other credit enhancements.
In 2015 and 2014, UBS AG did not provide support, financial or otherwise, to an unconsolidated SE when UBS AG was not contractually obligated to do so, nor has UBS AG an intention to do so in the future.
In 2015 and 2014, income and expenses from interests in unconsolidated SEs primarily resulted from mark-to-market movements recognized in net trading income, which have generally been hedged with other financial instruments, as well as fee and commission income received from UBS sponsored funds.
Interests in securitization vehicles
As of 31 December 2015 and 31 December 2014, UBS AG retained interests in various securitization vehicles. As of 31 December 2015, a majority of our interests in securitization vehicles related to a portfolio of credit default swap (CDS) positions referencing asset-backed securities (ABS), which are held within Corporate Center - Non-core and Legacy Portfolio. The Investment Bank also retained interests in securitization vehicles related to financing, underwriting, secondary market and derivative trading activities.
In some cases UBS AG may be required to absorb losses from an unconsolidated SE before other parties because UBS AG’s interest is subordinated to others in the ownership structure. An overview of UBS AG’s interests in unconsolidated securitization vehicles and the relative ranking and external credit rating of those interests as of 31 December 2015 and 31 December 2014 is presented in the table on the following page.
® Refer to Note 1a items 3 and 12 for more information on when UBS AG is viewed as the sponsor of an SE and for UBS AG’s accounting policies regarding securitization vehicles established by UBS AG
Interests in client vehicles
As of 31 December 2015 and 31 December 2014, UBS AG retained interests in client vehicles sponsored by UBS AG and third parties that relate to financing and derivative activities and to hedge structured product offerings. Included within these investments are securities guaranteed by US government agencies.
Interests in investment funds
UBS AG holds interests in a number of investment funds, primarily resulting from seed investments or to hedge structured product offerings. In addition to the interests disclosed in the table on the previous page, UBS AG manages the assets of various pooled investment funds and receives fees that are based, in whole or part, on the net asset value of the fund and / or the performance of the fund. The specific fee structure is determined based on various market factors and considers the nature of the fund, the jurisdiction of incorporation as well as fee schedules negotiated with clients. These fee contracts represent an interest in the fund as they align UBS AG’s exposure to investors, providing a variable return that is based on the performance of the entity. Depending on the structure of the fund, these fees may be collected directly from the fund assets and / or from the investors. Any amounts due are collected on a regular basis and are generally backed by the assets of the fund. UBS AG did not have any material exposure to loss from these interests as of 31 December 2015 or as of 31 December 2014.
Note 30 Interests in subsidiaries and other entities (continued)
Interests in unconsolidated securitization vehicles¹ | | | |
| | 31.12.15 |
CHF million, except where indicated | | Residential mortgage- backed securities | Commercial mortgage- backed securities | Other asset-backed securities² | Re-securiti- zation³ | Total |
Sponsored by UBS AG | | | | | | |
Interests in senior tranches | | 0 | 54 | 0 | 13 | 66 |
of which: rated investment grade | | | 54 | 0 | | 54 |
of which: defaulted | | | | | 13 | 13 |
Interests in mezzanine tranches | | 3 | 7 | 0 | 0 | 10 |
of which: rated investment grade | | | 7 | | | 7 |
of which: rated sub-investment grade | | 2 | | | | 2 |
of which: defaulted | | 1 | | | | 1 |
Total | | 3 | 61 | 0 | 13 | 77 |
of which: Trading portfolio assets | | 3 | 61 | 0 | 13 | 77 |
Total assets held by the vehicles in which UBS AG had an interest (CHF billion) | | 0 | 28 | 0 | 1 | 29 |
| | | | | | |
Not sponsored by UBS AG | | | | | | |
Interests in senior tranches | | 284 | 66 | 383 | 140 | 873 |
of which: rated investment grade | | 284 | 65 | 383 | 140 | 872 |
Interests in mezzanine tranches | | 61 | 17 | 17 | 0 | 95 |
of which: rated investment grade | | 58 | 17 | 17 | 0 | 92 |
of which: defaulted | | 3 | | | | 3 |
Interests in junior tranches | | 11 | 3 | 0 | 0 | 14 |
of which: rated investment grade | | 11 | 0 | | | 11 |
of which: not rated | | 0 | 3 | | | 3 |
Total | | 356 | 86 | 400 | 140 | 983 |
of which: Trading portfolio assets | | 356 | 86 | 400 | 140 | 983 |
Total assets held by the vehicles in which UBS AG had an interest (CHF billion) | | 64 | 37 | 6 | 2 | 109 |
1 This table excludes derivative transactions with securitization vehicles. 2 Includes credit card, car and student loan structures. 3 Includes collateralized debt obligations. |
Consolidated financial statements
Notes to the UBS AG consolidated financial statements
Note 30 Interests in subsidiaries and other entities (continued)
Interests in unconsolidated securitization vehicles¹ (continued) | | | |
| | 31.12.14 |
CHF million, except where indicated | | Residential mortgage- backed securities | Commercial mortgage- backed securities | Other asset-backed securities² | Re-securiti- zation³ | Total |
Sponsored by UBS AG | | | | | | |
Interests in senior tranches | | 0 | 59 | 1 | 389 | 450 |
of which: rated investment grade | | 0 | 59 | 1 | 381 | 442 |
of which: defaulted | | | | | 8 | 8 |
Interests in mezzanine tranches | | 1 | 16 | 0 | 6 | 22 |
of which: rated investment grade | | | 7 | | 6 | 13 |
of which: defaulted | | 1 | 1 | | | 2 |
of which: not rated | | | 8 | | | 8 |
Total | | 1 | 75 | 1 | 395 | 472 |
of which: Trading portfolio assets | | 1 | 75 | 1 | 14 | 91 |
of which: Loans | | | | | 381 | 381 |
Total assets held by the vehicles in which UBS AG had an interest (CHF billion) | | 1 | 14 | 3 | 2 | 20 |
| | | | | | |
Not sponsored by UBS AG | | | | | | |
Interests in senior tranches | | 376 | 293 | 454 | 207 | 1,329 |
of which: rated investment grade | | 369 | 286 | 452 | 205 | 1,313 |
of which: rated sub-investment grade | | 6 | 6 | 2 | 1 | 15 |
Interests in mezzanine tranches | | 154 | 143 | 172 | 62 | 531 |
of which: rated investment grade | | 134 | 105 | 164 | 54 | 457 |
of which: rated sub-investment grade | | 15 | 37 | 8 | 8 | 69 |
of which: defaulted | | 5 | 1 | | 0 | 5 |
Interests in junior tranches | | 68 | 18 | 1 | 2 | 89 |
of which: rated investment grade | | 56 | 11 | | | 67 |
of which: rated sub-investment grade | | 4 | 6 | | | 10 |
of which: defaulted | | 0 | 0 | 1 | | 1 |
of which: not rated | | 8 | 1 | | 2 | 11 |
Total | | 598 | 453 | 627 | 271 | 1,949 |
of which: Trading portfolio assets | | 598 | 453 | 588 | 225 | 1,865 |
of which: Loans | | | 0 | 39 | 46 | 85 |
Total assets held by the vehicles in which UBS AG had an interest (CHF billion) | | 115 | 115 | 88 | 12 | 331 |
1 This table excludes derivative transactions with securitization vehicles. 2 Includes credit card, car and student loan structures. 3 Includes collateralized debt obligations. |
Note 30 Interests in subsidiaries and other entities (continued)
Sponsored unconsolidated structured entities in which UBS AG did not have an interest
For several sponsored SEs, no interest was held by UBS AG as of 31 December 2015 or as of 31 December 2014. However, during the respective reporting period UBS AG transferred assets, provided services and held instruments that did not qualify as an interest in these sponsored SEs, and accordingly earned income or incurred expenses from these entities. The table below presents the income earned and expenses incurred directly from these entities during 2015 and 2014 as well as corresponding asset information. The table does not include income earned and expenses incurred from risk management activities, including income and expenses from financial instruments that UBS AG may utilize to economically hedge instruments transacted with the unconsolidated SEs.
Sponsored unconsolidated structured entities in which UBS AG did not have an interest at year end¹ | |
| As of or for the year ended |
| 31.12.15 |
CHF million, except where indicated | Securitization vehicles | Client vehicles | Investment funds | Total |
Net interest income | 2 | (11) | 0 | (10) |
Net fee and commission income | 0 | 0 | 57 | 57 |
Net trading income | 18 | 208 | 48 | 274 |
Total income | 20 | 197 | 104 | 321 |
Asset information (CHF billion) | 8² | 1³ | 12⁴ | |
| | | | |
| As of or for the year ended |
| 31.12.14 |
CHF million, except where indicated | Securitization vehicles | Client vehicles | Investment funds | Total |
Net interest income | 6 | (51) | | (44) |
Net fee and commission income | | | 54 | 54 |
Net trading income | 63 | (158) | 10 | (85) |
Total income | 69 | (208) | 64 | (75) |
Asset information (CHF billion) | 4² | 1³ | 14⁴ | |
1 These tables exclude profit attributable to preferred noteholders of CHF 77 million for the year ended 31 December 2015 and CHF 142 million for the year ended 31 December 2014. 2 Represents the amount of assets transferred to the respective securitization vehicles. Of the total amount transferred, CHF 3 billion was transferred by UBS AG (31 December 2014: CHF 1 billion) and CHF 5 billion was transferred by third parties (31 December 2014: CHF 3 billion). 3 Represents total assets transferred to the respective client vehicles. Of the total amount transferred, CHF 1 billion was transferred by UBS AG (31 December 2014: CHF 1 billion) and CHF 1 billion was transferred by third parties (31 December 2014: CHF 1 billion). 4 Represents the total net asset value of the respective investment funds. |
Consolidated financial statements
Notes to the UBS AG consolidated financial statements
Note 30 Interests in subsidiaries and other entities (continued)
During 2015 and 2014, UBS AG primarily earned fees and recognized net trading income from sponsored SEs in which UBS AG did not hold an interest. The majority of the fee income arose from investment funds that are sponsored and administrated by UBS AG, but managed by third parties. As UBS AG does not provide any active management services, UBS AG was not exposed to risk from the performance of these entities and was therefore deemed not to have an interest in them.
In certain structures, the fees receivable for administrative purposes may be collected directly from the investors and have therefore not been included in the table above.
In addition, UBS AG incurred net trading income from mark-to-market movements arising primarily from derivatives, such as interest rate swaps and credit derivatives, in which UBS AG purchases protection, and financial liabilities designated at fair value, which do not qualify as interests because UBS AG does not absorb variability from the performance of the entity. The net income reported does not reflect economic hedges or other mitigating effects from UBS AG’s risk management activities.
During 2015, UBS AG and third parties transferred assets totaling CHF 9 billion (2014: CHF 6 billion) into sponsored securitization and client vehicles created in 2015. For sponsored investment funds, transfers arose during the period as investors invested and redeemed positions, thereby changing the overall size of the funds, which, when combined with market movements, resulted in a total closing net asset value of CHF 12 billion (31 December 2014: CHF 14 billion).
Note 31 Business combinations
In 2015 and 2014, UBS AG did not complete any significant business combinations.
Note 32 Changes in organization and disposals
Measures to improve the resolvability of the Group in response to too big to fail requirements in Switzerland and other countries in which the Group operates
In December 2014, UBS Group AG completed an exchange offer for the shares of UBS AG and established UBS Group AG as the holding company for UBS Group. During 2015, UBS Group AG filed and completed a court procedure under article 33 of the Swiss Stock Exchange Act (SESTA procedure) resulting in the cancellation of the shares of the remaining minority shareholders of UBS AG. As a result, UBS Group AG now owns 100% of the outstanding shares of UBS AG.
In June 2015, UBS AG transferred its Personal & Corporate Banking and Wealth Management business booked in Switzerland to UBS Switzerland AG.
In the second quarter of 2015, UBS AG also completed the implementation of a more self-sufficient business and operating model for UBS Limited, its investment banking subsidiary in the UK, under which UBS Limited bears and retains a larger proportion of the risk and reward in its business activities.
Also during 2015, UBS AG established a new subsidiary, UBS Americas Holding LLC, which UBS AG intends to designate as its intermediate holding company for its US subsidiaries prior to the 1 July 2016 deadline under new rules for foreign banks in the US pursuant to the Dodd-Frank Wall Street Reform and Consumer Protection Act (Dodd-Frank). During the third quarter of 2015, UBS AG contributed its equity participation in the principal US operating subsidiaries to UBS Americas Holding LLC to meet the requirement under Dodd-Frank that the intermediate holding company own all of our US operations, except branches of UBS AG.
Lastly, UBS AG also established UBS Asset Management AG, a new subsidiary, in 2015.
Sale of subsidiaries and businesses
In 2015, UBS AG sold its Alternative Fund Services (AFS) business to Mitsubishi UFJ Financial Group Investor Services. The Asset Management Investment Fund Services business, which provides fund administration for traditional mutual funds, was not included in the sale. Upon completion of the sale, UBS AG recognized a gain on sale of CHF 56 million and reclassified an associated net foreign currency translation gain of CHF 119 million from Other comprehensive income to the Income statement.
Also during 2015, UBS AG completed the sale of certain subsidiaries and businesses within Wealth Management, which resulted in the recognition of a combined gain of CHF 197 million.
Finally, in 2015, UBS AG agreed to sell certain businesses within Wealth Management and these sales are expected to close in 2016 subject to customary closing conditions. As of 31 December 2015, the assets and liabilities of these subsidiaries and businesses were presented as a disposal group held-for-sale within Other assets and Other liabilities and amounted to CHF 279 million and CHF 235 million, respectively. UBS recognized a loss of CHF 28 million in 2015 related to these sales.
Restructuring expenses
Restructuring expenses arise from programs that materially change either the scope of business undertaken by UBS AG or the manner in which such business is conducted. Restructuring expenses are temporary costs that are necessary to effect such programs and include items such as severance and other personnel-related expenses, duplicate headcount costs, impairment and accelerated depreciation of assets, contract termination costs, consulting fees, and related infrastructure and system costs. These costs are presented in the income statement according to the underlying nature of the expense. As the costs associated with restructuring programs are temporary in nature, and in order to provide a more thorough understanding of business performance, such costs are separately presented in this Note.
Consolidated financial statements
Notes to the UBS AG consolidated financial statements
Note 32 Changes in organization and disposals
Net restructuring expenses by business division and Corporate Center unit | | | | |
| | For the year ended |
CHF million | | 31.12.15 | 31.12.14 | 31.12.13 |
Wealth Management | | 323 | 185 | 178 |
Wealth Management Americas | | 137 | 55 | 59 |
Personal & Corporate Banking | | 101 | 64 | 54 |
Asset Management | | 82 | 50 | 43 |
Investment Bank | | 396 | 261 | 210 |
Corporate Center | | 194 | 61 | 229 |
of which: Services | | 138 | 30 | (6) |
of which: Non-core and Legacy Portfolio | | 56 | 31 | 235 |
Total net restructuring expenses | | 1,233 | 677 | 772 |
of which: personnel expenses | | 458 | 327 | 156 |
of which: general and administrative expenses | | 760 | 319 | 548 |
of which: depreciation and impairment of property, equipment and software | | 12 | 29 | 68 |
of which: amortization and impairment of intangible assets | | 2 | 2 | 0 |
Net restructuring expenses by personnel expense category | | | | |
| | For the year ended |
CHF million | | 31.12.15 | 31.12.14 | 31.12.13 |
Salaries | | 311 | 145 | 65 |
Variable compensation – performance awards | | 38 | 35 | (15) |
Variable compensation – other | | 108 | 138 | 88 |
Contractors | | 46 | 28 | 3 |
Social security | | 5 | 4 | 5 |
Pension and other post-employment benefit plans | | (65) | (29) | 8 |
Other personnel expenses | | 15 | 6 | 3 |
Total net restructuring expenses: personnel expenses | | 458 | 327 | 156 |
Net restructuring expenses by general and administrative expense category | | | | |
| | For the year ended |
CHF million | | 31.12.15 | 31.12.14 | 31.12.13 |
Occupancy | | 109 | 49 | 35 |
Rent and maintenance of IT and other equipment | | 31 | 23 | 8 |
Administration | | 7 | 3 | 2 |
Travel and entertainment | | 16 | 11 | 4 |
Professional fees | | 187 | 148 | 76 |
Outsourcing of IT and other services | | 316 | 82 | 59 |
Other¹ | | 95 | 2 | 364 |
Total net restructuring expenses: general and administrative expenses | | 760 | 319 | 548 |
1 Mainly comprised of onerous real estate lease contracts. |
Note 33 Operating leases and finance leases
Information on lease contracts classified as operating leases where UBS AG is the lessee is provided in Note 33a and information on finance leases where UBS AG acts as a lessor is provided in Note 33b.
a) Operating lease commitments
As of 31 December 2015, UBS AG was obligated under a number of non-cancellable operating leases for premises and equipment used primarily for banking purposes. The significant premises leases usually include renewal options and escalation clauses in line with general office rental market conditions, as well as rent adjustments based on price indices. However, the lease agreements do not contain contingent rent payment clauses and purchase options, nor do they impose any restrictions on UBS AG’s ability to pay dividends, engage in debt financing transactions or enter into further lease agreements.
CHF million | 31.12.15 |
Expenses for operating leases to be recognized in: | |
2016 | 743 |
2017 | 683 |
2018 | 558 |
2019 | 475 |
2020 | 413 |
2021 and thereafter | 1,858 |
Subtotal commitments for minimum payments under operating leases | 4,730 |
Less: Sublease rental income commitments | 348 |
Net commitments for minimum payments under operating leases | 4,382 |
CHF million | 31.12.15 | 31.12.14 | 31.12.13 |
Gross operating lease expense recognized in the income statement | 741 | 759 | 792 |
Sublease rental income | 70 | 73 | 74 |
Net operating lease expense recognized in the income statement | 671 | 686 | 718 |
b) Finance lease receivables
UBS AG leases a variety of assets to third parties under finance leases, such as commercial vehicles, production lines, medical equipment, construction equipment and aircrafts. At the end of the respective leases, assets may be sold to third parties or be leased further. Lessees may participate in any sales proceeds achieved. Leasing charges cover the cost of the assets less their residual value as well as financing costs.
As of 31 December 2015, unguaranteed residual values of CHF 167 million had been accrued, and the accumulated allowance for uncollectible minimum lease payments receivable amounted to CHF 10 million. No contingent rents were received in 2015.
Lease receivables | | | | |
CHF million | | 31.12.15 |
| | Total minimum lease payments | Unearned finance income | Present value |
2016 | | 341 | 23 | 318 |
2017–2020 | | 651 | 38 | 613 |
thereafter | | 158 | 6 | 152 |
Total | | 1,150 | 67 | 1,083 |
Consolidated financial statements
Notes to the UBS AG consolidated financial statements
UBS AG defines related parties as associates (entities which are significantly influenced by UBS AG), post-employment benefit plans for the benefit of UBS AG employees, key management personnel, close family members of key management personnel and entities which are, directly or indirectly, controlled or jointly controlled by key management personnel or their close family members. Key management personnel is defined as members of the Board of Directors (BoD) and Group Executive Board (GEB).
a) Remuneration of key management personnel
The non-independent members of the BoD have top management employment contracts and receive pension benefits upon retirement. Total remuneration of the non-independent members of the BoD and GEB members, including those who stepped down during 2015, is provided in the table below.
Remuneration of key management personnel | | | |
CHF million | 31.12.15 | 31.12.14 | 31.12.13 |
Base salaries and other cash payments | 21¹ | 22¹ | 19 |
Incentive awards – cash² | 9 | 8 | 10 |
Annual incentive award under DCCP | 20 | 18 | 19 |
Employer's contributions to retirement benefit plans | 1 | 2 | 2 |
Benefits in kind, fringe benefits (at market value) | 2 | 1 | 2 |
Equity-based compensation³ | 39 | 35 | 38 |
Total | 92 | 86 | 89 |
1 Includes role-based allowances that have been made in line with with market practice in response to the EU Capital Requirements Directive of 2013 (CRD IV). 2 Includes immediate and deferred cash. 3 Expenses for shares granted is measured at grant date and allocated over the vesting period, generally for 5 years. In 2015, 2014 and 2013, equity-based compensation was entirely comprised of EOP awards. |
The independent members of the BoD do not have employment or service contracts with UBS AG, and thus are not entitled to benefits upon termination of their service on the BoD. Payments to these individuals for their services as external board members amounted to CHF 6.7 million in 2015, CHF 7.1 million in 2014 and CHF 7.6 million in 2013.
b) Equity holdings of key management personnel
| 31.12.15 | 31.12.14 |
Number of stock options from equity participation plans held by non-independent members of the BoD and the GEB members¹ | 1,401,686 | 1,738,598 |
Number of shares held by members of the BoD, GEB and parties closely linked to them² | 3,324,650 | 3,716,957 |
1 Refer to Note 29 for more information. 2 Excludes shares granted under variable compensation plans with forfeiture provisions. |
Of the share totals above, 95,597 shares were held by close family members of key management personnel on 31 December 2015 and 31 December 2014. No shares were held by entities that are directly or indirectly controlled or jointly controlled by key management personnel or their close family members on 31 December 2015 and 31 December 2014. Refer to Note 29 for more information. As of 31 December 2015, no member of the BoD or GEB was the beneficial owner of more than 1% of UBS Group AG’s shares.
Note 34 Related parties (continued)
c) Loans, advances and mortgages to key management personnel
Non-independent members of the BoD and GEB members have been granted loans, fixed advances and mortgages on the same terms and conditions that are available to other employees, which are based on terms and conditions granted to third parties but are adjusted for differing credit risk. Independent BoD members are granted loans and mortgages under general market conditions.
Movements in the loan, advances and mortgage balances are as follows.
Loans, advances and mortgages to key management personnel¹ | | |
CHF million | 2015 | 2014 |
Balance at the beginning of the year | 27 | 20 |
Additions | 6 | 10 |
Reductions | (1) | (3) |
Balance at the end of the year | 33 | 27 |
1 Loans are granted by UBS AG. All loans are secured loans. |
d) Other related party transactions with entities controlled by key management personnel
In 2015, UBS AG did not enter into transactions with entities which are directly or indirectly controlled or jointly controlled by UBS AG’s key management personnel or their close family members. In 2014, UBS AG entered into transactions with Immo Heudorf AG (Switzerland).
Other related party transactions | | |
CHF million | 2015 | 2014 |
Balance at the beginning of the year | 0 | 10 |
Additions | 0 | 0 |
Reductions | 0 | 10 |
Balance at the end of the year¹ | 0 | 0 |
1 Comprised of loans. |
In 2014 and 2015, entities controlled by key management personnel did not sell goods or provide services to UBS AG, and therefore did not receive any fees from UBS AG. Furthermore, UBS AG did not provide services to such entities in both 2014 and 2015, and therefore also did not receive any fees.
Consolidated financial statements
Notes to the UBS AG consolidated financial statements
Note 34 Related parties (continued)
e) Transactions with associates and joint ventures
Loans and outstanding receivables to associates and joint ventures |
CHF million | | 2015 | 2014 |
Carrying value at the beginning of the year | | 552 | 288 |
Additions | | 9 | 313 |
Reductions | | (85) | (1) |
Impairment | | 0 | (51) |
Foreign currency translation | | 0 | 3 |
Carrying value at the end of the year | | 476 | 552 |
of which: unsecured loans | | 464 | 539 |
includes allowances for credit losses | | 1 | 1 |
| | | |
| | | |
Other transactions with associates and joint ventures |
| | As of or for the year ended |
CHF million | | 31.12.15 | 31.12.14 |
Payments to associates and joint ventures for goods and services received | | 149 | 169 |
Fees received for services provided to associates and joint ventures | | 7 | 1 |
Commitments and contingent liabilities to associates and joint ventures | | 4 | 2 |
® Refer to Note 30 for an overview of investments in associates and joint ventures
f) Receivables and payables from / to UBS Group AG and other subsidiaries of UBS Group AG
CHF million | | 2015 | 2014 |
Receivables | | | |
Loans | | 774 | 227 |
Trading portfolio assets | | 12 | 0 |
Other assets | | 93 | 80 |
Payables | | | |
Due to customers | | 12,323 | 772 |
Other liabilities | | 943 | 511 |
Note 35 Invested assets and net new money
Invested assets
Invested assets include all client assets managed by or deposited with UBS AG for investment purposes. Invested assets include managed fund assets, managed institutional assets, discretionary and advisory wealth management portfolios, fiduciary deposits, time deposits, savings accounts and wealth management securities or brokerage accounts. All assets held for purely transactional purposes and custody-only assets, including corporate client assets held for cash management and transactional purposes, are excluded from invested assets as UBS AG only administers the assets and does not offer advice on how the assets should be invested. Also excluded are non-bankable assets (e.g., art collections) and deposits from third-party banks for funding or trading purposes.
Discretionary assets are defined as client assets that UBS AG decides how to invest. Other invested assets are those where the client ultimately decides how the assets are invested. When a single product is created in one business division and sold in another, it is counted in both the business division that manages the investment and the one that distributes it. This results in double counting within UBS AG total invested assets, as both business divisions are independently providing a service to their respective clients, and both add value and generate revenue.
Net new money
Net new money in a reporting period is the amount of invested assets that are entrusted to UBS AG by new and existing clients, less those withdrawn by existing clients and clients who terminated their relationship with UBS AG.
Net new money is calculated using the direct method, under which inflows and outflows to / from invested assets are determined at the client level based on transactions. Interest and dividend income from invested assets are not counted as net new money inflows. Market and currency movements as well as fees, commissions and interest on loans charged are excluded from net new money, as are the effects resulting from any acquisition or divestment of a UBS AG subsidiary or business. Reclassifications between invested assets and custody-only assets as a result of a change in the service level delivered are generally treated as net new money flows; however, where such change in service level directly results from a new externally-imposed regulation, the one-time net effect of the implementation is reported as an asset reclassification without net new money impact.
The Investment Bank does not track invested assets and net new money. However, when a client is transferred from the Investment Bank to another business division, this produces net new money even though client assets were already with UBS AG. There were no such transfers between the Investment Bank and other business divisions in 2015 and 2014.
Invested assets and net new money |
| | For the year ended |
CHF billion | | 31.12.15 | 31.12.14 |
Fund assets managed by UBS | | 282 | 270 |
Discretionary assets | | 830 | 854 |
Other invested assets | | 1,577 | 1,610 |
Total invested assets¹ | | 2,689 | 2,734 |
of which: double count | | 185 | 173 |
Net new money¹ | | 27.7 | 58.9 |
1 Includes double counts. |
Development of invested assets |
| | For the year ended |
CHF billion | | 31.12.15 | 31.12.14 |
Total invested assets at the beginning of the year¹ | | 2,734 | 2,390 |
Net new money | | 28 | 59 |
Market movements² | | (24) | 115 |
Foreign currency translation | | (31) | 173 |
Other effects | | (16) | (3) |
of which: acquisitions / (divestments) | | (16) | 0 |
Total invested assets at the end of the year¹ | | 2,689 | 2,734 |
1 Includes double counts. 2 Includes interest and dividend income. |
Consolidated financial statements
Notes to the UBS AG consolidated financial statements
Note 36 Currency translation rates
The following table shows the rates of the main currencies used to translate the financial information of foreign operations into Swiss francs.
| | Spot rate | | Average rate¹ |
| | As of | | For the year ended |
| | 31.12.15 | 31.12.14 | | 31.12.15 | 31.12.14 | 31.12.13 |
1 USD | | 1.00 | 0.99 | | 0.97 | 0.92 | 0.92 |
1 EUR | | 1.09 | 1.20 | | 1.06 | 1.21 | 1.23 |
1 GBP | | 1.48 | 1.55 | | 1.47 | 1.51 | 1.45 |
100 JPY | | 0.83 | 0.83 | | 0.80 | 0.86 | 0.95 |
1 Monthly income statement items of foreign operations with a functional currency other than the Swiss franc are translated with month-end rates into Swiss francs. Disclosed average rates for a year represent an average of 12 month-end rates, weighted according to the income and expense volumes of all foreign operations with the same functional currency for each month. Weighted average rates for individual business divisions may deviate from the weighted average rates for UBS AG. |
Note 37 Events after the reporting period
There have been no material events after the reporting period which would require disclosure in or adjustment to the 31 December 2015 Financial Statements.
Note 38 Swiss GAAP requirements
The consolidated financial statements of UBS AG are prepared in accordance with International Financial Reporting Standards (IFRS). The Swiss Financial Market Supervisory Authority (FINMA) requires financial groups that present their financial statements under IFRS to provide a narrative explanation of the main differences between IFRS and Swiss GAAP (FINMA Circular 2015 / 1 and the Banking Ordinance). Included in this Note are the significant differences in the recognition and measurement between IFRS and the provisions of the Banking Ordinance and the guidelines of FINMA governing true and fair view financial statement reporting pursuant to Article 25 through Article 42 of the Banking Ordinance.
1. Consolidation
Under IFRS, all entities that are controlled by the holding entity are consolidated.
Under Swiss GAAP, controlled entities that are deemed immaterial to the group or that are held temporarily only are exempt from consolidation, but instead are recorded as participations or financial investments.
2. Financial investments classified as available-for-sale
Under IFRS, financial investments classified as available-for-sale are carried at fair value. Changes in fair value are recorded directly in equity until an investment is sold, collected or otherwise disposed of, or until an investment is determined to be impaired. At the time an available-for-sale investment is determined to be impaired, the cumulative unrealized loss previously recognized in equity is included in net profit or loss for the period. On disposal of a financial investment classified as available-for-sale, the cumulative unrealized gain or loss previously recognized in equity is reclassified to the income statement.
Under Swiss GAAP, classification and measurement of financial investments designated as available-for-sale depends on the nature of the investment. Equity instruments with no permanent holding intent, as well as debt instruments, are classified as Financial investments and measured at the lower of (amortized) cost or market value. Market value adjustments up to the original cost amount and realized gains or losses upon disposal of the investment are recorded in the income statement as Other income from ordinary activities. Equity instruments with a permanent holding intent are classified as participations in Investments in subsidiaries and other participations and measured at cost less impairment. Impairment losses are recorded in the income statement as Impairment of investments in subsidiaries and other participations. Reversal of impairments up to the original cost amount as well as realized gains or losses upon disposal of the investment are recorded as Extraordinary income / Extraordinary expenses in the income statement.
3. Cash flow hedges
Under IFRS, when hedge accounting is applied, the fair value gain or loss on the effective portion of the derivative designated as a cash flow hedge is recognized in equity. When the hedged cash flows materialize, the accumulated unrealized gain or loss is reclassified to the income statement.
Under Swiss GAAP, the effective portion of the fair value change of the derivative instrument used to hedge cash flow exposures is deferred on the balance sheet as Other assets or Other liabilities. The deferred amounts are released to the income statement when the hedged cash flows materialize.
4. Fair value option
Under IFRS, UBS AG applies the fair value option to certain financial assets and financial liabilities not held for trading. Instruments for which the fair value option is applied are accounted for at fair value with changes in fair value reflected in Net trading income. The fair value option is applied primarily to structured debt instruments, certain non-structured debt instruments, structured reverse repurchase and repurchase agreements and securities borrowing agreements, certain structured and non-structured loans as well as loan commitments.
Under Swiss GAAP, the fair value option can only be applied to structured debt instruments that consist of a debt host contract and one or more embedded derivatives that do not relate to own equity. Furthermore, changes in fair value attributable to changes in unrealized own credit are not recognized in the income statement and the balance sheet.
Consolidated financial statements
Notes to the UBS AG consolidated financial statements
Note 38 Swiss GAAP requirements (continued)
5. Goodwill and intangible assets
Under IFRS, goodwill acquired in a business combination is not amortized but tested annually for impairment. Intangible assets with an indefinite useful life are also not amortized but tested annually for impairment.
Under Swiss GAAP, goodwill and intangible assets with indefinite useful lives are amortized over a period not exceeding five years, unless a longer useful life, which may not exceed 10 years, can be justified.
6. Pension and other post-employment benefit plans
Swiss GAAP permits the use of IFRS or Swiss accounting standards for pension and other post-employment benefit plans, with the election made on a plan-by-plan basis.
UBS AG has elected to apply IFRS (IAS 19) for the non-Swiss defined benefit plans and Swiss GAAP (FER 16) for the Swiss pension plan in its standalone financial statements. The requirements of Swiss GAAP are better aligned with the specific nature of Swiss pension plans, which are hybrid in that they combine elements of defined contribution and defined benefit plans, but are treated as defined benefit plans under IFRS. Key differences between Swiss GAAP and IFRS include the treatment of dynamic elements, such as future salary increases and future interest credits on retirement savings, which are not considered under the static method used in accordance with Swiss GAAP. Also, the discount rate used to determine the defined benefit obligation in accordance with IFRS is based on the yield of high-quality corporate bonds of the market in the respective pension plan country. The discount rate used in accordance with Swiss GAAP, i.e., the technical interest rate, is determined by the Pension Foundation Board based on the expected returns of the Board’s investment strategy.
For defined benefit plans, IFRS requires the full defined benefit obligation net of the plan assets to be recorded on the balance sheet, with changes resulting from remeasurements recognized directly in equity. However, for plans for which IFRS is elected, Swiss GAAP requires that changes due to remeasurements are recognized in the income statement.
Swiss GAAP requires that employer contributions to the pension fund are recognized as personnel expenses in the income statement. Further, Swiss GAAP requires an assessment as to whether, based on the financial statements of the pension fund prepared in accordance with Swiss accounting standards (FER 26), an economic benefit to, or obligation of, the employer arises from the pension fund and is recognized in the balance sheet when conditions are met. Conditions for recording a pension asset or liability would be met if, for example, an employer contribution reserve is available or the employer is required to contribute to the reduction of a pension deficit (on a FER 26 basis).
7. Netting of replacement values
Under IFRS, replacement values and related cash collateral are reported on a gross basis unless the restrictive IFRS netting requirements are met: i) existence of master netting agreements and related collateral arrangements that are unconditional and legally enforceable, both in the normal course of business and in the event of default, bankruptcy or insolvency of UBS AG and its counterparties, and ii) UBS AG’s intention to either settle on a net basis or to realize the asset and settle the liability simultaneously.
Under Swiss GAAP, replacement values and related cash collateral are generally reported on a net basis, provided the master netting and the related collateral agreements are legally enforceable in the event of default, bankruptcy or insolvency of UBS AG's counterparties.
8. Negative interest
Under IFRS, negative interest income arising on a financial asset does not meet the definition of interest income and, therefore, negative interest on financial assets and negative interest on financial liabilities is presented within interest expense and interest income, respectively.
Under Swiss GAAP, negative interest on financial assets is presented within interest income and negative interest on financial liabilities is presented within interest expense.
9. Extraordinary income and expense
Certain non-recurring and non-operating income and expense items, such as realized gains or losses from the disposal of participations, fixed and intangible assets, as well as reversals of impairments of participations and fixed assets, are classified as extraordinary items under Swiss GAAP. This distinction is not available under IFRS.
10. Other presentational differences
Under IFRS, financial statements are comprised of an Income statement, Statement of comprehensive income, Balance sheet, Statement of changes in equity, Statement of cash flows and Notes to the financial statements. Under Swiss GAAP, the concept of other comprehensive income does not exist and consequently no Statement of comprehensive income is required. In addition, various other presentational differences exist. ▲
Note 39 Supplemental guarantor information required under SEC regulations
Guarantee of PaineWebber securities
Prior to its acquisition by UBS in 2000, Paine Webber Group Inc. (PaineWebber) was an SEC registrant. Upon acquisition, PaineWebber was merged into UBS Americas Inc., a wholly owned subsidiary of UBS AG. Following the acquisition, UBS AG entered into a full and unconditional guarantee of the senior notes (Debt Securities) issued by PaineWebber. Under the guarantee, if UBS Americas Inc. fails to make any timely payment under the Debt Securities agreements, the holders of the Debt Securities or the Debt Securities trustee may demand payment from UBS AG without first proceeding against UBS Americas Inc.
As of 31 December 2015, the amount of outstanding senior notes of UBS Americas Inc. was approximately CHF 150 million. These senior notes mature between 2017 and 2018.
Guarantee of other securities
Certain US-domiciled entities that are 100% legally owned by UBS AG have outstanding trust preferred securities, which are registered under the US Securities Act. These entities, UBS Preferred Funding Trust IV and UBS Preferred Funding Trust V, are not consolidated by UBS AG as UBS AG does not absorb any variability from the performance of these entities. However, UBS AG has fully and unconditionally guaranteed these securities. The non-consolidated issuing US domiciled entities are presented in a separate column in the supplemental guarantor information provided in the following tables. Amounts presented in this column are eliminated in the Elimination entries column, as these entities are not consolidated. UBS AG’s obligations under the guarantee are subordinated to the prior payment in full of the deposit liabilities of UBS AG and all other liabilities of UBS AG.
As of 31 December 2015, the outstanding amount of the preferred securities was USD 1.3 billion and the amount of senior liabilities of UBS AG to which the holders of these securities would be subordinated was approximately CHF 872 billion.
Joint liability of UBS Switzerland AG
In June 2015, the Retail & Corporate and Wealth Management businesses booked in Switzerland were transferred from UBS AG to UBS Switzerland AG through an asset transfer in accordance with the Swiss Merger Act. Under the terms of the asset transfer agreement, UBS Switzerland AG assumed joint liability for contractual obligations of UBS AG existing on the asset transfer date, including the existing guarantee of abovementioned PaineWebber and other securities. To reflect this joint liability, UBS Switzerland AG is, on a prospective basis, presented in a separate column as a subsidiary co-guarantor.
Consolidated financial statements
Notes to the UBS AG consolidated financial statements
Note 39 Supplemental guarantor information required under SEC regulations (continued)
Supplemental guarantor consolidated income statement |
CHF million | UBS AG (standalone)¹ | UBS Switzerland AG (standalone)¹ | UBS Americas Inc.² | UBS Preferred Funding Trust IV & V | Other subsidiaries² | Elimination entries | UBS AG (consolidated) |
For the year ended 31 December 2015 |
Operating income | | | | | | | |
Interest income | 8,911 | 3,040 | 1,662 | 63 | 1,515 | (2,013) | 13,178 |
Interest expense | (5,882) | (544) | (590) | | (1,321) | 1,888 | (6,449) |
Net interest income | 3,029 | 2,496 | 1,072 | 63 | 194 | (125) | 6,729 |
Credit loss (expense) / recovery | (109) | (12) | 0 | | 4 | 0 | (117) |
Net interest income after credit loss expense | 2,921 | 2,484 | 1,072 | 63 | 198 | (126) | 6,612 |
Net fee and commission income | 2,852 | 2,539 | 7,751 | | 4,115 | (72) | 17,184 |
Net trading income | 5,252 | 709 | 274 | | 224 | (763) | 5,696 |
Other income | 10,335 | 564 | 496 | | (917) | (9,366) | 1,112 |
Total operating income | 21,359 | 6,296 | 9,592 | 63 | 3,620 | (10,326) | 30,605 |
Operating expenses | | | | | | | |
Personnel expenses | 6,800 | 1,607 | 6,281 | | 1,265 | 0 | 15,954 |
General and administrative expenses | 549 | 2,579 | 3,442 | | 1,647 | 2 | 8,219 |
Depreciation and impairment of property, equipment and software | 672 | 11 | 159 | | 76 | 0 | 918 |
Amortization and impairment of intangible assets | 22 | | 73 | | 12 | 0 | 107 |
Total operating expenses | 8,044 | 4,197 | 9,955 | | 3,001 | 2 | 25,198 |
Operating profit / (loss) before tax | 13,315 | 2,099 | (362) | 63 | 619 | (10,327) | 5,407 |
Tax expense / (benefit) | 1,136 | 489 | (1,200) | | (1,317) | (16) | (908) |
Net profit / (loss) | 12,180 | 1,610 | 837 | 63 | 1,936 | (10,313) | 6,314 |
Net profit / (loss) attributable to preferred noteholders | 77 | | | 31 | | (31) | 77 |
Net profit / (loss) attributable to non-controlling interests | | | | | 3 | 0 | 3 |
Net profit / (loss) attributable to UBS AG shareholders | 12,103 | 1,610 | 837 | 32 | 1,933 | (10,281) | 6,235 |
1 Amounts presented for UBS AG (standalone) and UBS Switzerland AG (standalone) represent IFRS-standalone information. Refer to the UBS AG standalone and UBS Switzerland AG standalone financial statements for information prepared in accordance with Swiss GAAP. 2 Amounts presented in these columns serve as a basis for preparing UBS AG consolidated financial statements in accordance with IFRS. |
Note 39 Supplemental guarantor information required under SEC regulations (continued)
Supplemental guarantor consolidated statement of comprehensive income |
CHF million | UBS AG (standalone)¹ | UBS Switzerland AG (standalone)¹ | UBS Americas Inc.² | UBS Preferred Funding Trust IV & V | Other subsidiaries² | Elimination entries | UBS AG (consolidated) |
For the year ended 31 December 2015 |
| | | | | | | |
Comprehensive income attributable to UBS AG shareholders | | | | | | | |
Net profit / (loss) | 12,103 | 1,610 | 837 | 32 | 1,933 | (10,281) | 6,235 |
| | | | | | | |
Other comprehensive income | | | | | | | |
Other comprehensive income that may be reclassified to the income statement | | | | | | | |
Foreign currency translation, net of tax | (11) | 0 | 121 | | (843) | 467 | (266) |
Financial investments available-for-sale, net of tax | (51) | 43 | (21) | | (16) | (19) | (64) |
Cash flow hedges, net of tax | (503) | (72) | 0 | | 0 | 57 | (518) |
Total other comprehensive income that may be reclassified to the income statement, net of tax | (564) | (29) | 100 | 0 | (859) | 504 | (848) |
| | | | | | | |
Other comprehensive income that will not be reclassified to the income statement | | | | | | | |
Defined benefit plans, net of tax | 701 | (337) | (71) | | 27 | (15) | 304 |
Total other comprehensive income that will not be reclassified to the income statement, net of tax | 701 | (337) | (71) | 0 | 27 | (15) | 304 |
| | | | | | | |
Total other comprehensive income | 136 | (366) | 29 | 0 | (832) | 489 | (545) |
| | | | | | | |
Total comprehensive income attributable to shareholders | 12,239 | 1,244 | 866 | 32 | 1,101 | (9,792) | 5,690 |
| | | | | | | |
Total comprehensive income attributable to preferred noteholders | 18 | 0 | 0 | 0 | 0 | 0 | 18 |
Total comprehensive income attributable to non-controlling interests | 0 | 0 | 0 | 0 | 1 | 0 | 1 |
Total comprehensive income attributable to UBS Preferred Funding Trust IV & V | 0 | 0 | 0 | 40 | 0 | (40) | 0 |
Total comprehensive income | 12,257 | 1,244 | 866 | 72 | 1,102 | (9,832) | 5,709 |
1 Amounts presented for UBS AG (standalone) and UBS Switzerland AG (standalone) represent IFRS-standalone information. Refer to the UBS AG standalone and UBS Switzerland AG standalone financial statements for information prepared in accordance with Swiss GAAP. 2 Amounts presented in these columns serve as a basis for preparing UBS AG (consolidated) financial statements in accordance with IFRS. |
Consolidated financial statements
Notes to the UBS AG consolidated financial statements
Note 39 Supplemental guarantor information required under SEC regulations (continued)
Supplemental guarantor consolidated balance sheet |
CHF million | UBS AG (standalone)¹ | UBS Switzerland AG (standalone)¹ | UBS Americas Inc.² | UBS Preferred Funding Trust IV & V | Other subsidiaries² | Elimination entries | UBS AG (consolidated) |
As of 31 December 2015 |
Assets | | | | | | | |
Cash and balances with central banks | 45,125 | 38,701 | 4,971 | | 2,509 | 0 | 91,306 |
Due from banks | 29,225 | 3,224 | 12,776 | | 27,510 | (60,868) | 11,866 |
Cash collateral on securities borrowed | 27,925 | 7,414 | 38,007 | | 6,506 | (54,268) | 25,584 |
Reverse repurchase agreements | 61,253 | 16,258 | 21,039 | | 14,586 | (45,243) | 67,893 |
Trading portfolio assets | 94,132 | 1,736 | 5,931 | 1,310 | 30,132 | (9,194) | 124,047 |
of which: assets pledged as collateral which may be sold or repledged by counterparties | 53,708 | 0 | 3,038 | | 2,264 | (7,066) | 51,943 |
Positive replacement values | 175,943 | 6,033 | 21,463 | | 28,921 | (64,925) | 167,435 |
Cash collateral receivables on derivative instruments | 19,026 | 1,056 | 5,964 | | 12,678 | (14,962) | 23,763 |
Financial assets designated at fair value | 6,303 | 0 | 199 | | 2,628 | (3,322) | 5,808 |
Loans | 89,052 | 186,872 | 47,054 | | 14,554 | (24,809) | 312,723 |
Financial investments available-for-sale | 32,044 | 23,184 | 5,360 | | 5,996 | (4,042) | 62,543 |
Investments in subsidiaries and associates | 45,689 | 14 | 1 | | 1 | (44,751) | 954 |
Property, equipment and software | 6,499 | 15 | 972 | | 197 | 0 | 7,683 |
Goodwill and intangible assets | 347 | 0 | 5,112 | | 1,139 | (30) | 6,568 |
Deferred tax assets | 2,332 | 845 | 7,766 | | 1,890 | 0 | 12,833 |
Other assets | 12,108 | 1,255 | 10,041 | | 3,111 | (4,266) | 22,249 |
Total assets | 647,006 | 286,608 | 186,654 | 1,310 | 152,359 | (330,680) | 943,256 |
Liabilities | | | | | | | |
Due to banks | 31,725 | 18,948 | 26,320 | 4 | 5,782 | (70,944) | 11,836 |
Cash collateral on securities lent | 34,094 | 2,493 | 23,437 | | 2,274 | (54,268) | 8,029 |
Repurchase agreements | 20,658 | 6,505 | 11,490 | | 16,244 | (45,243) | 9,653 |
Trading portfolio liabilities | 21,193 | 128 | 3,919 | | 11,317 | (7,420) | 29,137 |
Negative replacement values | 170,718 | 5,655 | 21,109 | | 29,877 | (64,928) | 162,430 |
Cash collateral payables on derivative instruments | 31,399 | 374 | 6,438 | | 15,033 | (14,962) | 38,282 |
Financial liabilities designated at fair value | 61,630 | 0 | 288 | | 4,675 | (3,598) | 62,995 |
Due to customers | 102,483 | 231,252 | 53,633 | | 34,002 | (18,848) | 402,522 |
Debt issued | 70,792 | 8,274 | 3,126 | | 321 | (153) | 82,359 |
Provisions | 1,680 | 179 | 1,969 | | 319 | 17 | 4,163 |
Other liabilities | 40,255 | 1,806 | 16,683 | 1 | 20,179 | (4,318) | 74,606 |
Total liabilities | 586,628 | 275,611 | 168,411 | 4 | 140,023 | (284,664) | 886,013 |
Equity attributable to UBS AG shareholders | 58,423 | 10,997 | 18,243 | 4 | 12,296 | (44,714) | 55,248 |
Equity attributable to preferred noteholders | 1,954 | 0 | 0 | 1,302 | 0 | (1,302) | 1,954 |
Equity attributable to non-controlling interests | 0 | 0 | 0 | 0 | 41 | 0 | 41 |
Total equity | 60,378 | 10,997 | 18,243 | 1,306 | 12,336 | (46,016) | 57,243 |
Total liabilities and equity | 647,006 | 286,608 | 186,654 | 1,310 | 152,359 | (330,680) | 943,256 |
1 Amounts presented for UBS AG (standalone) and UBS Switzerland AG (standalone) represent IFRS-standalone information. Refer to the UBS AG standalone and UBS Switzerland AG standalone financial statements for information prepared in accordance with Swiss GAAP. 2 Amounts presented in these columns serve as a basis for preparing UBS AG (consolidated) financial statements in accordance with IFRS. |
Note 39 Supplemental guarantor information required under SEC regulations (continued)
Supplemental guarantor consolidated statement of cash flows |
CHF million | UBS AG¹ | UBS Switzerland AG¹ | UBS Americas Inc.¹ | Other subsidiaries¹ | UBS AG (consolidated) |
For the year ended 31 December 2015 |
Net cash flow from / (used in) operating activities | (1,457) | 2,681 | (525) | 1,298 | 1,997 |
Cash flow from / (used in) investing activities | | | | | |
Purchase of subsidiaries, associates and intangible assets | (12) | 0 | (1) | 0 | (13) |
Disposal of subsidiaries, associates and intangible assets² | 464 | 0 | 13 | 0 | 477 |
Purchase of property, equipment and software | (1,423) | (5) | (299) | (114) | (1,841) |
Disposal of property, equipment and software | 503 | 0 | 9 | 35 | 547 |
Net (investment in) / divestment of financial investments available-for-sale | (15,144) | 3,815 | 230 | 3,494 | (7,605) |
Net cash flow from / (used in) investing activities | (15,613) | 3,810 | (47) | 3,415 | (8,434) |
Cash flow from / (used in) financing activities | | | | | |
Net short-term debt issued / (repaid) | (5,603) | 24 | (826) | 0 | (6,404) |
Distributions paid on UBS AG shares | (2,626) | 0 | 0 | 0 | (2,626) |
Issuance of long-term debt, including financial liabilities designated at fair value | 46,882 | 772 | 7 | 129 | 47,790 |
Repayment of long-term debt, including financial liabilities designated at fair value | (42,415) | (402) | (129) | (1,274) | (44,221) |
Dividends paid and repayments of preferred notes | (108) | 0 | 0 | 0 | (108) |
Net changes of non-controlling interests | 0 | 0 | 0 | (5) | (5) |
Net activity related to group internal capital transactions and dividends³ | (30,512) | 33,293 | (114) | (2,666) | 0 |
Net cash flow from / (used in) financing activities | (34,382) | 33,687 | (1,062) | (3,817) | (5,573) |
Effects of exchange rate differences on cash and cash equivalents | (1,309) | 67 | (241) | (259) | (1,742) |
Net increase / (decrease) in cash and cash equivalents | (52,760) | 40,246 | (1,875) | 638 | (13,753) |
Cash and cash equivalents at the beginning of the year | 100,662 | 0 | 8,960 | 7,093 | 116,715 |
Cash and cash equivalents at the end of the year | 47,902 | 40,246 | 7,084 | 7,731 | 102,962 |
Cash and cash equivalents comprise:³ | | | | | |
Cash and balances with central banks | 45,125 | 38,701 | 4,971 | 2,509 | 91,306 |
Due from banks | 2,072 | 1,438 | 2,009 | 5,213 | 10,732 |
Money market paper⁴ | 704 | 107 | 104 | 9 | 924 |
Total | 47,902 | 40,246 | 7,084 | 7,731 | 102,962⁵ |
1 Cash flows generally represent a third-party view from a UBS AG (consolidated) perspective. As a consequence, the non-consolidated UBS Preferred Funding Trusts IV and V are not presented in this table. For the year ended 31 December 2015, these trusts had cash inflows of CHF 77 million from operating activities and an equivalent cash outflow for dividends paid to preferred note holders. 2 Includes dividends received from associates. 3 Includes a transfer of cash and cash equivalents from UBS AG to UBS Switzerland AG of CHF 33,283 million. Refer to "Establishment of UBS Switzerland AG" in the "Legal entity financial and regulatory information" section of this report for more information on the business transfer from UBS AG to UBS Switzerland AG. 4 Money market paper is included in the balance sheet under Trading portfolio assets and Financial investments available-for-sale. 5 CHF 3,963 million of cash and cash equivalents were restricted. |
Consolidated financial statements
Notes to the UBS AG consolidated financial statements
Note 39 Supplemental guarantor information required under SEC regulations (continued)
Supplemental guarantor consolidated income statement |
CHF million | UBS AG (standalone)¹ | UBS Americas Inc.² | Other subsidiaries² | Elimination entries | UBS AG (consolidated) |
For the year ended 31 December 2014 |
Operating income | | | | | |
Interest income | 11,585 | 1,591 | 1,160 | (1,143) | 13,194 |
Interest expense | (6,287) | (597) | (898) | 1,143 | (6,639) |
Net interest income | 5,298 | 995 | 262 | 0 | 6,555 |
Credit loss (expense) / recovery | (108) | 9 | 9 | 13 | (78) |
Net interest income after credit loss expense | 5,190 | 1,003 | 270 | 13 | 6,477 |
Net fee and commission income | 6,111 | 7,288 | 3,799 | (122) | 17,076 |
Net trading income | 2,750 | 438 | 237 | 416 | 3,841 |
Other income | 5,584 | 95 | (46) | (5,002) | 632 |
Total operating income | 19,636 | 8,825 | 4,261 | (4,695) | 28,026 |
Operating expenses | | | | | |
Personnel expenses | 7,991 | 5,806 | 1,483 | 0 | 15,280 |
General and administrative expenses | 5,621 | 2,415 | 1,341 | 0 | 9,377 |
Depreciation and impairment of property, equipment and software | 595 | 139 | 83 | 0 | 817 |
Amortization and impairment of intangible assets | 7 | 59 | 16 | 0 | 83 |
Total operating expenses | 14,214 | 8,420 | 2,922 | 0 | 25,557 |
Operating profit / (loss) before tax | 5,421 | 404 | 1,339 | (4,695) | 2,469 |
Tax expense / (benefit) | 949 | (2,375) | 248 | (2) | (1,180) |
Net profit / (loss) | 4,472 | 2,779 | 1,091 | (4,693) | 3,649 |
Net profit / (loss) attributable to preferred noteholders | 142 | 0 | 0 | 0 | 142 |
Net profit / (loss) attributable to non-controlling interests | 0 | 0 | 5 | 0 | 5 |
Net profit / (loss) attributable to UBS AG shareholders | 4,330 | 2,779 | 1,086 | (4,693) | 3,502 |
1 Amounts presented for UBS AG (standalone) represent IFRS-standalone information. Refer to the UBS AG standalone financial statements for information prepared in accordance with Swiss GAAP. 2 Amounts presented in these columns serve as a basis for preparing UBS AG (consolidated) financial statements in accordance with IFRS. |
Note 39 Supplemental guarantor information required under SEC regulations (continued)
Supplemental guarantor consolidated statement of comprehensive income |
CHF million | UBS AG (standalone)¹ | UBS Americas Inc.² | Other subsidiaries² | Elimination entries | UBS AG (consolidated) |
For the year ended 31 December 2014 |
| | | | | |
Comprehensive income attributable to UBS AG shareholders | | | | | |
Net profit / (loss) | 4,330 | 2,779 | 1,086 | (4,693) | 3,502 |
| | | | | |
Other comprehensive income | | | | | |
Other comprehensive income that may be reclassified to the income statement | | | | | |
Foreign currency translation, net of tax | 325 | 928 | 1,500 | (920) | 1,834 |
Financial investments available-for-sale, net of tax | 32 | 78 | 37 | (6) | 140 |
Cash flow hedges, net of tax | 693 | 0 | 0 | 0 | 693 |
Total other comprehensive income that may be reclassified to the income statement, net of tax | 1,050 | 1,006 | 1,537 | (926) | 2,667 |
| | | | | |
Other comprehensive income that will not be reclassified to the income statement | | | | | |
Defined benefit plans, net of tax | (999) | (167) | (56) | 14 | (1,208) |
Property revaluation surplus, net of tax | 0 | 0 | 0 | 0 | 0 |
Total other comprehensive income that will not be reclassified to the income statement, net of tax | (999) | (167) | (56) | 14 | (1,208) |
Total other comprehensive income | 51 | 838 | 1,481 | (912) | 1,459 |
Total comprehensive income attributable to UBS AG shareholders | 4,381 | 3,617 | 2,567 | (5,605) | 4,961 |
| | | | | |
Total comprehensive income attributable to preferred noteholders | 260 | 0 | 0 | 0 | 260 |
Total comprehensive income attributable to non-controlling interests | 0 | 0 | 7 | 0 | 7 |
Total comprehensive income | 4,641 | 3,617 | 2,575 | (5,605) | 5,229 |
1 Amounts presented for UBS AG (standalone) represents IFRS-standalone information. Refer to the UBS AG (standalone) audited financial statements for information prepared in accordance with Swiss GAAP. 2 Amounts presented in these columns serve as a basis for preparing UBS AG consolidated Financial Statements in accordance with IFRS. |
Consolidated financial statements
Notes to the UBS AG consolidated financial statements
Note 39 Supplemental guarantor information required under SEC regulations (continued)
Supplemental guarantor consolidated balance sheet |
CHF million | UBS AG (standalone)¹ | UBS Americas Inc.² | Other subsidiaries² | Elimination entries | UBS AG (consolidated) |
As of 31 December 2014 |
Assets | | | | | |
Cash and balances with central banks | 95,711 | 6,440 | 1,923 | 0 | 104,073 |
Due from banks | 32,448 | 7,099 | 52,637 | (78,850) | 13,334 |
Cash collateral on securities borrowed | 33,676 | 36,033 | 5,181 | (50,827) | 24,063 |
Reverse repurchase agreements | 64,496 | 24,417 | 30,328 | (50,827) | 68,414 |
Trading portfolio assets | 101,922 | 6,697 | 34,479 | (4,943) | 138,156 |
of which: assets pledged as collateral which may be sold or repledged by counterparties | 51,476 | 3,310 | 6,969 | (5,737) | 56,018 |
Positive replacement values | 262,073 | 19,597 | 51,327 | (76,020) | 256,978 |
Cash collateral receivables on derivative instruments | 25,501 | 5,503 | 14,487 | (14,512) | 30,979 |
Financial assets designated at fair value | 4,691 | 481 | 2,882 | (3,562) | 4,493 |
Loans | 299,032 | 43,566 | 16,553 | (43,168) | 315,984 |
Financial investments available-for-sale | 42,580 | 5,403 | 9,175 | 0 | 57,159 |
Investments in subsidiaries and associates | 27,163 | 2 | 1 | (26,239) | 927 |
Property, equipment and software | 5,792 | 823 | 238 | 0 | 6,854 |
Goodwill and intangible assets | 354 | 5,381 | 1,051 | 0 | 6,785 |
Deferred tax assets | 4,290 | 6,479 | 349 | (57) | 11,060 |
Other assets | 14,649 | 9,021 | 2,256 | (2,857) | 23,069 |
Total assets | 1,014,379 | 176,942 | 222,867 | (351,860) | 1,062,327 |
Liabilities | | | | | |
Due to banks | 38,461 | 38,269 | 12,611 | (78,850) | 10,492 |
Cash collateral on securities lent | 33,284 | 22,961 | 3,761 | (50,827) | 9,180 |
Repurchase agreements | 22,087 | 12,548 | 28,010 | (50,827) | 11,818 |
Trading portfolio liabilities | 18,936 | 4,856 | 8,234 | (4,068) | 27,958 |
Negative replacement values | 258,680 | 19,448 | 51,993 | (76,020) | 254,101 |
Cash collateral payables on derivative instruments | 32,106 | 5,926 | 18,852 | (14,512) | 42,372 |
Financial liabilities designated at fair value | 73,857 | 130 | 5,598 | (4,288) | 75,297 |
Due to customers | 362,564 | 48,236 | 43,474 | (43,294) | 410,979 |
Debt issued | 86,894 | 157 | 4,312 | (156) | 91,207 |
Provisions | 2,725 | 1,268 | 372 | 0 | 4,366 |
Other liabilities | 33,699 | 17,615 | 21,985 | (2,907) | 70,392 |
Total liabilities | 963,293 | 171,415 | 199,201 | (325,748) | 1,008,162 |
Equity attributable to UBS AG shareholders | 49,073 | 5,527 | 23,621 | (26,113) | 52,108 |
Equity attributable to preferred noteholders | 2,013 | 0 | 0 | 0 | 2,013 |
Equity attributable to non-controlling interests | 0 | 0 | 45 | 0 | 45 |
Total equity | 51,085 | 5,527 | 23,666 | (26,113) | 54,165 |
Total liabilities and equity | 1,014,379 | 176,942 | 222,867 | (351,860) | 1,062,327 |
1 Amounts presented for UBS AG (standalone) represents IFRS-standalone information. Refer to the UBS AG (standalone) audited financial statements for information prepared in accordance with Swiss GAAP. 2 Amounts presented in these columns serve as a basis for preparing UBS AG consolidated Financial Statements in accordance with IFRS. |
Note 39 Supplemental guarantor information required under SEC regulations (continued)
Supplemental guarantor consolidated statement of cash flows |
CHF million | UBS AG¹ | UBS Americas Inc.¹ | Other subsidiaries¹ | UBS AG (consolidated) |
For the year ended 31 December 2014 |
Net cash flow from / (used in) operating activities | 7,438 | (1,814) | 1,608 | 7,231 |
Cash flow from / (used in) investing activities | | | | |
Purchase of subsidiaries, associates and intangible assets | (18) | 0 | 0 | (18) |
Disposal of subsidiaries, associates and intangible assets² | 41 | 9 | 20 | 70 |
Purchase of property, equipment and software | (1,521) | (300) | (94) | (1,915) |
Disposal of property, equipment and software | 313 | 14 | 23 | 350 |
Net (investment in) / divestment of financial investments available-for-sale | 7,774 | (568) | (3,098) | 4,108 |
Net cash flow from / (used in) investing activities | 6,589 | (845) | (3,149) | 2,596 |
Cash flow from / (used in) financing activities | | | | |
Net short-term debt issued / (repaid) | (3,984) | 0 | 1,064 | (2,921) |
Net movements in treasury shares and own equity derivative activity | (719) | 0 | 0 | (719) |
Distributions paid on UBS AG shares | (938) | 0 | 0 | (938) |
Issuance of long-term debt, including financial liabilities designated at fair value | 40,272 | 24 | 686 | 40,982 |
Repayment of long-term debt, including financial liabilities designated at fair value | (32,083) | (494) | (1,632) | (34,210) |
Dividends paid and repayments of preferred notes | (110) | 0 | 0 | (110) |
Net changes of non-controlling interests | 0 | 0 | (3) | (3) |
Net activity related to group internal capital transactions and dividends | (319) | 0 | 319 | 0 |
Net cash flow from / (used in) financing activities | 2,118 | (470) | 434 | 2,081 |
Effects of exchange rate differences on cash and cash equivalents | 7,394 | 840 | 289 | 8,522 |
Net increase / (decrease) in cash and cash equivalents | 23,539 | (2,289) | (819) | 20,430 |
Cash and cash equivalents at the beginning of the year | 77,123 | 11,249 | 7,911 | 96,284 |
Cash and cash equivalents at the end of the year | 100,662 | 8,960 | 7,093 | 116,715 |
Cash and cash equivalents comprise: | | | | |
Cash and balances with central banks | 95,711 | 6,440 | 1,923 | 104,073 |
Due from banks | 4,119 | 2,489 | 5,164 | 11,772 |
Money market paper³ | 832 | 31 | 6 | 869 |
Total | 100,662 | 8,960 | 7,093 | 116,715⁴ |
1 Cash flow generally represent a third-party view from a UBS AG (consolidated) perspective. 2 Includes dividends received from associates. 3 Money market paper is included in the balance sheet under Trading portfolio assets and Financial investments available-for-sale. 4 CHF 4,178 million of cash and cash equivalents were restricted. |
Consolidated financial statements
Notes to the UBS AG consolidated financial statements
Note 39 Supplemental guarantor information required under SEC regulations (continued)
Supplemental guarantor consolidated income statement |
CHF million | UBS AG (standalone)¹ | UBS Americas Inc.² | Other subsidiaries² | Elimination entries | UBS AG (consolidated) |
For the year ended 31 December 2013 |
Operating income | | | | | |
Interest income | 11,308 | 1,984 | 1,204 | (1,359) | 13,137 |
Interest expense | (7,093) | (695) | (930) | 1,366 | (7,351) |
Net interest income | 4,215 | 1,290 | 275 | 6 | 5,786 |
Credit loss (expense) / recovery | (19) | (33) | (3) | 5 | (50) |
Net interest income after credit loss expense | 4,196 | 1,257 | 271 | 11 | 5,736 |
Net fee and commission income | 6,430 | 6,781 | 3,079 | (4) | 16,287 |
Net trading income | 4,922 | 379 | 159 | (329) | 5,130 |
Other income | 499 | 416 | (909) | 574 | 580 |
Total operating income | 16,046 | 8,833 | 2,600 | 252 | 27,732 |
Operating expenses | | | | | |
Personnel expenses | 8,099 | 5,584 | 1,499 | 0 | 15,182 |
General and administrative expenses | 3,959 | 3,364 | 1,058 | 0 | 8,380 |
Depreciation and impairment of property, equipment and software | 575 | 133 | 107 | 0 | 816 |
Amortization and impairment of intangible assets | 6 | 60 | 17 | 0 | 83 |
Total operating expenses | 12,639 | 9,141 | 2,681 | 0 | 24,461 |
Operating profit / (loss) before tax | 3,408 | (307) | (81) | 252 | 3,272 |
Tax expense / (benefit) | 570 | (937) | 261 | (3) | (110) |
Net profit / (loss) | 2,837 | 630 | (342) | 256 | 3,381 |
Net profit / (loss) attributable to preferred noteholders | 204 | 0 | 0 | 0 | 204 |
Net profit / (loss) attributable to non-controlling interests | 0 | 0 | 5 | 0 | 5 |
Net profit / (loss) attributable to UBS AG shareholders | 2,634 | 630 | (347) | 256 | 3,172 |
1 Amounts presented for UBS AG (standalone) represent IFRS-standalone information. Refer to the UBS AG standalone financial statements for information prepared in accordance with Swiss GAAP. 2 Amounts presented in these columns serve as a basis for preparing UBS AG (consolidated) financial statements in accordance with IFRS. |
Note 39 Supplemental guarantor information required under SEC regulations (continued)
Supplemental guarantor consolidated statement of comprehensive income |
CHF million | UBS AG (standalone)¹ | UBS Americas Inc.² | Other subsidiaries² | Elimination entries | UBS AG (consolidated) |
For the year ended 31 December 2013 |
| | | | | |
Comprehensive income attributable to UBS AG shareholders | | | | | |
Net profit / (loss) | 2,634 | 630 | (347) | 256 | 3,172 |
| | | | | |
Other comprehensive income | | | | | |
Other comprehensive income that may be reclassified to the income statement | | | | | |
Foreign currency translation, net of tax | 392 | (348) | (311) | (204) | (471) |
Financial investments available-for-sale, net of tax | 17 | (163) | (16) | 8 | (154) |
Cash flow hedges, net of tax | (1,520) | 0 | 0 | 0 | (1,520) |
Total other comprehensive income that may be reclassified to the income statement, net of tax | (1,112) | (510) | (327) | (196) | (2,145) |
| | | | | |
Other comprehensive income that will not be reclassified to the income statement | | | | | |
Defined benefit plans, net of tax | 824 | 110 | 6 | 0 | 939 |
Property revaluation surplus, net of tax | (6) | 0 | 0 | 0 | (6) |
Total other comprehensive income that will not be reclassified to the income statement, net of tax | 818 | 110 | 6 | 0 | 933 |
Total other comprehensive income | (294) | (401) | (321) | (196) | (1,211) |
Total comprehensive income attributable to UBS AG shareholders | 2,340 | 229 | (668) | 60 | 1,961 |
| | | | | |
Total comprehensive income attributable to preferred noteholders | 559 | 0 | 0 | 0 | 559 |
Total comprehensive income attributable to non-controlling interests | 0 | 0 | 4 | 0 | 4 |
Total comprehensive income | 2,899 | 229 | (664) | 60 | 2,524 |
1 Amounts presented for UBS AG (standalone) represents IFRS-standalone information. Refer to the UBS AG (standalone) audited financial statements for information prepared in accordance with Swiss GAAP. 2 Amounts presented in these columns serve as a basis for preparing UBS AG consolidated Financial Statements in accordance with IFRS. |
Consolidated financial statements
Notes to the UBS AG consolidated financial statements
Note 39 Supplemental guarantor information required under SEC regulations (continued)
Supplemental guarantor consolidated statement of cash flows |
CHF million | UBS AG¹ | UBS Americas Inc.¹ | Other subsidiaries¹ | UBS AG (consolidated) |
For the year ended 31 December 2013 |
Net cash flow from / (used in) operating activities | 58,756 | (8,311) | 3,929 | 54,374 |
Cash flow from / (used in) investing activities | | | | |
Purchase of subsidiaries, associates and intangible assets | (49) | 0 | 0 | (49) |
Disposal of subsidiaries, associates and intangible assets² | 136 | 0 | 0 | 136 |
Purchase of property, equipment and software | (1,032) | (160) | (44) | (1,236) |
Disposal of property, equipment and software | 545 | 5 | 91 | 639 |
Net (investment in) / divestment of financial investments available-for-sale | 751 | 6,076 | (861) | 5,966 |
Net cash flow from / (used in) investing activities | 351 | 5,922 | (815) | 5,457 |
Cash flow from / (used in) financing activities | | | | |
Net short-term debt issued / (repaid) | (1,400) | 0 | (2,890) | (4,290) |
Net movements in treasury shares and own equity derivative activity | (341) | 0 | 0 | (341) |
Capital issuance | 1 | 0 | 0 | 1 |
Distributions paid on UBS AG shares | (564) | 0 | 0 | (564) |
Issuance of long-term debt, including financial liabilities designated at fair value | 27,442 | 59 | 513 | 28,014 |
Repayment of long-term debt, including financial liabilities designated at fair value | (65,112) | (486) | (3,356) | (68,954) |
Dividends paid and repayments of preferred notes | (1,415) | 0 | 0 | (1,415) |
Net changes of non-controlling interests | 0 | 0 | (6) | (6) |
Net activity related to group internal capital transactions and dividends | 12 | 23 | (35) | 0 |
Net cash flow from / (used in) financing activities | (41,377) | (405) | (5,774) | (47,555) |
Effects of exchange rate differences on cash and cash equivalents | (2,329) | (203) | (174) | (2,705) |
Net increase / (decrease) in cash and cash equivalents | 15,400 | (2,998) | (2,834) | 9,569 |
Cash and cash equivalents at the beginning of the year | 61,723 | 14,247 | 10,745 | 86,715 |
Cash and cash equivalents at the end of the year | 77,123 | 11,249 | 7,911 | 96,284 |
Cash and cash equivalents comprise: | | | | |
Cash and balances with central banks | 69,808 | 8,893 | 2,178 | 80,879 |
Due from banks | 3,091 | 2,327 | 5,699 | 11,117 |
Money market paper³ | 4,224 | 28 | 35 | 4,288 |
Total | 77,123 | 11,249 | 7,911 | 96,284⁴ |
1 Cash flow generally represent a third-party view from a UBS AG (consolidated) perspective. 2 Includes dividends received from associates. 3 Money market paper is included in the balance sheet under Trading portfolio assets and Financial investments available-for-sale. 4 CHF 4,534 million of cash and cash equivalents were restricted. |
▲
Legal entity financial and regulatory information
Legal entity financial and regulatory information
Table of contents
Legal entity financial and regulatory information
Introduction
This section of the Annual Report includes select financial and regulatory information for UBS Group AG, the holding company of the UBS Group, and those legal entities within the UBS Group that are considered by the Swiss Financial Market Supervisory Authority (FINMA) to be significant for Pillar 3 reporting purposes and consists of:
UBS Group AG
Audited 2015 standalone financial statements prepared in accordance with the principles of the Swiss Law on Accounting and Financial Reporting (32nd title of the Swiss Code of Obligations).
Establishment of UBS Switzerland AG
Transition disclosures including pre- and post-transfer balance sheets for UBS AG and UBS Switzerland AG.
UBS AG
– Audited 2015 standalone financial statements prepared in accordance with Swiss GAAP (FINMA Circular 2015 / 1 and the Banking Ordinance); and
– Standalone regulatory disclosures in accordance with FINMA Circular 2008 / 22 “Disclosure – banks.”
UBS Switzerland AG
– Audited 2015 standalone financial statements prepared in accordance with Swiss GAAP (FINMA Circular 2015 / 1 and the Banking Ordinance); and
– Standalone regulatory disclosures in accordance with FINMA Circular 2008 / 22 “Disclosure – banks.”
The financial statements of UBS Group AG, UBS AG and UBS Switzerland AG have been audited by Ernst & Young Ltd.
UBS Limited
Select standalone financial information and standalone regulatory information in accordance with FINMA Circular 2008 / 22 “Disclosure – banks.”
Other legal entity-specific disclosures
In addition to legal entity disclosures provided within this Annual Report, UBS provides further legal entity-specific disclosures, including disclosures in accordance with Article 89 of the European Union Capital Requirements Directive IV (CRD IV), in “Subsidiary and branch information” at www.ubs.com/investors.
Under CRD IV, UBS is required to provide certain disclosures (such as nature of activities, location, turnover, number of employees, and profit or loss before tax), on an annual basis by Member State and by third country in which it has an establishment. UBS subsidiaries domiciled in Luxembourg, France, Germany, Italy, Monaco, The Netherlands, Spain and the UK are in scope of this requirement.
® Refer to “Subsidiary and branch information” at www.ubs.com/investors for more information
All references to 2015 and 2014 refer to the financial years ended 31 December 2015 and 2014, respectively.
UBS Group AG standalone financial statements
Audited |
Income statement | | | | | | | |
| | | | For the year ended | For the period ended | | % change from |
CHF million | | Note | | 31.12.15 | 31.12.14 | | 31.12.14 |
Dividend income from the investment in UBS AG | | | | 2,869 | 0 | | |
Other operating income | | 3 | | 49 | 8 | | 551 |
Financial income | | 4 | | 294 | 0 | | |
Operating income | | | | 3,213 | 8 | | |
Personnel expenses | | 5 | | 9 | 0 | | |
Other operating expenses | | 6 | | 171 | 10 | | |
Financial expenses | | 7 | | 267 | 7 | | |
Operating expenses | | | | 447 | 17 | | |
Profit / (loss) before income taxes | | | | 2,765 | (10) | | |
Tax expense / (benefit) | | | | 9 | 0 | | |
Net profit / (loss) for the period | | | | 2,756 | (10) | | |
UBS Group AG was incorporated on 10 June 2014. The Income statement and corresponding Notes presented for the period ended on 31 December 2014 include income and expenses for the period from 10 June to 31 December 2014 only.
Legal entity financial and regulatory information
UBS Group AG standalone financial statements
Balance sheet |
| | | | | | | | % change from |
CHF million | | Note | | 31.12.15 | | 31.12.14 | | 31.12.14 |
| | | | | | | | |
Assets | | | | | | | | |
Liquid assets | | 8 | | 1,442 | | 742 | | 94 |
Marketable securities | | 9 | | 85 | | 113 | | (25) |
Other short-term receivables | | 10 | | 632 | | 511 | | 24 |
Accrued income and prepaid expenses | | 11 | | 264 | | 91 | | 190 |
Total current assets | | | | 2,422 | | 1,457 | | 66 |
Investments in subsidiaries | | 12 | | 40,431 | | 38,691 | | 4 |
of which: Investment in UBS AG | | | | 40,376 | | 38,691 | | 4 |
Financial assets | | 13 | | 5,475 | | 320 | | |
Prepaid assets | | | | 54 | | 64 | | (16) |
Total non-current assets | | | | 45,959 | | 39,074 | | 18 |
Total assets | | | | 48,381 | | 40,531 | | 19 |
of which: amounts due from subsidiaries | | | | 7,503 | | 1,239 | | 505 |
| | | | | | | | |
Liabilities | | | | | | | | |
Current interest-bearing liabilities | | | | 736 | | 227 | | 224 |
Accrued expenses and deferred income | | 14 | | 1,006 | | 838 | | 20 |
Total short-term liabilities | | | | 1,741 | | 1,065 | | 64 |
Long-term interest-bearing liabilities | | 15 | | 5,106 | | 0 | | |
Compensation-related long-term liabilities | | 16 | | 3,119 | | 2,313 | | 35 |
Total long-term liabilities | | | | 8,225 | | 2,313 | | 256 |
Total liabilities | | | | 9,966 | | 3,377 | | 195 |
of which: amounts due to subsidiaries | | | | 750 | | 227 | | 230 |
| | | | | | | | |
Equity | | | | | | | | |
Share capital | | 17 | | 385 | | 372 | | 4 |
General reserves | | | | 37,006 | | 38,321 | | (3) |
of which: statutory capital reserve | | | | 37,006 | | 38,321 | | (3) |
of which: capital contribution reserve | | | | 38,035 | | 39,428 | | (4) |
of which: other capital reserve | | | | (1,029) | | (1,107) | | (7) |
Voluntary earnings reserve | | | | (10) | | 0 | | |
Treasury shares | | 18 | | (1,724) | | (1,529) | | 13 |
Reserve for own shares held by subsidiaries | | | | 1 | | 0 | | |
Net profit / (loss) for the period | | | | 2,756 | | (10) | | |
Equity attributable to shareholders | | | | 38,415 | | 37,154 | | 3 |
Total liabilities and equity | | | | 48,381 | | 40,531 | | 19 |
Statement of appropriation of retained earnings and proposed dividend distribution out of capital contribution reserve
The Board of Directors proposes that the Annual General Meeting of Shareholders (AGM) on 10 May 2016 approves the following appropriation of retained earnings.
Proposed appropriation of retained earnings
| For the year ended |
CHF million | 31.12.15 |
Net profit for the period | 2,756 |
Retained earnings carried forward | 0 |
Total retained earnings available for appropriation | 2,756 |
| |
Proposed appropriation of retained earnings | |
Appropriation to other capital reserve | (1,029) |
Appropriation to voluntary earnings reserve | (1,727) |
Retained earnings carried forward | 0 |
Proposed dividend distribution out of capital contribution reserve
The Board of Directors proposes that the Annual General Meeting of Shareholders (AGM) on 10 May 2016 approves an ordinary dividend distribution of CHF 0.60 in cash per share of CHF 0.10 par value and a special dividend distribution of CHF 0.25 in cash per share of CHF 0.10 par value payable out of the capital contribution reserve. Provided that the proposed dividend distribution out of the capital contribution reserve is approved, the total payment of CHF 0.85 per share would be made on 17 May 2016 to holders of shares on the record date 13 May 2016. The shares will be traded ex-dividend as of 12 May 2016 and, accordingly, the last day on which the shares may be traded with entitlement to receive the dividend will be 11 May 2016.
CHF million, except where indicated | 31.12.15 |
Total statutory capital reserve: capital contribution reserve before proposed distribution¹˒² | 38,035 |
Proposed ordinary distribution of capital contribution reserve within statutory capital reserve: CHF 0.60 per dividend-bearing share³ | (2,310) |
Proposed special distribution of capital contribution reserve within statutory capital reserve: CHF 0.25 per dividend-bearing share³ | (962) |
Total statutory capital reserve: capital contribution reserve after proposed distribution | 34,763 |
1 The capital contribution reserve of CHF 38,035 million is a component of the statutory capital reserve of CHF 37,006 million after taking into account the negative other capital reserve of CHF 1,029 million. 2 The Swiss Federal tax authorities confirmed that UBS Group AG would be able to repay to shareholders a maximum amount of CHF 25.6 billion of the disclosed capital contribution reserve (status as of 31 December 2014) without being subject to the withholding tax deduction that applies to dividends paid out of retained earnings. This assessment reflects the qualification of the capital contribution reserve of UBS AG as a consequence of the reorganization implemented by the share-for-share exchange. The amount decreased to CHF 22.9 billion as of 31 December 2015 subsequent to distributions in 2015. 3 Dividend-bearing shares are all shares issued except for treasury shares held by UBS Group AG as of the record date. The CHF 2,310 million and CHF 962 million presented are based on the total number of shares issued as of 31 December 2015. |
Legal entity financial and regulatory information
Notes to the UBS Group AG standalone financial statements
Notes to the UBS Group AG standalone financial statements
Note 1 Corporate information
UBS Group AG is incorporated and domiciled in Switzerland and its registered office is at Bahnhofstrasse 45, CH-8001 Zurich, Switzerland. UBS Group AG operates under the Swiss Code of Obligations as a stock corporation (Aktiengesellschaft), a corporation that has issued shares of common stock to investors.
UBS Group AG is the ultimate holding company of the UBS Group, the grantor of the majority of UBS’s deferred compensation plans and also issues long-term capital instruments.
Establishment of UBS Group AG
UBS Group AG was incorporated on 10 June 2014 as a wholly-owned subsidiary of UBS AG. On 29 September 2014, UBS Group AG launched an offer to acquire all issued ordinary shares of UBS AG in exchange for registered shares of UBS Group AG on a one-for-one basis. On 28 November 2014, the first settlement of the exchange offer was completed and UBS Group AG became the holding company of UBS Group and the parent company of UBS AG. Following the exchange offer and subsequent private exchanges on a one-for-one basis with various shareholders and banks in Switzerland and elsewhere outside the United States, UBS Group AG acquired 96.68% of UBS AG shares by 31 December 2014.
In March 2015, UBS Group AG initiated a procedure under article 33 of the Swiss Stock Exchange Act (SESTA procedure). Upon the successful completion of the SESTA procedure in August 2015, all UBS AG shares that had remained publicly held were canceled and UBS Group AG shares were delivered as compensation. As a result, UBS Group AG now owns 100% of the issued shares of UBS AG. UBS AG shares traded on 27 August 2015 for the last time on the SIX Swiss Exchange.
Transfer of deferred compensation plans
As part of the Group reorganization in 2014, UBS Group AG assumed obligations of UBS AG as grantor in connection with certain outstanding awards under employee share, option, notional fund and deferred cash compensation plans. At the same time, UBS Group AG acquired the beneficial ownership of the financial assets and 90.5 million treasury shares of UBS Group AG held to hedge the economic exposure arising from these plans. As a result of the transfer, UBS Group AG assumed all responsibilities and rights associated with the grantor role for the plans from UBS AG, including the right of recharge to its subsidiaries employing the personnel.
Obligations relating to deferred compensation plans which are required to be, and have been, granted by employing and / or sponsoring subsidiaries have not been assumed by UBS Group AG and will continue on this basis. Furthermore, obligations related to other compensation awards, such as defined benefit pension plans and other local awards, have not been assumed by UBS Group AG and are retained by the relevant employing and / or sponsoring subsidiaries.
Establishment of UBS Business Solutions AG
In 2015, UBS Business Solutions AG was established as a direct subsidiary of UBS Group AG. Its purpose is to act as the Group service company. As part of the establishment of UBS Business Solutions AG, UBS AG paid a cash dividend of CHF 30 million and transferred its participation in the Poland Service Center (PSC) as a dividend-in-kind at book value of CHF 5 million to UBS Group AG. UBS Group AG then contributed CHF 30 million and the participation in the PSC at book value into UBS Business Solutions AG.
Further, during 2015, UBS Business Solutions AG purchased UBS Corporate Management (Shanghai) Co. Ltd from UBS AG for CHF 4 million in cash consideration.
UBS Business Solutions (India) Private Limited was incorporated on 18 November 2015 as a direct subsidiary of UBS Business Solutions AG.
Issuance of additional tier 1 capital instruments
During 2015, UBS Group AG issued perpetual capital notes, which qualify as Basel III additional tier 1 (AT1) capital on a consolidated UBS Group basis. The issuances consisted of: i) EUR 1.0 billion, low-trigger loss-absorbing capital notes with a fixed-rate initial coupon of 5.75% and an optional first call date in 7 years, ii) USD 1.25 billion high-trigger loss-absorbing capital notes with a fixed-rate initial coupon of 7.125% and an optional first call date in 5 years, iii) USD 1.25 billion low-trigger loss-absorbing capital notes with a fixed-rate initial coupon of 7% and an optional first call date in 10 years, iv) USD 1.575 billion high-trigger loss-absorbing capital notes with a fixed-rate initial coupon of 6.875% and an optional first call date in 10 years.
Furthermore, UBS Group AG granted deferred contingent capital plan (DCCP) awards to UBS Group employees during 2015. These DCCP awards also qualify as Basel III AT1 capital on a consolidated UBS Group basis.
As of 31 December 2015, UBS Group AG's distributable items for the purpose of additional tier 1 capital instruments were CHF 38.0 billion. For this purpose, distributable items are defined in the terms and conditions of the relevant instruments as the aggregate of (i) net profits carried forward and (ii) freely distributable reserves, in each case, less any amounts that must be contributed to legal reserves under applicable law.
Note 2 Accounting policies
The UBS Group AG standalone financial statements are prepared in accordance with the principles of the Swiss Law on Accounting and Financial Reporting (32nd title of the Swiss Code of Obligations).
The functional currency of UBS Group AG is the Swiss franc. The significant accounting and valuation principles applied are described below.
Foreign currency translation
Transactions denominated in foreign currency are translated into Swiss francs at the spot exchange rate on the date of the transaction. At the balance sheet date, all current assets and short-term liabilities as well as Financial assets measured at fair value, which are denominated in a foreign currency, are translated into Swiss francs using the closing exchange rate. For other non-current assets and long-term liabilities, where the asset mirrors the terms of a corresponding liability or the asset and liability otherwise form an economic hedge relationship, the asset and liability are treated as one unit of account for foreign currency translation purposes, with offsetting unrealized foreign currency translation gains and losses based on the closing exchange rate presented net in the income statement. Investments in subsidiaries measured at historic cost are translated at the exchange rate on the date of the transaction. All currency translation effects are recognized in the income statement.
The main currency translation rates used by UBS Group AG can be found in Note 36 to the consolidated financial statements.
Marketable securities
Marketable securities include investments in alternative investment vehicles (AIVs) with a short-term holding period. The holding period is deemed short-term if the vesting of the awards hedged by the AIV is within 12 months after the balance sheet date. These are equity instruments and are measured at fair value based on quoted market prices or other observable market prices as of the balance sheet date. Gains and losses resulting from fair value changes are recognized in Financial income and Financial expenses, respectively.
Financial assets
Financial assets include investments in AIVs with a long-term holding period. The holding period is deemed long-term if the vesting of the awards hedged by the AIV is more than 12 months after the balance sheet date. These are equity instruments and are measured at fair value based on their quoted market prices or other observable market prices as of the balance sheet date. Gains and losses resulting from fair value changes are recognized in Financial income and Financial expenses, respectively.
Investments in AIVs that have no quoted market price or no other observable market price are recognized as Financial assets and are measured at their acquisition cost adjusted for impairment losses.
Financial assets further include loans granted to UBS AG which substantially mirror the terms of additional tier 1 perpetual capital notes issued. The loans are measured at nominal value.
® Refer to Note 13 for more information
Investments in subsidiaries
Investments in subsidiaries are equity interests that are held to carry on the business of UBS Group or for other strategic purposes. They include all subsidiaries directly held by UBS Group AG through which UBS conducts its business on a global basis. The investments are measured individually and carried at cost less impairment.
® Refer to Note 2 to the consolidated financial statements for a description of businesses of the UBS Group
® Refer to Note 30 to the consolidated financial statements
Treasury shares
Treasury shares acquired by UBS Group AG are recognized at acquisition cost and are presented as a deduction from shareholders’ equity. Upon disposition or settlement of related share awards, the realized gain or loss is recognized through the income statement as Financial income and Financial expenses, respectively. For settlement of related share awards, the realized gains and losses on treasury shares represent the difference between the market price of the treasury shares at settlement and their acquisition cost.
For shares of UBS Group AG acquired by a direct or indirect subsidiary, a Reserve for own shares held by subsidiaries is generally created in UBS Group AG’s equity. However, where UBS AG or UBS Switzerland AG acquire shares of UBS Group AG and hold them in their trading portfolios, no Reserve for own shares held by subsidiaries is created.
® Refer to Note 18 for more information
Legal entity financial and regulatory information
Notes to the UBS Group AG standalone financial statements
Note 2 Accounting policies (continued)
Equity participation and other compensation plans
Transfer from UBS AG to UBS Group AG
The transfer of the deferred compensation plans and related hedging assets in 2014 was conducted on an arm’s length basis, with a step-up of the plan obligation to fair value. This step-up resulted in a net liability that was recorded in the standalone financial statements of UBS AG and transferred to UBS Group AG (net liability related to deferred compensation plan transfer) in 2014. The fair value of this net liability is taken into account in the income statement over the average vesting period (for share awards) or upon exercise / expiry (for option awards) as Other operating income. Upon exercise of option awards that are settled using conditional capital, the fair value of this net liability is recorded in the Statutory capital reserve within General reserves. The difference between the fair value of the hedging assets and the fair value of the obligations on the plans transferred was compensated for with a loan from UBS AG to UBS Group AG.
Equity participation plans
The grant date fair value of equity-settled share-based compensation awards granted to employees is generally recognized over the vesting period of the awards. Awards granted in the form of UBS Group AG shares, notional shares and performance shares are settled by delivering UBS Group AG shares at vesting and are recognized as Compensation-related long-term liabilities if vesting is more than 12 months after the balance sheet date or as Accrued expenses and deferred income if vesting is within 12 months from the balance sheet date. The amount recognized is adjusted for forfeiture assumptions, such that the amount ultimately recognized is based on the number of awards that meet the related service conditions at the vesting date. The grant date fair value is based on the UBS Group AG share price, taking into consideration post-vesting sale and hedge restrictions, non-vesting conditions and market conditions, where applicable.
Upon settlement of the share awards, any realized gain or loss is recognized in the income statement as Other operating income and Other operating expenses, respectively. Realized gains and losses on share awards represent the difference between the market price of the treasury shares at settlement and the grant date fair value of the share awards.
For certain awards, employees receive beneficial and legal ownership of the underlying UBS Group AG shares at the grant date (prepaid awards). Such prepaid awards are recognized as Prepaid assets if vesting is more than 12 months after the balance sheet date or as Accrued income and prepaid expenses if vesting is within 12 months from the balance sheet date.
Shares awarded to employees that are settled using conditional capital are accounted for as follows at settlement: the amount paid by the employees for the nominal value of the shares awarded is recorded in Share capital, while any paid amount exceeding the nominal value is considered to be share premium and is recorded in the Statutory capital reserve within General reserves.
Other compensation plans
Deferred compensation plans that are not share-based, including deferred contingent capital plan (DCCP) awards and awards in the form of AIVs, are accounted for as cash-settled awards. The fair value of the amount payable to employees that is settled in cash is recognized as a liability generally over the vesting period, as Compensation-related long-term liabilities if vesting is more than 12 months after the balance sheet date and as Accrued expenses and deferred income if vesting is within 12 months from the balance sheet date. The liabilities are remeasured at each balance sheet date at the fair value of the corresponding award and investments in AIVs, respectively. Gains and losses resulting from fair value changes in the liabilities are recognized in Other operating income and Other operating expenses, respectively.
Recharge of compensation expenses
Expenses related to deferred compensation plans are recharged by UBS Group AG to its subsidiaries employing the personnel. Upon recharge, UBS Group AG recognizes a receivable from its subsidiaries and a liability representing its obligation towards employees.
Dispensations in the standalone financial statements
As UBS Group AG prepares consolidated financial statements in accordance with IFRS, UBS Group AG is exempt from various disclosures in the standalone financial statements. The dispensations include the management report and the statement of cash flows, as well as certain note disclosures.
Income statement notes
Note 3 Other operating income
| | For the year ended | | For the period ended | | % change from |
CHF million | | 31.12.15 | | 31.12.14 | | 31.12.14 |
Fair value gains on alternative investment vehicles awards | | 13 | | 7 | | 82 |
Realized gains from the settlement of equity-settled awards | | 29 | | 0 | | |
Amortization of net liability related to deferred compensation plan transfer | | 6 | | 0 | | |
Commission income from guarantees issued | | 1 | | 0 | | |
Total other operating income | | 49 | | 8 | | 551 |
Note 4 Financial Income
| | For the year ended | | For the period ended | | % change from |
CHF million | | 31.12.15 | | 31.12.14 | | 31.12.14 |
Realized gains on disposition of and settlement of equity-settled awards with treasury shares | | 32 | | 0 | | |
Interest income on long-term receivables from UBS AG | | 253 | | 0 | | |
Foreign currency translation gains | | 10 | | 0 | | |
Total financial income | | 294 | | 0 | | |
Note 5 Personnel expenses
Personnel expenses include recharges from UBS AG for personnel-related costs for activities performed by UBS AG personnel for the benefit of UBS Group AG.
UBS Group AG had no employees throughout 2015. All employees of the UBS Group, including the members of the Group Executive Board of UBS Group AG, were employed by subsidiaries of UBS Group AG. As of 31 December 2015, the UBS Group employed 60,099 personnel (31 December 2014: 60,155) on a full-time equivalent basis.
Note 6 Other operating expenses
| | For the year ended | | For the period ended | | % change from |
CHF million | | 31.12.15 | | 31.12.14 | | 31.12.14 |
Realized losses from the settlement of equity-settled awards | | 147 | | 0 | | |
Capital tax | | 13 | | 8 | | 66 |
Stamp tax | | 1 | | 2 | | (69) |
Other | | 11 | | 0 | | |
Total other operating expenses | | 171 | | 10 | | |
Note 7 Financial expenses
| | For the year ended | | For the period ended | | % change from |
CHF million | | 31.12.15 | | 31.12.14 | | 31.12.14 |
Fair value losses on marketable securities and financial assets | | 13 | | 7 | | 83 |
Interest expense on interest-bearing liabilities | | 255 | | 0 | | |
Total financial expenses | | 267 | | 7 | | |
Legal entity financial and regulatory information
Notes to the UBS Group AG standalone financial statements
Balance sheet notes
Liquid assets comprise current accounts held at UBS Switzerland AG.
Note 9 Marketable securities
Marketable securities include investments in AIVs related to compensation awards vesting within 12 months after the balance sheet date.
Note 10 Other short-term receivables
Other short-term receivables are mainly comprised of receivables from employing entities related to compensation awards.
Note 11 Accrued income and prepaid expenses
| | | | | | % change from |
CHF million | | 31.12.15 | | 31.12.14 | | 31.12.14 |
Short-term portion of prepaid awards | | 7 | | 91 | | (92) |
Accrued interest income | | 257 | | 0 | | |
Total accrued income and prepaid expenses | | 264 | | 91 | | 190 |
Note 12 Investments in subsidiaries
Unless otherwise stated, the subsidiaries listed in the tables below have share capital consisting solely of ordinary shares, which are held by UBS Group AG or UBS AG, respectively. The proportion of ownership interest held is equal to the voting rights held by UBS Group AG or UBS AG, respectively. The country where the respective registered office is located is also generally the principal place of business.
Directly held subsidiaries as of 31 December 2015 |
Company | Registered office | | Share capital in million | Equity interest accumulated in % |
UBS AG | Zurich and Basel, Switzerland | | CHF | 385.8 | 100.0 |
UBS Business Solutions AG | Zurich, Switzerland | | CHF | 1.0 | 100.0 |
UBS Group Funding (Jersey) Ltd. | St. Helier, Jersey | | CHF | 0.0 | 100.0 |
| | | | | |
| | | | | |
Individually significant subsidiaries of UBS AG as of 31 December 2015 |
Company | Registered office | Primary business division | Share capital in million | Equity interest accumulated in % |
UBS Americas Holding LLC | Wilmington, Delaware, USA | Corporate Center | USD | 1,200.0¹ | 100.0 |
UBS Bank USA | Salt Lake City, Utah, USA | Wealth Management Americas | USD | 0.0 | 100.0 |
UBS Financial Services Inc. | Wilmington, Delaware, USA | Wealth Management Americas | USD | 0.0 | 100.0 |
UBS Limited | London, United Kingdom | Investment Bank | GBP | 226.6 | 100.0 |
UBS Securities LLC | Wilmington, Delaware, USA | Investment Bank | USD | 1,283.1² | 100.0 |
UBS Switzerland AG | Zurich, Switzerland | Personal & Corporate Banking | CHF | 10.0 | 100.0 |
1 Comprised of common share capital of USD 1,000 and non-voting preferred share capital of USD 1,200,000,000. 2 Comprised of common share capital of USD 100,000 and non-voting preferred share capital of USD 1,283,000,000. |
Individually significant subsidiaries of UBS AG are those entities that contribute significantly to the Group’s financial position or results of operations, based on a number of criteria, including the subsidiaries’ equity and their contribution to the Group’s total assets and profit and loss before tax, in accordance with Swiss regulations.
UBS Americas Holding LLC, UBS Limited and UBS Switzerland AG are fully held by UBS AG. UBS Bank USA, UBS Financial Services Inc. and UBS Securities LLC are fully held, directly or indirectly, by UBS Americas Holding LLC.
Note 13 Financial assets
| | | | | | % change from |
CHF million | | 31.12.15 | | 31.12.14 | | 31.12.14 |
Long-term receivables from UBS AG¹ | | 5,171 | | 0 | | |
Investments in alternative investment vehicles at fair value related to awards vesting after 12 months | | 294 | | 309 | | (5) |
Investments in alternative investment vehicles at cost less impairment | | 9 | | 11 | | (12) |
Total financial assets | | 5,475 | | 320 | | |
1 Long-term receivables from UBS AG include the onward lending of the proceeds from the issuances of additional tier 1 (AT1) perpetual capital notes. |
Legal entity financial and regulatory information
Notes to the UBS Group AG standalone financial statements
Note 14 Accrued expenses and deferred income
| | | | | | % change from |
CHF million | | 31.12.15 | | 31.12.14 | | 31.12.14 |
Short-term portion of net liability related to deferred compensation plan transfer | | 2 | | 6 | | (68) |
Short-term portion of compensation liabilities | | 720 | | 830 | | (13) |
of which: deferred contingent capital plan | | 65 | | 49 | | 32 |
of which: other deferred compensation plans | | 655 | | 781 | | (16) |
Accrued interest expense | | 255 | | 0 | | |
Other | | 29 | | 3 | | 984 |
Total accrued expenses and deferred income | | 1,006 | | 838 | | 20 |
Note 15 Long-term interest-bearing liabilities
Notes issued, overview by amount, maturity and coupon | | 31.12.15 |
in million, except where indicated | | Carrying value in transaction currency | Carrying value in CHF | Maturity¹ | Coupon¹ |
Euro-denominated low-trigger loss-absorbing additional tier 1 perpetual capital notes | | 988 | 1,075 | 19.02.22 | 5.750% |
US dollar-denominated low-trigger loss-absorbing additional tier 1 perpetual capital notes | | 1,234 | 1,236 | 19.02.25 | 7.000% |
US dollar-denominated high-trigger loss-absorbing additional tier 1 perpetual capital notes | | 1,234 | 1,236 | 19.02.20 | 7.125% |
US dollar-denominated high-trigger loss-absorbing additional tier 1 perpetual capital notes | | 1,555 | 1,558 | 07.08.25 | 6.875% |
Total long-term interest-bearing liabilities | | | 5,106 | | |
1 The disclosed maturity refers to the optional first call date of the respective issuance and the disclosed coupon refers to the fixed coupon rate from the issue date up to (but excluding) the optional first call date. |
Note 16 Compensation-related long-term liabilities
| | | | | | % change from |
CHF million | | 31.12.15 | | 31.12.14 | | 31.12.14 |
Long-term portion of net liability related to deferred compensation plan transfer | | 11 | | 15 | | (24) |
Long-term portion of compensation liabilities | | 3,107 | | 2,298 | | 35 |
of which: deferred contingent capital plan | | 1,109 | | 745 | | 49 |
of which: other deferred compensation plans | | 1,999 | | 1,552 | | 29 |
Total compensation-related long-term liabilities | | 3,119 | | 2,313 | | 35 |
On 31 December 2015, the issued share capital consisted of 3,849,731,535 (31 December 2014: 3,717,128,324) registered shares at a par value of CHF 0.10 each.
® Refer to “UBS shares” in the “Risk, treasury and capital management” section of this report for more information on UBS Group AG shares
Note 18 Treasury shares
| Number of registered shares | Average price in CHF |
Balance as of 10 June 2014 | 1,000,000 | 0.10 |
Share-for-share exchange | 91,453,788 | 16.95 |
Capital reduction | (1,000,000) | 0.10 |
Acquisitions | 641 | 15.24 |
Dispositions | (3,268,157) | 17.31 |
Delivery of shares to settle equity-settled awards | (314,535) | 17.08 |
Balance as of 31 December 2014 | 87,871,737 | 16.94 |
of which: treasury shares held by UBS Group AG¹ | 90,176,988 | 16.95 |
of which: short sales of treasury shares by UBS AG and other subsidiaries | (2,305,251) | 17.30 |
Share-for-share exchange | (100,923) | 19.90 |
Acquisitions | 89,594,586 | 17.57 |
Dispositions | (27,510,789) | 17.08 |
Delivery of shares to settle equity-settled awards | (51,148,336) | 17.29 |
Balance as of 31 December 2015 | 98,706,275 | 17.51 |
of which: treasury shares held by UBS Group AG¹ | 98,465,708 | 17.50 |
of which: treasury shares held by UBS AG and other subsidiaries | 240,567 | 19.51 |
1 Treasury shares held by UBS Group AG had a carrying value of CHF 1,724 million as of 31 December 2015 (31 December 2014: CHF 1,529 million). |
The line item share-for-share exchange in 2014 includes 90,490,886 UBS AG treasury shares that were held by UBS AG as a hedge of its share based compensation plans before the share-for-share exchange. These shares were exchanged into UBS Group AG shares and were transferred to UBS Group AG in connection with the transfer of the deferred compensation plans. They were transferred from UBS AG to UBS Group AG at the price of CHF 16.95, the fair value at the date of transfer.
Legal entity financial and regulatory information
Notes to the UBS Group AG standalone financial statements
Additional information
In 2015, UBS Group AG issued senior unsecured debt, through its subsidiary UBS Group Funding (Jersey) Ltd, for a nominal amount equivalent to CHF 5,668 million as of 31 December 2015. This debt will contribute to the total loss-absorbing capacity (TLAC) of the Group. UBS Group AG issued guarantee to the external investors against any default in payments of interest and principal by UBS Group Funding (Jersey) Ltd.
Note 20 Assets pledged to secure own liabilities
As of 31 December 2015, total pledged assets of UBS Group AG were CHF 41,835 million (31 December 2014: CHF 39,761 million). These assets, which primarily consist of the investment in UBS AG, as well as certain liquid assets, marketable securities and financial assets were pledged to UBS AG. The associated liabilities secured by these pledged assets were CHF 581 million as of 31 December 2015 (31 December 2014: CHF 206 million).
Note 21 Contingent liabilities
UBS Group AG is jointly and severally liable for the value added tax (VAT) liability of Swiss subsidiaries that belong to its VAT group.
Note 22 Significant shareholders
Shareholders registered in the UBS Group AG share register with 3% or more of total share capital |
% of share capital | 31.12.15 | 31.12.14 |
Chase Nominees Ltd., London | 9.14 | 9.05 |
GIC Private Limited, Singapore | 6.38 | 6.61 |
DTC (Cede & Co.), New York¹ | 6.14 | 5.76 |
Nortrust Nominees Ltd., London | 3.60 | 3.52 |
1 DTC (Cede & Co.), New York, "The Depository Trust Company", is a US securities clearing organization. |
As of 1 January 2016, the Federal Act on Financial Market Infrastructures and Market Conduct in Securities and Derivatives Trading of 19 June 2015 (Swiss Financial Market Infrastructure Act) replaced certain provisions of the Swiss Federal Act on Stock Exchanges and Securities Trading of 24 March 1995 as amended (Swiss Stock Exchange Act). Under the Swiss Financial Market Infrastructure Act, anyone holding shares in a company listed in Switzerland, or holding derivative rights related to shares of such a company, must notify the company and the SIX if the holding reaches, falls below or exceeds one of the following thresholds: 3, 5, 10, 15, 20, 25, 331⁄3, 50, or 662⁄3% of voting rights, regardless of whether or not such rights may be exercised. The detailed disclosure requirements and the methodology for calculating the thresholds are defined in the Swiss Financial Market Supervisory Authority Ordinance on Financial Market Infrastructure (FMIO-FINMA), which replaced certain provisions of the Swiss Financial Market Supervisory Authority Ordinance on Stock Exchanges and Securities Trading (SESTO-FINMA) as of 1 January 2016. In particular, the FMIO-FINMA (as the former SESTO-FINMA) sets forth that nominee companies that cannot autonomously decide how voting rights are exercised are not obligated to notify the company and SIX if they reach, exceed or fall below the threshold percentages. In addition, pursuant to the Swiss Code of Obligations, UBS Group AG must disclose in the notes to its financial statements the identity of any shareholder with a holding of more than 5% of the total share capital of UBS Group AG.
According to disclosure notifications filed on 10 December 2014 with UBS Group AG and the SIX under the Swiss Stock Exchange Act and respective FINMA Ordinance, both as in force at that time, GIC Private Limited disclosed a holding of 7.07% of the total share capital of UBS Group AG. The beneficial owner of this holding is the Government of Singapore. On 10 December 2014, Norges Bank, Oslo, the Central Bank of Norway, disclosed a holding of 3.30%. On 15 January 2015, BlackRock Inc., New York, disclosed a holding of 4.89% and on 10 February 2016, MFS Investment Management, Boston, disclosed a holding of 3.05%. In accordance with the Swiss Stock Exchange Act and, as of 1 January 2016, the Swiss Financial Market Infrastructure Act, the aforementioned percentages were calculated in relation to the total share capital of UBS Group AG reflected in the Articles of Association at the time of the respective disclosure notification. Information on disclosures under the Swiss Stock Exchange Act and the Swiss Financial Market Infrastructure Act, respectively, is available on the SIX Disclosure Office website at www.six-exchange-regulation.com/en/home/publications/significantshareholders.html.
According to the share register, the shareholders (acting in their own name or in their capacity as nominees for other investors or beneficial owners) listed in the table above were registered with 3% or more of the total share capital of UBS Group AG as of 31 December 2015.
Legal entity financial and regulatory information
Notes to the UBS Group AG standalone financial statements
Note 23 Share and option ownership of the members of the Board of Directors, the Group Executive Board and other employees
Shares awarded | | | | | | |
| | For the year ended 31.12.15 | | For the year ended 31.12.14 |
| | Number of shares | Value of shares in CHF million | | Number of shares | Value of shares in CHF million |
Awarded to members of the Board of Directors | | 425,258 | 7 | | 473,567 | 9 |
Awarded to members of the Group Executive Board | | 2,230,800 | 37 | | 1,888,666 | 35 |
Awarded to other UBS Group employees | | 64,213,472 | 1,042 | | 57,036,519 | 1,045 |
Total | | 66,869,530 | 1,087 | | 59,398,752 | 1,088 |
® Refer to the “Corporate Governance “ section in this report for more information on the terms and conditions of the shares and options awarded to the members of the Board of Directors and the Group Executive Board
Number of shares of BoD members¹ |
Name, function | on 31 December | Number of shares held | Voting rights in % |
Axel A. Weber, Chairman | 2015 | 488,889 | 0.026 |
2014 | 333,333 | 0.017 |
Michel Demaré, Vice Chairman | 2015 | 215,992 | 0.012 |
2014 | 181,246 | 0.009 |
David Sidwell, Senior Independent Director | 2015 | 163,317 | 0.009 |
2014 | 185,181 | 0.009 |
Reto Francioni, member | 2015 | 28,787 | 0.002 |
2014 | 11,859 | 0.001 |
Ann F. Godbehere, member | 2015 | 169,054 | 0.009 |
2014 | 139,653 | 0.007 |
Axel P. Lehmann, member | 2015 | 252,761 | 0.014 |
2014 | 217,373 | 0.011 |
Helmut Panke, former member² | 2015 | – | – |
2014 | 182,009 | 0.009 |
William G. Parrett, member | 2015 | 104,271 | 0.006 |
2014 | 100,019 | 0.005 |
Isabelle Romy, member | 2015 | 66,490 | 0.004 |
2014 | 44,217 | 0.002 |
Beatrice Weder di Mauro, member | 2015 | 71,261 | 0.004 |
2014 | 45,424 | 0.002 |
Joseph Yam, member | 2015 | 87,354 | 0.005 |
2014 | 66,863 | 0.003 |
Total | 2015 | 1,648,176 | 0.088 |
2014 | 1,507,177 | 0.077 |
1 This table includes blocked and unblocked shares held by BoD members, including those held by related parties. No options were granted in 2015 and 2014. 2 Helmut Panke did not stand for re-election at the AGM on 7 May 2015. |
Note 23 Share and option ownership of the members of the Board of Directors, the Group Executive Board and other employees (continued)
Share and option ownership / entitlements of GEB members¹ |
Name, function | on 31 December | Number of unvested shares / at risk² | Number of vested shares | Total number of shares | Potentially conferred voting rights in % | Number of options³ | Potentially conferred voting rights in %⁴ |
Sergio P. Ermotti, Group Chief Executive Officer | 2015 | 947,964 | 155,736 | 1,103,700 | 0.059 | 0 | 0.000 |
2014 | 670,935 | 97,589 | 768,524 | 0.039 | 0 | 0.000 |
Markus U. Diethelm, Group General Counsel | 2015 | 447,694 | 61,797 | 509,491 | 0.027 | 0 | 0.000 |
2014 | 528,973 | 0 | 528,973 | 0.027 | 0 | 0.000 |
Lukas Gähwiler, President Personal & Corporate Banking and President UBS Switzerland | 2015 | 558,657 | 1,515 | 560,172 | 0.030 | 0 | 0.000 |
2014 | 522,769 | 1,052 | 523,821 | 0.027 | 0 | 0.000 |
Ulrich Körner, President Asset Management and President UBS EMEA | 2015 | 642,813 | 95,597 | 738,410 | 0.039 | 0 | 0.000 |
2014 | 713,051 | 292,519 | 1,005,570 | 0.051 | 0 | 0.000 |
Philip J. Lofts, Group Chief Risk Officer | 2015 | 540,288 | 247,929 | 788,217 | 0.042 | 277,082 | 0.015 |
2014 | 611,479 | 204,346 | 815,825 | 0.042 | 394,172 | 0.020 |
Robert J. McCann, President Wealth Management Americas and President UBS Americas | 2015 | 1,010,805 | 0 | 1,010,805 | 0.054 | 0 | 0.000 |
2014 | 983,028 | 62,901 | 1,045,929 | 0.053 | 0 | 0.000 |
Tom Naratil, Group Chief Financial Officer and Group Chief Operating Officer | 2015 | 598,172 | 310,054 | 908,226 | 0.049 | 555,115 | 0.030 |
2014 | 523,751 | 288,151 | 811,902 | 0.041 | 721,125 | 0.037 |
Andrea Orcel, President Investment Bank | 2015 | 933,686 | 117,646 | 1,051,332 | 0.056 | 0 | 0.000 |
2014 | 915,399 | 408,296 | 1,323,695 | 0.068 | 0 | 0.000 |
Chi-Won Yoon, President UBS Asia Pacific | 2015 | 383,164 | 683,994 | 1,067,158 | 0.057 | 483,210 | 0.026 |
2014 | 492,093 | 507,602 | 999,695 | 0.051 | 515,180 | 0.026 |
Jürg Zeltner, President Wealth Management | 2015 | 683,767 | 3,721 | 687,488 | 0.037 | 86,279 | 0.005 |
2014 | 675,211 | 0 | 675,211 | 0.034 | 108,121 | 0.006 |
Total | 2015 | 6,747,010 | 1,677,989 | 8,424,999 | 0.450 | 1,401,686 | 0.075 |
2014 | 6,636,689 | 1,862,456 | 8,499,145 | 0.434 | 1,738,598 | 0.089 |
1 This table includes all vested and unvested shares and options of GEB members, including those held by related parties. 2 Includes shares granted under variable compensation plans with forfeiture provisions. The actual number of shares vesting in the future will be calculated under the terms of the plans. Refer to the “Our deferred variable compensation plans for 2015” section in this report for more information on the plans. 3 Refer to “Note 29 Equity participation and other compensation plans” in the “Consolidated financial statements” section of the Annual Report 2015 for more information. 4 No conversion rights are outstanding. |
Legal entity financial and regulatory information
Notes to the UBS Group AG standalone financial statements
Related parties are defined under the Swiss Code of Obligations as direct and indirect participants with voting rights of 20% or more, management bodies (Board of Directors and Group Executive Board), external auditors and direct and indirect investments in subsidiaries. Payables due to members of the Board of Directors and Group Executive Board are provided in the table below. Amounts due from and due to subsidiaries are provided on the face of the balance sheet.
| | | | | | % change from |
CHF million | | 31.12.15 | | 31.12.14 | | 31.12.14 |
Payables due to the members of the Board of Directors and Group Executive Board | | 144 | | 102 | | 41 |
of which: deferred contingent capital plan | | 53 | | 28 | | 89 |
of which: other deferred compensation plans | | 91 | | 74 | | 23 |
▲
Legal entity financial and regulatory information

Legal entity financial and regulatory information

Legal entity financial and regulatory information

Legal entity financial and regulatory information
Establishment of UBS Switzerland AG
Establishment of UBS Switzerland AG
Establishment of UBS Switzerland AG
UBS Switzerland AG is a stock corporation (Aktiengesellschaft) incorporated and organized under the laws of, and domiciled in, Switzerland, with its registered office at Bahnhofstrasse 45, Zurich.
UBS Switzerland AG was incorporated on 3 September 2014 as a wholly owned subsidiary of UBS AG. Between 3 September 2014 and 31 March 2015, UBS Switzerland AG had a share capital of CHF 100,000, but no operations and recorded therefore virtually no profit or loss during that period. On 12 May 2015, the share capital of UBS Switzerland AG was increased to CHF 10 million and on 21 May 2015, UBS Switzerland AG received banking, securities dealer and custodian bank licenses from FINMA.
On 14 June 2015, UBS AG transferred its Personal & Corporate Banking and Wealth Management businesses booked in Switzerland to UBS Switzerland AG. This business transfer was executed by way of transfer of assets and liabilities in accordance with articles 69 ff. of the Swiss Federal Act on Merger, Scission, Conversion and Transfer of Assets and Liabilities (Merger Act) as an equity contribution to UBS Switzerland AG, thereby increasing UBS AG’s investment in UBS Switzerland AG. The transfer was recorded retrospectively as of 1 April 2015.
The opening balance sheet of UBS Switzerland AG as of 1 April 2015, presented within the table on page 770, was audited by Ernst & Young.
Business transferred to UBS Switzerland AG
The following businesses and related functions booked in Switzerland were transferred from UBS AG to UBS Switzerland AG:
i. The Personal & Corporate Banking and Wealth Management businesses of UBS AG, including the front- and middle-office functions, but excluding certain specific transactions, as outlined in the “Businesses retained in UBS AG” paragraph;
ii. other businesses of UBS AG, mainly from the Investment Bank, including market-making on the SIX Swiss Exchange, secured financing transactions and the bank notes business;
iii. the access to financial market infrastructure serving the business, including payment and custody infrastructure, third-party brokers and certain exchange memberships; and
iv. select finance, risk control and legal functions, generally part of Corporate Center, aligned with the businesses mentioned under items i to iii above.
Businesses retained in UBS AG
UBS AG retained the following businesses and related functions:
i. Personal & Corporate Banking and Wealth Management business booked outside Switzerland;
ii. certain Personal & Corporate Banking and Wealth Management business transactions (mainly comprised of derivative transactions) booked within Switzerland. This primarily relates to clients that had entered into international trading agreements with various UBS AG branches (multi-branch trading agreements); and
iii. the business or functions of the Corporate Center and all other business divisions of UBS AG, especially the Investment Bank and Asset Management, with the exception of the aforementioned functions aligned with the transferred businesses.
Financial accounting effects for UBS AG and UBS Switzerland AG
UBS AG’s investment in UBS Switzerland AG
The business transfer resulted in a CHF 7,822 million increase in UBS AG’s investment in UBS Switzerland AG and a corresponding increase in the General reserve of UBS Switzerland AG. The value of this equity contribution was equal to the net book value of assets and liabilities transferred to, or assumed by, UBS Switzerland AG immediately prior to the transfer. UBS AG did not recognize any gains or losses as a result of the transfer.
Transfer of third party assets and liabilities from UBS AG to
UBS Switzerland AG
Total assets and liabilities transferred from UBS AG to UBS Switzerland AG amounted to CHF 272,634 million and CHF 274,671 million, respectively. The transfer of the Personal & Corporate Banking and Wealth Management business booked in Switzerland resulted in the transfer of nearly all Mortgage loans, a significant portion of Lombard and other loans as well as the majority of amounts Due to customers.
Additionally, certain foreign exchange and interest rate derivative instruments with Personal & Corporate Banking and Wealth Management clients were transferred. The transfer of receivables and payables from and to banks mainly related to positions with UBS Group subsidiaries entered into in connection with the Wealth Management business and Corporate Center - Group Asset and Liability Management functions. Balances with UBS Group subsidiaries mainly related to UBS Switzerland AG having assumed the clearing business of UBS AG (and any related receivables and payables) in connection with the business transfer. These balances significantly decreased until 31 December 2015 as UBS Group subsidiaries and their clients have updated their settlement instructions for the newly established clearing accounts in UBS AG. The remainder of the assets and liabilities transferred mainly consisted of alternative funding sources such as liquid assets, money market paper and financial investments in connection with the management of liquidity risk of UBS Switzerland AG.
Intercompany assets and liabilities between UBS AG and UBS Switzerland AG
As a result of the business transfer, certain internal transactions between businesses and functions of UBS AG became intercompany transactions between UBS AG and UBS Switzerland AG as of 1 April 2015. These transactions mainly relate to securities financing transactions, on-demand payables and receivables in various currencies, derivative instruments that transfer the market risk of derivative transactions with Personal & Corporate Banking and Wealth Management from UBS Switzerland AG to UBS AG, as well as derivatives to manage the UBS Switzerland AG interest rate risk.
Recognition of goodwill by UBS Switzerland AG
As part of the business transfer and in addition to net assets of CHF 7,822 million, UBS Switzerland AG recognized Goodwill of CHF 5,250 million. This Goodwill will be amortized over five years. Despite tax technical limitations otherwise restricting the level of UBS AG tax losses that could be transferred as part of the establishment of UBS Switzerland AG, UBS Group's tax position in Switzerland and globally remains materially unchanged. The business transfer did not result in the recognition of a tax expense from any write-off of deferred tax assets at the Group level, largely as a result of the aforementioned recognition of Goodwill by UBS Switzerland AG that is deductible for tax purposes as it is amortized into the income statement.
Other
For UBS AG, the business transfer also resulted in a balance sheet reclassification of fiduciary deposits, totaling CHF 9,977 million, from Due to customers to Due to banks, as the counterparty to these liabilities is now UBS Switzerland AG and not its clients. For UBS Switzerland AG, these fiduciary deposits are recorded as off-balance sheet positions as UBS Switzerland AG only acts in a fiduciary capacity for these deposits.
UBS Switzerland AG has also recognized CHF 7,782 million of off-balance sheet contingent liabilities and CHF 7,784 million of off-balance sheet irrevocable commitments as a result of the business transfer.
Joint and several liability
As of the asset transfer date, UBS AG assumed joint liability for approximately CHF 260 billion of obligations of UBS Switzerland AG, excluding the collateralized portion of secured contractual obligations. Conversely, UBS Switzerland AG assumed joint liability for approximately CHF 325 billion of obligations of UBS AG, excluding the collateralized portion of secured contractual obligations and covered bonds.
® Refer to the UBS AG and UBS Switzerland AG standalone financial statements within this section for more information
Legal entity financial and regulatory information
Establishment of UBS Switzerland AG
UBS AG (standalone): reconciliation of pre- and post-transfer balance sheet |
CHF million, Swiss GAAP | | Balance sheet as of 31.3.15 | Transfer of third-party assets and liabilities to UBS Switzerland AG¹ | Intercompany assets and liabilities with UBS Switzerland AG as counterparty | Investment in UBS Switzerland AG and other items | Balance sheet as of 1.4.15 |
| | | | | | |
Assets | | | | | | |
Cash and balances with central banks | | 60,944 | (30,564) | | | 30,380 |
Due from banks | | 39,784 | (6,153) | 19,288 | | 52,918 |
Receivables from securities financing transactions | | 110,022 | (7,800) | 16,668 | | 118,890 |
of which: cash collateral on securities borrowed | | 32,570 | (7,800) | 4,123 | | 28,893 |
of which: reverse repurchase agreements | | 77,453 | 0 | 12,545 | | 89,998 |
Due from customers | | 153,306 | (44,125) | | | 109,180 |
Mortgage loans | | 155,391 | (151,121) | | | 4,270 |
Trading portfolio assets | | 102,153 | (2,792) | | | 99,361 |
Positive replacement values | | 45,234 | (3,017) | 651 | | 42,868 |
Financial investments | | 56,341 | (26,058) | | | 30,283 |
Accrued income and prepaid expenses | | 2,157 | (276) | 46 | | 1,926 |
Investments in subsidiaries and other participations | | 26,243 | (42) | | 7,822 | 34,022 |
Property, equipment and software | | 5,881 | (22) | | | 5,859 |
Goodwill and other intangible assets | | 52 | 0 | | | 52 |
Other assets | | 3,709 | (663) | 2,057 | 424 | 5,526 |
Total assets | | 761,216 | (272,634) | 38,708 | 8,246 | 535,538 |
| | | | | | |
Liabilities | | | | | | |
Due to banks | | 43,111 | (18,978) | 25,238 | 9,977 | 59,348 |
Payables from securities financing transactions | | 54,833 | (4,355) | 23,214 | | 73,691 |
of which: cash collateral on securities lent | | 32,347 | (3,409) | 1,361 | | 30,299 |
of which: repurchase agreements | | 22,486 | (946) | 21,853 | | 43,393 |
Due to customers | | 381,935 | (238,574) | | (9,977) | 133,384 |
Trading portfolio liabilities | | 21,884 | (191) | | | 21,693 |
Negative replacement values | | 48,398 | (2,109) | 75 | | 46,363 |
Financial liabilities designated at fair value | | 45,968 | 0 | | | 45,968 |
Medium-term notes | | 539 | (539) | | | 0 |
Bonds issued and loans from central mortgage institutions | | 105,690 | (7,901) | | | 97,789 |
Accrued expenses and deferred income | | 4,147 | (314) | 5 | | 3,838 |
Other liabilities | | 8,098 | (1,538) | 37 | 424 | 7,021 |
Provisions | | 2,542 | (174) | | | 2,369 |
Total liabilities | | 717,144 | (274,671) | 48,569 | 424 | 491,466 |
| | | | | | |
Equity | | | | | | |
Share capital | | 384 | | | | 384 |
General reserve | | 36,302 | | | | 36,302 |
Voluntary earnings reserve | | 5,689 | | | | 5,689 |
Net profit / (loss) for the period | | 1,696 | | | | 1,696 |
Total equity | | 44,072 | | | | 44,072 |
Total liabilities and equity | | 761,216 | (274,671) | 48,569 | 424 | 535,538 |
1 Includes balances with other UBS Group subsidiaries. |
UBS AG (standalone): reconciliation of pre- and post-transfer off-balance sheet items | |
CHF million, Swiss GAAP | | Off-balance sheet as of 31.3.15 | Transfer of third-party UBS AG positions | Intercompany positions with UBS Switzerland AG as counterparty | Off-balance sheet as of 1.4.15 |
Contingent liabilities¹ | | 38,986 | (7,782) | 74 | 31,278 |
Irrevocable commitments¹ | | 49,448 | (7,784) | 0 | 41,665 |
Forward starting transactions² | | 16,394 | | 881 | 17,275 |
Liabilities for calls on shares and other equities | | 45 | (37) | | 7 |
1 Numbers are presented net of sub-participations. 2 Cash to be paid in the future by either UBS AG or the counterparty. |
Legal entity financial and regulatory information
Establishment of UBS Switzerland AG
UBS Switzerland AG (standalone): reconciliation of pre- and post-transfer balance sheet |
CHF million, Swiss GAAP | | Balance sheet as of 31.3.15 | Transfer of third-party assets and liabilities from UBS AG¹ | Intercompany assets and liabilities with UBS AG as counterparty | Subtotal including equity | Recognition of goodwill | Balance sheet as of 1.4.15 |
| | | | | | | |
Assets | | | | | | | |
Cash and balances with central banks | | | 30,564 | | 30,564 | | 30,564 |
Due from banks | | 0 | 6,153 | 25,238 | 31,391 | | 31,391 |
Receivables from securities financing transactions | | | 7,800 | 23,214 | 31,013 | | 31,013 |
of which: cash collateral on securities borrowed | | | 7,800 | 1,361 | 9,161 | | 9,161 |
of which: reverse repurchase agreements | | | 0 | 21,853 | 21,853 | | 21,853 |
Due from customers | | | 44,125 | | 44,125 | | 44,125 |
Mortgage loans | | | 151,121 | | 151,121 | | 151,121 |
Trading portfolio assets | | | 2,792 | | 2,792 | | 2,792 |
Positive replacement values | | | 3,017 | 75 | 3,092 | | 3,092 |
Financial investments | | | 26,058 | | 26,058 | | 26,058 |
Accrued income and prepaid expenses | | | 276 | 5 | 281 | | 281 |
Investments in subsidiaries and other participations | | | 42 | | 42 | | 42 |
Property, equipment and software | | | 22 | | 22 | | 22 |
Goodwill and other intangible assets | | | 0 | | 0 | 5,250 | 5,250 |
Other assets | | | 663 | 37 | 700 | | 700 |
Total assets | | 0 | 272,634 | 48,569 | 321,203 | 5,250 | 326,452 |
| | | | | | | |
Liabilities | | | | | | | |
Due to banks | | | 18,978 | 19,288 | 38,265 | | 38,265 |
Payables from securities financing transactions | | | 4,355 | 16,668 | 21,023 | | 21,023 |
of which: cash collateral on securities lent | | | 3,409 | 4,123 | 7,531 | | 7,531 |
of which: repurchase agreements | | | 946 | 12,545 | 13,491 | | 13,491 |
Due to customers | | | 238,574 | | 238,574 | | 238,574 |
Trading portfolio liabilities | | | 191 | | 191 | | 191 |
Negative replacement values | | | 2,109 | 651 | 2,760 | | 2,760 |
Financial liabilities designated at fair value | | | 0 | | 0 | | 0 |
Medium-term notes | | | 539 | | 539 | | 539 |
Bonds issued and loans from central mortgage institutions | | | 7,901 | | 7,901 | | 7,901 |
Accrued expenses and deferred income | | | 314 | 46 | 360 | | 360 |
Other liabilities | | | 1,538 | 2,057 | 3,594 | | 3,594 |
Provisions | | | 174 | | 174 | | 174 |
Total liabilities | | | 274,671 | 38,710 | 313,381 | | 313,381 |
| | | | | | | |
Equity | | | | | | | |
Share capital | | 0 | | | 0 | | 0 |
General reserve | | | | | 7,822 | 5,250 | 13,072 |
Voluntary earnings reserve | | | | | | | |
Net profit / (loss) for the period | | | | | | | |
Total equity | | 0 | | | 7,822 | 5,250 | 13,072 |
Total liabilities and equity | | 0 | 274,671 | 38,710 | 321,203 | 5,250 | 326,452 |
1 Includes balances with other UBS Group subsidiaries. |
UBS Switzerland AG (standalone): reconciliation of pre- and post-transfer off-balance sheet items | |
CHF million, Swiss GAAP | | Off-balance sheet as of 31.3.15 | Transfer of third-party UBS AG positions | Intercompany positions with UBS AG as counterparty | Off-balance sheet as of 1.4.15 |
Contingent liabilities¹ | | | 7,782 | | 7,782 |
Irrevocable commitments¹ | | | 7,784 | | 7,784 |
Forward starting transactions² | | | | 881 | 881 |
Liabilities for calls on shares and other equities | | | 37 | | 37 |
1 Numbers are presented net of sub-participations. 2 Cash to be paid in the future by either UBS Switzerland AG or the counterparty. |
Legal entity financial and regulatory information
UBS AG standalone financial statements
UBS AG standalone financial statements
Audited |
Income statement |
| | | | For the year ended | | % change from |
CHF million | | Note | | 31.12.15 | | 31.12.14 | | 31.12.14 |
Interest and discount income | | | | 6,204 | | 8,653 | | (28) |
Interest and dividend income from trading portfolio | | | | 2,602 | | 2,683 | | (3) |
Interest and dividend income from financial investments | | | | 199 | | 210 | | (5) |
Interest expense | | | | (5,917) | | (6,450) | | (8) |
Gross interest income | | | | 3,088 | | 5,097 | | (39) |
Credit loss (expense) / recovery | | | | (158) | | (129) | | 22 |
Net interest income | | | | 2,929 | | 4,968 | | (41) |
Fee and commission income from securities and investment business | | | | 3,416 | | 6,248 | | (45) |
Credit-related fees and commissions | | | | 285 | | 492 | | (42) |
Other fee and commission income | | | | 110 | | 598 | | (82) |
Fee and commission expense | | | | (1,012) | | (1,147) | | (12) |
Net fee and commission income | | | | 2,799 | | 6,192 | | (55) |
Net trading income | | 3 | | 3,725 | | 3,407 | | 9 |
Net income from disposal of financial investments | | | | 150 | | 147 | | 2 |
Dividend income from investments in subsidiaries and other participations | | | | 1,218 | | 878 | | 39 |
Income from real estate holdings | | | | 565 | | 26 | | |
Sundry ordinary income | | 4 | | 4,706 | | 4,494 | | 5 |
Sundry ordinary expenses | | 4 | | (831) | | (1,816) | | (54) |
Other income from ordinary activities | | | | 5,809 | | 3,729 | | 56 |
Total operating income | | | | 15,263 | | 18,297 | �� | (17) |
Personnel expenses | | 5 | | 6,438 | | 6,787 | | (5) |
General and administrative expenses | | 6 | | 5,615 | | 5,727 | | (2) |
Subtotal operating expenses | | | | 12,053 | | 12,514 | | (4) |
Impairment of investments in subsidiaries and other participations | | | | 413 | | 415 | | 0 |
Depreciation and impairment of property, equipment and software | | | | 674 | | 596 | | 13 |
Amortization and impairment of goodwill and other intangible assets | | | | 22 | | 20 | | 10 |
Changes in provisions and other allowances and losses | | | | 25 | | 1,484 | | (98) |
Total operating expenses | | | | 13,187 | | 15,029 | | (12) |
Operating profit | | | | 2,076 | | 3,267 | | (36) |
Extraordinary income | | 7 | | 10,264 | | 4,850 | | 112 |
Extraordinary expenses | | 7 | | 136 | | 57 | | 139 |
Tax expense / (benefit) | | 8 | | 220 | | 212 | | 4 |
Net profit / (loss) | | | | 11,984 | | 7,849 | | 53 |
Balance sheet |
| | | | | | | | % change from |
CHF million | | Note | | 31.12.15 | | 31.12.14 | | 31.12.14 |
| | | | | | | | |
Assets | | | | | | | | |
Cash and balances with central banks | | | | 45,125 | | 95,711 | | (53) |
Due from banks | | | | 40,611 | | 39,245 | | 3 |
Receivables from securities financing transactions | | 9 | | 90,479 | | 100,158 | | (10) |
of which: cash collateral on securities borrowed | | | | 27,925 | | 33,676 | | (17) |
of which: reverse repurchase agreements | | | | 62,553 | | 66,481 | | (6) |
Due from customers | | 10 | | 97,401 | | 156,344 | | (38) |
Mortgage loans | | 10 | | 4,679 | | 155,406 | | (97) |
Trading portfolio assets | | 12 | | 94,210 | | 107,549 | | (12) |
Positive replacement values | | 13 | | 20,987 | | 42,385 | | (50) |
Financial investments | | 14 | | 27,528 | | 42,384 | | (35) |
Accrued income and prepaid expenses | | | | 1,708 | | 2,012 | | (15) |
Investments in subsidiaries and other participations | | | | 43,791 | | 27,199 | | 61 |
Property, equipment and software | | | | 6,503 | | 5,899 | | 10 |
Goodwill and other intangible assets | | | | 36 | | 33 | | 9 |
Other assets | | 15 | | 3,986 | | 3,568 | | 12 |
Total assets | | | | 477,045 | | 777,893 | | (39) |
of which: subordinated assets | | | | 5,752 | | 4,257 | | 35 |
of which: subject to mandatory conversion and / or debt waiver | | | | 4,020 | | 0 | | |
| | | | | | | | |
Liabilities | | | | | | | | |
Due to banks | | | | 36,669 | | 43,787 | | (16) |
Payables from securities financing transactions | | 9 | | 55,457 | | 56,460 | | (2) |
of which: cash collateral on securities lent | | | | 34,094 | | 33,284 | | 2 |
of which: repurchase agreements | | | | 21,363 | | 23,175 | | (8) |
Due to customers | | | | 144,842 | | 397,194 | | (64) |
Trading portfolio liabilities | | 12 | | 21,179 | | 18,965 | | 12 |
Negative replacement values | | 13 | | 24,669 | | 42,911 | | (43) |
Financial liabilities designated at fair value | | 12,18 | | 58,104 | | 49,803 | | 17 |
Medium-term notes | | | | 0 | | 602 | | (100) |
Bonds issued and loans from central mortgage institutions | | | | 72,750 | | 111,302 | | (35) |
Accrued expenses and deferred income | | | | 4,356 | | 4,700 | | (7) |
Other liabilities | | 15 | | 5,505 | | 6,962 | | (21) |
Provisions | | 11 | | 1,786 | | 2,831 | | (37) |
Total liabilities | | | | 425,316 | | 735,517 | | (42) |
| | | | | | | | |
Equity | | | | | | | | |
Share capital | | 19 | | 386 | | 384 | | 0 |
General reserve | | | | 33,669 | | 28,453 | | 18 |
of which: statutory capital reserve | | | | 38,149 | | 40,782 | | (6) |
of which: capital contribution reserve¹ | | | | 38,149 | | 40,782 | | (6) |
of which: statutory earnings reserve | | | | (4,480) | | (12,329) | | (64) |
Voluntary earnings reserve | | | | 5,689 | | 5,689 | | 0 |
Net profit / (loss) for the period | | | | 11,984 | | 7,849 | | 53 |
Total equity | | | | 51,728 | | 42,376 | | 22 |
Total liabilities and equity | | | | 477,045 | | 777,893 | | (39) |
of which: subordinated liabilities | | | | 16,139 | | 18,538 | | (13) |
of which: subject to mandatory conversion and / or debt waiver | | | | 11,858 | | 10,687 | | 11 |
|
Legal entity financial and regulatory information
UBS AG standalone financial statements
Balance sheet (continued) |
| | | | | | % change from |
CHF million | | 31.12.15 | | 31.12.14 | | 31.12.14 |
| | | | | | |
Off-balance sheet items | | | | | | |
Contingent liabilities, gross | | 27,787 | | 41,872 | | (34) |
Sub-participations | | (1,866) | | (2,792) | | (33) |
Contingent liabilities, net | | 25,920 | | 39,080 | | (34) |
of which: guarantees to third parties related to subsidiaries | | 19,392 | | 23,140 | | (16) |
of which: credit guarantees and similar instruments | | 4,224 | | 7,842 | | (46) |
of which: performance guarantees and similar instruments | | 26 | | 2,555 | | (99) |
of which: documentary credits | | 2,278 | | 5,543 | | (59) |
Irrevocable commitments, gross | | 50,901 | | 54,296 | | (6) |
Sub-participations | | (1,559) | | (1,256) | | 24 |
Irrevocable commitments, net | | 49,342 | | 53,040 | | (7) |
of which: loan commitments | | 49,342 | | 52,172 | | (5) |
of which: payment commitment related to deposit insurance | | 0 | | 868 | | (100) |
Forward starting transactions² | | 4,195 | | 9,932 | | (58) |
of which: reverse repurchase agreements | | 1,626 | | 6,048 | | (73) |
of which: securities borrowing agreements | | 6 | | 125 | | (95) |
of which: repurchase agreements | | 2,561 | | 3,758 | | (32) |
of which: securities lending agreements | | 2 | | 0 | | |
Liabilities for calls on shares and other equity instruments | | 7 | | 45 | | (84) |
1 Effective 1 January 2011, the Swiss withholding tax law provides that payments out of the capital contribution reserve are not subject to withholding tax. This law has led to interpretational differences between the Swiss Federal Tax Authorities and companies about the qualifying amounts of capital contribution reserve and the disclosure in the financial statements. In view of this, the Swiss Federal Tax Authorities have confirmed that UBS would be able to repay to shareholders CHF 27.4 billion of disclosed capital contribution reserve (status as of 1 January 2011) without being subject to the withholding tax deduction that applies to dividends paid out of retained earnings. This amount decreased to CHF 23.0 billion as of 31 December 2015 subsequent to distributions in 2012, 2013, 2014 and 2015. The decision about the remaining amount has been deferred to a future point in time. 2 Cash to be paid in the future by either UBS AG or the counterparty. |
Off-balance sheet items
Off-balance sheet items include indemnities and guarantees issued by UBS AG for the benefit of subsidiaries and creditors of subsidiaries.
Where the indemnity amount issued by UBS AG is not specifically defined, the indemnity relates to the solvency or minimum capitalization of a subsidiary, and therefore no amount is included in the table above.
In addition, UBS AG is jointly and severally liable for the value added tax (VAT) liability of Swiss subsidiaries that belong to its VAT group. This contingent liability is not included in the table above.
Guarantee to UBS Limited
UBS AG has issued a guarantee for the benefit of each counterparty of UBS Limited. Under this guarantee, UBS AG irrevocably and unconditionally guarantees each and every obligation that UBS Limited enters into. UBS AG promises to pay to that counterparty on demand any unpaid balance of such liabilities under the terms of the guarantee.
Joint and several liability UBS Switzerland AG
In June 2015, the Personal & Corporate Banking and Wealth Management businesses booked in Switzerland were transferred from UBS AG to UBS Switzerland AG through an asset transfer in accordance with the Swiss Merger Act (refer to “Establishment of UBS Switzerland AG” in this section for more information). Under the Swiss Merger Act, UBS AG assumed joint liability for obligations existing on the asset transfer date, 14 June 2015, which were transferred to UBS Switzerland AG. UBS AG has no liability for new obligations incurred by UBS Switzerland AG after the asset transfer date.
As of the asset transfer date, UBS AG assumed joint liability for approximately CHF 260 billion of obligations of UBS Switzerland AG, excluding the collateralized portion of secured contractual obligations. The joint liability amount declines as obligations mature, terminate or are novated following the asset transfer date. As of 31 December 2015, the joint liability amounted to approximately CHF 55 billion.
As of 31 December 2015, the probability of an outflow under this joint and several liability was assessed to be remote and as a result, the table above does not include any exposures arising under this joint and several liability.
Statement of changes in equity |
CHF million | | Share capital | | Statutory capital reserve | | Statutory earnings reserve | | Voluntary earnings reserve | | Net profit / (loss) for the period | | Total equity |
Balance as of 1 January 2015 | | 384 | | 40,782 | | (12,329) | | 5,689 | | 7,849 | | 42,376 |
Capital increase | | 1 | | | | | | | | | | 1 |
Dividends and other distributions | | | | (2,633) | | | | | | | | (2,633) |
Net profit / (loss) appropriation | | | | | | 7,849 | | | | (7,849) | | 0 |
Net profit / (loss) for the period | | | | | | | | | | 11,984 | | 11,984 |
Balance as of 31 December 2015 | | 386 | | 38,149 | | (4,480) | | 5,689 | | 11,984 | | 51,728 |
Statement of appropriation of retained earnings and proposed dividend distribution
The Board of Directors proposes that the Annual General Meeting of Shareholders (AGM) on 4 May 2016 approves the following appropriation of retained earnings and dividend distribution. Provided that the proposed dividend distribution is approved, the payment of CHF 3,434 million would be made on 12 May 2016 to UBS Group AG. Dividend payments out of retained earnings are generally subject to Swiss withholding tax. However, as certain conditions are met, the withholding tax related to the dividend distribution from UBS AG to UBS Group AG will be settled with the Swiss Federal Tax Administration through a so-called dividend notification procedure. Under this procedure, effectively no tax will be withheld.
Proposed appropriation of retained earnings | | |
| | For the year ended |
CHF million | | 31.12.15 |
Net profit for the period | | 11,984 |
Retained earnings carried forward | | 0 |
Total retained earnings available for appropriation | | 11,984 |
| | |
Proposed appropriation of retained earnings | | |
Appropriation to general reserve: statutory earnings reserve | | (4,480) |
Appropriation to voluntary earnings reserve | | (4,070) |
Dividend distribution | | (3,434) |
Retained earnings carried forward | | 0 |
Legal entity financial and regulatory information
Notes to the UBS AG standalone financial statements
Notes to the UBS AG standalone financial statements
Note 1 Name, legal form and registered office
UBS AG is incorporated and domiciled in Switzerland. Its registered offices are at Bahnhofstrasse 45, CH-8001 Zurich and Aeschenvorstadt 1, CH-4051 Basel, Switzerland. UBS AG operates under the Swiss Code of Obligations and Swiss Federal Banking Law as a stock corporation (Aktiengesellschaft), a corporation that has issued shares of common stock to investors. UBS AG is 100% owned by UBS Group AG, the ultimate parent of the UBS Group.
Note 2 Accounting policies
a) Significant accounting policies
UBS AG standalone financial statements are prepared in accordance with Swiss GAAP (FINMA Circular 2015 / 1 and the Banking Ordinance) in the form of reliable assessment statutory single-entity financial statements. The accounting policies are principally the same as for the consolidated financial statements outlined in Note 1 to the consolidated financial statements. Major differences between the Swiss GAAP requirements and International Financial Reporting Standards are described in Note 38 to the consolidated financial statements. The significant accounting policies applied for the standalone financial statements of UBS AG are discussed below.
Risk management
UBS AG (standalone) is fully integrated into the Group-wide risk management process described in the audited part of the “Risk, treasury and capital management” section of this report.
Further information on the use of derivative instruments and hedge accounting are outlined in Notes 1 and 14 to the consolidated financial statements.
Compensation policy
The compensation structure and processes of UBS AG conform to the compensation principles and framework of UBS Group AG. For detailed information refer to the Compensation Report of UBS Group AG.
Foreign currency translation
Transactions denominated in foreign currency are translated into Swiss francs at the spot exchange rate on the date of the transaction. At the balance sheet date, all monetary assets and liabilities, as well as equity instruments recorded in Trading portfolio assets and Financial investments denominated in foreign currency, are translated into Swiss francs using the closing exchange rate. Non-monetary items measured at historic cost are translated at the exchange rate on the date of the transaction. Assets and liabilities of foreign branches are translated into Swiss francs at the closing exchange rate. Income and expense items of foreign branches are translated at weighted average exchange rates for the period. All currency translation effects are recognized in the income statement.
The main currency translation rates used by UBS AG can be found in Note 36 to the consolidated financial statements.
Structured products
Structured products consist of a host contract and one or more embedded derivatives that do not relate to UBS AG's own equity. The embedded derivatives are assessed for bifurcation for measurement purposes and presented in the same balance sheet line as the host contract. By applying the fair value option, certain structured debt instruments are measured at fair value as a whole, and recognized in Financial liabilities designated at fair value. Structured debt instruments comprise structured debt instruments issued and structured over-the-counter debt instruments. The fair value option for structured debt instruments can be applied only if the following criteria are cumulatively met:
– the structured debt instrument is measured on a fair value basis and is subject to risk management that is equivalent to risk management for trading activities;
– the application of the fair value option eliminates or significantly reduces an accounting mismatch that would otherwise arise; and
– changes in fair value attributable to changes in unrealized own credit are not recognized in the income statement and the balance sheet.
Fair value changes related to Financial liabilities designated at fair value, excluding changes in unrealized own credit, are recognized in Net trading income. Interest expense on Financial liabilities designated at fair value is recognized in Interest expense.
® Refer to Note 18 for more information
Note 2 Accounting policies (continued)
Investments in subsidiaries and other participations
Investments in subsidiaries and other participations are equity interests that are held to carry on the business of UBS AG or for other strategic purposes. They include all subsidiaries directly held by UBS AG through which UBS AG conducts its business on a global basis. The investments are measured individually and carried at cost less impairment. The carrying value is tested for impairment when indications for a decrease in value exist, which include incurrence of significant operating losses or a severe depreciation of the currency in which the investment is denominated. If an investment in a subsidiary is impaired, its value is generally written down to the net asset value. Subsequent recoveries in value are recognized up to the original cost value based on either the increased net asset value or a value above the net asset value if, in the opinion of management, forecasts of future profitability provide sufficient evidence that a carrying value above net asset value is supported. Management may exercise its discretion as to what extent and in which period a recovery in value is recognized.
Impairments of investments are presented as Impairment of investments in subsidiaries and other participations. Reversals of impairments are presented as Extraordinary income in the income statement. Impairments and partial or full reversals of impairments for a subsidiary during the same annual period are determined on a net basis.
Deferred taxes
Deferred tax assets are not recognized in UBS AG’s standalone financial statements. However, deferred tax liabilities may be recognized for taxable temporary differences. Changes in the deferred tax liability balance are recognized in the income statement.
Services provided to and received from subsidiaries, affiliated entities and UBS Group AG
Services provided to and received from UBS Group AG or any of its subsidiaries are settled in cash as hard cost transfers or hard revenue transfers paid or received.
When the nature of the underlying transaction between UBS AG and UBS Group AG or any of its subsidiaries contains a single, clearly identifiable service element, related income and expenses are presented in the respective income statement line item, e.g., Fee and commission income from securities and investment business, Other fee and commission income, Fee and commission expense, Net trading income or General and administrative expenses. To the extent the nature of the underlying transaction contains various service elements and is not clearly attributable to a particular Income statement line item, related income and expenses are presented in Sundry ordinary income and Sundry ordinary expenses.
® Refer to Notes 4 and 6 for more information
Pension and other post-employment benefit plans
Swiss GAAP permits the use of IFRS or Swiss accounting standards for pension and other post-employment benefit plans, with the election made on a plan-by-plan basis.
UBS AG has elected to apply Swiss GAAP (FER 16) for the Swiss pension plan in its standalone financial statements. The requirements of Swiss GAAP are better aligned with the specific nature of Swiss pension plans, which are hybrid in that they combine elements of defined contribution and defined benefit plans, but are treated as defined benefit plans under IFRS. Swiss GAAP requires that the employer contributions to the pension fund are recognized as Personnel expenses in the income statement. The employer contributions to the Swiss pension fund are determined as a percentage of contributory compensation. Further, Swiss GAAP requires an assessment as to whether, based on the financial statements of the pension fund prepared in accordance with Swiss accounting standards (FER 26), an economic benefit to, or obligation of, UBS AG arises from the pension fund and is recognized in the balance sheet when conditions are met. Conditions for recording a pension asset or liability would be met if, for example, an employer contribution reserve is available or UBS AG is required to contribute to the reduction of a pension deficit (on a FER 26 basis).
Key differences between Swiss GAAP and IFRS include the treatment of dynamic elements, such as future salary increases and future interest credits on retirement savings, which are not considered under the static method used in accordance with Swiss GAAP. Also, the discount rate used to determine the defined benefit obligation in accordance with IFRS is based on the yield of high-quality corporate bonds of the market in the respective pension plan country. The discount rate used in accordance with Swiss GAAP, i.e., the technical interest rate, is determined by the Pension Foundation Board based on the expected returns of the Board’s investment strategy.
® Refer to Note 20 for more information
UBS AG has elected to apply IFRS (IAS 19) for its non-Swiss defined benefit plans. However, remeasurements of the defined benefit obligation and the plan assets are recognized in the income statement rather than directly in equity. For corresponding disclosures in accordance with IAS 19 requirements, refer to Note 28 to the consolidated financial statements.
Legal entity financial and regulatory information
Notes to the UBS AG standalone financial statements
Note 2 Accounting policies (continued)
Subordinated assets and liabilities
Subordinated assets are comprised of claims that arise from an irrevocable written declaration where in the event of liquidation, bankruptcy or restructuring of the debtor, rank after the claims of all other creditors and may not be offset against amounts payable to the debtor nor secured by its assets. Subordinated liabilities are comprised of corresponding obligations.
Subordinated assets and liabilities that contain a point-of-non-viability clause in accordance with Swiss capital requirements per articles 29 and 30 of the Capital Adequacy Ordinance are disclosed as being subject to mandatory conversion and / or debt waiver and provide for the claim or the obligation to be written off or converted into equity in the event that the issuing bank reaches a point of non-viability.
Dispensations in the standalone financial statements
As UBS AG prepares consolidated financial statements in accordance with IFRS, UBS AG is exempt from various disclosures in the standalone financial statements. The dispensations include the management report, the statement of cash flows and various note disclosures, as well as the publication of interim financial statements.
b) Changes in accounting policies, comparability and other adjustments
Comparative period figures
Comparative figures presented for 31 December 2014 include the Personal & Corporate Banking and Wealth Management businesses booked in Switzerland, which were transferred from UBS AG to UBS Switzerland AG effective 1 April 2015.
® Refer to “Establishment of UBS Switzerland AG” within this section of the report for more information
Furthermore, as explained in further detail below, UBS AG adopted the revisions to Swiss GAAP retrospectively from 1 January 2015. The comparative 2014 income statement and balance sheet were only amended for changes in presentation. Also, no comparatives are provided for Note disclosures that are newly required under revised Swiss GAAP, as UBS AG made use of the available transition relief.
Lastly, UBS AG re-assessed the presentation of hard cost and revenue transfers and 2015 figures are presented on a revised basis, while comparative 2014 amounts were not amended. Further details are provided on the next page.
Amendment of accounting standards applicable to banks and securities dealers
The Swiss Law on Accounting and Financial Reporting (32nd title of the Swiss Code of Obligations) was revised in 2011 and became effective on 1 January 2013 with a transition period of two years (i.e., is effective for annual periods beginning on or after 1 January 2015). Following this change, the accounting standards applicable to banks and securities dealers were amended accordingly. On 30 April 2014, the Swiss Federal Council passed the amended Banking Ordinance, and on 3 June 2014 the new FINMA Circular 2015/1 Accounting – banks was published. Revised Swiss GAAP, in accordance with the amended Banking Ordinance and the new FINMA Circular, is effective for annual periods beginning on or after 1 January 2015. UBS AG made use of transition relief for interim reporting from the first to third quarter of 2015 and adopted revised Swiss GAAP as of 1 November 2015 for the 2015 annual financial statements, retrospectively from 1 January 2015.
The main transition effects on the UBS AG standalone financial statements from this adoption are summarized below.
Recognition and measurement changes
The scope of the fair value option was increased to include structured debt instruments with embedded derivatives that are clearly and closely related to the host debt contracts. As a result, structured debt instruments with a fair value in the amount of CHF 19.3 billion were reclassified to Financial liabilities designated at fair value from Due to customers and Bonds issued and loans from central mortgage institutions. The transition impact from measuring those structured debt instruments at fair value was CHF 190 million, which was recognized as a decrease to Net trading income in 2015.
Own bonds held in the amount of CHF 4.9 billion previously recognized within Trading portfolio assets were offset against bonds issued recognized within Financial liabilities designated at fair value and Bonds issued and loans from central mortgage institutions. An accumulated measurement difference between own bonds held and own bonds issued in the amount of CHF 25 million was recognized as a decrease to Net trading income in 2015.
A reduction of the useful life of certain intangible assets from 20 to 10 years had an immaterial impact on the income statement and balance sheet.
Note 2 Accounting policies (continued)
Revision to Swiss GAAP: presentational balance sheet changes |
| | Former Swiss GAAP | Revised Swiss GAAP | | Absolute change |
CHF million | | 31.12.14 | 31.12.14 | | 31.12.14 |
| | | | | |
Total assets | | 777,893 | 777,893 | | 0 |
of which: Money market paper | | 10,966 | | | (10,966) |
of which: Trading portfolio assets | | 101,820 | 107,549 | | 5,729 |
of which: Financial investments | | 37,154 | 42,384 | | 5,230 |
of which: Due from banks | | 112,649 | 39,245 | | (73,404) |
of which: Due from customers | | 183,091 | 156,344 | | (26,747) |
of which: Receivables from securities financing transactions | | | 100,158 | | 100,158 |
| | | | | |
Total liabilities | | 735,517 | 735,517 | | 0 |
of which: Money market paper issued | | 34,235 | | | (34,235) |
of which: Bonds issued and loans from central mortgage institutions | | 77,067 | 111,302 | | 34,235 |
of which: Due to banks | | 94,952 | 43,787 | | (51,165) |
of which: Due to customers on savings and deposit accounts | | 112,709 | | | (112,709) |
of which: Other amounts due to customers | | 289,779 | | | (289,779) |
of which: Due to customers | | | 397,194 | | 397,194 |
of which: Payables from securities financing transactions | | | 56,460 | | 56,460 |
Presentation and disclosure changes
The presentation order of certain items in the income statement was amended and different sub-totals were added to the income statement. Furthermore, Credit loss (expense) / recovery is now included within Net interest income, whereas previously this was included within Allowances, provisions and losses. The comparative income statement for 2014 was amended accordingly and as a result, Net interest income and Total operating income decreased by CHF 129 million with a corresponding increase in Changes in provisions and other allowances and losses, reflecting the aforementioned change in presentation of Credit loss (expense) / recovery. There was no impact on net profit or equity.
The structure of the balance sheet was also amended. Money market paper held and money market paper issued are no longer shown as separate balance sheet line items but are instead reported within Trading portfolio assets, Financial investments, Due from customers and Bonds issued and loans from central mortgage institutions. Conversely, Receivables from securities financing transactions and Payables from securities financing transactions are now shown separately, whereas previously these receivables and payables were reported within Due from banks, Due from customers, Due to banks and Due to customers. Lastly, the previously disclosed balance sheet lines Due to customers on savings and deposit accounts and Other amounts due to customers were combined into Due to customers. The table above provides the quantitative effect on the balance sheet as of 31 December 2014 from these presentational changes.
In addition to the aforementioned changes to the income statement and balance sheet, certain Notes have been added to the financial statements.
Presentation of internal hard transfers
During 2015, UBS re-assessed the presentation of hard cost and revenue transfers between UBS AG and its subsidiaries, affiliated entities and UBS Group AG, and aligned the presentation of the related income and expenses with the underlying nature of the transaction for the year ended 31 December 2015, without adjusting comparative period amounts. When the nature of the underlying transaction contains a single, clearly identifiable service element, related income and expenses are newly presented in the respective income statement line item. Only to the extent that the nature of the underlying transaction contains various service elements and is not clearly attributable to a particular Income statement line item, related income and expenses continue to be presented in Sundry ordinary income and Sundry ordinary expenses.
Legal entity financial and regulatory information
Notes to the UBS AG standalone financial statements
Note 3a Net trading income by business
| | For the year ended | | % change from |
CHF million | | 31.12.15 | | 31.12.14 | | 31.12.14 |
Investment Bank Corporate Client Solutions | | 318 | | 56 | | 467 |
Investment Bank Investor Client Services | | 3,203 | | 3,039 | | 5 |
Other business divisions and Corporate Center | | 205 | | 313 | | (35) |
Total net trading income | | 3,725 | | 3,407 | | 9 |
Note 3b Net trading income by underlying risk category
| | For the year ended |
CHF million | | 31.12.15 |
Interest rate instruments (including funds) | | (346) |
Foreign exchange instruments | | 1,912 |
Equity instruments (including funds) | | 1,822 |
Credit instruments | | 290 |
Precious metals / commodities | | 47 |
Total net trading income | | 3,725 |
of which: net gains / (losses) from financial liabilities designated at fair value¹ | | 3,139 |
1 Excludes fair value changes of hedges related to financial liabilities designated at fair value and foreign currency effects arising from translating foreign currency transactions into the respective functional currency, both of which are reported within net trading income. |
Note 4 Sundry ordinary income and expenses
| | For the year ended | | % change from |
CHF million | | 31.12.15 | | 31.12.14 | | 31.12.14 |
Gains from sale of loans and receivables | | 23 | | 47 | | (52) |
Income from hard cost transfers¹˒² | | 4,580 | | 2,498 | | 83 |
Income from hard revenue transfers² | | 18 | | 1,853 | | (99) |
Other | | 86 | | 96 | | (11) |
Total sundry ordinary income | | 4,706 | | 4,494 | | 5 |
Losses from early redemption of debt | | (275) | | (4) | | |
Expenses from hard revenue transfers² | | (497) | | (1,772) | | (72) |
Other | | (59) | | (40) | | 47 |
Total sundry ordinary expenses | | (831) | | (1,816) | | (54) |
1 Represents income received from UBS Group AG and subsidiaries in the UBS Group for services provided by UBS AG. Services provided by UBS AG primarily related to Corporate Center functions. 2 Refer to Note 2b for more information. |
Note 5 Personnel expenses
| | For the year ended |
CHF million | | 31.12.15 |
Salaries | | 3,459 |
Variable compensation – performance awards | | 1,707 |
Variable compensation – other | | 191 |
Contractors | | 303 |
Social security | | 408 |
Pension and other post-employment benefit plans | | 122 |
of which: value adjustments for economic benefits or obligations from pension funds¹ | | (318) |
Wealth Management Americas: Financial advisor compensation | | 8 |
Other personnel expenses | | 240 |
Total personnel expenses | | 6,438 |
1 Reflects the remeasurement of the defined benefit obligation and return on plan assets for the non-Swiss defined benefit plans where UBS AG applies IAS 19. |
Note 6 General and administrative expenses
| | For the year ended |
CHF million | | 31.12.15 |
Occupancy | | 588 |
Rent and maintenance of IT equipment | | 383 |
Communication and market data services | | 322 |
Administration¹ | | 1,413 |
of which: hard cost transfers paid | | 955 |
Marketing and public relations | | 283 |
Travel and entertainment | | 226 |
Fees to audit firms | | 53 |
of which: financial and regulatory audits | | 44 |
of which: audit related services | | 6 |
of which: tax and other services | | 3 |
Other professional fees | | 776 |
Outsourcing of IT and other services | | 1,571 |
Total general and administrative expenses | | 5,615 |
1 Includes hard cost transfers paid to UBS Group AG and subsidiaries in the UBS Group for services provided to UBS AG. |
Legal entity financial and regulatory information
Notes to the UBS AG standalone financial statements
Note 7 Extraordinary income and expenses
| | For the year ended | | % change from |
CHF million | | 31.12.15 | | 31.12.14 | | 31.12.14 |
Gains from disposals of subsidiaries and other participations | | 334 | | 96 | | 249 |
Reversal of impairments and provisions of subsidiaries and other participations | | 9,551 | | 4,646 | | 106 |
Prior period related income | | 0 | | 63 | | (100) |
Other extraordinary income | | 379 | | 45 | | 735 |
Total extraordinary income | | 10,264 | | 4,850 | | 112 |
Losses from disposals of subsidiaries and other participations | | 1 | | 0 | | |
Prior period related expenses | | 0 | | 55 | | (100) |
Other extraordinary expenses | | 134 | | 2 | | |
Total extraordinary expenses | | 136 | | 57 | | 139 |
In the third quarter of 2015, UBS AG contributed its participations in UBS Americas Inc., UBS Securities LLC and three Asset Management subsidiaries into UBS Americas Holding LLC, a direct subsidiary of UBS AG. This contribution was made at a fair value of CHF 21.2 billion, resulting in a gain of CHF 10.0 billion that was recognized in the income statement, largely as extraordinary income, and which increased UBS AG’s investment value in UBS Americas Holding LLC.
| | For the year ended |
CHF million | | 31.12.15 |
Income tax expense / (benefit) | | 186 |
of which: current | | 185 |
of which: deferred | | 1 |
Capital tax | | 34 |
Total tax expense / (benefit) | | 220 |
For the year ended 31 December 2015, the average tax rate, defined as income tax expense divided by the sum of operating profit and extraordinary income minus extraordinary expenses and capital tax, was 1.5%. Income tax expense for the year ended 31 December 2015 includes a benefit of CHF 3,188 million from the utilization of tax losses carried forward in UBS AG's main tax jurisdictions.
Note 9 Securities financing transactions
CHF billion | | 31.12.15 |
| | |
On-balance sheet | | |
Receivables from securities financing transactions, gross | | 133.3 |
Netting of securities financing transactions | | (42.8) |
Receivables from securities financing transactions, net | | 90.5 |
Payables from securities financing transactions, gross | | 98.2 |
Netting of securities financing transactions | | (42.8) |
Payables from securities financing transactions, net | | 55.5 |
Assets pledged as collateral in connection with securities financing transactions | | 54.0 |
of which: trading portfolio assets | | 52.8 |
of which: assets which may be sold or repledged by counterparties | | 51.9 |
of which: financial investments | | 1.2 |
of which: assets which may be sold or repledged by counterparties | | 1.2 |
| | |
Off-balance sheet | | |
Fair value of assets received as collateral in connection with securities financing transactions | | 249.9 |
of which: repledged | | 183.0 |
of which: sold in connection with short sale transactions | | 21.2 |
Note 10a Collateral for loans and off-balance sheet transactions
| | 31.12.15 |
| | Secured | | Unsecured | | Total |
| | Secured by collateral | | Secured by other credit enhancements² | | | | |
CHF million | | Real estate | | Other collateral¹ | | | | | |
| | | | | | | | | | |
On-balance sheet | | | | | | | | | | |
Due from customers, gross | | 4 | | 64,223 | | 1,457 | | 31,947³ | | 97,630 |
Mortgage loans, gross | | 4,681 | | 0 | | 0 | | 0 | | 4,681 |
of which: residential mortgages | | 4,605 | | | | | | | | 4,605 |
of which: office and business premises mortgages | | 4 | | | | | | | | 4 |
of which: industrial premises mortgages | | 44 | | | | | | | | 44 |
of which: other mortgages | | 28 | | | | | | | | 28 |
Total on-balance sheet, gross | | 4,684 | | 64,223 | | 1,457 | | 31,947 | | 102,311 |
Allowances | | (2) | | (152) | | 0 | | (77) | | (231) |
Total on-balance sheet, net | | 4,683 | | 64,071 | | 1,457 | | 31,870 | | 102,080 |
| | | | | | | | | | |
Off-balance sheet | | | | | | | | | | |
Contingent liabilities, gross | | 0 | | 2,121 | | 2,093 | | 23,573 | | 27,787 |
Irrevocable commitments, gross | | 456 | | 9,673 | | 7,515 | | 33,256 | | 50,901 |
Forward starting reverse repurchase and securities borrowing transactions | | 0 | | 1,632 | | 0 | | 0 | | 1,632 |
Liabilities for calls on shares and other equities | | 0 | | 0 | | 0 | | 7 | | 7 |
Total off-balance sheet | | 456 | | 13,425 | | 9,608 | | 56,837 | | 80,327 |
1 Mainly comprised of cash and securities. 2 Includes credit default swaps and guarantees. 3 Primarily comprised of amounts due from subsidiaries. |
Legal entity financial and regulatory information
Notes to the UBS AG standalone financial statements
Note 10b Impaired financial instruments
| | 31.12.15 |
CHF million | | Gross impaired financial instruments | | Allowances and provisions | | Estimated liquidation proceeds of collateral | | Net impaired financial instruments |
Amounts due from customers | | 474 | | 229 | | 0 | | 245 |
Mortgage loans | | 5 | | 2 | | 4 | | 0 |
Guarantees and loan commitments | | 17 | | 3 | | 0 | | 14 |
Total impaired financial instruments | | 496 | | 234 | | 4 | | 259 |
CHF million | | Balance as of 31.12.14 | Increase recognized in the income statement | | Release recognized in the income statement | | Write-offs | | Recoveries and past due interest | | Reclassifications / other² | | Foreign currency translation | | Transfer to UBS Switzerland AG | | Balance as of 31.12.15 |
Specific allowances for amounts due from customers and mortgage loans | | 655 | 198 | | (39) | | (18) | | 21 | | 44 | | (18) | | (611) | | 231 |
Specific allowances for due from banks | | 12 | 0 | | 0 | | 0 | | 0 | | 0 | | 0 | | (12) | | 0 |
Collective allowances¹ | | 5 | 0 | | (1) | | 0 | | 0 | | 0 | | 0 | | (5) | | 0 |
Other allowances | | 0 | 0 | | 0 | | 0 | | 0 | | 0 | | 0 | | 0 | | 0 |
Total allowances | | 673 | 198 | | (40) | | (18) | | 21 | | 44 | | (18) | | (628) | | 231 |
1 Mainly relates to amounts due from customers. 2 Includes CHF 47 million related to a specific allowance for amounts due from customers, which was recognized in a prior period. |
CHF million | | Balance as of 31.12.14 | Increase recognized in the income statement | | Release recognized in the income statement | | Provisions used in conformity with designated purpose | | Recoveries | | Reclassifica- tions | | Foreign currency translation | | Transfer to UBS Switzerland AG | | Balance as of 31.12.15 |
Default risk related to loan commitments and guarantees | | 23 | 3 | | (3) | | 0 | | 0 | | 3 | | 0 | | (23) | | 3 |
Operational risks | | 28 | 8 | | (5) | | (3) | | 0 | | 0 | | (2) | | (7) | | 20 |
Litigation, regulatory and similar matters¹ | | 1,881 | 95 | | (73) | | (720) | | 0 | | 0 | | (17) | | (103) | | 1,063 |
Restructuring | | 329 | 158 | | (40) | | (160) | | 7 | | 0 | | 3 | | (9) | | 288 |
Real estate² | | 83 | 26 | | (1) | | (16) | | 3 | | 0 | | (1) | | 0 | | 94 |
Employee benefits | | 208 | 4 | | (15) | | 0 | | 2 | | 0 | | (7) | | (27) | | 165 |
Parental support to subsidiaries | | 97 | 0 | | 0 | | 0 | | 0 | | 0 | | 0 | | 0 | | 96 |
Deferred taxes | | 10 | 1 | | 0 | | 0 | | 0 | | 0 | | (1) | | 0 | | 10 |
Other | | 172 | 6 | | (15) | | (112) | | 0 | | 0 | | 0 | | (5) | | 47 |
Total provisions | | 2,831 | 301 | | (152) | | (1,011) | | 12 | | 3 | | (24) | | (174) | | 1,786 |
1 Includes provisions for litigation resulting from security risks. 2 Includes provisions for onerous lease contracts of CHF 25 million as of 31 December 2015 (31 December 2014: CHF 14 million) and reinstatement cost provisions for leasehold improvements of CHF 69 million as of 31 December 2015 (31 December 2014: CHF 70 million). |
Note 12 Trading portfolio and other financial instruments measured at fair value
CHF million | | 31.12.15 |
| | |
Assets | | |
Trading portfolio assets | | 94,210 |
of which: debt instruments¹ | | 22,261 |
of which: listed | | 13,831 |
of which: equity instruments | | 70,035 |
of which: precious metals and other physical commodities | | 1,915 |
Total assets measured at fair value | | 94,210 |
of which: fair value derived using a valuation model | | 18,783 |
of which: securities eligible for repurchase transactions in accordance with liquidity regulations | | 15,894 |
| | |
Liabilities | | |
Trading portfolio liabilities | | 21,179 |
of which: debt instruments¹ | | 4,190 |
of which: listed | | 3,899 |
of which: equity instruments | | 16,989 |
Financial liabilities designated at fair value² | | 58,104 |
Total liabilities measured at fair value | | 79,283 |
of which: fair value derived using a valuation model | | 60,520 |
1 Includes money market paper. 2 Refer to Note 18 for more information. |
Legal entity financial and regulatory information
Notes to the UBS AG standalone financial statements
Note 13 Derivative instruments
| | 31.12.15 |
CHF billion | | PRV² | | NRV³ | | Total notional values |
Interest rate contracts | | | | | | |
Forwards¹ | | 0.1 | | 0.3 | | 2,458 |
Swaps | | 69.3 | | 60.7 | | 7,636 |
of which: designated in hedge accounting relationships | | 0.4 | | 0.0 | | 6 |
Futures | | 0.0 | | 0.0 | | 335 |
Over-the-counter (OTC) options | | 17.4 | | 19.2 | | 1,132 |
Exchange-traded options | | 0.0 | | 0.0 | | 208 |
Total | | 86.9 | | 80.1 | | 11,769 |
Foreign exchange contracts | | | | | | |
Forwards | | 17.7 | | 16.5 | | 1,388 |
Interest and currency swaps | | 38.8 | | 38.0 | | 2,837 |
Futures | | 0.0 | | 0.0 | | 8 |
Over-the-counter (OTC) options | | 9.6 | | 9.3 | | 975 |
Exchange-traded options | | 0.0 | | 0.0 | | 8 |
Total | | 66.1 | | 63.8 | | 5,217 |
Equity / index contracts | | | | | | |
Forwards | | 0.1 | | 0.1 | | 15 |
Swaps | | 3.5 | | 4.6 | | 150 |
Futures | | 0.0 | | 0.0 | | 25 |
Over-the-counter (OTC) options | | 4.7 | | 6.7 | | 156 |
Exchange-traded options | | 5.5 | | 6.5 | | 231 |
Total | | 13.8 | | 18.0 | | 577 |
Credit derivative contracts | | | | | | |
Credit default swaps | | 6.0 | | 5.9 | | 318 |
Total return swaps | | 0.6 | | 0.7 | | 12 |
Other | | 0.0 | | 0.0 | | 4 |
Total | | 6.7 | | 6.5 | | 334 |
Commodity, precious metals and other contracts | | | | | | |
Forwards | | 0.3 | | 0.3 | | 5 |
Swaps | | 0.7 | | 0.5 | | 19 |
Futures | | 0.0 | | 0.0 | | 8 |
Over-the-counter (OTC) options | | 0.9 | | 0.6 | | 19 |
Exchange-traded options | | 0.7 | | 0.9 | | 11 |
Total | | 2.5 | | 2.3 | | 63 |
Total before netting as of 31 December 2015 | | 176.0 | | 170.7 | | 17,960 |
of which: trading derivatives | | 175.6 | | 170.7 | | |
of which: fair value derived using a valuation model | | 175.2 | | 170.3 | | |
of which: derivatives designated in hedge accounting relationships | | 0.4 | | 0.0 | | |
of which: fair value derived using a valuation model | | 0.4 | | 0.0 | | |
Netting with cash collateral payables / receivables | | (18.7) | | (9.7) | | |
Replacement value netting | | (136.3) | | (136.3) | | |
Total after netting as of 31 December 2015 | | 21.0 | | 24.7 | | |
of which: with central clearing counterparties | | 0.0 | | 0.6 | | |
of which: with bank and broker-dealer counterparties | | 7.4 | | 9.2 | | |
of which: other client counterparties | | 13.6 | | 14.9 | | |
| | |
| | 31.12.14 |
CHF billion | | PRV² | | NRV³ | | Total notional values |
Total before netting as of 31 December 2014 | | 262.2 | | 258.7 | | 25,017 |
Netting with cash collateral payables / receivables | | (20.0) | | (16.0) | | |
Replacement value netting | | (199.8) | | (199.8) | | |
Total after netting as of 31 December 2014 | | 42.4 | | 42.9 | | |
1 Includes forward rate agreements. 2 PRV: positive replacement values. 3 NRV: negative replacement values. |
Note 14a Financial investments by instrument type
| | 31.12.15 |
CHF million | | Carrying value | | Fair value |
Debt instruments available-for-sale | | 27,296 | | 27,354 |
Equity instruments | | 223 | | 234 |
of which: qualified participations¹ | | 133 | | 137 |
Property | | 9 | | 9 |
Total financial investments | | 27,528 | | 27,598 |
of which: securities eligible for repurchase transactions in accordance with liquidity regulations | | 27,127 | | 27,181 |
1 Qualified participations are investments in which UBS AG holds 10% or more of the total capital or has at least 10% of total voting rights. |
Note 14b Financial investments by counterparty rating – debt instruments
CHF million | | 31.12.15 |
Internal UBS rating¹ | | |
0–1 | | 26,632 |
2–3 | | 653 |
4–5 | | 0 |
6–8 | | 0 |
9–13 | | 0 |
Non-rated | | 10 |
Total financial investments | | 27,296 |
1 Refer to Note 17 for more information. |
| | | | | | % change from |
CHF million | | 31.12.15 | | 31.12.14 | | 31.12.14 |
Settlement and clearing accounts | | 116 | | 348 | | (67) |
VAT and other indirect tax receivables | | 226 | | 179 | | 26 |
Bail deposit¹ | | 1,210 | | 1,323 | | (9) |
Other | | 2,435 | | 1,718 | | 42 |
of which: other receivables from UBS Group AG and subsidiaries in the UBS Group | | 1,850 | | 1,344 | | 38 |
Total other assets | | 3,986 | | 3,568 | | 12 |
1 Refer to item 1 in Note 22b to the consolidated financial statements for more information. |
Note 15b Other liabilities
| | | | | | % change from |
CHF million | | 31.12.15 | | 31.12.14 | | 31.12.14 |
Deferral position for hedging instruments | | 2,826 | | 3,597 | | (21) |
Settlement and clearing accounts | | 232 | | 720 | | (68) |
Net defined benefit liabilities | | 129 | | 680 | | (81) |
VAT and other indirect tax payables | | 110 | | 232 | | (53) |
Other | | 2,208 | | 1,732 | | 27 |
of which: other payables to UBS Group AG and subsidiaries in the UBS Group | | 1,694 | | 818 | | 107 |
Total other liabilities | | 5,505 | | 6,962 | | (21) |
Legal entity financial and regulatory information
Notes to the UBS AG standalone financial statements
The table below provides information on assets that are primarily pledged in connection with derivative transactions. Information for 31 December 2014 included loans pledged to Swiss mortgage institutions and in connection with the issuance of covered bonds. These loans were transferred to UBS Switzerland AG during 2015. The table excludes securities financing transactions.
® Refer to Note 9 for more information on securities financing transactions
| | 31.12.15 | | 31.12.14 |
CHF million | | Carrying value of pledged assets | | Effective commitment | | Carrying value of pledged assets | | Effective commitment |
Mortgage loans² | | 0 | | 0 | | 27,973 | | 21,643 |
Securities | | 2,597 | | 258 | | 1,568 | | 0 |
Pledges of precious metals to subsidiaries and other | | 0 | | 0 | | 1,153 | | 0 |
Total pledged assets | | 2,597 | | 258 | | 30,694 | | 21,643 |
1 Excludes assets placed with central banks related to undrawn credit lines and for payment, clearing and settlement purposes (31 December 2015: CHF 2.1 billion, 31 December 2014: CHF 4.9 billion). 2 These pledged mortgage loans serve as collateral for existing liabilities against Swiss central mortgage institutions and for existing covered bond issuances. Of these pledged mortgage loans, approximately CHF 0 billion as 31 December 2015 (31 December 2014: approximately CHF 4.5 billion) could be withdrawn or used for future liabilities or covered bond issuances without breaching existing collateral requirements. |
Note 17 Country risk of total assets
The table below provides a breakdown of total non-Swiss assets by credit rating. These credit ratings represent the sovereign credit rating of the country to which the ultimate risk of the underlying asset is related. The ultimate risk country on unsecured loan positions is the domicile of the immediate borrower, or, in the case of a legal entity, the domicile of the ultimate parent entity. For collateralized or guaranteed positions, the ultimate risk country is the domicile of the provider of the collateral or guarantor, or, if applicable, the domicile of the ultimate parent entity of the provider of the collateral or guarantor. For mortgage loans, the ultimate risk country is the country where the real estate is located. Similarly, the ultimate risk country of property and equipment is the country where the property and equipment is located. Assets for which Switzerland is the ultimate risk country are provided separately in order to reconcile to total balance sheets assets.
® Refer to the "Risk management and control" section of this report for more information
| | | | | | 31.12.15 |
Classification | Internal UBS rating | Description | Moody’s Investors Service | Standard & Poor’s | Fitch | CHF million | % |
| 0 and 1 | Investment grade | Aaa | AAA | AAA | 227,855 | 48 |
Low risk | 2 | | Aa1 to Aa3 | AA+ to AA– | AA+ to AA– | 141,073 | 30 |
3 | | A1 to A3 | A+ to A– | A+ to AA– | 39,846 | 8 |
Medium risk | 4 | | Baa1 to Baa2 | BBB+ to BBB | BBB+ to BBB | 19,053 | 4 |
5 | | Baa3 | BBB– | BBB– | 4,399 | 1 |
High risk | 6 | Sub-investment grade | Ba1 | BB+ | BB+ | 2,430 | 1 |
7 | | Ba2 | BB | BB | 84 | 0 |
8 | | Ba3 | BB– | BB– | 73 | 0 |
9 | | B1 | B+ | B+ | 173 | 0 |
Very high risk | 10 | | B2 | B | B | 93 | 0 |
11 | | B3 | B– | B– | 954 | 0 |
12 | | Caa | CCC | CCC | 216 | 0 |
13 | | Ca to C | CC to C | CC to C | 82 | 0 |
Distressed | Default | Defaulted | D | D | D | 5 | 0 |
Subtotal | | | | | | 436,336 | 91 |
Switzerland | | | | | | 40,709 | 9 |
Total assets | | | | | | 477,045 | 100 |
Note 18 Structured debt instruments
The table below provides a breakdown of financial liabilities designated at fair value which are considered structured debt instruments.
CHF million | | 31.12.15 |
Fixed rate bonds with structured features | | 3,017 |
Structured debt instruments issued: | | |
Equity-linked | | 30,236 |
Rates-linked | | 16,118 |
Credit-linked | | 2,949 |
Commodities-linked¹ | | 1,075 |
FX-linked | | 218 |
Structured over-the-counter debt instruments | | 4,491 |
Total financial liabilities designated at fair value | | 58,104 |
1 Includes precious metals-linked debt instruments issued. |
In addition to financial liabilities designated at fair value, certain structured debt instruments were reported within the balance sheet lines Bonds issued and loans from central mortgage institutions and Due to customers. These instruments were bifurcated for measurement purposes. As of 31 December 2015, the carrying values of the host instruments amounted to CHF 3,304 million and CHF 320 million, respectively. The carrying values of the bifurcated embedded derivatives were negative CHF 126 million and positive CHF 66 million, respectively.
| | 31.12.15 | | 31.12.14 |
| | Par value in CHF | | Number of shares | | Of which: dividend bearing | | Par value in CHF | | Number of shares | | Of which: dividend bearing |
Share capital¹ | | 385,840,847 | | 3,858,408,466 | | 3,858,408,466 | | 384,456,091 | | 3,844,560,913 | | 3,842,445,658 |
of which: shares outstanding | | 385,840,847 | | 3,858,408,466 | | 3,858,408,466 | | 384,244,566 | | 3,842,445,658 | | 3,842,445,658 |
of which: treasury shares held by UBS AG | | 0 | | 0 | | 0 | | 211,526 | | 2,115,255 | | 0 |
Conditional share capital | | 55,235,276 | | 552,352,759 | | | | 51,620,031 | | 516,200,312 | | |
of which: capital increase during the year | | 1,384,755 | | 13,847,553 | | | | 255,884 | | 2,558,844 | | |
1 Registered shares issued. |
UBS AG's share capital is fully paid up. Each share has a par value of CHF 0.10 and entitles the holder to one vote at the UBS AG shareholder's meeting, if entered into the share register as having the right to vote, as well as a proportionate share of distributed dividends. UBS AG does not apply any restrictions or limitations on the transferability of shares.
Treasury shares
As of 1 January 2015, UBS AG held 2,115,255 treasury shares, which were exchanged with UBS Group AG shares in 2015.
Non-distributable reserves
Non-distributable reserves consist of 50% of the share capital of UBS AG, amounting to CHF 193 million as of 31 December 2015.
Non-cash dividends
During 2015, shares issued by UBS AG increased by 13,847,553 shares due to the issuance of new UBS AG shares out of conditional share capital upon distribution of a share dividend in May 2015.
As part of the establishment of UBS Business Solutions AG, UBS AG transferred its participation in the Poland Service Center as a dividend-in-kind at book value of CHF 5 million to UBS Group AG.
Legal entity financial and regulatory information
Notes to the UBS AG standalone financial statements
Note 19b Significant shareholders
| | 31.12.15 | | 31.12.14 |
CHF million, except where indicated | | Share capital held | Shares held (%) | | Share capital held | Shares held (%) |
Significant direct shareholder of UBS AG | | | | | | |
UBS Group AG | | 386 | 100 | | 372 | 97 |
Significant indirect shareholders of UBS AG | | | | | | |
Chase Nominees Ltd., London | | 35 | 9 | | 34 | 9 |
GIC Private Limited, Singapore | | 25 | 6 | | 25 | 7 |
DTC (Cede & Co.), New York¹ | | 24 | 6 | | 21 | 6 |
Nortrust Nominees Ltd, London | | 14 | 4 | | 13 | 4 |
1 DTC (Cede & Co.), New York, “The Depository Trust Company”, is a US securities clearing organization. |
Significant shareholders presented in this Note are those that, directly or indirectly, hold 3% or more of UBS AG’s total share capital. The sole direct shareholder of UBS AG is UBS Group AG, which holds 100% of UBS AG shares. These shares entitle to voting rights. Indirect shareholders of UBS AG included in the table above comprise direct shareholders of UBS Group AG, who are entered into the UBS Group AG share register. The shares and share capital of UBS AG held by indirect shareholders represent their relative holding of UBS Group AG shares. They do not have voting rights in UBS AG.
® Refer to Note 22 to the UBS Group AG standalone financial statements for more information on significant shareholders of UBS Group AG
Note 20 Swiss pension plan and non-Swiss defined benefit plans
a) Liabilities related to Swiss pension plan and non-Swiss defined benefit plans | | | | |
CHF million | | 31.12.15 | | 31.12.14 |
Provision for Swiss pension plan | | 0 | | 0 |
Net defined benefit liabilities for non-Swiss defined benefit plans | | 129 | | 680 |
Total provision for Swiss pension plan and net defined benefit liabilities for non-Swiss defined benefit plans | | 129 | | 680 |
Bank accounts at UBS and UBS debt instruments held by Swiss pension fund | | 260 | | 385 |
UBS derivative financial instruments held by Swiss pension fund | | 27 | | 102 |
Total liabilities related to Swiss pension plan and non-Swiss defined benefit plans | | 416 | | 1,168 |
|
b) Swiss pension plan | | | | |
| | As of or for the year ended |
CHF million | | 31.12.15 | | 31.12.14 |
Pension plan surplus¹ | | 2,243 | | 4,572 |
Economic benefit / (obligation) of UBS AG | | 0 | | 0 |
Change in economic benefit / obligation recognized in the income statement | | 0 | | 0 |
Employer contributions for the period recognized in the income statement | | 270 | | 444 |
Performance rewards related employer contributions accrued | | 30 | | 45 |
Total pension expense recognized in the income statement within Personnel expenses | | 300 | | 489 |
1 The pension plan surplus is determined in accordance with FER 26 and consists of the reserve for the fluctuation in asset value. The surplus did not represent an economic benefit for UBS AG in accordance with FER 16 as of 31 December 2015 or 31 December 2014. |
UBS AG has elected to apply FER 16 for the Swiss pension plan and IAS 19 for its UK and other non-Swiss defined benefit plans.
® Refer to Note 28 to the consolidated financial statements for more information on non-Swiss defined benefit plans in accordance with IAS 19
The Swiss pension plan had no employer contribution reserve in 2015 or 2014.
Note 21 Share-based compensation
Following the establishment of UBS Group AG as the ultimate holding company of the UBS Group, the obligations of UBS AG as grantor of certain outstanding awards under employee share, option, notional fund and deferred cash compensation plans were transferred to UBS Group AG. Expenses for such awards granted to UBS AG employees are charged by UBS Group AG to UBS AG. Obligations relating to deferred compensation plans which are required to be, and have been, granted by employing and / or sponsoring subsidiaries, such as UBS AG, have not been assumed by UBS Group AG and will continue on this basis. Furthermore, obligations related to other compensation vehicles, such as defined benefit pension plans and other local awards, have not been assumed by UBS Group AG and are retained by the relevant employing and / or sponsoring subsidiaries, such as UBS AG.
® Refer to Note 29 to the consolidated financial statements for more information
Transactions with related parties are conducted at internally agreed transfer prices, at arm’s length, or with respect to loans, fixed advances and mortgages to non-independent members of the Board of Directors and Group Executive Board members on the same terms and conditions that are available to other employees.
| | 31.12.15 |
CHF million | | Amounts due from | | Amounts due to |
Qualified shareholders | | 581 | | 5,776 |
of which: Due from / to customers | | 567 | | 5,171 |
Subsidiaries | | 119,900 | | 87,059 |
of which: Due from / to banks | | 37,278 | | 28,685 |
of which: Due from / to customers | | 23,308 | | 8,558 |
of which: Receivables / payables from securities financing transactions | | 54,422 | | 44,149 |
Affiliated entities | | 117 | | 5,752 |
of which: Due from / to customers | | 39 | | 5,699 |
Members of the Board of Directors and Group Executive Board | | 33 | | |
External auditors | | | | 20 |
Other related parties¹ | | 9 | | |
1 Primarily relates to UBS Securities Co. Limited, Beijing, in which UBS AG has a 24.99% equity interest. | | | | |
As of 31 December 2015, off-balance sheet positions related to subsidiaries amounted to CHF 26.5 billion, of which CHF 19.4 billion were guarantees to third parties and CHF 5.3 billion were loan commitments.
Note 23 Fiduciary transactions
| | | | | | % change from |
CHF million | | 31.12.15 | | 31.12.14 | | 31.12.14 |
Fiduciary deposits | | 310 | | 5,869 | | (95) |
of which: placed with third-party banks | | 310 | | 5,853 | | (95) |
of which: placed with subsidiaries and affiliated entities | | 0 | | 16 | | (100) |
Total fiduciary transactions | | 310 | | 5,869 | | (95) |
Fiduciary transactions encompass transactions entered into or granted by UBS AG that result in holding or placing assets on behalf of individuals, trusts, defined benefit plans and other institutions. Unless the recognition criteria for the assets are satisfied, these assets and the related income are excluded from UBS AG’s balance sheet and income statement, but disclosed in this Note as off-balance sheet fiduciary transactions. Client deposits that are initially placed as fiduciary transactions with UBS AG may be recognized on UBS AG’s balance sheet in situations in which the deposit is subsequently placed within UBS AG. In such cases, these deposits are not reported in the table above.
Legal entity financial and regulatory information
Notes to the UBS AG standalone financial statements
Note 24a Invested assets and net new money
| | For the year ended |
CHF billion | | 31.12.15 |
Fund assets managed | | 11 |
Discretionary assets | | 166 |
Other invested assets | | 311 |
Total invested assets | | 488 |
of which: double count | | 2 |
Net new money | | 0.0 |
Note 24b Development of invested assets
| | For the year ended |
CHF billion | | 31.12.15 |
Total invested assets at the beginning of the year¹ | | 1,076 |
Net new money | | 0 |
Market movements² | | 8 |
Foreign currency translation | | (29) |
Transfer to UBS Switzerland AG | | (557) |
Other effects | | (10) |
of which: acquisitions / (divestments) | | (10) |
Total invested assets at the end of the year¹ | | 488 |
1 Includes double counts. 2 Includes interest and dividend income. | | |
® Refer to Note 35 to the consolidated financial statements for more information ▲
Legal entity financial and regulatory information

Legal entity financial and regulatory information
UBS AG (standalone) regulatory information
UBS AG (standalone) regulatory information
Swiss SRB capital requirements and capital information
Pillar 3 | UBS AG is considered a systemically relevant bank (SRB) under Swiss banking law and is subject to capital regulations on a standalone basis.
Under Swiss SRB regulations, article 125 “Reliefs for financial groups and individual institutions” of the Swiss Capital Ordinance (CAO) stipulates that the Swiss Financial Market Supervisory Authority (FINMA) may grant, under certain conditions, capital relief to individual institutions, to ensure that an individual institution’s compliance with the capital requirements does not lead to a de facto overcapitalization of the group of which it is part.
FINMA granted relief concerning the regulatory capital requirements of UBS AG on a standalone basis by means of a decree issued on 20 December 2013, which became effective on 1 January 2014.
Reconciliation of Swiss federal banking law equity to Swiss SRB capital | |
CHF billion | 31.12.15 | 31.12.14³ |
Equity - Swiss federal banking law¹ | 51.7 | 42.4 |
Deferred tax assets | 1.9 | 3.5 |
Defined benefit plans | 0.0 | 3.7 |
Investments in the finance sector | (16.6) | (9.2) |
Goodwill and intangible assets | (0.4) | (0.4) |
Other² | (4.0) | (4.2) |
Common equity tier 1 capital (phase-in) | 32.7 | 35.9 |
Additional tier 1 capital (phase-in) | 0.0 | 0.0 |
Tier 2 capital (phase-in) | 0.0 | 6.4 |
Total capital (phase-in) | 32.7 | 42.2 |
1 Equity under Swiss federal banking law is adjusted to derive equity in accordance with IFRS and then further adjusted to derive common equity tier 1 (CET1) capital in accordance with Swiss SRB requirements. 2 Includes accruals for proposed dividends to shareholders and other items. 3 Comparative balances presented for 31 December 2014 include the Personal & Corporate Banking and Wealth Management businesses booked in Switzerland which were transferred from UBS AG to UBS Switzerland AG effective 1 April 2015. Refer to “Establishment of UBS Switzerland AG” within this section for more information. |
Swiss SRB capital ratio requirements and information (phase-in) |
| | Capital ratio (%) | | Capital |
| | Requirement | | Actual | | Requirement | | Eligible |
CHF million, except where indicated | | 31.12.15 | | 31.12.15 | 31.12.14¹ | | 31.12.15 | | 31.12.15 | 31.12.14¹ |
Common equity tier 1 capital | | 10.0 | | 14.4 | 12.2 | | 22,717 | | 32,656 | 35,851 |
of which: effect of countercyclical buffer | | 0.0 | | 0.0 | 0.1 | | 0 | | 0 | 322 |
Common equity tier 1 capital / high-trigger loss-absorbing capital | | 11.6 | | 14.4 | 12.2 | | 26,337 | | 32,656 | 35,851 |
Low-trigger loss-absorbing capital less net deductions | | | | 0.0 | 2.2 | | | | 0 | 6,390 |
Total capital | | 14.0 | | 14.4 | 14.4 | | 31,804 | | 32,656 | 42,241 |
1 Comparative balances presented for 31 December 2014 include the Personal & Corporate Banking and Wealth Management businesses booked in Switzerland, which were transferred from UBS AG to UBS Switzerland AG effective 1 April 2015. Refer to “Establishment of UBS Switzerland AG” for more information. |
Swiss SRB capital information (phase-in) |
CHF million, except where indicated | | | | | | | | | 31.12.15 | 31.12.14¹ |
Common equity tier 1 capital | | | | | | | | | | |
Common equity tier 1 capital | | | | | | | | | 32,656 | 35,851 |
Additional tier 1 capital | | | | | | | | | | |
High-trigger loss-absorbing capital | | | | | | | | | 1,252 | 0 |
Net deductions | | | | | | | | | (1,252) | 0 |
Total additional tier 1 capital | | | | | | | | | 0 | 0 |
Tier 1 capital | | | | | | | | | 32,656 | 35,851 |
Tier 2 capital | | | | | | | | | | |
Low-trigger loss-absorbing capital | | | | | | | | | 10,325 | 10,451 |
Net deductions | | | | | | | | | (10,325) | (4,061) |
Total tier 2 capital | | | | | | | | | 0 | 6,390 |
Total capital | | | | | | | | | 32,656 | 42,241 |
Common equity tier 1 capital ratio (%) | | | | | | | | | 14.4 | 12.2 |
Tier 1 capital ratio (%) | | | | | | | | | 14.4 | 12.2 |
Total capital ratio (%) | | | | | | | | | 14.4 | 14.4 |
Risk-weighted assets | | | | | | | | | 227,170 | 293,889 |
1 Comparative balances presented for 31 December 2014 include the Personal & Corporate Banking and Wealth Management businesses booked in Switzerland, which were transferred from UBS AG to UBS Switzerland AG effective 1 April 2015. Refer to “Establishment of UBS Switzerland AG” for more information. |
Legal entity financial and regulatory information
UBS AG (standalone) regulatory information
Leverage ratio information
Swiss SRB leverage ratio
The Swiss SRB leverage ratio requirement is equal to 24% of the capital ratio requirements (excluding the countercyclical buffer requirement).
As of 31 December 2015, the effective total leverage ratio requirement for UBS AG (standalone) was 3.4%, resulting from multiplying the total capital ratio requirement (excluding the countercyclical buffer requirement) of 14.0% by 24%.
Swiss SRB leverage ratio requirements and information (phase-in) |
| | Swiss SRB leverage ratio (%) | | Swiss SRB leverage ratio capital |
| | Requirement¹ | | Actual | | Requirement² | | Eligible |
CHF million, except where indicated | | 31.12.15 | | 31.12.15 | 31.12.14³ | | 31.12.15 | | 31.12.15 | 31.12.14³ |
Common equity tier 1 capital | | 2.4 | | 5.2 | 3.8 | | 15,216 | | 32,656 | 35,851 |
Common equity tier 1 capital and high-trigger loss-absorbing capital | | 2.8 | | 5.2 | 3.8 | | 17,640 | | 32,656 | 35,851 |
Total capital | | 3.4 | | 5.2 | 4.5 | | 21,302 | | 32,656 | 42,241 |
1 Requirements for common equity tier 1 capital (24% of 10%), common equity tier 1 capital / high-trigger loss absorbing capital (24% of 11.6%) and total capital (24% of 14%). 2 The leverage ratio denominator (LRD) used to calculate the actual requirements is calculated in accordance with Swiss SRB rules. From 31 December 2015 onward, these are fully aligned to the BIS Basel III rules and the LRD is reported on a spot basis. Prior to the alignment to BIS rules, the LRD was calculated based on former FINMA rules and reported on a 3-month average basis and is therefore not fully comparable. 3 Comparative balances presented for 31 December 2014 include the Personal & Corporate Banking and Wealth Management businesses booked in Switzerland which were transferred from UBS AG to UBS Switzerland AG effective 1 April 2015. Refer to “Establishment of UBS Switzerland AG” within this section for more information. |
Swiss SRB leverage ratio¹ | |
CHF million, except where indicated | | As of 31.12.15 | Average 4Q14 |
Swiss GAAP total assets | | 477,045 | 770,253 |
Difference between Swiss GAAP and IFRS total assets | | 169,961 | 231,226 |
Less derivative exposures and securities financing transactions² | | (295,490) | (374,315) |
On-balance sheet exposures (excluding derivative exposures and securities financing transactions) | | 351,516 | 627,165 |
Derivative exposures² | | 124,079 | 153,659 |
Securities financing transactions² | | 130,766 | 70,859 |
Off-balance sheet items | | 42,573 | 102,117 |
Items deducted from Swiss SRB tier 1 capital, phase-in | | (14,948) | (9,552) |
Total exposures (leverage ratio denominator), phase-in³ | | 633,985 | 944,248 |
| |
| | As of |
Phase-in | | 31.12.15 | 31.12.14 |
Common equity tier 1 capital | | 32,656 | 35,851 |
Tier 2 capital | | 0 | 6,390 |
Total capital | | 32,656 | 42,241 |
Swiss SRB leverage ratio (%) | | 5.2 | 4.5 |
1 Calculated in accordance with Swiss SRB rules. From 31 December 2015 onward, the Swiss SRB leverage ratio denominator (LRD) calculation is fully aligned to the BIS Basel III rules and the LRD is reported on a spot basis. Prior to the alignment to BIS rules, the LRD was calculated based on former FINMA rules and reported on a 3-month average basis and is therefore not fully comparable to the LRD reported for 31 December 2015, although the presentation format was aligned. In addition, due to the business transfer to UBS Switzerland AG effective in June 2015, numbers are not comparable. Refer to “Establishment of UBS Switzerland AG” within this section for more information. 2 Consists of positive replacement values, cash collateral receivables on derivative instruments, cash collateral on securities borrowed, reverse repurchase agreements, margin loans and prime brokerage receivables related to securities financing transactions, which are presented separately under derivative exposures and securities financing transactions in this table. 3 In accordance with former Swiss SRB LRD calculation rules, the leverage ratio denominator for average 4Q14 excludes forward starting repos, securities lending indemnifications and CEM add-ons for exchange-traded derivatives (ETD), both proprietary and agency transactions, and for OTC derivatives with a qualifying central counterparty. |
BIS Basel III leverage ratio (phase-in) |
CHF million, except where indicated | | 31.12.15 |
BIS Basel III tier 1 capital | | 32,656 |
Total exposures (leverage ratio denominator) | | 633,985 |
BIS Basel III leverage ratio (%) | | 5.2 |
Liquidity coverage ratio
FINMA and Basel III rules require disclosure of the liquidity coverage ratio (LCR). As a Swiss SRB, we must maintain an LCR of at least 100% since 1 January 2015 and disclose LCR information on a quarterly basis.
Liquidity coverage ratio |
| | Weighted value¹ |
CHF billion, except where indicated | | Average 4Q15 |
High-quality liquid assets | | 108 |
Total net cash outflows | | 93 |
of which: cash outflows | | 219 |
of which: cash inflows | | 125 |
Liquidity coverage ratio (%) | | 116 |
1 Calculated after the application of haircuts and inflow and outflow rates. |
▲
Legal entity financial and regulatory information
UBS Switzerland AG standalone financial statements
UBS Switzerland AG standalone financial statements
Audited |
Income statement |
| | | | For the financial year ended¹ |
CHF million | | Note | | 31.12.15 |
Interest and discount income | | | | 2,963 |
Interest and dividend income from trading portfolio | | | | 0 |
Interest and dividend income from financial investments | | | | 54 |
Interest expense | | | | (533) |
Gross interest income | | | | 2,484 |
Credit loss (expense) / recovery | | | | (4) |
Net interest income | | | | 2,480 |
Fee and commission income from securities and investment business | | | | 2,642 |
Credit-related fees and commissions | | | | 116 |
Other fee and commission income | | | | 524 |
Fee and commission expense | | | | (281) |
Net fee and commission income | | | | 3,001 |
Net trading income | | 3 | | 735 |
Net income from disposal of financial investments | | | | 11 |
Dividend income from investments in subsidiaries and other participations | | | | 30 |
Income from real estate holdings | | | | 0 |
Sundry ordinary income | | | | 103 |
Sundry ordinary expenses | | | | (66) |
Other income from ordinary activities | | | | 79 |
Total operating income | | | | 6,295 |
Personnel expenses | | 4 | | 1,608 |
General and administrative expenses | | 5 | | 2,583 |
Subtotal operating expenses | | | | 4,192 |
Depreciation and impairment of property, equipment and software | | | | 11 |
Amortization and impairment of goodwill and other intangible assets | | | | 788 |
Changes in provisions and other allowances and losses | | | | 15 |
Total operating expenses | | | | 5,005 |
Operating profit | | | | 1,290 |
Extraordinary income | | | | 0 |
Extraordinary expenses | | | | 0 |
Tax expense / (benefit) | | 6 | | 222 |
Net profit / (loss) | | | | 1,068 |
1 The financial year ended 31 December 2015 covers the period 1 April 2015 to 31 December 2015. Comparative results have not been presented as no material profit / (loss) was generated by UBS Switzerland AG during the prior period. |
Balance sheet | | | | |
| | | | | | | | % change from |
CHF million | | Note | | 31.12.15 | | 1.4.15¹ | | 1.4.15 |
| | | | | | | | |
Assets | | | | | | | | |
Cash and balances with central banks | | | | 38,701 | | 30,564 | | 27 |
Due from banks | | 9 | | 3,477 | | 31,391 | | (89) |
Receivables from securities financing transactions | | 7 | | 23,672 | | 31,013 | | (24) |
of which: cash collateral on securities borrowed | | | | 7,414 | | 9,161 | | (19) |
of which: reverse repurchase agreements | | | | 16,258 | | 21,853 | | (26) |
Due from customers | | 8, 9 | | 38,373 | | 44,125 | | (13) |
Mortgage loans | | 8, 9 | | 148,492 | | 151,121 | | (2) |
Trading portfolio assets | | 10 | | 1,736 | | 2,792 | | (38) |
Positive replacement values | | 11 | | 2,274 | | 3,092 | | (26) |
Financial investments | | 12 | | 22,878 | | 26,058 | | (12) |
Accrued income and prepaid expenses | | | | 237 | | 281 | | (16) |
Investments in subsidiaries and other participations | | | | 42 | | 42 | | 0 |
Property, equipment and software | | | | 15 | | 22 | | (32) |
Goodwill and other intangible assets | | | | 4,463 | | 5,250 | | (15) |
Other assets | | 13 | | 817 | | 700 | | 17 |
Total assets | | | | 285,176 | | 326,452 | | (13) |
of which: subordinated assets | | | | 0 | | 1,155 | | (100) |
of which: subject to mandatory conversion and / or debt waiver | | | | 0 | | 0 | | |
| | | | | | | | |
Liabilities | | | | | | | | |
Due to banks | | | | 19,280 | | 38,265 | | (50) |
Payables from securities financing transactions | | 7 | | 8,997 | | 21,023 | | (57) |
of which: cash collateral on securities lent | | | | 2,493 | | 7,531 | | (67) |
of which: repurchase agreements | | | | 6,505 | | 13,491 | | (52) |
Due to customers | | | | 231,294 | | 238,574 | | (3) |
Trading portfolio liabilities | | 10 | | 128 | | 191 | | (33) |
Negative replacement values | | 11 | | 1,092 | | 2,760 | | (60) |
Medium-term notes | | | | 0 | | 539 | | (100) |
Bonds issued and loans from central mortgage institutions | | | | 8,274 | | 7,901 | | 5 |
Accrued expenses and deferred income | | | | 822 | | 360 | | 128 |
Other liabilities | | 13 | | 963 | | 3,594 | | (73) |
Provisions | | 9 | | 179 | | 174 | | 3 |
Total liabilities | | | | 271,027 | | 313,381 | | (14) |
| | | | | | | | |
Equity | | | | | | | | |
Share capital | | 16 | | 10 | | 0 | | |
General reserve | | | | 13,072 | | 13,072 | | 0 |
of which: statutory capital reserve | | | | 13,072 | | 13,072 | | 0 |
of which: capital contribution reserve | | | | 13,072 | | 13,072 | | 0 |
Voluntary earnings reserve | | | | 0 | | 0 | | |
Net profit / (loss) for the period | | | | 1,068 | | 0 | | |
Total equity | | | | 14,149 | | 13,072 | | 8 |
Total liabilities and equity | | | | 285,176 | | 326,452 | | (13) |
of which: subordinated liabilities | | | | 4,020 | | 19 | | |
of which: subject to mandatory conversion and / or debt waiver | | | | 4,020 | | 0 | | |
Legal entity financial and regulatory information
UBS Switzerland AG standalone financial statements
Balance sheet (continued) | | | | |
| | | | | | % change from |
CHF million | | 31.12.15 | | 1.4.15 | | 1.4.15 |
| | | | | | |
Off-balance sheet items | | | | | | |
Contingent liabilities, gross | | 8,784 | | 8,689 | | 1 |
Sub-participations | | (854) | | (907) | | (6) |
Contingent liabilities, net | | 7,930 | | 7,782 | | 2 |
of which: guarantees to third parties related to subsidiaries | | 9 | | 9 | | 0 |
of which: credit guarantees and similar instruments | | 3,313 | | 2,895 | | 14 |
of which: performance guarantees and similar instruments | | 2,318 | | 2,413 | | (4) |
of which: documentary credits | | 2,291 | | 2,465 | | (7) |
Irrevocable commitments, gross | | 7,982 | | 7,784 | | 3 |
Sub-participations | | 0 | | 0 | | |
Irrevocable commitments, net | | 7,982 | | 7,784 | | 3 |
of which: loan commitments | | 7,117 | | 6,916 | | 3 |
of which: payment commitment related to deposit insurance | | 865 | | 868 | | 0 |
Forward starting transactions² | | 0 | | 881 | | (100) |
of which: reverse repurchase agreements | | 0 | | 733 | | (100) |
of which: repurchase agreements | | 0 | | 148 | | (100) |
Liabilities for calls on shares and other equity instruments | | 37 | | 37 | | 0 |
1 As of 31 March 2015, UBS Switzerland AG had share capital of CHF 0.1 million and a corresponding balance in Due from banks. Comparative balances have been provided as of 1 April 2015 in order to provide greater transparency with respect to movements during the period. 2 Cash to be paid in the future by either UBS or the counterparty. |
Off-balance sheet items
Swiss deposit insurance
Swiss banking law and the deposit insurance system require Swiss banks and securities dealers to jointly guarantee an amount of up to CHF 6 billion for privileged client deposits in the event that a Swiss bank or securities dealer becomes insolvent. The Swiss Financial Market Supervisory Authority (FINMA) estimates the share of UBS Switzerland AG from 1 July 2015 to 30 June 2016 to be CHF 865 million, which is reflected in the table above.
Joint and several liability UBS Switzerland AG
In June 2015, the Personal & Corporate Banking and Wealth Management businesses booked in Switzerland were transferred from UBS AG to UBS Switzerland AG through an asset transfer in accordance with the Swiss Merger Act (refer to “Establishment of UBS Switzerland AG” in this section for more information). Under the Swiss Merger Act, UBS AG assumed joint liability for obligations existing on the asset transfer date, 14 June 2015, which were transferred to UBS Switzerland AG.
As of the asset transfer date, UBS Switzerland AG assumed joint liability for approximately CHF 325 billion of obligations of UBS AG, excluding the collateralized portion of secured contractual obligations and covered bonds. UBS Switzerland AG has no liability for new obligations incurred by UBS AG after the asset transfer date. The joint liability amount declines as obligations mature, terminate or are novated following the asset transfer date. As of 31 December 2015, the joint liability of UBS Switzerland AG amounted to approximately CHF 136 billion.
As of 31 December 2015, the probability of an outflow under this joint and several liability was assessed to be remote and as a result, the table above does not include any exposures arising under this joint and several liability.
Statement of changes in equity |
CHF million | | Share capital | | Statutory capital reserve | | Voluntary earnings reserve | | Net profit / (loss) for the period | | Total equity |
Balance as of 1 April 2015 | | 0 | | 13,072 | | 0 | | 0 | | 13,072 |
Capital increase | | 10 | | | | | | | | 10 |
Net profit / (loss) for the period | | | | | | | | 1,068 | | 1,068 |
Balance as of 31 December 2015 | | 10 | | 13,072 | | 0 | | 1,068 | | 14,149 |
Statement of appropriation of retained earnings
The Board of Directors proposes that the Annual General Meeting of Shareholders (AGM) on 25 April 2016 approves the following appropriation of retained earnings.
Proposed appropriation of retained earnings | | |
| | For the financial year ended |
CHF million | | 31.12.15 |
Net profit for the period | | 1,068 |
Retained earnings carried forward | | 0 |
Total retained earnings available for appropriation | | 1,068 |
| | |
Proposed appropriation of retained earnings | | |
Appropriation to voluntary earnings reserve | | (1,068) |
Retained earnings carried forward | | 0 |
Legal entity financial and regulatory information
Notes to the UBS Switzerland AG standalone financial statements
Notes to the UBS Switzerland AG standalone financial statements
Note 1 Name, legal form and registered office
UBS Switzerland AG is incorporated and domiciled in Switzerland. Its registered office is at Bahnhofstrasse 45, CH-8001 Zurich, Switzerland. UBS Switzerland AG operates under the Swiss Code of Obligations and Swiss Federal Banking Law as a stock corporation (Aktiengesellschaft), a corporation that has issued shares of common stock to investors. UBS Switzerland AG is 100% owned by UBS AG.
Note 2 Accounting policies
a) Significant accounting policies
UBS Switzerland AG standalone financial statements are prepared in accordance with Swiss GAAP (FINMA Circular 2015 / 1 and the Banking Ordinance) in the form of reliable assessment statutory single-entity financial statements. The accounting policies are principally the same as for the consolidated financial statements of UBS Group AG outlined in Note 1 to the consolidated financial statements of UBS Group AG. Major differences between the Swiss GAAP requirements and International Financial Reporting Standards are described in Note 38 to the consolidated financial statements of UBS Group AG. The significant accounting policies applied for the standalone financial statements of UBS Switzerland AG are discussed below.
Risk management
UBS Switzerland AG (standalone) is fully integrated into the Group-wide risk management process described in the audited part of the “Risk, treasury and capital management” section of this report.
Further information on the use of derivative instruments and hedge accounting are outlined in Notes 1 and 14 to the consolidated financial statements of UBS Group AG.
Compensation policy
The compensation structure and processes of UBS Switzerland AG conform to the compensation principles and framework of UBS Group AG. For detailed information refer to the Compensation Report of UBS Group AG.
Foreign currency translation
Transactions denominated in foreign currency are translated into Swiss francs at the spot exchange rate on the date of the transaction. At the balance sheet date, all monetary assets and liabilities, as well as equity instruments recorded in Trading portfolio assets and Financial investments denominated in foreign currency, are translated into Swiss francs using the closing exchange rate. Non-monetary items measured at historic cost are translated at the exchange rate on the date of the transaction. All currency translation effects are recognized in the income statement.
The main currency translation rates used by UBS Switzerland AG can be found in Note 36 to the consolidated financial statements of UBS Group AG.
Goodwill
As part of the business transfer as outlined in the section "Establishment of UBS Switzerland AG", UBS Switzerland AG recognized goodwill of CHF 5,250 million. This goodwill is amortized on a straight-line basis over five years and assessed for impairment annually.
Deferred taxes
Deferred tax assets are not recognized in UBS Switzerland AG’s standalone financial statements. However, deferred tax liabilities may be recognized for taxable temporary differences. Changes in the deferred tax liability balance are recognized in the income statement.
Note 2 Accounting policies (continued) Services provided to and received from subsidiaries, affiliated entities, UBS AG and UBS Group AG
Services provided to and received from UBS Group AG or any of its subsidiaries are settled in cash as hard cost transfers or hard revenue transfers paid or received.
When the nature of the underlying transaction between UBS Switzerland AG and UBS Group AG or any of its subsidiaries contains a single, clearly identifiable service element, related income and expenses are presented in the respective Income statement line item, e.g., Fee and commission income from securities and investment business, Other fee and commission income, Fee and commission expense, Net trading income or General and administrative expenses. To the extent the nature of the underlying transaction contains various service elements and is not clearly attributable to a particular Income statement line item, related income and expenses are presented in Sundry ordinary income and Sundry ordinary expenses.
® Refer to Note 5 for more information
Pension and other post-employment benefit plans
Swiss GAAP permits the use of IFRS or Swiss accounting standards for pension and other post-employment benefit plans, with the election made on a plan-by-plan basis.
UBS Switzerland AG has elected to apply Swiss GAAP (FER 16) for its pension plan. The requirements of Swiss GAAP are better aligned with the specific nature of Swiss pension plans, which are hybrid in that they combine elements of defined contribution and defined benefit plans, but are treated as defined benefit plans under IFRS. Swiss GAAP requires that the employer contributions to the pension fund are recognized as Personnel expenses in the income statement. The employer contributions to the Swiss pension fund are determined as a percentage of contributory compensation. Further, Swiss GAAP requires an assessment as to whether, based on the financial statements of the pension fund prepared in accordance with Swiss accounting standards (FER 26), an economic benefit to, or obligation of, UBS Switzerland AG arises from the pension fund and is recognized in the balance sheet when conditions are met. Conditions for recording a pension asset or liability would be met if, for example, an employer contribution reserve is available or UBS Switzerland AG is required to contribute to the reduction of a pension deficit (on a FER 26 basis).
® Refer to Note 17 for more information
Subordinated assets and liabilities
Subordinated assets are comprised of claims that arise from an irrevocable written declaration where in the event of liquidation, bankruptcy or restructuring of the debtor, rank after the claims of all other creditors and may not be offset against amounts payable to the debtor nor secured by its assets. Subordinated liabilities are comprised of corresponding obligations.
Subordinated assets and liabilities that contain a point-of-non-viability clause in accordance with Swiss capital requirements per articles 29 and 30 of the Capital Adequacy Ordinance are disclosed as being subject to mandatory conversion and / or debt waiver and provide for the claim or the obligation to be written off or converted into equity in the event that the issuing bank reaches a point of non-viability.
Dispensations in the standalone financial statements
As UBS Switzerland AG has no listed shares outstanding and is within the scope of the UBS Group AG consolidated financial statements prepared in accordance with IFRS, UBS Switzerland AG is exempt from various disclosures in the standalone financial statements. The dispensations include the management report and the statement of cash flows, as well as various note disclosures.
b) Changes in accounting policies, comparability and other adjustments
Amendment of accounting standards applicable to banks and securities dealers
The Swiss Law on Accounting and Financial Reporting (32nd title of the Swiss Code of Obligations) was revised in 2011 and became effective on 1 January 2013 with a transition period of two years (i.e., is effective for annual periods beginning on or after 1 January 2015). Following this change, the accounting standards applicable to banks and securities dealers were amended accordingly. On 30 April 2014, the Swiss Federal Council passed the amended Banking Ordinance, and on 3 June 2014 the new FINMA Circular 2015/1 Accounting – banks was published. Revised Swiss GAAP, in accordance with the amended Banking Ordinance and the new FINMA Circular, is effective for annual periods beginning on or after 1 January 2015. UBS Switzerland AG made use of transition relief for interim reporting for the second and third quarters of 2015 and adopted revised Swiss GAAP as of 1 November 2015 for the 2015 annual financial statements, retrospectively from 1 April 2015.
Legal entity financial and regulatory information
Notes to the UBS Switzerland AG standalone financial statements
Note 2 Accounting policies (continued)
The presentation order of certain items in the income statement was amended and different sub-totals were added to the income statement. Furthermore, Credit loss (expense) / recovery is now included within Net interest income, whereas previously this was included within Allowances, provisions and losses. There was no impact on net profit or equity.
The structure of the balance sheet was also amended. Money market paper held and money market paper issued are no longer shown as separate balance sheet line items but are instead reported within Trading portfolio assets, Financial investments, Due from customers and Bonds issued and loans from central mortgage institutions. Conversely, Receivables from securities financing transactions and Payables from securities financing transactions are now shown separately, whereas previously these receivables and payables were reported within Due from banks, Due from customers, Due to banks and Due to customers. Lastly, the previously disclosed balance sheet lines Due to customers on savings and deposit accounts and Other amounts due to customers were combined into Due to customers. The table below provides the quantitative effect on the balance sheet as of 1 April 2015 from these presentational changes.
Term deposits previously presented as Medium-term notes were re-classified to Due to customers under revised Swiss GAAP. UBS Switzerland AG presents its remaining immaterial balance of medium-term notes within Bonds issued and loans from central mortgage institutions.
In addition to the aforementioned changes to the income statement and balance sheet, certain Notes have been added to the financial statements.
Comparative period figures
UBS Switzerland AG prepared its first annual financial statements as a bank for the short financial year beginning 1 April 2015 and ending 31 December 2015. During the period from its incorporation on 3 September 2014 to 31 March 2015, UBS Switzerland AG had share capital of CHF 0.1 million and a corresponding balance in Due from banks, but no operations and hence recorded virtually no profit or loss during that period. Refer to "Establishment of UBS Switzerland AG" within this section for more information. Therefore, no comparative results have been presented for the income statement and no comparative results or balances have been presented for the Notes.
Comparative balances for the balance sheet and off-balance sheet items have been provided as of 1 April 2015 in order to provide greater transparency with respect to movements during the aforementioned short financial year.
Revision to Swiss GAAP: presentational balance sheet changes |
| | Former Swiss GAAP | Revised Swiss GAAP | | Absolute change |
CHF million | | 1.4.15 | 1.4.15 | | 1.4.15 |
| | | | | |
Total assets | | 326,452 | 326,452 | | 0 |
of which: Money market paper | | 5,825 | | | (5,825) |
of which: Trading portfolio assets | | 2,762 | 2,792 | | 29 |
of which: Financial investments | | 20,269 | 26,058 | | 5,789 |
of which: Due from banks | | 62,405 | 31,391 | | (31,013) |
of which: Due from customers | | 44,119 | 44,125 | | 7 |
of which: Receivables from securities financing transactions | | | 31,013 | | 31,013 |
| | | | | |
Total liabilities | | 313,381 | 313,381 | | 0 |
of which: Money market paper issued | | 36 | | | (36) |
of which: Bonds issued and loans from central mortgage institutions | | 7,865 | 7,901 | | 36 |
of which: Due to banks | | 59,287 | 38,265 | | (21,022) |
of which: Due to customers on savings and deposit accounts | | 96,542 | | | (96,542) |
of which: Other amounts due to customers | | 142,032 | | | (142,032) |
of which: Due to customers | | | 238,574 | | 238,574 |
of which: Payables from securities financing transactions | | | 21,023 | | 21,023 |
Note 3a Net trading income by business | | For the financial year ended |
CHF million | | 31.12.15 |
Wealth Management | | 280 |
Personal & Corporate Banking | | 248 |
Other business divisions and Corporate Center | | 206 |
Total net trading income | | 735 |
Note 3b Net trading income by underlying risk category
| | For the financial year ended |
CHF million | | 31.12.15 |
Interest rate instruments (including funds) | | 123 |
Foreign exchange instruments | | 571 |
Equity instruments (including funds) | | 11 |
Credit instruments | | 7 |
Precious metal / commodities | | 22 |
Total net trading income | | 735 |
Note 4 Personnel expenses
| | For the financial year ended |
CHF million | | 31.12.15 |
Salaries | | 976 |
Variable compensation – performance awards | | 314 |
Variable compensation – other | | 14 |
Contractors | | 3 |
Social security | | 80 |
Pension and other post-employment benefit plans | | 181 |
Other personnel expenses | | 41 |
Total personnel expenses | | 1,608 |
Legal entity financial and regulatory information
Notes to the UBS Switzerland AG standalone financial statements
Note 5 General and administrative expenses
| | For the financial year ended |
CHF million | | 31.12.15 |
Occupancy | | 2 |
Rent and maintenance of IT equipment | | 5 |
Communication and market data services | | 23 |
Administration¹ | | 2,182 |
of which: hard cost transfer paid | | 2,097 |
Marketing and public relations | | 148 |
Travel and entertainment | | 75 |
Fees to audit firms | | 2 |
of which: financial and regulatory audits | | 1 |
of which: other services | | 0 |
Other professional fees | | 69 |
Outsourcing of IT and other services | | 78 |
Total general and administrative expenses | | 2,583 |
1 Includes hard cost transfers paid to UBS Group AG and subsidiaries in the UBS Group for services provided to UBS Switzerland AG. |
| | For the financial year ended |
CHF million | | 31.12.15 |
Income tax expense / (benefit) | | 199 |
of which: current | | 199 |
of which: deferred | | 0 |
Capital tax | | 23 |
Total tax expense / (benefit) | | 222 |
For the financial year ended 31 December 2015, the average tax rate, defined as income tax expense divided by the sum of operating profit and extraordinary income minus extraordinary expenses and capital tax, was 15.7%. Income tax expense for the financial year ended 31 December 2015 includes a benefit of CHF 66 million from the utilization of tax losses carried forward in Switzerland.
Note 7 Securities financing transactions CHF billion | | 31.12.15 |
| | |
On-balance sheet | | |
Receivables from securities financing transactions, gross | | 24.4 |
Netting of securities financing transactions | | (0.8) |
Receivables from securities financing transactions, net | | 23.7 |
Payables from securities financing transactions, gross | | 9.8 |
Netting of securities financing transactions | | (0.8) |
Payables from securities financing transactions, net | | 9.0 |
| | |
Off-balance sheet | | |
Fair value of assets received as collateral in connection with securities financing transactions | | 118.1 |
of which: repledged | | 102.9 |
of which: sold in connection with short sale transactions | | 0.1 |
Note 8a Collateral for loans and off-balance sheet transactions
| | 31.12.15 |
| | Secured | | Unsecured | | Total |
| | Secured by collateral | | Secured by other credit enhancements² | | | | |
CHF million | | Real estate | | Other collateral¹ | | | | | |
| | | | | | | | | | |
On-balance sheet | | | | | | | | | | |
Due from customers, gross | | 1,301 | | 27,589 | | 1,462 | | 8,533 | | 38,885 |
Mortgage loans, gross | | 148,514 | | | | | | | | 148,514 |
of which: residential mortgages | | 127,252 | | | | | | | | 127,252 |
of which: office and business premises mortgages | | 7,908 | | | | | | | | 7,908 |
of which: industrial premises mortgages | | 3,170 | | | | | | | | 3,170 |
of which: other mortgages | | 10,184 | | | | | | | | 10,184 |
Total on-balance sheet, gross | | 149,815 | | 27,589 | | 1,462 | | 8,533 | | 187,400 |
Allowances | | (28) | | (73) | | (57) | | (376) | | (534) |
Total on-balance sheet, net | | 149,787 | | 27,517 | | 1,405 | | 8,157 | | 186,865 |
| | | | | | | | | | |
Off-balance sheet | | | | | | | | | | |
Contingent liabilities gross | | 175 | | 2,452 | | 1,033 | | 5,125 | | 8,784 |
Irrevocable commitments gross | | 1,251 | | 82 | | 304 | | 6,345 | | 7,982 |
Forward starting transactions | | | | | | 0 | | | | 0 |
Total off-balance sheet | | 1,425 | | 2,535 | | 1,336 | | 11,507 | | 16,804 |
1 Includes but not limited to deposits, securities, life insurance contracts, inventory, accounts receivable, patents, and copyrights. 2 Includes credit default swaps and guarantees. |
Note 8b Impaired financial instruments | | 31.12.15 |
CHF million | | Gross impaired financial instruments | | Allowances and provisions¹ | | Estimated liquidation proceeds of collateral | | Net impaired financial instruments |
Amounts due from banks | | 3 | | 3 | | 0 | | 0 |
Amounts due from customers | | 702 | | 512 | | 22 | | 168 |
Mortgage loans | | 185 | | 22 | | 137 | | 26 |
Guarantees and loan commitments | | 275 | | 31 | | 4 | | 239 |
Total impaired financial instruments | | 1,164 | | 568 | | 163 | | 433 |
1 Includes CHF 4 million collective loan loss allowances. |
CHF million | Balance as of 1.4.15¹ | Increase recognized in the income statement | Release recognized in the income statement | Write-offs | Recoveries and past due interest | Reclassifications | Foreign currency translation | Balance as of 31.12.15 |
Specific allowances for amounts due from customers and mortgage loans | 611 | 135 | (133) | (127) | 44 | (6) | 6 | 530 |
Specific allowances for due from banks | 12 | 0 | 0 | (9) | 0 | 0 | 0 | 3 |
Collective allowances² | 5 | 0 | 0 | 0 | 0 | 0 | 0 | 4 |
Total allowances | 628 | 135 | (133) | (137) | 44 | (6) | 6 | 537 |
1 Represents the effects of the business transfer from UBS AG. 2 Mainly relates to amounts due from customers. |
Legal entity financial and regulatory information
Notes to the UBS Switzerland AG standalone financial statements
CHF million | Balance as of 1.4.15¹ | Increase recognized in the income statement | Release recognized in the income statement | Provisions used in conformity with designated purpose | Recoveries | Reclassifications | Foreign currency translation | Balance as of 31.12.15 |
Default risk related to loan commitments and guarantees | 23 | 2 | 0 | 0 | 0 | 6 | 0 | 31 |
Operational risks | 7 | 0 | 0 | (4) | 0 | 1 | 0 | 3 |
Litigation, regulatory and similar matters² | 103 | 11 | (2) | (15) | 0 | (2) | 1 | 96 |
Restructuring | 9 | 37 | (9) | (24) | 0 | 1 | 0 | 13 |
Employee benefits | 27 | 1 | (2) | 0 | 0 | 0 | 0 | 27 |
Other | 5 | 6 | 0 | (3) | 0 | 0 | 0 | 8 |
Total provisions | 174 | 58 | (14) | (46) | 0 | 6 | 0 | 179 |
1 Represents the effects of the business transfer from UBS AG. 2 Includes provisions for litigation resulting from security risks. |
Note 10 Trading portfolio and other financial instruments measured at fair value CHF million | | 31.12.15 |
| | |
Assets | | |
Trading portfolio assets | | 1,736 |
of which: debt instruments | | 2 |
of which: listed | | 1 |
of which: equity instruments | | 7 |
of which: precious metals and other physical commodities | | 1,728 |
Total assets measured at fair value | | 1,736 |
of which: fair value derived using a valuation model | | 6 |
| | |
Liabilities | | |
Trading portfolio liabilities | | 128 |
of which: debt instruments | | 64 |
of which: listed | | 61 |
of which: equity instruments | | 64 |
Total liabilities measured at fair value | | 128 |
of which: fair value derived using a valuation model | | 89 |
Note 11 Derivative instruments | | 31.12.15 |
CHF million, except where indicated | | PRV² | | NRV³ | | Total notional values (CHF billion) |
Interest rate contracts | | | | | | |
Forwards¹ | | 13 | | 19 | | 5 |
Swaps | | 3,393 | | 3,099 | | 213 |
of which: designated in hedge accounting relationships | | 1,022 | | 382 | | 44 |
Over-the-counter (OTC) options | | 81 | | 78 | | 3 |
Total | | 3,488 | | 3,196 | | 222 |
Foreign exchange contracts | | | | | | |
Forwards | | 551 | | 517 | | 42 |
Interest and currency swaps | | 876 | | 819 | | 127 |
Over-the-counter (OTC) options | | 245 | | 244 | | 31 |
Total | | 1,672 | | 1,580 | | 200 |
Equity / index contracts | | | | | | |
Forwards | | 18 | | 21 | | 3 |
Swaps | | 2 | | 2 | | 0 |
Over-the-counter (OTC) options | | 323 | | 323 | | 7 |
Exchange-traded options | | 281 | | 281 | | 0 |
Total | | 625 | | 627 | | 10 |
Credit derivative contracts | | | | | | |
Credit default swaps | | 7 | | 10 | | 1 |
Total | | 7 | | 10 | | 1 |
Commodity, precious metals and other contracts | | | | | | |
Forwards | | 15 | | 14 | | 1 |
Swaps | | 51 | | 51 | | 2 |
Over-the-counter (OTC) options | | 176 | | 176 | | 6 |
Total | | 242 | | 241 | | 9 |
Total before netting as of 31 December 2015 | | 6,033 | | 5,655 | | 441 |
of which: trading derivatives | | 5,011 | | 5,273 | | |
of which: fair value derived using a valuation model | | 4,968 | | 5,223 | | |
of which: derivatives designated in hedge accounting relationships | | 1,022 | | 382 | | |
of which: fair value derived using a valuation model | | 1,022 | | 382 | | |
Netting with cash collateral payables / receivables | | | | (804) | | |
Replacement value netting | | (3,759) | | (3,759) | | |
Total after netting as of 31 December 2015 | | 2,274 | | 1,092 | | |
of which: with bank and broker-dealer counterparties | | 80 | | 259 | | |
of which: other client counterparties | | 2,194 | | 833 | | |
1 Includes forward rate agreements. 2 PRV: positive replacement values. 3 NRV: negative replacement values. |
Legal entity financial and regulatory information
Notes to the UBS Switzerland AG standalone financial statements
Note 12a Financial investments by instrument type | | 31.12.15 |
CHF million | | Carrying value | | Fair value |
Debt instruments available-for-sale | | 22,849 | | 22,875 |
Property | | 29 | | 29 |
Total financial investments | | 22,878 | | 22,904 |
of which: securities eligible for repurchase transactions in accordance with liquidity regulations | | 22,849 | | 22,875 |
Note 12b Financial investments by counterparty rating – debt instruments
CHF million | | 31.12.15 |
Internal UBS rating¹ | | |
0–1 | | 22,321 |
2–3 | | 528 |
4–5 | | 0 |
6–8 | | 0 |
9–13 | | 0 |
Non-rated | | 0 |
Total financial investments | | 22,849 |
1 Refer to Note 15 for more information. |
CHF million | | 31.12.15 |
Deferral position for hedging instruments | | 349 |
Settlement and clearing accounts | | 101 |
VAT and other indirect tax receivables | | 33 |
Other | | 334 |
of which: other receivables from UBS Group AG and subsidiaries in the UBS Group | | 293 |
Total other assets | | 817 |
Note 13b Other liabilities
CHF million | | 31.12.15 |
Settlement and clearing accounts | | 338 |
VAT and other indirect tax payables | | 115 |
Other | | 510 |
of which: other payables to UBS Group AG and subsidiaries in the UBS Group | | 323 |
Total other liabilities | | 963 |
| | 31.12.15 |
CHF million | | Carrying value of pledged assets | | Effective commitment |
Mortgage loans² | | 24,980 | | 16,235 |
Securities | | 0 | | 0 |
Pledges of precious metals to subsidiaries and other | | 0 | | 0 |
Total pledged assets | | 24,980 | | 16,235 |
1 Excluding securities financing transactions. Refer to Note 7 for more information on securities financing transactions. 2 These pledged mortgage loans serve as collateral for existing liabilities against Swiss central mortgage institutions and for existing covered bond issuances. Of these pledged mortgage loans, approximately CHF 4.4 billion as 31 December 2015 could be withdrawn or used for future liabilities or covered bond issuances without breaching existing collateral requirements. |
Note 15 Country risk of total assets
The table below provides a breakdown of total non-Swiss assets by credit rating. These credit ratings represent the sovereign credit rating of the country to which the ultimate risk of the underlying asset is related. The ultimate risk country on unsecured loan positions is the domicile of the immediate borrower, or, in the case of a legal entity, the domicile of the ultimate parent entity. For collateralized or guaranteed positions, the ultimate risk country is the domicile of the provider of the collateral or guarantor, or, if applicable, the domicile of the
ultimate parent entity of the provider of the collateral or guarantor. For mortgage loans, the ultimate risk country is the country where the real estate is located. Similarly, the ultimate risk country of property and equipment is the country where the property and equipment is located. Assets for which Switzerland is the ultimate risk country are provided separately in order to reconcile to total balance sheets assets.
® Refer to the "Risk management and control" section of this report for more information
| | | | | | 31.12.15 |
Classification | Internal UBS rating | Description | Moody’s Investors Service | Standard & Poor’s | Fitch | CHF million | % |
| 0 and 1 | Investment grade | Aaa | AAA | AAA | 40,924 | 14 |
Low risk | 2 | | Aa1 to Aa3 | AA+ to AA– | AA+ to AA– | 14,884 | 5 |
3 | | A1 to A3 | A+ to A– | A+ to AA– | 5,906 | 2 |
Medium risk | 4 | | Baa1 to Baa2 | BBB+ to BBB | BBB+ to BBB | 2,518 | 1 |
5 | | Baa3 | BBB– | BBB– | 1,248 | 0 |
High risk | 6 | Sub-investment grade | Ba1 | BB+ | BB+ | 884 | 0 |
7 | | Ba2 | BB | BB | 17 | 0 |
8 | | Ba3 | BB– | BB– | 16 | 0 |
9 | | B1 | B+ | B+ | 53 | 0 |
Very high risk | 10 | | B2 | B | B | 39 | 0 |
11 | | B3 | B– | B– | 99 | 0 |
12 | | Caa | CCC | CCC | 144 | 0 |
13 | | Ca to C | CC to C | CC to C | 33 | 0 |
Distressed | Default | Defaulted | D | D | D | 0 | 0 |
Subtotal | | | | | | 66,767 | 23 |
Switzerland | | | | | | 218,410 | 77 |
Total assets | | | | | | 285,176 | 100 |
| | 31.12.15 |
| | Par value in CHF | | Number of shares | | Of which: dividend bearing |
Share capital¹ | | 10,000,000 | | 100,000,000 | | 100,000,000 |
of which: shares outstanding | | 10,000,000 | | 100,000,000 | | 100,000,000 |
1 Registered shares issued. |
UBS Switzerland AG's share capital is fully paid up. Each share has a par value of CHF 0.10 and entitles the holder to one vote at the UBS Switzerland AG shareholder's meeting, if entered into the share register as having the right to vote, as well as a proportionate share of distributed dividends. UBS Switzerland AG does not apply any restrictions or limitations on the transferability of shares.
Non-distributable reserves
Non-distributable reserves consist of 50% of the share capital of UBS Switzerland AG, amounting to CHF 5 million as of 31 December 2015.
Legal entity financial and regulatory information
Notes to the UBS Switzerland AG standalone financial statements
Note 16b Significant shareholders
| | 31.12.15 |
CHF million, except where indicated | | Share capital held | Shares held (%) |
Significant direct shareholder of UBS Switzerland AG | | | |
UBS AG | | 10 | 100 |
Significant indirect shareholders of UBS Switzerland AG | | | |
UBS Group AG | | 10 | 100 |
Chase Nominees Ltd., London | | 1 | 9 |
GIC Private Limited, Singapore | | 1 | 6 |
DTC (Cede & Co.), New York¹ | | 1 | 6 |
Nortrust Nominees Ltd, London | | 0 | 4 |
1 DTC (Cede & Co.), New York, "The Depository Trust Company", is a US securities clearing organization. |
Significant shareholders presented in this Note are those that, directly or indirectly, hold 3% or more of UBS Switzerland AG’s total share capital. The sole direct shareholder of UBS Switzerland AG is UBS AG, which holds 100% of UBS Switzerland AG shares. These shares entitle to voting rights. Indirect shareholders of UBS Switzerland AG, which do not have voting rights, include UBS Group AG, which holds 100% of UBS AG shares. The table above additionally includes as indirect shareholders of UBS Switzerland the shareholders of UBS Group AG, who are entered into the UBS Group AG share register. The shares and share capital of UBS Switzerland held by indirect shareholders other than UBS Group AG represent their relative holding of UBS Group AG shares.
® Refer to Note 22 to the UBS Group AG standalone financial statements for more information on significant shareholders of UBS Group AG
Note 17 Swiss pension plan
a) Liabilities related to Swiss pension plan | | |
CHF million | | 31.12.15 |
Provision for Swiss pension plan | | 0 |
Bank accounts at UBS and UBS debt instruments held by Swiss pension fund | | 262 |
UBS derivative financial instruments held by Swiss pension fund | | 27 |
Total liabilities related to Swiss pension plan | | 289 |
| | |
b) Swiss pension plan¹ | | |
| | As of or for the financial year ended |
CHF million | | 31.12.15 |
Pension plan surplus | | 2,264 |
Economic benefit / (obligation) of UBS Switzerland AG | | 0 |
Change in economic benefit / obligation recognized in the income statement | | 0 |
Employer contributions for the period recognized in the income statement | | 158 |
Performance rewards related employer contributions accrued | | 24 |
Total pension expense recognized in the income statement within Personnel expenses | | 181 |
1 The pension plan surplus is determined in accordance with FER 26 and consists of the reserve for the fluctuation in asset value. The surplus did not represent an economic benefit for UBS Switzerland AG in accordance with FER 16 as of 31 December 2015. |
The Swiss pension plan had no employer contribution reserve in 2015.
Note 18 Share-based compensation
UBS Group AG is the grantor of the majority of UBS’s deferred compensation plans. Expenses for awards granted under such plans to UBS Switzerland AG employees are charged by UBS Group AG to UBS Switzerland AG.
® Refer to Note 29 to the UBS Group AG consolidated financial statements for more information
Transactions with related parties are conducted at internally agreed transfer prices or at arm’s length, or with respect to loans, fixed advances and mortgages to non-independent members of the Board of Directors and Group Executive Board members on the same terms and conditions that are available to other employees.
| | 31.12.15 |
CHF million | | Amounts due from | | Amounts due to |
Qualified shareholders¹ | | 11,232 | | 21,683 |
of which: Due from / to banks | | 743 | | 13,881 |
of which: Receivables / payables from securities financing transactions | | 9,958 | | 5,760 |
of which: Due from / to customers | | 169 | | 1,442 |
Subsidiaries² | | 35 | | 380 |
of which: Due from / to customers | | 30 | | 380 |
Affiliated entities³ | | 1,239 | | 2,232 |
of which: Due from / to banks | | 318 | | 629 |
of which: Receivables / payables from securities financing transactions | | 372 | | 786 |
of which: Due from / to customers | | 78 | | 328 |
Members of the Board of Directors and Group Executive Board | | 7 | | |
External auditors | | | | 1 |
Other related parties⁴ | | 468 | | |
1 Qualified shareholders of UBS Switzerland AG are UBS Group AG and UBS AG. 2 Subsidiaries of UBS Switzerland AG are UBS Card Center AG, Topcard Service AG and UBS Hypotheken AG. 3 Affiliated entities of UBS Switzerland AG are all direct and indirect subsidiaries of UBS Group AG including subsidiaries of UBS AG. 4 Primarily relates to SIX Group AG, in which UBS AG has a 17.3% equity interest. |
Note 20 Fiduciary transactions
| | |
CHF million | | 31.12.15 |
Fiduciary deposits | | 13,210 |
of which: placed with third-party banks | | 7,246 |
of which: placed with subsidiaries and affiliated entities | | 5,964 |
Total fiduciary transactions | | 13,210 |
Fiduciary transactions encompass transactions entered into or granted by UBS Switzerland AG that result in holding or placing assets on behalf of individuals, trusts, defined benefit plans and other institutions. Unless the recognition criteria for the assets are satisfied, these assets and the related income are excluded from UBS Switzerland AG’s balance sheet and income statement, but disclosed in this Note as off-balance sheet fiduciary transactions. Client deposits that are initially placed as fiduciary transactions with UBS Switzerland AG may be recognized on UBS Switzerland AG’s balance sheet in situations in which the deposit is subsequently placed within UBS Switzerland AG. In such cases, these deposits are not reported in the table above.
Legal entity financial and regulatory information
Notes to the UBS Switzerland AG standalone financial statements
Note 21a Invested assets and net new money
| | For the financial year ended |
CHF billion | | 31.12.15 |
Fund assets managed | | 0 |
Discretionary assets | | 88 |
Other invested assets | | 444 |
Total invested assets | | 532 |
of which: double count | | 0 |
Net new money | | (17.3) |
Note 21b Development of invested assets
| | For the financial year ended |
CHF billion | | 31.12.15 |
Total invested assets as of 1.4.15¹˒² | | 557 |
Net new money | | (17) |
Market movements³ | | (17) |
Foreign currency translation | | 9 |
Other effects | | 0 |
of which: acquisitions / (divestments) | | 0 |
Total invested assets at the end of the year² | | 532 |
1 Represents the effects of the business transfer from UBS AG. 2 Includes double counts. 3 Includes interest and dividend income. | | |
® Refer to Note 35 to the UBS Group AG consolidated financial statements for more information ▲
Legal entity financial and regulatory information

UBS Switzerland AG (standalone)
regulatory information
Swiss SRB capital requirements and capital information
Pillar 3 | UBS Switzerland AG is considered a systemically relevant bank (SRB) under Swiss banking law and is subject to capital regulations on a standalone basis.
As of 31 December 2015, the total capital requirement for UBS Switzerland AG (standalone) according to the Swiss Capital Adequacy Ordinance was 12.8% of RWA and consisted of: (i) base capital of 4.5%, (ii) buffer capital of 5.5%, of which 0.4% was attributable to the countercyclical buffer capital requirement and (iii) progressive buffer capital of 2.8%. In addition, FINMA has defined capital requirements for UBS Switzerland AG (standalone) which are outlined in footnote 1 of the table “Swiss SRB capital ratio requirements and information (phase-in)” on the next page. UBS Switzerland AG (standalone) met these capital requirements since commencement of business.
The tables in this section provide capital information under Swiss SRB regulations for UBS Switzerland AG (standalone), in accordance with the abovementioned requirements.
In the first quarter of 2016, UBS Switzerland AG increased its additional tier 1 capital by CHF 0.5 billion. The respective instruments are held by UBS AG. They are not included in the table below.
® Refer to "Disclosure for subsidiaries and branches" at www.ubs.com/investors for more information on the capital instruments of UBS Switzerland AG on a standalone basis
Reconciliation of Swiss federal banking law equity to Swiss SRB capital |
CHF billion | 31.12.15 |
Equity - Swiss federal banking law¹ | 14.1 |
Deferred tax assets | 0.9 |
Goodwill and intangible assets | (4.5) |
Other | (0.1) |
Common equity tier 1 capital (phase-in) | 10.5 |
Additional tier 1 capital (phase-in) | 1.5 |
Tier 2 capital (phase-in) | 2.5 |
Total capital (phase-in) | 14.5 |
1 Equity under Swiss federal banking law is adjusted to derive equity in accordance with IFRS and then further adjusted to derive common equity tier 1 (CET1) capital in accordance with Swiss SRB requirements. |
Legal entity financial and regulatory information
UBS Switzerland AG (standalone) regulatory information
Swiss SRB capital ratio requirements and information (phase-in) |
| | Capital ratio (%) | | Capital |
| | Requirement¹ | Actual² | | Requirement | Eligible |
CHF million, except where indicated | | 31.12.15 | 31.12.15 | | 31.12.15 | 31.12.15 |
Base capital (common equity tier 1 capital) | | 4.5 | 4.5 | | 4,309 | 4,309 |
Buffer capital (common equity tier 1 capital and high-trigger loss-absorbing capital) | | 5.5³ | 7.8 | | 5,259 | 7,447 |
of which: effect of countercyclical buffer | | 0.4 | 0.4 | | 351 | 351 |
Progressive buffer capital (high- and low-trigger loss-absorbing capital) | | 2.8 | 2.8 | | 2,711 | 2,711⁴ |
Total capital | | 12.8 | 15.1 | | 12,280 | 14,468 |
1 The total capital ratio requirement of 12.8% is the current phase-in requirement according to the Swiss Capital Adequacy Ordinance. In addition, FINMA defined a total capital ratio requirement for UBS Switzerland AG which is the sum of 14.4% and the effect of the countercyclical buffer requirement of 0.4%, of which 10.0% plus the effect of the countercyclical buffer requirement must be satisfied with CET1 capital. The FINMA total capital requirement will be effective until it is exceeded by the Swiss SRB phase-in requirement. 2 Swiss SRB CET1 capital exceeding the base capital requirement is allocated to the buffer capital. 3 CET1 capital can be substituted by high-trigger loss-absorbing capital up to 2.3% in 2015. 4 Includes tier 2 capital of CHF 2,500 million; the residual amount of CHF 211 million was allocated from buffer capital to meet the progressive buffer requirement. |
Swiss SRB capital information (phase-in) |
CHF million, except where indicated | | | | | | 31.12.15 |
Common equity tier 1 capital | | | | | | |
Common equity tier 1 capital | | | | | | 10,468 |
Additional tier 1 capital | | | | | | |
High-trigger loss-absorbing capital | | | | | | 1,500 |
Tier 1 capital¹ | | | | | | 11,968 |
Tier 2 capital | | | | | | |
Low-trigger loss-absorbing capital | | | | | | 2,500 |
Tier 2 capital¹ | | | | | | 2,500 |
Total capital | | | | | | 14,468 |
Common equity tier 1 capital ratio (%) | | | | | | 10.9 |
Tier 1 capital ratio (%) | | | | | | 12.5 |
Total capital ratio (%) | | | | | | 15.1 |
Risk-weighted assets² | | | | | | 95,765 |
1 CHF 211 million of tier 1 capital and CHF 2,500 million tier 2 capital are used to meet the progressive buffer requirement. 2 Effective 31 December 2015, UBS Switzerland AG early adopted revised Basel 1 floor requirements set by FINMA, resulting in CHF 14 billion higher RWA compared with the RWA disclosed in our third quarter 2015 report. |
Leverage ratio information
Swiss SRB leverage ratio
The Swiss SRB leverage ratio requirement is equal to 24% of the capital ratio requirements (excluding the countercyclical buffer requirement).
As of 31 December 2015, the effective total leverage ratio requirement for UBS Switzerland AG (standalone) was 3.0%, resulting from multiplying the total capital ratio requirement (excluding the countercyclical buffer requirement) of 12.5% by 24%.
Swiss SRB leverage ratio requirements and information (phase-in) |
| | Swiss SRB leverage ratio (%) | | Swiss SRB leverage ratio capital |
| | Requirement¹ | Actual²˒³ | | Requirement | Eligible²˒³ |
CHF million, except where indicated | | 31.12.15 | 31.12.15 | | 31.12.15 | 31.12.15 |
Base capital (common equity tier 1 capital) | | 1.1 | 1.1 | | 3,206 | 3,206 |
Buffer capital (common equity tier 1 capital and high-trigger loss-absorbing capital) | | 1.2³ | 3.0 | | 3,651 | 8,762 |
Progressive buffer capital (low-trigger loss-absorbing capital) | | 0.7 | 0.8 | | 2,017 | 2,500 |
Total | | 3.0 | 4.9 | | 8,875 | 14,468 |
1 The total leverage ratio requirement of 3.0% is the current phase-in requirement according to the Swiss Capital Adequacy Ordinance. In addition, FINMA defined a total leverage ratio requirement of 3.5%, which will be effective until it is exceeded by the Swiss SRB phase-in requirement. 2 Swiss SRB CET1 capital exceeding the base capital requirement is allocated to the buffer capital. 3 CET1 capital can be substituted by high-trigger loss-aborbing capital up to 0.5% in 2015. |
Swiss SRB leverage ratio¹ |
CHF million, except where indicated | | 31.12.15 |
Swiss GAAP total assets | | 285,176 |
Difference between Swiss GAAP and IFRS total assets | | 1,431 |
Less derivative exposures and securities financing transactions² | | (30,761) |
On-balance sheet exposures (excluding derivative exposures and securities financing transactions) | | 255,846 |
Derivative exposures² | | 4,736 |
Securities financing transactions² | | 24,705 |
Off-balance sheet items | | 11,871 |
Items deducted from Swiss SRB tier 1 capital, phase-in | | (292) |
Total exposures (leverage ratio denominator), phase-in | | 296,865 |
|
Phase-in | | |
Common equity tier 1 capital | | 10,468 |
Loss-absorbing capital | | 4,000 |
Common equity tier 1 capital including loss-absorbing capital | | 14,468 |
Swiss SRB leverage ratio (%) | | 4.9 |
1 Calculated in accordance with Swiss SRB rules. From 31 December 2015 onward, the Swiss SRB leverage ratio denominator (LRD) calculation is fully aligned to the BIS Basel III rules and the LRD is reported on a spot basis. 2 Consists of positive replacement values, cash collateral receivables on derivative instruments, cash collateral on securities borrowed, reverse repurchase agreements, margin loans and prime brokerage receivables related to securities financing transactions, which are presented separately under derivative exposures and securities financing transactions in this table. |
BIS Basel III leverage ratio (phase-in) |
CHF million, except where indicated | | 31.12.15 |
BIS Basel III tier 1 capital | | 11,968 |
Total exposures (leverage ratio denominator) | | 296,865 |
BIS Basel III leverage ratio (%) | | 4.0 |
Legal entity financial and regulatory information
UBS Switzerland AG (standalone) regulatory information
Liquidity coverage ratio
FINMA and Basel III rules require disclosure of the liquidity coverage ratio (LCR). As a Swiss SRB, we must maintain an LCR of at least 100% and disclose LCR information on a quarterly basis.
Liquidity coverage ratio |
| | Weighted value¹ |
CHF billion, except where indicated | | Average 4Q15 |
High-quality liquid assets | | 75 |
Total net cash outflows | | 65 |
of which: cash outflows | | 106 |
of which: cash inflows | | 41 |
Liquidity coverage ratio (%) | | 115 |
1 Calculated after the application of haircuts and inflow and outflow rates. |
▲
UBS Limited (standalone) financial and regulatory information
Income statement | | | | | |
| | For the year ended | | % change from |
GBP million | | 31.12.15 | 31.12.14 | | 31.12.14 |
Interest income | | 289 | 313 | | (8) |
Interest expense | | (289) | (270) | | 7 |
Net interest income | | 0 | 43 | | |
Credit loss expense / recovery | | 2 | (2) | | |
Net fee and commission income | | 667 | 439 | | 52 |
Net trading income | | 42 | (45) | | |
Other income | | 17 | 47 | | (64) |
Total operating income | | 727 | 482 | | 51 |
Total operating expenses | | 538 | 383 | | 40 |
Operating profit before tax | | 189 | 99 | | 91 |
Tax expense / (benefit) | | (52) | (101) | | (48) |
Net profit | | 241 | 199 | | 21 |
Statement of comprehensive income | | | | | |
| | For the year ended | | % change from |
GBP million | | 31.12.15 | 31.12.14 | | 31.12.14 |
Net profit | | 241 | 199 | | 21 |
| | | | | |
Other comprehensive income | | | | | |
Other comprehensive income that may be reclassified to the income statement | | | | | |
Financial investments available-for-sale | | | | | |
Net unrealized gains / (losses) on financial investments available-for-sale | | (5) | 6 | | |
Total other comprehensive income that may be reclassified to the income statement | | (5) | 6 | | |
Total comprehensive income | | 236 | 205 | | 15 |
Legal entity financial and regulatory information
UBS Limited (standalone) financial and regulatory information
Balance sheet | | | | | |
| | | | | % change from |
GBP million | | 31.12.15 | 31.12.14 | | 31.12.14 |
| | | | | |
Assets | | | | | |
Cash and balances with central banks | | 5 | 9 | | (43) |
Due from banks | | 841 | 900 | | (7) |
Cash collateral on securities borrowed | | 3,711 | 2,486 | | 49 |
Reverse repurchase agreements | | 2,973 | 8,914 | | (67) |
Trading portfolio assets | | 3,770 | 3,937 | | (4) |
Positive replacement values | | 17,668 | 30,042 | | (41) |
Cash collateral receivables on derivative instruments | | 6,027 | 7,052 | | (15) |
Financial assets designated at fair value | | 666 | 527 | | 26 |
Loans | | 791 | 364 | | 117 |
Financial Investments | | 3,163 | 5,512 | | (43) |
Deferred tax asset | | 172 | 106 | | 62 |
Other assets | | 320 | 214 | | 50 |
Total assets | | 40,106 | 60,063 | | (33) |
| | | | | |
Liabilities | | | | | �� |
Due to banks | | 2,309 | 5,150 | | (55) |
Cash collateral on securities lent | | 668 | 946 | | (29) |
Repurchase agreements | | 4,021 | 7,818 | | (49) |
Trading portfolio liabilities | | 4,787 | 2,447 | | 96 |
Negative replacement values | | 18,040 | 29,929 | | (40) |
Cash collateral payables on derivative instruments | | 5,966 | 7,991 | | (25) |
Financial liabilities designated at fair value | | 728 | 559 | | 30 |
Due to customers | | 230 | 754 | | (69) |
Other liabilities | | 316 | 257 | | 23 |
Total liabilities | | 37,064 | 55,851 | | (34) |
| | | | | |
Equity | | | | | |
Share capital | | 227 | 227 | | 0 |
Share premium | | 2,184 | 3,123 | | (30) |
Retained earnings | | 396 | 241 | | 64 |
Cumulative net income recognized directly in equity, net of tax | | 1 | 6 | | (78) |
Other equity instruments | | 235 | 615 | | (62) |
Total equity | | 3,042 | 4,212 | | (28) |
Total liabilities and equity | | 40,106 | 60,063 | | (33) |
The financial statements of UBS Limited are prepared in accordance with International Financial Reporting Standards (IFRS), as endorsed by the European Union (EU), and are stated in British pounds (GBP), the functional currency of the entity. UBS Limited is 100% owned by UBS AG, which is 100% owned by UBS Group AG, the ultimate parent company of the UBS Group.
This financial information is unaudited and should be read in conjunction with the audited financial statements of UBS Limited. The full Annual Report and Financial Statements of UBS Limited for the year ended 31 December 2015 will be available from April 2016 in the “Subsidiary and branch information” section at www.ubs.com/investors.
Capital information¹˒²˒³ | | | |
GBP million, except where indicated | | 31.12.15 | 31.12.14 |
Tier 1 capital | | 2,629 | 3,947 |
of which: common equity tier 1 capital | | 2,394 | 3,332 |
Tier 2 capital | | 587 | 997 |
Total capital | | 3,216 | 4,944 |
Common equity tier 1 capital ratio (%) | | 19.4 | 30.8 |
Tier 1 capital ratio (%) | | 21.3 | 36.5 |
Total capital ratio (%) | | 26.1 | 45.7 |
Risk-weighted assets | | 12,316 | 10,810 |
Leverage Ratio % | | 6.9 | |
Leverage Ratio Denominator | | 38,046 | |
1 Capital information for UBS Limited has been prepared in accordance with Regulation (EU) No 575 / 2013 (as amended by Regulation (EU) 2015 / 62 in respect of the leverage ratio). 2 There is no local disclosure requirement for the liquidity coverage ratio for UBS Limited. 3 Capital information disclosed in this table excludes 2015 net profit carried forward, which will become eligible for inclusion only after completion of the statutory audit. |
Additional regulatory information
Additional regulatory information
Table of contents
871 | Table 9d: Residential mortgages – A-IRB approach: Regulatory net credit risk exposure, weighted average PD, LGD and RWA by internal UBS ratings |
872 | Table 9e: Lombard lending – A-IRB approach: Regulatory net credit risk exposure, weighted average PD, LGD and RWA by internal UBS ratings |
873 | Table 9f: Qualifying revolving retail exposures – A-IRB approach: Regulatory net credit risk exposure, weighted average PD, LGD and RWA by internal UBS ratings |
874 | Table 9g: Other retail – A-IRB approach: Regulatory net credit risk exposure, weighted average PD, LGD and RWA by internal UBS ratings |
| |
875 | Standardized approach |
875 | Table 10a: Regulatory gross and net credit risk exposure by risk weight under the standardized approach |
876 | Table 10b: Regulatory net credit risk exposure under the standardized approach risk-weighted using external ratings |
876 | Table 11: Eligible financial collateral recognized under the standardized approach |
| |
877 | Comparison of A-IRB approach and Standardized Approach (SA) |
878 | Table 12: Breakdown by exposure segments |
| |
882 | Impairment, default and credit loss |
882 | Table 13: Total actual and expected credit losses |
| |
883 | Derivatives credit risk |
883 | Table 14: Credit risk exposure of derivative instruments |
| |
884 | Other credit risk information |
884 | Table 15: Credit derivatives |
| |
885 | Equity instruments in the banking book |
885 | Table 16: Equity instruments in the banking book |
| |
| |
| |
| |
| |
| |
| |
| |
| |
| |
| |
| |
| |
| |
| |
886 | Market risk |
| |
887 | Securitization |
| |
887 | Table 17: Securitization / re-securitization |
| |
888 | Objectives, roles and involvement |
| |
890 | Securitization exposures in the banking and trading book |
890 | Table 18: Securitization activity for the year in the banking book |
891 | Securitization activity for the year in the trading book |
| |
891 | Table 19: Outstanding securitized exposures |
892 | Table 20: Impaired or past due securitized exposures and losses related to securitized exposures in the banking book |
892 | Table 21: Exposures intended to be securitized in the banking and trading book |
893 | Table 22: Securitization positions retained or purchased in the banking book |
894 | Table 23: Securitization positions retained or purchased in the trading book |
895 | Table 24a: Capital requirement for securitization / re-securitization positions retained or purchased in the banking book |
895 | Table 24b: Securitization / re-securitization exposures treated under the ratings-based approach by rating clusters – banking book |
896 | Table 24c: Securitization / re-securitization exposures treated under the supervisory formula approach by rating clusters – banking book |
896 | Gains on sale – securitization exposures to be deducted from Basel III tier 1 capital |
Additional regulatory information
UBS Group AG consolidated supplemental disclosures required under SEC regulations
A – Introduction
The following pages contain supplemental UBS Group AG disclosures that are required under SEC regulations. UBS Group AG’s consolidated financial statements have been prepared in accordance with International Financial Reporting Standards (IFRS) as issued by the International Accounting Standards Board (IASB) and are denominated in Swiss francs (CHF), the reporting currency of the Group.
The consolidated financial statements of UBS Group AG were prepared as a continuation of the consolidated financial statements of UBS AG, applying the same accounting policies under International Financial Reporting Standards (IFRS). The comparative information for 2013, 2012 and 2011 reflects the consolidated financial statements of UBS AG, as previously published, except for certain voluntary changes in accounting policy and presentation that are unrelated to the establishment of UBS Group AG.
Additional regulatory information
UBS Group AG consolidated supplemental disclosures required under SEC regulations
B – Selected financial data
The tables below provide information concerning the noon purchase rate for the Swiss franc, expressed in United States dollars, or USD, per one Swiss franc. The noon purchase rate is the rate in New York City for cable transfers in foreign currencies as certified for customs purposes by the Federal Reserve Bank of New York.
On 29 February 2016, the noon purchase rate was 1.0040 USD per 1 CHF.
Year ended 31 December | High | Low | Average rate (USD per 1 CHF)¹ | At period end |
2011 | 1.3706 | 1.0251 | 1.1398 | 1.0668 |
2012 | 1.1174 | 1.0043 | 1.0724 | 1.0923 |
2013 | 1.1292 | 1.0190 | 1.0826 | 1.1231 |
2014 | 1.1478 | 1.0066 | 1.0893 | 1.0066 |
2015 | 1.1781 | 0.9704 | 1.0368 | 0.9983 |
| | | | |
Month | High | Low | | |
September 2015 | 1.0401 | 1.0225 | | |
October 2015 | 1.0539 | 1.0086 | | |
November 2015 | 1.0149 | 0.9704 | | |
December 2015 | 1.0180 | 0.9713 | | |
January 2016 | 1.0028 | 0.9779 | | |
February 2016 | 1.0303 | 0.9802 | | |
1 The average of the noon purchase rates on the last business day of each full month during the relevant period. |
Key figures | | | | | | |
| | As of or for the year ended |
CHF million, except where indicated | | 31.12.15 | 31.12.14 | 31.12.13 | 31.12.12 | 31.12.11 |
| | | | | | |
Group results | | | | | | |
Operating income | | 30,605 | 28,027 | 27,732 | 25,423 | 27,788 |
Operating expenses | | 25,116 | 25,567 | 24,461 | 27,216 | 22,482 |
Operating profit / (loss) from continuing operations before tax | | 5,489 | 2,461 | 3,272 | (1,794) | 5,307 |
Net profit / (loss) attributable to UBS Group AG shareholders | | 6,203 | 3,466 | 3,172 | (2,480) | 4,138 |
Diluted earnings per share (CHF)¹ | | 1.64 | 0.91 | 0.83 | (0.66) | 1.08 |
| | | | | | |
Key performance indicators² | | | | | | |
Profitability | | | | | | |
Return on tangible equity (%) | | 13.7 | 8.2 | 8.0 | 1.6 | 11.9 |
Return on assets, gross (%) | | 3.1 | 2.8 | 2.5 | 1.9 | 2.1 |
Cost / income ratio (%) | | 81.8 | 91.0 | 88.0 | 106.6 | 80.7 |
Growth | | | | | | |
Net profit growth (%) | | 79.0 | 9.3 | | | (44.5) |
Net new money growth for combined wealth management businesses (%)³ | | 2.2 | 2.5 | 3.4 | 3.2 | 2.4 |
Resources | | | | | | |
Common equity tier 1 capital ratio (%, fully applied)⁴ | | 14.5 | 13.4 | 12.8 | 9.8 | |
BIS tier 1 capital ratio, Basel 2.5 (%) | | | | | 21.3 | 15.9 |
BIS total capital ratio, Basel 2.5 (%) | | | | | 25.2 | 17.2 |
Swiss SRB leverage ratio (phase-in, %)⁵ | | 6.2 | 5.4 | 4.7 | 3.6 | |
| | | | | | |
Additional information | | | | | | |
Profitability | | | | | | |
Return on equity (RoE) (%) | | 11.8 | 7.0 | 6.7 | (5.1) | 9.1 |
Return on risk-weighted assets, gross (%)⁶ | | 14.1 | 12.4 | 11.4 | 12.0 | 13.7 |
Resources | | | | | | |
Total assets | | 942,819 | 1,062,478 | 1,013,355 | 1,259,797 | 1,416,962 |
Equity attributable to UBS Group AG shareholders | | 55,313 | 50,608 | 48,002 | 45,949 | 48,530 |
Common equity tier 1 capital (fully applied)⁴ | | 30,044 | 28,941 | 28,908 | 25,182 | |
Common equity tier 1 capital (phase-in)⁴ | | 40,378 | 42,863 | 42,179 | 40,032 | |
Risk-weighted assets (fully applied)⁴ | | 207,530 | 216,462 | 225,153 | 258,113 | |
Risk-weighted assets (phase-in)⁴ | | 212,302 | 220,877 | 228,557 | 261,800 | |
Common equity tier 1 capital ratio (%, phase-in)⁴ | | 19.0 | 19.4 | 18.5 | 15.3 | |
Total capital ratio (%) (fully applied)⁴ | | 22.9 | 18.9 | 15.4 | 11.4 | |
Total capital ratio (%) (phase-in)⁴ | | 26.8 | 25.5 | 22.2 | 18.9 | |
Swiss SRB leverage ratio (fully applied, %)⁵ | | 5.3 | 4.1 | 3.4 | 2.4 | |
Swiss SRB leverage ratio denominator (fully applied)⁵ | | 897,607 | 997,822 | 1,015,306 | 1,206,214 | |
Swiss SRB leverage ratio denominator (phase-in)⁵ | | 904,014 | 1,004,869 | 1,022,924 | 1,216,561 | |
BIS tier 1 capital, Basel 2.5 | | | | | 40,982 | 38,370 |
BIS risk-weighted assets, Basel 2.5 | | | | | 192,505 | 240,962 |
Average equity of average assets (%) | | 5.0 | 4.7 | 4.0 | 3.4 | 3.2 |
Additional regulatory information
UBS Group AG consolidated supplemental disclosures required under SEC regulations
Key figures (continued) | | | | | | |
| | As of or for the year ended |
CHF million, except where indicated | | 31.12.15 | 31.12.14 | 31.12.13 | 31.12.12 | 31.12.11 |
Other | | | | | | |
Invested assets (CHF billion)⁷ | | 2,689 | 2,734 | 2,390 | 2,230 | 2,088 |
Personnel (full-time equivalents) | | 60,099 | 60,155 | 60,205 | 62,628 | 64,820 |
Americas | | 20,816 | 20,951 | 21,317 | 21,995 | 22,924 |
of which: USA | | 19,897 | 19,715 | 20,037 | 20,833 | 21,746 |
Asia Pacific | | 7,539 | 7,385 | 7,116 | 7,426 | 7,690 |
Europe, Middle East and Africa | | 10,505 | 10,254 | 10,052 | 10,829 | 11,019 |
of which: United Kingdom | | 5,373 | 5,425 | 5,595 | 6,459 | 6,674 |
of which: Rest of Europe | | 4,957 | 4,663 | 4,303 | 4,202 | 4,182 |
of which: Middle East and Africa | | 176 | 166 | 153 | 167 | 162 |
Switzerland | | 21,238 | 21,564 | 21,720 | 22,378 | 23,188 |
Market capitalization⁸ | | 75,147 | 63,526 | 65,007 | 54,729 | 42,843 |
Total book value per share (CHF)⁸ | | 14.75 | 13.94 | 12.74 | 12.26 | 12.95 |
Tangible book value per share (CHF)⁸ | | 13.00 | 12.14 | 11.07 | 10.54 | 10.36 |
Registered ordinary shares (number)⁹ | | 3,849,731,535 | 3,717,128,324 | 3,842,002,069 | 3,835,250,233 | 3,832,121,899 |
Treasury shares (number)⁸ | | 98,706,275 | 87,871,737 | 73,800,252 | 87,879,601 | 84,955,551 |
1 Refer to Note 9 to the consolidated financial statements for more information. 2 Refer to the "Measurement of performance" section of this report for the definitions of our key performance indicators. 3 Based on adjusted net new money, which excludes the negative effect on net new money in 2015 of CHF 9.9 billion from our balance sheet and capital optimization program. 4 Based on the Basel III framework as applicable for Swiss systemically relevant banks (SRBs). Refer to the "Capital management" section of this report for more information. 5 Calculated in accordance with Swiss SRB rules. From 31 December 2015 onward, the Swiss SRB leverage ratio denominator calculation is fully aligned with the BIS Basel III rules. Prior-period figures are calculated in accordance with former Swiss SRB rules and are therefore not fully comparable. Refer to the "Capital management" section of this report for more information. 6 Based on phase-in risk-weighted assets. 7 Includes invested assets for Personal & Corporate Banking. 8 Refer to the “UBS shares” section of this report for more information. 9 Registered ordinary shares as of 31 December 2015 and 31 December 2014 reflect UBS Group AG shares. Other comparative period information relates to UBS AG shares. Refer to the “UBS shares” section of this report for more information. |
Income statement data | | | | | | |
| | For the year ended |
CHF million, except where indicated | | 31.12.15 | 31.12.14 | 31.12.13 | 31.12.12 | 31.12.11 |
Interest income | | 13,177 | 13,194 | 13,137 | 15,968 | 17,969 |
Interest expense | | (6,445) | (6,639) | (7,351) | (9,990) | (11,143) |
Net interest income | | 6,732 | 6,555 | 5,786 | 5,978 | 6,826 |
Credit loss (expense) / recovery | | (117) | (78) | (50) | (118) | (84) |
Net interest income after credit loss (expense) / recovery | | 6,615 | 6,477 | 5,736 | 5,860 | 6,742 |
Net fee and commission income | | 17,140 | 17,076 | 16,287 | 15,396 | 15,236 |
Net trading income | | 5,742 | 3,842 | 5,130 | 3,526 | 4,343 |
Other income | | 1,107 | 632 | 580 | 641 | 1,467 |
Total operating income | | 30,605 | 28,027 | 27,732 | 25,423 | 27,788 |
Total operating expenses | | 25,116 | 25,567 | 24,461 | 27,216 | 22,482 |
Operating profit / (loss) before tax | | 5,489 | 2,461 | 3,272 | (1,794) | 5,307 |
Tax expense / (benefit) | | (898) | (1,180) | (110) | 461 | 901 |
Net profit / (loss) | | 6,386 | 3,640 | 3,381 | (2,255) | 4,406 |
Net profit / (loss) attributable to preferred noteholders | | | 142 | 204 | 220 | |
Net profit / (loss) attributable to non-controlling interests | | 183 | 32 | 5 | 5 | 268 |
Net profit / (loss) attributable to UBS Group AG shareholders | | 6,203 | 3,466 | 3,172 | (2,480) | 4,138 |
Cost / income ratio (%)¹ | | 81.8 | 91.0 | 88.0 | 106.6 | 80.7 |
Per share data (CHF) | | | | | | |
Basic² | | 1.68 | 0.93 | 0.84 | (0.66) | 1.10 |
Diluted² | | 1.64 | 0.91 | 0.83 | (0.66) | 1.08 |
Ordinary cash dividends declared per share (CHF)³˒⁴ | | 0.60 | 0.50 | 0.25 | 0.15 | 0.10 |
Ordinary cash dividends declared per share (USD)³˒⁴ | | | 0.54 | 0.28 | 0.16 | 0.11 |
Special cash dividends declared per share (CHF)³˒⁴ | | 0.25 | 0.25 | | | |
Special cash dividends declared per share (USD)³˒⁴ | | | 0.26 | | | |
Dividend payout ratio (%) | | 52 | 55⁵ | 30 | (23) | 9 |
Rates of return (%) | | | | | | |
Return on equity attributable to UBS Group AG shareholders | | 11.8 | 7.0 | 6.7 | (5.1) | 9.1 |
Return on average equity | | 11.8 | 7.0 | 6.7 | (5.0) | 9.1 |
Return on average assets | | 0.6 | 0.3 | 0.3 | (0.2) | 0.3 |
1 Operating expenses / operating income before credit loss expense. 2 Refer to Note 9 to the consolidated financial statements for more information. 3 Dividends and / or distribution of the capital contribution reserve are normally approved and paid in the year subsequent to the reporting period. 4 Refer to the “Proposed dividend distribution out of capital contribution reserve” in the UBS Group AG standalone financial statements for more information. 5 The calculation of the dividend payout ratio for the year ended 31 December 2014 excludes the special cash dividend related to the one-time supplementary capital return paid after the successful completion of the SESTA procedure. |
Additional regulatory information
UBS Group AG consolidated supplemental disclosures required under SEC regulations
Balance sheet data |
CHF million | 31.12.15 | 31.12.14 | 31.12.13 | 31.12.12 | 31.12.11 |
Assets | | | | | |
Total assets | 942,819 | 1,062,478 | 1,013,355 | 1,259,797 | 1,416,962 |
Cash and balances with central banks | 91,306 | 104,073 | 80,879 | 66,383 | 40,638 |
Due from banks | 11,948 | 13,334 | 13,874 | 21,220 | 23,218 |
Cash collateral on securities borrowed | 25,584 | 24,063 | 27,496 | 37,372 | 58,763 |
Reverse repurchase agreements | 67,893 | 68,414 | 91,563 | 130,941 | 213,501 |
Trading portfolio assets | 124,035 | 138,156 | 122,848 | 160,564 | 181,525 |
of which: assets pledged as collateral which may be sold or repledged by counterparties | 51,943 | 56,018 | 42,449 | 44,698 | 39,936 |
Positive replacement values | 167,435 | 256,978 | 254,084 | 418,957 | 486,584 |
Cash collateral receivables on derivative instruments | 23,763 | 30,979 | 26,548 | 30,413 | 41,322 |
Loans | 311,954 | 315,757 | 286,959 | 279,901 | 266,604 |
Financial investments available-for-sale | 62,543 | 57,159 | 59,525 | 66,230 | 53,174 |
Other assets | 22,160 | 22,988 | 20,228 | 17,244 | 15,492 |
Liabilities | | | | | |
Due to banks | 11,836 | 10,492 | 12,862 | 23,024 | 30,201 |
Cash collateral on securities lent | 8,029 | 9,180 | 9,491 | 9,203 | 8,136 |
Repurchase agreements | 9,653 | 11,818 | 13,811 | 38,557 | 102,429 |
Trading portfolio liabilities | 29,137 | 27,958 | 26,609 | 34,247 | 39,480 |
Negative replacement values | 162,430 | 254,101 | 248,079 | 395,260 | 473,400 |
Cash collateral payables on derivative instruments | 38,282 | 42,372 | 44,507 | 71,148 | 67,114 |
Financial liabilities designated at fair value | 62,995 | 75,297 | 69,901 | 91,901 | 88,982 |
Due to customers | 390,185 | 410,207 | 390,825 | 373,459 | 342,409 |
Debt issued | 93,147 | 91,207 | 81,586 | 104,837 | 140,617 |
Other liabilities | 75,652 | 71,112 | 62,777 | 66,523 | 69,633 |
Equity attributable to UBS Group AG shareholders | 55,313 | 50,608 | 48,002 | 45,949 | 48,530 |
C – Information on the company
Property, plant and equipment
As of 31 December 2015, UBS operated about 856 business and banking locations worldwide, of which approximately 41% were in Switzerland, 41% in the Americas, 11% in the rest of Europe, Middle East and Africa and 7% in Asia Pacific. Of the business and banking locations in Switzerland, 33% were owned directly by UBS, with the remainder, along with most of UBS’s offices outside Switzerland, being held under commercial leases. These premises are subject to continuous maintenance and upgrading and are considered suitable and adequate for current and anticipated operations.
Additional regulatory information
UBS Group AG consolidated supplemental disclosures required under SEC regulations
D – Information required by industry guide 3
Selected statistical information
The following tables set forth select statistical information regarding the Group’s banking operations extracted from the financial statements. Unless otherwise indicated, average balances for the years ended 31 December 2015, 31 December 2014 and 31 December 2013 are calculated from monthly data. The distinction between domestic (Swiss) and foreign (non-Swiss) is generally based on the booking location. For loans, this method is not significantly different from an analysis based on the domicile of the borrower.
Average balances and interest rates
The following table sets forth average interest-earning assets and average interest-bearing liabilities, along with the average yield, for the years ended
| | 31.12.15 | | 31.12.14 | | 31.12.13 |
CHF million, except where indicated | | Average balance | Interest income | Average yield (%) | | Average balance | Interest income | Average yield (%) | | Average balance | Interest income | Average yield (%) |
Assets | | | | | | | | | | | | |
Due from banks | | | | | | | | | | | | |
Domestic | | 3,524 | 5 | 0.1 | | 3,269 | 8 | 0.2 | | 3,051 | 8 | 0.3 |
Foreign | | 10,846 | 61 | 0.6 | | 16,692 | 95 | 0.6 | | 16,420 | 82 | 0.5 |
Cash collateral on securities borrowed and reverse repurchase agreements | | | | | | | | | | | | |
Domestic | | 6,415 | 14¹ | 0.2 | | 7,374 | 4 | 0.1 | | 11,479 | 10 | 0.1 |
Foreign | | 138,961 | 614¹ | 0.4 | | 133,640 | 463 | 0.3 | | 162,479 | 575 | 0.4 |
Trading portfolio assets | | | | | | | | | | | | |
Domestic | | 4,921 | 159 | 3.2 | | 5,105 | 209 | 4.1 | | 5,189 | 177 | 3.4 |
Foreign taxable | | 121,542 | 2,912 | 2.4 | | 118,038 | 2,988 | 2.5 | | 119,894 | 2,736 | 2.3 |
Foreign non-taxable | | 0 | 0 | | | 0 | 0 | | | 0 | 0 | |
Foreign total | | 121,542 | 2,912 | 2.4 | | 118,038 | 2,988 | 2.5 | | 119,894 | 2,736 | 2.3 |
Cash collateral receivables on derivative instruments | | | | | | | | | | | | |
Domestic | | 249 | 3 | 1.2 | | 113 | 1 | 0.9 | | 155 | 0 | 0.0 |
Foreign | | 29,469 | 59 | 0.2 | | 27,920 | 54 | 0.2 | | 29,244 | 70 | 0.2 |
Financial assets designated at fair value | | | | | | | | | | | | |
Domestic | | 710 | 1 | 0.1 | | 729 | 1 | 0.1 | | 414 | 0 | 0.0 |
Foreign | | 4,715 | 193 | 4.1 | | 4,982 | 207 | 4.2 | | 10,113 | 364 | 3.6 |
Loans | | | | | | | | | | | | |
Domestic | | 192,815 | 3,644 | 1.9 | | 192,993 | 3,780 | 2.0 | | 189,969 | 3,974 | 2.1 |
Foreign | | 120,692 | 2,510 | 2.1 | | 109,137 | 2,520 | 2.3 | | 100,027 | 2,420 | 2.4 |
Financial investments available-for-sale | | | | | | | | | | | | |
Domestic | | 20,037 | 63 | 0.3 | | 2,006 | 8 | 0.4 | | 1,980 | 11 | 0.6 |
Foreign taxable | | 43,131 | 328 | 0.8 | | 52,642 | 307 | 0.6 | | 60,093 | 310 | 0.5 |
Foreign non-taxable | | 0 | 0 | | | 0 | 0 | | | 0 | 0 | |
Foreign total | | 43,131 | 328 | 0.8 | | 52,642 | 307 | 0.6 | | 60,093 | 310 | 0.5 |
Other interest-earning assets | | | | | | | | | | | | |
Domestic | | 0 | 0 | | | 0 | 0 | | | 0 | 0 | |
Foreign | | 12,749 | 526 | 4.1 | | 12,024 | 477 | 4.0 | | 8,953 | 430 | 4.8 |
Total interest-earning assets | | 710,777 | 11,092 | 1.6 | | 686,662 | 11,123 | 1.6 | | 719,460 | 11,168 | 1.6 |
Net interest income on swaps | | | 1,630 | | | | 1,613 | | | | 1,528 | |
Interest income on off-balance sheet securities and other | | | 455¹ | | | | 458 | | | | 441 | |
Interest income and average interest-earning assets | | 710,777 | 13,177 | 1.9 | | 686,662 | 13,194 | 1.9 | | 719,460 | 13,137 | 1.8 |
Non-interest-earning assets | | | | | | | | | | | | |
Positive replacement values | | 213,913 | | | | 232,739 | | | | 337,781 | | |
Fixed assets | | 7,154 | | | | 6,383 | | | | 6,054 | | |
Other | | 126,767 | | | | 127,799 | | | | 115,921 | | |
Total average assets | | 1,058,611 | | | | 1,053,584 | | | | 1,179,216 | | |
Additional regulatory information
UBS Group AG consolidated supplemental disclosures required under SEC regulations
Average balances and interest rates (continued)
| | 31.12.15 | | 31.12.14 | | 31.12.13 |
CHF million, except where indicated | | Average balance | Interest expense | Average interest rate (%) | | Average balance | Interest expense | Average interest rate (%) | | Average balance | Interest expense | Average interest rate (%) |
Liabilities and equity | | | | | | | | | | | | |
Due to banks | | | | | | | | | | | | |
Domestic | | 9,571 | 11 | 0.1 | | 8,932 | 16 | 0.2 | | 13,859 | 37 | 0.3 |
Foreign | | 2,480 | 11 | 0.4 | | 3,691 | 14 | 0.4 | | 4,073 | 24 | 0.6 |
Cash collateral on securities lent and repurchase agreements | | | | | | | | | | | | |
Domestic | | 3,413 | 2² | 0.1 | | 5,328 | 1 | 0.0 | | 5,344 | 2 | 0.0 |
Foreign | | 71,129 | 442² | 0.6 | | 58,639 | 338 | 0.6 | | 65,088 | 344 | 0.5 |
Trading portfolio liabilities | | | | | | | | | | | | |
Domestic | | 535 | 5 | 0.9 | | 638 | 14 | 2.2 | | 628 | 12 | 1.9 |
Foreign | | 31,418 | 1,665 | 5.3 | | 28,733 | 1,789 | 6.2 | | 29,874 | 1,834 | 6.1 |
Cash collateral payables on derivative instruments | | | | | | | | | | | | |
Domestic | | 993 | 1 | 0.1 | | 612 | 0 | 0.0 | | 540 | 0 | 0.0 |
Foreign | | 41,499 | 57 | 0.1 | | 42,595 | 45 | 0.1 | | 58,693 | 65 | 0.1 |
Financial liabilities designated at fair value | | | | | | | | | | | | |
Domestic | | 2,055 | 6 | 0.3 | | 1,747 | 13 | 0.7 | | 1,207 | 9 | 0.7 |
Foreign | | 65,446 | 724 | 1.1 | | 68,928 | 906 | 1.3 | | 79,182 | 1,188 | 1.5 |
Due to customers | | | | | | | | | | | | |
Domestic demand deposits | | 124,210 | (19) | 0.0 | | 130,593 | 43 | 0.0 | | 126,953 | 60 | 0.0 |
Domestic savings deposits | | 96,848 | 70 | 0.1 | | 97,825 | 172 | 0.2 | | 95,937 | 246 | 0.3 |
Domestic time deposits | | 12,372 | 11 | 0.1 | | 7,593 | 12 | 0.2 | | 4,379 | 15 | 0.3 |
Domestic total | | 233,430 | 62 | 0.0 | | 236,012 | 227 | 0.1 | | 227,268 | 321 | 0.1 |
Foreign | | 157,496 | 264 | 0.2 | | 159,170 | 340 | 0.2 | | 155,312 | 373 | 0.2 |
Short-term debt | | | | | | | | | | | | |
Domestic | | 873 | 4 | 0.5 | | 1,270 | 2 | 0.2 | | 1,703 | 3 | 0.2 |
Foreign | | 26,425 | 107 | 0.4 | | 26,734 | 101 | 0.4 | | 33,363 | 170 | 0.5 |
Long-term debt | | | | | | | | | | | | |
Domestic | | 18,717 | 720 | 3.8 | | 14,937 | 447 | 3.0 | | 11,823 | 281 | 2.4 |
Foreign | | 49,457 | 1,762 | 3.6 | | 43,264 | 1,833 | 4.2 | | 50,053 | 2,131 | 4.3 |
Other interest-bearing liabilities | | | | | | | | | | | | |
Domestic | | 0 | 0 | | | 0 | 0 | | | 0 | 0 | |
Foreign | | 39,968 | 58 | 0.1 | | 35,503 | 58 | 0.2 | | 35,706 | 67 | 0.2 |
Total interest-bearing liabilities | | 754,904 | 5,899 | 0.8 | | 736,733 | 6,145 | 0.8 | | 773,717 | 6,863 | 0.9 |
Interest expense on off-balance sheet securities and other | | | 546² | | | | 495 | | | | 489 | |
Interest expense and average interest-bearing liabilities | | 754,904 | 6,445 | 0.9 | | 736,733 | 6,640 | 0.9 | | 773,717 | 7,351 | 1.0 |
Non-interest-bearing liabilities | | | | | | | | | | | | |
Negative replacement values | | 210,551 | | | | 229,286 | | | | 321,681 | | |
Other | | 37,960 | | | | 35,474 | | | | 34,188 | | |
Total liabilities | | 1,003,415 | | | | 1,001,493 | | | | 1,129,586 | | |
Total equity | | 55,196 | | | | 52,091 | | | | 49,630 | | |
Total average liabilities and equity | | 1,058,611 | | | | 1,053,584 | | | | 1,179,216 | | |
Net interest income | | | 6,732 | | | | 6,555 | | | | 5,786 | |
Net yield on interest-earning assets | | | | 0.9 | | | | 1.0 | | | | 0.8 |
1 Includes negative interest, including fees, on securities lent and repurchase agreements. 2 Includes negative interest, including fees, on securities borrowed and reverse repurchase agreements. |
Average balances and interest rates (continued)
The percentage of total average interest-earning assets attributable to foreign activities was 68% for 2015 (69% for 2014 and 71% for 2013). The percentage of total average interest-bearing liabilities attributable to foreign activities was 64% for 2015 (63% for 2014 and 66% for 2013). All assets and liabilities are translated into CHF at uniform month-end rates. Interest income and expense are translated at monthly average rates.
Average rates earned and paid on assets and liabilities can change from period to period based on the changes in interest rates in general, but are also affected by changes in the currency mix included in the assets and liabilities. This is especially true for foreign assets and liabilities. Tax-exempt income is not recorded on a tax-equivalent basis. For all three years presented, tax-exempt income is considered to be insignificant and the impact from such income is therefore negligible.
Additional regulatory information
UBS Group AG consolidated supplemental disclosures required under SEC regulations
Analysis of changes in interest income and expense
The following tables allocate, by categories of interest-earning assets and interest-bearing liabilities, the changes in interest income and expense due to changes in volume and interest rates for the year ended 31 December 2015 compared with the year ended 31 December 2014, and for the year ended 31 December 2014 compared with the year ended 31 December 2013. Volume and rate variances have been calculated on movements in average balances and changes in interest rates. Changes due to a combination of volume and rates have been allocated proportionally.
| | 2015 compared with 2014 | | 2014 compared with 2013 |
| | Increase / (decrease) due to changes in | | | | Increase / (decrease) due to changes in | | |
CHF million | | Average volume | Average interest rate | | Net change | | Average volume | Average interest rate | | Net change |
Interest income from interest-earning assets | | | | | | | | | | |
Due from banks | | | | | | | | | | |
Domestic | | 1 | (5) | | (4) | | 1 | (1) | | 0 |
Foreign | | (35) | 2 | | (33) | | 1 | 11 | | 12 |
Cash collateral on securities borrowed and reverse repurchase agreements | | | | | | | | | | |
Domestic | | (1) | 11 | | 10 | | (4) | (2) | | (6) |
Foreign | | 16 | 135 | | 151 | | (115) | 4 | | (111) |
Trading portfolio assets | | | | | | | | | | |
Domestic | | (8) | (42) | | (50) | | (3) | 35 | | 32 |
Foreign taxable | | 88 | (164) | | (76) | | (43) | 295 | | 252 |
Foreign non-taxable | | 0 | 0 | | 0 | | 0 | 0 | | 0 |
Foreign total | | 88 | (164) | | (76) | | (43) | 295 | | 252 |
Cash collateral receivables on derivative instruments | | | | | | | | | | |
Domestic | | 1 | 1 | | 2 | | 0 | 1 | | 0 |
Foreign | | 3 | 2 | | 5 | | (3) | (12) | | (15) |
Financial assets designated at fair value | | | | | | | | | | |
Domestic | | 0 | 0 | | 0 | | 0 | 1 | | 1 |
Foreign | | (11) | (4) | | (15) | | (185) | 28 | | (157) |
Loans | | | | | | | | | | |
Domestic | | (4) | (131) | | (135) | | 63 | (258) | | (195) |
Foreign | | 266 | (276) | | (10) | | 219 | (120) | | 99 |
Financial investments available-for-sale | | | | | | | | | | |
Domestic | | 72 | (17) | | 55 | | 0 | (3) | | (3) |
Foreign taxable | | (57) | 78 | | 21 | | (37) | 34 | | (3) |
Foreign non-taxable | | 0 | 0 | | 0 | | 0 | 0 | | 0 |
Foreign total | | (57) | 78 | | 21 | | (37) | 34 | | (3) |
Other interest-bearing assets | | | | | | | | | | |
Domestic | | 0 | 0 | | 0 | | 0 | 0 | | 0 |
Foreign | | 29 | 19 | | 48 | | 147 | (99) | | 48 |
Interest income | | | | | | | | | | |
Domestic | | 61 | (183) | | (122) | | 57 | (227) | | (170) |
Foreign | | 299 | (208) | | 91 | | (16) | 140 | | 124 |
Total interest income from interest-earning assets | | 360 | (391) | | (31) | | 41 | (87) | | (46) |
Net interest on swaps | | | | | 17 | | | | | 86 |
Interest income on off-balance sheet securities and other | | | | | (4) | | | | | 17 |
Total interest income | | | | | (17) | | | | | 57 |
Analysis of changes in interest income and expense (continued)
| | 2015 compared with 2014 | | 2014 compared with 2013 |
| | Increase / (decrease) due to changes in | | | | Increase / (decrease) due to changes in | | |
CHF million | | Average volume | Average interest rate | | Net change | | Average volume | Average interest rate | | Net change |
Interest expense on interest-bearing liabilities | | | | | | | | | | |
Due to banks | | | | | | | | | | |
Domestic | | 1 | (6) | | (5) | | (15) | (6) | | (21) |
Foreign | | (5) | 2 | | (3) | | (2) | (7) | | (9) |
Cash collateral on securities lent and repurchase agreements | | | | | | | | | | |
Domestic | | 0 | 0 | | 0 | | 0 | 0 | | 0 |
Foreign | | 75 | 30 | | 105 | | (32) | 26 | | (6) |
Trading portfolio liabilities | | | | | | | | | | |
Domestic | | (2) | (8) | | (10) | | 0 | 2 | | 2 |
Foreign | | 166 | (290) | | (124) | | (70) | 25 | | (45) |
Cash collateral payables on derivative instruments | | | | | | | | | | |
Domestic | | 0 | 1 | | 1 | | 0 | 0 | | 0 |
Foreign | | (1) | 13 | | 12 | | (16) | (4) | | (20) |
Financial liabilities designated at fair value | | | | | | | | | | |
Domestic | | 2 | (9) | | (7) | | 4 | 0 | | 4 |
Foreign | | (45) | (137) | | (182) | | (154) | (128) | | (282) |
Due to customers | | | | | | | | | | |
Domestic demand deposits | | 0 | (62) | | (62) | | 0 | (18) | | (18) |
Domestic savings deposits | | (2) | (100) | | (102) | | 6 | (80) | | (74) |
Domestic time deposits | | 10 | (11) | | (1) | | 10 | (13) | | (3) |
Domestic total | | 8 | (173) | | (165) | | 16 | (111) | | (95) |
Foreign | | (3) | (73) | | (76) | | 8 | (41) | | (33) |
Short-term debt | | | | | | | | | | |
Domestic | | (1) | 3 | | 2 | | (1) | (1) | | (2) |
Foreign | | (1) | 7 | | 6 | | (33) | (36) | | (69) |
Long-term debt | | | | | | | | | | |
Domestic | | 113 | 160 | | 273 | | 75 | 91 | | 166 |
Foreign | | 260 | (332) | | (72) | | (292) | (6) | | (298) |
Other interest-bearing liabilities | | | | | | | | | | |
Domestic | | 0 | 0 | | 0 | | 0 | 0 | | 0 |
Foreign | | 9 | (9) | | 0 | | 0 | (9) | | (9) |
Interest expense | | | | | | | | | | |
Domestic | | 121 | (32) | | 89 | | 79 | (25) | | 54 |
Foreign | | 455 | (790) | | (335) | | (591) | (181) | | (772) |
Total interest expense on interest-bearing liabilities | | 576 | (822) | | (246) | | (512) | (206) | | (718) |
Interest expense on off-balance sheet securities and other | | | | | 51 | | | | | 6 |
Total interest expense | | | | | (195) | | | | | (712) |
Additional regulatory information
UBS Group AG consolidated supplemental disclosures required under SEC regulations
The following table analyzes average deposits and average rates on each deposit category listed below for the years ended 31 December 2015, 2014 and 2013. The geographic allocation is based on the location of the office or branch where the deposit is made. Deposits by foreign depositors in domestic offices were CHF 72,532 million, CHF 76,362 million and CHF 76,246 million at 31 December 2015, 31 December 2014 and 31 December 2013, respectively.
| | 31.12.15 | | 31.12.14 | | 31.12.13 |
CHF million, except where indicated | | Average deposits | Average rate (%) | | Average deposits | Average rate (%) | | Average deposits | Average rate (%) |
Banks | | | | | | | | | |
Domestic offices | | | | | | | | | |
Demand deposits | | 5,261 | (0.2) | | 5,149 | (0.1) | | 8,513 | (0.1) |
Time deposits | | 4,310 | 0.5 | | 3,783 | 0.6 | | 5,346 | 0.8 |
Total domestic offices | | 9,571 | 0.1 | | 8,932 | 0.2 | | 13,859 | 0.3 |
Foreign offices | | | | | | | | | |
Interest-bearing deposits | | 2,437 | 0.4 | | 3,691 | 0.4 | | 3,763 | 0.6 |
Total due to banks¹ | | 12,007 | 0.2 | | 12,624 | 0.2 | | 17,622 | 0.3 |
| | | | | | | | | |
Customer accounts | | | | | | | | | |
Domestic offices | | | | | | | | | |
Demand deposits | | 124,210 | 0.0 | | 130,593 | 0.0 | | 126,953 | 0.0 |
Savings deposits | | 96,848 | 0.1 | | 97,825 | 0.2 | | 95,937 | 0.3 |
Time deposits | | 12,372 | 0.1 | | 7,593 | 0.2 | | 4,379 | 0.3 |
Total domestic offices | | 233,430 | 0.0 | | 236,012 | 0.1 | | 227,268 | 0.1 |
Foreign offices | | | | | | | | | |
Demand deposits | | 52,404 | 0.0 | | 49,098 | 0.0 | | 43,954 | 0.0 |
Time and savings deposits | | 105,091 | 0.2 | | 110,072 | 0.3 | | 111,358 | 0.3 |
Total foreign offices | | 157,496 | 0.2 | | 159,170 | 0.2 | | 155,312 | 0.2 |
Total due to customers | | 390,925 | 0.1 | | 395,182 | 0.1 | | 382,580 | 0.2 |
1 Due to banks is considered to represent short-term borrowings to the extent that the total Due to banks exceeds total Due from banks, without differentiating between domestic and foreign offices. The remainder of total Due to banks is considered to represent deposits for the purpose of this disclosure. |
As of 31 December 2015, the maturity of time deposits was as follows:
CHF million | | | | | | | | Domestic | Foreign |
Within 3 months | | | | | | | | 16,145 | 39,735 |
3 to 6 months | | | | | | | | 887 | 1,982 |
6 to 12 months | | | | | | | | 314 | 812 |
1 to 5 years | | | | | | | | 235 | 596 |
Over 5 years | | | | | | | | 60 | 99 |
Total time deposits | | | | | | | | 17,642 | 43,225 |
The table below presents the period-end, average and maximum month-end outstanding amounts for short-term borrowings, along with the average rates and period-end rates at and for the years ended 31 December 2015, 2014 and 2013.
| | Short-term debt | | Due to banks¹ | | Repurchase agreements² |
CHF million, except where indicated | | 31.12.15 | 31.12.14 | 31.12.13 | | 31.12.15 | 31.12.14 | 31.12.13 | | 31.12.15 | 31.12.14 | 31.12.13 |
Period-end balance | | 21,215 | 27,363 | 27,633 | | 0 | 0 | 0 | | 71,775 | 54,625 | 41,160 |
Average balance | | 27,298 | 28,004 | 35,067 | | 44 | 0 | 309 | | 65,118 | 52,865 | 61,251 |
Maximum month-end balance | | 31,911 | 33,674 | 44,789 | | 570 | 0 | 1,370 | | 80,372 | 65,033 | 76,014 |
Average interest rate during the period (%) | | 0.4 | 0.4 | 0.5 | | 0.2 | 0.0 | 0.3 | | 0.3 | 0.2 | 0.2 |
Average interest rate at period-end (%) | | 0.5 | 0.2 | 0.4 | | 0.0 | 0.0 | 0.0 | | 0.2 | 0.2 | 0.2 |
1 Amounts due to banks are presented net of amounts due from banks in order to reflect short-term borrowings. The difference between the gross Due to banks amount and the amount disclosed here is presented as deposits from banks on the preceding page. 2 Repurchase agreements are presented on a gross basis, and therefore, for the purpose of this disclosure, do not reflect the effect of netting permitted under IFRS. |
Contractual maturities of investments in debt instruments available-for-sale¹˒² | | | |
| | Within 1 year | | 1 up to 5 years | | 5 to 10 years | | Over 10 years | | Total |
CHF million, except percentages | | Amount | Yield (%) | | Amount | Yield (%) | | Amount | Yield (%) | | Amount | Yield (%) | | |
31 December 2015 | | | | | | | | | | | | | | |
Swiss national government and agencies | | 701 | (0.83) | | | | | 1 | 4.00 | | | | | 702 |
US Treasury and agencies | | 11,171 | 0.39 | | 6,856 | 1.29 | | | | | | | | 18,027 |
Foreign governments and official institutions | | 13,966 | 0.21 | | 11,049 | 0.64 | | 104 | 1.33 | | | | | 25,119 |
Corporate debt securities | | 6,062 | 0.42 | | 8,118 | 0.87 | | 264 | 1.27 | | | | | 14,443 |
Mortgage-backed securities | | | | | 0 | 5.20 | | | | | 3,396 | 1.74 | | 3,396 |
Total fair value³ | | 31,900 | | | 26,023 | | | 369 | | | 3,396 | | | 61,688 |
| | | | | | | | | | | | | | |
| | Within 1 year | | 1 up to 5 years | | 5 to 10 years | | Over 10 years | | Total |
CHF million, except percentages | | Amount | Yield (%) | | Amount | Yield (%) | | Amount | Yield (%) | | Amount | Yield (%) | | |
31 December 2014 | | | | | | | | | | | | | | |
Swiss national government and agencies | | 41 | 0.48 | | | | | 1 | 4.00 | | | | | 43 |
US Treasury and agencies | | 4,873 | 0.23 | | 8,317 | 1.02 | | | | | | | | 13,189 |
Foreign governments and official institutions | | 14,072 | 0.31 | | 13,758 | 0.74 | | 243 | 1.25 | | | | | 28,072 |
Corporate debt securities | | 2,089 | 0.45 | | 8,489 | 0.84 | | 280 | 1.33 | | | | | 10,858 |
Mortgage-backed securities | | | | | 0 | 4.82 | | 0 | 4.42 | | 4,029 | 1.34 | | 4,029 |
Total fair value³ | | 21,075 | | | 30,563 | | | 525 | | | 4,029 | | | 56,192 |
| | | | | | | | | | | | | | |
| | Within 1 year | | 1 up to 5 years | | 5 to 10 years | | Over 10 years | | Total |
CHF million, except percentages | | Amount | Yield (%) | | Amount | Yield (%) | | Amount | Yield (%) | | Amount | Yield (%) | | |
31 December 2013 | | | | | | | | | | | | | | |
Swiss national government and agencies | | | | | 43 | 0.46 | | 1 | 3.55 | | | | | 44 |
US Treasury and agencies | | 849 | 0.17 | | 13,010 | 0.36 | | 3 | 3.30 | | | | | 13,861 |
Foreign governments and official institutions | | 25,483 | 0.27 | | 7,277 | 0.55 | | 63 | 0.98 | | 19 | 12.16 | | 32,842 |
Corporate debt securities | | 743 | 0.52 | | 6,873 | 0.80 | | 178 | 0.85 | | 1 | 6.60 | | 7,795 |
Mortgage-backed securities | | | | | | | | 0 | 4.71 | | 4,017 | 2.09 | | 4,017 |
Total fair value³ | | 27,075 | | | 27,202 | | | 245 | | | 4,037 | | | 58,559 |
1 Debt instruments without fixed maturities are not disclosed in this table. 2 Average yields are calculated on an amortized cost basis. 3 Includes investments in debt instruments as of 31 December 2015 issued by US government and government agencies of CHF 21,424 million (31 December 2014: CHF 17,219 million, 31 December 2013: CHF 17,876 million), the German government of CHF 8,583 million (31 December 2014: CHF 10,145 million, 31 December 2013: CHF 6,733 million), the French government of CHF 3,566 million (31 December 2014: CHF 5,351 million, 31 December 2013: CHF 5,601 million) and the UK government of CHF 2,782 million (31 December 2014: CHF 2,348 million, 31 December 2013: CHF 8,089 million). |
Additional regulatory information
UBS Group AG consolidated supplemental disclosures required under SEC regulations
EDTF | Due from banks and loans (gross)
The Group’s lending portfolio is widely diversified across industry sectors. CHF 186.7 billion (57.5% of the total) consists of loans to thousands of private households, predominantly in Switzerland, and mostly secured by mortgages, financial collateral or other assets. Exposure to banks and financial institutions amounted to CHF 73.7 billion (22.7% of the total). Exposure to banks includes money market deposits with highly rated institutions. Excluding banks and financial institutions, the largest industry sector exposure as of 31 December 2015 was CHF 23.2 billion (7.1% of the total) to Services. For further discussion of the loan portfolio, refer to the “Risk management and control” section of this report.
The table below illustrates the diversification of the loan portfolio among industry sectors as of 31 December 2015, 2014, 2013, 2012 and 2011. The industry categories presented are consistent with the classification of loans for reporting to the Swiss Financial Market Supervisory Authority (FINMA) and the Swiss National Bank. Loans designated at fair value and loans held in the trading portfolio are excluded from the tables below.
CHF million | 31.12.15 | 31.12.14 | 31.12.13 | 31.12.12 | 31.12.11 |
Domestic | | | | | |
Banks | 538 | 1,157 | 736 | 532 | 566 |
Chemicals | 308 | 392 | 382 | 300 | 377 |
Construction | 1,520 | 1,418 | 1,429 | 1,360 | 1,292 |
Electricity, gas and water supply | 234 | 260 | 255 | 351 | 260 |
Financial services | 5,325 | 6,466 | 4,643 | 4,265 | 4,257 |
Food and beverages | 208 | 206 | 241 | 284 | 276 |
Hotels and restaurants | 1,647 | 1,696 | 1,817 | 1,745 | 1,831 |
Manufacturing | 2,012 | 2,319 | 2,512 | 2,976 | 3,252 |
Mining | 23 | 34 | 36 | 45 | 35 |
Private households | 123,967 | 125,461 | 124,569 | 123,167 | 120,671 |
Public authorities | 1,609 | 2,098 | 2,415 | 2,708 | 2,992 |
Real estate and rentals | 13,707 | 14,549 | 14,511 | 13,682 | 13,169 |
Retail and wholesale | 3,687 | 4,169 | 3,784 | 4,345 | 4,433 |
Services | 5,250 | 4,794 | 5,330 | 5,862 | 5,770 |
Transport, storage and communication | 1,876 | 1,964 | 2,013 | 1,728 | 1,414 |
Other | 697 | 732 | 753 | 830 | 769 |
Total domestic | 162,609 | 167,713 | 165,426 | 164,180 | 161,364 |
Foreign | | | | | |
Banks | 11,413 | 12,190 | 13,201 | 20,711 | 22,669 |
Chemicals | 113 | 75 | 178 | 254 | 392 |
Construction | 635 | 645 | 1,132 | 1,731 | 750 |
Electricity, gas and water supply | 706 | 1,100 | 1,337 | 1,205 | 746 |
Financial services | 56,375 | 57,645 | 43,125 | 40,650 | 38,801 |
Food and beverages | 65 | 56 | 63 | 45 | 49 |
Hotels and restaurants | 148 | 120 | 181 | 347 | 372 |
Manufacturing | 1,958 | 1,961 | 1,850 | 1,828 | 1,955 |
Mining | 1,466 | 1,345 | 1,175 | 1,279 | 1,979 |
Private households | 62,695 | 60,466 | 49,920 | 46,458 | 41,045 |
Public authorities | 1,272 | 1,413 | 1,322 | 4,319 | 5,459 |
Real estate and rentals | 2,213 | 2,517 | 2,995 | 2,721 | 2,158 |
Retail and wholesale | 1,975 | 1,924 | 1,791 | 2,063 | 2,044 |
Services | 17,929 | 17,470 | 14,733 | 10,735 | 8,529 |
Transport, storage and communication | 2,858 | 3,017 | 2,809 | 3,021 | 2,068 |
Other | 163 | 142 | 362 | 301 | 282 |
Total foreign | 161,985 | 162,086 | 136,174 | 137,669 | 129,300 |
Total gross | 324,594 | 329,800 | 301,601 | 301,849 | 290,664 |
▲
EDTF | Due from banks and loans (gross) (continued)
The table below analyzes the Group’s mortgage portfolio by client domicile and type of mortgage as of 31 December 2015, 2014, 2013, 2012 and 2011. Mortgages are included in the industry categories mentioned on the previous page.
CHF million | 31.12.15 | 31.12.14 | 31.12.13 | 31.12.12 | 31.12.11 |
Mortgages | | | | | |
Domestic | 144,230 | 146,637 | 144,852 | 142,143 | 138,204 |
Foreign | 18,887 | 18,112 | 15,235 | 12,311 | 8,818 |
Total gross mortgages | 163,117 | 164,748 | 160,086 | 154,454 | 147,022 |
| | | | | |
Mortgages | | | | | |
Residential | 141,608 | 142,380 | 137,370 | 132,033 | 125,775 |
Commercial | 21,509 | 22,368 | 22,716 | 22,421 | 21,247 |
Total gross mortgages | 163,117 | 164,748 | 160,086 | 154,454 | 147,022 |
p
Due from banks and loan maturities (gross) | | | | |
CHF million | Within 1 year | 1 to 5 years | Over 5 years | Total |
Domestic | | | | |
Banks | 538 | 0 | 0 | 538 |
Mortgages | 60,404 | 49,062 | 34,764 | 144,230 |
Other loans | 14,461 | 2,555 | 824 | 17,840 |
Total domestic | 75,403 | 51,617 | 35,588 | 162,609 |
Foreign | | | | |
Banks | 11,354 | 34 | 24 | 11,413 |
Mortgages | 5,170 | 4,615 | 9,102 | 18,887 |
Other loans | 109,263 | 18,387 | 4,035 | 131,685 |
Total foreign | 125,787 | 23,036 | 13,162 | 161,985 |
Total gross | 201,191 | 74,654 | 48,750 | 324,594 |
As of 31 December 2015, the total amounts of Due from banks and Loans granted at fixed- and floating-rates were as follows:
CHF million | Within 1 year | 1 to 5 years | Over 5 years | Total |
Fixed-rate loans | 136,297 | 59,052 | 38,929 | 234,278 |
Adjustable or floating-rate loans | 64,893 | 15,601 | 9,821 | 90,316 |
Total | 201,191 | 74,654 | 48,750 | 324,594 |
Additional regulatory information
UBS Group AG consolidated supplemental disclosures required under SEC regulations
EDTF | Impaired and non-performing loans
A loan (included in Due from banks or Loans) is classified as nonperforming: (i) when the payment of interest, principal or fees is overdue by more than 90 days, (ii) when insolvency proceedings have commenced or (iii) when obligations have been restructured on preferential terms. For IFRS reporting purposes, the definition of impaired loans is more comprehensive, covering both non-performing loans and other situations where objective evidence indicates that UBS may be unable to collect all amounts due. Refer to “Impaired loans” in the “Risk management and control” section of this report for comprehensive information on UBS’s impaired loans, of which non-performing loans are a component. Also, refer to Note 1 to the consolidated financial statements for more information on the various risk factors that are considered to be indicative of impairment.
The table below provides an analysis of the Group’s non-performing loans.
CHF million | | 31.12.15 | 31.12.14 | 31.12.13 | 31.12.12 | 31.12.11 |
Non-performing loans: | | | | | | |
Domestic | | 1,174 | 1,293 | 1,113 | 1,121 | 1,199 |
Foreign | | 455 | 309 | 469 | 395 | 329 |
Total non-performing loans | | 1,630 | 1,602 | 1,582 | 1,516 | 1,529 |
| | | | | | |
CHF million | | 31.12.15 | 31.12.14 | 31.12.13 | 31.12.12 | 31.12.11 |
Gross interest income that would have been recorded on non-performing loans: | | | | | | |
Domestic | | 6 | 9 | 6 | 8 | 10 |
Foreign | | 7 | 6 | 4 | 3 | 9 |
Interest income included in Net profit for non-performing loans: | | | | | | |
Domestic | | 26 | 22 | 23 | 28 | 29 |
Foreign | | 5 | 7 | 7 | 6 | 6 |
UBS does not, as a matter of policy, typically restructure loans to accrue interest at rates different from the original contractual terms or reduce the principal amount of loans. Instead, specific loan allowances are established as necessary. Unrecognized interest related to restructured loans was not material to the results of operations in 2015, 2014, 2013, 2012 or 2011. p
Cross-border outstandings Cross-border outstandings consist of balances with central banks and other financial institutions, loans, reverse repurchase agreements and cash collateral on securities borrowed with counterparties domiciled outside Switzerland. Guarantees and commitments are provided separately in the table below.
The following tables list those countries for which cross-border outstandings exceeded 0.75% of total IFRS assets at 31 December 2015, 2014 and 2013. As of 31 December 2015, there were no outstandings that exceeded 0.75% of total IFRS assets in any country currently facing debt restructuring or liquidity problems that the Group expects would materially impact the country’s ability to service its obligations. Aggregate country risk exposures are monitored and reported on an ongoing basis. The internal risk view is not directly comparable to the cross-border outstandings in the table below due to different approaches to netting, differing trade populations and differing approach to allocation of exposures to countries. For more information on the country framework within risk control, refer to the “Risk management and control” section of this report.
| | 31.12.15 |
CHF million | | Banks | Private sector | Public sector | Total outstandings | % of total assets | Guarantees and Commitments¹ |
USA | | 8,633 | 90,201 | 27,807 | 126,641 | 13.4 | 42,286 |
United Kingdom | | 4,571 | 56,282 | 9,560 | 70,414 | 7.5 | 6,448 |
Japan | | 3,466 | 11,275 | 5,054 | 19,794 | 2.1 | 136 |
France | | 4,043 | 3,758 | 681 | 8,482 | 0.9 | 5,029 |
Hong Kong | | 347 | 7,692 | 121 | 8,160 | 0.9 | 79 |
| | | | | | | |
| | 31.12.14 |
CHF million | | Banks | Private sector | Public sector | Total outstandings | % of total assets | Guarantees and Commitments¹ |
USA | | 9,287 | 84,629 | 59,103 | 153,019 | 14.4 | 34,967 |
United Kingdom | | 6,288 | 47,003 | 13,928 | 67,220 | 6.3 | 7,660 |
Japan | | 1,780 | 16,906 | 5,422 | 24,107 | 2.3 | 1,771 |
France | | 3,952 | 6,006 | 67 | 10,025 | 0.9 | 5,037 |
| | | | | | | |
| | 31.12.13 |
CHF million | | Banks | Private sector | Public sector | Total outstandings | % of total assets | Guarantees and Commitments¹ |
USA | | 21,993 | 76,047 | 51,287 | 149,327 | 14.7 | 38,778 |
United Kingdom | | 10,638 | 39,528 | 8,583 | 58,749 | 5.8 | 8,494 |
Japan | | 1,019 | 17,009 | 4,765 | 22,794 | 2.2 | 289 |
France | | 4,739 | 7,478 | 56 | 12,273 | 1.2 | 6,997 |
Germany | | 3,914 | 2,664 | 1,900 | 8,478 | 0.8 | 2,062 |
1 Includes forward starting transactions (reverse repurchase agreements and securities borrowing agreements). |
Additional regulatory information
UBS Group AG consolidated supplemental disclosures required under SEC regulations
EDTF | Summary of movements in allowances and provisions for credit losses
The following table provides an analysis of movements in allowances and provisions for credit losses.
UBS writes off loans against allowances only on final settlement of bankruptcy proceedings, the sale of the underlying assets and/or in the case of debt forgiveness. Under Swiss law, a creditor can continue to collect from a debtor who has emerged from bankruptcy, unless the debt has been forgiven through a formal agreement.
CHF million | 31.12.15 | 31.12.14 | 31.12.13 | 31.12.12 | 31.12.11 |
Balance at beginning of year | 735 | 750 | 794 | 938 | 1,287 |
Domestic | | | | | |
Write-offs | | | | | |
Construction | (2) | (1) | (2) | (1) | (8) |
Electricity, gas and water supply | (1) | 0 | 0 | (6) | 0 |
Financial services | (3) | 0 | (6) | 0 | (17) |
Hotels and restaurants | 0 | 0 | 0 | (1) | 0 |
Manufacturing | (9) | (3) | (4) | (20) | (31) |
Private households | (35) | (39) | (38) | (45) | (59) |
Real estate and rentals | 0 | (1) | 0 | (2) | (3) |
Retail and wholesale | (47) | (28) | (11) | (21) | (37) |
Services | (3) | (15) | (4) | (6) | (21) |
Transport, storage and communications | (9) | (3) | (1) | (11) | (6) |
Total gross domestic write-offs | (110) | (90) | (67) | (112) | (183) |
Foreign | | | | | |
Write-offs | | | | | |
Banks | (9) | (15) | (1) | 0 | (8) |
Construction | 0 | (1) | (6) | 0 | 0 |
Electricity, gas and water supply | 0 | (1) | 0 | 0 | 0 |
Financial services | (3) | (12) | (44) | (106) | (39) |
Manufacturing | 0 | (7) | 0 | 0 | 0 |
Mining | (1) | 0 | 0 | 0 | 0 |
Private households | (12) | (6) | (6) | (15) | (72) |
Public authorities | 0 | 0 | (1) | (54) | (175) |
Real estate and rentals | 0 | (2) | (1) | 0 | (7) |
Retail and wholesale | (19) | (2) | (1) | 0 | 0 |
Services | (10) | (14) | 0 | (19) | (1) |
Transport, storage and communications | 0 | (1) | 0 | (5) | 0 |
Total gross foreign write-offs | (54) | (63) | (61) | (201) | (303) |
Total usage of provisions | 0 | (1) | 0 | 0 | (14) |
Total write-offs / usage of provisions | (164) | (154) | (128) | (313) | (501) |
Recoveries | | | | | |
Domestic | 41 | 29 | 35 | 43 | 50 |
Foreign | 7 | 0 | 10 | 21 | 1 |
Total recoveries | 48 | 29 | 45 | 63 | 51 |
Total net write-offs / usage of provisions | (116) | (124) | (83) | (250) | (450) |
Increase / (decrease) in specific allowances and provisions recognized in the income statement | 117 | 89 | 144 | 133 | 0 |
Increase / (decrease) in collective loan loss allowances recognized in the income statement | 0 | (11) | (93) | (15) | 84 |
Foreign currency translation | (11) | 21 | (9) | (8) | (1) |
Other | 2 | 11 | (3) | (3) | 18 |
Balance at end of year¹ | 727 | 735 | 750 | 794 | 938 |
1 Includes allowances for cash collateral on securities borrowed. |
▲
EDTF | Allocation of the allowances and provisions for credit losses
The following table provides an analysis of the allocation of the allowances and provisions for credit loss by industry sector and geographic location at 31 December 2015, 2014, 2013, 2012 and 2011. For a description of procedures with respect to allowances and provisions for credit losses, refer to the "Risk management and control" section of this report.
CHF million | 31.12.15 | 31.12.14 | 31.12.13 | 31.12.12 | 31.12.11 |
Domestic | | | | | |
Banks | 3 | 2 | 3 | 3 | 1 |
Chemicals | 0 | 0 | 1 | 0 | 0 |
Construction | 13 | 14 | 16 | 16 | 15 |
Electricity, gas and water supply | 2 | 1 | 1 | 0 | 9 |
Financial services | 17 | 18 | 16 | 21 | 19 |
Food and beverages | 3 | 4 | 2 | 3 | 2 |
Hotels and restaurants | 13 | 16 | 12 | 9 | 6 |
Manufacturing | 77 | 72 | 57 | 44 | 65 |
Private households | 47 | 52 | 54 | 60 | 77 |
Real estate and rentals | 13 | 18 | 9 | 10 | 14 |
Retail and wholesale | 78 | 123 | 152 | 123 | 131 |
Services | 23 | 25 | 23 | 24 | 24 |
Transport, storage and communication | 32 | 29 | 19 | 12 | 16 |
Other¹ | 0 | 0 | 0 | 1 | 1 |
Total domestic specific allowances | 321 | 374 | 365 | 326 | 379 |
Foreign | | | | | |
Banks² | 0 | 10 | 13 | 19 | 16 |
Chemicals | 0 | 0 | 0 | 1 | 8 |
Construction | 1 | 1 | 17 | 20 | 6 |
Electricity, gas and water supply | 0 | 0 | 1 | 1 | 1 |
Financial services | 90 | 35 | 37 | 37 | 96 |
Manufacturing | 13 | 9 | 18 | 23 | 23 |
Mining | 46 | 11 | 2 | 0 | 0 |
Private households | 61 | 65 | 66 | 45 | 60 |
Public authorities | 14 | 14 | 16 | 39 | 33 |
Real estate and rentals | 1 | 1 | 2 | 4 | 10 |
Retail and wholesale | 80 | 112 | 77 | 39 | 15 |
Services | 19 | 29 | 35 | 35 | 28 |
Transport, storage and communication | 40 | 43 | 19 | 27 | 39 |
Total foreign specific allowances | 365 | 330 | 303 | 290 | 335 |
Collective loan loss allowances | 6 | 8 | 20 | 114 | 131 |
Provisions for loan commitments and guarantees | 35 | 23 | 61 | 64 | 93 |
Total allowances and provisions for credit losses³ | 727 | 735 | 750 | 794 | 938 |
1 Includes mining and public authorities. 2 Counterparty allowances only. 3 Includes allowances for cash collateral on securities borrowed. |
▲
Additional regulatory information
UBS Group AG consolidated supplemental disclosures required under SEC regulations
Due from banks and loans by industry sector (gross)
The following table presents the percentage of loans in each industry sector and geographic location to total loans.
In % | 31.12.15 | 31.12.14 | 31.12.13 | 31.12.12 | 31.12.11 |
Domestic | | | | | |
Banks | 0.2 | 0.4 | 0.2 | 0.2 | 0.2 |
Chemicals | 0.1 | 0.1 | 0.1 | 0.1 | 0.1 |
Construction | 0.5 | 0.4 | 0.5 | 0.5 | 0.4 |
Electricity, gas and water supply | 0.1 | 0.1 | 0.1 | 0.1 | 0.1 |
Financial services | 1.6 | 2.0 | 1.5 | 1.4 | 1.5 |
Food and beverages | 0.1 | 0.1 | 0.1 | 0.1 | 0.1 |
Hotels and restaurants | 0.5 | 0.5 | 0.6 | 0.6 | 0.6 |
Manufacturing | 0.6 | 0.7 | 0.8 | 1.0 | 1.1 |
Private households | 38.2 | 38.0 | 41.3 | 40.8 | 41.5 |
Public authorities | 0.5 | 0.6 | 0.8 | 0.9 | 1.0 |
Real estate and rentals | 4.2 | 4.4 | 4.8 | 4.5 | 4.5 |
Retail and wholesale | 1.1 | 1.3 | 1.3 | 1.4 | 1.5 |
Services | 1.6 | 1.5 | 1.8 | 1.9 | 2.0 |
Transport, storage and communication | 0.6 | 0.6 | 0.7 | 0.6 | 0.5 |
Other¹ | 0.2 | 0.2 | 0.2 | 0.3 | 0.3 |
Total domestic | 50.1 | 50.9 | 54.8 | 54.4 | 55.5 |
Foreign | | | | | |
Banks | 3.5 | 3.7 | 4.4 | 6.9 | 7.8 |
Chemicals | 0.0 | 0.0 | 0.1 | 0.1 | 0.1 |
Construction | 0.2 | 0.2 | 0.4 | 0.6 | 0.3 |
Electricity, gas and water supply | 0.2 | 0.3 | 0.4 | 0.4 | 0.3 |
Financial services | 17.4 | 17.5 | 14.3 | 13.5 | 13.3 |
Hotels and restaurants | 0.0 | 0.0 | 0.1 | 0.1 | 0.1 |
Manufacturing | 0.6 | 0.6 | 0.6 | 0.6 | 0.7 |
Mining | 0.5 | 0.4 | 0.4 | 0.4 | 0.7 |
Private households | 19.3 | 18.3 | 16.6 | 15.4 | 14.1 |
Public authorities | 0.4 | 0.4 | 0.4 | 1.4 | 1.9 |
Real estate and rentals | 0.7 | 0.8 | 1.0 | 0.9 | 0.7 |
Retail and wholesale | 0.6 | 0.6 | 0.6 | 0.7 | 0.7 |
Services | 5.5 | 5.3 | 4.9 | 3.6 | 2.9 |
Transport, storage and communication | 0.9 | 0.9 | 0.9 | 1.0 | 0.7 |
Other² | 0.1 | 0.0 | 0.1 | 0.1 | 0.1 |
Total foreign | 49.9 | 49.1 | 45.2 | 45.6 | 44.5 |
Total gross | 100.0 | 100.0 | 100.0 | 100.0 | 100.0 |
1 Includes mining 2 Includes food and beverages |
UBS Group AG consolidated supplemental disclosures required under Basel III Pillar 3 regulations
Additional regulatory information
UBS Group AG consolidated supplemental disclosures required under Basel III Pillar 3 regulations
Introduction
This section of the report provides supplemental Bank for International Settlements (BIS) Basel III Pillar 3 disclosures for UBS Group AG on a consolidated basis. These disclosures complement other required Pillar 3 disclosures that are provided elsewhere in the Annual Report 2015 and are labelled accordingly as Pillar 3 |.
The capital adequacy framework consists of three complementary pillars. Pillar 1 provides a framework for measuring minimum capital requirements for the credit, market, operational and non-counterparty-related risks faced by banks. Pillar 2 addresses the principles of the supervisory review process, emphasizing the need for a qualitative approach to supervising banks. Pillar 3 aims to encourage market discipline by requiring banks to publish a range of disclosures, mainly on risk and capital.
This supplemental Pillar 3 disclosures section relates to UBS Group AG on a consolidated basis as Pillar 3 disclosure requirements are applicable at this level. An exception is the requirement to disclose total and tier 1 capital ratios related to the significant bank subsidiaries UBS AG, UBS Switzerland AG and UBS Limited, which are presented in the “Legal entity financial and regulatory information” section of this report. Capital information as of 31 December 2015 for UBS Group AG (consolidated) and UBS AG (consolidated) is provided in the “Capital management” section of this report.
This supplemental Pillar 3 disclosures section is based on phase-in rules under the BIS Basel III framework, as implemented by the revised Swiss Capital Adequacy Ordinance issued by the Swiss Federal Council and required by Swiss Financial Market Supervisory Authority (FINMA) regulation. Further, as UBS is considered a systemically relevant bank (SRB) under Swiss banking law, UBS Group and UBS AG are required to comply with regulations based on the Basel III framework as applicable to Swiss SRBs on a consolidated basis.
FINMA requires us to publish comprehensive quantitative and qualitative Pillar 3 disclosures annually, as well as an update of quantitative disclosures and any significant changes to qualitative information semi-annually. For the first half of 2015, our Basel III Pillar 3 disclosures were provided in the Basel III Pillar 3 report published on the UBS website.
® Refer to the “Legal entity financial and regulatory information” section of this report for more information on UBS AG, UBS Switzerland AG and UBS Limited
® Refer to the “Capital management” section of this report for more information on regulatory requirements and differences between the Swiss SRB and BIS Basel III capital regulations
® Refer to “Pillar 3, SEC filings & other disclosures” at www.ubs.com/investors for more information on G-SIBs indicators and previous Pillar 3 reports
Revised Pillar 3 disclosure requirements
In January 2015, the Basel Committee on Banking Supervision (BCBS) issued revised Pillar 3 disclosure requirements that aim to improve comparability and consistency of disclosures, through the introduction of harmonized templates. The revised requirements will take effect at the end of 2016.
Location of Pillar 3 disclosures
The following table provides an overview of Pillar 3 disclosures in this report.
Pillar 3 disclosures | Location in our UBS Group AG Annual Report 2015 | Location in this supplemental section |
Scope of consolidation and transfer restrictions | Consolidated financial statements – Note 1 Summary of significant accounting policies – Note 30 Interests in subsidiaries and other entities – Note 25 Restricted and transferred financial assets | Scope of regulatory consolidation (on page 860) Table 1: Main legal entities consolidated under IFRS but not included in the regulatory scope of consolidation |
Capital structure | Capital management (on pages
253 – 257, 260) | |
Capital adequacy | Capital management (on page 249) | |
Capital instruments | Capital management (on pages
258 – 259) “Bondholder information” at www.ubs.com/investors | |
BIS Basel III leverage ratio | Capital management (on page 275) “Pillar 3, SEC filings & other disclosures” at www.ubs.com/investors | |
Risk management objectives, policies and methodologies – qualitative disclosures | Risk management and control (on pages 165 – 233) Currency management (on page 247) Capital management (on page 250) | |
Risk-weighted assets | Capital management (on pages
263 – 266) | Overview of exposures and risk-weighted assets (on pages 861 – 863) Table 2: Detailed segmentation of exposures and risk-weighted assets |
Additional regulatory information
UBS Group AG consolidated supplemental disclosures required under Basel III Pillar 3 regulations
Location of Pillar 3 disclosures (continued )
The following table provides an overview of Pillar 3 disclosures in this report.
Pillar 3 disclosures | Location in our UBS Group AG Annual Report 2015 | Location in this supplemental section |
Credit risk | Risk management and control (on pages 177, 196 – 201) Information on – Impaired assets by region, – Impaired assets by exposure segment, and on – Changes in allowances and provisions (on pages 181 – 186) Treasury management (on page 244) Consolidated financial statements – Note 14 Derivative instruments and hedge accounting – Note 26 Offsetting financial assets and financial liabilities | Credit risk (on pages 864 – 885) Table 3: Regulatory credit risk exposure and RWA Table 4: Regulatory gross credit risk exposure by geographical region Table 5: Regulatory gross credit risk exposure by counterparty type Table 6: Regulatory gross credit risk exposure by residual contractual maturity Table 7: Credit risk mitigation for standardized and A-IRB approaches Table 8: Regulatory gross credit risk exposure covered by guarantees and credit derivatives Table 9a: Sovereigns – A-IRB approach: Regulatory net credit risk exposure, weighted average PD, LGD and RWA by internal UBS ratings Table 9b: Banks – A-IRB approach: Regulatory net credit risk exposure, weighted average PD, LGD and RWA by internal UBS ratings Table 9c: Corporates – A-IRB approach: Regulatory net credit risk exposure, weighted average PD, LGD and RWA by internal UBS ratings Table 9d: Residential mortgages – A-IRB approach: Regulatory net credit risk exposure, weighted average PD, LGD and RWA by internal UBS ratings Table 9e: Lombard lending – A-IRB approach: Regulatory net credit risk exposure, weighted average PD, LGD and RWA by internal UBS ratings Table 9f: Qualifying revolving retail exposures – A-IRB approach: Regulatory net credit risk exposures, weighted average PD, LGD and RWA by internal UBS ratings Table 9g: Other retail – A-IRB approach: Regulatory net credit risk exposure, weighted average PD, LGD and RWA by internal UBS ratings Table 10a:Regulatory gross and net credit risk exposure by risk weight under the standardized approach Table 10b: Regulatory net credit risk exposure under the standardized approach risk-weighted using external ratings Table 11: Eligible financial collateral recognized under the standardized approach Table 12: Breakdown by exposure segments Table 13: Total actual and expected credit losses Table 14: Credit risk exposure of derivative instruments Table 15: Credit derivatives Table 16: Equity instruments in the banking book |
Location of Pillar 3 disclosures (continued)
The following table provides an overview of Pillar 3 disclosures in this report.
Pillar 3 disclosures | Location in our UBS Group AG Annual Report 2015 | Location in this supplemental section |
Market risk | Risk management and control (on pages 204 – 205) Information on Group regulatory value-at-risk (on pages 207, 209 – 216) Consolidated financial statements – Note 24 Fair value measurement | |
Operational risk | Risk management and control (on pages 230 – 233) | |
Interest rate risk in the banking book | Risk management and control (on pages 217 – 221) | |
Securitization | | Securitization (on pages 887 – 900) Table 17: Securitization / re-securitization Table 18: Securitization activity for the year in the banking book Securitization activity for the year in the trading book Table 19: Outstanding securitized exposures Table 20: Impaired or past due securitized exposures and losses related to securitized exposures in the banking book Table 21: Exposures intended to be securitized in the banking and trading book Table 22: Securitization positions retained or purchased in the banking book Table 23: Securitization positions retained or purchased in the trading book Table 24a: Capital requirement for securitization / re-securitization positions retained or purchased in the banking book Table 24b: Securitization / re-securitization exposures treated under the ratings-based approach by rating clusters – banking book Table 24c: Securitization / re-securitization exposures treated under the supervisory formula approach by rating clusters – banking book Gains on sale – securitization exposures to be deducted from Basel III tier 1 capital Securitization exposures subject to early amortization in the banking and trading book Re-securitization positions retained or purchased in the banking book Table 25: Re-securitization positions retained or purchased in the trading book Outstanding notes issued by securitization vehicles related to UBS’s retained exposures subject to the market risk approach Table 26: Correlation products subject to the comprehensive risk measure or the securitization framework for specific risk Table 27a: Securitization positions and capital requirement for trading book positions subject to the securitization framework Table 27b: Securitization / re-securitization exposures treated under the ratings-based approach by rating clusters – trading book Table 27c: Securitization / re-securitization exposures treated under the supervisory formula approach by rating clusters – trading book Table 28: Capital requirement for securitization positions related to correlation products |
Additional regulatory information
UBS Group AG consolidated supplemental disclosures required under Basel III Pillar 3 regulations
Location of Pillar 3 disclosures (continued)
The following table provides an overview of Pillar 3 disclosures in this report.
Pillar 3 disclosures | Location in our UBS Group AG Annual Report 2015 | Location in this supplemental section |
Balance sheet reconciliation | | Balance sheet reconciliation (on pages 901 – 902) Table 29: Reconciliation of accounting balance sheet to balance sheet under the regulatory scope of consolidation |
Composition of capital | | Composition of capital (on pages 903 – 906) Table 30: Composition of capital |
G-SIB indicators (annual disclosure requirement only) | | G-SIB indicator (on page 907) “Pillar 3, SEC filings & other disclosures” at www.ubs.com/investors |
Remuneration (annual disclosure requirement only) | Compensation (on pages 342 – 343, 344, 348, 353, 356, 360, 364, 368 – 372, 373 – 374, 376 – 379) Corporate governance (on page 308) | |
Equity attribution and performance measurement | Measurement of performance (on page 39) Equity attribution framework (on pages 280 – 281) | |
Legal entity information | Legal entity financial and regulatory information (on pages 743 – 826) | |
Our approach to measuring risk exposure and risk-weighted assets
Measures of risk exposure may differ depending on whether the exposures are calculated for financial accounting purposes under International Financial Reporting Standards (IFRS), for deriving our regulatory capital requirement or for risk management purposes. Our Basel III Pillar 3 disclosures are generally based on measures of risk exposure used to derive the regulatory capital required to underpin those risks.
The table on the next page provides a summary of the approaches we use for the main risk categories to derive risk-weighted assets (RWA).
The naming conventions for the exposure segments used in the following tables are based on BIS rules and may differ from
those under Swiss and European Union (EU) regulations. For example, “sovereigns” under the BIS naming convention are termed “central governments and central banks” under the Swiss and EU regulations. Similarly, “banks” are “institutions” and “residential mortgages” are “claims secured by residential real estate.”
Our RWA are published according to the BIS Basel III framework, as implemented by the revised Swiss Capital Adequacy Ordinance issued by the Swiss Federal Council and required by FINMA regulation.
® Refer to the “Capital management” section of this report for more information on differences between Swiss SRB and BIS Basel III capital regulations
Category | UBS approach |
Credit risk | |
Credit risk by exposure segment | Under the advanced internal ratings-based (A-IRB) approach applied for the majority of our businesses, counterparty risk weights are determined by reference to internal counterparty ratings and loss given default estimates. We use internal models to measure the credit risk exposures to third parties on derivatives and securities financing transactions. All internal credit risk models are approved by FINMA. For a subset of our credit portfolio, we apply the standardized approach, based on external ratings. |
Securitization / re-securitization in the banking book | Securitization / re-securitization exposures in the banking book are generally assessed using the ratings-based approach, applying risk weights based on external ratings. For certain exposures, the supervisory formula-based approach is applied, considering the A-IRB risk weights. |
Equity instruments in the banking book | Simple risk weight method under the IRB approach. |
Credit valuation adjustment (CVA) | The credit valuation adjustment (CVA) is an additional capital requirement to the existing counterparty credit risk default charge. Banks are required to hold capital for the risk of mark-to-market losses (i.e., CVA) associated with the deterioration of counterparty credit quality. The model that we use is approved by FINMA. For a subset of our credit portfolio, we apply the standardized approach. |
Settlement risk | Capital requirements for failed transactions are determined according to the rules for failed trades and non-delivery-versus- payment transactions under the Basel III framework. |
Non-counterparty- related risk | The required capital for non-counterparty-related assets such as our premises, other property, equipment and software, deferred tax assets on temporary differences and defined benefit plans is calculated according to prescribed regulatory risk weights. |
Market risk | |
Value-at-risk (VaR) | The regulatory capital requirement is calculated using a variety of methods approved by FINMA. The components are value- at-risk (VaR), stressed VaR (SVaR), an add-on for risks which are potentially not fully modeled in VaR (RniV), the incremental risk charge (IRC), the comprehensive risk measure (CRM) for the correlation portfolio and the securitization framework for securitization positions in the trading book, which is described below. Details on the derivation of RWA for each of these components are provided in the “Risk management and control” section of this report. |
Stressed VaR (SVaR) |
Add-on for risks-not-in-VaR (RniV) |
Incremental risk charge (IRC) |
Comprehensive risk measure (CRM) |
Securitization / re-securitization in the trading book | Securitization / re-securitization in the trading book are assessed for their general market risk as well as for their specific risk. The capital requirement for general market risk is determined by the VaR and SVaR methods, whereas the capital requirement for specific risk is determined using the CRM method or the ratings-based approach, applying risk weights based on external ratings. |
Operational risk | Our model to quantify operational risk meets the regulatory capital standard under the advanced measurement approach and is approved by FINMA. Operational risk RWA also include the incremental operational risk RWA based on the supplemental operational risk capital analysis mutually agreed to by UBS and FINMA. |
® Refer to the “Risk management and control” section of this report for more information
Additional regulatory information
UBS Group AG consolidated supplemental disclosures required under Basel III Pillar 3 regulations
Scope of regulatory consolidation
The scope of consolidation for the purpose of calculating Group regulatory capital is generally the same as the consolidation scope under IFRS and includes subsidiaries directly or indirectly controlled by UBS Group AG that are active in the banking and finance sector. However, subsidiaries consolidated under IFRS that are active in sectors other than banking and finance are excluded from the regulatory scope of consolidation. More information on the IFRS scope of consolidation, as well as the list of significant subsidiaries included in this scope as of 31 December 2015, are available in the “Consolidated financial statements” section of this report.
® Refer to “Note 1 Summary of significant accounting policies” and “Note 30 Interests in subsidiaries and other entities” in the “Consolidated financial statements” section of this report for more information
The main differences in the basis of consolidation between IFRS and regulatory capital purposes relate to the following entities as of 31 December 2015:
– Investments in insurance, real estate and commercial companies as well as investment vehicles that were consolidated under IFRS, but not for regulatory capital purposes, and were subject to risk-weighting;
– Joint ventures which were fully consolidated for regulatory capital purposes, but which were accounted for under the equity method under IFRS;
– Entities that have issued preferred securities which were consolidated for regulatory capital purposes but not consolidated under IFRS. These entities hold bonds issued by UBS AG, which are eliminated in the consolidated regulatory capital accounts. These entities do not have material third-party asset balances, and their equity is attributable to non-controlling interests.
The table below provides a list of the most significant entities that were included in the IFRS scope of consolidation, but not in the regulatory capital scope of consolidation. As of 31 December 2015, entities consolidated under IFRS, but not included in the regulatory scope of consolidation, did not report any significant capital deficiencies.
In the banking book, certain equity investments were not required to be consolidated, neither under IFRS nor in the regulatory scope. These investments mainly consisted of infrastructure holdings and joint operations (for example, settlement and clearing institutions, stock and financial futures exchanges) and included our participation in the SIX Group. These investments were risk-weighted based on applicable threshold rules.
® Refer to “Table 16: Equity instruments in the banking book” of this section for more information on the measurement of these instruments
® Refer to “Table 29: Reconciliation of accounting balance sheet to balance sheet under the regulatory scope of consolidation” of this section for more information
® Refer to “Note 25 Restricted and transferred financial assets” in the “Consolidated financial statements” section of this report for more information on transferability restrictions under IFRS 12
Table 1: Main legal entities consolidated under IFRS but not included in the regulatory scope of consolidation
| | 31.12.15 | | | |
CHF million | | Total assets¹ | Total equity¹ | | | Purpose |
UBS Asset Management Life Ltd - Long Term Fund | | 10,032 | 16 | | | Life insurance |
UBS International Life Designated Activity Company | | 5,806 | 82 | | | Life Insurance |
A&Q Alternative Solution Limited | | 660 | 631² | | | Investment vehicle for multiple investors |
A&Q Alternative Solution Master Limited | | 647 | 640² | | | Investment vehicle for feeder funds |
UBS Life AG | | 293 | 57 | | | Life insurance |
A&Q Alpha Select Hedge Fund XL | | 275 | 139² | | | Investment vehicle for multiple investors |
A&Q Alpha Select Hedge Fund Limited | | 219 | 213² | | | Investment vehicle for multiple investors |
O'Connor Global Multi-Strategy Alpha (Levered) Limited | | 189 | 189² | | | Investment vehicle for multiple investors |
UBS Life Insurance Company USA | | 166 | 43 | | | Life Insurance |
A&Q Global Alpha Strategies XL Limited | | 145 | 73² | | | Investment vehicle for multiple investors |
Key Multi-Manager Alternative Commodities Fund Limited | | 113 | 105² | | | Offshore hedge fund |
1 Total assets and total equity on a standalone basis. 2 Represents the net asset value (NAV) of issued fund units. These fund units are subject to liability treatment in the consolidated financial statements in accordance with IFRS. |
Overview of exposures and risk-weighted assets
“Table 2: Detailed segmentation of exposures and risk-weighted assets” and subsequent tables provide a breakdown according to BIS-defined exposure segments as follows:
– Sovereigns, consisting of exposures relating to sovereign states and their central banks, the BIS, the International Monetary Fund, the EU (including the European Central Bank) and eligible multilateral development banks.
– Banks, consisting of exposures to legal entities holding a banking license. This segment also includes securities firms subject to supervisory and regulatory arrangements, including risk-based capital requirements, which are comparable to those applied to banks according to the framework. This segment also includes exposures to public sector entities with tax-raising power or entities whose liabilities are fully guaranteed by a public entity.
– Corporates, consisting of all exposures that do not fit into any of the other exposure segments. This segment includes private commercial entities such as corporations, partnerships or proprietorships, insurance companies and funds (including managed funds).
– Central counterparties (CCP) are clearing houses that interpose themselves between counterparties to contracts traded in one or more financial markets, becoming the buyer to every seller and the seller to every buyer and thereby ensuring the future performance of open contracts. A CCP becomes a counterparty to trades with market participants through novation, an open offer system, or another legally binding arrangement.
– Retail, Residential mortgages, consisting of residential mortgages, regardless of exposure size, if the debtor occupies or rents out the mortgaged property.
– Retail, Lombard lending, consisting of loans made against the pledge of eligible marketable securities or cash.
– Retail, Qualifying revolving retail exposures, consisting of unsecured revolving credits that exhibit appropriate loss characteristics relating to credit card relationships treated under the advanced internal ratings-based (A-IRB) approach.
– Retail, Other retail, consisting of exposures to small businesses, private clients and other retail customers without mortgage financing.
Table 2 also shows the gross and net exposure at default (EAD) per risk type and exposure segment, which forms the basis for the calculation of the RWA as well as the capital requirement per exposure category. The Basel III credit risk-related component “Stressed expected positive exposure (sEPE)” is newly included in “Credit risk by exposure segment” while “Credit valuation adjustment (CVA)” is still disclosed separately in this table. Comparative figures for December 2014 have been restated accordingly.
Gross EAD decreased by CHF 20 billion to CHF 724 billion in 2015, of which CHF 17 billion related to credit risk. This decrease was primarily a result of lower high-quality liquid assets held at central banks and reductions in derivative and securities financing transactions as a higher portion of these exposures with banks and corporate counterparties were treated with an internal exposure model. Further decreases resulted from asset size reductions and currency effects. These reductions were partially offset by increased gross EAD with central clearing houses following a change in treatment of these exposures.
Gross EAD related to highly-rated securities held for liquidity purposes previously treated with the standardized approach are now treated under the A-IRB/model-based approach. This resulted in a CHF 30 billion increase in exposures to sovereigns treated under the A-IRB/model-based approach and a corresponding decrease in exposures to sovereigns treated under the standardized approach.
Capital requirements presented in the following tables are calculated based on our Swiss SRB total capital requirement of 12.6% of RWA as of 31 December 2015 and 11.1% of RWA as of 31 December 2014, respectively.
® Refer to the table “Risk-weighted assets by exposure segment” in the “Capital management” section of this report for more information on RWA by business division and Corporate Center unit
® Refer to the table “Risk-weighted assets movement by key driver – fully applied” in the “Capital management” section of this report for more information on RWA movements
Additional regulatory information
UBS Group AG consolidated supplemental disclosures required under Basel III Pillar 3 regulations
EDTF | Table 2: Detailed segmentation of exposures and risk-weighted assets
| | 31.12.15 |
| | Swiss SRB (phase-in) |
| | Gross EAD | | A-IRB/model-based approach | | Standardized approach | | Total |
CHF million | | Total | | Net EAD | RWA¹ | Capital requirement | | Net EAD | RWA¹ | Capital requirement | | Net EAD | RWA¹ | Capital requirement² |
Credit risk | | 703,326 | | 571,755 | 85,210 | 10,757 | | 118,036 | 19,231 | 2,428 | | 689,792 | 104,441 | 13,184 |
Credit risk by exposure segment³ | | 697,240 | | 566,121 | 76,653 | 9,676 | | 117,604 | 17,147 | 2,165 | | 683,725 | 93,800 | 11,841 |
Sovereigns | | 162,229 | | 138,754 | 2,710 | 342 | | 23,475 | 317 | 40 | | 162,229 | 3,027 | 382 |
Banks | | 50,210 | | 44,217 | 7,934 | 1,002 | | 4,561 | 1,115 | 141 | | 48,778 | 9,050 | 1,142 |
Corporates | | 159,570 | | 137,438 | 41,768 | 5,273 | | 10,048 | 7,051 | 890 | | 147,486 | 48,819 | 6,163 |
Central counterparties | | 69,193 | | | | | | 69,193 | 2,846 | 359 | | 69,193 | 2,846 | 359 |
Retail | | 256,039 | | 245,712 | 24,241 | 3,060 | | 10,327 | 5,817 | 734 | | 256,039 | 30,058 | 3,794 |
Residential mortgages | | 136,696 | | 130,408 | 17,617 | 2,224 | | 6,288 | 2,360 | 298 | | 136,696 | 19,977 | 2,522 |
Lombard lending | | 113,131 | | 113,131 | 5,743 | 725 | | | | | | 113,131 | 5,743 | 725 |
Qualifying revolving retail exposures | | 1,504 | | 1,504 | 526 | 66 | | | | | | 1,504 | 526 | 66 |
Other retail | | 4,708 | | 669 | 355 | 45 | | 4,038 | 3,457 | 436 | | 4,708 | 3,812 | 481 |
Securitization/re-securitization in the banking book | | 4,207 | | 4,207 | 707 | 89 | | | | | | 4,207 | 707 | 89 |
Equity instruments in the banking book⁴ | | 1,272 | | 1,272 | 4,072 | 514 | | | | | | 1,272 | 4,072 | 514 |
Credit valuation adjustment (CVA) | | | | | 3,557 | 449 | | | 1,798 | 227 | | | 5,355 | 676 |
Settlement risk | | 607 | | 155 | 221 | 28 | | 432 | 286 | 36 | | 587 | 508 | 64 |
Non-counterparty-related risk | | 19,652 | | | | | | 19,652 | 20,743 | 2,619 | | 19,652 | 20,743 | 2,619 |
Deferred tax assets | | 9,634 | | | | | | 9,634 | 12,901 | 1,629 | | 9,634 | 12,901 | 1,629 |
Property, equipment and software | | 7,612 | | | | | | 7,612 | 7,612 | 961 | | 7,612 | 7,612 | 961 |
Other | | 2,406 | | | | | | 2,406 | 230 | 29 | | 2,406 | 230 | 29 |
Market risk | | 1,263 | | 1,263 | 12,063 | 1,523 | | | | | | 1,263 | 12,063 | 1,523 |
Value-at-risk (VaR) | | | | | 1,528 | 193 | | | | | | | 1,528 | 193 |
Stressed value-at-risk (SVaR) | | | | | 2,835 | 358 | | | | | | | 2,835 | 358 |
Add-on for risks-not-in-VaR (RNiV) | | | | | 4,212 | 532 | | | | | | | 4,212 | 532 |
Incremental risk charge (IRC) | | | | | 2,732 | 345 | | | | | | | 2,732 | 345 |
Comprehensive risk measure (CRM) | | | | | 84 | 11 | | | | | | | 84 | 11 |
Securitization/re-securitization in the trading book⁵ | | 1,263 | | 1,263 | 672 | 85 | | | | | | 1,263 | 672 | 85 |
Operational risk | | | | | 75,055 | 9,475 | | | | | | | 75,055 | 9,475 |
of which: incremental RWA⁶ | | | | | 13,327 | 1,682 | | | | | | | 13,327 | 1,682 |
Total Swiss SRB | | 724,241 | | 573,018 | 172,328 | 21,754 | | 137,688 | 39,974 | 5,046 | | 710,706 | 212,302 | 26,800 |
1 Refer to the “Capital management” section of this report for more information on the differences between phase-in and fully applied RWA. 2 Calculated based on our Swiss SRB total capital requirement of 12.6% of RWA. 3 Includes sEPE, most of which relates to exposures to Banks and Corporates. 4 Simple risk weight method applied. 5 The EAD of securitization positions equals the fair value of the net long and net short securitization positions retained or purchased in the trading book. 6 Incremental RWA reflect the effect of the supplemental operational risk capital analysis mutually agreed by UBS and FINMA. |
Table 2: Detailed segmentation of exposures and risk-weighted assets (continued)
| | 31.12.14 |
| | Swiss SRB (phase-in) |
| | Gross EAD | | A-IRB/model-based approach | | Standardized approach | | Total |
CHF million | | Total | | Net EAD | RWA¹ | Capital requirement | | Net EAD | RWA¹ | Capital requirement | | Net EAD | RWA¹ | Capital requirement² |
Credit risk | | 720,039 | | 553,788 | 86,282 | 9,594 | | 144,021 | 22,318 | 2,482 | | 697,810 | 108,601 | 12,075 |
Credit risk by exposure segment³ | | 709,293 | | 543,230 | 72,406 | 8,051 | | 143,841 | 18,694 | 2,079 | | 687,072 | 91,099 | 10,129 |
Sovereigns | | 166,261 | | 108,939 | 1,319 | 147 | | 57,321 | 189 | 21 | | 166,261 | 1,508 | 168 |
Banks | | 59,302 | | 48,628 | 8,070 | 897 | | 7,916 | 2,360 | 262 | | 56,544 | 10,430 | 1,160 |
Corporates | | 172,605 | | 145,399 | 41,126 | 4,573 | | 15,899 | 10,650 | 1,184 | | 161,298 | 51,775 | 5,757 |
Central counterparties | | 54,291 | | | | | | 54,291 | 1,478 | 164 | | 54,291 | 1,478 | 164 |
Retail | | 256,834 | | 240,263 | 21,892 | 2,434 | | 8,414 | 4,017 | 447 | | 248,678 | 25,909 | 2,881 |
Residential mortgages | | 137,159 | | 131,121 | 15,767 | 1,753 | | 6,038 | 2,234 | 248 | | 137,159 | 18,002 | 2,002 |
Lombard lending | | 115,192 | | 107,036 | 5,359 | 596 | | | | | | 107,036 | 5,359 | 596 |
Qualifying revolving retail exposures | | 1,524 | | 1,524 | 532 | 59 | | | | | | 1,524 | 532 | 59 |
Other retail | | 2,959 | | 582 | 233 | 26 | | 2,376 | 1,783 | 198 | | 2,959 | 2,016 | 224 |
Securitization/re-securitization in the banking book | | 9,048 | | 9,048 | 2,650 | 295 | | | | | | 9,048 | 2,650 | 295 |
Equity instruments in the banking book⁴ | | 1,448 | | 1,448 | 4,735 | 526 | | | | | | 1,448 | 4,735 | 526 |
Credit valuation adjustment (CVA) | | | | | 6,395 | 711 | | | 3,381 | 376 | | | 9,775 | 1,087 |
Settlement risk | | 250 | | 62 | 96 | 11 | | 180 | 244 | 27 | | 242 | 340 | 38 |
Non-counterparty-related risk | | 22,126 | | | | | | 22,126 | 19,060 | 2,119 | | 22,126 | 19,060 | 2,119 |
Deferred tax assets | | 10,010 | | | | | | 10,010 | 8,897 | 989 | | 10,010 | 8,897 | 989 |
Property, equipment and software | | 6,760 | | | | | | 6,760 | 6,760 | 752 | | 6,760 | 6,760 | 752 |
Other⁵ | | 5,356 | | | | | | 5,356 | 3,404 | 378 | | 5,356 | 3,404 | 378 |
Market risk | 1,610 | | 1,610 | 16,483 | 1,833 | | | | | | 1,610 | 16,483 | 1,833 |
Value-at-risk (VaR) | | | | | 2,024 | 225 | | | | | | | 2,024 | 225 |
Stressed value-at-risk (SVaR) | | | | | 4,115 | 458 | | | | | | | 4,115 | 458 |
Add-on for risks-not-in-VaR (RNiV) | | | | | 5,911 | 657 | | | | | | | 5,911 | 657 |
Incremental risk charge (IRC) | | | | | 3,039 | 338 | | | | | | | 3,039 | 338 |
Comprehensive risk measure (CRM) | | | | | 131 | 15 | | | | | | | 131 | 15 |
Securitization/re-securitization in the trading book⁶ | | 1,610 | | 1,610 | 1,262 | 140 | | | | | | 1,610 | 1,262 | 140 |
Operational risk | | | | | 76,734 | 8,532 | | | | | | | 76,734 | 8,532 |
of which: incremental RWA⁷ | | | | | 17,451 | 1,940 | | | | | | | 17,451 | 1,940 |
Total Swiss SRB | | 743,774 | | 555,398 | 179,498 | 19,958 | | 166,147 | 41,379 | 4,601 | | 721,545 | 220,877 | 24,559 |
1 Refer to the “Capital management” section of this report for more information on the differences between phase-in and fully applied RWA. 2 Calculated based on our Swiss SRB total capital requirement of 11.1% of RWA. 3 Includes sEPE, most of which relates to exposures to Banks and Corporates. 4 Simple risk weight method applied. 5 Primarily relates to defined benefit plans. 6 The EAD of securitization positions equals the fair value of the net long and net short securitization positions retained or purchased in the trading book. 7 Incremental RWA reflect the effect of the supplemental operational risk capital analysis mutually agreed by UBS and FINMA. |
▲
Additional regulatory information
UBS Group AG consolidated supplemental disclosures required under Basel III Pillar 3 regulations
Credit risk
The tables in this section provide details on the exposures used to determine the firm’s credit risk-related regulatory capital requirement. The parameters applied under the A-IRB approach are generally based on the same methodologies, data and systems we use for internal credit risk quantification, except where certain treatments are specified by regulatory requirements. These include, for example, the application of regulatory prescribed floors and multipliers, and differences with respect to eligibility criteria and exposure definitions. The exposure information presented in this section therefore differs from our internal management view disclosed in the “Risk management and control” sections of our quarterly and annual reports. Similarly, the regulatory capital prescribed measure of credit risk exposure also differs from that required under IFRS. The following credit risk-related tables are based on Swiss SRB phase-in requirements and correspond to the credit risk by exposure segment which is shown in “Table 2: Detailed segmentation of exposures and risk-weighted assets”. Stressed expected positive exposure (sEPE) is newly included in credit risk by exposure segment and comparative figures for December 2014 have been restated accordingly in the following tables.
® Refer to the “Risk management and control” section of this report for more information
The regulatory gross credit exposure for banking products is equal to the drawn loan amounts represented on the balance sheet, with the exception of off-balance sheet commitments where the regulatory gross credit exposure is calculated by applying a credit conversion factor to the undrawn amount or contingent claim.
Within traded products, we determine the regulatory credit exposure on the majority of our derivatives portfolio by applying the effective EPE and sEPE as defined in the Basel III framework. However, for the rest of the portfolio we apply the current exposure method (CEM) based on the replacement value of derivatives in combination with a regulatory prescribed add-on. For the majority of securities financing transactions (securities borrowing / lending and repurchase agreements / reverse repurchase agreements), we determine the regulatory gross credit exposure using the close-out period (COP) approach. The regulatory gross credit exposure for traded products is equal to regulatory net credit exposure in the credit risk tables on the following pages.
The regulatory net credit risk exposure detailed in the tables on the following pages is shown as the regulatory exposure at default after applying collateral, netting and other eligible risk mitigants permitted by the relevant regulations. The information on impaired and defaulted assets, consistent with the regulatory capital treatment, is presented in the “Impairment, default and credit loss” section of this report.
EDTF | Table 3: Regulatory credit risk exposure and RWA
This table shows the derivation of RWA from the regulatory gross credit risk exposure including sEPE broken down by major types of regulatory gross credit risk exposure according to classes of financial instruments.
| | Exposure | | Average regulatory risk weighting¹ | | RWA² |
CHF million | | Average regulatory gross credit risk exposure³ | Regulatory gross credit risk exposure | Less: regulatory credit risk offsets and adjustments | Regulatory net credit risk exposure | | | | |
Cash and balances with central banks | | 84,113 | 89,776 | | 89,776 | | 1% | | 779 |
Due from banks⁴ | | 11,564 | 9,902 | | 9,902 | | 20% | | 2,009 |
Loans | | 311,190 | 310,138 | (11,808) | 298,329 | | 16% | | 46,476 |
Financial assets designated at fair value | | 3,191 | 3,962 | (540) | 3,422 | | 23% | | 774 |
Guarantees, commitments and forward starting transactions | | 33,764 | 32,788 | (402) | 32,386 | | 36% | | 11,726 |
Banking products | | 443,823 | 446,565 | (12,750) | 433,815 | | 14% | | 61,764 |
Derivatives | | 78,202 | 73,473 | | 73,473 | | 21% | | 15,294 |
Cash collateral on derivative instruments | | 44,585 | 44,925 | | 44,925 | | 3% | | 1,535 |
Securities financing | | 57,468 | 54,995 | | 54,995 | | 9% | | 4,712 |
Traded products | | 180,254 | 173,394 | | 173,394 | | 12% | | 21,542 |
Trading portfolio assets | | 3,417 | 6,034 | | 6,034 | | 15% | | 892 |
Financial investments available-for-sale | | 64,222 | 60,842 | | 60,842 | | 4% | | 2,168 |
Other assets | | 11,103 | 10,406 | (765) | 9,641 | | 77% | | 7,433 |
Other products | | 78,742 | 77,281 | (765) | 76,517 | | 14% | | 10,493 |
Total 31.12.15 | | 702,820 | 697,240 | (13,515) | 683,725 | | 14% | | 93,800 |
Total 31.12.14 | | 671,762 | 709,293 | (22,221) | 687,072 | | 13% | | 91,099 |
1 Calculated as a ratio of regulatory net credit risk exposure to the corresponding RWA. 2 The derivation of RWA is based on the various credit risk parameters of the A-IRB approach and the standardized approach, respectively. 3 The average regulatory gross credit exposure represents the average of the applicable quarter-end exposures for the relevant reporting periods. 4 Includes non-bank financial institutions. |
▲
EDTF | Table 4: Regulatory gross credit risk exposure by geographical region
This table provides a breakdown of our portfolio including sEPE broken down by major types of regulatory gross credit risk exposure according to classes of financial instruments by geographical regions. The geographical distribution is based on the legal domicile of the counterparty or issuer.
CHF million | Asia Pacific | Latin America | Middle East and Africa | North America | Switzerland | Rest of Europe | Total regulatory gross credit risk exposure | Total regulatory net credit risk exposure |
Cash and balances with central banks | 5,921 | | | 25,480 | 46,596 | 11,778 | 89,776 | 89,776 |
Due from banks¹ | 2,317 | 35 | 191 | 2,942 | 763 | 3,655 | 9,902 | 9,902 |
Loans | 22,624 | 6,112 | 4,551 | 80,098 | 161,885 | 34,867 | 310,138 | 298,329 |
Financial assets designated at fair value | 1,016 | 4 | | 1,724 | 389 | 829 | 3,962 | 3,422 |
Guarantees, commitments and forward starting transactions | 908 | 300 | 421 | 18,551 | 7,081 | 5,526 | 32,788 | 32,386 |
Banking products | 32,786 | 6,451 | 5,163 | 128,795 | 216,715 | 56,655 | 446,565 | 433,815 |
Derivatives | 7,304 | 632 | 580 | 24,994 | 6,756 | 33,207 | 73,473 | 73,473 |
Cash collateral on derivative instruments | 4,888 | 35 | 38 | 17,436 | 164 | 22,363 | 44,925 | 44,925 |
Securities financing | 4,836 | 206 | 1,478 | 24,899 | 2,282 | 21,295 | 54,995 | 54,995 |
Traded products | 17,029 | 872 | 2,096 | 67,329 | 9,202 | 76,865 | 173,394 | 173,394 |
Trading portfolio assets | 85 | 7 | 21 | 2,869 | 11 | 3,042 | 6,034 | 6,034 |
Financial investments available-for-sale | 1,735 | 46 | | 28,781 | 2,163 | 28,117 | 60,842 | 60,842 |
Other assets | 508 | 41 | 14 | 6,094 | 702 | 3,047 | 10,406 | 9,641 |
Other products | 2,328 | 94 | 34 | 37,744 | 2,875 | 34,206 | 77,281 | 76,517 |
Total 31.12.15 | 52,142 | 7,418 | 7,293 | 233,868 | 228,793 | 167,727 | 697,240 | 683,725 |
Total 31.12.14 | 55,198 | 8,658 | 7,632 | 261,607 | 211,551 | 164,646 | 709,293 | 687,072 |
1 Includes non-bank financial institutions. |
▲
Additional regulatory information
UBS Group AG consolidated supplemental disclosures required under Basel III Pillar 3 regulations
EDTF | Table 5: Regulatory gross credit risk exposure by counterparty type
This table provides a breakdown of our portfolio including sEPE broken down by major types of regulatory gross credit risk exposure according to classes of financial instruments by counterparty type. The counterparty type is different from the BIS-defined exposure segments used in certain other tables in this section.
CHF million | Private individuals | Corporates¹ | Public entities (including sovereigns and central banks) | Banks and multilateral institutions | Total regulatory gross credit risk exposure | Total regulatory net credit risk exposure |
Cash and balances with central banks | | | 89,267 | 508 | 89,776 | 89,776 |
Due from banks¹ | | | 1,032 | 8,870 | 9,902 | 9,902 |
Loans | 197,507 | 109,758 | 2,873 | | 310,138 | 298,329 |
Financial assets designated at fair value | 496 | 3,020 | 4 | 443 | 3,962 | 3,422 |
Guarantees, commitments and forward starting transactions | 2,574 | 28,744 | 33 | 1,437 | 32,788 | 32,386 |
Banking products | 200,577 | 141,522 | 93,209 | 11,257 | 446,565 | 433,815 |
Derivatives | 1,936 | 45,108 | 5,076 | 21,353 | 73,473 | 73,473 |
Cash collateral on derivative financial instruments | 24 | 42,424 | 677 | 1,800 | 44,925 | 44,925 |
Securities financing | 28 | 39,088 | 4,918 | 10,962 | 54,995 | 54,995 |
Traded products | 1,988 | 126,619 | 10,671 | 34,115 | 173,394 | 173,394 |
Trading portfolio assets | | 951 | 4,945 | 138 | 6,034 | 6,034 |
Financial investments available-for-sale | | 9,898 | 34,342 | 16,602 | 60,842 | 60,842 |
Other assets | 4,419 | 3,488 | 1,596 | 903 | 10,406 | 9,641 |
Other products | 4,419 | 14,337 | 40,882 | 17,643 | 77,281 | 76,517 |
Total 31.12.15 | 206,984 | 282,478 | 144,763 | 63,015 | 697,240 | 683,725 |
Total 31.12.14 | 205,470 | 283,300 | 153,477 | 67,046 | 709,293 | 687,072 |
1 Includes non-bank financial institutions. |
▲
EDTF | Table 6: Regulatory gross credit risk exposure by residual contractual maturity
This table provides a breakdown of our portfolio including sEPE by major types of regulatory gross credit risk exposure according to classes of financial instruments by residual contractual maturity, not taking into account any early redemption features.
CHF million | On demand¹ | Due in 1 year or less | Due between 1 year and 5 years | Due over 5 years | Total regulatory gross credit risk exposure | Total regulatory net credit risk exposure |
Cash and balances with central banks | 89,776 | | | | 89,776 | 89,776 |
Due from banks² | 7,885 | 1,966 | 26 | 24 | 9,902 | 9,902 |
Loans | 41,476 | 147,231 | 72,673 | 48,757 | 310,138 | 298,329 |
Financial assets designated at fair value | | 1,207 | 2,408 | 348 | 3,962 | 3,422 |
Guarantees, commitments and forward starting transactions | | 8,321 | 21,374 | 3,093 | 32,788 | 32,386 |
Banking products | 139,137 | 158,725 | 96,481 | 52,222 | 446,565 | 433,815 |
Derivatives | | 45,319 | 15,790 | 12,364 | 73,473 | 73,473 |
Cash collateral on derivative instruments | 12,486 | 8,711 | 9,925 | 13,803 | 44,925 | 44,925 |
Securities financing | 42,258 | 11,403 | 1,334 | | 54,995 | 54,995 |
Traded products | 54,744 | 65,434 | 27,049 | 26,167 | 173,394 | 173,394 |
Trading portfolio assets | | 295 | 572 | 5,167 | 6,034 | 6,034 |
Financial investments available-for-sale | | 31,303 | 25,790 | 3,750 | 60,842 | 60,842 |
Other assets | 5,583 | 56 | 2,899 | 1,868 | 10,406 | 9,641 |
Other products | 5,583 | 31,654 | 29,260 | 10,784 | 77,281 | 76,517 |
Total 31.12.15 | 199,464 | 255,812 | 152,790 | 89,173 | 697,240 | 683,725 |
Total 31.12.14 | 239,564 | 250,598 | 141,195 | 77,935 | 709,293 | 687,072 |
1 Includes loans without a fixed term, cash collateral on derivative instruments and securities financing transactions, on which notice of termination has not been given. 2 Includes non-bank financial institutions. |
▲
Table 7: Credit risk mitigation for standardized and A-IRB approaches
This table provides a derivation of the regulatory net credit risk exposure from the regulatory gross credit risk exposure including sEPE after the application of credit risk mitigation according to the A-IRB and the standardized approach.
CHF million | Advanced IRB approach | Standardized approach | Total 31.12.15 | Total 31.12.14 |
Total regulatory gross credit risk exposure | 573,246 | 123,994 | 697,240 | 709,293 |
Less: regulatory credit risk offsets and adjustments | (7,125) | (6,391) | (13,515) | (22,221) |
Total regulatory net credit risk exposure | 566,121 | 117,604 | 683,725 | |
Total 31.12.14 | 543,230 | 143,841 | | 687,072 |
® Refer to “Table 2: Detailed segmentation of exposures and risk-weighted assets” for more information on the regulatory net credit exposure by exposure segment
Table 8: Regulatory gross credit risk exposure covered by guarantees and credit derivatives
This table provides a breakdown of regulatory gross credit risk exposure including sEPE covered by guarantees and credit derivatives according to BIS-defined exposure segments. The amounts in the table reflect the values used for determining regulatory capital to the extent collateral is eligible under the BIS framework.
CHF million | Regulatory gross credit risk exposure | of which: covered by guarantees¹ | of which: covered by credit derivatives |
Exposure segment | | | |
Sovereigns | 162,229 | 105 | 43 |
Banks | 50,210 | 234 | |
Corporates | 159,570 | 3,212 | 7,263 |
Central counterparties | 69,193 | | |
Retail | | | |
Residential mortgages | 136,696 | 1 | |
Lombard lending | 113,131 | 1,360 | |
Qualifying revolving retail exposures | 1,504 | 56 | |
Other retail | 4,708 | 1 | |
Total 31.12.15 | 697,240 | 4,969 | 7,306 |
Total 31.12.14 | 709,293 | 4,507 | 9,392 |
1 Includes guarantees and standby letters of credit provided by third parties, the majority of which are banks. |
Advanced internal ratings-based approach
UBS uses the advanced internal ratings-based (A-IRB) approach for calculating certain credit risk exposures. Under the A-IRB approach, the required capital for credit risk is quantified through empirical models that we have developed to estimate the probability of default (PD), loss given default (LGD), exposure at default (EAD) and other parameters, subject to FINMA approval.
® Refer to the “Risk management and control” section of this report for more information
Tables 9a to 9g provide a breakdown of the regulatory net credit risk exposure, weighted average PD, LGD, RWA and the average risk weight under the A-IRB approach by internal UBS ratings across BIS-defined exposure segments. In line with the numbers presented in table 2, impaired and defaulted assets and sEPE are now included in tables 9a through 9g. Comparative figures for December 2014 have been restated accordingly.
Additional regulatory information
UBS Group AG consolidated supplemental disclosures required under Basel III Pillar 3 regulations
EDTF | Table 9a: Sovereigns – Advanced IRB approach: Regulatory net credit risk exposure, weighted average PD, LGD and RWA by internal UBS ratings
| 31.12.15 |
CHF million, except where indicated | Regulatory net credit risk exposure | of which: loan commitments | Average PD in %¹ | Average LGD in % | RWA | Average risk weight in % |
Investment grade |
Rating 0 | 65,602 | 1 | 0.0 | 34.0 | 0 | 0.0 |
Rating 1 | 65,207 | 87 | 0.0 | 32.9 | 1,627 | 2.5 |
Rating 2 | 3,937 | | 0.0 | 36.7 | 335 | 8.5 |
Rating 3 | 3,365 | | 0.1 | 46.8 | 443 | 13.2 |
Rating 4 | 117 | | 0.2 | 66.0 | 49 | 42.3 |
Rating 5 | 434 | | 0.4 | 42.0 | 179 | 41.3 |
Sub-investment grade |
Rating 6 | 29 | | 0.6 | 36.1 | 14 | 48.7 |
Rating 7 | 15 | 0 | 1.0 | 41.6 | 12 | 79.2 |
Rating 8 | 10 | 1 | 1.7 | 28.5 | 9 | 90.5 |
Rating 9 | 13 | 0 | 2.7 | 25.9 | 10 | 79.6 |
Rating 10 | 3 | | 4.6 | 39.8 | 3 | 118.4 |
Rating 11 | 8 | | 7.8 | 40.4 | 13 | 153.8 |
Rating 12 | 3 | | 13.0 | 10.0 | 2 | 55.2 |
Rating 13 | 0 | | 22.0 | 10.0 | 0 | 60.2 |
Impaired and defaulted² | 12 | 1 | | | 13 | 106.0 |
Total 31.12.15 | 138,754 | 89 | 0.0² | 33.9² | 2,710 | 2.0 |
1 Average PD for internal rating categories is based on midpoint values. 2 Total weighted average PD and LGD exclude impaired and defaulted financial instruments. Refer to the “Risk management and control” section of this report for information on impaired and defaulted financial instruments. |
| | | | | | |
| 31.12.14 |
CHF million, except where indicated | Regulatory net credit risk exposure | of which: loan commitments | Average PD in %¹ | Average LGD in % | RWA | Average risk weight in % |
Investment grade |
Rating 0 | 95,107 | 1 | 0.0 | 33.1 | 29 | 0.0 |
Rating 1 | 6,888 | 79 | 0.0 | 32.9 | 243 | 3.5 |
Rating 2 | 2,277 | 4 | 0.0 | 44.2 | 223 | 9.8 |
Rating 3 | 4,142 | | 0.1 | 51.6 | 584 | 14.1 |
Rating 4 | 185 | | 0.2 | 58.9 | 67 | 36.4 |
Rating 5 | 286 | | 0.4 | 42.4 | 126 | 44.0 |
Sub-investment grade |
Rating 6 | 8 | | 0.6 | 10.2 | 2 | 21.0 |
Rating 7 | 9 | 0 | 1.0 | 42.6 | 6 | 63.0 |
Rating 8 | 1 | | 1.7 | 85.8 | 1 | 175.7 |
Rating 9 | 7 | 0 | 2.7 | 12.6 | 3 | 42.3 |
Rating 10 | 3 | | 4.6 | 39.8 | 4 | 121.8 |
Rating 11 | 1 | 0 | 7.8 | 16.1 | 0 | 66.4 |
Rating 12 | 9 | | 13.0 | 30.7 | 13 | 154.3 |
Rating 13 | 0 | | 22.0 | 10.0 | 0 | 54.5 |
Impaired and defaulted² | 17 | 1 | | | 18 | 106.0 |
Total 31.12.14 | 108,939 | 84 | 0.0² | 34.1² | 1,319 | 1.2 |
1 Average PD for internal rating categories is based on midpoint values. 2 Total weighted average PD and LGD exclude impaired and defaulted financial instruments. Refer to the “Risk management and control” section of our Annual Report 2014 for information on impaired and defaulted financial instruments. |
Table 9b: Banks – Advanced IRB approach: Regulatory net credit risk exposure, weighted average PD, LGD and RWA by internal UBS ratings
| 31.12.15 |
CHF million, except where indicated | Regulatory net credit risk exposure | of which: loan commitments | Average PD in %¹ | Average LGD in % | RWA | Average risk weight in % |
Investment grade |
Rating 0 | | | | | | |
Rating 1 | | | | | | |
Rating 2 | 22,392 | 3,335 | 0.0 | 32.9 | 2,168 | 9.7 |
Rating 3 | 13,699 | 2,025 | 0.1 | 34.6 | 2,301 | 16.8 |
Rating 4 | 4,449 | 101 | 0.2 | 39.2 | 1,443 | 32.4 |
Rating 5 | 1,899 | 3 | 0.4 | 43.5 | 881 | 46.4 |
Sub-investment grade |
Rating 6 | 1,241 | 4 | 0.6 | 40.1 | 698 | 56.2 |
Rating 7 | 331 | | 1.0 | 46.4 | 202 | 61.2 |
Rating 8 | 85 | 0 | 1.7 | 34.2 | 73 | 85.8 |
Rating 9 | 63 | | 2.7 | 38.9 | 74 | 117.4 |
Rating 10 | 18 | 2 | 4.6 | 44.2 | 26 | 146.8 |
Rating 11 | 28 | | 7.8 | 44.5 | 50 | 179.2 |
Rating 12 | 3 | 1 | 13.0 | 42.0 | 8 | 227.6 |
Rating 13 | 1 | | 22.0 | 23.1 | 1 | 132.8 |
Impaired and defaulted² | 9 | | | | 10 | 106.0 |
Total 31.12.15 | 44,217 | 5,471 | 0.1² | 34.8² | 7,934 | 17.9 |
1 Average PD for internal rating categories is based on midpoint values. 2 Total weighted average PD and LGD exclude impaired and defaulted financial instruments. Refer to the “Risk management and control” section of this report for information on impaired and defaulted financial instruments. |
| | | | | | |
| 31.12.14 |
CHF million, except where indicated | Regulatory net credit risk exposure | of which: loan commitments | Average PD in %¹ | Average LGD in % | RWA | Average risk weight in % |
Investment grade | | | | | | |
Rating 0 | | | | | | |
Rating 1 | | | | | | |
Rating 2 | 29,231 | 5,550 | 0.0 | 35.9 | 2,859 | 9.8 |
Rating 3 | 12,022 | 1,567 | 0.1 | 35.6 | 2,028 | 16.9 |
Rating 4 | 3,644 | 106 | 0.2 | 39.3 | 1,135 | 31.1 |
Rating 5 | 2,197 | 6 | 0.4 | 44.9 | 940 | 42.8 |
Sub-investment grade | | | | | | |
Rating 6 | 779 | 7 | 0.6 | 43.0 | 484 | 62.1 |
Rating 7 | 425 | | 1.0 | 43.9 | 253 | 59.5 |
Rating 8 | 80 | | 1.7 | 30.6 | 58 | 72.6 |
Rating 9 | 141 | | 2.7 | 36.2 | 149 | 105.5 |
Rating 10 | 45 | | 4.6 | 35.5 | 53 | 116.8 |
Rating 11 | 31 | | 7.8 | 43.0 | 56 | 179.5 |
Rating 12 | 11 | 1 | 13.0 | 43.3 | 25 | 225.5 |
Rating 13 | 5 | | 22.0 | 43.6 | 12 | 259.1 |
Impaired and defaulted² | 17 | | | | 18 | 106.0 |
Total 31.12.14 | 48,628 | 7,236 | 0.1² | 36.7² | 8,070 | 16.6 |
1 Average PD for internal rating categories is based on midpoint values. 2 Total weighted average PD and LGD exclude impaired and defaulted financial instruments. Refer to the “Risk management and control” section of our Annual Report 2014 for information on impaired and defaulted financial instruments. |
Additional regulatory information
UBS Group AG consolidated supplemental disclosures required under Basel III Pillar 3 regulations
Table 9c: Corporates – Advanced IRB approach: Regulatory net credit risk exposure, weighted average PD, LGD and RWA by internal UBS ratings
| 31.12.15 |
CHF million, except where indicated | Regulatory net credit risk exposure | of which: loan commitments | Average PD in %¹ | Average LGD in % | RWA | Average risk weight in % |
Investment grade | | | | | | |
Rating 0 | | | | | | |
Rating 1 | | | | | | |
Rating 2 | 48,252 | 3,673 | 0.0 | 20.1 | 3,482 | 7.2 |
Rating 3 | 14,745 | 3,960 | 0.1 | 35.1 | 3,111 | 21.1 |
Rating 4 | 15,857 | 3,245 | 0.2 | 37.3 | 5,636 | 35.5 |
Rating 5 | 12,199 | 1,868 | 0.4 | 37.6 | 6,177 | 50.6 |
Sub-investment grade | | | | | | |
Rating 6 | 11,794 | 752 | 0.6 | 25.1 | 5,187 | 44.0 |
Rating 7 | 12,888 | 512 | 1.0 | 20.1 | 5,757 | 44.7 |
Rating 8 | 9,830 | 766 | 1.7 | 15.6 | 3,777 | 38.4 |
Rating 9 | 5,579 | 395 | 2.7 | 18.7 | 3,044 | 54.6 |
Rating 10 | 3,060 | 1,153 | 4.6 | 24.6 | 2,804 | 91.6 |
Rating 11 | 1,228 | 464 | 7.8 | 16.4 | 879 | 71.6 |
Rating 12 | 532 | 213 | 13.0 | 13.2 | 369 | 69.4 |
Rating 13 | 114 | 40 | 22.0 | 17.4 | 103 | 90.2 |
Impaired and defaulted² | 1,359 | 19 | | | 1,441 | 106.0 |
Total 31.12.15 | 137,438³ | 17,058 | 0.7² | 25.4² | 41,768⁴ | 30.4 |
1 Average PD for internal rating categories is based on midpoint values. 2 Total weighted average PD and LGD exclude impaired and defaulted financial instruments. Refer to the “Risk management and control” section of this report for infrormation on impaired and defaulted financial instruments. 3 Includes CHF 38,954 million relating to exposures with managed funds. Typically these funds have virtually no debt, are very low risk, and therefore have a very low A-IRB risk weight. 4 Includes high volatility commercial real estate (HVCRE) exposures. These exposures relate to specialized lending that is secured by properties sharing higher volatilities in portfolio default rates (RWA: CHF 98 million as of 31 December 2015). |
| | | | | | |
| 31.12.14 |
CHF million, except where indicated | Regulatory net credit risk exposure | of which: loan commitments | Average PD in %¹ | Average LGD in % | RWA | Average risk weight in % |
Investment grade |
Rating 0 | | | | | | |
Rating 1 | | | | | | |
Rating 2 | 53,700 | 2,568 | 0.0 | 19.2 | 3,744 | 7.0 |
Rating 3 | 20,974 | 5,431 | 0.1 | 36.8 | 4,108 | 19.6 |
Rating 4 | 11,427 | 1,354 | 0.2 | 37.9 | 3,728 | 32.6 |
Rating 5 | 12,071 | 992 | 0.4 | 36.4 | 5,417 | 44.9 |
Sub-investment grade | | | | | | |
Rating 6 | 13,741 | 708 | 0.6 | 26.9 | 6,114 | 44.5 |
Rating 7 | 12,287 | 500 | 1.0 | 22.8 | 5,424 | 44.1 |
Rating 8 | 8,250 | 611 | 1.7 | 18.5 | 3,492 | 42.3 |
Rating 9 | 5,579 | 586 | 2.7 | 20.8 | 3,038 | 54.4 |
Rating 10 | 3,994 | 1,575 | 4.6 | 21.1 | 3,028 | 75.8 |
Rating 11 | 1,416 | 452 | 7.8 | 17.5 | 1,068 | 75.4 |
Rating 12 | 300 | 82 | 13.0 | 14.6 | 186 | 62.1 |
Rating 13 | 108 | 21 | 22.0 | 23.1 | 135 | 124.3 |
Impaired and defaulted² | 1,552 | 4 | | | 1,645 | 106.0 |
Total 31.12.14 | 145,399³ | 14,884 | 0.7² | 25.8² | 41,126⁴ | 28.3 |
1 Average PD for internal rating categories is based on midpoint values. 2 Total weighted average PD and LGD exclude impaired and defaulted financial instruments. Refer to the “Risk management and control” section of our Annual Report 2014 for information on impaired and defaulted financial instruments. 3 Includes CHF 45,653 million relating to exposures with managed funds. Typically these funds have virtually no debt, are very low risk, and therefore have a very low A-IRB risk weight. 4 Includes high volatility commercial real estate (HVCRE) exposures. These exposures relate to specialized lending that is secured by properties sharing higher volatilities in portfolio default rates (RWA: CHF 159 million as of 31 December 2014). |
Table 9d: Residential mortgages – Advanced IRB approach: Regulatory net credit risk exposure, weighted average PD, LGD and RWA by internal UBS ratings
| 31.12.15 |
CHF million, except where indicated | Regulatory net credit risk exposure | of which: loan commitments | Average PD in %¹ | Average LGD in % | RWA | Average risk weight in % |
Investment grade |
Rating 0 | | | | | | |
Rating 1 | | | | | | |
Rating 2 | 38,012 | 191 | 0.0 | 10.6 | 688 | 1.8 |
Rating 3 | 16,511 | 60 | 0.1 | 11.0 | 622 | 3.8 |
Rating 4 | 17,272 | 51 | 0.2 | 11.2 | 1,163 | 6.7 |
Rating 5 | 15,144 | 60 | 0.4 | 11.4 | 1,637 | 10.8 |
Sub-investment grade |
Rating 6 | 11,461 | 49 | 0.6 | 12.3 | 1,801 | 15.7 |
Rating 7 | 11,601 | 281 | 1.0 | 12.0 | 2,544 | 21.9 |
Rating 8 | 8,617 | 47 | 1.7 | 12.0 | 2,643 | 30.7 |
Rating 9 | 5,740 | 24 | 2.7 | 11.3 | 2,380 | 41.5 |
Rating 10 | 3,221 | 16 | 4.6 | 10.9 | 1,778 | 55.2 |
Rating 11 | 1,455 | 4 | 7.8 | 10.7 | 1,028 | 70.6 |
Rating 12 | 618 | 11 | 13.0 | 11.2 | 546 | 88.4 |
Rating 13 | 208 | 2 | 22.0 | 10.9 | 206 | 99.1 |
Impaired and defaulted² | 548 | | | | 581 | 106.0 |
Total 31.12.15 | 130,408 | 796 | 0.8² | 11.2² | 17,617 | 13.5 |
1 Average PD for internal rating categories is based on midpoint values. 2 Total weighted average PD and LGD exclude impaired and defaulted financial instruments. Refer to the “Risk management and control” section of this report for information on impaired and defaulted financial instruments. |
| | | | | | |
| 31.12.14 |
CHF million, except where indicated | Regulatory net credit risk exposure | of which: loan commitments | Average PD in %¹ | Average LGD in % | RWA | Average risk weight in % |
Investment grade | | | | | | |
Rating 0 | | | | | | |
Rating 1 | | | | | | |
Rating 2 | 37,281 | 156 | 0.0 | 10.6 | 579 | 1.6 |
Rating 3 | 16,673 | 45 | 0.1 | 11.0 | 540 | 3.2 |
Rating 4 | 17,109 | 48 | 0.2 | 11.2 | 995 | 5.8 |
Rating 5 | 15,197 | 47 | 0.4 | 11.4 | 1,433 | 9.4 |
Sub-investment grade | | | | | | |
Rating 6 | 11,824 | 60 | 0.6 | 12.4 | 1,658 | 14.0 |
Rating 7 | 12,011 | 236 | 1.0 | 12.0 | 2,331 | 19.4 |
Rating 8 | 9,318 | 57 | 1.7 | 12.1 | 2,517 | 27.0 |
Rating 9 | 5,829 | 34 | 2.7 | 11.3 | 2,132 | 36.6 |
Rating 10 | 3,144 | 9 | 4.6 | 11.0 | 1,525 | 48.5 |
Rating 11 | 1,452 | 13 | 7.8 | 10.8 | 909 | 62.6 |
Rating 12 | 581 | 4 | 13.0 | 10.8 | 443 | 76.3 |
Rating 13 | 224 | 5 | 22.0 | 11.0 | 199 | 89.1 |
Impaired and defaulted² | 477 | | | | 506 | 106.0 |
Total 31.12.14 | 131,121 | 714 | 0.8² | 11.3² | 15,767 | 12.0 |
1 Average PD for internal rating categories is based on midpoint values. 2 Total weighted average PD and LGD exclude impaired and defaulted financial instruments. Refer to the “Risk management and control” section of our Annual Report 2014 for information on impaired and defaulted financial instruments. |
Additional regulatory information
UBS Group AG consolidated supplemental disclosures required under Basel III Pillar 3 regulations
Table 9e: Lombard lending – Advanced IRB approach: Regulatory net credit risk exposure, weighted average PD, LGD and RWA by internal UBS ratings
| 31.12.15 |
CHF million, except where indicated | Regulatory net credit risk exposure | of which: loan commitments | Average PD in %¹ | Average LGD in % | RWA | Average risk weight in % |
Investment grade |
Rating 0 | | | | | | |
Rating 1 | | | | | | |
Rating 2 | 61,107 | 146 | 0.0 | 20.0 | 1,610 | 2.6 |
Rating 3 | 36,902 | 63 | 0.1 | 20.0 | 1,650 | 4.5 |
Rating 4 | 2,632 | 1 | 0.2 | 20.0 | 203 | 7.7 |
Rating 5 | 7,010 | 4 | 0.4 | 20.0 | 872 | 12.4 |
Sub-investment grade |
Rating 6 | 2,226 | 1 | 0.6 | 20.0 | 365 | 16.4 |
Rating 7 | 1,433 | 8 | 1.0 | 20.0 | 390 | 27.2 |
Rating 8 | 604 | 15 | 1.7 | 20.0 | 180 | 29.8 |
Rating 9 | 95 | | 2.7 | 20.0 | 28 | 29.1 |
Rating 10 | 578 | 10 | 4.6 | 20.0 | 212 | 36.6 |
Rating 11 | 537 | 0 | 7.8 | 20.0 | 228 | 42.4 |
Rating 12 | | | | | | |
Rating 13 | | | | | | |
Impaired and defaulted² | 6 | | | | 7 | 106 |
Total 31.12.15 | 113,131 | 248 | 0.2² | 20.0² | 5,743 | 5.1 |
1 Average PD for internal rating categories is based on midpoint values. 2 Total weighted average PD and LGD exclude impaired and defaulted financial instruments. Refer to the “Risk management and control” section of this report for information on impaired and defaulted financial instruments. |
| | | | | | |
| 31.12.14 |
CHF million, except where indicated | Regulatory net credit risk exposure | of which: loan commitments | Average PD in %¹ | Average LGD in % | RWA | Average risk weight in % |
Investment grade |
Rating 0 | | | | | | |
Rating 1 | | | | | | |
Rating 2 | 56,020 | 199 | 0.0 | 20.0 | 1,473 | 2.6 |
Rating 3 | 35,336 | 102 | 0.1 | 20.0 | 1,577 | 4.5 |
Rating 4 | 3,257 | 6 | 0.2 | 20.0 | 250 | 7.7 |
Rating 5 | 6,651 | 32 | 0.4 | 20.0 | 807 | 12.1 |
Sub-investment grade |
Rating 6 | 3,007 | 2 | 0.6 | 20.0 | 520 | 17.3 |
Rating 7 | 1,463 | 1 | 1.0 | 20.0 | 315 | 21.6 |
Rating 8 | 358 | 11 | 1.7 | 20.0 | 111 | 31.0 |
Rating 9 | 38 | | 2.7 | 20.0 | 11 | 29.1 |
Rating 10 | 503 | 28 | 4.6 | 20.0 | 156 | 31.0 |
Rating 11 | 398 | 11 | 7.8 | 20.0 | 132 | 33.3 |
Rating 12 | | | | | | |
Rating 13 | | | | | | |
Impaired and defaulted² | 6 | | | | 6 | 106 |
Total 31.12.14 | 107,036 | 393 | 0.2² | 20.0² | 5,359 | 5.0 |
1 Average PD for internal rating categories is based on midpoint values. 2 Total weighted average PD and LGD exclude impaired and defaulted financial instruments. Refer to the “Risk management and control” section of our Annual Report 2014 for information on impaired and defaulted financial instruments. |
Table 9f: Qualifying revolving retail exposures – Advanced IRB approach: Regulatory net credit risk exposure, weighted average PD, LGD and RWA by internal UBS ratings
| 31.12.15 |
CHF million, except where indicated | Regulatory net credit risk exposure | of which: loan commitments | Average PD in %¹ | Average LGD in % | RWA | Average risk weight in % |
Investment grade | | | | | | |
Rating 0 | | | | | | |
Rating 1 | | | | | | |
Rating 2 | | | | | | |
Rating 3 | | | | | | |
Rating 4 | | | | | | |
Rating 5 | | | | | | |
Sub-investment grade | | | | | | |
Rating 6 | | | | | | |
Rating 7 | | | | | | |
Rating 8 | 117 | | 1.7 | 47.0 | 33 | 28.0 |
Rating 9 | 1,380 | | 2.7 | 42.0 | 485 | 35.2 |
Rating 10 | | | | | | |
Rating 11 | | | | | | |
Rating 12 | | | | | | |
Rating 13 | | | | | | |
Impaired and defaulted² | 7 | | | | 8 | 106.0 |
Total 31.12.15 | 1,504 | | 2.6² | 42.4² | 526 | 34.9 |
1 Average PD for internal rating categories is based on midpoint values. 2 Total weighted average PD and LGD exclude impaired and defaulted financial instruments. Refer to the “Risk management and control” section of this report for information on impaired and defaulted financial instruments. |
| | | | | | |
| 31.12.14 |
CHF million, except where indicated | Regulatory net credit risk exposure | of which: loan commitments | Average PD in %¹ | Average LGD in % | RWA | Average risk weight in % |
Investment grade | | | | | | |
Rating 0 | | | | | | |
Rating 1 | | | | | | |
Rating 2 | | | | | | |
Rating 3 | | | | | | |
Rating 4 | | | | | | |
Rating 5 | | | | | | |
Sub-investment grade | | | | | | |
Rating 6 | | | | | | |
Rating 7 | | | | | | |
Rating 8 | 124 | | 1.7 | 47.0 | 35 | 28.0 |
Rating 9 | 1,394 | | 2.7 | 42.0 | 490 | 35.2 |
Rating 10 | | | | | | |
Rating 11 | | | | | | |
Rating 12 | | | | | | |
Rating 13 | | | | | | |
Impaired and defaulted² | 7 | | | | 7 | 106.0 |
Total 31.12.14 | 1,524 | | 2.6² | 42.4² | 532 | 34.9 |
1 Average PD for internal rating categories is based on midpoint values. 2 Total weighted average PD and LGD exclude impaired and defaulted financial instruments. Refer to the “Risk management and control” section of our Annual Report 2014 for information on impaired and defaulted financial instruments. |
Additional regulatory information
UBS Group AG consolidated supplemental disclosures required under Basel III Pillar 3 regulations
Table 9g: Other retail – Advanced IRB approach: Regulatory net credit risk exposure, weighted average PD, LGD and RWA by internal UBS ratings
| 31.12.15 |
CHF million, except where indicated | Regulatory net credit risk exposure | of which: loan commitments | Average PD in %¹ | Average LGD in % | RWA | Average risk weight in % |
Investment grade | | | | | | |
Rating 0 | | | | | | |
Rating 1 | | | | | | |
Rating 2 | 133 | 0 | 0.0 | 18.0 | 5 | 3.6 |
Rating 3 | 21 | | 0.1 | 16.6 | 1 | 3.9 |
Rating 4 | 8 | 0 | 0.2 | 10.5 | 0 | 4.5 |
Rating 5 | 11 | | 0.4 | 10.0 | 1 | 6.6 |
Sub-investment grade | | | | | | |
Rating 6 | 7 | | 0.6 | 15.6 | 1 | 14.2 |
Rating 7 | 263 | | 1.0 | 41.4 | 162 | 61.4 |
Rating 8 | 4 | | 1.7 | 14.1 | 1 | 17.6 |
Rating 9 | 203 | 2 | 2.7 | 58.5 | 172 | 84.6 |
Rating 10 | 7 | | 4.6 | 23.7 | 3 | 37.2 |
Rating 11 | 3 | | 7.8 | 20.4 | 1 | 33.8 |
Rating 12 | 0 | | 13.0 | 63.2 | 0 | 112.8 |
Rating 13 | | | | | | |
Impaired and defaulted² | 8 | | | | 9 | 106.0 |
Total 31.12.15 | 669 | 3 | 1.4² | 39.6² | 355 | 53.0 |
1 Average PD for internal rating categories is based on midpoint values. 2 Total weighted average PD and LGD exclude impaired and defaulted financial instruments. Refer to the “Risk management and control” section of this report for information on impaired and defaulted financial instruments. |
| | | | | | |
| 31.12.14 |
CHF million, except where indicated | Regulatory net credit risk exposure | of which: loan commitments | Average PD in %¹ | Average LGD in % | RWA | Average risk weight in % |
Investment grade | | | | | | |
Rating 0 | | | | | | |
Rating 1 | | | | | | |
Rating 2 | 146 | | 0.0 | 18.0 | 7 | 4.8 |
Rating 3 | 63 | | 0.1 | 18.4 | 3 | 4.3 |
Rating 4 | 7 | | 0.2 | 12.4 | 0 | 5.1 |
Rating 5 | 10 | | 0.4 | 11.3 | 1 | 7.3 |
Sub-investment grade | | | | | | |
Rating 6 | 2 | | 0.6 | 14.1 | 0 | 12.9 |
Rating 7 | 107 | | 1.0 | 32.8 | 38 | 35.7 |
Rating 8 | 3 | | 1.7 | 22.7 | 1 | 28.1 |
Rating 9 | 217 | 1 | 2.7 | 51.8 | 163 | 75.0 |
Rating 10 | 8 | | 4.6 | 26.4 | 3 | 42.0 |
Rating 11 | 10 | | 7.8 | 49.7 | 8 | 81.1 |
Rating 12 | 0 | | 13.0 | 16.5 | 0 | 30.2 |
Rating 13 | | | | | | |
Impaired and defaulted² | 8 | | | | 9 | 106.0 |
Total 31.12.14 | 582 | 1 | 1.5² | 34.1² | 233 | 40.1 |
1 Average PD for internal rating categories is based on midpoint values. 2 Total weighted average PD and LGD exclude impaired and defaulted financial instruments. Refer to the “Risk management and control” section of our Annual Report 2014 for information on impaired and defaulted financial instruments. |
▲
Standardized approach
The standardized approach is generally applied where it is not possible to use the A-IRB approach. The standardized approach requires banks to use, where possible, risk assessments prepared by external credit assessment institutions (ECAI) or export credit agencies to determine the risk weightings applied to rated counterparties. We use FINMA-recognized ECAI risk assessments to determine the risk weight for certain counterparties according to the BIS- defined exposure segments.
We use three FINMA-recognized ECAI for this purpose: Standard & Poor’s, Moody’s Investors Service and Fitch Ratings. The mapping of external ratings to the standardized approach risk weights is determined by FINMA and published on its website.
EDTF | Table 10a: Regulatory gross and net credit risk exposure by risk weight under the standardized approach
This table provides a breakdown of the regulatory gross and net credit risk exposure by risk weight according to BIS-defined exposure segments for those credit exposures for which we apply the standardized approach.
CHF million | | Total exposure | | Total exposure |
Risk weight | | 0% | >0–20% | 21–50% | 51–100% | over 100% | | 31.12.15 | 31.12.14 |
| | | | | | | | | |
Regulatory gross credit risk exposure | | | | | | | | | |
Sovereigns | | 22,842 | 148 | 398 | 85 | 2 | | 23,475 | 57,321 |
Banks | | | 3,933 | 620 | 22 | | | 4,575 | 8,044 |
Corporates | | | 3,133 | 998 | 12,280 | 13 | | 16,425 | 21,065 |
Central counterparties | | 26,331¹ | 41,913 | | 578 | 371 | | 69,193 | 54,291 |
Retail | | | | | | | | | |
Residential mortgages | | | | 5,993 | 295 | | | 6,288 | 6,038 |
Lombard lending | | | | | | | | | |
Qualifying revolving retail exposures | | | | | | | | | |
Other retail | | | | | 4,038 | | | 4,038 | 2,377 |
Total 31.12.15 | | 49,173 | 49,127 | 8,010 | 17,299 | 386 | | 123,994 | |
Total 31.12.14 | | 86,387 | 35,861 | 9,823 | 16,823 | 243 | | | 149,136 |
| | | | | | | | | |
Regulatory net credit risk exposure | | | | | | | | | |
Sovereigns | | 22,842 | 148 | 398 | 85 | 2 | | 23,475 | 57,321 |
Banks | | | 3,919 | 620 | 22 | | | 4,561 | 7,916 |
Corporates | | | 3,133 | 990 | 5,911 | 13 | | 10,048 | 15,899 |
Central counterparties | | 26,331¹ | 41,913 | | 578 | 371 | | 69,193 | 54,291 |
Retail | | | | | | | | | |
Residential mortgages | | | | 5,993 | 295 | | | 6,288 | 6,038 |
Lombard lending | | | | | | | | | |
Qualifying revolving retail exposures | | | | | | | | | |
Other retail | | | | | 4,038 | | | 4,038 | 2,376 |
Total 31.12.15 | | 49,173 | 49,114 | 8,002 | 10,930 | 386 | | 117,604 | |
Total 31.12.14 | | 86,387 | 35,859 | 9,705 | 11,662 | 228 | | | 143,841 |
1 A risk weight of 0% is applied for trades that we have entered into with central counterparties on behalf of a client and where the client has signed a legally enforceable agreement reflecting that the default risk of that central counterparty is carried by the client. |
▲
Additional regulatory information
UBS Group AG consolidated supplemental disclosures required under Basel III Pillar 3 regulations
Table 10b: Regulatory net credit risk exposure under the standardized approach risk-weighted using external ratings
This table provides a breakdown of the rated and unrated regulatory net credit risk exposure by ECAI and by risk weight according to BIS-defined exposure segments for those credit exposures for which we apply the standardized approach.
CHF million | | | | Total exposure¹ | | Total exposure¹ |
Risk weight | | | | 0% | >0–20% | 21–50% | 51–100% | over 100% | | 31.12.15 | 31.12.14 |
| | | | | | | | | | | |
Regulatory net credit risk exposure² | | | | | | | | | | | |
Sovereigns | | Rated³ | | 22,517 | 148 | 398 | 28 | 2 | | 23,093 | 57,249 |
| | Unrated | | 325 | | | 57 | | | 382 | 72 |
Banks | | Rated³ | | | 1,237 | 232 | 22 | | | 1,491 | 3,720 |
| | Unrated | | | 2,683 | 388 | | | | 3,071 | 4,196 |
Corporates | | Rated³ | | | 3,133 | 990 | 39 | 9 | | 4,172 | 7,038 |
| | Unrated | | | | | 5,872 | 4 | | 5,876 | 8,861 |
Total 31.12.15 | | | | 22,842 | 7,201 | 2,008 | 6,019 | 15 | | 38,084 | |
Total 31.12.14 | | | | 56,931 | 11,330 | 3,905 | 8,952 | 19 | | | 81,136 |
1 As external ratings are not used in the calculation of RWA for retail exposures and exposures to central counterparties, these exposures are not reflected in the above table. For more information on the risk weights applied for these exposures, please refer to "Table 10a: Regulatory gross and net credit risk exposure by risk weight under the standardized approach". 2 For a breakdown of securitization exposures by risk weight bands and rating clusters refer to tables 24a to 24c (banking book) and 27a to 27c (trading book) of this report. 3 We use three FINMA-recognized ECAI to determine the risk weight for certain counterparties: Standard & Poor’s, Moody’s Investors Service and Fitch Ratings. |
Table 11: Eligible financial collateral recognized under the standardized approach
This table provides a breakdown of the financial collateral eligible for recognition in the regulatory capital calculation under the standardized approach, according to BIS-defined exposure segments.
CHF million | | Regulatory net credit risk exposure under standardized approach | | Eligible financial collateral recognized in capital calculation¹ |
| | 31.12.15 | 31.12.14 | | 31.12.15 | 31.12.14 |
Exposure segment | | | | | | |
Sovereigns | | 23,475 | 57,321 | | | 3 |
Banks | | 4,561 | 7,916 | | 442 | 1,662 |
Corporates | | 10,048 | 15,899 | | 7,762 | 6,604 |
Central counterparties | | 69,193 | 54,291 | | 30,961 | 9,465 |
Retail | | | | | | |
Residential mortgages | | 6,288 | 6,038 | | | |
Lombard lending | | | | | | |
Qualifying revolving retail exposures | | | | | | |
Other retail | | 4,038 | 2,376 | | | 19 |
Total | | 117,604 | 143,841 | | 39,165 | 17,752 |
1 Eligible financial collateral recognized in the capital calculation is based on the difference between the regulatory gross credit risk exposure and the regulatory net credit risk exposure for exposures not covered under internal exposure models. |
Comparison of A-IRB approach and Standardized Approach (SA)
In accordance with current prudential regulations, FINMA has approved our use of the Advanced IRB (A-IRB) approach for calculating the required capital for a majority of our credit risk exposures.
In light of a number of Basel Committee on Banking Supervision (BCBS) consultations on material changes to current Standardized Approach (SA) rules, and potential implementation of capital floors based on the revised SA, we have outlined below the principal differences between the current SA rules and the A-IRB approach.
UBS is actively participating in the Quantitative Impact Studies, whereby the BCBS collects data from banks for the design of the revised SA rules. Given the uncertainty regarding the final rules and the calibration of any floors, the discussion of the differences provided below is based on the current SA rules. There can be no assurance that the differences described will be indicative of the differences under the revised rules.
We continue to believe that advanced approaches that adequately capture economic risks are paramount for the appropriate representation of the capital requirements related to risk-taking activities. Within a strong risk control framework and in combination with robust stress testing practices, strict risk limits, as well as leverage and liquidity requirements, advanced approaches promote a proactive risk culture, ensuring the right incentives are in place to prudently manage risks.
Key methodological differences between A-IRB and current SA approaches
In line with the BCBS objective, the A-IRB approach seeks to balance the maintenance of prudent levels of capital while encouraging, where appropriate, the use of advanced risk management techniques. By design, the calibration of the current SA rules and the A-IRB approaches is such that low-risk, short-maturity, well-collateralized portfolios across the various asset classes (with the exception of Sovereigns) receive lower risk weights under the A-IRB than under the current SA rules. Accordingly, risk weighted assets (RWA) and capital requirements under the current SA rules would be substantially higher than under the A-IRB approach for lower risk portfolios. Conversely, RWA for higher risk portfolios are higher under the A-IRB than under the current SA approach.
Differences primarily arise due to the measurement of Exposure at Default (EAD) and to the risk weights applied. In both cases, the treatment of risk mitigation such as collateral can have a significant impact.
EAD measurement:
For the measurement of EAD, the main differences relate to derivatives, driven by the differences between the Internal Model Method (IMM) and the regulatory prescribed Current Exposure Method (CEM).
The model-based approaches to derive estimates of EAD for derivatives and securities financing transactions reflect the detailed characteristics of individual transactions. They model the range of possible exposure outcomes across all transactions within the same legally enforceable netting set at various future time points. This assesses the net amount that may be owed to us, or that we may owe to others, taking into account the impact of correlated market moves over the potential time it could take to close out a position. The calculation considers current market conditions, and is therefore sensitive to deteriorations in the market environment.
In contrast, EAD under the regulatory prescribed rules are calculated as replacement costs at the balance sheet date plus regulatory add-ons, which take into account potential future market movements, but, at predetermined fixed rates, which are not sensitive to changes in market conditions. These add-ons are crudely differentiated by reference to only five product types and three maturity buckets. Further, the current regulatory prescribed rules calculation gives very limited recognition to the benefits of diversification across transactions within the same legally enforceable netting set. As a result, large diversified portfolios, such as those arising from our activities with other market making banks, will generate much higher EAD under the current regulatory prescribed rules than under the model-based approach.
Risk Weights:
Under the A-IRB approach, risk weights are assigned according to the bank's internal credit assessment of the counterparty to determine the Probability of Default (PD) and Loss Given Default (LGD).
The PD is an estimate of the likelihood of a counterparty defaulting on its contractual obligations. It is assessed using rating tools tailored to the various categories of counterparties. Statistically developed scorecards, based on key attributes of the obligor, are used to determine PD for many of our corporate clients and for loans secured by real estate. Where available, market data may also be used to derive the PD for large corporate counterparties. For Lombard loans, Merton-type model simulations are used that take into account potential changes in the value of securities collateral. PD is not only an integral part of the credit risk measurement, but also an important input for determining the level of credit approval required for any given transaction. Moreover, for the purpose of capital underpinning, the majority of counterparty PDs are subject to a floor.
The LGD is an estimate of the magnitude of the likely loss if there is a default. The calculation takes into account the loss of principal, interest and other amounts such as workout costs, including the cost of carrying an impaired position during the workout process less recovered amounts. Importantly, LGD considers credit mitigation by way of collateral or guarantees, with the estimates being supported by our internal historical loss data and external information where available.
Additional regulatory information
UBS Group AG consolidated supplemental disclosures required under Basel III Pillar 3 regulations
The combination of PD and LGD determined at the counterparty level results in a highly granular level of differentiation of the economic risk from different borrowers and transactions.
In contrast, the SA risk weights are largely reliant on external rating agencies' assessments of the credit quality of the counterparty, with a 100% risk weight typically being applied where no external rating is available. Even where external ratings are available, there is only a coarse granularity of risk weights, with only four primary risk weights used for differentiating counterparties, with the addition of a 0% risk weight for AA- or better rated sovereigns. In addition, weights of 35% and 75% are used for mortgages and retail exposures.
In addition, the SA does not differentiate across transaction maturities except for interbank lending, albeit in a very simplistic manner considering only shorter or longer than three-months. This has clear limitations. For example, the economic risk of a six-month loan to, say, a BB rated US corporate, is significantly different to that of a 10-year loan to the same borrower. This difference is evident from the distinction of probability of default levels based on ratings assigned by external rating agencies through their separate ratings for short-term and long-term debt for a given issuer.
The SA typically assigns lower risk weights to sub-investment grade counterparties than the A-IRB approach, thereby potentially understating the economic risk. Conversely, investment grade counterparties typically receive higher risk weights under the SA than under the A-IRB approach.
Maturity also plays an important factor, with the A-IRB approach producing a higher capital requirement for longer maturity exposures than for shorter maturity exposures. Since the accelerated implementation of our strategy, the maturity effect has become particularly important as we had a notable shift from longer-term to shorter-term transactions in our credit portfolio.
Additionally, under the A-IRB approach we calculate expected loss measures that are deducted from CET1 capital to the extent that they exceed general provisions, which is not the case under the SA.
Given the divergence between the SA and the economic risk, which is better represented under the A-IRB approach, particularly for lower grade counterparties, there is a risk that applying the SA could incentivize higher risk taking without a commensurate increase in capital required.
Comparison of the A-IRB approach EAD and Leverage Ratio Denominator by exposure segment
The following table shows EAD, average risk-weight (RW), risk-weighted assets (RWA) and Leverage Ratio Denominator (LRD) per Basel III Exposure Segment for Sovereigns, Banks, Corporates and Retail credit risk exposures subject to the A-IRB approach, consistent with our Pillar 3 disclosures. LRD is the exposure measure used for the Leverage Ratio.
LRD estimates presented in the table reflect the credit risk-related component of exposures only and are therefore not representative of the LRD requirement at bank level overall. The LRD estimates exclude exposures subject to market risk, non-counterparty related risk and SA credit risk, to provide a like-for-like comparison with the A-IRB credit risk EAD shown.
Table 12: Breakdown by exposure segments |
| A-IRB | | LRD |
in CHF billion | EAD | RW | RWA | | |
Sovereigns | 139 | 2% | 3 | | 138 |
Banks | 44 | 18% | 8 | | 71 |
Corporates | 137 | 30% | 42 | | 205 |
Retail | 246 | 10% | 24 | | 246 |
o/w Residential mortgages | 130 | 14% | 18 | | 130 |
o/w Lombard Lending | 113 | 5% | 6 | | 114 |
Comparison of the A-IRB approach, the SA and LRD by exposure segment
The following discusses the differences between the A-IRB approach, the SA and LRD per exposure segment.
Exposure Segment Sovereigns:
The regulatory net EAD for Sovereigns is CHF 139 billion under the A-IRB approach. Since the vast majority of our exposure to Sovereigns is driven by banking products exposures, the LRD is broadly in line with the A-IRB net EAD and we would expect a similar amount under the SA.
The chart below provides a comparison of risk weights for Sovereigns exposures calculated under the A-IRB approach and the SA. Risk weights under the A-IRB approach are shown for 1-year and 5-year maturities, both assuming an LGD of 45% (the default LGD assigned for senior unsecured exposures under the Foundation IRB approach). Our internal A-IRB ratings have been mapped to external ratings based on the long-term average of one-year default rates available from the major credit rating agencies, as described on page 200 of our Annual Report 2014.

The SA assigns a zero risk weight to Sovereigns counterparties rated AA- and better, while the A-IRB approach generally assigns risk weights higher than zero even for the highest quality sovereign counterparties.
Despite this, we would expect an increase in average risk weight under the SA due to exposures to unrated counterparties such as sovereign wealth funds, which attract a 100% risk weight under the SA despite being generally considered very low risk, and short-term repo transactions with central banks rated below AA-, such as the Bank of Japan.
However, as the Sovereigns exposure segment is not a significant driver of RWA, we would expect any resulting increase in RWA to be relatively small.
Exposure Segment Banks:
The regulatory net EAD for Banks is CHF 44 billion under the A-IRB approach. The A-IRB net EAD is lower compared to the LRD as a result of collateral mitigation on derivatives and securities financing transactions. We would expect the net EAD to increase significantly under the regulatory prescribed rules related to derivatives and securities financing transactions within the Investment Bank, due to the aforementioned methodological differences between the calculation of EAD under the two approaches.
The chart below provides a comparison of risk weights for SA.

As can be seen from Table 9b of our Pillar 3 disclosures, the vast majority of our Banks exposure is of investment grade quality. The average contractual maturity of this exposure is closer to the 1-year example provided. Therefore, we would expect a higher average risk weight under the SA than the 18% average risk weight under the A-IRB approach. In combination with higher EAD, we would expect this to lead to significantly higher RWA for Banks under the SA.
Exposure Segment Corporates:
The regulatory net EAD for Corporates is CHF 137 billion under the A-IRB approach. The A-IRB net EAD is lower compared to the LRD as a result of collateral mitigation on derivatives and securities financing transactions. We would expect the EAD figure to be higher under the regulatory prescribed rules related to derivatives, which typically account for one third of the EAD for this exposure segment, due to the aforementioned methodological differences between the calculation of EAD under the two approaches.
The following chart provides a comparison of risk weights for Corporates exposures calculated under the A-IRB approach and the SA. These exposures primarily arise from corporate lending and derivatives trading within the Investment Bank, and lending to large corporates and small- and medium-sized enterprises within Switzerland.
Additional regulatory information
UBS Group AG consolidated supplemental disclosures required under Basel III Pillar 3 regulations
Investment grade counterparties typically receive higher risk weights under the SA than under the A-IRB approach. The majority of our Corporates exposures fall into this category, as can be seen from the distribution of Corporates regulatory net EAD provided in table 9c. We would therefore expect risk weights for Corporates to be generally higher under the SA.
In addition, SA risk weights are reliant on external ratings, with a default weighting of 100% applied where no external rating is available. Typically, counterparties with no external rating are riskier and thus also have higher risk weights under the A-IRB approach. However, managed funds, which comprise nearly one third of our Corporates EAD, typically have no debt and are therefore unrated. The SA applies a 100% risk weight to exposures to these funds. Under A-IRB, these funds are considered very low risk and have an average risk weight of 5%. We believe the SA significantly overstates the risk.
Conversely, for certain exposures, we consider the risk weight of 100% under the SA resulting from the absence of an external rating as insufficient, as evident from the hypothetical leveraged finance counterparty example in the table below.

Exposure Segment Retail
Sub-segment residential mortgages:
The regulatory net EAD for residential mortgages is CHF 130 billion under the A-IRB approach. Since the vast majority is driven by banking products exposures, the LRD is broadly in line with the A-IRB net EAD and we would expect a similar amount under the SA.
With our leading personal and corporate banking business in Switzerland, our domestic portfolios represent a significant portion of our overall lending exposures, with the largest being loans secured by residential properties.
Our internal models take a sophisticated approach in assigning risk weights to such loans by considering the debt service capacity of borrowers as well as the availability of other collateralizing assets. These are important considerations for the Swiss market, where there is legal recourse to the borrower.
In contrast, and different to the assignment of risk weights for exposure segments above, the SA only crudely differentiates the risk weights based on loan-to-value (LTV) ranges as shown in the table below.
The vast majority of our exposures would attract the 35% risk weight under the SA, compared to the 14% observed under the A-IRB approach.
The difference is largely due to the current SA rules not giving benefit to the portion of exposures with LTV lower than 67%. The vast majority of exposures fall within this category, as shown in the “Swiss mortgages: distribution of net exposure at default (EAD) across exposure segments and loan-to-value (LTV) buckets” table in the “Risk management and control” section of this report.
The following example illustrates the importance of considering the quality of the portfolio at a more granular level than the SA allows. The majority of the CHF 130 billion Residential mortgages EAD shown relates to loans secured by real estate in Switzerland. If the value assigned to the real estate collateral underlying those Swiss mortgage loans were to reduce by 30% and costs of closing out impaired loans would be 20% of the current property value, we estimate that the default rates would need to be higher than 10% to lose an amount equivalent to the current capital requirement of CHF 2.2 billion related to that portfolio (calculated based on our Swiss SRB Basel III total capital ratio requirement of 12.6% of RWA, including the countercyclical buffer). Moreover, FINMA requires banks using the A-IRB approach to apply bank-specific A-IRB multipliers when calculating RWA for Swiss mortgages. As the multiplier is phased in through 2019, the default rate required to generate a loss exceeding the capital requirement will increase substantially.
Sub-segment Lombard Lending:
Lombard loans, with CHF 113 billion of regulatory net EAD under the A-IRB approach, mainly arise in our wealth management businesses, which offer comprehensive financial services to private clients with substantial financial resources.
Eligible collateral is more limited under the SA than under A-IRB. However, the haircuts applied to collateral under the A-IRB approach are generally greater than those prescribed under the SA. Given this, we would expect the overall effect of applying current SA rules to be limited for this portfolio.
Additional regulatory information
UBS Group AG consolidated supplemental disclosures required under Basel III Pillar 3 regulations
Impairment, default and credit loss
EDTF | The table below and on the next page provides a breakdown over the last four years of expected loss estimates on our credit exposures (covering banking and traded products) and actual losses recognized in our income statement, broken down by exposure segments. Both expected and actual losses relate to defaulted and non-defaulted counterparties, include specific credit valuation adjustments on derivatives and are presented net of recoveries.
Although such a comparison may provide some insight, the comparison between expected and actual losses has limitations and the two measures are not directly comparable. For example, our estimates of expected loss are calibrated on a through the cycle basis, taking into account observed losses over a prolonged historical period. In contrast, the actual loss figures presented are a point in time view of our credit loss expenses, equal to the amount recognized in the income statement in a specific financial year. Furthermore, the estimated expected loss at the start of the period assumes that the portfolio will be unchanged throughout the coming year. In reality, the portfolio composition changes on an ongoing basis, affecting the actual loss experience. p
® Refer to the “Risk management and control” section and “Note 12 Allowances and provisions for credit losses” in the “Consolidated financial statements” section of this report for more information on the impaired, default and credit loss-related disclosures
EDTF | Table 13: Total actual and expected credit losses1
| | As of 31.12.14 for the year ended 31.12.15 | For the year ended 31.12.15 | | As of 31.12.13 for the year ended 31.12.14 | For the year ended 31.12.14 |
CHF million | | Expected loss | Allowances balance | Actual loss | | Expected loss | Allowances balance | Actual loss |
Sovereigns | | 17 | 14 | | | 16 | 14 | |
Banks | | 45 | 17 | | | 130 | 27 | 122 |
Corporates | | 989 | 654 | 83 | | 1,001 | 792 | 80 |
Central Counterparties | | | | | | | | |
Retail | | | | | | | | |
Residential mortgages | | 145 | 40 | | | 158 | 39 | |
Lombard lending | | 54 | 47 | 26 | | 61 | 19 | 1 |
Qualifying revolving other retail exposures | | 33 | 17 | 4 | | 34 | 16 | 5 |
Other retail | | 19 | 9 | 0 | | 18 | 15 | 0 |
Not allocated segment² | | | 6 | | | | 8 | (11) |
Total (gain) / loss | | 1,302 | 803 | 114 | | 1,416 | 930 | 196 |
1 Actual losses reflect credit losses for financial assets at amortized cost and financial instruments not recognized on the balance sheet as well as specific credit valuation adjustments for derivative instruments recognized in our IFRS income statement, including recoveries. Actual and expected losses include defaulted and not defaulted assets. Prior period numbers for 2014, 2013 and 2012 have been restated accordingly. 2 Includes changes in collective loan loss allowances. |
Table 13: Total actual and expected credit losses1 (continued)
|
| | As of 31.12.12 for the year ended 31.12.13 | For the year ended 31.12.13 | | As of 31.12.11 for the year ended 31.12.12 | For the year ended 31.12.12 |
CHF million | | Expected loss | Allowances balance | Actual loss | | Expected loss | Allowances balance | Actual loss |
Sovereigns | | 20 | 14 | | | 35 | 15 | |
Banks | | 75 | 91 | 14 | | 63 | 39 | (3) |
Corporates | | 1,150 | 812 | (21) | | 2,410 | 951 | 227 |
Central Counterparties | | | | | | | | |
Retail | | | | | | | | |
Residential mortgages | | 147 | 46 | | | 124 | 51 | |
Lombard lending | | 67 | 31 | (1) | | 46 | 35 | 12 |
Qualifying revolving other retail exposures | | 34 | 17 | 7 | | 18 | 18 | 7 |
Other retail | | 17 | 13 | 0 | | 30 | 14 | 0 |
Not allocated segment² | | | 20 | (93) | | | 114 | (15) |
Total (gain) / loss | | 1,510 | 1,044 | (94) | | 2,726 | 1,238 | 229 |
1 Actual losses reflect credit losses for financial assets at amortized cost and financial instruments not recognized on the balance sheet as well as specific credit valuation adjustments for derivative instruments recognized in our IFRS income statement, including recoveries. Actual and expected losses include defaulted and not defaulted assets. Prior period numbers for 2014, 2013 and 2012 have been restated accordingly. 2 Includes changes in collective loan loss allowances. |
▲
Derivatives credit risk
EDTF | Table 14: Credit risk exposure of derivative instruments
This table provides an overview of our credit risk exposures arising from derivatives. Exposures are provided based on the balance sheet carrying values of derivatives as well as regulatory net credit risk exposures. The net balance sheet credit exposure differs from the regulatory net credit risk exposures because of differences in valuation methods, netting and collateral deductions used for accounting and regulatory capital purposes. Net current credit risk exposure is derived from gross positive replacement values which reflect the balance sheet carrying values of derivatives after netting and eligible financial collateral, where an enforceable Master Netting Agreement is in place. Regulatory net credit exposure is calculated using our internal models or the supervisory approach.
CHF million | 31.12.15 | 31.12.14 |
Gross positive replacement values | 167,435 | 256,978 |
Netting benefits recognized¹ | (122,985) | (198,744) |
Collateral held¹ | (25,513) | (30,794) |
of which: cash collateral | (19,757) | (25,128) |
of which: non-cash collateral | (5,756) | (5,666) |
Net current credit exposure | 18,938 | 27,439 |
| | |
Regulatory net credit risk exposure | 73,473 | 82,961 |
of which: based on internal models (effective EPE) | 58,662 | 68,917 |
of which: based on supervisory approaches (current exposure method) | 14,811 | 14,044 |
1 For the purpose of this disclosure, the amounts of financial instruments and cash collateral presented have been capped by the relevant netting agreement so as not to exceed the net amount of financial assets presented on the balance sheet; i.e., over-collateralization, where it exists, is not reflected in the table. |
▲
® Refer to “Note 14 Derivative instruments and hedge accounting” in the “Consolidated financial statements” section of this report for more information on derivative instruments
Additional regulatory information
UBS Group AG consolidated supplemental disclosures required under Basel III Pillar 3 regulations
Other credit risk information
Our credit derivatives trading is predominantly conducted on a collateralized basis. This means that our mark-to-market exposures arising from derivatives activities with collateralized counterparties are typically closed out in full or reduced to nominal levels on a regular basis by the use of collateral.
Derivatives trading with counterparties with high credit ratings is typically conducted under an International Swaps and Derivatives Association (ISDA) master netting agreement. Credit exposures to those counterparties from credit default swaps (CDS), together with exposures from other over-the-counter (OTC) derivatives, are netted and included in the calculation of
the collateral that is required to be posted. Trading with lower-rated counterparties, such as hedge funds, would generally require an initial margin to be posted by the counterparty.
We receive collateral from or post collateral to our counterparties based on our open net receivable or net payable from OTC derivative activities. Under the terms of the ISDA master netting agreement and similar agreements, this collateral, which generally takes the form of cash or highly liquid debt securities, is available to cover any amounts due under those derivative transactions.
Table 15: Credit derivatives
This table provides an overview of the notional amount of credit derivatives, including those used to manage risks within our banking and trading books. Notional amounts of credit derivatives do not include any netting benefits. For capital underpinning of the counterparty credit risk of derivative positions, the effective EPE or exposure according to current exposure method is applied. Notional amounts are reported based on the regulatory scope of consolidation.
| | Regulatory banking book | | Regulatory trading book | | Total |
Notional amounts, CHF million | | Protection bought | Protection sold | Total | | Protection bought | Protection sold | Total | | 31.12.15 | 31.12.14 |
Credit default swaps | | 10,644 | 369 | 11,013 | | 155,257 | 152,095 | 307,352 | | 318,365 | 483,875 |
Total rate of return swaps | | 2,819 | | 2,819 | | 3,456 | 2,810 | 6,266 | | 9,085 | 8,899 |
Options and warrants | | | | | | 4,225 | 54 | 4,280 | | 4,280 | 8,028 |
Total 31.12.15 | | 13,463 | 369 | 13,832 | | 162,938 | 154,959 | 317,897 | | 331,729 | |
Total 31.12.14 | | 13,970 | 751 | 14,722 | | 248,849 | 237,231 | 486,080 | | | 500,802 |
Measured on a notional basis, our counterparties for buying and selling protection are mainly banks and central counterparties and to a lesser extent broker-dealers. In 2015, we saw a material reduction in notional exposures of CDS in the regulatory trading book, primarily with banks.
® Refer to “Note 14 Derivative instruments and hedge accounting” in the “Consolidated financial statements” section of this report for more information on credit derivatives by instrument and counterparty
Equity instruments in the banking book
The regulatory capital view for equity instruments in the banking book differs from the IFRS view, primarily due to the following:
– Differences in the basis of valuation, for example, financial investments classified as available-for-sale are subject to fair value accounting under IFRS but for regulatory capital purposes the “lower of cost or market” or “cost less impairment” concept is applied.
– Certain instruments which are held as debt investments on the IFRS balance sheet, mainly investment fund units, are treated as equity instruments for regulatory capital purposes.
– Certain instruments which are held as trading portfolio assets on the IFRS balance sheet, but which are not part of the regulatory VaR framework, are included as equity instruments in the banking book for regulatory capital purposes.
– Differences in the scope of consolidation.
® Refer to the “Scope of regulatory consolidation” section of this supplemental Pillar 3 section for more information
EDTF | Table 16: Equity instruments in the banking book
The table below shows the different equity instruments categories held in the banking book on the basis of amounts recognized under IFRS, followed by the regulatory capital adjustment amount. This adjustment considers the abovementioned differences to IFRS resulting in the total regulatory equity instruments exposure under the BIS framework, the corresponding RWA and the capital requirement.
The table also shows net realized gains and losses and unrealized revaluation gains relating to equity instruments.
| | As of |
CHF million | | 31.12.15 | 31.12.14 |
Equity instruments | | | |
Financial investments available-for-sale | | 645 | 664 |
Investments in associates | | 954 | 927 |
Total equity instruments under IFRS | | 1,598 | 1,591 |
Regulatory capital adjustment¹ | | 419 | 780 |
Total equity instruments under regulatory capital² | | 2,017 | 2,371 |
of which: to be risk-weighted | | | |
publicly traded (risk-weighted at 300%) | | 37 | 219 |
privately held (risk-weighted at 400%)³ | | 814 | 1,039 |
not deducted in application of threshold, but risk-weighted at 250% | | 805 | 738 |
of which: deduction from common equity tier 1 capital⁴ | | 360 | 375 |
RWA according to simple risk-weight method⁵ | | 4,072 | 4,735 |
Capital requirement according to simple risk-weight method⁵ | | 514 | 526 |
Total capital requirement (including deductions from common equity tier 1 capital) | | 875 | 901 |
| | | |
Net realized gains / (losses) and unrealized gains from equity instruments | | For the year ended 31.12.15 | For the year ended 31.12.14 |
Net realized gains / (losses) from disposals | | 106 | 80 |
Unrealized revaluation gains | | 332 | 285 |
of which: included in the BIS tier 2 capital | | 149 | 128 |
1 Includes CHF 477 million of investment fund units treated as debt investments under IFRS as of 31 December 2015 (31 December 2014: CHF 767 million). 2 The gross and net EAD of CHF 1,272 million presented for "Equity instruments in the banking book" line of "Table 2: Detailed segmentation of exposures and risk-weighted assets" excludes CHF 385 million booked in trust entities (compensation and benefit vehicles) and CHF 360 million goodwill of investments in associates. 3 Includes CHF 385 million exposure booked in trust entities (compensation and benefit vehicles) that did not generate risk-weighted assets. 4 Goodwill related to investments in associates is deducted from common equity tier 1 capital. 5 Risk-weighted assets of CHF 4,072 million and the capital requirement of CHF 514 million, as of 31 December 2015, are also disclosed in the "Equity instruments in the banking book" line of "Table 2: Detailed segmentation of exposures and risk-weighted assets." |
▲
Additional regulatory information
UBS Group AG consolidated supplemental disclosures required under Basel III Pillar 3 regulations
Market risk
The “Risk management and control” section of this report provides comprehensive information on market risk-related Pillar 3 disclosures.
® Refer to “Market risk” in the “Risk management and control” section of this report for more information
Securitization
This section provides details of traditional and synthetic securitization exposures in the banking and trading book based on the Basel III framework. Securitized exposures are generally risk-weighted, based on their external ratings. This section also provides details of the regulatory capital requirement associated with these exposures.
In a traditional securitization, a pool of loans (or other debt obligations) is typically transferred to structured entities that have been established to own the loan pool and to issue tranched securities to third-party investors referencing this pool of loans. In a synthetic securitization, legal ownership of securitized pools of assets is typically retained, but associated credit risk is transferred to structured entities typically through guarantees, credit derivatives or credit-linked notes. Hybrid structures with a mix of traditional and synthetic features are disclosed as synthetic securitizations.
We act in different roles in securitization transactions. As originator, we create or purchase financial assets, which are then securitized in traditional or synthetic securitization transactions, enabling us to transfer significant risk to third-party investors. As sponsor, we manage, provide financing or advise securitization programs. In line with the Basel framework, sponsoring includes underwriting, that is, placing securities in the market. In all other cases, we act in the role of investor by taking securitization positions.
RWA attributable to securitization positions decreased to CHF 1.4 billion as of 31 December 2015 from CHF 3.9 billion as of 31 December 2014, mainly due to a decline of CHF 2.2 billion in Corporate Center – Non-core and Legacy Portfolio, primarily due to the termination of hedging transactions synthetically transferring credit risk.
® Refer to “Note 30 Interests in subsidiaries and other entities subsidiaries and other entities” in the “Consolidated financial statements” section of this report for more information on structured entities
® Refer to the “Corporate Center” section of this report for more information on RWA by portfolio composition and exposure category
Table 17: Securitization / re-securitization
| | 31.12.15 | | 31.12.14 |
CHF million | | Gross EAD | Net EAD | RWA | Capital requirement | | Gross EAD | Net EAD | RWA | Capital requirement |
Securitization/re-securitization in the banking book | | 4,207 | 4,207 | 707 | 89 | | 9,048 | 9,048 | 2,650 | 295 |
CC - Non-core and Legacy Portfolio | | 1,089 | 1,089 | 319 | 40 | | 4,735 | 4,735 | 2,028 | 226 |
Other business divisions¹ | | 3,119 | 3,119 | 388 | 49 | | 4,313 | 4,313 | 622 | 69 |
Securitization/re-securitization in the trading book | | 1,263 | 1,263 | 672 | 85 | | 1,610 | 1,610 | 1,262 | 140 |
CC - Non-core and Legacy Portfolio | | 925 | 925 | 518 | 65 | | 1,205 | 1,205 | 993 | 110 |
Other business divisions¹ | | 338 | 338 | 154 | 19 | | 405 | 405 | 268 | 30 |
1 Mainly reflecting exposures in the Investment Bank. | | | | | | | | | | |
Additional regulatory information
UBS Group AG consolidated supplemental disclosures required under Basel III Pillar 3 regulations
Objectives, roles and involvement
Securitization in the banking book
Securitization positions held in the banking book include tranches of synthetic securitization of loan exposures. These were primarily hedging transactions executed by synthetically transferring credit risk. In addition, securitization in the banking book includes legacy risk positions in Corporate Center – Non Core and Legacy portfolio.
In 2015, we acted in the roles of both originator and sponsor. As originator, we sold originated commercial mortgage loans into securitization programs. As sponsor, we managed or advised securitization programs and helped to place the securities in the market. Refer to “Table 18: Securitization activity for the year in the banking book” for an overview of our originating and sponsoring activities in 2015 and 2014, respectively.
Securitization and re-securitization positions in the banking book are measured either at fair value or at amortized cost less impairment. The impairment assessment for a securitized position is generally based on the net present value of future cash flows expected from the underlying pool of assets.
Securitization in the trading book
Securitizations (including correlation products) held in the trading book are part of the trading activities, which typically include market-making and client facilitation. Included in the trading book are positions in our correlation book and legacy positions in leveraged super senior tranches. In the trading book, securitization and re-securitization positions are measured at fair value, reflecting market prices where available or are based on our internal pricing models.
Type of structured entities and affiliated entities involved in the securitization transactions
For the securitization of third-party exposures, the type of structured entities employed is selected as appropriate based on the type of transaction undertaken. Examples include limited liability corporations, common law trusts and depositor entities.
We also manage or advise significant groups of affiliated entities that invest in exposures we have securitized or in structured entities that we sponsor.
® Refer to “Note 30 Interests in subsidiaries and other entities” in the “Consolidated financial statements” section of this report for more information on structured entities
® Refer to the “Corporate Center” section of this report for more information on RWA by portfolio composition and exposure category
Managing and monitoring of the credit and market risk of securitization positions
The banking book securitization and re-securitization portfolio is subject to specific risk monitoring, which may include interest rate and credit spread sensitivity analysis, as well as inclusion in firm-wide earnings-at-risk, capital-at-risk and combined stress test metrics.
The trading book securitization and re-securitization positions are also subject to multiple risk limits, such as management VaR and stress limits as well as market value limits. As part of managing risks within pre-defined risk limits, traders may utilize hedging and risk mitigation strategies. Hedging may, however, expose the firm to basis risks as the hedging instrument and the position being hedged may not always move in parallel. Such basis risks are managed within the overall limits. Any retained securitization from origination activities and any purchased securitization positions are governed by risk limits together with any other trading positions. Legacy trading book securitization exposure is subject to the same management VaR limit framework. Additionally, risk limits are used to control the unwind, novation and asset sales process on an ongoing basis.
Regulatory capital treatment of securitization structures
Generally, in both the banking and trading book we apply the ratings-based approach to securitization positions using ratings, if available, from Standard & Poor’s, Moody’s Investors Service and Fitch Ratings for all securitization and re-securitization exposures. The selection of the External Credit Assessment Institutions (ECAI) is based on the primary rating agency concept. This concept is applied, in principle, to avoid having the credit assessment by one ECAI applied to one or more tranches and another ECAI for the other tranches, unless this is the result of the application of the specific rules for multiple assessments. If any two of the abovementioned rating agencies have issued a rating for a particular position, we would apply the lower credit rating of the two. If all three rating agencies have issued a rating for a particular position, we would apply the middle credit rating of the three. Under the ratings-based approach, the amount of capital required for securitization and re-securitization exposures in the banking book is capped at the level of the capital requirement that would have been assessed against the underlying assets had they not been securitized. This treatment has been applied in particular to the US and European reference-linked note programs. For the purposes of determining regulatory capital and the Pillar 3 disclosure for these positions, the underlying exposures are reported under the standardized approach, the advanced internal ratings-based approach or the securitization approach, depending on the category of the underlying security. If the underlying security is reported under the standardized approach or the advanced internal ratings-based approach, the related positions are excluded from the tables on the following pages.
The supervisory formula approach is applied to synthetic securitizations of portfolios of counterparty credit risk inherent in derivatives and loan exposures for which an external rating was not sought. The supervisory formula approach is also applied to leveraged super senior tranches.
In the trading book, the comprehensive risk measure is used for the correlation portfolio as defined by Basel III requirements. This measure broadly covers securitizations of liquid corporate underlying assets as well as associated hedges that are not necessarily securitizations, for example, single-name credit default swaps and credit default swaps on indices.
We do not apply the concentration ratio approach or the internal assessment approach to securitization positions.
The counterparty risk of interest rate or foreign currency derivatives with securitization vehicles is treated under the advanced internal ratings-based approach and is therefore not part of this disclosure.
Accounting policies
Refer to “Note 1 Summary of significant accounting policies” in the “Consolidated financial statements” section of this report for information on accounting policies that relate to securitization activities, primarily “Note 1a item 3 Subsidiaries and structured entities” and “Note 1a item 12 Securitization structures set up by UBS.”
We disclose our intention to securitize exposures as an originator if assets are designated for securitization and a tentative pricing date for a transaction is known as of the balance sheet date or if a pricing of a transaction has been fixed. Exposures intended to be securitized continue to be valued in the same way until such time as the securitization transaction takes place.
Presentation principles
It is our policy to present Pillar 3 disclosures for securitization transactions and balances in line with the capital adequacy treatments which were applied under Pillar 1 in the respective period presented.
We do not amend comparative prior period numbers for presentational changes triggered by new and revised information from third-party data providers, as long as the updated information does not impact the Pillar 1 treatments of prior periods.
Good practice guidelines
Disclosures within this section consider the “Industry good practice guidelines on Pillar 3 disclosure requirement for securitization” as published by the European Banking Federation, the Association for Financial Markets in Europe, the European Savings Banks Group and the European Association of Public Banks and Funding Agencies.
Additional regulatory information
UBS Group AG consolidated supplemental disclosures required under Basel III Pillar 3 regulations
Securitization exposures in the banking and trading book
Table 18 outlines the exposures measured as the transaction size we securitized at inception in the banking book in 2015 and in 2014. The activity is further broken down by our role (originator / sponsor) and by type (traditional / synthetic).
Amounts disclosed under the Traditional column of this table reflect the total outstanding notes at par value issued by the securitization vehicle at issuance. For synthetic securitization transactions, the amounts disclosed generally reflect the balance sheet carrying values of the securitized exposures at issuance.
For securitization transactions where we acted as originator,
exposures are split into two parts: those in which we have retained securitization positions and / or continue to be involved on an ongoing basis (for example credit enhancement or implicit support), and those in which we do not have retained securitization positions and / or have no further involvement.
Where we acted as both originator and sponsor to a securitization, originated assets are reported under Originator and the total amount of the underlying assets securitized is reported under Sponsor. As a result, as of 31 December 2015 and 31 December 2014, amounts of CHF 2.8 billion and CHF 2.9 billion, respectively, were included in “Table 18: Securitization activity for the year in the banking book” under both Originator and Sponsor and in “Table 19: Outstanding securitized exposures” under both Originator and Sponsor.
Table 18: Securitization activity for the year in the banking book
| | Originator | | Sponsor |
| | Traditional | | Synthetic | | Realized gains / (losses) on traditional securitizations | | Traditional | Synthetic |
CHF million | | Securitization positions retained | No securitization positions retained | | Securitization positions retained | No securitization positions retained | | | | | |
Residential mortgages | | | | | | | | | | | |
Commercial mortgages | | 973 | 1,784 | | | | | 51 | | 7,891 | |
Credit card receivables | | | | | | | | | | | |
Leasing | | | | | | | | | | | |
Loans to corporates or small and medium-sized enterprises | | | | | | | | | | | |
Consumer loans | | | | | | | | | | | |
Student loans | | | | | | | | | | | |
Trade receivables | | | | | | | | | | | |
Re-securitizations | | | | | | | | | | | |
Other | | | | | 2,718 | | | | | | |
Total 31.12.15 | | 973 | 1,784 | | 2,718 | 0 | | 51 | | 7,891 | 0 |
| | | | | | | | | | | |
Residential mortgages | | | | | | | | | | | |
Commercial mortgages | | 1,680 | 1,262 | | | | | 68 | | 9,258 | |
Credit card receivables | | | | | | | | | | | |
Leasing | | | | | | | | | | | |
Loans to corporates or small and medium-sized enterprises | | | | | | | | | | | |
Consumer loans | | | | | | | | | | | |
Student loans | | | | | | | | | | | |
Trade receivables | | | | | | | | | | | |
Re-securitizations | | | | | | | | | | | |
Other | | | | | 351 | | | | | | |
Total 31.12.14 | | 1,680 | 1,262 | | 351 | 0 | | 68 | | 9,258 | 0 |
Securitization activity for the year in the trading book
In 2015 and 2014, we had no securitization activity in the trading book.
Table 19: Outstanding securitized exposures
This table outlines the outstanding transaction size of securitization exposures which we have originated / sponsored and retained securitization positions at the balance sheet date in the banking or trading book and / or are otherwise involved on an ongoing basis, for example through the provision of credit enhancement or implicit support.
Amounts disclosed under the Traditional column in this table reflect the total outstanding notes at par value issued by the securitization vehicle. For synthetic securitization transactions, we generally disclose the balance sheet carrying values of the exposures securitized or, for hybrid structures, the outstanding notes at par value issued by the securitization vehicle.
The table also includes securitization activities conducted in 2015 and in 2014 in which we retained and / or purchased positions. These can also be found in “Table 18: Securitization activity for the year in the banking book.” Where no positions were retained, the outstanding transaction size is only disclosed in the year of inception for originator transactions.
All values in this table are as of the balance sheet date.
| | Banking book | | Trading book¹˒² |
| | Originator | | Sponsor | | Originator | | Sponsor |
CHF million | | Traditional | Synthetic | | Traditional | | Synthetic | | Traditional | | Synthetic | | Traditional³ | | Synthetic |
Residential mortgages | | | | | 1,822 | | | | 673 | | | | 3,119 | | |
Commercial mortgages | | 2,756 | | | 23,874 | | | | | | | | 5,894 | | |
Credit card receivables | | | | | | | | | | | | | | | |
Leasing | | | | | 263 | | | | | | | | | | |
Loans to corporates or small and medium-sized enterprises | | | | | | | | | | | | | | | |
Consumer loans | | | | | | | | | | | | | | | |
Student loans | | | | | 359 | | | | | | | | 311 | | |
Trade receivables | | | | | | | | | | | | | | | |
Re-securitizations | | | | | | | | | | | 1,053 | | | | |
Other | | | 4,864 | | 423 | | | | | | | | 13,341 | | |
Total 31.12.15 | | 2,756 | 4,864 | | 26,741 | | 0 | | 673 | | 1,053 | | 22,665 | | 0 |
| | | | | | | | | | | | | | | |
Residential mortgages | | | | | | | | | 1,008 | | | | 7,307 | | |
Commercial mortgages | | 2,942 | | | 17,234 | | | | | | | | 2,437 | | |
Credit card receivables | | | | | | | | | | | | | | | |
Leasing | | | | | 282 | | | | | | | | | | |
Loans to corporates or small and medium-sized enterprises | | | | | | | | | | | | | | | |
Consumer loans | | | | | | | | | | | | | | | |
Student loans | | | | | 405 | | | | | | | | 742 | | |
Trade receivables | | | | | | | | | | | | | | | |
Re-securitizations | | | 243 | | 1,106 | | | | 199 | | 1,057 | | | | |
Other | | | 7,306 | | 463 | | | | | | | | | | |
Total 31.12.14 | | 2,942 | 7,549 | | 19,489 | | 0 | | 1,207 | | 1,057 | | 10,487 | | 0 |
1 Both net long and net short positions are underpinned in the trading book and EAD is capped at the maximum possible loss. 2 In line with our disclosure principles, we disclose the UBS originated and sponsored deals only where the positions result in a RWA or capital deduction under Pillar 1. 3 This disclosure excludes sponsor-only activity where we do not retain a position. In such cases, we advised the originator or placed securities in the market for a fee, and there was no other impact on our capital ratios. |
Additional regulatory information
UBS Group AG consolidated supplemental disclosures required under Basel III Pillar 3 regulations
Table 20: Impaired or past due securitized exposures and losses related to securitized exposures in the banking book
This table provides a breakdown of the outstanding impaired or past due exposures at the balance sheet date as well as losses recognized in our income statement for transactions in which we acted as originator or sponsor in the banking book. Losses are reported after taking into account the offsetting effects of any credit protection from eligible risk mitigation instruments under the Basel III framework for the retained or purchased positions.
Where we did not retain positions, impaired or past due information is only reported in the year of inception of a transaction. Where available, past due information is derived from investor reports. Past due is generally defined as delinquency above 60 days. Where investor reports do not provide this information, alternative methods have been applied, which may include an assessment of the fair value of the retained position or reference assets, or identification of any credit events.
| | 31.12.15 | | 31.12.14 |
| | Originator | | Sponsor | | Originator | | Sponsor |
CHF million | | Impaired or past due in securitized exposures | Recognized losses in income statement | | Impaired or past due in securitized exposures | Recognized losses in income statement | | Impaired or past due in securitized exposures | Recognized losses in income statement | | Impaired or past due in securitized exposures | Recognized losses in income statement |
Residential mortgages | | | | | 13 | | | | | | | 0 |
Commercial mortgages | | | | | 36 | 1 | | | | | 30 | |
Credit card receivables | | | | | | | | | | | | |
Leasing | | | | | | 0 | | | | | | 0 |
Loans to corporates or small and medium-sized enterprises | | | | | | | | | | | | |
Consumer loans | | | | | | | | | | | | |
Student loans | | | | | 6 | | | | | | 8 | |
Trade receivables | | | | | | | | | | | | |
Re-securitizations | | | | | | | | | | | | |
Other | | | 2 | | | 0 | | | 6 | | | |
Total | | 0 | 2 | | 55 | 2 | | 0 | 6 | | 38 | 1 |
Table 21: Exposures intended to be securitized in the banking and trading book
This table provides the amount of exposures by exposure type we intend to securitize in the banking and trading book. We disclose our intention to securitize exposures as an originator if
assets are designated for securitization and a tentative pricing date for a transaction is known at the balance sheet date or if a pricing of a transaction has been fixed.
| | 31.12.15 | | 31.12.14 |
CHF million | | Banking book | Trading book | | Banking book | Trading book |
Residential mortgages | | | | | | |
Commercial mortgages | | 323 | | | 144 | |
Credit card receivables | | | | | | |
Leasing | | | | | | |
Loans to corporates or small and medium-sized enterprises | | | | | | |
Consumer loans | | | | | | |
Student loans | | | | | | |
Trade receivables | | | | | | |
Re-securitizations | | | | | | |
Other | | | | | | |
Total | | 323 | 0 | | 144 | 0 |
Table 22: Securitization positions retained or purchased in the banking book
This table provides a breakdown of securitization positions we retained or purchased in the banking book, irrespective of our role in the securitization transaction. The value disclosed is the net exposure amount at default subject to risk-weighting at the balance sheet date.
| | 31.12.15 | | 31.12.14 |
CHF million | | On balance sheet | Off-balance sheet³ | Total | | On balance sheet | Off-balance sheet³ | Total |
Residential mortgages | | 351 | | 351 | | 499 | | 499 |
Commercial mortgages | | 0 | | 0 | | 31 | | 31 |
Credit card receivables | | | | | | | | |
Leasing | | 0 | | 0 | | 1 | | 1 |
Loans to corporates or small and medium-sized enterprises | | 0 | | 0 | | 173 | | 173 |
Consumer loans | | | | | | 1 | | 1 |
Student loans | | 178 | | 178 | | 402 | | 402 |
Trade receivables | | | | | | | | |
Re-securitizations | | 0 | 0 | 0 | | 452 | 39 | 492 |
Other² | | 3,678 | | 3,678 | | 7,449 | | 7,449 |
Total¹ | | 4,207 | 0 | 4,207 | | 9,009 | 39 | 9,048 |
1 The total exposure of CHF 4,207 million as of 31 December 2015 is also disclosed in “Table 2: Detailed segmentation of exposures and risk-weighted assets” in line “Securitization / re-securitization in the banking book.” 2 “Other” primarily includes securitization of portfolios of counterparty credit risk in over-the-counter (OTC) derivatives and loan exposures. 3 Synthetic long exposures through sold CDS positions are classified as off-balance sheet exposures. |
Additional regulatory information
UBS Group AG consolidated supplemental disclosures required under Basel III Pillar 3 regulations
Table 23: Securitization positions retained or purchased in the trading book
This table provides a breakdown of securitization positions we purchased or retained in the trading book subject to the securitization framework for specific market risk, irrespective of our role in the securitization transaction. Gross long and gross short amounts reflect the positions prior to the eligible offsetting of cash and derivative positions. Net long and net short amounts are the result of offsetting cash and derivative positions to the extent eligible under the Basel III framework. The amounts disclosed are either the fair value or, in the case of derivative positions, the aggregate of the notional amount and the associated replacement value at the balance sheet date.
| | Cash positions | | Derivative positions | | Total |
CHF million | | Gross long | Gross short | | Gross long | Gross short | | Net long | Net short | Net Total¹˒² |
Residential mortgages | | 7 | 1 | | 260 | 291 | | 13 | 15 | 28 |
Commercial mortgages | | 146 | 0 | | 1,500 | 1,570 | | 209 | 117 | 326 |
Credit card receivables | | | | | | | | | | |
Leasing | | | | | | | | | | |
Loans to corporates or small and medium-sized enterprises | | | | | | | | | | |
Consumer loans | | | | | | | | | | |
Student loans | | 0 | 0 | | | | | | | |
Trade receivables | | | | | | | | | | |
Re-securitizations | | 24 | | | 24 | 19 | | 9 | 1 | 10 |
Other | | 5 | 0 | | 106 | 106 | | 5 | | 5 |
Total 31.12.15 | | 183 | 1 | | 1,889 | 1,985 | | 236 | 133 | 369 |
| | | | | | | | | | |
Residential mortgages | | 14 | 3 | | 481 | 633 | | 16 | 45 | 61 |
Commercial mortgages | | 238 | | | 1,299 | 1,332 | | 427 | 6 | 433 |
Credit card receivables | | | | | | | | | | |
Leasing | | | | | | | | | | |
Loans to corporates or small and medium-sized enterprises | | | | | | | | | | |
Consumer loans | | | | | | | | | | |
Student loans | | | | | | | | | | |
Trade receivables | | | | | | | | | | |
Re-securitizations | | 28 | 1 | | 106 | 39 | | 15 | 4 | 18 |
Other | | 3 | 0 | | 203 | 203 | | 3 | | 3 |
Total 31.12.14 | | 283 | 4 | | 2,090 | 2,208 | | 461 | 55 | 515 |
1 Both net long and net short positions are underpinned in the trading book and EAD is capped at the maximum possible loss. 2 Figures as of 31 December 2015 exclude CHF 894 million related to leveraged super senior tranches treated under the supervisory formula approach which are reported in “Table 27c: Securitization / re-securitization exposures treated under the supervisory formula approach by rating clusters – trading book.” Including these exposures, net total exposures were CHF 1,263 million, which equals the gross and net exposure of securitization / re-securitization in the trading book presented in “Table 2: Detailed segmentation of exposures and risk-weighted assets.” |
Table 24a: Capital requirement for securitization / re-securitization positions retained or purchased in the banking book
Tables 24a to 24c provide the capital requirements for securitization and re-securitization positions we purchased or retained in the banking book, irrespective of our role in the securitization transaction, split by risk weight bands and regulatory capital approach. We use three FINMA-recognized ECAI for this purpose: Standard & Poor’s, Moody’s Investors Service and Fitch Ratings.
| | 31.12.15 | | | | 31.12.14 | | |
| | Ratings-based approach | | Supervisory formula approach | | | | Ratings-based approach | Supervisory formula approach | | |
CHF million | | Securitization | Re- securitization | | Securitization | Re- securitization | | Total | | Securitization | Re- securitization | Securitization | Re- securitization | | Total |
over 0–20% | | 12 | | | 28 | | | 40 | | 20 | 16 | 45 | | | 81 |
over 20–35% | | 2 | | | 1 | | | 3 | | 5 | 2 | 53 | | | 60 |
over 35–50% | | 1 | | | | | | 1 | | 6 | 18 | | | | 24 |
over 50–75% | | 7 | | | | | | 7 | | 11 | 0 | | | | 11 |
over 75–100% | | 13 | | | | | | 13 | | 7 | | | | | 7 |
over 100–250% | | 0 | | | | | | 0 | | 6 | 0 | | | | 6 |
over 250–1,249% | | | | | | | | 0 | | 5 | 1 | | | | 6 |
1,250% rated | | 0 | 0 | | | | | 0 | | 34 | 10 | | | | 44 |
1,250% unrated | | 0 | | | 23 | | | 23 | | 16 | 2 | 37 | | | 55 |
Total¹ | | 36 | 0 | | 52 | 0 | | 89 | | 110 | 49 | 135 | 0 | | 295 |
1 Refer to “Table 2: Detailed segmentation of exposures and risk-weighted assets.” On 31 December 2015, CHF 4,207 million banking book securitization net exposures translated into an overall capital requirement of CHF 89 million. |
Table 24b: Securitization / re-securitization exposures treated under the ratings-based approach by rating clusters – banking book
| | 31.12.15 | | 31.12.14 |
CHF million | | Exposure amount | Capital requirement | | Exposure amount | Capital requirement |
AAA | | 205 | 3 | | 223 | 4 |
AA | | 302 | 6 | | 917 | 27 |
A+ | | 31 | 1 | | 54 | 1 |
A | | 92 | 2 | | 335 | 8 |
A– | | 39 | 2 | | 119 | 5 |
BBB+ | | 20 | 1 | | 121 | 10 |
BBB | | 89 | 7 | | 126 | 11 |
BBB– | | 99 | 13 | | 69 | 12 |
BB+ | | 0 | 0 | | 26 | 10 |
BB | | | | | 9 | 5 |
BB– | | | | | 6 | 6 |
Below BB– / unrated | | 0 | 1 | | 44 | 62 |
Total | | 878 | 37 | | 2,050 | 159 |
Additional regulatory information
UBS Group AG consolidated supplemental disclosures required under Basel III Pillar 3 regulations
Table 24c: Securitization / re-securitization exposures treated under the supervisory formula approach by rating clusters – banking book
| | 31.12.15 | | 31.12.14 |
CHF million | | Exposure amount | Capital charge | | Exposure amount | Capital charge |
over 0–20% | | 3,247 | 28 | | 5,190 | 45 |
over 20–35% | | 68 | 1 | | 1,782 | 53 |
1,250% | | 15 | 23 | | 27 | 37 |
Total | | 3,329 | 52 | | 6,998 | 135 |
Gains on sale – securitization exposures to be deducted from Basel III tier 1 capital
In 2015 and in 2014, we have not retained any significant exposures relating to securitization for which we have recorded gains on sale requiring deduction from Basel III tier 1 capital.
Securitization exposures subject to early amortization in the banking and trading book
In 2015 and in 2014, we have not retained any securitization structures in the banking and trading book that are subject to early amortization treatment.
Re-securitization positions retained or purchased in the banking book
During 2015, the majority of our Re-securitization positions retained or purchased in the banking book have been sold or terminated.
Table 25: Re-securitization positions retained or purchased in the trading book
The table below outlines re-securitization positions retained or purchased subject to the securitization framework for specific market risk held in the trading book on a gross long and gross short basis, including synthetic long and short positions resulting from derivative transactions. It also includes positions on a net
long and net short basis, that is, gross long and short positions after offsetting to the extent it is eligible under the Basel III framework. As of 31 December 2015, none of the retained or purchased trading book re-securitization positions had an integrated insurance wrapper.
CHF million | Gross long | Gross short | Net long | Net short |
Total 31.12.15 | 48 | 19 | 9 | 1 |
Total 31.12.14 | 134 | 41 | 15 | 4 |
Outstanding notes issued by securitization vehicles related to UBS’s retained exposures subject to the market risk approach
The information presented in table 26 in our Annual Report 2014 is now located within the “Trading Book” information in “Table 19: Outstanding securitized exposures” in this report. In 2015 and 2014, there was no origination activity for securitization vehicles in the trading book.
Additional regulatory information
UBS Group AG consolidated supplemental disclosures required under Basel III Pillar 3 regulations
Table 26: Correlation products subject to the comprehensive risk measure or the securitization framework for specific risk
This table outlines products in the correlation portfolio that we retained or purchased in the trading book, irrespective of our role in the securitization transaction. They are subject to either the comprehensive risk measure or the securitization framework for specific risk. Correlation products subject to the securitization framework are leveraged super senior positions. The values disclosed are market values for cash positions, replacement values and notional values for derivative positions. Derivatives are split by positive replacement value and negative replacement value. The decrease in notional values related to positive and negative replacement values resulted mainly from trades maturing during the year, as well as from trade terminations.
| | Cash positions | | Derivative positions |
CHF million | | Assets | | Liabilities | | Assets | | Liabilities |
31.12.15 | | Market value | | Market value | | Positive replacement value | Positive replacement value notionals | | Negative replacement value | Negative replacement value notionals |
Positions subject to comprehensive risk measure | | 59 | | 481 | | 60 | 1,371 | | 305 | 2,011 |
Positions subject to securitization framework¹ | | | | | | | 2,569 | | | 2,569 |
| | | | | | | | | | |
31.12.14 | | | | | | | | |
Positions subject to comprehensive risk measure | | 137 | | 609 | | 254 | 4,019 | | 627 | 5,610 |
Positions subject to securitization framework¹ | | | | | | 1 | 3,095 | | 1 | 3,095 |
1 Includes leveraged super senior tranches. |
Table 27a: Securitization positions and capital requirement for trading book positions subject to the securitization framework
Tables 27a to 27c outline securitization positions we purchased or retained and the capital requirement in the trading book subject to the securitization framework for specific market risk, irrespective of our role in the securitization transaction, broken down by risk weight bands and regulatory capital approach. The amounts disclosed for securitization positions are market values at the balance sheet date after eligible netting under the Basel III framework.
| | 31.12.15 | | 31.12.14 |
| | Ratings-based approach | | Ratings-based approach |
CHF million | | Net long | Net short | Net Total¹ | Capital requirement² | | Net long | Net short | Net Total¹ | Capital requirement |
over 0–20% | | 147 | 97 | 244 | 4 | | 346 | 0 | 347 | 5 |
over 20–35% | | 52 | 5 | 57 | 2 | | 51 | | 51 | 2 |
over 35–50% | | 9 | | 9 | 1 | | 17 | 0 | 18 | 1 |
over 50–75% | | 6 | 0 | 6 | 1 | | 8 | 3 | 11 | 1 |
over 75–100% | | 2 | 14 | 16 | 2 | | 0 | 6 | 6 | 1 |
over 100–250% | | | 0 | 0 | 0 | | 8 | | 8 | 2 |
over 250–1,249% | | 5 | | 5 | 3 | | | 0 | 0 | 0 |
1,250% rated | | 9 | 14 | 23 | 36 | | 13 | 42 | 55 | 76 |
1,250% unrated | | 6 | 3 | 9 | 13 | | 18 | 2 | 20 | 28 |
Total³ | | 236 | 133 | 369 | 62 | | 461 | 55 | 516 | 116 |
1 Both net long and net short positions are underpinned in the trading book and EAD is capped at the maximum possible loss. 2 The capital requirement of CHF 85 million as of 31 December 2015 disclosed in “Table 2: Detailed segmentation of exposures and risk-weighted assets” in line “Securitization / re-securitization in the trading book” includes the total ratings-based approach charge of CHF 62 million and a CHF 23 million capital requirement for leveraged super senior tranches as disclosed in “Table 28: Capital requirement for securitization positions related to correlation products.” 3 Leveraged super senior tranches (subject to the securitization framework) are not included in this table, but are disclosed in “Table 26: Correlation products subject to the comprehensive risk measure or the securitization framework for specific risk.” |
Table 27b: Securitization / re-securitization exposures treated under the ratings-based approach by rating clusters – trading book
| | 31.12.15 | | 31.12.14 |
CHF million | | Exposure amount | Capital requirement | | Exposure amount | Capital requirement |
AAA | | 224 | 4 | | 301 | 4 |
AA | | 40 | 1 | | 60 | 1 |
A+ | | | | | | |
A | | 4 | 0 | | 12 | 1 |
A– | | 37 | 2 | | 35 | 1 |
BBB+ | | 9 | 1 | | 14 | 1 |
BBB | | 1 | 0 | | 4 | 0 |
BBB– | | 16 | 2 | | 6 | 1 |
BB+ | | 0 | 0 | | 8 | 2 |
BB | | 5 | 3 | | 0 | 0 |
BB– | | 0 | 0 | | | |
Below BB– /unrated | | 32 | 50 | | 75 | 104 |
Total | | 369 | 62 | | 515 | 116 |
Additional regulatory information
UBS Group AG consolidated supplemental disclosures required under Basel III Pillar 3 regulations
Table 27c: Securitization / re-securitization exposures treated under the supervisory formula approach by rating clusters – trading book
| | 31.12.15 | | 31.12.14 |
CHF million | | Exposure amount | Capital requirement | | Exposure amount | Capital requirement |
over 0–20% | | 894 | 23 | | 1,095 | 24 |
Total | | 894 | 23 | | 1,095 | 24 |
Table 28: Capital requirement for securitization positions related to correlation products
This table outlines the capital requirement for securitization positions in the trading book for correlation products, including positions subject to comprehensive risk measure and positions related to leveraged super senior positions and certain re-securitized corporate credit exposure positions subject to the securitization framework. Our model does not distinguish between “default risk,” “migration risk” and “correlation risk.” The capital requirement for positions subject to the comprehensive risk measure declined mainly from trades maturing during the year, as well as from trade terminations
| | 31.12.15 | | 31.12.14 |
CHF million | | Capital requirement | | Capital requirement |
Positions subject to comprehensive risk measure | | 11 | | 15 |
Positions subject to securitization framework¹ | | 23 | | 24 |
Total | | 34 | | 39 |
1 Leveraged super senior tranches. | | | | |
Balance sheet reconciliation
Table 29: Reconciliation of accounting balance sheet to balance sheet under the regulatory scope of consolidation
The table below provides a reconciliation of the IFRS balance sheet to the balance sheet according to the regulatory scope of consolidation as defined by BIS and FINMA. Lines in the balance sheet under the regulatory scope of consolidation are expanded and referenced where relevant to display all components that are used in “Table 30: Composition of capital.”
® Refer to the “Introduction” section for more information
| Balance sheet in accordance with IFRS scope of consolidation | Effect of deconsolidated entities for regulatory consolidation | Effect of additional consolidated entities for regulatory consolidation | Balance sheet in accordance with regulatory scope of consolidation | References¹ |
CHF million | 31.12.15 | | | | |
Assets | | | | | |
Cash and balances with central banks | 91,306 | | | 91,306 | |
Due from banks | 11,948 | (280) | | 11,668 | |
Cash collateral on securities borrowed | 25,584 | | | 25,584 | |
Reverse repurchase agreements | 67,893 | | | 67,893 | |
Trading portfolio assets | 124,035 | (16,302) | | 107,733 | |
Positive replacement values | 167,435 | 17 | | 167,452 | |
Cash collateral receivables on derivative instruments | 23,763 | | | 23,763 | |
Financial assets designated at fair value | 6,146 | | | 6,146 | |
Loans | 311,954 | 78 | | 312,032 | |
Financial investments available-for-sale | 62,543 | (80) | | 62,463 | |
Consolidated participations | 0 | 166 | | 166 | |
Investments in associates | 954 | | | 954 | |
of which: goodwill | 360 | | | 360 | 4 |
Property, equipment and software | 7,695 | (83) | | 7,612 | |
Goodwill and intangible assets | 6,568 | | | 6,568 | |
of which: goodwill | 6,240 | | | 6,240 | 4 |
of which: intangible assets | 328 | | | 328 | 5 |
Deferred tax assets | 12,835 | (1) | | 12,834 | |
of which: deferred tax assets recognized for tax loss carry-forwards | 7,093 | (1) | | 7,092 | 9 |
of which: deferred tax assets on temporary differences | 5,742 | | | 5,742 | 12 |
Other assets | 22,160 | (280) | 1 | 21,881 | |
of which: net defined benefit pension and other post-employment assets | 50 | | | 50 | 10 |
Total assets | 942,819 | (16,764) | 1 | 926,055 | |
Additional regulatory information
UBS Group AG consolidated supplemental disclosures required under Basel III Pillar 3 regulations
Table 29: Reconciliation of accounting balance sheet to balance sheet under the regulatory scope of consolidation (continued)
| Balance sheet in accordance with IFRS scope of consolidation | Effect of deconsolidated entities for regulatory consolidation | Effect of additional consolidated entities for regulatory consolidation | Balance sheet in accordance with regulatory scope of consolidation | References¹ |
CHF million | 31.12.15 | | | | |
Liabilities | | | | | |
Due to banks | 11,836 | (54) | | 11,781 | |
Cash collateral on securities lent | 8,029 | | | 8,029 | |
Repurchase agreements | 9,653 | | | 9,653 | |
Trading portfolio liabilities | 29,137 | | | 29,137 | |
Negative replacement values | 162,430 | 81 | | 162,512 | |
Cash collateral payables on derivative instruments | 38,282 | | | 38,282 | |
Financial liabilities designated at fair value | 62,995 | 68 | | 63,063 | |
Due to customers | 390,185 | (165) | | 390,021 | |
Debt issued | 93,147 | (19) | | 93,129 | |
of which: amount eligible for high-trigger loss-absorbing additional tier 1 capital² | 2,837 | | | 2,837 | 13 |
of which: amount eligible for low-trigger loss-absorbing additional tier 1 capital² | 2,326 | | | 2,326 | 13 |
of which: amount eligible for low-trigger loss-absorbing tier 2 capital³ | 10,325 | | | 10,325 | 7 |
of which: amount eligible for capital instruments subject to phase-out from tier 2 capital⁴ | 996 | | | 996 | 8 |
Provisions | 4,164 | | | 4,164 | |
Other liabilities | 75,652 | (16,544) | | 59,108 | |
of which: amount eligible for high-trigger loss-absorbing capital (Deferred Contingent Capital Plan (DCCP))⁵ | 1,134 | | | 1,134 | 13 |
Total liabilities | 885,511 | (16,633) | 0 | 868,878 | |
Equity | | | | | |
Share capital | 385 | (1) | 1 | 385 | 1 |
Share premium | 31,164 | | | 31,164 | 1 |
Treasury shares | (1,693) | | | (1,693) | 3 |
Retained earnings | 29,504 | (247) | | 29,257 | 2 |
Other comprehensive income recognized directly in equity, net of tax | (4,047) | 116 | (1) | (3,932) | 3 |
of which: unrealized gains / (losses) from cash flow hedges according to regulatory scope of consolidation | 1,638 | | | 1,638 | 11 |
Equity attributable to UBS Group AG shareholders | 55,313 | (132) | 1 | 55,181 | |
Equity attributable to non-controlling interests | 1,995 | 1 | | 1,996 | 6 |
Total equity | 57,308 | (131) | 1 | 57,177 | |
Total liabilities and equity | 942,819 | (16,764) | 1 | 926,055 | |
1 References link the lines of this table to the respective reference numbers provided in the column "References" in "Table 30: Composition of capital." 2 Represents IFRS book value. 3 IFRS book value is CHF 10,346 million. 4 IFRS book value is CHF 2,254 million. 5 IFRS book value is CHF 1,181 million. Refer to the "Compensation" section of this report for more information on the DCCP. |
Composition of capital
The table on the next pages provides the “Composition of capital” as defined by BIS and FINMA. The naming convention does not always reflect the UBS naming convention. Reference is made to items reconciling to the balance sheet under the regulatory scope of consolidation as disclosed in “Table 29: Reconciliation of accounting balance sheet to balance sheet under the regulatory scope of consolidation.” Where relevant, the effect of phase-in arrangements is disclosed as well.
® Refer to the “Capital management” section of this report for more information on phase-in arrangements
An overview of the main features of our regulatory capital instruments, as well as the full terms and conditions, are published in the “Bondholder information” section of our Investor Relations website.
® Refer to “Bondholder information” at www.ubs.com/investors for more information on the capital instruments of UBS Group AG and UBS AG on a consolidated and on a standalone basis
Additional regulatory information
UBS Group AG consolidated supplemental disclosures required under Basel III Pillar 3 regulations
EDTF | Table 30: Composition of capital
| | Numbers phase-in | Effect of the transition phase | References¹ |
| CHF million, except where indicated | 31.12.15 | 31.12.15 | |
1 | Directly issued qualifying common share (and equivalent for non-joint stock companies) capital plus related stock surplus | 31,549 | | 1 |
2 | Retained earnings | 29,257 | | 2 |
3 | Accumulated other comprehensive income (and other reserves) | (5,625) | | 3 |
4 | Directly issued capital subject to phase-out from common equity tier 1 capital (only applicable to non-joint stock companies) | | | |
5 | Common share capital issued by subsidiaries and held by third parties (amount allowed in group common equity tier 1 capital) | | | |
6 | Common equity tier 1 capital before regulatory adjustments | 55,181 | | |
7 | Prudential valuation adjustments | (83) | | |
8 | Goodwill, net of tax, less hybrid capital and additional tier 1 capital² | (2,618) | (3,927) | 4 |
9 | Intangible assets, net of tax² | (323) | | 5 |
10 | Deferred tax assets recognized for tax loss carry-forwards³ | (2,988) | (4,480) | 9 |
11 | Unrealized (gains) / losses from cash flow hedges, net of tax | (1,638) | | 11 |
12 | Expected losses on advanced internal ratings-based portfolio less general provisions | (311) | | |
13 | Securitization gain on sale | | | |
14 | Own credit related to financial liabilities designated at fair value and replacement values, net of tax | (442) | | |
15 | Defined benefit plans | (20) | (30) | 10 |
16 | Compensation and own shares-related capital components (not recognized in net profit) | (1,383) | | |
17 | Reciprocal crossholdings in common equity | | | |
17a | Qualifying interest where a controlling influence is exercised together with other owners (CET instruments) | | | |
17b | Consolidated investments (CET1 instruments) | | | |
18 | Investments in the capital of banking, financial and insurance entities that are outside the scope of regulatory consolidation, net of eligible short positions, where the bank does not own more than 10% of the issued share capital (amount above 10% threshold) | | | |
19 | Significant investments in the common stock of banking, financial and insurance entities that are outside the scope of regulatory consolidation, net of eligible short positions (amount above 10% threshold) | | | |
20 | Mortgage servicing rights (amount above 10% threshold) | | | |
21 | Deferred tax assets arising from temporary differences (amount above 10% threshold, net of related tax liability)⁶ | (702) | (1,896) | 12 |
22 | Amount exceeding the 15% threshold | | | |
23 | of which: significant investments in the common stock of financials | | | |
24 | of which: mortgage servicing rights | | | |
25 | of which: deferred tax assets arising from temporary differences | | | |
26 | Expected losses on equity investments treated according to the PD/LGD approach | | | |
26a | Other adjustments relating to the application of an internationally accepted accounting standard | (402) | | |
26b | Other deductions | (3,895) | | 13 |
27 | Regulatory adjustments applied to common equity tier 1 due to insufficient additional tier 1 and tier 2 to cover deductions | | | |
28 | Total regulatory adjustments to common equity tier 1 | (14,804) | (10,334) | |
29 | Common equity tier 1 capital (CET1) | 40,378 | (10,334) | |
Table 30: Composition of capital (continued)
| | Numbers phase-in | Effect of the transition phase | References¹ |
| CHF million, except where indicated | 31.12.15 | 31.12.15 | |
30 | Directly issued qualifying additional tier 1 instruments plus related stock surplus | 6,154 | 0 | |
31 | of which: classified as equity under applicable accounting standards | | | |
32 | of which: classified as liabilities under applicable accounting standards⁵ | 6,154 | 0 | 13 |
33 | Directly issued capital instruments subject to phase-out from additional tier 1 | | | |
34 | Additional tier 1 instruments (and CET1 instruments not included in row 5) issued by subsidiaries and held by third parties (amount allowed in group additional tier 1) | 1,954 | (1,954) | 6 |
35 | of which: instruments issued by subsidiaries subject to phase-out | 1,954 | (1,954) | |
36 | Additional tier 1 capital before regulatory adjustments | 8,108 | (1,954) | |
37 | Investments in own additional tier 1 instruments | | | |
38 | Reciprocal crossholdings in additional tier 1 instruments | | | |
38a | Qualifying interest where a controlling influence is exercised together with other owner (AT1 instruments) | | | |
38b | Holdings in companies which are to be consolidated (additional tier1 instruments) | | | |
39 | Investments in the capital of banking, financial and insurance entities that are outside the scope of regulatory consolidation, net of eligible short positions, where the bank does not own more than 10% of the issued common share capital of the entity (amount above 10% threshold) | | | |
40 | Significant investments in the capital of banking, financial and insurance entities that are outside the scope of regulatory consolidation (net of eligible short positions) | | | |
41 | National specific regulatory adjustments | (3,927) | 3,927 | |
42 | Regulatory adjustments applied to additional tier 1 due to insufficient tier 2 to cover deductions | | | |
| Tier 1 adjustments on impact of transitional arrangements | (3,927) | 3,927 | |
| of which: prudential valuation adjustment | | | |
| of which: own CET1 instruments | | | |
| of which: goodwill net of tax, offset against hybrid capital and low-trigger loss-absorbing capital | (3,927) | 3,927 | |
| of which: intangible assets (net of related tax liabilities) | | | |
| of which: gains from the calculation of cash flow hedges | | | |
| of which: IRB shortfall of provisions to expected losses | | | |
| of which: gains on sales related to securitization transactions | | | |
| of which: gains/losses in connection with own credit risk | | | |
| of which: investments | | | |
| of which: expected loss amount for equity exposures under the PD/LGD approach | | | |
| of which: mortgage servicing rights | | | |
42a | Excess of the adjustments which are allocated to the common equity tier 1 capital | | | |
43 | Total regulatory adjustments to additional tier 1 capital | (3,927) | 3,927 | |
44 | Additional tier 1 capital (AT1) | 4,181 | 1,973 | |
45 | Tier 1 capital (T1 = CET1 + AT1) | 44,559 | (8,361) | |
46 | Directly issued qualifying tier 2 instruments plus related stock surplus⁴ | 11,242 | 0 | 7 |
47 | Directly issued capital instruments subject to phase-out from tier 2 | 998 | (998) | 8 |
48 | Tier 2 instruments (and CET1 and additional tier 1 instruments not included in rows 5 or 34) issued by subsidiaries and held by third parties (amount allowed in group tier 2) | | | |
49 | of which: instruments issued by subsidiaries subject to phase-out | | | |
50 | Provisions | | | |
51 | Tier 2 capital before regulatory adjustments | 12,239 | (998) | |
Additional regulatory information
UBS Group AG consolidated supplemental disclosures required under Basel III Pillar 3 regulations
Table 30: Composition of capital (continued)
| | Numbers phase-in | Effect of the transition phase | References¹ |
| CHF million, except where indicated | 31.12.15 | 31.12.15 | |
52 | Investments in own tier 2 instruments | (6) | 2 | 7, 8 |
53 | Reciprocal cross holdings in tier 2 instruments | | | |
53a | Qualifying interest where a controlling influence is exercised together with other owner (tier 2 instruments) | | | |
53b | Investments to be consolidated (tier 2 instruments) | | | |
54 | Investments in the capital of banking, financial and insurance entities that are outside the scope of regulatory consolidation, net of eligible short positions, where the bank does not own more than 10% of the issued common share capital of the entity (amount above the 10% threshold) | | | |
55 | Significant investments in the capital banking, financial and insurance entities that are outside the scope of regulatory consolidation (net of eligible short positions) | | | |
56 | National specific regulatory adjustments | | | |
56a | Excess of the adjustments which are allocated to the additional tier 1 capital | | | |
57 | Total regulatory adjustments to tier 2 capital | (6) | 2 | |
58 | Tier 2 capital (T2) | 12,233 | (996) | |
| of which: high-trigger loss-absorbing capital⁵ | 912 | | 13 |
| of which: low-trigger loss-absorbing capital⁴ | 10,325 | | 7 |
59 | Total capital (TC = T1 + T2) | 56,792 | (9,357) | |
| Amount with risk-weight pursuant the transitional arrangement (phase-in) | | (4,771) | |
| of which: net defined benefit pension assets | | (30) | |
| of which: DTA on temporary differences | | (4,741) | |
60 | Total risk-weighted assets | 212,302 | (4,771) | |
| Capital ratios and buffers | | | |
61 | Common equity tier 1 (as a percentage of risk-weighted assets) | 19.0 | | |
62 | Tier 1 (Pos 45 as a percentage of risk-weighted assets) | 21.0 | | |
63 | Total capital (pos 59 as a percentage of risk-weighted assets) | 26.8 | | |
64 | CET1 requirement (base capital, buffer capital and countercyclical buffer requirements) plus G-SIB buffer requirement, expressed as a percentage of risk-weighted assets | 7.5 | | |
65 | of which: capital buffer requirement | 2.9 | | |
66 | of which: bank-specific countercyclical buffer requirement | 0.2 | | |
67 | of which: G-SIB buffer requirement | | | |
68 | Common equity tier 1 available to meet buffers (as a percentage of risk-weighted assets) | 19.0 | | |
68a–f | Not applicable for systemically relevant banks according to FINMA RS 11/2 | | | |
72 | Non-significant investments in the capital of other financials | 1,074 | | |
73 | Significant investments in the common stock of financials | 800 | | |
74 | Mortgage servicing rights (net of related tax liability) | | | |
75 | Deferred tax assets arising from temporary differences (net of related tax liability) | 5,862 | | |
| Applicable caps on the inclusion of provisions in tier 2 | | | |
76 | Provisions eligible for inclusion in tier 2 in respect of exposures subject to standardised approach (prior to application of cap) | | | |
77 | Cap on inclusion of provisions in tier 2 under standardized approach | | | |
78 | Provisions eligible for inclusion in tier 2 in respect of exposures subject to internal ratings-based approach (prior to application of cap) | | | |
79 | Cap for inclusion of provisions in tier 2 under internal ratings-based approach | | | |
1 References link the lines of this table to the respective reference numbers provided in the column “References” in “Table 29: Reconciliation of accounting balance sheet to balance sheet under the regulatory scope of consolidation.” 2 The CHF 6,545 million (CHF 2,618 million and CHF 3,927 million) reported in line 8 includes goodwill on investments in associates of CHF 360 million and DTL on goodwill of CHF 55 million. The CHF 323 million reported in line 9 includes DTL on intangibles assets of CHF 5 million. 3 The CHF 7,468 million (CHF 2,988 million and CHF 4,480 million) deferred tax assets recognized for tax loss carry-forwards reported in line 10 differ from the CHF 7,093 million deferred tax assets shown in the line “Deferred tax assets” in Table 29 because the latter figure is shown after the offset of deferred tax liabilities for cash flow hedge gains (CHF 350 million) and other temporary differences, which are adjusted out in line 11 and other lines of this table respectively. 4 The CHF 11,242 million in the line 46 includes CHF 10,330 million low-trigger loss-absorbing tier 2 capital recognized in line “Debt issue” in table 29, which is shown net of CHF 4 million investments in own tier 2 instruments reported in the line 52 of this table and high-trigger loss-absorbing capital of CHF 912 million reported in line 58. 5 CHF 6,154 million and CHF 912 million reported in line 32 and 58 respectively of this report, includes the following positions: CHF 2,837 million and CHF 2,326 million recognized in the line “Debt issued” in table 29, CHF 1,134 million DCCP recognized in the line “Other liabilities” in table 29 and CHF 769 million recognized as a DCCP-related charge for regulatory capital purposes in the line 26b “Other deductions” of this table. 6 The CHF 2,598 million (CHF 702 million and CHF 1,896 million) deferred tax assets arising from temporary differences in line 20 differ from the CHF 5,742 million deferred tax assets on temporary differences shown in the line "Deferred tax assets" in Table 29 as the former relates only to the amount above the 10% threshold. |
▲
G-SIB indicators
The Financial Stability Board (FSB) determined that UBS is a global systemically important bank (G-SIB), using an indicator-based methodology adopted by the Basel Committee on Banking Supervision (BCBS). Based on published indicators, G-SIB are subject to additional CET1 capital buffer requirements in the range from 1.0% to 3.5%. These requirements will be phased in from 1 January 2016 to 31 December 2018 and become fully effective on 1 January 2019. In November 2015, the FSB determined that, based on the year-end 2014 indicators, the requirement for UBS Group is 1.0%. As our Swiss SRB Basel III capital requirements exceed the BCBS requirements including the G-SIB buffer, UBS is not affected by the above.
Banks that qualify as G-SIBs are required to disclose, as defined by the BCBS, the 12 indicators for assessing the systemic importance of G-SIBs. These 12 indicators are used for the G-SIB score calculation and cover the five categories size, cross-jurisdictional activity, inter-connectedness, substitutability/ financial institution infrastructure and complexity.
Our G-SIB indicators per 31 December 2015 will be available online by the end of April 2016.
® Refer to “Pillar 3, SEC filings & other disclosures” at www.ubs.com/investors for more information
Additional regulatory information
UBS AG consolidated supplemental disclosures required under SEC regulations
UBS AG consolidated supplemental disclosures required under SEC regulations
A – Introduction
The following pages contain supplemental UBS AG disclosures that are required under SEC regulations. UBS AG’s consolidated financial statements have been prepared in accordance with International Financial Reporting Standards (IFRS) as issued by the International Accounting Standards Board (IASB) and are denominated in Swiss francs (CHF), the reporting currency of UBS AG.
B – Selected financial data
The tables below provide information concerning the noon purchase rate for the Swiss franc, expressed in United States dollars, or USD, per one Swiss franc. The noon purchase rate is the rate in New York City for cable transfers in foreign currencies as certified for customs purposes by the Federal Reserve Bank of New York.
On 29 February 2016, the noon purchase rate was 1.0040 USD per 1 CHF.
Year ended 31 December | High | Low | Average rate (USD per 1 CHF)¹ | At period end |
2011 | 1.3706 | 1.0251 | 1.1398 | 1.0668 |
2012 | 1.1174 | 1.0043 | 1.0724 | 1.0923 |
2013 | 1.1292 | 1.0190 | 1.0826 | 1.1231 |
2014 | 1.1478 | 1.0066 | 1.0893 | 1.0066 |
2015 | 1.1781 | 0.9704 | 1.0368 | 0.9983 |
| | | | |
Month | High | Low | | |
September 2015 | 1.0401 | 1.0225 | | |
October 2015 | 1.0539 | 1.0086 | | |
November 2015 | 1.0149 | 0.9704 | | |
December 2015 | 1.0180 | 0.9713 | | |
January 2016 | 1.0028 | 0.9779 | | |
February 2016 | 1.0303 | 0.9802 | | |
1 The average of the noon purchase rates on the last business day of each full month during the relevant period. |
Additional regulatory information
UBS AG consolidated supplemental disclosures required under SEC regulations
Key figures | | | | | | |
| | As of or for the year ended |
CHF million, except where indicated | | 31.12.15 | 31.12.14 | 31.12.13 | 31.12.12 | 31.12.11 |
| | | | | | |
Results | | | | | | |
Operating income | | 30,605 | 28,026 | 27,732 | 25,423 | 27,788 |
Operating expenses | | 25,198 | 25,557 | 24,461 | 27,216 | 22,482 |
Operating profit / (loss) from continuing operations before tax | | 5,407 | 2,469 | 3,272 | (1,794) | 5,307 |
Net profit / (loss) attributable to UBS AG shareholders | | 6,235 | 3,502 | 3,172 | (2,480) | 4,138 |
| | | | | | |
Key performance indicators¹ | | | | | | |
Profitability | | | | | | |
Return on tangible equity (%) | | 13.5 | 8.2 | 8.0 | 1.6 | 11.9 |
Return on assets, gross (%) | | 3.1 | 2.8 | 2.5 | 1.9 | 2.1 |
Cost / income ratio (%) | | 82.0 | 90.9 | 88.0 | 106.6 | 80.7 |
Growth | | | | | | |
Net profit growth (%) | | 78.0 | 10.4 | | | (44.5) |
Net new money growth for combined wealth management businesses (%) | | 2.2 | 2.5 | 3.4 | 3.2 | 2.4 |
Resources | | | | | | |
Common equity tier 1 capital ratio (%, fully applied)² | | 15.4 | 14.2 | 12.8 | 9.8 | |
BIS tier 1 capital ratio, Basel 2.5 (%) | | | | | 21.3 | 15.9 |
BIS total capital ratio, Basel 2.5 (%) | | | | | 25.2 | 17.2 |
Swiss SRB leverage ratio (phase-in, %) | | 5.7 | 5.4 | 4.7 | 3.6 | |
| | | | | | |
Additional information | | | | | | |
Profitability | | | | | | |
Return on equity (RoE) (%) | | 11.7 | 7.0 | 6.7 | (5.1) | 9.1 |
Return on risk-weighted assets, gross (%)³ | | 14.1 | 12.4 | 11.4 | 12.0 | 13.7 |
Resources | | | | | | |
Total assets | | 943,256 | 1,062,327 | 1,013,355 | 1,259,797 | 1,416,962 |
Equity attributable to UBS AG shareholders | | 55,248 | 52,108 | 48,002 | 45,949 | 48,530 |
Common equity tier 1 capital (fully applied)² | | 32,042 | 30,805 | 28,908 | 25,182 | |
Common equity tier 1 capital (phase-in)² | | 41,516 | 44,090 | 42,179 | 40,032 | |
Risk-weighted assets (fully applied)² | | 208,186 | 217,158 | 225,153 | 258,113 | |
Risk-weighted assets (phase-in)² | | 212,609 | 221,150 | 228,557 | 261,800 | |
Common equity tier 1 capital ratio (%, phase-in)² | | 19.5 | 19.9 | 18.5 | 15.3 | |
Total capital ratio (%) (fully applied)² | | 21.0 | 19.0 | 15.4 | 11.4 | |
Total capital ratio (%) (phase-in)² | | 24.9 | 25.6 | 22.2 | 18.9 | |
Swiss SRB leverage ratio (fully applied, %) | | 4.9 | 4.1 | 3.4 | 2.4 | |
Swiss SRB leverage ratio denominator (fully applied)⁴ | | 898,251 | 999,124 | 1,015,306 | 1,206,214 | |
Swiss SRB leverage ratio denominator (phase-in)⁴ | | 904,518 | 1,006,001 | 1,022,924 | 1,216,561 | |
BIS tier 1 capital, Basel 2.5 | | | | | 40,982 | 38,370 |
BIS risk-weighted assets, Basel 2.5 | | | | | 192,505 | 240,962 |
Average equity of average assets (%) | | 5.0 | 4.8 | 4.0 | 3.4 | 3.2 |
Key figures (continued) | | | | | | |
| | As of or for the year ended |
CHF million, except where indicated | | 31.12.15 | 31.12.14 | 31.12.13 | 31.12.12 | 31.12.11 |
Other | | | | | | |
Invested assets (CHF billion)⁵ | | 2,689 | 2,734 | 2,390 | 2,230 | 2,088 |
Personnel (full-time equivalents) | | 58,131 | 60,155 | 60,205 | 62,628 | 64,820 |
Americas | | 20,816 | 20,951 | 21,317 | 21,995 | 22,924 |
of which: USA | | 19,897 | 19,715 | 20,037 | 20,833 | 21,746 |
Asia Pacific | | 7,348 | 7,385 | 7,116 | 7,426 | 7,690 |
Europe, Middle East and Africa | | 8,730 | 10,254 | 10,052 | 10,829 | 11,019 |
of which: United Kingdom | | 5,373 | 5,425 | 5,595 | 6,459 | 6,674 |
of which: Rest of Europe | | 3,181 | 4,663 | 4,303 | 4,202 | 4,182 |
of which: Middle East and Africa | | 176 | 166 | 153 | 167 | 162 |
Switzerland | | 21,238 | 21,564 | 21,720 | 22,378 | 23,188 |
Registered ordinary shares (number)⁶ | | 3,858,408,466 | 3,844,560,913 | 3,842,002,069 | 3,835,250,233 | 3,832,121,899 |
Treasury shares (number)⁶ | | 0 | 2,115,255 | 73,800,252 | 87,879,601 | 84,955,551 |
1 For the definitions of our key performance indicators, refer to the “Measurement of performance” section of this report. 2 Based on the Basel III framework as applicable for Swiss systemically relevant banks (SRBs). Refer to the "Capital management" section of this report for more information. 3 Based on phase-in risk-weighted assets. 4 Calculated in accordance with Swiss SRB rules. From 31 December 2015 onward, the Swiss SRB leverage ratio denominator calculation is fully aligned with the BIS Basel III rules. Prior-period figures are calculated in accordance with former Swiss SRB rules and are therefore not fully comparable. Refer to the "Capital management" section of this report for more information. 5 Total UBS AG invested assets includes invested assets for Personal & Corporate Banking. 6 Refer to the “UBS shares” section of this report for more information. |
Additional regulatory information
UBS AG consolidated supplemental disclosures required under SEC regulations
Income statement data | | | | | | |
| | For the year ended |
CHF million, except where indicated | | 31.12.15 | 31.12.14 | 31.12.13 | 31.12.12 | 31.12.11 |
Interest income | | 13,178 | 13,194 | 13,137 | 15,968 | 17,969 |
Interest expense | | (6,449) | (6,639) | (7,351) | (9,990) | (11,143) |
Net interest income | | 6,729 | 6,555 | 5,786 | 5,978 | 6,826 |
Credit loss (expense) / recovery | | (117) | (78) | (50) | (118) | (84) |
Net interest income after credit loss (expense) / recovery | | 6,612 | 6,477 | 5,736 | 5,860 | 6,742 |
Net fee and commission income | | 17,184 | 17,076 | 16,287 | 15,396 | 15,236 |
Net trading income | | 5,696 | 3,841 | 5,130 | 3,526 | 4,343 |
Other income | | 1,112 | 632 | 580 | 641 | 1,467 |
Total operating income | | 30,605 | 28,026 | 27,732 | 25,423 | 27,788 |
Total operating expenses | | 25,198 | 25,557 | 24,461 | 27,216 | 22,482 |
Operating profit / (loss) before tax | | 5,407 | 2,469 | 3,272 | (1,794) | 5,307 |
Tax expense / (benefit) | | (908) | (1,180) | (110) | 461 | 901 |
Net profit / (loss) | | 6,314 | 3,649 | 3,381 | (2,255) | 4,406 |
Net profit / (loss) attributable to preferred noteholders | | 77 | 142 | 204 | 220 | |
Net profit / (loss) attributable to non-controlling interests | | 3 | 5 | 5 | 5 | 268 |
Net profit / (loss) attributable to UBS AG shareholders | | 6,235 | 3,502 | 3,172 | (2,480) | 4,138 |
Cost / income ratio (%)¹ | | 82.0 | 90.9 | 88.0 | 106.6 | 80.7 |
Rates of return (%) | | | | | | |
Return on equity attributable to UBS AG shareholders | | 11.7 | 7.0 | 6.7 | (5.1) | 9.1 |
Return on average equity | | 11.7 | 7.0 | 6.7 | (5.0) | 9.1 |
Return on average assets | | 0.6 | 0.3 | 0.3 | (0.2) | 0.3 |
1 Operating expenses / operating income before credit loss expense. |
Balance sheet data |
CHF million | 31.12.15 | 31.12.14 | 31.12.13 | 31.12.12 | 31.12.11 |
Assets | | | | | |
Total assets | 943,256 | 1,062,327 | 1,013,355 | 1,259,797 | 1,416,962 |
Cash and balances with central banks | 91,306 | 104,073 | 80,879 | 66,383 | 40,638 |
Due from banks | 11,866 | 13,334 | 13,874 | 21,220 | 23,218 |
Cash collateral on securities borrowed | 25,584 | 24,063 | 27,496 | 37,372 | 58,763 |
Reverse repurchase agreements | 67,893 | 68,414 | 91,563 | 130,941 | 213,501 |
Trading portfolio assets | 124,047 | 138,156 | 122,848 | 160,564 | 181,525 |
of which: assets pledged as collateral which may be sold or repledged by counterparties | 51,943 | 56,018 | 42,449 | 44,698 | 39,936 |
Positive replacement values | 167,435 | 256,978 | 254,084 | 418,957 | 486,584 |
Cash collateral receivables on derivative instruments | 23,763 | 30,979 | 26,548 | 30,413 | 41,322 |
Loans | 312,723 | 315,984 | 286,959 | 279,901 | 266,604 |
Financial investments available-for-sale | 62,543 | 57,159 | 59,525 | 66,230 | 53,174 |
Other assets | 22,249 | 23,069 | 20,228 | 17,244 | 15,492 |
Liabilities | | | | | |
Due to banks | 11,836 | 10,492 | 12,862 | 23,024 | 30,201 |
Cash collateral on securities lent | 8,029 | 9,180 | 9,491 | 9,203 | 8,136 |
Repurchase agreements | 9,653 | 11,818 | 13,811 | 38,557 | 102,429 |
Trading portfolio liabilities | 29,137 | 27,958 | 26,609 | 34,247 | 39,480 |
Negative replacement values | 162,430 | 254,101 | 248,079 | 395,260 | 473,400 |
Cash collateral payables on derivative instruments | 38,282 | 42,372 | 44,507 | 71,148 | 67,114 |
Financial liabilities designated at fair value | 62,995 | 75,297 | 69,901 | 91,901 | 88,982 |
Due to customers | 402,522 | 410,979 | 390,825 | 373,459 | 342,409 |
Debt issued | 82,359 | 91,207 | 81,586 | 104,837 | 140,617 |
Other liabilities | 74,606 | 70,392 | 62,777 | 66,523 | 69,633 |
Equity attributable to UBS AG shareholders | 55,248 | 52,108 | 48,002 | 45,949 | 48,530 |
Ratio of earnings to fixed charges
The following table sets forth UBS AG’s ratio of earnings to fixed charges on an IFRS basis for the periods indicated. The ratios are calculated based on earnings from continuing operations. Ratios of earnings to fixed charges and preferred share dividends are not presented as there were no mandatory preferred share dividends in any of the periods indicated.
| For the year ended |
| 31.12.15 | 31.12.14 | 31.12.13 | 31.12.12 | 31.12.11 |
| 1.76 | 1.33 | 1.41 | 0.83 | 1.42 |
Additional regulatory information
UBS AG consolidated supplemental disclosures required under SEC regulations
C – Information on the company
Property, plant and equipment
As of 31 December 2015, UBS AG operated about 856 business and banking locations worldwide, of which approximately 41% were in Switzerland, 41% in the Americas, 11% in the rest of Europe, Middle East and Africa and 7% in Asia Pacific. Of the business and banking locations in Switzerland, 33% were owned directly by UBS AG, with the remainder, along with most of UBS AG’s offices outside Switzerland, being held under commercial leases. These premises are subject to continuous maintenance and upgrading and are considered suitable and adequate for current and anticipated operations.
D – Information required by industry guide 3
Selected statistical information
The following tables set forth select statistical information regarding the UBS AG’s banking operations extracted from the financial statements. Unless otherwise indicated, average balances for the years ended 31 December 2015, 31 December 2014 and 31 December 2013 are calculated from monthly data. The distinction between domestic and foreign is generally based on the booking location. For loans, this method is not significantly different from an analysis based on the domicile of the borrower.
Additional regulatory information
UBS AG consolidated supplemental disclosures required under SEC regulations
Average balances and interest rates
| | 31.12.15 | | 31.12.14 | | 31.12.13 |
CHF million, except where indicated | | Average balance | Interest income | Average yield (%) | | Average balance | Interest income | Average yield (%) | | Average balance | Interest income | Average yield (%) |
Assets | | | | | | | | | | | | |
Due from banks | | | | | | | | | | | | |
Domestic | | 3,525 | 5 | 0.1 | | 3,269 | 8 | 0.2 | | 3,051 | 8 | 0.3 |
Foreign | | 10,822 | 60 | 0.6 | | 16,692 | 95 | 0.6 | | 16,420 | 82 | 0.5 |
Cash collateral on securities borrowed and reverse repurchase agreements | | | | | | | | | | | | |
Domestic | | 6,415 | 14¹ | 0.2 | | 7,374 | 4 | 0.1 | | 11,479 | 10 | 0.1 |
Foreign | | 138,961 | 614¹ | 0.4 | | 133,640 | 463 | 0.3 | | 162,479 | 575 | 0.4 |
Trading portfolio assets | | | | | | | | | | | | |
Domestic | | 5,016 | 159 | 3.2 | | 5,105 | 209 | 4.1 | | 5,189 | 177 | 3.4 |
Foreign taxable | | 121,558 | 2,912 | 2.4 | | 118,038 | 2,988 | 2.5 | | 119,894 | 2,736 | 2.3 |
Foreign non-taxable | | 0 | 0 | | | 0 | 0 | | | 0 | 0 | |
Foreign total | | 121,558 | 2,912 | 2.4 | | 118,038 | 2,988 | 2.5 | | 119,894 | 2,736 | 2.3 |
Cash collateral receivables on derivative instruments | | | | | | | | | | | | |
Domestic | | 249 | 3 | 1.2 | | 113 | 1 | 0.9 | | 155 | 0 | 0.0 |
Foreign | | 29,469 | 59 | 0.2 | | 27,920 | 54 | 0.2 | | 29,244 | 70 | 0.2 |
Financial assets designated at fair value | | | | | | | | | | | | |
Domestic | | 377 | 1 | 0.3 | | 672 | 1 | 0.1 | | 414 | 0 | 0.0 |
Foreign | | 4,689 | 193 | 4.1 | | 4,969 | 207 | 4.2 | | 10,113 | 364 | 3.6 |
Loans | | | | | | | | | | | | |
Domestic | | 194,032 | 3,646 | 1.9 | | 193,026 | 3,780 | 2.0 | | 189,969 | 3,974 | 2.1 |
Foreign | | 120,664 | 2,510 | 2.1 | | 109,137 | 2,520 | 2.3 | | 100,027 | 2,420 | 2.4 |
Financial investments available-for-sale | | | | | | | | | | | | |
Domestic | | 20,037 | 63 | 0.3 | | 2,006 | 8 | 0.4 | | 1,980 | 11 | 0.6 |
Foreign taxable | | 43,131 | 328 | 0.8 | | 52,642 | 307 | 0.6 | | 60,093 | 310 | 0.5 |
Foreign non-taxable | | 0 | 0 | | | 0 | 0 | | | 0 | 0 | |
Foreign total | | 43,131 | 328 | 0.8 | | 52,642 | 307 | 0.6 | | 60,093 | 310 | 0.5 |
Other interest-earning assets | | | | | | | | | | | | |
Domestic | | 0 | 0 | | | 0 | 0 | | | 0 | 0 | |
Foreign | | 12,749 | 526 | 4.1 | | 12,024 | 477 | 4.0 | | 8,953 | 430 | 4.8 |
Total interest-earning assets | | 711,695 | 11,093 | 1.6 | | 686,626 | 11,123 | 1.6 | | 719,460 | 11,168 | 1.6 |
Net interest income on swaps | | | 1,630 | | | | 1,613 | | | | 1,528 | |
Interest income on off-balance sheet securities and other | | | 455¹ | | | | 458 | | | | 441 | |
Interest income and average interest-earning assets | | 711,695 | 13,178 | 1.9 | | 686,626 | 13,194 | 1.9 | | 719,460 | 13,137 | 1.8 |
Non-interest-earning assets | | | | | | | | | | | | |
Positive replacement values | | 213,913 | | | | 232,739 | | | | 337,781 | | |
Fixed assets | | 7,149 | | | | 6,383 | | | | 6,054 | | |
Other | | 126,820 | | | | 127,812 | | | | 115,921 | | |
Total average assets | | 1,059,576 | | | | 1,053,561 | | | | 1,179,216 | | |
Average balances and interest rates (continued) | | 31.12.15 | | 31.12.14 | | 31.12.13 |
CHF million, except where indicated | | Average balance | Interest expense | Average interest rate (%) | | Average balance | Interest expense | Average interest rate (%) | | Average balance | Interest expense | Average interest rate (%) |
Liabilities and equity | | | | | | | | | | | | |
Due to banks | | | | | | | | | | | | |
Domestic | | 9,571 | 11 | 0.1 | | 8,932 | 16 | 0.2 | | 13,859 | 37 | 0.3 |
Foreign | | 2,480 | 11 | 0.4 | | 3,691 | 14 | 0.4 | | 4,073 | 24 | 0.6 |
Cash collateral on securities lent and repurchase agreements | | | | | | | | | | | | |
Domestic | | 3,413 | 2² | 0.1 | | 5,328 | 1 | 0.0 | | 5,344 | 2 | 0.0 |
Foreign | | 71,129 | 442² | 0.6 | | 58,639 | 338 | 0.6 | | 65,088 | 344 | 0.5 |
Trading portfolio liabilities | | | | | | | | | | | | |
Domestic | | 569 | 5 | 0.9 | | 638 | 14 | 2.2 | | 628 | 12 | 1.9 |
Foreign | | 31,426 | 1,665 | 5.3 | | 28,737 | 1,789 | 6.2 | | 29,874 | 1,834 | 6.1 |
Cash collateral payables on derivative instruments | | | | | | | | | | | | |
Domestic | | 993 | 1 | 0.1 | | 612 | 0 | 0.0 | | 540 | 0 | 0.0 |
Foreign | | 41,499 | 57 | 0.1 | | 42,595 | 45 | 0.1 | | 58,693 | 65 | 0.1 |
Financial liabilities designated at fair value | | | | | | | | | | | | |
Domestic | | 2,057 | 6 | 0.3 | | 1,747 | 13 | 0.7 | | 1,207 | 9 | 0.7 |
Foreign | | 65,446 | 724 | 1.1 | | 68,928 | 906 | 1.3 | | 79,182 | 1,188 | 1.5 |
Due to customers | | | | | | | | | | | | |
Domestic demand deposits | | 126,048 | (19) | 0.0 | | 130,703 | 43 | 0.0 | | 126,953 | 60 | 0.0 |
Domestic savings deposits | | 96,848 | 70 | 0.1 | | 97,825 | 172 | 0.2 | | 95,937 | 246 | 0.3 |
Domestic time deposits | | 15,930 | 261 | 1.6 | | 7,593 | 12 | 0.2 | | 4,379 | 15 | 0.3 |
Domestic total | | 238,825 | 312 | 0.1 | | 236,121 | 227 | 0.1 | | 227,268 | 321 | 0.1 |
Foreign | | 159,027 | 312 | 0.2 | | 159,170 | 340 | 0.2 | | 155,312 | 373 | 0.2 |
Short-term debt | | | | | | | | | | | | |
Domestic | | 873 | 4 | 0.5 | | 1,270 | 2 | 0.2 | | 1,703 | 3 | 0.2 |
Foreign | | 26,425 | 107 | 0.4 | | 26,734 | 101 | 0.4 | | 33,363 | 170 | 0.5 |
Long-term debt | | | | | | | | | | | | |
Domestic | | 15,182 | 471 | 3.1 | | 14,937 | 447 | 3.0 | | 11,823 | 281 | 2.4 |
Foreign | | 47,941 | 1,717 | 3.6 | | 43,264 | 1,833 | 4.2 | | 50,053 | 2,131 | 4.3 |
Other interest-bearing liabilities | | | | | | | | | | | | |
Domestic | | 0 | 0 | | | 0 | 0 | | | 0 | 0 | |
Foreign | | 39,968 | 58 | 0.1 | | 35,503 | 58 | 0.2 | | 35,706 | 67 | 0.2 |
Total interest-bearing liabilities | | 756,824 | 5,904 | 0.8 | | 736,847 | 6,145 | 0.8 | | 773,717 | 6,863 | 0.9 |
Interest expense on off-balance sheet securities and other | | | 546² | | | | 495 | | | | 489 | |
Interest expense and average interest-bearing liabilities | | 756,824 | 6,449 | 0.9 | | 736,847 | 6,640 | 0.9 | | 773,717 | 7,351 | 1.0 |
Non-interest-bearing liabilities | | | | | | | | | | | | |
Negative replacement values | | 210,551 | | | | 229,286 | | | | 321,681 | | |
Other | | 37,041 | | | | 35,359 | | | | 34,188 | | |
Total liabilities | | 1,004,416 | | | | 1,001,493 | | | | 1,129,586 | | |
Total equity | | 55,160 | | | | 52,068 | | | | 49,630 | | |
Total average liabilities and equity | | 1,059,576 | | | | 1,053,561 | | | | 1,179,216 | | |
Net interest income | | | 6,729 | | | | 6,555 | | | | 5,786 | |
Net yield on interest-earning assets | | | | 0.9 | | | | 1.0 | | | | 0.8 |
1 Includes negative interest, including fees, on securities lent and repurchase agreements. 2 Includes negative interest, including fees, on securities borrowed and reverse repurchase agreements. |
Additional regulatory information
UBS AG consolidated supplemental disclosures required under SEC regulations
Average balances and interest rates (continued)
Average rates earned and paid on assets and liabilities can change from period to period based on the changes in interest rates in general, but are also affected by changes in the currency mix included in the assets and liabilities. This is especially true for foreign assets and liabilities. Tax-exempt income is not recorded on a tax-equivalent basis. For all three years presented, tax-exempt income is considered to be insignificant and the impact from such income is therefore negligible.
Analysis of changes in interest income and expense
| | 2015 compared with 2014 | | 2014 compared with 2013 |
| | Increase / (decrease) due to changes in | | | | Increase / (decrease) due to changes in | | |
CHF million | | Average volume | Average interest rate | | Net change | | Average volume | Average interest rate | | Net change |
Interest income from interest-earning assets | | | | | | | | | | |
Due from banks | | | | | | | | | | |
Domestic | | 1 | (5) | | (4) | | 1 | (1) | | 0 |
Foreign | | (35) | 1 | | (34) | | 1 | 11 | | 12 |
Cash collateral on securities borrowed and reverse repurchase agreements | | | | | | | | | | |
Domestic | | (1) | 11 | | 10 | | (4) | (2) | | (6) |
Foreign | | 16 | 135 | | 151 | | (115) | 4 | | (111) |
Trading portfolio assets | | | | | | | | | | |
Domestic | | (4) | (46) | | (50) | | (3) | 35 | | 32 |
Foreign taxable | | 88 | (164) | | (76) | | (43) | 295 | | 252 |
Foreign non-taxable | | 0 | 0 | | 0 | | 0 | 0 | | 0 |
Foreign total | | 88 | (164) | | (76) | | (43) | 295 | | 252 |
Cash collateral receivables on derivative instruments | | | | | | | | | | |
Domestic | | 1 | 1 | | 2 | | 0 | 1 | | 0 |
Foreign | | 3 | 2 | | 5 | | (3) | (12) | | (15) |
Financial assets designated at fair value | | | | | | | | | | |
Domestic | | 0 | 0 | | 0 | | 0 | 1 | | 1 |
Foreign | | (12) | (3) | | (15) | | (185) | 28 | | (157) |
Loans | | | | | | | | | | |
Domestic | | 20 | (153) | | (133) | | 64 | (258) | | (194) |
Foreign | | 265 | (275) | | (10) | | 219 | (120) | | 99 |
Financial investments available-for-sale | | | | | | | | | | |
Domestic | | 72 | (17) | | 55 | | 0 | (3) | | (3) |
Foreign taxable | | (57) | 78 | | 21 | | (37) | 34 | | (3) |
Foreign non-taxable | | 0 | 0 | | 0 | | 0 | 0 | | 0 |
Foreign total | | (57) | 78 | | 21 | | (37) | 34 | | (3) |
Other interest-bearing assets | | | | | | | | | | |
Domestic | | 0 | 0 | | 0 | | 0 | 0 | | 0 |
Foreign | | 29 | 19 | | 48 | | 147 | (99) | | 48 |
Interest income | | | | | | | | | | |
Domestic | | 89 | (209) | | (120) | | 58 | (228) | | (170) |
Foreign | | 297 | (207) | | 90 | | (16) | 140 | | 124 |
Total interest income from interest-earning assets | | 386 | (416) | | (30) | | 42 | (87) | | (45) |
Net interest on swaps | | | | | 17 | | | | | 86 |
Interest income on off-balance sheet securities and other | | | | | (4) | | | | | 17 |
Total interest income | | | | | (17) | | | | | 57 |
Additional regulatory information
UBS AG consolidated supplemental disclosures required under SEC regulations
Analysis of changes in interest income and expense (continued) | | 2015 compared with 2014 | | 2014 compared with 2013 |
| | Increase / (decrease) due to changes in | | | | Increase / (decrease) due to changes in | | |
CHF million | | Average volume | Average interest rate | | Net change | | Average volume | Average interest rate | | Net change |
Interest expense on interest-bearing liabilities | | | | | | | | | | |
Due to banks | | | | | | | | | | |
Domestic | | 1 | (6) | | (5) | | (15) | (6) | | (21) |
Foreign | | (5) | 2 | | (3) | | (2) | (7) | | (9) |
Cash collateral on securities lent and repurchase agreements | | | | | | | | | | |
Domestic | | 0 | 0 | | 0 | | 0 | 0 | | 0 |
Foreign | | 75 | 30 | | 105 | | (32) | 26 | | (6) |
Trading portfolio liabilities | | | | | | | | | | |
Domestic | | (2) | (8) | | (10) | | 0 | 2 | | 2 |
Foreign | | 167 | (291) | | (124) | | (69) | 24 | | (45) |
Cash collateral payables on derivative instruments | | | | | | | | | | |
Domestic | | 0 | 1 | | 1 | | 0 | 0 | | 0 |
Foreign | | (1) | 13 | | 12 | | (16) | (4) | | (20) |
Financial liabilities designated at fair value | | | | | | | | | | |
Domestic | | 2 | (9) | | (7) | | 4 | 0 | | 4 |
Foreign | | (45) | (137) | | (182) | | (154) | (128) | | (282) |
Due to customers | | | | | | | | | | |
Domestic demand deposits | | 0 | (62) | | (62) | | 0 | (18) | | (18) |
Domestic savings deposits | | (2) | (100) | | (102) | | 6 | (80) | | (74) |
Domestic time deposits | | 17 | 232 | | 249 | | 10 | (13) | | (3) |
Domestic total | | 15 | 70 | | 85 | | 16 | (111) | | (95) |
Foreign | | 0 | (29) | | (29) | | 8 | (41) | | (33) |
Short-term debt | | | | | | | | | | |
Domestic | | (1) | 3 | | 2 | | (1) | (1) | | (2) |
Foreign | | (1) | 7 | | 6 | | (33) | (36) | | (69) |
Long-term debt | | | | | | | | | | |
Domestic | | 7 | 18 | | 25 | | 75 | 91 | | 166 |
Foreign | | 196 | (312) | | (116) | | (292) | (6) | | (298) |
Other interest-bearing liabilities | | | | | | | | | | |
Domestic | | 0 | 0 | | 0 | | 0 | 0 | | 0 |
Foreign | | 9 | (9) | | 0 | | 0 | (9) | | (9) |
Interest expense | | | | | | | | | | |
Domestic | | 22 | 68 | | 90 | | 79 | (25) | | 54 |
Foreign | | 395 | (727) | | (332) | | (590) | (182) | | (772) |
Total interest expense on interest-bearing liabilities | | 417 | (658) | | (241) | | (511) | (206) | | (718) |
Interest expense on off-balance sheet securities and other | | | | | 51 | | | | | 6 |
Total interest expense | | | | | (190) | | | | | (712) |
The following table analyzes average deposits and average rates on each deposit category listed below for the years ended 31 December 2015, 2014 and 2013. The geographic allocation is based on the location of the office or branch where the deposit is made. Deposits by foreign depositors in domestic offices were CHF 72,544 million, CHF 76,391 million and CHF 76,246 million at 31 December 2015, 31 December 2014 and 31 December 2013, respectively.
| | 31.12.15 | | 31.12.14 | | 31.12.13 |
CHF million, except where indicated | | Average deposits | Average rate (%) | | Average deposits | Average rate (%) | | Average deposits | Average rate (%) |
Banks | | | | | | | | | |
Domestic offices | | | | | | | | | |
Demand deposits | | 5,261 | (0.2) | | 5,149 | (0.1) | | 8,513 | (0.1) |
Time deposits | | 4,310 | 0.5 | | 3,783 | 0.6 | | 5,346 | 0.8 |
Total domestic offices | | 9,571 | 0.1 | | 8,932 | 0.2 | | 13,859 | 0.3 |
Foreign offices | | | | | | | | | |
Interest-bearing deposits | | 2,437 | 0.4 | | 3,691 | 0.4 | | 3,763 | 0.6 |
Total due to banks¹ | | 12,007 | 0.2 | | 12,624 | 0.2 | | 17,622 | 0.3 |
| | | | | | | | | |
Customer accounts | | | | | | | | | |
Domestic offices | | | | | | | | | |
Demand deposits | | 126,048 | 0.0 | | 130,703 | 0.0 | | 126,953 | 0.0 |
Savings deposits | | 96,848 | 0.1 | | 97,825 | 0.2 | | 95,937 | 0.3 |
Time deposits | | 15,930 | 0.1 | | 7,593 | 0.2 | | 4,379 | 0.3 |
Total domestic offices | | 238,825 | 0.1 | | 236,121 | 0.1 | | 227,268 | 0.1 |
Foreign offices | | | | | | | | | |
Demand deposits | | 52,406 | 0.0 | | 49,098 | 0.0 | | 43,954 | 0.0 |
Time and savings deposits | | 106,622 | 0.2 | | 110,072 | 0.3 | | 111,358 | 0.3 |
Total foreign offices | | 159,027 | 0.2 | | 159,170 | 0.2 | | 155,312 | 0.2 |
Total due to customers | | 397,853 | 0.2 | | 395,292 | 0.1 | | 382,580 | 0.2 |
1 Due to banks is considered to represent short-term borrowings to the extent that the total Due to banks exceeds total Due from banks, without differentiating between domestic and foreign offices. The remainder of total Due to banks is considered to represent deposits for the purpose of this disclosure. |
As of 31 December 2015, the maturity of time deposits was as follows:
CHF million | | | | | | | | Domestic | Foreign |
Within 3 months | | | | | | | | 16,145 | 39,735 |
3 to 6 months | | | | | | | | 887 | 1,982 |
6 to 12 months | | | | | | | | 314 | 812 |
1 to 5 years | | | | | | | | 238 | 2,399 |
Over 5 years | | | | | | | | 5,242 | 3,965 |
Total time deposits | | | | | | | | 22,826 | 48,893 |
Additional regulatory information
UBS AG consolidated supplemental disclosures required under SEC regulations
| | Short-term debt | | Due to banks¹ | | Repurchase agreements² |
CHF million, except where indicated | | 31.12.15 | 31.12.14 | 31.12.13 | | 31.12.15 | 31.12.14 | 31.12.13 | | 31.12.15 | 31.12.14 | 31.12.13 |
Period-end balance | | 21,215 | 27,363 | 27,633 | | 0 | 0 | 0 | | 71,775 | 54,625 | 41,160 |
Average balance | | 27,298 | 28,004 | 35,067 | | 44 | 0 | 309 | | 65,118 | 52,865 | 61,251 |
Maximum month-end balance | | 31,911 | 33,674 | 44,789 | | 570 | 0 | 1,370 | | 80,372 | 65,033 | 76,014 |
Average interest rate during the period (%) | | 0.4 | 0.4 | 0.5 | | 0.2 | 0.0 | 0.3 | | 0.3 | 0.2 | 0.2 |
Average interest rate at period-end (%) | | 0.5 | 0.2 | 0.4 | | 0.0 | 0.0 | 0.0 | | 0.2 | 0.2 | 0.2 |
1 Amounts due to banks are presented net of amounts due from banks in order to reflect short-term borrowings. The difference between the gross Due to banks amount and the amount disclosed here is presented as deposits from banks on the preceding page. 2 Repurchase agreements are presented on a gross basis, and therefore, for the purpose of this disclosure, do not reflect the effect of netting permitted under IFRS. |
Contractual maturities of investments in debt instruments available-for-sale¹˒² | | | |
| | Within 1 year | | 1 up to 5 years | | 5 to 10 years | | Over 10 years | | Total |
CHF million, except percentages | | Amount | Yield (%) | | Amount | Yield (%) | | Amount | Yield (%) | | Amount | Yield (%) | | |
31 December 2015 | | | | | | | | | | | | | | |
Swiss national government and agencies | | 701 | (0.83) | | | | | 1 | 4.00 | | | | | 702 |
US Treasury and agencies | | 11,171 | 0.39 | | 6,856 | 1.29 | | | | | | | | 18,027 |
Foreign governments and official institutions | | 13,966 | 0.21 | | 11,049 | 0.64 | | 104 | 1.33 | | | | | 25,119 |
Corporate debt securities | | 6,062 | 0.42 | | 8,118 | 0.87 | | 264 | 1.27 | | | | | 14,443 |
Mortgage-backed securities | | | | | 0 | 5.20 | | | | | 3,396 | 1.74 | | 3,396 |
Total fair value³ | | 31,900 | | | 26,023 | | | 369 | | | 3,396 | | | 61,688 |
| | | | | | | | | | | | | | |
| | Within 1 year | | 1 up to 5 years | | 5 to 10 years | | Over 10 years | | Total |
CHF million, except percentages | | Amount | Yield (%) | | Amount | Yield (%) | | Amount | Yield (%) | | Amount | Yield (%) | | |
31 December 2014 | | | | | | | | | | | | | | |
Swiss national government and agencies | | 41 | 0.48 | | | | | 1 | 4.00 | | | | | 43 |
US Treasury and agencies | | 4,873 | 0.23 | | 8,317 | 1.02 | | | | | | | | 13,189 |
Foreign governments and official institutions | | 14,072 | 0.31 | | 13,758 | 0.74 | | 243 | 1.25 | | | | | 28,072 |
Corporate debt securities | | 2,089 | 0.45 | | 8,489 | 0.84 | | 280 | 1.33 | | | | | 10,858 |
Mortgage-backed securities | | | | | 0 | 4.82 | | 0 | 4.42 | | 4,029 | 1.34 | | 4,029 |
Total fair value³ | | 21,075 | | | 30,563 | | | 525 | | | 4,029 | | | 56,192 |
| | | | | | | | | | | | | | |
| | Within 1 year | | 1 up to 5 years | | 5 to 10 years | | Over 10 years | | Total |
CHF million, except percentages | | Amount | Yield (%) | | Amount | Yield (%) | | Amount | Yield (%) | | Amount | Yield (%) | | |
31 December 2013 | | | | | | | | | | | | | | |
Swiss national government and agencies | | | | | 43 | 0.46 | | 1 | 3.55 | | | | | 44 |
US Treasury and agencies | | 849 | 0.17 | | 13,010 | 0.36 | | 3 | 3.30 | | | | | 13,861 |
Foreign governments and official institutions | | 25,483 | 0.27 | | 7,277 | 0.55 | | 63 | 0.98 | | 19 | 12.16 | | 32,842 |
Corporate debt securities | | 743 | 0.52 | | 6,873 | 0.80 | | 178 | 0.85 | | 1 | 6.60 | | 7,795 |
Mortgage-backed securities | | | | | | | | 0 | 4.71 | | 4,017 | 2.09 | | 4,017 |
Total fair value³ | | 27,075 | | | 27,202 | | | 245 | | | 4,037 | | | 58,559 |
1 Debt instruments without fixed maturities are not disclosed in this table. 2 Average yields are calculated on an amortized cost basis. 3 Includes investments in debt instruments as of 31 December 2015 issued by US government and government agencies of CHF 21,424 million (31 December 2014: CHF 17,219 million, 31 December 2013: CHF 17,876 million), the German government of CHF 8,583 million (31 December 2014: CHF 10,145 million, 31 December 2013: CHF 6,733 million), the French government of CHF 3,566 million (31 December 2014: CHF 5,351 million, 31 December 2013: CHF 5,601 million) and the UK government of CHF 2,782 million (31 December 2014: CHF 2,348 million, 31 December 2013: CHF 8,089 million). |
Due from banks and loans (gross)
UBS AG’s lending portfolio is widely diversified across industry sectors. CHF 186.7 billion (57.4% of the total) consists of loans to thousands of private households, predominantly in Switzerland, and mostly secured by mortgages, financial collateral or other assets. Exposure to banks and financial institutions amounted to CHF 74.3 billion (22.9% of the total). Exposure to banks includes money market deposits with highly rated institutions. Excluding banks and financial institutions, the largest industry sector exposure as of 31 December 2015 was CHF 23.2 billion (7.1% of the total) to Services. For further discussion of the loan portfolio, refer to the “Risk management and control” section of this report.
The table below illustrates the diversification of the loan portfolio among industry sectors as of 31 December 2015, 2014, 2013, 2012 and 2011. The industry categories presented are consistent with the classification of loans for reporting to the Swiss Financial Market Supervisory Authority (FINMA) and the Swiss National Bank. Loans designated at fair value and loans held in the trading portfolio are excluded from the tables below.
CHF million | 31.12.15 | 31.12.14 | 31.12.13 | 31.12.12 | 31.12.11 |
Domestic | | | | | |
Banks | 772 | 1,157 | 736 | 532 | 566 |
Chemicals | 308 | 392 | 382 | 300 | 377 |
Construction | 1,520 | 1,418 | 1,429 | 1,360 | 1,292 |
Electricity, gas and water supply | 234 | 260 | 255 | 351 | 260 |
Financial services | 6,061 | 6,693 | 4,643 | 4,265 | 4,257 |
Food and beverages | 208 | 206 | 241 | 284 | 276 |
Hotels and restaurants | 1,647 | 1,696 | 1,817 | 1,745 | 1,831 |
Manufacturing | 2,012 | 2,319 | 2,512 | 2,976 | 3,252 |
Mining | 23 | 34 | 36 | 45 | 35 |
Private households | 123,967 | 125,461 | 124,569 | 123,167 | 120,671 |
Public authorities | 1,609 | 2,098 | 2,415 | 2,708 | 2,992 |
Real estate and rentals | 13,707 | 14,549 | 14,511 | 13,682 | 13,169 |
Retail and wholesale | 3,687 | 4,169 | 3,784 | 4,345 | 4,433 |
Services | 5,250 | 4,794 | 5,330 | 5,862 | 5,770 |
Transport, storage and communication | 1,876 | 1,964 | 2,013 | 1,728 | 1,414 |
Other | 697 | 732 | 752 | 830 | 769 |
Total domestic | 163,578 | 167,940 | 165,426 | 164,180 | 161,364 |
Foreign | | | | | |
Banks | 11,097 | 12,190 | 13,201 | 20,711 | 22,669 |
Chemicals | 113 | 75 | 178 | 254 | 392 |
Construction | 635 | 645 | 1,132 | 1,731 | 750 |
Electricity, gas and water supply | 706 | 1,100 | 1,337 | 1,205 | 746 |
Financial services | 56,414 | 57,645 | 43,125 | 40,650 | 38,802 |
Food and beverages | 65 | 56 | 63 | 45 | 49 |
Hotels and restaurants | 148 | 120 | 181 | 347 | 372 |
Manufacturing | 1,958 | 1,961 | 1,850 | 1,828 | 1,955 |
Mining | 1,466 | 1,345 | 1,175 | 1,279 | 1,979 |
Private households | 62,695 | 60,466 | 49,920 | 46,458 | 41,045 |
Public authorities | 1,272 | 1,413 | 1,322 | 4,319 | 5,459 |
Real estate and rentals | 2,213 | 2,517 | 2,995 | 2,721 | 2,158 |
Retail and wholesale | 1,975 | 1,924 | 1,791 | 2,063 | 2,044 |
Services | 17,924 | 17,470 | 14,733 | 10,735 | 8,529 |
Transport, storage and communication | 2,858 | 3,017 | 2,809 | 3,021 | 2,068 |
Other | 163 | 142 | 361 | 301 | 281 |
Total foreign | 161,703 | 162,086 | 136,174 | 137,669 | 129,300 |
Total gross | 325,281 | 330,027 | 301,601 | 301,849 | 290,664 |
Additional regulatory information
UBS AG consolidated supplemental disclosures required under SEC regulations
Due from banks and loans (gross) (continued)
The table below analyzes UBS AG’s mortgage portfolio by client domicile and type of mortgage as of 31 December 2015, 2014, 2013, 2012 and 2011. Mortgages are included in the industry categories mentioned on the previous page.
CHF million | 31.12.15 | 31.12.14 | 31.12.13 | 31.12.12 | 31.12.11 |
Mortgages | | | | | |
Domestic | 144,230 | 146,637 | 144,852 | 142,143 | 138,204 |
Foreign | 18,887 | 18,112 | 15,235 | 12,311 | 8,818 |
Total gross mortgages | 163,117 | 164,748 | 160,086 | 154,454 | 147,022 |
| | | | | |
Mortgages | | | | | |
Residential | 141,608 | 142,380 | 137,370 | 132,033 | 125,775 |
Commercial | 21,509 | 22,368 | 22,716 | 22,421 | 21,247 |
Total gross mortgages | 163,117 | 164,748 | 160,086 | 154,454 | 147,022 |
▲
Due from banks and loan maturities (gross) | | | | |
CHF million | Within 1 year | 1 to 5 years | Over 5 years | Total |
Domestic | | | | |
Banks | 772 | 0 | 0 | 772 |
Mortgages | 60,404 | 49,062 | 34,764 | 144,230 |
Other loans | 15,196 | 2,555 | 824 | 18,576 |
Total domestic | 76,373 | 51,617 | 35,588 | 163,578 |
Foreign | | | | |
Banks | 11,038 | 34 | 24 | 11,097 |
Mortgages | 5,170 | 4,615 | 9,102 | 18,887 |
Other loans | 109,297 | 18,387 | 4,035 | 131,719 |
Total foreign | 125,505 | 23,036 | 13,162 | 161,703 |
Total gross | 201,878 | 74,654 | 48,750 | 325,281 |
As of 31 December 2015, the total amounts of Due from banks and Loans granted at fixed- and floating-rates were as follows:
CHF million | Within 1 year | 1 to 5 years | Over 5 years | Total |
Fixed-rate loans | 136,297 | 59,052 | 38,929 | 234,278 |
Adjustable or floating-rate loans | 65,581 | 15,601 | 9,821 | 91,003 |
Total | 201,878 | 74,654 | 48,750 | 325,281 |
Impaired and non-performing loans
A loan (included in Due from banks or Loans) is classified as nonperforming: (i) when the payment of interest, principal or fees is overdue by more than 90 days, (ii) when insolvency proceedings have commenced or (iii) when obligations have been restructured on preferential terms. For IFRS reporting purposes, the definition of impaired loans is more comprehensive, covering both non-performing loans and other situations where objective evidence indicates that UBS AG may be unable to collect all amounts due. Refer to “Impaired loans” in the “Risk management and control” section of this report for comprehensive information on UBS AG’s impaired loans, of which non-performing loans are a component. Also, refer to Note 1 to the consolidated financial statements for more information on the various risk factors that are considered to be indicative of impairment.
The table below provides an analysis of the UBS AG’s non-performing loans.
CHF million | | 31.12.15 | 31.12.14 | 31.12.13 | 31.12.12 | 31.12.11 |
Non-performing loans: | | | | | | |
Domestic | | 1,174 | 1,293 | 1,113 | 1,121 | 1,199 |
Foreign | | 455 | 309 | 469 | 395 | 329 |
Total non-performing loans | | 1,630 | 1,602 | 1,582 | 1,516 | 1,529 |
| | | | | | |
CHF million | | 31.12.15 | 31.12.14 | 31.12.13 | 31.12.12 | 31.12.11 |
Gross interest income that would have been recorded on non-performing loans: | | | | | | |
Domestic | | 6 | 9 | 6 | 8 | 10 |
Foreign | | 7 | 6 | 4 | 3 | 9 |
Interest income included in Net profit for non-performing loans: | | | | | | |
Domestic | | 26 | 22 | 23 | 28 | 29 |
Foreign | | 5 | 7 | 7 | 6 | 6 |
UBS AG does not, as a matter of policy, typically restructure loans to accrue interest at rates different from the original contractual terms or reduce the principal amount of loans. Instead, specific loan allowances are established as necessary. Unrecognized interest related to restructured loans was not material to the results of operations in 2015, 2014, 2013, 2012 or 2011.
Additional regulatory information
UBS AG consolidated supplemental disclosures required under SEC regulations
Cross-border outstandings
The following tables list those countries for which cross-border outstandings exceeded 0.75% of total IFRS assets at 31 December 2015, 2014 and 2013. As of 31 December 2015, there were no outstandings that exceeded 0.75% of total IFRS assets in any country currently facing debt restructuring or liquidity problems that UBS AG expects would materially impact the country’s ability to service its obligations. Aggregate country risk exposures are monitored and reported on an ongoing basis. The internal risk view is not directly comparable to the cross-border outstandings in the table below due to different approaches to netting, differing trade populations and differing approach to allocation of exposures to countries. For more information on the country framework within risk control, refer to the “Risk management and control” section of this report.
| | 31.12.15 |
CHF million | | Banks | Private sector | Public sector | Total outstandings | % of total assets | Guarantees and Commitments¹ |
USA | | 8,633 | 90,201 | 27,807 | 126,641 | 13.4 | 42,286 |
United Kingdom | | 4,498 | 56,282 | 9,560 | 70,340 | 7.5 | 6,448 |
Japan | | 3,466 | 11,275 | 5,054 | 19,794 | 2.1 | 136 |
France | | 4,043 | 3,758 | 681 | 8,482 | 0.9 | 5,029 |
Hong Kong | | 344 | 7,692 | 121 | 8,157 | 0.9 | 79 |
| | | | | | | |
| | 31.12.14 |
CHF million | | Banks | Private sector | Public sector | Total outstandings | % of total assets | Guarantees and Commitments¹ |
USA | | 9,287 | 84,629 | 59,103 | 153,019 | 14.4 | 34,967 |
United Kingdom | | 6,288 | 47,003 | 13,928 | 67,220 | 6.3 | 7,660 |
Japan | | 1,780 | 16,906 | 5,422 | 24,107 | 2.3 | 1,771 |
France | | 3,952 | 6,006 | 67 | 10,025 | 0.9 | 5,037 |
| | | | | | | |
| | 31.12.13 |
CHF million | | Banks | Private sector | Public sector | Total outstandings | % of total assets | Guarantees and Commitments¹ |
USA | | 21,993 | 76,047 | 51,287 | 149,327 | 14.7 | 38,778 |
United Kingdom | | 10,638 | 39,528 | 8,583 | 58,749 | 5.8 | 8,494 |
Japan | | 1,019 | 17,009 | 4,765 | 22,794 | 2.2 | 289 |
France | | 4,739 | 7,478 | 56 | 12,273 | 1.2 | 6,997 |
Germany | | 3,914 | 2,664 | 1,900 | 8,478 | 0.8 | 2,062 |
1 Includes forward starting transactions (reverse repurchase agreements and securities borrowing agreements). |
Summary of movements in allowances and provisions for credit losses
The following table provides an analysis of movements in allowances and provisions for credit losses.
UBS AG writes off loans against allowances only on final settlement of bankruptcy proceedings, the sale of the underlying
assets and/or in the case of debt forgiveness. Under Swiss law, a creditor can continue to collect from a debtor who has emerged from bankruptcy, unless the debt has been forgiven through a formal agreement
CHF million | 31.12.15 | 31.12.14 | 31.12.13 | 31.12.12 | 31.12.11 |
Balance at beginning of year | 735 | 750 | 794 | 938 | 1,287 |
Domestic | | | | | |
Write-offs | | | | | |
Construction | (2) | (1) | (2) | (1) | (8) |
Electricity, gas and water supply | (1) | 0 | 0 | (6) | 0 |
Financial services | (3) | 0 | (6) | 0 | (17) |
Hotels and restaurants | 0 | 0 | 0 | (1) | 0 |
Manufacturing | (9) | (3) | (4) | (20) | (31) |
Private households | (35) | (39) | (38) | (45) | (59) |
Real estate and rentals | 0 | (1) | 0 | (2) | (3) |
Retail and wholesale | (47) | (28) | (11) | (21) | (37) |
Services | (3) | (15) | (4) | (6) | (21) |
Transport, storage and communications | (9) | (3) | (1) | (11) | (6) |
Total gross domestic write-offs | (110) | (90) | (67) | (112) | (183) |
Foreign | | | | | |
Write-offs | | | | | |
Banks | (9) | (15) | (1) | 0 | (8) |
Construction | 0 | (1) | (6) | 0 | 0 |
Electricity, gas and water supply | 0 | (1) | 0 | 0 | 0 |
Financial services | (3) | (12) | (44) | (106) | (39) |
Manufacturing | 0 | (7) | 0 | 0 | 0 |
Mining | (1) | 0 | 0 | 0 | 0 |
Private households | (12) | (6) | (6) | (15) | (72) |
Public authorities | 0 | 0 | (1) | (54) | (175) |
Real estate and rentals | 0 | (2) | (1) | 0 | (7) |
Retail and wholesale | (19) | (2) | (1) | 0 | 0 |
Services | (10) | (14) | 0 | (19) | (1) |
Transport, storage and communications | 0 | (1) | 0 | (5) | 0 |
Total gross foreign write-offs | (54) | (63) | (61) | (201) | (303) |
Total usage of provisions | 0 | (1) | 0 | 0 | (14) |
Total write-offs / usage of provisions | (164) | (154) | (128) | (313) | (501) |
Recoveries | | | | | |
Domestic | 41 | 29 | 35 | 43 | 50 |
Foreign | 7 | 0 | 10 | 21 | 1 |
Total recoveries | 48 | 29 | 45 | 63 | 51 |
Total net write-offs / usage of provisions | (116) | (124) | (83) | (250) | (450) |
Increase / (decrease) in specific allowances and provisions recognized in the income statement | 117 | 89 | 144 | 133 | 0 |
Increase / (decrease) in collective loan loss allowances recognized in the income statement | 0 | (11) | (93) | (15) | 84 |
Foreign currency translation | (11) | 21 | (9) | (8) | (1) |
Other | 2 | 11 | (3) | (3) | 18 |
Balance at end of year¹ | 727 | 735 | 750 | 794 | 938 |
1 Includes allowances for cash collateral on securities borrowed. |
Additional regulatory information
UBS AG consolidated supplemental disclosures required under SEC regulations
Allocation of the allowances and provisions for credit losses
The following table provides an analysis of the allocation of the allowances and provisions for credit loss by industry sector and geographic location at 31 December 2015, 2014, 2013, 2012 and 2011. For a description of procedures with respect to allowances and provisions for credit losses, refer to the "Risk management and control" section of this report.
CHF million | 31.12.15 | 31.12.14 | 31.12.13 | 31.12.12 | 31.12.11 |
Domestic | | | | | |
Banks | 3 | 2 | 3 | 3 | 1 |
Chemicals | 0 | 0 | 1 | 0 | 0 |
Construction | 13 | 14 | 16 | 16 | 15 |
Electricity, gas and water supply | 2 | 1 | 1 | 0 | 9 |
Financial services | 17 | 18 | 16 | 21 | 19 |
Food and beverages | 3 | 4 | 2 | 3 | 2 |
Hotels and restaurants | 13 | 16 | 12 | 9 | 6 |
Manufacturing | 77 | 72 | 57 | 44 | 65 |
Private households | 47 | 52 | 54 | 60 | 77 |
Real estate and rentals | 13 | 18 | 9 | 10 | 14 |
Retail and wholesale | 78 | 123 | 152 | 123 | 131 |
Services | 23 | 25 | 23 | 24 | 24 |
Transport, storage and communication | 32 | 29 | 19 | 12 | 16 |
Other¹ | 0 | 0 | 0 | 1 | 1 |
Total domestic specific allowances | 321 | 374 | 365 | 326 | 379 |
Foreign | | | | | |
Banks² | 0 | 10 | 13 | 19 | 16 |
Chemicals | 0 | 0 | 0 | 1 | 8 |
Construction | 1 | 1 | 17 | 20 | 6 |
Electricity, gas and water supply | 0 | 0 | 1 | 1 | 1 |
Financial services | 90 | 35 | 37 | 37 | 96 |
Manufacturing | 13 | 9 | 18 | 23 | 23 |
Mining | 46 | 11 | 2 | 0 | 0 |
Private households | 61 | 65 | 66 | 45 | 60 |
Public authorities | 14 | 14 | 16 | 39 | 33 |
Real estate and rentals | 1 | 1 | 2 | 4 | 10 |
Retail and wholesale | 80 | 112 | 77 | 39 | 15 |
Services | 19 | 29 | 35 | 35 | 28 |
Transport, storage and communication | 40 | 43 | 19 | 27 | 39 |
Total foreign specific allowances | 365 | 330 | 303 | 290 | 335 |
Collective loan loss allowances | 6 | 8 | 20 | 114 | 131 |
Provisions for loan commitments and guarantees | 35 | 23 | 61 | 64 | 93 |
Total allowances and provisions for credit losses³ | 727 | 735 | 750 | 794 | 938 |
1 Includes mining and public authorities. 2 Counterparty allowances only. 3 Includes allowances for cash collateral on securities borrowed. |
Due from banks and loans by industry sector (gross)
The following table presents the percentage of loans in each industry sector and geographic location to total loans.
In % | 31.12.15 | 31.12.14 | 31.12.13 | 31.12.12 | 31.12.11 |
Domestic | | | | | |
Banks | 0.2 | 0.4 | 0.2 | 0.2 | 0.2 |
Chemicals | 0.1 | 0.1 | 0.1 | 0.1 | 0.1 |
Construction | 0.5 | 0.4 | 0.5 | 0.5 | 0.4 |
Electricity, gas and water supply | 0.1 | 0.1 | 0.1 | 0.1 | 0.1 |
Financial services | 1.9 | 2.0 | 1.5 | 1.4 | 1.5 |
Food and beverages | 0.1 | 0.1 | 0.1 | 0.1 | 0.1 |
Hotels and restaurants | 0.5 | 0.5 | 0.6 | 0.6 | 0.6 |
Manufacturing | 0.6 | 0.7 | 0.8 | 1.0 | 1.1 |
Private households | 38.1 | 38.0 | 41.3 | 40.8 | 41.5 |
Public authorities | 0.5 | 0.6 | 0.8 | 0.9 | 1.0 |
Real estate and rentals | 4.2 | 4.4 | 4.8 | 4.5 | 4.5 |
Retail and wholesale | 1.1 | 1.3 | 1.3 | 1.4 | 1.5 |
Services | 1.6 | 1.5 | 1.8 | 1.9 | 2.0 |
Transport, storage and communication | 0.6 | 0.6 | 0.7 | 0.6 | 0.5 |
Other¹ | 0.2 | 0.2 | 0.1 | 0.3 | 0.3 |
Total domestic | 50.3 | 50.9 | 54.8 | 54.4 | 55.5 |
Foreign | | | | | |
Banks | 3.4 | 3.7 | 4.4 | 6.9 | 7.8 |
Chemicals | 0.0 | 0.0 | 0.1 | 0.1 | 0.1 |
Construction | 0.2 | 0.2 | 0.4 | 0.6 | 0.3 |
Electricity, gas and water supply | 0.2 | 0.3 | 0.4 | 0.4 | 0.3 |
Financial services | 17.3 | 17.5 | 14.3 | 13.5 | 13.3 |
Hotels and restaurants | 0.0 | 0.0 | 0.1 | 0.1 | 0.1 |
Manufacturing | 0.6 | 0.6 | 0.6 | 0.6 | 0.7 |
Mining | 0.5 | 0.4 | 0.4 | 0.4 | 0.7 |
Private households | 19.3 | 18.3 | 16.6 | 15.4 | 14.1 |
Public authorities | 0.4 | 0.4 | 0.4 | 1.4 | 1.9 |
Real estate and rentals | 0.7 | 0.8 | 1.0 | 0.9 | 0.7 |
Retail and wholesale | 0.6 | 0.6 | 0.6 | 0.7 | 0.7 |
Services | 5.5 | 5.3 | 4.9 | 3.6 | 2.9 |
Transport, storage and communication | 0.9 | 0.9 | 0.9 | 1.0 | 0.7 |
Other² | 0.1 | 0.0 | 0.2 | 0.1 | 0.1 |
Total foreign | 49.7 | 49.1 | 45.2 | 45.6 | 44.5 |
Total gross | 100.0 | 100.0 | 100.0 | 100.0 | 100.0 |
1 Includes mining 2 Includes food and beverages |
s
Abbreviations frequently used in our financial reports
A
ABS asset-backed security
AGM annual general meeting of shareholders
AIV alternative investment vehicle
AMA advanced measurement approach
AT1 additional tier 1
B
BCBS Basel Committee on
Banking Supervision
BIS Bank for international Settlements
BoD Board of Directors
C
CC Corporate Center
CCAR Comprehensive Capital Analysis and Review
CCF credit conversion factors
CCP central counterparty
CDO collateralized debt
obligation
CDR constant default rate
CDS credit default swap
CEA Commodity Exchange Act
CEO Chief Executive Officer
CET1 common equity tier 1
CFO Chief Financial Officer
CHF Swiss franc
CLN credit-linked note
CLO collateralized loan obligation
CMBS commercial mortgage
backed security
CVA credit valuation
adjustment
D
DBO defined benefit obligation
DCCP Deferred Contingent Capital Plan
DOJ Department of Justice
DTA deferred tax asset
DVA (debit valuation adjustment
E
EAD exposure at default
EC European Commission
ECB European Central Bank
EIR effective interest rate
EMEA Europe, Middle East and Africa
EOP Equity Ownership Plan
EPS earnings per share
ETD exchange-traded derivatives
ETF exchange-traded fund
EU European Union
EUR euro
EURIBOR Euro Interbank Offered Rate
F
FCA UK Financial Conduct
Authority
FCT foreign currency translation
FDIC Federal Deposit Insurance Corporation
FINMA Swiss Financial Market Supervisory Authority
FRA forward rate agreement
FSA UK Financial Services Authority
FSB Financial Stability Board
FTD first to default
FTP funds transfer price
FVA funding valuation adjustment
FX foreign exchange
G
GAAP generally accepted
accounting principles
GBP British pound
GEB Group Executive Board
GIIPS Greece, Italy, Ireland,
Portugal and Spain
Group ALM Group Asset and Liability Management
H
HQLA high-quality liquid assets
I
IAS International Accounting Standards
IASB International Accounting Standards Board
IFRS International Financial Reporting Standards
IRB internal ratings-based
IRC incremental risk charge
ISDA International Swaps and Derivatives Association
K
KPI key performance indicator
L
LAC loss-absorbing capital
LAS liquidity-adjusted stress
LCR liquidity coverage ratio
LGD loss given default
LIBOR London Interbank Offered Rate
LRD leverage ratio denominator
LTV loan-to-value
M
MTN medium-term note
Abbreviations frequently used in our financial reports (continued)
N
NAV net asset value
NRV negative replacement values
NPA non-prosecution agreement
NSFR net stable funding ratio
O
OCI other comprehensive income
OTC over-the-counter
P
PRA UK Prudential Regulation Authority
PRV positive replacement values
R
RLN reference-linked note
RMBS residential mortgage-backed security
RoAE return on attributed equity
RoE return on equity
RoTE return on tangible equity
RV replacement value
RWA risk-weighted assets
S
SE structured entity
SEC US Securities and Exchange Commission
SEEOP Senior Executive Equity Ownership Plan
SFT securities financing transaction
SNB Swiss National Bank
SRB systemically relevant bank
SRM Single Resolution
Mechanism
SVaR stressed value-at-risk
T
TBTF too big to fail
TLAC total loss-absorbing capacity
TRS total return swap
U
USD US dollar
V
VaR value-at-risk
Information sources
Reporting publications
Annual publications: Annual report (SAP no. 80531): Published in both English and German, this single volume report provides a description of our Group strategy and performance; the strategy and performance of the business divisions and the Corporate Center; a description of risk, treasury, capital management, corporate governance, responsibility and senior management compensation, including compensation for the Board of Directors and the Group Executive Board members; and financial information, including the financial statements. Review (SAP no. 80530): The booklet contains key information on our strategy and financials. It is published in English, German, French and Italian. Compensation Report (SAP no. 82307): The report discusses our compensation framework and provides information on compensation for the Board of Directors and the Group Executive Board members. It is published in English and German.
Quarterly publications: Letter to shareholders: The letter is published for the first, second and third quarter and provides an update from executive management on our strategy and performance. The letter is published in English, German, French and Italian. Financial report (SAP no. 80834) and results materials: The quarterly financial report, published for the first, second and third quarter, and the fourth-quarter earnings release and financial supplement provide an update on our strategy and performance for the respective quarter. They are mainly available in English.
How to order reports: The annual and quarterly publications are available in PDF on the internet at www.ubs.com/investors in the “Financial information” section. Printed copies can be ordered from the same website in the “Investor services” section, which can be accessed via the link on the left-hand side of the screen. Alternatively, they can be ordered by quoting the SAP number and the language preference, where applicable, from UBS AG, F4UK–AUL, P.O. Box, CH-8098 Zurich, Switzerland.
Other information
Website: The “Investor Relations” website at www.ubs.com/investors provides the following information on UBS: news releases, financial information, including results-related filings with the US Securities and Exchange Commission, corporate information, including UBS share price charts and data and dividend information, the UBS corporate calendar and presentations by management for investors and financial analysts. Information on the internet is available in English and German.
Result presentations: Our quarterly results presentations are webcast live. A playback of most presentations is downloadable at www.ubs.com/presentations.
Messaging service / UBS news alert: On the www.ubs.com/ newsalerts website, it is possible to subscribe to receive news alerts about UBS via SMS or email. Messages are sent in English, German, French or Italian and it is possible to state theme preferences for the alerts received.
Form 20-F and other submissions to the US Securities and Exchange Commission: We file periodic reports and submit other information about UBS to the US Securities and Exchange Commission (SEC). Principal among these filings is the annual report on Form 20-F, filed pursuant to the US Securities Exchange Act of 1934. The filing of Form 20-F is structured as a “wrap-around” document. Most sections of the filing can be satisfied by referring to parts of the annual report. However, there is a small amount of additional information in Form 20-F which is not presented elsewhere, and is particularly targeted at readers in the US. Readers are encouraged to refer to this additional disclosure. Any document that we file with the SEC is available to read and copy on the SEC’s website, www.sec.gov, or at the SEC’s public reference room at 100 F Street, N.E., Room 1580, Washington, DC, 20549. Please call the SEC by dialing +1-800-SEC-0330 for further information on the operation of its public reference room. Please visit www.ubs.com/investors for more information.
Cautionary Statement Regarding Forward-Looking Statements | This report contains statements that constitute “forward-looking statements,” including but not limited to management’s outlook for UBS’s financial performance and statements relating to the anticipated effect of transactions and strategic initiatives on UBS’s business and future development. While these forward-looking statements represent UBS’s judgments and expectations concerning the matters described, a number of risks, uncertainties and other important factors could cause actual developments and results to differ materially from UBS’s expectations. These factors include, but are not limited to: (i) the degree to which UBS is successful in executing its announced strategic plans, including its cost reduction and efficiency initiatives and its targets for risk-weighted assets (RWA) and leverage ratio denominator (LRD), and the degree to which UBS is successful in implementing changes to its wealth management businesses to meet changing market, regulatory and other conditions; (ii) the continuing low or negative interest rate environment, developments in the macroeconomic climate and in the markets in which UBS operates or to which it is exposed, including movements in securities prices or liquidity, credit spreads, and currency exchange rates, and the effect of economic conditions and market developments on the financial position or creditworthiness of UBS’s clients and counterparties; (iii) changes in the availability of capital and funding, including any changes in UBS’s credit spreads and ratings, as well as availability and cost of funding to meet requirements for debt that will be eligible for total loss-absorbing capacity (TLAC) requirements, or loss-absorbing capital; (iv) changes in or the implementation of financial legislation and regulation in Switzerland, the US, the UK and other financial centers that may impose, or result in, more stringent capital, TLAC, leverage ratio, liquidity and funding requirements, incremental tax requirements, additional levies, limitations on permitted activities, constraints on remuneration or other measures; (v) uncertainty as to when and to what degree the Swiss Financial Market Supervisory Authority (FINMA) will approve reductions to the incremental RWA resulting from the supplemental operational risk capital analysis mutually agreed to by UBS and FINMA, or will approve a limited reduction of capital or gone concern requirements due to measures to reduce resolvability risk; (vi) the degree to which UBS is successful in implementing changes to its legal structure to improve its resolvability and meet related regulatory requirements, including changes in legal structure and reporting required to implement US enhanced prudential standards, implementing a service company model, the transfer of the Asset Management business to a holding company, and the potential need to make further changes to the legal structure or booking model of UBS Group in response to legal and regulatory requirements relating to capital requirements, resolvability requirements and proposals in Switzerland and other countries for mandatory structural reform of banks and the extent to which such changes have the intended effects; (vii) changes in UBS’s competitive position, including whether differences in regulatory capital and other requirements among the major financial centers will adversely affect UBS’s ability to compete in certain lines of business; (viii) changes in the standards of conduct applicable to our businesses that may result from new regulation or new enforcement of existing standards, including measures to impose new or enhanced duties when interacting with customers or in the execution and handling of customer transactions; (ix) the liability to which UBS may be exposed, or possible constraints or sanctions that regulatory authorities might impose on UBS, due to litigation, contractual claims and regulatory investigations, including the potential for disqualification from certain businesses or loss of licenses or privileges as a result of regulatory or other governmental sanctions; (x) the effects on UBS’s cross-border banking business of tax or regulatory developments and of possible changes in UBS’s policies and practices relating to this business; (xi) UBS’s ability to retain and attract the employees necessary to generate revenues and to manage, support and control its businesses, which may be affected by competitive factors including differences in compensation practices; (xii) changes in accounting or tax standards or policies, and determinations or interpretations affecting the recognition of gain or loss, the valuation of goodwill, the recognition of deferred tax assets and other matters; (xiii) limitations on the effectiveness of UBS’s internal processes for risk management, risk control, measurement and modeling, and of financial models generally; (xiv) whether UBS will be successful in keeping pace with competitors in updating its technology, particularly in trading businesses; (xv) the occurrence of operational failures, such as fraud, misconduct, unauthorized trading, financial crime, cyber-attacks, and systems failures; (xvi) restrictions on the ability of UBS Group AG to make payments or distributions, including due to restrictions on the ability of its subsidiaries to make loans or distributions, directly or indirectly, or, in the case of financial difficulties, due to the exercise by FINMA of its broad statutory powers in relation to protective measures, restructuring and liquidation proceedings; (xvii) the degree to which changes in regulation, capital or legal structure, financial results or other factors, including methodology, assumptions and stress scenarios, may affect UBS’s ability to maintain its stated capital return objective; and (xviii) the effect that these or other factors or unanticipated events may have on our reputation and the additional consequences that this may have on our business and performance. The sequence in which the factors above are presented is not indicative of their likelihood of occurrence or the potential magnitude of their consequences. Our business and financial performance could be affected by other factors identified in our past and future filings and reports, including those filed with the SEC. More detailed information about those factors is set forth in documents furnished by UBS and filings made by UBS with the SEC, including UBS’s Annual Report on Form 20-F for the year ended 31 December 2015. UBS is not under any obligation to (and expressly disclaims any obligation to) update or alter its forward-looking statements, whether as a result of new information, future events, or otherwise.
Rounding | Numbers presented throughout this report may not add up precisely to the totals provided in the tables and text. Percentages, percent changes and absolute variances are calculated based on rounded figures displayed in the tables and text and may not precisely reflect the percentages, percent changes and absolute variances that would be derived based on figures that are not rounded.
Tables | Within tables, blank fields generally indicate that the field is not applicable or not meaningful, or that information is not available as of the relevant date or for the relevant period. Zero values generally indicate that the respective figure is zero on an actual or rounded basis.
UBS Group AG
P.O. Box, CH-8098 Zurich
UBS AG
P.O. Box, CH-8098 Zurich
P.O. Box, CH-4002 Basel
www.ubs.com