UNITED STATES
SECURITIES AND EXCHANGE COMMISSION
Washington, D.C. 20549
FORM N-CSR
CERTIFIED SHAREHOLDER REPORT OF REGISTERED MANAGEMENT INVESTMENT COMPANIES
Investment Company Act file number 811-02809 and 811-10095
Name of Fund: BlackRock Value Opportunities Fund, Inc. and Master Value Opportunities LLC
Fund Address: 100 Bellevue Parkway, Wilmington, DE 19809
Name and address of agent for service: John M. Perlowski, Chief Executive Officer, BlackRock Value Opportunities Fund, Inc. and Master Value Opportunities LLC, 55 East 52nd Street, New York, NY 10055
Registrants’ telephone number, including area code: (800) 441-7762
Date of fiscal year end: 03/31/2013
Date of reporting period: 09/30/2012
Item 1 – Report to Stockholders
 | September 30, 2012 |
Semi-Annual Report (Unaudited)
BlackRock Value Opportunities Fund, Inc.
Not FDIC Insured • No Bank Guarantee • May Lose Value
Table of Contents
| 2 | BLACKROCK VALUE OPPORTUNITIES FUND, INC. | SEPTEMBER 30, 2012 |
Dear Shareholder
Late in the summer of 2011, financial markets were upended by sovereign debt turmoil in the United States and Europe as well as growing concerns about the future of the global economy. Investor confidence had crumbled. However, the fourth quarter of 2011 brought improving economic data and more concerted efforts among European leaders toward stemming the region’s debt crisis, gradually drawing investors back to the markets. Improving sentiment carried over into early 2012 as investors felt some relief from the world’s financial woes. Volatility abated and risk assets (including stocks, commodities and high yield bonds) moved boldly higher through the first two months of 2012, while climbing Treasury yields pressured higher-quality fixed income assets.
Markets reversed course in the spring when Europe’s debt problems boiled over once again. High levels of volatility returned as political instability in Greece threatened the country’s membership in the eurozone. Spain faced severe deficit issues while the nation’s banks clamored for liquidity. Yields on Spanish and Italian government debt rose to levels deemed unsustainable. European leaders conferred and debated vehemently over the need for fiscal integration among the 17 nations comprising the euro currency bloc as a means to resolve the crisis for the long term.
Alongside the drama in Europe, investors were discouraged by gloomy economic reports from various parts of the world. A slowdown in China, a key powerhouse for global growth, became particularly worrisome. In the United States, disappointing jobs reports dealt a crushing blow to investor sentiment. Risk assets sold off in the second quarter as investors again retreated to safe haven assets.
Despite ongoing concerns about the health of the global economy and the debt crisis in Europe, most asset classes enjoyed a robust summer rally powered mainly by expectations for policy stimulus from central banks in Europe and the United States. Although global economic data continued to be mixed, the spate of downside surprises seen in the second quarter had receded and, outside of Europe, the risk of recession largely subsided. Additionally, in response to growing debt pressures, the European Central Bank allayed investors’ fears by stating its conviction to hold the eurozone together. Early in September, the European Central Bank announced a plan to purchase sovereign debt in the eurozone’s most troubled nations. Later that month, the US Federal Reserve announced its long-awaited — and surprisingly aggressive — stimulus program, committing to purchase $40 billion of agency mortgage-backed securities per month until the US economy exhibits enough strength to sustain real growth and improving labor market conditions. These central bank actions boosted risk assets globally as investors increased their risk appetites in their search for higher returns.
All asset classes performed well for the 12-month period ended September 30, 2012, with particularly strong returns from US stocks and high yield bonds. For the six-month period ended September 30, 2012, fixed income investments outperformed equities. US Treasury bonds posted exceptional gains by historical standards and outperformed investment-grade corporate bonds and tax-exempt municipals. High yield bonds also generated solid returns. US stocks finished the six-month period with modest gains, while international and emerging market stocks lagged other asset classes amid ongoing uncertainty. Near-zero short term interest rates continued to keep yields on money market securities near their all-time lows.
The financial world is more uncertain than ever, but there are new avenues of opportunity — new ways to invest and new markets in which to invest. We believe it’s our responsibility to help investors adapt to today’s new world of investing and build the portfolios these times require. We encourage you to visit www.blackrock.com/newworld for more information.
Sincerely,

Rob Kapito
President, BlackRock Advisors, LLC

“The financial world is more uncertain than ever, but there are new avenues of opportunity.”
Rob Kapito
President, BlackRock Advisors, LLC
Total Returns as of September 30, 2012
| | | | |
| | 6-month | 12-month |
| |
| US large cap equities | 3.43 | % | 30.20 | % |
| (S&P 500® Index) | | | | |
| |
| US small cap equities | 1.60 | | 31.91 | |
| (Russell 2000® Index) | | | | |
| |
| International equities | (0.70 | ) | 13.75 | |
| (MSCI Europe, Australasia, | | | | |
| Far East Index) | | | | |
| |
| Emerging market | (1.84 | ) | 16.93 | |
| equities (MSCI Emerging | | | | |
| Markets Index) | | | | |
| |
| 3-month Treasury | 0.06 | | 0.07 | |
| bill (BofA Merrill Lynch | | | | |
| 3-Month US Treasury | | | | |
| Bill Index) | | | | |
| |
| US Treasury securities | 6.78 | | 5.66 | |
| (BofA Merrill Lynch 10- | | | | |
| Year US Treasury Index) | | | | |
| |
| US investment grade | 3.68 | | 5.16 | |
| bonds (Barclays | | | | |
| US Aggregate Bond Index) | | | | |
| |
| Tax-exempt municipal | 4.50 | | 8.84 | |
| bonds (S&P Municipal | | | | |
| Bond Index) | | | | |
| |
| US high yield bonds | 6.40 | | 19.35 | |
| (Barclays US Corporate | | | | |
| High Yield 2% Issuer | | | | |
| Capped Index) | | | | |
Past performance is no guarantee of future results. Index performance is shown for illustrative purposes only. You cannot invest directly in an index.
| | THIS PAGE NOT PART OF YOUR FUND REPORT | 3 |
Fund Summary as of September 30, 2012
Investment Objective
BlackRock Value Opportunities Fund, Inc.’s (the “Fund”) investment objective is to seek long term growth of capital by investing in a diversified portfolio of securities, primarily common stock, of relatively small companies that management of the Fund believes have special investment value and emerging growth companies regardless of size.
Portfolio Management Commentary
How did the Fund perform?
| • | | For the six-month period ended September 30, 2012, the Fund, through its investment in Master Value Opportunities LLC (the “Master LLC”), underperformed its benchmark, the S&P SmallCap 600® Value Index. |
What factors influenced performance?
| • | | Stock selection in the energy sector detracted from portfolio performance during the period, as holdings of land drillers and some service names struggled. Positioning in financials also had a negative impact, with an underweight relative to the benchmark index in the insurance industry and stock selection among banks detracting. In the industrials sector, the absence of building products names hurt relative performance, as did stock selection within and overweights to the road & rail and machinery industries and overweight exposure to aerospace companies. Finally, stock selection in consumer discretionary dragged on returns due to significant underperformance from the Master LLC’s retailer holdings during the period. |
| • | | Contributing positively to performance was stock selection and an overweight in the health care sector. Most notably, a heavy overweight to health care providers had a positive impact on returns. In addition, the Master LLC’s biotechnology holdings delivered particularly strong returns, including standout performer Arena Pharmaceuticals, Inc., which the Master LLC sold after the shares soared on promising product approval news during the period. |
Describe recent portfolio activity.
| • | | During the six-month period, the Master LLC increased exposure to the consumer discretionary, health care and energy sectors, while reducing holdings of information technology names. |
Describe portfolio positioning at period end.
| • | | At the end of the period, the Master LLC’s most significant sector positions relative to the S&P SmallCap 600® Value Index were overweights in health care and energy, and underweights in financials, consumer staples, consumer discretionary and industrials. |
The views expressed reflect the opinions of BlackRock as of the date of this report and are subject to change based on changes in market, economic or other conditions. These views are not intended to be a forecast of future events and are no guarantee of future results.
| 4 | BLACKROCK VALUE OPPORTUNITIES FUND, INC. | SEPTEMBER 30, 2012 |
Total Return Based on a $10,000 Investment
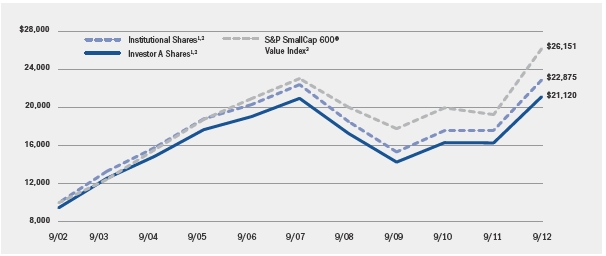
| 1 | | Assuming maximum sales charges, if any, transaction costs and other operating expenses, including administration fees. Institutional Shares do not have a sales charge. |
| 2 | | The Fund invests all of its assets in the Master LLC. The Master LLC invests primarily in common stock of small companies and emerging growth companies that the Master LLC’s management believes have special investment value. |
| 3 | | This unmanaged index measures performance of the small-capitalization value sector of the US equity market. |
Performance Summary for the Period Ended September 30, 2012
| | | | | | | | | | | | | | | | | |
| | | | | Average Annual Total Returns4 |
| | | | | 1 Year | | 5 Years | | 10 Years |
| | | 6-Month
Total Returns | w/o sales
charge | w/sales
charge | | w/o sales
charge | w/sales
charge | | w/o sales
charge | w/sales
charge |
| Institutional | | (0.37 | )% | 30.02 | % | N/A | | | 0.43 | % | N/A | | | 8.63 | % | N/A | |
| Investor A | | (0.43 | ) | 29.73 | | 22.92 | % | | 0.16 | | (0.92 | )% | | 8.35 | | 7.76 | % |
| Investor B | | (0.91 | ) | 28.44 | | 23.94 | | | (0.80 | ) | (1.14 | ) | | 7.63 | | 7.63 | |
| Investor C | | (0.96 | ) | 28.48 | | 27.48 | | | (0.83 | ) | (0.83 | ) | | 7.38 | | 7.38 | |
| Class R | | (0.62 | ) | 29.27 | | N/A | | | (0.23 | ) | N/A | | | 8.03 | | N/A | |
| S&P SmallCap 600® Value Index | 1.50 | | 35.85 | | N/A | | | 2.58 | | N/A | | | 10.09 | | N/A | |
| 4 | | Assuming maximum sales charges, if any. Average annual total returns with and without sales charges reflect reductions for distribution and service fees. See “About Fund Performance” on page 6 for a detailed description of share classes, including any related sales charges and fees. |
N/A — Not applicable as share class and index do not have a sales charge.
Past performance is not indicative of future results.
Expense Example
| | | | | | | | | | | | | | | |
| | Actual | | Hypothetical6 | | |
| | Beginning
Account Value
April 1, 2012 | Ending
Account Value
September 30,
2012 | Expenses Paid
During the Period5 | | Beginning
Account Value
April 1, 2012 | Ending
Account Value
September 30,
2012 | Expenses Paid
During the Period5 | Annualized
Expense Ratio |
| Institutional | $ | 1,000.00 | $ | 996.30 | $ | 5.50 | | $ | 1,000.00 | $ | 1,019.57 | $ | 5.57 | 1.10 | % |
| Investor A | $ | 1,000.00 | $ | 995.70 | $ | 6.40 | | $ | 1,000.00 | $ | 1,018.67 | $ | 6.48 | 1.28 | % |
| Investor B | $ | 1,000.00 | $ | 990.90 | $ | 11.23 | | $ | 1,000.00 | $ | 1,013.77 | $ | 11.36 | 2.25 | % |
| Investor C | $ | 1,000.00 | $ | 990.39 | $ | 11.23 | | $ | 1,000.00 | $ | 1,013.77 | $ | 11.36 | 2.25 | % |
| Class R | $ | 1,000.00 | $ | 993.79 | $ | 8.20 | | $ | 1,000.00 | $ | 1,016.87 | $ | 8.29 | 1.64 | % |
| 5 | | For each class of the Fund, expenses are equal to the annualized expense ratio for the class, multiplied by the average account value over the period, multiplied by 183/365 (to reflect the one-half year period shown). Because the Fund invests significantly in the Master LLC, the expense example reflects the net expenses of both the Fund and the Master LLC in which it invests. |
| 6 | | Hypothetical 5% annual return before expenses is calculated by pro rating the number of days in the most recent fiscal half year divided by 365. |
See “Disclosure of Expenses” on page 6 for further information on how expenses were calculated.
| BLACKROCK VALUE OPPORTUNITIES FUND, INC. | SEPTEMBER 30, 2012 | 5 |
About Fund Performance
| • | | Institutional Shares are not subject to any sales charge. These shares bear no ongoing distribution or service fees and are available only to eligible investors. |
| • | | Investor A Shares are subject to a maximum initial sales charge (front-end load) of 5.25% and a service fee of 0.25% per year (but no distribution fee). |
| • | | Investor B Shares are subject to a maximum contingent deferred sales charge (“CDSC”) of 4.50% declining to 0% after six years. In addition, these shares are subject to a distribution fee of 0.75% per year and a service fee of 0.25% per year. These shares automatically convert to Investor A Shares after approximately eight years. (There is no initial sales charge for automatic share conversions.) All returns for periods greater than eight years reflect this conversion. Investor B Shares are only available through exchanges, dividend reinvestment by existing shareholders or for purchase by certain qualified employee benefit plans. |
| • | | Investor C Shares are subject to a 1.00% CDSC if redeemed within one year of purchase. In addition, these shares are subject to a distribution fee of 0.75% per year and a service fee of 0.25% per year. |
| • | | Class R Shares are not subject to any sales charge. These shares are subject to a distribution fee of 0.25% per year and a service fee of 0.25% per year. These shares are available only to certain retirement plans and other similar plans. Prior to February 4, 2003, Class R Share performance results are those of Institutional Shares (which have no distribution or service fees) restated to reflect Class R Share fees. |
Performance information reflects past performance and does not guarantee future results. Current performance may be lower or higher than the performance data quoted. Refer to www.blackrock.com/funds to obtain performance data current to the most recent month end. Performance results do not reflect the deduction of taxes that a shareholder would pay on fund distributions or the redemption of fund shares. Figures shown in the performance table on the previous page assume reinvestment of all dividends and capital gain distributions, if any, at net asset value (“NAV”) on the ex-dividend date. Investment return and principal value of shares will fluctuate so that shares, when redeemed, may be worth more or less than their original cost. Dividends paid to each class of shares will vary because of the different levels of service, distribution and transfer agency fees applicable to each class, which are deducted from the income available to be paid to shareholders.
Disclosure of Expenses
Shareholders of the Fund may incur the following charges: (a) expenses related to transactions, including sales charges and exchange fees; and (b) operating expenses, including administration fees, service and distribution fees, including 12b-1 fees and other Fund expenses. The expense example on the previous page (which is based on a hypothetical investment of $1,000 invested on April 1, 2012 and held through September 30, 2012) is intended to assist shareholders both in calculating expenses based on an investment in the Fund and in comparing these expenses with similar costs of investing in other mutual funds.
The expense example provides information about actual account values and actual expenses. In order to estimate the expenses a shareholder paid during the period covered by this report, shareholders can divide their account value by $1,000 and then multiply the result by the number corresponding to their share class under the heading entitled “Expenses Paid During the Period.”
The expense example also provides information about hypothetical account values and hypothetical expenses based on the Fund’s actual expense ratio and an assumed rate of return of 5% per year before expenses. In order to assist shareholders in comparing the ongoing expenses of investing in the Fund and other funds, compare the 5% hypothetical example with the 5% hypothetical examples that appear in other funds’ shareholder reports.
The expenses shown in the expense example are intended to highlight shareholders’ ongoing costs only and do not reflect any transactional expenses, such as sales charges or exchange fees, if any. Therefore, the hypothetical example is useful in comparing ongoing expenses only, and will not help shareholders determine the relative total expenses of owning different funds. If these transactional expenses were included, shareholder expenses would have been higher.
Derivative Financial Instruments
The Master LLC may invest in various derivative financial instruments, including foreign currency exchange contracts, as specified in Note 2 of the Master LLC’s Notes to Financial Statements, which may constitute forms of economic leverage. Such derivative financial instruments are used to obtain exposure to a market without owning or taking physical custody of securities or to hedge market and foreign currency exchange rate risks. Derivative financial instruments involve risks, including the imperfect correlation between the value of a derivative financial instrument and the underlying asset, possible default of the counterparty to the transaction or illiquidity of the derivative financial instrument. The Master LLC’s ability to use a derivative financial instrument successfully depends on the investment advisor’s ability to predict pertinent market movements accurately, which cannot be assured. The use of derivative financial instruments may result in losses greater than if they had not been used, may require the Master LLC to sell or purchase portfolio investments at inopportune times or for distressed values, may limit the amount of appreciation the Master LLC can realize on an investment, may result in lower dividends paid to shareholders or may cause the Master LLC to hold an investment that it might otherwise sell. The Master LLC’s investments in these instruments are discussed in detail in the Master LLC’s Notes to Financial Statements.
| 6 | BLACKROCK VALUE OPPORTUNITIES FUND, INC. | SEPTEMBER 30, 2012 |
| |
| Statement of Assets and Liabilities | BlackRock Value Opportunities Fund, Inc. |
September 30, 2012 (Unaudited)
| | | |
| Assets | | | |
| Investments at value — Master LLC (cost — $711,123,476) | $ | 842,581,692 | |
| Withdrawals receivable from Master LLC | | 2,299,222 | |
| Capital shares sold receivable | | 849,404 | |
| Prepaid expenses | | 18,745 | |
| Total assets | | 845,749,063 | |
| |
| Liabilities | | | |
| Capital shares redeemed payable | | 3,148,626 | |
| Service and distribution fees payable | | 261,621 | |
| Administration fees payable | | 175,380 | |
| Officer’s fees payable | | 247 | |
| Other accrued expenses payable | | 757,042 | |
| Total liabilities | | 4,342,916 | |
| Net Assets | $ | 841,406,147 | |
| |
| Net Assets Consist of | | | |
| Paid-in capital | $ | 1,135,039,183 | |
| Distributions in excess of net investment income | | (3,222,323 | ) |
| Accumulated net realized loss allocated from the Master LLC | | (421,868,929 | ) |
| Net unrealized appreciation/depreciation allocated from the Master LLC | | 131,458,216 | |
| Net Assets | $ | 841,406,147 | |
| |
| Net Asset Value | | | |
| Institutional — Based on net assets of $227,407,472 and 10,605,891 shares outstanding, 100 million shares authorized, $0.10 par value | $ | 21.44 | |
| Investor A — Based on net assets of $383,454,220 and 18,271,125 shares outstanding, 100 million shares authorized, $0.10 par value | $ | 20.99 | |
| Investor B — Based on net assets of $32,314,727 and 1,863,848 shares outstanding, 100 million shares authorized, $0.10 par value | $ | 17.34 | |
| Investor C — Based on net assets of $170,776,269 and 10,341,480 shares outstanding, 100 million shares authorized, $0.10 par value | $ | 16.51 | |
| Class R — Based on net assets of $27,453,459 and 1,557,690 shares outstanding, 100 million shares authorized, $0.10 par value | $ | 17.62 | |
See Notes to Financial Statements.
| BLACKROCK VALUE OPPORTUNITIES FUND, INC. | SEPTEMBER 30, 2012 | 7 |
| |
| Statement of Operations | BlackRock Value Opportunities Fund, Inc. |
Six Months Ended September 30, 2012 (Unaudited)
| | | |
| Investment Income | | | |
| Net investment income allocated from the Master LLC: | | | |
| Dividends — unaffiliated | $ | 4,557,745 | |
| Securities lending — affiliated | | 480,991 | |
| Dividends — affiliated | | 19,728 | |
| Expenses | | (2,321,462 | ) |
| Fees waived | | 9,334 | |
| Total income | | 2,746,336 | |
| |
| |
| Fund Expenses | | | |
| Administration | | 1,050,813 | |
| Service — Investor A | | 468,020 | |
| Service and distribution — Investor B | | 207,308 | |
| Service and distribution — Investor C | | 865,478 | |
| Service and distribution — Class R | | 68,693 | |
| Transfer agent — Institutional | | 317,921 | |
| Transfer agent — Investor A | | 391,368 | |
| Transfer agent — Investor B | | 89,995 | |
| Transfer agent — Investor C | | 360,696 | |
| Transfer agent — Class R | | 43,342 | |
| Professional | | 39,041 | |
| Printing | | 24,766 | |
| Registration | | 23,116 | |
| Officer | | 397 | |
| Miscellaneous | | 8,371 | |
| Total expenses | | 3,959,325 | |
| Net investment loss | | (1,212,989 | ) |
| |
| |
| Realized and Unrealized Gain (Loss) Allocated from the Master LLC | | | |
| Net realized gain from investments and foreign currency transactions | | 46,128,702 | |
| Net change in unrealized depreciation on investments | | (53,098,044 | ) |
| Total realized and unrealized loss | | (6,969,342 | ) |
| Net Decrease in Net Assets Resulting from Operations | $ | (8,182,331 | ) |
See Notes to Financial Statements.
| 8 | BLACKROCK VALUE OPPORTUNITIES FUND, INC. | SEPTEMBER 30, 2012 |
| |
| Statements of Changes in Net Assets | BlackRock Value Opportunities Fund, Inc. |
| | | | | | |
| Increase (Decrease) in Net Assets: | Six Months
Ended
September 30,
2012
(Unaudited) | Year Ended
March 31,
2012 |
| Operations | | | | | | |
| Net investment loss | $ | (1,212,989 | ) | $ | (2,929,737 | ) |
| Net realized gain | | 46,128,702 | | | 138,398,237 | |
| Net change in unrealized appreciation/depreciation | | (53,098,044 | ) | | (147,360,026 | ) |
| Net decrease in net assets resulting from operations | | (8,182,331 | ) | | (11,891,526 | ) |
| |
| Capital Share Transactions | | | | | | |
| Net decrease in net assets derived from capital share transactions | | (72,282,405 | ) | | (293,751,362 | ) |
| |
| Net Assets | | | | | | |
| Total decrease in net assets | | (80,464,736 | ) | | (305,642,888 | ) |
| Beginning of period | | 921,870,883 | | | 1,227,513,771 | |
| End of period | $ | 841,406,147 | | $ | 921,870,883 | |
| Distributions in excess of net investment income | $ | (3,222,323 | ) | $ | (2,009,334 | ) |
See Notes to Financial Statements.
| BLACKROCK VALUE OPPORTUNITIES FUND, INC. | SEPTEMBER 30, 2012 | 9 |
| |
| Financial Highlights | BlackRock Value Opportunities Fund, Inc. |
| | | | | | | | | | | | | | | | | | |
| | Institutional |
| | Six Months
Ended
September 30,
2012
(Unaudited) |
Year Ended March 31, |
| | 2012 | 2011 | 2010 | 2009 | 2008 |
| Per Share Operating Performance | | | | | | | | | | | | | | | | | | |
| Net asset value, beginning of period | $ | 21.52 | | $ | 21.36 | | $ | 16.70 | | $ | 10.01 | | $ | 18.24 | | $ | 24.95 | |
| Net investment income1 | | 0.01 | | | 0.04 | | | 0.05 | | | 0.09 | | | 0.11 | | | 0.05 | |
| Net realized and unrealized gain (loss) | | (0.09 | ) | | 0.12 | | | 4.65 | 2 | | 6.65 | 2 | | (8.03 | )2 | | (2.82 | )2 |
| Net increase (decrease) from investment operations | | (0.08 | ) | | 0.16 | | | 4.70 | | | 6.74 | | | (7.92 | ) | | (2.77 | ) |
| Dividends and distributions from: | | | | | | | | | | | | | | | | | | |
| Net investment income | | — | | | — | | | (0.04 | ) | | (0.05 | ) | | — | | | — | |
| Net realized gain | | — | | | — | | | — | | | — | | | (0.31 | ) | | (3.94 | ) |
| Total dividends and distributions | | — | | | — | | | (0.04 | ) | | (0.05 | ) | | (0.31 | ) | | (3.94 | ) |
| Net asset value, end of period | $ | 21.44 | | $ | 21.52 | | $ | 21.36 | | $ | 16.70 | | $ | 10.01 | | $ | 18.24 | |
| |
| Total Investment Return3 | | | | | | | | | | | | | | | | | | |
| Based on net asset value | | (0.37 | )%4 | | 0.75 | % | | 28.24 | % | | 67.43 | %5 | | (44.18 | )% | | (13.48 | )% |
| |
| Ratios to Average Net Assets6 | | | | | | | | | | | | | | | | | | |
| Total expenses | | 1.10 | %7,8 | | 1.00 | %7 | | 1.01 | % | | 1.07 | % | | 1.09 | % | | 0.97 | % |
| Net investment income | | 0.10 | %7,8 | | 0.19 | %7 | | 0.30 | % | | 0.63 | % | | 0.68 | % | | 0.20 | % |
| |
| Supplemental Data | | | | | | | | | | | | | | | | | | |
| Net assets, end of period (000) | $ | 227,407 | | $ | 249,012 | | $ | 418,333 | | $ | 288,028 | | $ | 206,966 | | $ | 521,653 | |
| Portfolio turnover of the Master LLC | | 24 | % | | 45 | % | | 52 | % | | 79 | % | | 147 | % | | 109 | % |
| 1 | | Based on average shares outstanding. |
| 2 | | Includes a redemption fee, which is less than $0.01 per share. |
| 3 | | Where applicable, total investment returns include the reinvestment of dividends and distributions. |
| 4 | | Aggregate total investment return. |
| 5 | | Includes proceeds received from a settlement of litigation, through its investment in the Master LLC, which impacted the Fund’s total investment return. Not including these proceeds, the total investment return would have been 67.13%. |
| 6 | | Includes the Fund’s share of the Master LLC’s allocated expenses and/or net investment income. |
| 7 | | Includes the Fund’s share of the Master LLC’s allocated fees waived of less than 0.01%. |
See Notes to Financial Statements.
| 10 | BLACKROCK VALUE OPPORTUNITIES FUND, INC. | SEPTEMBER 30, 2012 |
| |
| Financial Highlights (continued) | BlackRock Value Opportunities Fund, Inc. |
| | | | | | | | | | | | | | | | | | |
| | Investor A |
| | Six Months
Ended
September 30,
2012
(Unaudited) |
Year Ended March 31, |
| | 2012 | 2011 | 2010 | 2009 | 2008 |
| Per Share Operating Performance | | | | | | | | | | | | | | | | | | |
| Net asset value, beginning of period | $ | 21.08 | | $ | 20.99 | | $ | 16.41 | | $ | 9.85 | | $ | 17.98 | | $ | 24.65 | |
| Net investment income (loss)1 | | (0.01 | ) | | (0.03 | ) | | 0.00 | 2 | | 0.04 | | | 0.06 | | | (0.01 | ) |
| Net realized and unrealized gain (loss) | | (0.08 | ) | | 0.12 | | | 4.58 | 3 | | 6.54 | 3 | | (7.88 | )3 | | (2.79 | )3 |
| Net increase (decrease) from investment operations | | (0.09 | ) | | 0.09 | | | 4.58 | | | 6.58 | | | (7.82 | ) | | (2.80 | ) |
| Dividends and distributions from: | | | | | | | | | | | | | | | | | | |
| Net investment income | | — | | | — | | | (0.00 | )4 | | (0.02 | ) | | — | | | — | |
| Net realized gain | | — | | | — | | | — | | | — | | | (0.31 | ) | | (3.87 | ) |
| Total dividends and distributions | | — | | | — | | | (0.00 | )4 | | (0.02 | ) | | (0.31 | ) | | (3.87 | ) |
| Net asset value, end of period | $ | 20.99 | | $ | 21.08 | | $ | 20.99 | | $ | 16.41 | | $ | 9.85 | | $ | 17.98 | |
| |
| Total Investment Return5 | | | | | | | | | | | | | | | | | | |
| Based on net asset value | | (0.43 | )%6 | | 0.43 | % | | 27.92 | % | 66.80 | %7 | | (44.27 | )% | | (13.74 | )% |
| |
| Ratios to Average Net Assets8 | | | | | | | | | | | | | | | | | | |
| Total expenses | | 1.28 | %9,10 | | 1.30 | %9 | | 1.29 | % | | 1.35 | % | | 1.34 | % | | 1.23 | % |
| Net investment income (loss) | | (0.08 | )%9,10 | | (0.14 | )%9 | | 0.02 | % | | 0.33 | % | | 0.39 | % | | (0.06 | )% |
| |
| Supplemental Data | | | | | | | | | | | | | | | | | | |
| Net assets, end of period (000) | $ | 383,454 | | $ | 397,591 | | $ | 445,797 | | $ | 403,008 | | $ | 264,870 | | $ | 499,605 | |
| Portfolio turnover of the Master LLC | | 24 | % | | 45 | % | | 52 | % | | 79 | % | | 147 | % | | 109 | % |
| 1 | | Based on average shares outstanding. |
| 2 | | Amount is less than $0.01 per share. |
| 3 | | Includes a redemption fee, which is less than $0.01 per share. |
| 4 | | Amount is less than $(0.01) per share. |
| 5 | | Where applicable, total investment returns exclude the effects of any sales charges and include the reinvestment of dividends and distributions. |
| 6 | | Aggregate total investment return. |
| 7 | | Includes proceeds received from a settlement of litigation, through its investment in the Master LLC, which impacted the Fund’s total investment return. Not including these proceeds, the total investment return would have been 66.49%. |
| 8 | | Includes the Fund’s share of the Master LLC’s allocated expenses and/or net investment income. |
| 9 | | Includes the Fund’s share of the Master LLC’s allocated fees waived of less than 0.01%. |
See Notes to Financial Statements.
| BLACKROCK VALUE OPPORTUNITIES FUND, INC. | SEPTEMBER 30, 2012 | 11 |
| |
| Financial Highlights (continued) | BlackRock Value Opportunities Fund, Inc. |
| | | | | | | | | | | | | | | | | | |
| | Investor B |
| | Six Months
Ended
September 30,
2012
(Unaudited) |
Year Ended March 31, |
| | 2012 | 2011 | | 2010 | 2009 | 2008 |
| Per Share Operating Performance | | | | | | | | | | | | | | | | | | |
| Net asset value, beginning of period | $ | 17.50 | | $ | 17.61 | | $ | 13.89 | | $ | 8.41 | | $ | 15.54 | | $ | 21.82 | |
| Net investment loss1 | | (0.09 | ) | | (0.18 | ) | | (0.13 | ) | | (0.07 | ) | | (0.06 | ) | | (0.18 | ) |
| Net realized and unrealized gain (loss) | | (0.07 | ) | | 0.07 | | | 3.85 | 2 | | 5.55 | 2 | | (6.76 | )2 | | (2.41 | )2 |
| Net increase (decrease) from investment operations | | (0.16 | ) | | (0.11 | ) | | 3.72 | | | 5.48 | | | (6.82 | ) | | (2.59 | ) |
| Distributions from net realized gain | | — | | | — | | | — | | | — | | | (0.31 | ) | | (3.69 | ) |
| Net asset value, end of period | $ | 17.34 | | $ | 17.50 | | $ | 17.61 | | $ | 13.89 | | $ | 8.41 | | $ | 15.54 | |
| |
| Total Investment Return3 | | | | | | | | | | | | | | | | | | |
| Based on net asset value | | (0.91 | )%4 | | (0.62 | )% | | 26.78 | % | | 65.16 | %5 | | (44.79 | )% | | (14.49 | )% |
| |
| Ratios to Average Net Assets6 | | | | | | | | | | | | | | | | | | |
| Total expenses | | 2.25 | %7,8 | | 2.30 | %7 | | 2.25 | % | | 2.34 | % | | 2.25 | % | | 2.08 | % |
| Net investment loss | | (1.07 | )%7,8 | | (1.14 | )%7 | | (0.93 | )% | | (0.64 | )% | | (0.46 | )% | | (0.89 | )% |
| |
| Supplemental Data | | | | | | | | | | | | | | | | | | |
| Net assets, end of period (000) | $ | 32,315 | | $ | 54,590 | | $ | 88,310 | | 109,461 | | $ | 110,538 | | $ | 311,312 | |
| Portfolio turnover of the Master LLC | | 24 | % | | 45 | % | | 52 | % | | 79 | % | | 147 | % | | 109 | % |
| 1 | | Based on average shares outstanding. |
| 2 | | Includes a redemption fee, which is less than $0.01 per share. |
| 3 | | Where applicable, total investment returns exclude the effects of any sales charges and include the reinvestment of dividends and distributions. |
| 4 | | Aggregate total investment return. |
| 5 | | Includes proceeds received from a settlement of litigation, through its investment in the Master LLC, which impacted the Fund’s total investment return. Not including these proceeds, the total investment return would have been 64.92%. |
| 6 | | Includes the Fund’s share of the Master LLC’s allocated expenses and/or net investment income. |
| 7 | | Includes the Fund’s share of the Master LLC’s allocated fees waived of less than 0.01%. |
See Notes to Financial Statements.
| 12 | BLACKROCK VALUE OPPORTUNITIES FUND, INC. | SEPTEMBER 30, 2012 |
| |
| Financial Highlights (continued) | BlackRock Value Opportunities Fund, Inc. |
| | | | | | | | | | | | | | | | | | |
| | Investor C |
| | Six Months
Ended
September 30,
2012
(Unaudited) |
Year Ended March 31, |
| | 2012 | 2011 | 2010 | 2009 | 2008 |
| Per Share Operating Performance | | | | | | | | | | | | | | | | | |
| Net asset value, beginning of period | $ | 16.67 | | $ | 16.76 | | $ | 13.23 | | $ | 8.01 | | $ | 14.83 | | $ | 21.01 | |
| Net investment loss1 | | (0.08 | ) | | (0.17 | ) | | (0.13 | ) | | (0.08 | ) | | (0.07 | ) | | (0.19 | ) |
| Net realized and unrealized gain (loss) | | (0.08 | ) | | 0.08 | | | 3.66 | 2 | | 5.30 | 2 | | (6.44 | )2 | | (2.28 | )2 |
| Net increase (decrease) from investment operations | | (0.16 | ) | | (0.09 | ) | | 3.53 | | | 5.22 | | | (6.51 | ) | | (2.47 | ) |
| Distributions from net realized gain | | — | | | — | | | — | | | — | | | (0.31 | ) | | (3.71 | ) |
| Net asset value, end of period | $ | 16.51 | | $ | 16.67 | | $ | 16.76 | | $ | 13.23 | | $ | 8.01 | | $ | 14.83 | |
| |
| Total Investment Return3 | | | | | | | | | | | | | | | | | | |
| Based on net asset value | | (0.96 | )%4 | | (0.54 | )% | | 26.68 | % | | 65.17 | %5 | | (44.85 | )% | | (14.51 | )% |
| |
| Ratios to Average Net Assets6 | | | | | | | | | | | | | | | | | |
| Total expenses | | 2.25 | %7,8 | | 2.25 | %7 | | 2.26 | % | | 2.40 | % | | 2.34 | % | | 2.13 | % |
| Net investment loss | | (1.04 | )%7,8 | | (1.09 | )%7 | | (0.94 | )% | | (0.71 | )% | | (0.58 | )% | | (0.96 | )% |
| |
| Supplemental Data | | | | | | | | | | | | | | | | | | |
| Net assets, end of period (000) | $ | 170,776 | | $ | 190,059 | | $ | 232,996 | | $215,916 | | $ | 155,267 | | $ | 355,755 | |
| Portfolio turnover of the Master LLC | | 24 | % | | 45 | % | | 52 | % | | 79 | % | | 147 | % | | 109 | % |
| 1 | | Based on average shares outstanding. |
| 2 | | Includes a redemption fee, which is less than $0.01 per share. |
| 3 | | Where applicable, total investment returns exclude the effects of any sales charges and include the reinvestment of dividends and distributions. |
| 4 | | Aggregate total investment return. |
| 5 | | Includes proceeds received from a settlement of litigation, through its investment in the Master LLC, which impacted the Fund’s total investment return. Not including these proceeds, the total investment return would have been 64.92%. |
| 6 | | Includes the Fund’s share of the Master LLC’s allocated expenses and/or net investment income. |
| 7 | | Includes the Fund’s share of the Master LLC’s allocated fees waived of less than 0.01%. |
See Notes to Financial Statements.
| BLACKROCK VALUE OPPORTUNITIES FUND, INC. | SEPTEMBER 30, 2012 | 13 |
| |
| Financial Highlights (concluded) | BlackRock Value Opportunities Fund, Inc. |
| | | | | | | | | | | | | | | | | | |
| | Class R |
| | Six Months
Ended
September 30,
2012
(Unaudited) |
Year Ended March 31, |
| | 2012 | 2011 | 2010 | 2009 | 2008 |
| Per Share Operating Performance | | | | | | | | | | | | | | | | | |
| Net asset value, beginning of period | $ | 17.73 | | $ | 17.72 | | $ | 13.90 | | $ | 8.36 | | $ | 15.38 | | $ | 21.69 | |
| Net investment loss 1 | | (0.04 | ) | | (0.08 | ) | | (0.05 | ) | | (0.01 | ) | | (0.00 | )2 | | (0.10 | ) |
| Net realized and unrealized gain (loss) | | (0.07 | ) | | 0.09 | | | 3.87 | 3 | | 5.55 | 3 | | (6.71 | )3 | | (2.38 | )3 |
| Net increase (decrease) from investment operations | | (0.11 | ) | | 0.01 | | | 3.82 | | | 5.54 | | | (6.71 | ) | | (2.48 | ) |
| Distributions from net realized gain | | — | | | — | | | — | | | — | | | (0.31 | ) | | (3.83 | ) |
| Net asset value, end of period | $ | 17.62 | | $ | 17.73 | | $ | 17.72 | | $ | 13.90 | | $ | 8.36 | | $ | 15.38 | |
| |
| Total Investment Return4 | | | | | | | | | | | | | | | | | | |
| Based on net asset value | | (0.62 | )%5 | | 0.06 | % | | 27.48 | % | 66.27 | %6 | | (44.54 | )% | | (14.13 | )% |
| |
| Ratios to Average Net Assets7 | | | | | | | | | | | | | | | | | | |
| Total expenses | | 1.64 | %8,9 | | 1.65 | %8 | | 1.65 | % | | 1.75 | % | | 1.76 | % | | 1.65 | % |
| Net investment loss | | (0.44 | )%8,9 | | (0.50 | )%8 | | (0.33 | )% | (0.05 | )% | | (0.02 | )% | | (0.52 | )% |
| |
| Supplemental Data | | | | | | | | | | | | | | | | | | |
| Net assets, end of period (000) | $ | 27,453 | | $ | 30,620 | | $ | 42,078 | | $39,126 | | $ | 31,767 | | $ | 60,194 | |
| Portfolio turnover of the Master LLC | | 24 | % | | 45 | % | | 52 | % | | 79 | % | | 147 | % | | 109 | % |
| 1 | | Based on average shares outstanding. |
| 2 | | Amount is less than $(0.01) per share. |
| 3 | | Includes a redemption fee, which is less than $0.01 per share. |
| 4 | | Where applicable, total investment returns include the reinvestment of dividends and distributions. |
| 5 | | Aggregate total investment return. |
| 6 | | Includes proceeds received from a settlement of litigation, through its investment in the Master LLC, which impacted the Fund’s total investment return. Not including these proceeds, the total investment return would have been 66.03%. |
| 7 | | Includes the Fund’s share of the Master LLC’s allocated expenses and/or net investment income. |
| 8 | | Includes the Fund’s share of the Master LLC’s allocated fees waived of less than 0.01%. |
See Notes to Financial Statements.
| 14 | BLACKROCK VALUE OPPORTUNITIES FUND, INC. | SEPTEMBER 30, 2012 |
| |
| Notes to Financial Statements (Unaudited) | BlackRock Value Opportunities Fund, Inc. |
1. Organization and Significant Accounting Policies:
BlackRock Value Opportunities Fund, Inc. (the “Fund”) is registered under the Investment Company Act of 1940, as amended (the “1940 Act”), as a diversified, open-end management investment company. The Fund is organized as a Maryland corporation. The Fund seeks to achieve its investment objective by investing all of its assets in Master Value Opportunities LLC (the “Master LLC”), an affiliate of the Fund, which has the same investment objective and strategies as the Fund. The value of the Fund’s investment in the Master LLC reflects the Fund’s proportionate interest in the net assets of the Master LLC. The performance of the Fund is directly affected by the performance of the Master LLC. The percentage of the Master LLC owned by the Fund at September 30, 2012 was 99.4%. The financial statements of the Master LLC, including the Schedule of Investments, are included elsewhere in this report and should be read in conjunction with the Fund’s financial statements. The Fund’s financial statements are prepared in conformity with accounting principles generally accepted in the United States of America (“US GAAP”), which may require management to make estimates and assumptions that affect the reported amounts of assets and liabilities in the financial statements and the reported amounts of increases and decreases in net assets from operations during the reporting period. Actual results could differ from those estimates. The Fund offers multiple classes of shares. Institutional Shares are sold without a sales charge and only to certain eligible investors. Investor A Shares are generally sold with a front-end sales charge. Investor B and Investor C Shares may be subject to a CDSC. Class R Shares are sold without a sales charge and only to certain retirement and other similar plans. All classes of shares have identical voting, dividend, liquidation and other rights and the same terms and conditions, except that Investor A, Investor B, Investor C and Class R Shares bear certain expenses related to the shareholder servicing of such shares, and Investor B, Investor C and Class R Shares also bear certain expenses related to the distribution of such shares. Investor B Shares automatically convert to Investor A Shares after approximately eight years. Investor B Shares are only available through exchanges, dividend reinvestment by existing shareholders or for purchase by certain qualified employee benefit plans. Each class has exclusive voting rights with respect to matters relating to its shareholder servicing and distribution expenditures (except that Investor B shareholders may vote on material changes to the Investor A distribution and service plan).
The following is a summary of significant accounting policies followed by the Fund:
Valuation: US GAAP defines fair value as the price the Fund would receive to sell an asset or pay to transfer a liability in an orderly transaction between market participants at the measurement date. The Fund’s policy is to fair value its financial instruments at market value. The Fund records its investment in the Master LLC at fair value based on the Fund’s proportionate interest in the net assets of the Master LLC. Valuation of securities held by the Master LLC is discussed in Note 1 of the Master LLC’s Notes to Financial Statements, which are included elsewhere in this report.
Investment Transactions and Investment Income: For financial reporting purposes, contributions to and withdrawals from the Master LLC are accounted for on a trade date basis. The Fund records daily its proportionate share of the Master LLC’s income, expenses and realized and unrealized gains and losses. Realized and unrealized gains and losses are adjusted for utilizing partnership tax allocation rules. In addition, the Fund accrues its own expenses. Income, expenses and realized and unrealized gains and losses are allocated daily to each class based on its relative net assets.
Dividends and Distributions: Dividends and distributions paid by the Fund are recorded on the ex-dividend dates. The portion of distributions that exceeds the Fund’s current and accumulated earnings and profits, which are measured on a tax basis, will constitute a nontaxable return of capital. Distributions in excess of the Fund’s taxable income and net capital gains, but not in excess of the Fund’s earnings and profits, will be taxable to shareholders as ordinary income and will not constitute a nontaxable return of capital. Capital losses carried forward from years beginning before 2011 do not reduce earnings and profits, even if such carried forward losses offset current year realized gains. The character and timing of dividends and distributions are determined in accordance with federal income tax regulations, which may differ from US GAAP.
Income Taxes: It is the Fund’s policy to comply with the requirements of the Internal Revenue Code of 1986, as amended, applicable to regulated investment companies and to distribute substantially all of its taxable income to its shareholders. Therefore, no federal income tax provision is required.
The Fund files US federal and various state and local tax returns. No income tax returns are currently under examination. The statute of limitations on the Fund’s US federal tax returns remains open for each of the four years ended March 31, 2012. The statutes of limitations on the Fund’s state and local tax returns may remain open for an additional year depending upon the jurisdiction. Management does not believe there are any uncertain tax positions that require recognition of a tax liability.
Other: Expenses directly related to the Fund or its classes are charged to the Fund or that class. Other operating expenses shared by several funds are pro rated among those funds on the basis of relative net assets or other appropriate methods. Expenses directly related to the Fund and other shared expenses pro rated to the Fund are allocated daily to each class based on its relative net assets or other appropriate methods.
| BLACKROCK VALUE OPPORTUNITIES FUND, INC. | SEPTEMBER 30, 2012 | 15 |
| |
| Notes to Financial Statements (continued) | BlackRock Value Opportunities Fund, Inc. |
2. Administration Agreement and Other Transactions with Affiliates:
The PNC Financial Services Group, Inc. (“PNC”) is the largest stockholder and an affiliate, for 1940 Act purposes, of BlackRock, Inc. (“BlackRock”).
The Fund entered into an Administration Agreement with BlackRock Advisors, LLC (the “Administrator”), an indirect, wholly owned subsidiary of BlackRock, to provide administrative services (other than investment advice and related portfolio activities). For such services, the Fund pays the Administrator a monthly fee at an annual rate of 0.25% of the average daily value of the Fund’s net assets. The Fund does not pay an investment advisory fee or investment management fee.
The Fund entered into a Distribution Agreement and Distribution and Service Plan with BlackRock Investments, LLC (“BRIL”), an affiliate of the Administrator. Pursuant to the Distribution and Service Plan and in accordance with Rule 12b-1 under the 1940 Act, the Fund pays BRIL ongoing service and distribution fees. The fees are accrued daily and paid monthly at annual rates based upon the average daily net assets of the shares of the Fund as follows:
| | | | |
| | Service
Fee | Distribution
Fee |
| Investor A | 0.25 | % | — | |
| Investor B | 0.25 | % | 0.75 | % |
| Investor C | 0.25 | % | 0.75 | % |
| Class R | 0.25 | % | 0.25 | % |
Pursuant to sub-agreements with BRIL, broker-dealers and BRIL provide shareholder servicing and distribution services to the Fund. The ongoing service and/or distribution fee compensates BRIL and each broker-dealer for providing shareholder servicing and/or distribution related services to Investor A, Investor B, Investor C and Class R shareholders.
For the six months ended September 30, 2012, affiliates earned underwriting discounts, direct commissions and dealer concessions on sales of the Fund’s Investor A Shares, which totaled $1,360.
For the six months ended September 30, 2012, affiliates received CDSCs as follows:
| | |
| Investor A | $ | 22 |
| Investor B | $ | 256 |
| Investor C | $ | 1,041 |
Pursuant to written agreements, certain financial intermediaries, some of which may be affiliates, provide the Fund with sub-accounting, recordkeeping, sub-transfer agency and other administrative services with respect to sub-accounts they service. For these services, these entities receive an annual fee per shareholder account, which will vary depending on share class and/or net assets. For the six months ended September 30, 2012, the Fund paid the following to affiliates in return for these services, which is included in transfer agent — class specific in the Statement of Operations:
The Administrator maintains a call center, which is responsible for providing certain shareholder services to the Fund, such as responding to shareholder inquiries and processing transactions based upon instructions from shareholders with respect to the subscription and redemption of Fund shares. For the six months ended September 30, 2012, the Fund reimbursed the Administrator the following amounts for costs incurred in running the call center, which are included in transfer agent — class specific in the Statement of Operations:
| | |
| Institutional | $ | 937 |
| Investor A | $ | 952 |
| Investor B | $ | 129 |
| Investor C | $ | 687 |
| Class R | $ | 85 |
Certain officers and/or directors of the Fund are officers and/or directors of BlackRock or its affiliates. The Fund reimburses the Administrator for a portion of the compensation paid to the Fund’s Chief Compliance Officer.
3. Capital Loss Carryforward:
As of March 31, 2012, the Fund had a capital loss carryforward of $455,091,100 available to offset future realized capital gains, all of which expires March 31, 2018.
| 16 | BLACKROCK VALUE OPPORTUNITIES FUND, INC. | SEPTEMBER 30, 2012 |
| |
| Notes to Financial Statements (concluded) | BlackRock Value Opportunities Fund, Inc. |
4. Capital Share Transactions:
Transactions in capital shares for each class were as follows:
| | | | | | | | | | | |
| | Six Months Ended
September 30, 2012 | | Year Ended
March 31, 2012 |
| | Shares | Amount | | Shares | Amount |
| Institutional | | | | | | | | | | | |
| Shares sold | 383,384 | | $ | 7,935,473 | | | 2,841,087 | | $ | 57,039,677 | |
| Shares redeemed | (1,350,755 | ) | (27,998,853 | ) | | (10,849,660 | ) | | (223,552,762 | ) |
| Net decrease | (967,371 | ) | $(20,063,380 | ) | | (8,008,573 | ) | $(166,513,085 | ) |
| |
| Investor A | | | | | | | | | | | |
| Shares sold and automatic conversion of shares | 1,659,823 | | $ | 33,022,718 | | | 3,486,773 | | $ | 66,350,628 | |
| Shares redeemed | (2,250,813 | ) | (45,002,187 | ) | | (5,860,845 | ) | | (113,839,538 | ) |
| Net decrease | (590,990 | ) | $(11,979,469 | ) | | (2,374,072 | ) | $ | (47,488,910 | ) |
| |
| Investor B | | | | | | | | | | | |
| Shares sold | 146,561 | | $ | 2,422,689 | | | 579,222 | | $ | 9,371,713 | |
| Shares redeemed and automatic conversion of shares | (1,401,906 | ) | (23,055,303 | ) | | (2,475,819 | ) | | (40,119,371 | ) |
| Net decrease | (1,255,345 | ) | $(20,632,614 | ) | | (1,896,597 | ) | $ | (30,747,658 | ) |
| |
| Investor C | | | | | | | | | | | |
| Shares sold | 508,175 | | $ | 8,014,496 | | | 1,480,057 | | $ | 22,919,456 | |
| Shares redeemed | (1,570,416 | ) | (24,791,569 | ) | | (3,980,857 | ) | | (61,111,596 | ) |
| Net decrease | (1,062,241 | ) | $(16,777,073 | ) | | (2,500,800 | ) | $ | (38,192,140 | ) |
| |
| Class R | | | | | | | | | | | |
| Shares sold | 253,793 | | $ | 4,253,597 | | | 593,645 | | $ | 9,807,192 | |
| Shares redeemed | (422,802 | ) | | (7,083,466 | ) | | (1,241,126 | ) | | (20,616,761 | ) |
| Net decrease | (169,009 | ) | $ | (2,829,869 | ) | | (647,481 | ) | $ | (10,809,569 | ) |
| Total Net Decrease | (4,044,956 | ) | $(72,282,405 | ) | | (15,427,523 | ) | $(293,751,362 | ) |
5. Subsequent Events:
Management has evaluated the impact of all subsequent events on the Fund through the date the financial statements were issued and has determined that there were no subsequent events requiring adjustment or additional disclosure in the financial statements.
| BLACKROCK VALUE OPPORTUNITIES FUND, INC. | SEPTEMBER 30, 2012 | 17 |
| |
| Master LLC Portfolio Information | Master Value Opportunities LLC |
As of September 30, 2012
| | |
| Ten Largest Holdings | Percent of
Long-Term Investments |
| DuPont Fabros Technology, Inc. | 2 | % |
| Tenet Healthcare Corp. | 2 | |
| SM Energy Co. | 1 | |
| Wright Medical Group, Inc. | 1 | |
| NuVasive, Inc. | 1 | |
| Affymetrix, Inc. | 1 | |
| Africa Oil Corp. | 1 | |
| Rockwood Holdings, Inc. | 1 | |
| Carpenter Technology Corp. | 1 | |
| Men’s Wearhouse, Inc. | 1 | |
| | |
| Sector Allocations | Percent of
Long-Term Investments |
| Financials | 19 | % |
| Industrials | 17 | |
| Consumer Discretionary | 15 | |
| Health Care | 14 | |
| Information Technology | 13 | |
| Energy | 11 | |
| Materials | 6 | |
| Utilities | 4 | |
| Consumer Staples | 1 | |
For Master LLC compliance purposes, the Master LLC’s sector classifications refer to any one or more of the sector sub-classifications used by one or more widely recognized market indexes or ratings group indexes, and/or as defined by Master LLC management. These definitions may not apply for purposes of this report, which may combine such sector sub-classifications for reporting ease.
| 18 | BLACKROCK VALUE OPPORTUNITIES FUND, INC. | SEPTEMBER 30, 2012 |
| |
| Schedule of Investments September 30, 2012 (Unaudited) | Master Value Opportunities LLC
(Percentages shown are based on Net Assets) |
| | |
| Common Stocks | Shares | Value |
| |
| Aerospace & Defense — 4.7% | | |
| Curtiss-Wright Corp. | 131,300 | $ | 4,293,510 |
| Esterline Technologies Corp. (a) | 125,100 | 7,023,114 |
| The KEYW Holding Corp. (a) | 380,600 | 4,757,500 |
| Moog, Inc., Class A (a)(b) | 186,400 | 7,058,968 |
| Orbital Sciences Corp. (a) | 504,400 | 7,344,064 |
| Spirit AeroSystems Holdings, Inc., Class A (a) | 429,000 | 9,528,090 |
| | | 40,005,246 |
| Automobiles — 0.6% | | |
| Thor Industries, Inc. | 143,125 | 5,198,300 |
| Beverages — 0.6% | | |
| Cott Corp. (a) | 683,200 | 5,397,280 |
| Biotechnology — 0.8% | | |
| Geron Corp. (a) | 791,800 | 1,346,060 |
| MannKind Corp. (a)(b) | 940,139 | 2,707,600 |
| Pacific Biosciences of California, Inc. (a) | 516,700 | 945,561 |
| XOMA Corp. (a) | 523,200 | 1,930,608 |
| | | 6,929,829 |
| Capital Markets — 0.3% | | |
| Investment Technology Group, Inc. (a) | 313,500 | 2,727,450 |
| Chemicals — 2.6% | | |
| Ferro Corp. (a)(b) | 249,800 | 856,814 |
| Georgia Gulf Corp. | 58,400 | 2,115,248 |
| Huntsman Corp. | 319,900 | 4,776,107 |
| OM Group, Inc. (a) | 131,100 | 2,430,594 |
| Rockwood Holdings, Inc. | 213,500 | 9,949,100 |
| Spartech Corp. (a) | 315,400 | 1,687,390 |
| | | 21,815,253 |
| Commercial Banks — 11.8% | | |
| Banner Corp. | 172,799 | 4,682,853 |
| BBCN Bancorp, Inc. (a) | 684,500 | 8,631,545 |
| Boston Private Financial Holdings, Inc. | 585,676 | 5,616,633 |
| F.N.B Corp. | 257,000 | 2,880,970 |
| First Commonwealth Financial Corp. | 786,100 | 5,542,005 |
| First Financial Bankshares, Inc. | 108,550 | 3,911,056 |
| Glacier Bancorp, Inc. | 426,600 | 6,646,428 |
| Independent Bank Corp./MA | 193,900 | 5,834,451 |
| National Penn Bancshares, Inc. | 1,025,600 | 9,343,216 |
| Old National Bancorp | 666,700 | 9,073,787 |
| PacWest Bancorp | 117,600 | 2,748,312 |
| Pinnacle Financial Partners, Inc. (a)(b) | 373,900 | 7,223,748 |
| PrivateBancorp, Inc. | 306,300 | 4,897,737 |
| Susquehanna Bancshares, Inc. | 877,000 | 9,173,420 |
| UMB Financial Corp. | 26,200 | 1,275,416 |
| Umpqua Holdings Corp. | 578,700 | 7,459,443 |
| Wintrust Financial Corp. | 136,100 | 5,113,277 |
| | | 100,054,297 |
| Commercial Services & Supplies — 1.1% | | |
| ACCO Brands Corp. (a) | 710,400 | 4,610,496 |
| EnerNOC, Inc. (a) | 384,700 | 4,993,406 |
| | | 9,603,902 |
| Communications Equipment — 2.0% | | |
| Arris Group, Inc. (a) | 615,400 | 7,870,966 |
| Harmonic, Inc. (a) | 811,000 | 3,681,940 |
| Polycom, Inc. (a)(b) | 539,600 | 5,325,852 |
| | | 16,878,758 |
| | |
| Common Stocks | Shares | Value |
| |
| Computers & Peripherals — 1.0% | | |
| NCR Corp. (a) | 249,543 | $ | 5,816,847 |
| QLogic Corp. (a)(b) | 207,400 | 2,368,508 |
| | | 8,185,355 |
| Construction & Engineering — 0.8% | | |
| KBR, Inc. | 221,200 | 6,596,184 |
| Containers & Packaging — 0.9% | | |
| Packaging Corp. of America | 71,600 | 2,599,080 |
| Rock-Tenn Co., Class A | 74,180 | 5,354,312 |
| | | 7,953,392 |
| Electric Utilities — 1.7% | | |
| Allete, Inc. | 185,300 | 7,734,422 |
| El Paso Electric Co. | 67,323 | 2,305,813 |
| Hawaiian Electric Industries, Inc. | 176,000 | 4,630,560 |
| | | 14,670,795 |
| Electronic Equipment, Instruments | | |
| & Components — 3.3% | | |
| Anixter International, Inc. | 120,000 | 6,895,200 |
| Ingram Micro, Inc., Class A (a) | 390,100 | 5,941,223 |
| Plexus Corp. (a)(b) | 134,300 | 4,067,947 |
| Rofin-Sinar Technologies, Inc. (a)(b) | 269,100 | 5,309,343 |
| ScanSource, Inc. (a)(b) | 194,300 | 6,221,486 |
| | | 28,435,199 |
| Energy Equipment & Services — 1.7% | | |
| McDermott International, Inc. (a) | 222,600 | 2,720,172 |
| Oil States International, Inc. (a) | 55,900 | 4,441,814 |
| Pioneer Energy Services Corp. (a)(b) | 466,057 | 3,630,584 |
| Tetra Technologies, Inc. (a) | 552,300 | 3,341,415 |
| | | 14,133,985 |
| Gas Utilities — 0.8% | | |
| Southwest Gas Corp. | 157,200 | 6,948,240 |
| Health Care Equipment & Supplies — 5.6% | | |
| CONMED Corp. | 156,884 | 4,471,194 |
| Hansen Medical, Inc. (a)(b) | 1,575,400 | 3,072,030 |
| Invacare Corp. | 549,164 | 7,765,179 |
| NuVasive, Inc. (a)(b) | 500,490 | 11,466,226 |
| OraSure Technologies, Inc. (a)(b) | 792,015 | 8,807,207 |
| Wright Medical Group, Inc. (a)(b) | 531,828 | 11,758,717 |
| | | 47,340,553 |
| Health Care Providers & Services — 6.7% | | |
| Brookdale Senior Living, Inc. (a) | 314,716 | 7,307,706 |
| Gentiva Health Services, Inc. (a)(b) | 687,798 | 7,785,873 |
| Healthways, Inc. (a) | 680,510 | 7,968,772 |
| Kindred Healthcare, Inc. (a)(b) | 696,344 | 7,924,395 |
| LCA-Vision, Inc. (a) | 793,203 | 3,204,540 |
| Owens & Minor, Inc. | 310,206 | 9,268,955 |
| Tenet Healthcare Corp. (a)(b) | 2,164,615 | 13,572,136 |
| | | 57,032,377 |
| Hotels, Restaurants & Leisure — 2.1% | | |
| Papa John’s International, Inc. (a) | 136,889 | 7,311,242 |
| Ruby Tuesday, Inc. (a)(b) | 582,000 | 4,219,500 |
| Ryman Hospitality Properties (b) | 157,300 | 6,218,069 |
| | | 17,748,811 |
| Household Durables — 2.1% | | |
| KB Home (b) | 416,500 | 5,976,775 |
| MDC Holdings, Inc. | 77,939 | 3,001,431 |
| Skullcandy, Inc. (a)(b) | 255,500 | 3,513,125 |
See Notes to Financial Statements.
| BLACKROCK VALUE OPPORTUNITIES FUND, INC. | SEPTEMBER 30, 2012 | 19 |
| |
| Schedule of Investments (continued) | Master Value Opportunities LLC
(Percentages shown are based on Net Assets) |
| | |
| Common Stocks | Shares | Value |
| |
| Household Durables (concluded) | | |
| SodaStream International Ltd. (a) | 134,100 | $ | 5,252,697 |
| | | 17,744,028 |
| Insurance — 1.2% | | |
| National Financial Partners Corp. (a) | 90,600 | 1,531,140 |
| Selective Insurance Group, Inc. | 437,300 | 8,304,327 |
| | | 9,835,467 |
| Internet & Catalog Retail — 0.1% | | |
| CafePress, Inc. (a) | 57,939 | 527,824 |
| IT Services — 0.8% | | |
| Acxiom Corp. (a) | 362,886 | 6,629,927 |
| Leisure Equipment & Products — 0.1% | | |
| Leapfrog Enterprises, Inc. (a)(b) | 116,330 | 1,049,297 |
| Life Sciences Tools & Services — 1.2% | | |
| Affymetrix, Inc. (a)(b) | 2,388,918 | 10,344,015 |
| Machinery — 8.4% | | |
| AGCO Corp. (a) | 177,000 | 8,403,960 |
| Altra Holdings, Inc. | 495,378 | 9,015,880 |
| Briggs & Stratton Corp. | 407,600 | 7,609,892 |
| CIRCOR International, Inc. | 171,900 | 6,489,225 |
| EnPro Industries, Inc. (a)(b) | 238,300 | 8,581,183 |
| IDEX Corp. | 232,400 | 9,707,348 |
| Kennametal, Inc. | 148,300 | 5,498,964 |
| RBC Bearings, Inc. (a)(b) | 187,700 | 9,028,370 |
| Robbins & Myers, Inc. | 21,600 | 1,287,360 |
| Terex Corp. (a)(b) | 216,100 | 4,879,538 |
| Wabash National Corp. (a) | 83,802 | 597,508 |
| | | 71,099,228 |
| Metals & Mining — 1.2% | | |
| Carpenter Technology Corp. | 189,800 | 9,930,336 |
| Multi-Utilities — 1.1% | | |
| NorthWestern Corp. | 254,600 | 9,224,158 |
| Multiline Retail — 1.1% | | |
| Big Lots, Inc. (a)(b) | 124,700 | 3,688,626 |
| Fred’s, Inc., Class A | 376,814 | 5,362,063 |
| | | 9,050,689 |
| Oil, Gas & Consumable Fuels — 6.8% | | |
| Africa Oil Corp. (a) | 1,021,200 | 10,065,536 |
| Bill Barrett Corp. (a)(b) | 157,800 | 3,908,706 |
| Cabot Oil & Gas Corp. | 103,498 | 4,647,060 |
| Carrizo Oil & Gas, Inc. (a)(b) | 286,200 | 7,157,862 |
| Gastar Exploration Ltd. (a)(b) | 1,416,643 | 2,351,627 |
| Goodrich Petroleum Corp. (a)(b) | 256,300 | 3,239,632 |
| Oasis Petroleum, Inc. (a) | 316,824 | 9,336,803 |
| SM Energy Co. | 219,100 | 11,855,501 |
| Whiting Petroleum Corp. (a) | 117,000 | 5,543,460 |
| | | 58,106,187 |
| Paper & Forest Products — 0.9% | | |
| Schweitzer-Mauduit International, Inc. | 167,040 | 5,510,650 |
| Wausau Paper Corp. | 254,000 | 2,352,040 |
| | | 7,862,690 |
| Professional Services — 1.0% | | |
| Kelly Services, Inc., Class A | 306,600 | 3,863,160 |
| Kforce, Inc. (a) | 373,000 | 4,397,670 |
| | | 8,260,830 |
| | |
| Common Stocks | Shares | Value |
| |
| Real Estate Investment Trusts (REITs) — 7.9% | | |
| Acadia Realty Trust (b) | 388,887 | $ | 9,652,175 |
| BioMed Realty Trust, Inc. (b) | 345,700 | 6,471,504 |
| CommonWealth REIT | 265,275 | 3,862,404 |
| Corporate Office Properties Trust (b) | 191,300 | 4,585,461 |
| Cousins Properties, Inc. | 963,581 | 7,650,833 |
| DuPont Fabros Technology, Inc. (b) | 540,700 | 13,652,675 |
| Kilroy Realty Corp. (b) | 47,868 | 2,143,529 |
| Lexington Realty Trust (b) | 651,206 | 6,290,650 |
| Omega Healthcare Investors, Inc. (b) | 199,577 | 4,536,385 |
| Rouse Properties, Inc. (b) | 549,710 | 7,888,339 |
| | | 66,733,955 |
| Road & Rail — 1.1% | | |
| Marten Transport Ltd. | 270,248 | 4,748,257 |
| Vitran Corp., Inc. (a) | 784,021 | 4,664,925 |
| | | 9,413,182 |
| Semiconductors & Semiconductor | | |
| Equipment — 2.2% | | |
| DSP Group, Inc. (a) | 816,137 | 4,847,854 |
| Fairchild Semiconductor International, Inc. (a)(b) | 302,400 | 3,967,488 |
| PMC-Sierra, Inc. (a) | 977,200 | 5,511,408 |
| Teradyne, Inc. (a)(b) | 286,800 | 4,078,296 |
| | | 18,405,046 |
| Software — 3.4% | | |
| Bottomline Technologies, Inc. (a)(b) | 290,497 | 7,172,371 |
| Compuware Corp. (a) | 555,800 | 5,507,978 |
| Parametric Technology Corp. (a) | 209,300 | 4,562,740 |
| Progress Software Corp. (a) | 88,900 | 1,901,571 |
| Take-Two Interactive Software, Inc. (a)(b) | 919,400 | 9,589,342 |
| | | 28,734,002 |
| Specialty Retail — 6.0% | | |
| Ascena Retail Group, Inc. (a) | 327,330 | 7,021,229 |
| Chico’s FAS, Inc. | 205,000 | 3,712,550 |
| The Children’s Place Retail Stores, Inc. (a)(b) | 115,800 | 6,948,000 |
| Express, Inc. (a) | 507,300 | 7,518,186 |
| Genesco, Inc. (a) | 102,300 | 6,826,479 |
| Hot Topic, Inc. | 292,900 | 2,548,230 |
| The Men’s Wearhouse, Inc. | 288,187 | 9,922,278 |
| Penske Automotive Group, Inc. | 191,100 | 5,750,199 |
| Tilly’s, Inc. Class A (a) | 51,500 | 943,995 |
| | | 51,191,146 |
| Textiles, Apparel & Luxury Goods — 2.8% | | |
| G-III Apparel Group Ltd. (a)(b) | 191,192 | 6,863,793 |
| The Jones Group, Inc. | 490,216 | 6,309,080 |
| Perry Ellis International, Inc. (a)(b) | 137,078 | 3,022,570 |
| The Warnaco Group, Inc. (a) | 89,800 | 4,660,620 |
| Wolverine World Wide, Inc. | 59,800 | 2,653,326 |
| | | 23,509,389 |
| Thrifts & Mortgage Finance — 0.9% | | |
| Provident Financial Services, Inc. | 466,700 | 7,369,193 |
| Trading Companies & Distributors — 0.2% | | |
| Air Lease Corp. (a) | 83,600 | 1,705,440 |
| Total Common Stocks — 99.6% | | 844,381,235 |
See Notes to Financial Statements.
| 20 | BLACKROCK VALUE OPPORTUNITIES FUND, INC. | SEPTEMBER 30, 2012 |
| |
| Schedule of Investments (concluded) | Master Value Opportunities LLC
(Percentages shown are based on Net Assets) |
| | |
| Warrants (c) | Shares | Value |
| |
| Biotechnology — 0.0% | | |
| MannKind Corp. (Issued/exercisable 2/06/12, | |
| 0.6 Share for 1 warrant, Expires 2/08/16, | |
| Strike Price $2.40) | 220,500 | $ | 160,965 |
| XOMA Corp. (Issued/Exercisable 3/09/12, 0.50 | |
| Share for 1 Warrant, Expires 3/09/17, Strike | |
| Price $1.76) | 202,350 | 195,268 |
| Total Warrants — 0.0% | | 356,233 |
| Total Long-Term Investments | |
| (Cost — $712,450,680) — 99.6% | 844,737,468 |
| |
| |
| Short-Term Securities | Beneficial
Interest
(000) | |
| BlackRock Liquidity Series LLC, Money Market | |
| Series, 0.29% (d)(e)(f) | $ 168,113 | 168,113,212 |
| Total Short-Term Securities | |
| (Cost — $168,113,212) — 19.8% | 168,113,212 |
| Total Investments (Cost — $880,563,892*) — 119.4% | 1,012,850,680 |
| Liabilities in Excess of Other Assets — (19.4)% | (164,791,070) |
| Net Assets — 100.0% | | $ | 848,059,610 |
* As of September 30, 2012, gross unrealized appreciation and gross unrealized depreciation based on cost for federal income tax purposes were as follows:
| |
| Tax cost | $ | 893,729,514 |
| Gross unrealized appreciation | $ | 187,091,754 |
| Gross unrealized depreciation | (67,970,588) |
| Net unrealized appreciation | $ | 119,121,166 |
| (a) | | Non-income producing security. |
| (b) | | Security, or a portion of security, is on loan. |
| (c) | | Warrants entitle the Master LLC to purchase a predetermined number of shares of common stock and are non-income producing. The purchase price and number of shares are subject to adjustment under certain conditions until the expiration date, if any. |
| (d) | | Investments in issuers considered to be an affiliate of the Master LLC during the period ended September 30, 2012, for purposes of Section 2(a)(3) of the 1940 Act, as amended, were as follows: |
| | | | |
| Affiliate | Shares/
Beneficial
Interest Held at
March 31,
2012 | Net
Activity | Shares/
Beneficial
Interest Held at
September 30,
2012 | Income |
| BlackRock Liquidity | | | | |
| Funds, TempFund, | | | | |
| Institutional Class | 12,877,033 | (12,877,033) | �� — | $ 19,850 |
| BlackRock Liquidity | | | | |
| Series LLC, Money | | | | |
| Market Series | $157,155,871 | $10,957,341 | $168,113,212 | $484,009 |
| (e) | | Represents the current yield as of report date. |
| (f) | | Security was purchased with the cash collateral from loaned securities. The Master LLC may withdraw up to 25% of its investment daily, although the manager of the Money Market Series, in its sole discretion, may permit an investor to withdraw more than 25% on any one day. |
| • | | For Master LLC compliance purposes, the Master LLC’s industry classifications refer to any one or more of the industry sub-classifications used by one or more widely recognized market indexes or rating group indexes, and/or as defined by Master LLC management. These definitions may not apply for purposes of this report, which may combine such industry sub-classifications for reporting ease. |
| • | | Fair Value Measurements — Various inputs are used in determining the fair value of investments. These inputs to valuation techniques are categorized into a disclosure hierarchy consisting of three broad levels for financial statement purposes as follows: |
| • | | Level 1 — unadjusted price quotations in active markets/exchanges for identical assets and liabilities that the Master LLC has the ability to access |
| • | | Level 2—other observable inputs (including, but not limited to: quoted prices for similar assets or liabilities in markets that are active, quoted prices for identical or similar assets or liabilities in markets that are not active, inputs other than quoted prices that are observable for the assets or liabilities (such as interest rates, yield curves, volatilities, prepayment speeds, loss severities, credit risks and default rates) or other market-corroborated inputs) |
| • | | Level 3 — unobservable inputs based on the best information available in the circumstances, to the extent observable inputs are not available (including the Master LLC’s own assumptions used in determining the fair value of investments) |
The hierarchy gives the highest priority to unadjusted quoted prices in active markets for identical assets or liabilities (Level 1 measurements) and the lowest priority to unobservable inputs (Level 3 measurements). Accordingly, the degree of judgment exercised in determining fair value is greatest for instruments categorized in Level 3. The inputs used to measure fair value may fall into different levels of the fair value hierarchy. In such cases, for disclosure purposes, the level in the fair value hierarchy within which the fair value measurement falls in its entirety is determined based on the lowest level input that is significant to the fair value measurement in its entirety.
Changes in valuation techniques may result in transfers into or out of an assigned level within the disclosure hierarchy. In accordance with the Master LLC’s policy, transfers between different levels of the fair value disclosure hierarchy are deemed to have occurred as of the beginning of the reporting period. The categorization of a value determined for investments is based on the pricing transparency of the investment and is not necessarily an indication of the risks associated with investing in those securities. For information about the Master LLC’s policy regarding valuation of investments and other significant accounting policies, please refer to Note 1 of the Notes to Financial Statements.
The following table summarizes the Master LLC’s investments categorized in the disclosure hierarchy as of September 30, 2012:
| | | | |
| | Level 1 | Level 2 | Level 3 | Total |
| Assets: | | | | |
| Investments: | | | | |
| Long-Term | | | | |
| Investments1 | $ | 844,381,235 | $ | 356,233 | — | $ | 844,737,468 |
| Short-Term | | | | |
| Securities | — | 168,113,212 | — | 168,113,212 |
| Total | $ | 844,381,235 | $ | 168,469,445 | — | $ | 1,012,850,680 |
1 See above Schedule of Investments for values in each industry.
Certain of the Master LLC’s assets and liabilities are held at carrying amount, which approximates fair value for financial statement purposes. As of September 30, 2012, such assets and liabilities are categorized within the disclosure hierarchy as follows:
| | | | |
| | Level 1 | Level 2 | Level 3 | Total |
| Assets: | | | | |
| Foreign currency | | | | |
| at value | $ | 44 | — | — | $ | 44 |
| Liabilities: | | | | |
| Collateral on | | | | |
| securities loaned | | | | |
| at value | — | $ | (168,113,212) | — | (168,113,212) |
| Bank overdraft | — | (2,199,513) | — | (2,199,513) |
| Total | $ | 44 | $ | (170,312,725) | — | $ | (170,312,681) |
Certain securities are fair valued utilizing an external pricing service to reflect any significant market movements between the time the Master LLC values such securities. Such fair valuations are categorized as Level 2 on the disclosure hierarchy. As of March 31, 2012, there were securities with a value of $133,080 that were not systematically fair valued, but were valued using systematic fair values as of September 30, 2012, due to significant market movements. Therefore, these securities were transferred from Level 1 to Level 2 during the period.
See Notes to Financial Statements.
| BLACKROCK VALUE OPPORTUNITIES FUND, INC. | SEPTEMBER 30, 2012 | 21 |
| |
| Statement of Assets and Liabilities | Master Value Opportunities LLC |
September 30, 2012 (Unaudited)
| | |
| Assets |
| |
| Investments at value — unaffiliated (including securities loaned of $161,677,728) (cost — $712,450,680) | $ | 844,737,468 |
| Investments at value — affiliated (cost — $168,113,212) | | 168,113,212 |
| Investments sold receivable | | 11,674,651 |
| Dividends receivable | | 724,696 |
| Securities lending income receivable — affiliated | | 167,109 |
| Foreign currency at value (cost — $44) | | 44 |
| Prepaid expenses | | 16,483 |
| Total assets | | 1,025,433,663 |
| |
| |
| Liabilities |
| |
| Collateral on securities loaned at value | | 168,113,212 |
| Bank overdraft | | 2,199,513 |
| Investments purchased payable | | 4,291,299 |
| Withdrawals payable to investors | | 2,299,222 |
| Investment advisory fees payable | | 353,384 |
| Other affiliates payable | | 10,322 |
| Directors’ fees payable | | 2,805 |
| Other accrued expenses payable | | 104,296 |
| Total liabilities | | 177,374,053 |
| Net Assets | $ | 848,059,610 |
| |
| |
| Net Assets Consist of |
| |
| Investors’ capital | $ | 715,772,822 |
| Net unrealized appreciation/depreciation | | 132,286,788 |
| Net Assets | $ | 848,059,610 |
See Notes to Financial Statements.
| 22 | BLACKROCK VALUE OPPORTUNITIES FUND, INC. | SEPTEMBER 30, 2012 |
| | | | |
| Statement of Operations | Master Value Opportunities LLC |
Six Months Ended September 30, 2012 (Unaudited)
| | | |
| Investment Income |
| Dividends — unaffiliated | $ | 4,586,110 | |
| Securities lending — affiliated | | 484,009 | |
| Dividends — affiliated | | 19,850 | |
| Total income | | 5,089,969 | |
| |
| Expenses |
| Investment advisory | | 2,117,698 | |
| Accounting services | | 109,946 | |
| Custodian | | 36,547 | |
| Professional | | 32,616 | |
| Directors | | 18,549 | |
| Printing | | 8,604 | |
| Miscellaneous | | 11,920 | |
| Total expenses | | 2,335,880 | |
| Less fees waived by Manager | | (9,392 | ) |
| Total expenses after fees waived | | 2,326,488 | |
| Net investment income | | 2,763,481 | |
| |
| Realized and Unrealized Gain (Loss) |
| Net realized gain from: | | | |
| Investments | | 46,413,507 | |
| Foreign currency transactions | | 1,765 | |
| | | 46,415,272 | |
| Net change in unrealized appreciation/depreciation on investments | | (53,405,480 | ) |
| Total realized and unrealized loss | | (6,990,208 | ) |
| Net Decrease in Net Assets Resulting from Operations | $ | (4,226,727 | ) |
See Notes to Financial Statements.
| BLACKROCK VALUE OPPORTUNITIES FUND, INC. | SEPTEMBER 30, 2012 | 23 |
| |
| Statements of Changes in Net Assets | Master Value Opportunities LLC |
| | | | | | |
| Increase (Decrease) in Net Assets: | Six Months
Ended
September 30,
2012
(Unaudited) | Year Ended
March 31,
2012 |
| Operations |
| Net investment income | $ | 2,763,481 | | $ | 6,567,413 | |
| Net realized gain | | 46,415,272 | | | 138,038,067 | |
| Net change in unrealized appreciation/depreciation | | (53,405,480 | ) | | (147,040,478 | ) |
| Net decrease in net assets resulting from operations | | (4,226,727 | ) | | (2,434,998 | ) |
| |
| Capital Transactions |
| Proceeds from contributions | | 55,648,973 | | | 166,429,563 | |
| Value of withdrawals | | (131,955,691 | ) | | (471,023,813 | ) |
| Net decrease in net assets derived from capital transactions | | (76,306,718 | ) | | (304,594,250 | ) |
| |
| Net Assets |
| Total decrease in net assets | | (80,533,445 | ) | | (307,029,248 | ) |
| Beginning of period | | 928,593,055 | | | 1,235,622,303 | |
| End of period | $ | 848,059,610 | | $ | 928,593,055 | |
See Notes to Financial Statements.
| 24 | BLACKROCK VALUE OPPORTUNITIES FUND, INC. | SEPTEMBER 30, 2012 |
| |
| Financial Highlights | Master Value Opportunities LLC |
| | | | | | | | | | | | | | | | | | |
| | Six Months
Ended
September 30,
2012
(Unaudited) |
Year Ended March 31, |
| | 2012 | 2011 | 2010 | 2009 | 2008 |
| Total Investment Return |
| Total investment return | | (0.10 | )%1 | | 1.17 | % | | 28.70 | % | | 68.13 | %2 | | (43.58 | )% | | (13.02 | )% |
| |
| Ratios to Average Net Assets |
| Total expenses | | 0.55 | %3 | | 0.54 | % | | 0.54 | % | | 0.55 | % | | 0.54 | % | | 0.51 | % |
| Total expenses after fees waived | | 0.55 | %3 | | 0.54 | % | | 0.54 | % | | 0.55 | % | | 0.54 | % | | 0.51 | % |
| Net investment income | | 0.65 | %3 | | 0.62 | % | | 0.78 | % | | 1.14 | % | | 1.21 | % | | 0.66 | % |
| |
| Supplemental Data |
| Net assets, end of period (000) | $ | 848,060 | | $ | 928,593 | | $ | 1,235,622 | | $ | 1,056,751 | | $ | 770,616 | | $ | 1,750,575 | |
| Portfolio turnover | | 24 | % | | 45 | % | | 52 | % | | 79 | % | | 147 | % | | 109 | % |
| 1 | | Aggregate total investment return. |
| 2 | | Includes proceeds received from a settlement of litigation, which impacted the Master LLC’s total investment return. Not including these proceeds, the total investment return would have been 67.83%. |
See Notes to Financial Statements.
| BLACKROCK VALUE OPPORTUNITIES FUND, INC. | SEPTEMBER 30, 2012 | 25 |
| |
| Notes to Financial Statements (Unaudited) | Master Value Opportunities LLC |
1. Organization and Significant Accounting Policies:
Master Value Opportunities LLC (the “Master LLC”) is registered under the Investment Company Act of 1940, as amended (the “1940 Act”), as a diversified, open-end management investment company and is organized as a Delaware limited liability company. The Limited Liability Company Agreement permits the Board of Directors of the Master LLC (the “Board”) to issue non-transferable interests in the Master LLC, subject to certain limitations. The Master LLC’s financial statements are prepared in conformity with accounting principles generally accepted in the United States of America (“US GAAP”), which may require management to make estimates and assumptions that affect the reported amounts of assets and liabilities in the financial statements and the reported amounts of increases and decreases in net assets from operations during the reporting period. Actual results could differ from those estimates.
The following is a summary of significant accounting policies followed by the Master LLC:
Valuation: US GAAP defines fair value as the price the Master LLC would receive to sell an asset or pay to transfer a liability in an orderly transaction between market participants at the measurement date. The Master LLC fair value its financial instruments at market value using independent dealers or pricing services under policies approved by the Board. The BlackRock Global Valuation Methodologies Committee (the “Global Valuation Committee”) is the committee formed by management to develop global pricing policies and procedures and to provide oversight of the pricing function for the Master LLC for all financial instruments.
Equity investments traded on a recognized securities exchange or the NASDAQ Global Market System (“NASDAQ”) are valued at the last reported sale price that day or the NASDAQ official closing price, if applicable. For equity investments traded on more than one exchange, the last reported sale price on the exchange where the stock is primarily traded is used. Equity investments traded on a recognized exchange for which there were no sales on that day are valued at the last available bid (long positions) or ask (short positions) price. If no bid or ask price is available, the prior day’s price will be used, unless it is determined that such prior day’s price no longer reflects the fair value of the security. Investments in open-end registered investment companies are valued at NAV each business day. Short-term securities with remaining maturities of 60 days or less may be valued at amortized cost, which approximates fair value.
The Master LLC values its investments in BlackRock Liquidity Series, LLC Money Market Series (the “Money Market Series”) at fair value, which is ordinarily based upon its pro rata ownership in the underlying fund’s net assets. The Money Market Series seeks current income consistent with maintaining liquidity and preserving capital. Although the Money Market Series is not registered under the 1940 Act, its investments will follow the parameters of investments by a money market fund that is subject to Rule 2a-7 under the 1940 Act. The Master LLC may withdraw up to 25% of its investment daily, although the manager of the Money Market Series, in its sole discretion, may permit an investor in the Money Market Series to withdraw more than 25% on any one day.
Securities and other assets and liabilities denominated in foreign currencies are translated into US dollars using exchange rates determined as of the close of business on the New York Stock Exchange (“NYSE”). Foreign currency exchange contracts are valued at the mean between the bid and ask prices and are determined as of the close of business on the NYSE. Interpolated values are derived when the settlement date of the contract is an interim date for which quotations are not available.
Generally, trading in foreign instruments is substantially completed each day at various times prior to the close of business on the New York Stock Exchange (“NYSE”). Occasionally, events affecting the values of such instruments may occur between the foreign market close and the close of business on the NYSE that may not be reflected in the computation of the Master LLC’s net assets. If events (for example, a company announcement, market volatility or a natural disaster) occur during such periods that are expected to affect the value of such instruments materially, those instruments may be Fair Value Assets and valued at their fair value, as determined in good faith by the Global Valuation Committee using a pricing service and/or policies approved by the Board. Each business day, the Master LLC uses a pricing service to assist with the valuation of certain foreign exchange-traded equity securities and foreign exchange-traded and OTC options (the “Systematic Fair Value Price”). Using current market factors, the Systematic Fair Value Price is designed to value such foreign securities and foreign options at fair value as of the close of business on the NYSE, which follows the close of the local markets.
In the event that application of these methods of valuation results in a price for an investment that is deemed not to be representative of the market value of such investment, or if a price is not available, the investment will be valued by the Global Valuation Committee, or its delegate, in accordance with a policy approved by the Board as reflecting fair value (“Fair Value Assets”). When determining the price for Fair Value Assets, the Global Valuation Committee, or its delegate, seeks to determine the price that the Master LLC might reasonably expect to receive from the current sale of that asset in an arm’s-length transaction. Fair value determinations shall be based upon all available factors that the investment advisor and/or sub-advisor deems relevant consistent with the principles of fair value measurement which include the market approach, income approach and/or cost approach, as appropriate. A market approach generally consists of using comparable market transactions. The income approach generally is used to discount
| 26 | BLACKROCK VALUE OPPORTUNITIES FUND, INC. | SEPTEMBER 30, 2012 |
| |
| Notes to Financial Statements (continued) | Master Value Opportunities LLC |
future cash flows to present value and adjusted for liquidity as appropriate. These factors include but are not limited to (i) attributes specific to the investment or asset; (ii) the principal market for the investment or asset; (iii) the customary participants in the principal market for the investment or asset; (iv) data assumptions by market participants for the investment or asset, if reasonably available; (v) quoted prices for similar investments or assets in active markets; and (vi) other factors, such as future cash flows, interest rates, yield curves, volatilities, prepayment speeds, loss severities, credit risks, recovery rates, liquidation amounts and/or default rates. Due to the inherent uncertainty of valuations of such investments, the fair values may differ from the values that would have been used had an active market existed. The Global Valuation Committee, or its delegate, employs various methods for calibrating valuation approaches for investments where an active market does not exist including regular due diligence of the Master LLC’s pricing vendors, a regular review of key inputs and assumptions, transactional back-testing or disposition analysis to compare unrealized gains and losses to realized gains and losses, reviews of missing or stale prices and large movements in market values and reviews of any market related activity. The pricing of all Fair Value Assets is subsequently reported to the Board or a committee thereof on a quarterly basis.
Foreign Currency: The Master LLC’s books and records are maintained in US dollars. Purchases and sales of investment securities are recorded at the rates of exchange prevailing on the respective date of such transactions. Generally, when the US dollar rises in value against a foreign currency, the Master LLC’s investments denominated in that currency will lose value because that currency is worth fewer US dollars; the opposite effect occurs if the US dollar falls in relative value.
The Master LLC does not isolate the portion of the results of operations arising as a result of changes in the foreign exchange rates from the changes in the market prices of investments held or sold for financial reporting purposes. Accordingly, the effects of changes in foreign currency exchange rates on investments are not segregated on the Statement of Operations from the effects of changes in market prices of those investments but are included as a component of net realized and unrealized gain (loss) from investments. The Master LLC reports realized currency gains (losses) on foreign currency related transactions as components of net realized gain (loss) for financial reporting purposes, whereas such components are treated as ordinary income for federal income tax purposes.
Segregation and Collateralization: In cases in which the 1940 Act and the interpretive positions of the Securities and Exchange Commission (“SEC”) require that the Master LLC either deliver collateral or segregate assets in connection with certain investments (e.g., foreign currency exchange contracts), the Master LLC will, consistent with SEC rules and/or certain interpretive letters issued by the SEC, segregate collateral or designate on its books and records cash or liquid securities having a market value at least equal to the amount that would otherwise be required to be physically segregated. Furthermore, based on requirements and agreements with certain exchanges and third party broker-dealers, each party to the Master LLC engaging in such transactions may have requirements to deliver/deposit securities to/ with an exchange or broker-dealer as collateral for certain investments.
Investment Transactions and Investment Income: For financial reporting purposes, investment transactions are recorded on the dates the transactions are entered into (the trade dates). Realized gains and losses on investment transactions are determined on the identified cost basis. Dividend income is recorded on the ex-dividend dates. Dividends from foreign securities where the ex-dividend date may have passed are subsequently recorded when the Master LLC is informed of the ex-dividend date. Upon notification from issuers, some of the dividend income received from a real estate investment trust may be redesignated as a reduction of cost of the related investment and/or realized gain.
Securities Lending: The Master LLC may lend securities to approved borrowers, such as banks, brokers and other financial institutions. The borrower pledges cash, securities issued or guaranteed by the US government or irrevocable letters of credit issued by a bank as collateral, which will be maintained at all times in an amount equal to at least 100% of the current market value of the loaned securities. The market value of the loaned securities is determined at the close of business of the Master LLC and any additional required collateral is delivered to the Master LLC on the next business day. Securities lending income, as disclosed in the Statement of Operations, represents the income earned from the investment of the cash collateral, net of rebates paid to, or fees paid by, borrowers and less the fees paid to the securities lending agent. During the term of the loan, the Master LLC earns dividend or interest income on the securities loaned but does not receive interest income on the securities received as collateral. Loans of securities are terminable at any time and the borrower, after notice, is required to return borrowed securities within the standard time period for settlement of securities transactions. In the event that the borrower defaults on its obligation to return borrowed securities because of insolvency or for any other reason, the Master LLC could experience delays and costs in gaining access to the collateral. The Master LLC also could suffer a loss if the value of an investment purchased with cash collateral falls below the market value of loaned securities or if the value of an investment purchased with cash collateral falls below the value of the original cash collateral received. During the six months ended September 30, 2012, any securities on loan were collateralized by cash.
| BLACKROCK VALUE OPPORTUNITIES FUND, INC. | SEPTEMBER 30, 2012 | 27 |
| |
| Notes to Financial Statements (continued) | Master Value Opportunities LLC |
Income Taxes: The Master LLC is classified as a partnership for federal income tax purposes. As such, each investor in the Master LLC is treated as the owner of its proportionate share of net assets, income, expenses and realized and unrealized gains and losses of the Master LLC. Therefore, no federal income tax provision is required. It is intended that the Master LLC’s assets will be managed so an investor in the Master LLC can satisfy the requirements of Subchapter M of the Internal Revenue Code of 1986, as amended.
The Master LLC files US federal and various state and local tax returns. No income tax returns are currently under examination. The statute of limitations on the Master LLC’s US federal tax returns remains open for each of the four years ended March 31, 2012. The statutes of limitations on the Master LLC’s state and local tax returns may remain open for an additional year depending upon the jurisdiction. Management does not believe there are any uncertain tax positions that require recognition of a tax liability.
Recent Accounting Standard: In December 2011, the Financial Accounting Standards Board issued guidance that will expand current disclosure requirements on the offsetting of certain assets and liabilities. The new disclosures will be required for investments and derivative financial instruments subject to master netting or similar agreements which are eligible for offset in the Statement of Assets and Liabilities and will require an entity to disclose both gross and net information about such investments and transactions in the financial statements. The guidance is effective for financial statements with fiscal years beginning on or after January 1, 2013, and interim periods within those fiscal years. Management is evaluating the impact of this guidance on the Master LLC’s financial statement disclosures.
Other: Expenses directly related to the Master LLC are charged to the Master LLC. Other operating expenses shared by several funds are pro rated among those funds on the basis of relative net assets or other appropriate methods.
The Master LLC has an arrangement with the custodian whereby fees may be reduced by credits earned on uninvested cash balances, which, if applicable, are shown as fees paid indirectly in the Statement of Operations. The custodian imposes fees on overdrawn cash balances, which can be offset by accumulated credits earned or may result in additional custody charges.
2. Derivative Financial Instruments:
The Master LLC engages in various portfolio investment strategies using derivative contracts both to increase the returns of the Master LLC and/ or to economically hedge, or protect, its exposure to certain risks such as foreign currency exchange rate risk. These contracts may be transacted on an exchange or OTC.
Losses may arise if the value of the contract decreases due to an unfavorable change in the market rates or values of the underlying instrument or if the counterparty does not perform under the contract. The Master LLC’s maximum risk of loss from counterparty credit risk on OTC derivatives is generally the aggregate unrealized gain netted against any collateral pledged by/posted to the counterparty.
The Master LLC may mitigate counterparty risk by procuring collateral and through netting provisions included within an International Swaps and Derivatives Association, Inc. master agreement (“ISDA Master Agreement”) implemented between the Master LLC and each of its respective counterparties. An ISDA Master Agreement allows the Master LLC to offset with each separate counterparty certain derivative financial instrument’s payables and/or receivables with collateral held. The amount of collateral moved to/from applicable counterparties is generally based upon minimum transfer amounts of up to $500,000. To the extent amounts due to the Master LLC from its counterparties are not fully collateralized, contractually or otherwise, the Master LLC bears the risk of loss from counterparty non-performance. See Note 1 “Segregation and Collateralization” for information with respect to collateral practices. In addition, the Master LLC manages counterparty risk by entering into agreements only with counterparties that it believes have the financial resources to honor their obligations and by monitoring the financial stability of those counterparties.
Certain ISDA Master Agreements allow counterparties to OTC derivatives to terminate derivative contracts prior to maturity in the event the Master LLC’s net assets decline by a stated percentage or the Master LLC fails to meet the terms of its ISDA Master Agreements, which would cause the Master LLC to accelerate payment of any net liability owed to the counterparty.
Foreign Currency Exchange Contracts: The Master LLC enters into foreign currency exchange contracts as an economic hedge against either specific transactions or portfolio instruments or to obtain exposure to foreign currencies (foreign currency exchange rate risk). A foreign currency exchange contract is an agreement between two parties to buy and sell a currency at a set exchange rate on a future date. Foreign currency exchange contracts, when used by the Master LLC, help to manage the overall exposure to the currencies in which some of the investments held by the Master LLC are denominated. The contract is marked-to-market daily and the change in market value is recorded by the Master LLC as an unrealized gain or loss. When the contract is closed, the Master LLC records a realized gain or loss equal to the difference between the value at the time it was opened and the value at the time it was closed. The use of foreign currency exchange contracts involves the risk that the value of a foreign currency exchange contract changes unfavorably due to movements in the value of the referenced foreign currencies and the risk that the counterparty to the contract does not perform its obligations under the agreement.
| 28 | BLACKROCK VALUE OPPORTUNITIES FUND, INC. | SEPTEMBER 30, 2012 |
| |
| Notes to Financial Statements (continued) | Master Value Opportunities LLC |
Derivative Financial Instruments Categorized by Risk Exposure:
| | | |
The Effect of Derivative Financial Instruments in the Statement of Operations
Six Months Ended September 30, 2012 |
| | Net Realized Loss From |
| | Foreign Currency
Exchange Contracts |
| Foreign currency transactions | $ | (35,707 | ) |
For the six months ended September 30, 2012, the average quarterly balances of outstanding derivative financial instruments were as follows:
| | |
| Foreign currency exchange contracts: | | |
| Average number of contracts — US dollars purchased | | 11 |
| Average US dollar amounts purchased | $ | 347,6911 |
1 Average contract amount shown due to limited activity.
3. Investment Advisory Agreement and Other Transactions with Affiliates:
The PNC Financial Services Group, Inc. (“PNC”) is the largest stockholder and an affiliate, for 1940 Act purposes, of BlackRock, Inc. (“BlackRock”).
The Master LLC entered into an Investment Advisory Agreement with BlackRock Advisors, LLC (the “Manager”), the Master LLC’s investment advisor, an indirect, wholly owned subsidiary of BlackRock, to provide investment advisory and administration services. The Manager is responsible for the management of the Master LLC’s portfolio and provides the necessary personnel, facilities, equipment and certain other services necessary to the operations of the Master LLC. For such services, the Master LLC pays the Manager a monthly fee based on a percentage of the Master LLC’s average daily net assets at the following annual rates:
| | |
| Average Daily Net Assets | Investment
Advisory
Fee |
| First $1 Billion | 0.500 | % |
| $1 Billion – $1.5 Billion | 0.475 | % |
| Greater than $1.5 Billion | 0.450 | % |
The Manager voluntarily agreed to waive its investment advisory fees by the amount of investment advisory fees the Master LLC pays to the Manager indirectly through its investment in affiliated money market funds. However, the Manager does not waive its investment advisory fees by the amount of investment advisory fees paid in connection with the Master LLC’s investment in other affiliated investment companies, if any. This amount is included in fees waived by Manager in the Statement of Operations.
The Manager entered into a sub-advisory agreement with BlackRock Investment Management, LLC (“BIM”), an affiliate of the Manager. The Manager pays BIM for services it provides, a monthly fee that is a percentage of the investment advisory fees paid by the Master LLC to the Manager.
For the six months ended September 30, 2012, the Master LLC reimbursed the Manager $7,749 for certain accounting services, which is included in accounting services in the Statement of Operations.
The Master LLC received an exemptive order from the SEC permitting it, among other things, to pay an affiliated securities lending agent a fee based on a share of the income derived from the securities lending activities and has retained BIM as the securities lending agent. BIM may, on behalf of the Master LLC, invest cash collateral received by the Master LLC for such loans, among other things, in a private investment company managed by the Manager or in registered money market funds advised by the Manager or its affiliates. As securities lending agent, BIM is responsible for all transaction fees and all other operational costs relating to securities lending activities, other than extraordinary expenses. BIM does not receive any fees for managing the cash collateral. The market value of securities on loan and the value of the related collateral, if applicable, are shown in the Statement of Assets and Liabilities as securities loaned at value and collateral on securities loaned at value, respectively. The cash collateral invested by BIM is disclosed in the Schedule of Investments, if any. Securities lending income is equal to the total of income earned from the reinvestment of cash collateral, net of rebates paid to, or fees paid by, borrowers of securities. The Master LLC retains 65% of securities lending income and pays a fee to BIM equal to 35% of such income. The share of income earned by the Master LLC is shown as securities lending — affiliated in the Statement of Operations. For the six months ended September 30, 2012, BIM received $260,620 in securities lending agent fees related to securities lending activities for the Master LLC.
Certain officers and/or directors of the Master LLC are officers and/or directors of BlackRock or its affiliates.
4. Investments:
Purchases and sales of investments, excluding short-term securities for the six months ended September 30, 2012, were $195,186,831 and $261,933,805, respectively.
5. Borrowings:
The Master LLC, along with certain other funds managed by the Manager and its affiliates, is a party to a $500 million credit agreement with a group of lenders. The Master LLC may borrow under the credit agreement to fund shareholder redemptions. Effective November 2011 to November 2012, the credit agreement has the following terms: a commitment fee of 0.065% per annum based on the Master LLC’s pro
| BLACKROCK VALUE OPPORTUNITIES FUND, INC. | SEPTEMBER 30, 2012 | 29 |
| |
| Notes to Financial Statements (concluded) | Master Value Opportunities LLC |
rata share of the unused portion of the credit agreement and interest at a rate equal to the higher of (a) the one-month London Interbank Offered Rate plus 0.80% per annum or (b) the Fed Funds rate plus 0.80% per annum on amounts borrowed. In addition, the Master LLC paid administration and arrangement fees which were allocated to the Master LLC based on its net assets as of October 31, 2011. The Master LLC did not borrow under the credit agreement during the six months ended September 30, 2012.
6. Market and Credit Risk:
In the normal course of business, the Master LLC invests in securities and enters into transactions where risks exist due to fluctuations in the market (market risk) or failure of the issuer of a security to meet all its obligations (issuer credit risk). The value of securities held by the Master LLC may decline in response to certain events, including those directly involving the issuers whose securities are owned by the Master LLC; conditions affecting the general economy; overall market changes; local, regional or global political, social or economic instability; and currency and interest rate and price fluctuations. Similar to issuer credit risk, the Master LLC may be exposed to counterparty credit risk, or the risk that an entity with which the Master LLC has unsettled or open transactions may fail to or be unable to perform on its commitments. The Master LLC manages counterparty credit risk by entering into transactions only with counterparties that it believes have the financial resources to honor their obligations and by monitoring the financial stability of those counterparties. Financial assets, which potentially expose the Master LLC to market, issuer and counterparty credit risks, consist principally of financial instruments and receivables due from counterparties. The extent of the Master LLC’s exposure to market, issuer and counterparty credit risks with respect to these financial assets is generally approximated by their value recorded in the Master LLC’s Statement of Assets and Liabilities, less any collateral held by the Master LLC.
7. Subsequent Events:
Management has evaluated the impact of all subsequent events on the Master LLC through the date the financial statements were issued and has determined that there were no subsequent events requiring adjustment or additional disclosure in the financial statements.
| 30 | BLACKROCK VALUE OPPORTUNITIES FUND, INC. | SEPTEMBER 30, 2012 |
Disclosure of Investment Advisory Agreement and Sub-Advisory Agreement
The Board of Directors of the Master Value Opportunities LLC (the “Master Fund”) met on April 10, 2012 and May 8-9, 2012 to consider the approval of the Master Fund’s investment advisory agreement (the “Advisory Agreement”) with BlackRock Advisors, LLC (the “Manager”), the Master Fund’s investment advisor. The Board of Directors of the Master Fund also considered the approval of the sub-advisory agreement (the “Sub-Advisory Agreement”) between the Manager and BlackRock Investment Management, LLC (the “Sub-Advisor”), with respect to the Master Fund. The BlackRock Value Opportunities Fund, Inc. (the “Feeder Fund”) is a “feeder” fund that invests all of its investable assets in the Master Fund. Accordingly, the Board of Directors of the Feeder Fund also considered the approval of the Advisory Agreement and the Sub-Advisory Agreement with respect to the Master Fund. The Manager and the Sub-Advisor are referred to herein as “BlackRock.” The Advisory Agreement and the Sub-Advisory Agreement are referred to herein as the “Agreements.” For simplicity, the Board of Directors of the Master Fund and the Board of Directors of the Feeder Fund are referred to herein collectively as the “Board,” and the members are referred to as “Board Members.”
Activities and Composition of the Board
The Board consists of thirteen individuals, ten of whom are not “interested persons” of the Master Fund or the Feeder Fund as defined in the Investment Company Act of 1940, as amended (the “1940 Act”) (the “Independent Board Members”). The Board Members are responsible for the oversight of the operations of the Master Fund or the Feeder Fund, as pertinent, and perform the various duties imposed on the directors of investment companies by the 1940 Act. The Independent Board Members have retained independent legal counsel to assist them in connection with their duties. The Chairman of the Board is an Independent Board Member. The Board has established five standing committees: an Audit Committee, a Governance and Nominating Committee, a Compliance Committee, a Performance Oversight Committee and an Executive Committee, each of which is chaired by an Independent Board Member and composed of Independent Board Members (except for the Performance Oversight Committee and the Executive Committee, each of which also has one interested Board Member).
The Agreements
Pursuant to the 1940 Act, the Board is required to consider the continuation of the Agreements on an annual basis. The Board has four quarterly meetings per year, each extending over two days, and a fifth meeting to consider specific information surrounding the consideration of renewing the Agreements. In connection with this process, the Board assessed, among other things, the nature, scope and quality of the services provided to the Master Fund and the Feeder Fund by BlackRock, its personnel and its affiliates, including investment management, administrative and shareholder services, oversight of fund accounting and custody, marketing services, risk oversight, compliance and assistance in meeting applicable legal and regulatory requirements.
The Board, acting directly and through its committees, considers at each of its meetings, and from time to time as appropriate, factors that are relevant to its annual consideration of the renewal of the Agreements, including the services and support provided by BlackRock to the Master Fund, the Feeder Fund and their shareholders. Among the matters the Board considered were: (a) investment performance for one-, three- and five-year periods, as applicable, against peer funds, and applicable benchmarks, if any, as well as senior management’s and portfolio managers’ analysis of the reasons for any over performance or underperformance against its peers and/or benchmark, as applicable; (b) fees, including advisory, administration, if applicable, and other amounts paid to BlackRock and its affiliates by the Master Fund and/or the Feeder Fund for services, such as marketing and distribution, call center and fund accounting; (c) the Master Fund’s and/or the Feeder Fund’s operating expenses and how BlackRock allocates expenses to the Master Fund and the Feeder Fund; (d) the resources devoted to, risk oversight of, and compliance reports relating to, implementation of the Master Fund’s and the Feeder Fund’s investment objective, policies and restrictions; (e) the Master Fund’s and the Feeder Fund’s compliance with its respective Code of Ethics and other compliance policies and procedures; (f) the nature, cost and character of non-investment management services provided by BlackRock and its affiliates; (g) BlackRock’s and other service providers’ internal controls and risk and compliance oversight mechanisms; (h) BlackRock’s implementation of the proxy voting policies approved by the Board; (i) the use of brokerage commissions and execution quality of portfolio transactions; (j) BlackRock’s implementation of the Master Fund’s and/or the Feeder Fund’s valuation and liquidity procedures; (k) an analysis of management fees for products with similar investment objectives across the open-end fund, exchange traded fund (“ETF”), closed-end fund and institutional account product channels, as applicable; (l) BlackRock’s compensation methodology for its investment professionals and the incentives it creates; and (m) periodic updates on BlackRock’s business.
The Board has engaged in an ongoing strategic review with BlackRock of opportunities to consolidate funds and of BlackRock’s commitment to investment performance. In addition, the Board requested, to the extent reasonably possible, an analysis of the risk and return relative to selected funds in peer groups. BlackRock provides information to the Board in response to specific questions. These questions covered issues such as profitability, investment performance and management fee levels. The Board considered the importance of: (i) managing fixed income assets with a view toward preservation of capital; (ii) portfolio managers’ investments in the funds they manage; (iii) BlackRock’s controls surrounding the coding of quantitative investment models; and (iv) BlackRock’s oversight of relationships with third party service providers.
| BLACKROCK VALUE OPPORTUNITIES FUND, INC. | SEPTEMBER 30, 2012 | 31 |
Disclosure of Investment Advisory Agreement and Sub-Advisory Agreement (continued)
Board Considerations in Approving the Agreements
The Approval Process: Prior to the April 10, 2012 meeting, the Board requested and received materials specifically relating to the Agreements. The Board is engaged in a process with its independent legal counsel and BlackRock to review periodically the nature and scope of the information provided to better assist its deliberations. The materials provided in connection with the April meeting included (a) information independently compiled and prepared by Lipper, Inc. (“Lipper”) on fees and expenses of the Master Fund and the Feeder Fund, as applicable, and the investment performance of the Feeder Fund as compared with a peer group of funds as determined by Lipper (collectively, “Peers”); (b) information on the profitability of the Agreements to BlackRock and a discussion of fall-out benefits to BlackRock and its affiliates; (c) a general analysis provided by BlackRock concerning investment management fees (a combination of the advisory fee and the administration fee, if any) charged to other clients, such as institutional clients, ETFs and closed-end funds, under similar investment mandates, as well as the performance of such other clients, as applicable; (d) the existence, impact and sharing of potential economies of scale; (e) a summary of aggregate amounts paid by the Master Fund and/or the Feeder Fund to BlackRock; (f) sales and redemption data regarding the Feeder Fund’s shares; and (g) if applicable, a comparison of management fees to similar BlackRock open-end funds, as classified by Lipper.
At an in-person meeting held on April 10, 2012, the Board reviewed materials relating to its consideration of the Agreements. As a result of the discussions that occurred during the April 10, 2012 meeting, and as a culmination of the Board’s year-long deliberative process, the Board presented BlackRock with questions and requests for additional information. BlackRock responded to these requests with additional written information in advance of the May 8-9, 2012 Board meeting.
At an in-person meeting held on May 8-9, 2012, the Board of the Master Fund, including all the Independent Board Members, approved the continuation of the Advisory Agreement between the Manager and the Master Fund and the Sub-Advisory Agreement between the Manager and the Sub-Advisor with respect to the Master Fund, each for a one-year term ending June 30, 2013. The Board of the Feeder Fund, including the Independent Board Members, also considered the continuation of the Agreements and found the Agreements to be satisfactory. In approving the continuation of the Agreements, the Board considered: (a) the nature, extent and quality of the services provided by BlackRock; (b) the investment performance of the Master Fund, the Feeder Fund and BlackRock; (c) the advisory fee and the cost of the services and profits to be realized by BlackRock and its affiliates from their relationship with the Master Fund and the Feeder Fund; (d) economies of scale; (e) fall-out benefits to BlackRock as a result of its relationship with the Master Fund and the Feeder Fund; and (f) other factors deemed relevant by the Board Members.
The Board also considered other matters it deemed important to the approval process, such as payments made to BlackRock or its affiliates relating to the distribution of Feeder Fund shares and securities lending, services related to the valuation and pricing of portfolio holdings of the Master Fund, direct and indirect benefits to BlackRock and its affiliates from their relationship with the Master Fund and the Feeder Fund and advice from independent legal counsel with respect to the review process and materials submitted for the Board’s review. The Board noted the willingness of BlackRock personnel to engage in open, candid discussions with the Board. The Board did not identify any particular information as controlling, and each Board Member may have attributed different weights to the various items considered.
A. Nature, Extent and Quality of the Services Provided by BlackRock: The Board, including the Independent Board Members, reviewed the nature, extent and quality of services provided by BlackRock, including the investment advisory services and the resulting performance of the Feeder Fund. Throughout the year, the Board compared the Feeder Fund’s performance to the performance of a comparable group of mutual funds and/or the performance of a relevant benchmark, if any. The Board met with BlackRock’s senior management personnel responsible for investment operations, including the senior investment officers. The Board also reviewed the materials provided by the Master Fund’s portfolio management team discussing the Master Fund’s performance and the Master Fund’s investment objective, strategies and outlook.
The Board considered, among other factors, the number, education and experience of BlackRock’s investment personnel generally and the Master Fund’s portfolio management team, investments by portfolio managers in the funds they manage, BlackRock’s portfolio trading capabilities, BlackRock’s use of technology, BlackRock’s commitment to compliance, BlackRock’s credit analysis capabilities, BlackRock’s risk analysis and oversight capabilities and BlackRock’s approach to training and retaining portfolio managers and other research, advisory and management personnel. The Board engaged in a review of BlackRock’s compensation structure with respect to the Master Fund’s portfolio management team and BlackRock’s ability to attract and retain high-quality talent and create performance incentives.
In addition to advisory services, the Board considered the quality of the administrative and non-investment advisory services provided to the Master Fund and the Feeder Fund. BlackRock and its affiliates provide the Master Fund and the Feeder Fund with certain administrative, shareholder and other services (in addition to any such services provided to the Master Fund and the Feeder Fund by third parties) and officers and other personnel as are necessary for the operations of the Master Fund and the Feeder Fund. In particular, BlackRock and its affiliates provide the Master Fund and the Feeder Fund with the following administrative services, including, among others: (i) preparing
| 32 | BLACKROCK VALUE OPPORTUNITIES FUND, INC. | SEPTEMBER 30, 2012 |
Disclosure of Investment Advisory Agreement and Sub-Advisory Agreement (continued)
disclosure documents, such as the prospectus, the statement of additional information and periodic shareholder reports; (ii) assisting with daily accounting and pricing; (iii) overseeing and coordinating the activities of other service providers; (iv) organizing Board meetings and preparing the materials for such Board meetings; (v) providing legal and compliance support; and (vi) performing other administrative functions necessary for the operation of the Master Fund and the Feeder Fund, such as tax reporting, fulfilling regulatory filing requirements and call center services. The Board reviewed the structure and duties of BlackRock’s fund administration, accounting, legal and compliance departments and considered BlackRock’s policies and procedures for assuring compliance with applicable laws and regulations.
B. The Investment Performance of the Master Fund, the Feeder Fund and BlackRock: The Board, including the Independent Board Members, also reviewed and considered the performance history of the Master Fund and the Feeder Fund, as applicable. The Board noted that the Master Fund’s investment results correspond directly to the investment results of the Feeder Fund. In preparation for the April 10, 2012 meeting, the Board worked with its independent legal counsel, BlackRock and Lipper to develop a template for, and was provided with, reports independently prepared by Lipper, which included a comprehensive analysis of the Feeder Fund’s performance. The Board also reviewed a narrative and statistical analysis of the Lipper data that was prepared by BlackRock, which analyzed various factors that affect Lipper’s rankings. In connection with its review, the Board received and reviewed information regarding the investment performance of the Feeder Fund as compared to funds in the Feeder Fund’s applicable Lipper category. The Board was provided with a description of the methodology used by Lipper to select peer funds and periodically meets with Lipper representatives to review their methodology. The Board and the Board’s Performance Oversight Committee regularly review, and meet with Master Fund management to discuss, the performance of the Master Fund and the Feeder Fund, as applicable, throughout the year.
The Board noted that the Feeder Fund ranked in the second, third and fourth quartiles against its Lipper Performance Universe for the one-, three- and five-year periods reported, respectively. The Board and BlackRock reviewed and discussed the reasons for the Feeder Fund’s underperformance during the three- and five-year periods compared with its Peers. The Board was informed that, among other things, longer-term relative results continue to be negatively impacted by the Master Fund’s underperformance during the 2008 financial crisis, as the Master Fund’s holdings in the financial sector weighed heavily on returns during the U.S. real estate market collapse and the subsequent credit crisis. Master Fund holdings experienced significantly worse returns than the broader sector. The investment process changed in 2009 to a process that concentrates less exposure in top positions so as to mitigate the likelihood of individual position losses such as those experienced in 2009.
The Board and BlackRock discussed BlackRock’s strategy for improving the Master Fund’s/Feeder Fund’s performance and BlackRock’s commitment to providing the resources necessary to assist the Master Fund’s portfolio managers and to improve the Master Fund’s/Feeder Fund’s performance.
C. Consideration of the Advisory/Management Fees and the Cost of the Services and Profits to be Realized by BlackRock and its Affiliates from their Relationship with the Master Fund and the Feeder Fund: The Board, including the Independent Board Members, reviewed the Master Fund’s/Feeder Fund’s contractual management fee rate compared with the other funds in the Feeder Fund’s Lipper category. It also compared the Feeder Fund’s total expense ratio, as well as the Master Fund’s/ Feeder Fund’s actual management fee rate, to those of other funds in the Feeder Fund’s Lipper category. The Board considered the services provided and the fees charged by BlackRock to other types of clients with similar investment mandates, including separately managed institutional accounts.
The Board received and reviewed statements relating to BlackRock’s financial condition and profitability with respect to the services it provided the Master Fund and the Feeder Fund. The Board was also provided with a profitability analysis that detailed the revenues earned and the expenses incurred by BlackRock for services provided to the Master Fund and the Feeder Fund. The Board reviewed BlackRock’s profitability with respect to the Master Fund and the Feeder Fund, as applicable, and other funds the Board currently oversees for the year ended December 31, 2011 compared to available aggregate profitability data provided for the years ended December 31, 2010 and December 31, 2009. The Board reviewed BlackRock’s profitability with respect to other fund complexes managed by the Manager and/or its affiliates. The Board reviewed BlackRock’s assumptions and methodology of allocating expenses in the profitability analysis, noting the inherent limitations in allocating costs among various advisory products. The Board recognized that profitability may be affected by numerous factors including, among other things, fee waivers and expense reimbursements by the Manager, the types of funds managed, expense allocations and business mix, and the difficulty of comparing profitability as a result of those factors.
The Board noted that, in general, individual fund or product line profitability of other advisors is not publicly available. The Board considered BlackRock’s operating margin, in general, compared to the operating margin for leading investment management firms whose operations include advising open-end funds, among other product types. In addition, the Board considered, among other things, certain third party data comparing BlackRock’s operating margin with that of other publicly-traded asset management firms. The Board considered the differences between BlackRock and these other firms, including the contribution of technology at BlackRock, BlackRock’s expense management, and the relative product mix.
| BLACKROCK VALUE OPPORTUNITIES FUND, INC. | SEPTEMBER 30, 2012 | 33 |
Disclosure of Investment Advisory Agreement and Sub-Advisory Agreement (concluded)
In addition, the Board considered the cost of the services provided to the Master Fund and the Feeder Fund by BlackRock, and BlackRock’s and its affiliates’ profits relating to the management and distribution of the Master Fund and the Feeder Fund and the other funds advised by BlackRock and its affiliates. As part of its analysis, the Board reviewed BlackRock’s methodology in allocating its costs to the management of the Master Fund and the Feeder Fund. The Board also considered whether BlackRock has the financial resources necessary to attract and retain high quality investment management personnel to perform its obligations under the Agreements and to continue to provide the high quality of services that is expected by the Board.
The Board noted that the Master Fund’s/Feeder Fund’s contractual management fee ratio (a combination of the advisory fee and the administration fee, if any) was lower than or equal to the median contractual management fee ratio paid by the Feeder Fund’s Peers, in each case before taking into account any expense reimbursements or fee waivers. The Board also noted that the Master Fund has an advisory fee arrangement that includes breakpoints that adjust the fee ratio downward as the size of the Master Fund increases above certain contractually specified levels.
D. Economies of Scale: The Board, including the Independent Board Members, considered the extent to which economies of scale might be realized as the assets of the Master Fund and the Feeder Fund increase, as well as the existence of expense caps. The Board also considered the extent to which the Master Fund and the Feeder Fund benefit from such economies and whether there should be changes in the advisory fee rate or structure in order to enable the Master Fund and the Feeder Fund to participate in these economies of scale, for example through the use of revised breakpoints in the advisory fee based upon the asset level of the Master Fund. In its consideration, the Board Members took into account the existence of expense caps and further considered the continuation and/or implementation, as applicable, of such caps.
E. Other Factors Deemed Relevant by the Board Members: The Board, including the Independent Board Members, also took into account other ancillary or “fall-out” benefits that BlackRock or its affiliates may derive from their respective relationships with the Master Fund and the Feeder Fund, both tangible and intangible, such as BlackRock’s ability to leverage its investment professionals who manage other portfolios and risk management personnel, an increase in BlackRock’s profile in the investment advisory community, and the engagement of BlackRock’s affiliates as service providers to the Master Fund and the Feeder Fund, including for administrative, distribution, securities lending and cash management services. The Board also considered BlackRock’s overall operations and its efforts to expand the scale of, and improve the quality of, its operations. The Board also noted that BlackRock may use and benefit from third party research obtained by soft dollars generated by certain registered fund transactions to assist in managing all or a number of its other client accounts. The Board further noted that it had considered the investment by BlackRock’s funds in ETFs without any offset against the management fees payable by the funds to BlackRock.
In connection with its consideration of the Agreements, the Board also received information regarding BlackRock’s brokerage and soft dollar practices. The Board received reports from BlackRock which included information on brokerage commissions and trade execution practices throughout the year.
The Board noted the competitive nature of the open-end fund marketplace, and that shareholders are able to redeem their Feeder Fund shares if they believe that the Feeder Fund’s and/or the Master Fund’s fees and expenses are too high or if they are dissatisfied with the performance of the Feeder Fund.
Conclusion
The Board of the Master Fund, including all the Independent Board Members, approved the continuation of the Advisory Agreement between the Manager and the Master Fund for a one-year term ending June 30, 2013, and the Sub-Advisory Agreement between the Manager and the Sub-Advisor with respect to the Master Fund for a one-year term ending June 30, 2013. Based upon its evaluation of all of the aforementioned factors in their totality, the Board of the Master Fund, including the Independent Board Members, was satisfied that the terms of the Agreements were fair and reasonable and in the best interest of the Master Fund and its shareholders. The Board of the Feeder Fund, including the Independent Board Members, also considered the continuation of the Agreements with respect to the Master Fund and found the Agreements to be satisfactory. In arriving at its decision to approve the Agreements, the Board of the Master Fund did not identify any single factor or group of factors as all-important or controlling, but considered all factors together, and different Board Members may have attributed different weights to the various factors considered. The Independent Board Members were also assisted by the advice of independent legal counsel in making this determination. The contractual fee arrangements for the Master Fund reflect the results of several years of review by the Board Members and predecessor Board Members, and discussions between such Board Members (and predecessor Board Members) and BlackRock. As a result, the Board Members’ conclusions may be based in part on their consideration of these arrangements in prior years.
| 34 | BLACKROCK VALUE OPPORTUNITIES FUND, INC. | SEPTEMBER 30, 2012 |
Officers and Directors
Robert M. Hernandez, Chairman of the Board and Director
Fred G. Weiss, Vice Chairman of the Board and Director
Paul L. Audet, Director
James H. Bodurtha, Director
Bruce R. Bond, Director
Donald W. Burton, Director
Honorable Stuart E. Eizenstat, Director
Laurence D. Fink, Director
Kenneth A. Froot, Director
Henry Gabbay, Director
John F. O’Brien, Director
Roberta Cooper Ramo, Director
David H. Walsh, Director
John M. Perlowski, President and Chief Executive Officer
Brendan Kyne, Vice President
Neal Andrews, Chief Financial Officer
Jay Fife, Treasurer
Brian Kindelan, Chief Compliance Officer and
Anti-Money Laundering Officer
Benjamin Archibald, Secretary1
| 1 | | Effective May 8, 2012, Ira P. Shapiro resigned as Secretary of the Fund and Master LLC and Benjamin Archibald became Secretary of the Fund and Master LLC. |
Investment Advisor
BlackRock Advisors, LLC
Wilmington, DE 19809
Sub-Advisor
BlackRock Investment Management, LLC
Princeton, NJ 08540
Custodian
The Bank of New York Mellon
New York, NY 10286
Transfer Agent
BNY Mellon Investment Servicing (US) Inc.
Wilmington, DE 19809
Accounting Agent
State Street Bank and Trust Company
Boston, MA 02110
Distributor
BlackRock Investments, LLC
New York, NY 10022
Independent Registered Public
Accounting Firm
Deloitte & Touche LLP
Boston, MA 02116
Legal Counsel
Willkie Farr & Gallagher LLP
New York, NY 10019
Address of the Fund
100 Bellevue Parkway
Wilmington, DE 19809
| BLACKROCK VALUE OPPORTUNITIES FUND, INC. | SEPTEMBER 30, 2012 | 35 |
Additional Information
General Information
Electronic Delivery
Electronic copies of most financial reports and prospectuses are available on the Fund’s website or shareholders can sign up for e-mail notifications of quarterly statements, annual and semi-annual reports and prospectuses by enrolling in the Fund’s electronic delivery program.
To enroll:
Shareholders Who Hold Accounts with Investment Advisors, Banks or Brokerages:
Please contact your financial advisor. Please note that not all investment advisors, banks or brokerages may offer this service.
Shareholders Who Hold Accounts Directly with BlackRock:
| 1) | | Access the BlackRock website at
http://www.blackrock.com/edelivery |
| 2) | | Select “eDelivery” under the “More Information” section |
Householding
The Fund will mail only one copy of shareholder documents, including prospectuses, annual and semi-annual reports and proxy statements, to shareholders with multiple accounts at the same address. This practice is commonly called “householding” and is intended to reduce expenses and eliminate duplicate mailings of shareholder documents. Mailings of your shareholder documents may be householded indefinitely unless you instruct us otherwise. If you do not want the mailing of these documents to be combined with those for other members of your household, please call the Fund at (800) 441-7762.
Availability of Quarterly Schedule of Investments
The Fund/Master LLC file their complete schedule of portfolio holdings with the SEC for the first and third quarters of each fiscal year on Form N-Q. The Fund’s/Master LLC’s Forms N-Q are available on the SEC’s website at http://www.sec.gov and may also be reviewed and copied at the SEC’s Public Reference Room in Washington, DC. Information on how to access documents on the SEC’s website without charge may be obtained by calling (800) SEC-0330. The Fund’s/Master LLC’s Forms N-Q may also be obtained upon request and without charge by calling (800) 441-7762.
Availability of Proxy Voting Policies and Procedures
A description of the policies and procedures that the Fund/Master LLC use to determine how to vote proxies relating to portfolio securities is available (1) without charge, upon request, by calling (800) 441-7762; (2) at http://www.blackrock.com; and (3) on the SEC’s website at http://www.sec.gov.
Availability of Proxy Voting Record
Information about how the Fund/Master LLC voted proxies relating to securities held in the Fund’s/Master LLC’s portfolio during the most recent 12-month period ended June 30 is available upon request and without charge (1) at http://www.blackrock.com or by calling (800) 441-7762 and (2) on the SEC’s website at http://www.sec.gov.
Shareholder Privileges
Account Information
Call us at (800) 441-7762 from 8:00 AM to 6:00 PM EST on any business day to get information about your account balances, recent transactions and share prices. You can also reach us on the Web at http://www.blackrock.com/funds.
Automatic Investment Plans
Investor Class shareholders who want to invest regularly can arrange to have $50 or more automatically deducted from their checking or savings account and invested in any of the BlackRock funds.
Systematic Withdrawal Plans
Investor Class shareholders can establish a systematic withdrawal plan and receive periodic payments of $50 or more from their BlackRock funds, as long as their account balance is at least $10,000.
Retirement Plans
Shareholders may make investments in conjunction with Traditional, Rollover, Roth, Coverdell, Simple IRAs, SEP IRAs and 403(b) Plans.
| 36 | BLACKROCK VALUE OPPORTUNITIES FUND, INC. | SEPTEMBER 30, 2012 |
Additional Information (concluded)
BlackRock Privacy Principles
BlackRock is committed to maintaining the privacy of its current and former fund investors and individual clients (collectively, “Clients”) and to safeguarding their non-public personal information. The following information is provided to help you understand what personal information BlackRock collects, how we protect that information and why in certain cases we share such information with select parties.
If you are located in a jurisdiction where specific laws, rules or regulations require BlackRock to provide you with additional or different privacy-related rights beyond what is set forth below, then BlackRock will comply with those specific laws, rules or regulations.
BlackRock obtains or verifies personal non-public information from and about you from different sources, including the following: (i) information we receive from you or, if applicable, your financial intermediary, on applications, forms or other documents; (ii) information about your transactions with us, our affiliates, or others; (iii) information we receive from a consumer reporting agency; and (iv) from visits to our websites.
BlackRock does not sell or disclose to non-affiliated third parties any non-public personal information about its Clients, except as permitted by law or as is necessary to respond to regulatory requests or to service Client accounts. These non-affiliated third parties are required to protect the confidentiality and security of this information and to use it only for its intended purpose.
We may share information with our affiliates to service your account or to provide you with information about other BlackRock products or services that may be of interest to you. In addition, BlackRock restricts access to non-public personal information about its Clients to those BlackRock employees with a legitimate business need for the information. BlackRock maintains physical, electronic and procedural safeguards that are designed to protect the non-public personal information of its Clients, including procedures relating to the proper storage and disposal of such information.
| BLACKROCK VALUE OPPORTUNITIES FUND, INC. | SEPTEMBER 30, 2012 | 37 |
A World-Class Mutual Fund Family
BlackRock offers a diverse lineup of open-end mutual funds crossing all investment styles and managed by experts in equity, fixed income and tax-exempt investing.
Equity Funds
| | |
| BlackRock ACWI ex-US Index Fund | BlackRock Global Dividend Income Portfolio | BlackRock Mid-Cap Growth Equity Portfolio |
| BlackRock All-Cap Energy & Resources | BlackRock Global Opportunities Portfolio | BlackRock Mid Cap Value Opportunities |
| Portfolio | BlackRock Global SmallCap Fund | Fund |
| BlackRock Balanced Capital Fund† | BlackRock Health Sciences Opportunities Portfolio | BlackRock Natural Resources Trust |
| BlackRock Basic Value Fund | BlackRock Index Equity Portfolio | BlackRock Pacific Fund |
| BlackRock Capital Appreciation Fund | BlackRock India Fund | BlackRock Real Estate Securities Fund |
| BlackRock China Fund | BlackRock International Fund | BlackRock Russell 1000 Index Fund |
| BlackRock Commodity Strategies Fund | BlackRock International Index Fund | BlackRock Science & Technology |
| BlackRock Emerging Markets Fund | BlackRock International Opportunities Portfolio | Opportunities Portfolio |
| BlackRock Emerging Markets Long/Short | BlackRock Large Cap Core Fund | BlackRock Small Cap Growth Equity |
| Equity Fund | BlackRock Large Cap Core Plus Fund | Portfolio |
| BlackRock Energy & Resources Portfolio | BlackRock Large Cap Growth Fund | BlackRock Small Cap Growth Fund II |
| BlackRock Equity Dividend Fund | BlackRock Large Cap Value Fund | BlackRock Small Cap Index Fund |
| BlackRock EuroFund | BlackRock Latin America Fund | BlackRock S&P 500 Index Fund |
| BlackRock Flexible Equity Fund | BlackRock Long-Horizon Equity Fund | BlackRock S&P 500 Stock Fund |
| BlackRock Focus Growth Fund | BlackRock Managed Volatility Portfolio† | BlackRock U.S. Opportunities Portfolio |
| BlackRock Global Allocation Fund† | | BlackRock Value Opportunities Fund |
| | | BlackRock World Gold Fund |
Taxable Fixed Income Funds
| | |
| BlackRock Bond Index Fund | BlackRock High Yield Bond Portfolio | BlackRock Strategic Income |
| BlackRock Core Bond Portfolio | BlackRock Inflation Protected Bond Portfolio | Opportunities Portfolio |
| BlackRock CoreAlpha Bond Fund | BlackRock International Bond Portfolio | BlackRock Total Return Fund |
| BlackRock Emerging Market Local Debt Portfolio | BlackRock Long Duration Bond Portfolio | BlackRock US Government Bond Portfolio |
| BlackRock Floating Rate Income Portfolio | BlackRock Low Duration Bond Portfolio | BlackRock US Mortgage Portfolio |
| BlackRock Global Long/Short Credit Fund | BlackRock Multi-Asset Income Portfolio† | BlackRock World Income Fund |
| BlackRock GNMA Portfolio | BlackRock Secured Credit Portfolio | |
Municipal Fixed Income Funds
| | |
| BlackRock California Municipal Bond Fund | BlackRock National Municipal Fund | BlackRock Pennsylvania Municipal Bond Fund |
| BlackRock High Yield Municipal Fund | BlackRock New Jersey Municipal Bond Fund | BlackRock Short-Term Municipal Fund |
| BlackRock Intermediate Municipal Fund | BlackRock New York Municipal Bond Fund | |
Target Risk & Target Date Funds†
| | | | | | |
| BlackRock Prepared Portfolios | LifePath Active Portfolios | LifePath Portfolios | | LifePath Index Portfolios |
| Conservative Prepared Portfolio | 2015 | 2035 | Retirement | 2040 | Retirement | 2040 |
| Moderate Prepared Portfolio | 2020 | 2040 | 2020 | 2045 | 2020 | 2045 |
| Growth Prepared Portfolio | 2025 | 2045 | 2025 | 2050 | 2025 | 2050 |
| Aggressive Growth Prepared Portfolio | 2030 | 2050 | 2030 | 2055 | 2030 | 2055 |
| | | | 2035 | | 2035 | |
† Mixed asset fund.
BlackRock mutual funds are currently distributed by BlackRock Investments, LLC. You should consider the investment objectives, risks, charges and expenses of the funds under consideration carefully before investing. Each fund’s prospectus contains this and other information and is available a t www.blackrock.com or by calling (800) 441-7762 or from your financial advisor. The prospectus should be read carefully before investing.
| 38 | BLACKROCK VALUE OPPORTUNITIES FUND, INC. | SEPTEMBER 30, 2012 |
This report is not authorized for use as an offer of sale or a solicitation of an offer to buy shares of the Fund unless accompanied or preceded by the Fund’s current prospectus. Past performance results shown in this report should not be considered a representation of future performance. Investment returns and principal value of shares will fluctuate so that shares, when redeemed, may be worth more or less than their original cost. Statements and other information herein are as dated and are subject to change.


#10253-9/12-SAR
| Item 2 – | Code of Ethics – Not Applicable to this semi-annual report |
| Item 3 – | Audit Committee Financial Expert – Not Applicable to this semi-annual report |
| Item 4 – | Principal Accountant Fees and Services – Not Applicable to this semi-annual report |
| Item 5 – | Audit Committee of Listed Registrants – Not Applicable |
| Item 6 – | Investments |
| | (a) The registrants’ Schedules of Investments are included as part of the Report to Stockholders filed under Item 1 of this Form. |
| | (b) Not Applicable due to no such divestments during the semi-annual period covered since the previous Form N-CSR filing. |
| Item 7 – | Disclosure of Proxy Voting Policies and Procedures for Closed-End Management Investment Companies – Not Applicable |
| Item 8 – | Portfolio Managers of Closed-End Management Investment Companies – Not Applicable |
| Item 9 – | Purchases of Equity Securities by Closed-End Management Investment Company and Affiliated Purchasers – Not Applicable |
| Item 10 – | Submission of Matters to a Vote of Security Holders – There have been no material changes to these procedures. |
| Item 11 – | Controls and Procedures |
| | (a) – The registrants’ principal executive and principal financial officers, or persons performing similar functions, have concluded that the registrants’ disclosure controls and procedures (as defined in Rule 30a-3(c) under the Investment Company Act of 1940, as amended (the “1940 Act”)) are effective as of a date within 90 days of the filing of this report based on the evaluation of these controls and procedures required by Rule 30a-3(b) under the 1940 Act and Rule 15d-15(b) under the Securities Exchange Act of 1934, as amended. |
| | (b) – There were no changes in the registrants’ internal control over financial reporting (as defined in Rule 30a-3(d) under the 1940 Act) that occurred during the second fiscal quarter of the period covered by this report that have materially affected, or are reasonably likely to materially affect, the registrants’ internal control over financial reporting. |
| Item 12 – | Exhibits attached hereto |
| | (a)(1) – Code of Ethics – Not Applicable to this semi-annual report |
| | (a)(2) – Certifications – Attached hereto |
| | (a)(3) – Not Applicable |
| | (b) – Certifications – Attached hereto |
2
Pursuant to the requirements of the Securities Exchange Act of 1934 and the Investment Company Act of 1940, each registrant has duly caused this report to be signed on its behalf by the undersigned, thereunto duly authorized.
BlackRock Value Opportunities Fund, Inc. and Master Value Opportunities LLC
By: /s/ John M. Perlowski
John M. Perlowski
Chief Executive Officer (principal executive officer) of
BlackRock Value Opportunities Fund, Inc. and Master Value Opportunities LLC
Date: December 4, 2012
Pursuant to the requirements of the Securities Exchange Act of 1934 and the Investment Company Act of 1940, this report has been signed below by the following persons on behalf of each registrant and in the capacities and on the dates indicated.
By: /s/ John M. Perlowski
John M. Perlowski
Chief Executive Officer (principal executive officer) of
BlackRock Value Opportunities Fund, Inc. and Master Value Opportunities LLC
Date: December 4, 2012
By: /s/ Neal J. Andrews
Neal J. Andrews
Chief Financial Officer (principal financial officer) of
BlackRock Value Opportunities Fund, Inc. and Master Value Opportunities LLC
Date: December 4, 2012
3