UNITED STATES
SECURITIES AND EXCHANGE COMMISSION
Washington, D.C. 20549
FORM N-CSR
CERTIFIED SHAREHOLDER REPORT OF REGISTERED MANAGEMENT INVESTMENT COMPANIES
Investment Company Act file number: 811-02809 and 811-10095
Name of Fund: BlackRock Value Opportunities Fund, Inc. and Master Value Opportunities LLC
Fund Address: 100 Bellevue Parkway, Wilmington, DE 19809
Name and address of agent for service: John M. Perlowski, Chief Executive Officer, BlackRock Value Opportunities Fund, Inc. and Master Value Opportunities LLC, 55 East 52nd Street, New York, NY 10055
Registrants’ telephone number, including area code: (800) 441-7762
Date of fiscal year end: 03/31/2015
Date of reporting period: 09/30/2014
Item 1 – Report to Stockholders
SEPTEMBER 30, 2014
| | | | |
SEMI-ANNUAL REPORT (UNAUDITED) | | | | BLACKROCK® |
BlackRock Value Opportunities Fund, Inc.
| | |
| Not FDIC Insured ¡ May Lose Value ¡ No Bank Guarantee | | |
| | | | | | |
| 2 | | BLACKROCK VALUE OPPORTUNITIES FUND, INC. | | SEPTEMBER 30, 2014 | | |
Dear Shareholder,
The fourth quarter of 2013 was a generally strong period for most risk assets such as equities and high yield bonds even as investors grappled with uncertainty as to when and by how much the U.S. Federal Reserve would begin to gradually reduce (or “taper”) its asset purchase programs. A prolonged debate over the U.S. debt ceiling and partial government shutdown roiled financial markets at the start of the period, but stocks quickly resumed their upward course once a compromise was struck in mid-October. Higher quality fixed income and emerging market investments, however, began to struggle as Fed tapering became increasingly imminent. When the central bank ultimately announced its tapering plans in mid-December, equity investors reacted positively, as this action signaled the Fed’s perception of real improvement in the economy.
Most asset classes moved higher in the first half of 2014 despite the pull back in Fed stimulus. The year got off to a rocky start, however, as a number of developing economies showed signs of stress while facing the onset of diminishing global liquidity. These risks, combined with disappointing U.S. economic data, caused equities to decline in January while bond markets found renewed strength from investors seeking relatively safer assets. Although these headwinds persisted, equities were back on the rise in February as investors were assuaged by increasing evidence that the softer U.S. data was a temporary and weather-related trend, and forecasts pointed to growth picking up later in the year.
In the months that followed, interest rates trended lower and bond prices climbed higher in the modest growth environment. Financial markets exhibited a remarkably low level of volatility despite rising geopolitical risks and mixed global economic news. Tensions in Russia and Ukraine and signs of decelerating growth in China caused some turbulence, but markets were resilient as investors focused on signs of improvement in the U.S. recovery, stronger corporate earnings, increased merger-and-acquisition activity and, perhaps most importantly, a dovish tone from the Fed offering reassurance that no changes to short-term interest rates were on the horizon.
In the ongoing low-rate environment, investors looked to equities as a source of yield, pushing major indices to record levels. As stock prices continued to move higher, investors soon became wary of stretched valuations and a new theme emerged. Stocks that had experienced significant price appreciation in 2013, particularly growth and momentum names, broadly declined as investors fled to stocks with cheaper valuations. This rotation resulted in the strongest performers of 2013 struggling most in 2014, and vice versa. Especially hard hit were U.S. small cap and European stocks, where earnings growth had not kept pace with market gains. In contrast, emerging market stocks benefited from the trend after having suffered heavy selling pressure earlier in the year.
Asset prices tend to be more vulnerable to bad news when investors believe valuations are high. Consequently, markets came under pressure in July as geopolitical turmoil intensified in Gaza, Iraq and Ukraine and financial troubles boiled over in Argentina and Portugal. Investors regained some confidence in August and, although volatility ticked up, markets briefly rebounded amid renewed comfort that the Fed would continue to keep rates low and hopes that the European Central Bank would increase stimulus. However, markets swiftly reversed in September as improving U.S. economic indicators raised the likelihood of the Fed increasing short-term interest rates sooner than previously anticipated. Global credit markets tightened as the U.S. dollar strengthened, ultimately putting a strain on investor flows. High valuations combined with impending rate hikes and tighter credit conditions stoked increasing volatility in financial markets. Escalating global risks added to uncertainty as the U.S. renewed its involvement in Iraq, the European Union imposed additional sanctions against Russia, and Scottish voters contemplated a referendum for the region’s independence from the UK. In this environment, most asset classes saw steep declines over the final month of the period.
U.S. large cap stocks were the strongest performers for the six- and 12-month periods ended September 30, 2014, while U.S. small cap and international stocks lagged. Emerging market equities endured some hearty swings in sentiment during the period, yet the asset class generated modest gains. Most fixed income assets produced positive results even as the Fed reduced its open-market purchases. Tax-exempt municipal bonds benefited from a favorable supply-and-demand environment. Short-term interest rates remained near zero, keeping yields on money market securities close to historic lows.
At BlackRock, we believe investors need to think globally, extend their scope across a broad array of asset classes and be prepared to move freely as market conditions change over time. We encourage you to talk with your financial advisor and visit blackrock.com for further insight about investing in today’s world.
Sincerely,

Rob Kapito
President, BlackRock Advisors, LLC

The economic and monetary environment has remained generally supportive of financial markets, although higher stock valuations combined with expectations for higher U.S. rates has caused volatility to rise, albeit from levels below the historical norm.
Rob Kapito
President, BlackRock Advisors, LLC
| | | | | | | | |
| Total Returns as of September 30, 2014 | |
| | | 6-month | | | 12-month | |
U.S. large cap equities
(S&P 500® Index) | | | 6.42 | % | | | 19.73 | % |
U.S. small cap equities
(Russell 2000® Index) | | | (5.46 | ) | | | 3.93 | |
International equities
(MSCI Europe, Australasia, Far East Index) | | | (2.03 | ) | | | 4.25 | |
Emerging market equities
(MSCI Emerging Markets Index) | | | 2.87 | | | | 4.30 | |
3-month Treasury bills
(BofA Merrill Lynch
3-Month U.S. Treasury
Bill Index) | | | 0.02 | | | | 0.05 | |
U.S. Treasury securities
(BofA Merrill Lynch
10- Year U.S. Treasury
Index) | | | 3.42 | | | | 4.29 | |
U.S. investment-grade
bonds (Barclays U.S.
Aggregate Bond Index) | | | 2.21 | | | | 3.96 | |
Tax-exempt municipal
bonds (S&P Municipal Bond Index) | | | 4.21 | | | | 8.29 | |
U.S. high yield bonds
(Barclays U.S. Corporate
High Yield 2% Issuer
Capped Index) | | | 0.50 | | | | 7.19 | |
|
| Past performance is no guarantee of future results. Index performance is shown for illustrative purposes only. You cannot invest directly in an index. | |
| | | | | | | | |
| | | THIS PAGE NOT PART OF YOUR FUND REPORT | | | | | 3 | |
| | | | |
| Fund Summary as of September 30, 2014 | | | BlackRock Value Opportunities Fund, Inc. | |
BlackRock Value Opportunities Fund, Inc.’s (the “Fund”) investment objective is to seek long term growth of capital by investing in a diversified portfolio of securities, primarily common stock, of relatively small companies that management of the Fund believes have special investment value and emerging growth companies regardless of size.
|
| Portfolio Management Commentary |
How did the Fund perform?
| Ÿ | | For the six-month period ended September 30, 2014, the Fund, through its investment in Master Value Opportunities LLC (the “Master LLC”), and its benchmark, the S&P SmallCap 600® Value Index, generated negative returns. The Fund’s Institutional Shares performed in line with the benchmark, while the Fund’s Investor A, Investor B, Investor C and Class R Shares underperformed. |
What factors influenced performance?
| Ÿ | | Individual stock selection in the financial sector, particularly within the capital markets and real estate investment trust industries, made the largest contribution to relative performance during the six-month period. Holdings in Marcus & Millichap, Inc. and CyrusOne, Inc. were substantial contributors within these industries. Stock selection was also very strong in the oil, gas & consumable fuels industry within the energy sector. Arch Coal, Inc., Cloud Peak Energy, Inc. and SM Energy Co. were sizeable contributors in the space. An underweight position in the industrials sector also helped relative performance. |
| Ÿ | | Security selection in the health care sector, particularly within the health care equipment & supplies industry, was the largest detractor from performance. Notable detractors included Hansen Medical, Inc., Invacare Corp. and Lumenis Ltd. Stock selection in the materials sector detracted from performance, as both Century Aluminum Co. and Kraton Performance Polymers, Inc. had an adverse impact on relative returns. Security |
| | | selection in the utilities sector also weighed on performance, with the electric utility ALLETE, Inc. posting a negative return during the period. |
Describe recent portfolio activity.
| Ÿ | | During the six-month period, the Master LLC continued to reduce its underweight in the financials sector by adding to companies such as LTC Properties, Inc., Cash America International, Inc., Argo Group International Holdings Ltd., Centerstate Banks, Inc. and Monmouth Real Estate Investment Corp. The Master LLC also added to its industrials exposure during a volatile period for the sector, purchasing Actuant Corp., Gencorp, Inc. and UTi Worldwide, Inc. The Master LLC reduced exposure to the health care sector, where many stocks had moved to premium valuations following strong performance in the fourth quarter of 2013 and first quarter of 2014. LCA-Vision, Inc., Gentiva Health Services, Inc. and Wright Medical Group, Inc. were among the positions that were sold or trimmed. |
Describe portfolio positioning at period end.
| Ÿ | | At the end of the period, the Master LLC was positioned with its largest allocations to the financials, information technology, industrials and consumer discretionary sectors. The Master LLC maintained smaller weights in consumer staples, materials, energy and utilities, where there were fewer opportunities to find relatively inexpensive companies with stronger growth prospects. |
The views expressed reflect the opinions of BlackRock as of the date of this report and are subject to change based on changes in market, economic or other conditions. These views are not intended to be a forecast of future events and are no guarantee of future results.
| | | | | | |
| 4 | | BLACKROCK VALUE OPPORTUNITIES FUND, INC. | | SEPTEMBER 30, 2014 | | |
|
| Total Return Based on a $10,000 Investment |
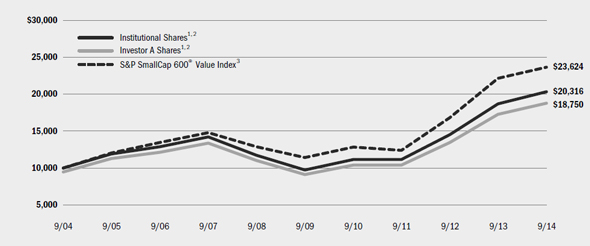
| | 1 | Assuming maximum sales charges, if any, transaction costs and other operating expenses, including administration fees. Institutional Shares do not have a sales charge. |
| | 2 | The Fund invests all of its assets in the Master LLC. The Master LLC invests primarily in common stock of small companies and emerging growth companies that the Master LLC’s management believes have special investment value. |
| | 3 | This unmanaged index is a subset of the S&P 600® Index that consists of those stocks in the S&P 600® Index exhibiting the strongest value characteristics. |
| | | | | | | | | | | | | | | | | | | | | | | | | | | | |
| Performance Summary for the Period Ended September 30, 2014 | |
| | | | | | Average Annual Total Returns4 | |
| | | | | | 1 Year | | | 5 Years | | | 10 Years | |
| | | 6-Month
Total Returns | | | w/o sales
charge | | | w/ sales
charge | | | w/o sales
charge | | | w/ sales
charge | | | w/o sales
charge | | | w/ sales
charge | |
Institutional | | | (4.63 | )% | | | 8.80 | % | | | N/A | | | | 15.90 | % | | | N/A | | | | 7.35 | % | | | N/A | |
Investor A | | | (4.72 | ) | | | 8.58 | | | | 2.88 | % | | | 15.58 | | | | 14.34 | % | | | 7.06 | | | | 6.49 | % |
Investor B | | | (5.25 | ) | | | 7.45 | | | | 2.95 | | | | 14.42 | | | | 14.18 | | | | 6.30 | | | | 6.30 | |
Investor C | | | (5.12 | ) | | | 7.66 | | | | 6.66 | | | | 14.54 | | | | 14.54 | | | | 6.10 | | | | 6.10 | |
Class R | | | (4.83 | ) | | | 8.24 | | | | N/A | | | | 15.21 | | | | N/A | | | | 6.71 | | | | N/A | |
S&P SmallCap 600® Value Index | | | (4.66 | ) | | | 6.74 | | | | N/A | | | | 15.66 | | | | N/A | | | | 8.98 | | | | N/A | |
| | 4 | | Assuming maximum sales charges, if any. Average annual total returns with and without sales charges reflect reductions for distribution and service fees. See “About Fund Performance” on page 6 for a detailed description of share classes, including any related sales charges and fees. |
| | | | N/A—Not applicable as share class and index do not have a sales charge. |
| | | | Past performance is not indicative of future results. |
| | | | | | | | | | | | | | | | | | | | | | | | | | | | |
| Expense Example | |
| | | Actual | | | Hypothetical6 | | | | |
| | | Beginning
Account Value
April 1, 2014 | | | Ending
Account Value
September 30, 2014 | | | Expenses Paid
During the Period5 | | | Beginning
Account Value
April 1, 2014 | | | Ending
Account Value
September 30, 2014 | | | Expenses Paid
During the Period5 | | | Annualized
Expense Ratio | |
Institutional | | | $1,000.00 | | | | $953.70 | | | | $4.95 | | | | $1,000.00 | | | | $1,020.00 | | | | $5.11 | | | | 1.01 | % |
Investor A | | | $1,000.00 | | | | $952.80 | | | | $6.07 | | | | $1,000.00 | | | | $1,018.85 | | | | $6.28 | | | | 1.24 | % |
Investor B | | | $1,000.00 | | | | $947.50 | | | | $11.28 | | | | $1,000.00 | | | | $1,013.49 | | | | $11.66 | | | | 2.31 | % |
Investor C | | | $1,000.00 | | | | $948.80 | | | | $10.16 | | | | $1,000.00 | | | | $1,014.64 | | | | $10.50 | | | | 2.08 | % |
Class R | | | $1,000.00 | | | | $951.70 | | | | $7.58 | | | | $1,000.00 | | | | $1,017.30 | | | | $7.84 | | | | 1.55 | % |
| | 5 | | For each class of the Fund, expenses are equal to the annualized expense ratio for the class, multiplied by the average account value over the period, multiplied by 183/365 (to reflect the one-half year period shown). Because the Fund invests significantly in the Master LLC, the expense table reflects the net expenses of both the Fund and the Master LLC in which it invests. |
| | 6 | | Hypothetical 5% annual return before expenses is calculated by pro rating the number of days in the most recent fiscal half year divided by 365. |
| | | | See “Disclosure of Expenses” on page 6 for further information on how expenses were calculated. |
| | | | | | |
| | | BLACKROCK VALUE OPPORTUNITIES FUND, INC. | | SEPTEMBER 30, 2014 | | 5 |
| Ÿ | | Institutional Shares are not subject to any sales charge. These shares bear no ongoing distribution or service fees and are available only to certain eligible investors. |
| Ÿ | | Investor A Shares are subject to a maximum initial sales charge (front-end load) of 5.25% and a service fee of 0.25% per year (but no distribution fee). Certain redemptions of these shares may be subject to a contingent deferred sales charge (“CDSC”) where no initial sales charge was paid at the time of purchase. |
| Ÿ | | Investor B Shares are subject to a maximum CDSC of 4.50% declining to 0% after six years. In addition, these shares are subject to a distribution fee of 0.75% per year and a service fee of 0.25% per year. These shares automatically convert to Investor A Shares after approximately eight years. (There is no initial sales charge for automatic share conversions.) All returns for periods greater than eight years reflect this conversion. These shares are only available through exchanges and dividend reinvestments by current holders and for purchase by certain employer-sponsored retirement plans. |
| Ÿ | | Investor C Shares are subject to a 1.00% CDSC if redeemed within one year of purchase. In addition, these shares are subject to a distribution fee of 0.75% per year and a service fee of 0.25% per year. |
| Ÿ | | Class R Shares are not subject to any sales charge. These shares are subject to a distribution fee of 0.25% per year and a service fee of 0.25% per year. These shares are available only to certain employer-sponsored retirement plans. |
Performance information reflects past performance and does not guarantee future results. Current performance may be lower or higher than the performance data quoted. Refer to www.blackrock.com/funds to obtain performance data current to the most recent month end. Performance results do not reflect the deduction of taxes that a shareholder would pay on fund distributions or the redemption of fund shares. Figures shown in the performance table on the previous page assume reinvestment of all distributions, if any, at net asset value (“NAV”) on the ex-dividend date. Investment return and principal value of shares will fluctuate so that shares, when redeemed, may be worth more or less than their original cost. Distributions paid to each class of shares will vary because of the different levels of service, distribution and transfer agency fees applicable to each class, which are deducted from the income available to be paid to shareholders.
Shareholders of the Fund may incur the following charges: (a) transactional expenses, such as sales charges; and (b) operating expenses, including administration fees, service and distribution fees, including 12b-1 fees, acquired fund fees and expenses and other Fund expenses. The expense example shown on the previous page (which is based on a hypothetical investment of $1,000 invested on April 1, 2014 and held through September 30, 2014) is intended to assist shareholders both in calculating expenses based on an investment in the Fund and in comparing these expenses with similar costs of investing in other mutual funds.
The expense example provides information about actual account values and actual expenses. In order to estimate the expenses a shareholder paid during the period covered by this report, shareholders can divide their account value by $1,000 and then multiply the result by the number corresponding to their share class under the heading entitled “Expenses Paid During the Period.”
The expense example also provides information about hypothetical account values and hypothetical expenses based on the Fund’s actual expense ratio and an assumed rate of return of 5% per year before expenses. In order to assist shareholders in comparing the ongoing expenses of investing in the Fund and other funds, compare the 5% hypothetical example with the 5% hypothetical examples that appear in other funds’ shareholder reports.
The expenses shown in the expense example are intended to highlight shareholders’ ongoing costs only and do not reflect any transactional expenses, such as sales charges, if any. Therefore, the hypothetical example is useful in comparing ongoing expenses only, and will not help shareholders determine the relative total expenses of owning different funds. If these transactional expenses were included, shareholder expenses would have been higher.
| | | | | | |
| 6 | | BLACKROCK VALUE OPPORTUNITIES FUND, INC. | | SEPTEMBER 30, 2014 | | |
| | | | |
| Statement of Assets and Liabilities | | | BlackRock Value Opportunities Fund, Inc. | |
| | | | |
| September 30, 2014 (Unaudited) | | | |
| | | | |
| Assets | | | | |
Investments at value — Master LLC (cost — $694,748,579) | | $ | 814,162,862 | |
Withdrawals receivable from the Master LLC | | | 1,395,375 | |
Capital shares sold receivable | | | 547,118 | |
Prepaid expenses | | | 69,965 | |
| | | | |
Total assets | | | 816,175,320 | |
| | | | |
| | | | |
| Liabilities | | | | |
Capital shares redeemed payable | | | 1,942,493 | |
Transfer agent fees payable | | | 403,763 | |
Service and distribution fees payable | | | 267,667 | |
Administration fees payable | | | 175,386 | |
Other affiliates payable | | | 4,415 | |
Officer’s fees payable | | | 151 | |
Other accrued expenses payable | | | 38,649 | |
| | | | |
Total liabilities | | | 2,832,524 | |
| | | | |
Net Assets | | $ | 813,342,796 | |
| | | | |
| | | | |
| Net Assets Consist of | | | | |
Paid-in capital | | $ | 784,740,737 | |
Accumulated net investment loss | | | (2,536,130 | ) |
Accumulated net realized loss allocated from the Master LLC | | | (88,276,094 | ) |
Net unrealized appreciation/depreciation allocated from the Master LLC | | | 119,414,283 | |
| | | | |
Net Assets | | $ | 813,342,796 | |
| | | | |
| | | | |
| Net Asset Value | | | | |
Institutional — Based on net assets of $158,853,927 and 5,286,723 shares outstanding, 100 million shares authorized, $0.10 par value | | $ | 30.05 | |
| | | | |
Investor A — Based on net assets of $442,970,695 and 15,143,996 shares outstanding, 100 million shares authorized, $0.10 par value | | $ | 29.25 | |
| | | | |
Investor B — Based on net assets of $7,635,104 and 322,780 shares outstanding, 100 million shares authorized, $0.10 par value | | $ | 23.65 | |
| | | | |
Investor C — Based on net assets of $178,420,521 and 7,885,465 shares outstanding, 100 million shares authorized, $0.10 par value | | $ | 22.63 | |
| | | | |
Class R — Based on net assets of $25,462,549 and 1,042,753 shares outstanding, 100 million shares authorized, $0.10 par value | | $ | 24.42 | |
| | | | |
See Notes to Financial Statements.
| | | | | | |
| | | BLACKROCK VALUE OPPORTUNITIES FUND, INC. | | SEPTEMBER 30, 2014 | | 7 |
| | | | |
| Statement of Operations | | | BlackRock Value Opportunities Fund, Inc. | |
| | | | |
| Six Months Ended September 30, 2014 (Unaudited) | | | |
| | | | |
| Investment Income | | | | |
Net investment income allocated from the Master LLC: | | | | |
Dividends — unaffiliated | | $ | 6,009,870 | |
Foreign taxes withheld | | | (11,880 | ) |
Securities lending — affiliated — net | | | 875,590 | |
Dividends — affiliated | | | 76,954 | |
Expenses | | | (2,543,781 | ) |
Fees waived | | | 7,279 | |
| | | | |
Total income | | | 4,414,032 | |
| | | | |
| | | | |
| Fund Expenses | | | | |
Administration | | | 1,165,903 | |
Service — Investor A | | | 591,196 | |
Service and distribution — Investor B | | | 47,736 | |
Service and distribution — Investor C | | | 968,432 | |
Service and distribution — Class R | | | 68,926 | |
Transfer agent — Institutional | | | 223,654 | |
Transfer agent — Investor A | | | 397,934 | |
Transfer agent — Investor B | | | 23,600 | |
Transfer agent — Investor C | | | 249,942 | |
Transfer agent — Class R | | | 31,770 | |
Registration | | | 41,272 | |
Professional | | | 39,384 | |
Printing | | | 24,979 | |
Officer | | | 268 | |
Miscellaneous | | | 11,259 | |
| | | | |
Total expenses | | | 3,886,255 | |
| | | | |
Net investment income | | | 527,777 | |
| | | | |
| | | | |
| Realized and Unrealized Gain (Loss) Allocated from the Master LLC | | | | |
Net realized gain from investments and foreign currency transactions | | | 92,205,168 | |
Net change in unrealized appreciation/depreciation on investments and foreign currency translations | | | (128,549,437 | ) |
| | | | |
Total realized and unrealized loss | | | (36,344,269 | ) |
| | | | |
Net Decrease in Net Assets Resulting from Operations | | $ | (35,816,492 | ) |
| | | | |
See Notes to Financial Statements.
| | | | | | |
| 8 | | BLACKROCK VALUE OPPORTUNITIES FUND, INC. | | SEPTEMBER 30, 2014 | | |
| | | | |
| Statements of Changes in Net Assets | | | BlackRock Value Opportunities Fund, Inc. | |
| | | | | | | | |
| Increase (Decrease) in Net Assets: | | Six Months
Ended September 30,
2014 (Unaudited) | | | Year Ended March 31,
2014 | |
| | | | | | | | |
| Operations | | | | | | | | |
Net investment income (loss) | | $ | 527,777 | | | $ | (866,232 | ) |
Net realized gain | | | 92,205,168 | | | | 187,904,675 | |
Net change in unrealized appreciation/depreciation | | | (128,549,437 | ) | | | 57,610,706 | |
| | | | |
Net increase (decrease) in net assets resulting from operations | | | (35,816,492 | ) | | | 244,649,149 | |
| | | | |
| | | | | | | | |
| Capital Share Transactions | | | | | | | | |
Net decrease in net assets derived from capital share transactions | | | (178,600,224 | ) | | | (141,288,532 | ) |
| | | | |
| | | | | | | | |
| Net Assets | | | | | | | | |
Total increase (decrease) in net assets | | | (214,416,716 | ) | | | 103,360,617 | |
Beginning of period | | | 1,027,759,512 | | | | 924,398,895 | |
| | | | |
End of period | | $ | 813,342,796 | | | $ | 1,027,759,512 | |
| | | | |
Accumulated net investment loss, end of period | | $ | (2,536,130 | ) | | $ | (3,063,907 | ) |
| | | | |
See Notes to Financial Statements.
| | | | | | |
| | | BLACKROCK VALUE OPPORTUNITIES FUND, INC. | | SEPTEMBER 30, 2014 | | 9 |
| | | | |
| Financial Highlights | | | BlackRock Value Opportunities Fund, Inc. | |
| | | | | | | | | | | | | | | | | | | | | | | | |
| | | Institutional | |
| | | Six Months
Ended
September 30,
2014
(Unaudited) | | | Year Ended March 31, | |
| | | | 2014 | | | 2013 | | | 2012 | | | 2011 | | | 2010 | |
| Per Share Operating Performance | | | | | | | | | | | | | | | | | | | | | | | | |
Net asset value, beginning of period | | $ | 31.51 | | | $ | 24.44 | | | $ | 21.52 | | | $ | 21.36 | | | $ | 16.70 | | | $ | 10.01 | |
| | | | |
Net investment income1 | | | 0.08 | | | | 0.08 | | | | 0.08 | | | | 0.04 | | | | 0.05 | | | | 0.09 | |
Net realized and unrealized gain (loss) | | | (1.54 | ) | | | 6.99 | | | | 2.84 | | | | 0.12 | | | | 4.65 | 2 | | | 6.65 | 2 |
| | | | |
Net increase (decrease) from investment operations | | | (1.46 | ) | | | 7.07 | | | | 2.92 | | | | 0.16 | | | | 4.70 | | | | 6.74 | |
| | | | |
Distributions from net investment income | | | — | | | | — | | | | — | | | | — | | | | (0.04 | )3 | | | (0.05 | )3 |
| | | | |
Net asset value, end of period | | $ | 30.05 | | | $ | 31.51 | | | $ | 24.44 | | | $ | 21.52 | | | $ | 21.36 | | | $ | 16.70 | |
| | | | |
| | | | | | | | | | | | | | | | | | | | | | | | |
| Total Return4 | | | | | | | | | | | | | | | | | | | | | | | | |
Based on net asset value | | | (4.63 | )%5 | | | 28.93 | % | | | 13.57 | % | | | 0.75 | % | | | 28.24 | % | | | 67.43 | %6 |
| | | | |
| | | | | | | | | | | | | | | | | | | | | | | | |
| Ratios to Average Net Assets7 | | | | | | | | | | | | | | | | | | | | | | | | |
Total expenses | | | 1.01 | %8,9 | | | 0.97 | %8 | | | 0.99 | %8 | | | 1.00 | %8 | | | 1.01 | % | | | 1.07 | % |
| | | | |
Net investment income | | | 0.50 | %8,9 | | | 0.30 | %8 | | | 0.37 | %8 | | | 0.19 | %8 | | | 0.30 | % | | | 0.63 | % |
| | | | |
| | | | | | | | | | | | | | | | | | | | | | | | |
| Supplemental Data | | | | | | | | | | | | | | | | | | | | | | | | |
Net assets, end of period (000) | | $ | 158,854 | | | $ | 308,697 | | | $ | 280,316 | | | $ | 249,012 | | | $ | 418,333 | | | $ | 288,028 | |
| | | | |
Portfolio turnover rate of the Master LLC | | | 23 | % | | | 61 | % | | | 51 | % | | | 45 | % | | | 52 | % | | | 79 | % |
| | | | |
| | 1 | | Based on average shares outstanding. |
| | 2 | | Includes redemption fees, which are less than $0.005 per share. |
| | 3 | | Distributions for annual periods determined in accordance with federal income tax regulations. |
| | 4 | | Where applicable, assumes the reinvestment of distributions. |
| | 5 | | Aggregate total return. |
| | 6 | | Includes proceeds received from a settlement of litigation, through its investment in the Master LLC, which impacted the Fund’s total return. Not including these proceeds, the Fund’s total return would have been 67.13%. |
| | 7 | | Includes the Fund’s share of the Master LLC’s allocated net expenses and/or net investment income. |
| | 8 | | Includes the Fund’s share of the Master LLC’s allocated fees waived of less than 0.005%. |
See Notes to Financial Statements.
| | | | | | |
| 10 | | BLACKROCK VALUE OPPORTUNITIES FUND, INC. | | SEPTEMBER 30, 2014 | | |
| | | | |
| Financial Highlights (continued) | | | BlackRock Value Opportunities Fund, Inc. | |
| | | | | | | | | | | | | | | | | | | | | | | | |
| | | Investor A | |
| | | Six Months
Ended
September 30,
2014 (Unaudited) | | | Year Ended March 31, | |
| | | | 2014 | | | 2013 | | | 2012 | | | 2011 | | | 2010 | |
| Per Share Operating Performance | | | | | | | | | | | | | | | | | | | | | | | | |
Net asset value, beginning of period | | $ | 30.70 | | | $ | 23.88 | | | $ | 21.08 | | | $ | 20.99 | | | $ | 16.41 | | | $ | 9.85 | |
| | | | |
Net investment income (loss)1 | | | 0.04 | | | | 0.00 | 2 | | | 0.02 | | | | (0.03 | ) | | | 0.00 | 2 | | | 0.04 | |
Net realized and unrealized gain (loss) | | | (1.49 | ) | | | 6.82 | | | | 2.78 | | | | 0.12 | | | | 4.58 | 3 | | | 6.54 | 3 |
| | | | |
Net increase (decrease) from investment operations | | | (1.45 | ) | | | 6.82 | | | | 29.25 | | | | 0.09 | | | | 4.58 | | | | 6.58 | |
| | | | |
Distributions from net investment income | | | — | | | | — | | | | — | | | | — | | | | (0.00 | )4,5 | | | (0.02 | )4 |
| | | | |
Net asset value, end of period | | $ | 29.25 | | | $ | 30.70 | | | $ | 23.88 | | | $ | 21.08 | | | $ | 20.99 | | | $ | 16.41 | |
| | | | |
| | | | | | | | | | | | | | | | | | | | | | | | |
| Total Return6 | | | | | | | | | | | | | | | | | | | | | | | | |
Based on net asset value | | | (4.72 | )%7 | | | 28.56 | % | | | 13.28 | % | | | 0.43 | % | | | 27.92 | % | | | 66.80 | %8 |
| | | | |
| | | | | | | | | | | | | | | | | | | | | | | | |
| Ratios to Average Net Assets9 | | | | | | | | | | | | | | | | | | | | | | | | |
Total expenses | | | 1.24 | %10,11 | | | 1.25 | %10 | | | 1.26 | %10 | | | 1.30 | %10 | | | 1.29 | % | | | 1.35 | % |
| | | | |
Net investment income (loss) | | | 0.24 | %10,11 | | | 0.01 | %10 | | | 0.09 | %10 | | | (0.14 | )%10 | | | 0.02 | % | | | 0.33 | % |
| | | | |
| | | | | | | | | | | | | | | | | | | | | | | | |
| Supplemental Data | | | | | | | | | | | | | | | | | | | | | | | | |
Net assets, end of period (000) | | $ | 442,971 | | | $ | 479,719 | | | $ | 416,998 | | | $ | 397,591 | | | $ | 445,797 | | | $ | 403,008 | |
| | | | |
Portfolio turnover rate of the Master LLC | | | 23 | % | | | 61 | % | | | 51 | % | | | 45 | % | | | 52 | % | | | 79 | % |
| | | | |
| | 1 | | Based on average shares outstanding. |
| | 2 | | Amount is less than $0.005 per share. |
| | 3 | | Includes redemption fees, which are less than $0.005 per share. |
| | 4 | | Distributions for annual periods determined in accordance with federal income tax regulations. |
| | 5 | | Amount is greater than $(0.005) per share. |
| | 6 | | Where applicable, excludes the effects of any sales charges and assumes the reinvestment of distributions. |
| | 7 | | Aggregate total return. |
| | 8 | | Includes proceeds received from a settlement of litigation, through its investment in the Master LLC, which impacted the Fund’s total return. Not including these proceeds, the Fund’s total return would have been 66.49%. |
| | 9 | | Includes the Fund’s share of the Master LLC’s allocated net expenses and/or net investment income. |
| | 10 | | Includes the Fund’s share of the Master LLC’s allocated fees waived of less than 0.005%. |
See Notes to Financial Statements.
| | | | | | |
| | | BLACKROCK VALUE OPPORTUNITIES FUND, INC. | | SEPTEMBER 30, 2014 | | 11 |
| | | | |
| Financial Highlights (continued) | | | BlackRock Value Opportunities Fund, Inc. | |
| | | | | | | | | | | | | | | | | | | | | | | | |
| | | Investor B | |
| | | Six Months
Ended
September 30,
2014 (Unaudited) | | | Year Ended March 31, | |
| | | | 2014 | | | 2013 | | | 2012 | | | 2011 | | | 2010 | |
| Per Share Operating Performance | | | | | | | | | | | | | | | | | | | | | | | | |
Net asset value, beginning of period | | $ | 24.96 | | | $ | 19.63 | | | $ | 17.50 | | | $ | 17.61 | | | $ | 13.89 | | | $ | 8.41 | |
| | | | |
Net investment loss1 | | | (0.10 | ) | | | (0.24 | ) | | | (0.15 | ) | | | (0.18 | ) | | | (0.13 | ) | | | (0.07 | ) |
Net realized and unrealized gain (loss) | | | (1.21 | ) | | | 5.57 | | | | 2.28 | | | | 0.07 | | | | 3.85 | 2 | | | 5.55 | 2 |
| | | | |
Net increase (decrease) from investment operations | | | (1.31 | ) | | | 5.33 | | | | 2.13 | | | | (0.11 | ) | | | 3.72 | | | | 5.48 | |
| | | | |
Net asset value, end of period | | $ | 23.65 | | | $ | 24.96 | | | $ | 19.63 | | | $ | 17.50 | | | $ | 17.61 | | | $ | 13.89 | |
| | | | |
| | | | | | | | | | | | | | | | | | | | | | | | |
| Total Return3 | | | | | | | | | | | | | | | | | | | | | | | | |
Based on net asset value | | | (5.25 | )%4 | | | 27.15 | % | | | 12.17 | % | | | (0.62 | )% | | | 26.78 | % | | | 65.16 | %5 |
| | | | |
| | | | | | | | | | | | | | | | | | | | | | | | |
| Ratios to Average Net Assets6 | | | | | | | | | | | | | | | | | | | | | | | | |
Total expenses | | | 2.31 | %7,8 | | | 2.37 | %7 | | | 2.24 | %7 | | | 2.30 | %7 | | | 2.25 | % | | | 2.34 | % |
| | | | |
Net investment loss | | | (0.83 | )%7,8 | | | (1.09 | )%7 | | | (0.90 | )%7 | | | (1.14 | )%7 | | | (0.93 | )% | | | (0.64 | )% |
| | | | |
| | | | | | | | | | | | | | | | | | | | | | | | |
| Supplemental Data | | | | | | | | | | | | | | | | | | | | | | | | |
Net assets, end of period (000) | | $ | 7,635 | | | $ | 10,655 | | | $ | 22,579 | | | $ | 54,590 | | | $ | 88,310 | | | $ | 109,461 | |
| | | | |
Portfolio turnover rate of the Master LLC | | | 23 | % | | | 61 | % | | | 51 | % | | | 45 | % | | | 52 | % | | | 79 | % |
| | | | |
| | 1 | | Based on average shares outstanding. |
| | 2 | | Includes redemption fees, which are less than $0.005 per share. |
| | 3 | | Where applicable, excludes the effects of any sales charges and assumes the reinvestment of distributions. |
| | 4 | | Aggregate total return. |
| | 5 | | Includes proceeds received from a settlement of litigation, through its investment in the Master LLC, which impacted the Fund’s total return. Not including these proceeds, the Fund’s total return would have been 64.92%. |
| | 6 | | Includes the Fund’s share of the Master LLC’s allocated net expenses and/or net investment income. |
| | 7 | | Includes the Fund’s share of the Master LLC’s allocated fees waived of less than 0.005%. |
See Notes to Financial Statements.
| | | | | | |
| 12 | | BLACKROCK VALUE OPPORTUNITIES FUND, INC. | | SEPTEMBER 30, 2014 | | |
| | | | |
| Financial Highlights (continued) | | | BlackRock Value Opportunities Fund, Inc. | |
| | | | | | | | | | | | | | | | | | | | | | | | |
| | | Investor C | |
| | | Six Months
Ended
September 30,
2014 (Unaudited) | | | Year Ended March 31, | |
| | | | 2014 | | | 2013 | | | 2012 | | | 2011 | | | 2010 | |
| Per Share Operating Performance | | | | | | | | | | | | | | | | | | | | | | | | |
Net asset value, beginning of period | | $ | 23.85 | | | $ | 18.71 | | | $ | 16.67 | | | $ | 16.76 | | | $ | 13.23 | | | $ | 8.01 | |
| | | | |
Net investment loss1 | | | (0.07 | ) | | | (0.18 | ) | | | (0.13 | ) | | | (0.17 | ) | | | (0.13 | ) | | | (0.08 | ) |
Net realized and unrealized gain (loss) | | | (1.15 | ) | | | 5.32 | | | | 2.17 | | | | 0.08 | | | | 3.66 | 2 | | | 5.30 | 2 |
| | | | |
Net increase (decrease) from investment operations | | | (1.22 | ) | | | 5.14 | | | | 2.04 | | | | (0.09 | ) | | | 3.53 | | | | 5.22 | |
| | | | |
Net asset value, end of period | | $ | 22.63 | | | $ | 23.85 | | | $ | 18.71 | | | $ | 16.67 | | | $ | 16.76 | | | $ | 13.23 | |
| | | | |
| | | | | | | | | | | | | | | | | | | | | | | | |
| Total Return3 | | | | | | | | | | | | | | | | | | | | | | | | |
Based on net asset value | | | (5.12 | )%4 | | | 27.47 | % | | | 12.24 | % | | | (0.54 | )% | | | 26.68 | % | | | 65.17 | %5 |
| | | | |
| | | | | | | | | | | | | | | | | | | | | | | | |
| Ratios to Average Net Assets6 | | | | | | | | | | | | | | | | | | | | | | | | |
Total expenses | | | 2.08 | %7,8 | | | 2.11 | %7 | | | 2.17 | %7 | | | 2.25 | %7 | | | 2.26 | % | | | 2.40 | % |
| | | | |
Net investment loss | | | (0.60 | )%7,8 | | | (0.84 | )%7 | | | (0.82 | )%7 | | | (1.09 | )%7 | | | (0.94 | )% | | | (0.71 | )% |
| | | | |
| | | | | | | | | | | | | | | | | | | | | | | | |
| Supplemental Data | | | | | | | | | | | | | | | | | | | | | | | | |
Net assets, end of period (000) | | $ | 178,421 | | | $ | 200,245 | | | $ | 176,629 | | | $ | 190,059 | | | $ | 232,996 | | | $ | 215,916 | |
| | | | |
Portfolio turnover rate of the Master LLC | | | 23 | % | | | 61 | % | | | 51 | % | | | 45 | % | | | 52 | % | | | 79 | % |
| | | | |
| | 1 | | Based on average shares outstanding. |
| | 2 | | Includes redemption fees, which are less than $0.005 per share. |
| | 3 | | Where applicable, excludes the effects of any sales charges and assumes the reinvestment of distributions. |
| | 4 | | Aggregate total return. |
| | 5 | | Includes proceeds received from a settlement of litigation, through its investment in the Master LLC, which impacted the Fund’s total return. Not including these proceeds, the Fund’s total return would have been 64.92%. |
| | 6 | | Includes the Fund’s share of the Master LLC’s allocated net expenses and/or net investment income. |
| | 7 | | Includes the Fund’s share of the Master LLC’s allocated fees waived of less than 0.005%. |
See Notes to Financial Statements.
| | | | | | |
| | | BLACKROCK VALUE OPPORTUNITIES FUND, INC. | | SEPTEMBER 30, 2014 | | 13 |
| | | | |
| Financial Highlights (concluded) | | | BlackRock Value Opportunities Fund, Inc. | |
| | | | | | | | | | | | | | | | | | | | | | | | |
| | | Class R | |
| | | Six Months
Ended
September 30,
2014 (Unaudited) | | | Year Ended March 31, | |
| | | | 2014 | | | 2013 | | | 2012 | | | 2011 | | | 2010 | |
| Per Share Operating Performance | | | | | | | | | | | | | | | | | | | | | | | | |
Net asset value, beginning of period | | $ | 25.66 | | | $ | 20.02 | | | $ | 17.73 | | | $ | 17.72 | | | $ | 13.90 | | | $ | 8.36 | |
| | | | |
Net investment loss1 | | | (0.01 | ) | | | (0.06 | ) | | | (0.04 | ) | | | (0.08 | ) | | | (0.05 | ) | | | (0.01 | ) |
Net realized and unrealized gain (loss) | | | (1.23 | ) | | | 5.70 | | | | 2.33 | | | | 0.09 | | | | 3.87 | 2 | | | 5.55 | 2 |
| | | | |
Net increase (decrease) from investment operations | | | (1.24 | ) | | | 5.64 | | | | 2.29 | | | | 0.01 | | | | 3.82 | | | | 5.54 | |
| | | | |
Net asset value, end of period | | $ | 24.42 | | | $ | 25.66 | | | $ | 20.02 | | | $ | 17.73 | | | $ | 17.72 | | | $ | 13.90 | |
| | | | |
| | | | | | | | | | | | | | | | | | | | | | | | |
| Total Return3 | | | | | | | | | | | | | | | | | | | | | | | | |
Based on net asset value | | | (4.83 | )%4 | | | 28.17 | % | | | 12.92 | % | | | 0.06 | % | | | 27.48 | % | | | 66.27 | %5 |
| | | | |
| | | | | | | | | | | | | | | | | | | | | | | | |
| Ratios to Average Net Assets6 | | | | | | | | | | | | | | | | | | | | | | | | |
Total expenses | | | 1.55 | %7,8 | | | 1.54 | %7 | | | 1.59 | %7 | | | 1.65 | %7 | | | 1.65 | % | | | 1.75 | % |
| | | | |
Net investment loss | | | (0.07 | )%7,8 | | | (0.27 | )%7 | | | (0.23 | )%7 | | | (0.50 | )%7 | | | (0.33 | )% | | | (0.05 | )% |
| | | | |
| | | | | | | | | | | | | | | | | | | | | | | | |
| Supplemental Data | | | | | | | | | | | | | | | | | | | | | | | | |
Net assets, end of period (000) | | $ | 25,463 | | | $ | 28,444 | | | $ | 27,877 | | | $ | 30,620 | | | $ | 42,078 | | | $ | 39,126 | |
| | | | |
Portfolio turnover rate of the Master LLC | | | 23 | % | | | 61 | % | | | 51 | % | | | 45 | % | | | 52 | % | | | 79 | % |
| | | | |
| | 1 | | Based on average shares outstanding. |
| | 2 | | Includes redemption fees, which are less than $0.005 per share. |
| | 3 | | Where applicable, assumes the reinvestment of distributions. |
| | 4 | | Aggregate total return. |
| | 5 | | Includes proceeds received from a settlement of litigation, through its investment in the Master LLC, which impacted the Fund’s total return. Not including these proceeds, the Fund’s total return would have been 66.03%. |
| | 6 | | Includes the Fund’s share of the Master LLC’s allocated net expenses and/or net investment income. |
| | 7 | | Includes the Fund’s share of the Master LLC’s allocated fees waived of less than 0.005%. |
See Notes to Financial Statements.
| | | | | | |
| 14 | | BLACKROCK VALUE OPPORTUNITIES FUND, INC. | | SEPTEMBER 30, 2014 | | |
| | | | |
| Notes to Financial Statements (Unaudited) | | | BlackRock Value Opportunities Fund, Inc. | |
1. Organization:
BlackRock Value Opportunities Fund, Inc. (the “Fund”) is registered under the Investment Company Act of 1940, as amended (the “1940 Act”), as a diversified, open-end management investment company. The Fund is organized as a Maryland corporation. The Fund seeks to achieve its investment objective by investing all of its assets in Master Value Opportunities LLC (the “Master LLC”), an affiliate of the Fund, which has the same investment objective and strategies as the Fund. The value of the Fund’s investment in the Master LLC reflects the Fund’s proportionate interest in the net assets of the Master LLC. The performance of the Fund is directly affected by the performance of the Master LLC. The percentage of the Master LLC owned by the Fund at September 30, 2014 was 100.0%. As such, the financial statements of the Master LLC, including the Schedule of Investments, are included elsewhere in this report and should be read in conjunction with the Fund’s financial statements.
The Fund offers multiple classes of shares. Institutional Shares are sold without a sales charge and only to certain eligible investors. Investor A Shares are generally sold with an initial sales charge, but may be subject to a CDSC for certain redemptions where no initial sales charge was paid at the time of purchase. Investor B and Investor C Shares may be subject to a CDSC. Class R Shares are sold without a sales charge and only to certain employer-sponsored retirement plans. All classes of shares have identical voting, dividend, liquidation and other rights and are subject to the same terms and conditions, except that Investor A, Investor B, Investor C and Class R Shares bear certain expenses related to the shareholder servicing of such shares, and Investor B, Investor C and Class R Shares also bear certain expenses related to the distribution of such shares. Investor B Shares automatically convert to Investor A Shares after approximately eight years. Investor B Shares are only available through exchanges and dividend reinvestments by existing shareholders and for purchase by certain employer-sponsored retirement plans. Each class has exclusive voting rights with respect to matters relating to its shareholder servicing and distribution expenditures (except that Investor B shareholders may vote on material changes to the Investor A distribution and service plan).
2. Significant Accounting Policies:
The Fund’s financial statements are prepared in conformity with accounting principles generally accepted in the United States of America (“U.S. GAAP”), which may require management to make estimates and assumptions that affect the reported amounts of assets and liabilities in the financial statements and the reported amounts of increases and decreases in net assets from operations during the reporting period. Actual results could differ from those estimates. The Fund is considered an investment company under U.S. GAAP and follows the accounting and reporting guidance applicable to investment companies. The following is a summary of significant accounting policies followed by the Fund:
Valuation: The Fund’s investments are valued at fair value as of the close of trading on the New York Stock Exchange (“NYSE”) (generally 4:00 p.m., Eastern time). U.S. GAAP defines fair value as the price the Fund would receive to sell an asset or pay to transfer a liability in an orderly transaction between market participants at the measurement date. The Fund’s policy is to fair value its financial instruments at market value. The Fund records its investment in the Master LLC at fair value based on the Fund’s proportionate interest in the net assets of the Master LLC. Valuation of securities held by the Master LLC is discussed in Note 2 of the Master LLC’s Notes to Financial Statements, which are included elsewhere in this report.
Investment Transactions and Investment Income: For financial reporting purposes, contributions to and withdrawals from the Master LLC are accounted on a trade date basis. The Fund records daily its proportionate share of the Master LLC’s income, expenses and realized and unrealized gains and losses. Realized and unrealized gains and losses are adjusted utilizing partnership tax allocation rules. In addition, the Fund accrues its own expenses. Income, expenses and realized and unrealized gains and losses are allocated daily to each class based on its relative net assets.
Distributions: Distributions paid by the Fund are recorded on the ex-dividend date. The character and timing of distributions are determined in accordance with federal income tax regulations, which may differ from U.S. GAAP.
Other: Expenses directly related to the Fund or its classes are charged to the Fund or the applicable class. Other operating expenses shared by several funds are pro rated among those funds on the basis of relative net assets or other appropriate methods. Expenses directly related to the Fund and other shared expenses pro rated to the Fund are allocated daily to each class based on its relative net assets or other appropriate methods.
3. Administration Agreement and Other Transactions with Affiliates:
The PNC Financial Services Group, Inc. is the largest stockholder and an affiliate, for 1940 Act purposes, of BlackRock, Inc. (“BlackRock”).
The Fund entered into an Administration Agreement with BlackRock Advisors, LLC (the “Administrator”), an indirect, wholly owned subsidiary of BlackRock, to provide administrative services (other than investment advice and related portfolio activities). For such services, the Fund pays the Administrator a monthly fee at an annual rate of 0.25% of the average daily value of the Fund’s net assets. The Fund does not pay an investment advisory fee or investment management fee.
| | | | | | |
| | | BLACKROCK VALUE OPPORTUNITIES FUND, INC. | | SEPTEMBER 30, 2014 | | 15 |
| | | | |
| Notes to Financial Statements (continued) | | | BlackRock Value Opportunities Fund, Inc. | |
The Fund entered into a Distribution Agreement and a Distribution and Service Plan with BlackRock Investments, LLC (“BRIL”), an affiliate of the Administrator. Pursuant to the Distribution and Service Plan and in accordance with Rule 12b-1 under the 1940 Act, the Fund pays BRIL ongoing service and distribution fees. The fees are accrued daily and paid monthly at annual rates based upon the average daily net assets of the relevant share class of the Fund as follows:
| | | | | | | | | | | | | | | | |
| | | Investor A | | | Investor B | | | Investor C | | | Class R | |
Service Fee | | | 0.25 | % | | | 0.25 | % | | | 0.25 | % | | | 0.25 | % |
Distribution Fee | | | — | | | | 0.75 | % | | | 0.75 | % | | | 0.25 | % |
Pursuant to sub-agreements with BRIL, broker-dealers and BRIL provide shareholder servicing and distribution services to the Fund. The ongoing service and/or distribution fee compensates BRIL and each broker-dealer for providing shareholder servicing and/or distribution related services to Investor A, Investor B, Investor C and Class R shareholders.
Pursuant to written agreements, certain financial intermediaries, some of which may be affiliates, provide the Fund with sub-accounting, recordkeeping, sub-transfer agency and other administrative services with respect to sub-accounts they service. For these services, these entities receive an asset-based fee or an annual fee per shareholder account, which will vary depending on share class and/or net assets. For the six months ended September 30, 2014, the Fund paid the following amounts to affiliates of BlackRock in return for these services, which are included in transfer agent — class specific in the Statement of Operations:
| | | | |
Institutional | | $ | 26,585 | |
Investor A | | $ | 44 | |
The Administrator maintains a call center, which is responsible for providing certain shareholder services to the Fund, such as responding to shareholder inquiries and processing transactions based upon instructions from shareholders with respect to the subscription and redemption of Fund shares. For the six months ended September 30, 2014, the Fund reimbursed the Administrator the following amounts for costs incurred in running the call center, which are included in transfer agent — class specific in the Statement of Operations:
| | | | | | | | | | | | | | |
| Institutional | | | Investor A | | | Investor B | | | Investor C | |
| $ | 3,356 | | | $ | 2,483 | | | $ | 68 | | | $ | 378 | |
For the six months ended September 30, 2014, affiliates earned underwriting discounts, direct commissions and dealer concessions on sales of the Fund’s Investor A Shares, which totaled $6,064.
For the six months ended September 30, 2014, affiliates received CDSCs as follows:
| | | | | | | | | | |
| Investor A | | | Investor B | | | Investor C | |
| $ | 375 | | | $ | 126 | | | $ | 1,910 | |
Certain officers and/or directors of the Fund are officers and/or directors of BlackRock or its affiliates. The Fund reimburses the Administrator for a portion of the compensation paid to the Fund’s Chief Compliance Officer, which is included in officer in the Statement of Operations.
4. Income Tax Information:
It is the Fund’s policy to comply with the requirements of the Internal Revenue Code of 1986, as amended, applicable to regulated investment companies, and to distribute substantially all of its taxable income to its shareholders. Therefore, no federal income tax provision is required.
The Fund files U.S. federal and various state and local tax returns. No income tax returns are currently under examination. The statute of limitations on the Fund’s U.S. federal tax returns remains open for each of the four years ended March 31, 2014. The statutes of limitations on the Fund’s state and local tax returns may remain open for an additional year depending upon the jurisdiction.
Management has analyzed tax laws and regulations and their application to the Fund’s facts and circumstances and does not believe that there are any uncertain tax positions that require recognition of a tax liability.
As of March 31, 2014, the Fund had a capital loss carryforward of $175,284,568 available to offset future realized capital gains, all of which is due to expire March 31, 2018.
| | | | | | |
| 16 | | BLACKROCK VALUE OPPORTUNITIES FUND, INC. | | SEPTEMBER 30, 2014 | | |
| | | | |
| Notes to Financial Statements (concluded) | | | BlackRock Value Opportunities Fund, Inc. | |
5. Capital Share Transactions:
Transactions in capital shares for each class were as follows:
| | | | | | | | | | | | | | | | | | |
| | | Six Months Ended
September 30, 2014 | | | | | Year Ended
March 31, 2014 | |
| | | Shares | | | Amount | | | | | Shares | | | Amount | |
Institutional | | | | | | | | | | | | | | | | | | |
Shares sold | | | 472,072 | | | $ | 14,945,009 | | | | | | 1,248,461 | | | $ | 34,600,719 | |
Shares redeemed | | | (4,983,372 | ) | | | (162,267,576 | ) | | | | | (2,920,710 | ) | | | (83,354,922 | ) |
| | | | | | | | | | |
Net decrease | | | (4,511,300 | ) | | $ | (147,322,567 | ) | | | | | (1,672,249 | ) | | $ | (48,754,203 | ) |
| | | | | | | | | | |
| | | | | | | | | | | | | | | | | | |
Investor A | | | | | | | | | | | | | | | | | | |
Shares sold and automatic conversion of shares | | | 1,836,023 | | | $ | 57,058,007 | | | | | | 2,381,624 | | | $ | 63,831,957 | |
Shares redeemed | | | (2,318,216 | ) | | | (71,934,398 | ) | | | | | (4,217,952 | ) | | | (112,711,643 | ) |
| | | | | | | | | | |
Net decrease | | | (482,193 | ) | | $ | (14,876,391 | ) | | | | | (1,836,328 | ) | | $ | (48,879,686 | ) |
| | | | | | | | | | |
| | | | | | | | | | | | | | | | | | |
Investor B | | | | | | | | | | | | | | | | | | |
Shares sold | | | 16,332 | | | $ | 403,530 | | | | | | 60,773 | | | $ | 1,329,996 | |
Shares redeemed and automatic conversion of shares | | | (120,461 | ) | | | (2,965,255 | ) | | | | | (783,940 | ) | | | (16,710,199 | ) |
| | | | | | | | | | |
Net decrease | | | (104,129 | ) | | $ | (2,561,725 | ) | | | | | (723,167 | ) | | $ | (15,380,203 | ) |
| | | | | | | | | | |
| | | | | | | | | | | | | | | | | | |
Investor C | | | | | | | | | | | | | | | | | | |
Shares sold | | | 427,627 | | | $ | 10,157,675 | | | | | | 1,127,181 | | | $ | 23,795,616 | |
Shares redeemed | | | (938,925 | ) | | | (22,276,587 | ) | | | | | (2,170,789 | ) | | | (45,639,787 | ) |
| | | | | | | | | | |
Net decrease | | | (511,298 | ) | | $ | (12,118,912 | ) | | | | | (1,043,608 | ) | | $ | (21,844,171 | ) |
| | | | | | | | | | |
| | | | | | | | | | | | | | | | | | |
Class R | | | | | | | | | | | | | | | | | | |
Shares sold | | | 158,763 | | | $ | 4,062,352 | | | | | | 398,538 | | | $ | 8,990,342 | |
Shares redeemed | | | (224,443 | ) | | | (5,782,981 | ) | | | | | (682,233 | ) | | | (15,420,611 | ) |
| | | | | | | | | | |
Net decrease | | | (65,680 | ) | | $ | (1,720,629 | ) | | | | | (283,695 | ) | | $ | (6,430,269 | ) |
| | | | | | | | | | |
Total Net Decrease | | | (5,674,600 | ) | | $ | (178,600,224 | ) | | | | | (5,559,047 | ) | | $ | (141,288,532 | ) |
| | | | | | | | | | |
6. Subsequent Events:
Management has evaluated the impact of all subsequent events on the Fund through the date the financial statements were issued and has determined that there were no subsequent events requiring adjustment or additional disclosure in the financial statements.
| | | | | | |
| | | BLACKROCK VALUE OPPORTUNITIES FUND, INC. | | SEPTEMBER 30, 2014 | | 17 |
| | | | |
| Master LLC Portfolio Information | | | Master Value Opportunities LLC | |
| | |
| Ten Largest Holdings | | Percent of
Long-Term Investments |
| | | | |
NorthWestern Corp | | | 2 | % |
Marcus & Millichap, Inc. | | | 2 | |
Pennsylvania Real Estate Investment Trust | | | 2 | |
CyrusOne, Inc. | | | 2 | |
SYNNEX Corp | | | 2 | |
SUPERVALU, Inc. | | | 1 | |
Rouse Properties, Inc. | | | 1 | |
NuVasive, Inc. | | | 1 | |
Owens & Minor, Inc. | | | 1 | |
Pacific Biosciences of California, Inc. | | | 1 | |
| | |
| Sector Allocation | | Percent of
Long-Term Investments |
| | | | |
Financials | | | 21 | % |
Information Technology | | | 16 | |
Industrials | | | 15 | |
Consumer Discretionary | | | 15 | |
Health Care | | | 9 | |
Utilities | | | 7 | |
Energy | | | 7 | |
Materials | | | 7 | |
Consumer Staples | | | 3 | |
For Master LLC compliance purposes, the Master LLC’s sector classifications refer to any one or more of the sector sub-classifications used by one or more widely recognized market indexes or ratings group indexes, and/or as defined by the investment advisor. These definitions may not apply for purposes of this report, which may combine sector sub-classifications for reporting ease.
| | | | | | |
| 18 | | BLACKROCK VALUE OPPORTUNITIES FUND, INC. | | SEPTEMBER 30, 2014 | | |
| | | | |
| Schedule of Investments September 30, 2014 (Unaudited) | | | Master Value Opportunities LLC | |
| | | (Percentages shown are based on Net Assets) | |
| | | | | | | | |
| Common Stocks | | Shares | | | Value | |
Aerospace & Defense — 3.5% | | | | | | | | |
Esterline Technologies Corp. (a)(b) | | | 63,300 | | | $ | 7,043,391 | |
GenCorp, Inc. (a) | | | 389,500 | | | | 6,220,315 | |
The KEYW Holding Corp. (a)(b) | | | 385,800 | | | | 4,270,806 | |
Moog, Inc., Class A (a) | | | 83,450 | | | | 5,707,980 | |
Triumph Group, Inc. | | | 75,600 | | | | 4,917,780 | |
| | | | | | | | |
| | | | | | | | 28,160,272 | |
Air Freight & Logistics — 0.9% | | | | | | | | |
UTi Worldwide, Inc. (a) | | | 693,543 | | | | 7,372,362 | |
Auto Components — 0.9% | | | | | | | | |
Tenneco, Inc. (a) | | | 145,053 | | | | 7,587,722 | |
Automobiles — 0.7% | | | | | | | | |
Thor Industries, Inc. | | | 116,298 | | | | 5,989,347 | |
Banks — 5.4% | | | | | | | | |
Banner Corp. | | | 106,299 | | | | 4,089,323 | |
Cathay General Bancorp | | | 96,496 | | | | 2,395,996 | |
Centerstate Banks, Inc. | | | 402,100 | | | | 4,161,735 | |
FCB Financial Holdings, Inc., Class A (a) | | | 201,200 | | | | 4,569,252 | |
First BanCorp Puerto Rico (a) | | | 437,400 | | | | 2,077,650 | |
Hanmi Financial Corp. | | | 98,000 | | | | 1,975,680 | |
Opus Bank (a) | | | 112,100 | | | | 3,433,623 | |
PrivateBancorp, Inc. | | | 104,900 | | | | 3,137,559 | |
TriState Capital Holdings, Inc. (a) | | | 433,600 | | | | 3,932,752 | |
Umpqua Holdings Corp. | | | 179,400 | | | | 2,954,718 | |
Wintrust Financial Corp. | | | 249,400 | | | | 11,140,698 | |
| | | | | | | | |
| | | | | | | | 43,868,986 | |
Beverages — 0.5% | | | | | | | | |
Cott Corp. | | | 620,708 | | | | 4,264,264 | |
Biotechnology — 0.9% | | | | | | | | |
ArQule, Inc. (a) | | | 607,044 | | | | 679,889 | |
MannKind Corp. (a)(b) | | | 863,511 | | | | 5,103,350 | |
XOMA Corp. (a)(b) | | | 378,620 | | | | 1,593,990 | |
| | | | | | | | |
| | | | | | | | 7,377,229 | |
Building Products — 1.4% | | | | | | | | |
Continental Building Products, Inc. (a)(b) | | | 334,900 | | | | 4,889,540 | |
Norcraft Cos., Inc. (a) | | | 409,100 | | | | 6,525,145 | |
| | | | | | | | |
| | | | | | | | 11,414,685 | |
Capital Markets — 2.2% | | | | | | | | |
FXCM, Inc., Class A (b) | | | 250,100 | | | | 3,964,085 | |
Marcus & Millichap, Inc. (a) | | | 458,993 | | | | 13,889,128 | |
| | | | | | | | |
| | | | | | | | 17,853,213 | |
Chemicals — 3.1% | | | | | | | | |
Axiall Corp. | | | 133,278 | | | | 4,772,685 | |
Huntsman Corp. | | | 202,000 | | | | 5,249,980 | |
Kraton Performance Polymers, Inc. (a)(b) | | | 332,695 | | | | 5,925,298 | |
OM Group, Inc. | | | 158,400 | | | | 4,110,480 | |
Rockwood Holdings, Inc. | | | 62,755 | | | | 4,797,620 | |
| | | | | | | | |
| | | | | | | | 24,856,063 | |
Communications Equipment — 2.6% | | | | | | | | |
ARRIS Group, Inc. (a) | | | 167,500 | | | | 4,749,463 | |
Digi International, Inc. (a) | | | 497,200 | | | | 3,729,000 | |
Harmonic, Inc. (a) | | | 673,600 | | | | 4,270,624 | |
Ixia (a)(b) | | | 479,400 | | | | 4,381,716 | |
Procera Networks, Inc. (a) | | | 386,500 | | | | 3,702,670 | |
| | | | | | | | |
| | | | | | | | 20,833,473 | |
| | | | | | | | |
| Common Stocks | | Shares | | | Value | |
Construction & Engineering — 3.1% | | | | | | | | |
EMCOR Group, Inc. | | | 258,000 | | | $ | 10,309,680 | |
MYR Group, Inc. (a) | | | 365,800 | | | | 8,808,464 | |
Orion Marine Group, Inc. (a) | | | 603,941 | | | | 6,027,331 | |
| | | | | | | | |
| | | | | | | | 25,145,475 | |
Consumer Finance — 1.6% | | | | | | | | |
Cash America International, Inc. | | | 170,100 | | | | 7,450,380 | |
Springleaf Holdings, Inc. (a) | | | 167,100 | | | | 5,335,503 | |
| | | | | | | | |
| | | | | | | | 12,785,883 | |
Containers & Packaging — 0.5% | | | | | | | | |
Rock-Tenn Co., Class A | | | 85,160 | | | | 4,051,913 | |
Diversified Consumer Services — 1.5% | | | | | | | | |
Apollo Education Group, Inc. (a) | | | 146,856 | | | | 3,693,428 | |
Lincoln Educational Services Corp. (c) | | | 768,834 | | | | 2,160,424 | |
Regis Corp. | | | 59,860 | | | | 955,366 | |
ServiceMaster Global Holdings, Inc. (a) | | | 234,101 | | | | 5,665,244 | |
| | | | | | | | |
| | | | | | | | 12,474,462 | |
Electric Utilities — 3.2% | | | | | | | | |
ALLETE, Inc. | | | 235,200 | | | | 10,440,528 | |
El Paso Electric Co. | | | 255,600 | | | | 9,342,180 | |
PNM Resources, Inc. | | | 259,300 | | | | 6,459,163 | |
| | | | | | | | |
| | | | | | | | 26,241,871 | |
Electronic Equipment, Instruments & Components — 4.8% | |
Anixter International, Inc. | | | 109,700 | | | | 9,306,948 | |
Ingram Micro, Inc., Class A (a) | | | 261,800 | | | | 6,757,058 | |
OSI Systems, Inc. (a) | | | 122,500 | | | | 7,776,300 | |
Plexus Corp. (a) | | | 81,600 | | | | 3,013,488 | |
SYNNEX Corp. (b) | | | 189,000 | | | | 12,215,070 | |
| | | | | | | | |
| | | | | | | | 39,068,864 | |
Energy Equipment & Services — 2.3% | | | | | | | | |
McDermott International, Inc. (a)(b) | | | 777,300 | | | | 4,446,156 | |
Pioneer Energy Services Corp. (a) | | | 195,896 | | | | 2,746,462 | |
Superior Energy Services, Inc. | | | 213,000 | | | | 7,001,310 | |
TETRA Technologies, Inc. (a) | | | 388,700 | | | | 4,205,734 | |
| | | | | | | | |
| | | | | | | | 18,399,662 | |
Food & Staples Retailing — 1.8% | | | | | | | | |
Smart & Final Stores, Inc. (a) | | | 192,700 | | | | 2,780,661 | |
SUPERVALU, Inc. (a) | | | 1,307,000 | | | | 11,684,580 | |
| | | | | | | | |
| | | | | | | | 14,465,241 | |
Food Products — 0.4% | | | | | | | | |
Pinnacle Foods, Inc. | | | 86,702 | | | | 2,830,820 | |
Gas Utilities — 2.3% | | | | | | | | |
Northwest Natural Gas Co. | | | 70,300 | | | | 2,970,175 | |
South Jersey Industries, Inc. | | | 169,400 | | | | 9,039,184 | |
Southwest Gas Corp. | | | 135,500 | | | | 6,582,590 | |
| | | | | | | | |
| | | | | | | | 18,591,949 | |
Health Care Equipment & Supplies — 5.4% | | | | | | | | |
Hansen Medical, Inc. (a)(b)(c) | | | 3,822,529 | | | | 4,510,584 | |
Invacare Corp. | | | 611,970 | | | | 7,227,366 | |
Lumenis Ltd., Class B (a) | | | 503,946 | | | | 4,490,159 | |
NuVasive, Inc. (a) | | | 331,696 | | | | 11,566,239 | |
OraSure Technologies, Inc. (a)(c) | | | 1,529,352 | | | | 11,041,921 | |
Thoratec Corp. (a) | | | 196,054 | | | | 5,240,523 | |
| | | | | | | | |
| | | | | | | | 44,076,792 | |
See Notes to Financial Statements.
| | | | | | |
| | | BLACKROCK VALUE OPPORTUNITIES FUND, INC. | | SEPTEMBER 30, 2014 | | 19 |
| | | | |
| Schedule of Investments (continued) | | | Master Value Opportunities LLC | |
| | | (Percentages shown are based on Net Assets) | |
| | | | | | | | |
| Common Stocks | | Shares | | | Value | |
Health Care Providers & Services — 1.4% | | | | | | | | |
Owens & Minor, Inc. | | | 352,243 | | | $ | 11,532,436 | |
Hotels, Restaurants & Leisure — 0.6% | | | | | | | | |
Papa John’s International, Inc. | | | 123,344 | | | | 4,932,527 | |
Household Durables — 0.7% | | | | | | | | |
The New Home Co., Inc. (a)(b) | | | 164,904 | | | | 2,226,204 | |
Taylor Morrison Home Corp., Class A (a) | | | 215,929 | | | | 3,502,368 | |
| | | | | | | | |
| | | | | | | | 5,728,572 | |
Insurance — 2.2% | | | | | | | | |
Argo Group International Holdings Ltd. | | | 90,500 | | | | 4,553,055 | |
Fidelity & Guaranty Life | | | 262,600 | | | | 5,606,510 | |
Heritage Insurance Holdings, Inc. (a) | | | 336,600 | | | | 5,069,196 | |
Maiden Holdings Ltd. | | | 251,200 | | | | 2,783,296 | |
| | | | | | | | |
| | | | | | | | 18,012,057 | |
Internet & Catalog Retail — 0.1% | | | | | | | | |
dELiA*s, Inc. (a)(b)(c) | | | 3,297,285 | | | | 910,051 | |
IT Services — 0.7% | | | | | | | | |
Euronet Worldwide, Inc. (a) | | | 118,944 | | | | 5,684,334 | |
Life Sciences Tools & Services — 1.4% | | | | | | | | |
Pacific Biosciences of California, Inc. (a)(c) | | | 2,291,956 | | | | 11,253,504 | |
Machinery — 5.2% | | | | | | | | |
Actuant Corp., Class A | | | 290,500 | | | | 8,866,060 | |
Albany International Corp., Class A | | | 141,100 | | | | 4,803,044 | |
Barnes Group, Inc. | | | 261,400 | | | | 7,933,490 | |
CIRCOR International, Inc. | | | 58,829 | | | | 3,960,957 | |
Crane Co. | | | 127,200 | | | | 8,040,312 | |
EnPro Industries, Inc. (a) | | | 25,288 | | | | 1,530,683 | |
RBC Bearings, Inc. | | | 127,500 | | | | 7,229,250 | |
| | | | | | | | |
| | | | | | | | 42,363,796 | |
Media — 2.0% | | | | | | | | |
AMC Entertainment Holdings, Inc., Class A | | | 185,888 | | | | 4,273,565 | |
Carmike Cinemas, Inc. (a) | | | 151,986 | | | | 4,708,526 | |
Cumulus Media, Inc., Class A (a) | | | 798,211 | | | | 3,216,790 | |
Live Nation Entertainment, Inc. (a) | | | 176,549 | | | | 4,240,707 | |
| | | | | | | | |
| | | | | | | | 16,439,588 | |
Metals & Mining — 2.1% | | | | | | | | |
Haynes International, Inc. | | | 176,495 | | | | 8,117,005 | |
Materion Corp. | | | 69,186 | | | | 2,121,935 | |
Rubicon Minerals Corp. (a) | | | 1,532,956 | | | | 2,100,150 | |
Stillwater Mining Co. (a)(b) | | | 311,100 | | | | 4,675,833 | |
| | | | | | | | |
| | | | | | | | 17,014,923 | |
Multiline Retail — 0.7% | | | | | | | | |
Fred’s, Inc., Class A | | | 409,034 | | | | 5,726,476 | |
Multi-Utilities — 1.7% | | | | | | | | |
NorthWestern Corp. | | | 312,900 | | | | 14,193,144 | |
Oil, Gas & Consumable Fuels — 4.7% | | | | | | | | |
Africa Oil Corp. (a)(b) | | | 914,900 | | | | 4,019,204 | |
Bill Barrett Corp. (a)(b) | | | 255,082 | | | | 5,622,007 | |
Emerald Oil, Inc. (a)(b) | | | 856,217 | | | | 5,265,735 | |
Navigator Holdings Ltd. (a) | | | 81,700 | | | | 2,273,711 | |
Oasis Petroleum, Inc. (a)(b) | | | 211,024 | | | | 8,822,913 | |
| | | | | | | | |
| Common Stocks | | Shares | | | Value | |
Oil, Gas & Consumable Fuels (concluded) | | | | | | | | |
Parsley Energy, Inc., Class A (a)(b) | | | 68,400 | | | $ | 1,458,972 | |
Ship Finance International Ltd. (b) | | | 182,800 | | | | 3,092,976 | |
SM Energy Co. | | | 48,600 | | | | 3,790,800 | |
StealthGas, Inc. (a) | | | 433,700 | | | | 3,951,007 | |
| | | | | | | | |
| | | | | | | | 38,297,325 | |
Paper & Forest Products — 0.9% | | | | | | | | |
PH Glatfelter Co. | | | 231,600 | | | | 5,083,620 | |
Schweitzer-Mauduit International, Inc. | | | 51,340 | | | | 2,120,855 | |
| | | | | | | | |
| | | | | | | | 7,204,475 | |
Professional Services — 1.1% | | | | | | | | |
Kforce, Inc. | | | 436,800 | | | | 8,548,176 | |
Real Estate Investment Trusts (REITs) — 9.4% | | | | | | | | |
Ashford Hospitality Prime, Inc. | | | 400,553 | | | | 6,100,422 | |
Corporate Office Properties Trust | | | 102,887 | | | | 2,646,254 | |
CyrusOne, Inc. | | | 525,651 | | | | 12,636,650 | |
Education Realty Trust, Inc. (b) | | | 1,038,217 | | | | 10,672,871 | |
LTC Properties, Inc. | | | 297,877 | | | | 10,988,683 | |
Monmouth Real Estate Investment Corp. (b) | | | 588,377 | | | | 5,954,375 | |
Pennsylvania Real Estate Investment Trust | | | 694,986 | | | | 13,858,021 | |
Rouse Properties, Inc. (b) | | | 715,403 | | | | 11,568,066 | |
Washington Prime Group, Inc. | | | 127,369 | | | | 2,226,410 | |
| | | | | | | | |
| | | | | | | | 76,651,752 | |
Semiconductors & Semiconductor Equipment — 3.5% | |
DSP Group, Inc. (a)(c) | | | 634,437 | | | | 5,627,456 | |
Exar Corp. (a)(b) | | | 293,100 | | | | 2,623,245 | |
RF Micro Devices, Inc. (a)(b) | | | 847,017 | | | | 9,774,576 | |
Teradyne, Inc. | | | 207,500 | | | | 4,023,425 | |
Veeco Instruments, Inc. (a) | | | 188,800 | | | | 6,598,560 | |
| | | | | | | | |
| | | | | | | | 28,647,262 | |
Software — 3.4% | | | | | | | | |
Bottomline Technologies, Inc. (a)(b) | | | 276,897 | | | | 7,639,588 | |
Mentor Graphics Corp. | | | 173,000 | | | | 3,545,635 | |
PTC, Inc. (a) | | | 192,200 | | | | 7,092,180 | |
Take-Two Interactive Software, Inc. (a) | | | 67,100 | | | | 1,547,997 | |
TIBCO Software, Inc. (a) | | | 338,600 | | | | 8,001,118 | |
| | | | | | | | |
| | | | | | | | 27,826,518 | |
Specialty Retail — 5.5% | | | | | | | | |
Abercrombie & Fitch Co., Class A | | | 207,383 | | | | 7,536,298 | |
The Children’s Place Retail Stores, Inc. | | | 126,248 | | | | 6,016,980 | |
Genesco, Inc. (a)(b) | | | 129,319 | | | | 9,666,595 | |
The Men’s Wearhouse, Inc. | | | 125,830 | | | | 5,941,693 | |
Murphy USA, Inc. (a) | | | 125,765 | | | | 6,673,091 | |
Office Depot, Inc. (a) | | | 827,395 | | | | 4,252,810 | |
Penske Automotive Group, Inc. | | | 119,943 | | | | 4,868,486 | |
| | | | | | | | |
| | | | | | | | 44,955,953 | |
Technology Hardware, Storage & Peripherals — 0.5% | | | | | | | | |
Silicon Graphics International Corp. (a) | | | 432,107 | | | | 3,988,348 | |
Textiles, Apparel & Luxury Goods — 1.5% | | | | | | | | |
G-III Apparel Group Ltd. (a)(b) | | | 74,637 | | | | 6,184,422 | |
See Notes to Financial Statements.
| | | | | | |
| 20 | | BLACKROCK VALUE OPPORTUNITIES FUND, INC. | | SEPTEMBER 30, 2014 | | |
| | | | |
| Schedule of Investments (continued) | | | Master Value Opportunities LLC | |
| | | (Percentages shown are based on Net Assets) | |
| | | | | | | | |
| Common Stocks | | Shares | | | Value | |
Textiles, Apparel & Luxury Goods (concluded) | | | | | | | | |
Vera Bradley, Inc. (a)(b) | | | 301,546 | | | $ | 6,235,971 | |
| | | | | | | | |
| | | | | | | | 12,420,393 | |
Total Common Stocks — 98.3% | | | | | | | 800,042,158 | |
| | | | | | | | |
| Warrants (d) | | | | | | |
Biotechnology — 0.1% | | | | | | | | |
MannKind Corp. (Issued/exercisable 2/06/12, 0.6 Share for 1 Warrant, Expires 2/08/16, Strike Price $2.40) (a) | | | 220,500 | | | | 522,585 | |
XOMA Corp. (Issued/exercisable 3/09/12, 0.50 Share for 1 Warrant, Expires 3/09/17, Strike Price $1.76) | | | 202,350 | | | | 248,891 | |
Total Warrants — 0.1% | | | | | | | 771,476 | |
Total Long-Term Investments (Cost — $679,973,852) — 98.4% | | | | 800,813,634 | |
| | | | | | | | |
| Short-Term Securities | | Shares | | | Value | |
BlackRock Liquidity Funds, TempFund, Institutional Class, 0.03% (e)(f) | | | 14,800,022 | | | $ | 14,800,022 | |
| | | Beneficial
Interest
(000) | | | | |
BlackRock Liquidity Series, LLC, Money Market Series, 0.19% (e)(f)(g) | | $ | 80,487 | | | | 80,486,552 | |
Total Short-Term Securities (Cost — $95,286,574) — 11.7% | | | | 95,286,574 | |
Total Investments (Cost — $775,260,426) — 110.1% | | | | 896,100,208 | |
Liabilities in Excess of Other Assets — (10.1)% | | | | (81,937,346 | ) |
| | | | | | | | |
Net Assets — 100.0% | | | | | | $ | 814,162,862 | |
| | | | | | | | |
|
| Notes to Schedule of Investments |
| (a) | Non-income producing security. |
| (b) | Security, or a portion of security, is on loan. |
| (c) | Investments in issuers (whereby the Master LLC held 5% or more of the companies’ outstanding securities) that were considered to be an affiliate during the six months ended September 30, 2014, for purposes of Section 2(a)(3) of the Investment Company Act of 1940, as amended, were as follows: |
| | | | | | | | | | | | | | | | | | | | | | | | | | | | |
| Affiliate | | Shares Held at
March 31, 2014 | | | Shares
Purchased | | | Shares
Sold | | | Shares Held at
September 30, 2014 | | | Value Held at
September 30, 2014 | | | Income | | | Realized
Gain
(Loss) | |
dELiA*s, Inc. | | | 3,738,985 | | | | — | | | | (441,700 | ) | | | 3,297,285 | | | $ | 910,051 | | | | — | | | $ | (301,240 | ) |
DSP Group, Inc. | | | 719,437 | | | | — | | | | (85,000 | ) | | | 634,437 | | | $ | 5,627,456 | | | | — | | | $ | (679,613 | ) |
Hansen Medical, Inc. | | | 3,304,601 | | | | 987,328 | | | | (469,400 | ) | | | 3,822,529 | | | $ | 4,510,584 | | | | — | | | $ | (954,044 | ) |
LCA-Vision, Inc. | | | 1,955,583 | | | | — | | | | (1,955,583 | ) | | | — | | | | — | | | | — | | | $ | 3,174,844 | |
Lincoln Educational Services Corp. | | | 719,420 | | | | 117,214 | | | | (67,800 | ) | | | 768,834 | | | $ | 2,160,424 | | | $ | 73,941 | | | $ | (172,945 | ) |
OraSure Technologies, Inc. | | | 1,951,720 | | | | 196,280 | | | | (618,648 | ) | | | 1,529,352 | | | $ | 11,041,921 | | | | — | | | $ | 1,047,475 | |
Pacific Biosciences of California, Inc. | | | 2,047,233 | | | | 603,529 | | | | (358,806 | ) | | | 2,291,956 | | | $ | 11,253,504 | | | | — | | | $ | (413,875 | ) |
| (d) | Warrants entitle the Master LLC to purchase a predetermined number of shares of common stock and are non-income producing. The purchase price and number of shares are subject to adjustment under certain conditions until the expiration date of the warrants, if any. |
| (e) | Represents the current yield as of report date. |
| (f) | Investments in issuers considered to be an affiliate of the Master LLC during the six months ended September 30, 2014, for purposes of Section 2(a)(3) of the Investment Company Act of 1940, as amended, were as follows: |
| | | | | | | | | | | | | | | | |
| Affiliate | | Shares/Beneficial
Interest Held at
March 31, 2014 | | | Net Activity | | | Shares/Beneficial
Interest Held at
September 30, 2014 | | | Income | |
BlackRock Liquidity Funds, TempFund, Institutional Class | | | 6,684,642 | | | | 8,115,380 | | | | 14,800,022 | | | $ | 3,312 | |
BlackRock Liquidity Series, LLC, Money Market Series | | $ | 114,194,743 | | | $ | (33,708,191 | ) | | $ | 80,486,552 | | | $ | 877,836 | |
| (g) | Security was purchased with the cash collateral from loaned securities. The Master LLC may withdraw up to 25% of its investment daily, although the manager of the BlackRock Liquidity Series, LLC, Money Market Series, in its sole discretion, may permit an investor to withdraw more than 25% on any one day. |
| Ÿ | | For Master LLC compliance purposes, the Master LLC’s industry classifications refer to any one or more of the industry sub-classifications used by one or more widely recognized market indexes or ratings group indexes, and/or as defined by the investment advisor. These definitions may not apply for purposes of this report, which may combine such industry sub-classifications for reporting ease. |
See Notes to Financial Statements.
| | | | | | |
| | | BLACKROCK VALUE OPPORTUNITIES FUND, INC. | | SEPTEMBER 30, 2014 | | 21 |
| | | | |
| Schedule of Investments (concluded) | | | Master Value Opportunities LLC | |
| Ÿ | | Fair Value Measurements — Various inputs are used in determining the fair value of investments. These inputs to valuation techniques are categorized into a disclosure hierarchy consisting of three broad levels for financial statement purposes. The hierarchy gives the highest priority to unadjusted quoted prices in active markets for identical assets or liabilities (Level 1 measurements) and the lowest priority to unobservable inputs (Level 3 measurements). Accordingly, the degree of judgment exercised in determining fair value is greatest for instruments categorized in Level 3. The inputs used to measure fair value may fall into different levels of the fair value hierarchy. In such cases, for disclosure purposes, the fair value hierarchy classification is determined based on the lowest level input that is significant to the fair value measurement in its entirety. The categorization of a value determined for investments is based on the pricing transparency of the investment and is not necessarily an indication of the risks associated with investing in those securities. The three levels of the fair value hierarchy are as follows: |
| | Ÿ | | Level 1 — unadjusted quoted prices in active markets/exchanges for identical assets or liabilities that the Master LLC has the ability to access |
| | Ÿ | | Level 2 — other observable inputs (including, but not limited to, quoted prices for similar assets or liabilities in markets that are active, quoted prices for identical or similar assets or liabilities in markets that are not active, inputs other than quoted prices that are observable for the assets or liabilities (such as interest rates, yield curves, volatilities, prepayment speeds, loss severities, credit risks and default rates) or other market–corroborated inputs) |
| | Ÿ | | Level 3 — unobservable inputs based on the best information available in the circumstances, to the extent observable inputs are not available (including the Master LLC’s own assumptions used in determining the fair value of investments) |
Changes in valuation techniques may result in transfers into or out of an assigned level within the disclosure hierarchy. In accordance with the Master LLC’s policy, transfers between different levels of the fair value disclosure hierarchy are deemed to have occurred as of the beginning of the reporting period. For information about the Master LLC’s policy regarding valuation of investments, please refer to Note 2 of the Notes to Financial Statements.
The following table summarizes the Master LLC’s investments categorized in the disclosure hierarchy as of September 30, 2014:
| | | | | | | | | | | | | | |
| | | Level 1 | | | Level 2 | | | Level 3 | | Total | |
Assets: | | | | | | | | | | | | | | |
Investments: | | | | | | | | | | | | | | |
Long-Term Investments: | | | | | | | | | | | | | | |
Common Stocks1 | | $ | 800,042,158 | | | | — | | | — | | $ | 800,042,158 | |
Warrants | | | 522,585 | | | $ | 248,891 | | | — | | | 771,476 | |
Short-Term Securities | | | 14,800,022 | | | | 80,486,552 | | | — | | | 95,286,574 | |
Total | | $ | 815,364,765 | | | $ | 80,735,443 | | | — | | $ | 896,100,208 | |
| | | | |
| | 1 | | See above Schedule of Investments for values in each industry. |
The Master LLC may hold assets and/or liabilities in which the fair value approximates the carrying amount for financial statement purposes. As of September 30, 2014, collateral on securities loaned at value of $80,486,552 is categorized as Level 2 within the disclosure hierarchy.
There were no transfers between levels during the six months ended September 30, 2014.
See Notes to Financial Statements.
| | | | | | |
| 22 | | BLACKROCK VALUE OPPORTUNITIES FUND, INC. | | SEPTEMBER 30, 2014 | | |
| | | | |
| Statement of Assets and Liabilities | | | Master Value Opportunities LLC | |
| | | | |
| September 30, 2014 (Unaudited) | | | |
| | | | |
| Assets | |
Investments at value — unaffiliated (including securities loaned at value of $75,998,923) (cost — $639,654,853) | | $ | 765,309,694 | |
Investments at value — affiliated (cost — $135,605,573) | | | 130,790,514 | |
Investments sold receivable | | | 4,262,219 | |
Dividends receivable — unaffiliated | | | 420,378 | |
Securities lending income receivable — affiliated | | | 121,002 | |
Dividends receivable — affiliated | | | 573 | |
Prepaid expenses | | | 1,156 | |
| | | | |
Total assets | | | 900,905,536 | |
| | | | |
| | | | |
| Liabilities | | | | |
Collateral on securities loaned at value | | | 80,486,552 | |
Investments purchased payable | | | 4,396,603 | |
Withdrawals payable to investors | | | 1,395,375 | |
Investment advisory fees payable | | | 349,816 | |
Directors’ fees payable | | | 8,826 | |
Other affiliates payable | | | 5,158 | |
Other accrued expenses payable | | | 100,344 | |
| | | | |
Total liabilities | | | 86,742,674 | |
| | | | |
Net Assets | | $ | 814,162,862 | |
| | | | |
| | | | |
| Net Assets Consist of | | | | |
Investors’ capital | | $ | 693,323,116 | |
Net unrealized appreciation/depreciation | | | 120,839,746 | |
| | | | |
Net Assets | | $ | 814,162,862 | |
| | | | |
See Notes to Financial Statements.
| | | | | | |
| | | BLACKROCK VALUE OPPORTUNITIES FUND, INC. | | SEPTEMBER 30, 2014 | | 23 |
| | | | |
| Statement of Operations | | | Master Value Opportunities LLC | |
| | | | |
| Six Months Ended September 30, 2014 (Unaudited) | | | |
| | | | |
| Investment Income | |
Dividends — unaffiliated | | $ | 6,033,371 | |
Foreign taxes withheld | | | (11,920 | ) |
Securities lending — affiliated — net | | | 877,836 | |
Dividends — affiliated | | | 77,253 | |
| | | | |
Total income | | | 6,976,540 | |
| | | | |
| | | | |
| Expenses | | | | |
Investment advisory | | | 2,341,438 | |
Accounting services | | | 110,977 | |
Custodian | | | 39,725 | |
Professional | | | 29,628 | |
Directors | | | 14,615 | |
Printing | | | 1,181 | |
Miscellaneous | | | 14,998 | |
| | | | |
Total expenses | | | 2,552,562 | |
Less fees waived by Manager | | | (7,303 | ) |
| | | | |
Total expenses after fees waived | | | 2,545,259 | |
| | | | |
Net investment income | | | 4,431,281 | |
| | | | |
| | | | |
| Realized and Unrealized Gain (Loss) | | | | |
Net realized gain from: | | | | |
Investments — unaffiliated | | | 90,944,429 | |
Investments — affiliated | | | 1,700,602 | |
Foreign currency transactions | | | 163 | |
| | | | |
| | | 92,645,194 | |
| | | | |
Net change in unrealized appreciation/depreciation on: | | | | |
Investments — unaffiliated | | | (122,012,874 | ) |
Investments — affiliated | | | (6,708,427 | ) |
Foreign currency translations | | | (15 | ) |
| | | | |
| | | (128,721,316 | ) |
| | | | |
Total realized and unrealized loss | | | (36,076,122 | ) |
| | | | |
Net Decrease in Net Assets Resulting from Operations | | $ | (31,644,841 | ) |
| | | | |
See Notes to Financial Statements.
| | | | | | |
| 24 | | BLACKROCK VALUE OPPORTUNITIES FUND, INC. | | SEPTEMBER 30, 2014 | | |
| | | | |
| Statements of Changes in Net Assets | | | Master Value Opportunities LLC | |
| | | | | | | | |
| Increase (Decrease) in Net Assets: | | Six Months
Ended
September 30,
2014 (Unaudited) | | | Year Ended
March 31, 2014 | |
| | | | | | | | |
| Operations | | | | | | | | |
Net investment income | | $ | 4,431,281 | | | $ | 7,077,972 | |
Net realized gain | | | 92,645,194 | | | | 188,834,993 | |
Net change in unrealized appreciation/depreciation | | | (128,721,316 | ) | | | 58,068,506 | |
| | | | |
Net increase (decrease) in net assets resulting from operations | | | (31,644,841 | ) | | | 253,981,471 | |
| | | | |
| | | | | | | | |
| Capital Transactions | | | | | | | | |
Proceeds from contributions | | | 86,626,921 | | | | 132,740,767 | |
Value of withdrawals | | | (275,885,516 | ) | | | (281,778,459 | ) |
| | | | |
Net decrease in net assets derived from capital transactions | | | (189,258,595 | ) | | | (149,037,692 | ) |
| | | | |
| | | | | | | | |
| Net Assets | | | | | | | | |
Total increase (decrease) in net assets | | | (220,903,436 | ) | | | 104,943,779 | |
Beginning of period | | | 1,035,066,298 | | | | 930,122,519 | |
| | | | |
End of period | | $ | 814,162,862 | | | $ | 1,035,066,298 | |
| | | | |
| | | | |
| Financial Highlights | | | Master Value Opportunities LLC | |
| | | | | | | | | | | | | | | | | | | | | | | | |
| | | Six Months
Ended
September 30,
2014 (Unaudited) | | | Year Ended March 31, | |
| | | | 2014 | | | 2013 | | | 2012 | | | 2011 | | | 2010 | |
| Total Return | | | | | | | | | | | | | | | | | | | | | | | | |
Total return | | | (4.40 | )%1 | | | 29.39 | % | | | 14.01 | % | | | 1.17 | % | | | 28.70 | % | | | 68.13 | %2 |
| | | | |
| | | | | | | | | | | | | | | | | | | | | | | | |
| Ratios to Average Net Assets | | | | | | | | | | | | | | | | | | | | | | | | |
Total expenses | | | 0.54 | %3 | | | 0.54 | % | | | 0.55 | % | | | 0.54 | % | | | 0.54 | % | | | 0.55 | % |
| | | | |
Total expenses after fees waived4 | | | 0.54 | %3 | | | 0.54 | % | | | 0.55 | % | | | 0.54 | % | | | 0.54 | % | | | 0.55 | % |
| | | | |
Net investment income | | | 0.95 | %3 | | | 0.72 | % | | | 0.81 | % | | | 0.62 | % | | | 0.78 | % | | | 1.14 | % |
| | | | |
| | | | | | | | | | | | | | | | | | | | | | | | |
| Supplemental Data | | | | | | | | | | | | | | | | | | | | | | | | |
Net assets, end of period (000) | | $ | 814,163 | | | $ | 1,035,066 | | | $ | 930,123 | | | $ | 928,593 | | | $ | 1,235,622 | | | $ | 1,056,751 | |
| | | | |
Portfolio turnover rate | | | 23 | % | | | 61 | % | | | 51 | % | | | 45 | % | | | 52 | % | | | 79 | % |
| | | | |
| | 1 | | Aggregate total return. |
| | 2 | | Includes proceeds received from a settlement of litigation, which impacted the Master LLC’s total return. Not including these proceeds, the Master LLC’s total return would have been 67.83%. |
| | 4 | | Includes allocated fees waived of less than 0.005%. |
See Notes to Financial Statements.
| | | | | | |
| | | BLACKROCK VALUE OPPORTUNITIES FUND, INC. | | SEPTEMBER 30, 2014 | | 25 |
| | | | |
| Notes to Financial Statements (Unaudited) | | | Master Value Opportunities LLC | |
1. Organization:
Master Value Opportunities LLC (the “Master LLC”) is registered under the Investment Company Act of 1940, as amended (the “1940 Act”), as a diversified, open-end management investment company. The Master LLC is organized as a Delaware limited liability company. The Limited Liability Company Agreement permits the Board of Directors of the Master LLC (the “Board”) to issue non-transferable interests in the Master LLC, subject to certain limitations.
The Master LLC, together with certain other registered investment companies advised by BlackRock Advisors, LLC (the “Manager”) or its affiliates, is included in a complex of open-end funds referred to as the Equity-Bond Complex.
2. Significant Accounting Policies:
The Master LLC’s financial statements are prepared in conformity with U.S. GAAP, which may require management to make estimates and assumptions that affect the reported amounts of assets and liabilities in the financial statements and the reported amounts of increases and decreases in net assets from operations during the reporting period. Actual results could differ from those estimates. The Master LLC is considered an investment company under U.S. GAAP and follows the accounting and reporting guidance applicable to investment companies. The following is a summary of significant accounting policies followed by the Master LLC:
Valuation: The Master LLC’s investments are valued at fair value as of the close of trading on the New York Stock Exchange (“NYSE”) (generally 4:00 p.m., Eastern time). U.S. GAAP defines fair value as the price the Master LLC would receive to sell an asset or pay to transfer a liability in an orderly transaction between market participants at the measurement date. The Master LLC determines the fair values of its financial instruments at market value using independent dealers or pricing services under policies approved by the Board. The BlackRock Global Valuation Methodologies Committee (the “Global Valuation Committee”) is the committee formed by management to develop global pricing policies and procedures and to provide oversight of the pricing function for the Master LLC for all financial instruments.
Equity investments traded on a recognized securities exchange are valued at the official close each day, if available. For equity investments traded on more than one exchange, the official close price on the exchange where the stock is primarily traded is used. Equity investments traded on a recognized exchange for which there were no sales on that day may be valued at the last available bid (long positions) or ask (short positions) price. Investments in open-end registered investment companies are valued at NAV each business day. Short-term securities with remaining maturities of 60 days or less may be valued at amortized cost, which approximates fair value.
Securities and other assets and liabilities denominated in foreign currencies are translated into U.S. dollars using exchange rates determined as of the close of business on the NYSE. Forward foreign currency exchange contracts are valued at the mean between the bid and ask prices and are determined as of the close of business on the NYSE. Interpolated values are derived when the settlement date of the contract is an interim date for which quotations are not available.
The Master LLC values its investment in BlackRock Liquidity Series, LLC, Money Market Series (the “Money Market Series”) at fair value, which is ordinarily based upon its pro rata ownership in the underlying fund’s net assets. The Money Market Series seeks current income consistent with maintaining liquidity and preserving capital. Although the Money Market Series is not registered under the 1940 Act, its investments will follow the parameters of investments by a money market fund that is subject to Rule 2a-7 under the 1940 Act. The Master LLC may withdraw up to 25% of its investment daily, although the manager of the Money Market Series, in its sole discretion, may permit an investor to withdraw more than 25% on any one day.
In the event that the application of these methods of valuation results in a price for an investment that is deemed not to be representative of the market value of such investment, or if a price is not available, the investment will be valued by the Global Valuation Committee, or its delegate, in accordance with a policy approved by the Board as reflecting fair value (“Fair Value Investments”). When determining the price for Fair Value Investments, the Global Valuation Committee, or its delegate, seeks to determine the price that the Master LLC might reasonably expect to receive or pay from the current sale or purchase of that asset or liability in an arm’s-length transaction. Fair value determinations shall be based upon all available factors that the Global Valuation Committee, or its delegate, deems relevant consistent with the principles of fair value measurement, which include the market approach, income approach and/or in the case of recent investments, the cost approach, as appropriate. The market approach generally consists of using comparable market transactions. The income approach generally is used to discount future cash flows to present value and is adjusted for liquidity as appropriate. These factors include but are not limited to: (i) attributes specific to the investment or asset; (ii) the principal market for the investment or asset; (iii) the customary participants in the principal market for the investment or asset; (iv) data assumptions by market participants for the investment or asset, if reasonably available; (v) quoted prices for similar investments or assets in active markets; and (vi) other factors, such as future cash flows, interest rates, yield curves, volatilities, prepayment speeds, loss severities, credit risks, recovery rates, liquidation amounts and/or default rates. Due to the inherent uncertainty of valuations of such investments, the fair values may differ from the values that would have been used
| | | | | | |
| 26 | | BLACKROCK VALUE OPPORTUNITIES FUND, INC. | | SEPTEMBER 30, 2014 | | |
| | | | |
| Notes to Financial Statements (continued) | | | Master Value Opportunities LLC | |
had an active market existed. The Global Valuation Committee, or its delegate, employs various methods for calibrating valuation approaches for investments where an active market does not exist, including regular due diligence of the Master LLC’s pricing vendors, regular reviews of key inputs and assumptions, transactional back-testing or disposition analysis to compare unrealized gains and losses to realized gains and losses, reviews of missing or stale prices and large movements in market values and reviews of any market related activity. The pricing of all Fair Value Investments is subsequently reported to the Board or a committee thereof on a quarterly basis.
Generally, trading in foreign instruments is substantially completed each day at various times prior to the close of business on the NYSE. Occasionally, events affecting the values of such instruments may occur between the foreign market close and the close of business on the NYSE that may not be reflected in the computation of the Master LLC’s net assets. If events (e.g., a company announcement, market volatility or a natural disaster) occur during such periods that are expected to materially affect the value of such instruments, those instruments may be Fair Value Assets and be valued at their fair value, as determined in good faith by the Global Valuation Committee, or its delegate, using a pricing service and/or policies approved by the Board. Each business day, the Master LLC uses a pricing service to assist with the valuation of certain foreign exchange-traded equity securities and foreign exchange-traded and OTC options (the “Systematic Fair Value Price”). Using current market factors, the Systematic Fair Value Price is designed to value such foreign securities and foreign options at fair value as of the close of business on the NYSE, which follows the close of the local markets.
Foreign Currency: The Master LLC’s books and records are maintained in U.S. dollars. Purchases and sales of investment securities are recorded at the rates of exchange prevailing on the respective date of such transactions. Generally, when the U.S. dollar rises in value against a foreign currency, the Master LLC’s investments denominated in that currency will lose value because that currency is worth fewer U.S. dollars; the opposite effect occurs if the U.S. dollar falls in relative value.
The Master LLC does not isolate the portion of the results of operations arising as a result of changes in the foreign exchange rates from the changes in the market prices of investments held or sold for financial reporting purposes. Accordingly, the effects of changes in foreign currency exchange rates on investments are not segregated in the Statement of Operations from the effects of changes in market prices of those investments but are included as a component of net realized and unrealized gain (loss) from investments. The Master LLC reports realized currency gains (losses) on foreign currency related transactions as components of net realized gain (loss) for financial reporting purposes, whereas such components are generally treated as ordinary income for federal income tax purposes.
Investment Transactions and Investment Income: For financial reporting purposes, investment transactions are recorded on the dates the transactions are entered into (the trade dates). Realized gains and losses on investment transactions are determined on the identified cost basis. Dividend income is recorded on the ex-dividend date. Dividends from foreign securities where the ex-dividend date may have passed are subsequently recorded when the Master LLC is informed of the ex-dividend date. Under the applicable foreign tax laws, a withholding tax at various rates may be imposed on capital gains, dividends and interest. Upon notification from issuers, some of the dividend income received from a real estate investment trust may be redesignated as a reduction of cost of the related investment and/or realized gain.
Recent Accounting Standard: In June 2014, the Financial Accounting Standards Board issued guidance to improve the financial reporting of reverse repurchase agreements and other similar transactions. The guidance will require expanded disclosure for entities that enter into reverse repurchase agreements and similar transactions accounted for as secured borrowings. It is effective for financial statements with fiscal years beginning on or after December 15, 2014 and interim periods within those fiscal years. Management is evaluating the impact, if any, of this guidance on the Master LLC’s financial statement disclosures.
Other: Expenses directly related to the Master LLC are charged to the Master LLC. Other operating expenses shared by several funds are pro rated among those funds on the basis of relative net assets or other appropriate methods.
The Master LLC has an arrangement with the custodian whereby fees may be reduced by credits earned on uninvested cash balances, which, if applicable, are shown as fees paid indirectly in the Statement of Operations. The custodian imposes fees on overdrawn cash balances, which can be offset by accumulated credits earned or may result in additional custody charges.
3. Securities and Other Investments:
Securities Lending: The Master LLC may lend its securities to approved borrowers, such as brokers, dealers and other financial institutions. The borrower pledges and maintains with the Master LLC collateral consisting of cash, an irrevocable letter of credit issued by a bank, or securities issued or guaranteed by the U.S. government. The initial collateral received by the Master LLC is required to have a value of at least 102% of the current value of the loaned securities for securities traded on U.S. exchanges and a value of at least 105% for all other securities. The collateral is maintained thereafter, at a value equal to at least 100% of the current market value of the securities on loan. The market value of the loaned securities is determined at
| | | | | | |
| | | BLACKROCK VALUE OPPORTUNITIES FUND, INC. | | SEPTEMBER 30, 2014 | | 27 |
| | | | |
| Notes to Financial Statements (continued) | | | Master Value Opportunities LLC | |
the close of each business day of the Master LLC and any additional required collateral is delivered to the Master LLC on the next business day. During the term of the loan, the Master LLC is entitled to all distributions made on or in respect of the loaned securities. Loans of securities are terminable at any time and the borrower, after notice, is required to return borrowed securities within the standard time period for settlement of securities transactions.
The market value of securities on loan and the value of the related collateral are shown separately in the Statement of Assets and Liabilities as a component of investments at value — unaffiliated, and collateral on securities loaned at value, respectively. As of September 30, 2014, any securities on loan were collateralized by cash. The cash collateral invested by the securities lending agent, BlackRock Investment Management, LLC (“BIM”), if any, is disclosed in the Schedule of Investments.
Securities lending transactions are entered into by the Master LLC under Master Securities Lending Agreements (each, an “MSLA”), which provide the right, in the event of default (including bankruptcy or insolvency), for the non-defaulting party to liquidate the collateral and calculate a net exposure to the defaulting party or request additional collateral. In the event that a borrower defaults, the Master LLC, as lender, would offset the market value of the collateral received against the market value of the securities loaned. When the value of the collateral is greater than that of the market value of the securities loaned, the lender is left with a net amount payable to the defaulting party. However, bankruptcy or insolvency laws of a particular jurisdiction may impose restrictions on or prohibitions against such a right of offset in the event of an MSLA counterparty’s bankruptcy or insolvency. Under the MSLA, the borrower can resell or re-pledge the loaned securities, and the Master LLC can reinvest cash collateral, or, upon an event of default, resell or re-pledge the collateral.
The following table is a summary of the Master LLC’s securities lending agreements by counterparty, which are subject to offset under an MSLA as of September 30, 2014:
| | | | | | | | | | | | |
| Counterparty | | Securities Loaned
at Value | | | Cash Collateral
Received1 | | | Net Amount | |
Citigroup Global Markets, Inc. | | $ | 12,096,272 | | | $ | (12,096,272 | ) | | | — | |
Credit Suisse Securities (USA) LLC | | | 2,720,486 | | | | (2,720,486 | ) | | | — | |
Deutsche Bank AG | | | 54,786 | | | | (54,786 | ) | | | — | |
Goldman Sachs & Co. | | | 8,903,662 | | | | (8,903,662 | ) | | | — | |
JP Morgan Securities LLC | | | 6,487,177 | | | | (6,487,177 | ) | | | — | |
Merrill Lynch, Pierce, Fenner & Smith Inc. | | | 921,795 | | | | (921,795 | ) | | | — | |
Morgan Stanley | | | 42,450,303 | | | | (42,450,303 | ) | | | — | |
UBS Securities LLC | | | 2,364,442 | | | | (2,364,442 | ) | | | — | |
| | | | |
Total | | $ | 75,998,923 | | | $ | (75,998,923 | ) | | | — | |
| | | | |
| | 1 | | Collateral with a value of $80,486,552 has been received in connection with securities lending agreements. Excess of collateral received from the individual counterparty is not shown for financial reporting purposes. |
The risks of securities lending include the risk that the borrower may not provide additional collateral when required or may not return the securities when due. To mitigate these risks, the Master LLC benefits from a borrower default indemnity provided by BIM. BIM’s indemnity allows for full replacement of the securities lent if the collateral received does not cover the value on the securities loaned in the event of borrower default. The Master LLC could suffer a loss if the value of an investment purchased with cash collateral falls below the market value of loaned securities or if the value of an investment purchased with cash collateral falls below the value of the original cash collateral received.
4. Investment Advisory Agreement and Other Transactions with Affiliates:
The PNC Financial Services Group, Inc. is the largest stockholder and an affiliate, for 1940 Act purposes, of BlackRock.
The Master LLC entered into an Investment Advisory Agreement with the Manager, the Master LLC’s investment advisor, an indirect, wholly owned subsidiary of BlackRock, to provide investment advisory and administration services. The Manager is responsible for the management of the Master LLC’s portfolio and provides the necessary personnel, facilities, equipment and certain other services to the operations of the Master LLC. For such services, the Master LLC pays the Manager a monthly fee based on a percentage of the Master LLC’s average daily net assets at the following annual rates:
| | | | |
| Average Daily Net Assets | | Investment
Advisory Fee | |
First $1 Billion | | | 0.500 | % |
$1 Billion - $1.5 Billion | | | 0.475 | % |
Greater than $1.5 Billion | | | 0.450 | % |
| | | | | | |
| 28 | | BLACKROCK VALUE OPPORTUNITIES FUND, INC. | | SEPTEMBER 30, 2014 | | |
| | | | |
| Notes to Financial Statements (continued) | | | Master Value Opportunities LLC | |
The Manager voluntarily agreed to waive its investment advisory fees by the amount of investment advisory fees the Master LLC pays to the Manager indirectly through its investment in affiliated money market funds. However, the Manager does not waive its investment advisory fees by the amount of investment advisory fees paid in connection with the Master LLC’s investment in other affiliated investment companies, if any. This amount is shown as fees waived by Manager in the Statement of Operations.
Prior to July 1, 2014, BIM, an affiliate of the Manager, served as a sub-advisor to the Master LLC pursuant to a sub-advisory agreement with the Manager, and received for its services a monthly fee from the Manager at an annual rate equal to a percentage of the investment advisory fees paid by the Master LLC to the Manager under the Investment Advisory Agreement. Effective July 1, 2014, the sub-advisory agreement between the Manager and BIM, with respect to the Master LLC, expired.
For the six months ended September 30, 2014, the Master LLC reimbursed the Manager $5,360 for certain accounting services, which is included in accounting services in the Statement of Operations.
The U.S. Securities and Exchange Commission has issued an exemptive order which permits BIM, an affiliate of the Manager, to serve as securities lending agent for the Master LLC, subject to applicable conditions. As securities lending agent, BIM bears all operational costs directly related to securities lending. The Master LLC is responsible for expenses in connection with the investment of cash collateral received for securities on loan (the “collateral investment expenses”). The cash collateral is invested in a private investment company managed by the Manager or its affiliates. However, BIM has agreed to cap the collateral investment expenses of the private investment company to an annual rate of 0.04%. The investment advisor to the private investment company will not charge any advisory fees with respect to shares purchased by the Master LLC.
Securities lending income is equal to the total of income earned from the reinvestment of cash collateral, net of fees and other payments to and from borrowers of securities, and less the collateral investment expenses. The Master LLC retains a portion of securities lending income and remits a remaining portion to BIM as compensation for its services as securities lending agent.
Pursuant to a securities lending agreement, the Master LLC retains 70% of securities lending income, and this amount retained can never be less than 65% of the total of securities lending income plus the collateral investment expenses.
In addition, commencing the business day following the date that the aggregate securities lending income earned across the Equity-Bond Complex in a calendar year exceeds the aggregate securities lending income earned across the Equity-Bond Complex in the calendar year 2013, the Master LLC, pursuant to the securities lending agreement, will retain for the remainder of that calendar year securities lending income as follows: 75% of securities lending income, and this amount retained can never be less than 65% of the total of securities lending income plus the collateral investment expenses.
The share of securities lending income earned by the Master LLC is shown as securities lending — affiliated — net in the Statement of Operations. For the six months ended September 30, 2014, the Master LLC paid BIM $316,681 for securities lending agent services.
Certain officers and/or directors of the Master LLC are officers and/or directors of BlackRock or its affiliates.
The Master LLC may purchase securities from, or sell securities to, an affiliated fund provided the affiliation is due solely to having a common investment advisor, common officers, or common trustees. For the six months ended September 30, 2014, the purchase and sale transactions with an affiliated fund in compliance with Rule 17a-7 under the 1940 Act were $2,459,667 and $5,920,471, respectively.
5. Purchases and Sales:
Purchases and sales of investments, excluding short-term securities, for the six months ended September 30, 2014, were $214,754,138 and $406,152,709, respectively.
6. Income Tax Information:
After July 3, 2014 the Master LLC was no longer considered a partnership. The feeder of the Master LLC is treated as the owner of the net assets, income, expenses and realized and unrealized gains and losses of the Master LLC. No federal income tax provision was required.
The Master LLC files U.S. federal and various state and local tax returns. No income tax returns are currently under examination. The statute of limitations on the Master LLC’s U.S. federal tax returns remains open for each of the four years ended March 31, 2014 and the period ended July 3, 2014. The statutes of limitations on the Master LLC’s state and local tax returns may remain open for an additional year depending upon the jurisdiction.
| | | | | | |
| | | BLACKROCK VALUE OPPORTUNITIES FUND, INC. | | SEPTEMBER 30, 2014 | | 29 |
| | | | |
| Notes to Financial Statements (concluded) | | | Master Value Opportunities LLC | |
Management has analyzed tax laws and regulations and their application to the Master LLC’s facts and circumstances and does not believe that there are any uncertain tax positions that require recognition of a tax liability.
As of September 30, 2014, gross unrealized appreciation and depreciation based on cost for federal income tax purposes were as follows:
| | | | |
Tax cost | | $ | 781,149,871 | |
| | | | |
Gross unrealized appreciation | | $ | 160,123,432 | |
Gross unrealized depreciation | | | (45,173,095 | ) |
| | | | |
Net unrealized appreciation | | $ | 114,950,337 | |
| | | | |
7. Bank Borrowings:
The Master LLC, along with certain other funds managed by the Manager and its affiliates (“Participating Funds”), is a party to a 364-day, $1.1 billion credit agreement with a group of lenders, under which the Master LLC may borrow to fund shareholder redemptions. The agreement expires in April 2015. Excluding commitments designated for a certain individual fund, other Participating Funds, including the Master LLC, can borrow up to an aggregate commitment amount of $650 million, subject to asset coverage and other limitations as specified in the agreement. The credit agreement has the following terms: a fee of 0.06% per annum on unused commitment amounts and interest at a rate equal to the higher of (a) the one-month LIBOR plus 0.80% per annum or (b) the Fed Funds rate plus 0.80% per annum on amounts borrowed. Participating Funds paid administration and arrangement fees, which are included in miscellaneous expenses in the Statement of Operations, along with commitment fees, were allocated among such funds based upon portions of the aggregate commitment available to them and relative net assets of Participating Funds. The Master LLC did not borrow under the credit agreement during the six months ended September 30, 2014.
8. Principal Risks:
In the normal course of business, the Master LLC invests in securities and enters into transactions where risks exist due to fluctuations in the market (market risk) or failure of the issuer of a security to meet all its obligations (issuer credit risk). The value of securities held by the Master LLC may decline in response to certain events, including those directly involving the issuers whose securities are owned by the Master LLC; conditions affecting the general economy; overall market changes; local, regional or global political, social or economic instability; and currency and interest rate and price fluctuations. Similar to issuer credit risk, the Master LLC may be exposed to counterparty credit risk, or the risk that an entity with which the Master LLC has unsettled or open transactions may fail to or be unable to perform on its commitments. The Master LLC manages counterparty credit risk by entering into transactions only with counterparties that it believes have the financial resources to honor their obligations and by monitoring the financial stability of those counterparties. Financial assets, which potentially expose the Master LLC to market, issuer and counterparty credit risks, consist principally of financial instruments and receivables due from counterparties. The extent of the Master LLC’s exposure to market, issuer and counterparty credit risks with respect to these financial assets is generally approximated by their value recorded in the Statement of Assets and Liabilities, less any collateral held by the Master LLC.
As of September 30, 2014, the Master LLC invested a significant portion of its assets in securities in the Financials sector. Changes in economic conditions affecting the financials sector would have a greater impact on the Master LLC and could affect the value, income and/or liquidity of positions in such securities.
9. Subsequent Events:
Management has evaluated the impact of all subsequent events on the Master LLC through the date the financial statements were issued and has determined that there were no subsequent events requiring adjustment or additional disclosure in the financial statements.
| | | | | | |
| 30 | | BLACKROCK VALUE OPPORTUNITIES FUND, INC. | | SEPTEMBER 30, 2014 | | |
| | |
| Disclosure of Investment Advisory Agreement | | |
The Board of Directors of the Master Value Opportunities LLC (the “Master Fund”) met in person on April 8, 2014 (the “April Meeting”) and May 13-14, 2014 (the “May Meeting”) to consider the approval of the Master Fund’s investment advisory agreement (the “Advisory Agreement” or the “Agreement”) with BlackRock Advisors, LLC (the “Manager” or “BlackRock”), the Master Fund’s investment advisor. At the May Meeting, it was noted that the sub-advisory agreement between the Manager and BlackRock Investment Management, LLC, with respect to the Master Fund, would expire effective July 1, 2014. It was also noted that the non-renewal of the sub-advisory agreement would not result in any change in the nature or quality of services provided to the Master Fund, or in the portfolio management team that serves the Master Fund. The BlackRock Value Opportunities Fund, Inc. (the “Feeder Fund”) is a “feeder” fund that invests all of its investable assets in the Master Fund. Accordingly, the Board of Directors of the Feeder Fund also considered the approval of the Advisory Agreement with respect to the Master Fund. For simplicity: (a) the Board of Directors of the Master Fund and the Board of Directors of the Feeder Fund are referred to herein collectively as the “Board,” and the members are referred to as “Board Members;” and (b) the shareholders of the Feeder Fund and the interest holders of the Master Fund are referred to as “shareholders.”
Activities and Composition of the Board
The Board consists of thirteen individuals, ten of whom are not “interested persons” of the Master Fund or the Feeder Fund as defined in the Investment Company Act of 1940, as amended (the “1940 Act”) (the “Independent Board Members”). The Board Members are responsible for the oversight of the operations of the Master Fund or the Feeder Fund, as pertinent, and perform the various duties imposed on the directors of investment companies by the 1940 Act. The Independent Board Members have retained independent legal counsel to assist them in connection with their duties. The Chairman of the Board is an Independent Board Member. The Board has established five standing committees: an Audit Committee, a Governance and Nominating Committee, a Compliance Committee, a Performance Oversight Committee and an Executive Committee, each of which is chaired by an Independent Board Member and composed of Independent Board Members (except for the Performance Oversight Committee and the Executive Committee, each of which also has one interested Board Member).
The Agreement
Pursuant to the 1940 Act, the Board is required to consider the continuation of the Agreement on an annual basis. The Board has four quarterly meetings per year, each extending over two days, and a fifth one-day meeting to consider specific information surrounding the consideration of renewing the Agreement. In connection with this process, the Board assessed, among other things, the nature, scope and quality of the services provided to the Master Fund and the Feeder Fund by BlackRock, its personnel and its affiliates, including (as applicable) investment management; administrative and shareholder services; oversight of fund service providers; marketing services; risk oversight; compliance and assistance in meeting applicable legal and regulatory requirements.
The Board, acting directly and through its committees, considers at each of its meetings, and from time to time as appropriate, factors that are relevant to its annual consideration of the renewal of the Agreement, including the services and support provided by BlackRock to the Master Fund, the Feeder Fund and their shareholders. Among the matters the Board considered were: (a) investment performance for one-year, three-year, five-year and/or since inception periods, as applicable, against peer funds, and applicable benchmarks, if any, as well as senior management’s and portfolio managers’ analysis of the reasons for any over-performance or underperformance against its peers and/or benchmark, as applicable; (b) fees, including advisory, administration, if applicable, and other amounts paid to BlackRock and its affiliates by the Master Fund and/or the Feeder Fund for services, such as marketing and distribution, call center and fund accounting; (c) the Master Fund’s and/or the Feeder Fund’s operating expenses and how BlackRock allocates expenses to the Master Fund and the Feeder Fund; (d) the resources devoted to, risk oversight of, and compliance reports relating to, implementation of the Master Fund’s and the Feeder Fund’s investment objective, policies and restrictions, and meeting new regulatory requirements; (e) the Master Fund’s and the Feeder Fund’s compliance with its respective Code of Ethics and other compliance policies and procedures; (f) the nature, cost and character of non-investment management services provided by BlackRock and its affiliates; (g) BlackRock’s and other service providers’ internal controls and risk and compliance oversight mechanisms; (h) BlackRock’s implementation of the proxy voting policies approved by the Board; (i) the use of brokerage commissions and execution quality of portfolio transactions; (j) BlackRock’s implementation of the Master Fund’s and/or the Feeder Fund’s valuation and liquidity procedures; (k) an analysis of management fees for products with similar investment objectives across the open-end fund, exchange-traded fund (“ETF”), closed-end fund and institutional account product channels, as applicable, and the similarities and differences between the services provided to these products as compared to the Master Fund and/or Feeder Fund; (l) BlackRock’s compensation methodology for its investment professionals and the incentives it creates; and (m) periodic updates on BlackRock’s business.
The Board has engaged in an ongoing strategic review with BlackRock of opportunities to consolidate funds and of BlackRock’s commitment to investment performance. BlackRock also furnished information to the Board in response to specific questions. These questions covered issues such as: BlackRock’s profitability; investment performance; subadvisory and advisory relationships with other clients (including mutual funds sponsored by third parties); the viability of specific funds; manager capacity and the potential for closing certain funds to new investments; portfolio managers’ investments in funds they manage; supplemental service agreements with third party distribution partners; and management fee levels and breakpoints. The
| | | | | | |
| | | BLACKROCK VALUE OPPORTUNITIES FUND, INC. | | SEPTEMBER 30, 2014 | | 31 |
| | |
| Disclosure of Investment Advisory Agreement (continued) | | |
Board further discussed with BlackRock: BlackRock’s management structure; portfolio turnover, execution quality and use of soft dollars; BlackRock’s portfolio manager compensation and performance accountability; marketing support for the funds; services provided to the funds by BlackRock affiliates; and BlackRock’s oversight of relationships with third party service providers.
Board Considerations in Approving the Agreement
The Approval Process: Prior to the April Meeting, the Board requested and received materials specifically relating to the Agreement. The Board is continuously engaged in a process with its independent legal counsel and BlackRock to review the nature and scope of the information provided to better assist its deliberations. The materials provided in connection with the April Meeting included (a) information independently compiled and prepared by Lipper, Inc. (“Lipper”) on fees and expenses of the Master Fund and the Feeder Fund, as applicable, as compared with a peer group of funds as determined by Lipper (“Expense Peers”) and the investment performance of the Feeder Fund as compared with a peer group of funds as determined by Lipper;1 (b) information on the profits realized by BlackRock and its affiliates pursuant to the Agreement and a discussion of fall-out benefits to BlackRock and its affiliates; (c) a general analysis provided by BlackRock concerning investment management fees charged to other clients, such as institutional clients, ETFs and closed-end funds, under similar investment mandates, as well as the performance of such other clients, as applicable; (d) review of non-management fees; (e) the existence, impact and sharing of potential economies of scale; (f) a summary of aggregate amounts paid by the Master Fund and/or the Feeder Fund to BlackRock; (g) sales and redemption data regarding the Feeder Fund’s shares; and (h) if applicable, a comparison of management fees to similar BlackRock open-end funds, as classified by Lipper.
At the April Meeting, the Board reviewed materials relating to its consideration of the Agreement. As a result of the discussions that occurred during the April Meeting, and as a culmination of the Board’s year-long deliberative process, the Board presented BlackRock with questions and requests for additional information. BlackRock responded to these requests with additional written information in advance of the May Meeting.
At the May Meeting, the Board of the Master Fund, including the Independent Board Members, approved the continuation of the Advisory Agreement between the Manager and the Master Fund for a one-year term ending June 30, 2015. The Board of the Feeder Fund, including the Independent Board Members, also considered the continuation of the Agreement and found the Agreement to be satisfactory. In approving the continuation of the Agreement, the Board considered: (a) the nature, extent and quality of the services provided by BlackRock; (b) the investment performance of the Master Fund, the Feeder Fund and BlackRock; (c) the advisory fee and the cost of the services and profits to be realized by BlackRock and its affiliates from their relationship with the Master Fund and the Feeder Fund; (d) the Feeder Fund’s costs to investors compared to the costs of Expense Peers and performance compared to the relevant performance comparison as previously discussed; (e) economies of scale; (f) fall-out benefits to BlackRock and its affiliates as a result of its relationship with the Master Fund and the Feeder Fund; and (g) other factors deemed relevant by the Board Members.
The Board also considered other matters it deemed important to the approval process, such as payments made to BlackRock or its affiliates relating to the distribution of Feeder Fund shares and securities lending, services related to the valuation and pricing of portfolio holdings of the Master Fund, direct and indirect benefits to BlackRock and its affiliates from their relationship with the Master Fund and the Feeder Fund and advice from independent legal counsel with respect to the review process and materials submitted for the Board’s review. The Board noted the willingness of BlackRock personnel to engage in open, candid discussions with the Board. The Board did not identify any particular information as determinative, and each Board Member may have attributed different weights to the various items considered.
A. Nature, Extent and Quality of the Services Provided by BlackRock: The Board, including the Independent Board Members, reviewed the nature, extent and quality of services provided by BlackRock, including the investment advisory services and the resulting performance of the Feeder Fund. Throughout the year, the Board compared the Feeder Fund’s performance to the performance of a comparable group of mutual funds and/or the performance of a relevant benchmark, as applicable. The Board met with BlackRock’s senior management personnel responsible for investment activities, including the senior investment officers. The Board also reviewed the materials provided by the Master Fund’s portfolio management team discussing the Master Fund’s performance and the Master Fund’s investment objective, strategies and outlook.
The Board considered, among other factors, with respect to BlackRock: the number, education and experience of investment personnel generally and the Master Fund’s portfolio management team; investments by portfolio managers in the funds they manage; portfolio trading capabilities; use of technology; commitment to compliance; credit analysis capabilities; risk analysis and oversight capabilities; and the approach to training and retaining portfolio managers and other research, advisory and management personnel. The Board engaged in a review of BlackRock’s compensation structure with respect to the Master Fund’s portfolio management team and BlackRock’s ability to attract and retain high-quality talent and create performance incentives.
| | 1 | | Funds are ranked by Lipper in quartiles, ranging from first to fourth, where first is the most desirable quartile position and fourth is the least desirable. |
| | | | | | |
| 32 | | BLACKROCK VALUE OPPORTUNITIES FUND, INC. | | SEPTEMBER 30, 2014 | | |
| | |
| Disclosure of Investment Advisory Agreement (continued) | | |
In addition to advisory services, the Board considered the quality of the administrative and other non-investment advisory services provided to the Master Fund and the Feeder Fund. BlackRock and its affiliates provide the Master Fund and the Feeder Fund with certain administrative, shareholder and other services (in addition to any such services provided to the Master Fund and the Feeder Fund by third parties) and officers and other personnel as are necessary for the operations of the Master Fund and the Feeder Fund. In particular, BlackRock and its affiliates provide the Master Fund and the Feeder Fund with the following administrative services including, among others: (i) preparing disclosure documents, such as the prospectus, the summary prospectus (as applicable), the statement of additional information and periodic shareholder reports; (ii) oversight of daily accounting and pricing; (iii) overseeing and coordinating the activities of other service providers; (iv) organizing Board meetings and preparing the materials for such Board meetings; (v) providing legal and compliance support; (vi) furnishing analytical and other support to assist the Board in its consideration of strategic issues such as the merger or consolidation of certain open-end funds; and (vii) performing other administrative functions necessary for the operation of the Master Fund and the Feeder Fund, such as tax reporting, fulfilling regulatory filing requirements and call center services. The Board reviewed the structure and duties of BlackRock’s fund administration, shareholder services, legal and compliance departments and considered BlackRock’s policies and procedures for assuring compliance with applicable laws and regulations.
B. The Investment Performance of the Master Fund, the Feeder Fund and BlackRock: The Board, including the Independent Board Members, also reviewed and considered the performance history of the Master Fund and the Feeder Fund, as applicable. The Board noted that the Feeder Fund’s investment results correspond directly to the investment results of the Master Fund. In preparation for the April Meeting, the Board worked with its independent legal counsel, BlackRock and Lipper to develop a template for, and was provided with, reports independently prepared by Lipper, which included a comprehensive analysis of the Feeder Fund’s performance. The Board also reviewed a narrative and statistical analysis of the Lipper data that was prepared by BlackRock, which analyzed various factors that affect Lipper’s rankings. In connection with its review, the Board received and reviewed information regarding the investment performance of the Feeder Fund as compared to other funds in its applicable Lipper category. The Board was provided with a description of the methodology used by Lipper to select peer funds and periodically meets with Lipper representatives to review its methodology. The Board and its Performance Oversight Committee regularly review, and meet with Master Fund management to discuss, the performance of the Master Fund and the Feeder Fund, as applicable, throughout the year.
The Board noted that for the one-, three- and five-year periods reported, the Feeder Fund ranked in the first, second and second quartiles, respectively, against its Lipper Performance Universe.
C. Consideration of the Advisory/Management Fees and the Cost of the Services and Profits to be Realized by BlackRock and its Affiliates from their Relationship with the Master Fund and the Feeder Fund: The Board, including the Independent Board Members, reviewed the Master Fund’s/Feeder Fund’s contractual management fee rate compared with the other funds in the Feeder Fund’s Lipper category. The contractual management fee rate represents a combination of the advisory fee and any administrative fees, before taking into account any reimbursements or fee waivers. The Board also compared the Feeder Fund’s total expense ratio, as well as the Master Fund’s/Feeder Fund’s actual management fee rate, to those of other funds in the Feeder Fund’s Lipper category. The total expense ratio represents a fund’s total net operating expenses, including any 12b-1 or non 12b-1 service fees. The total expense ratio gives effect to any expense reimbursements or fee waivers that benefit a fund, and actual management fee rate gives effect to any management fee reimbursements or waivers that benefit a fund. The Board considered the services provided and the fees charged by BlackRock to other types of clients with similar investment mandates, as applicable, including institutional accounts.
The Board received and reviewed statements relating to BlackRock’s financial condition. The Board was also provided with a profitability analysis that detailed the revenues earned and the expenses incurred by BlackRock for services provided to the Master Fund and the Feeder Fund. The Board reviewed BlackRock’s profitability with respect to the Master Fund and the Feeder Fund, as applicable, and other funds the Board currently oversees for the year ended December 31, 2013 compared to available aggregate profitability data provided for the two prior years. The Board reviewed BlackRock’s profitability with respect to certain other fund complexes managed by the Manager and/or its affiliates. The Board reviewed BlackRock’s assumptions and methodology of allocating expenses in the profitability analysis, noting the inherent limitations in allocating costs among various advisory products. The Board recognized that profitability may be affected by numerous factors including, among other things, fee waivers and expense reimbursements by the Manager, the types of funds managed, precision of expense allocations and business mix. As a result, calculating and comparing profitability at individual fund levels is difficult.
The Board noted that, in general, individual fund or product line profitability of other advisors is not publicly available. The Board reviewed BlackRock’s overall operating margin, in general, compared to that of certain other publicly-traded asset management firms. The Board considered the differences between BlackRock and these other firms, including the contribution of technology at BlackRock, BlackRock’s expense management, and the relative product mix.
| | | | | | |
| | | BLACKROCK VALUE OPPORTUNITIES FUND, INC. | | SEPTEMBER 30, 2014 | | 33 |
| | |
| Disclosure of Investment Advisory Agreement (concluded) | | |
In addition, the Board considered the cost of the services provided to the Master Fund and the Feeder Fund by BlackRock, and BlackRock’s and its affiliates’ profits relating to the management and distribution of the Master Fund and the Feeder Fund and the other funds advised by BlackRock and its affiliates. As part of its analysis, the Board reviewed BlackRock’s methodology in allocating its costs to the management of the Master Fund and the Feeder Fund. The Board also considered whether BlackRock has the financial resources necessary to attract and retain high quality investment management personnel to perform its obligations under the Agreement and to continue to provide the high quality of services that is expected by the Board. The Board further considered factors including but not limited to BlackRock’s commitment of time, assumption of risk and liability profile in servicing the Master Fund and the Feeder Fund in contrast to what is required of BlackRock with respect to other products with similar investment objectives across the open-end fund, ETF, closed-end fund and institutional account product channels, as applicable.
The Board noted that the Master Fund’s/Feeder Fund’s contractual management fee rate ranked in the second quartile, and that the actual management fee rate and the Feeder Fund’s total expense ratio ranked in the second and first quartiles, respectively, relative to the Feeder Fund’s Expense Peers. The Board also noted that the Master Fund has an advisory fee arrangement that includes breakpoints that adjust the fee rate downward as the size of the Master Fund increases above certain contractually specified levels.
D. Economies of Scale: The Board, including the Independent Board Members, considered the extent to which economies of scale might be realized as the assets of the Master Fund and the Feeder Fund increase, as well as the existence of expense caps, as applicable. The Board also considered the extent to which the Master Fund and the Feeder Fund benefit from such economies and whether there should be changes in the advisory fee rate or breakpoint structure in order to enable the Master Fund and the Feeder Fund to participate in these economies of scale, for example through the use of revised breakpoints in the advisory fee based upon the asset level of the Master Fund. In its consideration, the Board Members took into account the existence of any expense caps and further considered the continuation and/or implementation, as applicable, of such caps.
E. Other Factors Deemed Relevant by the Board Members: The Board, including the Independent Board Members, also took into account other ancillary or “fall-out” benefits that BlackRock or its affiliates may derive from their respective relationships with the Master Fund and the Feeder Fund, both tangible and intangible, such as BlackRock’s ability to leverage its investment professionals who manage other portfolios and risk management personnel, an increase in BlackRock’s profile in the investment advisory community, and the engagement of BlackRock’s affiliates as service providers to the Master Fund and the Feeder Fund, including for administrative, distribution, securities lending and cash management services. The Board also considered BlackRock’s overall operations and its efforts to expand the scale of, and improve the quality of, its operations. The Board also noted that BlackRock may use and benefit from third party research obtained by soft dollars generated by certain registered fund transactions to assist in managing all or a number of its other client accounts. The Board further noted that it had considered the investment by BlackRock’s funds in ETFs without any offset against the management fees payable by the funds to BlackRock.
In connection with its consideration of the Agreement, the Board also received information regarding BlackRock’s brokerage and soft dollar practices. The Board received reports from BlackRock which included information on brokerage commissions and trade execution practices throughout the year.
The Board noted the competitive nature of the open-end fund marketplace, and that shareholders are able to redeem their Feeder Fund shares if they believe that the Feeder Fund’s and/or the Master Fund’s fees and expenses are too high or if they are dissatisfied with the performance of the Feeder Fund.
Conclusion
The Board of the Master Fund, including the Independent Board Members, approved the continuation of the Advisory Agreement between the Manager and the Master Fund for a one-year term ending June 30, 2015. Based upon its evaluation of all of the aforementioned factors in their totality, the Board of the Master Fund, including the Independent Board Members, was satisfied that the terms of the Agreement were fair and reasonable and in the best interest of the Master Fund and its shareholders. The Board of the Feeder Fund, including the Independent Board Members, also considered the continuation of the Agreement with respect to the Master Fund and found the Agreement to be satisfactory. In arriving at its decision to approve the Agreement, the Board of the Master Fund did not identify any single factor or group of factors as all-important or controlling, but considered all factors together, and different Board Members may have attributed different weights to the various factors considered. The Independent Board Members were also assisted by the advice of independent legal counsel in making this determination. The contractual fee arrangements for the Master Fund reflect the results of several years of review by the Board Members and predecessor Board Members, and discussions between such Board Members (and predecessor Board Members) and BlackRock. As a result, the Board Members’ conclusions may be based in part on their consideration of these arrangements in prior years.
| | | | | | |
| 34 | | BLACKROCK VALUE OPPORTUNITIES FUND, INC. | | SEPTEMBER 30, 2014 | | |
Robert M. Hernandez, Chairman of the Board and Director
Fred G. Weiss, Vice Chairman of the Board and Director
Paul L. Audet, Director
James H. Bodurtha, Director
Bruce R. Bond, Director
Donald W. Burton, Director
Honorable Stuart E. Eizenstat, Director
Laurence D. Fink, Director
Kenneth A. Froot, Director
Henry Gabbay, Director
John F. O’Brien, Director
Roberta Cooper Ramo, Director
David H. Walsh, Director
John M. Perlowski, President and Chief Executive Officer
Jennifer McGovern, Vice President
Neal Andrews, Chief Financial Officer
Jay Fife, Treasurer
Charles Park, Chief Compliance Officer and Anti-Money
Laundering Officer
Benjamin Archibald, Secretary
Investment Advisor and Administrator
BlackRock Advisors, LLC
Wilmington, DE 19809
Accounting Agent and Transfer Agent
BNY Mellon Investment Servicing (US) Inc.
Wilmington, DE 19809
Custodian
The Bank of New York Mellon
New York, NY 10286
Distributor
BlackRock Investments, LLC
New York, NY 10022
Legal Counsel
Willkie Farr & Gallagher LLP
New York, NY 10019
Independent Registered Public Accounting Firm
Deloitte & Touche LLP
Philadelphia, PA 19103
Address of the Fund
100 Bellevue Parkway
Wilmington, DE 19809
Effective September 10, 2014, Brendan Kyne resigned as a Vice President of the Fund/Master LLC and Jennifer McGovern became a Vice President of the Fund/Master LLC
| | | | | | |
| | | BLACKROCK VALUE OPPORTUNITIES FUND, INC. | | SEPTEMBER 30, 2014 | | 35 |
Electronic Delivery
Shareholders can sign up for e-mail notifications of quarterly statements, annual and semi-annual shareholder reports and prospectuses by enrolling in the electronic delivery program. Electronic copies of shareholder reports and prospectuses are available on BlackRock’s website.
To enroll in electronic delivery:
Shareholders Who Hold Accounts with Investment Advisors, Banks or Brokerages:
Please contact your financial advisor. Please note that not all investment advisors, banks or brokerages may offer this service.
Shareholders Who Hold Accounts Directly With BlackRock:
| 1) | Access the BlackRock website at |
| 2) | Select “Access Your Account” |
| 3) | Next, select “eDelivery” in the “Related Resources” box and follow the sign-up instructions |
Householding
The Fund will mail only one copy of shareholder documents, including prospectuses, annual and semi-annual reports and proxy statements, to shareholders with multiple accounts at the same address. This practice is commonly called “householding” and is intended to reduce expenses and eliminate duplicate mailings of shareholder documents. Mailings of your shareholder documents may be householded indefinitely unless you instruct us otherwise. If you do not want the mailing of these documents to be combined with those for other members of your household, please call the Fund at (800) 441-7762.
Availability of Schedule of Investments
The Fund/Master LLC file their complete schedule of portfolio holdings with the SEC for the first and third quarters of each fiscal year on Form N-Q. The Fund/Master LLC’s Forms N-Q are available on the SEC’s website at http://www.sec.gov and may also be reviewed and copied at the SEC’s Public Reference Room in Washington, D.C. Information on how to access documents on the SEC’s website without charge may be obtained by calling (800) SEC-0330. The Fund/Master LLC’s Forms N-Q may also be obtained upon request and without charge by calling (800) 441-7762.
Availability of Proxy Voting Policies and Procedures
A description of the policies and procedures that the Fund/Master LLC use to determine how to vote proxies relating to portfolio securities is available (1) without charge, upon request, by calling (800) 441-7762; (2) at http://www.blackrock.com; and (3) on the SEC’s website at http://www.sec.gov.
Availability of Proxy Voting Record
Information about how the Fund/Master LLC voted proxies relating to securities held in the Fund/Master LLC’s portfolio during the most recent 12-month period ended June 30 is available upon request and without charge (1) at http://www.blackrock.com or by calling (800) 441-7762 and (2) on the SEC’s website at http://www.sec.gov.
BlackRock’s Mutual Fund Family
BlackRock offers a diverse lineup of open-end mutual funds crossing all investment styles and managed by experts in equity, fixed income and tax-exempt investing. Visit BlackRock online at http://www.blackrock.com for more information.
Account Information
Call us at (800) 441-7762 from 8:00 AM to 6:00 PM EST on any business day to get information about your account balances, recent transactions and share prices. You can also reach us on the Web at http:// www.blackrock.com/funds.
Automatic Investment Plans
Investor Class shareholders who want to invest regularly can arrange to have $50 or more automatically deducted from their checking or savings account and invested in any of the BlackRock funds.
Systematic Withdrawal Plan
Investor Class shareholders can establish a systematic withdrawal plan and receive periodic payments of $50 or more from their BlackRock funds, as long as their account balance is at least $10,000.
Retirement Plans
Shareholders may make investments in conjunction with Traditional, Rollover, Roth, Coverdell, Simple IRAs, SEP IRAs and 403(b) Plans.
| | | | | | |
| 36 | | BLACKROCK VALUE OPPORTUNITIES FUND, INC. | | SEPTEMBER 30, 2014 | | |
| | |
| Additional Information (concluded) | | |
|
| BlackRock Privacy Principles |
BlackRock is committed to maintaining the privacy of its current and former fund investors and individual clients (collectively, “Clients”) and to safeguarding their non-public personal information. The following information is provided to help you understand what personal information BlackRock collects, how we protect that information and why in certain cases we share such information with select parties.
If you are located in a jurisdiction where specific laws, rules or regulations require BlackRock to provide you with additional or different privacy-related rights beyond what is set forth below, then BlackRock will comply with those specific laws, rules or regulations.
BlackRock obtains or verifies personal non-public information from and about you from different sources, including the following: (i) information we receive from you or, if applicable, your financial intermediary, on applications, forms or other documents; (ii) information about your transactions with us, our affiliates, or others; (iii) information we receive from a consumer reporting agency; and (iv) from visits to our websites.
BlackRock does not sell or disclose to non-affiliated third parties any non-public personal information about its Clients, except as permitted by law or as is necessary to respond to regulatory requests or to service Client accounts. These non-affiliated third parties are required to protect the confidentiality and security of this information and to use it only for its intended purpose.
We may share information with our affiliates to service your account or to provide you with information about other BlackRock products or services that may be of interest to you. In addition, BlackRock restricts access to non-public personal information about its Clients to those BlackRock employees with a legitimate business need for the information. BlackRock maintains physical, electronic and procedural safeguards that are designed to protect the non-public personal information of its Clients, including procedures relating to the proper storage and disposal of such information.
| | | | | | |
| | | BLACKROCK VALUE OPPORTUNITIES FUND, INC. | | SEPTEMBER 30, 2014 | | 37 |
| | |
This report is transmitted to shareholders only. It is not authorized for use as an offer of sale or a solicitation of an offer to buy shares of a Fund unless accompanied or preceded by that Fund’s current prospectus. Past performance results shown in this report should not be considered a representation of future performance. Investment returns and principal value of shares will fluctuate so that shares, when redeemed, may be worth more or less than their original cost. Statements and other information herein are as dated and are subject to change. | | 
|
| | |
VO-9/14-SAR | | 
|
| | |
| |
| Item 2 – | | Code of Ethics – Not Applicable to this semi-annual report |
| |
| Item 3 – | | Audit Committee Financial Expert – Not Applicable to this semi-annual report |
| |
| Item 4 – | | Principal Accountant Fees and Services – Not Applicable to this semi-annual report |
| |
| Item 5 – | | Audit Committee of Listed Registrants – Not Applicable |
| |
| Item 6 – | | Investments |
| | (a) The registrants’ Schedules of Investments are included as part of the Report to Stockholders filed under Item 1 of this Form. |
| | (b) Not Applicable due to no such divestments during the semi-annual period covered since the previous Form N-CSR filing. |
| |
| Item 7 – | | Disclosure of Proxy Voting Policies and Procedures for Closed-End Management Investment Companies – Not Applicable |
| |
| Item 8 – | | Portfolio Managers of Closed-End Management Investment Companies – Not Applicable |
| |
| Item 9 – | | Purchases of Equity Securities by Closed-End Management Investment Company and Affiliated Purchasers – Not Applicable |
| |
| Item 10 – | | Submission of Matters to a Vote of Security Holders – There have been no material changes to these procedures. |
| |
| Item 11 – | | Controls and Procedures |
| |
| | (a) – The registrants’ principal executive and principal financial officers, or persons performing similar functions, have concluded that the registrants’ disclosure controls and procedures (as defined in Rule 30a-3(c) under the Investment Company Act of 1940, as amended (the “1940 Act”)) are effective as of a date within 90 days of the filing of this report based on the evaluation of these controls and procedures required by Rule 30a-3(b) under the 1940 Act and Rule 15d-15(b) under the Securities Exchange Act of 1934, as amended. |
| |
| | (b) – There were no changes in the registrants’ internal control over financial reporting (as defined in Rule 30a-3(d) under the 1940 Act) that occurred during the second fiscal quarter of the period covered by this report that have materially affected, or are reasonably likely to materially affect, the registrants’ internal control over financial reporting. |
| |
| Item 12 – | | Exhibits attached hereto |
| |
| | (a)(1) – Code of Ethics – Not Applicable to this semi-annual report |
| |
| | (a)(2) – Certifications – Attached hereto |
| |
| | (a)(3) – Not Applicable |
| |
| | (b) – Certifications – Attached hereto |
2
Pursuant to the requirements of the Securities Exchange Act of 1934 and the Investment Company Act of 1940, each registrant has duly caused this report to be signed on its behalf by the undersigned, thereunto duly authorized.
BlackRock Value Opportunities Fund, Inc. and Master Value Opportunities LLC
| | |
| By: | | /s/ John M. Perlowski |
| | John M. Perlowski |
| | Chief Executive Officer (principal executive officer) of |
| | BlackRock Value Opportunities Fund, Inc. and Master Value Opportunities LLC |
|
| Date: December 2, 2014 |
Pursuant to the requirements of the Securities Exchange Act of 1934 and the Investment Company Act of 1940, this report has been signed below by the following persons on behalf of each registrant and in the capacities and on the dates indicated.
| | |
| By: | | /s/ John M. Perlowski |
| | John M. Perlowski |
| | Chief Executive Officer (principal executive officer) of |
| | BlackRock Value Opportunities Fund, Inc. and Master Value Opportunities LLC |
|
| Date: December 2, 2014 |
| |
| By: | | /s/ Neal J. Andrews |
| | Neal J. Andrews |
| | Chief Financial Officer (principal financial officer) of |
| | BlackRock Value Opportunities Fund, Inc. and Master Value Opportunities LLC |
|
| Date: December 2, 2014 |
3