UNITED STATES
SECURITIES AND EXCHANGE COMMISSION
Washington, D.C. 20549
FORM N-CSR
CERTIFIED SHAREHOLDER REPORT OF REGISTERED MANAGEMENT INVESTMENT COMPANIES
Investment Company Act file number: 811-02809 and 811-10095
Name of Fund: BlackRock Value Opportunities Fund, Inc. and Master Value Opportunities LLC
Fund Address: 100 Bellevue Parkway, Wilmington, DE 19809
Name and address of agent for service: John M. Perlowski, Chief Executive Officer, BlackRock Value
Opportunities Fund, Inc. and Master Value Opportunities LLC, 55 East 52nd Street, New York, NY 10055
Registrants’ telephone number, including area code: (800) 441-7762
Date of fiscal year end: 03/31/2017
Date of reporting period: 09/30/2016
| | |
| Item 1 – | | Report to Stockholders |
SEPTEMBER 30, 2016
| | | | |
SEMI-ANNUAL REPORT (UNAUDITED) | | | | BLACKROCK® |
BlackRock Value Opportunities Fund, Inc.
| | |
| Not FDIC Insured ◾ May Lose Value ◾ No Bank Guarantee | | |
| | | | | | |
| | | 
| | Shareholders can sign up for e-mail notifications of quarterly statements, annual and semi-annual shareholder reports and prospectuses by enrolling in the electronic delivery program. Electronic copies of shareholder reports and prospectuses are also available on BlackRock’s website. TO ENROLL IN ELECTRONIC DELIVERY: Shareholders Who Hold Accounts with Investment Advisors, Banks or Brokerages: Please contact your financial advisor. Please note that not all investment advisors, banks or brokerages may offer this service. Shareholders Who Hold Accounts Directly with BlackRock: 1. Access the BlackRock website at blackrock.com 2. Select “Access Your Account” 3. Next, select “eDelivery” in the “Related Resources” box and follow the sign-up instructions | | |
| | | | | | |
| 2 | | BLACKROCK VALUE OPPORTUNITIES FUND, INC. | | SEPTEMBER 30, 2016 | | |
Dear Shareholder,
Most asset classes produced strong returns over the past year, particularly risk assets such as equities and high yield bonds. Central bank policy decisions continued to provide support to financial markets, while changing economic outlooks and geopolitical risks have been major drivers of investor sentiment.
The Federal Reserve (the “Fed”) has long been in the spotlight, particularly leading up to the decision to end its near-zero interest rate policy at the end of 2015, and after, as investors remained focused on the anticipated pace of future rate hikes. With the European Central Bank and the Bank of Japan having moved into stimulus mode, the divergence in global monetary policies drove heightened market volatility heading into 2016 and caused the U.S. dollar to strengthen considerably. The year had a rough start as the strong dollar challenged U.S. companies that generate revenues overseas, and pressured emerging market currencies and commodities prices. Low and volatile oil prices and signs of slowing growth in China were also meaningful factors behind the decline in risk assets early in the year. However, as the first quarter wore on, these pressures abated and a more tempered outlook for U.S. rate hikes helped financial markets rebound.
Volatility spiked in late June when the United Kingdom shocked investors with its vote to leave the European Union. Uncertainty around how the British exit might affect the global economy and political landscape drove investors to high-quality assets, pushing already low global yields to even lower levels. However, risk assets recovered swiftly in July as economic data suggested that the consequences had thus far been contained to the United Kingdom.
With a number of factors holding global interest rates down — central bank accommodation, an aging population, and weak productivity growth — assets offering decent yield have become increasingly scarce. As a result, income-seeking investors have stretched into riskier assets despite high valuations in many sectors. History implies that high valuations and low growth results in lower returns for risk assets. Still, perceived safe havens have their own risks, and investors are wise to carefully assess risk and potential reward.
At BlackRock, we believe investors need to think globally, extend their scope across a broad array of asset classes and be prepared to adjust accordingly as market conditions change over time. We encourage you to talk with your financial advisor and visit blackrock.com for further insight about investing in today’s markets.
Sincerely,

Rob Kapito
President, BlackRock Advisors, LLC

Rob Kapito
President, BlackRock Advisors, LLC
| | | | |
| Total Returns as of September 30, 2016 |
| | | 6-month | | 12-month |
U.S. large cap equities
(S&P 500® Index) | | 6.40% | | 15.43% |
U.S. small cap equities
(Russell 2000® Index) | | 13.18 | | 15.47 |
International equities
(MSCI Europe, Australasia,
Far East Index) | | 4.88 | | 6.52 |
Emerging market
equities (MSCI Emerging
Markets Index) | | 9.75 | | 16.78 |
3-month Treasury bills
(BofA Merrill Lynch
3-Month U.S. Treasury
Bill Index) | | 0.17 | | 0.27 |
U.S. Treasury securities
(BofA Merrill Lynch
10-Year U.S. Treasury Index) | | 2.25 | | 5.59 |
U.S. investment-grade
bonds (Bloomberg Barclays
U.S. Aggregate Bond Index) | | 2.68 | | 5.19 |
Tax-exempt municipal
bonds (S&P Municipal
Bond Index) | | 2.53 | | 5.84 |
U.S. high yield bonds
(Bloomberg Barclays U.S.
Corporate High Yield 2%
Issuer Capped Index) | | 11.38 | | 12.14 |
|
| Past performance is no guarantee of future results. Index performance is shown for illustrative purposes only. You cannot invest directly in an index. |
| | | | | | |
| | | THIS PAGE NOT PART OF YOUR FUND REPORT | | | | 3 |
| | | | |
| Fund Summary as of September 30, 2016 | | | BlackRock Value Opportunities Fund, Inc. | |
BlackRock Value Opportunities Fund, Inc.’s (the “Fund”) investment objective is to seek long term growth of capital by investing in a diversified portfolio of securities, primarily common stock, of relatively small companies that management of the Fund believes have special investment value and emerging growth companies regardless of size.
|
| Portfolio Management Commentary |
How did the Fund perform?
| • | | For the six-month period ended September 30, 2016, the Fund’s Institutional, Investor A, Investor C and Class R Shares, through their investment in Master Value Opportunities LLC (the “Master LLC”), outperformed their benchmark, the S&P SmallCap 600® Value Index, while the Fund’s Investor B Shares performed in line. |
What factors influenced performance?
| • | | The largest positive contribution came from the Master LLC’s stock selection in the energy sector, which was positive in both the energy equipment & services and oil, gas, & consumable fuels industries. Stock selection in the financials sector also contributed to performance, financials sector, particularly in the banking, and thrifts & mortgage finance industries. Selection in the consumer discretionary sector, especially within the media industry, and healthcare, which was strongest in the healthcare equipment & supplies group, also aided results. Stock selection in the consumer discretionary sector contributed positively, as well. The Master LLC’s zero weighting in the underperforming telecommunications services sector further supported performance. |
| • | | Stock selection within consumer staples, which was weakest in the food & staples retailing industry, was the most significant detractor from performance, followed by stock selection in information technology (IT). The |
| | | real estate sector — which was split off from financials in August — also detracted, as weaker returns for equity real estate investment trusts (“REITs”) weighed on results in the final month of the period. A small overweight in utilities was an additional drag to relative performance. |
Describe recent portfolio activity.
| • | | The Master LLC reduced its overweight position in IT, primarily through a decreased weighting in the semiconductors & semiconductor equipment industry. The Master LLC also reduced the extent of its underweight in the consumer discretionary sector, mostly due to increased weights in the textiles & apparel and hotels, restaurants & leisure industries. The Master LLC actively added to the energy sector, particularly in the energy equipment & services industry. Its overweight in health care and underweight positions in industrials and telecommunications services stayed relatively consistent through the period. |
Describe portfolio positioning at period end.
| • | | Relative to the S&P SmallCap 600® Value Index, the Master LLC held its largest overweight positions in health care, energy, IT and utilities. Its largest underweight positions were in the industrials, materials, telecommunications services, REITs, consumer staples, consumer discretionary and financials sectors. |
The views expressed reflect the opinions of BlackRock as of the date of this report and are subject to change based on changes in market, economic or other conditions. These views are not intended to be a forecast of future events and are no guarantee of future results.
| | | | | | |
| 4 | | BLACKROCK VALUE OPPORTUNITIES FUND, INC. | | SEPTEMBER 30, 2016 | | |
| | | | |
| | | | BlackRock Value Opportunities Fund, Inc. | |
|
| Total Return Based on a $10,000 Investment |
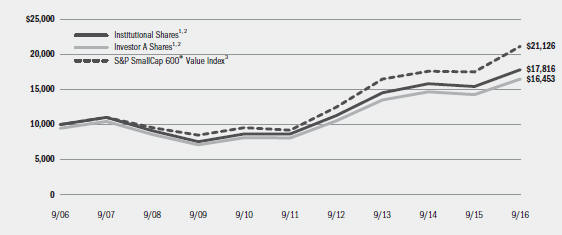
| | 1 | Assuming maximum sales charges, if any, transaction costs and other operating expenses, including administration fees. Institutional Shares do not have a sales charge. |
| | 2 | The Fund invests all of its assets in the Master LLC. The Master LLC invests primarily in common stock of small companies and emerging growth companies that the Master LLC’s management believes have special investment value. |
| | 3 | An unmanaged index that is a subset of the S&P 600® Index that consists of those stocks in the S&P 600® Index exhibiting the strongest value characteristics. |
| | | | | | | | | | | | | | | | | | | | | | | | | | | | |
| Performance Summary for the Period Ended September 30, 2016 | |
| | | | | | Average Annual Total Returns4 | |
| | | | | | 1 Year | | | 5 Years | | | 10 Years | |
| | | 6-Month
Total Returns | | | w/o sales
charge | | | w/ sales
charge | | | w/o sales
charge | | | w/ sales
charge | | | w/o sales
charge | | | w/ sales
charge | |
Institutional | | | 11.78 | % | | | 15.79 | % | | | N/A | | | | 15.51 | % | | | N/A | | | | 5.95 | % | | | N/A | |
Investor A | | | 11.66 | | | | 15.57 | | | | 9.50 | % | | | 15.23 | | | | 13.99 | % | | | 5.67 | | | | 5.11 | % |
Investor B | | | 10.86 | | | | 14.27 | | | | 9.77 | | | | 14.03 | | | | 13.79 | | | | 4.85 | | | | 4.85 | |
Investor C | | | 11.15 | | | | 14.56 | | | | 13.56 | | | | 14.23 | | | | 14.23 | | | | 4.71 | | | | 4.71 | |
Class R | | | 11.47 | | | | 15.27 | | | | N/A | | | | 14.88 | | | | N/A | | | | 5.31 | | | | N/A | |
S&P SmallCap 600® Value Index | | | 10.88 | | | | 20.94 | | | | N/A | | | | 18.09 | | | | N/A | | | | 7.77 | | | | N/A | |
| | 4 | | Assuming maximum sales charges, if any. Average annual total returns with and without sales charges reflect reductions for distribution and service fees. See “About Fund Performance” on page 6 for a detailed description of share classes, including any related sales charges and fees. |
| | | | N/A—Not applicable as share class and index do not have a sales charge. |
| | | | Past performance is not indicative of future results. |
| | | | Performance results may include adjustments made for financial reporting purposes in accordance with U.S. generally accepted accounting principles. |
| | | | | | | | | | | | | | | | | | | | | | | | | | | | |
| Expense Example | |
| | | Actual | | | Hypothetical6 | | | | |
| | | Beginning
Account Value
April 1, 2016 | | | Ending
Account Value
September 30, 2016 | | | Expenses Paid
During the Period5 | | | Beginning
Account Value
April 1, 2016 | | | Ending
Account Value
September 30, 2016 | | | Expenses Paid
During the Period5 | | | Annualized
Expense Ratio | |
Institutional | | | $1,000.00 | | | | $1,117.80 | | | | $ 5.10 | | | | $1,000.00 | | | | $1,020.26 | | | | $ 4.86 | | | | 0.96 | % |
Investor A | | | $1,000.00 | | | | $1,116.60 | | | | $ 6.63 | | | | $1,000.00 | | | | $1,018.80 | | | | $ 6.33 | | | | 1.25 | % |
Investor B | | | $1,000.00 | | | | $1,108.60 | | | | $13.80 | | | | $1,000.00 | | | | $1,011.98 | | | | $13.16 | | | | 2.61 | % |
Investor C | | | $1,000.00 | | | | $1,111.50 | | | | $11.06 | | | | $1,000.00 | | | | $1,014.59 | | | | $10.56 | | | | 2.09 | % |
Class R | | | $1,000.00 | | | | $1,114.70 | | | | $ 8.22 | | | | $1,000.00 | | | | $1,017.30 | | | | $ 7.84 | | | | 1.55 | % |
| | 5 | | For each class of the Fund, expenses are equal to the annualized expense ratio for the class, multiplied by the average account value over the period, multiplied by 183/366 (to reflect the one-half year period shown). Because the Fund invests significantly in the Master LLC, the expense table reflects the net expenses of both the Fund and the Master LLC in which it invests. |
| | 6 | | Hypothetical 5% annual return before expenses is calculated by prorating the number of days in the most recent fiscal half year divided by 366. |
| | | | See “Disclosure of Expenses” on page 6 for further information on how expenses were calculated. |
| | | | | | |
| | | BLACKROCK VALUE OPPORTUNITIES FUND, INC. | | SEPTEMBER 30, 2016 | | 5 |
| • | | Institutional Shares are not subject to any sales charge. These shares bear no ongoing distribution or service fees and are available only to certain eligible investors. |
| • | | Investor A Shares are subject to a maximum initial sales charge (front-end load) of 5.25% and a service fee of 0.25% per year (but no distribution fee). Certain redemptions of these shares may be subject to a contingent deferred sales charge (“CDSC”) where no initial sales charge was paid at the time of purchase. These shares are generally available through financial intermediaries. |
| • | | Investor B Shares are subject to a maximum CDSC of 4.50%, declining to 0% after six years. In addition, these shares are subject to a distribution fee of 0.75% per year and a service fee of 0.25% per year. These shares automatically convert to Investor A Shares after approximately eight years. (There is no initial sales charge for automatic share conversions.) All returns for periods greater than eight years reflect this conversion. These shares are only available through exchanges and distribution reinvestments by current holders and for purchase by certain employer-sponsored retirement plans. |
| • | | Investor C Shares are subject to a 1.00% CDSC if redeemed within one year of purchase. In addition, these shares are subject to a distribution fee of 0.75% per year and a service fee of 0.25% per year. These shares are generally available through financial intermediaries. |
| • | | Class R Shares are not subject to any sales charge. These shares are subject to a distribution fee of 0.25% per year and a service fee of 0.25% per year. These shares are available only to certain employer-sponsored retirement plans. |
Performance information reflects past performance and does not guarantee future results. Current performance may be lower or higher than the performance data quoted. Refer to www.blackrock.com/funds to obtain performance data current to the most recent month end. Performance results do not reflect the deduction of taxes that a shareholder would pay on fund distributions or the redemption of fund shares. Figures shown in the performance tables on the previous page assume reinvestment of all distributions, if any, at net asset value (“NAV”) on the ex-dividend date. Investment return and principal value of shares will fluctuate so that shares, when redeemed, may be worth more or less than their original cost. Distributions paid to each class of shares will vary because of the different levels of service, distribution and transfer agency fees applicable to each class, which are deducted from the income available to be paid to shareholders.
Shareholders of the Fund may incur the following charges: (a) transactional expenses, such as sales charges; and (b) operating expenses, including administration fees, service and distribution fees, including 12b-1 fees, acquired fund fees and expenses, and other fund expenses. The expense example shown on the previous page (which is based on a hypothetical investment of $1,000 invested on April 1, 2016 and held through September 30, 2016) is intended to assist shareholders both in calculating expenses based on an investment in the Fund and in comparing these expenses with similar costs of investing in other mutual funds.
The expense example provides information about actual account values and actual expenses. In order to estimate the expenses a shareholder paid during the period covered by this report, shareholders can divide their account value by $1,000 and then multiply the result by the number corresponding to their share class under the heading entitled “Expenses Paid During the Period.”
The expense example also provides information about hypothetical account values and hypothetical expenses based on the Fund’s actual expense ratio and an assumed rate of return of 5% per year before expenses. In order to assist shareholders in comparing the ongoing expenses of investing in the Fund and other funds, compare the 5% hypothetical example with the 5% hypothetical example that appear in shareholder reports of other funds.
The expenses shown in the expense example are intended to highlight shareholders’ ongoing costs only and do not reflect any transactional expenses, such as sales charges, if any. Therefore, the hypothetical example is useful in comparing ongoing expenses only, and will not help shareholders determine the relative total expenses of owning different funds. If these transactional expenses were included, shareholder expenses would have been higher.
| | | | | | |
| 6 | | BLACKROCK VALUE OPPORTUNITIES FUND, INC. | | SEPTEMBER 30, 2016 | | |
| | | | |
| Statement of Assets and Liabilities | | | BlackRock Value Opportunities Fund, Inc. | |
| | | | |
| September 30, 2016 (Unaudited) | | | |
| | | | |
| Assets | | | | |
Investments at value — Master LLC (cost — $622,794,829) | | $ | 717,592,913 | |
Receivables: | | | | |
Capital shares sold | | | 358,036 | |
Withdrawals from the Master LLC | | | 1,884,941 | |
Prepaid expenses | | | 65,077 | |
| | | | |
Total assets | | | 719,900,967 | |
| | | | |
| | | | |
| Liabilities | | | | |
Payables: | | | | |
Administration fees | | | 147,450 | |
Capital shares redeemed | | | 2,242,977 | |
Officer’s fees | | | 1,244 | |
Other accrued expenses | | | 79,477 | |
Other affiliates | | | 9,499 | |
Service and distribution fees | | | 205,640 | |
Transfer agent fees | | | 410,490 | |
| | | | |
Total liabilities | | | 3,096,777 | |
| | | | |
Net Assets | | $ | 716,804,190 | |
| | | | |
| | | | |
| Net Assets Consist of | | | | |
Paid-in capital | | $ | 601,588,961 | |
Accumulated net investment loss | | | (1,887,903 | ) |
Accumulated net realized gain allocated from the Master LLC | | | 22,305,048 | |
Net unrealized appreciation (depreciation) allocated from the Master LLC | | | 94,798,084 | |
| | | | |
Net Assets | | $ | 716,804,190 | |
| | | | |
| | | | |
| Net Asset Value | | | | |
Institutional — Based on net assets of $148,187,386 and 4,511,933 shares outstanding, 100 million shares authorized, $0.10 par value | | $ | 32.84 | |
| | | | |
Investor A — Based on net assets of $408,981,298 and 12,830,715 shares outstanding, 100 million shares authorized, $0.10 par value | | $ | 31.88 | |
| | | | |
Investor B — Based on net assets of $252,276 and 9,691 shares outstanding, 100 million shares authorized, $0.10 par value | | $ | 26.03 | |
| | | | |
Investor C — Based on net assets of $135,295,549 and 5,583,385 shares outstanding, 100 million shares authorized, $0.10 par value | | $ | 24.23 | |
| | | | |
Class R — Based on net assets of $24,087,681 and 914,533 shares outstanding, 100 million shares authorized, $0.10 par value | | $ | 26.34 | |
| | | | |
See Notes to Financial Statements.
| | | | | | |
| | | BLACKROCK VALUE OPPORTUNITIES FUND, INC. | | SEPTEMBER 30, 2016 | | 7 |
| | | | |
| Statement of Operations | | | BlackRock Value Opportunities Fund, Inc. | |
| | | | |
| Six Months Ended September 30, 2016 (Unaudited) | | | |
| | | | |
| Investment Income | | | | |
Net investment income allocated from the Master LLC: | | | | |
Dividends — unaffiliated | | $ | 4,230,035 | |
Securities lending — affiliated — net | | | 107,650 | |
Dividends — affiliated | | | 3,411 | |
Foreign taxes withheld | | | (9,010 | ) |
Expenses | | | (1,918,801 | ) |
Fees waived | | | 816 | |
| | | | |
Total income | | | 2,414,101 | |
| | | | |
| | | | |
| Fund Expenses | | | | |
Service and distribution — class specific | | | 1,240,844 | |
Administration | | | 878,951 | |
Transfer agent — class specific | | | 649,541 | |
Registration | | | 37,347 | |
Professional | | | 27,449 | |
Printing | | | 23,680 | |
Officer | | | 353 | |
Miscellaneous | | | 10,200 | |
| | | | |
Total expenses | | | 2,868,365 | |
| | | | |
Net investment loss | | | (454,264 | ) |
| | | | |
| | | | |
| Realized and Unrealized Gain (Loss) Allocated from the Master LLC | | | | |
Net realized gain from investments — unaffiliated | | | 51,144,009 | |
Net change in unrealized appreciation (depreciation) on investments and foreign currency translations | | | 26,155,511 | |
| | | | |
Total realized and unrealized gain | | | 77,299,520 | |
| | | | |
Net Increase in Net Assets Resulting from Operations | | $ | 76,845,256 | |
| | | | |
See Notes to Financial Statements.
| | | | | | |
| 8 | | BLACKROCK VALUE OPPORTUNITIES FUND, INC. | | SEPTEMBER 30, 2016 | | |
| | | | |
| Statements of Changes in Net Assets | | | BlackRock Value Opportunities Fund, Inc. | |
| | | | | | | | |
| Increase (Decrease) in Net Assets: | | Six Months Ended
September 30, 2016
(Unaudited) | | | Year Ended
March 31, 2016 | |
| | | | | | | | |
| Operations | | | | | | | | |
Net investment loss | | $ | (454,264 | ) | | $ | (1,544,932 | ) |
Net realized gain | | | 51,144,009 | | | | 15,212,003 | |
Net change in unrealized appreciation (depreciation) | | | 26,155,511 | | | | (82,984,949 | ) |
| | | | |
Net increase (decrease) in net assets resulting from operations | | | 76,845,256 | | | | (69,317,878 | ) |
| | | | |
| | | | | | | | |
| Distributions to Shareholders: | | | | | | | | |
From net investment income: | | | | | | | | |
Institutional | | | — | | | | (4,401,963 | ) |
Investor A | | | — | | | | (12,130,638 | ) |
Investor C | | | — | | | | (4,442,235 | ) |
Class R | | | — | | | | (789,491 | ) |
| | | | |
Decrease in net assets from distributions to shareholders | | | — | | | | (21,764,327 | ) |
| | | | |
| | | | | | | | |
| Capital Share Transactions | | | | | | | | |
Net decrease in net assets derived from capital share transactions | | | (47,853,235 | ) | | | (59,204,122 | ) |
| | | | |
| | | | | | | | |
| Net Assets | | | | | | | | |
Total increase (decrease) in net assets | | | 28,992,021 | | | | (150,286,327 | ) |
Beginning of period | | | 687,812,169 | | | | 838,098,496 | |
| | | | |
End of period | | $ | 716,804,190 | | | $ | 687,812,169 | |
| | | | |
Accumulated net investment loss, end of period | | $ | (1,887,903 | ) | | $ | (1,433,639 | ) |
| | | | |
See Notes to Financial Statements.
| | | | | | |
| | | BLACKROCK VALUE OPPORTUNITIES FUND, INC. | | SEPTEMBER 30, 2016 | | 9 |
| | | | |
| Financial Highlights | | | BlackRock Value Opportunities Fund, Inc. | |
| | | | | | | | | | | | | | | | | | | | | | | | |
| | | Institutional | |
| | | Six Months
Ended
September 30,
2016 (Unaudited) | | | Year Ended March 31, | |
| | | | 2016 | | | 2015 | | | 2014 | | | 2013 | | | 2012 | |
| | | | | | | | | | | | | | | | | | | | | | | | |
| Per Share Operating Performance | | | | | | | | | | | | | | | | | | | | | | | | |
Net asset value, beginning of period | | $ | 29.38 | | | $ | 33.01 | | | $ | 31.51 | | | $ | 24.44 | | | $ | 21.52 | | | $ | 21.36 | |
| | | | |
Net investment income1 | | | 0.04 | | | | 0.04 | | | | 0.09 | | | | 0.08 | | | | 0.08 | | | | 0.04 | |
Net realized and unrealized gain (loss) | | | 3.42 | | | | (2.72 | ) | | | 1.41 | | | | 6.99 | | | | 2.84 | | | | 0.12 | |
| | | | |
Net increase (decrease) from investment operations | | | 3.46 | | | | (2.68 | ) | | | 1.50 | | | | 7.07 | | | | 2.92 | | | | 0.16 | |
| | | | |
Distributions from net investment income2 | | | — | | | | (0.95 | ) | | | — | | | | — | | | | — | | | | — | |
| | | | |
Net asset value, end of period | | $ | 32.84 | | | $ | 29.38 | | | $ | 33.01 | | | $ | 31.51 | | | $ | 24.44 | | | $ | 21.52 | |
| | | | |
| | | | | | | | | | | | | | | | | | | | | | | | |
| Total Return3 | | | | | | | | | | | | | | | | | | | | | | | | |
Based on net asset value | | | 11.78 | %4 | | | (8.11 | )% | | | 4.76 | % | | | 28.93 | % | | | 13.57 | % | | | 0.75 | % |
| | | | |
| | | | | | | | | | | | | | | | | | | | | | | | |
| Ratios to Average Net Assets5,6 | | | | | | | | | | | | | | | | | | | | | | | | |
Total expenses | | | 0.96 | %7 | | | 1.08 | % | | | 1.00 | % | | | 0.97 | % | | | 0.99 | % | | | 1.00 | % |
| | | | |
Net investment income | | | 0.27 | %7 | | | 0.12 | % | | | 0.30 | % | | | 0.30 | % | | | 0.37 | % | | | 0.19 | % |
| | | | |
| | | | | | | | | | | | | | | | | | | | | | | | |
| Supplemental Data | | | | | | | | | | | | | | | | | | | | | | | | |
Net assets, end of period (000) | | $ | 148,187 | | | $ | 135,744 | | | $ | 166,487 | | | $ | 308,697 | | | $ | 280,316 | | | $ | 249,012 | |
| | | | |
Portfolio turnover rate of the Master LLC | | | 32 | % | | | 71 | % | | | 55 | % | | | 61 | % | | | 51 | % | | | 45 | % |
| | | | |
| | 1 | | Based on average shares outstanding. |
| | 2 | | Distributions for annual periods determined in accordance with federal income tax regulations. |
| | 3 | | Where applicable, assumes the reinvestment of distributions. |
| | 4 | | Aggregate total return. |
| | 5 | | Includes the Fund’s share of the Master LLC’s allocated fees waived of less than 0.005%. |
| | 6 | | Includes the Fund’s share of the Master LLC’s allocated net expenses and/or net investment income. |
See Notes to Financial Statements.
| | | | | | |
| 10 | | BLACKROCK VALUE OPPORTUNITIES FUND, INC. | | SEPTEMBER 30, 2016 | | |
| | | | |
| Financial Highlights (continued) | | | BlackRock Value Opportunities Fund, Inc. | |
| | | | | | | | | | | | | | | | | | | | | | | | |
| | | Investor A | |
| | | Six Months
Ended
September 30,
2016 (Unaudited) | | | Year Ended March 31, | |
| | | | 2016 | | | 2015 | | | 2014 | | | 2013 | | | 2012 | |
| | | | | | | | | | | | | | | | | | | | | | | | |
| Per Share Operating Performance | | | | | | | | | | | | | | | | | | | | | | | | |
Net asset value, beginning of period | | $ | 28.55 | | | $ | 32.09 | | | $ | 30.70 | | | $ | 23.88 | | | $ | 21.08 | | | $ | 20.99 | |
| | | | |
Net investment income (loss)1 | | | (0.00 | )2 | | | (0.02 | ) | | | 0.00 | 3 | | | 0.00 | 3 | | | 0.02 | | | | (0.03 | ) |
Net realized and unrealized gain (loss) | | | 3.33 | | | | (2.64 | ) | | | 1.39 | | | | 6.82 | | | | 2.78 | | | | 0.12 | |
| | | | |
Net increase (decrease) from investment operations | | | 3.33 | | | | (2.66 | ) | | | 1.39 | | | | 6.82 | | | | 2.80 | | | | 0.09 | |
| | | | |
Distributions from net investment income4 | | | — | | | | (0.88 | ) | | | — | | | | — | | | | — | | | | — | |
| | | | |
Net asset value, end of period | | $ | 31.88 | | | $ | 28.55 | | | $ | 32.09 | | | $ | 30.70 | | | $ | 23.88 | | | $ | 21.08 | |
| | | | |
| | | | | | | | | | | | | | | | | | | | | | | | |
| Total Return5 | | | | | | | | | | | | | | | | | | | | | | | | |
Based on net asset value | | | 11.66 | %6 | | | (8.28 | )% | | | 4.53 | % | | | 28.56 | % | | | 13.28 | % | | | 0.43 | % |
| | | | |
| | | | | | | | | | | | | | | | | | | | | | | | |
| Ratios to Average Net Assets7,8 | | | | | | | | | | | | | | | | | | | | | | | | |
Total expenses | | | 1.25 | %9 | | | 1.26 | % | | | 1.24 | % | | | 1.25 | % | | | 1.26 | % | | | 1.30 | % |
| | | | |
Net investment income (loss) | | | (0.01 | )%9 | | | (0.06 | )% | | | 0.00 | %10 | | | 0.01 | % | | | 0.09 | % | | | (0.14 | )% |
| | | | |
| | | | | | | | | | | | | | | | | | | | | | | | |
| Supplemental Data | | | | | | | | | | | | | | | | | | | | | | | | |
Net assets, end of period (000) | | $ | 408,981 | | | $ | 392,584 | | | $ | 458,593 | | | $ | 479,719 | | | $ | 416,998 | | | $ | 397,591 | |
| | | | |
Portfolio turnover rate of the Master LLC | | | 32 | % | | | 71 | % | | | 55 | % | | | 61 | % | | | 51 | % | | | 45 | % |
| | | | |
| | 1 | | Based on average shares outstanding. |
| | 2 | | Amount is greater than $(0.005) per share. |
| | 3 | | Amount is less than $0.005 per share. |
| | 4 | | Distributions for annual periods determined in accordance with federal income tax regulations. |
| | 5 | | Where applicable, excludes the effects of any sales charges and assumes the reinvestment of distributions. |
| | 6 | | Aggregate total return. |
| | 7 | | Includes the Fund’s share of the Master LLC’s allocated fees waived of less than 0.005%. |
| | 8 | | Includes the Fund’s share of the Master LLC’s allocated net expenses and/or net investment income. |
| | 10 | | Amount is less than 0.005%. |
See Notes to Financial Statements.
| | | | | | |
| | | BLACKROCK VALUE OPPORTUNITIES FUND, INC. | | SEPTEMBER 30, 2016 | | 11 |
| | | | |
| Financial Highlights (continued) | | | BlackRock Value Opportunities Fund, Inc. | |
| | | | | | | | | | | | | | | | | | | | | | | | |
| | | Investor B | |
| | | Six Months
Ended
September 30,
2016 (Unaudited) | | | Year Ended March 31, | |
| | | | 2016 | | | 2015 | | | 2014 | | | 2013 | | | 2012 | |
| | | | | | | | | | | | | | | | | | | | | | | | |
| Per Share Operating Performance | | | | | | | | | | | | | | | | | | | | | | | | |
Net asset value, beginning of period | | $ | 23.48 | | | $ | 25.85 | | | $ | 24.96 | | | $ | 19.63 | | | $ | 17.50 | | | $ | 17.61 | |
| | | | |
Net investment loss1 | | | (0.17 | ) | | | (0.33 | ) | | | (0.22 | ) | | | (0.24 | ) | | | (0.15 | ) | | | (0.18 | ) |
Net realized and unrealized gain (loss) | | | 2.72 | | | | (2.04 | ) | | | 1.11 | | | | 5.57 | | | | 2.28 | | | | 0.07 | |
| | | | |
Net increase (decrease) from investment operations | | | 2.55 | | | | (2.37 | ) | | | 0.89 | | | | 5.33 | | | | 2.13 | | | | (0.11 | ) |
| | | | |
Net asset value, end of period | | $ | 26.03 | | | $ | 23.48 | | | $ | 25.85 | | | $ | 24.96 | | | $ | 19.63 | | | $ | 17.50 | |
| | | | |
| | | | | | | | | | | | | | | | | | | | | | | | |
| Total Return2 | | | | | | | | | | | | | | | | | | | | | | | | |
Based on net asset value | | | 10.86 | %3 | | | (9.17 | )% | | | 3.57 | % | | | 27.15 | % | | | 12.17 | % | | | (0.62 | )% |
| | | | |
| | | | | | | | | | | | | | | | | | | | | | | | |
| Ratios to Average Net Assets4,5 | | | | | | | | | | | | | | | | | | | | | | | | |
Total expenses | | | 2.61 | %6 | | | 2.31 | % | | | 2.18 | % | | | 2.37 | % | | | 2.24 | % | | | 2.30 | % |
| | | | |
Net investment loss | | | (1.39 | )%6 | | | (1.34 | )% | | | (0.90 | )% | | | (1.09 | )% | | | (0.90 | )% | | | (1.14 | )% |
| | | | |
| | | | | | | | | | | | | | | | | | | | | | | | |
| Supplemental Data | | | | | | | | | | | | | | | | | | | | | | | | |
Net assets, end of period (000) | | $ | 252 | | | $ | 381 | | | $ | 6,716 | | | $ | 10,655 | | | $ | 22,579 | | | $ | 54,590 | |
| | | | |
Portfolio turnover rate of the Master LLC | | | 32 | % | | | 71 | % | | | 55 | % | | | 61 | % | | | 51 | % | | | 45 | % |
| | | | |
| | 1 | | Based on average shares outstanding. |
| | 2 | | Where applicable, excludes the effects of any sales charges and assumes the reinvestment of distributions. |
| | 3 | | Aggregate total return. |
| | 4 | | Includes the Fund’s share of the Master LLC’s allocated fees waived of less than 0.005%. |
| | 5 | | Includes the Fund’s share of the Master LLC’s allocated net expenses and/or net investment income. |
See Notes to Financial Statements.
| | | | | | |
| 12 | | BLACKROCK VALUE OPPORTUNITIES FUND, INC. | | SEPTEMBER 30, 2016 | | |
| | | | |
| Financial Highlights (continued) | | | BlackRock Value Opportunities Fund, Inc. | |
| | | | | | | | | | | | | | | | | | | | | | | | |
| | | Investor C | |
| | | Six Months
Ended
September 30,
2016 (Unaudited) | | | Year Ended March 31, | |
| | | | 2016 | | | 2015 | | | 2014 | | | 2013 | | | 2012 | |
| | | | | | | | | | | | | | | | | | | | | | | | |
| Per Share Operating Performance | | | | | | | | | | | | | | | | | | | | | | | | |
Net asset value, beginning of period | | $ | 21.80 | | | $ | 24.72 | | | $ | 23.85 | | | $ | 18.71 | | | $ | 16.67 | | | $ | 16.76 | |
| | | | |
Net investment loss1 | | | (0.10 | ) | | | (0.20 | ) | | | (0.20 | ) | | | (0.18 | ) | | | (0.13 | ) | | | (0.17 | ) |
Net realized and unrealized gain (loss) | | | 2.53 | | | | (2.03 | ) | | | 1.07 | | | | 5.32 | | | | 2.17 | | | | 0.08 | |
| | | | |
Net increase (decrease) from investment operations | | | 2.43 | | | | (2.23 | ) | | | 0.87 | | | | 5.14 | | | | 2.04 | | | | (0.09 | ) |
| | | | |
Distributions from net investment income2 | | | — | | | | (0.69 | ) | | | — | | | | — | | | | — | | | | — | |
| | | | |
Net asset value, end of period | | $ | 24.23 | | | $ | 21.80 | | | $ | 24.72 | | | $ | 23.85 | | | $ | 18.71 | | | $ | 16.67 | |
| | | | |
| | | | | | | | | | | | | | | | | | | | | | | | |
| Total Return3 | | | | | | | | | | | | | | | | | | | | | | | | |
Based on net asset value | | | 11.15 | %4 | | | (9.02 | )% | | | 3.65 | % | | | 27.47 | % | | | 12.24 | % | | | (0.54 | )% |
| | | | |
| | | | | | | | | | | | | | | | | | | | | | | | |
| Ratios to Average Net Assets5 | | | | | | | | | | | | | | | | | | | | | | | | |
Total expenses | | | 2.09 | %6,7 | | | 2.09 | %6 | | | 2.08 | % | | | 2.11 | %6 | | | 2.17 | %6 | | | 2.25 | %6 |
| | | | |
Total expenses after fees waived | | | 2.09 | %6,7 | | | 2.09 | %6 | | | 2.07 | % | | | 2.11 | %6 | | | 2.17 | %6 | | | 2.25 | %6 |
| | | | |
Net investment loss | | | (0.86 | )%6,7 | | | (0.89 | )%6 | | | (0.83 | )% | | | (0.84 | )%6 | | | (0.82 | )%6 | | | (1.09 | )%6 |
| | | | |
| | | | | | | | | | | | | | | | | | | | | | | | |
| Supplemental Data | | | | | | | | | | | | | | | | | | | | | | | | |
Net assets, end of period (000) | | $ | 135,296 | | | $ | 136,066 | | | $ | 180,679 | | | $ | 200,245 | | | $ | 176,629 | | | $ | 190,059 | |
| | | | |
Portfolio turnover rate of the Master LLC | | | 32 | % | | | 71 | % | | | 55 | % | | | 61 | % | | | 51 | % | | | 45 | % |
| | | | |
| | 1 | | Based on average shares outstanding. |
| | 2 | | Distributions for annual periods determined in accordance with federal income tax regulations. |
| | 3 | | Where applicable, excludes the effects of any sales charges and assumes the reinvestment of distributions. |
| | 4 | | Aggregate total return. |
| | 5 | | Includes the Fund’s share of the Master LLC’s allocated net expenses and/or net investment income. |
| | 6 | | Includes the Fund’s share of the Master LLC’s allocated fees waived of less than 0.005%. |
See Notes to Financial Statements.
| | | | | | |
| | | BLACKROCK VALUE OPPORTUNITIES FUND, INC. | | SEPTEMBER 30, 2016 | | 13 |
| | | | |
| Financial Highlights (concluded) | | | BlackRock Value Opportunities Fund, Inc. | |
| | | | | | | | | | | | | | | | | | | | | | | | |
| | | Class R | |
| | | Six Months
Ended
September 30,
2016 (Unaudited) | | | Year Ended March 31, | |
| | | | 2016 | | | 2015 | | | 2014 | | | 2013 | | | 2012 | |
| | | | | | | | | | | | | | | | | | | | | | | | |
| Per Share Operating Performance | | | | | | | | | | | | | | | | | | | | | | | | |
Net asset value, beginning of period | | $ | 23.63 | | | $ | 26.74 | | | $ | 25.66 | | | $ | 20.02 | | | $ | 17.73 | | | $ | 17.72 | |
| | | | |
Net investment loss1 | | | (0.04 | ) | | | (0.08 | ) | | | (0.09 | ) | | | (0.06 | ) | | | (0.04 | ) | | | (0.08 | ) |
Net realized and unrealized gain (loss) | | | 2.75 | | | | (2.20 | ) | | | 1.17 | | | | 5.70 | | | | 2.33 | | | | 0.09 | |
| | | | |
Net increase (decrease) from investment operations | | | 2.71 | | | | (2.28 | ) | | | 1.08 | | | | 5.64 | | | | 2.29 | | | | 0.01 | |
| | | | |
Distributions from net investment income2 | | | — | | | | (0.83 | ) | | | — | | | | — | | | | — | | | | — | |
| | | | |
Net asset value, end of period | | $ | 26.34 | | | $ | 23.63 | | | $ | 26.74 | | | $ | 25.66 | | | $ | 20.02 | | | $ | 17.73 | |
| | | | |
| | | | | | | | | | | | | | | | | | | | | | | | |
| Total Return3 | | | | | | | | | | | | | | | | | | | | | | | | |
Based on net asset value | | | 11.47 | %4 | | | (8.50 | )% | | | 4.21 | % | | | 28.17 | % | | | 12.92 | % | | | 0.06 | % |
| | | | |
| | | | | | | | | | | | | | | | | | | | | | | | |
| Ratios to Average Net Assets5,6 | | | | | | | | | | | | | | | | | | | | | | | | |
Total expenses | | | 1.55 | %7 | | | 1.51 | % | | | 1.59 | % | | | 1.54 | % | | | 1.59 | % | | | 1.65 | % |
| | | | |
Net investment loss | | | (0.31 | )%7 | | | (0.31 | )% | | | (0.34 | )% | | | (0.27 | )% | | | (0.23 | )% | | | (0.50 | )% |
| | | | |
| | | | | | | | | | | | | | | | | | | | | | | | |
| Supplemental Data | | | | | | | | | | | | | | | | | | | | | | | | |
Net assets, end of period (000) | | $ | 24,088 | | | $ | 23,037 | | | $ | 25,624 | | | $ | 28,444 | | | $ | 27,877 | | | $ | 30,620 | |
| | | | |
Portfolio turnover rate of the Master LLC | | | 32 | % | | | 71 | % | | | 55 | % | | | 61 | % | | | 51 | % | | | 45 | % |
| | | | |
| | 1 | | Based on average shares outstanding. |
| | 2 | | Distributions for annual periods determined in accordance with federal income tax regulations. |
| | 3 | | Where applicable, assumes the reinvestment of distributions. |
| | 4 | | Aggregate total return. |
| | 5 | | Includes the Fund’s share of the Master LLC’s allocated fees waived of less than 0.005%. |
| | 6 | | Includes the Fund’s share of the Master LLC’s allocated net expenses and/or net investment income. |
See Notes to Financial Statements.
| | | | | | |
| 14 | | BLACKROCK VALUE OPPORTUNITIES FUND, INC. | | SEPTEMBER 30, 2016 | | |
| | | | |
| Notes to Financial Statements (Unaudited) | | | BlackRock Value Opportunities Fund, Inc. | |
1. Organization:
BlackRock Value Opportunities Fund, Inc. (the “Fund”) is registered under the Investment Company Act of 1940, as amended (the “1940 Act”). The Fund is registered as a diversified, open-end management investment company. The Fund is organized as a Maryland corporation. The Fund seeks to achieve its investment objective by investing all of its assets in Master Value Opportunities LLC (the “Master LLC”), an affiliate of the Fund, which has the same investment objective and strategies as the Fund. The value of the Fund’s investment in the Master LLC reflects the Fund’s proportionate interest in the net assets of the Master LLC. The performance of the Fund is directly affected by the performance of the Master LLC. At September 30, 2016, the percentage of the Master LLC owned by the Fund was 100%. The financial statements of the Master LLC, including the Schedule of Investments, are included elsewhere in this report and should be read in conjunction with the Fund’s financial statements.
The Fund offers multiple classes of shares. All classes of shares have identical voting, dividend, liquidation and other rights and are subject to the same terms and conditions, except that certain classes bear expenses related to the shareholder servicing and distribution of such shares. Institutional Shares are sold only to certain eligible investors. Investor B Shares are only available through exchanges and distribution reinvestments by current holders and for purchase by certain employer-sponsored retirement plans. Investor A and Investor C Shares are generally available through financial intermediaries. Class R Shares are available only to certain employer-sponsored retirement plans. Each class has exclusive voting rights with respect to matters relating to its shareholder servicing and distribution expenditures (except that Investor B shareholders may vote on material changes to the Investor A distribution and service plan).
| | | | | | |
| Share Class | | Initial Sales
Charge | | CDSC | | Conversion Privilege |
Institutional and Class R Shares | | No | | No | | None |
Investor A Shares | | Yes | | No1 | | None |
Investor B Shares | | No | | Yes | | To Investor A Shares after approximately 8 years |
Investor C Shares | | No | | Yes | | None |
| | 1 | | Investor A Shares may be subject to a contingent deferred sales charge (“CDSC”) for certain redemptions where no initial sales charge was paid at the time of purchase. |
2. Significant Accounting Policies:
The financial statements are prepared in conformity with accounting principles generally accepted in the United States of America (“U.S. GAAP”), which may require management to make estimates and assumptions that affect the reported amounts of assets and liabilities in the financial statements, disclosure of contingent assets and liabilities at the date of the financial statements and the reported amounts of increases and decreases in net assets from operations during the reporting period. Actual results could differ from those estimates. The Fund is considered an investment company under U.S. GAAP and follows the accounting and reporting guidance applicable to investment companies. Below is a summary of significant accounting policies:
Investment Transactions and Investment Income: For financial reporting purposes, contributions to and withdrawals from the Master LLC are accounted on a trade date basis. The Fund records its proportionate share of the Master LLC’s income, expenses and realized and unrealized gains and losses on a daily basis. Realized and unrealized gains and losses are adjusted utilizing partnership tax allocation rules. In addition, the Fund accrues its own expenses. Income, expenses and realized and unrealized gains and losses are allocated daily to each class based on its relative net assets.
Distributions: Distributions paid by the Fund are recorded on the ex-dividend date. The character and timing of distributions are determined in accordance with federal income tax regulations, which may differ from U.S. GAAP.
Indemnifications: In the normal course of business, the Fund enters into contracts that contain a variety of representations that provide general indemnification. The Fund’s maximum exposure under these arrangements is unknown because it involves future potential claims against the Fund, which cannot be predicted with any certainty.
Other: Expenses directly related to the Fund or its classes are charged to the Fund or the applicable class. Other operating expenses shared by several funds, including other funds managed by the Manager, are prorated among those funds on the basis of relative net assets or other appropriate methods. Expenses directly related to the Fund and other shared expenses prorated to the Fund are allocated daily to each class based on its relative net assets or other appropriate methods.
3. Investment Valuation and Fair Value Measurements:
The Fund’s policy is to value its financial instruments at fair value. The Fund records its investment in the Master LLC at fair value based on the Fund’s proportionate interest in the net assets of the Master LLC. Valuation of securities held by the Master LLC is discussed in Note 3 of the Master LLC’s Notes to Financial Statements, which are included elsewhere in this report.
| | | | | | |
| | | BLACKROCK VALUE OPPORTUNITIES FUND, INC. | | SEPTEMBER 30, 2016 | | 15 |
| | | | |
| Notes to Financial Statements (continued) | | | BlackRock Value Opportunities Fund, Inc. | |
4. Administration Agreement and Other Transactions with Affiliates:
The PNC Financial Services Group, Inc. is the largest stockholder and an affiliate of BlackRock, Inc. (“BlackRock”), for 1940 Act purposes.
Administration: The Fund entered into an Administration Agreement with BlackRock Advisors, LLC (the “Administrator”), an indirect, wholly-owned subsidiary of BlackRock, to provide administrative services (other than investment advice and related portfolio activities). For such services, the Fund pays the Administrator a monthly fee at an annual rate of 0.25% of the average daily net asset of the Fund. The Fund does not pay an investment advisory fee or investment management fee.
Service and Distribution Fees: The Fund, entered into a Distribution Agreement and a Distribution and Service Plan with BlackRock Investments, LLC (“BRIL”), an affiliate of the Administrator. Pursuant to the Distribution and Service Plan and in accordance with Rule 12b-1 under the 1940 Act, the Fund pays BRIL ongoing service and distribution fees. The fees are accrued daily and paid monthly at annual rates based upon the average daily net assets of the relevant share class of the Fund as follows:
| | | | | | | | |
| | | Investor A | | Investor B | | Investor C | | Class R |
Service Fee | | 0.25% | | 0.25% | | 0.25% | | 0.25% |
Distribution Fee | | — | | 0.75% | | 0.75% | | 0.25% |
BRIL and broker-dealers, pursuant to sub-agreements with BRIL, provide shareholder servicing and distribution services to the Fund. The ongoing service and/or distribution fee compensates BRIL and each broker-dealer for providing shareholder servicing and/or distribution related services to the shareholders.
For the six months ended September 30, 2016, the following table shows the class specific service and distribution fees borne directly by each share class of the Fund:
| | | | | | | | |
| Investor A | | Investor B | | Investor C | | Class R | | Total |
| $501,878 | | $1,473 | | $678,151 | | $59,342 | | $1,240,844 |
Transfer Agent: Pursuant to written agreements, certain financial intermediaries, some of which may be affiliates, provide the Fund with sub-accounting, recordkeeping, sub-transfer agency and other administrative services with respect to sub-accounts they service. For these services, these entities receive an asset-based fee or an annual fee per shareholder account, which will vary depending on share class and/or net assets. For the six months ended September 30, 2016, the Fund paid the following amounts to affiliates of BlackRock in return for these services, which are included in transfer agent — class specific in the Statement of Operations:
The Administrator maintains a call center, that is responsible for providing certain shareholder services to the Fund. Shareholder services include responding to inquiries and processing subscriptions and redemptions based upon instructions from shareholders. For the six months ended September 30, 2016, the Fund reimbursed the Administrator the following amounts for costs incurred in running the call center, which are included in transfer agent — class specific in the Statement of Operations:
| | | | | | | | | | |
| Institutional | | Investor A | | Investor B | | Investor C | | Class R | | Total |
| $2,831 | | $2,491 | | $56 | | $681 | | $104 | | $6,163 |
For the six months ended September 30, 2016, the following table shows the class specific transfer agent fees borne directly by each class of the Fund:
| | | | | | | | | | |
| Institutional | | Investor A | | Investor B | | Investor C | | Class R | | Total |
| $97,237 | | $347,156 | | $1,147 | | $177,567 | | $26,434 | | $649,541 |
For the six months ended September 30, 2016, affiliates earned underwriting discounts, direct commissions and dealer concessions on sales of the Fund’s Investor A Shares, which totaled $2,359.
| | | | | | |
| 16 | | BLACKROCK VALUE OPPORTUNITIES FUND, INC. | | SEPTEMBER 30, 2016 | | |
| | | | |
| Notes to Financial Statements (continued) | | | BlackRock Value Opportunities Fund, Inc. | |
For the six months ended September 30, 2016, affiliates received CDSCs as follows:
| | | | |
Investor A | | $ | 247 | |
Investor C | | $ | 1,026 | |
Officers and Directors: Certain officers and/or directors of the Fund are officers and/or directors of BlackRock or its affiliates. The Fund reimburses the Administrator for a portion of the compensation paid to the Fund’s Chief Compliance Officer, which is included in Officer in the Statement of Operations.
5. Income Tax Information:
It is the Fund’s policy to comply with the requirements of the Internal Revenue Code of 1986, as amended, applicable to regulated investment companies, and to distribute substantially all of its taxable income to its shareholders. Therefore, no federal income tax provision is required.
The Fund files U.S. federal and various state and local tax returns. No income tax returns are currently under examination. The statute of limitations on the Fund’s U.S. federal tax returns generally remains open for each of the four years ended March 31, 2016. The statutes of limitations on the Fund’s state and local tax returns may remain open for an additional year depending upon the jurisdiction.
Management has analyzed tax laws and regulations and their application to the Fund as of September 30, 2016, inclusive of open tax return years, and does not believe there are any uncertain tax positions that require recognition of a tax liability in the Fund’s financial statements.
U.S. GAAP requires that certain components of net assets be adjusted to reflect permanent differences between financial and tax reporting. These reclassifications have no effect on net assets or net asset values per share. As of period end, the following permanent differences attributable to a net operating loss, distributions paid in excess of taxable income, income recognized from real estate investment trusts and basis difference on securities received from master were reclassified to the following accounts:
As of March 31, 2016, the Fund had a capital loss carryforward available to offset future realized capital gains of $1,388,244, all of which is due to expire March 31, 2018.
| | | | | | |
| | | BLACKROCK VALUE OPPORTUNITIES FUND, INC. | | SEPTEMBER 30, 2016 | | 17 |
| | | | |
| Notes to Financial Statements (concluded) | | | BlackRock Value Opportunities Fund, Inc. | |
6. Capital Share Transactions:
Transactions in capital shares for each class were as follows:
| | | | | | | | | | | | | | | | | | | | |
| | | Six Months Ended
September 30, 2016 | | | | | | Year Ended
March 31, 2016 | |
| | | Shares | | | Amount | | | | | | Shares | | | Amount | |
Institutional | | | | | | | | | | | | | | | | | | | | |
Shares sold | | | 302,851 | | | $ | 9,357,483 | | | | | | | | 517,523 | | | $ | 15,802,512 | |
Shares issued in reinvestment of distributions | | | — | | | | — | | | | | | | | 124,807 | | | | 3,645,605 | |
Shares redeemed | | | (411,005 | ) | | | (12,754,415 | ) | | | | | | | (1,065,824 | ) | | | (32,800,608 | ) |
| | | | | | | | | | | | |
Net decrease | | | (108,154 | ) | | $ | (3,396,932 | ) | | | | | | | (423,494 | ) | | $ | (13,352,491 | ) |
| | | | | | | | | | | | |
| | | | | | | | | | | | | | | | | | | | |
Investor A | | | | | | | | | | | | | | | | | | | | |
Shares sold and automatic conversion of shares | | | 617,289 | | | $ | 18,519,266 | | | | | | | | 1,810,934 | | | $ | 54,626,237 | |
Shares issued in reinvestment of distributions | | | — | | | | — | | | | | | | | 404,303 | | | | 11,482,185 | |
Shares redeemed | | | (1,535,630 | ) | | | (46,222,633 | ) | | | | | | | (2,755,931 | ) | | | (81,745,302 | ) |
| | | | | | | | | | | | |
Net decrease | | | (918,341 | ) | | $ | (27,703,367 | ) | | | | | | | (540,694 | ) | | $ | (15,636,880 | ) |
| | | | | | | | | | | | |
| | | | | | | | | | | | | | | | | | | | |
Investor B | | | | | | | | | | | | | | | | | | | | |
Shares sold | | | 193 | | | $ | 5,000 | | | | | | | | 2,549 | | | $ | 66,385 | |
Shares redeemed and automatic conversion of shares | | | (6,717 | ) | | | (161,626 | ) | | | | | | | (246,088 | ) | | | (6,273,405 | ) |
| | | | | | | | | | | | |
Net decrease | | | (6,524 | ) | | $ | (156,626 | ) | | | | | | | (243,539 | ) | | $ | (6,207,020 | ) |
| | | | | | | | | | | | |
| | | | | | | | | | | | | | | | | | | | |
Investor C | | | | | | | | | | | | | | | | | | | | |
Shares sold | | | 155,224 | | | $ | 3,536,440 | | | | | | | | 505,714 | | | $ | 11,552,926 | |
Shares issued in reinvestment of distributions | | | — | | | | — | | | | | | | | 186,654 | | | | 4,057,860 | |
Shares redeemed | | | (813,677 | ) | | | (18,590,419 | ) | | | | | | | (1,758,720 | ) | | | (39,936,156 | ) |
| | | | | | | | | | | | |
Net decrease | | | (658,453 | ) | | $ | (15,053,979 | ) | | | | | | | (1,066,352 | ) | | $ | (24,325,370 | ) |
| | | | | | | | | | | | |
| | | | | | | | | | | | | | | | | | | | |
Class R | | | | | | | | | | | | | | | | | | | | |
Shares sold | | | 134,130 | | | $ | 3,286,402 | | | | | | | | 306,533 | | | $ | 7,440,199 | |
Shares issued in reinvestment of distributions | | | — | | | | — | | | | | | | | 33,541 | | | | 788,881 | |
Shares redeemed | | | (194,551 | ) | | | (4,828,733 | ) | | | | | | | (323,434 | ) | | | (7,911,441 | ) |
| | | | | | | | | | | | |
Net increase (decrease) | | | (60,421 | ) | | $ | (1,542,331 | ) | | | | | | | 16,640 | | | $ | 317,639 | |
| | | | | | | | | | | | |
Total Net Decrease | | | (1,751,893 | ) | | $ | (47,853,235 | ) | | | | | | | (2,257,439 | ) | | $ | (59,204,122 | ) |
| | | | | | | | | | | | |
7. Subsequent Events:
Management has evaluated the impact of all subsequent events on the Fund through the date the financial statements were issued and has determined that there were no subsequent events requiring adjustment or additional disclosure in the financial statements.
| | | | | | |
| 18 | | BLACKROCK VALUE OPPORTUNITIES FUND, INC. | | SEPTEMBER 30, 2016 | | |
| | | | |
| Master LLC Portfolio Information | | | Master Value Opportunities LLC | |
| | | | | |
| Ten Largest Holdings | | Percent of
Net Assets |
Pennsylvania Real Estate Investment Trust | | 2% |
CACI International, Inc., Class A | | 2 |
Merit Medical Systems, Inc. | | 2 |
Landauer, Inc. | | 2 |
UMB Financial Corp. | | 2 |
OraSure Technologies, Inc. | | 1 |
Cable One, Inc. | | 1 |
PH Glatfelter Co. | | 1 |
Haynes International, Inc. | | 1 |
Newpark Resources, Inc. | | 1 |
| | | | | |
| Sector Allocation | | Percent of
Net Assets |
Industrials | | 17% |
Information Technology | | 17 |
Financials | | 15 |
Consumer Discretionary | | 15 |
Health Care | | 9 |
Materials | | 7 |
Energy | | 6 |
Real Estate | | 6 |
Utilities | | 5 |
Consumer Staples | | 2 |
Short-Term Securities | | 7 |
Liabilities in Excess of Other Assets | | (6) |
For Master LLC compliance purposes, the Master LLC’s sector classifications refer to one or more of the sector sub-classifications used by one or more widely recognized market indexes or ratings group indexes, and/or as defined by the investment adviser. These definitions may not apply for purposes of this report, which may combine sector sub-classifications for reporting ease.
| | | | | | |
| | | BLACKROCK VALUE OPPORTUNITIES FUND, INC. | | SEPTEMBER 30, 2016 | | 19 |
| | | | |
| Schedule of Investments September 30, 2016 (Unaudited) | | | Master Value Opportunities LLC | |
| | | (Percentages shown are based on Net Assets) | |
| | | | | | | | |
| Common Stocks | | Shares | | | Value | |
Aerospace & Defense — 3.0% | | | | | | | | |
Aerojet Rocketdyne Holdings, Inc. (a)(b) | | | 328,800 | | | $ | 5,780,304 | |
Cubic Corp. | | | 173,200 | | | | 8,107,492 | |
KLX, Inc. (a) | | | 130,800 | | | | 4,604,160 | |
Triumph Group, Inc. | | | 119,630 | | | | 3,335,284 | |
| | | | | | | | |
| | | | | | | | 21,827,240 | |
Air Freight & Logistics — 1.8% | | | | | | | | |
Forward Air Corp. | | | 108,500 | | | | 4,693,710 | |
Hub Group, Inc., Class A (a) | | | 208,775 | | | | 8,509,669 | |
| | | | | | | | |
| | | | | | | | 13,203,379 | |
Auto Components — 0.5% | | | | | | | | |
Dorman Products, Inc. (a) | | | 55,405 | | | | 3,540,379 | |
Banks — 8.3% | | | | | | | | |
CenterState Banks, Inc. | | | 313,300 | | | | 5,554,809 | |
Green Bancorp, Inc. (a) | | | 404,201 | | | | 4,417,917 | |
IBERIABANK Corp. | | | 77,200 | | | | 5,181,664 | |
NBT Bancorp, Inc. | | | 216,900 | | | | 7,129,503 | |
OFG Bancorp | | | 549,400 | | | | 5,554,434 | |
Opus Bank | | | 176,113 | | | | 6,229,117 | |
Texas Capital Bancshares, Inc. (a) | | | 115,700 | | | | 6,354,244 | |
TriState Capital Holdings, Inc. (a)(b) | | | 536,590 | | | | 8,665,929 | |
UMB Financial Corp. (b) | | | 172,300 | | | | 10,243,235 | |
| | | | | | | | |
| | | | | | | | 59,330,852 | |
Beverages — 0.6% | | | | | | | | |
Cott Corp. | | | 319,308 | | | | 4,550,139 | |
Biotechnology — 0.0% | | | | | | | | |
XOMA Corp. (a) | | | 4,694 | | | | 2,155 | |
Capital Markets — 0.4% | | | | | | | | |
Piper Jaffray Cos. (a) | | | 52,500 | | | | 2,535,750 | |
Chemicals — 1.1% | | | | | | | | |
Kraton Performance Polymers, Inc. (a) | | | 121,095 | | | | 4,243,169 | |
Stepan Co. | | | 54,593 | | | | 3,966,727 | |
| | | | | | | | |
| | | | | | | | 8,209,896 | |
Commercial Services & Supplies — 2.4% | | | | | | | | |
ABM Industries, Inc. | | | 119,577 | | | | 4,747,207 | |
Essendant, Inc. | | | 338,700 | | | | 6,950,124 | |
Matthews International Corp., Class A | | | 94,610 | | | | 5,748,504 | |
| | | | | | | | |
| | | | | | | | 17,445,835 | |
Communications Equipment — 1.8% | | | | | | | | |
Ciena Corp. (a) | | | 263,600 | | | | 5,746,480 | |
NetScout Systems, Inc. (a)(b) | | | 242,600 | | | | 7,096,050 | |
| | | | | | | | |
| | | | | | | | 12,842,530 | |
Construction & Engineering — 1.2% | | | | | | | | |
Aegion Corp. (a) | | | 134,900 | | | | 2,572,543 | |
EMCOR Group, Inc. | | | 36,000 | | | | 2,146,320 | |
KBR, Inc. | | | 235,600 | | | | 3,564,628 | |
| | | | | | | | |
| | | | | | | | 8,283,491 | |
Consumer Finance — 1.2% | | | | | | | | |
EZCORP, Inc., Class A (a) | | | 236,700 | | | | 2,617,902 | |
Firstcash, Inc. | | | 133,000 | | | | 6,261,640 | |
| | | | | | | | |
| | | | | | | | 8,879,542 | |
Electric Utilities — 2.0% | | | | | | | | |
ALLETE, Inc. | | | 142,300 | | | | 8,483,926 | |
| | | | | | | | |
| Common Stocks | | Shares | | | Value | |
Electric Utilities (continued) | | | | | | | | |
El Paso Electric Co. | | | 117,900 | | | $ | 5,514,183 | |
| | | | | | | | |
| | | | | | | | 13,998,109 | |
Electrical Equipment — 0.4% | | | | | | | | |
Generac Holdings, Inc. (a)(b) | | | 78,400 | | | | 2,845,920 | |
Electronic Equipment, Instruments & Components — 2.1% | |
Anixter International, Inc. (a) | | | 42,200 | | | | 2,721,900 | |
FARO Technologies, Inc. (a) | | | 96,300 | | | | 3,461,985 | |
InvenSense, Inc. (a)(b) | | | 279,700 | | | | 2,075,374 | |
MTS Systems Corp. | | | 109,500 | | | | 5,040,285 | |
Sanmina Corp. (a) | | | 69,200 | | | | 1,970,124 | |
| | | | | | | | |
| | | | | | | | 15,269,668 | |
Energy Equipment & Services — 4.4% | | | | | | | | |
CARBO Ceramics, Inc. | | | 290,000 | | | | 3,172,600 | |
Dril-Quip, Inc. (a) | | | 70,800 | | | | 3,946,392 | |
Newpark Resources, Inc. (a)(b) | | | 1,188,300 | | | | 8,745,888 | |
Patterson-UTI Energy, Inc. | | | 235,000 | | | | 5,256,950 | |
Superior Energy Services, Inc. | | | 387,900 | | | | 6,943,410 | |
U.S. Silica Holdings, Inc. | | | 81,900 | | | | 3,813,264 | |
| | | | | | | | |
| | | | | | | | 31,878,504 | |
Equity Real Estate Investment Trusts (REITs) — 4.9% | | | | | | | | |
Cedar Realty Trust, Inc. | | | 1,115,614 | | | | 8,032,421 | |
LTC Properties, Inc. | | | 156,978 | | | | 8,161,286 | |
Pebblebrook Hotel Trust (b) | | | 232,823 | | | | 6,193,092 | |
Pennsylvania Real Estate Investment Trust (b) | | | 537,847 | | | | 12,386,616 | |
| | | | | | | | |
| | | | | | | | 34,773,415 | |
Food & Staples Retailing — 1.3% | | | | | | | | |
Smart & Final Stores, Inc. (a)(b) | | | 192,700 | | | | 2,460,779 | |
SUPERVALU, Inc. (a) | | | 1,315,340 | | | | 6,563,547 | |
| | | | | | | | |
| | | | | | | | 9,024,326 | |
Food Products — 0.5% | | | | | | | | |
Pinnacle Foods, Inc. | | | 75,202 | | | | 3,772,884 | |
Snyder’s-Lance, Inc. | | | 945 | | | | 31,750 | |
| | | | | | | | |
| | | | | | | | 3,804,634 | |
Gas Utilities — 3.3% | | | | | | | | |
Northwest Natural Gas Co. | | | 96,100 | | | | 5,776,571 | |
South Jersey Industries, Inc. | | | 267,200 | | | | 7,895,760 | |
Southwest Gas Corp. | | | 31,023 | | | | 2,167,267 | |
Spire, Inc. | | | 122,900 | | | | 7,833,646 | |
| | | | | | | | |
| | | | | | | | 23,673,244 | |
Health Care Equipment & Supplies — 3.9% | | | | | | | | |
Invacare Corp. | | | 495,157 | | | | 5,530,904 | |
Merit Medical Systems, Inc. (a) | | | 447,733 | | | | 10,875,435 | |
OraSure Technologies, Inc. (a) | | | 1,219,087 | | | | 9,716,123 | |
Tandem Diabetes Care, Inc. (a) | | | 274,972 | | | | 2,106,285 | |
| | | | | | | | |
| | | | | | | | 28,228,747 | |
Health Care Providers & Services — 3.9% | | | | | | | | |
Landauer, Inc. | | | 235,182 | | | | 10,460,895 | |
LifePoint Hospitals, Inc. (a) | | | 147,118 | | | | 8,713,799 | |
Owens & Minor, Inc. | | | 250,844 | | | | 8,711,812 | |
| | | | | | | | |
| | | | | | | | 27,886,506 | |
Hotels, Restaurants & Leisure — 3.1% | | | | | | | | |
Bloomin’ Brands, Inc. | | | 282,470 | | | | 4,869,783 | |
See Notes to Financial Statements.
| | | | | | |
| 20 | | BLACKROCK VALUE OPPORTUNITIES FUND, INC. | | SEPTEMBER 30, 2016 | | |
| | | | |
| Schedule of Investments (continued) | | | Master Value Opportunities LLC | |
| | | | |
| | | | | | | | |
| Common Stocks | | Shares | | | Value | |
Hotels, Restaurants & Leisure (continued) | | | | | | | | |
Bob Evans Farms, Inc. | | | 182,402 | | | $ | 6,985,997 | |
Interval Leisure Group, Inc. | | | 506,681 | | | | 8,699,713 | |
Papa John’s International, Inc. | | | 21,507 | | | | 1,695,827 | |
| | | | | | | | |
| | | | | | | | 22,251,320 | |
Household Durables — 0.5% | | | | | | | | |
iRobot Corp. (a)(b) | | | 18,800 | | | | 826,824 | |
Taylor Morrison Home Corp., Class A (a)(b) | | | 155,729 | | | | 2,740,830 | |
| | | | | | | | |
| | | | | | | | 3,567,654 | |
Insurance — 2.6% | | | | | | | | |
American Equity Investment Life Holding Co. | | | 200,551 | | | | 3,555,769 | |
Heritage Insurance Holdings, Inc. | | | 268,000 | | | | 3,861,880 | |
ProAssurance Corp. | | | 126,800 | | | | 6,654,464 | |
Selective Insurance Group, Inc. | | | 121,600 | | | | 4,846,976 | |
| | | | | | | | |
| | | | | | | | 18,919,089 | |
Internet & Direct Marketing Retail — 0.6% | | | | | | | | |
1-800-Flowers.com, Inc., Class A (a) | | | 477,752 | | | | 4,380,986 | |
Internet Software & Services — 0.9% | | | | | | | | |
comScore, Inc. (a) | | | 96,600 | | | | 2,961,756 | |
Rackspace Hosting, Inc. (a) | | | 105,100 | | | | 3,330,619 | |
| | | | | | | | |
| | | | | | | | 6,292,375 | |
IT Services — 2.1% | | | | | | | | |
CACI International, Inc., Class A (a) | | | 108,500 | | | | 10,947,650 | |
CSG Systems International, Inc. | | | 96,491 | | | | 3,987,973 | |
| | | | | | | | |
| | | | | | | | 14,935,623 | |
Life Sciences Tools & Services — 1.1% | | | | | | | | |
Albany Molecular Research, Inc. (a) | | | 144,392 | | | | 2,383,912 | |
Pacific Biosciences of California, Inc. (a)(b) | | | 627,946 | | | | 5,626,396 | |
| | | | | | | | |
| | | | | | | | 8,010,308 | |
Machinery — 4.2% | | | | | | | | |
Actuant Corp., Class A | | | 321,600 | | | | 7,473,984 | |
Albany International Corp., Class A | | | 118,300 | | | | 5,013,554 | |
Chart Industries, Inc. (a) | | | 197,246 | | | | 6,475,586 | |
Franklin Electric Co., Inc. | | | 155,500 | | | | 6,330,405 | |
Hillenbrand, Inc. | | | 53,401 | | | | 1,689,608 | |
Joy Global, Inc. | | | 12,900 | | | | 357,846 | |
Kennametal, Inc. | | | 92,200 | | | | 2,675,644 | |
Titan International, Inc. | | | 37,500 | | | | 379,500 | |
| | | | | | | | |
| | | | | | | | 30,396,127 | |
Marine — 0.3% | | | | | | | | |
Scorpio Bulkers, Inc. (a) | | | 717,218 | | | | 2,481,574 | |
Media — 1.4% | | | | | | | | |
Cable One, Inc. | | | 16,619 | | | | 9,705,496 | |
Metals & Mining — 3.3% | | | | | | | | |
AK Steel Holding Corp. (a)(b) | | | 432,600 | | | | 2,089,458 | |
Haynes International, Inc. | | | 240,253 | | | | 8,915,789 | |
Hecla Mining Co. | | | 658,900 | | | | 3,755,730 | |
Materion Corp. | | | 281,786 | | | | 8,653,648 | |
| | | | | | | | |
| | | | | | | | 23,414,625 | |
Multiline Retail — 0.7% | | | | | | | | |
Dillard’s, Inc., Class A | | | 38,700 | | | | 2,438,487 | |
Fred’s, Inc., Class A | | | 280,590 | | | | 2,542,145 | |
| | | | | | | | |
| | | | | | | | 4,980,632 | |
| | | | | | | | |
| Common Stocks | | Shares | | | Value | |
Oil, Gas & Consumable Fuels — 1.9% | | | | | | | | |
Eclipse Resources Corp. (a) | | | 959,100 | | | $ | 3,155,439 | |
Energen Corp. | | | 106,400 | | | | 6,141,408 | |
SM Energy Co. | | | 57,000 | | | | 2,199,060 | |
Whiting Petroleum Corp. (a)(b) | | | 262,200 | | | | 2,291,628 | |
| | | | | | | | |
| | | | | | | | 13,787,535 | |
Paper & Forest Products — 2.1% | | | | | | | | |
Clearwater Paper Corp. (a) | | | 86,500 | | | | 5,593,955 | |
PH Glatfelter Co. | | | 423,200 | | | | 9,174,976 | |
| | | | | | | | |
| | | | | | | | 14,768,931 | |
Pharmaceuticals — 0.5% | | | | | | | | |
Phibro Animal Health Corp., Class A | | | 126,780 | | | | 3,445,880 | |
Professional Services — 1.0% | | | | | | | | |
Huron Consulting Group, Inc. (a) | | | 37,700 | | | | 2,252,952 | |
TriNet Group, Inc. (a) | | | 237,900 | | | | 5,145,777 | |
| | | | | | | | |
| | | | | | | | 7,398,729 | |
Real Estate Management & Development — 1.2% | | | | | | | | |
Marcus & Millichap, Inc. (a) | | | 316,839 | | | | 8,285,340 | |
Road & Rail — 1.3% | | | | | | | | |
ArcBest Corp. | | | 207,793 | | | | 3,952,223 | |
Heartland Express, Inc. | | | 273,700 | | | | 5,167,456 | |
| | | | | | | | |
| | | | | | | | 9,119,679 | |
Semiconductors & Semiconductor Equipment — 5.1% | | | | | | | | |
DSP Group, Inc. (a) | | | 226,086 | | | | 2,715,293 | |
Integrated Device Technology, Inc. (a) | | | 307,200 | | | | 7,096,320 | |
Kulicke & Soffa Industries, Inc. (a) | | | 455,200 | | | | 5,885,736 | |
Microsemi Corp. (a) | | | 109,069 | | | | 4,578,717 | |
Rambus, Inc. (a)(b) | | | 362,300 | | | | 4,528,750 | |
Semtech Corp. (a)(b) | | | 25,835 | | | | 716,405 | |
Ultratech, Inc. (a) | | | 271,100 | | | | 6,256,988 | |
Veeco Instruments, Inc. (a) | | | 236,600 | | | | 4,644,458 | |
| | | | | | | | |
| | | | | | | | 36,422,667 | |
Software — 4.1% | | | | | | | | |
Bottomline Technologies, Inc. (a) | | | 177,900 | | | | 4,146,849 | |
Mentor Graphics Corp. | | | 202,200 | | | | 5,346,168 | |
PTC, Inc. (a) | | | 150,400 | | | | 6,664,224 | |
TiVo Corp. (a)(b) | | | 159,800 | | | | 3,112,904 | |
Verint Systems, Inc. (a) | | | 171,300 | | | | 6,446,019 | |
Zynga, Inc., Class A (a) | | | 1,223,500 | | | | 3,560,385 | |
| | | | | | | | |
| | | | | | | | 29,276,549 | |
Specialty Retail — 4.3% | | | | | | | | |
Abercrombie & Fitch Co., Class A | | | 12,200 | | | | 193,858 | |
Buckle, Inc. | | | 117,400 | | | | 2,821,122 | |
Children’s Place, Inc. | | | 33,744 | | | | 2,695,133 | |
DSW, Inc., Class A | | | 30,382 | | | | 622,223 | |
Express, Inc. (a) | | | 247,900 | | | | 2,922,741 | |
Five Below, Inc. (a)(b) | | | 107,100 | | | | 4,315,059 | |
Genesco, Inc. (a) | | | 10,379 | | | | 565,240 | |
GNC Holdings, Inc., Class A | | | 153,300 | | | | 3,130,386 | |
Hibbett Sports, Inc. (a)(b) | | | 121,600 | | | | 4,851,840 | |
Murphy USA, Inc. (a) | | | 23,655 | | | | 1,688,021 | |
Party City Holdco, Inc. (a)(b) | | | 226,599 | | | | 3,879,375 | |
Penske Automotive Group, Inc. | | | 72,089 | | | | 3,473,248 | |
| | | | | | | | |
| | | | | | | | 31,158,246 | |
See Notes to Financial Statements.
| | | | | | |
| | | BLACKROCK VALUE OPPORTUNITIES FUND, INC. | | SEPTEMBER 30, 2016 | | 21 |
| | | | |
| Schedule of Investments (continued) | | | Master Value Opportunities LLC | |
| | | | |
| | | | | | | | |
| Common Stocks | | Shares | | | Value | |
Technology Hardware, Storage & Peripherals — 0.5% | | | | | | | | |
Diebold, Inc. | | | 140,200 | | | $ | 3,475,558 | |
Textiles, Apparel & Luxury Goods — 3.6% | | | | | | | | |
Deckers Outdoor Corp. (a) | | | 34,104 | | | | 2,030,893 | |
G-III Apparel Group Ltd. (a) | | | 163,184 | | | | 4,756,814 | |
Oxford Industries, Inc. | | | 70,300 | | | | 4,759,310 | |
Perry Ellis International, Inc. (a) | | | 67,200 | | | | 1,295,616 | |
Skechers U.S.A., Inc., Class A (a) | | | 46,700 | | | | 1,069,430 | |
Steven Madden Ltd. (a) | | | 103,200 | | | | 3,566,592 | |
Vera Bradley, Inc. (a) | | | 96,600 | | | | 1,463,490 | |
Wolverine World Wide, Inc. | | | 293,670 | | | | 6,763,220 | |
| | | | | | | | |
| | | | | | | | 25,705,365 | |
Thrifts & Mortgage Finance — 2.5% | | | | | | | | |
Essent Group Ltd. (a) | | | 227,500 | | | | 6,053,775 | |
HomeStreet, Inc. (a) | | | 143,300 | | | | 3,591,098 | |
Northwest Bancshares, Inc. | | | 543,800 | | | | 8,543,098 | |
| | | | | | | | |
| | | | | | | | 18,187,971 | |
Trading Companies & Distributors — 1.4% | | | | | | | | |
Applied Industrial Technologies, Inc. | | | 165,100 | | | | 7,716,774 | |
WESCO International, Inc. (a) | | | 41,100 | | | | 2,527,239 | |
| | | | | | | | |
| | | | | | | | 10,244,013 | |
Total Common Stocks — 99.3% | | | | | | | 712,646,533 | |
| | | | | | | | |
| Warrants | | | | | | |
Biotechnology — 0.0% | | | | | | | | |
XOMA Corp. (Issued/exercisable 3/09/12, 0.50 Share for 1 Warrant, Expires 3/09/17, Strike Price $1.76) | | | 202,350 | | | | — | |
Total Warrants — 0.0% | | | | | | | — | |
Total Long-Term Investments (Cost — $617,848,444) — 99.3% | | | | 712,646,533 | |
| | | | | | | | |
| Short-Term Securities | | Shares | | | Value | |
BlackRock Liquidity Funds, T-Fund, Institutional Class, 0.20% (c)(d) | | | 10,437,889 | | | $ | 10,437,889 | |
| | | Beneficial
Interest
(000) | | | | |
BlackRock Liquidity Series, LLC, Money Market Series, 0.51% (c)(d)(e) | | | $ 36,231 | | | | 36,231,309 | |
Total Short-Term Securities (Cost — $46,669,198) — 6.5% | | | | 46,669,198 | |
Total Investments (Cost — $664,517,642) — 105.8% | | | | 759,315,731 | |
Liabilities in Excess of Other Assets — (5.8)% | | | | (41,722,818 | ) |
| | | | | | | | |
Net Assets — 100.0% | | | | | | $ | 717,592,913 | |
| | | | | | | | |
| | | | | | | | |
|
| Notes to Schedule of Investments |
| (a) | Non-income producing security. |
| (b) | Security, or a portion of security, is on loan. |
| (c) | Current yield as of period end. |
| (d) | During the six months ended September 30, 2016, investments in issuers considered to be affiliates of the Master LLC for purposes of Section 2(a)(3) of the Investment Company Act of 1940, as amended, were as follows: |
| | | | | | | | | | | | | | | | | | | | |
| Affiliate | | Shares/Beneficial
Interest Held at
March 31, 2016 | | | Net Activity | | | Shares/Beneficial
Interest Held at
September 30, 2016 | | | Value at
September 30,
2016 | | | Income | |
BlackRock Liquidity Funds, TempFund, Institutional Class | | | 216,833 | | | | (216,833 | ) | | | — | | | | — | | | $ | 1,569 | |
BlackRock Liquidity Funds, T-Fund, Institutional Class | | | — | | | | 10,437,889 | | | | 10,437,889 | | | | $10,437,889 | | | | 1,842 | |
BlackRock Liquidity Series, LLC, Money Market Series | | | $28,621,890 | | | $ | 7,609,419 | | | | $36,231,309 | | | | 36,231,309 | | | | 107,650 | 1 |
Total | | | | | | | | | | | | | | | $46,669,198 | | | $ | 111,061 | |
| | | | | | | | | | | | | | | | |
| | 1 | | Represents securities lending income earned from the reinvestment of cash collateral from loaned securities, net of fees and collateral investment expenses, and other payments to and from borrowers of securities. |
| (e) | Security was purchased with the cash collateral from loaned securities. The Master LLC may withdraw up to 25% of its investment daily, although the manager of the BlackRock Liquidity Series, LLC, Money Market Series, in its sole discretion, may permit an investor to withdraw more than 25% on any one day. |
See Notes to Financial Statements.
| | | | | | |
| 22 | | BLACKROCK VALUE OPPORTUNITIES FUND, INC. | | SEPTEMBER 30, 2016 | | |
| | | | |
| Schedule of Investments (concluded) | | | Master Value Opportunities LLC | |
| | • | | For Master LLC compliance purposes, the Master LLC’s industry classifications refer to one or more of the industry sub-classifications used by one or more widely recognized market indexes or ratings group indexes, and/or as defined by the investment adviser. These definitions may not apply for purposes of this report, which may combine such industry sub-classifications for reporting ease. |
|
| Fair Value Hierarchy as of Period End |
Various inputs are used in determining the fair value of investments. For information about the Master LLC’s policy regarding valuation of investments, refer to the Notes to Financial Statements.
The following table summarizes the Master LLC’s investments categorized in the disclosure hierarchy:
| | | | | | | | | | | | | | | | |
| | | Level 1 | | | Level 2 | | | Level 3 | | | Total | |
Assets: | | | | | | | | | | | | | | | | |
Investments: | | | | | | | | | | | | | | | | |
Long-Term Investments1: | | | | | | | | | | | | | | | | |
Common Stocks | | $ | 712,646,533 | | | | — | | | | — | | | $ | 712,646,533 | |
Short-Term Securities | | | 10,437,889 | | | $ | 36,231,309 | | | | — | | | | 46,669,198 | |
| | | | |
Total | | $ | 723,084,422 | | | $ | 36,231,309 | | | | — | | | $ | 759,315,731 | |
| | | | |
1 See above Schedule of Investments for values in each industry. | |
|
The Master LLC may hold assets and/or liabilities in which the fair value approximates the carrying amount for financial statement purposes. As of period end, such liabilities are categorized within the disclosure hierarchy as follows: | |
| | | Level 1 | | | Level 2 | | | Level 3 | | | Total | |
Liabilities: | | | | | | | | | | | | | | | | |
Bank overdraft | | | — | | | $ | (290,504 | ) | | | — | | | $ | (290,504 | ) |
Collateral on securities loaned at value | | | — | | | | (36,231,309 | ) | | | — | | | | (36,231,309 | ) |
| | | | |
Total | | | — | | | $ | (36,521,813 | ) | | | — | | | $ | (36,521,813 | ) |
| | | | |
During the six months ended September 30, 2016, there were no transfers between levels.
See Notes to Financial Statements.
| | | | | | |
| | | BLACKROCK VALUE OPPORTUNITIES FUND, INC. | | SEPTEMBER 30, 2016 | | 23 |
| | | | |
| Statement of Assets and Liabilities | | | Master Value Opportunities LLC | |
September 30, 2016 (Unaudited)
| | | | |
| Assets | | | | |
Investments at value — unaffiliated (including securities loaned at value of $35,594,949) (cost — $617,848,444) | | $ | 712,646,533 | |
Investments at value — affiliated (cost $46,669,198) | | | 46,669,198 | |
Receivables: | | | | |
Investments sold | | | 5,663,870 | |
Securities lending income — affiliated | | | 11,823 | |
Dividends — affiliated | | | 1,687 | |
Dividends — unaffiliated | | | 723,228 | |
Prepaid expenses | | | 714 | |
Other assets | | | 101,496 | |
| | | | |
Total assets | | | 765,818,549 | |
| | | | |
| | | | |
| Liabilities | | | | |
Bank overdraft | | | 290,504 | |
Cash collateral on securities loaned at value | | | 36,231,309 | |
Payables: | | | | |
Investments purchased | | | 9,455,128 | |
Directors’ fees | | | 8,516 | |
Investment advisory fees | | | 294,738 | |
Other accrued expenses | | | 54,554 | |
Other affiliates | | | 5,946 | |
Withdrawals to investors | | | 1,884,941 | |
| | | | |
Total liabilities | | | 48,225,636 | |
| | | | |
Net Assets | | $ | 717,592,913 | |
| | | | |
| | | | |
| Net Assets Consist of | | | | |
Investor’s capital | | $ | 622,794,852 | |
Net unrealized appreciation (depreciation) | | | 94,798,061 | |
| | | | |
Net Assets | | $ | 717,592,913 | |
| | | | |
See Notes to Financial Statements.
| | | | | | |
| 24 | | BLACKROCK VALUE OPPORTUNITIES FUND, INC. | | SEPTEMBER 30, 2016 | | |
| | | | |
| Statement of Operations | | | Master Value Opportunities LLC | |
Six Months Ended September 30, 2016 (Unaudited)
| | | | |
| Investment Income | | | | |
Dividends — unaffiliated | | $ | 4,230,035 | |
Securities lending — affiliated — net | | | 107,650 | |
Dividends — affiliated | | | 3,411 | |
Foreign taxes withheld | | | (9,010 | ) |
| | | | |
Total income | | | 4,332,086 | |
| | | | |
| | | | |
| Expenses | | | | |
Investment advisory | | | 1,759,970 | |
Accounting services | | | 72,266 | |
Custodian | | | 30,972 | |
Professional | | | 26,596 | |
Directors | | | 14,946 | |
Printing | | | 2,344 | |
Miscellaneous | | | 11,707 | |
| | | | |
Total expenses | | | 1,918,801 | |
Less fees waived by the Manager | | | (816 | ) |
| | | | |
Total expenses after fees waived | | | 1,917,985 | |
| | | | |
Net investment income | | | 2,414,101 | |
| | | | |
| | | | |
| Realized and Unrealized Gain (Loss) | | | | |
Net realized gain from investments — unaffiliated | | | 51,144,009 | |
| | | | |
Net change in unrealized appreciation (depreciation) on: | | | | |
Investments — unaffiliated | | | 26,155,516 | |
Foreign currency translations | | | (5 | ) |
| | | | |
| | | 26,155,511 | |
| | | | |
Total realized and unrealized gain | | | 77,299,520 | |
| | | | |
Net Increase in Net Assets Resulting from Operations | | $ | 79,713,621 | |
| | | | |
See Notes to Financial Statements.
| | | | | | |
| | | BLACKROCK VALUE OPPORTUNITIES FUND, INC. | | SEPTEMBER 30, 2016 | | 25 |
| | | | |
| Statements of Changes in Net Assets | | | Master Value Opportunities LLC | |
| | | | | | | | |
| Increase (Decrease) in Net Assets: | | Six Months Ended
September 30, 2016
(Unaudited) | | | Year Ended
March 31, 2016 | |
| | | | | | | | |
| Operations | | | | | | | | |
Net investment income | | $ | 2,414,101 | | | $ | 4,823,823 | |
Net realized gain | | | 51,144,009 | | | | 16,715,239 | |
Net change in unrealized appreciation (depreciation) | | | 26,155,511 | | | | (84,488,185 | ) |
| | | | |
Net increase (decrease) in net assets resulting from operations | | | 79,713,621 | | | | (62,949,123 | ) |
| | | | |
| | | | | | | | |
| Capital Transactions | | | | | | | | |
Proceeds from contributions | | | 34,704,591 | | | | 89,475,780 | |
Value of withdrawals | | | (85,458,690 | ) | | | (176,874,866 | ) |
| | | | |
Net decrease in net assets derived from capital transactions | | | (50,754,099 | ) | | | (87,399,086 | ) |
| | | | |
| | | | | | | | |
| Net Assets | | | | | | | | |
Total increase (decrease) in net assets | | | 28,959,522 | | | | (150,348,209 | ) |
Beginning of period | | | 688,633,391 | | | | 838,981,600 | |
| | | | |
End of period | | $ | 717,592,913 | | | $ | 688,633,391 | |
| | | | |
| | | | |
| Financial Highlights | | | Master Value Opportunities LLC | |
| | | | | | | | | | | | | | | | | | | | | | | | |
| | | Six Months Ended September 30, 2016 (Unaudited) | | | Year Ended March 31, | |
| | | | 2016 | | | 2015 | | | 2014 | | | 2013 | | | 2012 | |
| | | | | | | | | | | | | | | | | | | | | | | | |
| Total Return | | | | | | | | | | | | | | | | | | | | | | | | |
Total return | | | 12.00 | %1 | | | (7.59 | )% | | | 5.21 | % | | | 29.39 | % | | | 14.01 | % | | | 1.17 | % |
| | | | |
| | | | | | | | | | | | | | | | | | | | | | | | |
| Ratios to Average Net Assets | | | | | | | | | | | | | | | | | | | | | | | | |
Total expenses | | | 0.55 | %2 | | | 0.55 | % | | | 0.54 | % | | | 0.54 | % | | | 0.55 | % | | | 0.54 | % |
| | | | |
Total expenses after fees waived | | | 0.54 | %2 | | | 0.55 | % | | | 0.54 | % | | | 0.54 | % | | | 0.55 | % | | | 0.54 | % |
| | | | |
Net investment income | | | 0.69 | %2 | | | 0.65 | % | | | 0.72 | % | | | 0.72 | % | | | 0.81 | % | | | 0.62 | % |
| | | | |
| | | | | | | | | | | | | | | | | | | | | | | | |
| Supplemental Data | | | | | | | | | | | | | | | | | | | | | | | | |
Net assets, end of period (000) | | $ | 717,593 | | | $ | 688,633 | | | $ | 838,982 | | | $ | 1,035,066 | | | $ | 930,123 | | | $ | 928,593 | |
| | | | |
Portfolio turnover rate | | | 32 | % | | | 71 | % | | | 55 | % | | | 61 | % | | | 51 | % | | | 45 | % |
| | | | |
| | 1 | | Aggregate total return. |
See Notes to Financial Statements.
| | | | | | |
| 26 | | BLACKROCK VALUE OPPORTUNITIES FUND, INC. | | SEPTEMBER 30, 2016 | | |
| | | | |
| Notes to Financial Statements (Unaudited) | | | Master Value Opportunities LLC | |
1. Organization:
Master Value Opportunities LLC (the “Master LLC”) is registered under the Investment Company Act of 1940, as amended (the “1940 Act”). The Master LLC is registered as a diversified, open-end management investment company. The Master LLC is organized as a Delaware limited liability company. The Limited Liability Company Agreement of the Master LLC permits the Board of Directors of the Master LLC (the “Board”) to issue non-transferable interests in the Master LLC, subject to certain limitations.
The Master LLC, together with certain other registered investment companies advised by BlackRock Advisors, LLC (the “Manager”) or its affiliates, is included in a complex of open-end funds referred to as the Equity-Bond Complex.
2. Significant Accounting Policies:
The financial statements are prepared in conformity with accounting principles generally accepted in the United States of America (“U.S. GAAP”), which may require management to make estimates and assumptions that affect the reported amounts of assets and liabilities in the financial statements, disclosure of contingent assets and liabilities at the date of the financial statements and the reported amounts of increases and decreases in net assets from operations during the reporting period. Actual results could differ from those estimates. The Master LLC is considered an investment company under U.S. GAAP and follows the accounting and reporting guidance applicable to investment companies. Below is a summary of significant accounting policies:
Foreign Currency: The Master LLC’s books and records are maintained in U.S. dollars. Purchases and sales of investments are recorded at the rates of exchange prevailing on the respective dates of such transactions. Generally, when the U.S. dollar rises in value against a foreign currency, the investments denominated in that currency will lose value; the opposite effect occurs if the U.S. dollar falls in relative value.
The Master LLC does not isolate the portion of the results of operations arising as a result of changes in the exchange rates from the changes in the market prices of investments held or sold for financial reporting purposes. Accordingly, the effects of changes in exchange rates on investments are not segregated in the Statement of Operations from the effects of changes in market prices of those investments, but are included as a component of net realized and unrealized gain (loss) from investments. The Master LLC reports realized currency gains (losses) on foreign currency related transactions as components of net realized gain (loss) for financial reporting purposes, whereas such components are generally treated as ordinary income for federal income tax purposes.
Investment Transactions and Investment Income: For financial reporting purposes, investment transactions are recorded on the dates the transactions are entered into (the trade dates). Realized gains and losses on investment transactions are determined on the identified cost basis. Dividend income is recorded on the ex-dividend date. Dividends from foreign securities where the ex-dividend date may have passed are subsequently recorded when the Master LLC is informed of the ex-dividend date. Under the applicable foreign tax laws, a withholding tax at various rates may be imposed on capital gains, dividends and interest. Upon notification from issuers, some of the dividend income received from a real estate investment trust may be redesignated as a reduction of cost of the related investment and/or realized gain.
Indemnifications: In the normal course of business, the Master LLC enters into contracts that contain a variety of representations that provide general indemnification. The Master LLC’s maximum exposure under these arrangements is unknown because it involves future potential claims against the Master LLC, which cannot be predicted with any certainty.
Other: Expenses directly related to the Master LLC are charged to the Master LLC. Other operating expenses shared by several funds, including other funds managed by the Manager, are prorated among those funds on the basis of relative net assets or other appropriate methods.
The Master LLC has an arrangement with its custodian whereby credits are earned on uninvested cash balances, which could be used to reduce custody fees and/or overdraft charges. The Master LLC may incur charges on certain uninvested cash balances and overdrafts, subject to certain conditions.
3. Investment Valuation and Fair Value Measurements:
Investment Valuation Policies: The Master LLC’s investments are valued at fair value (also referred to as “market value” within the financial statements) as of the close of trading on the New York Stock Exchange (“NYSE”) (generally 4:00 p.m., Eastern time). U.S. GAAP defines fair value as the price the Master LLC would receive to sell an asset or pay to transfer a liability in an orderly transaction between market participants at the measurement date. The Master LLC determines the fair value of its financial instruments using various independent dealers or pricing services under policies approved by the Board. The BlackRock Global Valuation Methodologies Committee (the “Global Valuation Committee”) is the committee formed by management to develop global pricing policies and procedures and to oversee the pricing function for all financial instruments.
| | | | | | |
| | | BLACKROCK VALUE OPPORTUNITIES FUND, INC. | | SEPTEMBER 30, 2016 | | 27 |
| | | | |
| Notes to Financial Statements (continued) | | | Master Value Opportunities LLC | |
Fair Value Inputs and Methodologies: The following methods and inputs are used to establish the fair value of the Master LLC’s assets and liabilities:
| | • | | Equity investments traded on a recognized securities exchange are valued at the official closing price each day, if available. For equity investments traded on more than one exchange, the official closing price on the exchange where the stock is primarily traded is used. Equity investments traded on a recognized exchange for which there were no sales on that day may be valued at the last available bid (long positions) or ask (short positions) price. Generally, trading in foreign instruments is substantially completed each day at various times prior to the close of business on the NYSE. Occasionally, events affecting the values of such instruments may occur between the foreign market close and the close of business on the NYSE that may not be reflected in the computation of the Master LLC’s net assets. Each business day, the Master LLC uses a pricing service to assist with the valuation of certain foreign exchange-traded equity securities and foreign exchange-traded and over-the-counter (“OTC”) options (the “Systematic Fair Value Price”). Using current market factors, the Systematic Fair Value Price is designed to value such foreign securities and foreign options at fair value as of the close of business on the NYSE, which follows the close of the local markets. |
| | • | | Investments in open-end U.S. mutual funds are valued at net asset value (“NAV”) each business day. |
| | • | | The Master LLC values its investment in BlackRock Liquidity Series, LLC, Money Market Series (the “Money Market Series”) at fair value, which is ordinarily based upon its pro rata ownership in the underlying fund’s net assets. The Money Market Series seeks current income consistent with maintaining liquidity and preserving capital. Although the Money Market Series is not registered under the 1940 Act, its investments will follow the parameters of investments by a money market fund that is subject to Rule 2a-7 under the 1940 Act. The Master LLC may withdraw up to 25% of its investment daily, although the manager of the Money Market Series, in its sole discretion, may permit an investor to withdraw more than 25% on any one day. |
| | • | | Securities and other assets and liabilities denominated in foreign currencies are translated into U.S. dollars using exchange rates determined as of the close of trading on the NYSE. Forward foreign currency exchange contracts are valued at the mean between the bid and ask prices and are determined as of the close of trading on the NYSE. Interpolated values are derived when the settlement date of the contract is an interim date for which quotations are not available. |
If events (e.g., a company announcement, market volatility or a natural disaster) occur that are expected to materially affect the value of such instruments, or in the event that the application of these methods of valuation results in a price for an investment that is deemed not to be representative of the market value of such investment, or if a price is not available, the investment will be valued by the Global Valuation Committee, or its delegate, in accordance with a policy approved by the Board as reflecting fair value (“Fair Valued Investments”). When determining the price for Fair Valued Investments, the Global Valuation Committee, or its delegate, seeks to determine the price that the Master LLC might reasonably expect to receive or pay from the current sale or purchase of that asset or liability in an arm’s-length transaction. Fair value determinations shall be based upon all available factors that the Global Valuation Committee, or its delegate, deems relevant consistent with the principles of fair value measurement. The pricing of all Fair Valued Investments is subsequently reported to the Board or a committee thereof on a quarterly basis.
Fair Value Hierarchy: Various inputs are used in determining the fair value of investments. These inputs to valuation methodologies are categorized into a fair value hierarchy consisting of three broad levels for financial statement purposes as follows:
| | • | | Level 1 — unadjusted price quotations in active markets/exchanges for identical assets or liabilities that the Master LLC has the ability to access |
| | • | | Level 2 — other observable inputs (including, but not limited to, quoted prices for similar assets or liabilities in markets that are active, quoted prices for identical or similar assets or liabilities in markets that are not active, inputs other than quoted prices that are observable for the assets or liabilities (such as interest rates, yield curves, volatilities, prepayment speeds, loss severities, credit risks and default rates) or other market-corroborated inputs) |
| | • | | Level 3 — unobservable inputs based on the best information available in the circumstances, to the extent observable inputs are not available (including the Master LLC’s own assumptions used in determining the fair value of instruments) |
The hierarchy gives the highest priority to unadjusted quoted prices in active markets for identical assets or liabilities (Level 1 measurements) and the lowest priority to unobservable inputs (Level 3 measurements). Accordingly, the degree of judgment exercised in determining fair value is greatest for instruments categorized in Level 3. The inputs used to measure fair value may fall into different levels of the fair value hierarchy. In such cases, for disclosure purposes, the fair value hierarchy classification is determined based on the lowest level input that is significant to the fair value measurement in its entirety. Investments classified within Level 3 have significant unobservable inputs used by the Global Valuation Committee in determining the price for Fair Valued Investments. Level 3 Investments include equity or debt issued by privately-held companies. There may not be a secondary
| | | | | | |
| 28 | | BLACKROCK VALUE OPPORTUNITIES FUND, INC. | | SEPTEMBER 30, 2016 | | |
| | | | |
| Notes to Financial Statements (continued) | | | Master Value Opportunities LLC | |
market, and/or there are a limited number of investors. Level 3 investments may also be adjusted to reflect illiquidity and/or non-transferability, with the amount of such discount estimated by the Global Valuation Committee in the absence of market information.
Changes in valuation methodologies may result in transfers into or out of an assigned level within the hierarchy. In accordance with the Master LLC’s policy, transfers between different levels of the fair value hierarchy are deemed to have occurred as of the beginning of the reporting period. The categorization of a value determined for investments is based on the pricing transparency of the investment and is not necessarily an indication of the risks associated with investing in those securities.
4. Securities and Other Investments:
Warrants: Warrants entitle the Master LLC to purchase a specific number of shares of common stock and are non-income producing. The purchase price and number of shares are subject to adjustment under certain conditions until the expiration date of the warrants, if any. If the price of the underlying stock does not rise above the strike price before the warrant expires, the warrant generally expires without any value and the Master LLC will lose any amount it paid for the warrant. Thus, investments in warrants may involve more risk than investments in common stock. Warrants may trade in the same markets as their underlying stock; however, the price of the warrant does not necessarily move with the price of the underlying stock.
Securities Lending: The Master LLC may lend its securities to approved borrowers, such as brokers, dealers and other financial institutions. The borrower pledges and maintains with the Master LLC collateral consisting of cash, an irrevocable letter of credit issued by a bank, or securities issued or guaranteed by the U.S. Government. The initial collateral received by the Master LLC is required to have a value of at least 102% of the current value of the loaned securities for securities traded on U.S. exchanges and a value of at least 105% for all other securities. The collateral is maintained thereafter at a value equal to at least 100% of the current market value of the securities on loan. The market value of the loaned securities is determined at the close of each business day of the Master LLC and any additional required collateral is delivered to the Master LLC, or excess collateral returned by the Master LLC, on the next business day. During the term of the loan, the Master LLC is entitled to all distributions made on or in respect of the loaned securities but does not receive interest income on securities received as collateral. Loans of securities are terminable at any time and the borrower, after notice, is required to return borrowed securities within the standard time period for settlement of securities transactions.
The market value of any securities on loan, all of which were classified as common stocks in the Master LLC’s Schedule of Investments, and the value of any related collateral are shown separately in the Statement of Assets and Liabilities as a component of investments at value-unaffiliated, and collateral on securities loaned at value, respectively. As of period end, any securities on loan were collateralized by cash and/or U.S. Government obligations. Cash collateral invested by the securities lending agent, BlackRock Investment Management, LLC (“BIM”), if any, is disclosed in the Schedule of Investments.
Securities lending transactions are entered into by the Master LLC under Master Securities Lending Agreements (each, an “MSLA”), which provide the right, in the event of default (including bankruptcy or insolvency), for the non-defaulting party to liquidate the collateral and calculate a net exposure to the defaulting party or request additional collateral. In the event that a borrower defaults, the Master LLC, as lender, would offset the market value of the collateral received against the market value of the securities loaned. When the value of the collateral is greater than that of the market value of the securities loaned, the lender is left with a net amount payable to the defaulting party. However, bankruptcy or insolvency laws of a particular jurisdiction may impose restrictions on or prohibitions against such a right of offset in the event of an MSLA counterparty’s bankruptcy or insolvency. Under the MSLA, absent an event of default the borrower can resell or re-pledge the loaned securities, and the Master LLC can reinvest cash collateral received in connection with loaned securities. Upon an event of default, the parties’ obligations to return the securities or collateral to the other party are extinguished, and the parties can resell or re-pledge the loaned securities or the collateral received in connection with the loaned securities in order to satisfy the defaulting party’s net payment obligation for all transactions under the MSLA. The defaulting party remains liable for any deficiency.
| | | | | | |
| | | BLACKROCK VALUE OPPORTUNITIES FUND, INC. | | SEPTEMBER 30, 2016 | | 29 |
| | | | |
| Notes to Financial Statements (continued) | | | Master Value Opportunities LLC | |
As of period end, the following table is a summary of the Master LLC’s securities lending agreements by counterparty which are subject to offset under an MSLA:
| | | | | | | | | | | | | | | |
| Counterparty | | Securities Loaned
at Value | | Cash Collateral
Received1 | | Net Amount |
Citigroup Global Markets, Inc. | | | | 3,938,168 | | | | | (3,938,168 | ) | | — |
Deutsche Bank Securities, Inc. | | | | 9,378,589 | | | | | (9,378,589 | ) | | — |
Goldman Sachs & Co. | | | | 3,723,823 | | | | | (3,723,823 | ) | | — |
JP Morgan Securities LLC | | | | 10,511,186 | | | | | (10,511,186 | ) | | — |
Morgan Stanley | | | | 7,298,419 | | | | | (7,298,419 | ) | | — |
SG Americas Securities LLC | | | | 591,744 | | | | | (591,744 | ) | | — |
UBS Securities LLC | | | | 153,020 | | | | | (153,020 | ) | | — |
Total | | | $ | 35,594,949 | | | | $ | (35,594,949 | ) | | — |
| | 1 | | Cash collateral with a value of $36,231,309 has been received in connection with securities lending agreements. Collateral received in excess of the value of securities loaned from the individual counterparty is not shown for financial reporting purposes in the above table. |
The risks of securities lending include the risk that the borrower may not provide additional collateral when required or may not return the securities when due. To mitigate these risks, the Master LLC benefits from a borrower default indemnity provided by BIM. BIM’s indemnity allows for full replacement of the securities loaned if the collateral received does not cover the value on the securities loaned in the event of borrower default. The Master LLC could suffer a loss if the value of an investment purchased with cash collateral falls below the market value of loaned securities or if the value of an investment purchased with cash collateral falls below the value of the original cash collateral received.
5. Investment Advisory Agreement and Other Transactions with Affiliates:
The PNC Financial Services Group, Inc. is the largest stockholder and an affiliate of BlackRock, Inc. (“BlackRock”) for 1940 Act purposes.
Investment Advisory: The Master LLC entered into an Investment Advisory Agreement with the Manager, the Master LLC’s investment adviser, an indirect, wholly-owned subsidiary of BlackRock, to provide investment advisory and administration services. The Manager is responsible for the management of the Master LLC’s portfolio and provides the personnel, facilities, equipment and certain other services necessary to the operations of the Master LLC.
For such services, the Master LLC pays the Manager a monthly fee, which is determined by calculating a percentage of the Master LLC’s average daily net assets, based on the following annual rates:
| | | | | |
| Average Daily Net Assets | | Investment
Advisory Fee |
First $1 Billion | | 0.500% |
$1 Billion - $1.5 Billion | | 0.475% |
Greater than $1.5 Billion | | 0.450% |
Expense Waivers and Reimbursements: The Manager, with respect to Master LLC, voluntarily agreed to waive its investment advisory fees by the amount of investment advisory fees the Master LLC pays to the Manager indirectly through its investment in affiliated money market funds. This amount is included in fees waived by the Manager in the Statement of Operations. However, the Manager does not waive its investment advisory fees by the amount of investment advisory fees paid in connection with the Master LLC’s investments in other affiliated investment companies, if any.
For the six months ended September 30, 2016, the Master LLC reimbursed the Manager $3,955 for certain accounting services, which is included in accounting services in the Statement of Operations.
Securities Lending: The U.S. Securities and Exchange Commission has issued an exemptive order which permits BIM, an affiliate of the Manager, to serve as securities lending agent for the Master LLC, subject to applicable conditions. As securities lending agent, BIM bears all operational costs directly related to securities lending. The Master LLC is responsible for expenses in connection with the investment of cash collateral received for securities on loan (the “collateral investment expenses”). The cash collateral is invested in a private investment company managed by the Manager or its affiliates. However, BIM has agreed to cap the collateral investment expenses of the private investment company to an annual rate of 0.04%. The investment adviser to the private investment company will not charge any advisory fees with respect to shares purchased by the Master LLC.
Securities lending income is equal to the total of income earned from the reinvestment of cash collateral, net of fees and other payments to and from borrowers of securities, and less the collateral investment expenses. The Master LLC retains a portion of securities lending income and remits a remaining portion to BIM as compensation for its services as securities lending agent.
| | | | | | |
| 30 | | BLACKROCK VALUE OPPORTUNITIES FUND, INC. | | SEPTEMBER 30, 2016 | | |
| | | | |
| Notes to Financial Statements (continued) | | | Master Value Opportunities LLC | |
Pursuant to a securities lending agreement, the Master LLC retains 71.5% of securities lending income, and this amount retained can never be less than 65% of the total of securities lending income plus the collateral investment expenses.
In addition, commencing the business day following the date that the aggregate securities lending income earned across the Equity-Bond Complex in a calendar year exceeds a specified threshold, the Master LLC, pursuant to the securities lending agreement, will retain for the remainder of that calendar year securities lending income as follows: 75% of securities lending income, and this amount retained can never be less than 65% of the total of securities lending income plus the collateral investment expenses.
The share of securities lending income earned by the Master LLC is shown as securities lending — affiliated — net in the Statement of Operations. For the six months ended September 30, 2016, the Master LLC paid BIM $39,437 for securities lending agent services.
Officer and Directors: Certain officers and/or directors of the Master LLC are officers and/or directors of BlackRock or its affiliates.
Other Transactions: The Master LLC may purchase securities from, or sell securities to, an affiliated fund provided the affiliation is due solely to having a common investment adviser, common officers, or common trustees. For the six months ended September 30, 2016, the purchase and sales transactions with an affiliated fund in compliance with Rule 17a-7 under the 1940 Act were as follows:
| | | | |
| Purchases | | Sales | | Net Realized Gain (loss) |
$757,634 | | — | | — |
6. Purchases and Sales:
For the six months ended September 30, 2016, purchases and sales of investments, excluding short-term securities, were $221,320,784 and $272,682,533, respectively.
7. Income Tax Information:
The Master LLC is disregarded as an entity separate from its owner for tax purposes. As such, the owner of the Master LLC is treated as the owner of the net assets, income, expenses and realized and unrealized gains and losses of the Master LLC. Therefore, no federal income tax provision is required. It is intended that the Master LLC’s assets will be managed so the owner of the Master LLC can satisfy the requirements of Subchapter M of the Internal Revenue Code of 1986, as amended.
Prior to July 3, 2014, the Master LLC was classified as a partnership for federal income tax purposes. As such, each investor in the Master LLC was treated as the owner of its proportionate share of net assets, income, expenses and realized and unrealized gains and losses of the Master LLC.
The Master LLC files U.S. federal and various state and local tax returns. No income tax returns are currently under examination. The statute of limitations on the Master LLC’s U.S. federal tax returns generally remains open for each of the two years ended March 31, 2014 and the period ended July 3, 2014. The statutes of limitations on the Master LLC’s state and local tax returns may remain open for an additional year depending upon the jurisdiction.
Management has analyzed tax laws and regulations and their application to the Master LLC as of September 30, 2016, inclusive of the open tax return years, and does not believe there are any uncertain tax positions that require recognition of a tax liability in the Master LLC’s financial statements.
As of September 30, 2016, gross unrealized appreciation and depreciation based on cost for federal income tax purposes were as follows:
| | | | |
Tax cost | | $ | 669,329,110 | |
| | | | |
Gross unrealized appreciation | | $ | 116,986,442 | |
Gross unrealized depreciation | | | (26,999,821 | ) |
| | | | |
Net unrealized appreciation | | $ | 89,986,621 | |
| | | | |
8. Bank Borrowings:
The Master LLC, along with certain other funds managed by the Manager and its affiliates (“Participating Funds”), is a party to a 364-day, $2.1 billion credit agreement with a group of lenders. Under this agreement, the Master LLC may borrow to fund shareholder redemptions. Excluding commitments designated for certain individual funds, the Participating Funds, including the Master LLC, can borrow up to an aggregate commitment amount of $1.6 billion at any time outstanding, subject to asset coverage and other limitations as specified in the agreement. The credit agreement has the following terms: a fee of 0.12% per annum on unused commitment amounts and interest at a rate equal to the higher of (a) one-month LIBOR (but, in any
| | | | | | |
| | | BLACKROCK VALUE OPPORTUNITIES FUND, INC. | | SEPTEMBER 30, 2016 | | 31 |
| | | | |
| Notes to Financial Statements (concluded) | | | Master Value Opportunities LLC | |
event, not less than 0.00%) on the date the loan is made plus 0.80% per annum or (b) the Fed Funds rate (but, in any event, not less than 0.00%) in effect from time to time plus 0.80% per annum on amounts borrowed. The agreement expires in April 2017 unless extended or renewed. Prior to April 21, 2016, the credit agreement had a fee per annum of 0.06% on unused commitment amounts and interest at a rate equal to the higher of (a) one-month LIBOR (but, in any event, not less than 0.00%) on the date the loan is made plus 0.80% per annum or (b) the Fed Funds rate (but, in any event, not less than 0.00%) in effect from time to time plus 0.80% per annum on amounts borrowed. Participating Funds paid administration, legal and arrangement fees, which, if applicable, are included in miscellaneous expenses in the Statement of Operations. These fees were allocated among such funds based upon portions of the aggregate commitment available to them and relative net assets of Participating Funds. During the six months ended September 30, 2016, the Master LLC did not borrow under the credit agreement.
9. Principal Risks:
In the normal course of business, the Master LLC invests in securities and enters into transactions where risks exist due to fluctuations in the market (market risk) or failure of the issuer of a security to meet all its obligations, including to pay principal and interest when due (issuer credit risk). The value of securities held by the Master LLC may decline in response to certain events, including those directly involving the issuers of securities owned by the Master LLC. Changes arising from the general economy, the overall market and local, regional or global political and/or social instability, as well as currency, interest rate and price fluctuations, may also affect the securities’ value.
On October 11, 2016, BlackRock implemented certain changes required by amendments to Rule 2a-7 under the 1940 Act, which governs the operations of U.S. money market funds. The Master LLC may be exposed to additional risks when reinvesting cash collateral in money market funds that do not seek to maintain a stable NAV per share of $1.00 and which may be subject to redemption gates or liquidity fees under certain circumstances.
Valuation Risk: The market values of equities, such as common stocks and preferred securities or equity related investments, such as futures and options may decline due to general market conditions which are not specifically related to a particular company. They may also decline due to factors which affect a particular industry or industries. The Master LLC may invest in illiquid investments and may experience difficulty in selling those investments in a timely manner at the price that they believe the investments are worth. Prices may fluctuate widely over short or extended periods in response to company, market or economic news. Markets also tend to move in cycles, with periods of rising and falling prices. This volatility may cause the Master LLC’s NAV to experience significant increases or decreases over short periods of time. If there is a general decline in the securities and other markets, the NAV of the Master LLC may lose value, regardless of the individual results of the securities and other instruments in which the Master LLC invests.
Counterparty Credit Risk: Similar to issuer credit risk, the Master LLC may be exposed to counterparty credit risk, or the risk that an entity with which the Master LLC has unsettled or open transactions may fail to or be unable to perform on its commitments. The Master LLC manages counterparty credit risk by entering into transactions only with counterparties that the Manager believes have the financial resources to honor their obligations and by monitoring the financial stability of those counterparties. Financial assets, which potentially expose the Master LLC to market, issuer and counterparty credit risks, consist principally of financial instruments and receivables due from counterparties. The extent of the Master LLC’s exposure to market, issuer and counterparty credit risks with respect to these financial assets is generally approximated by their value recorded in the Statement of Assets and Liabilities, less any collateral held by the Master LLC.
10. Subsequent Events:
Management has evaluated the impact of all subsequent events on the Master LLC through the date the financial statements were issued and has determined that there were no subsequent events requiring adjustment or additional disclosure in the financial statements.
| | | | | | |
| 32 | | BLACKROCK VALUE OPPORTUNITIES FUND, INC. | | SEPTEMBER 30, 2016 | | |
| | | | |
| Disclosure of Investment Advisory Agreement | | | | |
The Board of Directors of the Master Value Opportunities LLC (the “Master Fund”) met in person on April 12, 2016 (the “April Meeting”) and May 10-11, 2016 (the “May Meeting”) to consider the approval of the investment advisory agreement (the “Advisory Agreement” or the “Agreement”) between the Master Fund and BlackRock Advisors, LLC (the “Manager” or “BlackRock”), the Master Fund’s investment advisor. The BlackRock Value Opportunities Fund, Inc. (the “Feeder Fund”) is a “feeder” fund that invests all of its investable assets in the Master Fund. Accordingly, the Board of Directors of the Feeder Fund also considered the approval of the Advisory Agreement with respect to the Master Fund. For simplicity: (a) the Board of Directors of the Master Fund and the Board of Directors of the Feeder Fund are referred to herein collectively as the “Board,” and the members are referred to as “Board Members;” and (b) the shareholders of the Feeder Fund and the interest holders of the Master Fund are referred to as “shareholders.”
Activities and Composition of the Board
On the date of the May Meeting, the Board consisted of thirteen individuals, ten of whom were not “interested persons” of the Master Fund or the Feeder Fund as defined in the Investment Company Act of 1940, as amended (the “1940 Act”) (the “Independent Board Members”). One of the Board Members is a non-management interested Board Member by virtue of his former positions with BlackRock, Inc. and its affiliates. The Board Members are responsible for the oversight of the operations of the Master Fund or the Feeder Fund, as pertinent, and perform the various duties imposed on the directors of investment companies by the 1940 Act. The Independent Board Members have retained independent legal counsel to assist them in connection with their duties. The Chair of the Board is an Independent Board Member. The Board has established five standing committees: an Audit Committee, a Governance and Nominating Committee, a Compliance Committee, a Performance Oversight Committee and an Executive Committee, each of which is chaired by an Independent Board Member and composed of Independent Board Members (except for the Performance Oversight Committee and the Executive Committee, each of which also has one interested Board Member).
The Agreement
Pursuant to the 1940 Act, the Board is required to consider the continuation of the Agreement on an annual basis. The Board has four quarterly meetings per year, each extending over two days, a fifth one-day meeting to consider specific information surrounding the consideration of renewing the Agreement and additional in-person and telephonic meetings as needed. In connection with this year-long deliberative process, the Board assessed, among other things, the nature, extent and quality of the services provided to the Master Fund and the Feeder Fund by BlackRock, BlackRock’s personnel and affiliates, including (as applicable): investment management; administrative and shareholder services; the oversight of fund service providers; marketing; risk oversight; compliance and ability to meet applicable legal and regulatory requirements.
The Board, acting directly and through its committees, considers at each of its meetings, and from time to time as appropriate, factors that are relevant to its annual consideration of the renewal of the Agreement, including the services and support provided by BlackRock to the Master Fund, the Feeder Fund and their shareholders. BlackRock also furnished additional information to the Board in response to specific questions from the Board. This additional information is discussed further below in the section titled “Board Considerations in Approving the Agreement.” Among the matters the Board considered were: (a) investment performance for one-year, three-year, five-year, ten-year, and/or since inception periods, as applicable, against peer funds, applicable benchmark, and performance metrics, as applicable, as well as senior management’s and portfolio managers’ analysis of the reasons for any over-performance or underperformance relative to its peers, benchmarks, and other performance metrics, as applicable; (b) fees, including advisory, administration, if applicable, and other amounts paid to BlackRock and its affiliates by the Master Fund and/or the Feeder Fund for services; (c) the Master Fund’s and/or the Feeder Fund’s operating expenses and how BlackRock allocates expenses to the Master Fund and the Feeder Fund; (d) the resources devoted to, risk oversight of, and compliance reports relating to, implementation of the Master Fund’s and the Feeder Fund’s investment objective(s), policies and restrictions, and meeting regulatory requirements; (e) the Master Fund’s and the Feeder Fund’s compliance with its compliance policies and procedures; (f) the nature, cost and character of non-investment management services provided by BlackRock and its affiliates; (g) BlackRock’s and other service providers’ internal controls and risk and compliance oversight mechanisms; (h) BlackRock’s implementation of the proxy voting policies approved by the Board; (i) the use of brokerage commissions and execution quality of portfolio transactions; (j) BlackRock’s implementation of the Master Fund’s and/or the Feeder Fund’s valuation and liquidity procedures; (k) an analysis of management fees for products with similar investment mandates across the open-end fund, exchange-traded fund (“ETF”), closed-end fund and institutional account product channels, as applicable, and the similarities and differences between these products and the services provided as compared to the Master Fund and/or Feeder Fund; (l) BlackRock’s compensation methodology for its investment professionals and the incentives and accountability it creates, along with investment professionals’ investments in the fund(s) they manage; and (m) periodic updates on BlackRock’s business.
| | | | | | |
| | | BLACKROCK VALUE OPPORTUNITIES FUND, INC. | | SEPTEMBER 30, 2016 | | 33 |
| | | | |
| Disclosure of Investment Advisory Agreement (continued) | | | | |
Board Considerations in Approving the Agreement
The Approval Process: Prior to the April Meeting, the Board requested and received materials specifically relating to the Agreement. The Board is continuously engaged in a process with its independent legal counsel and BlackRock to review the nature and scope of the information provided to better assist its deliberations. The materials provided in connection with the April Meeting included (a) information independently compiled and prepared by Broadridge Financial Solutions, Inc. (“Broadridge”) on fees and expenses of the Master Fund and the Feeder Fund, as applicable, as compared with a peer group of funds as determined by Broadridge (“Expense Peers”) and the investment performance of the Feeder Fund as compared with a peer group of funds as determined by Broadridge1; (b) information on the profits realized by BlackRock and its affiliates pursuant to the Agreement and a discussion of fall-out benefits to BlackRock and its affiliates; (c) a general analysis provided by BlackRock concerning investment management fees charged to other clients, such as institutional clients, sub-advised mutual funds, ETFs and closed-end funds, under similar investment mandates, as well as the performance of such other clients, as applicable; (d) review of non-management fees; (e) the existence, impact and sharing of potential economies of scale; (f) a summary of aggregate amounts paid by the Master Fund and/or the Feeder Fund to BlackRock; and (g) sales and redemption data regarding the Feeder Fund’s shares.
At the April Meeting, the Board reviewed materials relating to its consideration of the Agreement. As a result of the discussions that occurred during the April Meeting, and as a culmination of the Board’s year-long deliberative process, the Board presented BlackRock with questions and requests for additional information. BlackRock responded to these requests with additional written information in advance of the May Meeting.
At the May Meeting, the Board of the Master Fund, including the Independent Board Members, approved the continuation of the Advisory Agreement between the Manager and the Master Fund for a one-year term ending June 30, 2017. The Board of the Feeder Fund, including the Independent Board Members, also considered the continuation of the Agreement and found the Agreement to be satisfactory. In approving the continuation of the Agreement, the Board considered: (a) the nature, extent and quality of the services provided by BlackRock; (b) the investment performance of the Master Fund and the Feeder Fund; (c) the advisory fee and the cost of the services and profits to be realized by BlackRock and its affiliates from their relationship with the Master Fund and the Feeder Fund; (d) the Feeder Fund’s costs to investors compared to the costs of Expense Peers and performance compared to the relevant performance metrics as previously discussed; (e) the sharing of potential economies of scale; (f) fall-out benefits to BlackRock and its affiliates as a result of its relationship with the Master Fund and the Feeder Fund; and (g) other factors deemed relevant by the Board Members.
The Board also considered other matters it deemed important to the approval process, such as other payments made to BlackRock or its affiliates, securities lending and cash management, services related to the valuation and pricing of portfolio holdings of the Master Fund, and materials submitted for the Board’s review. The Board noted the willingness of BlackRock personnel to engage in open, candid discussions with the Board. The Board did not identify any particular information as determinative, and each Board Member may have attributed different weights to the various items considered.
A. Nature, Extent and Quality of the Services Provided by BlackRock: The Board, including the Independent Board Members, reviewed the nature, extent and quality of services provided by BlackRock, including the investment advisory services and the resulting performance of the Feeder Fund. Throughout the year, the Board compared the Feeder Fund’s performance to the performance of a comparable group of mutual funds, a relevant benchmark, and performance metrics, as applicable. The Board met with BlackRock’s senior management personnel responsible for investment activities, including the senior investment officers. The Board also reviewed the materials provided by the Master Fund’s portfolio management team discussing the Master Fund’s performance and the Master Fund’s investment objective(s), strategies and outlook.
The Board considered, among other factors, with respect to BlackRock: the number, education and experience of investment personnel generally and the Master Fund’s portfolio management team; BlackRock’s research capabilities; investments by portfolio managers in the funds they manage; portfolio trading capabilities; use of technology; commitment to compliance; credit analysis capabilities; risk analysis and oversight capabilities; and the approach to training and retaining portfolio managers and other research, advisory and management personnel. The Board engaged in a review of BlackRock’s compensation structure with respect to the Master Fund’s portfolio management team and BlackRock’s ability to attract and retain high-quality talent and create performance incentives.
In addition to investment advisory services, the Board considered the quality of the administrative and other non-investment advisory services provided to the Master Fund and the Feeder Fund. BlackRock and its affiliates provide the Master Fund and the Feeder Fund with certain administrative, shareholder and other services (in addition to any such services provided to the Master Fund and the Feeder Fund by third parties) and officers and other personnel as are necessary for the operations of the Master Fund and the Feeder Fund.
| 1 | | Funds are ranked by Broadridge in quartiles, ranging from first to fourth, where first is the most desirable quartile position and fourth is the least desirable. |
| | | | | | |
| 34 | | BLACKROCK VALUE OPPORTUNITIES FUND, INC. | | SEPTEMBER 30, 2016 | | |
| | | | |
| Disclosure of Investment Advisory Agreement (continued) | | | | |
In particular, BlackRock and its affiliates provide the Master Fund and the Feeder Fund with administrative services including, among others: (i) preparing disclosure documents, such as the prospectus, the summary prospectus (as applicable), the statement of additional information and periodic shareholder reports; (ii) oversight of daily accounting and pricing; (iii) preparing periodic filings with regulators; (iv) overseeing and coordinating the activities of other service providers; (v) organizing Board meetings and preparing the materials for such Board meetings; (vi) providing legal and compliance support; (vii) furnishing analytical and other support to assist the Board in its consideration of strategic issues such as the merger, consolidation or repurposing of certain open-end funds; and (viii) performing other administrative functions necessary for the operation of the Master Fund and the Feeder Fund, such as tax reporting, fulfilling regulatory filing requirements and call center services. The Board reviewed the structure and duties of BlackRock’s fund administration, shareholder services, and legal & compliance departments and considered BlackRock’s policies and procedures for assuring compliance with applicable laws and regulations.
B. The Investment Performance of the Master Fund, the Feeder Fund and BlackRock: The Board, including the Independent Board Members, also reviewed and considered the performance history of the Master Fund and the Feeder Fund, as applicable. The Board noted that the Feeder Fund’s investment results correspond directly to the investment results of the Master Fund. In preparation for the April Meeting, the Board was provided with reports independently prepared by Broadridge, which included a comprehensive analysis of the Feeder Fund’s performance. The Board also reviewed a narrative and statistical analysis of the Broadridge data that was prepared by BlackRock. In connection with its review, the Board received and reviewed information regarding the investment performance of the Feeder Fund as compared to other funds in its applicable Broadridge category. The Board was provided with a description of the methodology used by Broadridge to select peer funds and periodically meets with Broadridge representatives to review its methodology. The Board was provided with information on the composition of the Broadridge performance universes and expense universes. The Board and its Performance Oversight Committee regularly review, and meet with Master Fund management to discuss, the performance of the Master Fund and the Feeder Fund, as applicable, throughout the year.
In evaluating performance, the Board recognized that the performance data reflects a snapshot of a period as of a particular date and that selecting a different performance period could produce significantly different results. Further, the Board recognized that it is possible that long-term performance can be adversely affected by even one period of significant underperformance so that a single investment decision or theme has the ability to affect long-term performance disproportionately.
The Board noted that for the one-, three- and five-year periods reported, the Feeder Fund ranked in the third, second, and second quartiles, respectively, against its Broadridge Performance Universe. The Board and BlackRock reviewed and discussed the reasons for the Fund’s underperformance during the one-year period.
C. Consideration of the Advisory/Management Fees and the Cost of the Services and Profits to be Realized by BlackRock and its Affiliates from their Relationship with the Master Fund and the Feeder Fund: The Board, including the Independent Board Members, reviewed the Master Fund’s/Feeder Fund’s contractual management fee rate compared with the other funds in the Feeder Fund’s Broadridge category. The contractual management fee rate represents a combination of the advisory fee and any administrative fees, before taking into account any reimbursements or fee waivers. The Board also compared the Feeder Fund’s total expense ratio, as well as the Master Fund’s/Feeder Fund’s actual management fee rate, to those of other funds in the Feeder Fund’s Broadridge category. The total expense ratio represents a fund’s total net operating expenses, including any 12b-1 or non 12b-1 service fees. The total expense ratio gives effect to any expense reimbursements or fee waivers that benefit a fund, and the actual management fee rate gives effect to any management fee reimbursements or waivers that benefit a fund. The Board considered the services provided and the fees charged by BlackRock to other types of clients with similar investment mandates, as applicable, including institutional accounts and sub-advised mutual funds (including mutual funds sponsored by third parties).
The Board received and reviewed statements relating to BlackRock’s financial condition. The Board reviewed BlackRock’s profitability methodology and was also provided with a profitability analysis that detailed the revenues earned and the expenses incurred by BlackRock for services provided to the Master Fund and the Feeder Fund. The Board reviewed BlackRock’s profitability with respect to the Master Fund and the Feeder Fund, as applicable, and other funds the Board currently oversees for the year ended December 31, 2015 compared to available aggregate profitability data provided for the prior two years. The Board reviewed BlackRock’s profitability with respect to certain other U.S. fund complexes managed by the Manager and/or its affiliates. The Board reviewed BlackRock’s assumptions and methodology of allocating expenses in the profitability analysis, noting the inherent limitations in allocating costs among various advisory products. The Board recognized that profitability may be affected by numerous factors including, among other things, fee waivers and expense reimbursements by the Manager, the types of funds managed, precision of expense allocations and business mix. As a result, calculating and comparing profitability at individual fund level is difficult.
| | | | | | |
| | | BLACKROCK VALUE OPPORTUNITIES FUND, INC. | | SEPTEMBER 30, 2016 | | 35 |
| | | | |
| Disclosure of Investment Advisory Agreement (continued) | | | | |
The Board noted that, in general, individual fund or product line profitability of other advisors is not publicly available. The Board reviewed BlackRock’s overall operating margin, in general, compared to that of certain other publicly-traded asset management firms. The Board considered the differences between BlackRock and these other firms, including the contribution of technology at BlackRock, BlackRock’s expense management, and the relative product mix.
In addition, the Board considered the cost of the services provided to the Master Fund and the Feeder Fund by BlackRock, and BlackRock’s and its affiliates’ profits relating to the management and distribution of the Master Fund and the Feeder Fund and the other funds advised by BlackRock and its affiliates. As part of its analysis, the Board reviewed BlackRock’s methodology in allocating its costs of managing the Master Fund and the Feeder Fund, to the relevant Master Fund or Feeder Fund, as pertinent. The Board may receive and review information from independent third parties as part of its annual evaluation. The Board considered whether BlackRock has the financial resources necessary to attract and retain high quality investment management personnel to perform its obligations under the Agreement and to continue to provide the high quality of services that is expected by the Board. The Board further considered factors including but not limited to BlackRock’s commitment of time, assumption of risk and liability profile in servicing the Master Fund and the Feeder Fund in contrast to what is required of BlackRock with respect to other products with similar investment mandates across the open-end fund, ETF, closed-end fund, sub-advised mutual fund and institutional account product channels, as applicable.
The Board noted that the Master Fund’s/Feeder Fund’s contractual management fee rate ranked in the second quartile, and that the actual management fee rate and the Feeder Fund’s total expense ratio each ranked in the second quartile, relative to the Feeder Fund’s Expense Peers. The Board also noted that the Master Fund has an advisory fee arrangement that includes breakpoints that adjust the fee rate downward as the size of the Master Fund increases above certain contractually specified levels.
D. Economies of Scale: The Board, including the Independent Board Members, considered the extent to which economies of scale might be realized as the assets of the Master Fund and the Feeder Fund increase, as well as the existence of expense caps, as applicable. The Board also considered the extent to which the Master Fund and the Feeder Fund benefit from such economies in a variety of ways, and whether there should be changes in the advisory fee rate or breakpoint structure in order to enable the Master Fund and the Feeder Fund to more fully participate in these economies of scale. The Board considered the Master Fund’s asset levels and whether the current fee schedule was appropriate. In its consideration, the Board Members took into account the existence of any expense caps and further considered the continuation and/or implementation, as applicable, of such caps.
E. Other Factors Deemed Relevant by the Board Members: The Board, including the Independent Board Members, also took into account other ancillary or “fall-out” benefits that BlackRock or its affiliates may derive from their respective relationships with the Master Fund and the Feeder Fund, both tangible and intangible, such as BlackRock’s ability to leverage its investment professionals who manage other portfolios and risk management personnel, an increase in BlackRock’s profile in the investment advisory community, and the engagement of BlackRock’s affiliates as service providers to the Master Fund and the Feeder Fund, including for administrative, distribution, securities lending and cash management services. The Board also considered BlackRock’s overall operations and its efforts to expand the scale of, and improve the quality of, its operations. The Board also noted that BlackRock may use and benefit from third party research obtained by soft dollars generated by certain registered fund transactions to assist in managing all or a number of its other client accounts. The Board further noted that it had considered the investment by BlackRock’s funds in affiliated ETFs without any offset against the management fees payable by the funds to BlackRock.
In connection with its consideration of the Agreement, the Board also received information regarding BlackRock’s brokerage and soft dollar practices. The Board received reports from BlackRock which included information on brokerage commissions and trade execution practices throughout the year.
The Board noted the competitive nature of the open-end fund marketplace, and that shareholders are able to redeem their Feeder Fund shares if they believe that the Feeder Fund’s and/or the Master Fund’s fees and expenses are too high or if they are dissatisfied with the performance of the Feeder Fund.
Conclusion
The Board of the Master Fund, including the Independent Board Members, approved the continuation of the Advisory Agreement between the Manager and the Master Fund for a one-year term ending June 30, 2017. Based upon its evaluation of all of the aforementioned factors in their totality, as well as other information, the Board of the Master Fund, including the Independent Board Members, was satisfied that the terms of the Agreement were fair and reasonable and in the best interest of the Master Fund and its shareholders. The Board of the Feeder Fund, including the Independent Board Members, also considered the continuation of the Agreement with respect to the Master Fund and found the Agreement to be satisfactory. In arriving at its decision to approve the Agreement, the Board of the Master Fund did not identify any single factor or group of factors as all-important or controlling, but considered all factors together, and different Board Members may have attributed different weights to the various factors considered. The
| | | | | | |
| 36 | | BLACKROCK VALUE OPPORTUNITIES FUND, INC. | | SEPTEMBER 30, 2016 | | |
| | | | |
| Disclosure of Investment Advisory Agreement (concluded) | | | | |
Independent Board Members were also assisted by the advice of independent legal counsel in making this determination. The contractual fee arrangements for the Master Fund reflect the results of several years of review by the Board Members and predecessor Board Members, and discussions between such Board Members (and predecessor Board Members) and BlackRock. As a result, the Board Members’ conclusions may be based in part on their consideration of these arrangements in prior years.
Robert M. Hernandez, Chair of the Board and Director
Fred G. Weiss, Vice Chair of the Board and Director
James H. Bodurtha, Director
Bruce R. Bond, Director
Donald W. Burton, Director
Honorable Stuart E. Eizenstat, Director
John F. O’Brien, Director
Donald C. Opatrny, Director
Roberta Cooper Ramo, Director
David H. Walsh, Director
Robert Fairbairn, Director
Henry Gabbay, Director
Henry R. Keizer, Director
John M. Perlowski, Director, President and Chief Executive Officer
Jennifer McGovern, Vice President
Neal J. Andrews, Chief Financial Officer
Jay M. Fife, Treasurer
Charles Park, Chief Compliance Officer
Fernanda Piedra, Anti-Money Laundering Compliance Officer
Benjamin Archibald, Secretary
Effective May 6, 2016, Valerie G. Brown resigned as a Director of the Fund/Master LLC.
Effective May 10, 2016, Kenneth A. Froot resigned as a Director of the Fund/Master LLC.
On June 2, 2016, the Board appointed Henry R. Keizer as a Director of the Fund/Master LLC, effective July 28, 2016.
On September 26, 2016, the Board appointed Lena G. Goldberg as a Director of the Fund/Master LLC effective November 4, 2016.
| | | | | | |
| | | | |
Investment Adviser and Administrator BlackRock Advisors, LLC Wilmington, DE 19809 | | Custodian The Bank of New York Mellon New York, NY 10286 | | Accounting Agent and Transfer Agent BNY Mellon Investment Servicing (US) Inc. Wilmington, DE 19809 | | Address of the Fund 100 Bellevue Parkway Wilmington, DE 19809 |
| | | | | | |
Distributor BlackRock Investments, LLC New York, NY 10022 | | Independent Registered Public Accounting Firm Deloitte & Touche LLP Philadelphia, PA 19103 | | Legal Counsel Willkie Farr & Gallagher LLP New York, NY 10019 | | |
| | | | | | |
| | | BLACKROCK VALUE OPPORTUNITIES FUND, INC. | | SEPTEMBER 30, 2016 | | 37 |
Householding
The Fund will mail only one copy of shareholder documents, including prospectuses, annual and semi-annual reports and proxy statements, to shareholders with multiple accounts at the same address. This practice is commonly called “householding” and is intended to reduce expenses and eliminate duplicate mailings of shareholder documents. Mailings of your shareholder documents may be householded indefinitely unless you instruct us otherwise. If you do not want the mailing of these documents to be combined with those for other members of your household, please call the Fund at (800) 441-7762.
Availability of Quarterly Schedule of Investments
The Fund/Master LLC file their complete schedule of portfolio holdings with the SEC for the first and third quarters of each fiscal year on Form N-Q. The Fund/Master LLC’s Forms N-Q are available on the SEC’s website at http://www.sec.gov and may also be reviewed and copied at the SEC’s Public Reference Room in Washington, D.C. Information on the operation of the Public Reference Room or how to access documents on the SEC’s website without charge may be obtained by calling (800) SEC-0330. The Fund/Master LLC’s Forms N-Q may also be obtained upon request and without charge by calling (800) 441-7762.
Availability of Proxy Voting Policies and Procedures
A description of the policies and procedures that the Fund/Master LLC uses to determine how to vote proxies relating to portfolio securities is available upon request and without charge, (1) by calling (800) 441-7762; (2) at http://www.blackrock.com; and (3) on the SEC’s website at http://www.sec.gov.
Availability of Proxy Voting Record
Information about how the Fund/Master LLC voted proxies relating to securities held in the Fund/Master LLC’s portfolio during the most recent 12-month period ended June 30 is available upon request and without charge (1) at http://www.blackrock.com or by calling (800) 441-7762 and (2) on the SEC’s website at http://www.sec.gov.
BlackRock’s Mutual Fund Family
BlackRock offers a diverse lineup of open-end mutual funds crossing all investment styles and managed by experts in equity, fixed income and tax-exempt investing. Visit http://www.blackrock.com for more information.
Account Information
Call us at (800) 441-7762 from 8:00 AM to 6:00 PM ET on any business day to get information about your account balances, recent transactions and share prices. You can also reach us on the Web at http://www.blackrock.com/funds.
Automatic Investment Plans
Investor Class shareholders who want to invest regularly can arrange to have $50 or more automatically deducted from their checking or savings account and invested in any of the BlackRock funds.
Systematic Withdrawal Plans
Investor Class shareholders can establish a systematic withdrawal plan and receive periodic payments of $50 or more from their BlackRock funds, as long as their account balance is at least $10,000.
Retirement Plans
Shareholders may make investments in conjunction with Traditional, Rollover, Roth, Coverdell, Simple IRAs, SEP IRAs and 403(b) Plans.
| | | | | | |
| 38 | | BLACKROCK VALUE OPPORTUNITIES FUND, INC. | | SEPTEMBER 30, 2016 | | |
| | | | |
| Additional Information (concluded) | | | | |
|
| BlackRock Privacy Principles |
BlackRock is committed to maintaining the privacy of its current and former fund investors and individual clients (collectively, “Clients”) and to safeguarding their non-public personal information. The following information is provided to help you understand what personal information BlackRock collects, how we protect that information and why in certain cases we share such information with select parties.
If you are located in a jurisdiction where specific laws, rules or regulations require BlackRock to provide you with additional or different privacy-related rights beyond what is set forth below, then BlackRock will comply with those specific laws, rules or regulations.
BlackRock obtains or verifies personal non-public information from and about you from different sources, including the following: (i) information we receive from you or, if applicable, your financial intermediary, on applications, forms or other documents; (ii) information about your transactions with us, our affiliates, or others; (iii) information we receive from a consumer reporting agency; and (iv) from visits to our websites.
BlackRock does not sell or disclose to non-affiliated third parties any non-public personal information about its Clients, except as permitted by law or as is necessary to respond to regulatory requests or to service Client accounts. These non-affiliated third parties are required to protect the confidentiality and security of this information and to use it only for its intended purpose.
We may share information with our affiliates to service your account or to provide you with information about other BlackRock products or services that may be of interest to you. In addition, BlackRock restricts access to non-public personal information about its Clients to those BlackRock employees with a legitimate business need for the information. BlackRock maintains physical, electronic and procedural safeguards that are designed to protect the non-public personal information of its Clients, including procedures relating to the proper storage and disposal of such information.
| | | | | | |
| | | BLACKROCK VALUE OPPORTUNITIES FUND, INC. | | SEPTEMBER 30, 2016 | | 39 |
| | |
This report is intended for current holders. It is not authorized for use as an offer of sale or a solicitation of an offer to buy shares of the Fund unless preceded or accompanied by the Fund’s current prospectus. Past performance results shown in this report should not be considered a representation of future performance. Investment returns and principal value of shares will fluctuate so that shares, when redeemed, may be worth more or less than their original cost. Statements and other information herein are as dated and are subject to change. | | 
|
| | |
VO-9/16-SAR | |  |
| | |
| Item 2 – | | Code of Ethics – Not Applicable to this semi-annual report |
| |
| Item 3 – | | Audit Committee Financial Expert – Not Applicable to this semi-annual report |
| |
| Item 4 – | | Principal Accountant Fees and Services – Not Applicable to this semi-annual report |
| |
| Item 5 – | | Audit Committee of Listed Registrants – Not Applicable |
| |
| Item 6 – | | Investments |
| | (a) The registrants’ Schedules of Investments are included as part of the Report to Stockholders filed under Item 1 of this Form. |
| | (b) Not Applicable due to no such divestments during the semi-annual period covered since the previous Form N-CSR filing. |
| |
| Item 7 – | | Disclosure of Proxy Voting Policies and Procedures for Closed-End Management Investment Companies – Not Applicable |
| |
| Item 8 – | | Portfolio Managers of Closed-End Management Investment Companies – Not Applicable |
| |
| Item 9 – | | Purchases of Equity Securities by Closed-End Management Investment Company and Affiliated Purchasers – Not Applicable |
| |
| Item 10 – | | Submission of Matters to a Vote of Security Holders – There have been no material changes to these procedures. |
| |
| Item 11 – | | Controls and Procedures |
| |
| | (a) – The registrants’ principal executive and principal financial officers, or persons performing similar functions, have concluded that the registrants’ disclosure controls and procedures (as defined in Rule 30a-3(c) under the Investment Company Act of 1940, as amended (the “1940 Act”)) are effective as of a date within 90 days of the filing of this report based on the evaluation of these controls and procedures required by Rule 30a-3(b) under the 1940 Act and Rule 15d-15(b) under the Securities Exchange Act of 1934, as amended. |
| |
| | (b) – There were no changes in the registrants’ internal control over financial reporting (as defined in Rule 30a-3(d) under the 1940 Act) that occurred during the second fiscal quarter of the period covered by this report that have materially affected, or are reasonably likely to materially affect, the registrants’ internal control over financial reporting. |
| |
| Item 12 – | | Exhibits attached hereto |
| |
| | (a)(1) – Code of Ethics – Not Applicable to this semi-annual report |
| |
| | (a)(2) – Certifications – Attached hereto |
| |
| | (a)(3) – Not Applicable |
| |
| | (b) – Certifications – Attached hereto |
2
Pursuant to the requirements of the Securities Exchange Act of 1934 and the Investment Company Act of 1940, each registrant has duly caused this report to be signed on its behalf by the undersigned, thereunto duly authorized.
BlackRock Value Opportunities Fund, Inc. and Master Value Opportunities LLC
| | |
| By: | | /s/ John M. Perlowski |
| | John M. Perlowski |
| | Chief Executive Officer (principal executive officer) of |
| | BlackRock Value Opportunities Fund, Inc. and Master Value Opportunities LLC |
| |
| Date: | | December 2, 2016 |
Pursuant to the requirements of the Securities Exchange Act of 1934 and the Investment Company Act of 1940, this report has been signed below by the following persons on behalf of each registrant and in the capacities and on the dates indicated.
| | |
| By: | | /s/ John M. Perlowski |
| | John M. Perlowski |
| | Chief Executive Officer (principal executive officer) of |
| | BlackRock Value Opportunities Fund, Inc. and Master Value Opportunities LLC |
| |
| Date: | | December 2, 2016 |
| |
| By: | | /s/ Neal J. Andrews |
| | Neal J. Andrews |
| | Chief Financial Officer (principal financial officer) of |
| | BlackRock Value Opportunities Fund, Inc. and Master Value Opportunities LLC |
| |
| Date: | | December 2, 2016 |
3