
©2014 Coupons.com Incorporated Coupons.com Incorporated Q1 2014 Financial Results May 7, 2014

©2014 Coupons.com Incorporated Forward - Looking Statements 2 This presentation and the accompanying oral presentation contain “forward - looking” statements that are based on our management’s beliefs and assumptions and on information currently available to management, including Coupon . com’s projected second quarter and full year 2014 results, its plans, including product launches, strategy, and business outlook . Coupons . com operates in very competitive and rapidly changing environments, and new risks may emerge from time to time . It is not possible for Coupons . com’s management to predict all risks, nor can it assess the impact of all factors on our business or the extent to which any factor, or combination of factors, may cause actual results to differ materially from those contained in any forward - looking statements Coupons . com may make . Forward - looking statements should not be read as guarantees of future performance or results, and will not necessarily be accurate indications of the times at, or by, which such performance or results will be achieved . Forward - looking statements are based on information available to Coupons . com’s management at the date of this release and its management’s good faith belief as of such date with respect to future events, and are subject to risks and uncertainties that could cause actual performance or results to differ materially from those expressed in or suggested by the forward - looking statements . Important factors that could cause such differences include, but are not limited to, Coupons . com’s financial performance, including its revenues, margins, costs, expenditures, growth rates and operating expenses, and its ability to generate positive cash flow and become profitable ; the amount and timing of digital promotions by CPGs, which are affected by budget cycles, economic conditions and other factors ; the company’s ability to adapt to changing market conditions ; the company’s ability to retain and expand its business with existing CPGs and retailers ; the company’s ability to maintain and expand the use by consumers of digital promotions on its platforms ; the company’s ability to attract and retain third - party advertising agencies, performance marketing networks and other intermediaries ; the company’s ability to effectively manage its growth ; the effects of increased competition in the company’s markets and its ability to compete effectively ; the company’s ability to effectively grow and train its sales team ; the company’s ability to obtain new CPGs and retailers and to do so efficiently ; the company’s ability to maintain, protect and enhance its brand and intellectual property ; costs associated with defending intellectual property infringement and other claims ; the company’s ability to successfully enter new markets ; the company’s ability to develop and launch new services and features ; the company’s ability to attract and retain qualified employees and key personnel . These factors, together with those described in greater detail in Coupons . com’s 424 (b) prospectus filed with the SEC on March 7 , 2014 , and in Coupons . com’s future quarterly reports on Form 10 - Q, annual reports on Form 10 - K and other filings made with the Securities and Exchange Commission (“SEC”), may cause our actual results, performance or achievements to differ materially and adversely from those anticipated or implied by our forward - looking statements . Coupons . com disclaims any obligation to update information contained in these forward - looking statements whether as a result of new information, future events, or otherwise . In addition to the U . S . GAAP financials, this presentation includes certain non - GAAP financial measures . The non - GAAP measures have limitations as analytical tools and you should not consider them in isolation or as a substitute for an analysis of our results under U . S . GAAP . There are a number of limitations related to the use of these non - GAAP financial measures versus their nearest GAAP equivalents . For example, other companies may calculate non - GAAP financial measures differently or may use other measures to evaluate their performance, all of which could reduce the usefulness of our non - GAAP financial measures as tools for comparison . Coupons . com considers these non - GAAP financial measures to be important because they provide useful measures of the operating performance of the company, exclusive of unusual events or factors that do not directly affect what we consider to be our core operating performance, and are used by the company's management for that purpose . The use of non - GAAP measures is further discussed in accompanying press release, which has been furnished to the SEC on Form 8 - K and posted on Coupons . com’ website . The press release also defines our non - GAAP financial measures . A reconciliation between GAAP and non - GAAP measures can also be found in the accompanying press release and in the Appendix hereto .

©2014 Coupons.com Incorporated Steven Boal, Founder, President and CEO
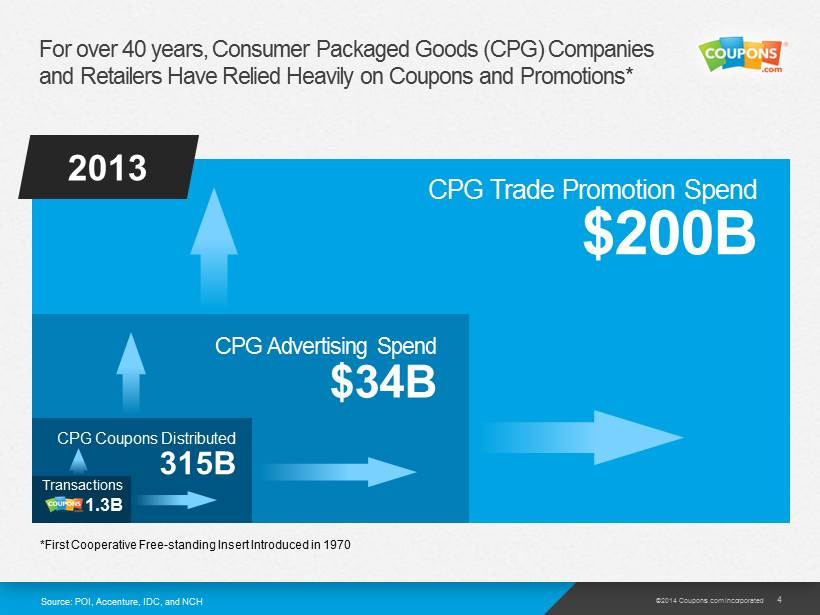
©2014 Coupons.com Incorporated CPG Trade Promotion Spend $ 200B For over 40 years, Consumer Packaged Goods (CPG) Companies and Retailers Have Relied Heavily on Coupons and Promotions* 4 CPG Advertising Spend $34B CPG Coupons Distributed 315B Transactions 1.3B Source: POI, Accenture, IDC, and NCH *First Cooperative Free - standing Insert Introduced in 1970 2013
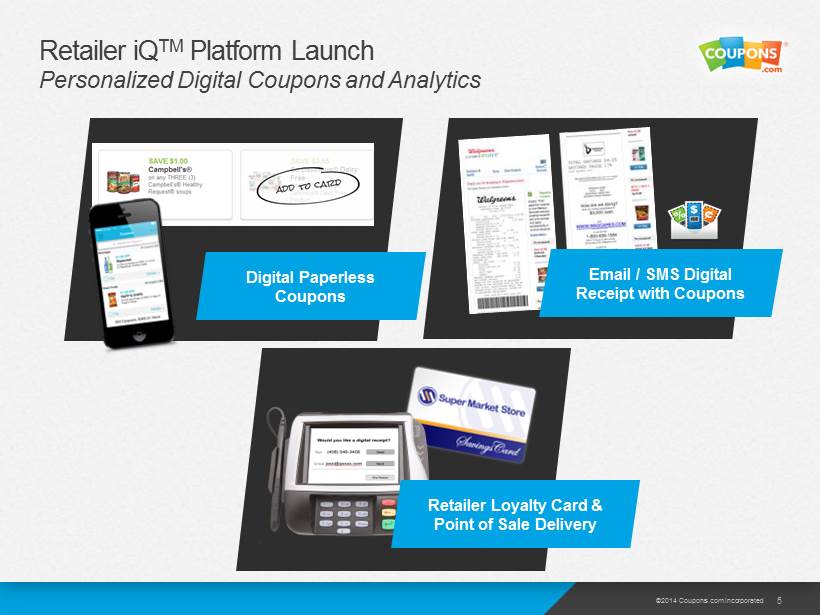
©2014 Coupons.com Incorporated Retailer iQ TM Platform Launch Personalized Digital Coupons and Analytics 5 Retailer Loyalty Card & Point of Sale Delivery Digital Paperless Coupons Email / SMS Digital Receipt with Coupons

©2014 Coupons.com Incorporated Mir Aamir, CFO and COO

©2014 Coupons.com Incorporated Quarterly Results Snapshot Strong YoY Growth in Key Metrics 7 Metric Q1 2014 Q1 2013 YoY Growth Total Revenue $51.5M $36.5 M 41% Adjusted EBITDA $3.9M ($4.9M) 180% Total Transactions 407.8 M 312.9 M 30% $220.8 Million in Cash and Cash Equivalents (as of March 31, 2014) Note: Adjusted EBITDA is net loss adjusted for interest expense, other income ( expense) - net , benefit from income taxes, depreciation and amortization, and stock - based compensation

©2014 Coupons.com Incorporated Revenues Up 41% YoY ($ in millions) 8 ▪ Accelerating shift from paper to digital coupons ▪ Revenue growth across all business areas ▪ 30% increase in transactions YoY ▪ End of quarter CPG promotions Q1 2013 Q1 2014 Promotions Advertising $30.0 $6.5 $36.5 $51.5 $40.6 $10.9
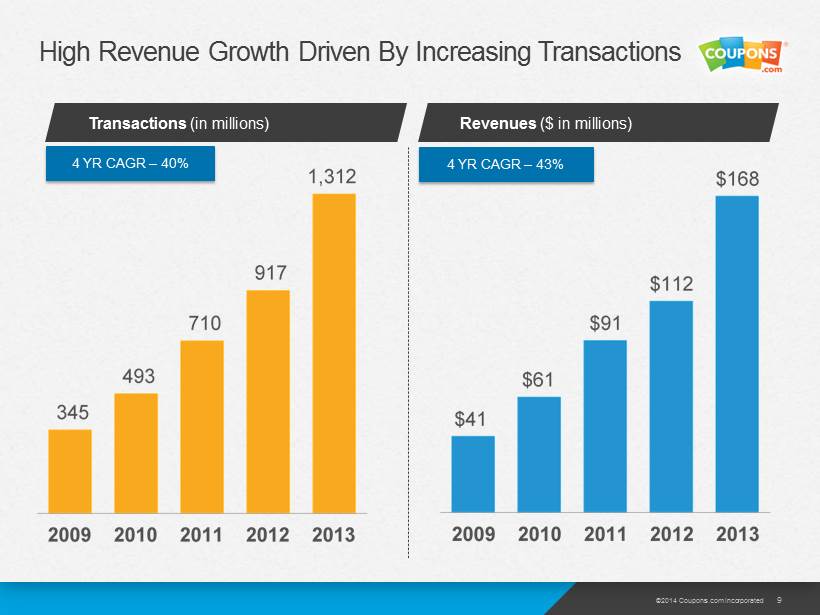
©2014 Coupons.com Incorporated 4 YR CAGR – 40% High Revenue Growth Driven By Increasing Transactions 9 4 YR CAGR – 43% Transactions (in millions) Revenues ($ in millions)
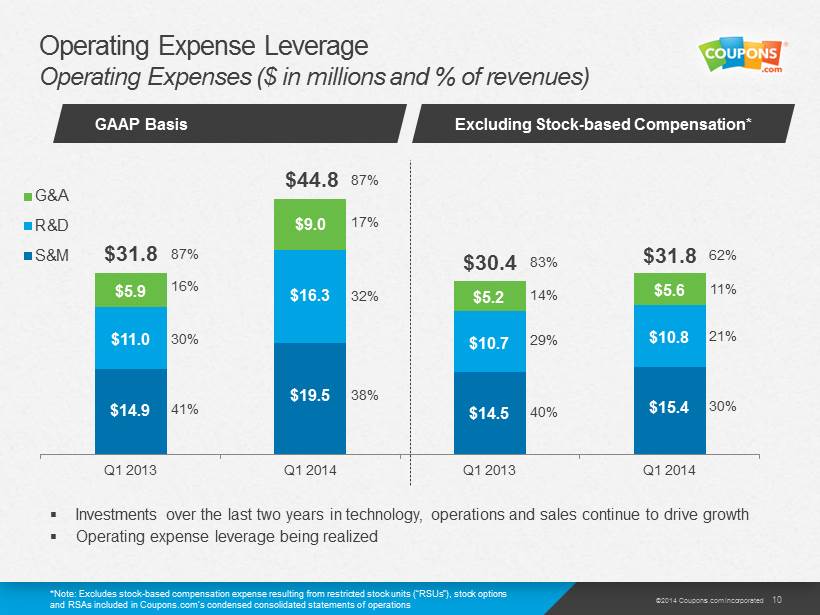
©2014 Coupons.com Incorporated Operating Expense Leverage Operating Expenses ($ in millions and % of revenues) 10 Q1 2013 Q1 2014 Q1 2013 Q1 2014 G&A R&D S&M $14.9 $19.5 $11.0 $16.3 $5.9 $9.0 $31.8 $44.8 87% 16% 30% 41% 87% 17% 32% 38% $15.4 $10.8 $5.2 $31.8 29% 40% 62% 11% 21% 30% 14% GAAP Basis 83% $5.6 $10.7 $14.5 $30.4 ▪ Investments over the last two years in technology, operations and sales continue to drive growth ▪ Operating expense leverage being realized *Note : Excludes stock - based compensation expense resulting from restricted stock units (“RSUs ”), stock options and RSAs included in Coupons.com’s condensed consolidated statements of operations Excluding Stock - based Compensation *
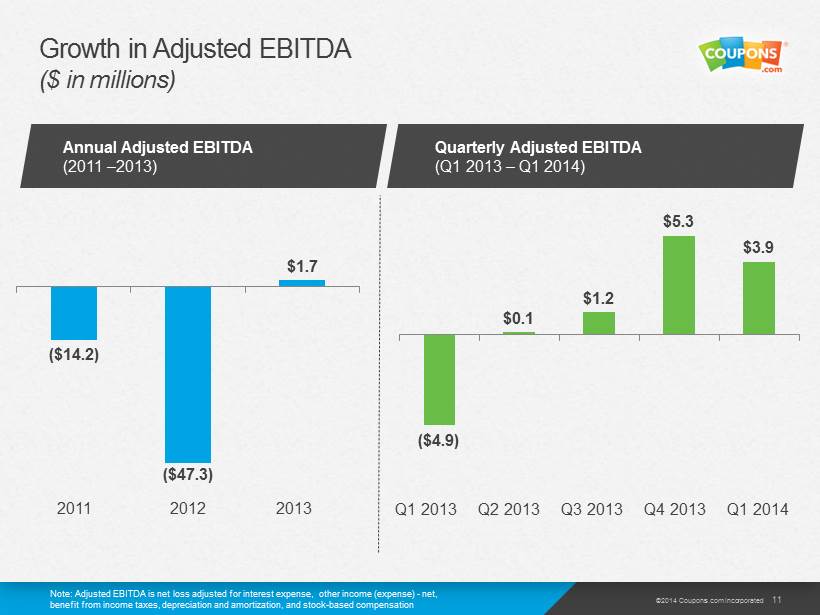
©2014 Coupons.com Incorporated Growth in Adjusted EBITDA ($ in millions) 11 Note: Adjusted EBITDA is net loss adjusted for interest expense, other income (expense ) - net, benefit from income taxes, depreciation and amortization, and stock - based compensation Annual Adjusted EBITDA (2011 – 2013) Quarterly Adjusted EBITDA (Q1 2013 – Q1 2014) ($4.9) $0.1 $1.2 $5.3 $3.9 ($14.2) ($47.3) $1.7 2011 2012 2013 Q1 2013 Q2 2013 Q3 2013 Q4 2013 Q1 2014
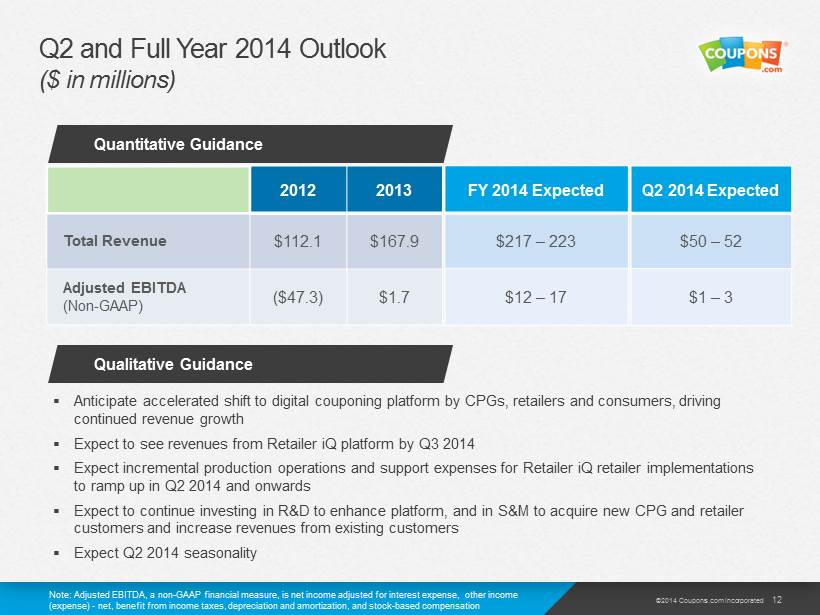
©2014 Coupons.com Incorporated Q2 and Full Year 2014 Outlook ($ in millions) 12 2012 2013 Total Revenue $112.1 $167.9 Adjusted EBITDA (Non - GAAP) ($47.3) $1.7 Note: Adjusted EBITDA, a non - GAAP financial measure, is net income adjusted for interest expense, other income ( expense) - net , benefit from income taxes, depreciation and amortization, and stock - based compensation FY 2014 Expected $217 – 223 $12 – 17 ▪ Anticipate accelerated shift to digital couponing platform by CPGs, retailers and consumers, driving continued revenue growth ▪ Expect to see revenues from Retailer iQ platform by Q3 2014 ▪ Expect incremental production operations and support expenses for Retailer iQ retailer implementations to ramp up in Q2 2014 and onwards ▪ Expect to continue investing in R&D to enhance platform, and in S&M to acquire new CPG and retailer customers and increase revenues from existing customers ▪ Expect Q2 2014 seasonality Q2 2014 Expected $50 – 52 $1 – 3 Quantitative Guidance Qualitative Guidance

©2014 Coupons.com Incorporated Q&A

©2014 Coupons.com Incorporated Appendix
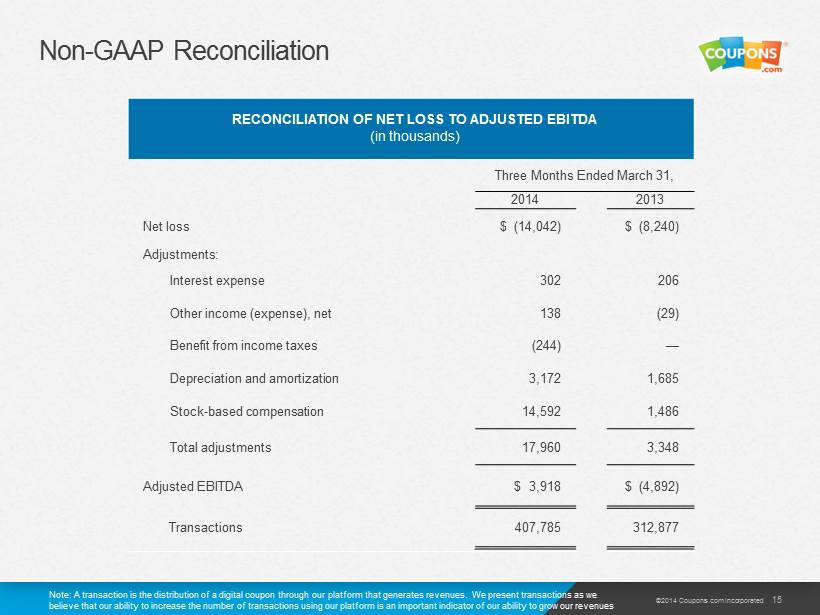
©2014 Coupons.com Incorporated Non - GAAP Reconciliation 15 RECONCILIATION OF NET LOSS TO ADJUSTED EBITDA (in thousands) Three Months Ended March 31, 2014 2013 Net loss $ ( 14,042) $ ( 8,240) Adjustments: Interest expense 302 206 Other income (expense), net 138 ( 29) Benefit from income taxes ( 244) — Depreciation and amortization 3,172 1,685 Stock - based compensation 14,592 1,486 Total adjustments 17,960 3,348 Adjusted EBITDA $ 3,918 $ ( 4,892) Transactions 407,785 312,877 Note: A transaction is the distribution of a digital coupon through our platform that generates revenues. We present transactions as we believe that our ability to increase the number of transactions using our platform is an important indicator of our ability t o g row our revenues