
©2015 Coupons.com Incorporated. Confidential and Proprietary 1

©2015 Coupons.com Incorporated. Confidential and Proprietary Coupons.com Incorporated Q4 and Full Year 2014 Financial Results February 9 , 2015 2
©2015 Coupons.com Incorporated. Confidential and Proprietary This presentation and the accompanying oral presentation contain “forward - looking” statements that are based on our management’s beliefs and assumptions and on information currently available to management, including Coupons.com’s projected first quarter and full year 2015 results, its plans, including product launches, strategy, and business outlook. Coupons.com operates in very competitive and rapidly changing environments, and new risks may emerge from time to time. It is n ot possible for Coupons.com’s management to predict all risks, nor can it assess the impact of all factors on our business or the extent to which any factor, or combinat ion of factors, may cause actual results to differ materially from those contained in any forward - looking statements Coupons.com may make. Forward - looking statements should not be read as gu arantees of future performance or results, and will not necessarily be accurate indications of the times at, or by, which such performance or results will be achieved. Forw ard - looking statements are based on information available to Coupons.com’s management at the date of this release and its management’s good faith belief as of such date with respect t o f uture events, and are subject to risks and uncertainties that could cause actual performance or results to differ materially from those expressed in or suggested by the fo rward - looking statements. Important factors that could cause such differences include, but are not limited to, Coupons.com’s financial performance, including its revenues, margins, co sts, expenditures, growth rates and operating expenses, and its ability to generate positive cash flow and become profitable; the amount and timing of digital promotions b y C PGs, which are affected by budget cycles, economic conditions and other factors; the company’s ability to adapt to changing market conditions; the company’s ability to retain a nd expand its business with existing CPGs and retailers; the company’s ability to maintain and expand the use by consumers of digital promotions on its platforms; the company’s abili ty to attract and retain third - party advertising agencies, performance marketing networks and other intermediaries; the company’s ability to effectively manage its growth; the effects of increased competition in the company’s markets and its ability to compete effectively; the company’s ability to effectively grow and train its sales team; the company’s ability to obtain new CPGs and retailers and to do so efficiently; the company’s ability to maintain, protect and enhance its brand and intellectual property; costs associated with defending intel lec tual property infringement and other claims; the company’s ability to successfully enter new markets; the company’s ability to acquire and integrate new companies; the compan y’s ability to develop and launch new services and features; the company’s ability to attract and retain qualified employees and key personnel. These factors, together with those described in greater detail in Coupons.com’s quarterly report on Form 10 - Q filed with the SEC on November 6, 2014, and in Coupons.com’s future quarterly reports on Form 10 - Q, annual r eports on Form 10 - K and other filings made with the SEC, may cause our actual results, performance or achievements to differ materially and adversely from those anticipated or implied by our forward - looking statements. Coupons.com disclaims any obligation to update information contained in these forward - looking statements whether as a result of new information, future events, or otherwise. In addition to the U.S. GAAP financials, this presentation includes certain non - GAAP financial measures. The non - GAAP measures have limitations as analytical tools and you should not consider them in isolation or as a substitute for an analysis of our results under U.S. GAAP. There are a number of limitations related to the use of these non - GAAP financial measures versus their nearest GAAP equivalents. For example, other companies may calculate non - GAAP financial measures differently or may use other measures to evaluate their performance, all of which could reduce the usefulness of our non - GAAP financial measures as tools for comparison. Coupons.com considers these non - GAAP financial measures to be important because they provide useful measures of the operating performance of the company, exclusiv e o f unusual events or factors that do not directly affect what we consider to be our core operating performance, and are used by the company's management for that purpose. The us e of non - GAAP measures is further discussed in the accompanying press release, which has been furnished to the SEC on Form 8 - K and posted on Coupons.com’s website. The press release also defines our non - GAAP financial measures. A reconciliation between GAAP and non - GAAP measures can also be found in the accompanying press release and in the A ppendix hereto. Forward - Looking Statements 3
©2015 Coupons.com Incorporated. Confidential and Proprietary Steven Boal Founder, President and CEO 4
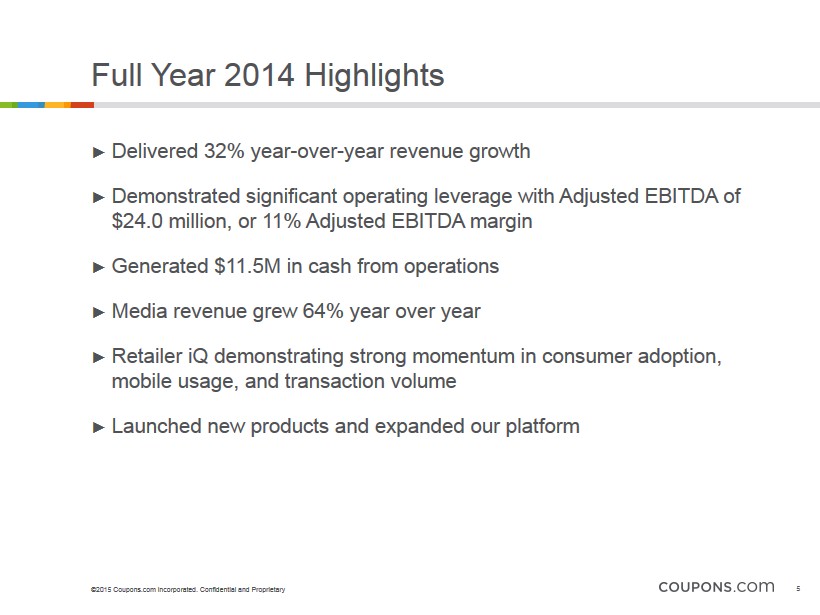
©2015 Coupons.com Incorporated. Confidential and Proprietary ► Delivered 32% year - over - year revenue growth ► Demonstrated significant operating leverage with Adjusted EBITDA of $24.0 million, or 11% Adjusted EBITDA margin ► Generated $11.5M in cash from operations ► M edia revenue grew 64% year over year ► Retailer iQ demonstrating strong momentum in consumer adoption, mobile usage, and transaction volume ► Launched new products and expanded our platform Full Year 2014 Highlights 5

© 2014 Coupons.com Incorporated. Proprietary and Confidential CPG Trade Promotion Spend $ 200B Large and Growing Market Opportunity CPG Advertising Spend $34B CPG Coupons Distributed 315B Transactions 1.3B Source: POI, Accenture, IDC, and NCH *First Cooperative Free - standing Insert Introduced in 1970 2013
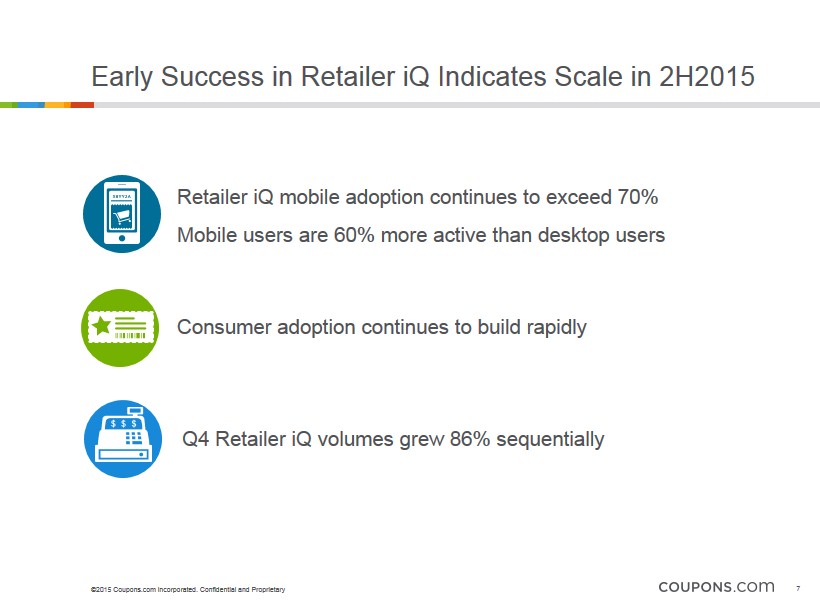
©2015 Coupons.com Incorporated. Confidential and Proprietary Early Success in Retailer iQ Indicates Scale in 2H2015 7 Retailer iQ mobile adoption continues to exceed 70% M obile users are 60% more active than desktop users Consumer adoption continues to build rapidly Q4 Retailer iQ volumes grew 86% sequentially
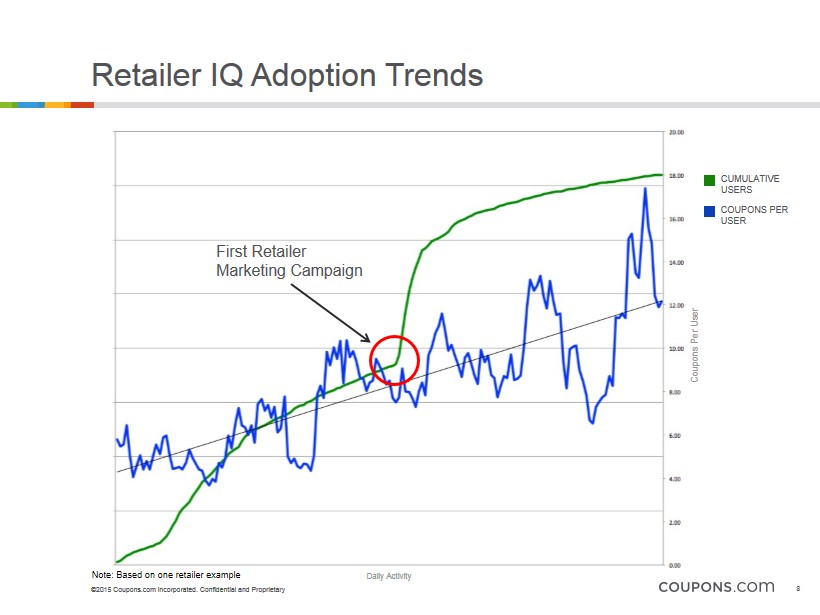
©2015 Coupons.com Incorporated. Confidential and Proprietary Retailer IQ Adoption Trends 8 First Retailer Marketing Campaign CUMULATIVE USERS COUPONS PER USER Coupons Per User Daily Activity Note: Based on one retailer example
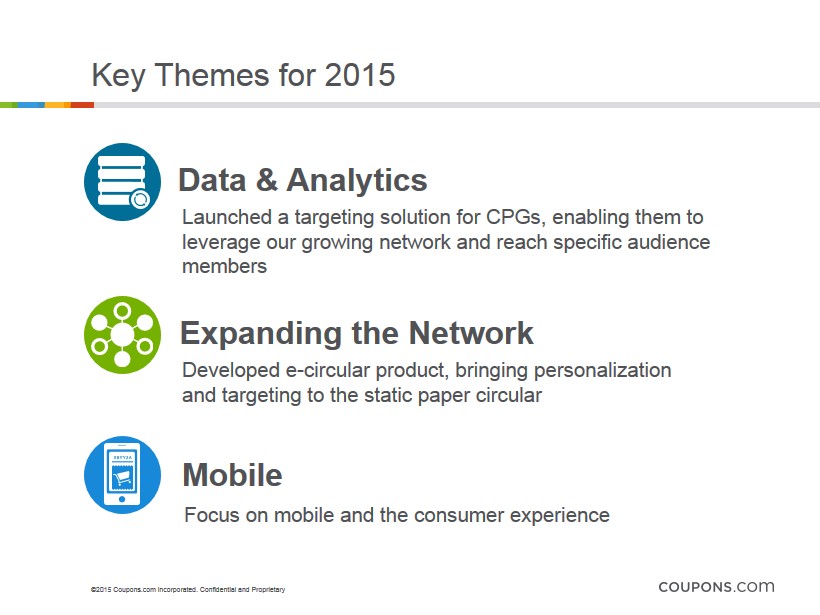
©2015 Coupons.com Incorporated. Confidential and Proprietary Key Themes for 2015 Launched a targeting solution for CPGs, enabling them to leverage our growing network and reach specific audience members Developed e - circular product, bringing personalization and targeting to the static paper circular F ocus on mobile and the consumer experience Mobile Data & Analytics 9 Expanding the Network
©2015 Coupons.com Incorporated. Confidential and Proprietary Mir Aamir CFO and COO 10
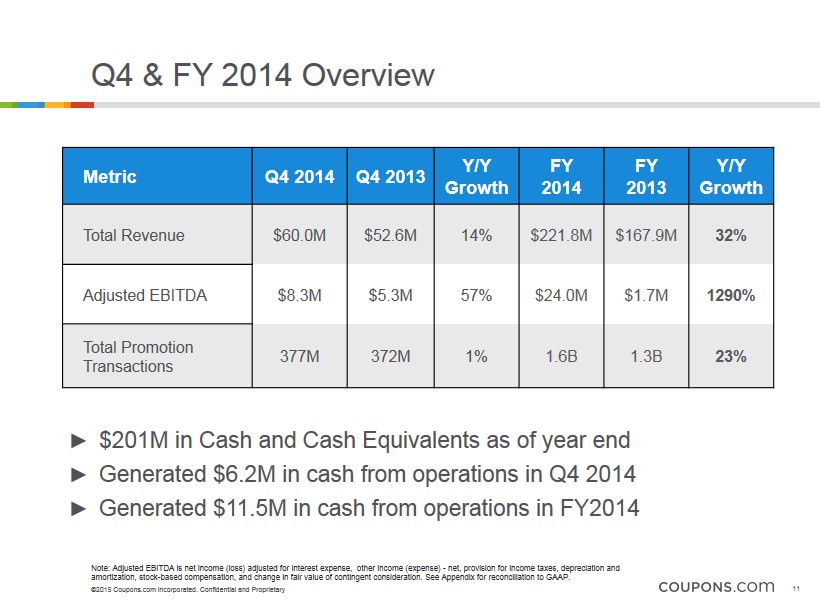
©2015 Coupons.com Incorporated. Confidential and Proprietary Q4 & FY 2014 Overview Metric Q4 2014 Q4 2013 Y/Y Growth FY 2014 FY 2013 Y/Y Growth Total Revenue $60.0M $52.6 M 14% $221.8M $167.9M 32% Adjusted EBITDA $8.3M $5.3M 57% $24.0M $1.7M 1290% Total Promotion Transactions 377M 372M 1% 1.6B 1.3B 23% ► $201M in Cash and Cash Equivalents as of year end ► Generated $6.2M in cash from operations in Q4 2014 ► Generated $11.5M in cash from operations in FY2014 Note: Adjusted EBITDA is net income (loss) adjusted for interest expense, other income (expense) - net, provision for income ta xes, depreciation and amortization, stock - based compensation, and change in fair value of contingent consideration. See Appendix for reconciliation to GAAP. 11

©2015 Coupons.com Incorporated. Confidential and Proprietary Revenue Components ($ in millions ) Q4 2013 Q4 2014 Promotions Media & Advertising $42.1 $10.5 $52.6 $60.0 $45.9 $ 14.1 12 FY 2013 FY 2014 Promotions Media & Advertising $167.9 $221.8 $135.9 $32.0 $169.2 $52.6
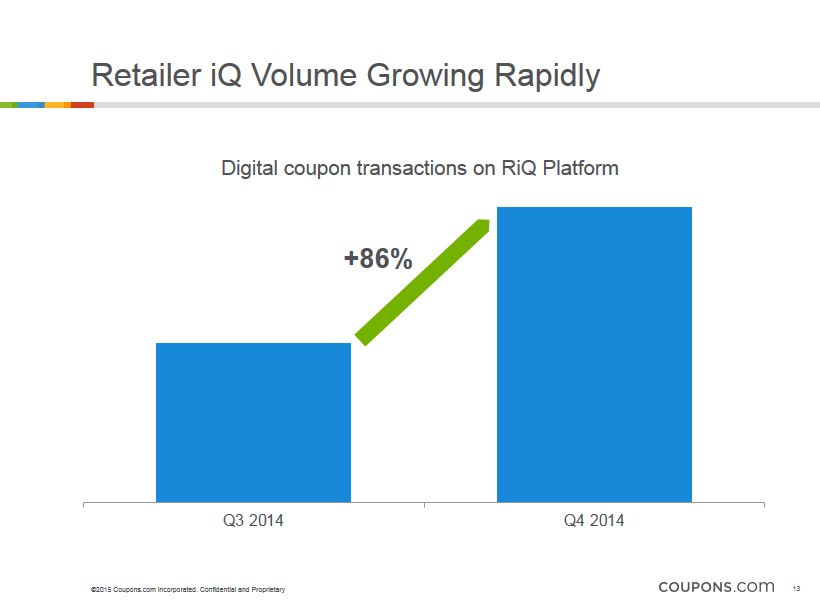
©2015 Coupons.com Incorporated. Confidential and Proprietary Retailer iQ Volume Growing Rapidly Q3 2014 Q4 2014 Digital coupon transactions on RiQ Platform +86% 13
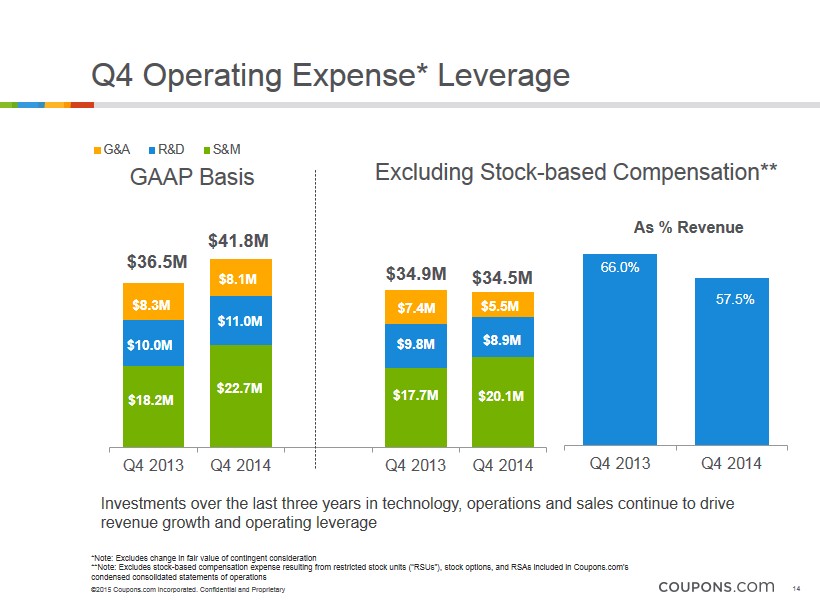
©2015 Coupons.com Incorporated. Confidential and Proprietary Q4 Operating Expense* Leverage 0 5 10 15 20 25 30 35 40 45 50 Q4 2013 Q4 2014 Q4 2013 Q4 2014 G&A R&D S&M $9.8M $18.2M $22.7M $10.0M $11.0M $8.3M $36.5M $8.1M $7.4M $20.1M $8.9M $17.7M $34.5M $5.5M $34.9M $ 41 .8M Investments over the last three years in technology, operations and sales continue to drive revenue growth and operating leverage GAAP Basis Excluding Stock - based Compensation** *Note: Excludes change in fair value of contingent consideration **Note: Excludes stock - based compensation expense resulting from restricted stock units (“RSUs”), stock options, and RSAs includ ed in Coupons.com’s condensed consolidated statements of operations 14 66.0% 57.5% Q4 2013 Q4 2014 As % Revenue
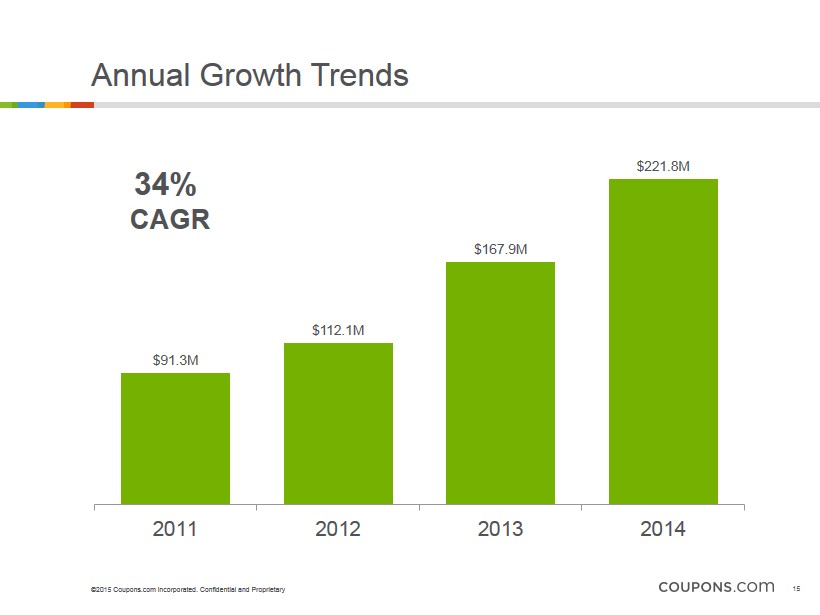
©2015 Coupons.com Incorporated. Confidential and Proprietary Annual Growth Trends $91.3M $112.1M $167.9M $ 221.8M 2011 2012 2013 2014 34% CAGR 15
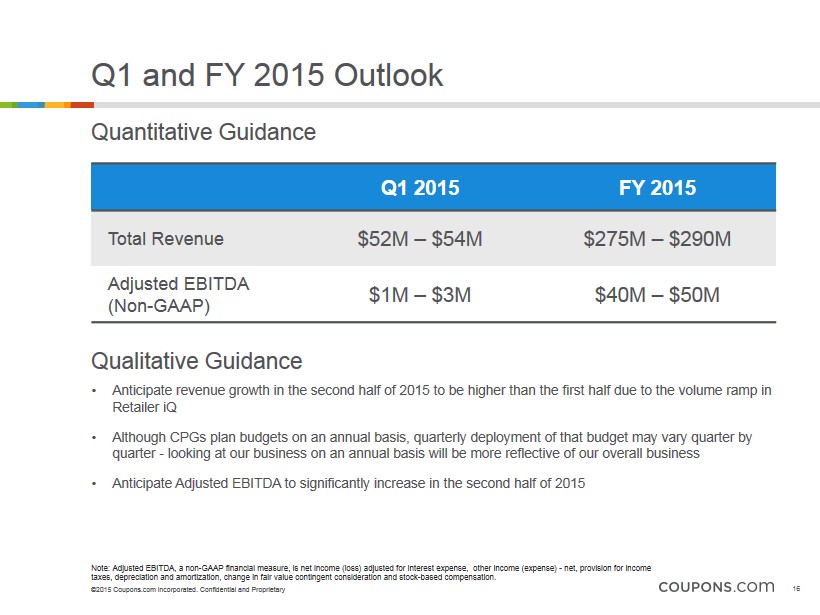
©2015 Coupons.com Incorporated. Confidential and Proprietary Q1 and FY 2015 Outlook Q1 2015 FY 2015 Total Revenue $52M – $54M $275M – $290M Adjusted EBITDA (Non - GAAP) $1M – $3M $40M – $50M • Anticipate revenue growth in the second half of 2015 to be higher than the first half due to the volume ramp in Retailer iQ • Although CPGs plan budgets on an annual basis, quarterly deployment of that budget may vary quarter by quarter - looking at our business on an annual basis will be more reflective of our overall business • Anticipate Adjusted EBITDA to significantly increase in the second half of 2015 Quantitative Guidance Qualitative Guidance Note: Adjusted EBITDA, a non - GAAP financial measure, is net income (loss) adjusted for interest expense, other income (expense) - net, provision for income taxes, depreciation and amortization, change in fair value contingent consideration and stock - based compensation. 16

©2015 Coupons.com Incorporated. Confidential and Proprietary Q&A 17

©2015 Coupons.com Incorporated. Confidential and Proprietary Appendix 18
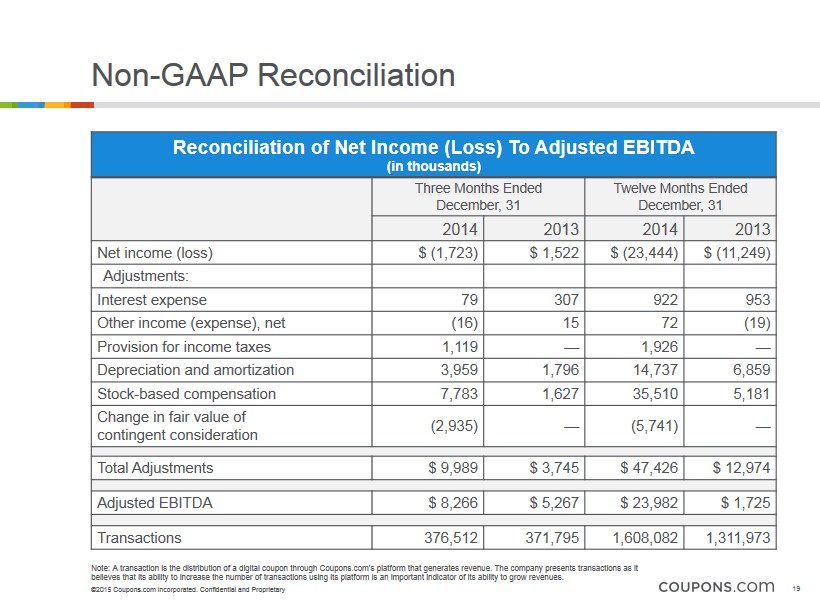
©2015 Coupons.com Incorporated. Confidential and Proprietary Non - GAAP Reconciliation Reconciliation of Net Income ( Loss) To Adjusted EBITDA (in thousands) Three Months Ended December, 31 Twelve Months Ended December, 31 2014 2013 2014 2013 Net income (loss) $ (1,723) $ 1,522 $ (23,444) $ (11,249) Adjustments: Interest expense 79 307 922 953 Other income (expense), net (16) 15 72 (19) Provision for income taxes 1,119 — 1,926 — Depreciation and amortization 3,959 1,796 14,737 6,859 Stock - based compensation 7,783 1,627 35,510 5,181 Change in fair value of contingent consideration (2,935) — (5,741) — Total Adjustments $ 9,989 $ 3,745 $ 47,426 $ 12,974 Adjusted EBITDA $ 8,266 $ 5,267 $ 23,982 $ 1,725 Transactions 376,512 371,795 1,608,082 1,311,973 Note: A transaction is the distribution of a digital coupon through Coupons.com’s platform that generates revenue. The company presents transactions as it believes that its ability to increase the number of transactions using its platform is an important indicator of its ability to grow revenues . 19