| Q4 2020 FINANCIAL RESULTS AND BUSINESS UPDATES | 5
|

Retail Partnerships
Our retail partnerships and network thrived in FY 2020. In total we added four partnerships to our network including Shipt, 7-Eleven, Rite Aid and Hy-Vee in FY 2020. We are pleased to announce we just signed our first Automotive vertical retail partnership a few weeks ago, demonstrating the strength, extensibility and scalability of our network.
| • | Our retail performance media (RPM) solution continues to gain market traction. |
| o | In FY 2020, we saw an increase of over 66% in bookings dollars from our CPG customers utilizing RPM on our retailer network versus the prior year. |
| o | Our RPM retailers saw approximately a 58% increase in alternative revenue streams (excluding revenue from our Retailer iQ platform, which many of these retailers also utilize) in FY 2020 as compared to the prior year. We look to continue to grow this number as we power digital solutions that drive increased sales for our partners and measurable ROI for our customers. In general, we believe alternative revenue streams will become increasingly important in 2021 and beyond as we enter a post-pandemic world in which consumers have more options for food consumption as we see more openings and a return to dining out. This could result in retailers facing challenging competitive environments with increased pricing and margin pressure. |
| • | We now have three retailers live on our sponsored search platform—including Rite Aid which just launched in Q4—with growing interest from others in adding this solution. |
The shift to digital collaborative spend programs, with retailers looking to CPGs to commit a percentage of their spend on their digital platforms, continues to progress. This is a strategic focus for retailers who want to utilize their digital platforms powered by Quotient and for CPGs who want to reach their shared consumers at every touch point along the path to purchase, while having the flexibility to change their campaigns in near real-time to achieve the best ROIs.
| Q4 2020 FINANCIAL RESULTS AND BUSINESS UPDATES | 6
|
| • | Our top three retailers who have put these programs in place continue to see success. We believe we will continue to see retailers and CPGs working together in a similar model going forward, as digital is here to stay. |
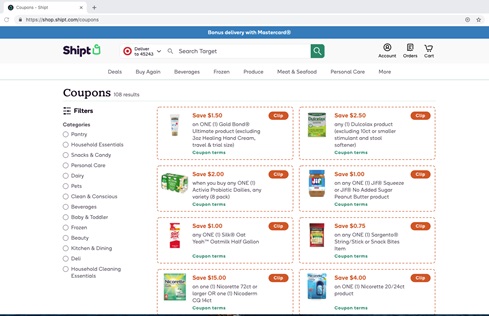
| • | Lastly in Q4, Shipt launched its coupon gallery (or coupon shelf), powered by Quotient, on their site. More recently, they went live with this solution on their app. Although we are in the early stages, we see additional opportunities with this partner to potentially add more solutions over time. This is also another solution for our customers when they are looking to deploy national digital promotional spend. |
| Q4 2020 FINANCIAL RESULTS AND BUSINESS UPDATES | 7
|
Awards & Social Update
Quotient’s social solutions continue to garner interest, not only from customer demand but also by the industry. In Q4, we were a finalist for the 2020 Digiday “Best Influencer Marketing Platform” Technology Award.
Quotient’s Social-Influencer solution continues to rise to the varied challenges of this evolving environment. We continue to successfully engage consumers with meaningful content through even the most turbulent times thanks to our winning formula for success, including analyzing past and ongoing behavior and trend data.
| • | In 2020, we ramped up our social efforts and saw 17% growth in revenue, a 15% increase in the number of advertisers investing with Quotient for social activations and a 24% increase in the number of total social campaigns launched—all metrics compared to the prior year. |
| • | Historically, brands invested in our social solution with a focus on driving in-store sales. However, with the increase in eCommerce driven by new consumer behavior over the last year, we were able to unlock budgets traditionally ear-marked for in-store to eCommerce objectives. We saw significant growth in campaigns where the primary KPI was add-to-cart directly from the paid ad placement on social media. We expect this trend to continue in FY 2021. |
| • | With social providing increased storytelling capabilities as compared to other media formats, advanced audience targeting with our proprietary shopper data and proven results married with our ability to measure incremental sales through third party studies, we believe our social solutions will become a larger part of our clients’ media playbooks for our RPM partners and beyond in FY 2021. |
| Q4 2020 FINANCIAL RESULTS AND BUSINESS UPDATES | 8
|
Solution Updates and Releases
Brands, retailers and consumers continue to know Quotient as a company that focuses on innovation and delivering value for our key stakeholders. We continuously look to improve and update our platforms and solutions while adding new products as needed to drive results or favorable outcomes through value-add capabilities.
Digital Out of Home (DOOH): Our ability to use exclusive shopper data to identify the right screens and match them to the right audiences combined with performance measurement continues to drive our customers to add this offering to their campaigns. We believe that driving an end-to-end solution as part of an omnichannel strategy is fueling growth in this space, as evidenced by the portfolio of Quotient customers/clients and agency partners seeking to expand their data and consumer-driven approaches to adopting DOOH.
| • | We recently announced our partnership with VIOOH, a leading marketplace for the programmatic selling of out-of-home (OOH) advertising. This partnership provides agencies and advertisers with access to inventory in the VIOOH marketplace, such as JCDecaux North America, and enables them to activate against it with exclusive data and insights. |
| • | At the end of FY 2020 we had inventory of over 174,000+ screens nationwide. This number continues to grow as we onboard screens with our partners in FY 2021. We are currently seeing traffic with over 80 vendors/publishers and are onboarding more in Q1 2021. We are continuously looking to grow our inventory and supply to maximize opportunities for our clients. |
| • | With DOOH, we can be in venues where visitation is higher or recovering as conditions evolve, and dynamically adjust impression delivery to quickly connect our brand message with target shoppers. Our customers are data-driven and look for the statistics and measurement results that we can provide to them. This in turn has resulted in a positive impact as they continue to have increased interest in our DOOH solution. |
| Q4 2020 FINANCIAL RESULTS AND BUSINESS UPDATES | 9
|
National Rebates Solution: Recently launched in the beginning of Q4, we continue to see demand for our National Rebates Solution on our Coupons.com app. Consumers welcome the option to have more choice in how and where they save while brands appreciate the ability to execute their promotions in one place with consistent data and measurement.
| • | Since October 2020, when we went live with this offering, we saw approximately 70 CPGs activate this solution in FY 2020. Momentum continues to grow, with customers adding this solution as part of their campaigns in early FY 2021. |
| • | We believe we will see continued demand for this solution as brands look for more opportunities to move away from the FSI and paper circulars to digital national offerings and consumers look for value and ways to save during these challenging economic times. |
Growth in eCommerce Channel: As noted in November at our Investor Day, eCommerce for online grocery is accelerating. Online grocery is projected to account for 21.5% of total grocery sales by 2025, or $250 billion. Also, as discussed with the roll-out of our three-year forecast, we believe this metric is closely aligned with our opportunities for growth as we see more spend shifting to digital.
| • | Momentum for sponsored search continued in Q4, as the number of CPGs who booked a sponsored search campaign increased approximately 30% compared to Q3 2020. We have seen consistent sequential quarter-over-quarter growth in bookings for this offering since adding it to our portfolio and believe demand will only continue as online shopping has become integrated for most consumers in the grocery purchasing experience. |
| Q4 2020 FINANCIAL RESULTS AND BUSINESS UPDATES | 10
|
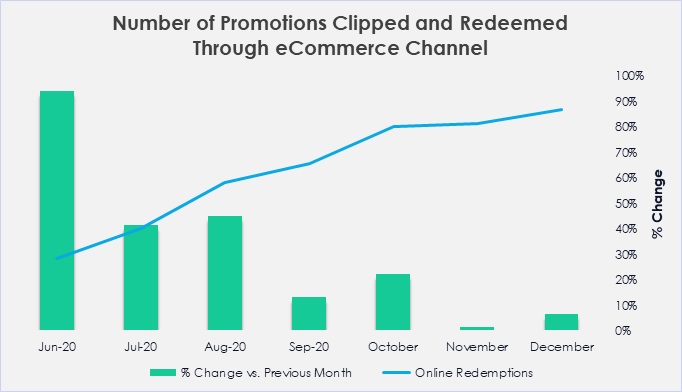
| • | As illustrated in the graph below, the number of redemptions from our eCommerce channel increased 52% in Q4 2020 over Q3 2020 as consumers continue to utilize online grocery sales channels. This was at a slower pace versus previous quarters but higher than the overall increase in the number of redemptions, which includes in-store. This is not unexpected, as our data and recent third-party publications have noted that consumers still enjoy shopping in-store. |
| • | In a recent issue of Today’s Grocer, Norm Chait, Director of OOH at Ubimo, a Quotient company, commented that, despite explosive growth in eCommerce during COVID-19, 90.4% of consumers still make at least one in-person shopping trip per week. This data came from a recent survey by Ubimo that polled more than 1,000 consumers to determine how shopping behavior has changed since the pandemic began. |
| • | As mixed-mode shopping continues, where consumers combine in-store buying with online purchases, brands and retailers turn to Quotient for comprehensive and cohesive brand-building and sales-driving opportunities that engage shoppers with consistent, targeted messaging throughout their path to purchase. |
| Q4 2020 FINANCIAL RESULTS AND BUSINESS UPDATES | 11
|
“As lockdowns went into effect, consumers shifted to e-commerce .... The online demand was absolutely tremendous, accelerating the trend of shoppers shifting to e-commerce by as much as 10 years in a few weeks.”
- Jeff Swearingen, SVP, PepsiCo
| Q4 2020 FINANCIAL RESULTS AND BUSINESS UPDATES | 12
|
In Summary
We closed the year strong as we utilized our proprietary and/or exclusive data, omnichannel capabilities, and integrated media and promotions to collaborate and deliver results for our customers and partners as well as better consumer experiences for shoppers.
With our focus on sales and marketing effectiveness in 2020, as well as the long-term health of the business after the pandemic-related disruptions, we delivered increased revenue of approximately 45% in the second half of 2020 over the first half of 2020. We believe market tailwinds, especially the shift to digital, and the growth drivers we outlined throughout 2020, will continue to drive momentum in 2021 and beyond. We are already witnessing this in our January bookings and Q1 pipeline.
This was a challenging year for many, including our employees—most of whom were working remotely for the majority of the twelve months. Yet the energy, dedication and perseverance of our team remained strong and acutely focused on helping deliver for our customers, partners and consumers as they navigated these unchartered waters. This dedication does not go overlooked and is what makes our company great. Our nimbleness and focus on staying ahead of industry and market trends, combined with our relationships with our key stakeholders, continue to position us as a market leader. We look forward to building upon our 2020 achievements in FY 2021 and beyond.
Sincerely,
|  |
| Steven Boal | Pamela Strayer |
| Chief Executive Officer | Chief Financial Officer |
| Q4 2020 FINANCIAL RESULTS AND BUSINESS UPDATES | 13
|
Full Year 2020 Summary Results
| • | We delivered revenue of $445.9 million, demonstrating growth of 2% over FY 2019.
|
| • | GAAP gross margin was 37.7%, compared to 39.6% in FY 2019.
|
| • | Non-GAAP gross margin was 45.8%, compared to 45.0% in FY 2019.
|
| • | GAAP operating expenses were 49.2% of revenue, compared to 45.9% of revenue in FY 2019.
|
| • | Non-GAAP operating expenses were $165.4 million and 37.1% of revenue, compared to the prior year of $158.9 million and 36.4% of revenue.
|
| • | We recorded a GAAP net loss of $65.4 million, compared to a net loss of $37.1 million in FY 2019. The increase in GAAP net loss from the prior year is due primarily to an increase in fair value of contingent consideration and a one-time charge to settle a contract dispute with one of our retailers as well as certain acquisition-related costs. Net Loss Per Share was $0.72 compared to $0.41 in FY 2019.
|
| • | Adjusted EBITDA was $46.0 million, representing a 10.3% margin.
|
| • | We ended the year with cash and cash equivalents of $222.8 million. |
Fourth Quarter 2020 Summary Results
| • | We delivered revenue of $142.5 million, up 20% over Q4 2019 and up 18% over Q3 2020 on a GAAP basis. |
| Q4 2020 FINANCIAL RESULTS AND BUSINESS UPDATES | 14
|
| • | Excluding approximately $10 million from a portion of our media business that was exited in Q3 2020, revenue growth was 31.1% over Q4 2019.
|
| • | GAAP gross margin was 35.1%, compared to 39.1% in Q4 2019.
|
| • | Non-GAAP gross margin was 45.1%, compared to 44.3% in Q4 2019.
|
| • | GAAP operating expenses were 50.3% of revenue, compared to 44.8% of revenue in Q4 2019.
|
| • | Non-GAAP operating expenses were $48.4 million and 34.0% of revenue, compared to the prior year of $42.9 million and 36.2% of revenue.
|
| • | We recorded a GAAP net loss of $25.3 million, compared to a net loss of $9.6 million in Q4 2019. The increase in GAAP net loss from the prior year is due primarily to an increase in fair value of contingent consideration, a one-time charge to settle a contract dispute with one of our retailers, certain acquisition-related costs and amortization of acquired intangible assets. Net Loss Per Share in the quarter was $0.28 compared to $0.11 in Q4 2019.
|
| • | Adjusted EBITDA was $17.9 million, representing a 12.6% margin. |
Revenue Details
We delivered $142.5 million of revenue in Q4 2020, up from $118.5 million in the prior year, as CPGs put money to work from previous quarters and spend generally increased in digital media and promotions on our platform.
Media revenue was up 34% in the fourth quarter over last year, with growth across almost all media products, offset by the elimination of the media business we exited in Q3 2020. Sponsored product search and DOOH also continued to contribute growth in the fourth quarter with increased synergies between these offerings and other media products. The growth rate for media, excluding Q4 2019 revenues from the portion of the media business we exited in Q3 2020, was approximately 63% compared to the prior year quarter. This also was the first quarter media revenues surpassed promotion revenues, with media composing 52% of total revenues.
| Q4 2020 FINANCIAL RESULTS AND BUSINESS UPDATES | 15
|
Promotion revenue increased 8% over last year driven by our digital paperless solutions, up 11% over Q4 2019. Additionally, spend from early quarters in 2020 was utilized with year-end budgets.
Q4 2020 customer cohorts grew 3% year over year, driven by growth of 19% in our 40+ cohort and 6% in our 21-40 cohort, offset by a revenue decline of 6% in our top 20 cohort. We believe spending by several customers in our top 20 cohort remains down over the prior year primarily due to supply chain concerns lingering from the impact of the pandemic. On a quarterly basis, revenue from our customer cohorts grew 6% in Q4 2020 over Q3 2020—driven by increased spend from CPGs and retailers across all cohorts.
Gross Margin
GAAP gross margin in the fourth quarter was 35.1%, down 400 basis points compared to the same quarter last year. This decrease was due to a one-time charge of $6.8 million to resolve a contract-related dispute. In 2020 implementation of one of our solutions with a retailer experienced slower than expected adoption due to a variety of factors, including impacts related to the spread of COVID-19 and the retailer’s failure to perform certain obligations under the agreement. In order to resolve the disagreement between Quotient and the retailer’s respective obligations, we recognized a loss of $8.8 million to settle the matter ($2.0 million noted in Q3 2020 plus the additional $6.8 million noted above). This retailer remains a partner on our retail network.
| Q4 2020 FINANCIAL RESULTS AND BUSINESS UPDATES | 16
|
Non-GAAP gross margin in Q4 2020 was 45.1%, up 80 basis points compared to 44.3% in Q4 last year. This increase was driven primarily by product mix with higher margin media solutions, offset by lower margin media solutions. Non-GAAP gross margin declined quarter over quarter by 110 basis points. Compared to Q3 2020, Non-GAAP gross margin declined due to product mix, partly offset by increases in higher margin media solutions.
Non-GAAP gross margin excludes stock-based compensation expense, amortization of acquired intangible assets and loss contingency/settlement related to a contract dispute.
Operating Expenses
We remain focused on managing costs and investing where appropriate while driving greater efficiencies in the business. Additionally, operating expenses continue to benefit from temporarily low variable compensation and travel expenses resulting from the global pandemic. However, due to higher revenues, we saw an increase in higher commissions as well as increased spend on sales and marketing projects, which resulted in higher operating expenses than previously forecasted. As noted last quarter, we continue to expect bonus expense to return to target levels in FY 2021, which will result in higher compensation costs without taking additional headcount growth into consideration.
GAAP operating expenses increased by approximately $18.5 million in Q4 2020 over the prior year. This increase is primarily due to an increase in the fair value of contingent consideration of $13.9 million as well as increases in sales and marketing. On a quarter-over-quarter basis, GAAP operating expenses increased by $23.7 million due primarily to an increase in the fair value of contingent consideration as well as increases in sales and marketing, sales commissions and R&D expense from lower labor capitalization.
| Q4 2020 FINANCIAL RESULTS AND BUSINESS UPDATES | 17
|
As discussed above, non-GAAP operating expenses came in higher than expected with an increase of approximately $5.5 million compared to Q4 2019, primarily due to increases in headcount, higher sales and marketing expenses and higher commissions from increased revenues, offset by a decrease in travel expenses, variable compensation and other expenses related to the global pandemic.
Non-GAAP operating expenses exclude stock-based compensation, the change in fair value of contingent consideration, amortization of acquired intangible assets, certain acquisition-related costs and restructuring charges.
Adjusted EBITDA
We reported $17.9 million of Adjusted EBITDA in the fourth quarter 2020. This was driven by our increased revenues compared to the prior year, while operating expenses remained low due to savings in travel and variable compensation.
Adjusted EBITDA excludes interest expense, income taxes, depreciation and amortization; the change in fair value of contingent consideration; stock-based compensation; charges for certain acquisition-related costs; loss contingency/settlement related to a contract dispute; restructuring charges and other (income) expense, net.
Balance Sheet and Cash Flow
We continue to focus on maintaining a strong balance sheet, delivering higher than expected cash flow from operations in Q4 2020 of $13.3 million. This was primarily driven by higher accounts payable and strong collections.
We ended FY 2020 with $222.8 million in cash and cash equivalents, up $12.9 million from the prior quarter.
| Q4 2020 FINANCIAL RESULTS AND BUSINESS UPDATES | 18
|
Additionally, our Board of Directors has authorized a stock buyback program of up to $50.0 million of Quotient’s common stock, effective February 16, 2021, through a new 10B5-1 plan that expires on February 16, 2022.
Looking Forward
We believe the momentum we saw for our business in FY 2020 will continue in FY 2021. As discussed at our November Investor Day, we continue to make improvements in our gross margins through streamlined operations, self-service offerings and automation. As a result of the introduction of new product offerings and automation, we expect certain product revenues will be shifting over time from gross revenue recognition to net revenue recognition. This will not impact gross margin dollars but generally results in higher gross margin percentages. That being said, product mix still remains the biggest variable in gross margin predictability.
With the continued evolving business climate, we remain focused on the investments that are most critical to our customers, partners and consumers to stay at the forefront of innovation and leadership. We anticipate non-GAAP operating expenses for the first quarter to be approximately $46 million to $48 million.
Maintaining a strong balance sheet remains a focus, along with cash flow from operations. As mentioned earlier, we are seeing a strong bookings pipeline for Q1 2021, but we also tend to experience seasonality in the first quarter of the year. Thus, we expect revenue in Q1 to be lower than other quarters in 2021.
Business Outlook
For the first quarter of 2021, we expect revenue to be in the range of $105.0 million to $113.0 million. Predicting the mix of revenue between promotion and media remains difficult at this time.
| Q4 2020 FINANCIAL RESULTS AND BUSINESS UPDATES | 19
|
For the first quarter of 2021, we expect Adjusted EBITDA to be in the range of $0.0 million to $10.0 million.
For the first quarter of 2021, we expect operating cash flow to be in the range of $4.5 million to $9.5 million.
For the full year 2021, we expect revenue to be in the range of $490.0 million to $520.0 million.
Adjusted EBITDA for the full year 2021 is expected to be in the range of $45.0 million to $65.0 million.
We expect weighted average diluted shares outstanding for 2021 to be approximately 94.5 million.
Quotient will be participating in the following events:
| • | Colliers Virtual NDR, February 23, 2021 |
| • | Morgan Stanley TMT Virtual Conference, March 2, 2021 |
Quotient will host a conference call and live webcast today at 2:00pm PST to discuss the fourth quarter and full year 2020 financial results. To listen to a live audio webcast, please visit Quotient’s Investor Relations website at investors.quotient.com. A replay of the webcast will be available at the same website. You may also access the call and register with a live operator by dialing (866) 270-1533, or outside the U.S. (412) 317-0797, at least 15 minutes prior to the 2:00 p.m. PST start time.
| Q4 2020 FINANCIAL RESULTS AND BUSINESS UPDATES | 20
|
About Quotient Technology Inc.
Quotient Technology (NYSE: QUOT) is the leading digital media and promotions technology company that creates cohesive omnichannel brand-building and sales-driving opportunities to deliver valuable outcomes for advertisers, retailers and consumers. The Quotient platform is powered by exclusive consumer spending data, location intelligence and purchase intent data to reach millions of shoppers daily and deliver measurable, incremental sales.
Quotient partners with leading advertisers and retailers, including Clorox, Procter & Gamble, General Mills, Unilever, Albertsons Companies, CVS, Dollar General and Peapod Digital Labs, a company of Ahold Delhaize USA. Quotient is headquartered in Mountain View, California, and has offices across the US as well as in Bangalore, Paris, London and Tel Aviv. For more information visit www.quotient.com.
Quotient and the Quotient logo are trademarks or registered trademarks of Quotient Technology Inc. and its subsidiaries in the United States and other countries. Other marks are the property of their respective owners.
Forward Looking Statements
This stockholder letter includes forward-looking statements that are based on our management’s beliefs and assumptions and on information currently available to management, including our current expectations with respect non-GAAP operating expenses, revenues, Adjusted EBITDA, and operating cash flow for the first quarter of 2021, and revenue, Adjusted EBITDA, and weighted average diluted shares outstanding for fiscal year 2021; expectations about our ability to grow revenues, gross margin and Adjusted EBITDA; our expectations for our solutions, partnerships, and product launches including national rebates platform; the strength, extensibility and scalability of our retailer partnerships and network ; the benefits of changes made to our sales & marketing organizations; our ability to manage our business and liquidity during and after the COVID-19 pandemic; growth in national promotions, RPM and eCommerce; retailers’ plans to prioritize RPM; increasing the number of retailers to our retailer network; benefits of a DOOH offering; our efforts to automate and provide self-service; opportunity with long-tail CPGs; the scalability of our operating models; CPGs’ plans to reduce spending in offline free-standing inserts; the future demands and behaviors of consumers, retailers and CPGs, particularly in light of the continuing effects of the COVID-19 pandemic; the impacts of the ongoing COVID-19 pandemic, which may continue to significantly impact our business, plans, and results of operations, as well as the value of our common stock; the expected growth of, and investments in, our business generally and the expected ability to leverage investments and operating expenses.
Forward-looking statements are based on information available to and the good faith beliefs of our Management team as of the time of this call and are subject to known and unknown risks and uncertainties that could cause actual performances or results to differ materially.
| Q4 2020 FINANCIAL RESULTS AND BUSINESS UPDATES | 21
|
Additional information about factors that could potentially impact our financial results can be found in today's press release and in the risk factors identified in our Quarterly Reports on Form 10-Q filed with the SEC on November 6, 2020. We disclaim any obligation to update information contained in these forward-looking statements, whether as a result of new information, future events or otherwise.
In addition to the U.S. GAAP financials, this stockholder letter includes certain non-GAAP financial measures. The non-GAAP measures have limitations as analytical tools and you should not consider them in isolation or as a substitute for an analysis of our results under U.S. GAAP. There are a number of limitations related to the use of these non-GAAP financial measures versus their nearest GAAP equivalents. For example, other companies may calculate non-GAAP financial measures differently or may use other measures to evaluate their performance, all of which could reduce the usefulness of our non-GAAP financial measures as tools for comparison. We consider these non-GAAP financial measures to be important because they provide useful measures of the operating performance of the company, exclusive of unusual events or factors that do not directly affect what we consider to be our core operating performance and are used by our management for that purpose. The use of non-GAAP measures is further discussed in the accompanying press release, which have been furnished to the SEC on Form 8-K and posted on our website. The press release defines our non-GAAP financial measure of Adjusted EBITDA. This stockholder letter defines our non-GAAP financial measure of Adjusted EBITDA, non-GAAP Gross Margins and non-GAAP Operating Expenses. A reconciliation between GAAP and non-GAAP measures can also be found in the accompanying press release and accompanying presentation’s appendix. A reconciliation of Adjusted EB ITDA, non-GAAP Gross Margins and non-GAAP Operating Expenses, all non-GAAP guidance measures, to a corresponding GAAP measure is not available on a forward-looking basis without unreasonable efforts due to the high variability and low visibility of certain (income) expense items that are excluded in calculating Adjusted EBITDA, non-GAAP Gross Margins and non-GAAP Operating Expenses.
| Q4 2020 FINANCIAL RESULTS AND BUSINESS UPDATES | 22
|
| Q4 2020 FINANCIAL RESULTS AND BUSINESS UPDATES | 23
|
QUOTIENT TECHNOLOGY INC. |
CONDENSED CONSOLIDATED BALANCE SHEETS |
(in thousands) |
|
|
| |
| December 31,
2020 | | December 31,
2019 |
| (unaudited) | | |
Assets | | | |
Current assets: | | | |
Cash and cash equivalents | $ | 222,752 | | | $ | 224,764 | |
Accounts receivable, net | 137,649 | | | 125,304 | |
Prepaid expenses and other current assets | 18,547 | | | 22,026 | |
Total current assets | 378,948 | | | 372,094 | |
Property and equipment, net | 17,268 | | | 13,704 | |
Operating leases right-of-use-assets | 16,222 | | | 7,211 | |
Intangible assets, net | 44,898 | | | 69,752 | |
Goodwill | 128,427 | | | 128,427 | |
Other assets | 1,029 | | | 750 | |
Total assets | $ | 586,792 | | | $ | 591,938 | |
Liabilities and Stockholders' Equity | | | |
Current liabilities: | | | |
Accounts payable | $ | 15,959 | | | $ | 19,116 | |
Accrued compensation and benefits | 14,368 | | | 15,232 | |
Other current liabilities | 70,620 | | | 50,032 | |
Deferred revenues | 12,027 | | | 10,903 | |
Contingent consideration related to acquisitions | 8,524 | | | 27,000 | |
Total current liabilities | 121,498 | | | 122,283 | |
Other non-current liabilities | 18,314 | | | 7,119 | |
Contingent consideration related to acquisitions | 20,930 | | | 9,220 | |
Convertible senior notes, net | 177,168 | | | 166,157 | |
Deferred tax liabilities | 1,853 | | | 1,937 | |
Total liabilities | 339,763 | | | 306,716 | |
| | | |
Stockholders' equity: | | | | | |
Common stock | 1 | | | 1 | |
Additional paid-in capital | 698,333 | | | 671,060 | |
Accumulated other comprehensive loss | (1,001 | ) | | (916 | ) |
Accumulated deficit | (450,304 | ) | | (384,923 | ) |
Total stockholders' equity | 247,029 | | | 285,222 | |
Total liabilities and stockholders' equity | $ | 586,792 | | | $ | 591,938 | |
| Q4 2020 FINANCIAL RESULTS AND BUSINESS UPDATES | 24
|
QUOTIENT TECHNOLOGY INC. |
CONDENSED CONSOLIDATED STATEMENTS OF OPERATIONS |
(Unaudited, in thousands, except per share data) |
|
|
| |
| Three Months Ended
December 31, | | Year Ended
December 31, |
| 2020 | | 2019 | | 2020 | | 2019 |
Revenues | $ | 142,529 | | | $ | 118,532 | | | $ | 445,887 | | | $ | 436,160 | |
Cost of revenues(1) | 92,469 | | | 72,219 | | | 277,914 | | | 263,606 | |
Gross Margin | 50,060 | | | 46,313 | | | 167,973 | | | 172,554 | |
Operating Expenses: | | | | | | | |
Sales and marketing(1) | 31,124 | | | 27,541 | | | 104,527 | | | 101,244 | |
Research and development(1) | 11,358 | | | 10,771 | | | 40,316 | | | 39,076 | |
General and administrative(1) | 14,720 | | | 14,227 | | | 54,177 | | | 58,328 | |
Change in fair value of contingent consideration | 14,446 | | | 519 | | | 20,234 | | | 1,571 | |
Total operating expenses | 71,648 | | | 53,058 | | | 219,254 | | | 200,219 | |
Loss from operations | (21,588 | ) | | (6,745 | ) | | (51,281 | ) | | (27,665 | ) |
Interest expense | (3,691 | ) | | (3,539 | ) | | (14,521 | ) | | (13,955 | ) |
Other income, net | 432 | | | 1,009 | | | 1,140 | | | 5,223 | |
Loss before income taxes | (24,847 | ) | | (9,275 | ) | | (64,662 | ) | | (36,397 | ) |
Provision for (benefit from) income taxes | 458 | | | 285 | | | 719 | | | 660 | |
Net loss | $ | (25,305 | ) | | $ | (9,560 | ) | | $ | (65,381 | ) | | $ | (37,057 | ) |
| | | | | | | |
Net loss per share, basic and diluted | $ | (0.28 | ) | | $ | (0.11 | ) | | $ | (0.72 | ) | | $ | (0.41 | ) |
| | | | | | | |
Weighted-average shares used to compute net loss per share, basic and diluted | 91,300 | | | 89,123 | | | 90,412 | | | 91,163 | |
| | | | | | | |
| | | | | | | |
(1) The stock-based compensation expense included above was as follows: | | |
| | | | | | | |
| Three Months Ended
December 31, | | Year Ended
December 31, |
| 2020 | | 2019 | | 2020 | | 2019 |
Cost of revenues | $ | 479 | | | $ | 521 | | | $ | 1,743 | | | $ | 2,193 | |
Sales and marketing | 1,399 | | | 1,816 | | | 5,311 | | | 6,812 | |
Research and development | 1,108 | | | 1,225 | | | 3,831 | | | 4,804 | |
General and administrative | 4,364 | | | 4,883 | | | 17,486 | | | 18,328 | |
Total stock-based compensation | $ | 7,350 | | | $ | 8,445 | | | $ | 28,371 | | | $ | 32,137 | |
| Q4 2020 FINANCIAL RESULTS AND BUSINESS UPDATES | 25
|
QUOTIENT TECHNOLOGY INC. |
CONDENSED CONSOLIDATED STATEMENTS OF CASH FLOWS |
(in thousands) |
| |
| Year Ended December 31, |
| 2020 | | 2019 |
| (unaudited) | | |
Cash flows from operating activities: | | | |
Net loss | $ | (65,381 | ) | | $ | (37,057 | ) |
Adjustments to reconcile net loss to net cash (used in) provided by operating activities: | | | |
Depreciation and amortization | 36,352 | | | 31,437 | |
Stock-based compensation | 28,371 | | | 32,137 | |
Amortization of debt discount and issuance cost | 11,011 | | | 10,438 | |
Allowance for credit losses | 888 | | | 1,227 | |
Deferred income taxes | 719 | | | 660 | |
Change in fair value of contingent consideration, net | 20,234 | | | 1,571 | |
Impairment of capitalized software development costs | — | | | 3,579 | |
Other non-cash expenses | 3,275 | | | 2,392 | |
Changes in operating assets and liabilities: | | | |
Accounts receivable | (13,232 | ) | | (7,142 | ) |
Prepaid expenses and other current assets | 3,164 | | | (11,145 | ) |
Accounts payable and other current liabilities | 15,554 | | | (62 | ) |
Payments for contingent consideration and bonuses | (15,418 | ) | | — | |
Accrued compensation and benefits | (197 | ) | | 1,567 | |
Deferred revenues | 1,125 | | | 2,216 | |
Net cash provided by operating activities | 26,465 | | | 31,818 | |
| | | |
Cash flows from investing activities: | | | |
Purchases of property and equipment | (8,351 | ) | | (9,021 | ) |
Purchases of intangible assets | (3,018 | ) | | (14,811 | ) |
Acquisitions, net of cash acquired | — | | | (13,730 | ) |
Purchases of short-term investments | — | | | — | |
Proceeds from maturity of short-term investment | — | | | 20,738 | |
Net cash used in investing activities | (11,369 | ) | | (16,824 | ) |
| | | |
Cash flows from financing activities: | | | |
Proceeds from issuance of common stock under stock plans | 5,002 | | | 5,017 | |
Payments for taxes related to net share settlement of equity awards | (7,203 | ) | | (9,838 | ) |
Repurchases and retirement of common stock under share repurchase program | — | | | (87,097 | ) |
Principal payments on promissory note and capital lease obligations | (391 | ) | | (317 | ) |
Payments for contingent consideration | (14,582 | ) | | — | |
Net cash used in financing activities | (17,174 | ) | | (92,235 | ) |
Effect of exchange rates on cash and cash equivalents | 66 | | | (23 | ) |
Net decrease in cash and cash equivalents | (2,012 | ) | | (77,264 | ) |
Cash and cash equivalents at beginning of period | 224,764 | | | 302,028 | |
Cash and cash equivalents at end of period | $ | 222,752 | | | $ | 224,764 | |
| Q4 2020 FINANCIAL RESULTS AND BUSINESS UPDATES | 26
|
QUOTIENT TECHNOLOGY INC. |
RECONCILIATION OF NET LOSS TO ADJUSTED EBITDA |
(Unaudited, in thousands) |
| | | | | | | |
| Three Months Ended
December 31, | | Year Ended
December 31, |
| 2020 | | 2019 | | 2020 | | 2019 |
Net loss | $ | (25,305 | ) | | $ | (9,560 | ) | | $ | (65,381 | ) | | $ | (37,057 | ) |
Adjustments: | | | | | | | |
Stock-based compensation | 7,350 | | | 8,445 | | | 28,371 | | | 32,137 | |
Depreciation and amortization | 9,830 | | | 8,177 | | | 36,352 | | | 31,437 | |
| Acquisition related costs and other(1) | 7,872 |
|
| 1,091 |
|
| 12,361 |
|
| 7,670 | |
Change in fair value of contingent consideration | 14,446 | | | 519 | | | 20,234 | | | 1,571 | |
Interest expense | 3,691 | | | 3,539 | | | 14,521 | | | 13,955 | |
Other income, net | (432 | ) | | (1,009 | ) | | (1,140 | ) | | (5,223 | ) |
Provision for income taxes | 458 | | | 285 | | | 719 | | | 660 | |
| | | | | | | |
Total adjustments | $ | 43,215 | | | $ | 21,047 | | | $ | 111,418 | | | $ | 82,207 | |
| | | | | | | |
Adjusted EBITDA | $ | 17,910 | | | $ | 11,487 | | | $ | 46,037 | | | $ | 45,150 | |
(1) For the three and twelve months ended December 31, 2020, other includes restructuring charges of zero and $1.5 million, respectively, and loss contingency and settlement of $6.8 million and $8.8 million, respectively, related to a contract dispute. For the three and twelve months ended December 31, 2019, other includes restructuring charges of zero and $4.3 million, respectively. |
| Q4 2020 FINANCIAL RESULTS AND BUSINESS UPDATES | 27
|
| QUOTIENT TECHNOLOGY INC. |
| RECONCILIATION OF GROSS MARGIN TO NON-GAAP GROSS MARGIN |
(Unaudited, in thousands)
|
| | | | | | | | | | | | | | | | | |
| | | Q4 FY 19 | | | Q3 FY 20 | | | Q4 FY 20 | | | | FY 2019 | | | FY 2020 | |
| Revenues | | $ | 118,532 | | | $ | 121,116 | | | $ | 142,529 | | | | $ | 436,160 | | | $ | 445,887 | |
| | | | | | | | | | | | | | | | | | | | | | |
| Cost of revenues (GAAP) | | $ | 72,219 | | | $ | 73,603 | | | $ | 92,469 | | | | $ | 263,606 | | | $ | 277,914 | |
| (less) Stock-based compensation | | | (521 | ) | | | (442 | ) | | | (479 | ) | | | | (2,193 | ) | | | (1,743 | ) |
| (less) Amortization of acquired intangible assets | | | (5,686 | ) | | | (6,027 | ) | | | (6,930 | ) | | | | (21,555 | ) | | | (25,560 | ) |
| (less) Loss contingency/settlement related to a contract dispute | | | — | | | | (2,000 | ) | | | (6,834 | ) | | | | — | | | | (8,834 | ) |
| (less) Restructuring charges | | | — | | | | — | | | | — | | | | | — | | | | (82 | ) |
| Cost of revenues (Non-GAAP) | | $ | 66,012 | | | $ | 65,134 | | | $ | 78,226 | | | | $ | 239,858 | | | $ | 241,695 | |
| | | | | | | | | | | | | | | | | | | | | | |
| | | | | | | | | | | | | | | | | | | | | | |
| Gross margin (GAAP) | | $ | 46,313 | | | $ | 47,513 | | | $ | 50,060 | | | | $ | 172,554 | | | $ | 167,973 | |
| Gross margin percentage (GAAP) | | | 39.1 | % | | | 39.2 | % | | | 35.1 | % | | | | 39.6 | % | | | 37.7 | % |
| | | | | | | | | | | | | | | | | | | | | | |
| Gross margin (Non-GAAP)* | | $ | 52,520 | | | $ | 55,982 | | | $ | 64,303 | | | | $ | 196,302 | | | $ | 204,192 | |
| Gross margin percentage (Non-GAAP) | | | 44.3 | % | | | 46.2 | % | | | 45.1 | % | | | | 45.0 | % | | | 45.8 | % |
* Non-GAAP gross margin excludes stock-based compensation, amortization of acquired intangible assets, loss contingency/settlement related to a contract dispute, and restructuring charges.
| Q4 2020 FINANCIAL RESULTS AND BUSINESS UPDATES | 28
|
| QUOTIENT TECHNOLOGY INC. |
| RECONCILIATION OF OPERATING EXPENSES TO NON-GAAP OPERATING EXPENSES |
| (Unaudited, in thousands) |
| | | | | | | | | | | | | | | | | |
| | | Q4 FY 19 | | | Q3 FY 20 | | | Q4 FY 20 | | | | FY 2019 | | | FY 2020 | |
| Revenues | | $ | 118,532 | | | $ | 121,116 | | | $ | 142,529 | | | | $ | 436,160 | | | $ | 445,887 | |
| | | | | | | | | | | | | | | | | | | | | | |
| Sales and marketing expenses | | | 27,541 | | | | 24,555 | | | | 31,124 | | | | | 101,244 | | | | 104,527 | |
| (less) Stock-based compensation | | | (1,816 | ) | | | (1,187 | ) | | | (1,399 | ) | | | | (6,812 | ) | | | (5,311 | ) |
| (less) Amortization of acquired intangible assets | | | (675 | ) | | | (866 | ) | | | (866 | ) | | | | (2,203 | ) | | | (3,562 | ) |
| (less) Restructuring charges | | | — | | | | — | | | | — | | | | | — | | | | (526 | ) |
| Non-GAAP Sales and marketing expenses | | $ | 25,050 | | | $ | 22,502 | | | $ | 28,859 | | | | $ | 92,229 | | | $ | 95,128 | |
| Non-GAAP Sales and marketing percentage | | | 21 | % | | | 19 | % | | | 20 | % | | | | 21 | % | | | 21 | % |
| | | | | | | | | | | | | | | | | | | | | | |
| Research and development | | | 10,771 | | | | 9,744 | | | | 11,358 | | | | | 39,076 | | | | 40,316 | |
| (less) Stock-based compensation | | | (1,225 | ) | | | (1,003 | ) | | | (1,108 | ) | | | | (4,804 | ) | | | (3,831 | ) |
| (less) Restructuring charges | | | — | | | | — | | | | — | | | | | — | | | | (283 | ) |
| Non-GAAP Research and development expenses | | $ | 9,546 | | | $ | 8,741 | | | $ | 10,250 | | | | $ | 34,272 | | | $ | 36,202 | |
| Non-GAAP Research and development percentage | | | 8 | % | | | 7 | % | | | 7 | % | | | | 8 | % | | | 8 | % |
| | | | | | | | | | | | | | | | | | | | | | |
| General and administrative expenses | | | 14,227 | | | | 12,099 | | | | 14,720 | | | | | 58,328 | | | | 54,177 | |
| (less) Stock-based compensation | | | (4,883 | ) | | | (3,857 | ) | | | (4,364 | ) | | | | (18,328 | ) | | | (17,486 | ) |
| (less) Restructuring charges | | | — | | | | — | | | | — | | | | | (4,212 | ) | | | (591 | ) |
| (less) Acquisiton related costs | | | (1,065 | ) | | | (393 | ) | | | (1,039 | ) | | | | (3,407 | ) | | | (2,045 | ) |
| Non-GAAP General and administrative expenses | | $ | 8,279 | | | $ | 7,849 | | | $ | 9,317 | | | | $ | 32,381 | | | $ | 34,055 | |
| Non-GAAP General and administrative percentage | | | 7 | % | | | 6 | % | | | 7 | % | | | | 7 | % | | | 8 | % |
| | | | | | | | | | | | | | | | | | | | | | |
| Non-GAAP Operating expenses* | | $ | 42,875 | | | $ | 39,092 | | | $ | 48,426 | | | | $ | 158,882 | | | $ | 165,385 | |
| Non-GAAP Operating expense percentage | | | 36 | % | | | 32 | % | | | 34 | % | | | | 36 | % | | | 37 | % |
* Non-GAAP operating expenses excludes changes in fair value of contingent consideration, stock-based compensation, amortization of acquired intangible assets, restructuring charges, and acquisition related costs.
| Q4 2020 FINANCIAL RESULTS AND BUSINESS UPDATES | 29
|