INTRODUCING THE NEW QUOTIENT
Since I returned to Quotient two plus years ago, we have significantly transformed the Company to meet the needs of an evolving landscape, including enhancing our product portfolio, our business operations and our network expansion model. I am pleased to report that Quotient is a more agile and more efficient company, which we believe positions us well to deliver sustainable and profitable growth. Over the course of 2022, we expect to grow quarterly non-GAAP gross margin as a percentage of revenue from roughly 40% in Q1 to above 60% in Q4. If we were to exclude Albertsons from our estimates and include the expected impact of the gross to net revenue adjustments for agreements that are already signed, our Q1 non-GAAP gross margin estimate would be 50% - 55% of revenues. As a result, we expect to deliver full year 2022 adjusted EBITDA of $35 - $45 million, roughly in-line with the prior year at the mid-point, even after the loss of one of our largest partners during the year.
In the face of the global pandemic that upended the grocery business, we have restructured our sales, operations, product, engineering, finance, customer success and human resources organizations. We have also decommissioned infrastructure and legacy systems and rolled out modern, efficient ones, which include self-service capabilities that allow our partners to use the Quotient platforms on their own. This new structure provides for clearer accountability, transparency and reduces manual work, which has reenergized our teams and aligned Quotient behind a single culture and purpose. While we have made tremendous progress to date, we have plans to drive further efficiencies over the course of 2022.
We have also evolved our network partner model. Legacy partnerships that helped us to launch and build our network have been or are in the process of being restructured or replaced with ones that are more aligned to our objectives of delivering balanced,
| Q4 2021 FINANCIAL RESULTS AND BUSINESS UPDATES | 2
|

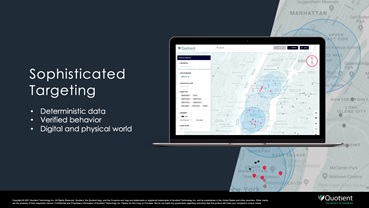
profitable growth, and greater value to our partners. Quotient is a leading digital demand partner for advertisers, primarily consumer packaged goods companies (CPGs), delivering promotions, coupons, rebates and other forms of purchase incentives. Our network offers partners broad reach to engaged shoppers, along with a set of sophisticated targeting and measurement capabilities. Today, we are thrilled to announce Amazon as the latest partner to join the Quotient promotions network, joining Microsoft, Figg, Redbox and other recently announced network partners. Additionally, we expect to announce several other exciting partners, already in various stages of implementation, over the next few months.
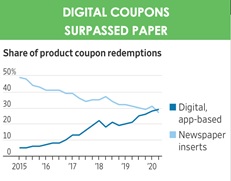
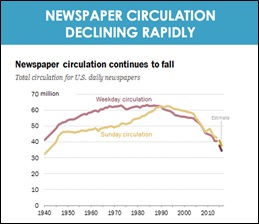
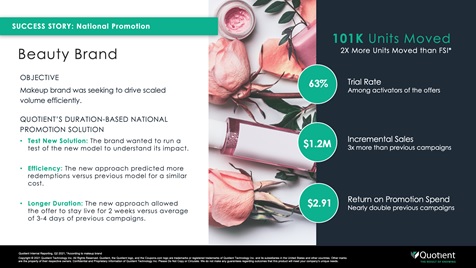
In 2021 we crossed an important milestone for the business and for the overall industry. For the first time, Quotient is now able to deliver more unit volume, at a more attractive ROI, than the traditional Free Standing Insert (FSI), the legacy newspaper coupons that have been a mainstay of the industry for many decades. As a result, we believe offline promotional spending will migrate online at an increasing rate, and that Quotient will capture a sizable portion of that spend. We aim to continue to expand the size of our promotions network throughout 2022 and expect our new partnerships to go a long way to getting us there.
| Q4 2021 FINANCIAL RESULTS AND BUSINESS UPDATES | 3
|
Turning to financial performance, in Q4 we delivered $146 million in revenue, and $12 million in adjusted EBITDA. For the full year, we delivered $521 million in revenue, and $41 million in EBITDA. Adjusted EBITDA was lower in FY’21 due to investments we made to improve our sales effectiveness and operational efficiency, and to change our business model to be more competitive. Additionally, adjusted EBITDA was negatively impacted by the well-publicized supply chain issues that led CPG customers to broadly pull back on promotional spending. Despite these headwinds, we believe we are on track to reduce operating costs and deliver higher gross margins in 2022.
The strength of our product portfolio, including recent offerings such as Promotion Amplification and Cash-Back Rebates, have helped to accelerate network partnership growth. Now that we have exited lower margin or declining businesses, such as our specialty retail business, we believe that our core offerings position us to deliver strong growth, excluding the impact of Albertsons, throughout FY’22. Below are some highlights from Q4 and expectations for 2022. Further details on our financial guidance for Q1 and full year 2022 are provided in the financial section of this document.
Promotions
| Q4 2021 FINANCIAL RESULTS AND BUSINESS UPDATES | 4
|
In 2022 we expect our national promotions business to see revenue growth of 25-30% over 2021 on a like-for-like basis, excluding Albertsons. Over the past two years, we have increasingly focused on expanding our network, and building new tools designed to make it simpler for our network partners to connect and grow volumes quickly. In addition to our digital paperless coupons, we also implemented the ability to provide cash-back rebates to shoppers, all in one fully integrated platform.
Partners large and small can now seamlessly connect to our promotions platform and create customized experiences for their users, which include digital paperless coupons, cash-back rebate coupons, and other forms of digital promotions, delivered in new and innovative ways. We look forward to sharing some of those uses of our platform over the coming weeks and months.
Just as we did for digital coupons many years ago, we have reimagined the cash-back rebate with the planned introduction of our Shopmium brand in the US later this year. Quotient has been testing rebates+media under our Shopmium brand in Europe for many years and we are now preparing to bring Shopmium, with its rich set of features and capabilities, to our US partner network, where it will become Quotient’s new consumer facing brand, replacing Coupons.com.
Shopper habits are ever evolving. Omnichannel shopping is growing at a faster pace than ever before, and shoppers are looking for different ways to engage with brands and to save money. Quotient has consolidated the multiple ways advertisers offer discounts (e.g., digital coupons, cash-back rebates, etc.) onto a single platform, providing them the ability to let shoppers decide how, where and when they want to
| Q4 2021 FINANCIAL RESULTS AND BUSINESS UPDATES | 5
|
save. Historically, advertisers, mainly CPGs, have had to make budgetary and operational decisions where and how to offer different forms of discounts. These differing tactics add to the overhead necessary to deploy and manage these programs, and ultimately lower return on investment. Quotient is addressing these long-felt challenges through an innovative, single platform for deployment of consumer promotions. Now, digital coupons, cash-back rebates, loyalty & continuity offers, and other types of promotions are available in one place, with consistent budgeting, forecasting, targeting and measurement.
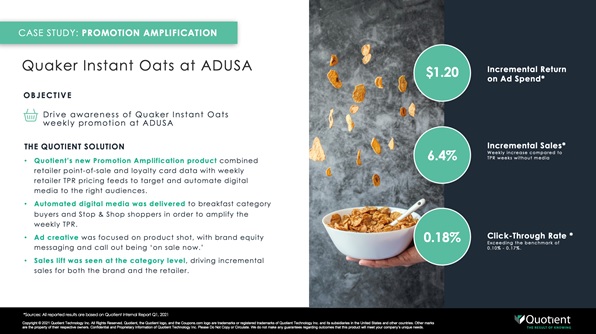
Quotient’s Promotion Amplification greatly expanded the reach and strength of our existing temporary price reduction weeks, which would normally only be communicated on-shelf. This capability allowed us to reach shoppers in a third-party digital environment and notify them of an existing sale when the product might not have made Stop & Shop’s weekly ad or email. This program was even more important as we had to make significant changes to our traditional promotion tactics during a pandemic year. Ultimately, it was an effective optimization of marketing and trade support to drive sales lift and incremental return on ad spend. — David Li, Associate Shopper Marketing Manager, PepsiCo
|
MediaWe have made equal strides in our media business over the past two years, and in 2022 we expect that our media business will deliver 15-20% revenue growth over 2021 on a like-for-like basis, excluding Albertsons and reflecting adjustments for gross to net revenue recognition. Fueled by Retail Performance Media, some exciting new partnerships that are currently in development, Quotient’s own unique
| Q4 2021 FINANCIAL RESULTS AND BUSINESS UPDATES | 6
|
audiences, and location and shopper touchpoints, we have released a series of self-service delivery and measurement capabilities that we believe will drive operating leverage as the business scales. We have also restructured the way we operate our media business, putting both technology and operational changes in place to make this business more profitable. Finally, we made changes in 2021 to increase the transparency of our media business and, beginning in Q2’22, we will be reporting the bulk of revenues net of associated media and traffic acquisition costs.
Most importantly, both our promotions and media products integrate tightly together to amplify advertiser ROIs. This is one of Quotient’s key competitive advantages, and we believe there are no comparable offerings in the marketplace.
One such example is a new feature we call Dynamic Price Integration. Quotient’s systems now connect a retailer’s sales pricing feeds (TPRs) and media creatives, and can automatically sense offer details and update media creatives in real-time. This sophisticated capability removes an extraordinary amount of manual work normally associated with these types of media deployments.
Another example, Quotient’s Promotion Amplification, continues to demonstrate strong sales lift and has expanded opportunities with both existing partners and new ones. We believe Promotion Amplification marks the beginning of the end of the paper circular, and feedback from both CPGs and retailers continues to be strong. Hundreds of millions of dollars are spent producing the weekly paper circular, and both retailers and CPGs would rather those dollars find their way to shoppers, increasing the ROI of that spend significantly.
| Q4 2021 FINANCIAL RESULTS AND BUSINESS UPDATES | 7
|
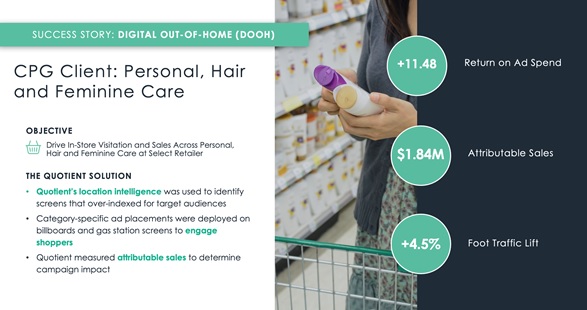
Digital out of home continues to be a shining star in the Quotient media portfolio, and will see no impact from the loss of Albertsons. Quotient’s proprietary assets and attribution technology deliver a way for advertisers to target and reach defined sets of shoppers, both in and out of stores, and then measure the direct impact on product sales. These capabilities, combined with our leading location-based DSP, are now fully self-service, and Quotient has struck deals with some of the largest out of home agencies to integrate our technology into their platforms.
Consumer traffic patterns are constantly changing, and our agency clients require the flexibility to dynamically adapt to evolving movement and visitation patterns. Our out of home DSP combines real-world consumer data with location intelligence to enable agencies to quickly build, plan and manage a truly omnichannel out of home
| Q4 2021 FINANCIAL RESULTS AND BUSINESS UPDATES | 8
|
campaign, bridging online and offline out of home touchpoints in one easy to use platform. Our technology is built for the unique challenges of out of home advertising, simplifying the complexity for agencies as their needs for quality, granularity and measurable performance continue to evolve. Our agency clients use Quotient to identify valuable customer audiences and determine how to reach them at the right moment to drive increased traffic, sales and return on investment.
Smaller CPGsSmaller CPGs continue to be a growth driver for Quotient. We have built a dedicated team to address this exciting segment of the market, and Quotient is becoming recognized by these CPGs as the place to engage to reach shoppers when they are making their buying decisions, with the same reach and scale that was historically only available to the biggest brands with the biggest budgets. In 2022 we expect this part of our business to see growth of between 40-50% over 2021, with no impact from the loss of Albertsons.
| Q4 2021 FINANCIAL RESULTS AND BUSINESS UPDATES | 9
|
In SummaryWe made important changes to our business operations and model that enhance our customer and partner experiences, while also delivering solid operating results. While we still have work to do, we believe that the hard work of our teams over the past two years – overhauling the business, developing new compelling capabilities for our customers and building valuable partnerships – has positioned Quotient to continue to lead the industry forward, and to deliver sustainable and profitable growth.
We look forward to sharing our progress with you over the coming months and quarters.
Sincerely,
|
| Steven Boal |
| |
| Chief Executive Officer |
| Q4 2021 FINANCIAL RESULTS AND BUSINESS UPDATES | 10
|
Full Year 2021 Summary Results
●
| We delivered revenue of $521.5 million, up 17% over FY’20.
|
| |
●
| GAAP gross margin was $188.8 million and 36.2% of revenue, compared to $168.0 million and 37.7% of revenue in FY’20.
|
| |
●
| Non-GAAP gross margin was $218.6 million and 41.9% of revenue, compared to $204.2 million and 45.8% of revenue in FY’20.
|
| |
●
| GAAP operating expenses were $215.4 million and 41.3% of revenue, compared to $219.3 million and 49.2% of revenue in FY’20.
|
| |
●
| Non-GAAP operating expenses were $185.6 million and 35.6% of revenue, compared to the prior year of $165.4 million and 37.1% of revenue.
|
| |
●
| We recorded a GAAP net loss for the year of $45.6 million, compared to a net loss of $65.4 million in FY’20. The decrease in GAAP net loss from the prior year is due primarily to an increase in gross profit of $20.8 million resulting from lower expenses. FY’20 included charges related to changes in fair value of contingent consideration and a one-time charge to settle a contract dispute with one of our retailers. In addition, we recorded lower amortization of acquired intangible assets compared to the prior year. Net Loss Per Share was $0.49 compared to $0.72 in FY’20.
|
| |
●
| Adjusted EBITDA was $40.6 million, representing a 7.8% margin.
|
| |
●
| We ended the year with cash and cash equivalents of $237.4 million.
|
| Q4 2021 FINANCIAL RESULTS AND BUSINESS UPDATES | 11
|
Fourth Quarter 2021 Summary Results
●
| We delivered revenue of $146.4 million, up 3% over Q4’20. |
| |
●
| GAAP gross margin was $54.4 million and 37.2% of revenue, compared to $50.1 million and 35.1% of revenue in Q4 of the prior year. |
| |
●
| Non-GAAP gross margin was $57.5 million and 39.3% of revenues, compared to $64.3 million and 45.1% of revenues in Q4 of the prior year. |
| |
●
| GAAP operating expenses were $54.7 million and 37.4% of revenue, compared to $71.6 million and 50.3% of revenue in Q4 of the prior year. |
| |
●
| Non-GAAP operating expenses were $47.4 million and 32.4% of revenue, compared to the prior year of $48.4 million and 34.0% of revenue. |
| |
●
| We recorded a GAAP net loss for the quarter of $7.1 million, compared to a net loss of $25.3 million in Q4’20. The decrease in GAAP net loss from the prior year is due primarily to lower operating expenses. The prior year quarter included charges associated with the change in fair value of contingent consideration and a one-time charge to settle a contract dispute with one of our retailers. In addition, we recorded lower amortization of intangible assets in the current quarter due to a write-down of intangible assets in Q3’21. Net Loss Per Share in the quarter was $0.08 compared to $0.28 in Q4’20. |
| |
●
| Adjusted EBITDA was $12.1 million, representing an 8.3% margin. |
Revenue Details
We delivered $146.4 million of revenue in Q4’21, up from $142.5 million in the prior year.
| Q4 2021 FINANCIAL RESULTS AND BUSINESS UPDATES | 12
|
We experienced strong growth in and mix shift toward our media business when compared to Q4’20. Media revenue was up 20% in the fourth quarter over last year, with higher growth in DOOH, sponsored search and programmatic media offerings.Promotion revenue decreased 15% on lower revenues from national promotions campaigns, as well as expected declines in digital print and specialty retail, the latter of which we have now exited entirely, and a 7% decline in our digital paperless solutions. Q4’20 benefitted from strong CPG marketing spend at the end of the year as, due to the pandemic, unused budgets from the first half of 2020 were shifted into the back half of the year. In contrast, Q4’21 experienced a pull-back in spending around national promotions budgets due to supply chain challenges.
Our guidance for Q4’21 revenue included an estimated $20 million reduction related to moving a portion of our revenues from gross revenue recognition to net revenue recognition as a result of changes we made to our commercial terms and operations. These changes took longer to implement than originally expected, which delayed recognition of the accounting change. As a result, we booked $4 million under net revenue recognition this quarter instead of the original $20 million estimate. Further, we recorded $3 million additional revenue and cost of revenue in Q4 related to Q3’21 activity. Neither of these items had any impact on gross margin dollars or adjusted EBITDA. Adjusting for these differences, we exceeded our revenue forecast by approximately $3 million on a like-for-like basis.
Customer cohorts grew 26% year over year in 2021, driven by growth across all cohorts. Our top 20 cohort, 21-40 cohort and 40+ cohort grew 21%, 42% and 28%, respectively.
Gross Margin
GAAP gross margin as a percentage of revenue in the fourth quarter was 37.2%, up 210 basis points compared to the same quarter last year. The prior year was negatively
| Q4 2021 FINANCIAL RESULTS AND BUSINESS UPDATES | 13
|
impacted by a $6.8 million charge taken to resolve a contract-related dispute. In addition, Q4’21 benefitted from lower amortization of intangibles. These savings were partially offset by lower gross margins on our media business as well as a higher mix of media revenues compared to the prior year, which carry lower margins than the promotions business.Non-GAAP gross margin as a percentage of revenue was 39.3%, down 580 basis points compared to 45.1% in Q4 last year. This decrease was driven primarily by higher distributions fees paid on certain campaigns, as well as a higher share of lower margin media in our total product mix. Gross margin as a percentage of revenue on the promotions business also declined compared to the prior year due to expected lower contributions from higher margin digital print and specialty retail, which we exited during the year.
We expect non-GAAP gross margin as a percentage of revenue to improve throughout the year as we continue to implement our business model changes and restructure our business terms and relationships. Specifically, we believe strong growth from higher margin national promotions will drive operating leverage and positive mix, while the launch of new distribution partners on our platform will drive scale. Further, as the year progresses, an increasing portion of our shopper media and shopper promotion campaigns will be recognized net of third-party media and distribution fees. The combination of these factors, along with continued cost controls, should result in growth in gross margin dollars quarter-over-quarter as we move through the year, as well as higher gross margins as a percentage of revenue.
Non-GAAP gross margin excludes stock-based compensation expense, amortization of acquired intangible assets, loss contingency/settlement related to a contract dispute, impairment of certain intangible assets, and restructuring charges.
| Q4 2021 FINANCIAL RESULTS AND BUSINESS UPDATES | 14
|
Operating ExpensesWe remain focused on managing costs and driving greater efficiencies, while investing where appropriate. GAAP operating expenses decreased from the prior year by approximately $16.9 million, primarily due to a reduction in change in fair value of contingent consideration of $13.8 million, as well as a decrease in stock-based compensation expense of $1.6 million. In addition, marketing spend and commissions expense were lower, partially offset by higher professional services, headcount and travel costs compared to the prior year. On a quarter-over-quarter basis, GAAP operating expenses increased by $1.8 million due primarily to an increase in professional service fees, commissions expense and travel costs, partially offset by lower headcount and marketing spend.
Non-GAAP operating expenses were lower compared to the prior year due to lower marketing and commissions expense, partially offset by higher professional services, headcount and travel costs. Compared to the prior quarter, non-GAAP operating expenses were up $1.9 million due to higher professional services, commissions and travel costs, partially offset by lower headcount and marketing spend.
Non-GAAP operating expenses exclude stock-based compensation, the change in fair value of contingent consideration, amortization of acquired intangible assets, certain acquisition-related costs and restructuring charges.
Adjusted EBITDA
We reported $12.1 million of adjusted EBITDA in the fourth quarter of 2021 resulting in a margin of 8%. Adjusted EBITDA was down from $17.9 million or 13% of revenue in Q4 2020 due primarily to lower non-GAAP gross margin dollars.
Adjusted EBITDA excludes interest expense, income taxes, depreciation and amortization; the change in fair value of contingent consideration; stock-based
| Q4 2021 FINANCIAL RESULTS AND BUSINESS UPDATES | 15
|
compensation; charges for certain acquisition-related costs; loss contingency/settlement related to a contract dispute; impairment of certain intangible assets; restructuring charges and other (income) expense, net.Balance Sheet and Cash Flow
We continue to focus on maintaining a strong balance sheet. Cash flows used in operations was $3.7 million in Q4’21, lower than forecasted due primarily to an $8 million upfront payment made to a customer that will be amortized against future revenue, in addition to working capital fluctuations.
We ended FY 2021 with $237.4 million in cash and cash equivalents, up $14.7 million from the prior year.
Looking Forward
We believe the changes we have made to our business in 2021 provide a strong foundation from which to grow profitably in 2022. While the loss of a large retailer partner reduces our revenues by approximately 27% and is expected to result in difficult compares throughout the year, we are successfully executing on our new strategy, signing up exciting new network partners and making positive changes to our existing partner relationships. In particular, recently signed network partnerships, combined with growth in high margin national promotions revenues, should lead to increased scale and operating leverage as the year progresses. Further, we expect gross margins as a percentage of revenue will improve as most of our shopper promotions and shopper media revenue shift to revenue recognition net of third-party costs, although the change in accounting treatment will have no impact on gross margin or adjusted EBITDA. As a result, over the course of 2022 we expect to grow quarterly non-GAAP gross margin as a percentage of revenue from 40% in Q1 to above 60% in Q4. Further, we expect to deliver full year adjusted EBITDA of $35 - $45 million, roughly in-line with
the
| Q4 2021 FINANCIAL RESULTS AND BUSINESS UPDATES | 16
|
prior year at the mid-point, despite losing one of our large retail partners.
Business Outlook
For the first quarter of 2022, we expect revenue to be in the range of $69.0 million to $79.0 million. Non-GAAP gross margin is expected to be $28.0 million to $32.0 million. We expect adjusted EBITDA to be in the range of negative $8.0 million to negative $4.0 million. Operating cash flow is expected to be in the range of negative $3.0 million to positive $3.0 million.
For the full year 2022, we expect revenue to be in the range of $330.0 million to $345.0 million. Non-GAAP gross margin is expected to be $180.0 million to $190.0 million. Adjusted EBITDA for the full year 2022 is expected to be in the range of $35.0 million to $45.0 million. Operating cash flow is expected to be in the range of $15.0 million to $25 million.
We expect weighted average basic shares outstanding for 2022 to be approximately 96.3 million.
Predicting the mix of revenue between promotion and media, as well as the timing of accounting changes from gross to net, is difficult, which could lead to variations in both our Q1’22 and FY’22 reported revenue and gross margins. Our outlook is based on current economic conditions, including current supply chain challenges, but could be negatively impacted if conditions worsen.
Quotient will host a conference call and live webcast today at 2:00pm PST to discuss the fourth quarter and full year 2021 financial results. To listen to the live audio webcast, please visit Quotient’s Investor Relations website at investors.quotient.com. A replay of the webcast will be available at the same website. You may also access the call and
| Q4 2021 FINANCIAL RESULTS AND BUSINESS UPDATES | 17
|
register with a live operator by dialing (844) 200 6205, 1 (833) 950 0062 for Canada, and +1 (929) 526 1599 for outside the U.S. You will be able to access the call by using code 087053. We suggest registering for call at least 15 minutes prior to the 2:00 p.m. PDT start time.
About Quotient Technology Inc.
Quotient Technology (NYSE: QUOT) is the leading digital media and promotions technology company for advertisers, retailers and consumers. Quotient’s omnichannel platform is powered by exclusive consumer spending data, location intelligence and purchase intent data to reach millions of shoppers daily and deliver measurable, incremental sales.
Quotient partners with leading advertisers and retailers, including Clorox, Procter & Gamble, General Mills, Unilever, CVS, Dollar General and Peapod Digital Labs, a company of Ahold Delhaize USA. Quotient is headquartered in Salt Lake City, Utah, and has offices across the US, as well as in Bangalore, Paris, London and Tel Aviv. For more information visit www.quotient.com.
Quotient and the Quotient logo are trademarks or registered trademarks of Quotient Technology Inc. and its subsidiaries in the United States and other countries. Other marks are the property of their respective owners.
Forward Looking Statements
This stockholder letter includes forward-looking statements that are based on our management’s beliefs and assumptions and on information currently available to management, including our current expectations with respect to non-GAAP gross margin for the first quarter and fourth quarter of 2022, revenues, non-GAAP operating expenses, Adjusted EBITDA, and operating cash flow for the first quarter of 2022, and revenue, Adjusted EBITDA, and weighted average diluted shares outstanding for fiscal year 2022; plans to drive further business efficiencies in 2022; plans regarding launch of new partnerships in the coming months; our compelling product capabilities and valuable partnerships as positioning us to continue to lead the industry and deliver sustainable and profitable growth; our belief that our core media and promotions offerings are positioned to deliver, excluding Albertsons, strong growth throughout 2022; our belief that offline promotions will migrate online at an increasing rate and that we will capture a sizable portion of that online spend; our continuing effort to expand the size of our promotions network throughout 2022; expectations regarding growth of the national promotions business; our intent to bring our overseas Shopmium business to the U.S. market; our expectations regarding the growth of our media business including our recent release of offerings with self-service and measurement capabilities that will drive operating leverage as the business scales; our promotions and media products being tightly integrated together (to amplify return on investment (ROI)) as being a key competitive advantage of ours, and our belief that there are no comparable offerings in the marketplace; our expectations regarding the growth of the DOOH segment of our media business; our expectations regarding the growth of the smaller CPG segment of our business; strong growth from higher margin national promotions as increasing operating leverage and product mix favorability, and the launch of new network partners as driving the scale of our network; an increasing proportion of shopper media and shopper promotion campaigns being recognized on a net revenue basis; the combined impact of an increasing proportion of shopper media and shopper promotion campaigns being recognized on a net revenue basis, national promotions’ increasing contribution to product mix, and the launch of new network partners on our platform as being expected to more than offset the negative product mix impact from media distribution fees; challenges to our revenue performance throughout the 2022 year due to the loss of a large retailer partnership; and the combined impact of recently signed partnerships, making positive changes to our existing partner relationships and growth in high margin national promotions revenue as leading to increased scale and operating leverage; gross margins improving as a greater proportion of shopper promotions and shopper media revenue shift to revenue recognition net of third-party costs; difficulty in predicting the future mix of our revenue between promotion and media, as well as the timing of accounting changes from gross to net, and these forecasting difficulties as leading to variations in both our first quarter 2022 and fully year 2022 reported revenue and gross margins; and our current financial outlook as changing in the future if economic conditions, including those relating to supply chain issues, worsen.
| Q4 2021 FINANCIAL RESULTS AND BUSINESS UPDATES | 18
|
Forward-looking statements are based on information available to and the good faith beliefs of our Management team as of the time of this call and are subject to known and unknown risks and uncertainties that could cause actual performances or results to differ materially.Additional information about factors that could potentially impact our financial results can be found in today's press release and in the risk factors identified in our Quarterly Reports on Form 10-Q filed with the SEC on November 5, 2021. We disclaim any obligation to update information contained in these forward-looking statements, whether as a result of new information, future events or otherwise.
| Q4 2021 FINANCIAL RESULTS AND BUSINESS UPDATES | 19
|
In addition to the U.S. GAAP financials, this stockholder letter includes certain non-GAAP financial measures. The non-GAAP measures have limitations as analytical tools and you should not consider them in isolation or as a substitute for an analysis of our results under U.S. GAAP. There are a number of limitations related to the use of these non-GAAP financial measures versus their nearest GAAP equivalents. For example, other companies may calculate non-GAAP financial measures differently or may use other measures to evaluate their performance, all of which could reduce the usefulness of our non-GAAP financial measures as tools for comparison. We consider these non-GAAP financial measures to be important because they provide useful measures of the operating performance of the company, exclusive of unusual events or factors that do not directly affect what we consider to be our core operating performance and are used by our management for that purpose. The use of non-GAAP measures is further discussed in the accompanying press release, which have been furnished to the SEC on Form 8-K and posted on our website. The press release defines our non-GAAP financial measure of Adjusted EBITDA and non-GAAP Gross Margins. This stockholder letter includes non-GAAP financial measures of Adjusted EBITDA, non-GAAP Gross Margins and non-GAAP Operating Expenses. A reconciliation between GAAP and non-GAAP measures can be found herein and can also be found in the accompanying press release and accompanying presentation’s appendix. A reconciliation of Adjusted EB ITDA and non-GAAP Operating Expenses, both non-GAAP guidance measures, to a corresponding GAAP measure is not available on a forward-looking basis without unreasonable efforts due to the high variability and low visibility of certain (income) expense items that are excluded in calculating Adjusted EBITDA, non-GAAP Gross Margins and non-GAAP Operating Expenses.
| Q4 2021 FINANCIAL RESULTS AND BUSINESS UPDATES | 20
|
| QUOTIENT TECHNOLOGY INC. |
| CONDENSED CONSOLIDATED BALANCE SHEETS |
| (in thousands) |
|
|
| |
| December 31,
2021 |
| December 31,
2020 |
| (unaudited) |
|
|
| Assets |
|
|
|
| Current assets: |
|
|
|
| Cash and cash equivalents | $ | 237,417 | |
| $ | 222,752 | |
| Accounts receivable, net | | 177,216 | |
| | 137,649 | |
| Prepaid expenses and other current assets | | 19,312 | |
| | 18,547 | |
| Total current assets | | 433,945 | |
| | 378,948 | |
| Property and equipment, net | | 22,660 | |
| | 17,268 | |
| Operating lease right-of-use-assets | | 23,874 | |
| | 16,222 | |
| Intangible assets, net | | 13,003 | |
| | 44,898 | |
| Goodwill | | 128,427 | |
| | 128,427 | |
| Other assets | | 13,571 | |
| | 1,029 | |
| Total assets | $ | 635,480 | |
| $ | 586,792 | |
| Liabilities and Stockholders’ Equity |
|
|
|
| Current liabilities: |
|
|
|
| Accounts payable | $ | 18,021 | |
| $ | 15,959 | |
| Accrued compensation and benefits | | 20,223 | |
| | 14,368 | |
| Other current liabilities | | 95,279 | |
| | 70,620 | |
| Deferred revenues | | 26,778 | |
| | 12,027 | |
| Contingent consideration related to acquisitions | | 22,275 | |
| | 8,524 | |
| Convertible senior notes, net | | 188,786 | |
| | — | |
| Total current liabilities | | 371,362 | |
| | 121,498 | |
| Operating lease liabilities | | 26,903 | |
| | 15,956 | |
| Other non-current liabilities | | 522 | |
| | 2,358 | |
| Contingent consideration related to acquisitions | | — | |
| | 20,930 | |
| Convertible senior notes, net | | — | |
| | 177,168 | |
| Deferred tax liabilities | | 1,991 | |
| | 1,853 | |
| Total liabilities | | 400,778 | |
| | 339,763 | |
|
|
| |
| Stockholders’ equity: |
|
|
|
| Common stock | | 1 | |
| | 1 | |
| Additional paid-in capital | | 731,672 | |
| | 698,333 | |
| Accumulated other comprehensive loss | | (1,099 | ) |
| | (1,001 | ) |
| Accumulated deficit | | (495,872 | ) |
| | (450,304 | ) |
| Total stockholders’ equity | | 234,702 | |
| | 247,029 | |
| Total liabilities and stockholders’ equity | $ | 635,480 | |
| $ | 586,792 | |
| Q4 2021 FINANCIAL RESULTS AND BUSINESS UPDATES | 21
|
| QUOTIENT TECHNOLOGY INC. |
| CONDENSED CONSOLIDATED STATEMENTS OF OPERATIONS |
| (Unaudited, in thousands, except per share data) |
|
|
|
|
|
|
| |
| Three Months Ended
December 31, |
| Year Ended
December 31, |
| 2021 |
| 2020 |
| 2021 |
| 2020 |
| Revenues | $ | 146,414 | |
| $ | 142,529 | |
| $ | 521,494 | |
| $ | 445,887 | |
| Cost of revenues (1) | | 91,992 | |
| | 92,469 | |
| | 332,672 | |
| | 277,914 | |
| Gross margin | | 54,422 | |
| | 50,060 | |
| | 188,822 | |
| | 167,973 | |
| Operating Expenses: |
|
|
|
|
|
|
|
| Sales and marketing (1) | | 27,030 | |
| | 31,124 | |
| | 112,263 | |
| | 104,527 | |
| Research and development (1) | | 10,400 | |
| | 11,358 | |
| | 44,941 | |
| | 40,316 | |
| General and administrative (1) | | 16,690 | |
| | 14,720 | |
| | 56,776 | |
| | 54,177 | |
| Change in fair value of contingent consideration | | 620 | |
| | 14,446 | |
| | 1,392 | |
| | 20,234 | |
| Total operating expenses | | 54,740 | |
| | 71,648 | |
| | 215,372 | |
| | 219,254 | |
| Loss from operations | | (318 | ) |
| | (21,588 | ) |
| | (26,550 | ) |
| | (51,281 | ) |
| Interest expense | | (3,871 | ) |
| | (3,691 | ) |
| | (15,177 | ) |
| | (14,521 | ) |
| Other income (expense), net | | (80 | ) |
| | 432 | |
| | (210 | ) |
| | 1,140 | |
| Loss before income taxes | | (4,269 | ) |
| | (24,847 | ) |
| | (41,937 | ) |
| | (64,662 | ) |
| Provision for income taxes | | 2,841 | |
| | 458 | |
| | 3,631 | |
| | 719 | |
| Net loss | $ | (7,110 | ) |
| $ | (25,305 | ) |
| $ | (45,568 | ) |
| $ | (65,381 | ) |
|
|
|
|
|
|
| |
| Net loss per share, basic and diluted | $ | (0.08 | ) |
| $ | (0.28 | ) |
| $ | (0.49 | ) |
| $ | (0.72 | ) |
|
|
|
|
|
|
| |
| Weighted-average shares used to compute net loss per share, basic and diluted | | 94,531 | |
| | 91,300 | |
| | 93,686 | |
| | 90,412 | |
|
|
|
|
|
|
| |
| (1) The stock-based compensation expense included above was as follows: |
|
|
|
|
|
|
|
|
|
|
| |
| Three Months Ended
December 31, |
| Year Ended
December 31, |
| 2021 |
| 2020 |
| 2021 |
| 2020 |
| Cost of revenues | $ | 556 | |
| $ | 479 | |
| $ | 1,905 | |
| $ | 1,743 | |
| Sales and marketing | | 1,165 | |
| | 1,399 | |
| | 5,012 | |
| | 5,311 | |
| Research and development | | 851 | |
| | 1,108 | |
| | 3,876 | |
| | 3,831 | |
| General and administrative | | 3,166 | |
| | 4,364 | |
| | 12,019 | |
| | 17,486 | |
| Total stock-based compensation | $ | 5,738 | |
| $ | 7,350 | |
| $ | 22,812 | |
| $ | 28,371 | |
| Q4 2021 FINANCIAL RESULTS AND BUSINESS UPDATES | 22
|
| QUOTIENT TECHNOLOGY INC. |
| CONDENSED CONSOLIDATED STATEMENTS OF CASH FLOWS |
| (in thousands) |
|
|
| |
| Year Ended
December 31, |
| 2021 |
| 2020 |
| (Unaudited) |
|
|
| Cash flows from operating activities: |
|
|
|
| Net loss | $ | (45,568 | ) |
| $ | (65,381 | ) |
| Adjustments to reconcile net loss to net cash provided by operating activities: |
|
|
|
| Depreciation and amortization | | 29,464 | |
| | 36,352 | |
| Stock-based compensation | | 22,812 | |
| | 28,371 | |
| Amortization of debt discount and issuance cost | | 11,618 | |
| | 11,011 | |
| Impairment of intangible asset | | 9,086 | |
| | — | |
| Allowance for credit losses | | 568 | |
| | 888 | |
| Deferred income taxes | | 138 | |
| | 719 | |
| Change in fair value of contingent consideration | | 1,392 | |
| | 20,234 | |
| Other non-cash expenses | | 5,465 | |
| | 3,275 | |
| Changes in operating assets and liabilities: |
|
|
|
| Accounts receivable | | (40,135 | ) |
| | (13,232 | ) |
| Prepaid expenses and other assets | | (14,326 | ) |
| | 3,164 | |
| Accounts payable and other liabilities | | 27,576 | |
| | 15,554 | |
| Payments for contingent consideration and bonuses | | (2,901 | ) |
| | (15,418 | ) |
| Accrued compensation and benefits | | 6,070 | |
| | (197 | ) |
| Deferred revenues | | 14,751 | |
| | 1,125 | |
| Net cash provided by operating activities | | 26,010 | |
| | 26,465 | |
|
|
| |
| Cash flows from investing activities: |
|
|
|
| Purchases of property and equipment | | (14,720 | ) |
| | (8,351 | ) |
| Purchases of intangible assets | | — | |
| | (3,018 | ) |
| Net cash used in investing activities | | (14,720 | ) |
| | (11,369 | ) |
|
|
| |
| Cash flows from financing activities: |
|
|
|
| Proceeds from issuances of common stock under stock plans | | 16,219 | |
| | 5,002 | |
| Payments for taxes related to net share settlement of equity awards | | (6,333 | ) |
| | (7,203 | ) |
| Principal payments on promissory note and finance lease obligations | | (456 | ) |
| | (391 | ) |
| Payments for contingent consideration | | (6,121 | ) |
| | (14,582 | ) |
| Net cash provided by (used in) financing activities | | 3,309 | |
| | (17,174 | ) |
| Effect of exchange rates on cash and cash equivalents | | 66 | |
| | 66 | |
| Net increase (decrease) in cash and cash equivalents | | 14,665 | |
| | (2,012 | ) |
| Cash and cash equivalents at beginning of period | | 222,752 | |
| | 224,764 | |
| Cash and cash equivalents at end of period | $ | 237,417 | |
| $ | 222,752 | |
| Q4 2021 FINANCIAL RESULTS AND BUSINESS UPDATES | 23
|
QUOTIENT TECHNOLOGY INC. |
RECONCILIATION OF NET LOSS TO ADJUSTED EBITDA AND ADJUSTED EBITDA MARGIN |
(Unaudited, in thousands) |
|
|
|
|
|
|
|
|
|
|
|
|
|
|
|
| |
| Three Months Ended
December 31, |
| Year Ended
December 31, |
|
| 2021 |
| 2020 |
| 2021 |
| 2020 |
|
| $ |
| % |
| $ |
| % |
| $ |
| % |
| $ |
| % |
|
| Net Loss ($) / Loss Margin (%) (2) | $ | (7,110 | ) |
| -5 | % |
| $ | (25,305 | ) |
| -18 | % |
| $ | (45,568 | ) |
| -9 | % |
| $ | (65,381 | ) |
| -15 | % |
|
| Adjustments: |
|
|
|
|
|
|
|
|
|
|
|
|
|
|
|
|
| Stock-based compensation | | 5,738 | |
| 4 | % |
| | 7,350 | |
| 5 | % |
| | 22,812 | |
| 4 | % |
| | 28,371 | |
| 6 | % |
|
| Depreciation and amortization | | 5,039 | |
| 3 | % |
| | 9,830 | |
| 7 | % |
| | 29,464 | |
| 6 | % |
| | 36,352 | |
| 8 | % |
|
| Acquisition related costs and other (1) | | 1,055 | |
| 1 | % |
| | 7,872 | |
| 6 | % |
| | 13,508 | |
| 3 | % |
| | 12,361 | |
| 3 | % |
|
| Change in fair value of contingent consideration | | 620 | |
| — | |
| | 14,446 | |
| 10 | % |
| | 1,392 | |
| — | |
| | 20,234 | |
| 5 | % |
|
| Interest expense | | 3,871 | |
| 3 | % |
| | 3,691 | |
| 3 | % |
| | 15,177 | |
| 3 | % |
| | 14,521 | |
| 3 | % |
|
| Other income (expense), net | | 80 | |
| — | |
| | (432 | ) |
| — | |
| | 210 | |
| — | |
| | (1,140 | ) |
| — | |
|
| Provision for income taxes | | 2,841 | |
| 2 | % |
| | 458 | |
| — | |
| | 3,631 | |
| 1 | % |
| | 719 | |
| — | |
|
|
|
|
|
|
|
|
|
|
|
|
|
|
|
|
| |
| Total adjustments | $ | 19,243 | |
| 13 | % |
| $ | 43,215 | |
| 31 | % |
| $ | 86,193 | |
| 17 | % |
| $ | 111,418 | |
| 25 | % |
|
|
|
|
|
|
|
|
|
|
|
|
|
|
|
|
| |
| Adjusted EBITDA ($) / Adjusted EBITDA Margin (%) (2) | $ | 12,134 | |
| 8 | % |
| $ | 17,910 | |
| 13 | % |
| $ | 40,626 | |
| 8 | % |
| $ | 46,037 | |
| 10 | % |
|
| (1) |
| For the year ended December 31, 2021, Other includes a charge of $9.1 million related to the impairment of certain intangible assets due to the circumstances surrounding the termination of our partnership with Albertsons, and restructuring charges of $2.7 million. For the year ended December 31, 2020, Other includes a $8.8 million loss contingency/settlement related to a contract dispute with Albertsons associated with a guaranteed distribution fee arrangement and restructuring charges of $1.5 million. For the year ended December 31, 2019, Other includes restructuring charges of $4.3 million. |
| (2) |
| Profit (Loss) Margin and Adjusted EBITDA Margin is the ratio of Profit (Loss) to Revenues and Adjusted EBITDA to Revenues. |
QUOTIENT TECHNOLOGY INC. |
| RECONCILIATION OF NET LOSS TO ADJUSTED EBITDA AND ADJUSTED EBITDA MARGIN |
| (Unaudited, in thousands) |
|
|
|
|
|
|
|
|
|
| |
| Q4 FY 20 |
| Q1 FY 21 |
| Q2 FY 21 |
| Q3 FY 21 |
| Q4 FY 21 |
|
| Net loss | $ | (25,305 | ) |
| $ | (13,414 | ) |
| $ | (17,201 | ) |
| $ | (7,843 | ) |
| $ | (7,110 | ) |
|
| Adjustments: |
|
|
|
|
|
|
|
|
|
|
| Stock-based compensation | | 7,350 | |
| | 5,844 | |
| | 6,540 | |
| | 4,690 | |
| | 5,738 | |
|
| Depreciation and amortization | | 9,830 | |
| | 9,431 | |
| | 7,707 | |
| | 7,287 | |
| | 5,039 | |
|
| Acquisition related costs and other (1) | | 7,872 | |
| | 482 | |
| | 3,251 | |
| | 8,720 | |
| | 1,055 | |
|
| Change in fair value of contingent consideration | | 14,446 | |
| | 285 | |
| | 242 | |
| | 245 | |
| | 620 | |
|
| Interest expense | | 3,691 | |
| | 3,730 | |
| | 3,767 | |
| | 3,809 | |
| | 3,871 | |
|
| Other (income) expense, net | | (432 | ) |
| | 228 | |
| | (194 | ) |
| | 96 | |
| | 80 | |
|
| Provision for income taxes | | 458 | |
| | 249 | |
| | 218 | |
| | 323 | |
| | 2,841 | |
|
|
|
|
|
|
|
|
|
|
| |
| Total adjustments | $ | 43,215 | |
| $ | 20,249 | |
| $ | 21,531 | |
| $ | 25,170 | |
| $ | 19,243 | |
|
|
|
|
|
|
|
|
|
|
| |
| Adjusted EBITDA (1) | $ | 17,910 | |
| $ | 6,835 | |
| $ | 4,330 | |
| $ | 17,327 | |
| $ | 12,134 | |
|
|
|
|
|
|
|
|
|
|
| |
| Adjusted EBITDA Margin (2) | | 13 | % |
| | 6 | % |
| | 3 | % |
| | 13 | % |
| | 8 | % |
|
| (1) | | Adjusted EBITDA, a non-GAAP financial measure, is net loss adjusted for stock-based compensation, depreciation and amortization, change in fair value of contingent consideration, interest expense, other (income) expense, net, provision for income taxes, and acquisition related costs and other, which includes: a settlement of $6.8 million related to a contract dispute during Q4 FY 20, charge of $2.6 million related to the impairment of a promotion service right and restructuring charges of $0.2 million during Q2 FY21; charge of $6.5 million related to the impairment of certain intangible assets and restructuring charges of $1.8 million during Q3 FY21; restructuring charges of $0.7 million during Q4 FY21. |
| (2) | | Adjusted EBITDA margin is the ratio of Adjusted EBITDA and Revenues. |
| Q4 2021 FINANCIAL RESULTS AND BUSINESS UPDATES | 24
|
| QUOTIENT TECHNOLOGY INC. |
| RECONCILIATION OF GROSS MARGIN TO NON-GAAP GROSS MARGIN |
| (Unaudited, in thousands) |
|
|
|
|
|
|
|
|
|
|
|
| |
|
|
| Q4 FY 20 |
| Q3 FY 21 |
| Q4 FY 21 |
|
| FY 2020 |
| FY 2021 |
| Revenues |
| $ | 142,529 | |
| $ | 135,884 | |
| $ | 146,414 | |
|
| $ | 445,887 | |
| $ | 521,494 | |
|
|
|
|
|
|
|
|
|
|
|
| |
| Cost of revenues (GAAP) |
| $ | 92,469 | |
| $ | 86,535 | |
| $ | 91,992 | |
|
| $ | 277,914 | |
| $ | 332,672 | |
| (less) Stock-based compensation |
| | (479 | ) |
| | (525 | ) |
| | (556 | ) |
|
| | (1,743 | ) |
| | (1,905 | ) |
| (less) Amortization of acquired intangible assets |
| | (6,930 | ) |
| | (4,396 | ) |
| | (2,337 | ) |
|
| | (25,560 | ) |
| | (18,603 | ) |
| (less) Loss contingency/settlement related to a contract dispute |
| | (6,834 | ) |
| | — | |
| | — | |
|
| | (8,834 | ) |
| | — | |
| (less) Impairment of certain intangible assets |
|
|
| | (6,506 | ) |
| | — | |
|
| | — | |
| | (9,086 | ) |
| (less) Restructuring charges |
| | — | |
| | (5 | ) |
| | (158 | ) |
|
| | (82 | ) |
| | (163 | ) |
| Cost of revenues (Non-GAAP) |
| $ | 78,226 | |
| $ | 75,103 | |
| $ | 88,941 | |
|
| $ | 241,695 | |
| $ | 302,915 | |
|
|
|
|
|
|
|
|
|
|
|
| |
|
|
|
|
|
|
|
|
|
|
|
| |
| Gross margin (GAAP) |
| $ | 50,060 | |
| $ | 49,349 | |
| $ | 54,422 | |
|
| $ | 167,973 | |
| $ | 188,822 | |
| Gross margin percentage (GAAP) |
| | 35.1 | % |
| | 36.3 | % |
| | 37.2 | % |
|
| | 37.7 | % |
| | 36.2 | % |
|
|
|
|
|
|
|
|
|
|
|
| |
| Gross margin (Non-GAAP)* |
| $ | 64,303 | |
| $ | 60,781 | |
| $ | 57,473 | |
|
| $ | 204,192 | |
| $ | 218,579 | |
| Gross margin percentage (Non-GAAP) |
| | 45.1 | % |
| | 44.7 | % |
| | 39.3 | % |
|
| | 45.8 | % |
| | 41.9 | % |
|
|
|
|
|
|
|
|
|
|
|
| |
| * Non-GAAP gross margin excludes stock-based compensation, amortization of acquired intangible assets, loss contingency/settlement related to a contract dispute, impairment of certain intangible assets, and restructuring charges. |
| Q4 2021 FINANCIAL RESULTS AND BUSINESS UPDATES | 25
|
| QUOTIENT TECHNOLOGY INC. |
| RECONCILIATION OF OPERATING EXPENSES TO NON-GAAP OPERATING EXPENSES |
| (Unaudited, in thousands) |
|
|
|
|
|
|
|
|
|
|
|
|
|
|
|
| |
|
|
| Q4 FY 20 |
| Q1 FY 21 |
| Q2 FY 21 |
| Q3 FY 21 |
| Q4 FY 21 |
|
| FY 2020 |
| FY 2021 |
| Revenues |
|
| $ | 142,529 | |
| $ | 115,316 | |
| $ | 123,880 | |
| $ | 135,884 | |
| $ | 146,414 | |
|
| $ | 445,887 | |
| $ | 521,494 | |
|
|
|
|
|
|
|
|
|
|
|
|
|
|
|
| |
| Sales and marketing expenses |
| | 31,124 | |
| | 27,365 | |
| | 28,467 | |
| | 29,401 | |
| | 27,030 | |
|
| | 104,527 | |
| | 112,263 | |
| (less) Stock-based compensation |
| | (1,399 | ) |
| | (1,255 | ) |
| | (1,181 | ) |
| | (1,411 | ) |
| | (1,165 | ) |
|
| | (5,311 | ) |
| | (5,012 | ) |
| (less) Amortization of acquired intangible assets |
| | (866 | ) |
| | (866 | ) |
| | (866 | ) |
| | (837 | ) |
| | (637 | ) |
|
| | (3,562 | ) |
| | (3,206 | ) |
| (less) Restructuring charges |
| | — | |
| | — | |
| | (217 | ) |
| | (903 | ) |
| | (328 | ) |
|
| | (526 | ) |
| | (1,448 | ) |
| Non-GAAP Sales and marketing expenses |
| $ | 28,859 | |
| $ | 25,244 | |
| $ | 26,203 | |
| $ | 26,250 | |
| $ | 24,900 | |
|
| $ | 95,128 | |
| $ | 102,597 | |
| Non-GAAP Sales and marketing percentage |
| | 20 | % |
| | 22 | % |
| | 21 | % |
| | 19 | % |
| | 17 | % |
|
| | 21 | % |
| | 20 | % |
|
|
|
|
|
|
|
|
|
|
|
|
|
|
|
| |
| Research and development |
| | 11,358 | |
| | 12,056 | |
| | 11,411 | |
| | 11,074 | |
| | 10,400 | |
|
| | 40,316 | |
| | 44,941 | |
| (less) Stock-based compensation |
| | (1,108 | ) |
| | (972 | ) |
| | (977 | ) |
| | (1,076 | ) |
| | (851 | ) |
|
| | (3,831 | ) |
| | (3,876 | ) |
| (less) Restructuring charges |
| | — | |
| | — | |
| | — | |
| | (463 | ) |
| | (106 | ) |
|
| | (283 | ) |
| | (569 | ) |
| Non-GAAP Research and development expenses |
| $ | 10,250 | |
| $ | 11,084 | |
| $ | 10,434 | |
| $ | 9,535 | |
| $ | 9,443 | |
|
| $ | 36,202 | |
| $ | 40,496 | |
| Non-GAAP Research and development percentage |
| | 7 | % |
| | 10 | % |
| | 8 | % |
| | 7 | % |
| | 6 | % |
|
| | 8 | % |
| | 8 | % |
|
|
|
|
|
|
|
|
|
|
|
|
|
|
|
| |
| General and administrative expenses |
| | 14,720 | |
| | 12,833 | |
| | 15,009 | |
| | 12,244 | |
| | 16,690 | |
|
| | 54,177 | |
| | 56,776 | |
| (less) Stock-based compensation |
| | (4,364 | ) |
| | (3,194 | ) |
| | (3,981 | ) |
| | (1,678 | ) |
| | (3,166 | ) |
|
| | (17,486 | ) |
| | (12,019 | ) |
| (less) Restructuring charges |
| | — | |
| | — | |
| | — | |
| | (463 | ) |
| | (83 | ) |
|
| | (591 | ) |
| | (546 | ) |
| (less) Acquisition related costs |
| | (1,039 | ) |
| | (482 | ) |
| | (453 | ) |
| | (380 | ) |
| | (381 | ) |
|
| | (2,045 | ) |
| | (1,696 | ) |
| Non-GAAP General and administrative expenses |
| $ | 9,317 | |
| $ | 9,157 | |
| $ | 10,575 | |
| $ | 9,723 | |
| $ | 13,060 | |
|
| $ | 34,055 | |
| $ | 42,515 | |
| Non-GAAP General and administrative percentage |
| | 7 | % |
| | 8 | % |
| | 9 | % |
| | 7 | % |
| | 9 | % |
|
| | 8 | % |
| | 8 | % |
|
|
|
|
|
|
|
|
|
|
|
|
|
|
|
| |
| Non-GAAP Operating expenses* |
| $ | 48,426 | |
| $ | 45,485 | |
| $ | 47,212 | |
| $ | 45,508 | |
| $ | 47,403 | |
|
| $ | 165,385 | |
| $ | 185,608 | |
| Non-GAAP Operating expense percentage |
| | 34 | % |
| | 39 | % |
| | 38 | % |
| | 33 | % |
| | 32 | % |
|
| | 37 | % |
| | 36 | % |
|
|
|
|
|
|
|
|
|
|
|
|
|
|
|
| |
| * Non-GAAP operating expenses excludes changes in fair value of contingent consideration, stock-based compensation, amortization of acquired intangible assets, restructuring charges, and acquisition related costs. |
| Q4 2021 FINANCIAL RESULTS AND BUSINESS UPDATES | 26
|
| QUOTIENT TECHNOLOGY INC. |
| RECONCILIATION OF GROSS MARGIN TO NON-GAAP GROSS MARGIN (FORECASTED) |
| (Unaudited, in thousands) |
|
|
|
|
|
|
|
|
|
| |
|
|
| Q1 FY 22 (Forecast) |
| FY22 (Forecast) |
|
|
|
| Low |
| High |
| Low |
| High |
|
| Revenues |
| $ | 69,000 | |
| $ | 79,000 | |
| $ | 330,000 | |
| $ | 345,000 | |
|
|
|
|
|
|
|
|
|
|
| |
| Cost of revenues (GAAP) |
| $ | 44,000 | |
| $ | 50,100 | |
| $ | 160,300 | |
| $ | 165,500 | |
|
| (less) Stock-based compensation |
| | (400 | ) |
| | (500 | ) |
| | (1,800 | ) |
| | (2,000 | ) |
|
| (less) Amortization of acquired intangible assets |
| | (2,600 | ) |
| | (2,600 | ) |
| | (8,500 | ) |
| | (8,500 | ) |
|
| Cost of revenues (Non-GAAP) |
| $ | 41,000 | |
| $ | 47,000 | |
| $ | 150,000 | |
| $ | 155,000 | |
|
|
|
|
|
|
|
|
|
|
| |
| Gross margin (GAAP) |
| $ | 25,000 | |
| $ | 28,900 | |
| $ | 169,700 | |
| $ | 179,500 | |
|
|
|
|
|
|
|
|
|
|
| |
| Gross margin (Non-GAAP) |
| $ | 28,000 | |
| $ | 32,000 | |
| $ | 180,000 | |
| $ | 190,000 | |
|
| Q4 2021 FINANCIAL RESULTS AND BUSINESS UPDATES | 27
|