QuickLinks -- Click here to rapidly navigate through this document

We are
growingin
gastroenterology

| DISEASES OF THE LIVER Liver and biliary diseases affect one in every ten Americans. Cholestatic liver diseases, conditions in which the bile flow is impaired, include Primary Biliary Cirrhosis (PBC), Primary Sclerosing Cholangitis (PSC) and many others. | DISEASES OF THE PANCREAS Common diseases of the pancreas, the "hidden organ" include Diabetes, Chronic Pancreatitis, Cystic Fibrosis, pancreatic enzyme deficiency, and pancreatic cancer. | DISEASES OF THE BOWEL Inflammatory Bowel Diseases (IBD) affect people of any gender, age or race and cause mild to debilitating symptoms including abdominal pain, cramping, fatigue and diarrhea. | GASTROINTESTINAL (GI) AND GI-RELATED CANCER Digestive cancers, affecting the colon and rectum, the esophagus and stomach and the liver and pancreas, have the world's highest incidence and mortality rate of cancer. | OTHER GI DISEASES AND DISORDERS Peptic ulcers, a sore on the lining of the stomach or duodenum, Irritable Bowel Syndrome (IBS), a disorder interfering with the normal functions of the colon, and hemorrhoids are common occurrences. |
A new era of growth...
Building on its solid base of five core therapeutic areas, Axcan is poised for expansion into larger GI markets with innovative products. Our commitment and dedication to improving quality of care and treatment of patients suffering from gastrointestinal diseases and disorders, are stronger than ever.
AXCAN PROUDLY PRESENTS ITS 9TH ANNUAL REPORT
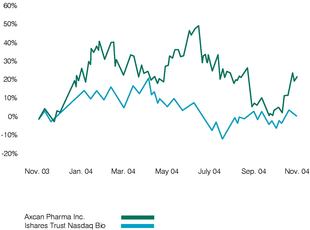
NASDAQ INDEX VS AXCAN
On November 24, 2003, Axcan was added to the NASDAQ Biotechnology Index joining biomedical industry leaders in their respective areas, and gaining increased visibility in the U.S. financial markets.
FORWARD-LOOKING STATEMENTS
This Annual Report contains forward-looking statements for either the Company or certain of its subsidiaries. These forward-looking statements, by their nature, necessarily involve risks and uncertainties that could cause actual results to differ materially from those contemplated by the forward-looking statements. The Company considers the assumptions on which these forward-looking statements are based to be reasonable at the time they were prepared, but cautions the reader that these assumptions regarding future events, many of which are beyond the control of the Company and its subsidiaries, may ultimately prove to be incorrect. Factors and risks, which could cause actual results to differ materially from current expectations, are discussed on page 44 of this Annual Report as well as in the Company's Annual Information Form for the year ended September 30, 2004. The Company disclaims any intention or obligation to update or revise any forward-looking statements whether as a result of new information, future events, or otherwise.
| TABLE OF CONTENTS | PAGE | |
|---|---|---|
| Financial and Operating Highlights | 04 | |
| Five-Year Financial Data | 06 | |
| Letter to Our Shareholders | 08 | |
| Our Five Core Gastroenterology Franchises | 14 | |
| ITAX, a Novel Gastroprokinetic Drug for Motility Disorders | 26 | |
| HEPENAX, a Novel Treatment for Hepatic Encephalopathy | 28 | |
| A Deep Pipeline | 30 | |
| Management's Discussion and Analysis of Financial Condition and Results of Operations | 32 | |
| Consolidated Financial Statements — U.S. GAAP | 47 | |
| Consolidated Financial Statements — Canadian GAAP | 75 | |
| Corporate Governance | 100 | |
| Board of Directors | 102 | |
| Management Team | 104 |
2
Axcan is a leading specialty pharmaceutical company focused in the field of gastroenterology.
The Company markets a broad line of prescription products sold for the treatment of symptoms in a number of gastrointestinal diseases and disorders such as Inflammatory Bowel Disease, Irritable Bowel Syndrome, cholestatic liver diseases, and complications related to Cystic Fibrosis. Axcan's products are marketed by its own sales force in North America and Europe. Today, the Company counts more than 450 employees worldwide.
Headquartered in Mont-St-Hilaire, Quebec, Canada, Axcan's common shares are traded on the Toronto Stock Exchange under the symbol "AXP" and on the NASDAQ National Market under the symbol "AXCA".

3
FINANCIAL AND OPERATING HIGHLIGHTS
A PROVEN TRACK RECORD
For the last five years, our dedication to executing our growth strategy has proven to be fruitful. We have further developed our core capabilities through multiple acquisitions and licensing agreements, smoothly integrating the merged entities while successfully filing Investigational New Drug Applications (INDs) and New Drug Applications (NDAs). We have also achieved another year of profitability and growth.
A SOUND BUSINESS MODEL
Successful integration of recently acquired companies, products and product lines allowed us to build a solid international infrastructure. Today, we are in a favorable position to leverage our strong foundation by adding new products through development or acquisitions, translating into higher margins.
4
5
Years ended September 30
(All amounts are stated in thousands of U.S. dollars, except share-related data, percentages and ratios)
| | 2004 | 2003 | 2002 | 2001 | 2000 | |||||||
|---|---|---|---|---|---|---|---|---|---|---|---|---|
| | $ | $ | $ | $ | $ | |||||||
| OPERATING DATA | ||||||||||||
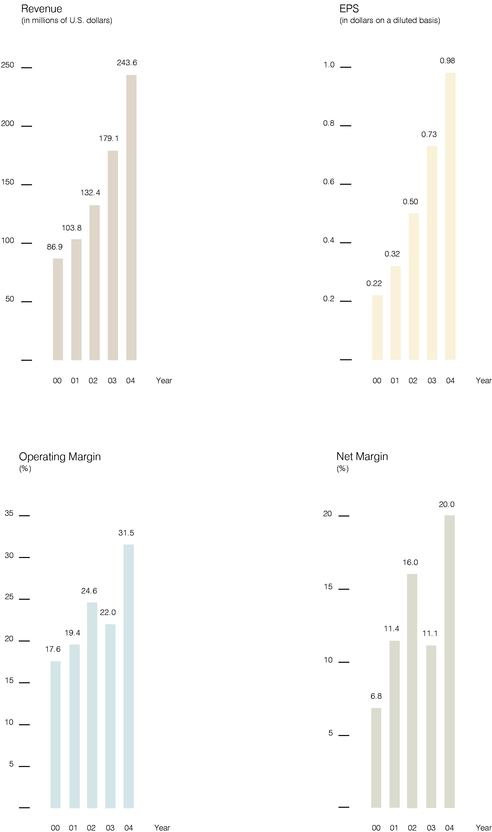
Revenue | 243,634 | 179,084 | 132,404 | 103,814 | 86,869 | |||||||
Expenses | ||||||||||||
| Cost of goods sold | 54,247 | 44,459 | 34,039 | 26,381 | 22,268 | |||||||
| Research and development | 19,886 | 12,098 | 8,855 | 7,243 | 7,066 | |||||||
| Selling and administrative | 76,365 | 63,084 | 49,392 | 38,185 | 31,821 | |||||||
| Depreciation and amortization | 16,359 | 8,063 | 7,546 | 11,829 | 10,410 | |||||||
Operating income | 76,797 | 39,380 | 32,572 | 20,176 | 15,304 | |||||||
| Net income | 48,728 | 19,925 | 21,188 | 11,825 | 5,936 | |||||||
| Net income, excluding one-time charges(1) | 48,728 | 33,350 | 21,188 | 11,825 | 5,936 | |||||||
Per share data, excluding one-time charges(1) | ||||||||||||
| Basic net income | 1.08 | 0.74 | 0.51 | 0.32 | 0.22 | |||||||
| Diluted net income | 0.98 | 0.73 | 0.50 | 0.32 | 0.22 | |||||||
| Weighted average number of common shares outstanding (000s) (diluted) | 52,788 | 45,608 | 42,528 | 36,531 | 26,792 | |||||||
FINANCIAL POSITION | ||||||||||||
Cash, cash equivalents and short-term investments | 37,901 | 170,885 | 80,717 | 16,515 | 20,911 | |||||||
| Total assets | 609,644 | 545,349 | 367,006 | 246,484 | 250,943 | |||||||
| Long-term debt (including convertible subordinated notes) | 129,694 | 131,002 | 8,603 | 2,919 | 50,006 | |||||||
| Shareholders' equity | 392,076 | 331,011 | 294,787 | 200,431 | 156,667 | |||||||
COMMON SHARE PERFORMANCE(2) | ||||||||||||
Market capitalization (000s) | 708,494 | 612,059 | 430,238 | 411,010 | 377,151 | |||||||
| Closing share price on NASDAQ National Market | 15.55 | 13.60 | 9.59 | 10.70 | 10.93 | |||||||
| Closing share price on Toronto Stock Exchange (CDN$) | 19.62 | 18.28 | 15.11 | 16.95 | 16.80 | |||||||
| Closing number of common shares issued and outstanding (000s) | 45,562 | 45,004 | 44,863 | 38,412 | 34,506 | |||||||
CASH FLOWS | ||||||||||||
Cash flows from operating activities | 23,360 | 51,496 | 35,331 | 16,390 | 11,285 | |||||||
| Acquisition of intangible assets | 149,628 | 76,093 | 1,561 | 1,892 | 19,886 | |||||||
| Net issuance of common shares | 4,900 | 1,103 | 65,039 | 30,969 | 83,466 | |||||||
| Issuance of long-term debt | 2,212 | 126,064 | 1,506 | — | — | |||||||
| Net increase (decrease) in cash and cash equivalents | (15,794 | ) | 17,796 | 3,462 | 5,391 | (16,398 | ) | |||||
RATIOS | ||||||||||||
Gross margin | 77.7% | 75.2% | 74.3% | 74.6% | 74.4% | |||||||
| Operating margin | 31.5% | 22.0% | 24.6% | 19.4% | 17.6% | |||||||
| Net margin | 20.0% | 11.1% | 16.0% | 11.4% | 6.8% | |||||||
| Return on equity | 13.5% | 6.4% | 8.6% | 6.6% | 5.5% | |||||||
| Revenue growth | 36.0% | 35.3% | 27.5% | 19.5% | 131.3% | |||||||
- (1)
- One-time charges consisting of take-over bid expenses, acquired in-process research and related income taxes, a non-GAAP measure (see page 37).
- (2)
- As of September 30
6-7

"Significant investments were made over the
last several years to create the impending new product flow that
will translate into sustained growth for the future."
8
LETTER TO OUR SHAREHOLDERS
FISCAL 2004 was a determining year for your company. It was a year that culminated five full years of solid growth and profitability. More importantly, 2004 marked the beginning of a new era for Axcan that will ensure its future growth. Over the course of the last 20 fiscal quarters, the company consistently executed its growth strategy, delivering repeated strong financial performances and achieving its major corporate objectives. Throughout this time, Axcan continued to successfully expand its core gastroenterology franchises by extending product lines, maintaining market share for its key products and increasing global market penetration. Axcan also in-licensed key later-stage products that hold tremendous promise for the future.
Today, Axcan is well positioned to build on its solid base of five core gastro-intestinal (GI) franchises and expand into larger GI markets with patented new products. One of these products continues to command a huge amount of attention. Indeed, ITAX (itopride hydrochloride) oral tablets may prove to be the answer to a major unmet clinical need since no safe and effective therapy exists for Functional Dyspepsia. There is no doubt that if approved, ITAX will be, by far, the largest drug in our portfolio. The launch of ITAX will encompass North America (Canada and the United States) as well as major markets in Europe (France, the United Kingdom and Germany). The launch of ITAX is expected to take place in 2007. It is planned to be followed by the launch of several other innovative GI products including HEPENAX (L-ornithine L-aspartate) in 2008, ursodeoxycholic acid-disulfate (SUDCA) in 2009 and others.
Significant investments have been made by our company over the course of the last several years in order to create the impending new product flow that will translate into solid, sustained growth for the future.
9

This year we were also pleased to inaugurate our new expanded corporate offices in Mont-St-Hilaire, to celebrate our 22 years of service to the stakeholders and patients afflicted with GI disorders and diseases. Within our newly expanded premises, we will endeavor to meet new challenges and discover new treatments in order to fulfill unmet medical needs in gastroenterology.
As part of the inauguration ceremony, we hosted a very special Analyst & Investor Luncheon featuring a R&D Update. This included presentations by world-renowned experts in their respective fields. We were honored to have such high quality speakers: Dr. Richard H. Hunt from the McMaster University Medical Center, Dr. Rajiv Jalan from the University College London Medical School, Dr. Kenneth D. Setchell from the Cincinnati Children's Hospital Medical Center, Dr. Steve Pereira from the University College Medical School and Mr. Alan Brownstein, Chairman of the American Liver Foundation.
They discussed the disease states that underlie four selected, high potential Axcan projects: ITAX (itopride hydrochloride) for the treatment of Functional Dyspepsia, HEPENAX (L-ornithine L-aspartate) in the treatment of Hepatic Encephalopathy, ursodeoxycholic acid-disulfate (SUDCA) in Liver Disease and Organ Preservation in Liver Transplant and finally PHOTOFRIN (porfimer sodium) in the treatment of Cholangiocarcinoma. As part of their presentations, the authors featured ground-breaking hitherto unpublished clinical data related to these topics as well as the clinical implications thereof.
FINANCIAL PERFORMANCE
Over the last five years, Axcan has had a remarkable track record with an annual compounded growth rate of 28% in revenue and 45% in diluted income per share. For the fiscal year 2004, our financial goals included growth of total revenue to $242.0 million, net income to $47.4 million, a solid improvement of our gross margin as well as EPS growth of 27.0%.
For the fiscal year ended September 30, 2004, the Company reported revenue growth of 36.0% to $243.6 million and net income of $48.7 million, a 46.1%(1) increase compared to the previous year. Gross margin amounted to 77.7% of revenue for the year 2004 compared to 75.2% of revenue in 2003. We achieved $0.98 in earnings per share on a fully diluted basis for the fiscal year 2004, representing a 34.2%(1) increase in comparison to fiscal year 2003.
The increase in revenue primarily resulted from $41.8 million in additional North American sales of the AVAX product line, which was acquired in November 2003 from Aventis S.A. and strong sales of CANASA in the United States. Revenues from sales made by our French subsidiary, following the acquisitions of DELURSAN as well as the PANZYTRAT product line, also contributed positively. Our overall gross margin was enhanced due to a product mix effect and generally improved margins in Europe.
- (1)
- Before one-time charges consisting of takeover-bid expenses, acquired in-process research and related income taxes, a non-GAAP measure (see page 37)
10
Research and development expenses increased by $7.8 million to $19.9 million for the year ended September 30, 2004, a 64.5% increase from the preceding fiscal year. This increase is mainly due to the acceleration of our ITAX development program for the treatment of Functional Dyspepsia.
Axcan is in a solid financial position with a healthy balance sheet, almost $40 million in cash, cash equivalents and short term investments and working capital of almost $90 million. Axcan also has access to credit facilities totaling $125 million. The company therefore maintains the flexibility to actively pursue strategic opportunities including revenue generating accretive product acquisitions and to continue advancing its current development programs. Given its strong balance sheet and excluding any large transactions, the company does not foresee requiring the issue of additional securities.
GROWING IN GASTROENTEROLOGY
Consistent with the execution of our business strategy, we continue to actively pursue acquisition opportunities that represent accretive extensions to Axcan's product portfolio. At the beginning of the year, we completed the acquisition of a group of gastrointestinal products from Aventis: CARAFATE and BENTYL for the U.S. market and SULCRATE, BENTYLOL and PROCTOSEDYL for the Canadian market, further consolidating our core revenue stream and leveraging our North American sales and marketing infrastructure.
We continue to successfully develop line extensions, either improvements or new indications for our key products, in order to strengthen their competitive positions and increase our global market penetration. This year, we obtained approval by the U.S. Food and Drug Administration (FDA) for a unique, double-strength tablet (500mg) of ursodiol for the treatment of Primary Biliary Cirrhosis. We also launched this new dosage form of ursodiol in the U.S., marketed under the brand name URSO Forte, and distributed through major independent and retail pharmacies. We also expect to receive approval shortly for a new, 750mg tablet dosage of SALOFALK (Canada) for the treatment of Ulcerative Colitis. Just recently, we received FDA approval for the use of a 1-gram mesalamine suppository dosage form in the treatment of Ulcerative Proctitis, for which we have been granted a 3-year market exclusivity for the new strength and dosing regimen.
Last, we obtained our first European approval for PHOTOBARR for the treatment of High-Grade Dysplasia associated with Barrett's Esophagus. This approval was very important demonstrating our ability to navigate the European regulatory process.
Continuously assessing the market opportunities and environment for each product in development, we believe that HELIZIDE will have good potential in export markets, where the incidence of gastric cancers is highest and the "test and treat" approach is systematic. We continue to pursue the process of qualifying a new North American manufacturer of biskalcitrate potassium (bismuth salt), a component of our HELIZIDE combination therapy for the eradication ofHelicobacter pylori bacterium. We have realigned the timelines for this product candidate and now aim for an FDA re-submission by the middle of calendar year 2005.
11
ADVANCING THE PIPELINE
On the Research and Development front, fiscal year 2004 was marked by crucial advancement in the development program for our potential "blockbuster" gastroprokinetic drug, ITAX. Further to positive Phase II efficacy and safety results for ITAX in the treatment of Functional Dyspepsia, Axcan initiated Phase III clinical trials in North America and Western Europe. Enrollment for the two Phase III studies is well underway and is expected to be completed in the second half of calendar year 2005.
More recently, the positive results of a cardiac safety study conducted in Montreal, with 162 healthy volunteers, strengthened our confidence in the safety profile of this new prokinetic drug. We intend to aggressively pursue the ITAX development program and remain confident that we can achieve our goal of an early 2007 launch in the U.S., Canada, Germany, the United Kingdom and France.
Other advances in our development programs include the completion of three Phase III studies to confirm the efficacy and safety of a new 4-gram, patented, mesalamine rectal gel for the treatment of Distal Ulcerative Colitis. In addition, we initiated a clinical research program for HEPENAX (L-ornithine L-aspartate), a very promising treatment for Porto-Systemic Encephalopathy. During the year, we also achieved positive animal study results for the new sulfated version of ursodiol as a potent chemopreventive agent in colorectal cancer, for which we will initiate animal toxicity studies in the second half of fiscal 2005.
BUILDING A STRONG AND EXPERIENCED MANAGEMENT TEAM
During the year, Axcan strengthened its existing core management team with the addition of Jean-François Hébert, appointed Vice President, Manufacturing Operations. Mr. Hébert, formerly with Abbott Laboratories where he assumed positions of increasing responsibility and received awards for operations and leadership, brings to Axcan more than 15 years of successful international business experience in the pharmaceutical and food industries.
A number of individuals also evolved within our growing organization and assumed new roles and challenges at Axcan. Jocelyn Pelchat was promoted to Senior Vice President, International Commercial Operations, with responsibility for building the Company's GI business in the European Union and other select markets outside North America. Richard Tarte assumed the position of Vice President, Corporate Development and General Counsel, with the goal of identifying, evaluating and negotiating new business opportunities for the Company, and Michael Thiel, in addition to his responsibilities as Vice President of Marketing for North American Commercial Operations, was appointed Global Project Leader — ITAX, responsible for planning, directing, and coordinating the development and commercialization of this product candidate.
We also enhanced the structure of our North American Commercial Operations and made new appointments there. A Sales Operations Department was created to manage Axcan's broad range of large accounts and to direct the sales support functions. Our Sales and Marketing structure was also realigned to further develop our capabilities to compete successfully in the future and to assure the effective commercialization of ITAX. Michael Pasternak was promoted to Vice President of Sales Operations, North America, while Paul Smith was appointed Vice President of Sales, North America. Having worked together for the last 14 years, they combine more than 50 years of pharmaceutical experience.
12
INVESTING FOR THE FUTURE
The end of fiscal year 2004 is marked by our stronger than ever commitment to advance our innovative pipeline of product candidates. ITAX, which could be the biggest product in Axcan's history, will receive special focus in the coming year.
Nevertheless, we will continue to build on our successes and continue to develop our core competencies to ensure Axcan's long-term profitability and growth. To leverage our existing infrastructure, acquisitions of value-added and carefully selected products remain a key element of our business strategy.
With our successfully established gastroenterology franchises, or products for five therapeutic areas, we believe that Axcan is ready to transition towards developing more innovative, IP-protected gastroenterology products, with an emphasis on hepatology diseases. This will allow attainment of better margins and provide higher growth potential for the Company. We will continue to address unmet therapeutic needs and help improve the quality of life of people suffering from GI diseases and disorders.
Axcan is already a specialty pharmaceutical world leader in the field of gastroenterology. By building our product portfolio and extending our market reach in both North America and Europe, we expect to enhance this position. As we continue to apply our proven three-pronged business model based on organic sales growth of our current products, in-licensing or acquisition of new products and continued product development, Axcan's growth potential is very promising. Since 2001, our compounded annual growth rate of diluted income per share has been 45%, an eloquent testimony to the effectiveness of our strategy.
In achieving our growth objectives, Axcan has taken great care to foster strict corporate governance practices. The Corporate Governance and Nominating Committee of Axcan's Board of Directors, comprised solely of independent directors, has a broad mandate to assure efficient and appropriate relations between senior management and the Board of Directors. In addition, at every level of the company, Axcan insists on a high standard of ethical business behavior, be it in scientific development, manufacturing, sales, or administration. Moreover, we are committed to transparent and ongoing communications with you, our shareholder.
The continued remarkable performance of Axcan in terms of top-line growth and profitability is in large measure the result of the commitment of our employees and their devotion to serving the needs of patients with GI diseases and disorders. On behalf of the Board of Directors and the entire Management team, I would like to take this opportunity to thank the Axcan employees who now number some 450 people in North America and in Europe and salute their role in helping make Axcan Pharma a recognized leader in gastroenterology.
I also want to express my gratitude to the members of the Board of Directors for their ongoing guidance and strategic, constructive counsel in this period of rapid growth.
Last, I would like to thank you, our shareholder, for believing in this Company as we do, and for your continuing support.
 Léon F. Gosselin Chairman of the Board, President and Chief Executive Officer |
13
AXCAN HAS BUILT A STRONG MULTI-PRODUCT GASTROINTESTINAL BASE FOCUSING ON UNMET THERAPEUTIC NEEDS.OUR CORE BUSINESS, ALWAYS GEARED TOWARDS GASTROENTEROLOGY, REVOLVES AROUND FIVE THERAPEUTIC AREAS.
14
| GI | DISEASES OF THE LIVER DISEASES OF THE PANCREAS DISEASES OF THE BOWEL GASTRO-INTESTINAL (GI) AND GI-RELATED CANCER OTHER GASTRO-INTESTINAL DISEASES AND DISORDERS |

15
GI DISEASES OF THE LIVER
Liver diseases affect one in every ten Americans
According to the American Liver Foundation (ALF), 25 million Americans are or have been afflicted with liver and biliary diseases. Furthermore, 25,000 Americans die each year from chronic liver disease and cirrhosis, and 300,000 people are hospitalized each year due to cirrhosis.
Cholestatic liver diseases are conditions in which the bile flow from the liver is impaired. Such conditions include Primary Biliary Cirrhosis (PBC), Primary Sclerosing Cholangitis (PSC) and many others. Axcan markets URSO 250 and URSO Forte in the United States for the treatment of PBC, as well as URSO DS in Canada and DELURSAN in France for the treatment of cholestatic liver diseases.

16
The only ursodiol approved for PBC
URSO (ursodeoxycholic acid), a therapeutic bile acid available in 500mg and 250mg film-coated tablets for oral administration, is the only ursodiol approved by the FDA for the treatment of patients with PBC, a chronic liver disease that slowly destroys the ducts that drain bile in the liver.
More than 10 years of clinical studies
The effectiveness and safety of URSO have been proven. It delays the progression of PBC, normalizes liver function tests, decreases the incidence of esophageal varices by 60%, and significantly improves transplant-free survival to the point that non-cirrhotic PBC patients have a survival rate similar to that of the general population.
PBC, a chronic liver disease
The disease causes slow, progressive destruction of bile ducts in the liver. This destruction interferes with the excretion of bile. Continued liver inflammation causes scarring and eventually leads to cirrhosis. Ursodeoxycholic acid is a life-saving, safe, and approved therapy.
Women are affected 10 times more frequently than men
Studies show that women are affected 10 times more commonly than men. PBC is usually diagnosed in patients between the ages of 35 and 60. The illness is chronic and can lead to liver failure and other life-threatening complications. Despite the fact that scientists and physicians have known about PBC for more than 100 years, the basic cause is still unknown.
| URSO 250, URSO Forte | URSO DS | DELURSAN | ||
|---|---|---|---|---|
| Tablets | Tablets | Tablets | ||
| United States | Canada | France | ||
| Primary Biliary Cirrhosis | Cholestatic liver diseases | Cholestatic liver diseases |
17
GI DISEASES OF THE PANCREAS
The pancreas is vital to good health
The pancreas, located deep in the abdomen behind the stomach, produces juices and enzymes that flow into the intestine, where they mix with food. The enzymes digest fat, protein, and carbohydrates so that they can be absorbed by the intestine. Pancreatic juices, therefore, play an important role in maintaining good health. The organ also produces insulin, important in regulating the amount of glucose in the blood. Common diseases of the pancreas include Diabetes, Chronic Pancreatitis, Cystic Fibrosis, pancreatic enzyme deficiency (like Steatorrhea), and pancreatic cancer, among others.

18
Thanks to medical development, the average life-span of cystic fibrosis patients is now approximately 33 years
Cystic Fibrosis (CF) is a genetic disease characterized by excessive secretions of certain glands, causing pancreatic insufficiency and pulmonary disorders. Mucus blocks the pancreatic ducts, which normally secrete the digestive enzymes that allow food to be digested in the small intestine. In order to aid digestion, patients need pancreatic enzyme supplements, specifically formulated multivitamin supplements, and hypercaloric formulas that may help weight maintenance.
Axcan's commitment to the CF community
Patients suffering from Cystic Fibrosis need the support of an extended family. Along with family members, friends, specialized caregivers and not-for-profit organizations, Axcan Pharma supports the CF community, providing quality products and services.
Quality products
Axcan provides a vast array of products in this field such as ULTRASE (pancrelipase), indicated for patients with partial or complete exocrine pancreatic insufficiency caused by Cystic Fibrosis, Chronic Pancreatitis, Pancreatectomy, and Shwachman's Syndrome. Pancrelipase capsules are also effective in controlling Steatorrhea (maldigestion of fat in the feces). VIOKASE (pancrelipase, USP) is indicated for the treatment of exocrine pancreatic insufficiency as associated with, but not limited to, Cystic Fibrosis, Chronic Pancreatitis, Pancreatectomy, or obstruction of the pancreas ducts. Other products for CF patients include ADEKs, SCANDISHAKE, SCANDICAL and FLUTTER.
Axcan sponsors programs to help make a difference
For CF patients, caregivers, and centers, Axcan implemented the following programs to help make a difference in the lives of patients and their families: CareFirst for CF, an innovative program to help ease the financial burden of infant patients diagnosed with CF; Comprehensive Care Program for CF, to provide additional support for CF patients by helping reduce the cost of therapy while providing better quality of care; the Rx Cost Reduction Program, a prescription rebate program to assist patients with the cost of treatment; and the CF Direct Connect Program, providing a dedicated Axcan resource to help ensure that the needs of the CF centers and caregivers are met.
| ULTRASE | VIOKASE | PANZYTRAT | ||
|---|---|---|---|---|
| Capsules | Tablets and powder | Microtablets | ||
| United States and Canada | United States and Canada | Worldwide | ||
| Partial or complete exocrine pancreatic insufficiency | Partial or complete exocrine pancreatic insufficiency | Partial or complete exocrine pancreatic insufficiency |
19
GI DISEASES OF THE BOWEL
Abdominal pain, cramping, fatigue and diarrhea
These are the main symptoms of Inflammatory Bowel Diseases (IBDs), a term used to describe two similar, yet distinct conditions: Crohn's Disease and Ulcerative Colitis. These diseases affect the digestive system and cause intestines to become inflamed, ulcerated, bleed easily, scar and lose the normal smoothness of the inner lining. Axcan markets a wide range of products used to treat inflammation associated with IBD therefore relieving these mild to debilitating symptoms.

20
Crohn's Disease
Affects any part of the gastrointestinal tract, from the mouth to the anus, and is characterized by patches of inflammation with healthy tissue between the diseased areas. The inflammation can extend through every layer of affected bowel tissue. No drug or surgery can cure the disease, although either or both can relieve the symptoms.
Ulcerative Colitis
Affects only the colon, and only a single layer of bowel tissue, the inner lining. The disease always starts in the portion of the colon called the rectum, and may extend as continuous inflammation from there to the rest of the colon. Usually, the disease can be controlled by medication.
IBD affects people regardless of gender, age or race
Most frequently, people are diagnosed between the ages of 15 and 25 years, or 45 and 55 years. No one knows what causes IBD. Also, IBD is unpredictable and many people experience "flare-ups" following which the disease seemingly goes away.
Improving treatment
Axcan is committed to developing novel forms of mesalamine (5-ASA) in order to improve the quality of life for IBD patients. A 1-gram suppository of mesalamine, a once-a-day formulation greatly improving convenience for the patient, has recently been approved by the U.S. Food and Drug Administration. Also, Axcan has recently completed Phase III clinical trials for a patented 4-gram rectal gel formulation of mesalamine for the topical treatment of Distal Ulcerative Colitis. The new formulation should be better tolerated by patients and prove to be easier to administer.
| CANASA | SALOFALK | CORTENEMA | ||
|---|---|---|---|---|
| Suppositories | Suppositories, tablets and enemas | Enemas | ||
| United States | Canada | Canada | ||
| Active ulcerative proctitis | Ulcerative proctitis Distal ulcerative colitis Acute ulcerative colitis | Adjunct in the treatment of non-specific inflammatory bowel diseases |
21
GI GASTRO-INTESTINAL (GI) AND GI-RELATED CANCER
Digestive cancers, the highest incidence and mortality of cancer worldwide
According to the International Digestive Cancer Alliance, in 2004, there will be approximately 3 million new cases of digestive cancers globally, with 2.2 million deaths. Digestive cancers affect the colon and rectum, the esophagus and stomach, and the liver and pancreas.

22
Barrett's esophagus, major risk factor for esophageal adenocarcinoma
Barrett's esophagus is a condition in which the normal lining of the lower part of the esophagus is replaced over time by another type of lining, normally present in the stomach. Usually Barrett's esophagus develops during the process of healing after a chronic injury to the esophageal mucosa such as caused by reflux of gastric juice (GERD) in the esophagus. Continued reflux may cause dysplastic changes progressing from Low-Grade to High-Grade Dysplasia. Such dysplasia may lead to esophageal adenocarcinoma, which is a life-threatening condition. The National Digestive Diseases Information Clearinghouse (NDDIC)(3) estimates that the risk of developing adenocarcinoma is 30 to 125 times greater in people who have Barrett's esophagus than in people who do not.
First Photodynamic Therapy (PDT) indicated for ablation of High-Grade Dysplasia in Barrett's esophagus
PHOTOFRIN (porfimer sodium) for injection is a photosensitizing agent used in the Photodynamic Therapy of tumors. It uses a combination of a photoactive drug and light from a laser, allowing the doctor to specifically target and destroy cells with High-Grade Dysplasia associated with Barrett's esophagus while limiting damage to surrounding healthy tissue. PHOTOFRIN was granted an orphan drug designation for this indication, which guarantees a 7-year marketing exclusivity.
Palliation of other cancers
PDT with PHOTOFRIN is also indicated for palliation of patients with completely or partially obstructing esophageal cancer, completely or partially obstructing endobronchial Non-Small Cell Lung Cancer (NSCLC) and papillary bladder cancer. Patients with NSCLC for whom surgery and radiotherapy are not indicated can also benefit from PHOTOFRIN.
- (3)
- The National Digestive Diseases Information Clearinghouse (NDDIC) is a service of the National Institute of Diabetes and Digestive and Kidney Diseases (NIDDK). The NIDDK is part of the National Institutes of Health under the U.S. Department of Health and Human Services.
| PHOTOFRIN | PHOTOBARR | |
|---|---|---|
| Powder for solution for injection | Powder for solution for injection | |
| Canada and Unites States | Worldwide | |
| Ablation of HGD in Barrett's esophagus | Ablation of HGD in Barrett's esophagus | |
| Palliative treatment of esophageal cancer | Palliative treatment of esophageal cancer | |
| Palliative and curative treatment of NSCLC | Palliative and curative treatment of NSCLC | |
| Papillary bladder cancer (Canada) |
23
GI OTHER GASTRO-INTESTINAL DISEASES AND DISORDERS
One in 10 Americans develops an ulcer at some time in his or her life.
A peptic ulcer is a sore on the lining of the stomach or duodenum, which is the beginning of the small intestine. A common occurrence, one cause of peptic ulcer is bacterial infection, but some ulcers are caused by long-term use of Non-Steroidal Anti-Inflammatory Drugs (NSAIDs), like aspirin and ibuprofen. In a few cases, cancerous tumors in the stomach or pancreas can cause ulcers. Peptic ulcers are not caused by stress or eating spicy foods, but these can make ulcers worse.
Effective treatment of active duodenal ulcers
CARAFATE is the U.S. brand, and SULCRATE, the Canadian brand of a sulcrafate-based product indicated for the treatment of active duodenal ulcers. Both of these products are currently available in suspension and tablet dosage forms.

24
One in five Americans has IBS
Irritable Bowel Syndrome (IBS) is a disorder that interferes with the normal functions of the large intestine (colon). Characterized by a group of symptoms such as cramps and abdominal pain, bloating, constipation, and diarrhea, IBS is one of the most common disorders diagnosed by doctors. It occurs more often in women than in men, usually beginning around age 20. IBS causes a great deal of discomfort and distress, but it does not permanently harm the intestines and does not lead to intestinal bleeding or to any serious disease such as cancer. Most people can control their symptoms with diet, stress management, and medications prescribed by their physician. But for some people, IBS can be disabling. They may be unable to work, attend social events, or travel even short distances.
Relieving symptoms of IBS
BENTYL and BENTYLOL (dicyclomine hydrochloride) are antispasmodic and anticholinergic drugs mainly used for the relief of gastrointestinal symptoms associated with Irritable Bowel Syndrome. These products are available in the U.S. and Canada.
About half of the population has hemorrhoids by age 50
The term hemorrhoids refers to a condition in which the veins around the anus or lower rectum are swollen and inflamed. Hemorrhoids may result from straining to move stool. Other contributing factors include pregnancy, aging, chronic constipation, diarrhea, etc. Hemorrhoids are either inside the anus (internal) or under the skin around the anus (external).
Relieving symptoms of hemorrhoids
PROCTOSEDYL (hydrocortisone acetate) is indicated for the reduction of swelling, pain and inflammation of hemorrhoids and other rectal lesions. This product is available in ointment and suppository dosage forms.
| CARAFATE | SULCRATE | BENTYL | BENTYLOL | PROCTOSEDYL | TAGAMET | |||||
|---|---|---|---|---|---|---|---|---|---|---|
| Tablets, suspensions United States Active duodenal ulcers | Tablets, suspensions Canada Duodenal and non-malignant gastric ulcers | Tablets, syrup and solution for intra-muscular injection United States Functional bowel and irritable bowel syndrome | Tablets, syrup Canada Irritable Bowel Functional bowel and irritable bowel syndrome | Ointment, suppositories Canada Hemorrhoids and rectal lesions | Tablets France Gastric and duodenal ulcers Esophagitis |
25
ITAX
(itopride hydrochloride) A NOVEL PROKINETIC DRUG TO TREAT MOTILITY DISORDERS
Up to 25% of the population is affected by dyspepsia
Functional Dyspepsia, a disorder of the upper gastrointestinal tract, affects up to 25% of the North American population annually and accounts for up to 5% of all visits to primary care physicians(4). Dyspepsia can be defined as pain or discomfort centered in the upper abdomen, characterized by abdominal fullness, early satiety, bloating, or nausea. The term functional dyspepsia refers to relapsing or chronic dyspepsia in patients without evidence of organic disease to explain the symptoms.
Dual mode of action
ITAX improves GI motility by a dual action mechanism. First, it acts as a dopamine antagonist on D2-receptors thereby increasing the secretion of acetylcholine; and secondly, it prevents hydrolysis of the released acetylcholine by the acetycholinesterase enzyme in the smooth muscles of the upper GI tract. This specific dual action on acetylcholine in the GI tract, by enhancing the acetylcholine-induced gastric contraction, effectively controls the gastric symptoms. ITAX has also been shown to have antiemetic properties.
Superior safety profile
Results from Axcan's recent high dose safety study on ITAX in healthy subjects showed no cardiac adverse drug reaction. Because it is metabolized by a Flavine-dependent Mono-Oxygenase (FMO) enzyme rather than by the Cytochrome P450 enzyme system, responsible for most drug metabolism, metabolic interactions and cardiotoxi-city are not expected from Itopride.
Therapeutic void for a distressing disorder
Currently in North America, there is no safe and efficacious treatment for Functional Dyspepsia. The void left by the first generation of gastroprokinetic drugs has yet to be filled because of significant cardiac side effects and other serious side effects. Currently, there is no FDA-approved drug for the treatment of motility disorders such as Functional Dyspepsia and Diabetic Gastroparesis. To date, the patients living with these distressing disorders have no satisfying therapeutic option available to them.
Itopride Hydrochloride in the Treatment of Functional Dyspepsia
Dr. Richard H. Hunt, Professor, Division of Gastroenterology,
McMaster University, Hamilton, Canada
Some of the most important developments in the treatment of gastrointestinal disease over the past thirty years have been for patients with upper gastrointestinal disorders. The principal areas of clinical need are for disorders of gastric statis and delayed gastric emptying such as may occur in patients with Diabetes Mellitus and Functional Dyspepsia and in patients with Gastroesophageal Reflux Disease especially those without heartburn or who experience regurgitation or high volume reflux. Itopride is a prokinetic drug, which also has antiemetic properties and has been available in Japan since 1995. In Caucasian populations, initial studies with Itopride suggest that it is safe and effective in patients with Functional Dyspepsia with a significant benefit for symptoms of pain and fullness and with a significant positive impact on quality of life.
September 17, 2004
Itopride in the treatment of Functional Dyspepsia
Scientific presentation of Dr. Richard Hunt
Mont-St-Hilaire, Quebec
- (4)
- Talley et al Gastroenterology 1992:102;1259-1268
26
ITAX Clinical Program on Track
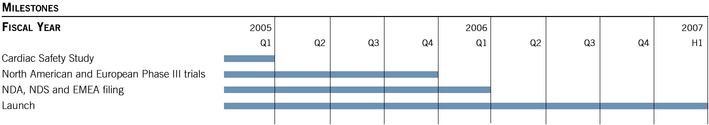
Enrollment for the two Phase III studies, being conducted in 90 North American centers and in 75 Western European centers, is underway and is expected to be completed in the third quarter of fiscal year 2005. More recently, a cardiac safety study, to examine ITAX in doses of up to 400mg three times a day, was completed, and results showed no cardiac adverse drug reaction. Axcan hopes to have results eight weeks after the final day of recruitment, which would allow filing an NDA, NDS and EMEA by the end of the first quarter of fiscal year 2006.
In addition, Axcan aims to study ITAX as a treatment for Diabetic Gastroparesis, a very serious condition that greatly affects quality of life.
ITAX for the Treatment of Diabetic Gastroparesis
Pursuing another unmet need
Diabetic Gastroparesis is the secondary indication that Axcan intends to pursue for ITAX. Gastroparesis is a neuromuscular disease characterized by delayed or absent emptying of the stomach. Gastroparesis occurs when the stomach's enteric nerves and/or muscle cells become damaged or destroyed. In addition, the disease can occur primarily as a result of nerve or muscle damage further down the digestive tract, which causes gastric contents to back up and pool in the stomach. The most prevalent secondary cause of Gastroparesis is Diabetes. Symptoms can include severe stomach muscle spasm, heartburn, nausea, vomiting and significant weight loss.
Almost 50% of Type I and Type II Diabetics have Gastroparesis
Gastroparesis occurs in Diabetes as a result of high blood glucose levels creating chemical and structural changes in the nerves and muscles of the stomach. Other secondary causes of the disease include Parkinson's Disease, migraine, connective tissue diseases (such as lupus and scleroderma) or failed gas-trectomy (a procedure now used to attempt to alleviate obesity). A recent study estimates that more than 5 million people in the U.S. suffer from either the primary or secondary form of Gastroparesis. In Diabetes, Gastroparesis is a significant contributor to loss of blood glucose control and diabetic crisis.
27
HEPENAX
(L-ornithine L-aspartate) A NOVEL TREATMENT FOR HEPATIC ENCEPHALOPATHY
When the liver fails, no other organ can take over its role
The liver performs a number of vital functions such as converting food into energy for the body's growth and maintenance as well as removing and converting toxins for elimination. Repeated or extensive damage to the liver caused by diseases such as alcoholism and Hepatitis C may ultimately result in cirrhosis, a severe degenerative disorder in which liver cells are destroyed and replaced by scar tissue, thus impairing its regenerative capacity.
PSE, a frequent and debilitating complication of cirrhosis
Porto-Systemic Encephalopathy (PSE) is a term used for Hepatic Encephalopathy (HE) in cirrhotic patients and, more rarely, in patients with portosystemic shunting without liver disease. HE, present in more than 28% of patients with cirrhosis, is the result of a diminished hepatic reservoir and inability to detoxify some toxins that originate in the bowel.
Ammonia is believed to be the main cause of HE
Ammonia is naturally produced by bacterial degradation of food proteins in the intestine. Normally, it is converted to urea by the liver and then excreted in the urine. However, because of the liver's impaired detoxifying capacity, increased ammonia levels enter the systemic circulation causing a wide variety of signs and symptoms. The most typical are changes in consciousness, intellectual function, and behavior as well as neuromuscular abnormalities. In severe cases, the symptoms can range from brain oedema to coma and even death.
No safe and effective therapy exists
Today, no available therapies have conclusively proven to be safe and effective in the treatment of HE. The conventional treatments have included protein intake restriction; use of non-absorbable disaccharides limited by the occurrence of flatulence, cramps and diarrhea; and antibiotics such as neomycin, which are associated with nephrotoxicity and ototoxicity.
28
Efficacy shown in seven Phase II studies
Developed and marketed by Merz Pharmaceuticals GmbH, L-ornithine L-aspartate (LOLA) has an excellent safety profile and has been shown to reduce ammonia blood levels and improve mental function in patients with HE. LOLA is believed to reduce ammonia levels by 1) enhancing the rate of the urea cycle, 2) acting as a substrate for the enzyme asparagine synthetase, which catalyses the reaction between ammonia and aspartate in the cells, and 3) acting as a substrate for glutamine synthetase, an enzyme which utilizes ammonia in the muscle for the synthesis of glutamine, thereby lowering blood ammonia concentration.
L-ornithine L-aspartate in the Management of Porto-Systemic Encephalopathy
Dr. Rajiv Jalan, Institute of Hepatology,
University College London Medical School, London, U.K.
Worldwide, deaths from cirrhosis, are increasing. Hepatic Encephalopathy (HE) is one of the most debilitating complications of cirrhosis. Currently, there are no available therapies that have been conclusively shown successful in the treatment of encephalopathy. The studies so far provide a compelling argument for L-ornithine L-aspartate (LOLA) in the treatment of HE. From the pathophysiological perspective, LOLA enhances the body's ability to detoxify ammonia in the muscle, central to the pathogenesis of HE. The current clinical plan by Axcan is likely to provide data required for approval by the FDA.
September 17, 2004
L-ornithine L-aspartate in the Management of Porto-Systemic Encephalopathy
Scientific Presentation of Dr. Rajiv Jalan
Mont-St-Hilaire, Quebec
29
A DEEP PIPELINE
PHOTOFRIN PDT in the Treatment of Cholangiocarcinoma
Dr. Steve Pereira, University College Medical School, London, U.K.
Cholangiocarcinoma (cancer of the bile ducts) and cancer of the gall bladder are tumors of the biliary tract that are considered as one pathological entity (biliary tract carcinoma, BTC). Recently published, a multicentre, randomised, controlled trial of repeated PDT with stenting versus stenting alone for unresectable, advanced cholangiocarcinoma was discontinued early by the monitoring committee after 39 patients had been randomised as there was a dramatic five-fold survival advantage in the PDT group, with an average survival at the time of publication of 493 days compared with 98 days in the stent alone group. Further multicentre studies, to confirm these exciting results and to define the likely important role of PDT in relation to best supportive care and other cancer therapies, are underway.
September 17, 2004
PHOTOFRIN PDT in the Treatment of Cholangiocarcinoma
Scientific Presentation of Dr. Steve Pereira
Mont-St-Hilaire, Quebec
Ursodeoxycholic Acid-disulfate in Liver Disease and Transplant
Kenneth D.R. Setchell(2), Nigel D. Heaton(2), Hector Vilca-Melendez(2), Clinical Mass Spectrometry Department, Cincinnati Children's Hospital Medical Center, Cincinnati, Ohio, U.S.A.(1), and Liver Transplant Surgical Service, King's College Hospital, London, U.K.(2)
(...) results from the successful completion of a 2-year study using an animal model of colon cancer were reported this year and showed that ursodiol disulfate (SUDCA) is significantly superior to ursodiol (UDCA) in colon cancer prevention in this model. Oral administration of SUDCA led to a 50% reduction in tumor burden, and 55% of animals were without tumors when challenged with the potent carcinogen, azoymethane. Completion of this proof-of-concept study justifies continuing evaluation of SUDCA in humans at risk for colon cancer.
Since SUDCA is highly hydrophilic it is ideally suited to intravenous use. In the last year we have initiated studies aimed at investigating the choleretic properties of SUDCA in an experimental pig model for human liver transplantation as a prelude to performing studies in human donors. The goal was to first demonstrate that SUDCA has a marked stimulatory effect on bile-flow that will be beneficial in improving initial function of the transplanted liver and later we will examine whether the highly hydrophilic property of SUDCA can protect the liver from ischemic damage that occurs during organ retrieval. Initial bile-flow following transplantation has been found to be associated with better graft function in humans and for this reason this has been first examined. (...) Based on these preliminary studies, we conclude that SUDCA is a potent choleretic bile acid, superior to UDCA, and its aqueous solubility makes it a potentially useful therapeutic agent for intravenous use in human liver transplantation. Its role as a protective agent from ischemia-reperfusion injury is presently under investigation.
September 17, 2004
Ursodeoxycholic Acid-disulfate in Liver Disease and Transplant
Scientific presentation of Dr. Kenneth D.R. Setchell
Mont-St-Hilaire, Quebec
30
| PRODUCT | INDICATION | STAGE OF DEVELOPMENT | TIMELINES | |||
|---|---|---|---|---|---|---|
| CANASA (4-gram mesalamine rectal gel) | Treatment of Distal Ulcerative Colitis | Phase III study results Launch | Q2 2005 H2 2006 | |||
ITAX (itopride hydrochloride, 100mg oral tablets) | Treatment of Functional Dyspepsia Treatment of Diabetic Gastroparesis | Cardiac Safety Study NDA, NDS and EMEA filing Launch Launch | Q1 2005 Q1 2006 H1 2007 FY 2008 | |||
PHOTOFRIN (porfimer sodium) | Treatment of Cholangiocarcinoma | Start of Phase III study | Q1 2005 | |||
HEPENAX (L-ornithine L-aspartate) | Treatment of Porto-Systemic Encephalopathy | Dose ranging study Phase III study (ies) NDA, NDS and EMEA filing Launch | Q4 2005 H2 2007 Q4 2007 H2 2008 | |||
URSODIOL DISULFATE (SUDCA) (oral tablets) | Chemoprevention of Colorectal Polyps | Animal toxicity studies Phase I study | Q2 2005 FY 2005 | |||
URSODIOL DISULFATE (SUDCA) (injectable formulation) | Total Parental Nutrition (TPN) Cholestatis Organ Preservation in Liver Transplant | — — | — — | |||
NCX-1000 (nitric oxide-releasing derivative of ursodiol) | Treatment of Portal Hypertension | Phase II studies | FY 2005 | |||
NMK-150 (high protease pancrelipase) | Pain Management in the Treatment of Chronic Small Duct Pancreatitis | Start of clinical development | FY 2005 | |||
NMK-250 (bacterial lipase) | Steatorrhea | Formulation work | Q2 2005 |
31
MANAGEMENT'S DISCUSSION AND ANALYSIS OF FINANCIAL CONDITION AND RESULTS OF OPERATIONS
This discussion should be read in conjunction with the information contained in Axcan's consolidated financial statements and the related notes thereto. All amounts are in U.S. dollars.
OVERVIEW
Axcan is a leading specialty pharmaceutical company concentrating in the field of gastroenterology, with operations in North America and Europe. Axcan markets and sells pharmaceutical products used in the treatment of a variety of gastrointestinal diseases and disorders. The Company seeks to expand its gastrointestinal franchise by in-licensing products and acquiring products or companies, as well as developing additional products and expanding indications for existing products. Axcan's current products include ULTRASE, PANZYTRAT and VIOKASE for the treatment of certain gastrointestinal symptoms, related to cystic fibrosis in the case of ULTRASE and PANZYTRAT; URSO and DELURSAN for the treatment of certain cholestatic liver diseases; SALOFALK and CANASA for the treatment of certain inflammatory bowel diseases; and PHOTOFRIN for the treatment of certain types of gastrointestinal cancers and other conditions. In addition, as at September 30, 2004, Axcan had one product pending approval, a new formulation for a product currently marketed in the United States. Axcan also has a number of other pharmaceutical projects in all phases of development including ITAX for the treatment of functional dyspepsia. Axcan reported revenue of $243.6 million and operating income of $76.8 million for the year ended September 30, 2004.
Much of Axcan's recent sales growth is derived from sales in the United States and from sales by its French subsidiary, following recent acquisitions. During the first quarter of fiscal 2003, Axcan acquired the worldwide rights to the PANZYTRAT enzyme product line from Abbott Laboratories ("Abbott") and the rights to DELURSAN, an ursodiol 250mg tablet, from Aventis Pharma S.A. ("Aventis") for the French market. During the first quarter of fiscal 2004, Axcan acquired the rights to a group of products from Aventis for a cash purchase price of $145.0 million. These products are CARAFATE and BENTYL for the U.S. market and SULCRATE, BENTYLOL and PROCTOSEDYL for the Canadian market (collectively, "AVAX" product line). Revenue from sales of Axcan's products in the United States was $166.7 million (68.4% of total revenue) for the year ended September 30, 2004, compared to $113.9 million (63.6% of total revenue) for fiscal 2003 and $100.1 million for fiscal 2002. In Canada, revenue was $28.0 million (11.5% of total revenue) for the year ended September 30, 2004, compared to $20.6 million (11.5% of total revenue) for fiscal 2003 and $17.4 million for fiscal 2002. In Europe, revenue was $48.7 million (20.0% of total revenue) for the year ended September 30, 2004, compared to $44.5 million (24.8% of total revenue) for fiscal 2003 and $14.8 million for fiscal 2002.
Axcan's revenue historically has been and continues to be principally derived from sales of pharmaceutical products to large pharmaceutical wholesalers and large chain pharmacies. Axcan utilizes a "pull-through" marketing approach that is typical of pharmaceutical companies. Under this approach, Axcan's sales representatives demonstrate the features and benefits of its products to gastroenterologists who may write their patients prescriptions for Axcan's products. The patients, in turn, take the prescriptions to pharmacies to be filled. The pharmacies then place orders with the wholesalers or, in the case of large chain pharmacies, their distribution centres, to whom Axcan sells its products.
Axcan's expenses are comprised primarily of selling and administrative expenses (including marketing expenses), cost of goods sold (including royalty payments to those companies from whom Axcan licenses some of its products), research and development expenses as well as depreciation and amortization.
Axcan's annual and quarterly operating results are primarily affected by three factors: wholesaler buying patterns; the level of acceptance of Axcan's products by gastroenterologists and their patients; and the extent of Axcan's control over the marketing of its products. Wholesaler buying patterns, including a tendency to increase inventory levels prior to an anticipated or announced price increase, affect Axcan's operating results by shifting revenue between quarters. To maintain good relations with wholesalers, Axcan typically gives prior notice of price increases. The level of patient and physician acceptance of Axcan's products, as well as the availability of similar therapies, which may be less effective but also less expensive than some of Axcan's products, impact Axcan's revenues by driving the level and timing of prescriptions for its products.
32
CRITICAL ACCOUNTING POLICIES
Axcan's consolidated financial statements are prepared in accordance with generally accepted accounting principles in the United States of America ("U.S. GAAP"), applied on a consistent basis. Axcan's critical accounting policies include the use of estimates, revenue recognition, the recording of research and development expenses and the determination of the useful lives or fair value of goodwill and intangible assets. Some of our critical accounting policies require the use of judgment in their application or require estimates of inherently uncertain matters. Although our accounting policies are in compliance with U.S. GAAP, a change in the facts and circumstances of an underlying transaction could significantly change the application of our accounting policies to that transaction, which could have an effect on our financial statements. Discussed below are those policies that we believe are critical and require the use of complex judgment in their application.
USE OF ESTIMATES
The preparation of financial statements in accordance with U.S. GAAP requires management to make estimates and assumptions that affect the recorded amounts of assets and liabilities, the disclosure of contingent assets and liabilities as of the date of the financial statements and the disclosure of recognized amounts of revenues and expenses during the year. Significant estimates and assumptions made by management include the allowance for accounts receivable and inventories, reserves for product returns, rebates and chargebacks, the classification of intangible assets between finite and indefinite life, useful lives of long-lived assets, the expected cash flows used in evaluating long-lived assets, goodwill and investments for impairment, contingency provisions and other accrued charges. These estimates were made using the historical information available to management. The Company reviews all significant estimates affecting the financial statements on a recurring basis and records the effect of any adjustment when necessary. Actual results could differ from those estimates.
REVENUE RECOGNITION
Revenue is recognized when the product is shipped to the Company's customer, provided the Company has not retained any significant risks of ownership or future obligations with respect to the product shipped. Revenue from product sales is recognized net of sales discounts, allowances, returns, rebates and chargebacks. In certain circumstances, returns or exchanges of products are allowed under the Company's policy, and provisions are maintained accordingly. Amounts received from customers as prepayments for products to be shipped in the future are reported as deferred revenue.
GOODWILL AND INTANGIBLE ASSETS
Axcan's goodwill and intangible assets are stated at cost, less accumulated amortization. Since October 1, 2001, the Company does not amortize goodwill and intangible assets with an indefinite life. However, management evaluates the value of the unamortized portion of goodwill and intangible assets annually, by comparing the carrying value to the future benefits of the Company's activities or the expected sale of pharmaceutical products. Should there be a permanent impairment in value or if the unamortized balance exceeds recoverable amounts, a write-down will be recognized for the current year. To date, Axcan has not recognized any significant permanent impairment in value except for an amount of $83,000 of goodwill for the year ended September 30, 2004. Intangible assets with finite life are amortized over their estimated useful lives.
RESEARCH AND DEVELOPMENT EXPENSES
Research and development expenses are charged to operations in the year they are incurred. Acquired in-process research and development having no alternative future use is written off at the time of acquisition. The cost of intangibles that are acquired from others for a particular research and development project, with no alternative use, is written off at the time of acquisition.
ACQUISITION OF COMPANIES
On November 7, 2001, Axcan acquired all the outstanding shares of Laboratoires Entéris S.A.S. ("Entéris"), a company specializing in the distribution of gastrointestinal products in France. The acquisition cost, including transaction expenses, amounted to $23.0 million and was paid in cash.
33
On April 17, 2002, Axcan acquired all of the oustanding shares and certain related assets of Laboratoire du Lactéol du Docteur Boucard S.A. ("Lactéol"). Lactéol specializes in the manufacturing and distribution of gastrointestinal products in France. The acquisition cost, including transaction expenses, amounted to $13.1 million and was paid through the issuance of 365,532 common shares of the Company and the payment of $8.4 million in cash.
The acquisition costs for both transactions have been allocated to the assets and liabilities acquired according to their estimated fair values at the acquisition dates. The operating results of Entéris and Lactéol have been included in the consolidated financial statements from their respective acquisition dates.
ACQUISITION OF PRODUCTS
On November 18, 2003, the Company acquired the rights to the AVAX product line from Aventis. The $145.0 million purchase price was paid out of Axcan's cash on hand.
On August 29, 2003, the Company acquired an exclusive license for North America, the European Union and Latin America, from Abbott to develop, manufacture and market ITAX, a patented gastroprokinetic drug. Under the terms of this license agreement, the Company paid $10 million in cash and assumed $2 million in research contract liability. This product is in development, has not reached technological feasibility and has no known alternative uses; therefore, its acquisition was deemed to be acquired in-process research and was expensed in the period of acquisition.
On December 10, 2002, the Company acquired the rights to the Ursodiol 250mg tablets DELURSAN for the French market from Aventis, for a cash purchase price of $22.8 million.
On December 3, 2002, the Company acquired the worldwide rights to the PANZYTRAT enzyme product line from Abbott for a cash purchase price of $45.0 million.
During a transition period, the seller in each of these acquisition transactions acts as selling agent for the management of these products. For the year ended September 30, 2004, sales of these products were still managed in part by the sellers. Axcan includes in its revenue the net sales from such products less corresponding cost of goods sold and other seller related expenses. Consequently, although net sales of such products for the year ended September 30, 2004, were $7,667,940 ($14,255,979 in 2003), the Company only included in its revenue an amount of $4,685,673 ($9,463,645 in 2003) representing the net sales less cost of goods sold and other seller related expenses.
RESULTS OF OPERATIONS
The following table sets forth, for the years indicated, the percentage of revenue represented by items in Axcan's consolidated statements of operations:
| For the years ended September 30 | 2004 | 2003 | 2002 | ||||
|---|---|---|---|---|---|---|---|
| | % | % | % | ||||
| Revenue | 100.0 | 100.0 | 100.0 | ||||
| Cost of goods sold | 22.2 | 24.8 | 25.7 | ||||
| Selling and administrative expenses | 31.4 | 35.2 | 37.3 | ||||
| Research and development expenses | 8.2 | 6.8 | 6.7 | ||||
| Acquired in-process research | — | 6.7 | — | ||||
| Depreciation and amortization | 6.7 | 4.5 | 5.7 | ||||
| 68.5 | 78.0 | 75.4 | |||||
| Operating income | 31.5 | 22.0 | 24.6 | ||||
| Financial expenses | 2.8 | 2.4 | 0.7 | ||||
| Interest income | (0.3 | ) | (0.9 | ) | (0.7 | ) | |
| Loss (gain) on foreign exchange | (0.1 | ) | — | 0.2 | |||
| Takeover-bid expenses | — | 2.1 | — | ||||
| 2.4 | 3.6 | 0.2 | |||||
| Income before income taxes | 29.1 | 18.4 | 24.4 | ||||
| Income taxes | 9.1 | 7.3 | 8.4 | ||||
| Net income | 20.0 | 11.1 | 16.0 | ||||
34
QUARTERLY RESULTS
(amounts in thousands of dollars, except share related data)
| | | | Net income (loss) per share | ||||||
|---|---|---|---|---|---|---|---|---|---|
| Quarter | | Net income (loss) | |||||||
| Revenue | Basic | Diluted | |||||||
| | $ | $ | $ | $ | |||||
| 2004 | |||||||||
| First | 57,565 | 10,435 | 0.23 | 0.23 | |||||
| Second | 63,192 | 12,421 | 0.27 | 0.24 | |||||
| Third | 62,005 | 12,552 | 0.28 | 0.25 | |||||
| Fourth | 60,872 | 13,320 | 0.29 | 0.26 | |||||
2003 | |||||||||
| First | 37,846 | 6,557 | 0.15 | 0.14 | |||||
| Second | 45,621 | 8,933 | 0.20 | 0.20 | |||||
| Third | 46,877 | 6,339 | 0.14 | 0.14 | |||||
| Fourth | 48,740 | (1,904 | ) | (0.04 | ) | (0.04 | ) | ||
YEAR ENDED SEPTEMBER 30, 2004
COMPARED TO YEAR ENDED SEPTEMBER 30, 2003
REVENUE
For the year ended September 30, 2004, revenue was $243.6 million compared to $179.1 million for the preceding fiscal year, an increase of 36.0%. This increase in revenue primarily resulted from $41.8 million in U.S. and Canadian sales of the AVAX product line which was acquired in November 2003 and strong sales of CANASA in the U.S. Revenues from sales made by the French subsidiary, following the acquisition of DELURSAN as well as the PANZYTRAT product line, also contributed to the increase.
PRODUCT SALES
Key sales figures for fiscal 2004 are as follows:
- •
- Worldwide sales of pancreatic enzymes (ULTRASE, PANZYTRAT and VIOKASE) amounted to $57.6 million, a decrease of 1.0% over fiscal 2003 sales of pancreatic enzymes. PANZYTRAT acquired in the first quarter of fiscal 2003, accounted for $10.2 million of these sales in fiscal 2003 and $13.5 million in fiscal 2004;
- •
- Worldwide sales of ursodiol (URSO 250, URSO DS and DELURSAN) increased 4.0% to $56.1 million. DELURSAN acquired in the second quarter of fiscal 2003 accounted for $6.9 million of these sales in fiscal 2003 and $ 10.8 million in fiscal 2004;
- •
- Sales of mesalamine (CANASA and SALOFALK) amounted to $50.3 million, a 92.0% increase from the prior year. This increase offsets the 24% decrease announced last year and reflects not only the increase in prescriptions but also the fluctuations in wholesalers buying patterns. Often, customers will buy in advance of pre-announced price increases or in anticipation of price increases, thus shifting revenue from one period to another.
- •
- Sales of the AVAX product line amounted to $41.8 million. The AVAX product line was acquired in November 2003.
- •
- Sales of PHOTOFRIN and other products in North America amounted to $14.1 million, the same total as for the prior year.
- •
- Sales of other products in Europe, mainly LACTÉOL and TAGAMET amounted to $23.7 million, a 14% decrease over the prior year. This decrease is mainly due to lower sales of TAGAMET following changes in the regulatory rules applicable to this product.
COST OF GOODS SOLD
Cost of goods sold consists principally of costs of raw materials, royalties and manufacturing costs. Axcan outsources most of its manufacturing requirements. Cost of goods sold increased $9.7 million (21.8%) to $54.2 million for the year ended September 30, 2004, from $44.5 million for the preceding fiscal year. As a percentage of revenue, cost of goods sold for the year ended September 30, 2004, decreased as compared to the preceding fiscal year from 24.8% to 22.2%. This decrease in the cost of goods sold as a percentage of revenue was due to the increase in sales of products with a higher margin in the United States and an improved margin in Europe.
35
SELLING AND ADMINISTRATIVE EXPENSES
Selling and administrative expenses consist principally of salaries and other costs associated with Axcan's sales force and marketing activities Selling and administrative expenses increased $13.3 million (21.1%) to $76.4 million for the year ended September 30, 2004, from $63.1 million for the preceding fiscal year. This increase is mainly due to an increase in our sales force as a result of the recent acquisition of additional products.
RESEARCH AND DEVELOPMENT EXPENSES
Research and development expenses consist principally of fees paid to outside parties that Axcan uses to conduct clinical studies and to submit governmental approval applications on its behalf as well as the salaries and benefits paid to its personnel involved in research and development projects. Excluding acquired in-process research, research and development expenses increased $7.8 million (64.5%) to $19.9 million for the year ended September 30, 2004, from $12.1 million for the preceding fiscal year. This increase is mainly due to the development of ITAX, acquired in August 2003, for the treatment of functional dyspepsia.
ACQUIRED IN-PROCESS RESEARCH
The acquired in-process research of $12.0 million for the year ended September 30, 2003, was a result of the acquisition of an exclusive license for North America, the European Union and Latin America, from Abbott to develop, manufacture and market ITAX, a patented gastroprokinetic drug. Under the terms of this license agreement, Axcan paid $10.0 million and assumed $2.0 million in research liability. As this product had not reached technological feasibility and had no known alternative use, it was considered to be acquired in-process research and was expensed in the fourth quarter of the year ended September 30, 2003, the period of acquisition.
DEPRECIATION AND AMORTIZATION
Depreciation and amortization consists principally of the amortization of intangible assets with a finite life. Intangible assets include trademarks, trademark licenses and manufacturing rights. Depreciation and amortization increased $8.3 million (102.5%) to $16.4 million for the year ended September 30, 2004, from $8.1 million for the preceding fiscal year. The increase is mainly due to the amortization of the AVAX product line acquired from Aventis on November 18, 2003, and of TAGAMET which was reclassified from intangible assets with an indefinite life to intangible assets with a finite life on October 1, 2003.
FINANCIAL EXPENSES
Financial expenses consist principally of interest and fees paid in connection with money borrowed for acquisitions. Financial expenses increased $2.6 million (60.5%) to $6.9 million for the year ended September 30, 2004, from $4.3 million for the preceding fiscal year. This increase is mainly due to the Company recognizing a full year's worth of interest expense on the $125.0 million aggregate principal amount of 41/4% convertible subordinated notes due 2008 which were issued on March 5, 2003, and amortization of deferred debt issue expenses.
TAKEOVER-BID EXPENSES
On April 10, 2003, Axcan made an unsolicited cash tender offer of $8.75 per share for all of the outstanding shares of common stock of Salix Pharmaceuticals Inc. ("Salix"), which was subsequently increased to $10.50 per share. On June 27, 2003, the offer for all outstanding shares of Salix expired without acceptance or extension. Total costs related to the offer were $3.7 million and were expensed during the quarter ended June 30, 2003, thus reducing net income by approximately $2.4 million, or $0.05 per share for the year ended September 30, 2003.
INCOME TAXES
Income taxes amounted to $22.3 million for the year ended September 30, 2004, compared to $13.0 million for the year ended September 30, 2003. The effective tax rates were 31.4% for the year ended September 30, 2004, and 39.5% for the year ended September 30, 2003. The acquired in-process research is deductible at a lower rate than most operating expenses. As discussed below in "net income", excluding acquired in-process research and takeover-bid expenses, the effective tax rate was 31.4% for the year ended September 30, 2003.
36
NET INCOME
Net income was $48.7 million or $1.08 of basic income per share and $0.98 of diluted income per share, for the year ended September 30, 2004, compared to $19.9 million or $0.44 of both basic and diluted income per share for the preceding year. The weighted average number of common shares outstanding used to establish the basic per share amounts increased from 44.9 million for the year ended September 30, 2003, to 45.3 million for the year ended September 30, 2004, following the exercise of options previously granted pursuant to Axcan's stock option plan. The weighted average number of common shares used to establish the diluted per share amounts increased from 45.6 million for the year ended September 30, 2003, to 52.8 million for the year ended September 30, 2004, because the shares issuable under the convertible subordinated notes are included because a trigger event giving holders the right to convert their notes occurred in each of the second, third and fourth quarters of this fiscal year as a result of the stock trading price exceeding 110% of the conversion price of the convertible notes.
Net income (in thousands of dollars), basic income per share and diluted income per share excluding takeover-bid expenses, acquired in-process research and related income taxes for the years ended September 30, 2004, and 2003, were as follows:
| | For the years ended September 30 | |||||
|---|---|---|---|---|---|---|
| | 2004 | 2003 | ||||
| | $ | $ | ||||
| Net income in accordance with U.S. GAAP | 48,728 | 19,925 | ||||
| Plus: Takeover-bid expenses | — | 3,697 | ||||
| Acquired in-process research | — | 12,000 | ||||
| Less: Related income taxes | — | (2,272 | ) | |||
| Net income excluding takeover-bid expenses, acquired in-process research and related income taxes | 48,728 | 33,350 | ||||
| Income per share excluding takeover-bid expenses, acquired in-process research and related income taxes | ||||||
| Basic | 1.08 | 0.74 | ||||
| Diluted | 0.98 | 0.73 | ||||
This measure of net income, basic income per share and diluted income per share excluding certain items is a non-GAAP measure that does not have a standardized meaning and, as such, is not necessarily comparable to similarly titled measures presented by other companies. This measure is provided to assist our investors in assessing Axcan's operating performance. We believe the presentation of this non-GAAP measure provides useful information because it eliminates certain expenses unrelated to our operations and because it provides similar information for period-to-period comparisons. Investors should consider this non-GAAP measure in the context of Axcan's U.S. and Canadian GAAP results of operations.
Excluding takeover-bid expenses, acquired in-process research and related income taxes, net income for the year ended September 30, 2004, was $48.7 million or $1.08 of basic income per share and $0.98 of diluted income per share compared to $33.4 million of net income or $0.74 of basic income per share and $0.73 of diluted income per share for the year ended September 30, 2003.
YEAR ENDED SEPTEMBER 30, 2003, COMPARED TO YEAR ENDED SEPTEMBER 30, 2002
REVENUE
Revenue increased $46.7 million (35.3%) to $179.1 million for the year ended September 30, 2003, from $132.4 million for the preceding fiscal year. This increase in revenue resulted primarily from sales generated by Axcan's French subsidiary, following the acquisitions of Entéris and Lactéol and the PANZYTRAT and DELURSAN product lines. Strong sales of URSO in North America also contributed to the increase. Revenue from Europe, including domestic and foreign sales, amounted to $44.5 million for the year ended September 30, 2003, compared to $14.8 million for the year ended September 30, 2002.
37
PRODUCT SALES
Key sales figures for fiscal 2003 are as follows:
- •
- Worldwide sales of pancreatic enzymes (ULTRASE, PANZYTRAT and VIOKASE) amounted to $57.9 million, an increase of 47% over fiscal 2002 sales of pancreatic enzymes. PANZYTRAT acquired in the first quarter of fiscal 2003, accounted for $10.2 million of these sales;
- •
- Worldwide sales of ursodiol (URSO 250, URSO DS and DELURSAN) increased 79% to $53.9 million. DELURSAN acquired in the second quarter of fiscal 2003 accounted for $6.9 million of these sales;
- •
- Sales of mesalamine (CANASA and SALOFALK) amounted to $26.2 million, a 24% decrease from the prior year. This decrease was mainly due to the resolution of short product supply, that occurred in fiscal 2002, for a product competing with CANASA in an associated indication.
- •
- Sales of PHOTOFRIN and other products in North America amounted to $14.1 million, an increase of 3%.
- •
- Sales of other products in Europe, mainly LACTÉOL and TAGAMET, amounted to $27.6 million, a 76% increase over the prior year.
COST OF GOODS SOLD
Cost of goods sold increased $10.5 million (28.3%) to $44.5 million for the year ended September 30, 2003, from $34.0 million for the preceding fiscal year. As a percentage of revenue, cost of goods sold for the year ended September 30, 2003, decreased as compared to the preceding fiscal year, from 25.7% to 24.8% of revenue. This decrease in the cost of goods sold expressed as a percentage of revenue is due in part to the accounting treatment of the PANZYTRAT revenue during the transition period. Since the acquisition of the PANZYTRAT rights in December 2002, Abbott acted as an agent for sales of this product line, until marketing authorization transfers were completed. During the transition period, Axcan included in its revenue the net sales from PANZYTRAT less corresponding cost of goods sold and other Abbott related expenses. Thus, Axcan's cost of goods sold did not include costs related to these PANZYTRAT sales.
SELLING AND ADMINISTRATIVE EXPENSES
Selling and administrative expenses increased $13.7 million (27.7%) to $63.1 million for the year ended September 30, 2003, from $49.4 million for the preceding fiscal year. This increase was mainly due to the inclusion of $15.0 million of selling and administrative expenses from Entéris and Lactéol for the year ended September 30, 2003, compared to $7.8 million for the preceding year which represented five months of operations for Lactéol and eleven months of operations for Entéris.
RESEARCH AND DEVELOPMENT EXPENSES
Excluding acquired in-process research, research and development expenses increased $3.2 million (36.0%) to $12.1 million for the year ended September 30, 2003, from $8.9 million for the preceding fiscal year. The increase was primarily due to the fact that Axcan was conducting two additional clinical studies on its new CANASA rectal gel formulation in order to meet regulatory requirements. Also, additional costs were incurred to address manufacturing issues at one of the five manufacturing sites involved in the production of HELIZIDE.
DEPRECIATION AND AMORTIZATION
Depreciation and amortization increased $0.5 million (6.6%) to $8.1 million for the year ended September 30, 2003, from $7.6 million for the preceding fiscal year. The increase resulted mainly from depreciation and amortization of capital assets acquired in the November 2001 acquisition of Entéris and the April 2002 acquisition of Lactéol.
FINANCIAL EXPENSES
Financial expenses increased $3.4 million to $4.3 million for the year ended September 30, 2003, from $0.9 million for the preceding fiscal year. This increase is mainly due to interest expense on the $125.0 million aggregate principal amount of 41/4% convertible subordinated notes due 2008, which were issued on March 5, 2003.
38
INCOME TAXES
Income taxes amounted to $13.0 million for the year ended September 30, 2003, compared to $11.1 million for the preceding fiscal year. The effective tax rates were 39.5% for the year ended September 30, 2003, and 34.4% for the year ended September 30, 2002. The increase in our effective tax rate was due to acquired in-process research which is deductible at a lower rate than most operating expenses.
NET INCOME
Net income (in thousands of dollars), basic income per share and diluted income per share excluding takeover-bid expenses, acquired in-process research and related income taxes for the years ended September 30, 2003, and 2002, were as follows:
| | For the years ended September 30 | ||||
|---|---|---|---|---|---|
| | 2003 | 2002 | |||
| | $ | $ | |||
| Net income in accordance with U.S. GAAP | 19,925 | 21,188 | |||
| Plus: Takeover-bid expenses | 3,697 | — | |||
| Acquired in-process research | 12,000 | — | |||
| Less: Related income taxes | (2,272 | ) | — | ||
| Net income excluding acquired in-process research, takeover-bid expenses and related income taxes | 33,350 | 21,188 | |||
| Income per share excluding takeover-bid expenses, acquired in-process research and related income taxes | |||||
| Basic | 0.74 | 0.51 | |||
| Diluted | 0.73 | 0.50 | |||
For the year ended September 30, 2003, net income was $19.9 million or $0.44 of both basic and diluted income per share, compared to $21.2 million or $0.51 of basic income per share and $0.50 of diluted income per share for the preceding year. Excluding takeover-bid expenses, acquired in-process research and related income taxes, net income for the year ended September 30, 2003, was $33.4 million or $0.74 of basic income per share and $0.73 of diluted income per share compared to $21.2 of net income or $0.51 of basic income per share and $0.50 of diluted income per share for the year ended September 30, 2002.
The basic weighted average number of common shares outstanding used to establish the per share amounts increased from 41.7 million for the year ended September 30, 2002, to 44.9 million for the year ended September 30, 2003, following the exercise of options previously granted pursuant to Axcan's stock option plan in fiscal 2003 and the completion of public offerings, the subscription of investors through private placements, the exercise of options and the issuance of shares for the acquisition of assets in fiscal 2002. The adjusted weighted average number of common shares outstanding used to establish the diluted per share amounts increased from 42.5 million for the year ended September 30, 2002, to 45.6 million for the year ended September 30, 2003.
CANADIAN GAAP
The differences (in thousands of dollars) between U.S. and Canadian GAAP which affect net income for the years ended September 30, 2004, and 2003, are summarized in the following table:
| | For the years ended September 30 | ||||
|---|---|---|---|---|---|
| | 2004 | 2003 | |||
| | $ | $ | |||
| Net income in accordance with U.S. GAAP | 48,728 | 19,925 | |||
Implicit interest on convertible debt | (4,234 | ) | (2,292 | ) | |
| Acquired in-process research | — | 12,000 | |||
| Amortization of new product acquisition costs | (54 | ) | (54 | ) | |
| Income tax impact of the above adjustments | 20 | (962 | ) | ||
| Net earnings in accordance with Canadian GAAP | 44,460 | 28,617 | |||
39
On March 5, 2003, the Company closed an offering of $125.0 million aggregate principal amount of 41/4% convertible subordinated notes due April 15, 2008. As a result of the terms of the notes, under Canadian GAAP, an amount of $24,238,899 was included in shareholders' equity as equity component of the convertible debt and an amount of $100,761,101 was included in long-term debt, as the liability component of the convertible notes. For the year ended September 30, 2004, implicit interest in the amount of $4,233,768 ($2,292,478 in 2003) was accounted for and added to the liability component.
Under Canadian GAAP, research and development expenses are stated net of related tax credits which generally constitute between 10% and 15% of the aggregate amount of such expenses. Under U.S. GAAP, these tax credits are applied against income taxes.
Under U.S. GAAP, acquired in-process research is included in results of operations as at the date of acquisition if no alternative use is established. Under Canadian GAAP, the acquired in-process research, including the new product acquisition costs, is deferred and amortized from the date of commencement of commercial production.
LIQUIDITY AND CAPITAL RESOURCES
Axcan's cash, cash equivalents and short term investments decreased $133.0 million (77.8%) to $37.9 million at September 30, 2004, from $170.9 million at September 30, 2003. As of September 30, 2004, working capital was $87.7 million, compared to $174.8 million at September 30, 2003. These decreases are mainly due to the acquisition of the rights to the AVAX product line for a total cash purchase price of $145.0 million plus transaction expenses.
Total assets increased $64.3 million (11.8%) to $609.6 million as of September 30, 2004, from $545.3 million as of September 30, 2003. Total assets were $367.0 million as of September 30, 2002. Shareholders' equity increased $61.1 million (18.5%) to $392.1 million as of September 30, 2004 from $331.0 million as of September 30, 2003.
Historically, Axcan has financed research and development, operations, acquisitions, milestone payments and investments out of the proceeds of public and private sales of its equity and convertible debt, cash flows from operating activities, and loans from joint venture partners and financial institutions. Since it went public in Canada in December 1995, Axcan has raised approximately $243.0 million from sales of its equity and $125.0 million from sales of convertible notes. Furthermore, Axcan has borrowed and since repaid funds from financial institutions to finance the acquisition of Axcan Scandipharm Inc. and from Schwarz Pharma Inc., a former joint venture partner, to finance the acquisition of Axcan URSO.
Axcan's research and development expenses totalled $19.9 million for fiscal 2004. Axcan believes that cash, cash equivalents and short term investments, together with funds provided by operations, will be sufficient to meet its operating cash requirements, including the development of products through research and development activities, capital expenditures and repayment of its debt. Assuming regulatory approvals of future products and indications stemming from its research and development efforts, Axcan believes that these will also significantly contribute to an increase in funds provided by operations. However, Axcan regularly reviews product and other acquisition opportunities and may therefore require additional debt or equity financing. Axcan cannot be certain that such additional financing, if required, will be available on acceptable terms, or at all.
LINE OF CREDIT
Since September 22, 2004, the Company has had an amended credit facility with a banking syndicate. The amended credit facility consists of a $125 million 364-day extendible revolving facility with a two-year term-out option maturing on September 22, 2007.
40
The credit facility is secured by a first priority security interest on all present and future acquired assets of the Company and its material subsidiaries, and provides for the maintenance of certain financial ratios. Among the restrictions imposed by the credit facility is a convenant limiting cash dividends, share repurchases (other than redeemable shares issued in connection with a permitted acquisition) and similar distributions to shareholders to 10% of the Company's net income for the preceding fiscal year. As of September 30, 2004, Axcan was in compliance with all covenants under the credit facility.
The interest rate varies, depending on the Company's leverage, between 25 basis points and 100 basis points over Canadian prime rate or U.S. base rate, and between 125 basis points and 200 basis points over the LIBOR rate or bankers acceptances. The credit facility may be drawn in U.S. dollars or in Cana-dian dollar equivalents. As of September 30, 2004, there was no amount outstanding under this credit facility.
CONVERTIBLE SUBORDINATED NOTES AND OTHER LONG-TERM DEBT
Long-term debt including instalments due within one year totaled $129.7 million as of September 30, 2004, compared to $131.0 million as of September 30, 2003. As of September 30, 2004, long-term debt included $2.2 million of bank loans, $2.5 million of obligations under capital leases contracted by Axcan's French subsidiary and the $125.0 million 41/4% convertible subordinated notes due 2008 which were issued on March 5, 2003.
The notes are convertible into 8,924,113 common shares during any quarterly conversion period if the closing price per share for at least 20 consecutive trading days during the 30 consecutive trading-day period ending on the first day of the conversion period exceeds 110% of the conversion price in effect on that thirtieth trading day. Since this trigger event occurred during the second, third and fourth quarter of the year ended September 30, 2004, the 8,924,113, common shares are included in the weighted average number of common shares outstanding for these periods. The notes are also convertible during the five business-day period following any 10 consecutive trading-day period in which the daily average of the trading prices for the notes was less than 95% of the average conversion value for the notes during that period. The note-holders may also convert their notes upon the occurrence of specified corporate transactions or if the Company has called the notes for redemption. On or after April 20, 2006, the Company may at its option, redeem the notes, in whole or in part at redemption prices varying from 101.70% to 100.85% of the principal amount plus any accrued and unpaid interest to the redemption date. The notes also include provisions for the redemption of all the notes for cash at the option of the Company following certain changes in tax treatment.
CASH FLOWS
Cash flows from operating activities decreased $28.1 million (54.6%) from $51.5 million of cash provided by operating activities for the year ended September 30, 2003, to $23.4 million for the year ended September 30, 2004. This decrease is mainly due to the increase in accounts receivable and inventories during this fiscal year following the increase in sales and the acquisition of new products. Cash flows from financing activities for the year ended September 30, 2004, were $3.3 million. Cash flows used by investment activities for the year ended September 30, 2004, were $42.7 million mainly due to the net cash used for the acquisition of intangible assets for $149.6 million and property, plant and equipment for $13.4 million with the proceeds from the disposal of short term investments. Cash flows from financing activities for the year ended September 30, 2003, were $117.9 million mainly due to the issuance of the convertible subordinated notes, which provided net proceeds of $120.5 million. Cash flows used for investment activities for the year ended September 30, 2003, were $152.1 million mainly due to the net cash used for the acquisition of short term investments and the acquisition of intangible assets with the proceeds from the disposal of short term investments.
41
OFF-BALANCE SHEET ARRANGEMENTS
Axcan does not have any transactions, arrangements and other relationships with unconsolidated entities that are likely to affect its operating results, liquidity or capital resources. Axcan has no special purpose or limited purpose entities that provide off balance sheet financing, liquidity or market or credit risk support, engage in leasing, hedging, research and development services, or other relationships that expose the Company to liability that is not reflected on the face of the consolidated financial statements.
CONTRACTUAL OBLIGATIONS
The following table summarizes Axcan's significant contractual obligations (in thousands of dollars) as of September 30, 2004, and the effect such obligations are expected to have on our liquidity and cash flows in future years. This table excludes amounts already recorded on the balance sheet as current liabilities at September 30, 2004 or certain other purchase obligations as discussed below:
| | For the years ending September 30 | |||||||||
|---|---|---|---|---|---|---|---|---|---|---|
| | 2005 | 2006 | 2007 | 2008 | 2009 and thereafter | |||||
| | $ | $ | $ | $ | $ | |||||
| Long-term debt | 1,779 | 1,542 | 1,085 | 125,246 | 42 | |||||
| Operating leases | 1,146 | 433 | 147 | 113 | 51 | |||||
| Other commitments | 1,579 | 520 | 150 | 150 | — | |||||
| 4,504 | 2,495 | 1,382 | 125,509 | 93 | ||||||
Purchase orders for raw materials, finished goods and other goods and services are not included in the above table. Management is not able to determine the aggregate amount of such purchase orders that represent contractual obligations, as purchase orders may represent authorizations to purchase rather than binding agreements. For the purpose of this table, contractual obligations for purchase of goods or services are defined as agreements that are enforceable and legally binding on the Company and that specify all significant terms, including: fixed or minimum quantities to be purchased; fixed, minimum or variable price provisions; and the approximate timing of the transaction. Axcan's purchase orders are based on current needs and are fulfilled by our vendors with relatively short timetables. The Company does not have significant agreements for the purchase of raw materials or finished goods specifying minimum quantities or set prices that exceed its short term expected requirements. Axcan also enters into contracts for outsourced services; however, the obligations under these contracts are not significant and the contracts generally contain clauses allowing for cancellation without significant penalty except for a sales management services contract included in the above table. As milestone payments are primarily contingent on receiving regulatory approval for products under development, they do not have defined maturities.
The expected timing of payment of the obligations discussed above is estimated based on current information. Timing of payments and actual amounts paid may be different depending on the time of receipt of goods or services, or for some obligations, changes to agreed-upon amounts.
EFFECT OF RECENTLY ISSUED U.S. ACCOUNTING PRONOUNCEMENTS
In November 2002, the Financial Accounting Standards Board ("FASB") issued interpretation ("FIN") No. 45,"Guarantor's Accounting and Disclosure Requirements for Guarantees." FIN No. 45 requires a guarantor to recognize, at the inception of a guarantee, a liability for the fair value of the obligation it has undertaken in issuing the guarantee. FIN No. 45 also requires guarantors to disclose certain information for guarantees, including product warranties, outstanding at the end of the reporting period. At adoption, FIN No. 45 did not have any impact on the Company's consolidated statements of income or financial position.
42
In December 2002, the FASB issued Statement of Financial Accounting Standards ("SFAS") No. 148,"Accounting for Stock-Based Compensation — Transition and Disclosure". SFAS No. 148 amends SFAS No. 123,"Accounting for Stock-Based Compensation", to provide alternative methods of transition to SFAS No. 123's fair value method of accounting for stock-based employee compensation. SFAS No. 148 also amends the disclosure provisions of SFAS No. 123 and Accounting Principles Board Opinion ("APB") No. 28,"Interim Financial Reporting", to require disclosure in the summary of significant accounting policies of the effects of an entity's accounting policy with respect to stock-based employee compensation on reported net income and earnings per share in annual and interim financial statements. While SFAS No. 148 does not amend SFAS No. 123 to require companies to account for employee stock options using the fair value method, the disclosure provisions of SFAS No. 148 are applicable to all companies with stock-based employee compensation, regardless of whether they account for that compensation using the fair value method of SFAS No. 123 or the intrinsic value method of APB No. 25. As allowed by SFAS No. 123, the Company elected to continue to utilize the accounting method prescribed by APB No. 25 and adopted the disclosure requirements of SFAS No. 123.
In January 2003, the FASB issued FIN No. 46,"Consolidation of Variable Interest Entities, an interpretation for Accounting Research Bulletin No. 51." FIN No. 46 requires certain variable interest entities, or VIEs, to be consolidated by the primary beneficiary of the entity if the equity investors in the entity do not have the characteristics of a controlling financial interest or do not have sufficient equity at risk for the entity to finance its activities without additional subordinated financial support from other parties. FIN No. 46 is effective for all VIEs created or acquired after January 31, 2003. For VIEs created or acquired prior to February 1, 2003, the provisions of FIN No. 46 must be applied for the first interim or annual period beginning after December 15, 2003. The Company currently has no contractual relationship or other business relationship with a variable interest entity and therefore the adoption of FIN No. 46 did not have an effect on the Company's consolidated balance sheets or statements of operations, shareholders' equity and cash flows.
On March 31, 2004, the FASB issued an Exposure Draft, "Share-Based Payment, an Amendment of FASB Statements No. 123 and 95". The Exposure Draft would require all entities to recognize compensation cost for share-based awards, including options, granted to employees. The proposed Statement would eliminate the ability to account for share-based compensation transactions using APB No. 25,"Accounting for Stock Issued to Employees", and generally would require instead that such transactions be accounted for using a fair-value based method. Public companies would be required to measure stock-based compensation classified as equity by valuing the instrument the employee receives at its grant-date fair value. Share-based awards classified as liabilities, would be measured at fair value and remeasured at fair value at each reporting period. Currently such awards are measured at intrinsic value under both APB No. 25 and SFAS 123,"Accounting for Stock-Based Compensation". The Company would apply the proposed Statement for interim and fiscal periods beginning after June 15, 2005, using the modified prospective transition approach.
43
During the September 2004 meeting of the Emerging Issues Task Force ("EITF") a consensus was reached on EITF Issue 04-8,"The Effect of Contingently Convertible Debt on Diluted Earnings per Share". The EITF 04-8 requires Companies to include certain convertible debt and equity instruments, that were previously excluded, in their calculations of diluted earnings per share. The EITF concluded that Issue 04-8 will be effective for periods ending after December 15, 2004, and must be applied by restating all periods during which time the applicable convertible instruments were outstanding. The 41/4% convertible subordinated notes, issued in 2003 will always be included in the Company's diluted earnings per share calculation. If the Company had applied retroactively the conclusions of the Task Force, the diluted income per common share would have been $0.96 and $0.44 respectively for the years ended September 30, 2004, and 2003.
EARNINGS COVERAGE
Under U.S. GAAP, for the twelve months ended September 30, 2004, the Company's interest requirements amounted to $6.0 million on a pro-forma basis, and its earnings coverage ratio, defined as the ratio of earnings before interest and income taxes to pro-forma interest requirements, was 12.8 to one.
Under Canadian GAAP, for the twelve months ended September 30, 2004, the Company's interest requirements amounted to $10.6 million on a pro-forma basis, and its earnings coverage ratio was 7.3 to one. The principal difference between the earnings coverage ratios under Canadian GAAP and U.S. GAAP is attributable to the inclusion of implicit interest of $4.6 million as required by Canadian GAAP.
RISK FACTORS
Axcan is exposed to financial market risks, including changes in foreign currency exchange rates and interest rates. Axcan does not use derivative financial instruments for speculative or trading purposes. Axcan does not use off-balance sheet financing or similar special purpose entities. Inflation has not had a significant impact on Axcan's results of operations.
FOREIGN CURRENCY RISK
Axcan operates internationally; however, a substantial portion of the revenue and expense activities and capital expenditures are transacted in U.S. dollars. Axcan's exposure to exchange rate fluctuation is reduced because, in general, Axcan's revenues denominated in currencies other than the U.S. dollar are matched by a corresponding amount of costs denominated in the same currency. Axcan expects this matching to continue.
INTEREST RATE RISK
The primary objective of Axcan's investment policy is the protection of capital. Accordingly, investments are made in high-grade government and corporate securities with varying maturities, but typically, less than 180 days. Therefore, Axcan does not have a material exposure to interest rate risk, and a 100 basis-point adverse change in interest rates would not have a material effect on Axcan's consolidated results of operations, financial position or cash flows. Axcan is exposed to interest rate risk on borrowings under the credit facility. The credit facility bears interest based on LIBOR, U.S. dollar base rate, Canadian dollar prime rate, or Canadian dollar Bankers' Acceptances. Based on projected advances under the credit facility, a 100 basis-point adverse change in interest rates would not have a material effect on Axcan's consolidated results of operations, financial position, or cash flows.
44
SUPPLY AND MANUFACTURE
Axcan depends on third parties for the supply of active ingredients and for the manufacture of the majority of its products. Although Axcan looks to secure alternative suppliers, Axcan may not be able to obtain the active ingredients or products from such third parties, the active ingredients or products may not comply with specifications, or the prices at which Axcan purchases them may increase and Axcan may not be able to locate alternative sources of supply in a reasonable time period, or at all. If any of these events occur, Axcan may not be able to continue to market certain of its products, and its sales and profitability would be adversely affected.
VOLATILITY OF SHARE PRICES
The market price of Axcan's shares is subject to volatility. Deviations in actual financial or scientific results, as compared to expectations of securities analysts who follow our activities can have a significant effect on the trading price of Axcan's shares.
FORWARD-LOOKING STATEMENTS
This document contains forward-looking statements, which reflect the Company's current expectations regarding future events. To the extent that any statements in this document contain information that is not historical, the statements are essentially forward-looking and are often identified by words such as "anticipate", "expect", "estimate", "intend", "project", "plan" and "believe". These forward-looking statements include but are not limited to the expected sales growth of the Company's products and the expected increase in funds from operations resulting from the Company's research and development expenditures. The forward-looking statements involve risks and uncertainties. Actual events could differ materially from those projected herein and depend on a number of factors, including but not limited to the successful and timely completion of clinical studies, the difficulty of predicting FDA or other regulatory approvals, the commercialization of a drug or therapy after regulatory approval is received, the difficulty of predicting acceptance and demand for pharmaceutical products, the impact of competitive products and pricing, new product development and launch, the availability of raw materials, the protection of our intellectual property, fluctuations in our operating results and other risks detailed from time to time in the Company's filings with the Securities and Exchange Commission and the Canadian Securities Commissions. The reader is cautioned not to rely on these forward-looking statements. The Company disclaims any obligation to update these forward-looking statements.
On behalf of Management,
 Jean Vézina Vice President, Finance and Chief Financial Officer |
45
U.S. GAAP
CONSOLIDATED FINANCIAL STATEMENTS
| Management's Report | 48 | ||
| Auditors' Report | 49 | ||
| Financial Statements | |||
| Consolidated Balance Sheets | 50 | ||
| Consolidated Operations | 51 | ||
| Consolidated Shareholders' Equity | 52 | ||
| Consolidated Cash Flows | 53 | ||
| Notes to Consolidated Financial Statements | 54 to 73 | ||
MANAGEMENT'S REPORT
The consolidated financial statements of Axcan Pharma Inc. and the other financial information included in this annual report are the responsibility of the Company's management.
These consolidated financial statements and the other financial information have been prepared by management in accordance with accounting principles generally accepted in the United States of America. This responsibility includes the selection of appropriate accounting principles and methods in the circumstances and the use of careful judgement in establishing reasonable accounting estimates.
Management maintains internal control systems designed among other things, to provide reasonable assurance that the Company's assets are adequately safeguarded and that the accounting records are a reasonable basis to prepare relevant and reliable financial information.
The Audit Committee is composed solely of external directors. This Committee meets with the external auditors and management to discuss matters relating to the audit, internal control and financial information. The Committee also reviews the consolidated quarterly and annual financial statements.
These consolidated financial statements have been audited by Raymond Chabot Grant Thornton, LLP, Chartered Accountants, whose report indicating the scope of their audit and their opinion on the consolidated financial statements is presented below.
The Board of Directors has approved the Company's financial statements on the recommendation of the Audit Committee.
The Company decided, for the year beginning October 1, 2002, to switch from Canadian generally accepted accounting principles to generally accepted accounting principles in the United States of America as its primary reporting convention. Consolidated financial statements in accordance with Canadian generally accepted accounting principles have also been prepared.
Léon F. Gosselin President and Chief Executive Officer | David W. Mims Executive Vice President and Chief Operating Officer | Jean Vézina Vice President, Finance and Chief Financial Officer |
Mont-Saint-Hilaire, Quebec, Canada
November 10, 2004
48 U.S. GAAP
AUDITORS' REPORT
TO THE SHAREHOLDERS OF AXCAN PHARMA INC.
We have audited the consolidated balance sheets of Axcan Pharma Inc. as at September 30, 2004 and 2003 and the consolidated statements of operations, shareholders' equity and cash flows for each of the years in the three-year period ended September 30, 2004. These financial statements are the responsibility of the Company's management. Our responsibility is to express an opinion on these financial statements based on our audits.
We conducted our audits in accordance with the standards of the Public Company Accounting Oversight Board (United States) and with generally accepted auditing standards in Canada. Those standards require that we plan and perform an audit to obtain reasonable assurance whether the financial statements are free of material misstatement. An audit includes examining, on a test basis, evidence supporting the amounts and disclosures in the financial statements. An audit also includes assessing the accounting principles used and significant estimates made by management, as well as evaluating the overall financial statement presentation. We believe that our audits provide a reasonable basis for our opinion.
In our opinion, these consolidated financial statements present fairly, in all material respects, the financial position of the Company as at September 30, 2004 and 2003 and the results of its operations and its cash flows for each of the years in the three-year period ended September 30, 2004 in accordance with accounting principles generally accepted in the United Sates of America.
On November 10, 2004, we reported separately to the shareholders of Axcan Pharma Inc., on the consolidated financial statements for the same periods, prepared in accordance with generally accepted accounting principles in Canada.
Chartered Accountants |
Montreal, Quebec, Canada
November 10, 2004
U.S. GAAP 49
| September 30 | 2004 | 2003 | |||
|---|---|---|---|---|---|
| in thousands of U.S. dollars, except share related data | $ | $ | |||
| Assets | |||||
| Current assets | |||||
| Cash and cash equivalents | 21,979 | 37,773 | |||
| Short-term investments available for sale (Note 5) | 15,922 | 133,112 | |||
| Accounts receivable (Note 6) | 46,585 | 19,685 | |||
| Income taxes receivable | 9,196 | 5,294 | |||
| Inventories (Note 7) | 37,270 | 20,163 | |||
| Prepaid expenses and deposits | 3,494 | 2,794 | |||
| Deferred income taxes (Note 8) | 4,586 | 6,214 | |||
| Total current assets | 139,032 | 225,035 | |||
Investments (Note 9) | — | 1,002 | |||
| Property, plant and equipment, net (Note 10) | 31,252 | 20,331 | |||
| Intangible assets, net (Note 11) | 407,875 | 265,423 | |||
| Goodwill, net (Note 12) | 27,467 | 27,550 | |||
| Deferred debt issue expenses, at amortized cost | 3,088 | 4,233 | |||
| Deferred income taxes (Note 8) | 930 | 1,775 | |||
| Total assets | 609,644 | 545,349 | |||
Liabilities | |||||
| Current liabilities | |||||
| Accounts payable and accrued liabilities (Note 14) | 47,917 | 43,418 | |||
| Income taxes payable | 731 | 4,821 | |||
| Instalments on long-term debt | 1,778 | 1,528 | |||
| Deferred income taxes (Note 8) | 936 | 494 | |||
| Total current liabilities | 51,362 | 50,261 | |||
Long-term debt (Note 15) | 127,916 | 129,474 | |||
| Deferred income taxes (Note 8) | 38,290 | 34,603 | |||
| Total liabilities | 217,568 | 214,338 | |||
| Commitments and contingencies (Note 22) | |||||
Shareholders' Equity | |||||
| Capital stock (Note 16) | |||||
| Series A preferred shares, without par value; shares authorized: 14,175,000; no shares issued | — | — | |||
| Series B preferred shares, without par value; shares authorized: 12,000,000; no shares issued | — | — | |||
| Common shares, without par value; unlimited shares authorized; issued and outstanding: 45,562,336 and 45,004,320 as at September 30, 2004 and 2003, respectively | 260,643 | 255,743 | |||
| Retained earnings | 112,362 | 63,634 | |||
| Accumulated other comprehensive income | 19,071 | 11,634 | |||
| Total shareholders' equity | 392,076 | 331,011 | |||
| Total liabilities and shareholders' equity | 609,644 | 545,349 | |||
The accompanying notes are an integral part of the consolidated financial statements.
Léon F. Gosselin Director | Dr Claude Sauriol Director |
50 U.S. GAAP
CONSOLIDATED OPERATIONS
| Years ended September 30 | 2004 | 2003 | 2002 | |||||
|---|---|---|---|---|---|---|---|---|
| in thousands of U.S. dollars, except share related data | $ | $ | $ | |||||
| Revenue | 243,634 | 179,084 | 132,404 | |||||
| Cost of goods sold | 54,247 | 44,459 | 34,039 | |||||
| Selling and administrative expenses | 76,365 | 63,084 | 49,392 | |||||
| Research and development expenses | 19,866 | 12,098 | 8,855 | |||||
| Acquired in-process research | — | 12,000 | — | |||||
| Depreciation and amortization | 16,359 | 8,063 | 7,546 | |||||
| 166,837 | 139,704 | 99,832 | ||||||
| Operating income | 76,797 | 39,380 | 32,572 | |||||
Financial expenses | 6,885 | 4,283 | 898 | |||||
| Interest income | (756 | ) | (1,639 | ) | (912 | ) | ||
| Loss (gain) on foreign currency | (313 | ) | 122 | 266 | ||||
| Takeover-bid expenses | — | 3,697 | — | |||||
| 5,816 | 6,463 | 252 | ||||||
| Income before income taxes | 70,981 | 32,917 | 32,320 | |||||
| Income taxes (Note 8) | 22,253 | 12,992 | 11,132 | |||||
| Net income | 48,728 | 19,925 | 21,188 | |||||
| Income per common share | ||||||||
| Basic | 1.08 | 0.44 | 0.51 | |||||
| Diluted | 0.98 | 0.44 | 0.50 | |||||
Weighted average number of common shares | ||||||||
| Basic | 45,286,199 | 44,914,944 | 41,664,510 | |||||
| Diluted | 52,787,964 | 45,607,992 | 42,527,500 | |||||
The accompanying notes are an integral part of the consolidated financial statements.
U.S. GAAP 51
CONSOLIDATED SHAREHOLDERS' EQUITY
| Years ended September 30 | 2004 | 2003 | 2002 | ||||
|---|---|---|---|---|---|---|---|
| in thousands of U.S. dollars | | | | ||||
| Common shares (number) | |||||||
| Balance, beginning of year | 45,004,320 | 44,863,198 | 38,412,133 | ||||
| Shares issued following public offerings for cash | — | — | 5,000,000 | ||||
| Shares issued following private investors' subscription for cash | — | — | 208,044 | ||||
| Shares issued following the exercise of the underwriters' option for cash | — | — | 750,000 | ||||
| Shares issued pursuant to the stock option plan for cash | 558,016 | 141,122 | 127,489 | ||||
| Shares issued for the acquisition of assets | — | — | 365,532 | ||||
| Balance, end of year | 45,562,336 | 45,004,320 | 44,863,198 | ||||
| $ | $ | $ | |||||
Common shares | |||||||
| Balance, beginning of year | 255,743 | 254,640 | 183,193 | ||||
| Shares issued following public offerings for cash | — | — | 54,312 | ||||
| Shares issued following private investors' subscription for cash | — | — | 3,000 | ||||
| Shares issued following the exercise of the underwriters' option for cash | — | — | 8,625 | ||||
| Shares issued pursuant to the stock option plan for cash | 4,900 | 1,103 | 751 | ||||
| Shares issued for the acquisition of assets | — | — | 4,759 | ||||
| Balance, end of year | 260,643 | 255,743 | 254,640 | ||||
Retained earnings | |||||||
| Balance, beginning of year | 63,634 | 43,709 | 22,521 | ||||
| Net income | 48,728 | 19,925 | 21,188 | ||||
| Balance, end of year | 112,362 | 63,634 | 43,709 | ||||
Accumulated other comprehensive income (loss) | |||||||
| Balance, beginning of year | 11,634 | (3,562 | ) | (5,283 | ) | ||
| Foreign currency translation adjustments | 7,437 | 15,196 | 1,721 | ||||
| Balance, end of year | 19,071 | 11,634 | (3,562 | ) | |||
| Total shareholders' equity | 392,076 | 331,011 | 294,787 | ||||
Comprehensive income | |||||||
| Foreign currency translation adjustments | 7,437 | 15,196 | 1,721 | ||||
| Net income | 48,728 | 19,925 | 21,188 | ||||
| Total comprehensive income | 56,165 | 35,121 | 22,909 | ||||
The accompanying notes are an integral part of the consolidated financial statements.
52 U.S. GAAP
CONSOLIDATED CASH FLOWS
| Years ended September 30 | 2004 | 2003 | 2002 | |||||
|---|---|---|---|---|---|---|---|---|
| in thousands of U.S. dollars | $ | $ | $ | |||||
| Operations | ||||||||
| Net income | 48,728 | 19,925 | 21,188 | |||||
| Non-cash items | ||||||||
| Non-controlling interest | — | (103 | ) | (363 | ) | |||
| Amortization of deferred debt issue expenses | 1,144 | 646 | 247 | |||||
| Other depreciation and amortization | 16,359 | 8,063 | 7,546 | |||||
| Loss (gain) on disposal of assets | (5 | ) | 1,130 | — | ||||
| Foreign currency fluctuation | 342 | 305 | 507 | |||||
| Deferred income taxes | 6,625 | 1,848 | 2,378 | |||||
| Share in net loss of joint ventures | 455 | 106 | 46 | |||||
| Changes in working capital items (Note 18) | (50,288 | ) | 19,576 | 3,782 | ||||
| Cash flows from operating activities | 23,360 | 51,496 | 35,331 | |||||
| Financing | ||||||||
| Long-term debt | 2,212 | 126,064 | 1,506 | |||||
| Repayment of long-term debt | (3,842 | ) | (4,687 | ) | (3,267 | ) | ||
| Deferred debt issue expenses | — | (4,589 | ) | (537 | ) | |||
| Issue of shares | 4,900 | 1,103 | 65,039 | |||||
| Cash flows from financing activities | 3,270 | 117,891 | 62,741 | |||||
Investment | ||||||||
| Acquisition of short-term investments | (20,936 | ) | (133,112 | ) | (60,740 | ) | ||
| Disposal of short-term investments | 138,074 | 60,740 | — | |||||
| Acquisition of investments | — | — | (16 | ) | ||||
| Disposal of investments | 1,876 | 637 | 385 | |||||
| Acquisition of property, plant and equipment | (13,409 | ) | (4,291 | ) | (2,881 | ) | ||
| Disposal of property, plant and equipment | 405 | — | — | |||||
| Acquisition of intangible assets | (149,628 | ) | (76,093 | ) | (1,561 | ) | ||
| Disposal of intangible assets | 917 | — | — | |||||
| Other | — | — | 1,363 | |||||
| Net cash used for business acquisitions (Note 4) | — | — | (31,302 | ) | ||||
| Cash flows from investment activities | (42,701 | ) | (152,119 | ) | (94,752 | ) | ||
| Foreign exchange gain on cash held in foreign currencies | 277 | 528 | 142 | |||||
| Net increase (decrease) in cash and cash equivalents | (15,794 | ) | 17,796 | 3,462 | ||||
| Cash and cash equivalents, beginning of year | 37,773 | 19,977 | 16,515 | |||||
| Cash and cash equivalents, end of year | 21,979 | 37,773 | 19,977 | |||||
The accompanying notes are an integral part of the consolidated financial statements.
U.S. GAAP 53
NOTES TO CONSOLIDATED FINANCIAL STATEMENTS
September 30
Amounts in the tables are stated in thousands of U.S. dollars, except share related data.
1. GOVERNING STATUTES AND NATURE OF OPERATIONS
The Company, incorporated under the Canada Business Corporations Act, is involved in the research, development, production and distribution of pharmaceutical products, mainly in the field of gastroenterology.
2. CHANGES IN ACCOUNTING POLICIES
a) Year ended September 30, 2004
Disclosure of information about capital structure
In April 2004, the Financial Accounting Standards Board ("FASB") issued FASB Staff Position ("FSP") to Statement of Financial Accounting Standard ("SFAS") No. 129-1,"Disclosure Requirements under FASB Statement No. 129, Disclosure of Information about Capital Structure, Relating to Contingently Convertible Securities" to provide disclosure guidance for contingently convertible securities, including those instruments with contingent conversion requirements that have not been met and otherwise are not required to be included in the computation of diluted earnings per share. The FSP addresses concerns that disclosures relating to contingently convertible securities are inconsistent between companies or may be inadequate. FSP SFAS No. 129-1 states that to comply with the requirements of SFAS No. 129, the significant terms of the conversion features of the contingently convertible security should be disclosed to enable users of financial statements to understand the circumstances of the contingency and the potential impact of conversion. The Company evaluated the impact of this pronouncement and has enhanced its disclosures as required.
Consolidation of variable interest entities
In January 2003, the FASB issued Interpretation ("FIN") No. 46,"Consolidation of Variable Interest Entities, an interpretation for Accounting Research Bulletin No. 51." FIN No. 46 requires certain variable interest entities, or VIEs, to be consolidated by the primary beneficiary of the entity if the equity investors in the entity do not have the characteristics of a controlling financial interest or do not have sufficient equity at risk for the entity to finance its activities without additional subordinated financial support from other parties. FIN No. 46 is effective for all VIEs created or acquired after January 31, 2003. For VIEs created or acquired prior to February 1, 2003, the provisions of FIN No. 46 must be applied for the first interim or annual period beginning after December 15, 2003. The Company currently has no contractual relationship or other business relationship with a variable interest entity and therefore the adoption of FIN No. 46 did not have an effect on the Company's consolidated balance sheets or statements of operations, shareholders' equity and cash flows.
b) Year ended September 30, 2003
Basis of presentation
The Company decided, for the year beginning October 1, 2002, to switch from Canadian generally accepted accounting principles ("GAAP") to the United States of America ("U.S.") GAAP as its primary reporting convention. The change in GAAP was influenced by the Company's desire to better meet the needs of its shareholders by applying accounting rules that are consistent with the majority of its customers and peer companies. Consolidated financial statements prepared in U.S. dollars and in accordance with Canadian GAAP are available to shareholders and filed with regulatory authorities.
Guarantor's accounting and disclosure requirements for guarantees
In November 2002, the FASB issued FIN No. 45,"Guarantor's Accounting and Disclosure Requirements for Guarantees." FIN No. 45 requires a guarantor to recognize, at the inception of a guarantee, a liability for the fair value of the obligation it has undertaken in issuing the guarantee. FIN No. 45 also requires guarantors to disclose certain information for guarantees, including product warranties, outstanding at the end of the reporting period. At adoption, FIN No. 45 did not have any impact on the Company's consolidated statements of income or financial position.
Impairment or disposal of long-lived assets
SFAS No. 144,"Accounting for the Impairment or Disposal of Long-lived Assets" provides guidance on how assets are grouped when testing for and measuring impairment and proposes a two-step process for first determining when an impairment loss is recognized and then measuring that loss. The adoption of this new standard had no impact on the consolidated financial statements.
Stock-based compensation
In December 2002, the FASB issued SFAS No. 148,"Accounting for Stock-Based Compensation — Transition and Disclosure". SFAS No. 148 amends SFAS No. 123,"Accounting for Stock-Based Compensation", to provide alternative methods of transition to SFAS No. 123's fair value method of accounting for stock-based employee compensation. SFAS No. 148 also amends the disclosure provisions of SFAS No. 123 and Accounting Principles Board Opinion ("APB") No. 28,"Interim Financial Reporting", to require disclosure in the summary of significant accounting policies of the effects of an entity's accounting policy with respect to stock-based employee compensation on reported net income and earnings per share in annual and interim financial statements. While SFAS No. 148 does not amend SFAS No. 123 to require companies to account for employee stock options using the fair value method, the disclosure provisions of SFAS No. 148 are applicable to all companies with stock-based employee compensation, regardless of whether they account for that compensation using the fair value method of SFAS No. 123 or the intrinsic value method of APB No. 25. As allowed by SFAS No. 123, the Company elected to continue to utilize the accounting method prescribed by APB No. 25 and applies the disclosure requirements of SFAS No. 123.
54 U.S. GAAP
c) Year ended September 30, 2002
Business combinations, goodwill and other intangible assets
In June 2001, the FASB has approved for issuance SFAS No. 141,"Business Combinations," and No. 142,"Goodwill and Other Intangible Assets." SFAS No. 141 requires that the purchase method of accounting be used for all business combinations initiated after June 30, 2001 and that the use of the pooling-of-interest method is no longer allowed. SFAS No. 142 requires that upon adoption, amortization of goodwill and intangible assets with indefinite life will cease and instead, their carrying value will be evaluated for impairment on an annual basis. Intangible assets with finite life will continue to be amortized over their useful lives and reviewed for impairment. SFAS No. 142 is effective for fiscal years beginning after December 15, 2001. The Company has elected to early adopt and, since October 1, 2001, it no longer amortizes its goodwill and trademarks with indefinite life, but however, evaluates goodwill and trademarks with indefinite life for impairment annually. Intangible assets with finite life will continue to be amortized over their estimated useful lives. As required by the standards, the Company completed the impairment tests on October 1, 2001 and did not record any impairments.
d) Standards applicable for the year 2005
Effect of contingently convertible instruments on diluted earnings per share
During the September 2004 meeting of the Emerging Issues Task Force ("EITF") a consensus was reached on EITF Issue 04-8,"The Effect of Contingently Convertible Debt on Diluted Earnings per Share". The EITF 04-8 requires companies to include certain convertible debt and equity instruments, that were previously excluded, into their calculations of diluted earnings per share. The EITF concluded that Issue 04-8 will be effective for periods ending after December 15, 2004, and must be applied by restating all periods during which time the applicable convertible instruments were outstanding. The 4.25% convertible subordinated notes, issued in 2003, will always be included in the Company's diluted earnings per share calculation. If the Company had applied retroactively the conclusions of the EITF, the diluted income per common share would have been $0.96 and $0.44 respectively for the years ended September 30, 2004 and 2003.
Share-based payment
On March 31, 2004, the FASB issued an Exposure Draft,"Share-Based Payment, an Amendment of FASB Statements No. 123 and 95". The Exposure Draft would require all entities to recognize compensation cost for share-based awards, including options, granted to employees. The proposed Statement would eliminate the ability to account for share-based compensation transactions using APB No. 25,"Accounting for Stock Issued to Employees", and generally would require instead that such transactions be accounted for using a fair-value based method. Public companies would be required to measure stock-based compensation classified as equity by valuing the instrument the employee receives at its grant-date fair value. Share-based awards classified as liabilities, would be measured at fair value and remeasured at fair value at each reporting period. Currently such awards are measured at intrinsic value under both APB No. 25 and SFAS 123,"Accounting for Stock-Based Compensation". The Company would apply the proposed Statement for interim and fiscal periods beginning after June 15, 2005 using the modified prospective transition approach.
3. ACCOUNTING POLICIES
Basis of presentation
The Company has prepared these consolidated financial statements in U.S. dollars and in accordance with U.S. GAAP. Consolidated financial statements prepared in U.S. dollars and in accordance with Canadian GAAP are available to shareholders and filed with various regulatory authorities.
Accounting estimates
The preparation of financial statements in accordance with generally accepted accounting principles requires management to make estimates and assumptions that affect the recorded amounts of assets and liabilities and disclosure of contingent assets and liabilities as of the date of the financial statements and recognized amounts of revenues and expenses during the year. Significant estimates and assumptions made by management include allowances for accounts receivable and inventories, reserves for product returns, rebates and chargebacks, the classification of intangible assets between finite life and indefinite life, the useful lives of long-lived assets, the expected cash flows used in evaluating long-lived assets, goodwill and investments for impairment, pending legal settlements, the realizability of deferred tax assets and the allocation of the purchase price of acquired assets and businesses. The estimates are made using the historical information available to management and other expected factors. The Company reviews all significant estimates affecting the financial statements on a recurring basis and records the effect of any adjustments when necessary. Actual results could differ from those estimates.
Principles of consolidation
These financial statements include the accounts of the Company and its subsidiaries, the most important being Axcan Scandipharm Inc., Axcan Pharma U.S. Inc., and Axcan Pharma S.A. (the result of the merger of Laboratoires Entéris S.A.S. with Laboratoires du Lactéol du Docteur Boucard S.A.). Significant intercompany transactions have been eliminated in consolidation.
U.S. GAAP 55
Revenue recognition
Revenue is recognized when the product is shipped to the Company's customers, provided the Company has not retained any significant risks of ownership or future obligations with respect to the product shipped. Revenue from product sales is recognized net of sales discounts, allowances, returns, rebates and chargebacks. In certain circumstances, returns or exchange of products are allowed under the Company's policy and provisions are maintained accordingly. Amounts received from customers as prepayments for products to be shipped in the future are reported as deferred revenue.
Cash and cash equivalents
The Company includes in cash and cash equivalents cash and all highly liquid short-term investments with initial maturities of three months or less.
Short-term investments
The Company classifies its short-term investments as available for sale. These investments are recorded at their fair value, unrealized gains or losses are recorded as a component in shareholders' equity. As at September 30, 2004, there is no material unrealized gain or loss.
Accounts receivable
The majority of the Company's accounts receivable are due from companies in the pharmaceutical industry. Credit is extended based on evaluation of a customers' financial condition and, generally, collateral is not required. Accounts receivable are due within 30 days and are stated at amounts due from customers net of an allowance for doubtful accounts. Accounts outstanding longer than the contractual payment terms are considered past due. The Company determines its allowance by considering a number of factors, including the length of time trade accounts receivable are past due, the Company's previous loss history, the customer's current ability to pay its obligation to the Company, and the condition of the general economy and the industry as a whole. The Company writes off accounts receivable when they become uncollectible, and payments subsequently received on such receivables are credited to the bad debts expenses.
Inventory valuation
Inventories of raw materials and packaging material are valued at the lower of cost and replacement cost. Inventories of work in progress and finished goods are valued at the lower of cost and net realizable value. Cost is determined by the first-in, first-out method.
Research and development
Research and development expenses are charged to operations in the year they are incurred. Acquired in-process research and development having no alternative future use is written off at the time of acquisition. The cost of intangibles that are purchased from others for a particular research and development project that have no alternative future use are written off at the time of acquisition.
Depreciation and amortization
Property, plant and equipment and intangible assets with a finite life are reported at cost, less accumulated depreciation and are depreciated or amortized over their estimated useful lives according to the straight-line method at the following annual rates:
| Buildings | 4 to 10% | |
| Furniture and equipment | 10 to 20% | |
| Computer equipment | 20 to 50% | |
| Automotive equipment | 20 to 25% | |
| Leasehold and building improvements | 10 to 20% | |
| Trademarks, trademark licenses and manufacturing rights | 4 to 15% |
Depreciation or amortization commences when an asset is substantially completed and becomes available for productive commercial use.
Goodwill and intangible assets with indefinite life are no longer amortized since October 1, 2001.
Management evaluates the value of the unamortized portion of property, plant and equipment, goodwill and intangible assets annually. Should there be a permanent impairment in value, a write-down will be recognized for the current year to reflect the assets at fair value. To date, the Company has not recognized any permanent impairment in value except for an amount of $83,000 of goodwill for the year ended September 30, 2004.
Deferred debt issue expenses are amortized on a straight-line basis over the terms of the debts, until 2008.
Income taxes
Income taxes are calculated based on the liability method. Under this method, deferred income tax assets and liabilities are recognized as estimated taxes for recovery or settlement arising from the recovery or settlement of assets and liabilities recorded at their financial statement carrying amounts. Deferred income tax assets and liabilities are measured based on enacted tax rates and laws at the date of the financial statements for the years in which the temporary differences are expected to reverse. Adjustments to the deferred income tax asset and liability balances are recognized in net income as they occur.
56 U.S. GAAP
Stock-based compensation
Under the provision of SFAS No. 123,"Accounting for Stock Compensation", companies can either measure the compensation cost of equity instruments issued under employee compensation plans using a fair value-based method or can continue to recognize compensation cost using the intrinsic value method under the provisions of APB No. 25,"Accounting for Stock Issued to Employees". However, if the provisions of APB No. 25 are applied, pro-forma disclosure of net income and income per share must be presented in the financial statements as if the fair value method had been applied.
For all periods presented, the Company recognized compensation costs under the provisions of APB No. 25, and the Company has provided the expanded disclosure required by SFAS No. 123. The Company has elected to continue to measure compensation costs related to awards of stock options using the intrinsic value based method of accounting. No stock-based employee compensation cost is reflected in net income.
The following table illustrates the effect on net income and income per share if the Company had applied the fair value recognition provisions of SFAS No. 123 to stock-based compensation.
| | 2004 | 2003 | 2002 | ||||
|---|---|---|---|---|---|---|---|
| | $ | $ | $ | ||||
| Net income as reported | 48,728 | 19,925 | 21,188 | ||||
| Total stock-based compensation expenses determined under fair value based method | 4,286 | 3,369 | 2,489 | ||||
| Pro-forma net income | 44,442 | 16,556 | 18,699 | ||||
| Basic income per share | |||||||
| As reported | 1.08 | 0.44 | 0.51 | ||||
| Pro-forma | 0.98 | 0.37 | 0.45 | ||||
Diluted income per share | |||||||
| As reported | 0.98 | 0.44 | 0.50 | ||||
| Pro-forma | 0.90 | 0.36 | 0.44 | ||||
Foreign currency translation
The current rate method of translation of foreign currencies is followed for subsidiaries, or joint ventures considered financially and operationally self-sustaining. Therefore, all gains and losses arising from the translation of the financial statements of subsidiaries or joint ventures are deferred in a cumulative foreign currency translation adjustments account reported as a component of accumulated other comprehensive income in shareholders' equity.
For the operations in Canada and the United States of America, monetary assets and liabilities in currency other than U.S. dollars are translated into U.S. dollars, the functional currency of the Company, at the exchange rates in effect at the balance sheet date whereas other assets and liabilities are translated at exchange rates in effect at transaction dates. Revenue and operating expenses in foreign currency are translated at the average rates in effect during the year, except for depreciation and amortization, translated at historical rates. Gains and losses are included in net income for the year.
Income per share
Basic income per share is calculated using the weighted average number of common shares outstanding during the year. The treasury stock method is to be used for determining the dilution effect of options. The dilutive effect of convertible subordinated notes, balance of purchase price payable in shares and convertible preferred shares is determined using the "if-converted" method.
U.S. GAAP 57
4. ACQUISITIONS
a) Business acquisitions
September 30, 2002
On November 7, 2001, the Company acquired all the outstanding shares of Laboratoire Entéris S.A.S., a company specializing in the distribution of gastrointestinal products in France. The acquisition cost, including transaction expenses, amounting to $23,000,840, was paid in cash.
On April 17, 2002, the Company acquired all the outstanding shares of Laboratoires du Lactéol du Docteur Boucard S.A. and certain related assets. This company is specialized in the manufacturing and distribution of gastrointestinal products in France. The acquisition cost, including transaction expenses, amounting to $13,137,613, was paid with the issuance of 365,532 common shares of the Company and $8,378,728 in cash. The price of the common shares issued was determined on the basis of a twenty-day trading average closing price.
These two acquisitions allowed the Company to establish operations in France for the development of markets in all of Western Europe and added two products to the Company's product line.
The following table shows the breakdown of these acquisitions:
| | $ | ||
|---|---|---|---|
| Net assets acquired at the attributed values | |||
| Assets | |||
| Cash and cash equivalents | 77 | ||
| Other working capital items | 7,323 | ||
| Property, plant and equipment | 9,433 | ||
| Intangible assets with indefinite life | 29,175 | ||
| Goodwill | 9,632 | ||
| Deferred income taxes | 656 | ||
| Other assets | 1,363 | ||
| 57,659 | |||
| Liabilities | |||
| Accounts payable | 8,215 | ||
| Long-term debt | 6,922 | ||
| Deferred income taxes | 6,384 | ||
| 21,521 | |||
| 36,138 | |||
| Consideration | |||
| Cash | 31,379 | ||
| Common shares issued | 4,759 | ||
| 36,138 | |||
| Net cash used for the acquisitions | 31,302 | ||
The acquisition cost has been allocated to the assets and liabilities according to their estimated fair value at the acquisition dates. The operating results relating to these acquisitions have been included in the consolidated financial statements from the acquisition dates.
Using the assumption that the effective date of the business acquisitions is October 1, 2001, the consolidated pro-forma results of operations of the Company would have been as follows for the year ended September 30, 2002:
| | (unaudited) | |
|---|---|---|
| | $ | |
| Revenue | 140,983 | |
| Net earnings | 20,802 | |
| Net earnings per share | 0.50 | |
58 U.S. GAAP
b) Products acquisitions
On November 18, 2003, the Company acquired the rights to a group of products from Aventis Pharma S.A. ("Aventis") for a cash purchase price of $145,000,000. The acquired products are CARAFATE and BENTYL for the U.S. market and SULCRATE, BENTYLOL and PROCTOSEDYL for the Canadian market.
On August 29, 2003, the Company acquired an exclusive license for North America, the European Union and Latin America, from Abbott Laboratories ("Abbott") to develop, manufacture and market ITAX, a patented gastroprokinitic drug. Under the terms of this license agreement, the Company paid $10,000,000 and assumed $2,000,000 in research contract liability. This product in development had not reached technological feasibility and had no known alternative uses, it was therefore considered to be acquired in-process research and was expensed in the period of acquisition. The agreement also provides for milestone payments upon certain events.
On December 10, 2002, the Company acquired the rights to the Ursodiol 250mg tablets DELURSAN for the French market, for a cash purchase price of 22,300,000 Euros ($22,800,000) from Aventis. On December 3, 2002, the Company acquired the worldwide rights to the PANZYTRAT enzyme product line from Abbott for a cash purchase price of $45,000,000.
During a transition period, the sellers may act as Axcan's agents for the management of sales of some of these products. For the year ended September 30, 2004, a portion of the sales of these products is still managed by the sellers. Axcan includes in its revenue the net sales from such products less corresponding cost of goods sold and other seller related expenses. Consequently, although net sales of such products of the year ended September 30, 2004 were $7,667,940 ($14,255,979 in 2003), the Company only included in its revenue an amount of $4,685,673 ($9,463,645 in 2003) representing the net sales less cost of goods sold and other seller related expenses.
5. SHORT-TERM INVESTMENTS
As at September 30, 2004, short-term investments include short-term notes, mutual funds and debt securities. One mutual fund represent approximately 64% (four short-term notes for 60% in 2003) of the Company's total short-term investments. Interest rates on most of the short-term investments vary from 0.975% to 3.315% (0.81% to 1.08% in 2003).
6. ACCOUNTS RECEIVABLE
| | 2004 | 2003 | ||
|---|---|---|---|---|
| | $ | $ | ||
| Trade accounts, net of allowance for doubtful accounts of $876,000 ($613,000 in 2003)(a) | 44,320 | 16,696 | ||
| Investments receivable within one year | — | 1,102 | ||
| Taxes receivable | 1,978 | 1,479 | ||
| Other | 287 | 408 | ||
| 46,585 | 19,685 | |||
The Company believes that there is no unusual exposure associated with the collection of these accounts receivable.
- (a)
- As at September 30, 2004, the accounts receivable include amounts receivable from three customers which represent approximately 51% (two customers and one agent for 44% in 2003) of the Company's total accounts receivable.
U.S. GAAP 59
7. INVENTORIES
| | 2004 | 2003 | ||
|---|---|---|---|---|
| | $ | $ | ||
| Raw materials and packaging material | 10,311 | 8,441 | ||
| Work in progress | 1,781 | 1,466 | ||
| Finished goods | 25,178 | 10,256 | ||
| 37,270 | 20,163 | |||
8. INCOME TAXES
The deferred income tax assets and liabilities result from differences between the tax value and book value of the following items:
| | 2004 | 2003 | |||
|---|---|---|---|---|---|
| | $ | $ | |||
| Short-term deferred income tax assets | |||||
| Inventories | 376 | 2,554 | |||
| Prepaid expenses and deposits | 167 | — | |||
| Accounts payable and accrued liabilities | 2,941 | 2,558 | |||
| Pending legal settlements | 1,102 | 1,102 | |||
| 4,586 | 6,214 | ||||
| Long-term deferred income tax assets | |||||
| Investments | — | 16 | |||
| Share issue expenses | 930 | 1,746 | |||
| Unused operating losses | — | 13 | |||
| 930 | 1,775 | ||||
| Short-term deferred income tax liabilities | |||||
| Accounts receivable | 379 | 318 | |||
| Inventories | 109 | — | |||
| Prepaid expenses and deposits | 434 | 163 | |||
| Investments | 14 | 13 | |||
| 936 | 494 | ||||
| Long-term deferred income tax liabilities | |||||
| Property, plant and equipment | 2,484 | 1,993 | |||
| Intangible assets | 34,619 | 31,801 | |||
| Goodwill | 682 | 682 | |||
| Research and development expenses | 505 | 127 | |||
| 38,290 | 34,603 | ||||
60 U.S. GAAP
Income taxes included in the statement of operations are as follows:
| | 2004 | 2003 | 2002 | ||||
|---|---|---|---|---|---|---|---|
| | $ | $ | $ | ||||
| Current | 15,628 | 11,144 | 8,754 | ||||
| Deferred | |||||||
| Creation and reversal of temporary differences | 6,625 | 2,678 | 2,234 | ||||
| Change in promulgated rates | — | (830 | ) | 144 | |||
| 6,625 | 1,848 | 2,378 | |||||
| 22,253 | 12,992 | 11,132 | |||||
| Domestic | |||||||
| Current | (338 | ) | (1,763 | ) | 2,152 | ||
| Deferred | 2,756 | 574 | 1,704 | ||||
| 2,418 | (1,189 | ) | 3,856 | ||||
| Foreign | |||||||
| Current | 15,966 | 12,907 | 6,602 | ||||
| Deferred | 3,869 | 1,274 | 674 | ||||
| 19,835 | 14,181 | 7,276 | |||||
| 22,253 | 12,992 | 11,132 | |||||
The Company's effective income tax rate differs from the combined statutory federal and provincial income tax rate in Canada (31.52% for 2004, 33.59% for 2003 and 35.66% for 2002). This difference arises from the following:
| | 2004 | 2003 | 2002 | |||||||||||
|---|---|---|---|---|---|---|---|---|---|---|---|---|---|---|
| | % | $ | % | $ | % | $ | ||||||||
| Combined basic rate applied to pre-tax income | 31.52 | 22,373 | 33.59 | 11,057 | 35.66 | 11,525 | ||||||||
| Increase (decrease) in taxes resulting from: | 0.04 | 29 | — | — | — | — | ||||||||
| Large corporations tax | — | — | (2.52 | ) | (830 | ) | 0.44 | 144 | ||||||
| Change in promulgated rates | (2.47 | ) | (1,752 | ) | 4.54 | 1,495 | 3.68 | 1,189 | ||||||
| Difference with foreign tax rates | 1.79 | 1,268 | 2.90 | 953 | 0.79 | 257 | ||||||||
| Non-deductible items | — | — | — | — | (0.71 | ) | (231 | ) | ||||||
| Use of unrecorded prior years' losses | (0.65 | ) | (460 | ) | (1.35 | ) | (445 | ) | (5.30 | ) | (1,713 | ) | ||
| Non-taxable items and other | 2.76 | 1,958 | 3.80 | 1,250 | 2.45 | 791 | ||||||||
| Foreign withholding taxes | (1.64 | ) | (1,163 | ) | (1.49 | ) | (488 | ) | (2.57 | ) | (830 | ) | ||
| Investment tax credits | 31.35 | 22,253 | 39.47 | 12,992 | 34.44 | 11,132 | ||||||||
No provision has been made for income taxes on the undistributed earnings of the Company's foreign subsidiaries as at September 30, 2004 that the Company intends to indefinitely reinvest.
U.S. GAAP 61
9. INVESTMENTS
| | 2004 | 2003 | ||
|---|---|---|---|---|
| | $ | $ | ||
| Investments in preferred shares of a private company, at estimated net realizable value | — | 578 | ||
| Note receivable, 8.5% beginning on January 1, 2002, maturing on January 1, 2004 | — | 936 | ||
| Investments in joint ventures accounted for using equity method | — | 227 | ||
| Other | — | 363 | ||
| — | 2,104 | |||
| Investments receivable within one year | — | 1,102 | ||
| — | 1,002 | |||
10. PROPERTY, PLANT AND EQUIPMENT
| | 2004 | |||||
|---|---|---|---|---|---|---|
| | Cost | Accumulated depreciation | Net | |||
| | $ | $ | $ | |||
| Land | 1,581 | — | 1,581 | |||
| Buildings | 20,311 | 3,413 | 16,898 | |||
| Furniture and equipment | 15,751 | 7,975 | 7,776 | |||
| Automotive equipment | 65 | 14 | 51 | |||
| Computer equipment | 7,542 | 3,126 | 4,416 | |||
| Leasehold and building improvements | 810 | 280 | 530 | |||
| 46,060 | 14,808 | 31,252 | ||||
| | 2003 | |||||
|---|---|---|---|---|---|---|
| | Cost | Accumulated depreciation | Net | |||
| | $ | $ | $ | |||
| Land | 940 | — | 940 | |||
| Buildings | 12,431 | 2,484 | 9,947 | |||
| Furniture and equipment | 13,761 | 6,417 | 7,344 | |||
| Automotive equipment | 54 | 1 | 53 | |||
| Computer equipment | 3,822 | 2,085 | 1,737 | |||
| Leasehold and building improvements | 522 | 212 | 310 | |||
| 31,530 | 11,199 | 20,331 | ||||
Acquisitions of property, plant and equipment amount to $14,288,431 ($4,291,768 in 2003 and $14,071,633 in 2002).
The cost and accumulated depreciation of equipment under capital leases amount to $5,351,295 and $1,659,955 ($5,019,440 and $891,445 in 2003).
62 U.S. GAAP
11. INTANGIBLE ASSETS
| | 2004 | ||||||
|---|---|---|---|---|---|---|---|
| | Cost | Accumulated depreciation | Net | ||||
| | $ | $ | $ | ||||
| Trademarks, trademark licenses and manufacturing rights with a: | |||||||
| Finite life | 280,034 | 29,869 | 250,165 | ||||
| Indefinite life | 170,127 | 12,417 | 157,710 | ||||
| 450,161 | 42,286 | 407,875 | |||||
| | 2003 | ||||||
|---|---|---|---|---|---|---|---|
| | Cost | Accumulated depreciation | Net | ||||
| | $ | $ | $ | ||||
| Trademarks, trademark licenses and manufacturing rights with a: | |||||||
| Finite life | 111,327 | 19,998 | 91,329 | ||||
| Indefinite life | 186,512 | 12,418 | 174,094 | ||||
| 297,839 | 32,416 | 265,423 | |||||
The cost of the product TAGAMET has been transferred from intangible assets with an indefinite life to intangible assets with a finite life following changes in the regulatory rules applicable to this product and resulting in the modification of its useful life. The net cost of this product as of October 1, 2003, which amounted to $21,852,859, is therefore amortized over a 15-year period.
Acquisitions of intangible assets amount to $149,627,653 ($76,092,927 in 2003 and $30,036,118 in 2002). The current intangible assets with a finite life have a weighted-average remaining amortization period of approximately 18 years.
The annual amortization expenses without taking into account any future acquisitions expected for the years 2005 through 2009 are as follows:
| | $ | |
|---|---|---|
| 2005 | 13,744 | |
| 2006 | 13,744 | |
| 2007 | 13,744 | |
| 2008 | 13,744 | |
| 2009 | 13,744 |
12. GOODWILL
| | 2004 | 2003 | ||
|---|---|---|---|---|
| | $ | $ | ||
| Cost | 31,073 | 31,161 | ||
| Accumulated amortization | 3,606 | 3,611 | ||
| Net | 27,467 | 27,550 | ||
U.S. GAAP 63
The Company has a credit agreement relative to a $125,000,000 ($55,000,000 in 2003) financing. The credit agreement consists of a 364-day extendible revolving facility with a two-year (three-year in 2003) term-out option maturing on September 22, 2007 (October 12, 2007 in 2003). The term-out option provides for quarterly instalments equal to 8.57% (6.81% in 2003) of the amount then outstanding on the facility with a final instalment of 40% (25% in 2003).
The Company's credit facility is secured by a first security interest on all present and future acquired assets of the Company and its material subsidiaries, and provides for the maintenance of certain financial ratios. Cash dividends, repurchase of shares (other than redeemable shares issued in connection with a permitted acquisition) and similar distributions to shareholders are limited to 10% of the Company's net income for the preceding fiscal year.
The interest rate varies depending on the Company's leverage between 25 basis points and 100 (25 and 125 in 2003) basis points over prime rate and between 125 basis points and 200 (125 and 225 in 2003) basis points over the LIBOR rate or bankers acceptances. The line of credit also provides for a stand-by fee of between 25 and 37.5 basis points. The credit facility may be drawn in U.S. dollars or in Canadian dollars equivalent. As at September 30, 2004 and 2003 there was no amount outstanding under the line of credit.
14. ACCOUNTS PAYABLE AND ACCRUED LIABILITIES
| | 2004 | 2003 | ||
|---|---|---|---|---|
| | $ | $ | ||
| Accounts payable | 13,259 | 9,232 | ||
| Contract rebates, product returns and accrued chargebacks | 8,853 | 7,248 | ||
| Accrued interest on subordinated notes | 2,530 | 3,038 | ||
| Accrued royalty fees | 5,340 | 4,820 | ||
| Accrued salaries | 3,228 | 3,084 | ||
| Accrued bonuses | 2,804 | 2,883 | ||
| Accrued research and development expenses | 3,447 | 1,995 | ||
| Acquired in-process research payable | — | 7,000 | ||
| Other accrued liabilities | 5,556 | 1,218 | ||
| Pending legal settlements | 2,900 | 2,900 | ||
| 47,917 | 43,418 | |||
15. LONG-TERM DEBT
| | 2004 | 2003 | ||
|---|---|---|---|---|
| | $ | $ | ||
| Convertible subordinated notes, 4.25%, interest payable semi-annually starting October 15, 2003, convertible into 8,924,113 common shares, maturing April 15, 2008.(a) | 125,000 | 125,000 | ||
| Bank loans, 3.80% (interest rates varying between 4.84% and 7.15% as at September 30, 2003), secured by immovable hypothecs on land and buildings having a net book value of $6,826,494 in 2004, payable in quarterly instalments of $200,000, principal and interest, maturing in 2007. | 2,174 | 2,576 | ||
| Obligations under capital leases, interest rates varying between 3.81% and 6.2% payable in monthly instalments, principal and interest, maturing on different dates until 2009. | 2,520 | 3,426 | ||
| 129,694 | 131,002 | |||
| Instalments due within one year | 1,778 | 1,528 | ||
| 127,916 | 129,474 | |||
64 U.S. GAAP
- (a)
- The $125,000,000 subordinated notes are convertible into 8,924,113 common shares. The noteholders may convert their notes during any quarterly conversion period if the closing price per share for at least 20 consecutive trading days during the 30 consecutive trading-day period ending on the first day of the conversion period exceeds 110% of the conversion price in effect on that thirtieth trading day. The note-holders may also convert their notes during the five business-day period following any 10 consecutive trading-day period in which the daily average of the trading prices for the notes was less than 95% of the average conversion value for the notes during that period. Finally, the noteholders may also convert their notes upon the occurrence of specified corporate transactions or, if the company has called the notes for redemption. On or after April 20, 2006, the Company may at its option, redeem the notes, in whole or in part at redemption prices varying from 101.70% to 100.85% of the principal amount plus any accrued and unpaid interest to the redemption date. The notes also include provisions for the redemption of all the notes for cash at the option of the Company following some changes in tax treatment.
As at September 30, 2004, minimum instalments on long-term debt for the next years are as follows:
| | Obligations under capital leases | Other long term loans | ||
|---|---|---|---|---|
| | $ | $ | ||
| 2005 | 1,089 | 792 | ||
| 2006 | 838 | 760 | ||
| 2007 | 483 | 622 | ||
| 2008 | 264 | 125,000 | ||
| 2009 | 92 | — | ||
| 2,766 | ||||
| Interest included in the minimum lease payments | 246 | |||
| 2,520 | ||||
16. CAPITAL STOCK
Preferred shares
The Company has an unlimited number of authorized preferred shares without par value, issuable in series, rights, privileges and restrictions determined at the creation date.
During the year 2000, the Company created two series of preferred shares as follows:
| 14,175,000 | Series A, non-voting, annual preferential cumulative dividend of 5%, redeemable on or prior to June 8, 2001 at CDN$1.00 per share payable at the option of the Company in cash or by the issuance of common shares or in any combination of cash and common shares. | |
12,000,000 | Series B, non-voting, redeemable on the fifth anniversary of their issuance at CDN$1.00 per share payable in cash or by the issuance of common shares at the option of the Company, convertible into common shares at the holder's option on the basis of one common share for each 15 Series B preferred shares. |
Common stock option plan
The common stock option plan is intended for eligible directors, principal senior executives and employees. The number of stock options that can be granted under this plan cannot exceed 4,500,000 as at September 30, 2004, 2003 and 2002. Options are granted at the fair market value of the common stock on the last trading day prior to the granting date. Options may be exercised at a rate of 20% per year and expire ten years after the granting date except for the annual options granted to outside directors which may be exercised one year after the granting date.
U.S. GAAP 65
The changes to the number of stock options outstanding are as follows:
| | 2004 | 2003 | 2002 | |||||||||
|---|---|---|---|---|---|---|---|---|---|---|---|---|
| | Number of options | Weighted average exercise price | Number of options | Weighted average exercise price | Number of options | Weighted average exercise price | ||||||
| | | $ | | $ | | $ | ||||||
| Balance, beginning of year | 2,681,840 | 10.12 | 2,429,078 | 9.67 | 1,956,441 | 7.75 | ||||||
| Granted | 738,350 | 15.44 | 531,850 | 11.36 | 684,050 | 13.38 | ||||||
| Exercised | (558,016 | ) | 8.78 | (141,122 | ) | 7.82 | (127,489 | ) | 5.89 | |||
| Cancelled | (261,618 | ) | 11.23 | (137,966 | ) | 10.73 | (83,924 | ) | 9.58 | |||
| Balance, end of year | 2,600,556 | 11.86 | 2,681,840 | 10.12 | 2,429,078 | 9.67 | ||||||
| Options exercisable at end of year | 954,459 | 9.93 | 965,909 | 9.00 | 614,716 | 7.79 | ||||||
Stock options outstanding at September 30, 2004 are as follows:
| | Options outstanding | | | |||||||
|---|---|---|---|---|---|---|---|---|---|---|
| | Options exercisable | |||||||||
| | | Weighted average remaining contractual life | | |||||||
| Exercise price | Number | Weighted average exercise price | Number | Weighted average exercise price | ||||||
| | | | $ | | $ | |||||
| $4.06 — $5.00 | 17,000 | 5.23 | 4.06 | 11,000 | 4.06 | |||||
| $5.01 — $7.00 | 23,100 | 4.87 | 6.12 | 20,500 | 6.03 | |||||
| $7.01 — $10.00 | 809,586 | 5.84 | 8.42 | 527,549 | 8.30 | |||||
| $10.01 — $13.00 | 760,510 | 7.62 | 11.70 | 287,970 | 11.89 | |||||
| $13.01 — $16.00 | 707,360 | 8.40 | 13.56 | 107,440 | 14.00 | |||||
| $16.01 — $19.00 | 195,500 | 9.53 | 18.30 | — | — | |||||
| $19.01 — $19.99 | 87,500 | 9.39 | 19.99 | — | — | |||||
| 2,600,556 | 7.40 | 11.86 | 954,459 | 9.93 | ||||||
The average weighted fair value of granted stock options was $6.80, $5.41 and $6.96 for the years ended September 30, 2004, 2003 and 2002.
The fair values of all stock options granted during 2004, 2003 and 2002 were estimated as of the date of grant using the Black-Scholes option pricing model with the following weighted average assumptions:
| | 2004 | 2003 | 2002 | |||
|---|---|---|---|---|---|---|
| Expected option life (years) | 6 | 6 | 6 | |||
| Volatility | 44% | 46% | 47% | |||
| Risk-free interest rate | 4.17% | 4.43% | 4.93% | |||
| Expected dividend | — | — | — |
The Black-Scholes model, used by the Company to calculate option values, as well as other currently accepted option valuation models, were developed to estimate the fair value of freely tradable, fully transferable options without vesting restrictions, which significantly differ from the Company's stock option awards. These models also require highly subjective assumptions, including future stock price volatility and expected time until exercise, which greatly affect the calculated values. Accordingly, management believes that these models do not necessarily provide a reliable single measure of the fair value of the Company's stock option awards.
66 U.S. GAAP
17. FINANCIAL INFORMATION INCLUDED IN THE CONSOLIDATED STATEMENT OF OPERATIONS
a) Financial expenses
| | 2004 | 2003 | 2002 | |||
|---|---|---|---|---|---|---|
| | $ | $ | $ | |||
| Interest on long-term debt | 5,614 | 3,340 | 159 | |||
| Bank charges | 127 | 297 | 210 | |||
| Financing fees | — | — | 282 | |||
| Amortization of deferred debt issue expenses | 1,144 | 646 | 247 | |||
| 6,885 | 4,283 | 898 | ||||
b) Selling and administrative expenses
Selling and administrative expenses include the following:
| | 2004 | 2003 | 2002 | |||
|---|---|---|---|---|---|---|
| | $ | $ | $ | |||
| Shipping and handling expenses | 4,349 | 3,477 | 2,763 | |||
| Advertising expenses | 15,155 | 10,524 | 10,501 |
c) Other information
| | 2004 | 2003 | 2002 | ||||
|---|---|---|---|---|---|---|---|
| | $ | $ | $ | ||||
| Non-controlling interest | — | (103 | ) | (363 | ) | ||
| Rental expenses | 1,216 | 1,228 | 1,148 | ||||
| Depreciation of property, plant and equipment | 3,720 | 3,467 | 2,486 | ||||
| Amortization of intangible assets | 12,639 | 4,596 | 5,060 | ||||
| Share in net loss of joint ventures | (455 | ) | (106 | ) | (46 | ) |
The Company incurred professional fees with a law firm, in which a Company's director is a partner, totalling $556,724 for the year ended September 30, 2004 ($385,862 in 2003 and $466,056 in 2002). These transactions were concluded in the normal course of operations, at the exchange amount.
d) Income per common share
The following table reconciles the numerators and denominators of the basic and diluted income per share computations.
| | 2004 | 2003 | 2002 | ||||
|---|---|---|---|---|---|---|---|
| | $ | $ | $ | ||||
| Net income available to common shareholders | |||||||
| Basic | 48,728 | 19,925 | 21,188 | ||||
| Financial expenses relating to the convertible subordinated notes | 3,169 | — | — | ||||
| Net income available to common shareholders on a diluted basis | 51,897 | 19,925 | 21,188 | ||||
2004 | 2003 | 2002 | |||||
| Weighted average number of common shares | |||||||
| Weighted average number of common shares outstanding | 45,286,199 | 44,914,944 | 41,664,510 | ||||
| Effect of dilutive stock options | 820,872 | 472,599 | 660,970 | ||||
| Effect of dilutive purchase price | — | 220,449 | 202,020 | ||||
| Effect of dilutive convertible subordinated notes | 6,680,893 | — | — | ||||
| Adjusted weighted average number of common shares outstanding | 52,787,964 | 45,607,992 | 42,527,500 | ||||
Number of common shares outstanding as at November 9, 2004 | 45,562,336 | ||||||
U.S. GAAP 67
Options to purchase 283,000 common shares (754,100 for 2003 and 553,350 for 2002) were outstanding but were not included in the computation of diluted income per share as the exercise price of the options was greater than the average market price of the common shares. As of September 30, 2003, the subordinated notes convertible into 8,924,113 common shares had no effect on the diluted income per share. Since the trigger event occurred during the second, third and fourth quarters of the year ended September 30, 2004, the 8,924,113 common shares are included in the weighted average number of common shares outstanding for those periods.
18. FINANCIAL INFORMATION INCLUDED IN THE CONSOLIDATED STATEMENT OF CASH FLOWS
a) Changes in working capital items
| | 2004 | 2003 | 2002 | ||||
|---|---|---|---|---|---|---|---|
| | $ | $ | $ | ||||
| Accounts receivable | (27,795 | ) | 5,569 | 2,155 | |||
| Income taxes receivable | (3,773 | ) | (4,438 | ) | (406 | ) | |
| Inventories | (17,157 | ) | (417 | ) | (2,546 | ) | |
| Prepaid expenses and deposits | (703 | ) | (892 | ) | (58 | ) | |
| Accounts payable and accrued liabilities | 3,191 | 16,547 | 3,814 | ||||
| Income taxes payable | (4,051 | ) | 3,207 | 823 | |||
| (50,288 | ) | 19,576 | 3,782 | ||||
b) Cash flows relating to interest and income taxes of operating activities are as follows:
| | 2004 | 2003 | 2002 | |||
|---|---|---|---|---|---|---|
| | $ | $ | $ | |||
| Interest received | 1,035 | 1,427 | 787 | |||
| Interest paid | 6,122 | 342 | 242 | |||
| Income taxes paid | 23,620 | 12,417 | 7,672 |
19. JOINT VENTURES
The Company's interest in the joint ventures is accounted for by the equity method. During fiscal 2004, the Company wrote off its investment in these joint ventures.
The following accounts represent the share of the Company in the joint ventures:
| | 2004 | 2003 | 2002 | |||||
|---|---|---|---|---|---|---|---|---|
| | $ | $ | $ | |||||
| Current assets | 122 | 217 | 190 | |||||
| Total assets | 168 | 649 | 606 | |||||
| Current liabilities | 312 | 393 | 248 | |||||
| Total liabilities | 343 | 422 | 273 | |||||
| Revenue | 906 | 659 | 725 | |||||
| Expenses | 1,361 | 765 | 771 | |||||
| Net loss | (455 | ) | (106 | ) | (46 | ) | ||
| Cash flows from: | ||||||||
| Operations | (31 | ) | 92 | (8 | ) | |||
| Financing | 2 | 4 | — | |||||
| Investment | — | (11 | ) | 10 | ||||
68 U.S. GAAP
20. SEGMENTED INFORMATION
The Company considers that it operates in a single field of activity, the pharmaceutical industry, since its other activities do not account for a significant portion of segment assets.
| | 2004 | 2003 | 2002 | |||
|---|---|---|---|---|---|---|
| | % | % | % | |||
| Customer A | 24.3 | 15.6 | 20.2 | |||
| Customer B | 18.4 | 18.6 | 18.8 | |||
| Customer C | 13.1 | 15.4 | 13.3 | |||
| 55.8 | 49.6 | 52.3 | ||||
Purchases from one supplier represent approximately 15% of the cost of goods sold for the year ended September 30, 2004 (26% in 2003 and 30% in 2002).
The Company purchases its inventory from third party manufacturers, many of whom are the sole source of products for the Company. The failure of such manufacturers to provide an uninterrupted supply of products could adversely impact the Company's ability to sell such products.
The Company operates in the following geographic segments:
| | 2004 | 2003 | 2002 | |||||
|---|---|---|---|---|---|---|---|---|
| | $ | $ | $ | |||||
| Revenue | ||||||||
| Canada | ||||||||
| Domestic sales | 28,002 | 20,555 | 17,413 | |||||
| Foreign sales | — | — | — | |||||
| United States | ||||||||
| Domestic sales | 162,810 | 113,875 | 100,088 | |||||
| Foreign sales | 3,921 | — | — | |||||
| Europe | ||||||||
| Domestic sales | 43,830 | 39,971 | 13,099 | |||||
| Foreign sales | 4,846 | 4,531 | 1,696 | |||||
| Other | 225 | 152 | 108 | |||||
| 243,634 | 179,084 | 132,404 | ||||||
| Property, plant, equipment, intangible assets and goodwill | ||||||||
| Canada | 40,401 | 14,622 | 13,782 | |||||
| United States | 131,242 | 133,695 | 135,839 | |||||
| Europe | 265,417 | 138,113 | 54,677 | |||||
| Other | 29,534 | 26,874 | 23,423 | |||||
| 466,594 | 313,304 | 227,721 | ||||||
Revenue is attributed to geographic segments based on the sales country of origin.
U.S. GAAP 69
21. FINANCIAL INSTRUMENTS
Currency risk
The Company is exposed to financial risk arising from fluctuations in foreign exchange rates and the degree of volatility of the rates. The Company does not use derivative instruments to reduce its exposure to foreign currency risk.
Fair value of the financial instruments on the balance sheet
The estimated fair value of the financial instruments is as follows:
| | 2004 | 2003 | |||||||
|---|---|---|---|---|---|---|---|---|---|
| | Fair value | Carrying amount | Fair value | Carrying amount | |||||
| | $ | $ | $ | $ | |||||
| Assets | |||||||||
| Cash and cash equivalents | 21,979 | 21,979 | 37,773 | 37,773 | |||||
| Short-term investments | 15,922 | 15,922 | 133,112 | 133,112 | |||||
| Accounts receivable | 44,607 | 44,607 | 17,104 | 17,104 | |||||
| Investments in a private company | — | — | b | ) | 578 | ||||
| Note receivable | — | — | b | ) | 936 | ||||
| Other investments | — | — | 363 | 363 | |||||
| Liabilities | |||||||||
| Accounts payable and accrued liabilities | 47,917 | 47,917 | 43,418 | 43,418 | |||||
| Long-term debt | 162,674 | 129,694 | 154,283 | 131,002 | |||||
The following methods and assumptions were used to calculate the estimated fair value of the financial instruments on the balance sheet.
a) Financial instruments valued at carrying amount
The estimated fair value of certain financial instruments shown on the balance sheet is equivalent to their carrying amount because they are realizable in the short-term or because their carrying amount approximates the fair value. These financial instruments include cash and cash equivalents, short-term investments, accounts receivable, other investments and accounts payable and accrued liabilities.
b) Investments in a private company and note receivable
The fair value of investments in a private company and note receivable was not readily determinable.
c) Long-term debt
The fair value of long-term debt has been established by discounting the future cash flows at interest rates corresponding to those the Company would have obtained at that date for loans with similar maturity dates and terms. The fair value of the convertible subordinated notes is equivalent to the trading price at the end of the year.
22. COMMITMENTS AND CONTINGENCIES
a) Commitments
The Company has entered into non-cancelable operating leases and service agreements expiring on different dates until September 30, 2009 for the rental of office space, automotive equipment and other equipment and for sales management services. One of the office space leases contains an escalation clause providing for payment of additional rent.
| | $ | |
|---|---|---|
| 2005 | 2,725 | |
| 2006 | 953 | |
| 2007 | 297 | |
| 2008 | 263 | |
| 2009 | 44 | |
| 4,282 | ||
70 U.S. GAAP
The Company entered into an agreement with Nordmark Arzneimittel GmbH & Co to create a joint venture to develop patent-protected novel enzyme preparations. Under the terms of this agreement, the Company agreed to contribute up to a cumulative amount of $1,500,000 to the joint venture. As at September 30, 2004, a total amount of $600,000 ($100,000 in 2003) has been contributed.
b) Contingencies
The subsidiary Axcan Scandipharm has been named as a defendant in several legal proceedings related to the products line it markets under the name ULTRASE. Of the 12 lawsuits to date, Axcan Scandipharm was dismissed from one, nonsuited in another and settled ten. These lawsuits were filed against Axcan Scandipharm and certain other named defendants, including the enzyme manufacturer, stemming from allegations that, among other things, Axcan Scandipharm's enzyme products caused colonic strictures. At this time, it is difficult to predict if there will be other claims or their number and because of the young age of the patients involved, Axcan Scandipharm's product liability exposure for this issue in the United States will remain for a number of years. Axcan Scandipharm's insurance carriers have defended the lawsuits to date and Axcan expects them to continue to defend Axcan Scandipharm (to the extent of its product liability insurance) should other lawsuits be filed in the future.
In addition, the enzyme manufacturer and certain other companies have claimed a right to recover amounts paid defending and settling these claims as well as a declaration that Axcan Scandipharm and another named defendant must provide indemnification against future claims. This lawsuit is based on contractual and indemnity issues and the parties have agreed to settle their dispute through binding arbitration. The arbitration has commenced and the plaintiffs allege that the amount at issue may be in excess of $10,000,000. Axcan Scandipharm denies that such reimbursement is owed and has also responded with counterclaims against the plaintiffs.
As at September 30, 2004 and 2003, the Company has accrued $2,900,000 to cover any future settlements in connection with the indemnification claim and the lawsuits discussed above that may not be covered by, or exceed, applicable insurance proceeds. While the Company believes that the insurance coverage and provisions taken to date are adequate, an adverse determination of present or future claims could exceed insurance coverage and amounts currently accrued.
c) Milestone payments
The agreements with QLT PhotoTherapeutics Inc. ("QLT") relating to the purchase of PHOTOFRIN provided for milestone payments to be made by Axcan to QLT that could reach a maximum of CDN$20,000,000 upon receipt of certain regulatory approvals for specific or additional indication for PHOTOFRIN or other conditions. Each milestone payment shall be made at the option of the Company either in cash or in Series B preferred shares or in a combination of cash and preferred shares provided that at least one-half of the milestone payable shall be paid in cash. During the years 2004, 2003 and 2000, CDN$5,000,000, CDN$5,000,000 and CDN$5,000,000 (US$3,919,417, US$3,646,973 and US$3,378,378) was paid by Axcan in cash upon receipt of regulatory approvals and was recorded in intangible assets.
The agreement to acquire the exclusive licence for North America, the European Union and Latin America to develop, manufacture and market ITAX provides for milestone payments for an amount of $20,000,000 upon regulatory submission and an amount of $45,000,000 upon regulatory approval. The Company will also pay royalties of 9% of net sales from the date of first commercial sale until the expiration of the patent and 6% for ten years then after.
d) Royalties
Net sales of certain products of the Company are subject to royalties payable to unrelated third parties.
In particular, the Company must pay a 6% royalty on net sales of ULTRASE and a 5% royalty on the net sales of ADEK's respectively covered under agreements for the exclusive rights to market these products.
Axcan has to pay 5% of worldwide sales of PHOTOFRIN with a maximum of $500,000 per year and a maximum total aggregate of $3,108,245 until December 2007. Until September 30, 2004, an amount of $1,420,419 has been accounted for ($1,032,777 in 2003 and $753,134 in 2002). Axcan also has to pay 5% of net sales of PHOTOFRIN for use in the therapeutic treatment of cancer and 2% of net sales for other uses until December 2009.
Royalties amounting to $3,760,945, $4,387,092 and $3,731,113 respectively for years ended September 30, 2004, 2003 and 2002 were charged to operations.
e) Licensing
During the year 2000, Axcan entered into a new licensing agreement to market a new generation of pancrelipase minitablets. As at September 30, 2004, the Company paid $3,500,000 in development fees, which is the total amount of development fees the Company agreed to pay. Axcan will pay royalties of 6% on the first $30,000,000 of annual sales and 5% on annual sales in excess of $30,000,000 subject to minimum royalty payments of $750,000, $1,000,000 and $1,500,000 in the first three years of the agreement, respectively. The product was launched in October 2003.
U.S. GAAP 71
Axcan also entered into a licensing agreement with the Children's Hospital Research Foundation for a serie of sulfated derivatives of ursodeoxycholigic acid compounds" ("SUDCA"). Axcan has, until September 30, 2004, paid $814,000 in cash. The Company will also pay milestones for a maximum amount of $200,000 when SUDCA will be validated and a bonus when certain conditions are met; finally, Axcan will pay royalties based on sales.
In May 2002, the Company signed a co-development and licensing agreement with NicOx S.A. ("NicOx") for NCX-1000, a nitric oxide-donating ursodiol derivative, for the treatment of chronic liver diseases including portal hypertension and Hepatitis "C". Under the terms of this agreement, the Company has obtained from NicOx an exclusive license to commercialize NCX-1000 in Canada and Poland as well as an option to acquire the same exclusive rights for the United States market. The Company and NicOx will share the cost of the future development of NCX-1000 jointly through the completion of Phase II clinical studies. The Company will thereafter conduct the required Phase III clinical studies and be responsible for regulatory filings in the exclusively licensed territories. The Company will pay NicOx options or milestone payments totalling up to $17,000,000 at various stages of development. An amount of $2,000,000 has been paid in 2003. The Company also agreed to pay royalties of up to 12% on net sales of the product.
On October 10, 2002, the Company acquired from Gentium S.p.A., an Italian company, exclusive rights to develop and market in North America, a patented 4 gram rectal gel formulation of mesalamine (5-ASA) for the treatment of active distal ulcerative colitis. In return the Company will make milestone payments totalling approximately $1,500,000, the majority of which will be paid upon approval in the United States. An amount of approximately $200,000 has been paid in 2003. The Company will also pay a royalty of 4% on net sales for a ten-year period from product's launch.
On July 22, 2003, the Company acquired from Merz Pharmaceutical GmbH ("Merz") an exclusive licence to use, develop and submit for approval of injectable and oral granule formulations containing L-ornithine and L-aspartate. In consideration of the rights and licenses granted by Merz under this agreement, the Company shall pay a royalty of 6% of net sales or 4% of net sales if the Company develops any patentable invention or improvement and Merz incorporates such invention or improvement into its products.
f) Employee benefit plan
A subsidiary of the Company has a defined contribution plan (the "Plan") for its U.S. employees. Participation is available to substantially all U.S. employees. Employees may contribute up to 15% of their gross pay and up to limits set by the U.S. Internal Revenue Service. During the year, the Board of Directors approved and the Company charged to operations a contribution to the Plan totalling $268,757 ($319,871 in 2003 and $224,275 in 2002).
23. SUMMARY OF DIFFERENCES BETWEEN GENERALLY ACCEPTED ACCOUNTING PRINCIPLES IN THE UNITED STATES AND IN CANADA
The consolidated financial statements have been prepared in accordance with U.S. GAAP which, in the case of the Company, conform in all material respects with Canadian GAAP, except as set forth below:
| | 2004 | 2003 | 2002 | |||||
|---|---|---|---|---|---|---|---|---|
| | $ | $ | $ | |||||
| Earnings adjustments | ||||||||
| Net income in accordance with U.S. GAAP | 48,728 | 19,925 | 21,188 | |||||
| Prepaid advertising costs(1) | — | — | (457 | ) | ||||
| Acquired in-process research(2) | — | 12,000 | — | |||||
| Amortization of new product acquisition costs(2) | (54 | ) | (54 | ) | (54 | ) | ||
| Implicit interest on convertible debt(4) | (4,234 | ) | (2,292 | ) | — | |||
| Income tax impact of the above adjustments | 20 | (962 | ) | 191 | ||||
| Net earnings in accordance with Canadian GAAP | 44,460 | 28,617 | 20,868 | |||||
| Income per share in accordance with Canadian GAAP | ||||||||
| Basic | 0.98 | 0.64 | 0.50 | |||||
| Diluted | 0.96 | 0.63 | 0.49 | |||||
72 U.S. GAAP
| | 2004 | 2003 | ||||||||
|---|---|---|---|---|---|---|---|---|---|---|
| | U.S. GAAP | Canadian GAAP | U.S. GAAP | Canadian GAAP | ||||||
| | $ | $ | $ | $ | ||||||
| Balance sheet adjustments | ||||||||||
| Current assets(6) | 139,032 | 139,054 | 225,035 | 225,203 | ||||||
| Investments(6) | — | — | 1,002 | 775 | ||||||
| Property, plant and equipment(6) | 31,252 | 31,265 | 20,331 | 20,351 | ||||||
| Intangible assets(2) | 407,875 | 420,235 | 265,423 | 277,837 | ||||||
| Goodwill(3)(6) | 27,467 | 28,862 | 27,550 | 29,342 | ||||||
| Deferred debt issue expenses | 3,088 | 3,088 | 4,233 | 4,233 | ||||||
| Deferred income tax asset | 930 | 930 | 1,775 | 1,775 | ||||||
| Current liabilities(6) | 51,362 | 51,430 | 50,261 | 50,634 | ||||||
| Long-term debt(4) | 127,916 | 110,203 | 129,474 | 107,527 | ||||||
| Deferred income tax liability(2)(3) | 38,290 | 39,376 | 34,603 | 35,742 | ||||||
| Shareholders' equity | ||||||||||
| Equity component of convertible debt(4) | — | 24,239 | — | 24,239 | ||||||
| Capital stock(5)(7) | 260,643 | 267,288 | 255,743 | 262,388 | ||||||
| Retained earnings(2)(3)(4)(5)(7) | 112,362 | 107,671 | 63,634 | 63,211 | ||||||
| Accumulated foreign currency translation adjustments(7) | 19,071 | 23,227 | 11,634 | 15,775 | ||||||
- (1)
- Under U.S. GAAP, scientific symposium costs are included in operations in the year when they are incurred. Under Canadian GAAP, these costs were deferred and amortized over a two-year period until September 30, 2002.
- (2)
- Under U.S. GAAP, acquired in-process research are included in operations as at the date of acquisition as no alternative future use is established. Under Canadian GAAP, the acquired in-process research is deferred and amortized from the date of commencement of commercial production.
- (3)
- Under U.S. GAAP, some financial expenses were recorded when the minority interest in Axcan Scandipharm was purchased. Under Canadian GAAP, these financial expenses were included in goodwill.
- (4)
- Under U.S. GAAP, the entire convertible subordinated notes are included in long-term debt. Under Canadian GAAP, the estimated value of the right of conversion is included in the shareholders' equity as equity component of convertible debt and implicite interest is charged to income each year and accounted for in the balance sheet as an accretion to the liability component.
- (5)
- Under U.S. GAAP, share issuance expenses are deducted from the consideration received. Under Canadian GAAP, these expenses are charged directly to retained earnings.
- (6)
- Under U.S. GAAP, the investments in joint ventures are accounted for by the equity method. Under Canadian GAAP, these investments are accounted for using the proportionate consolidation method. This difference does not impact operations or shareholders' equity.
- (7)
- Effective October 1, 1999, the Company changed its measurement and reporting currency from the Canadian dollar to the U.S. dollar. Under U.S. GAAP, comparative figures must be restated as if the change in measurement and reporting currency had been applied retroactively. Under Canadian GAAP, comparative figures are presented using the translation of convenience method. At October 1, 1999, the change in measurement and reporting currency presented in accordance with Canadian GAAP resulted in an increase in cumulative translation adjustment balance of $4,156,000, and a decrease in capital stock balance of $3,584,000 and retained earnings balance of $572,000.
- (8)
- Under U.S. GAAP, the research and development tax credits are applied against income taxes. Under Canadian GAAP, these tax credits would be applied against research and development expenses. This difference had no impact on the consolidated net income.
- (9)
- Under U.S. GAAP, securities available for sale are recorded at their fair market value, unrealized gains or losses are recorded separately in shareholders' equity. Under Canadian GAAP, short-term investments are recorded at cost. As at September 30, 2004, there is no material unrealized gain or loss.
U.S. GAAP 73
CANADIAN GAAP
CONSOLIDATED FINANCIAL STATEMENTS
| Management's Report | 76 | ||
| Auditors' Report | 77 | ||
| Financial Statements | |||
| Consolidated Balance Sheets | 78 | ||
| Consolidated Earnings | 79 | ||
| Consolidated Retained Earnings | 79 | ||
| Consolidated Cash Flows | 80 | ||
| Notes to Consolidated Financial Statements | 81 to 99 | ||
MANAGEMENT'S REPORT
The consolidated financial statements of Axcan Pharma Inc. and the other financial information included in this annual report are the responsibility of the Company's management.
These consolidated financial statements and the other financial information have been prepared by management in accordance with Canadian generally accepted accounting principles. This responsibility includes the selection of appropriate accounting principles and methods in the circumstances and the use of careful judgement in establishing reasonable accounting estimates.
Management maintains internal control systems designed among other things, to provide reasonable assurance that the Company's assets are adequately safeguarded and that the accounting records are a reasonable basis to prepare relevant and reliable financial information.
The Audit Committee is composed solely of external directors. This Committee meets with the external auditors and management to discuss matters relating to the audit, internal control and financial information. The Committee also reviews the consolidated quarterly and annual financial statements.
These consolidated financial statements have been audited by Raymond Chabot Grant Thornton, LLP, Chartered Accountants, whose report indicating the scope of their audit and their opinion on the consolidated financial statements is presented below.
The Board of Directors has approved the Company's financial statements on the recommendation of the Audit Committee.
The Company decided, for the year beginning October 1, 2002 to switch from Canadian generally accepted accounting principles to generally accepted accounting principles in the United States of America as its primary reporting convention. Consolidated financial statements in accordance with generally accepted accounting principles in the United States of America have been also prepared.
Léon F. Gosselin President and Chief Executive Officer | David W. Mims Executive Vice President and Chief Operating Officer | Jean Vézina Vice President, Finance and Chief Financial Officer |
Mont-Saint-Hilaire, Quebec, Canada
November 10, 2004
76 CANADIAN GAAP
AUDITORS' REPORT
TO THE SHAREHOLDERS OF AXCAN PHARMA INC.
We have audited the consolidated balance sheets of Axcan Pharma Inc. as at September 30, 2004 and 2003 and the consolidated statements of earnings, retained earnings and cash flows for each of the years in the three-year period ended September 30, 2004. These financial statements are the responsibility of the Company's management. Our responsibility is to express an opinion on these financial statements based on our audits.
We conducted our audits in accordance with the standards of the Public Company Accounting Oversight Board (United States) and with generally accepted auditing standards in Canada. Those standards require that we plan and perform an audit to obtain reasonable assurance whether the financial statements are free of material misstatement. An audit includes examining, on a test basis, evidence supporting the amounts and disclosures in the financial statements. An audit also includes assessing the accounting principles used and significant estimates made by management, as well as evaluating the overall financial statement presentation.
In our opinion, these consolidated financial statements present fairly, in all material respects, the financial position of the Company as at September 30, 2004 and 2003 and the results of its operations and its cash flows for each of the years in the three-year period ended September 30, 2004 in accordance with generally accepted accounting principles in Canada.
On November 10, 2004, we reported separately to the shareholders of Axcan Pharma Inc. on the consolidated financial statements for the same periods, prepared in accordance with generally accepted accounting principles in the United States of America.
Chartered Accountants |
Montreal, Quebec, Canada
November 10, 2004
CANADIAN GAAP 77
| September 30 | 2004 | 2003 | |||
|---|---|---|---|---|---|
| in thousands of U.S. dollars | $ | $ | |||
| Assets | |||||
| Current assets | |||||
| Cash and cash equivalents | 22,063 | 37,886 | |||
| Short-term investments, at cost (Note 5) | 15,922 | 133,112 | |||
| Accounts receivable (Note 6) | 46,518 | 19,665 | |||
| Income taxes receivable | 9,196 | 5,315 | |||
| Inventories (Note 7) | 37,270 | 20,163 | |||
| Prepaid expenses and deposits | 3,499 | 2,848 | |||
| Future income taxes (Note 8) | 4,586 | 6,214 | |||
| Total current assets | 139,054 | 225,203 | |||
Investments (Note 9) | — | 775 | |||
| Property, plant and equipment (Note 10) | 31,265 | 20,351 | |||
| Intangible assets (Note 11) | 420,235 | 277,837 | |||
| Goodwill (Note 12) | 28,862 | 29,342 | |||
| Deferred debt issue expenses, at amortized cost | 3,088 | 4,233 | |||
| Future income taxes (Note 8) | 930 | 1,775 | |||
| 623,434 | 559,516 | ||||
Liabilities | |||||
| Current liabilities | |||||
| Accounts payable and accrued liabilities (Note 14) | 47,985 | 43,791 | |||
| Income taxes payable | 731 | 4,821 | |||
| Instalments on long-term debt | 1,778 | 1,528 | |||
| Future income taxes (Note 8) | 936 | 494 | |||
| Total current liabilities | 51,430 | 50,634 | |||
Long-term debt (Note 15) | 110,203 | 107,527 | |||
| Future income taxes (Note 8) | 39,376 | 35,742 | |||
| 201,009 | 193,903 | ||||
Shareholders' Equity | |||||
| Equity component of convertible debt (Note 16) | 24,239 | 24,239 | |||
| Capital stock (Note 17) | 267,288 | 262,388 | |||
| Retained earnings | 107,671 | 63,211 | |||
| Accumulated foreign currency translation adjustments | 23,227 | 15,775 | |||
| 422,425 | 365,613 | ||||
| 623,434 | 559,516 | ||||
The accompanying notes are an integral part of the consolidated financial statements.
Léon F. Gosselin Director | Dr Claude Sauriol Director |
78 CANADIAN GAAP
CONSOLIDATED EARNINGS
| Years ended September 30 | 2004 | 2003 | 2002 | |||||
|---|---|---|---|---|---|---|---|---|
| in thousands of U.S. dollars, except share related data | $ | $ | $ | |||||
| Revenue | 243,792 | 179,542 | 133,175 | |||||
| Cost of goods sold | 54,247 | 44,474 | 34,145 | |||||
| Selling and administrative expenses | 76,574 | 63,461 | 50,522 | |||||
| Research and development expenses | 18,641 | 11,638 | 8,025 | |||||
| Depreciation and amortization | 16,421 | 8,127 | 7,613 | |||||
| 165,883 | 127,700 | 100,305 | ||||||
| Operating income | 77,909 | 51,842 | 32,870 | |||||
| Financial expenses | 11,131 | 6,590 | 906 | |||||
| Interest income | (762 | ) | (1,642 | ) | (912 | ) | ||
| Loss (gain) on foreign currency | (308 | ) | 128 | 266 | ||||
| Takeover-bid expenses | — | 3,697 | — | |||||
| 10,061 | 8,773 | 260 | ||||||
| Earnings before income taxes | 67,848 | 43,069 | 32,610 | |||||
| Income taxes (Note 8) | 23,388 | 14,452 | 11,742 | |||||
| Net earnings | 44,460 | 28,617 | 20,868 | |||||
| Earnings per common share | ||||||||
| Basic | 0.98 | 0.64 | 0.50 | |||||
| Diluted | 0.96 | 0.63 | 0.49 | |||||
| Weighted average number of common shares | ||||||||
| Basic | 45,286,199 | 44,914,944 | 41,664,510 | |||||
| Diluted | 52,787,964 | 45,607,992 | 42,527,500 | |||||
The accompanying notes are an integral part of the consolidated financial statements.
CONSOLIDATED RETAINED EARNINGS
| Years ended September 30 | 2004 | 2003 | 2002 | ||||
|---|---|---|---|---|---|---|---|
| in thousands of U.S. dollars | $ | $ | $ | ||||
| Balance, beginning of year | 63,211 | 34,594 | 16,914 | ||||
| Net earnings | 44,460 | 28,617 | 20,868 | ||||
| Common share issue expenses, net of future income taxes in the amount of $1,649 for 2002 | — | — | (3,188 | ) | |||
| Balance, end of year | 107,671 | 63,211 | 34,594 | ||||
The accompanying notes are an integral part of the consolidated financial statements.
CANADIAN GAAP 79
CONSOLIDATED CASH FLOWS
| Years ended September 30 | 2004 | 2003 | 2002 | |||||
|---|---|---|---|---|---|---|---|---|
| in thousands of U.S. dollars | $ | $ | $ | |||||
| Operations | ||||||||
| Net earnings | 44,460 | 28,617 | 20,868 | |||||
| Non-cash items | ||||||||
| Implicit interest on convertible debt | 4,234 | 2,292 | — | |||||
| Non-controlling interest | — | (103 | ) | (363 | ) | |||
| Amortization of deferred debt issue expenses | 1,144 | 646 | 247 | |||||
| Other depreciation and amortization | 16,421 | 8,127 | 7,613 | |||||
| Loss on disposal of assets | 475 | 1,130 | — | |||||
| Foreign currency fluctuation | 342 | 305 | 507 | |||||
| Future income taxes | 6,597 | 2,810 | 2,187 | |||||
| Changes in working capital items (Note 19) | (50,344 | ) | 12,764 | 4,266 | ||||
| Cash flows from operating activities | 23,329 | 56,588 | 35,325 | |||||
Financing | ||||||||
| Long-term debt | 2,212 | 101,825 | 1,506 | |||||
| Repayment of long-term debt | (3,840 | ) | (1,979 | ) | (3,267 | ) | ||
| Equity component of convertible debt | — | 24,239 | — | |||||
| Repayment of balance of purchase price | — | (2,704 | ) | — | ||||
| Deferred debt issue expenses | — | (4,589 | ) | (537 | ) | |||
| Issue of shares | 4,900 | 1,103 | 69,876 | |||||
| Share issue expenses | — | — | (4,837 | ) | ||||
| Cash flows from financing activities | 3,272 | 117,895 | 62,741 | |||||
Investment | ||||||||
| Acquisition of short-term investments | (20,936 | ) | (133,112 | ) | (60,740 | ) | ||
| Disposal of short-term investments | 138,074 | 60,740 | — | |||||
| Acquisition of investments | — | — | (16 | ) | ||||
| Disposal of investments | 1,876 | 637 | 385 | |||||
| Acquisition of property, plant and equipment | (13,409 | ) | (4,302 | ) | (2,873 | ) | ||
| Disposal of property, plant and equipment | 405 | — | — | |||||
| Acquisition of intangible assets | (149,628 | ) | (81,093 | ) | (1,561 | ) | ||
| Disposal of intangible assets | 917 | — | — | |||||
| Other | — | — | 1,363 | |||||
| Net cash used for business acquisitions (Note 4) | — | — | (31,302 | ) | ||||
| Cash flows from investment activities | (42,701 | ) | (157,130 | ) | (94,744 | ) | ||
| Foreign exchange gain on cash held in foreign currencies | 277 | 528 | 142 | |||||
| Net increase (decrease) in cash and cash equivalents | (15,823 | ) | 17,881 | 3,464 | ||||
| Cash and cash equivalents, beginning of year | 37,886 | 20,005 | 16,541 | |||||
| Cash and cash equivalents, end of year | 22,063 | 37,886 | 20,005 | |||||
The accompanying notes are an integral part of the consolidated financial statements.
80 CANADIAN GAAP
NOTES TO CONSOLIDATED FINANCIAL STATEMENTS
September 30
Amounts in the tables are stated in thousands of U.S. dollars, except share related data.
1. GOVERNING STATUTES AND NATURE OF OPERATIONS
The Company, incorporated under the Canada Business Corporations Act, is involved in the research, development, production and distribution of pharmaceutical products, mainly in the field of gastroenterology.
2. CHANGES IN ACCOUNTING POLICIES
a) Year ended September 30, 2004
Revenue recognition
In December 2003, the Emerging Issues Committee ("EIC") of the Canadian Institute of Chartered Accountants ("CICA") issued some abstracts on revenue recognition: EIC-141,"Revenue Recognition" and EIC-142,"Revenue Arrangements with Multiple Deliverables". In general, the objective of these abstracts is to provide guidelines for the application of Section 3400 of the CICA Handbook,"Revenue". The new guidelines on revenue recognition are based on corresponding guidelines issued in the United States.
In 1999, in the United States, the Securities and Exchange Commission issued Staff Accounting Bulletin ("SAB") 101,"Revenue Recognition in Financial Statements". Since then, various securities regulators in Canada have indicated that the provisions in SAB 101 are consistent with Section 3400 of the CICA Handbook, and that they would look to SAB 101 when determining whether Canadian reporting issuers have complied with Canadian GAAP. The purpose of EIC-141 therefore is to summarize the principles set out in SAB 101 because, in the Committee's view, they are appropriate as interpretive guidance on the application of CICA 3400.
EIC-142 is based on Issue No. 00-21 titled"Revenue Arrangements with Multiple Deliverables" issued in May 2003 by the Emerging Issues Task Force of the Financial Accounting Standards Board in the United States. EIC-142 addresses how to determine whether an arrangement involving multiple deliverables ("AMD") contains more than one unit of accounting and, if so, how arrangement consideration should be allocated to the separate units of accounting in the arrangement. EIC-142 applies to all deliverables (that is, products, services, or rights to use assets) within AMDs (whether written, oral, or implied). The guidelines set out in EIC-141 and 142 may be applied prospectively and should be applied to sales transactions recognized and AMDs entered into in the first interim period or annual fiscal period beginning after December 17, 2003. The adoption of these guidelines have had no impact on the consolidated financial statements of the Company because Axcan already follows SAB 101 and Issue No 00-21.
Consolidation of variable interest entities
In January 2003, the CICA issued Accounting Guidelines ("AcG")-15, "Consolidation of Variable Interest Entities". This standard was subsequently modified in September 2004. AcG-15 requires certain variable interest entities, or VIEs, to be consolidated by the primary beneficiary of the entity if the equity investors in the entity do not have the characteristics of a controlling financial interest or do not have sufficient equity at risk for the entity to finance its activities without additional subordinated financial support from other parties. The Company currently has no contractual relationship or other business relationship with a variable interest entity and therefore the adoption of AcG-15 did not have an effect on the Company's consolidated balance sheets or statements of earnings, retained earnings and cash flows.
b) Year ended September 30, 2003
Basis of presentation
The Company decided, for the year beginning October 1, 2002, to switch from Canadian generally accepted accounting principles ("GAAP") to the United States of America ("U.S.") GAAP as its primary reporting convention. The change in GAAP was influenced by the Company's desire to better meet the needs of its shareholders by applying accounting rules that are consistent with the majority of its customers and peer companies. For regulatory authorities purposes, the Company continued to prepare and to file the present consolidated financial statements prepared in U.S. dollars and in accordance with Canadian GAAP.
Disclosure requirements for guarantees
In February 2003, the CICA issued AcG-14,"Guarantor's Accounting and Disclosure Requirements for Guarantees." AcG-14 requires guarantors to disclose certain information for guarantees, including product warranties, outstanding at the end of the reporting period. At adoption, AcG-14 did not have any impact on the Company's consolidated financial statements.
Impairment or disposal of long-lived assets
The CICA issued new Handbook Section 3063"Impairment of Long-lived Assets" and revised Section 3475"Disposal of Long-lived Assets and Discontinued Operations". These two sections provide guidance on how assets are grouped when testing for and measuring impairment and propose a two-step process for first determining when an impairment loss is recognized and then measuring that loss. The adoption of these new standards had no impact on the consolidated financial statements.
CANADIAN GAAP 81
Stock-based compensation
On October 1, 2002, the Company adopted retroactively the recommandations of the CICA Handbook, Section 3870,"Stock-based Compensation and Other Stock-based Payments". This Section defines notably recognition, measurement and disclosure standards for stock-based compensation to employees. These standards define a fair value-based method of accounting for stock-based employee compensation plans. Under this method, compensation cost should be measured at the grant date based on the fair value of the award and should be recognized over the related service period. An entity that did not adopt the fair value method of accounting for its awards granted to employees was required to include in its financial statements pro forma disclosures of net earnings and earnings per share as if the fair value method of accounting had been applied. The supplementary information required by this new Section is presented in note 24 for the years ended September 30, 2004, 2003 and 2002.
c) Year ended September 30, 2002
Business combination, intangible assets and goodwill
In 2001, the CICA approved new standards modifying the method of accounting for business combinations entered into after June 30, 2001 and addressed the accounting for goodwill and other intangible assets. The new standards on goodwill and other intangible assets should be applied for fiscal years beginning on or after January 1, 2002. The Company has elected to early adopt and, since October 1, 2001, it no longer amortizes its goodwill and trademarks with indefinite life, but however, evaluates goodwill and trademarks with indefinite life for impairment annually. Intangible assets with finite life will continue to be amortized over their estimated useful lives. As required by the standards, the Company completed the impairment tests on October 1, 2001 and did not record any impairments.
Scientific symposium costs
In 2002, the Company elected to expense its scientific symposium costs in the fiscal year they are incurred. In the previous years, these costs were deferred and amortized over a two-year period. This change in accounting policy has led to an increase in selling and administrative expenses of $457,000 during the year 2002.
d) Standards applicable for the year 2005
Stock-based compensation
In September and November 2003, the Accounting Standard Board ("AcSB") made amendments to CICA Handbook Section 3870 to require that the fair value based method be applied to awards granted to employees, which previously had not been accounted for at fair value. Thus, enterprises will be required to account for the effect of such awards in their financial statements for fiscal years beginning on or after January 1, 2004. The Company will adopt the fair value based method in its fiscal year 2005 with a retroactive application, without restating prior periods.
3. ACCOUNTING POLICIES
Basis of presentation
The consolidated financial statements are expressed in U.S. dollars and were prepared in accordance with Canadian GAAP. Consolidated financial statements prepared in U.S. dollars and in accordance with U.S. GAAP are available to the shareholders and filed with various regulatory authorities.
Accounting estimates
The preparation of financial statements in accordance with generally accepted accounting principles requires management to make estimates and assumptions that affect the recorded amounts of assets and liabilities and disclosure of contingent assets and liabilities as of the date of the financial statements and recognized amounts of revenues and expenses during the year. Significant estimates and assumptions made by management include allowances for accounts receivable and inventories, reserves for product returns, rebates and chargebacks, the classification of intangible assets between finite life and indefinite life, the useful lives of long-lived assets, the expected cash flows used in evaluating of long-lived assets, goodwill and investments for impairment, pending legal settlements, the realizability of future income tax assets and the allocation of the purchase price of acquired assets and businesses. The estimates are made using the historical information available to management and other expected factors. The Company reviews all significant estimates affecting the financial statements on a recurring basis and records the effect of any adjustments when necessary. Actual results could differ from those estimates.
Principles of consolidation
These financial statements include the accounts of the Company and its subsidiaries, the most important being Axcan Scandipharm Inc., Axcan Pharma U.S. Inc. and Axcan Pharma S.A. (the result of the merger of Laboratoires Entéris S.A.S. with Laboratoires du Lactéol du Docteur Boucard S.A.). Significant intercompany transactions have been eliminated in consolidation. The Company's interest in the joint ventures is accounted for by the proportionate consolidation method.
Revenue recognition
Revenue is recognized when the product is shipped to the Company's customers, provided the Company has not retained any significant risks of ownership or future obligations with respect to the product shipped. Revenue from product sales is recognized net of sales discounts, allowances, returns, rebates and chargebacks. In certain circumstances returns or exchange of products are allowed under the Company's policy and provisions are maintained accordingly. Amounts received from customers as prepayments for products to be shipped in the future are reported as deferred revenue.
Cash and cash equivalents
The Company includes in cash and cash equivalents cash and all highly liquid short-term investments with initial maturities of three months or less.
82 CANADIAN GAAP
Accounts receivable
The majority of the Company's accounts receivable are due from companies in the pharmaceutical industry. Credit is extended based on evaluation of a customers' financial condition and, generally, collateral is not required. Accounts receivable are due within 30 days and are stated at amounts due from customers net of an allowance for doubtful accounts. Accounts outstanding longer than the contractual payment terms are considered past due. The Company determines its allowance by considering a number of factors, including the length of time trade accounts receivable are past due, the Company's previous loss history, the customer's current ability to pay its obligation to the Company, and the condition of the general economy and the industry as a whole. The Company writes off accounts receivable when they become uncollectible, and payments subsequently received on such receivables are credited to bad debts expenses.
Inventory valuation
Inventories of raw materials and packaging material are valued at the lower of cost and replacement cost. Inventories of work in progress and finished goods are valued at the lower of cost and net realizable value. Cost is determined by the first in, first out method.
Research and development
Research and development expenses are charged to earnings in the year they are incurred, net of related tax credits.
Depreciation and amortization
Property, plant and equipment and intangible assets with a finite life are reported at cost, less accumulated depreciation and are depreciated or amortized over their estimated useful lives according to the straight-line method at the following annual rates:
| Buildings | 4 to 10% | |
| Furniture and equipment | 10 to 20% | |
| Computer equipment | 20 to 50% | |
| Automotive equipment | 20 to 25% | |
| Leasehold and building improvements | 10 to 20% | |
| Trademarks, trademark licenses and manufacturing rights | 4 to 15% |
Depreciation or amortization commences when an asset is substantially completed and becomes available for productive commercial use.
Goodwill and intangible assets with indefinite life are no longer amortized since October 1, 2001.
Management evaluates the value of the unamortized portion of property, plant and equipment, goodwill and intangible assets annually. Should there be a permanent impairment in value, a write-down will be recognized for the current year to reflect the assets at fair value. To date, the Company has not recognized any permanent impairment in value except for an amount of $480,000 of goodwill associated with the joint ventures for the year ended September 30, 2004.
Deferred debt issue expenses are amortized on a straight-line basis over the term of the debts until 2008.
Income taxes
Income taxes are calculated based on the liability method. Under this method, future income tax assets and liabilities are recognized as estimated taxes for recovery or settlement arising from the recovery or settlement of assets and liabilities recorded at their financial statement carrying amounts. Future income tax assets and liabilities are measured based on enacted or substantively enacted tax rates and laws at the date of the financial statements for the years in which the temporary differences are expected to reverse. Adjustments to the future income tax asset and liability balances are recognized in earnings as they occur.
Stock options
The Company has granted stock options as described in Note 17. Canadian GAAP establish a fair value-based method of accounting for stock-based compensation plans, but also permit an election to use an intrinsic value-based method with disclosure on a pro-forma basis for net earnings and net earnings per share. The Company elected to provide such pro-forma disclosure. Any consideration paid by employees on the exercise of stock options is credited to capital stock.
Foreign currency translation
The current rate method of translation of foreign currencies is followed for subsidiaries, or joint ventures considered financially and operationally self-sustaining. Therefore, all gains and losses arising from the translation of the financial statements of subsidiaries or joint ventures are deferred in an "Accumulated foreign currency translation adjustments" account under "Shareholders' equity".
For the operations in Canada and the United States of America, monetary assets and liabilities in currency other than U.S. dollars are translated into U.S. dollars, the functional currency of the Company, at the exchange rates in effect at the balance sheet date whereas other assets and liabilities are translated at exchange rates in effect at transaction dates. Revenue and operating expenses in foreign currency are translated at the average rates in effect during the year, except for depreciation and amortization, translated at historical rates. Gains and losses are included in earnings for the year.
Earnings per share
Basic earnings per share is calculated using the weighted average number of common shares outstanding during the year. The treasury stock method is to be used for determining the dilution effect of options. The dilutive effect of convertible subordinated notes, balance of purchase price payable in shares and convertible preferred shares is determined using the "if-converted" method.
CANADIAN GAAP 83
4. ACQUISITIONS
a) Business acquisitions
September 30, 2002
On November 7, 2001, the Company acquired all the outstanding shares of Laboratoires Entéris S.A.S., a company specializing in the distribution of gastrointestinal products in France. The acquisition cost, including transaction expenses, amounting to $23,000,840, was paid in cash.
On April 17, 2002, the Company acquired all the outstanding shares of Laboratoires du Lactéol du Docteur Boucard S.A. and certain related assets. This company is specialized in the manufacturing and distribution of gastrointestinal products in France. The acquisition cost, including transaction expenses, amounting to $13,137,613, was paid with the issuance of 365,532 common shares of the Company and $8,378,728 in cash. The price of the common shares issued was determined on the basis of a twenty-day trading average closing price.
These two acquisitions allowed the Company to establish operations in France for the development of markets in all of Western Europe and added two products to the Company's product line.
The following table shows the breakdown of these acquisitions:
| | $ | ||
|---|---|---|---|
| Net assets acquired at the attributed values | |||
| Assets | |||
| Cash and cash equivalents | 77 | ||
| Other working capital items | 7,323 | ||
| Property, plant and equipment | 9,433 | ||
| Intangible assets with indefinite life | 29,175 | ||
| Goodwill | 9,632 | ||
| Future income taxes | 656 | ||
| Other assets | 1,363 | ||
| 57,659 | |||
| Liabilities | |||
| Accounts payable | 8,215 | ||
| Long-term debt | 6,922 | ||
| Future income taxes | 6,384 | ||
| 21,521 | |||
| 36,138 | |||
| Consideration | |||
| Cash | 31,379 | ||
| Common shares issued | 4,759 | ||
| 36,138 | |||
| Net cash used for the acquisitions | 31,302 | ||
The acquisition cost has been allocated to the assets and liabilities according to their estimated fair value at the acquisition dates. The operating results relating to these acquisitions have been included in the consolidated financial statements from the acquisition dates.
Using the assumption that the effective date of the business acquisitions is October 1, 2001, the consolidated pro-forma results of operations of the Company would have been as follows for the year ended September 30, 2002:
| | (unaudited) | |
|---|---|---|
| | $ | |
| Revenue | 140,983 | |
| Net earnings | 20,802 | |
| Net earnings per share | 0.50 | |
84 CANADIAN GAAP
b) Products acquisitions
On November 18, 2003, the Company acquired the rights to a group of products from Aventis Pharma S.A. ("Aventis") for a cash purchase price of $145,000,000. The acquired products are CARAFATE and BENTYL for the U.S. market and SULCRATE, BENTYLOL and PROCTOSEDYL for the Canadian market.
On August 29, 2003, the Company acquired an exclusive license for North America, the European Union and Latin America, from Abbott Laboratories ("Abbott") to develop, manufacture and market ITAX, a patented gastroprokinitic drug. Under the terms of this license agreement, the Company paid $10,000,000 and assumed $2,000,000 in research contract liability. The agreement also provides for milestone payments upon certain events.
On December 10, 2002, the Company acquired the rights to the Ursodiol 250mg tablets DELURSAN for the French market, for a cash purchase price of 22,300,000 Euros ($22,800,000) from Aventis. On December 3, 2002, the Company acquired the worldwide rights to the PANZYTRAT enzyme product line from Abbott for a cash purchase price of $45,000,000.
During a transition period, the sellers may act as Axcan's agents for the management of sales of some of these products. For the year ended September 30, 2004, a portion of the sales of these products is still managed by the sellers. Axcan includes in its revenue the net sales from such products less corresponding cost of goods sold and other seller related expenses. Consequently, although net sales of such products of the year ended September 30, 2004 were $7,667,940 ($14,255,979 in 2003), the Company only included in its revenue an amount of $4,685,673 ($9,463,645 in 2003) representing the net sales less cost of goods sold and other seller related expenses.
5. SHORT-TERM INVESTMENTS
As at September 30, 2004, short-term investments include short-term ntoes, mutual funds and debt securities. One mutual fund represent approximately 64% (four short-term notes for 60% in 2003) of the Company's total short-term investments. Interest rates on most of the short-term investments vary from 0.975% to 3.315% (0.81% to 1.08% in 2003).
6. ACCOUNTS RECEIVABLE
| | 2004 | 2003 | ||
|---|---|---|---|---|
| | $ | $ | ||
| Trade accounts, net of allowance for doubtful accounts of $876,000 ($613,000 in 2003)(a) | 44,253 | 16,676 | ||
| Investments receivable within one year | — | 1,102 | ||
| Taxes receivable | 1,978 | 1,479 | ||
| Other | 287 | 408 | ||
| 46,518 | 19,665 | |||
The Company believes that there is no unusual exposure associated with the collection of these accounts receivable.
- (a)
- As at September 30, 2004, the accounts receivable include amounts receivable from three customers which represent approximately 51% (two customers and one agent for 44% in 2003) of the Company's total accounts receivable.
CANADIAN GAAP 85
7. INVENTORIES
| | 2004 | 2003 | ||
|---|---|---|---|---|
| | $ | $ | ||
| Raw materials and packaging material | 10,311 | 8,441 | ||
| Work in progress | 1,781 | 1,466 | ||
| Finished goods | 25,178 | 10,256 | ||
| 37,270 | 20,163 | |||
8. INCOME TAXES
The future income tax assets and liabilities result from differences between the tax value and book value of the following items:
| | 2004 | 2003 | |||
|---|---|---|---|---|---|
| | $ | $ | |||
| Short-term future income tax assets | |||||
| Inventories | 376 | 2,554 | |||
| Prepaid expenses and deposits | 167 | — | |||
| Accounts payable and accrued liabilities | 2,941 | 2,558 | |||
| Pending legal settlements | 1,102 | 1,102 | |||
| 4,586 | 6,214 | ||||
| Long-term future income tax assets | |||||
| Investments | — | 16 | |||
| Share issue expenses | 930 | 1,746 | |||
| Unused operating losses | — | 13 | |||
| 930 | 1,775 | ||||
| Short-term future income tax liabilities | |||||
| Accounts receivable | 379 | 318 | |||
| Inventories | 109 | — | |||
| Prepaid expenses and deposits | 434 | 163 | |||
| Investments | 14 | 13 | |||
| 936 | 494 | ||||
| Long-term future income tax liabilities | |||||
| Property, plant and equipment | 2,484 | 1,993 | |||
| Intangible assets | 35,705 | 32,940 | |||
| Goodwill | 682 | 682 | |||
| Research and development expenses | 505 | 127 | |||
| 39,376 | 35,742 | ||||
86 CANADIAN GAAP
Income taxes included in the statement of earnings are as follows:
| | 2004 | 2003 | 2002 | ||||
|---|---|---|---|---|---|---|---|
| | $ | $ | $ | ||||
| Current | 16,791 | 11,642 | 9,555 | ||||
| Future | |||||||
| Creation and reversal of temporary differences | 6,597 | 3,640 | 2,043 | ||||
| Change in promulgated rates | — | (830 | ) | 144 | |||
| 6,597 | 2,810 | 2,187 | |||||
| 23,388 | 14,452 | 11,742 | |||||
| Domestic | |||||||
| Current | 825 | (1,265 | ) | 2,953 | |||
| Future | 2,756 | 1,328 | 1,530 | ||||
| 3,581 | 63 | 4,483 | |||||
| Foreign | |||||||
| Current | 15,966 | 12,907 | 6,602 | ||||
| Future | 3,841 | 1,482 | 657 | ||||
| 19,807 | 14,389 | 7,259 | |||||
| 23,388 | 14,452 | 11,742 | |||||
The Company's effective income tax rate differs from the combined statutory federal and provincial income tax rate in Canada (31.52% for 2004, 33.59% for 2003 and 35.66% for 2002). This difference arises from the following:
| | 2004 | 2003 | 2002 | |||||||||||
|---|---|---|---|---|---|---|---|---|---|---|---|---|---|---|
| | % | $ | % | $ | % | $ | ||||||||
| Combined basic rate applied to pre-tax income | 31.52 | 21,386 | 33.59 | 14,467 | 35.66 | 11,629 | ||||||||
| Increase (decrease) in taxes resulting from: | ||||||||||||||
| Large corporations tax | 0.04 | 29 | — | — | — | — | ||||||||
| Change in promulgated rates | — | — | (1.93 | ) | (830 | ) | 0.44 | 144 | ||||||
| Difference with foreign tax rates | (2.59 | ) | (1,755 | ) | (3.05 | ) | (1,312 | ) | 3.65 | 1,189 | ||||
| Non-deductible items | 3.84 | 2,602 | 3.44 | 1,481 | 0.70 | 228 | ||||||||
| Use of unrecorded prior years' losses | — | — | — | — | (0.71 | ) | (231 | ) | ||||||
| Non-taxable items and other | (1.23 | ) | (832 | ) | (1.40 | ) | (604 | ) | (6.16 | ) | (2,008 | ) | ||
| Foreign withholding taxes | 2.89 | 1,958 | 2.90 | 1,250 | 2.43 | 791 | ||||||||
| 34.47 | 23,388 | 33.55 | 14,452 | 36.01 | 11,742 | |||||||||
No provision has been made for income taxes on the undistributed earnings of the Company's foreign subsidiaries as at September 30, 2004 that the Company intends to indefinitely reinvest.
CANADIAN GAAP 87
9. INVESTMENTS
| | 2004 | 2003 | ||
|---|---|---|---|---|
| | $ | $ | ||
| Investments in preferred shares of a private company, at estimated net realizable value | — | 578 | ||
| Note receivable, 8.5% beginning on January 1, 2002, maturing on January 1, 2004 | — | 936 | ||
| Other | — | 363 | ||
| — | 1,877 | |||
| Investments receivable within one year | — | 1,102 | ||
| — | 775 | |||
10. PROPERTY, PLANT AND EQUIPMENT
| | 2004 | |||||
|---|---|---|---|---|---|---|
| | Cost | Accumulated depreciation | Net | |||
| | $ | $ | $ | |||
| Land | 1,581 | — | 1,581 | |||
| Buildings | 20,311 | 3,412 | 16,899 | |||
| Furniture and equipment | 15,762 | 7,981 | 7,781 | |||
| Automotive equipment | 75 | 21 | 54 | |||
| Computer equipment | 7,553 | 3,132 | 4,421 | |||
| Leasehold and building improvements | 810 | 281 | 529 | |||
| 46,092 | 14,827 | 31,265 | ||||
2003 | ||||||
|---|---|---|---|---|---|---|
| | Cost | Accumulated depreciation | Net | |||
| | $ | $ | $ | |||
| Land | 940 | — | 940 | |||
| Buildings | 12,431 | 2,484 | 9,947 | |||
| Furniture and equipment | 13,761 | 6,417 | 7,344 | |||
| Automotive equipment | 86 | 13 | 73 | |||
| Computer equipment | 3,822 | 2,085 | 1,737 | |||
| Leasehold and building improvements | 522 | 212 | 310 | |||
| 31,562 | 11,211 | 20,351 | ||||
Acquisitions of property, plant and equipment amount to $14,288,431 ($4,301,768 in 2003 and $14,071,633 in 2002).
The cost and accumulated depreciation of equipment under capital leases amount to $5,351,295 and $1,659,955 ($5,019,440 and $891,445 in 2003).
88 CANADIAN GAAP
11. INTANGIBLE ASSETS
| | 2004 | ||||||
|---|---|---|---|---|---|---|---|
| | Cost | Accumulated depreciation | Net | ||||
| | $ | $ | $ | ||||
| Trademarks, trademark licenses and manufacturing rights with a: | |||||||
| Finite life | 292,863 | 30,338 | 262,525 | ||||
| Indefinite life | 170,127 | 12,417 | 157,710 | ||||
| 462,990 | 42,755 | 420,235 | |||||
2003 | |||||||
|---|---|---|---|---|---|---|---|
| | Cost | Accumulated depreciation | Net | ||||
| | $ | $ | $ | ||||
| Trademarks, trademark licenses and manufacturing rights with a: | |||||||
| Finite life | 124,157 | 20,414 | 103,743 | ||||
| Indefinite life | 186,512 | 12,418 | 174,094 | ||||
| 310,669 | 32,832 | 277,837 | |||||
The cost of the product TAGAMET has been transferred from intangible assets with an indefinite life to intangible assets with a finite life following changes in the regulatory rules applicable to this product and resulting in the modification of its useful life. The net cost of this product as of October 1, 2003, which amounted to $21,852,859, is therefore amortized over a 15-year period.
Acquisitions of intangible assets amount to $149,627,653 ($88,092,927 in 2003 and $30,036,118 in 2002). The current intangible assets with a finite life have a weighted-average remaining amortization period of approximately 18 years.
The annual amortization expenses without taking into account any future acquisitions expected for the years 2005 through 2009 is as follows:
| | $ | |
|---|---|---|
| 2005 | 13,798 | |
| 2006 | 13,798 | |
| 2007 | 13,798 | |
| 2008 | 13,798 | |
| 2009 | 13,787 |
12. GOODWILL
| | 2004 | 2003 | ||
|---|---|---|---|---|
| | $ | $ | ||
| Cost | 32,651 | 33,200 | ||
| Accumulated amortization | 3,789 | 3,858 | ||
| Net | 28,862 | 29,342 | ||
CANADIAN GAAP 89
The Company has a credit agreement relative to a $125,000,000 ($55,000,000 in 2003) financing. The credit agreement consists of a 364-day extendible revolving facility with a two-year (three-year in 2003) term-out option maturing on September 22, 2007 (October 12, 2007 in 2003). The term-out option provides for quarterly instalments equal to 8.57% (6.81% in 2003) of the amount then outstanding on the facility with a final instalment of 40% (25% in 2003).
The Company's credit facility is secured by a first security interest on all present and future acquired assets of the Company and its material subsidiaries, and provides for the maintenance of certain financial ratios. Cash dividends, repurchase of shares (other than redeemable shares issued in connection with a permitted acquisition) and similar distributions to shareholders are limited to 10% of the Company's net earnings for the preceding fiscal year.
The interest rate varies depending on the Company's leverage between 25 basis points and 100 (25 and 125 in 2003) basis points over prime rate and between 125 basis points and 200 (125 and 225 in 2003) basis points over the LIBOR rate or bankers acceptances. The line of credit also provides for a stand-by fee of between 25 and 37.5 basis points. The facility may be drawn in U.S. dollars or in Canadian dollars equivalent. As at September 30, 2004 and 2003 there was no amount outstanding under the line of credit.
14. ACCOUNTS PAYABLE AND ACCRUED LIABILITIES
| | 2004 | 2003 | ||
|---|---|---|---|---|
| | $ | $ | ||
| Accounts payable | 13,327 | 9,605 | ||
| Contract rebates, product returns and accrued chargebacks | 8,853 | 7,248 | ||
| Accrued interest on subordinated notes | 2,530 | 3,038 | ||
| Accrued royalty fees | 5,340 | 4,820 | ||
| Accrued salaries | 3,228 | 3,084 | ||
| Accrued bonuses | 2,804 | 2,883 | ||
| Accrued research and development expenses | 3,447 | 1,995 | ||
| Accounts payable on intangible assets | — | 7,000 | ||
| Other accrued liabilities | 5,556 | 1,218 | ||
| Pending legal settlements | 2,900 | 2,900 | ||
| 47,985 | 43,791 | |||
15. LONG-TERM DEBT
| | 2004 | 2003 | ||
|---|---|---|---|---|
| | $ | $ | ||
| Convertible subordinated notes, 4.25%, interest payable semi-annually starting October 15, 2003, convertible into 8,924,113 common shares, maturing April 15, 2008. (Note 16) | 107,287 | 103,053 | ||
Bank loans, 3.8% (interest rates varying between 4.84% and 7.15% as at September 30, 2003) secured by immovable hypothecs on land and buildings having a net book value of $6,826,494 in 2004, payable in quarterly instalments of $200,000, principal and interest, maturing in 2007. | 2,174 | 2,576 | ||
Obligations under capital leases, interest rates varying between 3.81% and 6.20% payable in monthly instalments, principal and interest, maturing on different dates until 2009. | 2,520 | 3,426 | ||
| 111,981 | 109,055 | |||
| Instalments due within one year | 1,778 | 1,528 | ||
| 110,203 | 107,527 | |||
90 CANADIAN GAAP
As at September 30, 2004, minimum instalments on long-term debt for the next years are as follows:
| | Obligations under capital leases | Other long term loans | ||
|---|---|---|---|---|
| | $ | $ | ||
| 2005 | 1,089 | 792 | ||
| 2006 | 838 | 760 | ||
| 2007 | 483 | 622 | ||
| 2008 | 264 | 107,287 | ||
| 2009 | 92 | — | ||
| 2,766 | ||||
| Interest included in the minimum lease payments | 246 | |||
| 2,520 | ||||
16. CONVERTIBLE SUBORDINATED NOTES
The Company issued convertible subordinated notes for $125,000,000 on March 5, 2003. According to the features of this debt, an amount of $24,238,899, representing the estimated value of the right of conversion, was included in the shareholders' equity as equity component of convertible debt and an amount of $100,761,101 was included in the long-term debt as liability component of convertible debt. For the year ended September 30, 2004, implicit interest of 9.17% and totaling $4,233,768 ($2,292,478 in 2003) was accounted for and added to the liability component.
The subordinated notes are convertible into 8,924,113 common shares. The noteholders may convert their notes during any quarterly conversion period if the closing price per share for at least 20 consecutive trading days during the 30 consecutive trading-day period ending on the first day of the conversion period exceeds 110% of the conversion price in effect on that thirtieth trading day. The noteholders may also convert their notes during the five business-day period following any 10 consecutive trading-day period in which the daily average of the trading prices for the notes was less than 95% of the average conversion value for the notes during that period. Finally, the noteholders may also convert their notes upon the occurrence of specified corporate transactions or if the Company has called the notes for redemption. On or after April 20, 2006, the Company may at its options, redeem the notes, in whole or in part at redemption prices varying from 101.70% to 100.85% of the principal amount plus any accrued and unpaid interest to the redemption date. The notes also include provisions for the redemption of all the notes for cash at the option of the Company following some changes in tax treatment.
17. CAPITAL STOCK
Authorized
Unlimited number of shares without par value
Common shares
Preferred shares, issuable in series, rights, privileges and restrictions determined at the creation date
During the year 2000, the Company created two series of preferred shares as follows:
| 14,175,000 | Series A, non-voting, annual preferential cumulative dividend of 5%, redeemable on or prior to June 8, 2001 at CDN$1.00 per share payable at the option of the Company in cash or by the issuance of common shares or in any combination of cash and common shares. | |
| 12,000,000 | Series B, non-voting, redeemable on the fifth anniversary of their issuance at CDN$1.00 per share payable in cash or by the issuance of common shares at the option of the Company, convertible into common shares at the holder's option on the basis of one common share for each 15 Series B preferred shares. |
CANADIAN GAAP 91
The issued and fully paid capital stock is as follows:
| | 2004 | 2003 | 2002 | ||||||||||
|---|---|---|---|---|---|---|---|---|---|---|---|---|---|
| | Number | Amount | Number | Amount | Number | Amount | |||||||
| | | $ | | $ | | $ | |||||||
| Common shares | |||||||||||||
| Balance, beginning of year | 45,004,320 | 262,388 | 44,863,198 | 261,285 | 38,412,133 | 186,650 | |||||||
| Shares issued following public offerings(a) | — | — | — | — | 5,000,000 | 57,500 | |||||||
| Shares issued following private investors' subscription(a) | — | — | — | — | 208,044 | 3,000 | |||||||
| Shares issued following the exercise of the underwriters' option(a) | — | — | — | — | 750,000 | 8,625 | |||||||
| Shares issued pursuant to the stock option plan(a) | 558,016 | 4,900 | 141,122 | 1,103 | 127,489 | 751 | |||||||
| Shares issued for the acquisition of assets | — | — | — | — | 365,532 | 4,759 | |||||||
| 45,562,336 | 267,288 | 45,004,320 | 262,388 | 44,863,198 | 261,285 | ||||||||
| Balance, end of year | |||||||||||||
- (a)
- Issued for cash
Common stock option plan
The common stock option plan is intended for eligible directors, principal senior executives and employees. The number of stock options that can be granted under this plan cannot exceed 4,500,000 as at September 30, 2004, 2003 and 2002. Options are granted at the fair market value of the common stock on the last trading day prior to the granting date. Options may be exercised at a rate of 20% per year and expire ten years after the granting date except for the annual options granted to outside directors which may be exercised one year after the granting date.
The changes to the number of stock options outstanding are as follows:
| | 2004 | 2003 | 2002 | |||||||||
|---|---|---|---|---|---|---|---|---|---|---|---|---|
| | Number of options | Weighted average exercise price | Number of options | Weighted average exercise price | Number of options | Weighted average exercise price | ||||||
| | | $ | | $ | | $ | ||||||
| Balance, beginning of year | 2,681,840 | 10.12 | 2,429,078 | 9.67 | 1,956,441 | 7.75 | ||||||
| Granted | 738,350 | 15.44 | 531,850 | 11.36 | 684,050 | 13.38 | ||||||
| Exercised | (558,016 | ) | 8.78 | (141,122 | ) | 7.82 | (127,489 | ) | 5.89 | |||
| Cancelled | (261,618 | ) | 11.23 | (137,966 | ) | 10.73 | (83,924 | ) | 9.58 | |||
| Balance, end of year | 2,600,556 | 11.86 | 2,681,840 | 10.12 | 2,429,078 | 9.67 | ||||||
| Options exercisable at end of year | 954,459 | 9.93 | 965,909 | 9.00 | 614,716 | 7.79 | ||||||
92 CANADIAN GAAP
Stock options outstanding at September 30, 2004 are as follows:
| | Options outstanding | | | |||||||
|---|---|---|---|---|---|---|---|---|---|---|
| | Options exercisable | |||||||||
| | | Weighted average remaining contractual life | | |||||||
| Exercise price | Number | Weighted average exercise price | Number | Weighted average exercise price | ||||||
| | | | $ | | $ | |||||
| $4.06 — $5.00 | 17,000 | 5.23 | 4.06 | 11,000 | 4.06 | |||||
| $5.01 — $7.00 | 23,100 | 4.87 | 6.12 | 20,500 | 6.03 | |||||
| $7.01 — $10.00 | 809,586 | 5.84 | 8.42 | 527,549 | 8.30 | |||||
| $10.01 — $13.00 | 760,510 | 7.62 | 11.70 | 287,970 | 11.89 | |||||
| $13.01 — $16.00 | 707,360 | 8.40 | 13.56 | 107,440 | 14.00 | |||||
| $16.01 — $19.00 | 195,500 | 9.53 | 18.30 | — | — | |||||
| $19.01 — $19.99 | 87,500 | 9.39 | 19.99 | — | — | |||||
| 2,600,556 | 7.40 | 11.86 | 954,459 | 9.93 | ||||||
18. FINANCIAL INFORMATION INCLUDED IN THE CONSOLIDATED STATEMENT OF EARNINGS
a) Financial expenses
| | 2004 | 2003 | 2002 | |||
|---|---|---|---|---|---|---|
| | $ | $ | $ | |||
| Interest on long-term debt | 9,848 | 5,647 | 159 | |||
| Bank charges | 139 | 297 | 218 | |||
| Financing fees | — | — | 282 | |||
| Amortization of deferred debt issue expenses | 1,144 | 646 | 247 | |||
| 11,131 | 6,590 | 906 | ||||
b) Selling and administrative expenses
Selling and administrative expenses include the following:
| | 2004 | 2003 | 2002 | |||
|---|---|---|---|---|---|---|
| | $ | $ | $ | |||
| Shipping and handling expenses | 4,349 | 3,477 | 2,763 | |||
| Advertising expenses | 15,155 | 10,524 | 10,501 |
c) Other information
| | 2004 | 2003 | 2002 | ||||
|---|---|---|---|---|---|---|---|
| | $ | $ | $ | ||||
| Non-controlling interest | — | (103 | ) | (363 | ) | ||
| Rental expenses | 1,216 | 1,228 | 1,148 | ||||
| Depreciation of property, plant and equipment | 3,728 | 3,477 | 2,499 | ||||
| Amortization of intangible assets | 12,693 | 4,650 | 5,114 | ||||
| Investment tax credits applied against research and development expenses | 1,163 | 488 | 830 |
The Company incurred professional fees with a law firm, in which a Company's director is a partner, totaling $556,724 for the year ended September 30, 2004 ($385,862 in 2003 and $466,056 in 2002). These transactions were concluded in the normal course of operations, at the exchange amount.
CANADIAN GAAP 93
d) Earnings per common share
The following table reconciles the numerators and denominators of the basic and diluted earnings per share computations.
| | 2004 | 2003 | 2002 | ||||
|---|---|---|---|---|---|---|---|
| | $ | $ | $ | ||||
| Net earnings available to common shareholders | |||||||
| Basic | 44,460 | 28,617 | 20,868 | ||||
| Financial expenses relating to the convertible notes | 6,379 | — | — | ||||
| Net earnings available to common shareholders on a diluted basis | 50,839 | 28,617 | 20,868 | ||||
2004 | 2003 | 2002 | |||||
| Weighted average number of common shares | |||||||
| Weighted average number of common shares outstanding | 45,286,199 | 44,914,944 | 41,664,510 | ||||
| Effect of dilutive stock options | 820,872 | 472,599 | 660,970 | ||||
| Effect of dilutive equity component of purchase price | — | 220,449 | 202,020 | ||||
| Effect of dilutive convertible subordinated notes | 6,680,893 | — | — | ||||
| Adjusted weighted average number of common shares outstanding | 52,787,964 | 45,607,992 | 42,527,500 | ||||
| Number of common shares outstanding as at November 9, 2004. | 45,562,336 | ||||||
Options to purchase 283,000 common shares (754,100 for 2003 and 553,350 for 2002) were outstanding but were not included in the computation of diluted earnings per share as the exercise price of the options was greater than the average market price of the common shares. As of September 30, 2003, the subordinated notes convertible into 8,924,113 common shares had no effect on the diluted earnings per share. Since the trigger event occurred during the second, third and fourth quarters of the year ended September 30, 2004, the 8,924,113 common shares are included in the weighted average number of common shares outstanding for those periods.
19. FINANCIAL INFORMATION INCLUDED IN THE CONSOLIDATED STATEMENT OF CASH FLOWS
a) Changes in working capital items
| | 2004 | 2003 | 2002 | ||||
|---|---|---|---|---|---|---|---|
| | $ | $ | $ | ||||
| Accounts receivable | (27,748 | ) | 5,750 | 2,120 | |||
| Income taxes receivable | (3,752 | ) | (4,459 | ) | (388 | ) | |
| Inventories | (17,157 | ) | (411 | ) | (2,532 | ) | |
| Prepaid expenses and deposits | (654 | ) | (942 | ) | 401 | ||
| Accounts payable and accrued liabilities | 3,018 | 9,619 | 3,870 | ||||
| Income taxes payable | (4,051 | ) | 3,207 | 795 | |||
| (50,344 | ) | 12,764 | 4,266 | ||||
b) Cash flows relating to interest and income taxes of operating activities are as follows:
| | 2004 | 2003 | 2002 | |||
|---|---|---|---|---|---|---|
| | $ | $ | $ | |||
| Interest received | 1,031 | 1,427 | 787 | |||
| Interest paid | 6,122 | 342 | 242 | |||
| Income taxes paid | 23,599 | 12,417 | 7,672 |
94 CANADIAN GAAP
20. JOINT VENTURES
The Company's interest in the joint ventures is accounted for by the proportionate consolidation method. During fiscal 2004, the Company wrote off its investment in these joint ventures.
The following accounts represent the share of the Company in the joint ventures:
| | 2004 | 2003 | 2002 | |||||
|---|---|---|---|---|---|---|---|---|
| | $ | $ | $ | |||||
| Current assets | 122 | 217 | 190 | |||||
| Total assets | 168 | 649 | 606 | |||||
| Current liabilities | 312 | 393 | 248 | |||||
| Total liabilities | 343 | 422 | 273 | |||||
| Revenue | 906 | 659 | 725 | |||||
| Expenses | 1,361 | 765 | 771 | |||||
| Net loss | (455 | ) | (106 | ) | (46 | ) | ||
| Cash flows from: | ||||||||
| Operations | (31 | ) | 92 | (8 | ) | |||
| Financing | 2 | 4 | — | |||||
| Investment | — | (11 | ) | 10 | ||||
21. SEGMENTED INFORMATION
The Company considers that it operates in a single field of activity, the pharmaceutical industry, since its other activities do not account for a significant portion of segment assets. No customer represents more than 10% of the Company's revenue except for three customers, for which the sales represented 55.7% of revenue for the year ended September 30, 2004 (49.6% and 52.3% in 2003 and 2002) and are detailled as follows:
| | 2004 | 2003 | 2002 | |||
|---|---|---|---|---|---|---|
| | % | % | % | |||
| Customer A | 24.3 | 15.6 | 20.2 | |||
| Customer B | 18.3 | 18.6 | 18.8 | |||
| Customer C | 13.1 | 15.4 | 13.3 | |||
| 55.7 | 49.6 | 52.3 | ||||
Purchases from one supplier represent approximately 15% of the cost of goods sold for the year ended September 30, 2004 (26% in 2003 and 30% in 2002).
The Company purchases its inventory from third party manufacturers, many of whom are the sole source of products for the Company. The failure of such manufacturers to provide an uninterrupted supply of products could adversely impact the Company's ability to sell such products.
CANADIAN GAAP 95
The Company operates in the following geographic segments:
| | 2004 | 2003 | 2002 | |||||
|---|---|---|---|---|---|---|---|---|
| | $ | $ | $ | |||||
| Revenue | ||||||||
| Canada | ||||||||
| Domestic sales | 28,002 | 20,555 | 17,413 | |||||
| Foreign sales | — | — | — | |||||
| United States | ||||||||
| Domestic sales | 162,810 | 113,875 | 100,088 | |||||
| Foreign sales | 3,921 | — | — | |||||
| Europe | ||||||||
| Domestic sales | 43,988 | 40,429 | 13,870 | |||||
| Foreign sales | 4,846 | 4,531 | 1,696 | |||||
| Other | 225 | 152 | 108 | |||||
| 243,792 | 179,542 | 133,175 | ||||||
| Property, plant, equipment, intangible assets and goodwill | ||||||||
| Canada | 44,676 | 19,311 | 15,645 | |||||
| United States | 131,602 | 133,695 | 135,839 | |||||
| Europe | 265,431 | 138,530 | 55,093 | |||||
| Other | 38,653 | 35,994 | 23,423 | |||||
| 480,362 | 327,530 | 230,000 | ||||||
Revenue is attributed to geographical segments based on the sales country of origin.
22. FINANCIAL INSTRUMENTS
Currency risk
The Company is exposed to financial risk arising from fluctuation in foreign exchange rates and the degree of volatility of the rates. The Company does not use derivative instruments to reduce its exposure to foreign currency risk.
Fair value of the financial instruments on the balance sheet:
The estimated fair value of the financial instruments is as follows:
| | 2004 | 2003 | |||||||
|---|---|---|---|---|---|---|---|---|---|
| | Fair value | Carrying amount | Fair value | Carrying amount | |||||
| | $ | $ | $ | $ | |||||
| Assets | |||||||||
| Cash and cash equivalents | 22,063 | 22,063 | 37,886 | 37,886 | |||||
| Short-term investments | 15,922 | 15,922 | 133,112 | 133,112 | |||||
| Accounts receivable | 44,540 | 44,540 | 17,894 | 17,894 | |||||
| Investments in a private company | — | — | b | ) | 578 | ||||
| Note receivable | — | — | b | ) | 936 | ||||
| Other investments | — | — | 363 | 363 | |||||
| Liabilities | |||||||||
| Accounts payable and accrued liabilities | 47,985 | 47,985 | 43,791 | 43,791 | |||||
| Long-term debt | 162,674 | 111,981 | 154,283 | 109,055 | |||||
96 CANADIAN GAAP
The following methods and assumptions were used to calculate the estimated fair value of the financial instruments on the balance sheet.
a) Financial instruments valued at carrying amount
The estimated fair value of certain financial instruments shown on the balance sheet is equivalent to their carrying amount because they are realizable in the short-term or items whose carrying amount approximates the fair value. These financial instruments include cash and cash equivalents, short-term investments, accounts receivable, other investments and accounts payable and accrued liabilities.
b) Investments in a private company and note receivable
The fair value of investments in a private company and note receivable was not readily determinable.
c) Long-term debt
The fair value of long-term debt has been established by discounting the future cash flows at interest rates corresponding to those the Company would have obtained at that date for loans with similar maturity dates and terms. The fair value of the convertible subordinated notes is equivalent to the trading price at the end of the year. The fair value of the convertible subordinated notes include the portion reported under Equity Component of Convertible Debt of $24,238,899.
23. COMMITMENTS AND CONTINGENCIES
a) Commitments
The Company has entered into non-cancelable operating leases and service agreements expiring on different dates until September 30, 2009 for the rental of office space, automotive equipment and other equipment and for sales management services. One of the office space leases contains an escalation clause providing for payment of additional rent.
| | $ | |
|---|---|---|
| 2005 | 2,725 | |
| 2006 | 953 | |
| 2007 | 297 | |
| 2008 | 263 | |
| 2009 | 44 | |
| 4,282 | ||
The Company entered into an agreement with Nordmark Arzneimittel GmbH & Co to create a joint venture to develop patent-protected novel enzyme preparations. Under the terms of this agreement, the Company agreed to contribute up to a cumulative amount of $1,500,000 to the joint venture. As at September 30, 2004, a total amount of $600,000 ($100,000 in 2003) has been contributed.
b) Contingencies
The subsidiary Axcan Scandipharm has been named as a defendant in several legal proceedings related to the products line it markets under the name ULTRASE. Of the 12 lawsuits to date, Axcan Scandipharm was dismissed from one, nonsuited in another and settled ten. These lawsuits were filed and claims have been asserted against Axcan Scandipharm and certain other named defendants, including the enzyme manufacturer, stemming from allegations that, among other things, Axcan Scandipharm's enzyme products caused colonic strictures. At this time, it is difficult to predict if there will be other claims or their number and because of the young age of the patients involved, Axcan Scandipharm's product liability exposure for this issue in the United States will remain for a number of years. Axcan Scandipharm's insurance carriers have defended the lawsuits to date and Axcan expects them to continue to defend Axcan Scandipharm (to the extent of its product liability insurance) should other lawsuits be filed in the future.
In addition, the enzyme manufacturer and certain other companies have claimed a right to recover amounts paid defending and settling these claims as well as a declaration that Axcan Scandipharm and another named defendant must provide indemnification against future claims. This lawsuit is based on contractual and indemnity issues and the parties have agreed to settle their dispute through binding arbitration. The arbitration has commenced and the plaintiffs allege that the amount at issue may be in excess of $10,000,000. Axcan Scandipharm denies that such reimbursement is owed and has also responded with counterclaims against the plaintiffs.
As at September 30, 2004 and 2003, the Company has accrued $2,900,000 to cover any future settlements in connection with the indemnification claim and the lawsuits discussed above that may not be covered by, or exceed, applicable insurance proceeds. While the Company believes that the insurance coverage and provisions taken to date are adequate, an adverse determination of any present and future claims or of future claims could exceed insurance coverage and amounts currently accrued.
CANADIAN GAAP 97
c) Milestone payments
The agreements with QLT Phototherapeutics Inc. ("QLT") relating to the purchase of PHOTOFRIN provided for milestone payments to be made by Axcan to QLT that could reach a maximum of CDN$20,000,000 upon receipt of certain regulatory approvals for specific or additional indication for PHOTOFRIN or other conditions. Each milestone payment shall be made at the option of the Company either in cash or in Series B preferred shares or in a combination of cash and preferred shares provided that at least one-half of the milestone payable shall be paid in cash. During the years 2004, 2003 and 2000 CDN$5,000,000, CDN$5,000,000 and CDN$5,000,000 (US$3,919,417, US$3,646,973 and US$3,378,378) was paid by Axcan in cash upon receipt of regulatory approvals and was recorded in intangible assets.
The agreement to acquire the exclusive licence for North America, the European Union and Latin America to develop, manufacture and market ITAX provides for milestone payments for an amount of $20,000,000 upon regulatory submission and an amount of $45,000,000 upon regulatory approval. The Company will also pay royalties of 9% of net sales from the date of first commercial sale until the expiration of the patent and 6% for ten years then after.
d) Royalties
Net sales of certain products of the Company are subject to royalties payable to unrelated third parties.
In particular, the Company must pay a 6% royalty on net sales of ULTRASE and 5% royalty on the net sales of ADEK's respectively covered under agreements for the exclusive rights to market these products.
Axcan has to pay 5% of worldwide sales of PHOTOFRIN with a maximum of $500,000 per year and a maximum total aggregate of $3,108,245 until December 2007. Until September 30, 2004, an amount of $1,420,419 has been accounted for ($1,032,777 in 2003 and $753,134 in 2002). Axcan also has to pay 5% of net sales of PHOTOFRIN for use in the therapeutic treatment of cancer and 2% of net sales for other uses until December 2009.
Royalties amounting to $3,760,945, $4,387,092 and $3,731,113 respectively for years ended September 30, 2004, 2003 and 2002 were charged to earnings.
e) Licensing
During the year 2000, Axcan entered into a new licensing agreement to market a new generation of pancrelipase minitablets. As at September 30, 2004, the Company paid $3,500,000 in development fees, which is the total amount of development fees the Company agreed to pay. Axcan will pay royalties of 6% on the first $30,000,000 of annual sales and 5% on annual sales in excess of $30,000,000 subject to minimum royalty payments of $750,000, $1,000,000 and $1,500,000 in the first three years of the agreement, respectively. The product was launched in October 2003.
Axcan also entered into a licensing agreement with the Children's Hospital Research Foundation for a serie of sulfated derivatives of ursodeoxycholigic acid compounds" ("SUDCA"). Axcan has, until September 30, 2004, paid $814,000 in cash. The Company will also pay milestones for a maximum amount of $200,000 when SUDCA will be validated and a bonus when certain conditions will be meet; finally, Axcan will pay royalty based on sales.
In May 2002, the Company signed a co-development and license agreement with NicOx S.A. ("NicOx") for NCX-1000, a nitric oxide-donating ursodiol derivative, for the treatment of chronic liver diseases including portal hypertension and Hepatitis "C". Under the terms of this agreement, the Company has obtained from NicOx an exclusive license to commercialize NCX-1000 in Canada and Poland as well as an option to acquire the same exclusive rights for the United States market. The Company and NicOx will share the cost of the future development of NCX-1000 jointly through the completion of Phase II clinical studies. The Company will thereafter conduct the required Phase III clinical studies and be responsible for regulatory filings in the exclusively licensed territories. The Company will pay NicOx options or milestone payments totaling up to $17,000,000 at various stages of development. An amount of $2,000,000 has been paid in 2003. The Company also agreed to pay royalties of up to 12% on net sales of the product.
On October 10, 2002, the Company acquired from Gentium S.p.A., an Italian company, exclusive rights to develop and market in North America, a patented 4 gram rectal gel formulation of mesalamine (5-ASA) for the treatment of active distal ulcerative colitis. In return the Company will make milestone payments totaling approximately $1,500,000, the majority of which will be paid upon approval in the United States. An amount of approximately $200,000 has been paid in 2003. The Company will also pay a royalty of 4% on net sales for a ten-year period from product's launch.
On July 22, 2003, the Company acquired from Merz Pharmaceutical GmbH ("Merz") an exclusive licence to use, develop and submit for approval of injectable and oral granule formulations containing L-ornithine and L-aspartate. In consideration of the rights and licenses granted by Merz under this agreement, the Company shall pay a royalty of 6% of net sales or 4% of net sales if the Company develops any patentable invention or improvement and Merz incorporates such invention or improvement into its products.
f) Employee benefit plan
A subsidiary of the Company has a defined contribution plan (the "Plan") for its US employees. Participation is available to substantially all U.S. employees. Employees may contribute up to 15% of their gross pay and up to limits set by the U.S. Internal Revenue Service. During the year, the Board of Directors approved and the Company charged to earnings a contribution to the Plan totaling $268,757 ($319,871 in 2003 and $224,275 in 2002).
98 CANADIAN GAAP
24. STOCK-BASED COMPENSATION
The Company has elected to measure compensation costs related to awards of stock options using the intrinsic value based method of accounting. No stocks-based employee compensation cost is reflected in net earnings. The Company is also required to make pro-forma disclosures of net earnings, basic earnings per share and diluted earnings per share as if the fair-value-based method of accounting had been applied.
The average weighted fair value of granted stock options was $6.80, $5.41 and $6.96 for the years ended September 30, 2004, 2003 and 2002.
The fair value of granted stock options was estimated with the Black-Scholes model of evaluation of the price of options using an expected life of six years, a risk-free interest rate of 4.17%, 4.43% and 4.93% for the years ended September 30, 2004, 2003 and 2002, a volatility of 44% in 2004, 46% in 2003 and 47% in 2002 and no expected dividends.
The Black-Scholes model, used by the Company to calculate option values, as well as other currently accepted option valuation models, were developed to estimate the fair value of freely tradable, fully transferable options without vesting restrictions, which significantly differ from the Company's stock option awards. These models also require highly subjective assumptions, including future stock price volatility and expected time until exercise, which greatly affect the calculated values. Accordingly, management believes that these models do not necessarily provide a reliable single measure of the fair value of the Company's stock option awards.
Accordingly, the Company's net earnings, basic earnings per share and diluted earnings per share would have been reduced for the years ended September 30, 2004, 2003 and 2002 on a pro-forma basis, as follows:
| | 2004 | 2003 | 2002 | |||||||||
|---|---|---|---|---|---|---|---|---|---|---|---|---|
| | Actual | Pro-forma | Actual | Pro-forma | Actual | Pro-forma | ||||||
| | $ | $ | $ | $ | $ | $ | ||||||
| Net earnings | 44,460 | 40,174 | 28,617 | 25,248 | 21,188 | 18,699 | ||||||
| Basic earnings per share | 0.98 | 0.89 | 0.64 | 0.56 | 0.51 | 0.45 | ||||||
| Diluted earnings per share | 0.96 | 0.88 | 0.63 | 0.55 | 0.50 | 0.44 | ||||||
CANADIAN GAAP 99
Axcan Pharma is committed to the highest standards in its business ethics and practices. We believe our continued success is dependent on the trust of all our stakeholders and as such, we expect the Company's directors, officers and employees to be dedicated to preserving that trust. Integrity, transparency and excellence are the pillars on which we base our Business Ethics and Conduct Code as well as our approach to corporate governance practices.
The Corporate Governance and Nominating Committee has monitored closely the various changes in the Canadian and American regulatory environments and where applicable, amended its governance practices to align. The Committee believes that Axcan has adopted a proactive approach in meeting and exceeding the "best practices" in evolving corporate governance requirements and guidelines. Axcan complies with the Toronto Stock Exchange (TSX) Guidelines and where applicable, with the recent Canadian Securities Administrators (CSA) proposals, the NASDAQ Corporate Governance Rules and the U.S. Securities and Exchange Commission (SEC) rules and regulations subsequent to the Sarbanes-Oxley Act of 2002.
In fiscal 2004, the Committee made the following governance improvements:
- •
- Enhanced the Company's governance processes, reflecting best North American practices and the feedback from the Board Effectiveness Survey;
- •
- Reviewed the size and composition of the Board, for an appropriate balance of expertise, resulting in the nomination of two new directors, and the re-alignment of the membership of the Board Committees;
- •
- Clarified the line of communication from security holders to the independent directors, for which one director has now taken responsibility;
- •
- Established an employee whistleblower mechanism for the Business Ethics and Conduct Code;
- •
- Ensured that the Company's Business Ethics and Conduct Code, and the main governance policies (Mandates, Disclosure Policy, etc.) are available to all shareholders, through the Company Web site at www.axcan.com.
 Colin R. Mallet Chairman of the Corporate Governance and Nominating Committee |
BOARD OF DIRECTORS
The Board of Directors assumes ultimate responsibility for the stewardship of the Company and carries out its mandate directly and through considering recommendations it receives from the three Committees of the Board and from management.
Management is responsible for the day-to-day operations of the company, and pursues Board-approved strategic initiatives within the context of authorized business, capital plans and corporate policies. Management is expected to report to the Board on a regular basis on short-term results and long-term development activities. The Board has adopted a written mandate, which details its specific responsibility (please visit www.axcan.com).
COMMITTEES
Axcan's Board of Directors has three Committees: the Audit Committee, the Compensation Committee and the Corporate Governance and Nominating Committee. All members of the Committees are independent directors. These Committees allow directors to share responsibility, to delegate powers, and to devote the necessary resources to a particular issue or area. Board Committees were created to achieve the objectives of the Board efficiently and utilize Board members' skills to the best advantage of the Company.
100
AUDIT COMMITTEE
The principal duties of the Audit Committee are to review annual and interim financial statements and all legally required public disclosure documents containing financial information prior to their approval by the directors; review the planned scope of the examination of the annual consolidated financial statements by the auditors of the Company; and review the adequacy of the systems of internal accounting and audit controls established by the Company. The Audit Committee is also responsible for overseeing reporting on internal control and management information systems. Commencing with the 2005 fiscal year, the Audit Committee, or in the absence of the full Committee, the Chairman of the Audit Committee, is charged with pre-approving all engagements of the Company's auditors for audit-related and permitted non-audit services. All members of the Audit Committee are independent directors.
The current members of the Audit Committee are:
- •
- Louis P. Lacasse, Chairman
- •
- Dr. Claude Sauriol
- •
- Michael M. Tarnow
COMPENSATION COMMITTEE
The primary responsibility of the Compensation Committee is to evaluate the performance of the CEO and the other named executive officers and to review their respective objectives and compensation. The Compensation Committee is also responsible for the compensation policies and benefits granted to employees of the Company and recommends Company guidelines including the establishment of categories of executives, pay scales, performance bonus guidelines, benefits and standardized grants of options for each category of executives.
The Compensation Committee determines the compensation of executive officers based on industry data with the goal to attract, retain and motivate key executive officers to ensure the long-term success of the Company. The compensation of senior executive officers is reviewed each year and includes the three following components: base salary, annual bonus based on performance and grant of stock options. The grant of stock options has been an important element in the development of the Company's compensation policy and the Company's Stock Option Plan has been adopted to attract and retain employees by offering an incentive measure that permits participation in the Company's long-term development. All members of the Compensation Committee are independent directors.
The current members of the Compensation Committee are:
- •
- Jacques Gauthier, Chairman
- •
- Louis P. Lacasse
- •
- Colin R. Mallet
CORPORATE GOVERNANCE AND NOMINATING COMMITTEE
The Corporate Governance and Nominating Committee is responsible for developing and fostering a healthy corporate governance structure by working with the Chairman of the Board of Directors in adopting procedures to ensure effective Board operation, ensuring that functions and roles delegated to Committees are appropriately carried out and that results are clearly reported to the Board as well as identifying and approaching qualified candidates to ascertain their interest in joining the Board. All members of the Corporate Governance and Nominating Committee are independent directors.
The current members of the Corporate Governance and Nominating Committee are:
- •
- Colin R. Mallet, Chairman
- •
- Dr. E. Rolland Dickson
- •
- Daniel Labrecque
- •
- Michael M. Tarnow
FURTHER INFORMATION
Axcan's Business Ethics and Conduct Code, Committees' Charters and further details on the Company's approach to corporate governance can be found in the 2004 Management Proxy Circular or by visiting www.axcan.com.
101
 |
- 1
- DR. E. ROLLAND DICKSON
Director since 2004
Member of the Corporate Governance and Nominating Committee
Independent
Dr. E. Rolland Dickson, 70, of Mantorville, Minnesota, U.S.A., has served on Axcan's Board of Directors since 2004. He is Emeritus Mary Lowell Leary and has served in senior leadership positions at the Mayo Clinic, including as Section Head in the Division of Gastroenterology. Among other activities, Dr. Dickson has served on the Executive Committee of Mayo's Institutional Research Committee and was Chair of the Fiscal Committee. He also was Professor of Medicine at Mayo Medical School/Mayo Clinic and is Emeritus Medical Director of Development at the Mayo Foundation where he has served since 1993. In 1999, Dr. Dickson was appointed to the Board of Trustees of the Mayo Foundation.
Dr. Dickson currently serves on the Board of Directors of NeoRx Pharmaceutical Corporation and of Pathway Corporation and is a member of the Scientific Advisory Board of Baxter International. He is President of Mayo Clinic Stiftung in Frankfurt, Germany and Chairman of the Board of Directors of the A.J. and Sigismunda Charitable Foundation.
- 2
- JACQUES GAUTHIER
Director since 1995
Chairman of the Compensation Committee
Independent
Jacques Gauthier, 77, of Town Mount-Royal, Quebec, has served on the Board of Directors of Axcan Pharma Inc. since December 1995. He has held various senior management positions, both in Canada and abroad, with Upjohn Laboratories Inc. and Upjohn International Inc., predecessor corporations to Pharmacia Corporation. In 1984, Mr. Gauthier joined BioMéga/Boehringer Ingelheim Research Inc. and served as President and General Manager until 1996.
Mr. Gauthier is currently an advisor to management of the Montreal Clinical Research Institute (IRCM) and serves on the Board of Directors of a variety of medical and pharmaceutical companies and associations.
- 3
- LÉON F. GOSSELIN
Director since 1993
Chairman of the Board
Not Independent
Léon F. Gosselin, 59, of Mont-St-Hilaire, Quebec, has served as Chairman of the Board, President, and Chief Executive Officer of Axcan Pharma Inc. since 1993. He is the co-founder of Interfalk Canada Inc., the predecessor of Axcan Pharma Inc., and has held various positions within the pharmaceutical industry including Assistant General Manager at Nordic Laboratories Inc., which is now part of Aventis S.A. He has also served as a consultant in the pharmaceutical industry. Mr. Gosselin holds a Bachelor's degree in Biochemistry and a Master's in business administration (M.B.A.) from the University of Sherbrooke.
- 4
- DANIEL LABRECQUE
Director since 2003
Member of the Corporate Governance and Nominating Committee
Independent
Daniel Labrecque, 48, of Montreal, Quebec, has served on the Board of Directors of Axcan Pharma Inc. since August 2003. He began his career in 1977 as Auditor at Raymond, Chabot, Martin, Paré, then held various positions at the Royal Bank of Canada, the Mercantile Bank of Canada, the National Bank of Canada, Lévesque Beaubien Geoffrion, Schroder Canada and Lazard Canada. In April 2002, Mr. Labrecque joined Rothschild where he now acts as President and Chief Executive Officer of its Canadian operations.
Mr. Labrecque is also Chairman of the Canadian INSEAD Foundation and member of the International Council of INSEAD, as well as Director of the C.D. Howe Institute and Director of La Fondation de l'Ecole Nationale de Cirque.
- 5
- LOUIS P. LACASSE
Director since 1995
Chairman of the Audit Committee and Member of the Compensation Committee
Independent
Louis P. Lacasse, 48, of Montreal, Quebec, has served on the Board of Directors of Axcan Pharma Inc. since December 1995. He is President of GeneChem Management Inc., an organization that manages Biotechnology Venture Capital funds. Prior to joining GeneChem in April 1997, Mr. Lacasse was Vice President of Healthcare and Bio-technology of SOFINOV, the venture capital subsidiary of Caisse de depot et placement du Québec. During his ten years with SOFINOV and the Caisse de dépôt et placement du Québec, Mr. Lacasse was involved in numerous investments in small and medium-sized businesses in high technology industries such as biotechnology, software and telecommunications. He was also responsible for setting up a network of regional venture capital funds throughout Quebec and for investments in funds both in Canada and the U.S. He has been a member of the Board of Directors of many private and public companies including BioChem Pharma Inc.
Mr. Lacasse is presently a Director of four publicly traded companies; Targeted Genetics, Methylgene, Warnex-Pharma and Chromos Molecular Systems, and of four privately held companies.
102
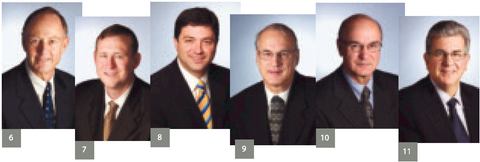
- 6
- COLIN R. MALLET
Director since 1995
Chairman of the Corporate Governance and Nominating Committee Member of the Compensation Committee
Independent
Colin R. Mallet, 61, of Vancouver, British Columbia, has served on the Board of Directors of Axcan Pharma Inc. since December 1995. He has worked in senior executive positions in the pharmaceutical industry in Europe, North America and southeast Asia. He was President and Chief Executive Officer of Sandoz Canada Inc. (now Novartis) for seven years and is a past Chair of the Canadian Association of Research-Based Pharmaceutical companies.
He is currently a Director of three other public pharmaceutical companies; AnorMED Inc., Methylgene Inc. and Migenix Inc., and is Chair of the Corporate Governance Committees of each of these companies.
- 7
- DAVID W. MIMS
Director since 2000
Not Independent
David W. Mims, 42, of Birmingham, Alabama, U.S.A., has served on the Board of Directors of Axcan Pharma Inc. since March 2000. He has served as senior accountant at a major accounting firm before joining Russ Pharmaceuticals, Inc. in 1987 as Accounting Services Manager. In 1991, Mr. Mims helped found Scandipharm, Inc. and served the Corporation as Vice President, Chief Operating Officer, and Chief Financial Officer. He resigned from Scandipharm, Inc. in March 1998, to join Cebert Pharmaceuticals, Inc. as Executive Vice President and Chief Operating Officer. Mr. Mims joined Axcan in 2000, shortly after the Company acquired Scandipharm, and presently serves as Executive Vice President and Chief Operating Officer.
He is a Director of the University of Alabama, Birmingham (UAB) Research Foundation and a member of the American Institute of Certified Public Accountants and the Alabama Society of Certified Public Accountants.
- 8
- FRANÇOIS PAINCHAUD
Director since 1995
Secretary
Not Independent
François Painchaud, 41, of St-Lambert, Quebec, has served on the Board of Directors of Axcan Pharma Inc. as Secretary and Director since December 1995. He is a partner in Léger Robic Richard, lawyers, patent and trademark agents, which specializes in business law and intellectual property, including patent law. Mr. Painchaud has oriented his practice towards the field of commercial law with particular emphasis on licensing of intellectual property and technology transfers.
Mr. Painchaud serves on the Board of several privately held companies and is also a Trustee and Vice President of the Licensing Executive Society (U.S.A. and Canada Inc.).
- 9
- DR. CLAUDE SAURIOL
Director since 1993
Member of the Audit Committee
Independent
Dr. Claude Sauriol, 63, of Laval, Quebec, has served on the Board of Directors of Axcan Pharma Inc. since 1993. He is a founder of Biopharm Laboratory Inc. where he was President and Chief Executive Officer for more than 25 years. He also served Axcan Pharma Inc. as Vice President of Research and Development where, for three years, he was responsible for regulatory affairs and clinical research.
He is currently a Director of Algorithme Pharma Inc. and is a member of the Audit and Compensation Committees of the company.
- 10
- JEAN SAURIOL
Director since 1993
Independent
Jean Sauriol, 58, of Laval, Quebec, has served on the Board of Directors of Axcan Pharma Inc. since 1993.
He is a co-founder of Biopharm Laboratory where he worked for more than 25 years and was Vice President of Manufacturing at Axcan Pharma until 1996. He also served as President and Chief Executive Officer of Althin-Biopharm Inc. for six years (an Althin-Axcan joint venture, sold in 2001).
- 11
- MICHAEL M. TARNOW
Director since 2000
Member of the Corporate Governance and Nominating Committee Member of the Audit Committee
Independent
Michael M. Tarnow, 60, of Boston, Massachusetts, U.S.A., has served on the Board of Directors of Axcan Pharma Inc. since August 2000. He has held various positions with Merck & Co., Inc. including President and Chief Executive Officer of Merck Frosst Canada from 1990 to 1994. From 1995 to 2000, he was President and Chief Executive Officer of Creative BioMolecules, a biotechnology corporation.
Currently, he is Chairman of Entremed and MediGene Inc, two publicly-traded companies, and serves on the Board of Directors of a number of private companies including Caprion Pharmaceuticals and Xenon Pharmaceuticals.
103
- 1
- LÉON F. GOSSELIN
President and Chief Executive Officer
Mr. Léon F. Gosselin has served as Chairman of the Board, President, and Chief Executive Officer of Axcan Pharma Inc. since 1993. He is the co-founder of Interfalk Canada Inc., the predecessor of Axcan Pharma, and has held various positions within the pharmaceutical industry including Assistant General Manager at Nordic Laboratories Inc. which is now part of Aventis S.A. He has also served as a consultant in the pharmaceutical industry. Mr. Gosselin holds a Bachelor's degree in Biochemistry and a Master's in Business Administration (M.B.A.) from the University of Sherbrooke.
- 2
- DAVID W. MIMS
Executive Vice President and Chief Operating Officer
Mr. David W. Mims obtained a Bachelor of Science degree in Accounting from Auburn University in 1985 and has been licensed in the State of Alabama as a Certified Public Accountant since July 1987. He served as senior accountant at a major accounting firm before joining Russ Pharmaceuticals, Inc. in 1987 as Accounting Services Manager. In 1991, Mr. Mims helped found Scandipharm Inc. and served the company as Vice President, Chief Operating Officer and Chief Financial Officer. Here signed from Scandipharm Inc. in March 1998 to join Cebert Pharmaceuticals Inc. as Executive Vice President and Chief Operating Officer. Mr. Mims serves as a member of the Axcan Pharma Board of Directors, Executive Vice President, and Chief Operating Officer. He joined Axcan in 2000, shortly after the Company acquired Scandipharm Inc. He is a Director of the University of Alabama at Birmingham (UAB) Research Foundation, and a member of the American Institute of Certified Public Accountants and the Alabama Society of Certified Public Accountants.
- 3
- DR. NORBERT CLAVEILLE
General Director
Axcan Pharma S.A.
Prior to joining Axcan in 2001, Dr. Norbert Claveille was President of the French division of Beaufour-Ipsen Group. Dr. Claveille obtained an M.D., and is an Honors graduate of the Faculté de Médecine Necker-Enfants Malades in Paris, France. In addition, he holds a Diploma from the National Institute of Marketing of the Paris Business School. Dr. Claveille began his career in 1973 as general practitioner. Since 1977, he has held various positions in the pharmaceutical industry with companies such as Servier Laboratories, Bottu-Human Pharm, and Beaufour-Ipsen.
- 4
- DR. PATRICK COLIN
Vice President
Research and Development
Dr. Patrick Colin obtained a Bachelor of Pharmacy degree from the University of Montreal in 1980 and a Ph.D. in Pharmaceutical Sciences from the University of Montreal in 1987. He began his career at Bristol Myers Squibb in 1987 where he worked in various clinical research positions. He is a member of several scientific organizations and an active member of the Québec Order of Pharmacists. Dr. Colin joined Axcan in 1994 as Director of Clinical Research and was subsequently appointed Vice President, Clinical Research in 2000, and Vice President, Research and Development, in October 2003. Dr. Colin is now responsible for all aspects of drug development, including pre-clinical toxicology, pharmaceutical development and Phase I to III clinical research. Dr. Colin has published extensively in several areas of drug development, and is a guest professor at both the University of Montreal and Laval University in Québec City.
- 5
- MARTHA DONZE
Vice President
Corporate Administration
Ms. Martha Donze obtained a Bachelor's degree from the University of Alabama in 1975. She has more than 30 years of experience in human resources and communications serving with Alabama Power Company, Avondale Mills, and Employers Insurance. Ms. Donze is a member of the U.S. Society of Human Resource Management and the Society of Human Resource Global Forum, an international human resources organization. She joined Axcan (Scandipharm) in May 1993.
- 6
- JEAN-FRANÇOIS HÉBERT
Vice President
Manufacturing Operations
Mr. Jean-François Hébert joined Axcan Pharma as Vice President, Manufacturing Operations in 2004 with 15 years of successful international business experience in the pharmaceutical and food industries. Formerly with Abbott Laboratories in Italy, France, and Canada, and with Saputo Group in Canada, Mr. Hébert has held various positions in engineering and operations management, project management, and product development. A member of the Ordre des Ingénieurs du Québec (OIQ) and the International Society of Pharmaceutical Engineering, Mr. Hébert holds a Master's in Business Administration (M.B.A.) degree from Concordia University in Montreal and a Bachelor's degree in Mechanical Engineering from the University of Quebec in Trois-Rivières. He is fluent in French, English, and Italian.
104
- 7
- DR. FRANÇOIS MARTIN
Senior Vice President
Scientific Affairs
Dr. François Martin obtained a Ph.D. degree in Medicine from the University of Montreal in 1964, a Gastroenterology Specialist Certificate in 1968, and a Royal College of Physicians of Canada Fellowship in 1972. Before joining Axcan in 1997 he held a full professorship in Medicine at the University of Montreal and he has practiced gastroenterology at St-Luc Hospital in Montreal since 1970. Dr. Martin has published more than 50 research articles and received the Academic and Scientific Excellence Award from the Québec Association of Gastroenterologists in 1995. While working at Axcan, he has continued to hold the position of Honorary Professor of Medicine at the University of Montreal, and he practices gastroenterology one day per week at the Downtown Gastroenterology Clinic.
- 8
- MICHAEL J. PASTERNAK
Vice President
Sales Operations North America
Mr. Michael J. Pasternak joined Axcan (Scandipharm) in the United States in 1991 as a founding member of the initial sales team. He has since served Axcan as Field Sales Manager, Zone Manager, Director of Sales and Business Operations — East, and currently, Vice President, Sales Operations, North America. Mr. Pasternak has dedicated 32 years to a professional career in pharmaceutical sales and sales management having also worked with Boehringer Ingelheim, Johnson & Johnson, and McNeil. He is a graduate of Quinnipiac College in southern Connecticut and holds a Bachelor of Science degree in Science.
- 9
- JOCELYN PELCHAT
Senior Vice President
International Commercial Operations
Mr. Jocelyn Pelchat obtained a Bachelor of Science degree in Chemistry and Biochemistry from the University of Sherbrooke in 1981 and a Master of Science degree in Radiobiology and Nuclear Medicine from the same institution in 1983. He also obtained a Master's in Business Administration (M.B.A.) from the Université du Québec à Montréal in 2003. He began his career at Roussel Canada as medical research associate. Mr. Pelchat held various positions of increasing responsibility in clinical research, sales and marketing as well as project and portfolio management with Jouveinal, Rhône Poulenc Rorer, Sandoz as well as Hoechst Marion Roussel now known as Sanofi-Aventis. In 1999, Mr. Pelchat was the Director of Business Development at the Société générale de financement du Québec, a diversified investment fund, prior to joining Axcan in November 2000 as Vice President, Business Development and Export Operations. In June 2004, Mr. Pelchat was appointed Senior Vice President, International Commercial Operations at Axcan.
- 10
- PAUL M. SMITH
Vice President, Sales North America
Now with more than a decade of service to the Company, Mr. Paul M. Smith joined Axcan (Scandipharm) in 1991 as part of the initial sales team in the United States. In addition to his early role as a Pharmaceutical Sales Representative and his current role as Vice President, Sales, North America, Mr. Smith has also served Axcan as Field Sales Manager, Zone Manager, and Director of Sales and Business Operations-West. He began his pharmaceutical career in 1987 with Russ Pharmaceuticals, Inc., the Birmingham, Alabama-based company that was later acquired by Ethyl Corporation of Richmond, Virginia. Mr. Smith holds a Bachelor of Arts degree in Business Administration from the University of Phoenix in Arizona.
- 11
- Richard Tarte
Vice President, Business Development and General Counsel
Mr. Richard Tarte, obtained a Bachelor of Law degree from the University of Montreal in 1986 and a Master's in Business Administration (M.B.A.) from l'Institut Européen d'Administration des Affaires (INSEAD) in France. He was admitted to the Quebec Bar in 1988. Before joining Axcan in June 2001 as General Counsel, he was In-House Counsel at the Société générale de financement du Québec, a diversified investment fund. He was also previously a partner with Coudert Frères, an international law firm where he practiced business law for 10 years.
105
- 12
- Michael E. Theil
Vice President, Marketing
North American Operations and Global Project Leader-ITAX
Mr. Michael E. Thiel has more than 14 years of Pharmaceutical Marketing, Sales, and Management experience in the North American and European markets. He holds a Bachelor of Arts degree in psychology from Stephen F. Austin State University and a Master's in Business Administration (M.B.A.) from Southern Nazarene University in Okla-homa City where he was a member of the Delta Mu Delta National Business Honor Society. Mr. Thiel also completed the Competitive Marketing Strategy Program at the Wharton School, University of Pennsylvania. Before entering the pharmaceutical industry he served in the U.S. Army as an officer and pilot. Mr. Thiel began his career at Axcan in July 2000 as Director of Marketing, U.S. In May 2002, he assumed the role of Director of Marketing, North America, and he was later appointed Vice President of Marketing, North American Commercial Operations. In June 2004, Mr. Thiel assumed an additional role as Global Leader for the launch of ITAX.
- 13
- JEAN VÉZINA
Vice President, Finance and Chief Financial Officer
Mr. Jean Vézina obtained a Bachelor's degree in Accounting from the University of Sherbrooke in 1977 and is a member of the Quebec Order of Certified General Accountants. Mr. Vézina began his career as Auditor at Raymond, Chabot, Martin, Paré, then held various financial positions with private and public companies prior to joining Axcan in 1992. Mr. Vézina completed the Executive Development Course at the McGill International Executive Institute in 2004.
106
CORPORATE INFORMATION
CORPORATE OFFICE
Axcan Pharma Inc.
597 Laurier Blvd.
Mont-Saint-Hilaire, Quebec
Canada J3H 6C4
Telephone: (450) 467-5138 or 1 (800) 565-3255
Fax: (450) 464-9979
www.axcan.com
STOCK LISTINGS
Toronto Stock Exchange (TSX) under the symbol "AXP".
NASDAQ National Market under the symbol "AXCA".
NUMBER OF SHARES
As at November 9, 2004, there were 45,562,336 common shares outstanding.
DIVIDEND POLICY
The Company currently does not pay dividends on its common shares, and has no plans to do so in the foreseeable future, preferring to reinvest its cash to enhance the Company's growth.
TRANSFER AGENT AND REGISTRAR
Our transfer agent, Computershare Trust Company of Canada, can assist you with a variety of shareholder related services, including changes of address and lost share certificates:
Computershare Trust Company of Canada
1500 University Street, Suite 700
Montreal, Quebec
Canada H3A 3S8
Telephone: 1 (800) 332-0095
www.computershare.com
INDEPENDENT AUDITORS
Raymond Chabot Grant Thornton, LLP
Chartered Accountants
ANNUAL MEETING OF SHAREHOLDERS
The Annual General Meeting of Shareholders of Axcan Pharma Inc. will be held at 10:00 A.M. on Thursday, February 17, 2005, at:
Centre Mont-Royal
2200 Mansfield
ontreal, Quebec
Canada H3A 3R8
Telephone: (514) 844-2000
An archived version of the web cast will be available on Axcan's web site after the Annual Meeting.
INVESTOR RELATIONS
Julie M. Thibodeau
Manager, Investor Relations
Axcan Pharma Inc.
597 Laurier Blvd.
Mont-Saint-Hilaire, Quebec
Canada J3H 6C4
Telephone: (450) 467-5138 or 1 (800) 565-3255
Fax: (450) 464-9979
E-mail: jthibodeau@axcan.com
Axcan files all mandatory information with Canadian securities commissions and the U.S. Securities and Exchange Commission. This information is available from the Company upon request.
Archives of financial and shareholder information are available on Axcan's web site at www.axcan.com
Pour obtenir une version française du rapport annuel, veuillez communiquer avec le service des relations avec les investisseurs.
Design: Spirale Communication Marketing Inc.
AXCAN PHARMA INC.
©2005-All rights reserved
Printed in Canada
The names BENTYL, BENTYLOL, CANASA, CARAFATE, DELURSAN, FLUTTER, HELIZIDE, HEPENAX, ITAX, LACTEOL, MODULON, PANZYTRAT, PHOTOFRIN, PROCTOSEDYL, SALOFALK, SCANDICAL, SCANDISHAKE, SULCRATE, TAGAMET, URSO 250, URSO Forte, URSO DS, ULTRASE and VIOKASE appearing in this annual report are trademarks of Axcan and its subsidiaries. The name ADEKs is a registered trademark of Carlsson-Rensselaer Corporation and CORTENEMA is a registered trademark of Reid Rowell Inc.SM Service marks are used under license by Axcan Scandipharm Inc.
GastroenterologyThe medical specialty concerned with the
function and disorders of the gastrointestinal tract and other associated
organs, including the intestines, liver, pancreas and stomach.
EXHIBIT 99.1
ANNUAL REPORT 2004
NOTES TO CONSOLIDATED FINANCIAL STATEMENTS September 30 Amounts in the tables are stated in thousands of U.S. dollars, except share related data.
NOTES TO CONSOLIDATED FINANCIAL STATEMENTS September 30 Amounts in the tables are stated in thousands of U.S. dollars, except share related data.