Item 1: Report to Shareholders| Global Technology Fund | June 30, 2005 |
The views and opinions in this report were current as of June 30, 2005. They are not guarantees of performance or investment results and should not be taken as investment advice. Investment decisions reflect a variety of factors, and the managers reserve the right to change their views about individual stocks, sectors, and the markets at any time. As a result, the views expressed should not be relied upon as a forecast of the fund’s future investment intent. The report is certified under the Sarbanes-Oxley Act of 2002, which requires mutual funds and other public companies to affirm that, to the best of their knowledge, the information in their financial reports is fairly and accurately stated in all material respects.
REPORTS ON THE WEB
Sign up for our E-mail Program, and you can begin to receive updated fund reports and prospectuses online rather than through the mail. Log in to your account at troweprice.com for more information.
Fellow Shareholders
After rallying last fall, global technology stocks struggled in the first half of 2005. Despite signs of a steady economic recovery, rising energy prices, higher short-term interest rates, and pockets of global weakness dampened investor enthusiasm. Most of the major market indices were either flat or declined slightly for the six-month period. The small-cap Russell 2000 Index posted a -1.25% return compared with -0.81% for the Standard & Poor’s 500 Index and - -3.64% for the Dow Jones Industrial Average.
| PERFORMANCE COMPARISON |
| | | |
| Periods Ended 6/30/05 | 6 Months | 12 Months |
| Global Technology Fund | 0.18% | 2.99% |
| MSCI AC World Index-Information | | |
| Technology | -4.55 | -2.49 |
Your fund finished the 6- and 12-month periods ended June 30, 2005, with gains of 0.18% and 2.99%, respectively. Results for both periods were ahead of the MSCI AC World Index–Information Technology, which measures the performance of tech stocks in various international markets. Stock selection was responsible for most of our favorable performance versus the benchmark. In six out of the last seven years, we have seen science and technology stocks decline in the early months of the year then surge in the second half. (The only exception was the year 2000, when the Nasdaq Composite peaked early in March followed by the Internet collapse in the fall.) Tech stocks’ behavior in the first half of this year has followed historic precedent, and we hope a rebound will occur in the second half—although there is no guarantee that the pattern of recent years will be repeated, despite attractive tech stock valuations.
MARKET ENVIRONMENT
After finishing 2004 near their highest levels of the year, the broad markets retreated during the first six months of 2005 with technology stocks faring poorly. The daily volatility and lack of a definitive direction reflected limited investor conviction. More often than not, an encouraging economic statistic gave the market a momentary boost in the morning, but worries about inflation or concerns about a slowing U.S. economy drove it down by the close. Outside the U.S., major European countries—Germany, France, Italy—showed signs of slowing economic growth. Oil prices rose to more than $60 a barrel and seem resistant to falling despite OPEC’s efforts to increase production. In addition, the lack of success in stabilizing Iraq and the possibility of more terrorist attacks in Europe and the United States added to the unsettled investment environment.
Not all the news was discouraging. Consolidation among technology companies continued, adding a slight lift to technology stocks. Adobe Systems’ $3.4 billion acquisition of Macromedia Inc. and Sun Microsystems’ $4.1 billion purchase of Storage Technology are among the larger deals so far this year. Another positive factor for global tech stocks is that the supply chain is in balance. Just-in-time manufacturing and the advent of new technologies allow companies to control and track their inventory of parts, materials, and finished products. As a result, the amount of inventory relative to monthly sales has declined steadily; much of last year’s large inventories of semiconductors have been absorbed. Demand for chips used in personal computers and consumer products, such as digital television sets and DVD players, has expanded, and the demand from wireless-handset makers and other communications companies continues to be strong.
PORTFOLIO REVIEW
During the past six months, relatively strong performance in semiconductors, communications equipment, and Internet stocks were offset to a great extent by weakness in computers and peripherals and information technology (IT) services. Our underweight position in IT aided relative results versus the benchmark. Stock selection was another positive factor, particularly an underweight in IBM, which declined as the company recorded first-quarter revenues below estimates when it failed to meet its growth targets due to weakness in Europe. We were also overweight in Infosys Technologies, which outperformed relative to the group. (Please refer to our portfolio of investments for a complete listing of the portfolio’s holdings and the amount each represents of the portfolio.)
Stock selection in software was also a key contributor to fund performance as we were overweight in Red Hat, I-Flex Solutions, video game company Activision, and virus scanning company McAfee. Mercury Interactive was a notable exception in the group as the stock detracted from results. Red Hat was notable in that the company reported a strong increase in first-quarter revenue thanks to heavy demand for its open-source operating system software—although earnings could be trimmed going forward by the strengthening U.S. dollar. The portfolio was overweight in media, another positive, and stock selection there enhanced relative performance. Our Internet holdings, including Google and CNET Networks, contributed strongly. Google did well when higher advertising revenues drove a rise in the company’s net income. On the negative side of the ledger, eBay and Chinese Internet services provider Sina were disappointments during the period.

Also worth noting were our positions in select telecommunications equipment stocks. Stock selection here offset the drag from underweighting the group, which did well overall. Corning helped relative results largely due to strength in its telecom equipment and LCD sales, although our failure to own Motorola was a negative.
The fund remains broadly diversified across the principal segments of the science and technology sector. Stocks of semiconductors, software, hardware, telecom equipment, IT services, and media companies accounted for virtually all of the portfolio, with telecom services constituting only 1%.
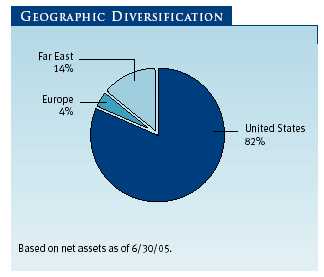
The fund’s 25 largest holdings, which included Dell, Microsoft, Nokia, Intel, and Samsung Electronics, represented 74.3% of net assets. U.S. stocks accounted for 82% of net assets at the end of June, up slightly from six months earlier. Our allocation to European shares remained steady at 4%, and the balance was invested in the Far East.
OUTLOOK
It is important for investors to understand why global investing in general makes sense in today’s world. The first good reason is choice; when investors have the flexibility to invest globally, they have more investment choices available than if they invest only in the U.S. market. If the companies with the best growth prospects in a particular industry are located in a foreign country, a global investment policy makes that choice possible. Another excellent reason is the expansion of opportunities for investors. Some of the world’s fastest-growing companies are now located beyond our borders. Industries that have matured domestically are still in the early stages of development in other countries, particularly in emerging growth markets throughout Asia, Eastern Europe, and Latin America. In addition, global investing can temper volatility because the world’s equities markets are not typically in sync with one another; some markets can be rising while others are declining.
Despite some challenging conditions—a stronger dollar, rising oil prices, higher interest rates, restrained corporate spending, and increased geopolitical risks—we believe there are ample opportunities among global technology stocks for the remainder of the year. If the historic pattern prevails, these stocks will exhibit seasonal strength during the summer and fall. With large hoards of cash and attractively valued targets, the pace of consolidation could accelerate.
There are, however, some concerns for the tech sector worth mentioning. The supply chain could be disrupted as customers verify compliance with new European environmental regulations limiting the use of lead in electronics manufacturing. With operating margins at all-time highs, companies will rely more heavily on sales growth to expand their earnings. Growing revenues could be difficult if companies remain circumspect about IT spending. While many corporations may be reluctant to commit to capital expenditures that would increase capacity, they may be more inclined to spend on technology-based products and services that allow them to innovate and squeeze more profits out of their revenues.
Despite the challenges in business spending, adoption of digital technology continues at a rapid clip. Consumers are enthusiastically embracing the rollouts of new products from high-definition televisions to cell phones with video capability. Consumers are exchanging dial-up Internet connections for broadband and generating demand for new and upgraded communications equipment.
On a macroeconomic level, worker productivity is strong, which bodes well for the overall strength of the global economy. Inflation remains benign, particularly within the developed markets. Profits are modestly increasing, and stock valuations are relatively attractive. Liquidity among countries and companies is good, and interest rates are still low in historical terms. Our focus remains on companies with growing market share and strong management teams that are positioned to benefit from the opportunities present in an improving economic and IT spending environment.
As always, we appreciate your continued support.
Respectfully submitted,

Robert N. Gensler
President of the fund and chairman of its Investment Advisory Committee
July 22, 2005
The committee chairman has day-to-day responsibility for managing the portfolio and works with committee members in developing and executing the fund’s investment program.
RISKS OF INVESTING IN THE FUND
Funds that invest only in specific industries will experience greater volatility than funds investing in a broad range of industries. Technology stocks, historically, have experienced unusually wide price swings, both up and down. The potential for wide variation in performance reflects the special risks common to companies in the rapidly changing field of technology. For example, products or services that at first appear promising may not prove commercially successful and may become obsolete quickly. Earnings disappointments and intense competition for market share can result in sharp price declines. Funds that invest in foreign securities are subject to additional risks, including the risks of political and economic instability, and currency fluctuations.
GLOSSARY
MSCI AC World Index—Information Technology: Measures the performance of technology stocks in 23 global markets, including the U.S. The index is listed in local currency and includes reinvestment of dividends.
Price/earnings ratio: Calculated by dividing a stock’s price per share by the company’s earnings per share for the past 12 months or by expected earnings for the coming year.
Russell 2000 Index: Tracks the stocks of the 2,000 smallest companies on a total-return basis.
S&P 500 Index: A market cap-weighted index of 500 widely held stocks often used as a proxy for the stock market. Performance is reported on a total return basis.
Nasdaq Composite: Measures the performance of all issues listed in the Nasdaq stock market, except for rights, warrants, units, and convertible debentures.
| TWENTY-FIVE LARGEST HOLDINGS | |
| | Percent of |
| | Net Assets |
| | 6/30/05 |
| |
| Dell | 9.9% |
| Microsoft | 6.3 |
| Nokia | 4.9 |
| Intel | 4.5 |
| Samsung Electronics | 4.1 |
| IBM | 3.6 |
| Infosys Technologies | 3.1 |
| Red Hat | 2.8 |
| Texas Instruments | 2.7 |
| Maxim Integrated Products | 2.6 |
| Google | 2.5 |
| Activision | 2.5 |
| Analog Devices | 2.5 |
| Xilinx | 2.4 |
| Cisco Systems | 2.4 |
| Oracle | 2.1 |
| Corning | 2.1 |
| QUALCOMM | 2.0 |
| Yahoo! | 1.8 |
| ChoicePoint | 1.7 |
| Mercury Interactive | 1.7 |
| I-Flex Solutions | 1.6 |
| LM Ericsson | 1.5 |
| CNET Networks | 1.5 |
| Open Solutions | 1.5 |
| Total | 74.3% |
| MAJOR PORTFOLIO CHANGES | |
| Listed in descending order of size | |
| |
| 6 Months Ended 6/30/05 | |
| |
| Largest Purchases | Largest Sales |
| |
| Microsoft | Xilinx |
| IBM* | Red Hat |
| Intel | Texas Instruments |
| Nokia | International Game Technology** |
| Xilinx | Corning |
| eBay | WMS Industries** |
| Cisco Systems | LM Ericsson |
| Open Solutions* | QUALCOMM |
| Texas Instruments | Samsung Electronics |
| LM Ericsson | Intel |
| |
| 12 Months Ended 6/30/05 | |
| |
| Largest Purchases | Largest Sales |
| |
| Microsoft | Microsoft |
| Xilinx | Red Hat |
| Nokia* | International Game Technology** |
| Red Hat | Samsung Electronics |
| IBM* | LM Ericsson |
| Texas Instruments* | Cisco Systems |
| Intel | VERITAS Software |
| Samsung Electronics | QUALCOMM |
| Analog Devices* | eBay |
| Maxim Integrated Products* | Xilinx |
| * | Position added |
| ** | Position eliminated |
Table may not include holdings that were both purchased and sold within the specified time period.
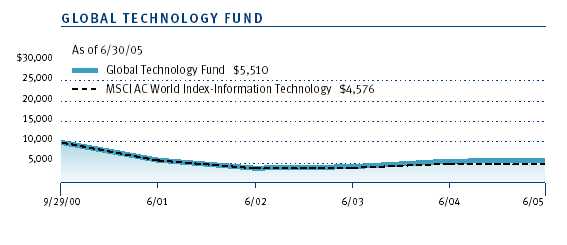
This chart shows the value of a hypothetical $10,000 investment in the fund over the past 10 fiscal year periods or since inception (for funds lacking 10-year records). The result is compared with benchmarks, which may include a broad-based market index and a peer group average or index. Market indexes do not include expenses, which are deducted from fund returns as well as mutual fund averages and indexes.
| AVERAGE ANNUAL COMPOUND TOTAL RETURN |
This table shows how the fund and its benchmarks would have performed if their actual (or cumulative) returns for the periods shown had been earned at a constant rate.
| | | Since |
| | | Inception |
| Periods Ended 6/30/05 | 1 Year | 9/29/00 |
| |
| Global Technology Fund | 2.99% | -11.79% |
| |
| MSCI AC World Index-Information Technology | -2.49 | -15.17 |
| |
| Current performance may be higher or lower than the quoted past performance, which can- |
| not guarantee future results. Share price, principal value, and return will vary, and you may |
| have a gain or loss when you sell your shares. For the most recent month-end performance |
| information, please visit our Web site (troweprice.com) or contact a T. Rowe Price repre- |
| sentative at 1-800-225-5132. | | |
| Average annual total return figures include changes in principal value, reinvested dividends, and capital |
| gain distributions. Returns do not reflect taxes that the shareholder may pay on fund distributions or |
| the redemption of fund shares. When assessing performance, investors should consider both short- and |
| long-term returns. | | |
As a mutual fund shareholder, you may incur two types of costs: (1) transaction costs such as redemption fees or sales loads and (2) ongoing costs, including management fees, distribution and service (12b-1) fees, and other fund expenses. The following example is intended to help you understand your ongoing costs (in dollars) of investing in the fund and to compare these costs with the ongoing costs of investing in other mutual funds. The example is based on an investment of $1,000 invested at the beginning of the most recent six-month period and held for the entire period.
Actual Expenses
The first line of the following table (“Actual”) provides information about actual account values and actual expenses. You may use the information in this line, together with your account balance, to estimate the expenses that you paid over the period. Simply divide your account value by $1,000 (for example, an $8,600 account value divided by $1,000 = 8.6), then multiply the result by the number in the first line under the heading “Expenses Paid During Period” to estimate the expenses you paid on your account during this period.
Hypothetical Example for Comparison Purposes
The information on the second line of the table (“Hypothetical”) is based on hypothetical account values and expenses derived from the fund’s actual expense ratio and an assumed 5% per year rate of return before expenses (not the fund’s actual return). You may compare the ongoing costs of investing in the fund with other funds by contrasting this 5% hypothetical example and the 5% hypothetical examples that appear in the shareholder reports of the other funds. The hypothetical account values and expenses may not be used to estimate the actual ending account balance or expenses you paid for the period.
Note: T. Rowe Price charges an annual small-account maintenance fee of $10, generally for accounts with less than $2,000 ($500 for UGMA/UTMA). The fee is waived for any investor whose T. Rowe Price mutual fund accounts total $25,000 or more, accounts employing automatic investing, and IRAs and other retirement plan accounts that utilize a prototype plan sponsored by T. Rowe Price (although a separate custodial or administrative fee may apply to such accounts). This fee is not included in the accompanying table. If you are subject to the fee, keep it in mind when you are estimating the ongoing expenses of investing in the fund and when comparing the expenses of this fund with other funds.
You should also be aware that the expenses shown in the table highlight only your ongoing costs and do not reflect any transaction costs, such as redemption fees or sales loads. Therefore, the second line of the table is useful in comparing ongoing costs only and will not help you determine the relative total costs of owning different funds. To the extent a fund charges transaction costs, however, the total cost of owning that fund is higher.
| T. ROWE PRICE GLOBAL TECHNOLOGY FUND |
| | | | |
| | Beginning | Ending | Expenses Paid |
| | Account Value | Account Value | During Period* |
| | 1/1/05 | 6/30/05 | 1/1/05 to 6/30/05 |
| Actual | $1,000.00 | $1,001.80 | $7.45 |
| Hypothetical (assumes 5% | | | |
| return before expenses) | 1,000.00 | 1,017.36 | 7.50 |
| | | | |
| * Expenses are equal to the fund’s annualized expense ratio for the six-month period (1.50%), multi- |
| plied by the average account value over the period, multiplied by the number of days in the most |
| recent fiscal half year (181) divided by the days in the year (365) to reflect the half-year period. |
Unaudited
| FINANCIAL HIGHLIGHTS | For a share outstanding throughout each period |
| | 6 Months | | Year | | | | | | | | 9/29/00 |
| | | Ended | | Ended | | | | | | | | Through |
| | 6/30/05** | | 12/31/04 | | 12/31/03 | | 12/31/02 | | 12/31/01 | | 12/31/00 |
| NET ASSET VALUE | | | | | | | | | | | | |
| Beginning of period | $ | 5.50 | $ | 4.99 | $ | 3.33 | $ | 4.75 | $ | 7.43 | $ | 10.00 |
|
|
| |
| Investment activities | | | | | | | | | | | | |
| Net investment | | | | | | | | | | | | |
| income (loss) | | (0.02) | | (0.02) | | (0.05)* | | (0.05)* | | (0.06)* | | (0.01) |
| Net realized and | | | | | | | | | | | | |
| unrealized gain (loss) | | 0.03 | | 0.53 | | 1.71 | | (1.37) | | (2.62) | | (2.56) |
|
|
| Total from | | | | | | | | | | | | |
| investment activities | | 0.01 | | 0.51 | | 1.66 | | (1.42) | | (2.68) | | (2.57) |
|
|
| |
| NET ASSET VALUE | | | | | | | | | | | | |
| End of period | $ | 5.51 | $ | 5.50 | $ | 4.99 | $ | 3.33 | $ | 4.75 | $ | 7.43 |
|
|
| |
| |
| Ratios/Supplemental Data | | | | | | | | | | |
| Total return^ | | 0.18% | | 10.22% | | 49.85%* | | (29.89)%* | | (36.07)%* | | (25.70)% |
| Ratio of total expenses to | | | | | | | | | | | | |
| average net assets | | 1.50%† | | 1.50% | | 1.50%* | | 1.50%* | | 1.50%* | | 1.37%† |
| Ratio of net investment | | | | | | | | | | | | |
| income (loss) to average | | | | | | | | | | | | |
| net assets | | (0.84)%† | | (0.45)% | | (1.17)%* | | (1.15)%* | | (1.08)%* | | (0.25)%† |
| Portfolio turnover rate | | 85.8%† | | 137.4 % | | 151.4% | | 211.4% | | 189.2% | | 123.6%† |
| Net assets, end of period | | | | | | | | | | | | |
| (in thousands) | $ | 104,288 | $ | 91,766 | $ | 84,764 | $ | 55,145 | $ | 84,120 | $ | 131,168 |
| ^ | Total return reflects the rate that an investor would have earned on an investment in the fund during each period, |
| | assuming reinvestment of all distributions. |
| * | Excludes expenses in excess of a 1.50% contractual expense limitation in effect through April 30, 2007. |
| † | Annualized |
| ** Per share amounts calculated using average shares outstanding method. |
The accompanying notes are an integral part of these financial statements.
Unaudited
| PORTFOLIO OF INVESTMENTS (1) | Shares | Value |
| (Cost and value in $ 000s) | | |
| COMMON STOCKS 95.8% | | |
| |
| HARDWARE 15.7% | | |
| Enterprise Hardware 13.4% | | |
| Dell * | 262,000 | 10,352 |
| EMC * | 110,000 | 1,508 |
| HOYA (JPY) | 9,000 | 1,034 |
| Nitto Denko (JPY) | 18,000 | 1,024 |
| | | 13,918 |
| Imaging 1.2% | | |
| Global Imaging Systems * | 40,000 | 1,274 |
| | | 1,274 |
| Supply Chain & Electronic Manufacturing 1.1% | | |
| CDW | 20,000 | 1,142 |
| | | 1,142 |
| Total Hardware | | 16,334 |
| |
| IT SERVICES 12.2% | | |
| IT Services 7.4% | | |
| Accenture, Class A * | 35,000 | 794 |
| IBM | 50,000 | 3,710 |
| Infosys Technologies (INR) | 60,000 | 3,230 |
| | | 7,734 |
| Processors 4.8% | | |
| Certegy | 15,000 | 573 |
| ChoicePoint * | 45,000 | 1,802 |
| Jack Henry & Associates | 60,000 | 1,099 |
| Open Solutions * | 77,000 | 1,564 |
| | | 5,038 |
| Total IT Services | | 12,772 |
| |
| MEDIA 11.7% | | |
| Internet 11.7% | | |
| CNET Networks * | 135,000 | 1,585 |
| eBay * | 40,000 | 1,320 |
| Google, Class A * | 9,000 | 2,647 |
| Monster Worldwide * | 45,000 | 1,291 |
| NCsoft (KRW) * | 16,000 | 1,184 |
| NHN (KRW) * | 6,000 | 616 |
| Sina * | 55,000 | 1,535 |
| The Knot * | 22,000 | 146 |
| Yahoo! * | 55,000 | 1,906 |
| Total Media | | 12,230 |
| |
| SEMICONDUCTORS 18.9% | | |
| Analog Semiconductors 6.9% | | |
| Analog Devices | 70,000 | 2,612 |
| Linear Technology | 25,000 | 917 |
| Maxim Integrated Products | 70,000 | 2,675 |
| National Semiconductor | 45,000 | 991 |
| | | 7,195 |
| Digital Semiconductors 12.0% | | |
| Altera * | 50,000 | 991 |
| Intel | 180,000 | 4,691 |
| Microchip Technology | 50,000 | 1,481 |
| Texas Instruments | 100,000 | 2,807 |
| Xilinx | 100,000 | 2,550 |
| | | 12,520 |
| Total Semiconductors | | 19,715 |
| |
| SOFTWARE 21.2% | | |
| Applications Software 1.1% | | |
| RightNow Technologies * | 91,000 | 1,094 |
| | | 1,094 |
| Consumer Software 3.5% | | |
| Activision * | 160,000 | 2,643 |
| THQ * | 34,000 | 995 |
| | | 3,638 |
| Infrastructure Software 11.2% | | |
| Microsoft | 265,000 | 6,583 |
| Oracle * | 165,000 | 2,178 |
| Red Hat * | 225,000 | 2,947 |
| | | 11,708 |
| Systems Software 5.4% | | |
| I-Flex Solutions (INR) | 90,000 | 1,633 |
| McAfee * | 45,000 | 1,178 |
| Mercury Interactive * | 45,000 | 1,726 |
| VERITAS Software * | 45,000 | 1,098 |
| | | 5,635 |
| Total Software | | 22,075 |
| |
| TELECOM EQUIPMENT 15.0% | | |
| Wireless Equipment 9.4% | | |
| LM Ericsson (SEK) | 500,000 | 1,599 |
| Nokia ADR | 120,000 | 1,997 |
| Nokia OYJ (EUR) | 185,000 | 3,078 |
| QUALCOMM | 63,000 | 2,079 |
| UNOVA * | 40,000 | 1,065 |
| | | 9,818 |
| Wireline Equipment 5.6% | | |
| Cisco Systems * | 130,000 | 2,484 |
| Corning * | 130,000 | 2,161 |
| Juniper Networks * | 45,000 | 1,133 |
| | | 5,778 |
| Total Telecom Equipment | | 15,596 |
| |
| TELECOM SERVICES 1.1% | | |
| Wireless-International 1.1% | | |
| America Movil ADR, Series L | 20,000 | 1,192 |
| Total Telecom Services | | 1,192 |
| Total Common Stocks (Cost $92,098) | | 99,914 |
| | | |
| PREFERRED STOCKS 4.1% | | |
| | | |
| Samsung Electronics (KRW) | 13,000 | 4,247 |
| Total Preferred Stocks (Cost $3,826) | | 4,247 |
| | | |
| SHORT-TERM INVESTMENTS 1.2% | | |
| | | |
| Money Market Fund 1.2% | | |
| T. Rowe Price Government Reserve Investment Fund, 2.94% #† | 1,274,181 | 1,274 |
| Total Short-Term Investments (Cost $1,274) | | 1,274 |
| | | |
| Total Investments in Securities | | |
| 101.1% of Net Assets (Cost $97,198) | $ | 105,435 |
| (1) | Denominated in U.S. dollars unless |
| | otherwise noted |
| # | Seven-day yield |
| * | Non-income producing |
| † | Affiliated company – See Note 4 |
| ADR | American Depository Receipts |
| EUR | Euro |
| INR | Indian rupee |
| JPY | Japanese yen |
| KRW | South Korean won |
| SEK | Swedish krona |
The accompanying notes are an integral part of these financial statements.
Unaudited
| STATEMENT OF ASSETS AND LIABILITIES |
| (In thousands except shares and per share amounts) |
| Assets | | |
| Investments in securities, at value | | |
| Affiliated companies (cost $1,274) | $ | 1,274 |
| Non-affiliated companies (cost $95,924) | | 104,161 |
|
|
| Total investments in securities | | 105,435 |
| Dividends receivable | | 11 |
| Receivable for investment securities sold | | 2,657 |
| Receivable for shares sold | | 166 |
| Other assets | | 353 |
|
|
| Total assets | | 108,622 |
|
|
| |
| Liabilities | | |
| Investment management fees payable | | 79 |
| Payable for investment securities purchased | | 3,828 |
| Payable for shares redeemed | | 40 |
| Due to affiliates | | 28 |
| Other liabilities | | 359 |
|
|
| Total liabilities | 4,334 |
|
|
| |
| NET ASSETS | $ | 104,288 |
|
|
| Net Assets Consist of: | | |
| Undistributed net investment income (loss) | $ | (388) |
| Undistributed net realized gain (loss) | | (85,330) |
| Net unrealized gain (loss) | | 8,237 |
| Paid-in-capital applicable to 18,930,975 shares of | | |
| $0.0001 par value capital stock outstanding; | | |
| 1,000,000,000 shares authorized | | 181,769 |
|
|
| |
| NET ASSETS | $ | 104,288 |
|
|
| |
| NET ASSET VALUE PER SHARE | $ | 5.51 |
|
|
The accompanying notes are an integral part of these financial statements.
Unaudited
| STATEMENT OF OPERATIONS |
| ($ 000s) |
| | | 6 Months |
| | | Ended |
| | | 6/30/05 |
| Investment Income (Loss) | | |
| Income | | |
| Dividend (net of foreign taxes of $27) | $ | 305 |
| Securities lending | | 3 |
|
|
| Total income | | 308 |
|
|
| Expenses | | |
| Investment management | | 354 |
| Shareholder servicing | | 194 |
| Custody and accounting | | 66 |
| Registration | | 21 |
| Prospectus and shareholder reports | | 17 |
| Legal and audit | | 6 |
| Proxy and annual meeting | | 3 |
| Directors | | 3 |
| Miscellaneous | | 4 |
| Reductions/repayments of fees and expenses | | |
| Investment management fees (waived) repaid | | 28 |
|
|
| Total expenses | | 696 |
|
|
| Net investment income (loss) | | (388) |
|
|
| |
| Realized and Unrealized Gain (Loss) | | |
| Net realized gain (loss) | | |
| Securities | | 2,177 |
| Foreign currency transactions | | (8) |
|
|
| Net realized gain (loss) | | 2,169 |
|
|
| Change in net unrealized gain (loss) on securities | | (1,177) |
|
|
| Net realized and unrealized gain (loss) | | 992 |
|
|
| |
| INCREASE (DECREASE) IN NET | | |
| ASSETS FROM OPERATIONS | $ | 604 |
|
|
The accompanying notes are an integral part of these financial statements.
Unaudited
| STATEMENT OF CHANGES IN NET ASSETS |
| ($ 000s) |
| | | 6 Months | | Year |
| | | Ended | | Ended |
| | | 6/30/05 | | 12/31/04 |
| |
| Increase (Decrease) in Net Assets | | | | |
| Operations | | | | |
| Net investment income (loss) | $ | (388) | $ | (386) |
| Net realized gain (loss) | | 2,169 | | 12,244 |
| Change in net unrealized gain (loss) | | (1,177) | | (3,485) |
|
|
| Increase (decrease) in net assets from operations | | 604 | | 8,373 |
|
|
| |
| Capital share transactions * | | | | |
| Shares sold | | 23,414 | | 21,141 |
| Shares redeemed | | (11,496) | | (22,512) |
|
|
| Increase (decrease) in net assets from capital | | | | |
| share transactions | | 11,918 | | (1,371) |
|
|
| |
| Net Assets | | | | |
| Increase (decrease) during period | | 12,522 | | 7,002 |
| Beginning of period | | 91,766 | | 84,764 |
|
|
| |
| End of period | $ | 104,288 | $ | 91,766 |
|
|
| (Including undistributed net investment income (loss) | | | | |
| of $(388) at 6/30/05 and $0 at 12/31/04) | | | | |
| |
| *Share information | | | | |
| Shares sold | | 4,417 | | 4,135 |
| Shares redeemed | | (2,172) | | (4,439) |
|
|
| Increase (decrease) in shares outstanding | | 2,245 | | (304) |
The accompanying notes are an integral part of these financial statements.
Unaudited
| NOTES TO FINANCIAL STATEMENTS |
NOTE 1 - SIGNIFICANT ACCOUNTING POLICIES
T. Rowe Price Global Technology Fund, Inc. (the fund) is registered under the Investment Company Act of 1940 (the 1940 Act) as a diversified, open-end management investment company. The fund commenced operations on September 29, 2000. The fund seeks to provide long-term capital growth.
The accompanying financial statements were prepared in accordance with accounting principles generally accepted in the United States of America, which require the use of estimates made by fund management. Fund management believes that estimates and security valuations are appropriate; however actual results may differ from those estimates, and the security valuations reflected in the financial statements may differ from the value the fund receives upon sale of the securities.
Valuation The fund values its investments and computes its net asset value per share at the close of the New York Stock Exchange (NYSE), normally 4 p.m. ET, each day that the NYSE is open for business. Equity securities listed or regularly traded on a securities exchange or in the over-the-counter market are valued at the last quoted sale price or, for certain markets, the official closing price at the time the valuations are made, except for OTC Bulletin Board securities, which are valued at the mean of the latest bid and asked prices. A security that is listed or traded on more than one exchange is valued at the quotation on the exchange determined to be the primary market for such security. Listed securities not traded on a particular day are valued at the mean of the latest bid and asked prices for domestic securities and the last quoted sale price for international securities.
Investments in mutual funds are valued at the mutual fund’s closing net asset value per share on the day of valuation.
Other investments, including restricted securities, and those for which the above valuation procedures are inappropriate or are deemed not to reflect fair value are stated at fair value as determined in good faith by the T. Rowe Price Valuation Committee, established by the fund’s Board of Directors.
Most foreign markets close before the close of trading on the NYSE. If the fund determines that developments between the close of a foreign market and the close of the NYSE will, in its judgment, materially affect the value of some or all of its portfolio securities, which in turn will affect the fund’s share price, the fund will adjust the previous closing prices to reflect the fair value of the securities as of the close of the NYSE, as determined in good faith by the T. Rowe Price Valuation Committee, established by the fund’s Board of Directors. A fund may also fair value securities in other situations, such as when a particular foreign market is closed but the fund is open. In deciding whether to make fair value adjustments, the fund reviews a variety of factors, including developments in foreign markets, the performance of U.S. securities markets, and the performance of instruments trading in U. S. markets that represent foreign securities and baskets of foreign securities. The fund uses outside pricing services to provide it with closing market prices and information used for adjusting those prices. The fund cannot predict when and how often it will use closing prices and when it will adjust those prices to reflect fair value. As a means of evaluating its fair value process, the fund routinely compares closing market prices, the next day’s opening prices in the same markets, and adjusted prices.
Currency Translation Assets, including investments, and liabilities denominated in foreign currencies are translated into U.S. dollar values each day at the prevailing exchange rate, using the mean of the bid and asked prices of such currencies against U.S. dollars as quoted by a major bank. Purchases and sales of securities, income, and expenses are translated into U.S. dollars at the prevailing exchange rate on the date of the transaction. The effect of changes in foreign currency exchange rates on realized and unrealized security gains and losses is reflected as a component of security gains and losses.
Rebates and Credits Subject to best execution, the fund may direct certain security trades to brokers who have agreed to rebate a portion of the related brokerage commission to the fund in cash. Commission rebates are included in realized gain on securities in the accompanying financial statements and totaled $12,000 for the six months ended June 30, 2005. Additionally, the fund earns credits on temporarily uninvested cash balances at the custodian that reduce the fund’s custody charges. Custody expense in the accompanying financial statements is presented before reduction for credits.
Investment Transactions, Investment Income, and Distributions Income and expenses are recorded on the accrual basis. Dividends received from mutual fund investments are reflected as dividend income; capital gain distributions are reflected as realized gain/loss. Dividend income and capital gain distributions are recorded on the ex-dividend date. Investment transactions are accounted for on the trade date. Realized gains and losses are reported on the identified cost basis.
Distributions to shareholders are recorded on the ex-dividend date. Income distributions are declared and paid on an annual basis. Capital gain distributions, if any, are declared and paid by the fund, typically on an annual basis.
NOTE 2 - INVESTMENT TRANSACTIONS
Consistent with its investment objective, the fund engages in the following practices to manage exposure to certain risks or enhance performance. The investment objective, policies, program, and risk factors of the fund are described more fully in the fund’s prospectus and Statement of Additional Information.
Emerging Markets At June 30, 2005, approximately 12% of the fund’s net assets were invested in securities of companies located in emerging markets. Future economic or political developments could adversely affect the liquidity or value, or both, of such securities.
Securities Lending The fund lends its securities to approved brokers to earn additional income. It receives as collateral cash and U.S. government securities valued at 102% to 105% of the value of the securities on loan. Cash collateral is invested in a money market pooled trust managed by the fund’s lending agent in accordance with investment guidelines approved by fund management. Collateral is maintained over the life of the loan in an amount not less than the value of loaned securities, as determined at the close of fund business each day; any additional collateral required due to changes in security values is delivered to the fund the next business day. Although risk is mitigated by the collateral, the fund could experience a delay in recovering its securities and a possible loss of income or value if the borrower fails to return the securities. Securities lending revenue recognized by the fund consists of earnings on invested collateral and borrowing fees, net of any rebates to the borrower and compensation to the lending agent. At June 30, 2005, there were no securities on loan.
Other Purchases and sales of portfolio securities, other than short-term securities, aggregated $52,087,000 and $40,236,000, respectively, for the six months ended June 30, 2005.
NOTE 3 - FEDERAL INCOME TAXES
No provision for federal income taxes is required since the fund intends to continue to qualify as a regulated investment company under Subchapter M of the Internal Revenue Code and distribute to shareholders all of its taxable income and gains. Federal income tax regulations differ from generally accepted accounting principles; therefore, distributions determined in accordance with tax regulations may differ in amount or character from net investment income and realized gains for financial reporting purposes. Financial reporting records are adjusted for permanent book/tax differences to reflect tax character. Financial records are not adjusted for temporary differences. The amount and character of tax-basis distributions and composition of net assets are finalized at fiscal year-end; accordingly, tax-basis balances have not been determined as of June 30, 2005.
The fund intends to retain realized gains to the extent of available capital loss carryforwards. As of December 31, 2004, the fund had $87,489,000 of unused capital loss carryforwards, of which $53,907,000 expire in 2009, and $33,582,000 expire in 2010.
At June 30, 2005, the cost of investments for federal income tax purposes was $97,198,000. Net unrealized gain aggregated $8,237,000 at period-end, of which $11,191,000 related to appreciated investments and $2,954,000 related to depreciated investments.
NOTE 4 - FOREIGN TAXES
The fund is subject to foreign income taxes imposed by certain countries in which it invests. Foreign income taxes are accrued by the fund as a reduction of income.
Gains realized upon disposition of certain Indian securities held by the fund are subject to capital gains tax in India, payable prior to repatriation of sale proceeds. The tax is computed on net realized gains, and realized losses in excess of gains may be carried forward eight years to offset future gains. In addition, the fund accrues a deferred tax liability for net unrealized gains on Indian securities when applicable. At June 30, 2005, the fund had no deferred tax liability, and $563,000 of capital loss carryforwards that expire in 2013, and $513,000 that expire in 2014.
NOTE 5 - RELATED PARTY TRANSACTIONS
The fund is managed by T. Rowe Price Associates, Inc. (the manager or Price Associates), a wholly owned subsidiary of T. Rowe Price Group, Inc. The investment management agreement between the fund and the manager provides for an annual investment management fee, which is computed daily and paid monthly. The fee consists of an individual fund fee, equal to 0.45 % of the fund’s average daily net assets, and a group fee. The group fee rate is calculated based on the combined net assets of certain mutual funds sponsored by Price Associates (the group) applied to a graduated fee schedule, with rates ranging from 0.48% for the first $1 billion of assets to 0.29% for assets in excess of $160 billion. Prior to May 1, 2005, the maximum group fee rate in the graduated fee schedule had been 0.295% for assets in excess of $120 billion. The fund’s group fee is determined by applying the group fee rate to the fund’s average daily net assets. At June 30, 2005, the effective annual group fee r ate was 0.31%.
The fund is also subject to a contractual expense limitation through April 30, 2007. During the limitation period, the manager is required to waive its management fee and reimburse the fund for any expenses, excluding interest, taxes, brokerage commissions, and extraordinary expenses, that would otherwise cause the fund’s ratio of total expenses to average net assets (expense ratio) to exceed its expense limitation of 1.50% . The fund is required to repay the manager for expenses previously reimbursed and management fees waived to the extent the fund’s net assets have grown or expenses have declined sufficiently to allow repayment without causing the fund’s expense ratio to exceed its expense limitation. However, no repayment will be made more than three years after the date of any reimbursement or waiver or later than April 30, 2009. Pursuant to this agreement, at June 30, 2005, management fees waived in the amount of $102,000 remain subject to repayment by the fund.
In addition, the fund has entered into service agreements with Price Associates and two wholly owned subsidiaries of Price Associates (collectively, Price). Price Associates computes the daily share price and maintains the financial records of the fund. T. Rowe Price Services, Inc., provides shareholder and administrative services in its capacity as the fund’s transfer and dividend disbursing agent. T. Rowe Price Retirement Plan Services, Inc., provides subaccounting and recordkeeping services for certain retirement accounts invested in the fund. For the six months ended June 30, 2005, expenses incurred pursuant to these service agreements were $42,000 for Price Associates, $146,000 for T. Rowe Price Services, Inc., and $1,000 for T. Rowe Price Retirement Plan Services, Inc. The total amount payable at period end pursuant to these service agreements is reflected as due to affiliates in the accompanying financial statements.
The fund may invest in the T. Rowe Price Reserve Investment Fund and the T. Rowe Price Government Reserve Investment Fund (collectively, the Reserve Funds), open-end management investment companies managed by Price Associates and affiliates of the fund. The Reserve Funds are offered as cash management options to mutual funds, trusts, and other accounts managed by Price Associates and/or its affiliates, and are not available for direct purchase by members of the public. The Reserve Funds pay no investment management fees. During the six months ended June 30, 2005, dividend income from the Reserve Funds totaled $18,000, and the value of shares of the Reserve Funds held at June 30, 2005 and December 31, 2004 was $1,274,000 and $423,000, respectively.
As of June 30, 2005, T. Rowe Price Group, Inc. and/or its wholly owned subsidiaries owned 199,621 shares of the fund, representing 1.1% of the fund’s net assets.
| INFORMATION ON PROXY VOTING POLICIES, PROCEDURES, AND RECORDS |
A description of the policies and procedures used by T. Rowe Price funds and portfolios to determine how to vote proxies relating to portfolio securities is available in each fund’s Statement of Additional Information, which you may request by calling 1-800-225-5132 or by accessing the SEC’s Web site, www.sec.gov. The description of our proxy voting policies and procedures is also available on our Web site, www.troweprice.com. To access it, click on the words “Company Info” at the top of our homepage for individual investors. Then, in the window that appears, click on the “Proxy Voting Policy” navigation button in the top left corner.
Each fund’s most recent annual proxy voting record is available on our Web site and through the SEC’s Web site. To access it through our Web site, follow the directions above, then click on the words “Proxy Voting Record” at the bottom of the Proxy Voting Policy page.
| HOW TO OBTAIN QUARTERLY PORTFOLIO HOLDINGS |
The fund files a complete schedule of portfolio holdings with the Securities and Exchange Commission for the first and third quarters of each fiscal year on Form N-Q. The fund’s Form N-Q is available electronically on the SEC’s Web site (www.sec.gov); hard copies may be reviewed and copied at the SEC’s Public Reference Room, 450 Fifth St. N.W., Washington, DC 20549. For more information on the Public Reference Room, call 1-800-SEC-0330.
| APPROVAL OF INVESTMENT MANAGEMENT AGREEMENT |
On March 2, 2005, the fund’s Board of Directors unanimously approved the investment advisory contract (“Contract”) between the fund and its investment manager, T. Rowe Price Associates, Inc. (“Manager”). The Board considered a variety of factors in connection with its review of the Contract, also taking into account information provided by the Manager during the course of the year, as discussed below:
Services Provided by the Manager
The Board considered the nature, quality, and extent of the services provided to the fund by the Manager. These services included, but were not limited to, management of the fund’s portfolio and a variety of activities related to portfolio management. The Board also reviewed the background and experience of the Manager’s senior management team and investment personnel involved in the management of the fund. The Board concluded that it was satisfied with the nature, quality, and extent of the services provided by the Manager.
Investment Performance of the Fund
The Board reviewed the fund’s average annual total return over the 1- and 3-year periods as well as the fund’s year-by-year returns and compared these returns to previously agreed upon comparable performance measures and market data, including those supplied by Lipper and Morningstar, which are independent providers of mutual fund data. On the basis of this evaluation and the Board’s ongoing review of investment results, the Board concluded that the fund’s performance was satisfactory.
Costs, Benefits, Profits, and Economies of Scale
The Board reviewed detailed information regarding the revenues received by the Manager under the Contract and other benefits that the Manager (and its affiliates) may have realized from its relationship with the fund, including research received under “soft dollar” agreements. The Board also received information on the estimated costs incurred and profits realized by the Manager and its affiliates from advising T. Rowe Price mutual funds, as well as estimates of the gross profits realized from managing the fund in particular. The Board concluded that the Manager’s profits were reasonable in light of the services provided to the fund. The Board also considered whether the fund or other funds benefit under the fee levels set forth in the Contract from any economies of scale realized by the Manager. Under the Contract, the fund pays a fee to the Manager composed of two components—a group fee rate based on the aggregate assets of certain T. Rowe Price mutual funds (including the fund) that declines at certain asset levels, and an individual fund fee rate that is assessed on the assets of the fund. The Board concluded that an additional breakpoint should be added to the group fee component of the fees paid by the fund under the Contract at a level of $160 billion. The Board further concluded that, with this change, the advisory fee structure for the fund continued to provide for a reasonable sharing of benefits from any economies of scale with the fund’s investors.
Fees
The Board reviewed the fund’s management fee rate, operating expenses, and total expense ratio and compared them to fees and expenses of other comparable funds based on information and data supplied by Lipper. The information provided to the Board indicated that the fund’s management fee and expense ratio were generally at or below those of comparable funds. The Board also reviewed the fee schedules for comparable privately managed accounts of the Manager and its affiliates. Management informed the Board that the Manager’s responsibilities for privately managed accounts are more limited than its responsibilities for the fund and other T. Rowe Price mutual funds that it or its affiliates advise. On the basis of the information provided, the Board concluded that the fees paid by the fund under the Contract were reasonable.
Approval of the Contract
As noted, the Board approved the continuation of the Contract as amended to add an additional breakpoint to the group fee rate. No single factor was considered in isolation or to be determinative to the decision. Rather, the Board concluded, in light of a weighting and balancing of all factors considered, that it was in the best interests of the fund to approve the continuation of the Contract, including the fees to be charged for services thereunder.
Item 2. Code of Ethics.
A code of ethics, as defined in Item 2 of Form N-CSR, applicable to its principal executive officer, principal financial officer, principal accounting officer or controller, or persons performing similar functions is filed as an exhibit to the registrant’s annual Form N-CSR. No substantive amendments were approved or waivers were granted to this code of ethics during the registrant’s most recent fiscal half-year.
Item 3. Audit Committee Financial Expert.
Disclosure required in registrant’s annual Form N-CSR.
Item 4. Principal Accountant Fees and Services.
Disclosure required in registrant’s annual Form N-CSR.
Item 5. Audit Committee of Listed Registrants.
Not applicable.
Item 6. Schedule of Investments.
Not applicable. The complete schedule of investments is included in Item 1 of this Form N-CSR.
Item 7. Disclosure of Proxy Voting Policies and Procedures for Closed-End Management Investment Companies.
Not applicable.
Item 8. Portfolio Managers of Closed-End Management Investment Companies.
Not applicable.
Item 9. Purchases of Equity Securities by Closed-End Management Investment Company and Affiliated Purchasers.
Not applicable.
Item 10. Submission of Matters to a Vote of Security Holders.
Not applicable.
Item 11. Controls and Procedures.
(a) The registrant’s principal executive officer and principal financial officer have evaluated the registrant’s disclosure controls and procedures within 90 days of this filing and have concluded that the registrant’s disclosure controls and procedures were effective, as of that date, in ensuring that information required to be disclosed by the registrant in this Form N-CSR was recorded, processed, summarized, and reported timely.
(b) The registrant’s principal executive officer and principal financial officer are aware of no change in the registrant’s internal control over financial reporting that occurred during the registrant’s second fiscal quarter covered by this report that has materially affected, or is reasonably likely to materially affect, the registrant’s internal control over financial reporting.
Item 12. Exhibits.
(a)(1) The registrant’s code of ethics pursuant to Item 2 of Form N-CSR is filed with the registrant’s annual Form N-CSR.
(2) Separate certifications by the registrant's principal executive officer and principal financial officer, pursuant to Section 302 of the Sarbanes-Oxley Act of 2002 and required by Rule 30a-2(a) under the Investment Company Act of 1940, are attached.
(3) Written solicitation to repurchase securities issued by closed-end companies: not applicable.
(b) A certification by the registrant's principal executive officer and principal financial officer, pursuant to Section 906 of the Sarbanes-Oxley Act of 2002 and required by Rule 30a-2(b) under the Investment Company Act of 1940, is attached.
| |
| |
SIGNATURES |
| |
| | Pursuant to the requirements of the Securities Exchange Act of 1934 and the Investment |
| Company Act of 1940, the registrant has duly caused this report to be signed on its behalf by the |
| undersigned, thereunto duly authorized. |
| |
| T. Rowe Price Global Technology Fund, Inc. |
| |
| By | /s/ James S. Riepe |
| | James S. Riepe |
| | Principal Executive Officer |
| |
| Date | August 18, 2005 |
| |
| |
| | Pursuant to the requirements of the Securities Exchange Act of 1934 and the Investment |
| Company Act of 1940, this report has been signed below by the following persons on behalf of |
| the registrant and in the capacities and on the dates indicated. |
| |
| |
| By | /s/ James S. Riepe |
| | James S. Riepe |
| | Principal Executive Officer |
| |
| Date | August 18, 2005 |
| |
| |
| |
| By | /s/ Joseph A. Carrier |
| | Joseph A. Carrier |
| | Principal Financial Officer |
| |
| Date | August 18, 2005 |