| UNITED STATES |
| SECURITIES AND EXCHANGE COMMISSION |
| Washington, D.C. 20549 |
| |
FORM N-CSR |
| |
CERTIFIED SHAREHOLDER REPORT OF REGISTERED |
MANAGEMENT INVESTMENT COMPANIES |
| |
| |
| |
| Investment Company Act File Number: 811-09995 |
|
| |
| T. Rowe Price Global Technology Fund, Inc. |
|
| (Exact name of registrant as specified in charter) |
| |
| 100 East Pratt Street, Baltimore, MD 21202 |
|
| (Address of principal executive offices) |
| |
| David Oestreicher |
| 100 East Pratt Street, Baltimore, MD 21202 |
|
| (Name and address of agent for service) |
| |
| |
| Registrant’s telephone number, including area code: (410) 345-2000 |
| |
| |
| Date of fiscal year end: December 31 |
| |
| |
| Date of reporting period: June 30, 2008 |
Item 1: Report to Shareholders| Global Technology Fund | June 30, 2008 |
The views and opinions in this report were current as of June 30, 2008. They are not guarantees of performance or investment results and should not be taken as investment advice. Investment decisions reflect a variety of factors, and the managers reserve the right to change their views about individual stocks, sectors, and the markets at any time. As a result, the views expressed should not be relied upon as a forecast of the fund’s future investment intent. The report is certified under the Sarbanes-Oxley Act, which requires mutual funds and other public companies to affirm that, to the best of their knowledge, the information in their financial reports is fairly and accurately stated in all material respects.
REPORTS ON THE WEB
Sign up for our E-mail Program, and you can begin to receive updated fund reports and prospectuses online rather than through the mail. Log in to your account at troweprice.com for more information.
Manager’s Letter
Fellow Shareholders
Science and technology stocks generated poor results during the first half of 2008. The ongoing credit crisis, declining consumer confidence, and rapidly rising inflation left investors with a diminished appetite for technology stocks. Within the global technology sector, first-half revenues and earnings seemed to be generally in line with estimates, but management teams have grown more cautious. As a result, the historical pattern of technology companies delivering improved results in the second half of the year is now in doubt.

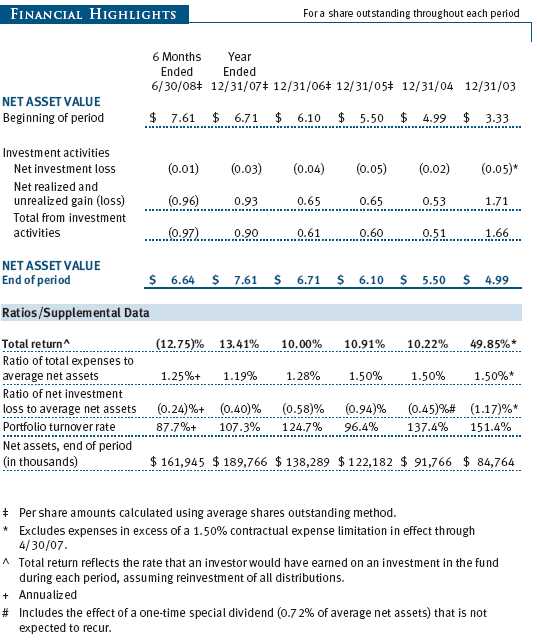
Your fund finished the six-month period ended June 30, 2008, with a loss of 12.75%, slightly behind the MSCI AC World Index–Information Technology, which tracks technology stocks in various international markets. Though results were disappointing, the fund did better than its global technology fund peers in the Lipper Global Science & Technology Funds Index. Our selection of U.S.-based semiconductor and Internet stocks was strong, but the fund suffered from weak stock selection outside the U.S. and within the telecommunication equipment sector.
HIGHLIGHTS
• The ongoing credit crisis, a reduction in consumer confidence, and rapidly rising inflation left investors with a diminished appetite for technology stocks in the first half of 2008.
• The Global Technology Fund generated a loss in the first half of 2008 but beat its Lipper peer group benchmark.
• Our selection of U.S.-based semiconductor and Internet stocks was strong but could not offset weak stock selection outside the U.S. and within the telecommunication equipment sector.
• The combined pressures of a recession and inflation are likely to weigh on global technology shares for the remainder of the year, but attractive valuations and new product cycles offer long-term growth opportunities.
MARKET ENVIRONMENT
Global equity markets performed poorly in the first half of 2008. Stocks sold off immediately to start the calendar year but clawed their way back after the first-quarter earnings season was more positive than expected. However, by the end of the first half, global markets headed back toward their year-to-date lows. The reasons for equity markets’ weakness are easily identifiable: rising commodity prices signaling a long-term rise in inflation expectations, weak housing data from the U.S. and Western Europe, and declining consumer confidence and purchasing power throughout the world. The U.S. dollar continued to depreciate against most major world currencies—particularly versus the euro and the Japanese yen.
Two historical patterns played out for technology stocks in the first half of 2008: technology stocks underperforming when the markets fall and technology stocks lagging the general market during the first half of the year. The large-cap S&P 500 Stock Index closed the first half of the year with a loss of 11.91%, while the Lipper Science & Technology Funds Index ended with a loss of 12.51% . Global technology stocks underperformed U.S.-based technology stocks for the third consecutive six-month period, reflected by a 15.04% decline in the Lipper Global Science & Technology Funds Index compared to the 12.51% decline in the U.S.-focused Lipper Science & Technology Funds Index.
The encouraging news was that the depreciating dollar provided a tailwind for U.S.-based exporters of technology products, such as IBM and Hewlett-Packard—both large positions in the fund. At the same time, the stronger euro and yen have created a significant headwind for Japanese and European companies. (Please see the portfolio of investments for a complete listing of holdings and the amount each represents in the portfolio.)
Seasonality has been a significant factor in technology stock performance. Since consumers buy more electronics around the traditional holiday season and corporate information technology spending is concentrated in the second half of the calendar year, the sector’s revenues and profits usually rise in the last two quarters. This year marked the seventh year in the last nine in which technology stocks underperformed the market in the first half. In eight of the last 10 years, technology stocks outperformed the general market during the second half of the calendar year. If historical patterns persist this year, we are entering a period in which technology stocks should typically outperform the general market. We are skeptical about this trend continuing, however. We discuss this point in more detail in the Outlook section.
We believe that successful investments in the technology sector involve correctly identifying product and technology adoption cycles and then investing in the companies that provide the best products or are well positioned to take advantage of the cyclical growth opportunities. As we have highlighted in past letters, we believe there are several major longer-term global technology cycles under way that offer appealing investment opportunities. Among these are digital media replacing analog in consumer devices, online advertising becoming a major marketing medium, outsourcing of business processes and IT development to India, adoption of advanced communications technology in emerging markets, and proliferation of broadband distribution in the wireline and wireless universes. We have positioned the portfolio to take advantage of these longer-term secular growth trends.
PORTFOLIO REVIEW
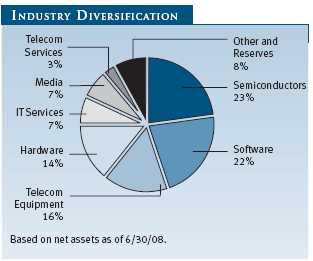
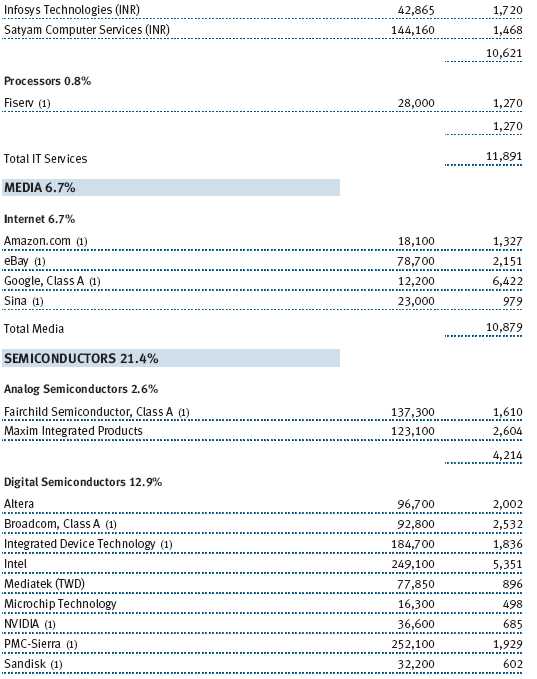
During the first half of 2008, the fund remained broadly diversified geographically and across the principal segments of the technology sector. As of June 30, 2008, hardware and telecommunication equipment represented 30% of the fund, semiconductors 23%, software 22%, the Internet 10%, IT services 7%, and the remaining 8% in cash.
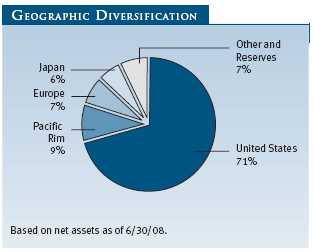
The most significant changes we made in the past six months were increasing the cash balance and reallocating money from telecommunication equipment into IT services. From a geographical perspective, the U.S. represented 71% of assets, the Pacific Rim 9%, Europe 7%, and Japan 6%. The remainder was in cash. In the past year, we have increased our weighting in the U.S. at the expense of a smaller allocation to the Pacific Rim.
The semiconductor industry was the most significant positive contributor to the fund. Our best performers were PMC-Sierra and Broadcom, communications-focused semiconductor companies that sell into the global rollout of fiberoptic networks. The fund also benefited from appreciation of our long-held investments in Xilinx and Altera. We believe both companies have technological advantages over their semiconductor peers that should afford them outsized long-term growth opportunities.
The Internet segment continues to perform well for the fund. Top contributors included Yahoo! and Sina, a major portal in China. The fund traded out of Yahoo! after it rejected Microsoft’s offer because we felt the company’s management was not acting in the best interests of its shareholders. Sina, posting double-digit growth in its online advertising, remains a position within the fund. During the latter part of the second quarter, we added e-commerce retailers eBay and Amazon.com after both stocks declined to attractive valuation levels.
Technology stocks outside of the U.S. have underperformed U.S.-centric technology stocks for the past 18 months, and our stock selection outside the U.S. was weak. This international tech underperformance follows a long period of outperformance, so we do not believe it is the right time to blindly jump back into the higher-risk international technology stocks. Significant declines in Asian-based technology stocks, such as Hon Hai Precision Industry, Foxconn International, Foxconn Technology, Mediatek, and Innolux, highlighted the weakness in our international holdings. The fund’s Pacific Rim weighting has shrunk after the dramatic decline in the region’s stock prices and because we reduced our positions in some of our holdings.
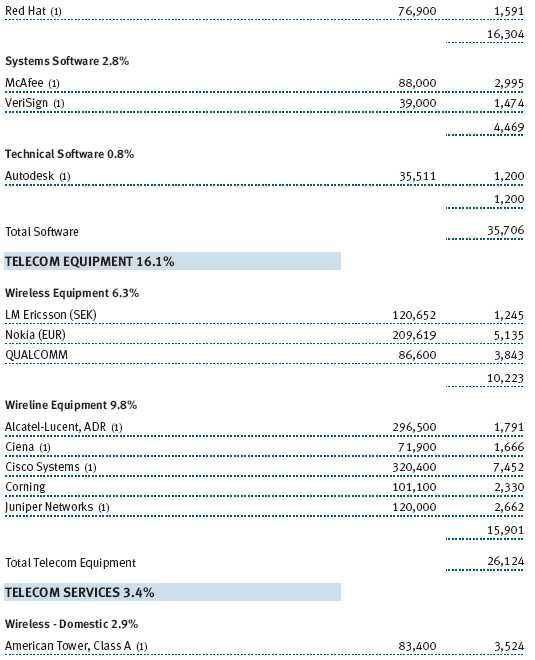
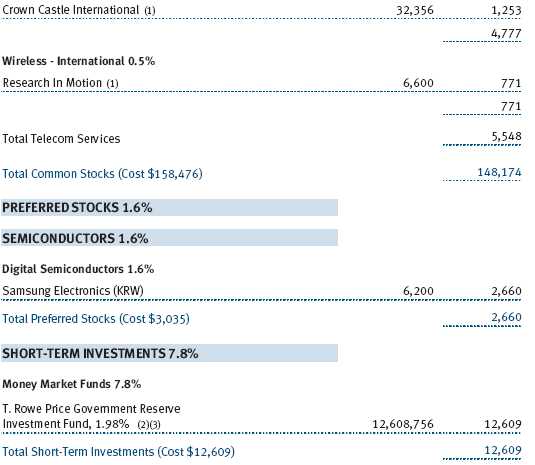
The telecommunications equipment group represented the largest detractor from performance during the first half, as large positions in Juniper Networks, Alcatel-Lucent, and Nokia performed poorly. The fund continues to own all three stocks because we believe valuations have reached attractive levels (Alcatel-Lucent and Nokia) or we believe in the long-term growth opportunity (Juniper and Nokia). A poorly timed LM Ericsson purchase also contributed to the weak performance of the fund’s telecom stocks. Since the company appears to be on the verge of turning around its struggling earnings and its valuation is near historic lows, we added to our position on its way down.
OUTLOOK
The second half of 2008 is likely to be challenging for global technology stocks. In the face of a global economic slowdown, there is little reason to believe that global technology companies can generate strong revenue and earnings. The combined pressures of a consumer-led recession and commodity-induced inflation are likely to leave investors unenthusiastic about global technology shares. However, we are entering a seasonal period of historically better fundamentals for technology stocks, and valuations, in some cases, are near decade lows. We have always believed that valuation alone does not make for a compelling investment case, but the combination of current low valuations, negative market sentiment, and a glimmer of hope on the product-cycle side may be enough of a catalyst to cause a big swing in global technology share prices. While there are considerable risks, we believe the fund is well positioned to benefit from the impact of several significant technology cycles, from online advertising to the explosion in digital media. These cycles are just starting and should provide the fund with years of long-term growth and investment opportunity.
As always, we appreciate your continued support.
Respectfully submitted,
Jeffrey Rottinghaus
President of the fund and chairman of its Investment Advisory Committee
July 24, 2008
The committee chairman has day-to-day responsibility for managing the portfolio and works with committee members in developing and executing the fund’s investment program.
PORTFOLIO MANAGEMENT CHANGE
On October 1, 2008, David Eiswert will replace Jeff Rottinghaus and become lead portfolio manager and chairman of the Investment Advisory Committee for the T. Rowe Price Global Technology Fund. Eiswert joined T. Rowe Price in 2003 as a telecom equipment analyst focusing on U.S. and European companies. Eiswert brings a global focus to his work, having traveled extensively to conduct research around the world. Eiswert will work with Kennard Allen, the new lead portfolio manager of the Science & Technology Fund, to develop our team of technology analysts and to coordinate our global technology research initiatives. Eiswert will also continue to follow a core group of telecom equipment companies.
RISKS OF INVESTING IN THE FUND
Funds that invest only in specific industries will experience greater volatility than funds investing in a broad range of industries. Technology stocks, historically, have experienced unusually wide price swings, both up and down. The potential for wide variation in performance reflects the special risks common to companies in the rapidly changing field of technology. For example, products or services that at first appear promising may not prove commercially successful and may become obsolete quickly. Earnings disappointments and intense competition for market share can result in sharp price declines.
GLOSSARY
Lipper index: An index of mutual fund performance returns for specified periods in defined categories as tracked by Lipper Inc.
Lipper Science & Technology Funds Index: An index of science and technology mutual fund performance returns for specified periods as tracked by Lipper Inc.
Lipper Global Science & Technology Funds Index: An index of mutual fund performance returns of funds that invest in technology companies around the world for specified periods as tracked by Lipper Inc.
MSCI AC World Index–Information Technology: An index that tracks information technology stocks in developed and emerging markets.
Price/earnings ratio: Calculated by dividing a stock’s market value per share by the company’s earnings per share for the past 12 months or by expected earnings for the coming year.
S&P 500 Stock Index: A market cap-weighted index of 500 widely held stocks often used as a proxy for the overall stock market. Performance is reported on a total return basis.


Performance and Expenses
This chart shows the value of a hypothetical $10,000 investment in the fund over the past 10 fiscal year periods or since inception (for funds lacking 10-year records). The result is compared with benchmarks, which may include a broad-based market index and a peer group average or index. Market indexes do not include expenses, which are deducted from fund returns as well as mutual fund averages and indexes.

| AVERAGE ANNUAL COMPOUND TOTAL RETURN |
This table shows how the fund would have performed each year if its actual (or cumulative) returns for the periods shown had been earned at a constant rate.


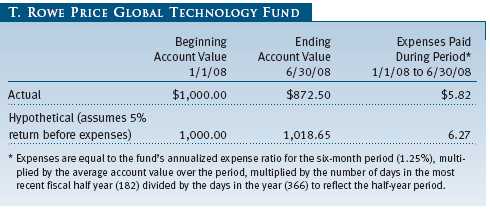
As a mutual fund shareholder, you may incur two types of costs: (1) transaction costs, such as redemption fees or sales loads, and (2) ongoing costs, including management fees, distribution and service (12b-1) fees, and other fund expenses. The following example is intended to help you understand your ongoing costs (in dollars) of investing in the fund and to compare these costs with the ongoing costs of investing in other mutual funds. The example is based on an investment of $1,000 invested at the beginning of the most recent six-month period and held for the entire period.
Actual Expenses
The first line of the following table (“Actual”) provides information about actual account values and expenses based on the fund’s actual returns. You may use the information in this line, together with your account balance, to estimate the expenses that you paid over the period. Simply divide your account value by $1,000 (for example, an $8,600 account value divided by $1,000 = 8.6), then multiply the result by the number in the first line under the heading “Expenses Paid During Period” to estimate the expenses you paid on your account during this period.
Hypothetical Example for Comparison Purposes
The information on the second line of the table (“Hypothetical”) is based on hypothetical account values and expenses derived from the fund’s actual expense ratio and an assumed 5% per year rate of return before expenses (not the fund’s actual return). You may compare the ongoing costs of investing in the fund with other funds by contrasting this 5% hypothetical example and the 5% hypothetical examples that appear in the shareholder reports of the other funds. The hypothetical account values and expenses may not be used to estimate the actual ending account balance or expenses you paid for the period.
Note: T. Rowe Price charges an annual small-account maintenance fee of $10, generally for accounts with less than $2,000 ($500 for UGMA/UTMA). The fee is waived for any investor whose T. Rowe Price mutual fund accounts total $25,000 or more, accounts employing automatic investing, and IRAs and other retirement plan accounts that utilize a prototype plan sponsored by T. Rowe Price (although a separate custodial or administrative fee may apply to such accounts). This fee is not included in the accompanying table. If you are subject to the fee, keep it in mind when you are estimating the ongoing expenses of investing in the fund and when comparing the expenses of this fund with other funds.
You should also be aware that the expenses shown in the table highlight only your ongoing costs and do not reflect any transaction costs, such as redemption fees or sales loads.
Therefore, the second line of the table is useful in comparing ongoing costs only and will not help you determine the relative total costs of owning different funds. To the extent a fund charges transaction costs, however, the total cost of owning that fund is higher.
Unaudited
The accompanying notes are an integral part of these financial statements.
Unaudited


The accompanying notes are an integral part of these financial statements.
Unaudited
The accompanying notes are an integral part of these financial statements.
Unaudited
The accompanying notes are an integral part of these financial statements.
Unaudited

The accompanying notes are an integral part of these financial statements.
Unaudited
| NOTES TO FINANCIAL STATEMENTS |
T. Rowe Price Global Technology Fund, Inc. (the fund), is registered under the Investment Company Act of 1940 (the 1940 Act) as a diversified, open-end management investment company. The fund commenced operations on September 29, 2000. The fund seeks to provide long-term capital growth.
NOTE 1 - SIGNIFICANT ACCOUNTING POLICIES
Basis of Preparation The accompanying financial statements were prepared in accordance with accounting principles generally accepted in the United States of America, which require the use of estimates made by fund management. Fund management believes that estimates and security valuations are appropriate; however, actual results may differ from those estimates, and the security valuations reflected in the financial statements may differ from the value the fund ultimately realizes upon sale of the securities.
Investment Transactions, Investment Income, and Distributions Income and expenses are recorded on the accrual basis. Dividends received from mutual fund investments are reflected as dividend income; capital gain distributions are reflected as realized gain/loss. Dividend income and capital gain distributions are recorded on the ex-dividend date. Income tax-related interest and penalties, if incurred, would be recorded as income tax expense. Investment transactions are accounted for on the trade date. Realized gains and losses are reported on the identified cost basis. Distributions to shareholders are recorded on the ex-dividend date. Income distributions are declared and paid on an annual basis. Capital gain distributions, if any, are declared and paid by the fund, typically on an annual basis.
Currency Translation Assets, including investments, and liabilities denominated in foreign currencies are translated into U.S. dollar values each day at the prevailing exchange rate, using the mean of the bid and asked prices of such currencies against U.S. dollars as quoted by a major bank. Purchases and sales of securities, income, and expenses are translated into U.S. dollars at the prevailing exchange rate on the date of the transaction. The effect of changes in foreign currency exchange rates on realized and unrealized security gains and losses is reflected as a component of security gains and losses.
Rebates Subject to best execution, the fund may direct certain security trades to brokers who have agreed to rebate a portion of the related brokerage commission to the fund in cash. Commission rebates are reflected as realized gain on securities in the accompanying financial statements and totaled $5,000 for the six months ended June 30, 2008.
New Accounting Pronouncements On January 1, 2008, the fund adopted Statement of Financial Accounting Standards No. 157 (FAS 157), Fair Value Measurements. FAS 157 defines fair value, establishes the framework for measuring fair value, and expands the disclosures of fair value measurements in the financial statements. Adoption of FAS 157 did not have a material impact on the fund’s net assets or results of operations.
In March 2008, the Financial Accounting Standards Board issued Statement of Financial Accounting Standards No. 161, Disclosures about Derivative Instruments and Hedging Activities (FAS 161), which is effective for fiscal years and interim periods beginning after November 15, 2008. FAS 161 requires enhanced disclosures about derivative and hedging activities, including how such activities are accounted for and their effect on financial position, performance and cash flows. Management is currently evaluating the impact the adoption of FAS 161 will have on the fund’s financial statements and related disclosures.
NOTE 2 - VALUATION
The fund’s investments are reported at fair value as defined under FAS 157. The fund values its investments and computes its net asset value per share at the close of the New York Stock Exchange (NYSE), normally 4 p.m. ET, each day that the NYSE is open for business.
Valuation Methods Equity securities listed or regularly traded on a securities exchange or in the over-the-counter (OTC) market are valued at the last quoted sale price or, for certain markets, the official closing price at the time the valuations are made, except for OTC Bulletin Board securities, which are valued at the mean of the latest bid and asked prices. A security that is listed or traded on more than one exchange is valued at the quotation on the exchange determined to be the primary market for such security. Listed securities not traded on a particular day are valued at the mean of the latest bid and asked prices for domestic securities and the last quoted sale price for international securities.
Investments in mutual funds are valued at the mutual fund’s closing net asset value per share on the day of valuation.
Other investments, including restricted securities, and those for which the above valuation procedures are inappropriate or are deemed not to reflect fair value are stated at fair value as determined in good faith by the T. Rowe Price Valuation Committee, established by the fund’s Board of Directors.
For valuation purposes, the last quoted prices of non-U.S. equity securities may be adjusted under the circumstances described below. If the fund determines that developments between the close of a foreign market and the close of the NYSE will, in its judgment, materially affect the value of some or all of its portfolio securities, the fund will adjust the previous closing prices to reflect what it believes to be the fair value of the securities as of the close of the NYSE. In deciding whether it is necessary to adjust closing prices to reflect fair value, the fund reviews a variety of factors, including developments in foreign markets, the performance of U.S. securities markets, and the performance of instruments trading in U.S. markets that represent foreign securities and baskets of foreign securities. A fund may also fair value securities in other situations, such as when a particular foreign market is closed but the fund is open. The fund uses outside pricing services to provide it with closing prices and information to evaluate and/or adjust those prices. The fund cannot predict how often it will use closing prices and how often it will determine it necessary to adjust those prices to reflect fair value. As a means of evaluating its security valuation process, the fund routinely compares closing prices, the next day’s opening prices in the same markets, and adjusted prices.
Valuation Inputs Various inputs are used to determine the value of the fund’s investments. These inputs are summarized in the three broad levels listed below:
Level 1 – quoted prices in active markets for identical securities
Level 2 – observable inputs other than Level 1 quoted prices (including, but not limited to, quoted prices for similar securities, interest rates, prepayment speeds, credit risk)
Level 3 – unobservable inputs
Observable inputs are those based on market data obtained from sources independent of the fund, and unobservable inputs reflect the fund’s own assumptions based on the best information available. The input levels are not necessarily an indication of the risk or liquidity associated with investments at that level. For example, non-U.S. equity securities actively traded in foreign markets generally are reflected in Level 2 despite the availability of closing prices, because the fund evaluates and determines whether those closing prices reflect fair value at the close of the NYSE or require adjustment, as described above. The following table summarizes the fund’s investments, based on the inputs used to determine their values on June 30, 2008:

NOTE 3 - INVESTMENT TRANSACTIONS
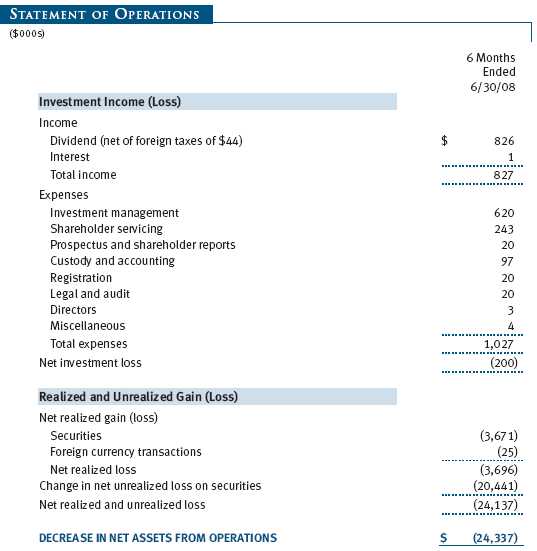
Purchases and sales of portfolio securities, other than short-term securities, aggregated $69,688,000 and $74,648,000, respectively, for the six months ended June 30, 2008.
NOTE 4 - FEDERAL INCOME TAXES
No provision for federal income taxes is required since the fund intends to continue to qualify as a regulated investment company under Subchapter M of the Internal Revenue Code and distribute to shareholders all of its taxable income and gains. Distributions are determined in accordance with Federal income tax regulations, which differ from generally accepted accounting principles, and, therefore, may differ in amount or character from net investment income and realized gains for financial reporting purposes. Financial reporting records are adjusted for permanent book/tax differences to reflect tax character but are not adjusted for temporary differences. The amount and character of tax-basis distributions and composition of net assets are finalized at fiscal year-end; accordingly, tax-basis balances have not been determined as of June 30, 2008.
The fund intends to retain realized gains to the extent of available capital loss carryforwards. As of December 31, 2007, the fund had $43,341,000 of unused capital loss carryforwards, of which $9,759,000 expire in fiscal 2009 and $33,582,000 expire in fiscal 2010.
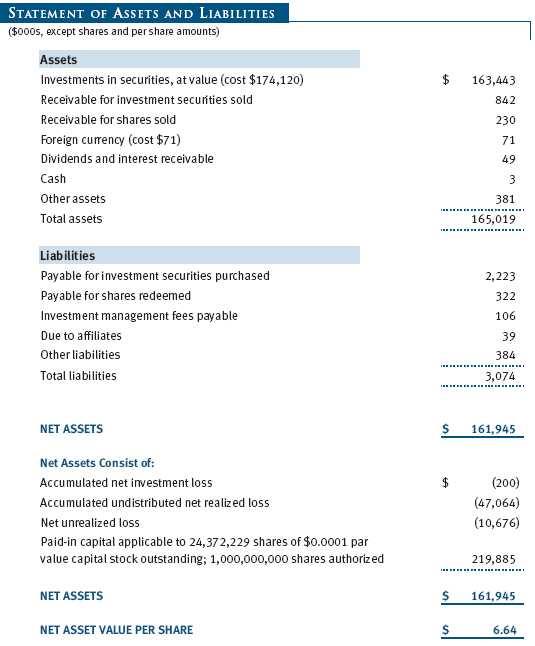
At June 30, 2008, the cost of investments for federal income tax purposes was $174,120,000. Net unrealized loss aggregated $10,676,000 at period-end, of which $6,177,000 related to appreciated investments and $16,853,000 related to depreciated investments.
NOTE 5 - FOREIGN TAXES
The fund is subject to foreign income taxes imposed by certain countries in which it invests. Additionally, capital gains realized by the fund upon disposition of securities issued in or by certain foreign countries are subject to capital gains tax imposed by those countries. All taxes are computed in accordance with the applicable foreign tax law, and, to the extent permitted, capital losses are used to offset capital gains. Tax expense attributable to income is accrued by the fund as a reduction of income. Current and deferred tax expense attributable to net capital gains is reflected as a component of realized and/or change in unrealized gain/loss on securities in the accompanying financial statements. At June 30, 2008, the fund had no deferred tax liability attributable to foreign securities and $1,805,000 of foreign capital loss carryforwards, including $24,000 that expire in 2013, $916,000 that expire in 2014, and $865,000 that expire in 2015.
NOTE 6 - RELATED PARTY TRANSACTIONS
The fund is managed by T. Rowe Price Associates, Inc. (the manager or Price Associates), a wholly owned subsidiary of T. Rowe Price Group, Inc. The investment management agreement between the fund and the manager provides for an annual investment management fee, which is computed daily and paid monthly. The fee consists of an individual fund fee, equal to 0.45% of the fund’s average daily net assets, and a group fee. The group fee rate is calculated based on the combined net assets of certain mutual funds sponsored by Price Associates (the group) applied to a graduated fee schedule, with rates ranging from 0.48% for the first $1 billion of assets to 0.285% for assets in excess of $220 billion. The fund’s group fee is determined by applying the group fee rate to the fund’s average daily net assets. At June 30, 2008, the effective annual group fee rate was 0.30%.
In addition, the fund has entered into service agreements with Price Associates and two wholly owned subsidiaries of Price Associates (collectively, Price). Price Associates computes the daily share price and provides certain other administrative services to the fund. T. Rowe Price Services, Inc., provides shareholder and administrative services in its capacity as the fund’s transfer and dividend disbursing agent. T. Rowe Price Retirement Plan Services, Inc., provides subaccounting and recordkeeping services for certain retirement accounts invested in the fund. For the six months ended June 30, 2008, expenses incurred pursuant to these service agreements were $70,000 for Price Associates, $189,000 for T. Rowe Price Services, Inc., and $4,000 for T. Rowe Price Retirement Plan Services, Inc. The total amount payable at period-end pursuant to these service agreements is reflected as Due to Affiliates in the accompanying financial statements.
The fund may invest in the T. Rowe Price Reserve Investment Fund and the T. Rowe Price Government Reserve Investment Fund (collectively, the T. Rowe Price Reserve Investment Funds), open-end management investment companies managed by Price Associates and considered affiliates of the fund. The T. Rowe Price Reserve Investment Funds are offered as cash management options to mutual funds, trusts, and other accounts managed by Price Associates and/or its affiliates and are not available for direct purchase by members of the public. The T. Rowe Price Reserve Investment Funds pay no investment management fees.
As of June 30, 2008, T. Rowe Price Group, Inc., and/or its wholly owned subsidiaries owned 539,179 shares of the fund, representing 2% of the fund’s net assets.
| INFORMATION ON PROXY VOTING POLICIES, PROCEDURES, AND RECORDS |
A description of the policies and procedures used by T. Rowe Price funds and portfolios to determine how to vote proxies relating to portfolio securities is available in each fund’s Statement of Additional Information, which you may request by calling 1-800-225-5132 or by accessing the SEC’s Web site, www.sec.gov. The description of our proxy voting policies and procedures is also available on our Web site, www.troweprice.com. To access it, click on the words “Company Info” at the top of our homepage for individual investors. Then, in the window that appears, click on the “Proxy Voting Policy” navigation button in the top left corner.
Each fund’s most recent annual proxy voting record is available on our Web site and through the SEC’s Web site. To access it through our Web site, follow the directions above, then click on the words “Proxy Voting Record” at the bottom of the Proxy Voting Policy page.
| HOW TO OBTAIN QUARTERLY PORTFOLIO HOLDINGS |
The fund files a complete schedule of portfolio holdings with the Securities and Exchange Commission for the first and third quarters of each fiscal year on Form N-Q. The fund’s Form N-Q is available electronically on the SEC’s Web site (www.sec.gov); hard copies may be reviewed and copied at the SEC’s Public Reference Room, 450 Fifth St. N.W., Washington, DC 20549. For more information on the Public Reference Room, call 1-800-SEC-0330.
| APPROVAL OF INVESTMENT MANAGEMENT AGREEMENT |
On March 4, 2008, the fund’s Board of Directors (Board) unanimously approved the investment advisory contract (Contract) between the fund and its investment manager, T. Rowe Price Associates, Inc. (Manager). The Board considered a variety of factors in connection with its review of the Contract, also taking into account information provided by the Manager during the course of the year, as discussed below:
Services Provided by the Manager
The Board considered the nature, quality, and extent of the services provided to the fund by the Manager. These services included, but were not limited to, management of the fund’s portfolio and a variety of related activities, as well as financial and administrative services, reporting, and communications. The Board also reviewed the background and experience of the Manager’s senior management team and investment personnel involved in the management of the fund. The Board concluded that it was satisfied with the nature, quality, and extent of the services provided by the Manager.
Investment Performance of the Fund
The Board reviewed the fund’s average annual total returns over the one-, three-, and five-year and since-inception periods as well as the fund’s year-by-year returns and compared these returns with previously agreed upon comparable performance measures and market data, including those supplied by Lipper and Morningstar, which are independent providers of mutual fund data. On the basis of this evaluation and the Board’s ongoing review of investment results, the Board concluded that the fund’s performance was satisfactory.
Costs, Benefits, Profits, and Economies of Scale
The Board reviewed detailed information regarding the revenues received by the Manager under the Contract and other benefits that the Manager (and its affiliates) may have realized from its relationship with the fund, including research received under “soft dollar” agreements. The Board noted that soft dollars were not used to pay for third-party, non-broker research. The Board also received information on the estimated costs incurred and profits realized by the Manager and its affiliates from advising T. Rowe Price mutual funds, as well as estimates of the gross profits realized from managing the fund in particular. The Board concluded that the Manager’s profits were reasonable in light of the services provided to the fund. The Board also considered whether the fund or other funds benefit under the fee levels set forth in the Contract from any economies of scale realized by the Manager. Under the Contract, the fund pays a fee to the Manager composed of two components—a group fee rate based on the aggregate assets of certain T. Rowe Price mutual funds (including the fund) that declines at certain asset levels and an individual fund fee rate that is assessed on the assets of the fund. The Board concluded that the advisory fee structure for the fund continued to provide for a reasonable sharing of benefits from any economies of scale with the fund’s investors.
Fees
The Board reviewed the fund’s management fee rate, operating expenses, and total expense ratio and compared them with fees and expenses of other comparable funds based on information and data supplied by Lipper. The information provided to the Board indicated that the fund’s management fee rate and expense ratio were above the median for certain groups of comparable funds but at or below the median for other groups of comparable funds. The Board also reviewed the fee schedules for comparable privately managed accounts of the Manager and its affiliates. Management informed the Board that the Manager’s responsibilities for privately managed accounts are more limited than its responsibilities for the fund and other T. Rowe Price mutual funds that it or its affiliates advise. On the basis of the information provided, the Board concluded that the fees paid by the fund under the Contract were reasonable.
Approval of the Contract
As noted, the Board approved the continuation of the Contract. No single factor was considered in isolation or to be determinative to the decision. Rather, the Board concluded, in light of a weighting and balancing of all factors considered, that it was in the best interests of the fund to approve the continuation of the Contract, including the fees to be charged for services thereunder.
Item 2. Code of Ethics.
A code of ethics, as defined in Item 2 of Form N-CSR, applicable to its principal executive officer, principal financial officer, principal accounting officer or controller, or persons performing similar functions is filed as an exhibit to the registrant’s annual Form N-CSR. No substantive amendments were approved or waivers were granted to this code of ethics during the registrant’s most recent fiscal half-year.
Item 3. Audit Committee Financial Expert.
Disclosure required in registrant’s annual Form N-CSR.
Item 4. Principal Accountant Fees and Services.
Disclosure required in registrant’s annual Form N-CSR.
Item 5. Audit Committee of Listed Registrants.
Not applicable.
Item 6. Investments.
(a) Not applicable. The complete schedule of investments is included in Item 1 of this Form N-CSR.
(b) Not applicable.
Item 7. Disclosure of Proxy Voting Policies and Procedures for Closed-End Management Investment Companies.
Not applicable.
Item 8. Portfolio Managers of Closed-End Management Investment Companies.
Not applicable.
Item 9. Purchases of Equity Securities by Closed-End Management Investment Company and Affiliated Purchasers.
Not applicable.
Item 10. Submission of Matters to a Vote of Security Holders.
Not applicable.
Item 11. Controls and Procedures.
(a) The registrant’s principal executive officer and principal financial officer have evaluated the registrant’s disclosure controls and procedures within 90 days of this filing and have concluded that the registrant’s disclosure controls and procedures were effective, as of that date, in ensuring that information required to be disclosed by the registrant in this Form N-CSR was recorded, processed, summarized, and reported timely.
(b) The registrant’s principal executive officer and principal financial officer are aware of no change in the registrant’s internal control over financial reporting that occurred during the registrant’s second fiscal quarter covered by this report that has materially affected, or is reasonably likely to materially affect, the registrant’s internal control over financial reporting.
Item 12. Exhibits.
(a)(1) The registrant’s code of ethics pursuant to Item 2 of Form N-CSR is filed with the registrant’s annual Form N-CSR.
(2) Separate certifications by the registrant's principal executive officer and principal financial officer, pursuant to Section 302 of the Sarbanes-Oxley Act of 2002 and required by Rule 30a-2(a) under the Investment Company Act of 1940, are attached.
(3) Written solicitation to repurchase securities issued by closed-end companies: not applicable.
(b) A certification by the registrant's principal executive officer and principal financial officer, pursuant to Section 906 of the Sarbanes-Oxley Act of 2002 and required by Rule 30a-2(b) under the Investment Company Act of 1940, is attached.
| | |
SIGNATURES |
| |
| | Pursuant to the requirements of the Securities Exchange Act of 1934 and the Investment |
| Company Act of 1940, the registrant has duly caused this report to be signed on its behalf by the |
| undersigned, thereunto duly authorized. |
| |
| T. Rowe Price Global Technology Fund, Inc. |
| |
| |
| |
| By | /s/ Edward C. Bernard |
| | Edward C. Bernard |
| | Principal Executive Officer |
| |
| Date | August 20, 2008 |
| |
| |
| |
| | Pursuant to the requirements of the Securities Exchange Act of 1934 and the Investment |
| Company Act of 1940, this report has been signed below by the following persons on behalf of |
| the registrant and in the capacities and on the dates indicated. |
| |
| |
| By | /s/ Edward C. Bernard |
| | Edward C. Bernard |
| | Principal Executive Officer |
| |
| Date | August 20, 2008 |
| |
| |
| |
| By | /s/ Gregory K. Hinkle |
| | Gregory K. Hinkle |
| | Principal Financial Officer |
| |
| Date | August 20, 2008 |