UNITED STATES
SECURITIES AND EXCHANGE COMMISSION
Washington, D.C. 20549
FORM N-CSR
CERTIFIED SHAREHOLDER REPORT OF REGISTERED
MANAGEMENT INVESTMENT COMPANIES
Investment Company Act File Number: 811-09995
| T. Rowe Price Global Technology Fund, Inc. |
| (Exact name of registrant as specified in charter) |
| 100 East Pratt Street, Baltimore, MD 21202 |
| (Address of principal executive offices) |
| David Oestreicher |
| 100 East Pratt Street, Baltimore, MD 21202 |
| (Name and address of agent for service) |
Registrant’s telephone number, including area code: (410) 345-2000
Date of fiscal year end: December 31
Date of reporting period: December 31, 2013
Item 1. Report to Shareholders
 |
| Global Technology Fund | December 31, 2013 |
The views and opinions in this report were current as of December 31, 2013. They are not guarantees of performance or investment results and should not be taken as investment advice. Investment decisions reflect a variety of factors, and the managers reserve the right to change their views about individual stocks, sectors, and the markets at any time. As a result, the views expressed should not be relied upon as a forecast of the fund’s future investment intent. The report is certified under the Sarbanes-Oxley Act, which requires mutual funds and other public companies to affirm that, to the best of their knowledge, the information in their financial reports is fairly and accurately stated in all material respects.
REPORTS ON THE WEB
Sign up for our E-mail Program, and you can begin to receive updated fund reports and prospectuses online rather than through the mail. Log in to your account at troweprice.com for more information.
Manager’s Letter
Fellow Shareholders
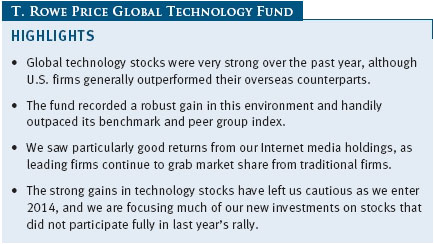
Global technology stocks recorded stellar returns in the six months since our last letter. Several factors fed into the advance, including signs of a strengthening recovery in the U.S., the end of a recession in Europe, a reinvigorated Japanese economy, and greater certainty about U.S. monetary policy. On a more fundamental level, many large technology firms continued to execute well, either serving new markets or, as in the case of advertising, seizing share from traditional competitors. We are pleased to report that we fared even better than our benchmark and peer group index, and the recent gains helped the fund record some of the best fiscal year returns in its 13-year history. We would caution shareholders, however, that very few rocks remained to be turned over by those seeking new technology investment opportunities. Valuations in the sector are elevated, suggesting that returns over the coming year are likely to be more muted.
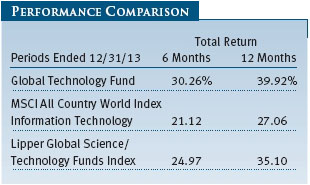
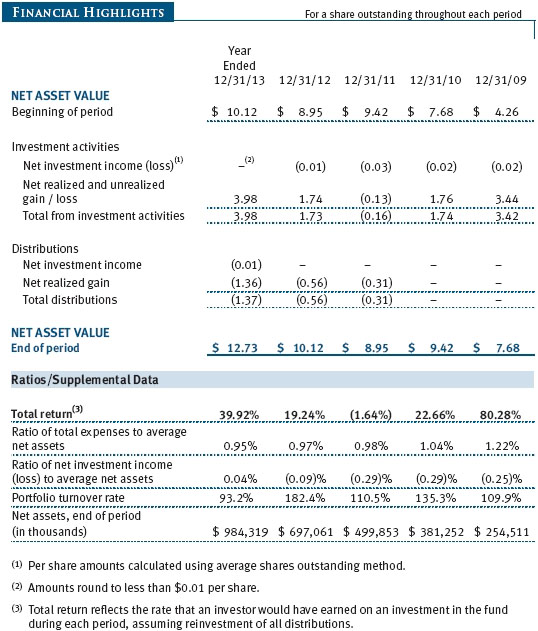
PERFORMANCE COMPARISON
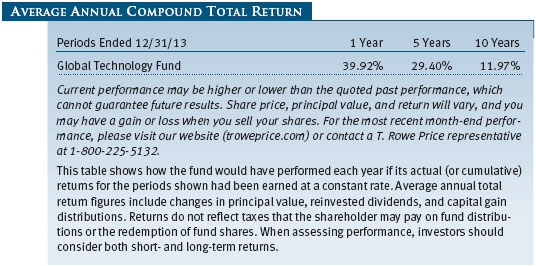
Our fund advanced 30.26% in the last six months, bringing its yearly gain to 39.92%. The fund again easily outperformed the MSCI All Country World Index Information Technology. We outperformed the Lipper Global Science/Technology Funds Index to a lesser, but still substantial, degree. The fund’s relative performance is very favorable over all time periods, and it is Lipper’s top-ranked fund in its category for the 5- and 10-year periods ended December 31, 2013. Based on cumulative total return, Lipper ranked the Global Technology Fund 14 of 45, 4 of 41, 1 of 29, and 1 of 19 global science and technology funds for the 1-, 3-, 5-, and 10-year periods ended December 31, 2013, respectively. (Results will vary for other periods. Past performance cannot guarantee future results.)
MARKET ENVIRONMENT
Global stock markets saw strong gains over the past six months, adding to their more muted gains earlier in the year. U.S. stocks were particularly strong, as investors grew more confident about the economic recovery. Manufacturing and service activity continued to expand, and the labor market picked up strength in the fall. Having slowed somewhat in the summer due to rising mortgage rates, the housing sector also gained traction as the year came to an end. Stocks also continued to have a tailwind from monetary policy. Although the Federal Reserve announced late in the year that it would soon begin reducing its long-term asset purchases, investors seemed confident that any rise in long-term interest rates would be contained, while short-term borrowing costs would remain minimal. Finally, a bipartisan budget deal at the end of the year promised to reduce some of the fiscal headwinds that have restrained the recovery.
Markets outside the U.S. were generally weaker for 2013 as a whole, but they saw robust gains in the second half of the year. European markets were particularly strong, as investors welcomed signs that the Continent had finally emerged from the recession. Less-restrictive fiscal policies and interest rate cuts by the European Central Bank further boosted growth and sentiment. Japanese stocks rallied dramatically early in the year, although returns for foreign investors were reduced by a sharp decline in the yen. Emerging markets were generally much weaker due to liquidity concerns, poor markets for commodity exports, inflation worries, and other factors.
Technology stocks performed somewhat better than the overall market in 2013 on a global basis, a pattern that was reversed within the U.S. market. Media stocks were particularly strong among global technology shares over the past year, more than doubling the overall return of the MSCI global technology index. Software, telecommunications equipment, and technology services firms performed roughly in line with the index, while semiconductor shares trailed modestly.
PORTFOLIO REVIEW
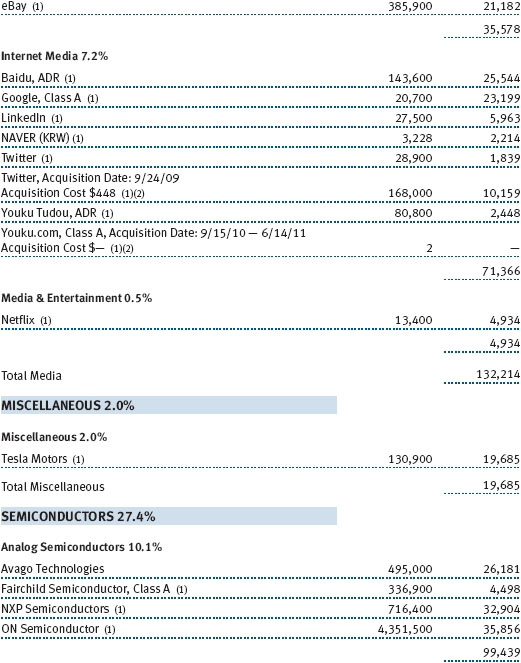
Many of the leading contributors we discussed in our semiannual letter continued to see strong gains in the back half of the year. Internet media holdings were especially helpful, with two names easily recognizable to most Americans—Google and LinkedIn—showing up among our top 10 contributors. One of our fund’s advantages, however, is that we are able to search far and wide for opportunities, and our top contributor for the period was China’s Baidu. The dominant search provider in the world’s most populated nation, Baidu has enjoyed accelerating revenue growth in recent months, and investors are particularly encouraged at its ability to earn revenues from mobile search. (Please refer to the fund’s portfolio of investments for a complete list of holdings and the amount each represents in the portfolio.)
Internet e-commerce is another focus of the portfolio. We should acknowledge that we were somewhat surprised with Amazon.com’s strong performance over the year. We had built up our position with muted expectations for short-term gain, but in recognition that the company deserves a prominent place in the portfolio given the number of markets it is coming to dominate. Nevertheless, investors continued to bid the stock higher, bringing its market capitalization to over $180 billion—behind only Wal-Mart in the consumer services sector. We sold our position in priceline.com following very strong performance in the stock. As investors have rewarded a remarkable stretch of earnings growth over the past few years, the company’s shares have rallied over 2,000% from their bear market low.
We discussed the rapidly growing market for “cloud based” software in our last letter, along with the prospects of two leading companies in the segment, Proofpoint and ServiceNow. Both were among our top contributors for the year, as earnings and revenue continued to grow rapidly. We harvested our gains and sold our position in Cornerstone OnDemand, a provider of Web-based human resources software. A new holding in security software firm Palo Alto Networks detracted from results. We added marketing automation software firm Marketo on its initial public offering (IPO) in May. The IPO was one of many during the year to draw substantial demand, and the stock ended up being one of our top performers for the year.
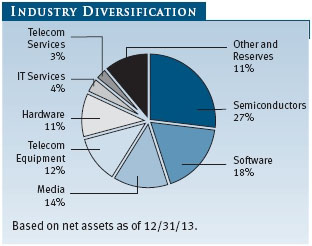
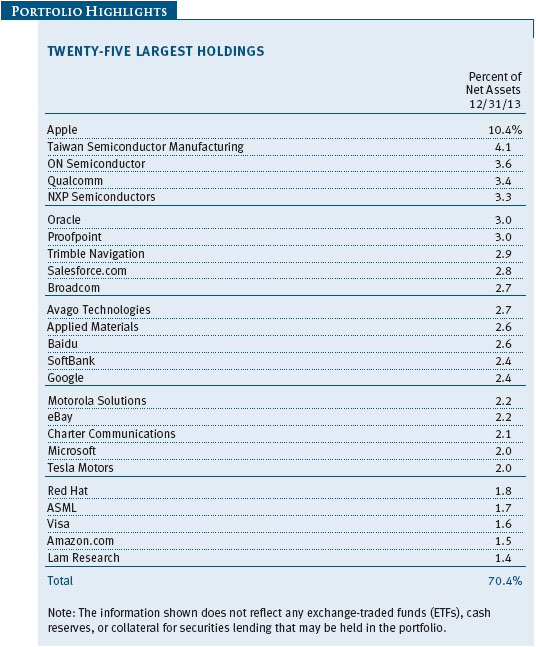
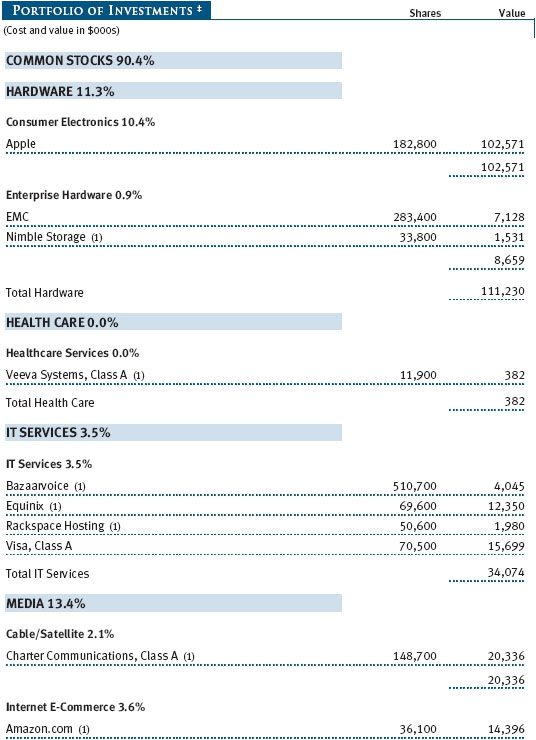
As shown in the Industry Diversification table, semiconductors is our single largest allocation. Our top performer in the segment was NXP Semiconductors, a Netherlands-based provider of analog and mixed-signal semiconductors that sells into a number of industries, including automotive, identification, mobile, and communications infrastructure. We also saw very good results from Avago Technologies, a designer and provider of analog semiconductors for a wide range of end markets. At the end of the year, Avago announced an agreement to acquire a storage and networking chip maker in a deal that we think will provide significant synergies. Overseas, we found what proved to be a good opportunity in South Korea’s SK Hynix. The maker of memory chips is benefiting from reduced competition in what had been a crowded and unprofitable market.
Apple regained its footing in the second half of the year, making it our top contributor for the period and one of our leading positions for the year as a whole. Investors were relieved to see the company’s dry spell of product launches broken by the iPhone 5, and many were optimistic that 2014 would see important refreshes of the iPad and other devices. China was a theme in this position as well, as a deal struck with China’s largest cellphone carrier, China Mobile, offered the prospect of 750 million new customers for the iPhone.
Fortunately, we were able to contain most of our mistakes over the past year to smaller positions. We liquidated a disappointing investment in Rudolph Technologies, which makes equipment to check for larger-scale defects in semiconductor production, which stand to become more common as semiconductor packaging grows more complex. While we still believe this is a lucrative area, the company over-promised on its tool delivery and research and development pipeline, and we exited the position. Communications equipment maker F5 Networks suffered from fears that the move to cloud-based software will reduce demand for the company’s load-balancing technology, and we sold our position after an underwhelming new product launch. We did have a substantial position in semiconductor manufacturer Broadcom, which saw its shares decline after reporting poor earnings in the second quarter and as investors worried that it was losing share in an already slowing smartphone market. The company has been investing heavily in its cellular business for several years now, making its loss of some key contracts during the year particularly disappointing.
OUTLOOK
Although we believe that many of the trends that are propelling technology profits are only in their early stages, we are cautious as we head into 2014. With valuations elevated in all of the fast-growing segments, investors have priced in little room for error if revenue growth falters or if profit margins decline. Finding new investment opportunities has become more of a challenge, as investors have bid up the shares of almost every rapidly growing technology company.
One way to position the fund in this environment would be to focus on the most defensive stocks—the legacy technology firms, such as IBM and Microsoft, that have widely diversified businesses, fortress-like balance sheets, and other advantages that should help them hold up better in a down market. We do have some holdings in these firms and are particularly interested in those, such as Oracle, that are being managed to the advantage of shareholders. Most of these firms have much less appeal over the longer term, however, as many of their markets are under attack from smaller and more nimble competitors. Changing the portfolio to focus on these defensive firms would put us in the position of calling a market top. Valuations are extended, to be sure, but not to the degree that we feel comfortable adopting a risky, contrarian strategy that does not accord with our focus on long-term performance.
Instead, we are attempting to position the fund somewhat defensively by increasing our investment in companies that have been left behind in the market’s rapid advance. We have been adding to some companies, such as Broadcom, that have suffered from company-specific challenges that we expect will be resolved in 2014. Cable company Charter Communications has also attracted our interest, both for its reasonable valuation and its excellent management team.
In other cases, we have focused investments on companies whose fortunes are closely tied to the health of the global economy and whose shares have lagged as investors continued to worry about the recession in Europe and the slowdown in emerging markets. We are especially hopeful that the highly cyclical global semiconductor market is entering an expansionary phase. Chinese demand is picking up, and the end market for personal computers appears to have finally stabilized after a long period of declines. With semiconductor firms planning to spend aggressively to meet increased demand, semiconductor capital equipment firms are poised to benefit. Moreover, these are some of the few technology firms trading at low multiples to earnings.
With analysts in London, Singapore, Hong Kong, and elsewhere providing support, we are pleased to work with a truly global team in the hunt for such opportunities. Thank you for your continued support, and we look forward to informing you on our progress in six months.
Respectfully submitted,

Joshua K. Spencer
President of the fund and chairman of its Investment Advisory Committee
January 17, 2014
The committee chairman has day-to-day responsibility for managing the portfolio and works with committee members in developing and executing the fund’s investment program.
RISKS OF INVESTING IN THE FUND
Funds that invest only in specific industries will experience greater volatility than funds investing in a broad range of industries. Technology stocks, historically, have experienced unusually wide price swings, both up and down. The potential for wide variation in performance reflects the special risks common to companies in the rapidly changing field of technology. For example, products or services that at first appear promising may not prove commercially successful and may become obsolete quickly. Earnings disappointments and intense competition for market share can result in sharp price declines.
GLOSSARY
Lipper Global Science/Technology Funds Index: An index of science and technology mutual fund performance returns of funds that invest in technology companies around the world for specified periods as tracked by Lipper Inc.
MSCI All Country World Index Information Technology: An index that tracks information technology stocks in developed and emerging markets.
Note: MSCI makes no express or implied warranties or representations and shall have no liability whatsoever with respect to any MSCI data contained herein. The MSCI data may not be further redistributed or used as a basis for other indices or any securities or financial products. This report is not approved, reviewed, or produced by MSCI.
Performance and Expenses
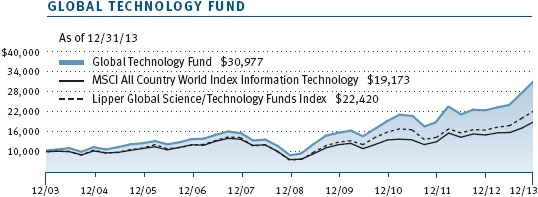
| Growth of $10,000 |
This chart shows the value of a hypothetical $10,000 investment in the fund over the past 10 fiscal year periods or since inception (for funds lacking 10-year records). The result is compared with benchmarks, which may include a broad-based market index and a peer group average or index. Market indexes do not include expenses, which are deducted from fund returns as well as mutual fund averages and indexes.
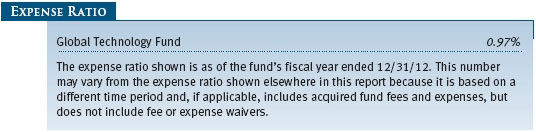
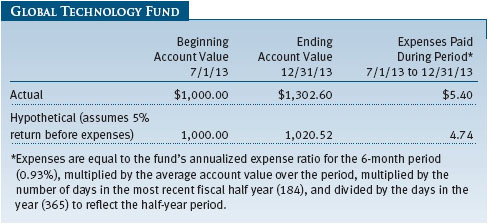
| Fund Expense Example |
As a mutual fund shareholder, you may incur two types of costs: (1) transaction costs, such as redemption fees or sales loads, and (2) ongoing costs, including management fees, distribution and service (12b-1) fees, and other fund expenses. The following example is intended to help you understand your ongoing costs (in dollars) of investing in the fund and to compare these costs with the ongoing costs of investing in other mutual funds. The example is based on an investment of $1,000 invested at the beginning of the most recent six-month period and held for the entire period.
Actual Expenses
The first line of the following table (Actual) provides information about actual account values and expenses based on the fund’s actual returns. You may use the information on this line, together with your account balance, to estimate the expenses that you paid over the period. Simply divide your account value by $1,000 (for example, an $8,600 account value divided by $1,000 = 8.6), then multiply the result by the number on the first line under the heading “Expenses Paid During Period” to estimate the expenses you paid on your account during this period.
Hypothetical Example for Comparison Purposes
The information on the second line of the table (Hypothetical) is based on hypothetical account values and expenses derived from the fund’s actual expense ratio and an assumed 5% per year rate of return before expenses (not the fund’s actual return). You may compare the ongoing costs of investing in the fund with other funds by contrasting this 5% hypothetical example and the 5% hypothetical examples that appear in the shareholder reports of the other funds. The hypothetical account values and expenses may not be used to estimate the actual ending account balance or expenses you paid for the period.
Note: T. Rowe Price charges an annual account service fee of $20, generally for accounts with less than $10,000. The fee is waived for any investor whose T. Rowe Price mutual fund accounts total $50,000 or more; accounts electing to receive electronic delivery of account statements, transaction confirmations, prospectuses, and shareholder reports; or accounts of an investor who is a T. Rowe Price Preferred Services, Personal Services, or Enhanced Personal Services client (enrollment in these programs generally requires T. Rowe Price assets of at least $100,000). This fee is not included in the accompanying table. If you are subject to the fee, keep it in mind when you are estimating the ongoing expenses of investing in the fund and when comparing the expenses of this fund with other funds.
You should also be aware that the expenses shown in the table highlight only your ongoing costs and do not reflect any transaction costs, such as redemption fees or sales loads. Therefore, the second line of the table is useful in comparing ongoing costs only and will not help you determine the relative total costs of owning different funds. To the extent a fund charges transaction costs, however, the total cost of owning that fund is higher.
The accompanying notes are an integral part of these financial statements.

The accompanying notes are an integral part of these financial statements.
The accompanying notes are an integral part of these financial statements.
The accompanying notes are an integral part of these financial statements.
The accompanying notes are an integral part of these financial statements.
| Notes to Financial Statements |
T. Rowe Price Global Technology Fund, Inc. (the fund), is registered under the Investment Company Act of 1940 (the 1940 Act) as a diversified, open-end management investment company. The fund commenced operations on September 29, 2000. The fund seeks to provide long-term capital growth.
NOTE 1 - SIGNIFICANT ACCOUNTING POLICIES
Basis of Preparation The fund is an investment company and follows accounting and reporting guidance in the Financial Accounting Standards Board Accounting Standards Codification Topic 946 (ASC 946). The accompanying financial statements were prepared in accordance with accounting principles generally accepted in the United States of America (GAAP), including but not limited to ASC 946. GAAP requires the use of estimates made by management. Management believes that estimates and valuations are appropriate; however, actual results may differ from those estimates, and the valuations reflected in the accompanying financial statements may differ from the value ultimately realized upon sale or maturity.
Investment Transactions, Investment Income, and Distributions Income and expenses are recorded on the accrual basis. Dividends received from mutual fund investments are reflected as dividend income; capital gain distributions are reflected as realized gain/loss. Dividend income and capital gain distributions are recorded on the ex-dividend date. Income tax-related interest and penalties, if incurred, would be recorded as income tax expense. Investment transactions are accounted for on the trade date. Realized gains and losses are reported on the identified cost basis. Distributions to shareholders are recorded on the ex-dividend date. Income distributions are declared and paid annually. Capital gain distributions, if any, are generally declared and paid by the fund annually.
Currency Translation Assets, including investments, and liabilities denominated in foreign currencies are translated into U.S. dollar values each day at the prevailing exchange rate, using the mean of the bid and asked prices of such currencies against U.S. dollars as quoted by a major bank. Purchases and sales of securities, income, and expenses are translated into U.S. dollars at the prevailing exchange rate on the date of the transaction. The effect of changes in foreign currency exchange rates on realized and unrealized security gains and losses is reflected as a component of security gains and losses.
Rebates and Credits Subject to best execution, the fund may direct certain security trades to brokers who have agreed to rebate a portion of the related brokerage commission to the fund in cash. Commission rebates are reflected as realized gain on securities in the accompanying financial statements and totaled $49,000 for the year ended December 31, 2013. Additionally, the fund earns credits on temporarily uninvested cash balances held at the custodian, which reduce the fund’s custody charges. Custody expense in the accompanying financial statements is presented before reduction for credits.
New Accounting Guidance On January 1, 2013, the fund adopted new accounting guidance, issued by the Financial Accounting Standards Board, that requires an entity to disclose information about offsetting and related arrangements to enable users of its financial statements to understand the effect of those arrangements on its financial position. Adoption had no effect on the fund’s net assets or results of operations.
NOTE 2 - VALUATION
The fund’s financial instruments are valued, and its net asset value (NAV) per share is computed at the close of the New York Stock Exchange (NYSE), normally 4 p.m. ET, each day the NYSE is open for business.
Fair Value The fund’s financial instruments are reported at fair value, which GAAP defines as the price that would be received to sell an asset or paid to transfer a liability in an orderly transaction between market participants at the measurement date. The T. Rowe Price Valuation Committee (the Valuation Committee) has been established by the fund’s Board of Directors (the Board) to ensure that financial instruments are appropriately priced at fair value in accordance with GAAP and the 1940 Act. Subject to oversight by the Board, the Valuation Committee develops and oversees pricing-related policies and procedures and approves all fair value determinations. Specifically, the Valuation Committee establishes procedures to value securities; determines pricing techniques, sources, and persons eligible to effect fair value pricing actions; oversees the selection, services, and performance of pricing vendors; oversees valuation-related business continuity practices; and provides guidance on internal controls and valuation-related matters. The Valuation Committee reports to the fund’s Board; is chaired by the fund’s treasurer; and has representation from legal, portfolio management and trading, operations, and risk management.
Various valuation techniques and inputs are used to determine the fair value of financial instruments. GAAP establishes the following fair value hierarchy that categorizes the inputs used to measure fair value:
Level 1 – quoted prices (unadjusted) in active markets for identical financial instruments that the fund can access at the reporting date
Level 2 – inputs other than Level 1 quoted prices that are observable, either directly or indirectly (including, but not limited to, quoted prices for similar financial instruments in active markets, quoted prices for identical or similar financial instruments in inactive markets, interest rates and yield curves, implied volatilities, and credit spreads)
Level 3 – unobservable inputs
Observable inputs are developed using market data, such as publicly available information about actual events or transactions, and reflect the assumptions that market participants would use to price the financial instrument. Unobservable inputs are those for which market data are not available and are developed using the best information available about the assumptions that market participants would use to price the financial instrument. GAAP requires valuation techniques to maximize the use of relevant observable inputs and minimize the use of unobservable inputs. When multiple inputs are used to derive fair value, the financial instrument is assigned to the level within the fair value hierarchy based on the lowest-level input that is significant to the fair value of the financial instrument. Input levels are not necessarily an indication of the risk or liquidity associated with financial instruments at that level but rather the degree of judgment used in determining those values.
Valuation Techniques Equity securities listed or regularly traded on a securities exchange or in the over-the-counter (OTC) market are valued at the last quoted sale price or, for certain markets, the official closing price at the time the valuations are made. OTC Bulletin Board securities are valued at the mean of the closing bid and asked prices. A security that is listed or traded on more than one exchange is valued at the quotation on the exchange determined to be the primary market for such security. Listed securities not traded on a particular day are valued at the mean of the closing bid and asked prices for domestic securities and the last quoted sale or closing price for international securities.
For valuation purposes, the last quoted prices of non-U.S. equity securities may be adjusted to reflect the fair value of such securities at the close of the NYSE. If the fund determines that developments between the close of a foreign market and the close of the NYSE will, in its judgment, materially affect the value of some or all of its portfolio securities, the fund will adjust the previous quoted prices to reflect what it believes to be the fair value of the securities as of the close of the NYSE. In deciding whether it is necessary to adjust quoted prices to reflect fair value, the fund reviews a variety of factors, including developments in foreign markets, the performance of U.S. securities markets, and the performance of instruments trading in U.S. markets that represent foreign securities and baskets of foreign securities. The fund may also fair value securities in other situations, such as when a particular foreign market is closed but the fund is open. The fund uses outside pricing services to provide it with quoted prices and information to evaluate or adjust those prices. The fund cannot predict how often it will use quoted prices and how often it will determine it necessary to adjust those prices to reflect fair value. As a means of evaluating its security valuation process, the fund routinely compares quoted prices, the next day’s opening prices in the same markets, and adjusted prices.
Actively traded domestic equity securities generally are categorized in Level 1 of the fair value hierarchy. Non-U.S. equity securities generally are categorized in Level 2 of the fair value hierarchy despite the availability of quoted prices because, as described above, the fund evaluates and determines whether those quoted prices reflect fair value at the close of the NYSE or require adjustment. OTC Bulletin Board securities, certain preferred securities, and equity securities traded in inactive markets generally are categorized in Level 2 of the fair value hierarchy.
Investments in mutual funds are valued at the mutual fund’s closing NAV per share on the day of valuation and are categorized in Level 1 of the fair value hierarchy. Assets and liabilities other than financial instruments, including short-term receivables and payables, are carried at cost, or estimated realizable value, if less, which approximates fair value.
Thinly traded financial instruments and those for which the above valuation procedures are inappropriate or are deemed not to reflect fair value are stated at fair value as determined in good faith by the Valuation Committee. The objective of any fair value pricing determination is to arrive at a price that could reasonably be expected from a current sale. Financial instruments fair valued by the Valuation Committee are primarily private placements, restricted securities, warrants, rights, and other securities that are not publicly traded.
Subject to oversight by the Board, the Valuation Committee regularly makes good faith judgments to establish and adjust the fair valuations of certain securities as events occur and circumstances warrant. For instance, in determining the fair value of an equity investment with limited market activity, such as a private placement or a thinly traded public company stock, the Valuation Committee considers a variety of factors, which may include, but are not limited to, the issuer’s business prospects, its financial standing and performance, recent investment transactions in the issuer, new rounds of financing, negotiated transactions of significant size between other investors in the company, relevant market valuations of peer companies, strategic events affecting the company, market liquidity for the issuer, and general economic conditions and events. In consultation with the investment and pricing teams, the Valuation Committee will determine an appropriate valuation technique based on available information, which may include both observable and unobservable inputs. The Valuation Committee typically will afford greatest weight to actual prices in arm’s length transactions, to the extent they represent orderly transactions between market participants; transaction information can be reliably obtained; and prices are deemed representative of fair value. However, the Valuation Committee may also consider other valuation methods such as market-based valuation multiples; a discount or premium from market value of a similar, freely traded security of the same issuer; or some combination. Fair value determinations are reviewed on a regular basis and updated as information becomes available, including actual purchase and sale transactions of the issue. Because any fair value determination involves a significant amount of judgment, there is a degree of subjectivity inherent in such pricing decisions, and fair value prices determined by the Valuation Committee could differ from those of other market participants. Depending on the relative significance of unobservable inputs, including the valuation technique(s) used, fair valued securities may be categorized in Level 2 or 3 of the fair value hierarchy.
Valuation Inputs The following table summarizes the fund’s financial instruments, based on the inputs used to determine their fair values on December 31, 2013:
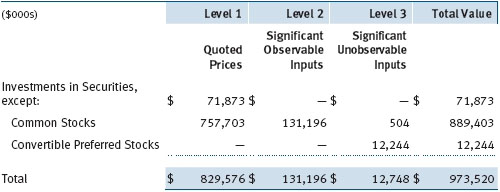
There were no material transfers between Levels 1 and 2 during the year.
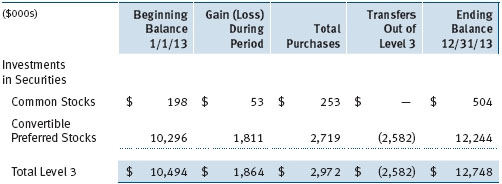
Following is a reconciliation of the fund’s Level 3 holdings for the year ended December 31, 2013. Gain (loss) reflects both realized and change in unrealized gain/loss on Level 3 holdings during the period, if any, and is included on the accompanying Statement of Operations. The change in unrealized gain/loss on Level 3 instruments held at December 31, 2013, totaled $1,864,000 for the year ended December 31, 2013. Transfers into and out of Level 3 are reflected at the value of the financial instrument at the beginning of the period. During the year, transfers out of Level 3 were because observable market data became available for the security.
NOTE 3 - OTHER INVESTMENT TRANSACTIONS
Consistent with its investment objective, the fund engages in the following practices to manage exposure to certain risks and/or to enhance performance. The investment objective, policies, program, and risk factors of the fund are described more fully in the fund’s prospectus and Statement of Additional Information.
Restricted Securities The fund may invest in securities that are subject to legal or contractual restrictions on resale. Prompt sale of such securities at an acceptable price may be difficult and may involve substantial delays and additional costs.
Other Purchases and sales of portfolio securities other than short-term securities aggregated $680,197,000 and $733,500,000, respectively, for the year ended December 31, 2013.
NOTE 4 - FEDERAL INCOME TAXES
No provision for federal income taxes is required since the fund intends to continue to qualify as a regulated investment company under Subchapter M of the Internal Revenue Code and distribute to shareholders all of its taxable income and gains. Distributions determined in accordance with federal income tax regulations may differ in amount or character from net investment income and realized gains for financial reporting purposes. Financial reporting records are adjusted for permanent book/tax differences to reflect tax character but are not adjusted for temporary differences.
The fund files U.S. federal, state, and local tax returns as required. The fund’s tax returns are subject to examination by the relevant tax authorities until expiration of the applicable statute of limitations, which is generally three years after the filing of the tax return but which can be extended to six years in certain circumstances. Tax returns for open years have incorporated no uncertain tax positions that require a provision for income taxes.
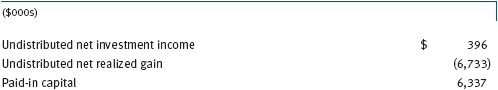
Reclassifications to paid-in capital relate primarily to a tax practice that treats a portion of the proceeds from each redemption of capital shares as a distribution of taxable net investment income or realized capital gain. Reclassifications between income and gain relate primarily to per share rounding of distributions. For the year ended December 31, 2013, the following reclassifications were recorded to reflect tax character (there was no impact on results of operations or net assets):
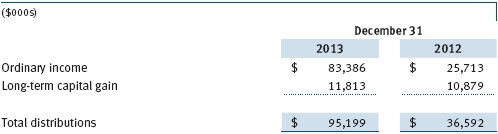
Distributions during the years ended December 31, 2013 and December 31, 2012, were characterized for tax purposes as follows:
At December 31, 2013, the tax-basis cost of investments and components of net assets were as follows:
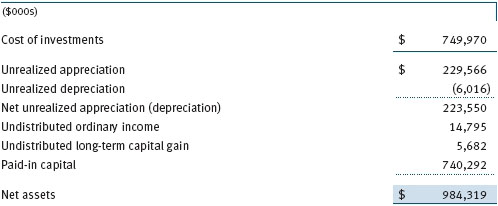
The difference between book-basis and tax-basis net unrealized appreciation (depreciation) is attributable to the deferral of losses from wash sales for tax purposes. The fund intends to retain realized gains to the extent of available capital loss carryforwards. Net realized capital losses may be carried forward indefinitely to offset future realized capital gains. During the year ended December 31, 2013, the fund utilized $233,000 of capital loss carryforwards.
NOTE 5 - RELATED PARTY TRANSACTIONS
The fund is managed by T. Rowe Price Associates, Inc. (Price Associates), a wholly owned subsidiary of T. Rowe Price Group, Inc. (Price Group). The investment management agreement between the fund and Price Associates provides for an annual investment management fee, which is computed daily and paid monthly. The fee consists of an individual fund fee, equal to 0.45% of the fund’s average daily net assets, and a group fee. The group fee rate is calculated based on the combined net assets of certain mutual funds sponsored by Price Associates (the group) applied to a graduated fee schedule, with rates ranging from 0.48% for the first $1 billion of assets to 0.275% for assets in excess of $400 billion. The fund’s group fee is determined by applying the group fee rate to the fund’s average daily net assets. At December 31, 2013, the effective annual group fee rate was 0.29%.
In addition, the fund has entered into service agreements with Price Associates and two wholly owned subsidiaries of Price Associates (collectively, Price). Price Associates computes the daily share price and provides certain other administrative services to the fund. T. Rowe Price Services, Inc., provides shareholder and administrative services in its capacity as the fund’s transfer and dividend-disbursing agent. T. Rowe Price Retirement Plan Services, Inc., provides subaccounting and recordkeeping services for certain retirement accounts invested in the fund. For the year ended December 31, 2013, expenses incurred pursuant to these service agreements were $115,000 for Price Associates; $484,000 for T. Rowe Price Services, Inc.; and $41,000 for T. Rowe Price Retirement Plan Services, Inc. The total amount payable at period-end pursuant to these service agreements is reflected as Due to Affiliates in the accompanying financial statements.
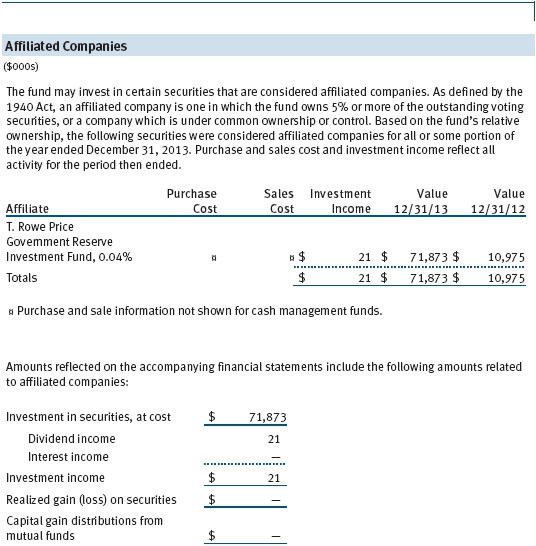
The fund may invest in the T. Rowe Price Reserve Investment Fund, the T. Rowe Price Government Reserve Investment Fund, or the T. Rowe Price Short-Term Reserve Fund (collectively, the Price Reserve Investment Funds), open-end management investment companies managed by Price Associates and considered affiliates of the fund. The Price Reserve Investment Funds are offered as short-term investment options to mutual funds, trusts, and other accounts managed by Price Associates or its affiliates and are not available for direct purchase by members of the public. The Price Reserve Investment Funds pay no investment management fees.
As of December 31, 2013, T. Rowe Price Group, Inc., or its wholly owned subsidiaries owned 539,179 shares of the fund, representing 1% of the fund’s net assets.
| Report of Independent Registered Public Accounting Firm |
To the Board of Directors and Shareholders of
T. Rowe Price Global Technology Fund, Inc.
In our opinion, the accompanying statement of assets and liabilities, including the portfolio of investments, and the related statements of operations and of changes in net assets and the financial highlights present fairly, in all material respects, the financial position of T. Rowe Price Global Technology Fund, Inc. (the “Fund”) at December 31, 2013, and the results of its operations, the changes in its net assets and the financial highlights for each of the periods indicated therein, in conformity with accounting principles generally accepted in the United States of America. These financial statements and financial highlights (hereafter referred to as “financial statements”) are the responsibility of the Fund’s management; our responsibility is to express an opinion on these financial statements based on our audits. We conducted our audits of these financial statements in accordance with the standards of the Public Company Accounting Oversight Board (United States). Those standards require that we plan and perform the audit to obtain reasonable assurance about whether the financial statements are free of material misstatement. An audit includes examining, on a test basis, evidence supporting the amounts and disclosures in the financial statements, assessing the accounting principles used and significant estimates made by management, and evaluating the overall financial statement presentation. We believe that our audits, which included confirmation of securities at December 31, 2013 by correspondence with the custodian and brokers, and confirmation of the underlying funds by correspondence with the transfer agent, provide a reasonable basis for our opinion.
PricewaterhouseCoopers LLP
Baltimore, Maryland
February 14, 2014
| Tax Information (Unaudited) for the Tax Year Ended 12/31/13 |
We are providing this information as required by the Internal Revenue Code. The amounts shown may differ from those elsewhere in this report because of differences between tax and financial reporting requirements.
The fund’s distributions to shareholders included:
- $88,435,000 from short-term capital gains,
- $12,802,000 from long-term capital gains, subject to the 15% rate gains category.
For taxable non-corporate shareholders, $7,294,000 of the fund’s income represents qualified dividend income subject to the 15% rate category.
For corporate shareholders, $5,959,000 of the fund’s income qualifies for the dividends-received deduction.
| Information on Proxy Voting Policies, Procedures, and Records |
A description of the policies and procedures used by T. Rowe Price funds and portfolios to determine how to vote proxies relating to portfolio securities is available in each fund’s Statement of Additional Information. You may request this document by calling 1-800-225-5132 or by accessing the SEC’s website, sec.gov.
The description of our proxy voting policies and procedures is also available on our website, troweprice.com. To access it, click on the words “Social Responsibility” at the top of our corporate homepage. Next, click on the words “Conducting Business Responsibly” on the left side of the page that appears. Finally, click on the words “Proxy Voting Policies” on the left side of the page that appears.
Each fund’s most recent annual proxy voting record is available on our website and through the SEC’s website. To access it through our website, follow the above directions to reach the “Conducting Business Responsibly” page. Click on the words “Proxy Voting Records” on the left side of that page, and then click on the “View Proxy Voting Records” link at the bottom of the page that appears.
| How to Obtain Quarterly Portfolio Holdings |
The fund files a complete schedule of portfolio holdings with the Securities and Exchange Commission for the first and third quarters of each fiscal year on Form N-Q. The fund’s Form N-Q is available electronically on the SEC’s website (sec.gov); hard copies may be reviewed and copied at the SEC’s Public Reference Room, 100 F St. N.E., Washington, DC 20549. For more information on the Public Reference Room, call 1-800-SEC-0330.
| About the Fund’s Directors and Officers |
Your fund is overseen by a Board of Directors (Board) that meets regularly to review a wide variety of matters affecting or potentially affecting the fund, including performance, investment programs, compliance matters, advisory fees and expenses, service providers, and business and regulatory affairs. The Board elects the fund’s officers, who are listed in the final table. At least 75% of the Board’s members are independent of T. Rowe Price Associates, Inc. (T. Rowe Price), and its affiliates; “inside” or “interested” directors are employees or officers of T. Rowe Price. The business address of each director and officer is 100 East Pratt Street, Baltimore, Maryland 21202. The Statement of Additional Information includes additional information about the fund directors and is available without charge by calling a T. Rowe Price representative at 1-800-638-5660.
| Independent Directors | ||
| Name | ||
| (Year of Birth) | ||
| Year Elected* | ||
| [Number of T. Rowe Price | Principal Occupation(s) and Directorships of Public Companies and | |
| Portfolios Overseen] | Other Investment Companies During the Past Five Years | |
| William R. Brody, M.D., Ph.D. | President and Trustee, Salk Institute for Biological Studies (2009 | |
| (1944) | to present); Director, Novartis, Inc. (2009 to present); Director, IBM | |
| 2009 | (2007 to present); President and Trustee, Johns Hopkins University | |
| [157] | (1996 to 2009); Chairman of Executive Committee and Trustee, | |
| Johns Hopkins Health System (1996 to 2009) | ||
| Anthony W. Deering | Chairman, Exeter Capital, LLC, a private investment firm (2004 to | |
| (1945) | present); Director and Member of the Advisory Board, Deutsche | |
| 2001 | Bank North America (2004 to present); Director, Under Armour | |
| [157] | (2008 to present); Director, Vornado Real Estate Investment Trust | |
| (2004 to 2012) | ||
| Donald W. Dick, Jr. | Principal, EuroCapital Partners, LLC, an acquisition and management | |
| (1943) | advisory firm (1995 to present) | |
| 2000 | ||
| [157] | ||
| Bruce W. Duncan | President, Chief Executive Officer, and Director, First Industrial Realty | |
| (1951) | Trust, owner and operator of industrial properties (2009 to present); | |
| 2013 | Chairman of the Board (2005 to present), Interim Chief Executive | |
| [157] | Officer (2007), and Director (1999 to present), Starwood Hotels & | |
| Resorts, a hotel and leisure company; Senior Advisor, Kohlberg, | ||
| Kravis, Roberts & Co. LP, a global investment firm (2008 to 2009); | ||
| Trustee, Starwood Lodging Trust, a real estate investment trust and | ||
| former subsidiary of Starwood (1995 to 2006) | ||
| Robert J. Gerrard, Jr. | Advisory Board Member, Pipeline Crisis/Winning Strategies (1997 | |
| (1952) | to present); Chairman of Compensation Committee and Director, | |
| 2012 | Syniverse Holdings, Inc. (2008 to 2011); Executive Vice President | |
| [157] | and General Counsel, Scripps Networks, LLC (1997 to 2009) | |
| Karen N. Horn | Limited Partner and Senior Managing Director, Brock Capital Group, | |
| (1943) | an advisory and investment banking firm (2004 to present); Director, | |
| 2003 | Eli Lilly and Company (1987 to present); Director, Simon Property | |
| [157] | Group (2004 to present); Director, Norfolk Southern (2008 to | |
| present); Director, Fannie Mae (2006 to 2008) | ||
| Paul F. McBride | Former Company Officer and Senior Vice President, Human Resources | |
| (1956) | and Corporate Initiatives (2004 to 2010) | |
| 2013 | ||
| [157] | ||
| Cecilia E. Rouse, Ph.D. | Dean, Woodrow Wilson School (2012 to present); Professor and | |
| (1963) | Researcher, Princeton University (1992 to present); Director, MDRC | |
| 2012 | (2011 to present); Member, National Academy of Education (2010 | |
| [157] | to present); Research Associate, National Bureau of Economic | |
| Research’s Labor Studies Program (1998 to 2009 and 2011 to | ||
| present); Member, President’s Council of Economic Advisors | ||
| (2009 to 2011); Member, The MacArthur Foundation Network on | ||
| the Transition to Adulthood and Public Policy (2000 to 2008); | ||
| Member, National Advisory Committee for the Robert Wood | ||
| Johnson Foundation’s Scholars in Health Policy Research Program | ||
| (2008); Director and Member, National Economic Association | ||
| (2006 to 2008); Member, Association of Public Policy Analysis and | ||
| Management Policy Council (2006 to 2008); Member, Hamilton | ||
| Project’s Advisory Board at The Brookings Institute (2006 to 2008); | ||
| Chair of Committee on the Status of Minority Groups in the Economic | ||
| Profession, American Economic Association (2006 to 2008 and | ||
| 2012 to present) | ||
| John G. Schreiber | Owner/President, Centaur Capital Partners, Inc., a real estate | |
| (1946) | investment company (1991 to present); Cofounder and Partner, | |
| 2001 | Blackstone Real Estate Advisors, L.P. (1992 to present); Director, | |
| [157] | General Growth Properties, Inc. (2010 to present); Director, BXMT | |
| (formerly Capital Trust, Inc.), a real estate investment company | ||
| (2012 to present); Director and Chairman of the Board, Brixmor | ||
| Property Group, Inc. (2013 to present) | ||
| Mark R. Tercek | President and Chief Executive Officer, The Nature Conservancy (2008 | |
| (1957) | to present); Managing Director, The Goldman Sachs Group, Inc. | |
| 2009 | (1984 to 2008) | |
| [157] | ||
| *Each independent director serves until retirement, resignation, or election of a successor. | ||
| Inside Directors | ||
| Name | ||
| (Year of Birth) | ||
| Year Elected* | ||
| [Number of T. Rowe Price | Principal Occupation(s) and Directorships of Public Companies and | |
| Portfolios Overseen] | Other Investment Companies During the Past Five Years | |
| Edward C. Bernard | Director and Vice President, T. Rowe Price; Vice Chairman of the | |
| (1956) | Board, Director, and Vice President, T. Rowe Price Group, Inc.; | |
| 2006 | Chairman of the Board, Director, and President, T. Rowe Price | |
| [157] | Investment Services, Inc.; Chairman of the Board and Director, | |
| T. Rowe Price Retirement Plan Services, Inc., and T. Rowe Price | ||
| Services, Inc.; Chairman of the Board, Chief Executive Officer, | ||
| and Director, T. Rowe Price International; Chairman of the Board, | ||
| Chief Executive Officer, Director, and President, T. Rowe Price Trust | ||
| Company; Chairman of the Board, all funds | ||
| Brian C. Rogers, CFA, CIC | Chief Investment Officer, Director, and Vice President, T. Rowe Price; | |
| (1955) | Chairman of the Board, Chief Investment Officer, Director, and Vice | |
| 2006 | President, T. Rowe Price Group, Inc.; Vice President, T. Rowe Price | |
| [105] | Trust Company | |
| *Each inside director serves until retirement, resignation, or election of a successor. | ||
| Officers | ||
| Name (Year of Birth) | ||
| Position Held With Global Technology Fund | Principal Occupation(s) | |
| Kennard W. Allen (1977) | Vice President, T. Rowe Price and T. Rowe Price | |
| Vice President | Group, Inc. | |
| P. Robert Bartolo, CFA, CPA (1972) | Vice President, T. Rowe Price, T. Rowe Price | |
| Vice President | Group, Inc., and T. Rowe Price Trust Company | |
| Christopher W. Carlson (1967) | Vice President, T. Rowe Price and T. Rowe Price | |
| Vice President | Group, Inc. | |
| David J. Eiswert, CFA (1972) | Vice President, T. Rowe Price, T. Rowe Price | |
| Vice President | Group, Inc., and T. Rowe Price International | |
| Henry M. Ellenbogen (1973) | Vice President, T. Rowe Price, T. Rowe Price | |
| Vice President | Group, Inc., and T. Rowe Price Trust Company | |
| Roger L. Fiery III, CPA (1959) | Vice President, Price Hong Kong, Price | |
| Vice President | Singapore, T. Rowe Price, T. Rowe Price Group, | |
| Inc., T. Rowe Price International, and T. Rowe | ||
| Price Trust Company | ||
| John R. Gilner (1961) | Chief Compliance Officer and Vice President, | |
| Chief Compliance Officer | T. Rowe Price; Vice President, T. Rowe Price | |
| Group, Inc., and T. Rowe Price Investment | ||
| Services, Inc. | ||
| Gregory S. Golczewski (1966) | Vice President, T. Rowe Price and T. Rowe Price | |
| Vice President | Trust Company | |
| Paul D. Greene II (1978) | Vice President, T. Rowe Price and T. Rowe Price | |
| Vice President | Group, Inc. | |
| Gregory K. Hinkle, CPA (1958) | Vice President, T. Rowe Price, T. Rowe Price | |
| Treasurer | Group, Inc., and T. Rowe Price Trust Company | |
| Rhett K. Hunter (1977) | Vice President, T. Rowe Price and T. Rowe Price | |
| Vice President | Group, Inc. | |
| Patricia B. Lippert (1953) | Assistant Vice President, T. Rowe Price and | |
| Secretary | T. Rowe Price Investment Services, Inc. | |
| Daniel Martino, CFA (1974) | Vice President, T. Rowe Price and T. Rowe Price | |
| Vice President | Group, Inc. | |
| Heather K. McPherson, CPA (1967) | Vice President, T. Rowe Price and T. Rowe Price | |
| Vice President | Group, Inc. | |
| Tobias F. Mueller (1980) | Vice President, T. Rowe Price Group, Inc., and | |
| Vice President | T. Rowe Price International; formerly intern, | |
| T. Rowe Price (to 2011); Investment Analyst, | ||
| Noric Mexxanine UK Limited and Consultant, | ||
| Victoria Capital Advisors LLC (to 2009) | ||
| David Oestreicher (1967) | Director, Vice President, and Secretary, T. Rowe | |
| Vice President | Price Investment Services, Inc., T. Rowe | |
| Price Retirement Plan Services, Inc., T. Rowe | ||
| Price Services, Inc., and T. Rowe Price Trust | ||
| Company; Chief Legal Officer, Vice President, | ||
| and Secretary, T. Rowe Price Group, Inc.; Vice | ||
| President and Secretary, T. Rowe Price and | ||
| T. Rowe Price International; Vice President, | ||
| Price Hong Kong and Price Singapore | ||
| Hiroaki Owaki, CFA (1962) | Vice President, T. Rowe Price Group, Inc. and | |
| Vice President | T. Rowe Price International | |
| Deborah D. Seidel (1962) | Vice President, T. Rowe Price, T. Rowe Price | |
| Vice President | Group, Inc., T. Rowe Price Investment Services, | |
| Inc., and T. Rowe Price Services, Inc. | ||
| Michael F. Sola, CFA (1969) | Vice President, T. Rowe Price and T. Rowe Price | |
| Vice President | Group, Inc. | |
| Joshua K. Spencer, CFA (1973) | Vice President, T. Rowe Price and T. Rowe Price | |
| President | Group, Inc. | |
| Julie L. Waples (1970) | Vice President, T. Rowe Price | |
| Vice President | ||
| Thomas H. Watson (1977) | Vice President, T. Rowe Price and T. Rowe Price | |
| Vice President | Group, Inc. | |
| Justin P. White (1981) | Vice President, T. Rowe Price and T. Rowe Price | |
| Vice President | Group, Inc. | |
| Alison Mei Ling Yip (1966) | Vice President, Price Hong Kong and T. Rowe | |
| Vice President | Price Group, Inc. | |
| Unless otherwise noted, officers have been employees of T. Rowe Price or T. Rowe Price International for at least 5 years. | ||
Item 2. Code of Ethics.
The registrant has adopted a code of ethics, as defined in Item 2 of Form N-CSR, applicable to its principal executive officer, principal financial officer, principal accounting officer or controller, or persons performing similar functions. A copy of this code of ethics is filed as an exhibit to this Form N-CSR. No substantive amendments were approved or waivers were granted to this code of ethics during the period covered by this report.
Item 3. Audit Committee Financial Expert.
The registrant’s Board of Directors/Trustees has determined that Mr. Anthony W. Deering qualifies as an audit committee financial expert, as defined in Item 3 of Form N-CSR. Mr. Deering is considered independent for purposes of Item 3 of Form N-CSR.
Item 4. Principal Accountant Fees and Services.
(a) – (d) Aggregate fees billed for the last two fiscal years for professional services rendered to, or on behalf of, the registrant by the registrant’s principal accountant were as follows:
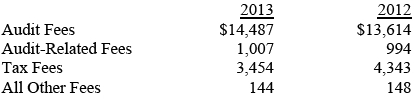
Audit fees include amounts related to the audit of the registrant’s annual financial statements and services normally provided by the accountant in connection with statutory and regulatory filings. Audit-related fees include amounts reasonably related to the performance of the audit of the registrant’s financial statements and specifically include the issuance of a report on internal controls and, if applicable, agreed-upon procedures related to fund acquisitions. Tax fees include amounts related to services for tax compliance, tax planning, and tax advice. The nature of these services specifically includes the review of distribution calculations and the preparation of Federal, state, and excise tax returns. All other fees include the registrant’s pro-rata share of amounts for agreed-upon procedures in conjunction with service contract approvals by the registrant’s Board of Directors/Trustees.
(e)(1) The registrant’s audit committee has adopted a policy whereby audit and non-audit services performed by the registrant’s principal accountant for the registrant, its investment adviser, and any entity controlling, controlled by, or under common control with the investment adviser that provides ongoing services to the registrant require pre-approval in advance at regularly scheduled audit committee meetings. If such a service is required between regularly scheduled audit committee meetings, pre-approval may be authorized by one audit committee member with ratification at the next scheduled audit committee meeting. Waiver of pre-approval for audit or non-audit services requiring fees of a de minimis amount is not permitted.
(2) No services included in (b) – (d) above were approved pursuant to paragraph (c)(7)(i)(C) of Rule 2-01 of Regulation S-X.
(f) Less than 50 percent of the hours expended on the principal accountant’s engagement to audit the registrant’s financial statements for the most recent fiscal year were attributed to work performed by persons other than the principal accountant’s full-time, permanent employees.
(g) The aggregate fees billed for the most recent fiscal year and the preceding fiscal year by the registrant’s principal accountant for non-audit services rendered to the registrant, its investment adviser, and any entity controlling, controlled by, or under common control with the investment adviser that provides ongoing services to the registrant were $1,691,000 and $1,802,000, respectively.
(h) All non-audit services rendered in (g) above were pre-approved by the registrant’s audit committee. Accordingly, these services were considered by the registrant’s audit committee in maintaining the principal accountant’s independence.
Item 5. Audit Committee of Listed Registrants.
Not applicable.
Item 6. Investments.
(a) Not applicable. The complete schedule of investments is included in Item 1 of this Form N-CSR.
(b) Not applicable.
Item 7. Disclosure of Proxy Voting Policies and Procedures for Closed-End Management Investment Companies.
Not applicable.
Item 8. Portfolio Managers of Closed-End Management Investment Companies.
Not applicable.
Item 9. Purchases of Equity Securities by Closed-End Management Investment Company and Affiliated Purchasers.
Not applicable.
Item 10. Submission of Matters to a Vote of Security Holders.
Not applicable.
Item 11. Controls and Procedures.
(a) The registrant’s principal executive officer and principal financial officer have evaluated the registrant’s disclosure controls and procedures within 90 days of this filing and have concluded that the registrant’s disclosure controls and procedures were effective, as of that date, in ensuring that information required to be disclosed by the registrant in this Form N-CSR was recorded, processed, summarized, and reported timely.
(b) The registrant’s principal executive officer and principal financial officer are aware of no change in the registrant’s internal control over financial reporting that occurred during the registrant’s second fiscal quarter covered by this report that has materially affected, or is reasonably likely to materially affect, the registrant’s internal control over financial reporting.
Item 12. Exhibits.
(a)(1) The registrant’s code of ethics pursuant to Item 2 of Form N-CSR is attached.
(b) A certification by the registrant's principal executive officer and principal financial officer, pursuant to Section 906 of the Sarbanes-Oxley Act of 2002 and required by Rule 30a-2(b) under the Investment Company Act of 1940, is attached.
SIGNATURES
Pursuant to the requirements of the Securities Exchange Act of 1934 and the Investment Company Act of 1940, the registrant has duly caused this report to be signed on its behalf by the undersigned, thereunto duly authorized.
T. Rowe Price Global Technology Fund, Inc.
| By | /s/ Edward C. Bernard | |
| Edward C. Bernard | ||
| Principal Executive Officer | ||
| Date February 14, 2014 | ||
Pursuant to the requirements of the Securities Exchange Act of 1934 and the Investment Company Act of 1940, this report has been signed below by the following persons on behalf of the registrant and in the capacities and on the dates indicated.
| By | /s/ Edward C. Bernard | |
| Edward C. Bernard | ||
| Principal Executive Officer | ||
| Date February 14, 2014 | ||
| By | /s/ Gregory K. Hinkle | |
| Gregory K. Hinkle | ||
| Principal Financial Officer | ||
| Date February 14, 2014 | ||