UNITED STATES
SECURITIES AND EXCHANGE COMMISSION
Washington, D.C. 20549
FORM 10-K
ANNUAL REPORT PURSUANT TO SECTION 13 OR 15(d) OF
THE SECURITIES EXCHANGE ACT OF 1934
For the fiscal year ended September 30, 2005
Commission File Number 0-30911
THE PBSJ CORPORATION
(Exact name of Registrant as specified in its charter)
| | |
| Florida | | 59-1494168 |
(State or other jurisdiction of Incorporation or organization) | | (I.R.S. Employer Identification No.) |
5300 West Cypress Street, Suite 200
Tampa, Florida 33607
(Address of principal executive offices)
(813) 282-7275
(Registrant’s telephone number, including area code)
Securities registered pursuant to Section 12(b) of the Act: None
Securities registered pursuant to Section 12(g) of the Act:
Common Stock ($.00067 Par Value)
(Title of class)
Indicate by check mark if the registrant is a well-known seasoned issuer, as defined in Rule 405 of the Securities Act. ¨ Yes x No
Indicate by check mark if the registrant is not required to file reports pursuant to Section 13 or Section 15(d) of the Act. ¨ Yes x No
Indicate by check mark whether the registrant (1) has filed all reports required to be filed by Section 13 or 15(d) of the Securities Exchange Act of 1934 during the preceding 12 months (or for such shorter period that the registrant was required to file such reports), and (2) has been subject to such filings for the past 90 days. ¨ Yes x No
Indicate by check mark if disclosure of delinquent filers pursuant to Item 405 of Regulation S-K (§229.405 of this chapter) is not contained herein, and will not be contained, to the best of the registrant’s knowledge, in definitive proxy or information statements incorporated by reference in Part III of this Form 10-K or any amendment of this Form 10-K. ¨
Indicate by check mark whether the registrant is a large accelerated filer, an accelerated filer, or a non-accelerated filer. See definition of “accelerated filer and large accelerated filer” in Rule 12b-2 of the Exchange Act. (Check one):
¨ Large accelerated filer ¨ Accelerated filer x Non-accelerated filer
Indicate by check mark whether the registrant is a shell company (as defined by Rule 12b-2 of the Act). ¨ Yes x No
The number of shares of Common Stock outstanding as of December 31, 2006 was 6,812,200. The aggregate value of the voting stock held by non-affiliates of the registrant based on the $28.00 price for the registrant’s Common Stock on March 31, 2005 was approximately $82,444,008. Directors, executive officers and 10% or greater shareholders are considered affiliates for purposes of this calculation but should not necessarily be deemed affiliates for any other purpose. There is no public trading market for the registrant’s common stock.
THE PBSJ CORPORATION
Form 10-K
For the Year Ended September 30, 2005
Table of Contents
2
CAUTIONARY NOTE REGARDING FORWARD-LOOKING STATEMENTS
This Annual Report and the information incorporated by reference in it include and are based on “forward-looking statements” within the meaning of Section 27A of the Securities Act of 1933 and Section 21E of the Securities Exchange Act of 1934. We intend these forward-looking statements to be covered by the safe harbor provisions for forward-looking statements in these sections. These statements can sometimes be identified by the fact that they do not relate strictly to historical or current facts and they frequently are accompanied by words such as “may,” “will,” “anticipate,” “estimate,” “expect,” or “intend” and similar terms and expressions. All statements regarding our expected financial position and operating results, our business strategy, our financing plans and forecasted demographic and economic trends relating to our industry, and statements relating to our ability to be awarded government contracts, the adoption of certain laws by Congress, our ability to compete effectively with other firms that provide similar services, our ability to attract and retain clients, our ability to achieve future growth and success, our expectations for the public and private sector economic growth, the outcome of our internal investigation and the various on-going government investigations, are forward-looking statements. These forward-looking statements involve known and unknown risks, uncertainties and other factors that may cause our actual results, performance or achievements to be materially different from the results, performance or achievements expressed or implied by the forward-looking statements. We cannot promise you that our expectations in such forward-looking statements will turn out to be correct. Factors that may impact such forward-looking statements include, among others, our ability to attract additional business, the timing of projects and the potential for contract cancellation by our customers, our ability to attract and retain skilled employees, our ability to comply with new laws and regulations, our insurance coverage covering certain events, the timing and amount of the spending bills adopted by the federal government and the states, our ability to complete our internal investigation in a timely matter, the outcome of the investigations by the Department of Justice, the United States Attorney’s Office, the Securities and Exchange Commission, the Federal Bureau of Investigation, possible changes in collections of accounts receivable, risks of competition, changes in general economic conditions and interest rates, the risk that the Internal Revenue Service or the courts may not accept the amount or nature of one or more items of deduction, loss, income or gain we report for tax purposes and the possible outcome of pending litigation, legal proceedings and governmental investigations and our actions in connection with such litigation, proceedings and investigations, as well as certain other risks including those set forth under the heading “Risk Factors” and elsewhere in this Annual Report and in other reports filed by the Company with the Securities and Exchange Commission. All forward-looking statements included herein are only made as of the date such statements are made, and we do not undertake any obligation to update or revise publicly any forward-looking statements, whether as a result of new information, future events or otherwise. Subsequent written and oral forward-looking statements attributable to the Company or to persons acting on its behalf are qualified in their entirety to the cautionary statements set forth above and elsewhere in this Annual Report and in other reports filed by the Company with the Securities and Exchange Commission.
PART I
ITEM 1.Business
General
The PBSJ Corporation (the “Company”), together with its subsidiaries, is an employee-owned professional services organization that provides a broad range of planning, design and construction services to a variety of public and private sector clients. Our four major business segments are transportation services, environmental services, civil engineering and construction management, representing 39%, 22%, 22%, and 17%, respectively, of our fiscal year ended September 30, 2005 revenues. We utilize our expertise in engineering, planning, management, environmental, architectural and surveying disciplines to address complex problems in each of these basic service areas. We provide these services through our staff of approximately 3,800 professional, technical and support personnel. We believe our multi-disciplinary approach to problems facilitates our ability to effectively meet the needs of our clients.
3
Since our founding in 1960, we have grown from a small civil engineering practice with operations only in South Florida to a national design firm offering a full range of engineering, construction management, architectural and planning services throughout the United States. Evidencing this, in 2005,Engineering News-Record ranked Post, Buckley, Schuh & Jernigan, Inc., a subsidiary of the Company, third on its list of the top 100 pure design firms (traditional design firms with no construction capability) in the United States, based on design revenue. During fiscal 2005, we provided services to approximately 3,000 clients in the public and private sectors. Approximately 90% of our clients had previously used our services. In fiscal 2005, 77% of our net earned revenues (“NER”) were derived from the public sector and 23% from the private sector.
We have built an organization composed of highly skilled professionals and top-level technical and administrative personnel with a wide variety of scientific, engineering, architectural and management resources. These resources enable us to develop and implement innovative long-term solutions to the complex problems of our clients, many of which are the subject of public concern and extensive governmental regulation. We assist our clients in responding to these concerns, in obtaining governmental permits and approvals and in complying with applicable laws and regulations.
We began operations on February 29, 1960. Our holding company, The PBSJ Corporation, was incorporated in 1973. We engage in business primarily through two wholly-owned subsidiaries: Post, Buckley, Schuh & Jernigan, Inc., a Florida corporation (through which we provide the majority of our engineering, architectural and planning services) and PBS&J Construction Services, Inc., a Florida corporation (through which we have certain large contracts for our construction management services). In addition, we have three other active subsidiaries: Seminole Development Corporation and Seminole Development II, Inc. (through which we hold title to certain of our real property); and PBS&J Caribe Engineering, C.S.P. (through which we perform certain work in Puerto Rico). In this Form 10-K, all references to “PBSJ”, the “Company”, “us”, “we” or “our” operations refer to The PBSJ Corporation and its wholly-owned subsidiaries and the activities of these entities on a consolidated basis. Our executive offices are located at 5300 West Cypress Street, Suite 200, Tampa, Florida.
Restatement of Financial Statements
In March 2005, subsequent to the issuance of the Company’s 2004 financial statements, we discovered misappropriations of Company funds by our former Chief Financial Officer and two former employees who worked in our information systems and treasury departments, collectively, (“the participants”). The participants colluded and circumvented controls to misappropriate funds and conceal the misappropriations possibly beginning as early as 1993 until the misappropriations were discovered.
Shortly after this discovery, an investigation sub-committee was formed comprised of the three outside members of our Corporate Audit Committee. These three outside members were subsequently appointed to the Board of Directors and became the three members of the Audit Committee of the Board of Directors. The Audit Committee retained independent counsel to conduct an investigation and advise the Audit Committee in connection with the investigation. The independent counsel retained forensic accountants, including accountants experienced in conducting forensic audits for companies that perform contracts for federal, state and local governments to assist with the investigation.
The investigation team discovered that at least $36.6 million was misappropriated between January 1, 1998 and the discovery of the misappropriations in March 2005. The amount misappropriated prior to January 1, 1998 could not be determined because certain data for the period prior to January 1, 1998 was unavailable. The participants in the embezzlement scheme used several methods to misappropriate the funds while engaging in conduct to conceal the misappropriated amounts. This conduct included among other things, recording and changing normal recurring journal entries and overstating accruals in prior periods to facilitate improper write-offs of misappropriated funds.
The Company determined that the misappropriation scheme led to the overstatement of overhead rates that the Company used to determine billings in connection with certain of our government contracts. As a result,
4
some of our government clients were overcharged for the Company’s services. During the review of the overhead rate calculations, the Company identified certain instances of costs erroneously included in our overhead cost pool which were unallowable under applicable regulations and an error in our calculation of our overhead rate, which related to certain general and administrative costs. The Company determined that the unallowable costs and general and administrative errors also led to the overstatement of overhead rates which the Company used in connection with certain government contracts.
The Audit Committee, at the direction of the Corporate Board, disclosed the overstatement of our overhead rate to our clients and other appropriate government agencies, including the Department of Justice (“DOJ”). We have been cooperating with our clients and such agencies to determine the amount of our reimbursement obligations and any other amounts we may be obligated to pay in order to resolve these issues. The DOJ and the United States Security and Exchange Commission have been investigating the misappropriations and the overstatement of overhead rates.
The Company determined corrected overhead rates considering the impact of the misappropriations and considering the impact of additional errors identified. The Company has also recorded a related reduction in revenue, an increase in interest expense and a corresponding liability in each relevant year in its restated financial statements.
In July 2006, we entered into a settlement agreement with the State of Texas, Department of Transportation which resolves all claims that the State of Texas may have had against us for overpayments related to the restatement of overhead rates on billings on or before April 30, 2006 under contracts with that agency based on our payment of approximately $5.4 million and provides for the determination of the appropriate overhead rate for billings after April 30, 2006. In November 2006, we entered into a settlement agreement with the Florida Department of Transportation which resolves all claims that agency may have had against us for the overstatement of rates on billings through September 30, 2005 (and with respect to cost contracts through September 30, 2006) under our contracts with them based on our payment of approximately $12.5 million. This settlement agreement also provides for the determination of the appropriate overhead rate for fiscal year 2006 billings under fixed price contracts.
In January 2007, we reached a settlement agreement with the Department of Justice, Civil Division on behalf of it and all other federal agencies with which we have contracts to resolve all federal claims including claims under the Federal Civil False Claims Act, related to the overstatements of overhead rates on our contracts with federal agencies. The agreement requires approximately $6.5 million of reimbursement payments for all contract amounts through September 30, 2005.
The settlements described above are included in the accrued reimbursement liability in the Company’s consolidated financial statements. We are in discussions with our remaining government clients to enter into settlement agreements in order to satisfy any refund obligations, which are in various stages of settlement. We currently expect that these payments will not exceed our accrued reimbursement liability.
In this Annual Report, we have restated our previously issued consolidated financial statements as of September 30, 2004 and for the years ended September 30, 2004 and 2003, as well as selected financial data as of September 30, 2003, 2002 and 2001, and for the years ended September 30, 2002 and 2001, primarily to reflect adjustments relating to the effects of the misappropriations and related concealment accounting and the correction of revenue amounts charged to certain of our government clients due to the errors in our overhead rates discussed above, in addition to certain other adjustments more fully described in “Management’s Discussion and Analysis of Financial Condition and Results of Operations” and in Note 2 to our restated consolidated financial statements included elsewhere in this Annual Report.
We have not amended and will not be amending our previously filed Annual Reports on Form 10-K for the restatement, and accordingly the consolidated financial statements and related financial statement information contained in those reports should no longer be relied upon, as previously reported on Form 8-K dated March 28, 2005. Throughout this Annual Report, all amounts presented from prior periods and prior period comparisons are labeled as “Restated” and reflect the balances and amounts on a restated basis.
5
Acquisitions
Throughout our history, we have made strategic acquisitions. Once we acquire a firm, it is integrated and consolidated into our existing operations and ceases to exist as a separate operating entity. We completed the following acquisitions during the last three fiscal years. The results of operations are included in the consolidated financial statements from the date of acquisition.
| | • | | We acquired all of the outstanding stock of Durham Technologies, Inc. (“DTI”) on December 1, 2002 for $1.5 million, net of cash acquired. DTI’s practice included risk modeling, risk assessment and risk management for public sector clients, primarily federal agencies. DTI’s expertise combined with PBSJ’s network of offices greatly enhanced our ability to provide emergency response and emergency management services to our clients and has resulted in substantial growth of these services. The purchase price was allocated to the respective assets and liabilities based upon their estimated fair values as of the acquisition date. The allocation of the purchase price resulted in assets of $1.7 million, including approximately $687,000 of goodwill, $484,000 of identifiable intangible assets and liabilities of $247,000. |
| | • | | On March 19, 2003, we acquired all of the outstanding stock of Welker & Associates, Inc. (“Welker”) for $4.4 million, comprised of $4.0 million in cash and 20,000 shares of our common stock valued at approximately $400,000. The purchase price was allocated to the respective assets and liabilities based upon their estimated fair values as of the acquisition date. The allocation of the purchase price resulted in assets of $5.1 million, including approximately $2.2 million of goodwill, $1.2 million of identifiable intangible assets and liabilities of $703,000. During 2005 and 2004, we recorded approximately $1.7 million and $1.9 million of additional goodwill in connection with performance earn-out payments. Welker’s expertise includes water, wastewater and storm water system design and management for municipal government. The Welker acquisition enhances our presence and technical capabilities in the growing Atlanta water market. |
| | • | | On June 1, 2004, we acquired all of the outstanding stock of TriLine Associates, Inc. (“TriLine”) for $3.7 million in cash. The purchase price was allocated to the respective assets and liabilities based upon their estimated fair values as of the acquisition date. The allocation of the purchase price resulted in assets of $4.3 million, including approximately $960,000 of intangible assets and $2.1 million of goodwill and liabilities of $625,000. During 2005, we recorded $10,000 of additional goodwill in connection with a purchase accounting true-up payment. TriLine’s expertise includes transportation, geotechnical, and environmental services. The TriLine acquisition enhances our presence in the transportation market in the greater Pittsburgh area and the State of Pennsylvania. |
| | • | | On July 1, 2004, the Company acquired 100% of the stock of W. Koo and Associates Structural Engineers, Inc. (“WKA”) for $2.5 million, net of cash acquired of $678,000, comprised of $413,000 in cash, $250,000 in accrued additional purchase price and 71,429 shares of the Company’s common stock valued at approximately $1.9 million. The purchase agreement calls for an adjustment of the number of shares issued based on the valuation of the Company’s stock price at September 30, 2004 so that the total number of shares issued is valued at approximately $1.9 million. |
The purchase agreement also called for an additional purchase amount of $500,000, contingent upon the satisfaction of certain conditions, to be paid in two installments of $250,000 on July 1, 2005 and July 1, 2006. The purchase price was allocated to the respective assets and liabilities based on their estimated fair values as of the acquisition date. The allocation of the purchase price resulted in assets of $4.0 million, including approximately $850,000 of intangible assets and $913,000 of goodwill and liabilities of $795,000.
6
During 2005, we issued an additional 1,021 shares in connection with the purchase agreement adjustment and we recorded an additional $6,000 of goodwill in connection with the July 1, 2005 installment payment. In 2006, the Company recorded additional goodwill of $389,000 in connection with the July 1, 2006 installment payment. WKA’s expertise includes infrastructure improvements for public, municipal, transit, port authorities and private sector projects with a primary focus on transportation structures in California. The WKA acquisition strengthens our technical capabilities in bridge design and structural project management, particularly in the West.
| | • | | On October 1, 2004, we acquired 100% of the stock of Croslin Associates, Inc. (“Croslin”) for a purchase price of $786,000, net of cash acquired of $153,000, comprised of $457,000 in cash, $30,000 held in escrow and 11,111 shares of our common stock valued at approximately $300,000. The purchase price was allocated to the respective assets and liabilities based upon their estimated fair values as of the acquisition date. The allocation of the purchase price resulted in assets of $1.2 million, including approximately $40,000 of intangibles and $454,000 of goodwill and liabilities of $330,000. Croslin is an architectural services firm. The Croslin acquisition contributes to the Company’s goal of developing technical and production resources to extend its successful architectural practice into additional markets in the Central and Western U.S. |
| | • | | On February 1, 2005, we acquired 100% of the stock of Land and Water Consulting, Inc. (“LWC”) for a purchase price of $1.3 million, net of cash acquired of $13,000, comprised of $323,000 in cash, $100,000 held in escrow and 33,862 shares of our common stock valued at approximately $914,000. The purchase price was allocated to the respective assets and liabilities based upon their estimated fair values as of the acquisition date. The allocation of the purchase price resulted in assets of $2.5 million, including approximately $63,000 of intangibles and $1.1 million of goodwill and liabilities of $1.2 million. LWC is an environmental consulting firm in Montana. The LWC acquisition enhances our technical capabilities in the environmental services market in the Northwest and West. |
| | • | | On April 30, 2006, we acquired 100% of the stock of EIP Associates (“EIP”) for a purchase price of $5.5 million in cash, net of $200,000 held in escrow. EIP specializes in environmental, urban planning, water resource planning and natural resources services in California. The EIP acquisition greatly enhances our technical strength in the California environmental, water and planning markets, and enhances our general presence in California. |
Business Segments
The following table sets forth our revenues, in thousands, from each of our four business segments for each of the three years ended September 30, 2005, 2004, and 2003, and the approximate percentage of our total revenues attributable to each business segment:
| | | | | | | | | | | | | | | |
| (Dollars in thousands) | | 2005 | | 2004 | | 2003 |
| | | Revenues | | % | | Revenues | | % | | Revenues | | % |
Transportation Services | | $ | 199,490 | | 39 | | $ | 179,743 | | 40 | | $ | 156,453 | | 41 |
Environmental Services | | | 113,821 | | 22 | | | 109,198 | | 25 | | | 105,304 | | 27 |
Civil Engineering | | | 111,312 | | 22 | | | 81,841 | | 18 | | | 64,188 | | 17 |
Construction Management | | | 87,314 | | 17 | | | 77,465 | | 17 | | | 57,764 | | 15 |
| | | | | | | | | | | | | | | |
Totals | | $ | 511,937 | | | | $ | 448,247 | | | | $ | 383,709 | | |
| | | | | | | | | | | | | | | |
Additional information concerning segment results of operations and financial information is set forth in Item 7 under the caption entitled “Management’s Discussion and Analysis of Financial Condition and Results of Operations” and in Item 8, Note 15 of “Notes to Consolidated Financial Statements” which are included herein.
7
Transportation Services
Industry Overview
During fiscal year 2005, many factors throughout the country altered upgrading the United States’ transportation infrastructure. A sluggish economy in numerous states and municipalities prevented recently executed transportation design contracts from receiving notices to proceed. Heightened airport security measures negatively impacted business travel causing large legacy passenger carriers to file bankruptcy and, consequently, fewer design and construction projects.
Our Services
Our consulting services in this area include planning, traffic engineering, intelligent transportation systems (“ITS”), corridor planning, highway design, structural design, alternate project delivery program management, toll facility design, aviation services, multi-modal/transit systems and right-of-way. We currently serve transportation departments in 17 states (Alabama, Arizona, Arkansas, California, Colorado, Florida, Georgia, Mississippi, Montana, North Carolina, Ohio, Pennsylvania, South Carolina, Tennessee, Texas, Utah and Virginia.)
During fiscal 2005, projects in Transportation included:
| | • | | A planning services contract for the Texas Department of Transportation (“TxDOT”), primarily to determine toll feasibility for potential roadway improvements throughout the State. All disciplines (highway design, drainage, construction, environmental services, ITS, traffic engineering, and structure design) were necessary to perform the work. |
| | • | | Multi-year contracts for both North Carolina Department of Transportation and Virginia Department of Transportation included the design, implementation, operation and maintenance of a statewide telephone-based travel information services accessible by dialing “511.” North Carolina’s 511 service was launched in August 2004 and assisted the State and its travelers during several hurricane evacuations during the fall of 2005. |
| | • | | The Florida Department of Transportation’s (“FDOT”) statewide intelligent transportation systems general consultant six-year contract, pursuant to which we are providing services related to the planning, architecture, standards development, and integration of ITS. |
| | • | | A general engineering five year consulting agreement with The Dayton International Airport in Ohio including runway rehabilitations projects, parking structure design, and terminal gate enhancements. |
| | • | | The I-70 project from downtown Denver, Colorado to the Denver International Airport is a full environmental impact study with respect to the corridor. The urban corridor includes multi-modal considerations (i.e. light rail, park and ride facilities, HOV lanes, etc.). The project includes freeway and rail design, structural components and a major public outreach effort. |
| | • | | Providing General Engineering Consulting Services to a number of Toll-road agencies including: |
| | • | | Florida’s Turnpike Enterprise |
| | • | | Orlando Orange County Expressway Authority |
| | • | | Miami-Dade County Expressway Authority |
| | • | | Texas Turnpike Authority |
| | • | | Transportation Corridor Agencies |
| | • | | As a significant sub-consultant to Parsons Brinckerhoff Quade and Douglas, a seven year program management contract with Miami-Dade Transit providing project management services in support of the implementation of the People’s Transportation Plan (PTP) for Miami-Dade County. Specific services include but are not limited to transit design, corridor planning, and project and cost control. |
8
| | • | | Multi-year full service Indefinite Deliver/Indefinite Quantity contracts for engineering services for the Federal Highway Administration Western and Central Federal Lands. The contracts provide for the engineering, design, and development of roads and bridges located on federal or locally owned roads on or leading to federal lands in the western United States. |
| | • | | San Diego Association of Governments (“SANDAG”) On Call: TransNet program planning, management, and technical support for SANDAG. We serve as an extension of SANDAG staff providing on-call engineering services as well as design for the next five years for the TransNet program in San Diego, California. This program is a large scale, long term transportation improvement program funded by a 1/2 cent county sales tax for a total of approximately $40 billion over 40 years. SANDAG identified some early action highway and transit transportation improvement projects on Routes 5, 15, 52, 76, 805 including Mid-Coast Light Rail with a 10-year completion timeline. |
| | • | | State Route 22 Design Build: 36 Bridges either new, widened, or replaced on CA SR22. We, as part of the GMR Design/Build team, were selected by the Orange County Transportation Authority in California for Design/Build Phase I of the SR-22 HOV Improvement project. The completed project will include 34 new or widened bridges, four travel lanes, an additional mainline HOV lane in both directions, auxiliary lanes between most of the interchanges, and new flyover connectors between SR-57/I-5 to WB SR-22 as well as numerous retaining walls, sound walls and MSE walls. |
| | • | | On-call Bridge Engineering Services: Caltrans Districts 11 and 12. We are providing bridge engineering on-call services for Caltrans Districts 11 (San Diego County) and 12 (Orange County) as a sub-consultant. |
9
Environmental Services
Industry Overview
Over the past thirty years, significant environmental laws at the federal, state and local levels have been enacted in response to public concern over the health of the nation’s air, water, and natural resources. Those laws and their implementation through regulation affect numerous industrial and governmental actions and form a key market driver for the services of our Environmental engineering and science business segment.
Two significant federal environmental laws, The Safe Drinking Water Act of 1974 and the Clean Water Act of 1972, continue to drive this segment of our business. Pursuant to these laws, Congress has allocated monies to assist state and local governments. According to the Environmental Protection Agency, as much as $23 billion a year will be needed for construction and upgrade of water and wastewater treatment facilities over the next 20 years.
Our Services
Our Environmental business segment focuses on the delivery of planning, design and construction management services for private and public sector clients related to:
| | |
Air Quality Management | | Flood Insurance Studies |
| |
Energy Planning | | Hazardous and Solid Waste Management |
| |
Cultural Resources Assessments | | Information Solutions |
| |
Ecological Studies | | Wastewater Treatment |
| |
Environmental Toxicology Analysis | | Water Resources |
| |
Aquatic Treatment Systems | | Water Supply |
| |
Biosolids Management | | Water Treatment: Distribution |
During fiscal 2005, some significant projects in our Environmental business segment included:
| | • | | A five-year assignment with the Washington Suburban Sanitary Commission to improve and expand the 288 million gallon per day Potomac Water Filtration Plant that provides drinking water for more than 1 million people in Montgomery and Prince Georges Counties, Maryland. We have been retained to design the improvements necessary to enhance water quality, increase process reliability, and expand plant capacity. Included in these improvements are: ultraviolet disinfection, pump stations, improved rapid mix and flow split facilities, flocculation equipment upgrades, hydraulic improvements and various electrical system enhancements. Completion of the design is expected in January 2006. Construction is expected to be completed in 2009. |
| | • | | A multi-year joint venture to the U.S. Army Corps of Engineers with respect to program management support activities on the federal portion of the Comprehensive Everglades Restoration Project (“CERP”). The joint venture contract is budgeted for up to $6 million per year and the contract is for 3 years with provisions for up to 5 renewal periods. The CERP is budgeted to cost over $8 billion and the cost is to be shared equally between the federal government and state and local agencies. |
| | • | | A significant project for the City of San Diego, California to provide policy and master planning services for recycled water. The City directed that the study evaluate all aspects of a viable increased water reuse program, including but not limited to groundwater storage, expansion of the distribution system, reservoirs for reclaimed water, live stream discharge, wetlands development, and reservoir augmentation. |
| | • | | An innovative project with the TxDOT to develop advanced research and planning tools for streamlining archaeological and historical assessments of road construction projects within a six-county area |
10
surrounding Houston, Texas. A GIS product was customized to perform specialized geographic registration providing higher levels of geographic translational accuracy than previously available using conventional map overlay and rubber-sheeting techniques. The successful development of the HHO/GIS product resulted in PBSJ expanding the geographic and temporal coverage of the six-county project area to include geo-referenced imagery of almost 300 historic period maps.
| | • | | A comprehensive contract with the San Antonio River Authority to provide system design, development and deployment for the creation of the Regional Watershed Modeling System (“RWMS”). The RWMS development is the result of a historic agreement between three government entities, the San Antonio River Authority, the City of San Antonio and Bexar County to form the Bexar Regional Watershed Management partnership. The inter-local agreement that formed this partnership has subsequently been expanded to include several of the suburban San Antonio municipalities and may eventually include many of the other cities and counties within the river basin. The RWMS provides a comprehensive regional watershed management system that will act as a single repository of spatial and modeling data to be used by all partners. |
| | • | | A five-year contract with the Federal Emergency Management Agency Region V, to perform all aspects of the federal government’s Map Modernization Program. This assignment includes engineering modeling and floodplain mapping for the States of Michigan, Minnesota, Wisconsin, Illinois, Ohio, and Indiana, which represent some of the most active and sophisticated floodplain managers in the United States. Efforts will also include assisting states in working with local floodplain administrators to understand the impacts of flood maps, and communicating these to residents impacted by the updated information. |
| | • | | A three year assignment with the California Department of Water Resources to provide floodplain mapping support services. Activities under this contract include a host of actions designed to improve or create floodplain management throughout California. Specific task orders include: |
| | • | | Levee Database: location and ownership of more than 8,000 miles of levees within the State. This task includes GIS map development, database, and application development, and extensive contact with levee districts to update information. |
| | • | | Statewide Mapping Plan: detailed and approximate floodplain mapping throughout the state. Stage one is to identify the costs and products necessary to map the Central Valley in 2-5 years, followed, by a full statewide plan. |
| | • | | Post Disaster Mitigation Grant Application: preparing and submitting a Post Disaster Mitigation Grant request. |
| | • | | Awareness Mapping: reprioritizing the planned production of Awareness Mapping statewide and performing mapping for approximately 1,000 miles of stream. |
| | • | | Executive Order: updating the Governor’s floodplain management task order. |
| | • | | Levee Certification (Procedure Memo #34) Outreach: aiding in the development of an outreach program to inform levee districts of the requirement relating to levee certification. |
| | • | | Design services for the expansion of the Cherokee County Water and Sewerage Authority’s Etowah River Water Treatment Facility to double the daily processing capacity. The work involved in the Etowah River WTF Expansion includes new raw water intake screens, two new raw water pumps, a new rapid mix basin, eight new flocculation basins, eight new sedimentation basins, fourteen new filters, two new clear wells, and a new high service pump station. |
11
Civil Engineering
Industry Overview
During fiscal 2005 the U.S Economy sustained its 2004 gains despite increasing interest rates by the Federal Reserve and some inflationary pressure primarily related to energy price increases. Federal spending remained strong, especially in the area of national defense, which increased opportunity and fortified our strategy for greater balance between the public and private sectors. Military planning increased substantially due to requirements in anticipation of Base Realignment and Closure (“BRAC”) and U.S. Army Modularity objectives. State and local government markets improved while the occurrence of natural disasters in the form of tropical storms and hurricanes increased demand for our disaster response related services to these sectors. Private investment in residential development remained very strong allowing greater selectivity in project selection and pursuit.
Near term expectations are for our markets of focus to remain strong. The Federal Department of Defense will continue to be fueled by BRAC implementation and the advancement of U.S. Army transformation. Although the private sector residential market growth can be anticipated to stabilize, government privatization and expansion of existing military installations will create new opportunities. Also the closure of many installations will provide new markets for private sector development. The recent frequency and intensity of natural disaster events is greatly increasing the national, state and local awareness of the need for planning, strong and effective response activities, and effective event management.
Our Services
Our civil engineering business provides architectural engineering and general civil engineering as well as specialized services to public and private clients. Included in these services are: site engineering and surveys, infrastructure engineering, master planning, disaster mitigation planning and response, infrastructure protection, asset management, emergency management and architectural and landscape architecture design.
Our civil engineering business will continue to focus its portfolio strategy to balance the public and private sectors with emphasis on specialized Federal National Defense markets and disaster mitigation, response and emergency management markets for state and local governments. We will continue our commitment to customers in the private sector corporate real estate development, leisure time and residential housing markets. We will rely on advanced technologies for competitive advantages and to distinguish us from our competition. These technologies include Geodata/Geographic Information Systems, database design and development, Global Positioning Systems (GPS), High Definition Survey technology and advanced data collection systems including Laser based imaging and measurement, 3D imaging, and application of web collaboration tools.
During fiscal 2005 our projects included:
| | • | | Administration and debris removal for major hurricanes for FDOT, several Florida counties and communities as well as significant storm related engineering subcontract activities in Mississippi, Alabama, Texas and Florida for the Federal Emergency Management Agency (“FEMA”). |
| | • | | Site/Civil engineering for Ft. Bliss Design/Build Temporary Facilities project as a member of the Design and Construction team. We were also awarded First Phase Land Development Engineering (“LDE”) Task Order for permanent facilities. |
| | • | | Charrette multidiscipline planning services for U.S Army facilities at various locations including Ft. Gordon, Ft. Benning, Ft. McPherson and Ft. Belvoir. Architectural and Engineering studies to support project justification as required by DD Form 1391. Facility examples include Law Enforcement, Emergency Services, Operations Centers, Security and Barracks. Most Charrette planning studies were done under contract with the Savannah District Corp of Engineers. |
12
| | • | | Numerous facility planning studies including Comprehensive Installation Master Planning, performed for Fort Belvoir, Virginia; Area Development Planning (“ADP’s”), including projects located at Fort Eustis, Redstone Arsenal and Fort Rucker; and Requirements Analysis, performed at various other Department of Defense (“DoD”) installations. |
| | • | | Asset Management related Real Property Inventory (“RPI”) and Asset Verification/Asset Validation studies. Notable projects include the National Guard installations of Camp McCain and Camp Shelby, located in the State of Mississippi. |
| | • | | Providing conceptual planning and urban design for the City of Clearwater, Florida for a six-block section of Gulfview Boulevard for Clearwater Beach, a world-class beach destination, located in Pinellas County. |
| | • | | Continued development, testing, and integration of the HAZUS-MH software models and GIS data for the National Institute of Building Services and FEMA. The model is designed to quantify the consequences of natural disaster events, hurricanes, floods, and earthquakes. |
| | • | | Designing a utility building in a campus setting for the Bridgeway Acres Redevelopment project in Pinellas County, Florida. The project transforms a waste to energy facility into five state-of-the-art campus buildings around a central green space designed to be both energy efficient and environmentally sensitive. |
| | • | | On-site beach replenishment permitting staff support, survey staff support, storm impact assessment, annual aerial oblique photography, aerial photography following hurricane landfall and other miscellaneous tasks as needed for Florida Bureau of Beaches and Coastal Systems GEC. |
| | • | | Architectural design services related to a series of planned resort communities for a prime developer with extensive projects planned in various locations throughout Florida and Nevada. |
| | • | | Design of a new 3-Story, 10,000 SF building to house the Institute for Geophysics and the Texas Advanced Computing Center, University of Texas at Austin. |
13
Construction Management
Industry Overview
The demand for our construction management services has also been fueled by the legislation and industry trends that are driving the growth in our Transportation and Environmental business segments. These trends have created a large number of infrastructure projects throughout the United States, which are subject to increasingly complex governmental regulations. The market should continue to grow as a result of the new Federal Transportation Act (TEA-Lu) that was passed in 2005. However due to the restraints placed on Federal consultants as a result of Hurricanes Katrina and Rita it remains unclear as to whether the Federal Government will fully fund its Transportation Commitment. Domestic military spending should also see a significant increase beginning in 2006 through 2008. This is a result of BRAC (Base Realigning and Closing) activity.
The role of the construction manager has become increasingly important to the success of these projects, requiring a new level of versatility and a wide range of skills. Both public and private sector entities are under pressure to complete these projects at accelerated schedules, resulting in a myriad of project delivery systems. With limited in-house staff, these entities must rely on experienced construction managers to complete projects on time and within budget.
Our Services
In the area of construction management, we provide a wide range of services as an agent for our clients, including contract administration, inspection, field-testing, scheduling/estimating, instituting project controls and quality assessment. Although we do not construct or build any projects, we may act as the program director of a project whereby on behalf of the owner of the project, we provide scheduling, cost estimating and construction observation services for the project, or our services may be limited to providing construction consulting.
During fiscal 2005, projects in our Construction Management Division included:
| | • | | Providing construction engineering and inspection services to the Departments of Transportation in Alabama, Arkansas, Colorado, Nevada, Texas, Florida, Georgia, North Carolina and Mississippi as well as to various municipalities such as Cobb County Water & Sewer Department, Georgia; Collier County, Florida; Commerce City, Colorado; Douglas County, Colorado; and Fulton County, Georgia . |
| | • | | Providing construction management services to Phoenix Valley Metro Rail, light rail transit project in Phoenix, Arizona. |
| | • | | Providing construction administration to the Clark County, Nevada, Department of Public Works, as well as the City of Oceanside, California, and the City of Dana Pointe, California. |
| | • | | Performing Structural Inspection Services for hurricane shelters for the State of Florida, Department of Community Affairs. |
| | • | | Performing Vertical Code Compliance for Miami-Dade College in Florida. |
| | • | | Providing comprehensive services, including cost estimating, scheduling and construction claims reviews, to the school boards of Miami-Dade County and Broward County, Florida; York County, SC; Cobb County DOT in Georgia and the TxDOT. |
| | • | | Providing construction-related services to BellSouth throughout Florida and Georgia, including quality assurance inspections, verification of contractors’ invoices, damage inspections and responding to natural disasters. |
| | • | | Providing construction inspection services nationally to the National Park Service and Federal Highway Administration’s Central and Western Lands Division. |
14
Clients
Through our four national business segments, we provide our services to a broad range of clients, including state, local and municipal agencies, the federal government and private sector businesses. Our state and local government clients include approximately 22 state departments of transportation, water utilities, local power generators, waste water treatment agencies, environmental protection agencies, schools and colleges, law enforcement agencies, judiciary, hospitals and other healthcare providers. During fiscal year 2005, we provided services to federal agencies, including the Army Corps of Engineers, EPA, Navy, Air Force, Coast Guard, United States Postal Service, FEMA, National Parks Service, and Department of Energy, and local entities. Our contracts with federal, state and local entities are subject to various methods of determining fees and costs. See “Contract Pricing and Terms of Engagement” for further discussion of our pricing arrangements with governmental clients.
Our private sector clients include retail and commercial, entertainment, railroad, petro-chemical, food, telecommunications, oil and gas, power, semi-conductor, transportation, technology, public utility, mining and forest products entities. The table below indicates the revenue generated, by client type, for each of the three years ended September 30, 2005, 2004 and 2003.
| | | | | | | | | | | | | | | |
| (Dollars in thousands) | | Fiscal 2005 | | Fiscal 2004 | | Fiscal 2003 |
| | | Revenues | | % | | Revenues | | % | | Revenues | | % |
Domestic | | | | | | | | | | | | | | | |
State and local agencies | | $ | 363,475 | | 71 | | $ | 318,255 | | 71 | | $ | 272,433 | | 71 |
Federal agencies | | | 30,716 | | 6 | | | 35,860 | | 8 | | | 30,697 | | 8 |
Private businesses | | | 117,746 | | 23 | | | 94,132 | | 21 | | | 80,579 | | 21 |
| | | | | | | | | | | | | | | |
Total | | $ | 511,937 | | | | $ | 448,247 | | | | $ | 383,709 | | |
| | | | | | | | | | | | | | | |
In fiscal 2005, we derived approximately 27% of our engineering fees from various districts and departments of the FDOT (approximately 19% of total engineering fees) and the TxDOT (approximately 8% of total engineering fees) under numerous contracts. While we believe the loss of any individual contract would not have a material adverse effect on our results of operations and would not adversely impact our ability to continue work under our other contracts with these clients, the loss of all the FDOT or the TxDOT contracts would have a material adverse effect on our results of operations by causing a material decrease in our revenues and profits. We do not believe that the impact of the misappropriations and the related accrued reimbursement liability will have a material adverse effect on our existing client relationships.
International Business
During fiscal 2005, 2004, and 2003 we did not have any revenues from international operations. Prior to fiscal 2003, these revenues had been declining because we discontinued entering into new international contracts. We do not currently have any plans to expand or grow our international operations.
Marketing
Marketing activities are conducted by key operating and executive personnel, including specifically assigned business development personnel, as well as through professional personnel who develop and maintain new and existing client relationships. Our continued ability to compete successfully in the areas in which we do business is largely dependent upon aggressive marketing, the development of information regarding client requirements, the submission of responsive cost-effective proposals and the successful completion of contracts. Information concerning private and governmental requirements is obtained, during the course of contract performance, from formal and informal briefings, from participation in activities of professional organizations, and from literature published by the government and other organizations.
15
Contract Pricing and Terms of Engagement
We earn our revenues for the various types of services we provide through cost-plus, time-and-materials, fixed price contracts, and contracts which combine any of these methods.
Cost-Plus Contracts. Under our cost-plus contracts, we charge clients negotiated indirect rates based on direct and indirect costs in addition to a profit component. We recognize engineering fees at the time services are performed. The amount of revenue is based on our actual labor costs incurred plus a recovery of indirect costs and a profit component. In negotiating cost-plus contracts, we estimate direct labor costs and indirect costs and then add a profit component, which is a percentage of total recoverable costs, to arrive at a total dollar value for the contract. Indirect expenses are recorded as incurred and are allocated to contracts. If the actual labor costs incurred are less than estimated, the revenues from a project will be less than estimated. If the actual labor costs incurred plus a recovery of indirect costs and profit exceed the initial negotiated total contract amount, we must obtain a contract modification to receive payment for such overage. If a contract modification or change order is not approved by our client, we may be able to pursue a claim to receive payment. Engineering fees from claims are recognized when collected. For each of fiscal 2005 and 2004, approximately 20% and 22%, respectively, of our contracts were cost-plus contracts, primarily with state and local government agencies.
Our contracts with governmental entities, once executed, are not subject to renegotiation of profits at the election of the government; however, the governmental entity may elect to discontinue funding. If a governmental client elects to discontinue funding a project, our fees for work completed are generally protected because our contracts often provide that we receive periodic payments throughout the course of the project.
Time-and-Materials Contracts. Under our time-and-materials contracts, we negotiate hourly billing rates and charge our clients based on actual time expended. In addition, clients reimburse us for our actual out-of-pocket costs of materials and other direct incidental expenditures incurred in connection with performing the contract. Our profit margins on time-and-materials contracts fluctuate based on actual labor and overhead costs directly charged or allocated to contracts compared with negotiated billing rates. During each of fiscal 2005 and 2004, approximately 54% and 53%, respectively, of our contracts were time-and-materials contracts, primarily with federal, state and local agencies, as well as some private sector clients.
Fixed-Price Contracts. Under our fixed-price contracts, clients pay us an agreed sum negotiated in advance for the specified scope of work. Under fixed-price contracts, there are no payment adjustments if we over-estimate or under-estimate the number of labor hours required to complete the project, unless there is a change of scope in the work to be performed. Accordingly, our profit margin will increase to the extent the labor hours and other costs are below the contracted amounts. The profit margin will decrease and we may realize a loss on a project if the number of labor hours required or other costs exceed the estimate. During fiscal 2005 and 2004, approximately 26% and 25%, respectively, of our contracts were fixed-price contracts, primarily with private sector clients.
Competition
We face active competition in all areas of our business. As we provide a wide array of engineering, architectural, planning and construction management services to companies in various industries throughout the United States, we encounter a different group of competitors in each of our markets. Our competitors include (1) national and regional design firms like us that provide a wide range of design services to clients in all industries, including CH2M Hill and Parsons Brickerhoff (2) industry specific firms that provide design as well as other services to customers in a specific industry or disciplines, including Montgomery Watson, Camp Dresser and McKee, Inc., and (3) local firms that provide some or all of our services in one of our markets. Some of our competitors are larger, more diversified firms having substantially greater financial resources and larger professional and technical staffs than ours. Competition for major contracts is frequently intense and may entail public submittals and multiple presentations by numerous firms seeking to be awarded the contract. The extent of competition we will encounter in the future will vary depending on changing customer requirements in terms of types of projects and technological developments. It has been our experience that the principal competitive
16
factors for the type of service business in which we engage are a firm’s demonstrated ability to perform certain types of projects, the client’s own previous experience with competing firms, the firm’s size and financial condition and the cost of the particular proposal.
No firm dominates a significant portion of the sectors in which we compete. Given the expanding demand for some of the services we provide, it is likely that additional competitors will emerge. At the same time, consolidation continues to occur in certain of the sub-segments of the industry in the United States, including the environmental-focused firms.
We believe that we will retain the ability to compete effectively with other firms that provide similar services by continuing to offer a broad range of high-quality consulting and environmental, transportation, and engineering and construction management services through our network of offices. Among other things, the wide range of expertise, which we possess, permits us to remain competitive in obtaining government contracts despite shifts in governmental spending emphasis. Our multi-disciplinary capabilities enable us to compete more effectively for clients whose projects require that the expertise of professionals in a number of different disciplines be utilized in the problem solving effort. We believe that our ability to offer our services over a large part of the United States is a positive factor in enabling us to attract and retain clients who have a need for our services in different parts of the country.
Backlog
Our backlog for services was estimated to be approximately $466.4 million and $400.4 million as of September 30, 2005 and 2004, respectively. We define backlog as contracted task orders less previously recognized revenue on such task orders. U.S. government agencies, and many state and local governmental agencies, operate under annual fiscal appropriations and fund various contracts only on an incremental basis. Our ability to realize revenues from our backlog depends on the availability of funding for various federal, state and local government agencies.
A majority of our customer orders or contract awards and additions to contracts previously awarded are received or occur at random during the year and may have varying periods of performance. The comparison of backlog amounts on the same date in successive years is not necessarily indicative of trends in our business or future revenues.
The major components of our operating costs are payroll and payroll-related costs. Because our business is dependent upon the reputation and experience of our personnel and adequate staffing, a reasonable backlog is important for the scheduling of operations and for the maintenance of a fully-staffed level of operations.
The following table presents the total backlog for services by reporting segment:
| | | | | | |
| | | September 30, |
| (Dollars in thousands) | | 2005 | | 2004 |
Transportation Services | | $ | 196,025 | | $ | 175,037 |
Environmental Services | | | 93,004 | | | 89,291 |
Civil Engineering | | | 65,237 | | | 46,359 |
Construction Management | | | 112,152 | | | 89,731 |
| | | | | | |
Totals | | $ | 466,418 | | $ | 400,418 |
| | | | | | |
Regulation
Compliance with federal, state and local regulations, which have been enacted or adopted relating to the protection of the environment, is not expected to have any material effect upon our capital expenditures, earnings and competitive position.
17
Personnel
We employed approximately 3,800 employees as of September 30, 2005 and 2004. Most of our employees are professional or technical personnel having specialized training and skills, including engineers, architects, analysts, scientists, management specialists, technical writers and skilled technicians. Although many of our personnel are highly specialized in certain areas and while there is a nationwide shortage of certain qualified technical personnel, we are not currently experiencing any significant difficulty in obtaining the personnel we require to perform under our contracts. We believe that our future growth and success will depend, in large part, upon our continued ability to attract and retain highly qualified personnel.
Liabilities and Insurance
When we perform services for our clients, we can become liable for breach of contract, personal injury, property damage and negligence. Such claims could include improper or negligent performance or design, failure to meet specifications and breaches of express or implied warranties. Our clients often require us to contractually assume liabilities for damage or personal injury to the client, third parties and their property and for fines and penalties. Because our projects are typically large enough to affect the lives of many people, the potential damages to a client or third parties are potentially large and could include punitive and consequential damages. For example, our transportation projects involve services that affect not only our client, but also many end users of those services.
We seek protection from potential liabilities by obtaining indemnification, where possible, from our public and private sector clients. However, even when we obtain such indemnification, it is generally not available if we fail to satisfy specified standards of care in performing our services or if the indemnifying person has insufficient assets to cover the liability. Therefore, we also maintain a full range of insurance coverage, including workers’ compensation, general and professional liability (including pollution liability) and property coverage. Our professional liability coverage is on a claims made basis (which means that the policy provides liability coverage for all claims made during the policy period, regardless of when the action occurred), while the rest of our insurance coverage is on an occurrence basis (which means that the policy provides liability coverage only for injury or damage arising from an action that occurs during the policy period, regardless of when the claim is actually made). Our professional liability insurance provides for annual coverage of up to $40.0 million with a per claim deductible of $125,000 and annual deductible of $3.0 million. Based upon our previous experience with such claims and lawsuits, we believe our insurance coverage is adequate for all of our present operational activities, although such coverage may not prove to be adequate in all cases. A successful claim or claims in excess of our insurance coverage could have a material adverse effect on our financial position and results of operation.
Available Information
This Annual Report, quarterly reports on Form 10-Q and From 10-Q/A, current reports on Form 8-K and amendments to those reports are available without charge on the Security and Exchange Commission’s (“SEC”) web site, www.sec.gov, as soon as reasonably practicable after they are filed electronically. We are providing the address to the SEC’s website solely for the information of investors.
ITEM 1A.Risk Factors
In addition to the factors discussed elsewhere in Item 1 and the notes to the consolidated financial statements, the following risks and uncertainties could materially adversely affect our business, financial condition, and results of operations. Additional risks and uncertainties not presently known to us or that we currently deem immaterial also may impair our business operations and financial condition.
18
Certain Risks Related to Our Marketplace and Our Operations
We are involved in litigation, legal proceedings and governmental investigations, which could have a material adverse effect on our profitability and financial position.
We are involved in litigation, legal proceedings and governmental investigations that are significant and described in more detail in Item 3 “Legal Proceedings”. Such litigation, proceedings and investigations could have a material adverse effect on our profitability and financial position if decided adversely.
Unpredictable downturns in the financial markets, and reduced federal, state and local government budget spending could cause our revenues to fluctuate and adversely affect our revenue and operating results.
Downturns in the financial markets can impact the capital expenditures of our clients. In particular, our private sector clients, and the markets in which we provide services, may from time to time experience periods of economic decline. Any prolonged downturn in the financial markets could negatively impact our ability to determine demand for our services. We cannot be certain that economic or political conditions will be generally favorable or that there will not be significant fluctuations adversely affecting our industry as a whole or key markets we target.
The demand for our government related services is contingent upon the level of government funding for new and existing infrastructure projects. As such, government funding is dependent upon policy objectives being in line with infrastructure needs. Any shift in policy away from these initiatives can impact our ability to secure current funding for projects and obtain new projects.
We operate in a highly competitive market. If we are unable to offer competitive services, our business may be adversely affected.
We have numerous competitors in the various marketplaces in which we operate. Our competitors range from large diversified firms having substantially greater financial resources and a larger technical staff than us, to smaller more specialized, low cost structure niche firms. It is not possible to estimate the extent of competition which our present or future activities will encounter because of changing competitive conditions, customer requirements, technological developments, political environments and other factors.
We continue to see significant price competition and customer demand for higher service completion levels. There is also significant price competition in the marketplace for federal, state and local government contracts as a result of budget issues, political pressure and other factors beyond our control. Our operating results could be negatively impacted should we be unable to achieve the necessary revenue growth to sustain profitable operating margins within our service lines.
Pending or future governmental audits could result in findings which require downward adjustments of our revenue; and, under certain circumstances, could cause us to incur significant liabilities or restrict our business activities.
We are party to numerous contracts with federal, state and other government agencies, which require strict compliance with applicable laws, regulations, standards and contractual requirements. Federal and many state agencies routinely conduct various types of audits of their contracts. In some cases, the agencies conducting these audits review and report instances of fraud, internal control deficiencies, and violations of regulations or provisions of the contract.
If these audits identify costs which have been incorrectly charged or billed, either directly or indirectly, to government contracts, the government agencies may not reimburse us for these costs, or if we have already been reimbursed, we may be required to refund these reimbursements.
Our internal controls may not prevent or detect specific isolated or deceitful violations of applicable laws, regulations, standards or contractual requirements. If these agencies determine that we or one of our subcontractors has engaged in illegal conduct, we may be subject to civil or criminal penalties, and this may impair our ability to obtain new work.
19
We derive a significant portion of our engineering fees from a few clients, and the loss of these clients could have a material adverse impact on our financial performance.
In fiscal 2005, we derived approximately 27% of our engineering fees from various districts and departments of the FDOT and the TxDOT under numerous contracts. While we believe the loss of any individual contract would not have a material adverse effect on our results of operations and would not adversely impact our ability to continue work under our other contracts with these clients, the loss of all the FDOT or the TxDOT contracts would have a material adverse effect on our results of operations by causing a material decrease in our engineering fees and profits.
Our backlog is subject to cancellation and unexpected adjustments, which could have a negative impact on future earnings.
Backlog represents the revenues associated with contracted task orders which are scheduled to commence in future periods, less previously recognized revenue on such task orders. Projects may remain in our backlog for prolonged periods of time prior to commencement, and our ability to realize revenues from our backlog is contingent on the availability of funding from federal, state and local government agencies. Most government agency contracts contain cancellation clauses, which if exercised, would cause a reduction in our backlog, and adversely affect future revenues. Future project cancellations and scope adjustments could further reduce the dollar amount of our backlog and the revenues and profits that we actually earn.
If we are unable to accurately estimate the revenues, costs, time and resources on our contractual commitments, we may incur a lower profit or loss on the contract.
We generally earn revenue for the services we provide through three principal types of contracts; cost-plus, time-and-materials, and fixed price contracts. Cost-plus contracts are usually subject to negotiated ceiling amounts, and limit the recovery of certain specified indirect costs. If we underestimate our costs, and our costs exceed the contract ceiling amount, we may not be reimbursed for such costs. Under time-and-materials contracts, we negotiate hourly billing rates and charge our clients based on actual time expended. If we underestimate our total contract costs, we may not recover these costs from our client, and the project may not be profitable for us. Under fixed price contracts, we receive a fixed sum negotiated in advance, regardless of actual costs incurred. If we underestimate our revenue and costs for the specified scope of work, we may experience significant over-runs and negatively impact profit margin or realize a loss on the contract. Under these types of contracts, we bear the inherent risk that actual performance cost may exceed the contract price.
If we are unable to retain and recruit highly qualified personnel to fulfill our contractual obligations, our business may be adversely affected.
Our employees are our most valuable resource. Many of our technical personnel are highly specialized in their respective disciplines. Since we derive substantially all of our engineering fees from services performed by our professional staff, our failure to retain and attract professional staff could negatively impact our ability complete our projects and secure new contracts.
Failure to meet the covenants of our existing revolving credit facility could result in the loss of use of our available line of credit.
Failure to meet any of the covenant terms of our existing revolving credit facility could result in an event of default. If an event of default occurs, and we are unable to receive a waiver of default, our lender may increase our borrowing costs, restrict our ability to obtain additional borrowings, accelerate all amounts outstanding or enforce their interest against all collateral pledged. In the past, we have obtained written waivers of default from
20
our lender, but we may not be able to obtain any necessary waivers in the future. In addition, we can not declare dividends or incur additional debt without written approval from our lender, which could significantly restrict our ability to raise additional capital. Our inability to raise additional capital could lead to working capital deficits that could have a materially adverse effect on our operations in future periods.
21
If the material weaknesses in our internal control over financial reporting identified below are not remediated or we otherwise fail to maintain effective internal control over financial reporting, future material misstatements in our financial statements could result, which would result in additional restatements, impact our ability to timely file our financial statements, or cause us to improperly calculate our overhead rate for our government contracts.
In this report we have restated our previously issued consolidated financial statements to reflect certain accounting adjustments. The restatements related to (i) overstatement of engineering fees resulting from incorrect overhead rates (ii) adjusting entries needed to correct concealing entries made in connection with the misappropriations, (iii) recognition of rent expenses, (iv) classification of leases as operating instead of capital leases and the timing of expense recognition in connection therewith, (v) the recognition of expenses in the appropriate accounting period, (vi) the accounting for post-employment benefit plans, (vii) accrued wages, (viii) billings in excess of cost correction and (ix) classification errors.
In connection with the restatements, management concluded that as of September 30, 2005, there remained significant material weaknesses in our internal control over financial reporting. We are implementing measures to ensure the accuracy of our financial statements and to attempt to remediate these material weaknesses. If the material weaknesses are not remediated or new material weaknesses arise, they could result in material misstatements in our financial statements in the future, which would result in additional restatements, impact our ability to timely file our financial statements or cause us to improperly calculate our overhead rate for our government contracts. As a result, our business and financial condition could be materially and adversely affected.
We may be negatively impacted as a result of litigation or other proceedings relating to past political contributions by us and certain of our employees.
In the course of our investigation of the accounting irregularities and misappropriations, it was determined that there were possible violations relating to past political contributions by us and certain of our employees. The United States Attorney’s Office for the Southern District of Florida and the Federal Bureau of Investigation are now conducting an investigation into this matter. An unfavorable resolution or outcome resulting from this investigation may cause irreparable damage to our reputation and negatively impact our ability to secure new contracts with existing governmental clients.
22
Certain Risks Related to Owning Our Stock
Because no public market exists for our stock, the ability of our shareholders to sell their common stock is limited.
There is no public market for our common stock. In order to provide some liquidity to our shareholders, we have historically maintained a limited annual stock offering period, which we call the stock window. The stock window has permitted existing shareholders to offer their shares for sale back to us during a predetermined period at a price determined by an appraisal. Although the stock window is intended to provide some liquidity to shareholders, the aggregate number of shares offered for sale during the stock window may be greater than the aggregate number of shares sought to be purchased by authorized buyers. As a result, sell orders may be prorated, and shareholders may not be able to sell all of the shares they desire to sell during the stock window. We did not open the stock window in fiscal 2006, and as such, there is no guarantee the stock window will be open or will not be delayed in future periods. Shareholders who desire to sell their shares in the future will only be able to do so if there are authorized buyers willing to purchase such shares during an open stock window.
The ability of shareholders to sell or transfer their common stock is restricted.
Only our employees, directors, and The PBSJ Employee Profit Sharing and Stock Ownership Plan and Trust (“ESOP”) may own our common stock. We have incorporated significant restrictions on the transfer of our common stock which limit our shareholders’ ability to sell their stock. All shares must be initially offered for sale back to us at the price determined by an appraisal. If we decline to purchase the shares, the ESOP Plan may purchase such shares. Should the ESOP Plan decline to purchase the shares, the shareholders may offer their shares for sale to other shareholders. The other shareholders have the right to purchase such shares based on each shareholder’s proportionate ownership of all issued shares. Because our shares are subject to transfer restrictions, shareholders who desire to sell all their shares may not be able to do so.
Pursuant to the Company’s by-laws, the Company is permitted to repurchase stock by delivery of a promissory note to the employee. Because the principal payable pursuant to any such promissory note may be paid at any time prior to the five year anniversary of the date of issuance, a shareholder may not receive a cash payment for his shares until such five year anniversary.
Because we do not intend to pay dividends, our shareholders will benefit from an investment in our common stock only if our stock price appreciates.
We have never declared or paid dividends to holders of our common stock. We expect to retain all future earnings for investment in our business, and do not expect to pay any cash dividends in the near future. As a result, the positive return of an investment in our common stock is solely dependable on future appreciation in value of our common stock and future earnings. There is no guarantee that our stock will appreciate in value or even maintain the original price at which it was purchased.
The value of our stock may be negatively impacted by current and future governmental agency investigations.
An unfavorable resolution or outcome resulting from working with various government agencies to resolve the amount of reimbursement obligations may result in a material adverse impact to our enterprise value, and may adversely impact the future value of our share price. In addition we are currently under investigation by the United States Attorney’s office for the Southern District of Florida and the Federal Bureau of Investigation for possible irregularities relating to past political contributions made by us and certain of our employees. In the event that criminal charges are filed against the Company, the future value of our share price may be impacted.
23
ITEM 1B.Unresolved Staff Comments
None.
ITEM 2.Properties
We lease and maintain our executive offices located at 5300 W. Cypress Street, Suite 200 Tampa, FL 33607. We own our Miami office located at 2001 N.W. 107th Avenue, Miami, Florida 33172, which consists of approximately 100,000 square feet of office space. We own our Orlando office located at 482 South Keller Road, Orlando, Florida 32810, which consists of approximately 90,000 square feet of office space. The Orlando office building is pledged as collateral under a mortgage note.
We lease an additional 77 offices in 23 states in the United States and Puerto Rico, all of which are used for our four major business segments. Aggregate lease payments during fiscal year 2005 were approximately $14.3 million.
We also have title to certain properties recovered during the investigation which we have classified as held for sale in the accompanying consolidated balance sheet at September 30, 2005. These properties include:
| | • | | 6,500 square foot residence located in Aventura, Florida, which is pledged as collateral under a mortgage note, |
| | • | | a 5,400 square foot residence located in Key Largo, Florida, which is pledged as collateral under a mortgage note, |
| | • | | a 2,000 square foot condominium located in Hollywood, Florida, |
| | • | | and a 19,000 square foot parcel of land located in Key Largo, Florida, which is pledged as collateral under a mortgage note. |
We believe that substantially all of our property and equipment are, in general, well maintained and in good operating condition. They are considered adequate for present needs, and as supplemented by planned construction, are expected to remain adequate for the near future.
We believe that we, or our subsidiaries, have clear title to the properties owned and used in our business, subject to liens for current taxes and easements, restrictions and other liens, which do not materially detract from the value of the properties or our interest in the properties or the use of those properties in our business.
24
ITEM 3.Legal Proceedings
We are party to several pending legal proceedings arising from our operations. We believe that we have sufficient professional liability insurance such that the outcome of any of these proceedings, individually and in the aggregate, will not have a material adverse effect on our financial position or results of operations. However, if our insurance company were to deny coverage for a significant judgment or if a judgment were entered against us in an amount greater than our coverage, it could adversely affect our results of operations and financial position.
We maintain a full range of insurance coverages, including workers’ compensation, commercial general liability (which includes property coverage), commercial automobile, and professional liability (which includes pollution coverage). Our professional liability coverage is on a “claims-made basis” meaning the coverage applies to claims made during a policy year regardless of when the causative action took place. All other coverages are “occurrence-basis” meaning that the policy in place when the injury or damage occurred is the policy that responds regardless of when the claim is made. Our professional liability limits per policy year are $40 million with a per claim deductible of $125,000 and an annual aggregate of $3 million. Based on our experience with claims and lawsuits we believe that the current levels of coverage are adequate for all of our present operational activities although such coverages may not prove to be adequate in all cases. A successful catastrophic claim or aggregate of several large claims in amounts in excess of our insurance coverages in any policy year could have a material adverse effect on our financial position and results of operation.
Misappropriation Loss
In March 2005, subsequent to the issuance of the Company’s 2004 financial statements, we discovered misappropriations of Company funds by our former Chief Financial Officer and two former employees who worked in our information systems and treasury departments, collectively, (“the participants”). The participants colluded and circumvented controls to misappropriate funds and conceal the misappropriations possibly beginning as early as 1993 until the misappropriations were discovered.
Shortly after this discovery, an investigation sub-committee was formed comprised of the three outside members of our Corporate Audit Committee. These three outside members were subsequently appointed to the Board of Directors and became the three members of the Audit Committee of the Board of Directors. The Audit Committee retained independent counsel to conduct an investigation and advise the Audit Committee in connection with the investigation. The independent counsel retained forensic accountants, including accountants experienced in conducting forensic audits for companies that perform contracts for federal, state and local governments to assist with the investigation.
The investigation team discovered that at least $36.6 million was misappropriated between January 1, 1998 and the discovery of the misappropriations in March 2005. The amount misappropriated prior to January 1, 1998 could not be determined because certain data for the period prior to January 1, 1998 was unavailable. The participants in the embezzlement scheme used several methods to misappropriate the funds while engaging in conduct to conceal the misappropriated amounts. This conduct included among other things, recording and changing normal recurring journal entries and overstating accruals in prior periods to facilitate improper write-offs of misappropriated funds.
The Company determined that the misappropriation scheme led to the overstatement of overhead rates that the Company used to determine billings in connection with certain of our government contracts. As a result, some of our government clients were overcharged for the Company’s services. During the review of the overhead rate calculations, the Company identified certain instances of costs erroneously included in our overhead cost pool which were unallowable under applicable regulations and an error in our calculation of our overhead rate, which related to certain general and administrative costs. The Company determined that the unallowable costs and general and administrative errors also led to the overstatement of overhead rates which the Company used in connection with certain government contracts.
The Audit Committee, at the direction of the Corporate Board, disclosed the overstatement of our overhead rate to our clients and other appropriate government agencies, including the Department of Justice (“DOJ”). We have
25
been cooperating with our clients and such agencies to determine the amount of our reimbursement obligations and any other amounts we may be obligated to pay in order to resolve these issues. The DOJ and certain other governmental entities have been investigating the misappropriations and the overstatement of overhead rates.
The Company determined corrected overhead rates considering the impact of the misappropriations and considering the impact of additional errors identified. The Company has also recorded a related reduction in revenue, an increase in interest expense and a corresponding liability in each relevant year in its restated financial statements.
In July 2006, we entered into a settlement agreement with the State of Texas, Department of Transportation which resolves all claims that the State of Texas may have had against us for overpayments related to the restatement of overhead rates on billings on or before April 30, 2006 under contracts with that agency based on our payment of approximately $5.4 million and provides for the determination of the appropriate overhead rate for billings after April 30, 2006. In November 2006, we entered into a settlement agreement with the Florida Department of Transportation which resolves all claims that agency may have had against us for the overstatement of rates on billings through September 30, 2005 (and with respect to cost contracts through September 30, 2006) under our contracts with them based on our payment of approximately $12.5 million. This settlement agreement also provides for the determination of the appropriate overhead rate for fiscal year 2006 billings under fixed price contracts.
In January 2007, we reached a settlement agreement with the Department of Justice, Civil Division on behalf of it and all other federal agencies with which we have contracts to resolve all federal claims including claims under the Federal Civil False Claims Act, related to the overstatements of overhead rates on our contracts with federal agencies. The agreement requires approximately $6.5 million of reimbursement payments for all contract amounts through September 30, 2005.
The settlements described above are included in the accrued reimbursement liability in the Company’s consolidated financial statements. We are in discussions with our remaining government clients to enter into settlement agreements in order to satisfy any refund obligations, which are in various stages of settlement. We currently expect that these payments will not exceed our accrued reimbursement liability.
Our Board of Directors, with the assistance of the CAC and the Audit Committee, instituted immediate corrective actions and began implementing long-term measures to implement new financial controls and establish procedures to safeguard assets and to establish more accurate accounting and financial reporting practices. These long-term measures are included within our new Ethics and Compliance Program.
In an effort to recover assets that were misappropriated, the Company has instituted lawsuits against certain persons who received money from one or more of the participants in the embezzlement scheme. The Company continues to incur costs associated with such lawsuits, and the Company may not prevail in these lawsuits. In the event that the Company does prevail, the Company may not actually recover assets from the persons who were sued by the Company.
In the course of our investigation of the accounting irregularities and misappropriations, it was determined that there were possible violations relating to past political contributions by us and certain of our employees. The United States Attorney’s Office for the Southern District of Florida (Miami) and the Federal Bureau of Investigation are now conducting an investigation relating to improper campaign contributions including improper use of political action committees. We have produced documents and other information to the government and are fully cooperating with the investigation. At the present time, we believe it unlikely that criminal charges will be filed against us in this matter, but the authorities are not precluded from bringing charges and circumstances may change.
The United States Securities & Exchange Commission is also conducting an investigation of the accounting irregularities and misappropriations of funds described above. We are fully cooperating with the investigation and have produced documents and other information to the commission. At the present time, we are unable to predict the likely outcome of this investigation.
Pursuant to the Company’s by-laws, the Company is permitted to repurchase stock by delivery of a promissory note to the employee. On February 23, 2006 the Company repurchased 46,000 shares and 3,400 shares,
26
respectively, of the Company’s stock from Richard A. Wickett, our former Chairman of the Board from 2002 to February 2005 and former Chief Financial Officer from 1993 to 2004, and Kathryn J. Wilson in the original principal amounts of $1.2 million and $92,000, respectively. The notes currently bear interest at the rate of 7.5% per annum and such rate is adjusted to the then current prime rate of Bank of America on December 31st of each year. Accrued interest and $1 of principal is due monthly on the notes with all remaining principal and accrued interest due and payable on the five year anniversary of the date of issuance. The notes are subject to the Company’s right of set off, which permits the Company to set off all claims it may have against the payee against amounts due and owing under the notes.
ITEM 4.Submission of Matters to a Vote of Security Holders
No items were submitted to a vote to security holders during the fiscal year ended September 30, 2005.
27
PART II
ITEM 5.Market for Registrant’s Common Equity, Related Shareholder Matters and Issuer Purchases of Equity Securities
There is no established public trading market for our common stock. As of September 30, 2005 there were no shares of common stock that were subject to outstanding warrants or options to purchase, or securities convertible into, our common stock, and no shares of our common stock could be sold pursuant to Rule 144 under the Securities Act. No shares of our common stock are being, or have been, publicly offered.
As of December 31, 2006, there were 6,812,200 shares of common stock outstanding and held of record by 1,581 shareholders.
Our by-laws require that common stock held by shareholders who terminate employment with us be offered for sale at fair market value to us pursuant to a right of first refusal. Should we decline to purchase the shares, the shares must next be offered to our ESOP plan at fair market value, and then ultimately to our full-time employees. Our by-laws provide that the fair market value be determined by an appraisal. Other than agreements with certain retired Directors, as of September 30, 2005 and 2004, there was no outstanding common stock held by individuals no longer employed by us.
Dividends
Each share of our common stock is entitled to share equally in any dividends declared by our Board of Directors. Pursuant to the terms of our credit agreement, we cannot declare or pay dividends in excess of 50% of our net income. We have not paid cash dividends on our common stock in the past and have no present intention of paying cash dividends on our common stock in the foreseeable future. All earnings are retained for investment in our business.
Issuer Purchases of Equity Securities by Issuer and Affiliated Purchasers
The following table provides information about repurchases of common stock during the year ended September 30, 2005:
| | | | | | | | | |
| | | Total Number of
Shares Repurchased
(1) | | Average Price
Paid Per Share | | Total Number of Shares
Purchased as Part of
Publicly Announced
Plans or Programs | | Maximum Number of
Shares That May Be
Purchased Under the
Plans or Programs |
October 1 to June 30 | | 476,616 | | $ | 26.91 | | — | | — |
July 1 to July 31 | | 34,698 | | | 27.00 | | — | | — |
August 1 to 31 | | 15,734 | | | 27.00 | | — | | — |
September 1 to September 30 | | 11,517 | | | 27.00 | | — | | — |
| | | | | | | | | |
Total | | 538,565 | | $ | 26.92 | | — | | — |
| | | | | | | | | |
| (1) | During fiscal 2005, stock repurchases totaling more than $300,000 were paid to employees at 90% of the total value in cash, and 10% of total value by delivery of a promissory note. |
28
ITEM 6.Selected Financial Data
Subsequent to the issuance of the September 30, 2004 consolidated financial statements, the Company determined that it was necessary to restate its consolidated financial statements as of September 30, 2004 and for the years ended September 30, 2004 and 2003 (see also Note 2 to our consolidated financial statements). The financial data as of September 30, 2005 and 2004 and for the years ended September 30, 2005, 2004 and 2003 have been derived from our audited financial statements. The consolidated financial statements for the years ended September 30, 2002 and 2001 have not been re-issued. We have restated selected financial data as of September 30, 2003, 2002 and 2001 and for the fiscal years ended September 30, 2002 and 2001, respectively. However, because the financial statements for those years and related restatement adjustments have not been reissued, the selected financial data is presented as unaudited. You should read the information set forth below in conjunction with our consolidated financial statements, including the notes thereto, and Management’s Discussion and Analysis of Financial Condition and Results of Operations included elsewhere in this Annual Report.
| | | | | | | | | | | | | | | |
| | | Years Ended September 30, |
| | | 2005 | | 2004 | | 2003 | | 2002 | | 2001 |
| | | | | (Restated) | | (Restated) | | (Restated) | | (Restated) |
| (Dollars in thousands, except per share amounts) | | | | | | | | (Unaudited) | | (Unaudited) |
Operating Data: | | | | | | | | | | | | | | | |
Engineering fees | | $ | 511,937 | | $ | 448,247 | | $ | 383,709 | | $ | 338,236 | | $ | 311,552 |
Net earned revenues | | | 389,951 | | | 351,875 | | | 302,016 | | | 262,668 | | | 233,292 |
Net income | | | 21,075 | | | 14,690 | | | 12,721 | | | 6,703 | | | 6,739 |
| Balance Sheet Data (at end of period): | | | | | | (Unaudited) | | (Unaudited) | | (Unaudited) |
Working capital | | | 30,506 | | | 20,293 | | | 19,800 | | | 15,795 | | | 12,833 |
Total assets | | | 251,647 | | | 204,365 | | | 168,501 | | | 149,010 | | | 141,536 |
Accrued reimbursement liability(1) | | | 34,772 | | | 24,119 | | | 16,248 | | | 10,425 | | | 4,956 |
Long-term debt, less current portion | | | 7,425 | | | 7,828 | | | 17,350 | | | 20,997 | | | 9,929 |
Capital leases obligations | | | 853 | | | 684 | | | 505 | | | 206 | | | — |
Total stockholders’ equity | | | 77,832 | | | 62,703 | | | 50,061 | | | 43,658 | | | 51,371 |
| | | | | |
Net income per share: | | | | | | | | | | | | | | | |
Basic | | $ | 2.92 | | $ | 2.03 | | $ | 1.71 | | $ | 0.83 | | $ | 0.83 |
Diluted | | $ | 2.74 | | $ | 1.91 | | $ | 1.61 | | $ | 0.79 | | $ | 0.80 |
| | (1) | Over-billings to our government clients resulting from the overstatement of our overhead rates resulting from the misappropriation loss and concealment entries and certain additional errors identified. |
We have not paid dividends for the five years ended December 31, 2005.
29
ITEM 7.Management’s Discussion and Analysis of Financial Condition and Results of Operations
Restatement
In March 2005, subsequent to the issuance of the Company’s 2004 financial statements, we discovered misappropriations of Company funds by our former Chief Financial Officer and two former employees who worked in our information systems and treasury departments, collectively, (“the participants”). The participants colluded and circumvented controls to misappropriate funds and conceal the misappropriations possibly beginning as early as 1993 until the misappropriations were discovered. The investigation discovered that at least $36.6 million was misappropriated between January 1, 1998 and the discovery of the misappropriations in March 2005. The amount misappropriated prior to January 1, 1998 could not be determined because certain data for the period prior to January 1, 1998 was unavailable (See Note 2 for further discussion).
The Company determined that the misappropriation scheme led to the overstatement of overhead rates that the Company used to determine billings in connection with certain of our government contracts. As a result, some of our government clients were overcharged for the Company’s services. During the review of the overhead rate calculations, the Company identified certain instances of costs erroneously included in our overhead cost pool which were unallowable under applicable regulations and an error in our calculation of our overhead rate, which related to certain general and administrative costs. The Company determined that the unallowable costs and general and administrative errors also led to the overstatement of overhead rates which the Company used in connection with certain government contracts.
We have restated our previously issued consolidated financial statements as of September 30, 2004 and for the years ended September 30, 2004 and 2003, as well as selected financial data as of September 30, 2002 and 2001, and for the years ended September 30, 2003, 2002 and 2001, primarily to reflect adjustments relating to the effects of the misappropriations and related concealment accounting and the correction of revenue amounts charged to certain of our government clients due to the errors in our overhead rates discussed above, in addition to certain other adjustments more fully described in Note 2 to our restated consolidated financial statements.
30
A summary of our fiscal 2005 and restated 2004 and 2003 operating results is as follows:
| | | | | | | | | | | | |
| | | Years ended September 30, | |
| (Dollars in thousands, except per share amounts) | | 2005 | | | 2004 | | | 2003 | |
Engineering fees | | $ | 511,937 | | | $ | 448,247 | | | $ | 383,709 | |
Direct expenses | | | 121,986 | | | | 96,372 | | | | 81,693 | |
| | | | | | | | | | | | |
Net earned revenues | | | 389,951 | | | | 351,875 | | | | 302,016 | |
| | | |
Costs and expenses: | | | | | | | | | | | | |
Direct salaries and direct costs | | | 146,299 | | | | 131,521 | | | | 111,991 | |
General and administrative expenses, including indirect salaries | | | 210,551 | | | | 186,068 | | | | 165,761 | |
Misappropriation loss (recoveries), net | | | (10,725 | ) | | | 4,854 | | | | 5,075 | |
Investigation and related costs | | | 5,446 | | | | — | | | | — | |
| | | | | | | | | | | | |
Operating income | | | 38,380 | | | | 29,432 | | | | 19,189 | |
Interest expense | | | (1,824 | ) | | | (1,625 | ) | | | (1,518 | ) |
Other, net | | | 260 | | | | 617 | | | | 1,561 | |
| | | | | | | | | | | | |
Income before income taxes | | | 36,816 | | | | 28,424 | | | | 19,232 | |
Provision for income taxes | | | 15,741 | | | | 13,734 | | | | 6,511 | |
| | | | | | | | | | | | |
Net income | | $ | 21,075 | | | $ | 14,690 | | | $ | 12,721 | |
| | | | | | | | | | | | |
Net income per share: | | | | | | | | | | | | |
Basic | | $ | 2.92 | | | $ | 2.03 | | | $ | 1.71 | |
Diluted | | $ | 2.74 | | | $ | 1.91 | | | $ | 1.61 | |
The following table sets forth the percentage of net earned revenue represented by the items in our consolidated statements of operations and sets forth the effect of the restatement for fiscal 2004 and 2003:
| | | | | | | | | |
| | | Years ended September 30, | |
| | | 2005 | | | 2004 | | | 2003 | |
Engineering fees | | 131.3 | % | | 127.4 | % | | 127.0 | % |
Direct reimbursable expenses | | 31.3 | | | 27.4 | | | 27.0 | |
| | | | | | | | | |
Net earned revenues | | 100.0 | | | 100.0 | | | 100.0 | |
| | | |
Costs and expenses: | | | | | | | | | |
Direct salaries and direct costs | | 37.5 | | | 37.4 | | | 37.1 | |
General and administrative expenses, including indirect salaries | | 54.0 | | | 52.9 | | | 54.9 | |
Misappropriation loss (recoveries), net | | (2.8 | ) | | 1.4 | | | 1.7 | |
Investigation and related costs | | 1.4 | | | — | | | — | |
| | | | | | | | | |
Operating income | | 9.9 | | | 8.3 | | | 6.3 | |
Interest expense | | (0.5 | ) | | (0.5 | ) | | (0.5 | ) |
Other, net | | 0.1 | | | 0.2 | | | 0.5 | |
| | | | | | | | | |
Income before income taxes | | 9.5 | | | 8.0 | | | 6.3 | |
Provision for income taxes | | 4.0 | | | 3.9 | | | 2.2 | |
| | | | | | | | | |
Net income | | 5.5 | % | | 4.1 | % | | 4.1 | % |
| | | | | | | | | |
31
Overview
Management’s Discussion and Analysis of Financial Condition and Results of Operations for prior periods has been revised for the effects of the restatement described above.
Business Overview
We provide services to both private and public sector clients, with the public sector comprising approximately 77% of our revenues. Our business has four segments: Transportation Services, Civil Engineering, Construction Management and Environmental Services. During fiscal 2005, the Transportation Services, Civil Engineering and Construction Management segments experienced significant growth. The growth in the Civil Engineering segment was fueled by large disaster response projects as a result of the hurricanes that hit Florida in August and September 2004, in addition to wild fires in southern California and growth in the segment’s homeland security program. The growth in the construction management segment was due primarily to several large projects with existing clients, including several state departments of transportation. All four segments of our business experienced increased volumes in backlog at September 30, 2005, as compared to September 30, 2004.
We earn revenue for time spent on projects, in addition to certain direct costs of our projects, such as blueprints and sub-contractor expenses. The fluctuation in direct costs, specifically sub-contractor costs, will influence the fluctuation of our net earned revenue. For instance, our environmental segment experienced a decrease in direct costs in fiscal 2005, as compared to 2004, as a result of a reduced need for a sub-consultant with a special skill for a project in California. As a result, our Environmental Services segment’s net earned revenue grew at a greater rate than its engineering fees, because more work was being performed by our in-house technical professionals. During fiscal 2005, there was an increase in the number of our employees who were primarily technical professionals, whose billable labor gets charged back to our clients, thereby increasing the amount of fees we earned. As chargeability of our technical professionals’ time increases, direct labor costs increase along with it, while indirect labor costs decrease, as more of the technical staff’s time worked is being charged back to our clients.
Business Environment
The need to modernize and upgrade the transportation infrastructure in the United States has been a source of continued business for us through the last ten years. Fueling the initial growth in this market was the Intermodal Surface Transportation Efficiency Act of 1991 (“ISTEA”). In 1998, ISTEA was reauthorized as the Transportation Equity Act for the 21st Century (“TEA-21”), earmarking $218 billion for highway and transit projects through 2003. Prior to the expiration of TEA-21 on September 30, 2003, the U.S. Congress and President Bush signed a five-month extension of the program. Since then, a series of additional extensions have been granted, the most recent of which occurred on July 30, 2005 and was set to expire on August 14, 2005, however, on August 10, 2005, the President signed into law the Safe, Accountable, Flexible, Efficient Transportation Act: A Legacy for Users (“SAFETEA-LU”). The SAFETEA-LU guarantees funding for highways, highway safety, and public transportation totaling $244.1 billion. SAFETEA-LU ensures that state agencies that depend largely on federal transportation funding, will continue to make investments needed to maintain and grow the vital transportation infrastructure.
The demand for our construction management services has also been fueled by the legislation and industry trends that are driving the growth in our Transportation and Environmental business segments, including ISTEA and TEA-21. These trends have created a large number of infrastructure projects throughout the United States, which are subject to increasingly complex governmental regulations. The market could level out or shrink slightly until a new Federal transportation funding bill is passed. The potential impact is currently minimal, but increases as time passes until the bill is passed. Projects/programs that depend on the Federal gas tax funding are being delayed, which may eventually lead to a temporary reduction in demand for the services we provide.
During the last quarter of fiscal 2004 and the first quarter of fiscal 2005, the economy entered a period of slow recovery with improving private sector corporate profitability, while investment in residential housing development continued at high rates. Federal spending remained strong especially in the area of national defense, which increased opportunity and fortified our strategy for greater balance between the public and private sectors. The state and local government markets remained weak but the market for our specialized services in the area of risk and
32
emergency management strengthened due in part to hurricanes and wild fires. Near term expectations are for the Federal Department of Defense and Homeland Security sectors to remain strong. As the economy expands its recovery, we expect the private sector to strengthen. We expect that state and local government markets will remain weak but will improve as increased tax revenue from private sector recovery trickles into the government sector.
In recent years, significant environmental laws at the federal, state and local levels have been enacted in response to public concern over the health of the nation’s air, water, and natural resources. Those laws and their implementation through regulation affect numerous industrial and governmental actions and form a key market driver for the services of our Environmental Services segment. Two federal environmental laws, The Safe Drinking Water Act of 1974 and the Clean Water Act of 1972, continue to drive this segment of our business. Pursuant to these laws, Congress has authorized significant monies to assist state and local governments. According to the EPA, as much as $23 billion a year will be needed for construction and upgrade of water and wastewater treatment facilities over the next 20 years.
Segment Results of Operations
Our businesses are reported as four segments, reflecting our management methodology and structure:
Activities in the Transportation Services business segment generally involve planning, design, right of way acquisition, development and design of intelligent transportation services and program construction management services for multiple transportation modes, including interstate and primary highways, toll roads, arterials, bridges, transit systems, airports and port facilities. The Program Management group of our Transportation segment provides many of its governmental clients the necessary resources to manage large infrastructure programs from concept through construction. Services include planning, programming, and contract support.
The Construction Management segment provides a wide range of services as an agent for the Company’s clients, including contract administration, inspection, field-testing, scheduling/estimating, instituting project controls and quality assessment. The Company provides scheduling, cost estimating and construction observation services for the project, or its services may be limited to providing construction consulting.
The Civil Engineering segment provides general civil engineering as well as specialized services to public and private clients. Included in these services are: site engineering and surveys, infrastructure engineering, master planning, disaster mitigation planning and response, asset assessment and management, emergency management and architectural and landscape design.
The Environmental Services business segment focuses on the delivery of planning, design and construction management services for private and public sector clients related to air quality management, flood insurance studies, energy planning, hazardous and solid waste management, ecological studies, wastewater treatment, water resources, environmental toxicology analysis, aquatic treatment systems and water supply and treatment.
The accounting policies of the segments are the same as those described in the footnotes to the accompanying consolidated financial statements. We evaluate performance based on operating income (loss) of the respective segments. The discussion that follows is a summary analysis of the primary changes in operating results by segment for fiscal 2005 as compared to fiscal 2004 and fiscal 2004 as compared to fiscal 2003.
Net earned revenue represents the net effect of gross revenues less direct reimbursable expenses. Direct reimbursable expenses is primarily comprised of subcontractor costs and other direct non-payroll reimbursable charges including travel and travel related costs, blueprints and equipment where the Company is responsible for procurement and management of such cost components on behalf of the Company’s clients. These direct reimbursable expenses are principally passed through to our clients with minimal or no mark-up. Indirect salaries represent wages earned by technical personnel not assigned to client billable projects and administrative and support personnel wages as well.
33
| | | | | | | | | | | | | | | | | | | | |
| | | Years Ended September 30, | |
| | | 2005 | | | % of NER | | | 2004 | | % of NER | | | 2003 | | | % of NER | |
| (Dollars in thousands) | | | | | | |
Transportation Services | | | | | | | | | | | | | | | | | | | | |
Engineering fees | | $ | 199,490 | | | 133.0 | % | | $ | 179,743 | | 133.0 | % | | $ | 156,453 | | | 129.0 | % |
Direct reimbursable expenses | | | 49,469 | | | 33.0 | | | | 44,632 | | 33.0 | | | | 35,149 | | | 29.0 | |
| | | | | | | | | | | | | | | | | | | | |
Net earned revenues (NER) | | | 150,021 | | | 100.0 | | | | 135,111 | | 100.0 | | | | 121,304 | | | 100.0 | |
Direct salaries and direct costs | | | 56,420 | | | 37.6 | | | | 50,714 | | 37.6 | | | | 45,629 | | | 37.6 | |
Indirect salaries | | | 28,924 | | | 19.3 | | | | 26,706 | | 19.8 | | | | 22,033 | | | 18.2 | |
General and administrative costs | | | 48,974 | | | 32.6 | | | | 45,051 | | 33.3 | | | | 39,610 | | | 32.7 | |
Misappropriation loss (recoveries), net | | | (3,932 | ) | | (2.6 | ) | | | 1,819 | | 1.3 | | | | 1,882 | | | 1.6 | |
Investigation and related costs | | | 1,997 | | | 1.3 | | | | — | | 0.0 | | | | — | | | 0.0 | |
| | | | | | | | | | | | | | | | | | | | |
Total costs and expenses | | | 132,383 | | | 88.2 | | | | 124,290 | | 92.0 | | | | 109,154 | | | 90.0 | |
| | | | | | | | | | | | | | | | | | | | |
Operating income | | $ | 17,638 | | | 11.8 | % | | $ | 10,821 | | 8.0 | % | | $ | 12,150 | | | 10.0 | % |
| | | | | | | | | | | | | | | | | | | | |
Construction Management | | | | | | | | | | | | | | | | | | | | |
Engineering fees | | $ | 87,314 | | | 129.0 | % | | $ | 77,465 | | 132.9 | % | | $ | 57,764 | | | 134.8 | % |
Direct reimbursable expenses | | | 19,635 | | | 29.0 | | | | 19,187 | | 32.9 | | | | 14,898 | | | 34.8 | |
| | | | | | | | | | | | | | | | | | | | |
Net earned revenues (NER) | | | 67,679 | | | 100.0 | | | | 58,278 | | 100.0 | | | | 42,866 | | | 100.0 | |
Direct salaries and direct costs | | | 28,032 | | | 41.4 | | | | 24,518 | | 42.1 | | | | 17,650 | | | 41.2 | |
Indirect salaries | | | 11,193 | | | 16.6 | | | | 8,084 | | 13.9 | | | | 6,982 | | | 16.3 | |
General and administrative costs | | | 22,078 | | | 32.6 | | | | 18,755 | | 32.2 | | | | 14,760 | | | 34.4 | |
Misappropriation loss (recoveries), net | | | (1,774 | ) | | (2.6 | ) | | | 757 | | 1.3 | | | | 701 | | | 1.6 | |
Investigation and related costs | | | 900 | | | 1.3 | | | | — | | 0.0 | | | | — | | | 0.0 | |
| | | | | | | | | | | | | | | | | | | | |
Total costs and expenses | | | 60,429 | | | 89.3 | | | | 52,114 | | 89.5 | | | | 40,093 | | | 93.5 | |
| | | | | | | | | | | | | | | | | | | | |
Operating income | | $ | 7,250 | | | 10.7 | % | | $ | 6,164 | | 10.5 | % | | $ | 2,773 | | | 6.5 | % |
| | | | | | | | | | | | | | | | | | | | |
Civil Engineering | | | | | | | | | | | | | | | | | | | | |
Engineering fees | | $ | 111,312 | | | 139.4 | % | | $ | 81,841 | | 117.1 | % | | $ | 64,188 | | | 116.6 | % |
Direct reimbursable expenses | | | 31,446 | | | 39.4 | | | | 11,924 | | 17.1 | | | | 9,156 | | | 16.6 | |
| | | | | | | | | | | | | | | | | | | | |
Net earned revenues (NER) | | | 79,866 | | | 100.0 | | | | 69,917 | | 100.0 | | | | 55,032 | | | 100.0 | |
Direct salaries and direct costs | | | 29,725 | | | 37.2 | | | | 25,850 | | 37.0 | | | | 20,454 | | | 37.2 | |
Indirect salaries | | | 16,107 | | | 20.2 | | | | 12,086 | | 17.3 | | | | 11,628 | | | 21.1 | |
General and administrative costs | | | 29,509 | | | 37.0 | | | | 25,423 | | 36.4 | | | | 22,085 | | | 40.1 | |
Misappropriation loss (recoveries), net | | | (2,369 | ) | | (3.0 | ) | | | 1,027 | | 1.5 | | | | 1,049 | | | 1.9 | |
Investigation and related costs | | | 1,203 | | | 1.5 | | | | — | | 0.0 | | | | — | | | 0.0 | |
| | | | | | | | | | | | | | | | | | | | |
Total costs and expenses | | | 74,175 | | | 92.9 | | | | 64,386 | | 92.2 | | | | 55,216 | | | 100.3 | |
| | | | | | | | | | | | | | | | | | | | |
Operating income | | $ | 5,691 | | | 7.1 | % | | $ | 5,531 | | 7.8 | % | | $ | (184 | ) | | -0.3 | % |
| | | | | | | | | | | | | | | | | | | | |
Environmental Services | | | | | | | | | | | | | | | | | | | | |
Engineering fees | | $ | 113,821 | | | 123.2 | % | | $ | 109,198 | | 123.3 | % | | $ | 105,304 | | | 127.2 | % |
Direct reimbursable expenses | | | 21,436 | | | 23.2 | | | | 20,629 | | 23.3 | | | | 22,490 | | | 27.2 | |
| | | | | | | | | | | | | | | | | | | | |
Net earned revenues (NER) | | | 92,385 | | | 100.0 | | | | 88,569 | | 100.0 | | | | 82,814 | | | 100.0 | |
Direct salaries and direct costs | | | 32,122 | | | 34.8 | | | | 30,439 | | 34.4 | | | | 28,258 | | | 34.1 | |
Indirect salaries | | | 20,763 | | | 22.5 | | | | 18,998 | | 21.4 | | | | 18,289 | | | 22.1 | |
General and administrative costs | | | 33,003 | | | 35.7 | | | | 30,965 | | 35.0 | | | | 30,374 | | | 36.7 | |
Misappropriation loss (recoveries), net | | | (2,650 | ) | | (2.9 | ) | | | 1,251 | | 1.4 | | | | 1,443 | | | 1.7 | |
Investigation and related costs | | | 1,346 | | | 1.5 | | | | — | | 0.0 | | | | — | | | 0.0 | |
| | | | | | | | | | | | | | | | | | | | |
Total costs and expenses | | | 84,584 | | | 91.6 | | | | 81,653 | | 92.2 | | | | 78,364 | | | 94.6 | |
| | | | | | | | | | | | | | | | | | | | |
Operating income | | $ | 7,801 | | | 8.4 | % | | $ | 6,916 | | 7.8 | % | | $ | 4,450 | | | 5.4 | % |
| | | | | | | | | | | | | | | | | | | | |
34
Year Ended September 30, 2005 Compared to Year Ended September 30, 2004
Engineering Fees
| | | | | | | | | | | | |
| | | Years Ended September 30, | | | | | |
| (Dollars in thousands) | | 2005 | | 2004 | | $ Change | | % Change | |
Transportation Services | | $ | 199,490 | | $ | 179,743 | | $ | 19,747 | | 11.0 | % |
Construction Management | | | 87,314 | | | 77,465 | | | 9,849 | | 12.7 | % |
Civil Engineering | | | 111,312 | | | 81,841 | | | 29,471 | | 36.0 | % |
Environmental Services | | | 113,821 | | | 109,198 | | | 4,623 | | 4.2 | % |
| | | | | | | | | | | | |
Total Engineering Fees | | $ | 511,937 | | $ | 448,247 | | $ | 63,690 | | 14.2 | % |
| | | | | | | | | | | | |
Engineering fees for the year ended September 30, 2005, were $511.9 million compared to $448.2 million in 2004, representing a 14.2% increase. Substantially all of the increase was in the Civil Engineering, Construction Management and Transportation Services segments.
Engineering fees from Civil Engineering services increased 36.0% to $111.3 million in fiscal 2005 from $81.8 million in fiscal 2004. This segment greatly benefited from large response projects related to the calendar year 2004 hurricanes in Florida, and to a lesser extent, from hurricane Katrina in late August of 2005. Engineering fees in the Civil Engineering segment also increased due to the Croslin acquisition on October 1, 2004. Engineering fees from Croslin, following the acquisition were approximately $2.7 million for the fiscal year ended September 30, 2005. This segment also experienced modest growth from our homeland security program and Southern California economic growth.
Our Construction Management engineering fees increased 12.7% to $87.3 million in fiscal 2005, from $77.5 million in fiscal 2004. The increase relates primarily to several large projects with existing clients including several state departments of transportation. The biggest growth arose out of an acceleration of Texas Turnpike Authority (“TTA”) projects and projects with Arkansas Department of Transportation (“DOT”). The later stages of construction management work typically require a full technical staff, plus temporary technical help, as well as a significant amount of overtime. This resulted in a continued growth in the year over year engineering fees for this segment’s operations in Arkansas and Texas. Lastly, our construction management segment benefited from the disaster response projects that resulted from the hurricanes that hit Florida in the third quarter of 2004 and to a lesser extent to hurricane Katrina which hit the Gulf States in late August 2005.
In the Transportation Services segment, engineering fees increased 11.0% to $199.5 million in fiscal 2005 from $179.7 million in fiscal 2004. The increase was primarily due to increase in new projects awarded by the Texas DOT (“TxDOT”) and to the TriLine and WKA acquisitions. Engineering fees from TriLine and WKA, following the acquisitions, were $5.2 million and $6.7 million, respectively, for the fiscal year ended September 30, 2005.
Engineering fees have remained relatively stable in our Environmental Services segment with engineering fees increasing 4.2% to $113.8 million in fiscal 2005 from $109.2 million in fiscal 2004. The increase is primarily attributable to the acquisition of LWC, acquired in March 2005. Engineering fees from the LWC acquisition were approximately $3.5 million in fiscal 2005. In addition, our Environmental Services’ engineering fees were negatively impacted by the winding down of a large FEMA project, offset by increased organic growth to replace these engineering fees. This organic growth was primarily driven by the segment’s increased focus on marketing and business development.
35
Net Earned Revenues
| | | | | | | | | | | | |
| | | Years Ended September 30, | | | | | |
| (Dollars in thousands) | | 2005 | | 2004 | | $ Change | | % Change | |
Transportation Services | | $ | 150,021 | | $ | 135,111 | | $ | 14,910 | | 11.0 | % |
Construction Management | | | 67,679 | | | 58,278 | | | 9,401 | | 16.1 | % |
Civil Engineering | | | 79,866 | | | 69,917 | | | 9,949 | | 14.2 | % |
Environmental Services | | | 92,385 | | | 88,569 | | | 3,816 | | 4.3 | % |
| | | | | | | | | | | | |
Total Net Earned Revenues | | $ | 389,951 | | $ | 351,875 | | $ | 38,076 | | 10.8 | % |
| | | | | | | | | | | | |
Net earned revenues (“NER”) was $390.0 million during the year ended September 30, 2005 as compared to $351.9 million in the same period in 2004, representing an increase of 10.8%. This increase was directly related to the increase in engineering fees, as previously explained.
| | | | | | | | | | | | |
| | | Years Ended September 30, | |
| (Dollars in thousands) | | 2005 | | % of NER | | | 2004 | | % of NER | |
Transportation Services | | $ | 49,469 | | 33.0 | % | | $ | 44,632 | | 33.0 | % |
Construction Management | | | 19,635 | | 29.0 | % | | | 19,187 | | 32.9 | % |
Civil Engineering | | | 31,446 | | 39.4 | % | | | 11,924 | | 17.1 | % |
Environmental Services | | | 21,436 | | 23.2 | % | | | 20,629 | | 23.3 | % |
| | | | | | | | | | | | |
Total Direct Reimbursable Expenses | | $ | 121,986 | | 31.3 | % | | $ | 96,372 | | 27.4 | % |
| | | | | | | | | | | | |
In addition, the change in our NER is affected by the fluctuation in our direct reimbursable expenses. Direct reimbursable expenses consist of out-of-pocket expenses related to the delivery of services such as blueprints, reproductions, CADD/computer charges, travel and sub-consultant expenses. As a percentage of NER, direct reimbursable expenses increased 3.9% to 31.3% in fiscal 2005 from 27.4% in fiscal 2004. The increase was driven by the Civil Engineering segment.
Direct reimbursable expenses in the Civil Engineering segment increased as a percentage of NER by 22.3% to 39.4% in fiscal 2005 from 17.1% in fiscal 2004. The increase was due to the disaster response projects related to the Florida hurricanes in the third quarter of 2004 and the Southern California fires and to a lesser extent, to hurricane Katrina which hit the Gulf States in late August of 2005. These disasters required significant travel and lodging costs for the hundreds of employees overseeing debris removal in the areas affected by the disasters. In addition, sub-consultants were hired to perform some of the work, adding to the direct reimbursable expenses.
In our Construction Management segment, direct reimbursable expenses as a percentage of NER decreased by 3.9% to 29.0% in fiscal 2005 from 32.9% in fiscal 2004. This decrease was primarily due to several projects shifting from direct reimbursable projects to cost plus projects, reducing the total direct reimbursable expenses. Also, an increase in lump sum contracts in the Southeast region has reduced direct reimbursable expenses.
Our Environmental Services segment showed a slight decrease of 0.1% in direct reimbursable expenses as a percentage of NER to 23.2% in fiscal 2005 from 23.3% in fiscal 2004. The decrease was due primarily to a return to normal direct reimbursable expense spending in fiscal 2005, as compared to 2004. In 2004, direct reimbursable expenses were larger than normal due to a video inspection sub-consultant that we utilized to assist us with the beginning stages of a job in California. Since then, the volume of video work has decreased, thereby reducing our direct reimbursable expenses in this segment.
Direct reimbursable expenses for the Transportation Services segment as a percentage of NER remained constant at 33.0% in fiscal 2005 and fiscal 2004.
36
Operating Income
| | | | | | | | | | | | | |
| | | Years Ended September 30, | |
| (Dollars in thousands) | | 2005 | | | % of NER | | | 2004 | | % of NER | |
Transportation Services | | $ | 17,638 | | | 11.8 | % | | $ | 10,821 | | 8.0 | % |
Construction Management | | | 7,250 | | | 10.7 | % | | | 6,164 | | 10.6 | % |
Civil Engineering | | | 5,691 | | | 7.1 | % | | | 5,531 | | 7.9 | % |
Environmental Services | | | 7,801 | | | 8.4 | % | | | 6,916 | | 7.8 | % |
| | | | | | | | | | | | | |
Total Operating Income | | $ | 38,380 | | | 9.8 | % | | $ | 29,432 | | 8.4 | % |
| | | | | | | | | | | | | |
Misappropriation Loss (Recoveries) and Investigation and Related Costs, net | | | (5,279 | ) | | -1.4 | % | | | 4,854 | | 1.4 | % |
| | | | | | | | | | | | | |
Total Operating Income before Misappropriation Loss and Investigation and Related Costs, net | | $ | 33,101 | | | 8.5 | % | | $ | 34,286 | | 9.7 | % |
| | | | | | | | | | | | | |
Operating income was $38.4 million in fiscal 2005 as compared to $29.4 million in fiscal 2004, representing an increase of 30.4%. The increase in total operating income is primarily the result of a $14.3 million gain from recovered assets, offset by $3.6 million misappropriation loss and $5.4 million in investigation related costs. All segments had increases in fiscal 2005 operating income from the prior fiscal year. Operating income, as a percentage of NER, increased by 1.4% to 9.8% in fiscal 2005 from 8.4% in fiscal 2004. All the segments, except Civil Engineering, experienced increases in fiscal 2005 operating income as a percentage of NER as compared to fiscal 2004.
We believe that operating income before misappropriation loss and investigation and related costs is a useful measure in evaluating our results of operations because the misappropriation loss, recoveries and investigation and related costs are unusual items which do not reflect the costs or revenues of our provision of services in the given year. While the misappropriations occurred over a long period, the recoveries and investigation costs are realized when recovered or incurred and not in relation to the period when the misappropriations occurred. We believe this measure is helpful for us and for our investors to evaluate the results of our operations and make comparisons between periods.
Operating income before misappropriation loss and investigation and related costs, net was $33.1 million for fiscal 2005 as compared to $34.3 million for fiscal 2004, representing a decrease of 3.5%. Operating income before misappropriation loss and related costs, net, as a percentage of NER, decreased by 1.2% to 8.5% in fiscal year 2005 from 9.7% in fiscal year 2004. Misappropriation loss and investigation and related costs, net are treated as corporate overhead costs, and as such, are allocated to each respective segment. The allocation is based on the segments’ proportionate share of general and administrative (“G&A”) costs to total Company G&A costs.
As a percentage of NER, the Transportation Services segment’s operating income before misappropriation loss and investigation and related costs, net increased by 1.2% to 10.5% in fiscal 2005 from 9.3% in fiscal 2004. This increase experienced by the Transportation Services segment was driven by improvements in engineering fees and chargeability, due largely to the large disaster response projects and significant increases in work volume with DOTs as a result of increased funding sources available to the states. As explained previously, as chargeability improves or increases, we are able to bill more of our labor costs to clients, thereby improving our profit margin. The other three segments experienced decreases in operating income before misappropriation loss and related costs, net, as a percentage of NER. These decreases were primarily due to decreased chargeability. When we experience a decrease in chargeability, we are billing less to our customers, thereby reducing our profit margin.
37
Costs
Costs consist principally of direct salaries and direct costs that are chargeable to clients and overhead and general and administrative expenses.
Direct Salaries and Direct Costs
| | | | | | | | | | | | |
| | | Years Ended September 30, | |
| (Dollars in thousands) | | 2005 | | % of NER | | | 2004 | | % of NER | |
Transportation Services | | $ | 56,420 | | 37.6 | % | | $ | 50,714 | | 37.5 | % |
Construction Management | | | 28,032 | | 41.4 | % | | | 24,518 | | 42.1 | % |
Civil Engineering | | | 29,725 | | 37.2 | % | | | 25,850 | | 37.0 | % |
Environmental Services | | | 32,122 | | 34.8 | % | | | 30,439 | | 34.4 | % |
| | | | | | | | | | | | |
Direct Salaries and Direct Costs | | $ | 146,299 | | 37.5 | % | | $ | 131,521 | | 37.4 | % |
| | | | | | | | | | | | |
Direct salaries and direct costs primarily includes direct salaries and to a lesser extent unreimburseable direct costs. Direct costs totaled $881,000 and $1.6 million in fiscal 2005 and 2004, respectively.
Direct salaries and direct costs were $146.3 million in fiscal 2005, as compared to $131.5 million in fiscal 2004, representing an increase of 11.2%. This increase is directly related to the increase in engineering fees and chargeability. As a percentage of NER, all segments except Construction Management experienced an increase from a year ago. On a Company basis, direct salaries and direct costs as a percentage of NER increased slightly to 37.5% in fiscal 2005 from 37.4% in fiscal 2004.
For the Civil Engineering segment, direct salaries and direct costs increased by 15.0% to $29.7 million in fiscal 2005 versus $25.9 million in fiscal 2004. Direct salaries and direct costs as a percentage of NER increased slightly to 37.2% in fiscal 2005 from 37.0% in fiscal 2004.
Direct salaries and direct costs in the Construction Management segment increased to $28.0 million in fiscal 2005, or a 14.3% increase from $24.5 million in fiscal 2004. As a percentage of NER, direct salaries and direct costs decreased 0.7% to 41.4% in fiscal 2005 from 42.1% in fiscal 2004. This decrease is due to increased chargeability and increased profitability from an acceleration of TxDOT projects and various transportation projects in Florida. The latter stages of these projects required full technical staff, plus temporary technical help as well as significant amounts of overtime.
The Transportation Services segment experienced an increase in direct salaries and direct costs of 11.3% to $56.4 million in fiscal 2005 compared to $50.7 million in fiscal 2004. As a percentage of NER, direct salaries and direct costs increased slightly to 37.6% in fiscal 2005 from 37.5% in fiscal 2004.
For our Environmental Services segment, direct salaries and direct costs increased to $32.1 million in fiscal 2005 from $30.4 million in fiscal 2004, a 5.5% increase. As a percentage of NER, direct salaries and direct costs increased by 0.4% from 34.4% in fiscal 2004 to 34.8% in fiscal 2005. The slight increase in direct salaries and direct costs as a percentage of NER is due primarily to a larger proportional increase in direct salaries and direct costs of 5.5% in relation to the increase in NER of 4.2%.
38
Indirect Salaries and General and Administrative Costs
The other component of costs is indirect costs, which include indirect salaries, and general and administrative costs.
| | | | | | | | | | | | |
| | | Years Ended September 30, | |
| (Dollars in thousands) | | 2005 | | % of NER | | | 2004 | | % of NER | |
Transportation Services | | $ | 28,924 | | 19.3 | % | | $ | 26,706 | | 19.8 | % |
Construction Management | | | 11,193 | | 16.5 | % | | | 8,084 | | 13.9 | % |
Civil Engineering | | | 16,107 | | 20.2 | % | | | 12,086 | | 17.3 | % |
Environmental Services | | | 20,763 | | 22.5 | % | | | 18,998 | | 21.4 | % |
| | | | | | | | | | | | |
Total Indirect Salaries | | $ | 76,987 | | 19.7 | % | | $ | 65,874 | | 18.7 | % |
| | | | | | | | | | | | |
Indirect salaries increased 16.9%, to $77.0 million in fiscal 2005 from $65.9 million in fiscal 2004. Indirect salaries as a percentage of NER increased 1.0% to 19.7% in fiscal 2005 compared to 18.7% in fiscal 2004.
Transportation Services experienced a decrease in indirect salaries as a percentage of NER of 0.5% from 19.8% in fiscal 2004 to 19.3% in fiscal 2005 resulting from an increase in chargeability from new projects with the TxDOT and acquisitions, as previously explained. As chargeability increases, and as more of the technical staff’s time worked is being charged back to clients, direct salaries increases and indirect salaries decreases.
Civil Engineering and Environmental Services experienced an increase in indirect salaries as a percentage of NER of 2.9% and 1.1%, respectively, as a result of the focus on marketing and business development and an increased use of sub-consultants on certain projects.
Indirect salaries in our Construction Management segment increased 38.5% to $11.2 million in fiscal 2005 from $8.1 million in fiscal 2004. As a percentage of NER, indirect salaries increased by 2.6% to 16.5% in fiscal 2005 from 13.9% in fiscal 2004. The primary result of this increase is attributable to delays in the commencement of certain projects and the opening of new offices to support new business initiatives in the East region.
| | | | | | | | | | | | |
| | | Years Ended September 30, | |
| (Dollars in thousands) | | 2005 | | % of NER | | | 2004 | | % of NER | |
Transportation Services | | $ | 48,974 | | 32.6 | % | | $ | 45,051 | | 33.3 | % |
Construction Management | | | 22,078 | | 32.6 | % | | | 18,755 | | 32.2 | % |
Civil Engineering | | | 29,509 | | 37.0 | % | | | 25,423 | | 36.4 | % |
Environmental Services | | | 33,003 | | 35.7 | % | | | 30,965 | | 35.0 | % |
| | | | | | | | | | | | |
Total General & Administrative Costs | | $ | 133,564 | | 34.3 | % | | $ | 120,194 | | 34.2 | % |
| | | | | | | | | | | | |
General and administrative (“G&A”) costs increased 11.1%, to $133.6 million in fiscal 2005 from $120.2 million in fiscal 2004. The majority of the increase is primarily related to increased medical insurance premiums ($3.8 million), payroll taxes ($2.1 million), professional fees ($1.7 million), incentive compensation ($1.0 million) and rent expense ($1.6 million). We also incurred additional fees for information technology system upgrades and Sarbanes-Oxley readiness and documentation. These costs are generally considered corporate costs which benefit all segments and are allocated to the respective segments based on the individual segments’ proportionate share of G&A costs as compared to total Company G&A costs.
Misappropriation loss (recoveries) and Investigation and Related Costs
As described elsewhere in this Annual Report, we have recorded $3.6 million and $4.9 million in adjustments to disclose the effect of the misappropriations of Company assets (previously concealed and included in G&A for fiscal year 2004) during 2005 and 2004, respectively. During fiscal 2005, we also recorded a gain from recovered assets totaling $14.3 million, resulting in a net misappropriation gain of $10.7 million for fiscal 2005.
39
Additionally, in fiscal 2005, we incurred $5.4 million in costs to investigate and quantify the impact of the embezzlement, and in costs related to the recovery and maintenance of certain assets. The recorded gain from recovered assets and the investigation and related costs have been allocated to our segments based on the individual segments’ proportionate share of G&A costs to total Company G&A costs.
The following table sets forth the components of the misappropriation loss for the years ended September 30, 2005, 2004, 2003 and prior and related investigation expenses:
| | | | | | | | | | | | | | | | | |
| | | | | | Years Ended September 30, |
| (Dollars in thousands) | | Cumulative
Total | | | 2005 | | | 2004 | | 2003 | | 2002 and Prior |
Misappropriation loss | | $ | 36,600 | | | $ | 3,636 | | | $ | 4,854 | | $ | 5,075 | | $ | 23,035 |
Less: gain from recovered assets | | | (14,361 | ) | | | (14,361 | ) | | | — | | | — | | | — |
Legal fees related to the investigation | | | 2,344 | | | | 2,344 | | | | — | | | — | | | — |
Forensic accounting fees and related costs | | | 2,849 | | | | 2,849 | | | | — | | | — | | | — |
Other | | | 253 | | | | 253 | | | | — | | | — | | | — |
| | | | | | | | | | | | | | | | | |
Total | | $ | 27,685 | | | $ | (5,279 | ) | | $ | 4,854 | | $ | 5,075 | | $ | 23,035 |
| | | | | | | | | | | | | | | | | |
During fiscal 2006, we expect to incur additional costs in connection with the investigation and with the restatement of our previously issued consolidated financial statements. We expect to incur an additional $11.1 million in investigation related and legal related expenses and $2.7 million in overhead rate and financial statement audit related expenses during fiscal 2006.
40
Year Ended September 30, 2004 Compared to Year Ended September 30, 2003
Engineering Fees
| | | | | | | | | | | | |
| | | Years Ended September 30, | | | | | |
| (Dollars in thousands) | | 2004 | | 2003 | | $ Change | | % Change | |
Transportation Services | | $ | 179,743 | | $ | 156,453 | | $ | 23,290 | | 14.9 | % |
Construction Management | | | 77,465 | | | 57,764 | | | 19,701 | | 34.1 | % |
Civil Engineering | | | 81,841 | | | 64,188 | | | 17,653 | | 27.5 | % |
Environmental Services | | | 109,198 | | | 105,304 | | | 3,894 | | 3.7 | % |
| | | | | | | | | | | | |
Total Engineering Fees | | $ | 448,247 | | $ | 383,709 | | $ | 64,538 | | 16.8 | % |
| | | | | | | | | | | | |
Engineering fees for the year ended September 30, 2004, were $448.2 million compared to $383.7 million in fiscal 2003, representing a 16.8% increase. All four segments experienced increases in engineering fees, driven by double digit percentage growth in the Construction Management, Civil Engineering and Transportation Services segments.
Our Construction Management engineering fees increased 34.1% to $77.5 million in fiscal 2004 from $57.8 million in fiscal 2003. The increase in our construction management fees relates primarily to several large projects with existing clients including several state departments of transportation. The biggest growth arose out of an acceleration of the TTA projects and projects with Arkansas DOT. TTA work required the addition of more than 100 full time technical employees. The program to manage $800 million in turnpike construction management was won by us in 2001 and began six months earlier than scheduled, resulting in the construction management staff growth over previous years. At the same time, our Construction Management segment was at its staffing peak on a project with the Arkansas DOT. This project was also won in 2001, but did not achieve full staffing until 2002, and was nearing its end in 2004. The later stages of construction management work typically require a full technical staff, plus temporary technical help, as well as a significant amount of overtime. This resulted in a continued growth in the year over year engineering fees for this segment’s operations in Arkansas and Texas. This project is essentially complete and will demobilize in 2005. Lastly, our construction management segment benefited from the disaster response projects that resulted from the hurricanes that hit Florida in 2004.
Engineering fees from our Civil Engineering segment increased 27.5% to $81.9 million in fiscal 2004 from $64.2 million in fiscal 2003. The increase in engineering fees is primarily due to large disaster response projects related to the 2004 hurricanes in Florida and wild fires in Southern California. In addition, growth in our homeland security program also contributed to the increase year over year.
In the Transportation Services segment, engineering fees increased 14.9% to $179.7 million in fiscal 2004 from $156.4 million in fiscal 2003 due to higher volumes from new and existing projects with several state departments of transportation and aviation projects around the country. Growth was greatest in Texas, Arizona, Nevada, Colorado and California. The growth in Texas was due to increased funding as a result of the passage of the HB 3588 bill by the Texas legislature. In addition, more money is being generated through bonding and new tax initiatives. Transportation Services’ growth in the western states was due to increased marketing efforts and the WKA acquisition. Our aviation programs grew due to natural escalation of salaries, as well as, new military clients.
In our Environmental Services segment, engineering fees have remained stable increasing 3.7% to $109.2 million in fiscal 2004 from $105.3 million in fiscal 2003. The growth is primarily related to a large FEMA project, which began to wind down in early fiscal 2004. In addition, more time was spent during fiscal 2004 on marketing and business development for future projects, which negatively impacts our engineering fees in the short-term.
41
Net Earned Revenues
| | | | | | | | | | | | |
| | | Years Ended September 30, | | | | | |
| (Dollars in thousands) | | 2004 | | 2003 | | $ Change | | % Change | |
Transportation Services | | $ | 135,111 | | $ | 121,304 | | $ | 13,807 | | 11.4 | % |
Construction Management | | | 58,278 | | | 42,866 | | | 15,412 | | 36.0 | % |
Civil Engineering | | | 69,917 | | | 55,032 | | | 14,885 | | 27.0 | % |
Environmental Services | | | 88,569 | | | 82,814 | | | 5,755 | | 6.9 | % |
| | | | | | | | | | | | |
Total Net Earned Revenues | | $ | 351,875 | | $ | 302,016 | | $ | 49,859 | | 16.5 | % |
| | | | | | | | | | | | |
NER was $351.9 million in fiscal, 2004 as compared to $302.0 million in fiscal 2003, representing an increase of 16.5%. This increase was directly related to the increase in engineering fees.
| | | | | | | | | | | | |
| | | Year Ended September 30, | |
| (Dollars in thousands) | | 2004 | | % of NER | | | 2003 | | % of NER | |
Transportation Services | | $ | 44,632 | | 33.0 | % | | $ | 35,149 | | 29.0 | % |
Construction Management | | | 19,187 | | 32.9 | % | | | 14,898 | | 34.8 | % |
Civil Engineering | | | 11,924 | | 17.1 | % | | | 9,156 | | 16.6 | % |
Environmental Services | | | 20,629 | | 23.3 | % | | | 22,490 | | 27.2 | % |
| | | | | | | | | | | | |
Total Direct Reimbursable Expenses | | $ | 96,372 | | 27.4 | % | | $ | 81,693 | | 27.0 | % |
| | | | | | | | | | | | |
In addition, the change in our NER is affected by the fluctuation in our direct reimbursable expenses. Direct reimbursable expenses consist of out-of-pocket expenses related to the delivery of services such as blueprints, reproductions, CADD/computer charges, and travel and sub-consultant expenses. As a percentage of NER, direct reimbursable expenses increased 0.4% to 27.4% in fiscal 2004 from 27.0% in fiscal 2003. The increase was driven primarily by the Transportation Services and Civil Engineering segments.
Direct reimbursable expenses for our Transportation Services segment increased in fiscal 2004 by 27.0% to $44.6 million from $35.1 million in fiscal 2003. As a percentage of NER, direct reimbursable expenses increased 4.0% to 33.0% in fiscal 2004 from 29.0% in fiscal 2003. The increase primarily resulted from increased use of sub consultants due to contract requirements.
Direct reimbursable expenses in the Civil Engineering segment increased during fiscal 2004 by 30.2% to $11.9 million versus $9.2 million in fiscal 2003. As a percentage of NER, direct reimbursable expenses increased 0.5% to 17.1% in fiscal 2004 from 16.6% in fiscal 2003. The increase was due to the disaster response projects related to the Florida hurricanes in 2004 and the Southern California wild fires. These disasters required significant travel and lodging costs for the hundreds of employees overseeing debris removal in the areas affected by the disasters. In addition, sub-consultants were hired to perform some of the work, adding to the direct reimbursable expenses.
In our Construction Management segment, direct reimbursable expenses increased to $19.2 million in fiscal 2004 versus $14.9 million in fiscal 2003, for a year to year increase of 28.8%. As a percentage of NER, direct reimbursable expenses decreased 1.9% to 32.9% in fiscal 2004 from 34.8% in fiscal 2003 due to decreased use of sub-consultants on several projects and changes in our reimbursement structure for a large project.
Our Environmental Services segment experienced a decrease in direct reimbursable expenses of 8.3% to $20.6 million in fiscal 2004 compared to $22.5 million in fiscal 2003. As a percentage of NER, direct reimbursable expenses decreased by 3.9% to 23.3% in fiscal 2004 versus 27.2% in fiscal 2003. The decrease was due primarily to a return to normal direct reimbursable expense spending in fiscal 2004, as compared to 2003. In 2003, direct reimbursable expenses were larger than normal due to a video inspection sub-consultant that we utilized to assist us with the beginning stages of a job in California. Since then, the volume of video work has decreased, thereby reducing direct our expenses in this segment.
42
Operating Income
| | | | | | | | | | | | | |
| | | Years Ended September 30, | |
| (Dollars in thousands) | | 2004 | | % of NER | | | 2003 | | | % of NER | |
Transportation Services | | $ | 10,821 | | 8.0 | % | | $ | 12,150 | | | 10.0 | % |
Construction Management | | | 6,164 | | 10.6 | % | | | 2,773 | | | 6.5 | % |
Civil Engineering | | | 5,531 | | 7.9 | % | | | (184 | ) | | -0.3 | % |
Environmental Services | | | 6,916 | | 7.8 | % | | | 4,450 | | | 5.4 | % |
| | | | | | | | | | | | | |
Total Operating Income | | $ | 29,432 | | 8.4 | % | | $ | 19,189 | | | 6.4 | % |
| | | | | | | | | | | | | |
Misappropriation Loss | | | 4,854 | | 1.4 | % | | | 5,075 | | | 1.7 | % |
| | | | | | | | | | | | | |
Total Operating Income before Misappropriation Loss | | $ | 34,286 | | 9.7 | % | | $ | 24,264 | | | 8.0 | % |
| | | | | | | | | | | | | |
Operating income was $29.4 million for fiscal 2004 as compared to $19.2 million for fiscal 2003, representing an increase of 53.4%. Operating income, as a percentage of NER, increased by 2.0% to 8.4% in fiscal 2004 from 6.4% in fiscal 2003. All the segments except Transportation Services experienced an increase in operating income compared to the prior year and increases in operating income as a percentage of NER.
We believe that operating income before misappropriation loss is a useful measure in evaluating our results of operations because the misappropriation loss is an unusual item which does not reflect the costs or revenues of our provision of services in the given year. We believe this measure is helpful for us and for our investors to evaluate the results of our operations and make comparisons between periods.
Operating income before misappropriation loss was $34.3 million for fiscal 2004 as compared to $24.3 million for fiscal 2003, representing an increase of 41.3%. Misappropriation loss is treated as a corporate overhead cost, and as such, it is allocated to each respective segment. The allocation is based on the segments’ proportionate share of general and administrative (“G&A”) costs to total Company G&A costs.
Operating income before misappropriation loss, as a percentage of NER, increased by 1.7% to 9.7% in fiscal 2004 from 8.0% in fiscal 2003. All the segments except Transportation Services experienced an increase in operating income before misappropriation loss compared to the prior year and increases in operating income before misappropriation loss as a percentage of NER. These were driven by improvements in engineering fees and chargeability, due largely to the large disaster response projects and significant increases in work volume with DOTs as a result of increased funding sources available to the states. In addition, all three segments had a reduction in costs and expenses, as a percentage of NER, as a result of the improvements in chargeability, which allowed for less growth in the indirect labor costs. As explained previously, as chargeability improves or increases, we are able to bill more of our labor costs to clients thereby improving our profit margin. These increases were partially offset by decreases in operating income before misappropriation loss as a percentage of NER experienced by the Transportation Services segment due to decreased chargeability and increases in other costs and expenses, primarily indirect labor, as a percentage of NER.
Costs
Costs consist principally of direct salaries and direct costs that are chargeable to clients and overhead and general and administrative expenses.
43
Direct Salaries and Direct Costs
| | | | | | | | | | | | |
| | | Years Ended September 30, | |
| (Dollars in thousands) | | 2004 | | % of NER | | | 2003 | | % of NER | |
Transportation Services | | $ | 50,714 | | 37.5 | % | | $ | 45,629 | | 37.6 | % |
Construction Management | | | 24,518 | | 42.1 | % | | | 17,650 | | 41.2 | % |
Civil Engineering | | | 25,850 | | 37.0 | % | | | 20,454 | | 37.2 | % |
Environmental Services | | | 30,439 | | 34.4 | % | | | 28,258 | | 34.1 | % |
| | | | | | | | | | | | |
Direct Salaries and Direct Costs | | $ | 131,521 | | 37.4 | % | | $ | 111,991 | | 37.1 | % |
| | | | | | | | | | | | |
Direct salaries and direct costs primarily includes direct salaries and to a lesser extent unreimburseable direct costs. Direct costs totaled $1.6 million and $1.3 million in fiscal 2004 and 2003, respectively.
Direct salaries and direct costs were $131.5 million in fiscal 2004, as compared to $112.0 million in fiscal 2003, representing an increase of 17.4%. This increase is directly related to the increase in engineering fees and chargeability previously explained. As a percentage of NER, direct salaries and direct costs increased slightly, to 37.4% in fiscal 2004 from 37.1% in fiscal 2003.
Direct salaries and direct costs in the Construction Management segment increased in fiscal 2004 by 38.9% to $24.5 million versus $17.7 million in fiscal 2003. As a percentage of NER, direct salaries and direct costs increased 0.9% to 42.1% in fiscal 2004 from 41.2% in fiscal 2003. This increase is due to significant growth in Texas and Arkansas as a result of new projects with existing clients, such as TTA and Arkansas DOT.
The Civil Engineering segment decreased slightly as a percentage of NER to 37.0% in fiscal 2004 from 37.2% in fiscal 2003.
Direct salaries and direct costs for the Transportation Services segment increased to $50.7 million in fiscal 2004 from $45.6 million in fiscal 2003, an 11.1% increase year-to-year. As a percentage of NER, direct salaries and direct costs decreased slightly by 0.1% to 37.5% in fiscal 2004 as compared to 37.6% in fiscal 2003.
For our Environmental Services segment, direct salaries and direct costs increased by 7.7% to $30.4 million in fiscal 2004 from $28.3 million in fiscal 2003. As a percentage of NER, direct salaries and direct costs increased slightly to 34.4% in fiscal 2004 from 34.1% in fiscal 2003.
Indirect Salaries and General and Administrative Costs
The other component of costs is indirect costs, which include indirect salaries, and general and administrative expenses.
| | | | | | | | | | | | |
| | | Years Ended September 30, | |
| (Dollars in thousands) | | 2004 | | % of NER | | | 2003 | | % of NER | |
Transportation Services | | $ | 26,706 | | 19.8 | % | | $ | 22,033 | | 18.2 | % |
Construction Management | | | 8,084 | | 13.9 | % | | | 6,982 | | 16.3 | % |
Civil Engineering | | | 12,086 | | 17.3 | % | | | 11,628 | | 21.1 | % |
Environmental Services | | | 18,998 | | 21.4 | % | | | 18,289 | | 22.1 | % |
| | | | | | | | | | | | |
Total Indirect Salaries | | $ | 65,874 | | 18.7 | % | | $ | 58,932 | | 19.5 | % |
| | | | | | | | | | | | |
Indirect salaries increased 11.8%, to $65.9 million fiscal 2004 from $58.9 million in fiscal 2003. As a percentage of NER, indirect salaries decreased 0.8% to 18.7% for fiscal 2004 compared to 19.5% for the comparable fiscal period in 2003.
Transportation Services experienced an increase of 1.6% in indirect salaries as a percentage of NER in fiscal 2004 when compared to the same fiscal period in 2003. This increase is the result of decreased chargeability due to the focus on marketing and business development, as well as initiatives supporting new segment programs with new and existing clients.
44
Construction Management, Civil Engineering and Environmental Services segments experienced a decrease in indirect salaries as a percentage of NER of 2.4%, 3.8% and 0.6%, respectively, in fiscal 2004 from fiscal 2003. The decreases were the result of improved chargeability from new projects including the hurricane relief efforts. As chargeability increases, and as more of the technical staff’s time worked is being charged back to clients, direct labor increases and indirect labor decreases.
| | | | | | | | | | | | |
| | | Years Ended September 30, | |
| (Dollars in thousands) | | 2004 | | % of NER | | | 2003 | | % of NER | |
Transportation Services | | $ | 45,051 | | 33.3 | % | | $ | 39,610 | | 32.7 | % |
Construction Management | | | 18,755 | | 32.2 | % | | | 14,760 | | 34.4 | % |
Civil Engineering | | | 25,423 | | 36.4 | % | | | 22,085 | | 40.1 | % |
Environmental Services | | | 30,965 | | 35.0 | % | | | 30,374 | | 36.7 | % |
| | | | | | | | | | | | |
Total General & Administrative Costs | | $ | 120,194 | | 34.2 | % | | $ | 106,829 | | 35.4 | % |
| | | | | | | | | | | | |
G&A costs increased 12.5%, to $120.2 million in fiscal 2004 from $106.8 million during fiscal 2003. The majority of the increase is primarily related to increased medical insurance premiums, relocation and travel expenses, legal accruals and increased fiscal year-end performance awards. These costs are generally considered corporate costs which benefit all segments and are allocated to the respective segments based on the individual segments’ proportionate share of G&A costs as compared to total Company G&A costs.
G&A costs as a percentage of NER decreased 1.2% to 34.2% in fiscal 2004, from 35.4% in fiscal 2003. This improvement is primarily related to slower growth in overhead costs within our Civil Engineering and Construction Management segments as compared to the growth in the NER within these segments. The slower growth in overhead costs is because the disaster response projects require the use of several hundred part time temporary technical professionals who do not receive fringe benefits, such as health benefits and paid time off.
Misappropriation Loss
As described elsewhere in this Annual Report, we have recorded $4.9 million and $5.1 million in adjustments to disclose the effect of the misappropriations of Company assets (previously concealed and included in G&A for fiscal year 2004 and 2003) during 2004 and 2003, respectively. The misappropriation loss has been allocated to our segments based on the individual segments’ proportionate share of general and administrative costs to total Company G&A costs.
Consolidated Results
Net Income:
Net income was $21.1 million, $14.7 million and $12.7 million for fiscal years 2005, 2004 and 2003, respectively. The percentage of net income to NER was 5.4%, 4.2% and 4.2% for fiscal years 2005, 2004 and 2003. The 43.5% increase in net income in fiscal 2005, as compared to 2004, was primarily the result of increased engineering fees and chargeability as well as reduction in our effective tax rate resulting from the use of federal research and development tax credits. Net income also benefited in fiscal 2005 from $10.7 million net gain on assets recovered during the investigation ($3.6 million misappropriation loss net of $14.3 million gain from assets recovered) partially offset by additional legal and investigation related costs of $5.4 million. The effective tax rate was 42.8% in fiscal 2005 compared to 48.8% in fiscal 2004. The increase in engineering fees was partially offset by an increase in indirect labor and G&A expenses which increased at a greater percentage than NER. The majority of the increase in G&A is primarily related to increased medical insurance premiums, increased professional fees for information technology system upgrades and Sarbanes-Oxley readiness and documentation, and general performance salary increases for employees.
45
Income Taxes:
The income tax provision was $15.7 million and $13.7 million, or an effective tax rate of 42.8% and 48.8%, for the years ended September 30, 2005 and 2004, respectively. The decrease in the effective tax rate in fiscal 2005 was due to the use of federal research and development tax credits. For the past several years, we have generated research and development tax credits related to certain qualifying costs. The qualifying costs relate primarily to our project costs which we believe involve technical uncertainty. These research and development costs were incurred in the course of providing services generally under long-term client projects. Because we have been unable to utilize the entire amount of research and development tax credits we have generated each year, the balance sheets reflect a deferred tax asset of $5.5 million and $6.2 million at September 30, 2005 and 2004, respectively, for the unused credit carry forwards. These research and development tax credit carry-forwards will expire beginning 2017 through 2022.
Our effective tax rate is based on income, statutory tax rates and tax planning opportunities available in the various jurisdictions in which we operate. Significant judgment is required in determining the effective tax rate and in evaluating our tax positions. The Company establishes reserves when, despite its belief that the tax return positions are fully supportable, it believes that certain positions, if challenged, will likely be resolved unfavorably to us. These reserves are adjusted in light of changing facts and circumstances, such as the progress of a tax audit or current developments in tax law. Our annual tax rate includes the impact of reserve provisions and changes to reserves. While it is often difficult to predict the final outcome or the timing of resolution of any particular matter, we believe that our reserves reflect the probable outcome of known tax contingencies. Resolution of the tax contingencies would be recognized as an increase or decrease to our tax rate in the period of resolution. We have recorded a tax contingency accrual of approximately $13.5 million and $6.7 million as of September 30, 2005 and 2004, respectively related to research and development tax credits taken on the Company’s tax returns. The tax accruals are presented in the consolidated balance sheets within accounts payable and accrued expenses.
Liquidity and Capital Resources
Our primary sources of liquidity were cash flows from operations, borrowings under our credit lines and sales of our common stock during the fiscal years ended September 30, 2005 and 2004. Our primary uses of cash have been to fund our working capital and capital expenditure needs, service our debt obligations, and purchase shares of our common stock during the annual stock window. We also anticipate additional cash flows to be generated from the sale of recovered assets classified as held for sale as of September 30, 2005. We believe, based on our past experience, that we can generate sufficient cash flows from operations and cash flows available under our credit facility to fund our operating and capital expenditure requirements, as well as to service our debt obligations, including our accrued client reimbursement liability, for fiscal 2006 and beyond. In the event we experience a significant adverse change in our business operations, we would likely need to secure additional sources of financing, and we may not be able to obtain additional sources of funding at reasonable rates and terms.
Cash Flows From Operating Activities
Net cash provided by operating activities totaled $37.5 million for fiscal 2005 as compared to $32.2 million for fiscal 2004. The net cash provided by operating activities was primarily from income generated from projects and slower payments of our accounts payable and accrued expense and other current liabilities. Cash flows from income generated by projects were partially offset by increases in accounts receivable and unbilled fees. The increases in unbilled fees and accounts receivable are attributable primarily to the increase in revenue during fiscal 2005 compared to fiscal 2004 due to the hurricane debris removal projects. Fluctuations in accounts payable are related to direct reimbursable expenses, where the timing of payment to subcontractors is directly related to the collection of related receivables. Additionally, increases in accounts payable and accrued expenses and accrued reimbursement liability contributed to the increase in cash provided by operating activities. These increases are timing in nature, and we expect these amounts to be paid in subsequent periods.
In fiscal year 2004, net cash provided by operating activities totaled $32.2 million as compared to $24.3 million in 2003. The increase was primarily a result of the increase in accounts payable, and income generated from projects, offset by the increase in unbilled fees and accounts receivable. Fluctuations in accounts payable are related
46
to direct reimbursable expenses, where the timing of payment to sub-contractors is directly related to the collection of related receivables. In addition, the Company generated a $9.3 million of non-cash depreciation and amortization which increased cash generated from operating activities.
Approximately 80% of our revenues are billed on a monthly basis. The remaining amounts are billed when we reach certain stages of completion as specified in the contract. Payment terms for accounts receivable and unbilled fees, when billed, are net 30 days. During fiscal 2005, unbilled fees increased 3.7% to $69.7 million at September 30, 2005 from $67.2 million at September 30, 2004. The increase in unbilled fees during fiscal 2005 is related to the increase in engineering fees in fiscal 2005 as compared to fiscal 2004 due to several large debris removal projects related to the Florida hurricanes. During 2004, unbilled fees and billings in excess of cost increased by $15.2 million. The increase in 2004 resulted from the increase in engineering fees and new electronic billing procedures implemented by FDOT on new contracts, which temporarily delayed some of our FDOT billings by one to two months.
Accounts receivable increased 11.7%, to $67.5 million at September 30, 2005, from $60.4 million at September 30, 2004, primarily due to the growth in engineering fees. The allowance for doubtful accounts increased $102,000 from September 30, 2004 to September 30, 2005. The allowance for doubtful accounts decreased $39,000 at September 30, 2004.
During fiscal 2006, we expect to incur additional costs in connection with the ongoing investigations (see Note 2 for further discussions) and with the restatement of our previously issued consolidated financial statements. We expect to incur an additional $11.1 million in investigation related legal expenses and $2.7 million in overhead rate and financial statement re-audit related expenses during fiscal 2006. Additionally, we expect to spend approximately $12.0 million in client reimbursements during fiscal 2006, and an additional $24.0 million in subsequent years. We may also incur additional fees and penalties from various government regulatory agencies as a result of the final outcome of the ongoing investigations.
Cash Flows from Investing Activities
Net cash used in investing activities was $12.3 million, $16.0 million and $12.7 million in fiscal years 2005, 2004 and 2003, respectively. Investing activity typically consists of fixed asset purchases, such as survey equipment, computer equipment, furniture and leasehold improvements. However during fiscal 2005 and fiscal 2004 approximately $2.0 million and $5.9 million, respectively, were used in acquisitions and earn-out payments on a previous acquisition.
In fiscal 2005, we completed two acquisitions. On October 1, 2004 we acquired 100% of the stock of Croslin Associates, Inc. for $456,000 in cash and 11,111 shares of our common stock valued at approximately $300,000. On February 1, 2005 we acquired 100% of the stock of Land and Water Consulting, Inc. for $323,000 in cash and 33,862 shares of our common stock valued at approximately $914,000.
In fiscal 2004, we also completed two acquisitions. On June 1, 2004 we acquired 100% of the stock of TriLine Associates, Inc. for $3.7 million in cash. On July 1, 2004 we acquired 100% of the stock of W. Koo and Associates for $413,000 in cash, $250,000 in accrued additional purchase price and 71,429 shares of our common stock, for a total purchase price of $2.5 million. Additionally in fiscal 2004, we paid an earn-out payment related to the Welker acquisition in the amount of $1.2 million.
During fiscal 2006, we anticipate our capital expenditures to be approximately $11.6 million, including approximately $1.3 million relating to the first stage of implementation of our new Oracle enterprise resource planning system. We also expect to continue to pursue our long term-growth strategy by actively pursuing strategic acquisitions. During fiscal 2006, we expect to spend an additional $5.5 million for payments in connection with such acquisitions.
47
Cash Flows from Financing Activities
Net cash used in financing activities for fiscal 2005 was $4.5 million, as compared to $14.5 million for fiscal 2004. The change in net cash used is primarily attributable to a decrease in net borrowings from our line of credit of $9.2 million and a decrease in the net purchases of common stock of $788,000. Net cash used in financing activities for fiscal 2004 was $14.5 million, as compared to net cash used in financing activities of $11.5 million in fiscal 2003. The increase in net cash used is primarily attributable to the increase in net payments under our line of credit, combined with an increase in the net purchases of our common stock.
Pursuant to the terms of our credit agreement, we cannot declare or pay dividends in excess of 50% of our net income. We have not previously paid cash dividends on our common stock and have no present intention of paying cash dividends on our common stock in the foreseeable future. All earnings are retained for investment in our business.
Capital Resources
We have a $58 million line of credit agreement, inclusive of $3 million in letters of credit, with Bank of America, N.A. (the “Bank”). The original expiration date on the line of credit was June 30, 2005. On June 27, 2005, we amended our revolving line of credit with the bank, effective July 1, 2005. The amendment extends the maturity date of the line of credit to June 30, 2008. The total amount of the credit line remains unchanged at $58 million, inclusive of letters of credit; however the maximum amount of letters of credit was increased from $3 million to $10 million. Although our most significant source of cash has historically been generated from operations, in the event that cash flows from operations are insufficient to cover our working capital needs, we would access our revolving line of credit facility.
The interest rate (4.36% and 2.34% at September 30, 2005 and September 30, 2004, respectively) on the revolving line of credit ranges from LIBOR plus 50 basis points to Prime minus 125 basis points if our funded debt average ratio is less than 2.5. The range increases to LIBOR plus 75 basis points to Prime minus 100 basis points if our funded debt coverage ratio is between 2.5 and 3.0. The line of credit requires us to comply with certain debt covenants, including, maintaining minimum levels of net worth, a minimum coverage ratio of certain fixed charges, and a minimum leverage ratio of earnings before interest, taxes, depreciation and amortization to funded debt (all as defined in the agreement). In June 2005, covenants requiring monthly reporting of accounts receivable were amended to require quarterly reporting. Additionally, the Bank waived any events of default caused by our failure to comply with the accounts receivable reporting covenants prior to the date of the amendment.
The amendment also included a waiver of default caused by our failure to deliver to the Bank audited financial statements for fiscal year 2005, so long as such financial statements are delivered to the Bank no later than January 31, 2007. The line of credit is collateralized by substantially all of our assets.
As of September 30, 2005 and 2004, we had no outstanding balance under the line of credit. The maximum amount borrowed under our line of credit was $13.8 million and $24.2 million during fiscal 2005 and 2004. We used cash flow from operating activities to repay amounts outstanding under our line of credit.
On March 19, 2001, we entered into a mortgage note with an original principal amount of $9.0 million due in monthly installments starting on April 16, 2001, with interest. Interest on the note is LIBOR plus the floating rate margin of not less than 65 basis points and not greater than 90 basis points. A balloon payment is due on the note on March 16, 2011. The effective interest rate on the mortgage note was 4.51% and 2.49% for the fiscal years ended September 30, 2005 and 2004, respectively. The mortgage note is collateralized by our office building located in Orlando, Florida. We used an interest rate swap (“the Swap”) agreement in order to minimize the adverse impact of the floating interest rate characteristics of our long term debt obligations. The swap effectively converts the floating interest rate on the note payable to a fixed rate of 6.28%. On March 10, 2006, our swap expired. Our previously fixed rate was converted to an adjustable rate mortgage which called for an interest rate based on the 30-day LIBOR plus a margin of .065%. We do not anticipate entering into any additional swap agreements.
48
Our capital expenditures are generally for purchases of property and equipment. We spent $10.3 million, $9.6 million and $7.6 million on such expenditures in fiscal years 2005, 2004 and 2003, respectively. Our capital expenditures primarily consist of equipment, furniture and leasehold improvement purchases.
A stock offering usually takes place on an annual basis for a one week period during the month of March. The Company suspended the stock offering window for March 2006 until the final impact of the restatement of the Company’s consolidated financial statements is determined. Once the final impact is determined, and the related adjustments are recorded, the Company will likely resume the stock offering in fiscal 2007. During this offering, shares of the Company’s common stock available for sale to all full time employees of the Company, pursuant to The PBSJ Corporation Stock Ownership Plan.
We believe that our existing financial resources, together with our cash flow from operations and availability under our line of credit, will provide sufficient capital to fund our operations for fiscal year 2006 and beyond.
Inflation
The rate of inflation has not had a material impact on our operations. Moreover, if inflation remains at its recent levels, it is not expected to have a material impact on our operations for the foreseeable future.
Off-Balance Sheet Arrangements
We do not have any off-balance sheet arrangements other than operating leases for most of our office facilities and certain equipment. Minimum operating lease obligations payable in future years are presented below in Contractual Obligations.
Related Party Transactions
We lease office space in a building which houses our Marietta, Georgia operations from BCE Properties, which is owned and controlled by James Belk. Mr. Belk is a former owner of Welker and a Vice-President and Project Director of ours. The lease was assumed in connection with our acquisition of Welker in March 2003. The rental cost of the space is $17,600 per month. On May 31, 2006, the lease expired and was not renewed. In June 2006, we moved our Marietta, Georgia operations to a new location.
We lease office space in a building which houses our Missoula, Montana operations from Cedar Enterprises, which is owned and controlled by Charlie K. Vandam. Mr. Vandam is a former owner of LWC and a Senior Program Manager of ours. The lease was assumed in connection with our acquisition of LWC in February 2005. The rental cost of the space is $9,500 per month.
We lease office space in a building which houses our Helena, Montana operations from Prickly Pear Enterprises, which is owned and controlled by Paul Callahan. Mr. Callahan is a former owner of LWC and a Vice-President and Senior Division Manager of ours. The lease was assumed in connection with our acquisition of LWC in February 2005. The rental cost of the space is $1,800 per month.
Recent Accounting Pronouncements
In September 2006, the Financial Accounting Standards Board (“FASB”) issued FASB Statement No. 158 (“SFAS 158”), “Employers’ Accounting for Defined Benefit Pension and Other Postretirement Plans”. This Statement requires an employer to recognize the overfunded or underfunded status of a defined benefit postretirement plan (other than a multiemployer plan) as an asset or liability in its statement of financial position and to recognize changes in that funded status in the year in which the changes occur through comprehensive income. The Company is required to adopt the provisions of SFAS 158 for the fiscal year ending September 30, 2007. The Company is still evaluating the impact of this statement on its consolidated financial statements.
In September 2006, the FASB issued FASB Statement No. 157 (“SFAS 157”), “Fair Value Measurements”. SFAS 157 prescribes a single definition of fair value as the price that would be received to sell an asset or paid to
49
transfer a liability in an orderly transaction between market participants at the measurement date. The accounting provisions of SFAS 157 will be effective for the Company beginning July 1, 2008. The Company does not believe the adoption of SFAS 157 will have a material impact on its financial condition or results of operations.
In September 2006, the SEC issued Staff Accounting Bulletin No. 108 (“SAB 108”). SAB 108 addresses how the effects of prior year uncorrected misstatements should be considered when quantifying misstatements in current year financial statements. SAB 108 requires companies to quantify misstatements using a balance sheet and income statement approach and to evaluate whether either approach results in quantifying an error that is material in light of relevant quantitative and qualitative factors. When the effect of initial adoption is material, companies will record the effect as a cumulative effect adjustment to beginning of year retained earnings. SAB 108 will be effective for the Company beginning July 1, 2007. The Company does not believe the adoption of SAB 108 will have a material impact on its financial condition or results of operations.
In July 2006, the FASB issued Interpretation (“FIN”) No.48 “Accounting for Uncertainty in Income Taxes – an interpretation of FASB No. 109” (“FIN 48”). This interpretation establishes guidelines and thresholds that must be met for the recognition and measurement of a tax position taken or expected to be taken in a tax return. The provisions of FIN 48 are effective for fiscal years beginning after December 31, 2006. The Company is currently evaluating the impact of adopting FIN 48 on its consolidated financial statements.
In November 2005, the FASB issued FASB Staff Position (“FSP”) FAS 115-1 and FAS 124-1, “The Meaning of Other-Than-Temporary Impairment and Its Application to Certain Investments,” (“ FSP 115-1 and 124-1”) which address the determination as to when an investment is impaired, whether that impairment is other than temporary, and the measurement of an impairment loss. FSP 115-1 and 124-1 also includes accounting considerations subsequent to the recognition of an other-than-temporary impairment and requires certain disclosures about unrealized losses that have not been recognized as other-than-temporary impairments. The guidance in FSP 115-1 and 124-1 amends FASB Statement No. 115,“Accounting for Certain Investments in Debt and Equity Securities,” and Accounting Principles Board (“APB”) Opinion No. 18, “The Equity Method of Accounting for Investments in Common Stock.” FSP 115-1 and 124-1 is effective for reporting periods beginning after December 15, 2005. We have evaluated the impact of the adoption of FSP 115-1 and 124-1 and we do not believe adoption will have a significant impact on our consolidated financial statements.
In May 2005, the FASB issued Statement of Financial Accounting Standards (“SFAS”) No. 154,“Accounting Changes and Error Corrections” (“SFAS 154”), which replaces APB Opinion No. 20“Accounting Changes” and SFAS No. 3 “Reporting Accounting Changes in Interim Financial Statements.” SFAS 154 requires that a voluntary change in accounting principle be applied retrospectively with all prior period financial statements presented on the new accounting principle. SFAS 154 also requires that a change in method of depreciating or amortizing a long-lived non-financial asset be accounted for prospectively as a change in estimate, and correction of errors in previously issued financial statements should be termed a restatement. SFAS 154 is effective for accounting changes and correction of errors made in the first annual reporting period beginning after December 15, 2005. We early adopted SFAS 154 and have reported and disclosed the correction of errors in our previously reported consolidated financial statements in accordance with SFAS 154. The other reporting and disclosure requirements of SFAS 154 did not have a material impact on our consolidated financial statements.
In March 2005, the FASB issued FIN No. 47, “Accounting for Conditional Asset Retirement Obligations, an interpretation of SFAS No. 143” (“FIN 47”). FIN 47 requires conditional asset retirement obligations to be recognized if a legal obligation exists to perform asset retirement activities and a reasonable estimate of the fair value of the obligation can be made. FIN 47 clarifies that the term “conditional asset retirement obligation” as used in SFAS No. 143, “Accounting for Conditional Asset Retirement Obligations,” refers to a legal obligation to perform an asset retirement activity in which the timing and/or method of settlement are conditional on a future event that may or may not be within the control of the entity. The Company adopted the provisions of FIN 47 during the year ended September 30, 2005. No conditional asset retirement obligations were recognized and, accordingly, the adoption of FIN 47 had no effect on the Company’s consolidated financial statements.
In December 2004, the FASB issued SFAS No. 123 (revised 2004),“Share-Based Payment” (“SFAS No. 123(R)”), which is a revision of FASB Statement No. 123,“Accounting for Stock-Based Compensation.” Statement
50
123(R) supersedes APB Opinion No. 25, Accounting for Stock Issued to Employees. SFAS No. 123(R) requires all share-based payments to employees, including grants of employee stock options, to be recognized in the financial statements based on their fair values, beginning with the first annual period beginning after December 2005, with early adoption encouraged. We are required to adopt SFAS No. 123(R) in our first quarter of fiscal 2007, beginning October 1, 2006. The adoption of SFAS No. 123(R) is not expected to have a material impact on our results of operations, financial condition or cash flows.
In December 2004, the FASB issued SFAS No. 153,“Exchanges of Non Monetary Assets, an amendment to Opinion No. 29, Accounting for Non Monetary Transactions.” The amendment to Opinion No. 29 eliminates the fair value exception for non monetary exchanges of similar productive assets and replaces it with a general exception for exchanges of non monetary assets that do not have commercial substance. Such an exchange has commercial substance if the future cash flows of the entity are expected to change significantly as a result of the exchange. SFAS No. 153 is effective for non monetary asset exchanges occurring in periods beginning after June 15, 2005. We adopted this new accounting standard effective September 30, 2005. The adoption of SFAS No. 153 did not have a material impact on our consolidated financial statements.
In December 2004, the FASB issued FSP FAS 109-1 (“FSP 109”), “Application of FASB Statement No. 109, (“SFAS 109”), Accounting for Income Taxes, to the Tax Deduction on Qualified Production Activities Provided by the American Jobs Creation Act of 2004.” FSP 109 clarifies guidance that applies to the new deduction for qualified domestic production activities. When fully phased-in, the deduction will be up to 9% of the lesser of “qualified production activities income” or taxable income. FSP 109 clarifies that the deduction should be accounted for as a special deduction under SFAS 109 and will reduce tax expense in the period or periods that the amounts are deductible on the tax return. FSP 109 is effective for us beginning fiscal 2005. The adoption of FSP 109 did not have a material impact on our financial results.
In December 2003, the FASB issued Interpretation No. 46 (revised December 2003), “Consolidation of Variable Interest Entities”(“FIN 46R”), which replaced FIN 46. FIN 46R addresses how a business enterprise should evaluate whether it has a controlling interest in an entity through means other than voting rights. This interpretation requires a variable interest entity to be consolidated by a company if that company is subject to a majority of the risk of loss from the variable interest entity’s activities or is entitled to receive a majority of the entity’s residual returns or both. The interpretation also requires disclosures about variable interest entities that the company is not required to consolidate but in which it has a significant variable interest. We are required to adopt FIN 46R immediately for entities created after December 31, 2003 and at the beginning of fiscal 2007 for all other entities. Although we have not completed our final evaluation of FIN 46R, the adoption is not expected to have a material impact on our results of operations, financial condition or cash flows.
Critical Accounting Policies
In the ordinary course of business, we make a number of estimates and assumptions relating to the reporting of results of operations and financial position in the preparation of financial statements in conformity with accounting principles generally accepted in the United States of America. Actual results could differ significantly from those estimates under different assumptions and conditions. We believe the following discussion addresses our most critical accounting policies. These policies require management to exercise judgments that are often difficult, subjective and complex due to the necessity of estimating the effect of matters that are inherently uncertain.
Revenue Recognition
We recognize engineering fees from different types of services under a variety of different types of contracts. In recognizing engineering fees, we evaluate each contractual arrangement to determine the applicable authoritative accounting methodology to apply to each contract.
In the course of providing services, we principally use three types of contracts: Cost-plus contracts, Time and Materials contracts and Fixed Price contracts.
51
Cost-plus Contracts. We recognize engineering fees from cost-plus contracts at the time services are performed. The amount of revenue recognized is based on our actual labor costs incurred, plus non-labor costs and the portion of the fixed negotiated fee earned to date. Included in non-labor costs are pass-through costs for client-reimbursable materials, equipment and subcontractor costs where we are responsible for engineering specifications, procurement and management of such cost components on behalf of our clients. These direct reimbursable expenses are principally passed through to our clients with minimal or no mark-up and are included in our engineering fees. Indirect expenses are recorded as incurred and are allocated to contracts.
Time and Materials Contracts. We recognize engineering fees from Time and Materials contracts at the time services are performed. The amount of revenue recognized is based on the actual number of hours we spend on the projects, multiplied by contractual rates or multipliers. In addition, our clients reimburse us for our actual out-of-pocket costs of materials and other direct reimbursable expenses that we incur in connection with our performance under these contracts. The amount of NER on a time and materials contract fluctuates based on the proportion of the actual labor spent and reimbursable costs that are incurred for each contract.
Fixed Price Contracts. We recognize engineering fees from fixed price contracts based on the percentage of completion method where fees are recognized based on the ratio of estimated costs incurred to total estimated contract costs. At the time a loss on a contract becomes known, we record the entire amount of the estimated loss.
Change orders that result from modification of an original contract are taken into consideration for revenue recognition when they result in a change of total contract value and are approved by our clients. Engineering fees relating to unapproved change orders are recognized when collected.
The Company’s federal government contracts are subject to the Federal Acquisition Regulations (“FAR”). These regulations are partially incorporated into many local and state agency contracts. The FAR limits the recovery of certain specified indirect costs on contracts subject to such regulations. In accordance with industry practice, most of the Company’s federal government contracts are subject to termination at the discretion of the client. Contracts typically provide for reimbursement of costs incurred and payment of fees earned through the termination date.
Contracts that fall under the FAR are subject to audit by the government, primarily the Defense Contract Audit Agency (“DCAA”), which reviews our overhead rates, operating systems and costs proposals. As a result of its audits, the DCAA may disallow costs if it determines that we have incorrectly or improperly accounted for such costs in a manner inconsistent with generally accepted government accounting standards.
Accrued Reimbursement Liability
The accrued reimbursement liability is an estimate related to the total impact of the overstated overhead rates billed under certain government contracts, primarily as a result of an error with respect to general and administrative expenses and the misappropriations previously described. This liability represents estimates of our future payment obligations associated with reimbursing clients for such overstated overhead rates. The estimate was developed through a detailed analysis, reimbursement settlements and discussions with various government client representatives and is dependent on assumptions made by management, which include the impact of the misappropriations and other items on the overhead rates, the government clients subject to reimbursement, the percentage of contracts with these identified government clients subject to reimbursement, the extent to which overhead rates used to bill these identified government contracts varied from the overhead rates, the profit earned on these identified government contracts and the assumed interest rate on the reimbursement amounts. A significant change in one or more of these assumptions could potentially have a material effect on the financial statements. Although false claims actions by certain state government agencies are possible under various State False Claims Acts (“State FCA”), the Company currently believes these actions are unlikely and has not accrued a liability for these actions. The State FCA allow for state and certain local government entities to recover damages from the presentation of certain false or fraudulent claims by entities in which they contract with. If false claims actions are initiated in the future by one or more of these state governmental agencies, such actions could have a material affect on the Company’s financial statements.
The Company has entered into reimbursement settlement agreements with the Florida Department of
52
Transportation and the Texas Department of Transportation, its two largest clients, for $11.8 million and $4.3 million, respectively for all contract amounts through September 30, 2005. Such amounts were paid in fiscal 2006. In addition, it has reached a reimbursement settlement agreement with the Department of Justice on behalf of all of the Company’s federal clients for $6.5 million for all contract amounts through September 30, 2005. These three settlements represent approximately 60% of the accrued reimbursement liability as of September 30, 2005. The Company has started discussions with several of its other government clients, which are in various stages of settlement.
Deferred Compensation
Estimated liabilities related to defined benefit pension and postretirement programs are included in deferred compensation. These liabilities represent actuarially determined estimates of our future obligations associated with providing these benefit programs to some of our employees. The actuarial studies and estimates are dependent on assumptions made by management, which include discount rates, life expectancy of participants and rates of increase in compensation levels. These assumptions are determined based on the current economic environment at year-end.
Income Taxes
In determining net income for financial statement purposes, we must make estimates and judgments in the calculation of tax assets and liabilities and in the determination of the recoverability of deferred tax assets. Tax assets and liabilities arise from temporary differences between the tax return and the financial statement recognition of revenues and expenses.
For the past several years, we have generated research and development tax credits related to certain qualifying costs. The qualifying costs relate primarily to the Company’s project costs which management believes involved technical uncertainty. These research and development costs were incurred by the Company in the course of providing services generally under long-term client projects. Because the Company has been unable to utilize the entire amount of research and development tax credits it has generated each year, the balance sheets reflect a deferred tax asset of $5.5 million and $6.2 million at September 30, 2005 and 2004, respectively, for the unused credit carry forwards. The credits will expire beginning 2017 through 2022.
The Company’s effective tax rate is based on income, statutory tax rates and tax planning opportunities available in the various jurisdictions in which the Company operates. Significant judgment is required in determining the effective tax rate and in evaluating the Company’s tax positions. The Company establishes reserves when, despite its belief that the tax return positions are fully supportable, it believes that certain positions, if challenged, will likely be resolved unfavorably to us. These reserves are adjusted in light of changing facts and circumstances, such as the progress of a tax audit or current developments in tax law. The Company’s annual tax rate includes the impact of reserve provisions and changes to reserves. While it is often difficult to predict the final outcome or the timing of resolution of any particular matter, the Company believes that its reserves reflect the probable outcome of known tax contingencies. Resolution of the tax contingencies would be recognized as an increase or decrease to the Company’s tax rate in the period of resolution. The Company has recorded a tax contingency accrual of approximately $13.5 million and $6.7 million as of September 30, 2005 and 2004, respectively, related to research and development tax credits taken on the Company’s tax return. The tax accruals are presented in the consolidated balance sheets within accounts payable and accrued expenses
Contingencies
Management estimates are inherent in the assessment of our exposure to litigation and other legal claims and contingencies. Significant management judgment is utilized in determining probable and or reasonably estimable amounts to be recorded or disclosed in our financial statements (seeAccrued Reimbursement Liability above). The results of any changes in accounting estimates are reflected in the financial statements of the period in which the changes are determined.
53
Contractual Obligations
A summary of our contractual obligations as of September 30, 2005 is as follows:
| | | | | | | | | | | | | | | |
| (Dollars in thousands) | | | | Payments due by period |
Contractual Obligations | | Total | | Less than 1
year | | 2-3 years | | 4-5 years | | More than 5
years |
Long-term debt obligations (1) | | $ | 7,833 | | $ | 408 | | $ | 1,024 | | $ | 1,024 | | $ | 5,377 |
Operating lease obligations | | | 51,893 | | | 16,786 | | | 24,689 | | | 9,402 | | | 1,016 |
Capital lease obligations | | | 1,366 | | | 559 | | | 667 | | | 140 | | | — |
Purchase obligations | | | 1,004 | | | 1,004 | | | — | | | — | | | — |
Expected retirement benefit payments | | | 11,965 | | | 795 | | | 1,753 | | | 1,951 | | | 7,466 |
Accrued client reimbursement payments | | | 21,830 | | | 3,996 | | | 17,834 | | | — | | | — |
| | | | | | | | | | | | | | | |
Total | | $ | 95,891 | | $ | 23,548 | | $ | 45,967 | | $ | 12,517 | | $ | 13,859 |
| | | | | | | | | | | | | | | |
| (1) | Excludes interest which is based on a variable rate. |
We are obligated under various non-cancelable leases for office facilities, furniture and equipment. Certain leases contain renewal options, escalation clauses and certain other operating expenses of the properties. In the normal course of business, leases that expire are expected to be renewed or replaced by leases for other properties.
In July 2004, the Company entered into a two year Microsoft Enterprise Agreement with Microsoft Licensing, GP covering all of the Company’s Microsoft based applications licenses. The annual payment under this agreement is approximately $728,000. At September 30, 2005, we have an outstanding purchase commitment of approximately $667,000 under this agreement, all of which is included in contractual purchase obligations above.
ITEM 7A.Quantitative and Qualitative Disclosures about Market Risk
We believe that our exposure to market risks is minimal. We do not hold market-risk sensitive instruments for trading purposes. We entered into one derivative financial instrument, a swap agreement, to hedge cash flows related to the LIBOR interest rate risk. Both at inception of the hedge and on an ongoing basis, we believe there is no ineffectiveness in the hedging relationship of interest rate risk involving interest-bearing debt and the interest-rate swap. Based on a hypothetical 1% point increase in the period ending market interest rate as of September 30, 2005, the change in the fair value of this liability would be approximately $200,000. We believe this instrument will be highly effective in hedging cash flows. We hold no other financial instruments or derivative commodity instruments to hedge any market risk, nor do we currently plan to employ them in the near future. On March 10, 2006, our swap expired. Our adjustable rate mortgage calls for an interest rate based on the 30 day LIBOR plus a margin of .065%. We do not anticipate entering into any additional swap agreements.
The interest rate (4.36% and 2.34% at September 30, 2005 and September 30, 2004, respectively) on our revolving line of credit and mortgage note ranges from LIBOR plus 50 basis points to prime minus 125 basis points if our funded debt coverage ratio is less than 2.5. The range increases to LIBOR plus 75 basis points to prime minus 100 basis points if our funded debt coverage ratio is between 2.5 to 3.0. We mitigate interest rate risk by continually monitoring interest rates and electing the lower of the LIBOR or prime rate option available under the line of credit or mortgage note. As of September 30, 2005, the fair value of the debt approximates the outstanding principal balance because of the variable rate nature of such instruments.
The interest rates under our revolving line of credit and mortgage note are variable and accordingly we have exposure to market risk. To the extent that we have borrowings outstanding, there is market risk relating to the amount of such borrowings, however, our exposure is minimal due to the short-term nature of our borrowings under our revolving line of credit and only $7.8 million outstanding principle balance under the mortgage note.
54
ITEM 8.Financial Statements and Supplementary Data
Report of Independent Registered Public Accounting Firm
To the Board of Directors and Stockholders of The PBSJ Corporation:
We have audited the accompanying consolidated balance sheets of The PBSJ Corporation and subsidiaries (the “Company”) as of September 30, 2005 and 2004, and the related consolidated statements of operations, of stockholders’ equity and comprehensive income, and of cash flows for the years then ended. These consolidated financial statements are the responsibility of the Company’s management. Our responsibility is to express an opinion on these consolidated financial statements based on our audits.
We conducted our audits in accordance with the standards of the Public Company Accounting Oversight Board (United States). Those standards require that we plan and perform the audit to obtain reasonable assurance about whether the consolidated financial statements are free of material misstatement. The Company is not required to have, nor were we engaged to perform, an audit of its internal control over financial reporting. Our audits included consideration of internal control over financial reporting as a basis for designing audit procedures that are appropriate in the circumstances, but not for the purpose of expressing an opinion on the effectiveness of the Company’s internal control over financial reporting. Accordingly, we express no such opinion. An audit also includes examining, on a test basis, evidence supporting the amounts and disclosures in the consolidated financial statements, assessing the accounting principles used and significant estimates made by management, as well as evaluating the overall financial statement presentation. We believe that our audits provide a reasonable basis for our opinion.
In our opinion, such consolidated financial statements present fairly, in all material respects, the financial position of The PBSJ Corporation and subsidiaries as of September 30, 2005 and 2004, and the results of their operations and their cash flows for the years then ended, in conformity with accounting principles generally accepted in the United States of America.
As discussed in Note 2, the accompanying 2004 financial statements have been restated.
|
| /s/ DELOITTE & TOUCHE LLP |
|
| Certified Public Accountants |
|
| Miami, Florida |
| January 29, 2007 |
55
Report of Independent Registered Certified Public Accounting Firm
To the Board of Directors and Stockholders of The PBSJ Corporation:
In our opinion, the accompanying consolidated statements of operations, stockholders’ equity and comprehensive income and cash flows for the year ended September 30, 2003 present fairly, in all material respects, the results of operations and cash flows of The PBSJ Corporation and its subsidiaries for the year ended September 30, 2003, in conformity with accounting principles generally accepted in the United States of America. These financial statements are the responsibility of the Company’s management. Our responsibility is to express an opinion on these financial statements based on our audit. We conducted our audit of these statements in accordance with the standards of the Public Company Accounting Oversight Board (United States). Those standards require that we plan and perform the audit to obtain reasonable assurance about whether the financial statements are free of material misstatement. An audit includes examining, on a test basis, evidence supporting the amounts and disclosures in the financial statements, assessing the accounting principles used and significant estimates made by management, and evaluating the overall financial statement presentation. We believe that our audit provides a reasonable basis for our opinion.
As discussed in Note 2, the Company has restated its consolidated financial statements for the year ended September 30, 2003.
|
| /s/ PricewaterhouseCoopers LLP |
|
| Miami, Florida |
| December 12, 2003, except for Note 2, as to which the date is January 29, 2007. |
56
THE PBSJ CORPORATION
Consolidated Balance Sheets
| | | | | | | | |
| | | September 30, | |
| (Amounts in thousands, except shares and per share amounts) | | 2005 | | | 2004 | |
| | | | | | (As Restated | |
| | | | | | See Note 2) | |
Assets | | | | | | | | |
Current Assets: | | | | | | | | |
Cash and cash equivalents | | $ | 22,556 | | | $ | 1,910 | |
Marketable securities at fair value | | | 636 | | | | 573 | |
Accounts receivable, net | | | 67,493 | | | | 60,445 | |
Unbilled fees | | | 69,658 | | | | 67,175 | |
Assets held for sale | | | 9,289 | | | | — | |
Shareholder subscription receivable | | | 4,276 | | | | 3,929 | |
Other current assets | | | 2,039 | | | | 2,166 | |
| | | | | | | | |
Total current assets | | | 175,947 | | | | 136,198 | |
| | |
Property and equipment, net | | | 36,741 | | | | 33,913 | |
Cash surrender value of life insurance | | | 9,602 | | | | 8,228 | |
Deferred income taxes | | | 4,817 | | | | 7,797 | |
Goodwill | | | 17,736 | | | | 14,390 | |
Intangible assets, net | | | 1,820 | | | | 3,268 | |
Other assets | | | 4,984 | | | | 571 | |
| | | | | | | | |
Total assets | | $ | 251,647 | | | $ | 204,365 | |
| | | | | | | | |
Liabilities and Stockholders’ Equity | | | | | | | | |
Current Liabilities: | | | | | | | | |
Accounts payable and accrued expenses | | $ | 84,223 | | | $ | 65,771 | |
Liabilities related to assets held for sale | | | 4,627 | | | | — | |
Accrued reimbursement liability | | | 34,772 | | | | 24,119 | |
Current portion of long-term debt | | | 408 | | | | 290 | |
Current portion of capital leases | | | 341 | | | | 240 | |
Accrued vacation | | | 10,163 | | | | 8,614 | |
Billings in excess of costs | | | 3,339 | | | | 3,388 | |
Deferred income taxes | | | 7,568 | | | | 13,483 | |
| | | | | | | | |
Total current liabilities | | | 145,441 | | | | 115,905 | |
Long-term debt, less current portion | | | 7,425 | | | | 7,828 | |
Capital leases, less current portion | | | 512 | | | | 444 | |
Deferred compensation | | | 11,994 | | | | 10,683 | |
Other liabilities | | | 8,443 | | | | 6,802 | |
| | | | | | | | |
Total liabilities | | | 173,815 | | | | 141,662 | |
| | | | | | | | |
Stockholders’ Equity: | | | | | | | | |
Common stock, par value $0.00067, 15,000,000 shares authorized, 7,720,527 and 7,913,680 shares issued and outstanding at September 30, 2005 and 2004, respectively | | | 5 | | | | 5 | |
Retained earnings | | | 82,991 | | | | 67,066 | |
Accumulated other comprehensive loss | | | (1,957 | ) | | | (2,053 | ) |
Unearned compensation and other | | | (3,207 | ) | | | (2,315 | ) |
| | | | | | | | |
Total stockholders’ equity | | | 77,832 | | | | 62,703 | |
| | | | | | | | |
Total liabilities and stockholders’ equity | | $ | 251,647 | | | $ | 204,365 | |
| | | | | | | | |
The accompanying notes are an integral part of these consolidated financial statements
57
THE PBSJ CORPORATION
Consolidated Statements of Operations
| | | | | | | | | | | | |
| | | Years Ended September 30, | |
| (Amounts in thousands, except per share amounts) | | 2005 | | | 2004 | | | 2003 | |
| | | | | | (As Restated
See Note 2) | | | (As Restated
See Note 2) | |
Earned revenues: | | | | | | | | | | | | |
Engineering fees | | $ | 511,937 | | | $ | 448,247 | | | $ | 383,709 | |
Direct reimbursable expenses | | | 121,986 | | | | 96,372 | | | | 81,693 | |
| | | | | | | | | | | | |
Net earned revenues | | | 389,951 | | | | 351,875 | | | | 302,016 | |
| | | | | | | | | | | | |
Costs and expenses: | | | | | | | | | | | | |
Direct salaries and direct costs | | | 146,299 | | | | 131,521 | | | | 111,991 | |
General and administrative expenses, including indirect salaries | | | 210,551 | | | | 186,068 | | | | 165,761 | |
Misappropriation loss (recoveries), net | | | (10,725 | ) | | | 4,854 | | | | 5,075 | |
Investigation and related costs | | | 5,446 | | | | — | | | | — | |
| | | | | | | | | | | | |
Total costs and expenses | | | 351,571 | | | | 322,443 | | | | 282,827 | |
| | | | | | | | | | | | |
Operating income | | | 38,380 | | | | 29,432 | | | | 19,189 | |
| | | |
Other income (expenses): | | | | | | | | | | | | |
Interest expense | | | (1,824 | ) | | | (1,625 | ) | | | (1,518 | ) |
Other, net | | | 260 | | | | 617 | | | | 1,561 | |
| | | | | | | | | | | | |
Total other income (expenses): | | | (1,564 | ) | | | (1,008 | ) | | | 43 | |
| | | | | | | | | | | | |
Income before income taxes | | | 36,816 | | | | 28,424 | | | | 19,232 | |
| | | |
Provision for income taxes | | | 15,741 | | | | 13,734 | | | | 6,511 | |
| | | | | | | | | | | | |
Net income | | $ | 21,075 | | | $ | 14,690 | | | $ | 12,721 | |
| | | | | | | | | | | | |
Net income per share: | | | | | | | | | | | | |
Basic | | $ | 2.92 | | | $ | 2.03 | | | $ | 1.71 | |
| | | | | | | | | | | | |
Diluted | | $ | 2.74 | | | $ | 1.91 | | | $ | 1.61 | |
| | | | | | | | | | | | |
Weighted average shares outstanding: | | | | | | | | | | | | |
Basic | | | 7,208 | | | | 7,249 | | | | 7,452 | |
| | | | | | | | | | | | |
Diluted | | | 7,685 | | | | 7,692 | | | | 7,886 | |
| | | | | | | | | | | | |
The accompanying notes are an integral part of these consolidated financial statements
58
THE PBSJ CORPORATION
Consolidated Statements of Stockholders’ Equity and Comprehensive Income
For the years ended September 30, 2005, 2004 and 2003
| | | | | | | | | | | | | | | | | | | | | | | | | | | |
| | | Common Stock | | | Additional Paid-in Capital | | | Retained Earnings | | | Accumulated Other
Comprehensive Loss | | | Unearned
Compensation and Other | | | Total Stockholders’ Equity | |
| (Amounts in thousands, except share data) | | Shares | | | Amount | | | | | | |
Balance at September 30, 2002 (Previously Reported) | | 8,346,524 | | | $ | 6 | | | $ | — | | | $ | 60,981 | | | $ | (501 | ) | | $ | (1,739 | ) | | $ | 58,747 | |
Cumulative effect of restatement on prior years | | — | | | | — | | | | — | | | | (13,852 | ) | | | (1,048 | ) | | | (189 | ) | | | (15,089 | ) |
| | | | | | | | | | | | | | | | | | | | | | | | | | | |
Balance at September 30, 2002 (As Restated See Note 2) | | 8,346,524 | | | | 6 | | | | — | | | | 47,129 | | | | (1,549 | ) | | | (1,928 | ) | | | 43,658 | |
Comprehensive income: | | | | | | | | | | | | | | | | | | | | | | | | | | | |
Net income (As Restated See Note 2) | | — | | | | — | | | | — | | | | 12,721 | | | | — | | | | — | | | | 12,721 | |
Unrealized gain on marketable securities, net of tax of $52 | | — | | | | — | | | | — | | | | — | | | | 114 | | | | — | | | | 114 | |
Unrealized loss on derivative, net of tax of $31 | | — | | | | — | | | | — | | | | — | | | | 69 | | | | — | | | | 69 | |
Minimum pension liability adjustment, net of tax of $96 | | — | | | | — | | | | — | | | | — | | | | 143 | | | | — | | | | 143 | |
| | | | | | | | | | | | | | | | | | | | | | | | | | | |
Total comprehensive income (As Restated See Note 2) | | | | | | | | | | | | | | | | | | | | | | | | | | 13,047 | |
Sale of stock | | 257,782 | | | | (1 | ) | | | 4,964 | | | | — | | | | — | | | | — | | | | 4,963 | |
Stock issued in acquisitions | | 20,000 | | | | — | | | | 400 | | | | — | | | | — | | | | — | | | | 400 | |
Shares purchased and retired | | (716,298 | ) | | | — | | | | (6,164 | ) | | | (6,379 | ) | | | — | | | | — | | | | (12,543 | ) |
Issuance of restricted stock, net of cancellations | | 61,772 | | | | — | | | | 800 | | | | — | | | | — | | | | (708 | ) | | | 92 | |
Amortization of deferred compensation | | — | | | | — | | | | — | | | | — | | | | — | | | | 444 | | | | 444 | |
| | | | | | | | | | | | | | | | | | | | | | | | | | | |
Balance at September 30, 2003 (As Restated See Note 2) | | 7,969,780 | | | | 5 | | | | — | | | | 53,471 | | | | (1,223 | ) | | | (2,192 | ) | | | 50,061 | |
Comprehensive income: | | | | | | | | | | | | | | | | | | | | | | | | | | | |
Net income (As Restated See Note 2) | | — | | | | — | | | | — | | | | 14,690 | | | | — | | | | — | | | | 14,690 | |
Unrealized gain on marketable securities, net of tax of $39 | | — | | | | — | | | | — | | | | — | | | | 62 | | | | — | | | | 62 | |
Unrealized loss on derivative, net of tax of $146 | | — | | | | — | | | | — | | | | — | | | | 233 | | | | — | | | | 233 | |
Minimum pension liability adjustment, net of tax benefit of $696 (As Restated See Note 2) | | — | | | | — | | | | — | | | | — | | | | (1,125 | ) | | | — | | | | (1,125 | ) |
| | | | | | | | | | | | | | | | | | | | | | | | | | | |
Total comprehensive income (As Restated See Note 2) | | | | | | | | | | | | | | | | | | | | | | | | | | 13,860 | |
Sale of stock (As Restated See Note 2) | | 442,848 | | | | — | | | | 9,964 | | | | — | | | | — | | | | — | | | | 9,964 | |
Stock issued in acquisitions | | 71,429 | | | | — | | | | 1,875 | | | | — | | | | — | | | | — | | | | 1,875 | |
Shares purchased and retired | | (597,086 | ) | | | — | | | | (12,510 | ) | | | (1,095 | ) | | | — | | | | — | | | | (13,605 | ) |
Issuance of restricted stock, net of cancellations (As Restated See Note 2) | | 26,709 | | | | — | | | | 671 | | | | — | | | | — | | | | (672 | ) | | | (1 | ) |
Amortization of deferred compensation | | — | | | | — | | | | — | | | | — | | | | — | | | | 549 | | | | 549 | |
| | | | | | | | | | | | | | | | | | | | | | | | | | | |
Balance at September 30, 2004 (As Restated See Note 2) | | 7,913,680 | | | | 5 | | | | — | | | | 67,066 | | | | (2,053 | ) | | | (2,315 | ) | | | 62,703 | |
Comprehensive income: | | | | | | | | | | | | | | | | | | | | | | | | | | | |
Net income | | — | | | | — | | | | — | | | | 21,075 | | | | — | | | | — | | | | 21,075 | |
Unrealized gain on marketable securities, net of tax of $10 | | — | | | | — | | | | — | | | | — | | | | 38 | | | | — | | | | 38 | |
Unrealized loss on derivative, net of tax of $74 | | — | | | | — | | | | — | | | | — | | | | 226 | | | | — | | | | 226 | |
Minimum pension liability adjustment, net of tax benefit of $130 | | — | | | | — | | | | — | | | | — | | | | (168 | ) | | | — | | | | (168 | ) |
| | | | | | | | | | | | | | | | | | | | | | | | | | | |
Total comprehensive income | | | | | | | | | | | | | | | | | | | | | | | | | | 21,171 | |
Sale of stock | | 413,641 | | | | — | | | | 11,168 | | | | — | | | | — | | | | — | | | | 11,168 | |
Stock issued in acquisitions | | 45,995 | | | | — | | | | 1,214 | | | | — | | | | — | | | | — | | | | 1,214 | |
Shares purchased and retired | | (538,565 | ) | | | — | | | | (13,543 | ) | | | (998 | ) | | | — | | | | — | | | | (14,541 | ) |
Shares recovered from investigation | | (174,261 | ) | | | — | | | | (554 | ) | | | (4,152 | ) | | | — | | | | — | | | | (4,706 | ) |
Issuance of restricted stock, net of cancellations | | 60,037 | | | | — | | | | 1,715 | | | | — | | | | — | | | | (1,715 | ) | | | — | |
Amortization of deferred compensation | | — | | | | — | | | | — | | | | — | | | | — | | | | 806 | | | | 806 | |
Other | | — | | | | — | | | | — | | | | | | | | — | | | | 17 | | | | 17 | |
| | | | | | | | | | | | | | | | | | | | | | | | | | | |
Balance at September 30, 2005 | | 7,720,527 | | | $ | 5 | | | $ | — | | | $ | 82,991 | | | $ | (1,957 | ) | | $ | (3,207 | ) | | $ | 77,832 | |
| | | | | | | | | | | | | | | | | | | | | | | | | | | |
The accompanying notes are an integral part of these consolidated financial statements
59
THE PBSJ CORPORATION
Consolidated Statements of Cash Flows
| | | | | | | | | | | | |
| | | Years Ended September 30, | |
| (Dollars in thousands) | | 2005 | | | 2004 | | | 2003 | |
| | | | | | (As Restated
See Note 2) | | | (As Restated
See Note 2) | |
Cash flows from operating activities: | | | | | | | | | | | | |
Net income | | $ | 21,075 | | | $ | 14,690 | | | $ | 12,721 | |
Adjustments to reconcile net income to net cash provided by operating activities: | | | | | | | | | | | | |
Increase in cash surrender value of life insurance | | | (835 | ) | | | (220 | ) | | | (365 | ) |
Depreciation and amortization | | | 9,980 | | | | 9,261 | | | | 8,848 | |
Gain on sale of property | | | (426 | ) | | | (85 | ) | | | (296 | ) |
Gain from shares recovered | | | (4,706 | ) | | | — | | | | — | |
Gain from assets recovered, net | | | (6,526 | ) | | | — | | | | — | |
Provision for bad debt and unbillable amounts | | | 486 | | | | 217 | | | | 162 | |
Provision (benefit) for deferred income taxes | | | (2,912 | ) | | | 7,180 | | | | 323 | |
Provision for and amortization of deferred compensation and other | | | 1,834 | | | | 998 | | | | 983 | |
Change in operating assets and liabilities, net of acquisitions: | | | | | | | | | | | | |
Increase in accounts receivable | | | (6,691 | ) | | | (7,801 | ) | | | (5,129 | ) |
Increase in unbilled fees and billings in excess of cost | | | (2,227 | ) | | | (15,228 | ) | | | (9,745 | ) |
(Increase) decrease in other current assets | | | (423 | ) | | | 2,470 | | | | 559 | |
Decrease (increase) in other assets | | | (211 | ) | | | 82 | | | | 81 | |
Increase in accounts payable and accrued expenses | | | 17,274 | | | | 10,176 | | | | 8,643 | |
Increase in accrued reimbursement liability | | | 10,653 | | | | 7,871 | | | | 5,823 | |
Increase in accrued vacation | | | 1,499 | | | | 871 | | | | 953 | |
Increase (decrease) in other liabilities | | | (371 | ) | | | 1,760 | | | | 740 | |
| | | | | | | | | | | | |
Net cash provided by operating activities | | | 37,473 | | | | 32,242 | | | | 24,301 | |
| | | | | | | | | | | | |
Cash flows from investing activities: | | | | | | | | | | | | |
Investment in life insurance policies | | | (539 | ) | | | (524 | ) | | | (309 | ) |
Acquisitions and purchase price adjustments, net of cash acquired | | | (1,984 | ) | | | (5,921 | ) | | | (5,506 | ) |
Dividends reinvested in marketable securities | | | (15 | ) | | | — | | | | — | |
Proceeds from the sale of property and equipment | | | 510 | | | | 102 | | | | 851 | |
Purchases of property and equipment | | | (10,269 | ) | | | (9,636 | ) | | | (7,707 | ) |
| | | | | | | | | | | | |
Net cash used in investing activities | | | (12,297 | ) | | | (15,979 | ) | | | (12,671 | ) |
| | | | | | | | | | | | |
Cash flows from financing activities: | | | | | | | | | | | | |
Borrowings under line of credit | | | 75,352 | | | | 150,014 | | | | 150,197 | |
Payments under line of credit | | | (75,352 | ) | | | (159,248 | ) | | | (152,979 | ) |
Principal payments under notes and mortgage payable | | | (506 | ) | | | (818 | ) | | | (991 | ) |
Principal payments under capital lease obligations | | | (304 | ) | | | (189 | ) | | | (20 | ) |
Common stock: | | | | | | | | | | | | |
Proceeds from sale | | | 10,821 | | | | 9,327 | | | | 4,813 | |
Payments for repurchase | | | (14,541 | ) | | | (13,605 | ) | | | (12,544 | ) |
| | | | | | | | | | | | |
Net cash used in financing activities | | | (4,530 | ) | | | (14,519 | ) | | | (11,524 | ) |
| | | | | | | | | | | | |
Net increase in cash and cash equivalents | | | 20,646 | | | | 1,744 | | | | 106 | |
| | | | | | | | | | | | |
Cash and cash equivalents at beginning of period | | | 1,910 | | | | 166 | | | | 60 | |
Cash and cash equivalents at end of period | | $ | 22,556 | | | $ | 1,910 | | | $ | 166 | |
| | | | | | | | | | | | |
The accompanying notes are an integral part of these consolidated financial statements.
60
The PBSJ Corporation
Notes to the Consolidated Financial Statements
1.Organization and Summary of Significant Accounting Policies
Organization and Principles of Consolidation
The consolidated financial statements include the accounts of The PBSJ Corporation and its wholly-owned subsidiaries, Post, Buckley, Schuh & Jernigan, Inc., a Florida corporation (“PBS&J”), PBS&J Construction Services, Inc., PBS&J Constructors, Inc., Post, Buckley International, Inc., Post Buckley de Mexico, S.A. de C.V., PBS&J Caribe Engineering, C.S.P., Seminole Development Corporation and Seminole Development II, Inc. (collectively, the “Company”). All material inter-company transactions and accounts have been eliminated in the accompanying consolidated financial statements. In these notes to our consolidated financial statements, the words “Company”, “we”, “our” and “us” refer to The PBSJ Corporation with its subsidiaries as the context may require.
Use of Estimates
The preparation of consolidated financial statements in conformity with accounting principles generally accepted in the United States of America requires management to make estimates and assumptions that affect the reported amounts of assets and liabilities and disclosure of contingent assets and liabilities at the date of the consolidated financial statements and the reported amounts of revenues and expenses during the reporting period. Such estimates in these consolidated financial statements include estimated cost to complete long-term fixed price contracts, allowance for doubtful accounts and unbilled fees, accruals for litigation, estimated liabilities for self-insurance, accrued reimbursement liability, valuation allowance on deferred income tax assets and tax contingencies, estimates of useful lives of intangible assets and the allocation of purchase price paid of acquired companies. Actual results could differ from those estimates.
Revenue Recognition
The Company recognizes engineering fees from different types of services under a variety of different types of contracts. In recognizing engineering fees, the Company evaluates each contractual arrangement to determine the applicable authoritative accounting methodology to apply to each contract. Net earned revenue represents engineering fees less direct reimbursable expenses.
In the course of providing its services, the Company principally has three types of contracts from which it earns revenue: cost-plus contract, time and materials contract and fixed price contract.
Cost-plus Contracts. Under Cost-plus contracts, the Company charges clients negotiated indirect rates based on direct and indirect costs in addition to a profit component. The Company generally recognizes engineering fees at the time services are performed. The amount of revenue is based on its actual labor costs incurred plus a recovery of indirect costs and a profit component. In negotiating cost-plus contracts, the Company estimates direct labor costs and indirect costs and then adds a profit component, which is a percentage of total recoverable costs, to arrive at a total dollar value for the contract. Indirect expenses are recorded as incurred and are allocated to contracts. If the actual labor costs incurred are less than estimated, the revenues from a project will be less than estimated. If the actual labor costs incurred plus a recovery of indirect costs and profit exceed the initial negotiated total contract amount, the Company must obtain a contract modification to receive payment for such overage. If a contract modification or change order is not approved by our client, the Company may be able to pursue a claim to receive payment. Engineering fees from claims are recognized when collected.
61
Time and Materials Contracts. The Company recognizes engineering fees for Time and Materials contracts at the time services are performed. The amount of revenue is based on the actual number of hours it spends on the projects, multiplied by contractual rates or multipliers. In addition, the Company’s clients reimburse it for its actual out-of-pocket costs of materials and other direct reimbursable expenses that it incurs in connection with its performance under these contracts.
Fixed Price Contracts. For Fixed Price Contracts, the Company recognizes engineering fees based on the percentage-of-completion method where fees are recognized based on the ratio of actual cost of work performed to date to the current total estimated contract costs (generally using the cost-to-cost method). In making such estimates, judgments are required to determine potential delays or changes in schedules, the costs of materials and labor, liability claims, contract disputes, or achievement of specified performance goals. At the time a loss on a contract becomes evident and estimable, the Company records the entire amount of the estimated loss.
Change orders that result from modification of an original contract are taken into consideration for revenue recognition when it results in a change of total contract value and is approved by our clients. Engineering fees relating to unapproved change orders are recognized when collected.
The Company’s federal government contracts are subject to the Federal Acquisition Regulations (“FAR”). These regulations are partially incorporated into many local and state agency contracts. The FAR limits the recovery of certain specified indirect costs on contracts subject to such regulations. In accordance with industry practice, most of the Company’s federal government contracts are subject to termination at the discretion of the client. Contracts typically provide for reimbursement of costs incurred and payment of fees earned through the termination date.
Contracts that fall under FAR and are generally cost-plus contracts are subject to audit by the government, primarily the Defense Contract Audit Agency (“DCAA”), which reviews the Company’s overhead rates, operating systems and costs proposals. As a result of its audits, the DCAA may disallow costs if it determines that the Company has accounted for such costs in a manner inconsistent with generally accepted cost accounting standards.
Direct Reimbursable Expenses
Direct reimbursable expenses are primarily comprised of subcontractor costs and other direct non-payroll reimbursable charges including travel and travel related costs, blueprints and equipment where the Company is responsible for procurement and management of such cost components on behalf of the Company’s clients. These direct reimbursable expenses are principally passed through to our clients with minimal or no mark-up.
Capital Structure
The by-laws of the Company require that common stock held by employee shareholders who terminate employment with the Company be offered for sale at fair market value to the Company, which has right of first refusal. Should the Company decline to purchase the shares, the shares must next be offered to the Company’s profit sharing and employee stock ownership plans at fair market value, and then ultimately to full-time employees of the Company. The by-laws of the Company provide that the fair market value be determined by an appraisal. Other than agreements with certain retired Directors, as of September 30, 2005 and 2004, there is no outstanding common stock held by individuals no longer employed by the Company.
At the annual meeting of the shareholders held on January 28, 2005, the shareholders approved a proposal to authorize the Company to execute an agreement with Richard A. Wickett, our former Chairman of the Board from 2002 to February 2005 and former Chief Financial Officer from 1993 to 2004, to allow him to retain his 138,607 shares of the Company’s stock, exclusive of his shares owned through the Company’s Employee Profit Sharing and Stock Ownership Plan and Trust (“ESOP”), upon retirement and offer for sale the shares, in blocks of 46,000, 46,000 and 46,607 shares in February 2005, 2006 and 2007, respectively, at a price determined at the valuation at the fiscal year end immediately preceding the redemption period.
62
Pursuant to the Company’s by-laws, the Company is permitted to repurchase stock by delivery of a promissory note to the employee. On February 23, 2006 the Company repurchased 46,000 and 3,400 shares, respectively, of the Company’s stock from Richard A. Wickett and Kathryn J. Wilson in the original principal amounts of $1.2 million and $92,000, respectively. The notes currently bear interest at the rate of 7.5% per annum and such rate is adjusted to the then current prime rate of Bank of America on December 31st of each year. Accrued interest and $1 of principal is due monthly on the notes with all remaining principal and accrued interest due and payable on the five year anniversary of the date of issuance. The notes are subject to the Company’s right of set off, which permits the Company to set off all claims it may have against the payee against amounts due and owing under the notes.
Pursuant to the terms of our credit agreement, we cannot declare or pay dividends in excess of 50% of our net income. We have not previously paid cash dividends on our common stock and have no present intention of paying cash dividends on our common stock in the foreseeable future. All earnings are retained for investment in our business.
Cash and Cash Equivalents
Cash equivalents consist of all highly liquid investments with an original maturity of three months or less from their dates of purchase. Cash equivalents consist primarily of money market accounts.
Income Taxes
The Company uses the asset and liability method in accounting for income taxes. Under this method the Company recognizes deferred tax assets and liabilities for the expected future tax consequences of temporary differences between tax bases and financial reporting carrying values of assets and liabilities based on enacted tax laws and rates applicable to the periods in which the differences are expected to affect taxable income. A valuation allowance is established when it is more likely than not that any of the deferred tax assets will not be realized.
Basic and Diluted Earnings Per Share
Basic net income per share has been computed by dividing net income by the weighted average number of common shares outstanding. Diluted net income per share reflects the potential dilution that could occur assuming the inclusion of dilutive potential common shares and has been computed by dividing net income by the weighted average number of common shares and dilutive potential common shares outstanding. Dilutive potential common shares include all outstanding restricted stock awards.
A reconciliation of the number of shares used in computing basic and diluted earnings per share follows:
| | | | | | |
| | | Years Ended September 30, |
| (Shares in thousands) | | 2005 | | 2004 | | 2003 |
Weighted average shares outstanding - Basic | | 7,208 | | 7,249 | | 7,452 |
Effect of dilutive unvested restricted stock | | 477 | | 443 | | 434 |
| | | | | | |
Weighted average shares outstanding - Diluted | | 7,685 | | 7,692 | | 7,886 |
| | | | | | |
Marketable Securities
Marketable securities consist of mutual funds that are considered available-for-sale and are recorded at fair value. Changes in unrealized gains and losses for available-for-sale securities are charged or credited as a component of accumulated other comprehensive income (loss), net of tax. A decline in the fair value of an
63
available-for-sale security below cost that is deemed other than temporary is charged to earnings. Investment security transactions are recorded on a trade date basis. The cost basis of investments sold is determined by the specific identification method.
Accounts Receivable
Accounts receivable is presented net of an allowance for doubtful accounts of $1.2 million and $1.1 million at September 30, 2005 and 2004, respectively. The Company estimates the allowance for doubtful accounts based on management’s evaluation of the contracts involved and the financial condition of its clients. The Company regularly evaluates the adequacy of the allowance for doubtful accounts by taking into consideration such factors as the type of client – governmental agencies or private sector, trends in actual and forecasted credit quality of the client, including delinquency and payment history, general economic and particular industry conditions that may affect a client’s ability to pay, and contract performance and the change order and claim analysis. Retainer amounts were not significant as of September 30, 2005 and 2004.
Unbilled Fees and Billings in Excess of Cost
Unbilled fees represent the excess of contract revenue recognized over billings to date on contracts in process. These amounts become billable according to the contract terms, which usually consider the passage of time, achievement of certain milestones or completion of the project. Management expects that substantially all unbilled amounts will be billed and collected within one year.
Billings in excess of cost represent the excess of billings to date, per the contract terms, over revenue recognized on contracts in process.
Fair Value of Financial Instruments
The fair value of the Company’s cash, accounts receivables, unbilled fees and trade accounts payable approximates book value due to the short-term maturities of these instruments. The carrying amounts of the Company’s marketable securities, cash surrender value of life insurance plans and interest rate swap are based on quoted market values or cash surrender value at the reporting date. The fair value of the Company’s debt approximates the carrying value; as such instruments are based on variable rates of interest.
Goodwill and Other Intangible Assets
Goodwill represents the excess of the purchase price over the estimated fair value of the net tangible and identifiable intangible assets of businesses acquired and accounted for under the purchase method. The Company accounts for its goodwill in accordance with Statement of Financial Accounting Standards (“SFAS”) No. 142,Goodwill and Other Intangible Assets, which requires the Company to test for goodwill impairment annually (or more frequently under certain conditions). The Company performed its annual impairment test as of September 30, 2005 and 2004 and determined that goodwill was not impaired.
We amortize the cost of other intangible assets over their estimated useful lives unless such lives are deemed indefinite. Amortizable intangible assets are reviewed for impairment whenever events or changes in business circumstances indicate the carrying value of the assets may not be recoverable. If assets are determined to be impaired, they are written down to the estimated fair value as required. No impairment was recorded during the years ended September 30, 2005, 2004, or 2003.
Stock Based Compensation and Stock Sales to Employees
Unvested restricted stock awarded to certain employees is measured at the estimated fair value of the stock at the grant date. The restricted stock award is recorded as compensation expense in general and administrative expenses, and reported as a separate line item in stockholders’ equity. The issuance of unvested restricted stock gives rise to unearned compensation that is amortized on a straight-line basis over the vesting period.
64
Eligible employees are allowed to purchase Company stock once a year, during a specified timeframe. With the exception of those considered to be insiders, as defined, employees who receive bonuses each year are allowed to use their bonus payments received in December following the Company’s fiscal year end to make their final payment for their stock purchase. The Company has a receivable from certain of its employees in the amount of approximately $3.9 million and $3.9 million at September 30, 2005 and 2004 respectively, for their stock purchase. Such amounts were paid in the subsequent quarter to the respective fiscal year ends.
Property and Equipment
Property and equipment are stated at cost less accumulated depreciation. Certain equipment held under capital leases are classified as furniture and equipment and the related obligations are recorded as liabilities. Major renewals and improvements are capitalized, while repairs and maintenance are expensed as incurred. Depreciation is computed using the straight-line method over the estimated useful lives of the related assets. Capital leases are amortized under the straight-line method over the lesser of the estimated useful life of the asset or the duration of the lease agreement. Capital lease amortization is included in depreciation.
Leasehold improvements are amortized over the shorter of the terms of the leases or their estimated useful lives. Cost and accumulated depreciation of property and equipment retired or sold are eliminated from the accounts at the time of retirement or sale and the resulting gain or loss is recorded in income.
Long-Lived Assets
In accordance with SFAS No. 144, long-lived assets are reviewed for impairment whenever events or changes in circumstances indicate that the carrying amount of an asset may not be recoverable. Long-lived assets are reviewed whenever events or changes in business circumstances indicate the carrying value of the assets may not be recoverable. If assets are determined to be impaired, they are written down to estimated fair value as required. No impairment was recorded during the years ended September 30, 2005, 2004, or 2003.
Concentrations of Credit Risk
Financial instruments, which potentially subject the Company to concentrations of credit risk, consist principally of cash, accounts receivable and unbilled fees. The Company deposits its cash with high credit quality financial institutions. At times, such deposits may be in excess of the Federal Deposit Insurance Corporation insurance limits.
Work performed for governmental entities accounted for approximately 77%, 79% and 79% of engineering fees for the years ended September 30, 2005, 2004 and 2003. Accounts receivable and unbilled fees from governmental entities were $48.2 million and $38.1 million, respectively, at September 30, 2005, and $47.0 million and $46.5 million, respectively, at September 30, 2004. For the years ended September 30, 2005, 2004 and 2003, engineering fees of $101.3 million, $79.4 million, and $70.0 million, respectively, were derived from various districts of the Florida Department of Transportation (“FDOT”) under numerous contracts. These revenues are primarily in the transportation segment. While the loss of any individual contract would not have a material adverse effect on the Company’s results of operations and would not adversely impact the Company’s ability to continue work under other contracts with the FDOT, the loss of all the FDOT contracts could have a material adverse effect on the Company’s results of operations.
Ongoing credit evaluations of customers are performed and generally no collateral is required. The Company provides an allowance for doubtful accounts based upon factors surrounding the credit risk of specific customers, historical trends and other information.
65
Derivative Instruments and Hedging Activities
In March 2001, the Company entered into an interest rate swap to convert the floating interest rate on the mortgage note payable to a fixed rate. The interest rate swap converts the floating interest rate on the note payable to a fixed rate of 6.28%. The Company accounts for the interest rate swap as a cash flow hedge in accordance with SFAS No. 133, “Accounting for Derivative Financial Instruments and Hedging Activities”. The underlying terms of the interest rate swap, including the notional amount, interest rate index, duration and reset dates, are identical to those of the associated debt and therefore the hedging relationship results in no ineffectiveness. Changes in fair value are included as a component of other comprehensive loss in stockholders’ equity in our consolidated balance sheets. The net amounts paid or received are included in interest expense. On March 16, 2006, the Company’s swap expired.
Estimated Liability for Self-Insurance
The Company is self-insured up to certain limits for costs associated with general liability, workers’ compensation and employee health coverage. The Company also maintains a stop loss insurance policy with a third party insurer to limit the Company’s exposure to individual and aggregate claims made. Insurance claims and reserves include accruals of estimated settlements for known claims, as well as accruals of estimates of incurred but not reported claims, net of payments made. At September 30, 2005 and 2004, we had total self-insurance accruals reflected in accounts payable and accrued expenses in our consolidated balance sheets of $7.7 million and $7.4 million, respectively. These estimates are subject to variability due to changes in trends of losses for outstanding claims and incurred but not recorded claims, including external factors such as future inflation rates, benefit level changes and claim settlement patterns.
Comprehensive Income
Comprehensive income consists of net income and other gains and losses affecting shareholders’ investment and minimum pension liability that, under generally accepted accounting principles, are excluded from net income.
The components of other comprehensive income are as follows for the years ended September 30, 2005, 2004 and 2003:
| | | | | | | | | | | | | | | |
| | | Years Ended September 30, | | Accumulated Other Comprehensive Loss | |
| (Dollars in thousands) | | 2005 | | | 2004 | | | 2003 | |
Net income | | $ | 21,075 | | | $ | 14,690 | | | $ | 12,721 | | | | |
Other comprehensive income: | | | | | | | | | | | | | | | |
Unrealized gain on available for sale marketable securities, net of tax | | | 38 | | | | 62 | | | | 114 | | $ | 228 | |
Unrealized gain on interest rate swap, net of tax | | | 226 | | | | 233 | | | | 69 | | | (35 | ) |
Minimum pension liability adjustment, net of tax | | | (168 | ) | | | (1,125 | ) | | | 143 | | | (2,150 | ) |
| | | | | | | | | | | | | | | |
Total comprehensive income | | $ | 21,171 | | | $ | 13,860 | | | $ | 13,047 | | $ | (1,957 | ) |
| | | | | | | | | | | | | | | |
Recent Accounting Pronouncements
In September 2006, the Financial Accounting Standards Board (“FASB”) issued FASB Statement No. 158 (“SFAS 158”), “Employers’ Accounting for Defined Benefit Pension and Other Postretirement Plans”. This Statement requires an employer to recognize the overfunded or underfunded status of a defined benefit postretirement plan (other than a multiemployer plan) as an asset or liability in its statement of financial position and to recognize changes in that funded status in the year in which the changes occur through comprehensive income. The Company is required to adopt the provisions of SFAS 158 for the fiscal year ending September 30, 2007. The Company is still evaluating the impact of this statement on its consolidated financial statements.
66
In September 2006, the FASB issued FASB Statement No. 157 (“SFAS 157”), “Fair Value Measurements”. SFAS 157 prescribes a single definition of fair value as the price that would be received to sell an asset or paid to transfer a liability in an orderly transaction between market participants at the measurement date. The accounting provisions of SFAS 157 will be effective for the Company beginning July 1, 2008. The Company does not believe the adoption of SFAS 157 will have a material impact on its financial condition or results of operations.
In September 2006, the SEC issued Staff Accounting Bulletin No. 108 (“SAB 108”). SAB 108 addresses how the effects of prior year uncorrected misstatements should be considered when quantifying misstatements in current year financial statements. SAB 108 requires companies to quantify misstatements using a balance sheet and income statement approach and to evaluate whether either approach results in quantifying an error that is material in light of relevant quantitative and qualitative factors. When the effect of initial adoption is material, companies will record the effect as a cumulative effect adjustment to beginning of year retained earnings. SAB 108 will be effective for the Company beginning July 1, 2007. The Company does not believe the adoption of SAB 108 will have a material impact on its financial condition or results of operations.
In July 2006, the FASB issued Interpretation (“FIN”) No. 48 “Accounting for Uncertainty in Income Taxes – an interpretation of FASB No. 109” (“FIN 48”). This interpretation establishes guidelines and thresholds that must be met for the recognition and measurement of a tax position taken or expected to be taken in a tax return. The provisions of FIN 48 are effective for fiscal years beginning after December 31, 2006. The Company is currently evaluating the impact of adopting FIN 48 on its consolidated financial statements.
In November 2005, the FASB issued FASB Staff Position (“FSP”) FAS 115-1 and FAS 124-1, “The Meaning of Other-Than-Temporary Impairment and Its Application to Certain Investments,” (“ FSP 115-1 and 124-1”) which address the determination as to when an investment is impaired, whether that impairment is other than temporary, and the measurement of an impairment loss. FSP 115-1 and 124-1 also includes accounting considerations subsequent to the recognition of an other-than-temporary impairment and requires certain disclosures about unrealized losses that have not been recognized as other-than-temporary impairments. The guidance in FSP 115-1 and 124-1 amends FASB Statement No. 115,“Accounting for Certain Investments in Debt and Equity Securities,” and Accounting Principles Board (“APB”) Opinion No. 18, “The Equity Method of Accounting for Investments in Common Stock.” FSP 115-1 and 124-1 is effective for reporting periods beginning after December 15, 2005. We have evaluated the impact of the adoption of FSP 115-1 and 124-1 and we do not believe adoption will have a significant impact on our consolidated financial statements.
In May 2005, the FASB issued Statement of Financial Accounting Standards (“SFAS”) No. 154,“Accounting Changes and Error Corrections” (“SFAS 154”), which replaces APB Opinion No. 20“Accounting Changes” and SFAS No. 3 “Reporting Accounting Changes in Interim Financial Statements.” SFAS 154 requires that a voluntary change in accounting principle be applied retrospectively with all prior period financial statements presented on the new accounting principle. SFAS 154 also requires that a change in method of depreciating or amortizing a long-lived non-financial asset be accounted for prospectively as a change in estimate, and correction of errors in previously issued financial statements should be termed a restatement. SFAS 154 is effective for accounting changes and correction of errors made in the first annual reporting period beginning after December 15, 2005. We early adopted SFAS 154 and have reported and disclosed the correction of errors in our previously reported consolidated financial statements in accordance with SFAS 154. The other reporting and disclosure requirements of SFAS 154 did not have a material impact on our consolidated financial statements.
In March 2005, the FASB issued FIN No. 47, “Accounting for Conditional Asset Retirement Obligations, an interpretation of SFAS No. 143” (“FIN 47”). FIN 47 requires conditional asset retirement obligations to be recognized if a legal obligation exists to perform asset retirement activities and a reasonable estimate of the fair value of the obligation can be made. FIN 47 clarifies that the term “conditional asset retirement obligation” as used in SFAS No. 143, “Accounting for Conditional Asset Retirement Obligations,” refers to a legal obligation to perform an asset retirement activity in which the timing and/or method of settlement are conditional on a future event that may or may not be within the control of the entity. The Company adopted the provisions of FIN 47 during the year ended September 30, 2005. No conditional asset retirement obligations were recognized and, accordingly, the adoption of FIN 47 had no effect on the Company’s consolidated financial statements.
67
In December 2004, the FASB issued SFAS No. 123 (revised 2004),“Share-Based Payment” (“SFAS No. 123(R)”), which is a revision of FASB Statement No. 123,“Accounting for Stock-Based Compensation.” Statement 123(R) supersedes APB Opinion No. 25, Accounting for Stock Issued to Employees. SFAS No. 123(R) requires all share-based payments to employees, including grants of employee stock options, to be recognized in the financial statements based on their fair values, beginning with the first annual period beginning after December 2005, with early adoption encouraged. We are required to adopt SFAS No. 123(R) in our first quarter of fiscal 2007, beginning October 1, 2006. The adoption of SFAS No. 123(R) is not expected to have a material impact on our results of operations, financial condition or cash flows.
In December 2004, the FASB issued SFAS No. 153,“Exchanges of Non Monetary Assets, an amendment to Opinion No. 29, Accounting for Non Monetary Transactions.” The amendment to Opinion No. 29 eliminates the fair value exception for non monetary exchanges of similar productive assets and replaces it with a general exception for exchanges of non monetary assets that do not have commercial substance. Such an exchange has commercial substance if the future cash flows of the entity are expected to change significantly as a result of the exchange. SFAS No. 153 is effective for non monetary asset exchanges occurring in periods beginning after June 15, 2005. We adopted this new accounting standard effective September 30, 2005. The adoption of SFAS No. 153 did not have a material impact on our consolidated financial statements.
In December 2004, the FASB issued FSP FAS 109-1 (“FSP 109”), “Application of FASB Statement No. 109, (“SFAS 109”), Accounting for Income Taxes, to the Tax Deduction on Qualified Production Activities Provided by the American Jobs Creation Act of 2004.” FSP 109 clarifies guidance that applies to the new deduction for qualified domestic production activities. When fully phased-in, the deduction will be up to 9% of the lesser of “qualified production activities income” or taxable income. FSP 109 clarifies that the deduction should be accounted for as a special deduction under SFAS 109 and will reduce tax expense in the period or periods that the amounts are deductible on the tax return. FSP 109 is effective for us beginning fiscal 2005. The adoption of FSP 109 did not have a material impact on our financial results.
In December 2003, the FASB issued Interpretation No. 46 (revised December 2003), “Consolidation of Variable Interest Entities”(“FIN 46R”), which replaced FIN 46. FIN 46R addresses how a business enterprise should evaluate whether it has a controlling interest in an entity through means other than voting rights. This interpretation requires a variable interest entity to be consolidated by a company if that company is subject to a majority of the risk of loss from the variable interest entity’s activities or is entitled to receive a majority of the entity’s residual returns or both. The interpretation also requires disclosures about variable interest entities that the company is not required to consolidate but in which it has a significant variable interest. We are required to adopt FIN 46R immediately for entities created after December 31, 2003 and at the beginning of fiscal 2007 for all other entities. Although we have not completed our final evaluation of FIN 46R, the adoption is not expected to have a material impact on our results of operations, financial condition or cash flows.
2.Restatement
Misappropriations of Funds
In March 2005, subsequent to the issuance of the Company’s 2004 financial statements, we discovered misappropriations of Company funds by our former Chief Financial Officer and two former employees who worked in our information systems and treasury departments, collectively, (“the participants”). The participants colluded and circumvented controls to misappropriate funds and conceal the misappropriations possibly beginning as early as 1993 until the misappropriations were discovered.
Shortly after this discovery, an investigation sub-committee was formed comprised of the three outside members of our Corporate Audit Committee. These three outside members were subsequently appointed to the Board of Directors and became the three members of the Audit Committee of the Board of Directors. The Audit
68
Committee retained independent counsel to conduct an investigation and advise the Audit Committee in connection with the investigation. The independent counsel retained forensic accountants, including accountants experienced in conducting forensic audits for companies that perform contracts for federal, state and local governments to assist with the investigation.
The investigation team discovered that at least $36.6 million was misappropriated between January 1, 1998 and the discovery of the misappropriations in March 2005. The amount misappropriated prior to January 1, 1998 could not be determined because certain data for the period prior to January 1, 1998 was unavailable. The participants in the embezzlement scheme used several methods to misappropriate the funds while engaging in conduct to conceal the misappropriated amounts. This conduct included among other things, recording and changing normal recurring journal entries and overstating accruals in prior periods to facilitate improper write-offs of misappropriated funds.
The methods that the three participants in the embezzlement scheme used to conceal their activities resulted in the overstatement or understatement of amounts previously reported in our consolidated financial statements. The following table illustrates the impact of recording the misappropriations and reversing the concealment entries and recording the actual impact such entries had on costs and expenses:
| | | | | | | | |
| (Dollars in thousands) | | Years Ended September 30, | |
| | | 2004 | | | 2003 | |
| | | Increase / (Decrease) | |
Costs and expenses: | | | | | | | | |
Direct salaries and direct costs | | $ | 150 | | | $ | — | |
General and administrative expenses, including indirect salaries | | | (6,367 | ) | | | (5,133 | ) |
Misappropriation loss | | | 4,854 | | | | 5,075 | |
| | | | | | | | |
Total costs and expenses | | $ | (1,363 | ) | | $ | (58 | ) |
| | | | | | | | |
The misappropriation loss and concealment also resulted in the overstatement of overhead rates which the Company used in connection with certain government contracts. As a result, in these instances, some of our billings to our government clients relied on or incorporated the overstated overhead rates, and as a result revenues were overstated and we incurred refund obligations to these clients. We have also recorded an accrual for the estimated reimbursement to our clients.
Overstatement of Amounts Billed for Overhead
The Company determined that the misappropriation scheme led to the overstatement of overhead rates that the Company used to determine billings in connection with certain of our government contracts. As a result, some of our government clients were overcharged for the Company’s services. During the review of the overhead expenses, the Company identified certain instances of costs erroneously included in our overhead cost pool which were unallowable under applicable regulations and an error in our calculation of our overhead rate, which related to certain general and administrative costs. The Company determined that the unallowable costs and general and administrative expense errors also led to the overstatement of overhead rates which the Company used in connection with certain of its government contracts. As a result, in these instances, some of our billings to our government clients relied on or incorporated the overstated overhead rates.
The Company determined corrected overhead rates considering the impact of the misappropriations and considering the impact of additional errors identified. The Company and its advisors have been working with its government clients to finalize the refund amount (See Note 13 for further discussion). The Company estimates that the total refund amount resulting from the overstated overhead rates is approximately $37.1 million as of fiscal 2005 ($26.1 million as of fiscal 2004), including interest that the Company will generally be required to reimburse its government clients. The Company has recorded a related reduction in revenue, an increase in interest expense and a corresponding liability in each relevant year in its restated financial statements. The impact on the Company’s financial statements from such over-billings is presented below.
69
The components of the accrued reimbursement liability related to the overstated overhead rates and interest as of September 30, 2004 is as follows:
| | | |
Beginning retained earnings adjustment as of October 1, 2002 related to the overstated overhead rates and the related accrued interest excluding the effect of income taxes: | | $ | 10,860 |
Year ended September 30, 2003 | | | 5,802 |
Year ended September 30, 2004 | | | 8,453 |
| | | |
Total | | $ | 25,115 |
| | | |
As of September 30, 2004 there was approximately $1.1 million and $869,000 of over billing recorded as a reduction of accounts receivable and unbilled fees, respectively, in our consolidated balance sheet as such amounts had not yet been collected from our clients. Prior to the restatement adjustment, the Company had accrued approximately $949,000 and $863,000 for a client reimbursement now included in our accrued reimbursement liability at September 30, 2004 and 2003, respectively.
The adjustments related to our consolidated statements of operations are as follows:
| | | | | | |
| (Dollars in thousands) | | Years Ended September 30, |
| | | 2004 | | 2003 |
Reduced revenues | | $ | 7,678 | | $ | 5,290 |
Interest | | | 775 | | | 512 |
| | | | | | |
Total | | $ | 8,453 | | $ | 5,802 |
| | | | | | |
We have restated our previously issued consolidated financial statements as of September 30, 2004 and for the years ended September 30, 2004 and 2003, primarily to reflect adjustments relating to the effects of the misappropriations and related concealment accounting and the correction of revenue amounts charged to certain of our government clients due to errors in our overhead rates, in addition to certain other adjustments.
Other Restatement Items
In connection with recording the misappropriations and concealment adjustments related to our overhead rate correction described above, the Company also identified and corrected the following other errors in its previously issued financial statements.
Unrecorded Revenue
The Company determined that it had incorrectly deferred revenue on a project and did not properly record revenue on another project in fiscal 2004. The impact of correcting this error was to increase engineering fees by $2.8 million in fiscal 2004 and increase unbilled fees by $2.8 million as of September 30, 2004.
Accounting for Defined Benefit Pension Plans
The Company also determined that its previous accounting for its post-employment benefit plans was not in accordance with SFAS No. 87, “Employers Accounting for Pensions” (“SFAS 87”). Historically, we have accounted for our deferred compensation plans by only accruing the present value of future minimum retirement payment obligations. SFAS 87 requires that amounts recognized in the financial statements be determined on an actuarial basis. In order to determine the impact of such error, the Company engaged an actuarial firm to perform a comprehensive review of our benefit plans. Accordingly, we have restated our previously issued consolidated financial statements to adjust our accumulated benefit obligation, and to defer recognition of prior service costs over the estimated remaining service period. The effect of this change was to decrease general and administrative
70
expenses by $809,000 in fiscal 2004 and an increase of $370,000 in fiscal 2003. The Company has also recorded a cumulative increase to deferred compensation liability in our consolidated balance sheet of $2.4 million as of September 30, 2004, related to the recognition of previously deferred prior service costs. The Company recorded a cumulative increase to intangible assets of $647,000 (inclusive of a $325,000 decrease recorded during fiscal 2004), and a cumulative increase to accumulated other comprehensive loss of $1.9 million (inclusive of a $1.0 million increase recorded in fiscal 2004) as of September 30, 2004, respectively, related to the recognition of previously deferred prior service costs.
Accrued Wages
The Company recorded an additional $362,000 ($1.5 million related to fiscal 2004 offset by $1.1 million carryover effect of the same error related to fiscal 2003) and $353,000 in general and administrative expenses in fiscal 2004 and 2003, respectively, in connection with previously unrecorded part-time and over-time wages earned by our employees that were paid in the subsequent fiscal year. These adjustments to our consolidated statement of operations represent the net effect of the unrecorded accrual for salaries as of the end of respective years. The Company recorded an additional $1.5 million accrual (recorded in accounts payable and accrued expenses) to correct its consolidated balance sheet at September 30, 2004.
Additionally, the Company recorded an increase in direct salaries and direct costs of $736,000 during fiscal 2004 and a corresponding increase to accounts payable and accrued expenses of $736,000, in connection with labor associated with previously unrecorded revenue at September 30, 2004 (SeeUnrecorded Revenueadjustment explanation above).
Accounting for Leases
The Company determined that the rent expense recorded in connection with certain of its operating leases with scheduled rent increases was not in accordance with SFAS No. 13“Accounting for Leases” and FASB Technical Bulletin (“EITF”) No. 85-3“Accounting for Operating Leases with Scheduled Rent Increases”. The Company should have recognized rent expense by applying a straight-line method on operating leases with fixed-rate rent escalation clauses. This method requires the lessee under a lease agreement to record as expense an amount equal to the total rental payments paid over the term of the lease (including lease renewals that are “reasonably assured”) on a straight-line basis. The impact of this change was to increase rent expense, included in general and administrative expenses, by $232,000 and $326,000 for the years ended September 30, 2004 and 2003 respectively, and a corresponding increase in deferred rent, which is included in accounts payable and accrued expenses, of $755,000 as of September 30, 2004.
The Company also determined that certain leases previously classified as operating leases should have been accounted for as capital leases. As a result, we have recorded cumulative capitalized lease equipment and related capital lease obligations of $990,000 (with $320,000 of related accumulated amortization) as of September 30, 2004, and $368,000 of capitalized lease equipment and related capital lease obligations during fiscal 2004. Our consolidated statements of operations reflect an adjustment to decrease lease expense in general and administrative expenses of $209,000 and $104,000 for the fiscal years ended September 30, 2004 and 2003. Additionally, a corresponding adjustment was recorded to increase depreciation and amortization in general and administrative expenses by $195,000 and $96,000 and interest expense of $20,000 and $12,000 for the fiscal years ended September 30, 2004 and 2003, respectively.
Accounting for Employee Expense Reports
The Company recorded an additional $513,000 ($1.2 million related to fiscal 2004 offset by $681,000 carryover effect of the same error related to fiscal 2003) and $115,000 in general and administrative expenses in fiscal 2004 and 2003, respectively, in connection with previously unrecorded business expenses incurred by our employees that were reimbursed to our employees in the subsequent fiscal year. These adjustments to our consolidated statement of operations represent the net effect of the unrecorded business expenses as of the end of respective years. Such amounts are not reimbursed to us by our clients. The Company recorded an additional $1.2 million accrual (recorded in accounts payable and accrued expenses) to correct its consolidated balance sheet at September 30, 2004.
71
Costs in Excess of Revenue
The Company has recorded an adjustment to accrue for losses on contracts in progress, which were expected to be completed with costs in excess of revenue. The impact of these adjustments is included in direct salaries and direct costs resulting in an increase of $50,000 and $462,000 in fiscal 2004 and 2003. The total amount of the previously unrecorded accrual, which has been included in the Company’s balance sheet as of September 30, 2004 is $1.7 million.
Other Miscellaneous Adjustments
In addition, the Company has recorded additional restatement adjustments to correct various other immaterial errors, including known errors which had not previously been corrected because the effect of the errors was not material to the financial statements.
Classification Corrections Not Impacting Net Income
Goodwill and Intangible Assets
The Company had incorrectly included its intangible asset balance in other assets in its consolidated balance sheets as of September 30, 2004. The Company recorded a decrease in other assets and a corresponding increase to intangible assets of $2.3 million as of September 30, 2004 to correct this misclassification.
Billing In Excess of Costs
The Company recorded an entry to properly classify credit balances previously recorded in unbilled fees in our consolidated balance sheets as billings in excess of costs. This resulted in an additional increase to unbilled fees and billings in excess of costs of $1.2 million as of September 30, 2004.
Accounting for Direct Reimbursable Expenses
The Company also identified certain accounting errors related to direct reimbursable expenses not being recorded in the period services were performed. The Company identified a number of sub-contractor invoices received subsequent to year-end for services performed in the prior period. The adjustment to record these transactions does not affect net income, as direct reimbursable expenses are billed directly to our clients on a dollar for dollar basis, with minimal or no mark-up. The resulting net effect (after the carry over effect of the same error related to the prior fiscal year) of this adjustment was to increase engineering fees and direct reimbursable expenses by $1.5 million and $163,000 for the years ended 2004 and 2003, respectively. These adjustments related to the classifications within the consolidated statement of operations represent the annual effect of the unrecorded accrual for sub-contractor invoices and related unbilled engineering fees as of the end of the respective years. The total amount of the previously unrecorded accruals which has been corrected in the Company’s consolidated balance sheet at September 30, 2004 is an additional accrual and increase in unbilled fees for sub-consultants expense of $8.4 million.
Accounting for Direct Salaries and Direct Costs
The Company recorded an entry to properly classify $749,000 previously recorded in general and administrative expenses in fiscal 2004 and $1.5 million and $873,000 previously recorded in direct reimbursable expenses in fiscal 2004 and 2003, respectively, in our consolidated statements of operations as direct salaries and direct costs. This resulted in an additional increase to direct salaries and direct costs of $2.2 million and $873,000 in fiscal 2004 and 2003, respectively.
72
Accounting for Shareholder Subscription Receivable
The Company recorded an entry to properly classify shareholder stock receivable balances previously recorded as a reduction of accounts payable and accrued expenses in our consolidated balance sheets as shareholder subscription receivable. This resulted in an additional increase accounts payable and accrued expenses and shareholder subscription receivable of $3.9 million as of September 30, 2004.
The following table reconciles as previously reported to as restated retained earnings and accumulated other comprehensive loss:
| | | | | | | | |
| (Dollars in thousands) | | Retained Earnings | | | Accumulated Other Comprehensive
Loss | |
Balance at October 1, 2002 (as previously reported) | | $ | 60,981 | | | $ | (501 | ) |
Effect of misappropriation and correction of related concealment entries | | | (4,836 | ) | | | — | |
Effect of overstatement of amounts billed for overhead | | | (10,860 | ) | | | — | |
Other restatement items: | | | | | | | | |
Effect of accounting for defined benefit plans | | | 1,580 | | | | (1,690 | ) |
Effect of previously unaccrued wages | | | (737 | ) | | | | |
Effect of accounting for leases | | | (198 | ) | | | — | |
Effect of costs in excess of revenue | | | (1,157 | ) | | | — | |
Effect of other miscellaneous adjustments | | | (195 | ) | | | — | |
Effect of restatement adjustments on tax accrual | | | 2,551 | | | | 642 | |
| | | | | | | | |
Total effect of restatement on previously reported financial statements | | | (13,852 | ) | | | (1,048 | ) |
| | |
Balance at October 1, 2002 (Restated) | | $ | 47,129 | | | $ | (1,549 | ) |
| | | | | | | | |
73
The following tables summarize the effect of the restatement on the previously reported consolidated financial statements line items presented in our consolidated financial statements included in this Annual Report on Form 10-K as of September 30, 2004 and for the years ended September 30, 2004 and 2003 respectively:
Consolidated Balance Sheet
| | | | | | | | | | | | |
| | | September 30, 2004 | |
| (Dollars in thousands) | | As Previously
Reported | | | Restatement
Adjustments | | | As Restated | |
Current Assets: | | | | | | | | | | | | |
Cash and cash equivalents | | $ | 2,796 | | | $ | (886 | ) | | $ | 1,910 | |
Marketable securities at fair value | | | 573 | | | | — | | | | 573 | |
Accounts receivable, net | | | 64,533 | | | | (4,088 | ) | | | 60,445 | |
Unbilled fees | | | 53,249 | | | | 13,926 | | | | 67,175 | |
Shareholder subscription receivable | | | — | | | | 3,929 | | | | 3,929 | |
Other current assets | | | 2,515 | | | | (349 | ) | | | 2,166 | |
| | | | | | | | | | | | |
Total current assets | | | 123,666 | | | | 12,532 | | | | 136,198 | |
Property and equipment, net | | | 33,202 | | | | 711 | | | | 33,913 | |
Cash surrender value of life insurance | | | 8,372 | | | | (144 | ) | | | 8,228 | |
Deferred income taxes | | | 799 | | | | 6,998 | | | | 7,797 | |
Goodwill | | | 14,878 | | | | (488 | ) | | | 14,390 | |
Intangible assets | | | — | | | | 3,268 | | | | 3,268 | |
Other assets | | | 2,920 | | | | (2,349 | ) | | | 571 | |
| | | | | | | | | | | | |
Total assets | | $ | 183,837 | | | $ | 20,528 | | | $ | 204,365 | |
| | | | | | | | | | | | |
Liabilities and Stockholders’ Equity | | | | | | | | | | | | |
Current Liabilities: | | | | | | | | | | | | |
Accounts payable and accrued expenses | | $ | 40,338 | | | $ | 25,433 | | | $ | 65,771 | |
Accrued reimbursement liability | | | — | | | | 24,119 | | | | 24,119 | |
Current portion of long-term debt | | | 290 | | | | — | | | | 290 | |
Current portion of capital leases | | | — | | | | 240 | | | | 240 | |
Accrued vacation | | | 8,614 | | | | — | | | | 8,614 | |
Billings in excess of costs | | | 2,215 | | | | 1,173 | | | | 3,388 | |
Deferred income taxes | | | 22,935 | | | | (9,452 | ) | | | 13,483 | |
| | | | | | | | | | | | |
Total current liabilities | | | 74,392 | | | | 41,513 | | | | 115,905 | |
Long-term debt, less current portion | | | 7,828 | | | | — | | | | 7,828 | |
Capital leases, less current portion | | | — | | | | 444 | | | | 444 | |
Deferred compensation | | | 8,296 | | | | 2,387 | | | | 10,683 | |
Other liabilities | | | 6,546 | | | | 256 | | | | 6,802 | |
| | | | | | | | | | | | |
Total liabilities | | | 97,062 | | | | 44,600 | | | | 141,662 | |
Stockholders’ Equity: | | | | | | | | | | | | |
Common stock | | | 5 | | | | — | | | | 5 | |
Retained earnings | | | 88,950 | | | | (21,884 | ) | | | 67,066 | |
Accumulated other comprehensive loss | | | (19 | ) | | | (2,034 | ) | | | (2,053 | ) |
Unearned compensation and other | | | (2,161 | ) | | | (154 | ) | | | (2,315 | ) |
| | | | | | | | | | | | |
Total stockholders’ equity | | | 86,775 | | | | (24,072 | ) | | | 62,703 | |
| | | | | | | | | | | | |
Total liabilities and stockholders’ equity | | $ | 183,837 | | | $ | 20,528 | | | $ | 204,365 | |
| | | | | | | | | | | | |
74
Consolidated Statements of Operations
| | | | | | | | | | | | |
| | | Year Ended September 30, 2004 | |
| (Dollars in thousands, except per share amounts) | | As Previously
Reported | | | Restatement
Adjustments | | | As Restated | |
Earned revenues: | | | | | | | | | | | | |
Engineering Fees | | $ | 451,153 | | | $ | (2,906 | ) | | $ | 448,247 | |
Direct reimbursable expenses | | | 96,227 | | | | 145 | | | | 96,372 | |
| | | | | | | | | | | | |
Net earned revenues | | | 354,926 | | | | (3,051 | ) | | | 351,875 | |
| | | | | | | | | | | | |
Costs and expenses: | | | | | | | | | | | | |
Direct salaries and direct costs | | | 128,641 | | | | 2,880 | | | | 131,521 | |
General and administrative expenses, including indirect expense | | | 193,150 | | | | (7,082 | ) | | | 186,068 | |
Misappropriation loss (recoveries), net | | | — | | | | 4,854 | | | | 4,854 | |
| | | | | | | | | | | | |
Total costs and expenses | | | 321,791 | | | | 652 | | | | 322,443 | |
| | | | | | | | | | | | |
Operating income | | | 33,135 | | | | (3,703 | ) | | | 29,432 | |
Other income (expenses): | | | | | | | | | | | | |
Interest expense | | | (830 | ) | | | (795 | ) | | | (1,625 | ) |
Other, net | | | 1,055 | | | | (438 | ) | | | 617 | |
| | | | | | | | | | | | |
Total other income (expenses): | | | 225 | | | | (1,233 | ) | | | (1,008 | ) |
| | | | | | | | | | | | |
Income before income taxes | | | 33,360 | | | | (4,936 | ) | | | 28,424 | |
Provision for income taxes | | | 15,107 | | | | (1,373 | ) | | | 13,734 | |
| | | | | | | | | | | | |
Net income | | $ | 18,253 | | | $ | (3,563 | ) | | $ | 14,690 | |
| | | | | | | | | | | | |
Basic and diluted net income per share: | | | | | | | | | | | | |
Basic | | $ | 2.52 | | | $ | (0.49 | ) | | $ | 2.03 | |
| | | | | | | | | | | | |
Diluted | | $ | 2.37 | | | $ | (0.46 | ) | | $ | 1.91 | |
| | | | | | | | | | | | |
75
| | | | | | | | | | | | |
| | | Year Ended September 30, 2003 | |
| (Dollars in thousands, except per share amounts) | | As Previously
Reported | | | Restatement
Adjustments | | | As Restated | |
Earned revenues: | | | | | | | | | | | | |
Engineering Fees | | $ | 389,156 | | | $ | (5,447 | ) | | $ | 383,709 | |
Direct reimbursable expenses | | | 82,677 | | | | (984 | ) | | | 81,693 | |
| | | | | | | | | | | | |
Net earned revenues | | | 306,479 | | | | (4,463 | ) | | | 302,016 | |
| | | | | | | | | | | | |
Costs and expenses: | | | | | | | | | | | | |
Direct salaries and direct costs | | | 110,657 | | | | 1,334 | | | | 111,991 | |
General and administrative expenses, including indirect expense | | | 169,582 | | | | (3,821 | ) | | | 165,761 | |
Misappropriation loss | | | — | | | | 5,075 | | | | 5,075 | |
| | | | | | | | | | | | |
Total Costs and expenses | | | 280,239 | | | | 2,588 | | | | 282,827 | |
| | | | | | | | | | | | |
Operating income | | | 26,240 | | | | (7,051 | ) | | | 19,189 | |
Other income (expenses): | | | | | | | | | | | | |
Interest expense | | | (993 | ) | | | (525 | ) | | | (1,518 | ) |
Other, net | | | 1,561 | | | | — | | | | 1,561 | |
| | | | | | | | | | | | |
Total other income (expenses): | | | 568 | | | | (525 | ) | | | 43 | |
| | | | | | | | | | | | |
Income before income taxes | | | 26,808 | | | | (7,576 | ) | | | 19,232 | |
Provision for income taxes | | | 9,617 | | | | (3,106 | ) | | | 6,511 | |
| | | | | | | | | | | | |
Net income | | $ | 17,191 | | | $ | (4,470 | ) | | $ | 12,721 | |
| | | | | | | | | | | | |
Basic and diluted net income per share: | | | | | | | | | | | | |
Basic | | $ | 2.31 | | | $ | (0.60 | ) | | $ | 1.71 | |
| | | | | | | | | | | | |
Diluted | | $ | 2.18 | | | $ | (0.57 | ) | | $ | 1.61 | |
| | | | | | | | | | | | |
76
Consolidated Statements of Cash Flows
| | | | | | | | | | | | |
| | | Year Ended September 30, 2004 | |
| (Dollars in thousands) | | As Previously
Reported | | | Restatement
Adjustments | | | As Restated | |
Cash flows from operating activities: | | | | | | | | | | | | |
Net income | | $ | 18,253 | | | $ | (3,563 | ) | | $ | 14,690 | |
Adjustments to reconcile net income to net cash provided by operating activities: | | | | | | | | | | | | |
Increase in cash surrender value of life insurance | | | (525 | ) | | | 305 | | | | (220 | ) |
Depreciation and amortization | | | 8,691 | | | | 570 | | | | 9,261 | |
Gain on sale of property | | | (85 | ) | | | — | | | | (85 | ) |
Provision for bad debt and unbillable amounts | | | 125 | | | | 92 | | | | 217 | |
Provision for deferred income taxes | | | 9,959 | | | | (2,779 | ) | | | 7,180 | |
Provision for and amortization of deferred compensation | | | 2,282 | | | | (1,284 | ) | | | 998 | |
Change in operating assets and liabilities, net of acquisitions: | | | | | | | | | | | | |
Increase in accounts receivable | | | (10,230 | ) | | | 2,429 | | | | (7,801 | ) |
Increase in unbilled fees and billings in excess of cost | | | (10,714 | ) | | | (4,514 | ) | | | (15,228 | ) |
Decrease in other current assets | | | 1,867 | | | | 603 | | | | 2,470 | |
Decrease (increase) in other assets | | | 121 | | | | (39 | ) | | | 82 | |
Increase in accounts payable and accrued expenses | | | 6,938 | | | | 3,238 | | | | 10,176 | |
Increase in accrued reimbursement liability | | | — | | | | 7,871 | | | | 7,871 | |
Increase in accrued vacation | | | 871 | | | | — | | | | 871 | |
Increase in other liabilities | | | 1,604 | | | | 156 | | | | 1,760 | |
| | | | | | | | | | | | |
Net cash provided by operating activities | | | 29,157 | | | | 3,085 | | | | 32,242 | |
| | | | | | | | | | | | |
Cash flows from investing activities: | | | | | | | | | | | | |
Investment in life insurance policies | | | (491 | ) | | | (33 | ) | | | (524 | ) |
Acquisitions and purchase price adjustments, net of cash acquired | | | (5,370 | ) | | | (551 | ) | | | (5,921 | ) |
Proceeds from the sale of property and equipment | | | 102 | | | | — | | | | 102 | |
Purchases of property and equipment | | | (9,596 | ) | | | (40 | ) | | | (9,636 | ) |
| | | | | | | | | | | | |
Net cash used in investing activities | | | (15,355 | ) | | | (624 | ) | | | (15,979 | ) |
| | | | | | | | | | | | |
Cash flows from financing activities: | | | | | | | | | | | | |
Borrowings under line of credit | | | 150,014 | | | | — | | | | 150,014 | |
Payments under line of credit | | | (159,248 | ) | | | — | | | | (159,248 | ) |
Principal payments under notes and mortgage payable | | | (802 | ) | | | (16 | ) | | | (818 | ) |
Principal payments under capital lease obligations | | | — | | | | (189 | ) | | | (189 | ) |
Common stock: | | | | | | | | | | | | |
Proceeds from sale | | | 9,345 | | | | (18 | ) | | | 9,327 | |
Payments for repurchase | | | (13,605 | ) | | | — | | | | (13,605 | ) |
| | | | | | | | | | | | |
Net cash used in financing activities | | | (14,296 | ) | | | (223 | ) | | | (14,519 | ) |
| | | | | | | | | | | | |
Net increase in cash and cash equivalents | | | (494 | ) | | | 2,238 | | | | 1,744 | |
| | | | | | | | | | | | |
Cash and cash equivalents at beginning of period | | | 3,290 | | | | (3,124 | ) | | | 166 | |
Cash and cash equivalents at end of period | | $ | 2,796 | | | $ | (886 | ) | | $ | 1,910 | |
| | | | | | | | | | | | |
77
| | | | | | | | | | | | |
| | | Year Ended September 30, 2003 | |
| (Dollars in thousands) | | As Previously
Reported | | | Restatement
Adjustments | | | As Restated | |
Cash flows from operating activities: | | | | | | | | | | | | |
Net income | | $ | 17,191 | | | $ | (4,470 | ) | | $ | 12,721 | |
Adjustments to reconcile net income to net cash provided by operating activities: | | | | | | | | | | | | |
Increase in cash surrender value of life insurance | | | (271 | ) | | | (94 | ) | | | (365 | ) |
Depreciation and amortization | | | 8,391 | | | | 457 | | | | 8,848 | |
Gain on sale of property | | | (296 | ) | | | — | | | | (296 | ) |
Provision for bad debt and unbillable amounts | | | 162 | | | | — | | | | 162 | |
Provision for deferred income taxes | | | 2,624 | | | | (2,301 | ) | | | 323 | |
Provision for and amortization of deferred compensation | | | 1,039 | | | | (56 | ) | | | 983 | |
Change in operating assets and liabilities, net of acquisitions: | | | | | | | | | | | | |
Increase in accounts receivable | | | (6,041 | ) | | | 912 | | | | (5,129 | ) |
Increase in unbilled fees and billings in excess of cost | | | (8,969 | ) | | | (776 | ) | | | (9,745 | ) |
Decrease in other current assets | | | 542 | | | | 17 | | | | 559 | |
Decrease (increase) in other assets | | | 81 | | | | — | | | | 81 | |
Increase in accounts payable and accrued expenses | | | 8,214 | | | | 429 | | | | 8,643 | |
Increase in accrued reimbursement liability | | | — | | | | 5,823 | | | | 5,823 | |
Increase in accrued vacation | | | 953 | | | | — | | | | 953 | |
Increase in other liabilities | | | 761 | | | | (21 | ) | | | 740 | |
| | | | | | | | | | | | |
Net cash provided by operating activities | | | 24,381 | | | | (80 | ) | | | 24,301 | |
| | | | | | | | | | | | |
Cash flows from investing activities: | | | | | | | | | | | | |
Investment in life insurance policies | | | (370 | ) | | | 61 | | | | (309 | ) |
Acquisitions and purchase price adjustments, net of cash acquired | | | (5,506 | ) | | | — | | | | (5,506 | ) |
Proceeds from the sale of property and equipment | | | 851 | | | | — | | | | 851 | |
Purchases of property and equipment | | | (7,635 | ) | | | (72 | ) | | | (7,707 | ) |
| | | | | | | | | | | | |
Net cash used in investing activities | | | (12,660 | ) | | | (11 | ) | | | (12,671 | ) |
| | | | | | | | | | | | |
Cash flows from financing activities: | | | | | | | | | | | | |
Borrowings under line of credit | | | 150,153 | | | | 44 | | | | 150,197 | |
Payments under line of credit | | | (152,979 | ) | | | — | | | | (152,979 | ) |
Principal payments under notes and mortgage payable | | | (991 | ) | | | — | | | | (991 | ) |
Principal payments under capital lease obligations | | | — | | | | (20 | ) | | | (20 | ) |
Common stock: | | | | | | | | | | | | |
Proceeds from sale | | | 4,963 | | | | (150 | ) | | | 4,813 | |
Payments for repurchase | | | (12,544 | ) | | | — | | | | (12,544 | ) |
| | | | | | | | | | | | |
Net cash used in financing activities | | | (11,398 | ) | | | (126 | ) | | | (11,524 | ) |
| | | | | | | | | | | | |
Net increase in cash and cash equivalents | | | 323 | | | | (217 | ) | | | 106 | |
| | | | | | | | | | | | |
Cash and cash equivalents at beginning of period | | | 2,967 | | | | (2,907 | ) | | | 60 | |
Cash and cash equivalents at end of period | | $ | 3,290 | | | $ | (3,124 | ) | | $ | 166 | |
| | | | | | | | | | | | |
Misappropriation Loss, Investigation Related Expenses and Recovery of Assets
The misappropriation loss for fiscal 2005 as previously described, is presented net of the gain from recovered assets. All assets recovered during the investigation and not yet liquidated, are classified as assets held for sale in the accompanying consolidated balance sheets and are recorded at estimated fair value, less estimated costs to sell, as of the date recovered. The recovered assets consist of personal homes, condominiums and other real estate, automobiles, funds from bank accounts, jewelry, fine-arts and cash proceeds from the liquidation of personal retirement accounts. Some of the real estate recovered was acquired subject to existing debt, liens or mortgage notes. Such debt is reported as liabilities related to assets held for sale in the accompanying
78
consolidated balance sheets. The Company does not own any other assets held for sale other than those recovered during the investigation. Gain from recovered assets has been recognized at the estimated fair value of the assets recovered, less related debt and estimated costs to sell the assets. The participants also surrendered approximately 174,000 shares of the Company’s common stock. These shares were recorded at estimated fair value and a gain on recovery of misappropriated assets of $4.7 million was recognized for the year ended September 30, 2005. The gain from recovered assets is included in misappropriation loss, net of recoveries in the accompanying consolidated statements of operations for the year ended September 30, 2005.
In addition to the misappropriation loss, the Company has incurred certain professional fees and other costs that relate to the investigation of the embezzlement and the recovery of assets. These expenses include legal fees, forensic audit fees and related costs, and other costs associated with the recovery of misappropriated assets. Collectively, these costs are stated as investigation and related costs in the accompanying consolidated statements of operations and are recorded in the period the costs are incurred.
| | | | | | | | | | |
| | | Years Ended September 30, |
| (Dollars in thousands) | | 2005 | | | 2004 | | 2003 |
Misappropriation loss | | $ | 3,636 | | | $ | 4,854 | | $ | 5,075 |
Less: gain from recovered assets | | | (14,361 | ) | | | — | | | — |
Legal fees related to the investigation | | | 2,344 | | | | — | | | — |
Forensic accounting fees and related costs | | | 2,849 | | | | — | | | — |
Other | | | 253 | | | | — | | | — |
| | | | | | | | | | |
Total | | $ | (5,279 | ) | | $ | 4,854 | | $ | 5,075 |
| | | | | | | | | | |
3.Marketable Securities
At September 30, 2005 and 2004, the Company held investments in marketable securities classified as available-for-sale, which primarily consisted of growth funds, growth and income funds and bond funds.
| | | | | | | | | |
| | | September 30, 2005 |
| (Dollars in thousands) | | Cost | | Fair Value | | Unrealized Gain |
Mutual Funds | | $ | 374 | | $ | 636 | | $ | 262 |
| | | | | | | | | |
| | $ | 374 | | $ | 636 | | $ | 262 |
| | | | | | | | | |
| | | September 30, 2004 |
| (Dollars in thousands) | | Cost | | Fair Value | | Unrealized Gain |
Mutual Funds | | $ | 374 | | $ | 573 | | $ | 199 |
| | | | | | | | | |
| | $ | 374 | | $ | 573 | | $ | 199 |
| | | | | | | | | |
There were no unrealized losses as of September 30, 2004 and 2003. In April 2006, the Company liquidated its investment in marketable securities and realized a gain of approximately $280,000.
79
4.Property and Equipment
Property and equipment consisted of the following:
| | | | | | | | | | |
| | | Estimated Useful
Lives | | September 30, | |
| (Dollars in thousands) | | | 2005 | | | 2004 | |
Land | | — | | $ | 2,097 | | | $ | 2,138 | |
Building and building improvements | | 10 - 40 years | | | 14,204 | | | | 14,186 | |
Furniture and equipment | | 3 - 7 years | | | 40,201 | | | | 37,035 | |
Computer equipment | | 3 years | | | 17,192 | | | | 12,561 | |
Vehicles | | 3 years | | | 2,259 | | | | 1,703 | |
Leasehold improvements | | 10 years | | | 10,366 | | | | 9,258 | |
Construction in process | | — | | | 465 | | | | — | |
| | | | | | | | | | |
| | | | | 86,784 | | | | 76,881 | |
Less accumulated amortization and depreciation | | | | | (50,043 | ) | | | (42,968 | ) |
| | | | | | | | | | |
Property and equipment at cost, net | | | | $ | 36,741 | | | $ | 33,913 | |
| | | | | | | | | | |
The net book value of equipment recorded under capital leases was $833,000 and $671,000 at September 30, 2005 and 2004 respectively.
Depreciation and amortization expense relating to property and equipment amounted to $8.4 million, $8.4 million and $8.3 million for the years ended September 30, 2005, 2004 and 2003, respectively. The Company’s purchases of property and equipment amounted to $10.3 million, $9.6 million and $7.7 million during fiscal years 2005, 2004 and 2003, respectively. Capital expenditures during fiscal 2005 and 2004 consisted of fixed asset purchases, such as survey equipment, computer equipment, furniture and leasehold improvements.
5.Assets Held for Sale
During the course of the investigation into the misappropriations (See Note 2 for further discussion), the Company identified and recovered certain assets acquired by the participants using misappropriated Company funds. All assets recovered during the investigation and not yet liquidated, are classified as assets held for sale in the accompanying consolidated balance sheets and are recorded at estimated fair value less estimated cost to sell as of the date recovered. The recovered assets consist of personal homes, condominiums and other real estate, automobiles, funds from bank accounts, jewelry, fine-arts and cash proceeds from the liquidation of personal retirement accounts. Some of the real estate recovered was acquired subject to existing debt, liens or mortgage notes. Such debt is reported as liabilities of assets held for sale in the accompanying consolidated balance sheets. The participants also surrendered approximately 174,000 shares of the Company’s common stock. These shares were recorded at estimated fair value and a gain on recovery of misappropriated assets of $4.7 million was recognized for the year ended September 30, 2005. This gain is included in misappropriation loss, net of recoveries in the consolidated statements of operations for the year ended September 30, 2005. These shares are not included in assets held for sale as the estimated fair value of such shares was recorded as a reduction of stockholders’ equity. The Company does not have any other assets held for sale other than those recovered.
80
| | | | |
| (Dollars in thousands) | | September 30,
2005 | |
Assets held for sale at estimated fair value | | $ | 10,180 | |
Less: estimated costs to sell | | | 891 | |
| | | | |
Adjusted fair value of assets held for sale | | | 9,289 | |
Outstanding mortgage liabilities assumed | | | (4,627 | ) |
| | | | |
Net fair value of assets held for sale | | $ | 4,662 | |
| | | | |
Additionally, the Company has classified $4.1 million in assets recovered during the investigation in other assets and $2.3 million of related liabilities in other liabilities in its consolidated balance sheet as of September 30, 2005. The Company intends to sell these assets as soon as practicable.
6.Acquisitions
The Company acquired 100% of the stock of Durham Technologies, Inc. (“DTI”) on December 1, 2002 for $1.5 million, net of cash acquired of $170,000. The purchase price has been allocated to the respective assets and liabilities acquired based upon their estimated fair values as of the acquisition date. The allocation of the purchase price resulted in assets of $1.7 million, including approximately $687,000 of goodwill, none of which is deductible for tax purposes, $484,000 of identifiable intangible assets and liabilities of $247,000. The weighted average amortization period for the identifiable intangible assets is 7.5 years. DTI’s area of specialty includes risk management and risk assessment for public sector clients, primarily Federal contracts.
On March 19, 2003, the Company acquired 100% of the stock of Welker & Associates, Inc. (“Welker”) for $4.4 million, comprised of approximately $4.0 million in cash and 20,000 shares of the Company’s common stock valued at approximately $400,000. The value of the common stock issued was determined based on the estimated fair value of the common stock as of the date of the acquisition. The purchase price has been allocated to the respective assets and liabilities based upon their estimated fair values as of the acquisition date. The allocation of the purchase price resulted in assets of $5.1 million, including approximately $2.2 million of goodwill none of which is deductible for tax purposes, $1.2 million of identifiable intangible assets and liabilities of $703,000. During 2005 and 2004, we recorded approximately $1.7 million and $1.9 million of additional goodwill in connection with performance earn-out payments. The weighted average amortization period for the identifiable intangible assets is 5.9 years. Welker’s areas of specialty include water, wastewater and storm water management for Georgia’s local governments.
On June 1, 2004, the Company acquired 100% of the stock of TriLine Associates, Inc. (“TriLine”) for $3.7 million in cash. The purchase price has been allocated to the respective assets and liabilities based upon their estimated fair values as of the acquisition date. The allocation of the purchase price resulted in assets of $4.3 million, including approximately $960,000 of intangible assets and $2.1 million of goodwill, none of which is deductible for tax purposes and liabilities of $625,000. During 2005, the Company recorded $10,000 of goodwill in connection with a purchase price adjustment. The weighted average amortization period for the identifiable intangible assets is 5.8 years. TriLine specializes in transportation, geotechnical, and environmental services.
On July 1, 2004, the Company acquired 100% of the stock of W. Koo and Associates Structural Engineers, Inc. (“WKA”) for $2.5 million, net of cash acquired of $678,000, comprised of $413,000 in cash, $250,000 in accrued additional purchase price and 71,429 shares of the Company’s common stock valued at approximately $1.9 million. The value of the common stock issued was determined based on the estimated fair value of the common stock as of the date of the acquisition. The purchase agreement calls for an adjustment of the number of shares issued based on the valuation of the Company’s stock price at September 30, 2004 so that the total number of shares issued is valued at $1.9 million based on the September 30, 2004 stock value. The purchase agreement called for an additional purchase amount of $500,000, contingent upon the satisfaction of
81
certain conditions, to be paid in two installments of $250,000 on July 1, 2005 and July 1, 2006. The purchase price has been allocated to the respective assets and liabilities based on their estimated fair values as of the acquisition date. The allocation of the purchase price resulted in assets of $3.3 million, including approximately $850,000 of intangible assets and $913,000 of goodwill, none of which is deductible for tax purposes, and liabilities of $795,000. During 2005, we issued an additional 1,021 shares in connection with the purchase agreement adjustment and the Company recorded an additional $6,000 of goodwill in connection with the July 1, 2005 installment payment. The weighted average amortization period for the identifiable intangible assets is 2.8 years. WKA specializes in infrastructure improvements for public, municipal, transit, port authorities and private sector projects with a primary focus on transportation structures in California.
On October 1, 2004, the Company acquired 100% of the stock of Croslin Associates, Inc. (“Croslin”) for a purchase price of $786,000, net of cash acquired of $153,000, comprised of $456,000 in cash, $30,000 cash held in escrow and 11,111 shares of the Company’s common stock valued at approximately $300,000. The value of the common stock was based on the estimated fair value of the stock as of the date of acquisition. The purchase price has been allocated to the respective assets and liabilities based upon their estimated fair values as of the acquisition date. The allocation of the purchase price resulted in assets of $1.2 million, including approximately $40,000 of intangible assets and $454,000 of goodwill, none of which is deductible for tax purposes, and liabilities of $330,000. The weighted average amortization period for the identifiable intangible assets is 2.0 years. Croslin specializes in architectural services.
On February 1, 2005, the Company acquired 100% of the stock of Land and Water Consulting, Inc. (“LWC”) for a purchase price of $1.3 million, net of cash acquired of $13,000, comprised of $323,000 in cash, $100,000 cash held in escrow and 33,862 shares of the Company’s common stock valued at approximately $914,000. The value of the common stock was based on the estimated fair value of the stock as of the date of acquisition. The purchase price has been allocated to the respective assets and liabilities based upon their estimated fair values as of the acquisition date. The allocation of the purchase price resulted in assets of $2.5 million, including approximately $63,000 of intangible assets and $1.1 million of goodwill, none of which is deductible for tax purposes, and liabilities of $1.2 million. The weighted average amortization period for the identifiable intangible assets is 2.4 years. LWC is an environmental consulting firm in Montana.
The primary factor that contributed to a purchase price that resulted in the recognition of goodwill in our acquisitions is the intellectual capital of the skilled professionals and senior technical personnel associated with the acquired entities which does not meet the criteria for recognition as an asset apart from goodwill. The results of operations of the above acquisitions are included from the date of each acquisition. The pro forma impact of these acquisitions is not material to reported historical operations.
On April 30, 2006, the Company acquired 100% of the stock of EIP Associates (“EIP”) for a purchase price of $5.5 million in cash, net of $200,000 held in escrow. EIP is a leading provider of environmental, urban planning, water resource planning and natural resources services in California.
82
7.Goodwill and Other Intangible Assets
The changes in the net carrying amounts of goodwill by segment are as follows:
| | | | | | | | | | | | | | | |
| | | Year Ended September 30, 2005 |
| | | Transportation
Services | | Construction
Management | | Civil Engineering | | Environmental
Services | | Total |
Goodwill, beginning of year | | $ | 3,634 | | $ | — | | $ | 2,187 | | $ | 8,569 | | $ | 14,390 |
Current year acquisitions: | | | | | | | | | | | | | | | |
Croslin | | | — | | | — | | | 454 | | | — | | | 454 |
LWC | | | — | | | — | | | — | | | 1,136 | | | 1,136 |
Purchase price payments - prior year acquisitions | | | 16 | | | — | | | — | | | 1,740 | | | 1,756 |
| | | | | | | | | | | | | | | |
Goodwill, end of year | | $ | 3,650 | | $ | — | | $ | 2,641 | | $ | 11,445 | | $ | 17,736 |
| | | | | | | | | | | | | | | |
| | | Year Ended September 30, 2004 |
| | | Transportation
Services | | Construction
Management | | Civil Engineering | | Environmental
Services | | Total |
Goodwill, beginning of year | | $ | 611 | | $ | — | | $ | 2,187 | | $ | 6,654 | | $ | 9,452 |
Current year acquisitions: | | | | | | | | | | | | | | | |
Triline | | | 2,110 | | | — | | | — | | | — | | | 2,110 |
WKA | | | 913 | | | — | | | — | | | — | | | 913 |
Purchase price payments - prior year acquisitions | | | — | | | — | | | — | | | 1,915 | | | 1,915 |
| | | | | | | | | | | | | | | |
Goodwill, end of year | | $ | 3,634 | | $ | — | | $ | 2,187 | | $ | 8,569 | | $ | 14,390 |
| | | | | | | | | | | | | | | |
The Company’s intangible assets consisted of the following:
| | | | | | | | |
| | | | | September 30, 2005 |
| (Dollars in thousands) | | Estimated Useful
Lives | | Gross Carrying
Amount | | Accumulated
Amortization |
Client list | | 10 years | | $ | 1,453 | | $ | 607 |
Client name recognition | | 2 years | | | 100 | | | 100 |
Backlog | | 3 years | | | 1,799 | | | 1,269 |
Website | | 7 years | | | 200 | | | 81 |
Pension intangible asset | | 6 years | | | 1,946 | | | 1,621 |
| | | | | | | | |
| | | | $ | 5,498 | | $ | 3,678 |
| | | | | | | | |
| | | | | September 30, 2004 |
| (Dollars in thousands) | | Estimated Useful
Lives | | Gross Carrying
Amount | | Accumulated
Amortization |
Client list | | 10 years | | $ | 1,440 | | $ | 220 |
Client name recognition | | 2 years | | | 100 | | | 75 |
Backlog | | 3 years | | | 1,709 | | | 484 |
Website | | 7 years | | | 200 | | | 52 |
Pension intangible asset | | 6 years | | | 1,946 | | | 1,296 |
| | | | | | | | |
| | | | $ | 5,395 | | $ | 2,127 |
| | | | | | | | |
Amortization expense of intangible assets amounted to $1.6 million, $947,000 and $531,000 for the years ended September 30, 2005, 2004 and 2003, respectively. Estimated amortization expense is $1.1 million for fiscal year 2006, $191,000 for fiscal year 2007 and $140,000 for each of the three succeeding fiscal years.
83
8.Income Taxes
The provision for income taxes consisted of the following:
| | | | | | | | | | |
| | | Years Ended September 30, |
| (Dollars in thousands) | | 2005 | | | 2004 | | 2003 |
Current | | | | | | | | | | |
Federal provision | | $ | 16,845 | | | $ | 6,107 | | $ | 5,766 |
State provision | | | 1,808 | | | | 447 | | | 422 |
Deferred | | | | | | | | | | |
Federal provision (benefit) | | | (2,623 | ) | | | 6,691 | | | 301 |
State provision (benefit) | | | (289 | ) | | | 489 | | | 22 |
| | | | | | | | | | |
Total provision | | $ | 15,741 | | | $ | 13,734 | | $ | 6,511 |
| | | | | | | | | | |
The tax effects of temporary differences that give rise to significant portions of the deferred tax assets and deferred tax liabilities consisted of the following:
| | | | | | | | |
| | | Years Ended September 30, | |
| (Dollars in thousands) | | 2005 | | | 2004 | |
Deferred tax liabilities: | | | | | | | | |
Accounts receivable | | $ | (26,110 | ) | | $ | (22,703 | ) |
Unbilled fees | | | (25,655 | ) | | | (23,855 | ) |
Fixed and intangible assets | | | (3,419 | ) | | | (4,529 | ) |
Other | | | (690 | ) | | | (481 | ) |
| | | | | | | | |
Gross deferred tax liabilities | | | (55,874 | ) | | | (51,568 | ) |
| | | | | | | | |
Deferred tax assets: | | | | | | | | |
Accounts payable and accrued expenses | | | 24,404 | | | | 21,526 | |
Accrued vacation | | | 3,932 | | | | 3,235 | |
Federal tax credit carry forwards | | | 5,471 | | | | 6,222 | |
Deferred compensation | | | 4,640 | | | | 4,013 | |
Other assets | | | 5,494 | | | | 4,203 | |
Accrued reimbursement liability | | | 13,451 | | | | 9,059 | |
Other adjustments/misappropriation losses | | | — | | | | 1,297 | |
| | | | | | | | |
Gross deferred tax asset | | | 57,392 | | | | 49,555 | |
Valuation allowance | | | (4,269 | ) | | | (3,673 | ) |
| | | | | | | | |
Net deferred tax asset | | | 53,123 | | | | 45,882 | |
| | | | | | | | |
Net deferred tax liability | | $ | (2,751 | ) | | $ | (5,686 | ) |
| | | | | | | | |
SFAS No. 109, “Accounting for Income Taxes”, requires a valuation allowance to reduce the deferred tax assets reported if it is not more likely than not that some portion or all of the deferred tax assets will be realized. At September 30, 2005 and 2004, the Company has recorded a valuation allowance against its deferred tax assets in the amount of $4.3 million and $3.7 million, respectively.
For the past several years, the Company has generated research and development tax credits related to certain qualifying costs. The qualifying costs relate primarily to the Company’s project costs which management believes involved technical uncertainty. These research and development costs were incurred by the Company in the course of providing services generally under long-term client projects. Because the Company has been unable to utilize the entire amount of research and development tax credits it has generated each year, the consolidated
84
balance sheets reflect a deferred tax asset of $5.5 million and $6.2 million ($1.2 million and $2.5 million net of a corresponding valuation allowance of $4.3 million and $3.7 million) as of September 30, 2005 and 2004, respectively, for the unused credit carry forwards. The credits will expire beginning 2017 through 2022.
The deferred tax balances have been classified in the consolidated balance sheets as follows:
| | | | | | | | |
| | | Years Ended September 30, | |
| (Dollars in thousands) | | 2005 | | | 2004 | |
Current assets | | $ | 50,663 | | | $ | 36,241 | |
Current liabilities | | | (54,463 | ) | | | (47,038 | ) |
Valuation allowance | | | (3,768 | ) | | | (2,686 | ) |
| | | | | | | | |
Net current liabilities | | | (7,568 | ) | | | (13,483 | ) |
| | | | | | | | |
Non-current assets | | | 6,729 | | | | 13,313 | |
Non-current liabilities | | | (1,411 | ) | | | (4,529 | ) |
Valuation allowance | | | (501 | ) | | | (987 | ) |
| | | | | | | | |
Net non-current assets | | | 4,817 | | | | 7,797 | |
| | | | | | | | |
Net deferred tax liabilities | | $ | (2,751 | ) | | $ | (5,686 | ) |
| | | | | | | | |
The Company’s effective tax rate is based on income, statutory tax rates and tax planning opportunities available in the various jurisdictions in which the Company operates. Significant judgment is required in determining the effective tax rate and in evaluating the Company’s tax positions. The Company establishes reserves when, despite its belief that the tax return positions are fully supportable, it believes that certain positions, if challenged, will likely be resolved unfavorably to us. These reserves are adjusted in light of changing facts and circumstances, such as the progress of a tax audit or current developments in tax law. The Company’s annual tax rate includes the impact of reserve provisions and changes to reserves. While it is often difficult to predict the final outcome or the timing of resolution of any particular matter, the Company believes that its reserves reflect the probable outcome of known tax contingencies. Resolution of the tax contingencies would be recognized as an increase or decrease to the Company’s tax rate in the period of resolution. The Company has recorded a tax contingency accrual of approximately $13.5 million and $6.7 million as of September 30, 2005 and 2004, respectively, related to research and development tax credits taken on the Company’s tax return. The tax accruals are presented in the consolidated balance sheets within accounts payable and accrued expenses
A reconciliation of the income tax provision to taxes computed at the U.S. federal statutory rate is as follows:
| | | | | | | | | |
| | | Years Ended September 30, | |
| | | 2005 | | | 2004 | | | 2003 | |
U.S. Statutory Rate | | 35.0 | % | | 35.0 | % | | 35.0 | % |
Federal tax credits | | (19.0 | ) | | (7.1 | ) | | (11.4 | ) |
State taxes net of federal benefit | | 3.9 | | | 2.8 | | | 2.8 | |
Non-deductible expenses | | 2.0 | | | 2.5 | | | 3.3 | |
Change in tax reserve | | 18.2 | | | 11.2 | | | 1.5 | |
Change in valuation allowance | | 1.6 | | | 3.9 | | | 2.6 | |
Change in statutory rate | | 0.8 | | | — | | | — | |
Other | | 0.3 | | | 0.5 | | | 0.1 | |
| | | | | | | | | |
Effective tax rate | | 42.8 | % | | 48.8 | % | | 33.9 | % |
| | | | | | | | | |
85
9.Retirement Plans
The Company maintains a two tiered noncontributory, unfunded, nonqualified defined benefit pension plan.
The Key Employee Supplemental Option Plan (“KESOP”) is a two tiered plan that provides key officers and employees postretirement benefits. Tier one of the KESOP, known as the Key Employee Retention Program (“KERP”), provides an annual restricted stock award equal to five percent of the participant’s annual gross salary for a period of up to ten years (see Note 10). Benefits under the KERP vest at age 56 and after ten years of continuous service with the Company. Tier two of the KESOP, known as the Supplemental Income Program (“SIP”), is an unfunded plan that provides participants with retirement income for a specified period of between 5 and 15 years upon retirement, death, or disability. The plan fixes a minimum level for retirement benefits to be paid to participants based on the participants’ position at the Company and their age and service at retirement. Certain key employee agreements include an annual retainer for consulting services for a period of up to five years.
The following are the assumptions used in the measurement of the projected benefit obligation (“PBO”) and net periodic pension expense for the SIP:
| | | | | | | | | |
| | | Years Ended September 30, | |
| | | 2005 | | | 2004 | | | 2003 | |
Discount rate | | 5.50 | % | | 5.75 | % | | 6.00 | % |
The discount rate is used to calculate the PBO. The rate used reflects a rate of return on high-quality fixed income investments that matches the duration of expected benefit payments. The Company has typically used the Moody’s Aa Corporate Bond rate as of September 30th of each year as a benchmark for this assumption.
The Company uses a September 30 measurement date for its plans. The following table provides a summary of the Company’s annual costs.
| | | | | | | | | |
| | | Years Ended September 30, |
(Dollars in thousands) | | 2005 | | 2004 | | 2003 |
Service benefits earned during period | | $ | 648 | | $ | 432 | | $ | 393 |
Interest cost on projected benefit obligation | | | 642 | | | 506 | | | 520 |
Amortization: | | | | | | | | | |
Prior service cost | | | 325 | | | 325 | | | 325 |
Net loss from past experience | | | 363 | | | 107 | | | 119 |
| | | | | | | | | |
Net periodic pension cost | | $ | 1,978 | | $ | 1,370 | | $ | 1,357 |
| | | | | | | | | |
In 2005, 2004, and 2003, the Company recognized the amortization of the net loss from past experience as measured by comparing the expected position of the plan at year-end (based on the beginning of the year actuarial assumptions) and the actual position of the plan at year-end. The loss is amortized over the average remaining service period for active plan participants and is subject to the applicable corridor that is based on 10% of the greater of the PBO.
86
The reconciliations of the benefit obligation based on a September 30th measurement date are as follows:
| | | | | | | | |
| (Dollars in thousands) | | 2005 | | | 2004 | |
Change in benefit obligation: | | | | | | | | |
Projected benefit obligation at beginning of year | | $ | 11,497 | | | $ | 8,717 | |
Service cost earned during the year | | | 648 | | | | 432 | |
Interest cost on projected benefit obligation | | | 642 | | | | 506 | |
Loss from past experience | | | 755 | | | | 2,328 | |
Benefits paid | | | (669 | ) | | | (486 | ) |
| | | | | | | | |
Projected benefit obligation at end of year | | $ | 12,873 | | | $ | 11,497 | |
| | | | | | | | |
Reconciliation of funded status: | | | | | | | | |
Funded status | | $ | (12,873 | ) | | $ | (11,497 | ) |
Unrecognized net actuarial loss | | | 4,449 | | | | 4,057 | |
Unrecognized prior service cost | | | 325 | | | | 650 | |
| | | | | | | | |
Net amount recognized | | $ | (8,099 | ) | | $ | (6,790 | ) |
| | | | | | | | |
Amounts recognized in the consolidated balance sheet consists of: | | | | | | | | |
Accrued benefit liability | | $ | (11,994 | ) | | $ | (10,683 | ) |
Intangible asset | | | 325 | | | | 650 | |
Accumulated other comprehensive income | | | 3,570 | | | | 3,243 | |
| | | | | | | | |
Net amount recognized | | $ | (8,099 | ) | | $ | (6,790 | ) |
| | | | | | | | |
The Company expects plan contributions to fund benefits paid. The following table summarizes the Company’s expected benefit payments to be paid for each of the following fiscal years:
| | | |
Year Ended September 30, | | Scheduled Benefit Payments |
| (Dollars in thousands) | | |
2006 | | $ | 795 |
2007 | | | 862 |
2008 | | | 891 |
2009 | | | 899 |
2010 | | | 1,052 |
2011 through 2015 | | | 7,466 |
| | | |
| | $ | 11,965 |
| | | |
10.Employee Benefit Plan and Special Programs
The Company maintains “The PBSJ Employee Profit Sharing and Stock Ownership Plan and Trust”, which is a qualified contributory 401(k) plan, a profit-sharing plan and an unleveraged employee stock ownership plan (“ESOP”), collectively the “Plans”. The Plans qualify as a deferred salary arrangement under Sections 401(a) and 401(k) of the Internal Revenue Code. Under the 401(k) plan, participating employees may elect to defer a portion of their pretax earnings, up to the maximum allowed by the Internal Revenue Service. The Company offers a discretionary matching contribution of up to 100% of the employees’ first 3% pre-tax contribution. Employees are eligible to participate in the 401(k) plan on the first date of hire. Participants in the 401(k) plan are at all times 100% vested in the employees’ contribution amounts. All matching contributions made by the Company generally vest ratably over five years of continued service. Under the profit-sharing plan, the Company makes a discretionary cash award to eligible employees, which is included in the participants’ retirement account, and can be invested in a variety of investment options. The Company may also make a discretionary stock contribution to the ESOP, which is allocated using a ratio of the individual participant’s compensation for the year to the total compensation of all eligible participants for the year.
87
The Company’s matching cash contribution to the 401(k) plan was $4.0 million, $3.5 million and $3.3 million for the years ended September 30, 2005, 2004 and 2003, respectively. In addition, the Company recorded an additional benefit expense of $2.7 million, $2.7 million and $2.1 million at September 30, 2005, 2004 and 2003, respectively, as discretionary cash contributions to the profit-sharing plan and the ESOP. The Company’s accrued matching and discretionary cash contributions are included in accounts payable and accrued expenses in the accompanying consolidated balance sheets at September 30, 2005 and 2004.
The Company also maintains an additional incentive plan (“Incentive Plan”) for select employees. On an annual basis, the Company makes a discretionary cash award to fund the Incentive Plan within the Company’s limits of profitability and operating guidelines. Participation in the Incentive Plan is re-confirmed on an annual basis for all participants. The related Incentive Plan expenses for the years ended September 30, 2005, 2004 and 2003 was $10.7 million, $10.8 million and $9.5 million are included in general and administrative expenses in the accompanying consolidated statements of operations.
11.Restricted Stock
Restricted stock awards are offered throughout the year, including the KERP restricted stock, and are intended to provide long-term incentives to key employees. Awards of restricted stock are subject to transfer restrictions and risk of forfeiture until they are earned. Restricted stock shares become fully vested usually over a period of five years of continued employment and are subject to total forfeiture if the employee ceases to be employed prior to the restricted stock maturity date, except in certain limited circumstances described in the individual restricted stock award agreement. During the restriction period, holders have the rights of shareholders, including the right to vote, but cannot transfer ownership of their shares. Restricted stock is recorded at fair value on the date of issuance. Pursuant to Company guidelines, the Company may not issue restricted stock if, after issuing the shares, the total number of restricted shares outstanding would exceed ten percent of the total shares outstanding. There were 543,853 and 499,615 shares of restricted stock outstanding at September 30, 2005 and 2004. Unearned compensation is reflected as a component of stockholders’ equity and amounted to $3.1 million and $2.3 million as of September 30 2005 and 2004, respectively.
The issuance of restricted stock gives rise to unearned compensation that is amortized over the vesting period. The total amount of compensation expense recognized under these agreements during fiscal 2005, 2004 and 2003 was $806,000, $549,000 and $444,000 respectively.
88
12.Long-Term Debt
The following table lists long-term debt including the respective current portions.
| | | | | | |
| | | September 30, |
| (Dollars in thousands) | | 2005 | | 2004 |
Line of credit unused availability of $58,000 at September 30, 2005 and 2004, respectively. | | $ | — | | $ | — |
| | |
Mortgage note payable due in monthly installments starting on April 16, 2001, with interest, collateralized by real property; unpaid principal due March 16, 2011. Interest at LIBOR plus the floating rate margin of not less than 65 basis points and not greater than 90 basis points (4.51% and 2.49% at September 30, 2005 and September 30, 2004, respectively). | | | 7,833 | | | 8,118 |
| | |
| | |
Capital lease obligations | | | 853 | | | 684 |
| | | | | | |
| | | 8,686 | | | 8,802 |
Less current portion of long-term debt | | | 408 | | | 290 |
Less current portion of capital lease obligations | | | 341 | | | 240 |
| | | | | | |
Long-term debt and capital lease obligations | | $ | 7,937 | | $ | 8,272 |
| | | | | | |
Scheduled maturities exclusive of capital leases are as follows:
| | | |
Year Ending September 30, | | Scheduled Maturities |
| (Dollars in thousands) | | |
2006 | | $ | 408 |
2007 | | | 512 |
2008 | | | 512 |
2009 | | | 512 |
Thereafter | | | 5,889 |
| | | |
| | $ | 7,833 |
| | | |
The Company has a $58 million line of credit agreement, inclusive of $3 million in letters of credit, with Bank of America, N.A. (the “Bank”). The expiration date on the line of credit was June 30, 2005. On June 27, 2005, the Company amended its revolving line of credit with the bank, effective July 1, 2005. The amendment extends the maturity date of the line of credit to June 30, 2008. The total amount of the credit line remains unchanged at $58 million, inclusive of letters of credit; however the maximum amount of letters of credit was increased from $3 million to $10 million.
Covenants requiring monthly reporting of accounts receivable were amended to require quarterly reporting. Additionally, the Bank waived any events of default caused by the Company’s failure to comply with the accounts receivable reporting covenants prior to the date of the amendment.
The amendment also included a waiver of default caused by the Company’s failure to deliver to the Bank audited financial statements for fiscal year 2005, so long as such financial statements are delivered to the Bank no later than January 31, 2007.
The interest rate (4.36% and 2.34% at September 30, 2005 and September 30, 2004, respectively) ranges from LIBOR plus 50 basis points to Prime minus 125 basis points if the Company’s funded debt coverage ratio is less than 2.5. The range increases to LIBOR plus 75 basis points to Prime minus 100 basis points if the
89
Company’s funded debt coverage ratio is between 2.5 to 3.0. The line of credit contains clauses requiring the maintenance of various covenants and financial ratios including minimum levels of net worth, a minimum coverage ratio of certain fixed charges and a minimum leverage ratio of earnings before interest, taxes, depreciation and amortization to funded debt. The Company was in compliance with or obtained a waiver of default of the line of credit financial covenants as of September 30, 2005. The line of credit is collateralized by substantially all of the Company’s assets. We used cash flow from operating activities to repay amounts outstanding under our line of credit.
On March 19, 2001, the Company entered into a mortgage note with an original principal amount of $9.0 million due in monthly installments starting on April 16, 2001, with interest. Interest on the mortgage is LIBOR plus the floating rate margin of not less than 65 basis points and not greater than 90 basis points. A balloon payment is due on the mortgage on March 16, 2011. The effective interest rate on the mortgage note was 4.51% and 2.49% for the fiscal years ended September 30, 2005 and 2004, respectively. We used an interest rate swap (“the Swap”) agreement in order to minimize the adverse impact of the floating interest rate characteristics of the Company’s long term debt obligations. The swap effectively converts the floating interest rate on the note payable to a fixed rate of 6.28%. On March 16, 2006, the Company’s swap expired. Our previously fixed rate was converted to an adjustable rate mortgage which called for an interest rate based on the 30 day LIBOR plus a margin of .065%. The mortgage agreement contains clauses requiring the maintenance of various covenants and financial ratios. On December 10, 2003, the lender approved an amendment to the mortgage agreement to reflect new conditions for the Tangible Net Worth covenant requirement under the agreement. The Company has received a written waiver from the lender as it relates to compliance for all reporting and covenant requirements under the mortgage agreement through January 31, 2007. The mortgage note is collateralized by the office building located in Maitland, Florida.
The Company’s capital leases consisted primarily of equipment. The interest rates used in computing the minimum lease payments range from 2.02% to 4.84%. The leases were capitalized using the lower of the present value of the minimum lease payments or the fair market value of the equipment at the inception of the lease.
90
13.Commitments and Contingencies
The Company is obligated under various non-cancelable leases for office facilities, furniture and equipment. Certain leases contain renewal options, escalation clauses and payment of certain other operating expenses of the properties. In the normal course of business, leases that expire are expected to be renewed or replaced by leases for other properties. As of September 30, 2005, the future minimum annual lease commitments are as follows:
| | | | | | |
Years Ending September 30, | | Operating Leases | | Capital Leases |
(Dollars in thousands) | | | | | | |
| | |
2006 | | $ | 16,786 | | $ | 559 |
2007 | | | 13,846 | | | 381 |
2008 | | | 10,843 | | | 286 |
2009 | | | 6,773 | | | 121 |
2010 | | | 2,629 | | | 19 |
Thereafter | | | 1,016 | | | — |
| | | | | | |
| | | 51,893 | | | 1,366 |
| | |
Less executory and other costs | | | 281 | | | 231 |
Less amount representing interest | | | — | | | 282 |
| | | | | | |
Present value of net minimum lease payments | | $ | 51,612 | | $ | 853 |
| | | | | | |
Total rent expense included in general and administrative expenses was $16.6 million, $14.6 million and $14.3 million for fiscal years ended 2005, 2004 and 2003, respectively.
As of September 30, 2005, there were various legal proceedings pending against the Company, where plaintiffs allege damages resulting from the Company’s engineering services. The plaintiffs’ allegations of liability in those cases seek recovery for damages caused by the Company based on various theories of negligence, contributory negligence or breach of contract. The Company accrues for contingencies when a loss is probable and the amounts can be reasonably estimated. As of September 30, 2005, the Company had an accrual of approximately $5.1 million for all potential and existing claims, lawsuits and pending proceedings that, in management’s opinion, are probable and can be reasonably estimated.
In July 1998, we entered into an agreement with West Frisco Development Corporation (“WFDC”) to provide various services, among which was a flood plain study to be used by WFDC, the City of Frisco and FEMA. In 2003, the City of Frisco retained the services of a third-party architecture and engineering firm in connection with the extension and widening of Teel Road which lies within the greater drainage basin included in the Company’s original flood plain study. This architecture and engineering firm’s assessment of the flood plain study determined that the Company used incorrect assumptions when calculating the size of the drainage culverts required for the increased development of the area’s transportation infrastructure. Based on this assessment, the Company has entered into negotiations with the City of Frisco to correct the drainage needs to support the Teel Road expansion project. As a result, the Company had recorded an estimated liability of $3.1 million to cover the costs associated with correcting the drainage needs of the Teel Road expansion project. Included in this estimate is the purchase of a parcel of land for $1.5 million, the remaining balance of $1.6 million is reflected in other liabilities in the accompanying consolidated balance sheets as of September 30, 2005.
The Company expects to pay these liabilities over the next one to three years. Management is of the opinion that the liabilities ultimately resulting from such existing and other pending proceedings, lawsuits and claims should not materially affect the Company’s financial position, results of operations or cash flows.
The Company maintains a full range of insurance coverage, including worker’s compensation, general and professional liability (including pollution liability) and property coverage. The Company’s insurance policies may offset the amount of loss exposure from legal actions.
91
In July 2006, we entered into a settlement agreement with the State of Texas, Department of Transportation which resolves all claims that the State of Texas may have had against us for overpayments related to the restatement of overhead rates on billings on or before April 30, 2006 under contracts with that agency based on our payment of approximately $5.4 million and provides for the determination of the appropriate overhead rate for billings after April 30, 2006. In November 2006, we entered into a settlement agreement with the Florida Department of Transportation which resolves all claims that agency may have had against us for the overstatement of rates on billings through September 30, 2005 (and with respect to cost contracts through September 30, 2006) under our contracts with them based on our payment of approximately $12.5 million. This settlement agreement also provides for the determination of the appropriate overhead rate for fiscal year 2006 billings under fixed price contracts.
In January 2007, we reached a settlement agreement with the Department of Justice, Civil Division on behalf of it and all other federal agencies with which we have contracts to resolve all federal claims including claims under the Federal Civil False Claims Act, related to the overstatements of overhead rates on our contracts with federal agencies. The agreement requires approximately $6.5 million of reimbursement payments for all contract amounts through September 30, 2005.
The settlements described above are included in the accrued reimbursement liability in the Company’s consolidated financial statements. We are in discussions with our remaining government clients to enter into settlement agreements in order to satisfy any refund obligations, which are in various stages of settlement.
In the course of our investigation of the accounting irregularities and misappropriations, it was determined that there were possible violations relating to past political contributions by us and certain of our employees. The United States Attorney’s Office for the Southern District of Florida (Miami) and the Federal Bureau of Investigation are now conducting an investigation relating to improper campaign contributions including improper use of political action committees. We have produced documents and other information to the government and are fully cooperating with the investigation. At the present time, we believe it unlikely that criminal charges will be filed against us in this matter but the authorities are not precluded from bringing charges and circumstances may change.
The United States Securities & Exchange Commission is also conducting an investigation of the accounting irregularities and misappropriations of funds described above. We are fully cooperating with the investigation and have produced documents and other information to the commission. At the present time, we are unable to predict the likely outcome of this investigation.
92
14.Supplemental Cash Flow Information
| | | | | | | | | | | | |
| | | Years Ended September 30, | |
| (Dollars in thousands) | | 2005 | | | 2004 | | | 2003 | |
Supplemental disclosures of cash flow information: | | | | | | | | | | | | |
Cash paid for interest | | $ | 689 | | | $ | 861 | | | $ | 1,014 | |
Cash paid for income taxes | | $ | 4,697 | | | $ | 5,202 | | | $ | 4,522 | |
| | | |
Acquisitions: | | | | | | | | | | | | |
Fair market value of assets acquired | | $ | 1,904 | | | $ | 2,846 | | | $ | 2,321 | |
Goodwill and intangibles recorded | | | 1,693 | | | | 4,834 | | | | 4,535 | |
Fair market value of liabilities assumed | | | (1,475 | ) | | | (1,421 | ) | | | (950 | ) |
| | | | | | | | | | | | |
Purchase Price | | | 2,122 | | | | 6,259 | | | | 5,906 | |
Less: stock issued | | | (1,214 | ) | | | (1,875 | ) | | | (400 | ) |
Less: escrow withheld | | | (130 | ) | | | — | | | | — | |
Less: accrued additional purchase price | | | — | | | | (250 | ) | | | — | |
Prior year purchase price adjustments | | | 1,756 | | | | 1,237 | | | | — | |
Deposit paid | | | (550 | ) | | | 550 | | | | — | |
| | | | | | | | | | | | |
Cash paid | | $ | 1,984 | | | $ | 5,921 | | | $ | 5,506 | |
| | | | | | | | | | | | |
Non-cash investing and financing activities: | | | | | | | | | | | | |
Prior year purchase price adjustments to goodwill | | $ | — | | | $ | 678 | | | $ | — | |
Property and equipment financed under capital leases | | $ | 473 | | | $ | 368 | | | $ | 319 | |
Change in fair value of marketable securities available for sale | | $ | 35 | | | $ | 62 | | | $ | 114 | |
Net change in subscription receivable for shares issued | | $ | 347 | | | $ | 622 | | | $ | 134 | |
15.Segment Reporting
The Company is organized by the services provided to its customers. Under this organizational structure, the Company has four segments: Transportation Services, Construction Management, Civil Engineering and Environmental Services.
Activities in the Transportation Services business segment generally involve planning, design, right of way acquisition, development and design of intelligent transportation services and program construction management services for multiple transportation modes, including interstate and primary highways, toll roads, arterials, bridges, transit systems, airports and port facilities. The Program Management group of our Transportation segment provides many of its governmental clients the necessary resources to manage large infrastructure programs from concept through construction. Services include planning, programming, and contract support.
The Construction Management segment provides a wide range of services as an agent for the Company’s clients, including contract administration, inspection, field-testing, scheduling/estimating, instituting project controls and quality assessment. The Company provides scheduling, cost estimating and construction observation services for the project, or its services may be limited to providing construction consulting.
The Civil Engineering segment provides general civil engineering as well as specialized services to public and private clients. Included in these services are: site engineering and surveys, infrastructure engineering, master planning, disaster mitigation planning and response, asset assessment and management, emergency management and architectural and landscape design.
The Environmental Services business segment focuses on the delivery of planning, design and construction management services for private and public sector clients related to air quality management, flood insurance studies, energy planning, hazardous and solid waste management, ecological studies, wastewater treatment, water resources, environmental toxicology analysis, aquatic treatment systems and water supply and treatment.
93
In fiscal 2005, we derived approximately 27% of our engineering fees from various districts and departments of the FDOT (approximately 19% of total engineering fees) and the Texas Department of Transportation (“TxDOT”) (approximately 8% of total engineering fees) under numerous contracts. The majority of these revenues were earned by our Transportation Services segment.
Segment operating income includes corporate related costs which are not generally specific to the individual segments’ operations. Such costs primarily consist of indirect salaries and general and administrative costs. The amounts are allocated to the segments based on the individual segments’ proportionate share of indirect salaries and general and administrative costs compared to total Company indirect salaries and general and administrative costs, excluding any allocable costs.
94
Financial information relating to the Company’s operations by segment is as follows:
| | | | | | | | | | | | | | | | |
| (Dollars in thousands) | | Transportation
Services | | Construction
Management | | Civil Engineering | | | Environmental
Services | | Total |
Year Ended September 30, 2005 | | | | | | | | | | | | | | | | |
Engineering fees | | $ | 199,490 | | $ | 87,314 | | $ | 111,312 | | | $ | 113,821 | | $ | 511,937 |
Net earned revenues | | | 150,021 | | | 67,679 | | | 79,866 | | | | 92,385 | | | 389,951 |
Operating income | | | 17,638 | | | 7,250 | | | 5,691 | | | | 7,801 | | | 38,380 |
Depreciation and amortization | | | 3,630 | | | 1,191 | | | 2,454 | | | | 2,705 | | | 9,980 |
Total assets | | | 98,061 | | | 42,920 | | | 54,716 | | | | 55,950 | | | 251,647 |
Purchases of property and equipment | | | 3,766 | | | 1,697 | | | 2,269 | | | | 2,537 | | | 10,269 |
| | | | | |
Year Ended September 30, 2004 | | | | | | | | | | | | | | | | |
Engineering fees | | $ | 179,743 | | $ | 77,465 | | $ | 81,841 | | | $ | 109,198 | | | 448,247 |
Net earned revenues | | | 135,111 | | | 58,278 | | | 69,917 | | | | 88,569 | | | 351,875 |
Operating income | | | 10,821 | | | 6,164 | | | 5,531 | | | | 6,916 | | | 29,432 |
Depreciation and amortization | | | 3,401 | | | 994 | | | 2,216 | | | | 2,650 | | | 9,261 |
Total assets | | | 81,948 | | | 35,318 | | | 37,313 | | | | 49,786 | | | 204,365 |
Purchases of property and equipment | | | 3,612 | | | 1,504 | | | 2,038 | | | | 2,482 | | | 9,636 |
| | | | | |
Year Ended September 30, 2003 | | | | | | | | | | | | | | | | |
Engineering fees | | $ | 156,453 | | $ | 57,764 | | $ | 64,188 | | | $ | 105,304 | | $ | 383,709 |
Net earned revenues | | | 121,304 | | | 42,866 | | | 55,032 | | | | 82,814 | | | 302,016 |
Operating income | | | 12,150 | | | 2,773 | | | (184 | ) | | | 4,450 | | | 19,189 |
Depreciation and amortization | | | 3,151 | | | 803 | | | 2,208 | | | | 2,606 | | | 8,848 |
Purchases of property and equipment | | | 2,858 | | | 1,065 | | | 1,593 | | | | 2,191 | | | 7,707 |
16.Related Party Transactions
We lease office space in a building which houses our Marietta, Georgia operations from BCE Properties, which is owned and controlled by James Belk. Mr. Belk is a former owner of Welker and a Vice-President and Project Director of ours. The lease was assumed in connection with our acquisition of Welker in March 2003. The rental cost of the space is $17,600 per month. On May 31, 2006, the lease expired and was not renewed. In June 2006, we moved our Marietta, Georgia operations to a new location.
We lease office space in a building which houses our Missoula, Montana operations from Cedar Enterprises, which is owned and controlled by Charlie K. Vandam. Mr. Vandam is a former owner of LWC and a Senior Program Manager of ours. The lease was assumed in connection with our acquisition of LWC in February 2005. The rental cost of the space is $9,500 per month.
We lease office space in a building which houses our Helena, Montana operations from Prickly Pear Enterprises, which is owned and controlled by Paul Callahan. Mr. Callahan is a former owner of LWC and a Vice-President and Senior Division Manager of ours. The lease was assumed in connection with our acquisition of LWC in February 2005. The rental cost of the space is $1,800 per month.
95
17.Allowance for Doubtful Accounts
The activity in the allowance for doubtful accounts was as follows:
| | | | | | | | | | | | |
| | | Years Ended September 30, | |
| (Dollars in thousands) | | 2005 | | | 2004 | | | 2003 | |
Balance at beginning of year | | | 1,080 | | | | 1,119 | | | | 1,354 | |
Additions charged to costs and expenses | | | 486 | | | | 217 | | | | 162 | |
Deductions | | | (384 | ) | | | (256 | ) | | | (397 | ) |
| | | | | | | | | | | | |
Balance at end of year | | $ | 1,182 | | | $ | 1,080 | | | $ | 1,119 | |
| | | | | | | | | | | | |
18.Quarterly Financial Data (Unaudited)
| | | | | | | | | | | | | | | | | | | | | | | | |
| | | Fiscal 2005 | | Fiscal 2004 |
| (Dollars in thousands, except per share amounts) | | Q4 | | Q3 | | Q2 | | Q1 | | Q4 | | Q3 | | Q2 | | Q1 |
Operating Data: | | | | | | | | | | | | | | | | | | | | | | | | |
Engineering fees | | $ | 136,601 | | $ | 124,726 | | $ | 122,993 | | $ | 127,617 | | $ | 125,996 | | $ | 111,639 | | $ | 108,776 | | $ | 101,836 |
Net earned revenues | | | 103,219 | | | 98,003 | | | 96,238 | | | 92,491 | | | 98,742 | | | 86,288 | | | 86,130 | | | 80,715 |
Operating income | | | 6,788 | | | 17,309 | | | 6,581 | | | 7,702 | | | 12,728 | | | 7,328 | | | 4,082 | | | 5,294 |
Net income | | | 4,218 | | | 9,223 | | | 3,489 | | | 4,145 | | | 6,434 | | | 3,622 | | | 2,008 | | | 2,626 |
Net income per common share | | | | | | | | | | | | | | | | | | | | | | | | |
Basic | | $ | 0.60 | | $ | 1.30 | | $ | 0.48 | | $ | 0.56 | | $ | 0.74 | | $ | 0.49 | | $ | 0.28 | | $ | 0.36 |
Diluted | | $ | 0.56 | | $ | 1.22 | | $ | 0.45 | | $ | 0.53 | | $ | 0.69 | | $ | 0.46 | | $ | 0.26 | | $ | 0.34 |
Note: Quarterly and year-to-date computations of per share amounts are made independently; therefore, the sum of per share amounts for the quarters may not equal per share amounts for the year.
96
ITEM 9.Changes in and Disagreements With Accountants on Accounting and Financial Disclosure
Not applicable.
ITEM 9A.Controls and Procedures
Evaluation of disclosure controls and procedures
We maintain disclosure controls and procedures that are designed to ensure that information required to be disclosed in the reports that the Company files or submits under the Securities and Exchange Act is recorded, processed, summarized and reported within the time periods specified in the SEC’s rules and forms, and that such information is accumulated and communicated to the Company’s management, including its Chief Executive Officer and Chief Financial Officer, as appropriate, to allow timely decisions regarding required financial disclosure.
As of the end of the period covered by this report, the Company carried out an evaluation, under the supervision and with the participation of the Audit Committee and management, including the Chief Executive Officer and Chief Financial Officer, of the effectiveness of the design and operation of the Company’s disclosure controls and procedures pursuant to Exchange Act Rule 13a-15(e). Based upon, and as of the date of, this evaluation, the Chief Executive Officer and Chief Financial Officer concluded that the Company’s disclosure controls and procedures were not effective, because of the material weaknesses discussed below. In light of the material weaknesses described below, the Company performed additional procedures to ensure that the consolidated financial statements are prepared in accordance with generally accepted accounting principles. Accordingly, management believes that the financial statements included in this Annual Report fairly present in all material respects the Company’s financial condition, results of operations and cash flows for the periods presented.
Material Weakness in Internal Control Over Financial Reporting
A material weakness (within the meaning of the Public Company Accounting Oversight Board (“PCAOB”) Auditing Standard No. 2) is a control deficiency, or combinations of control deficiencies, that results in more than a remote risk that a material misstatement in our annual or interim financial statements will not be prevented or detected. The Company identified the following material weaknesses:
1) Entity-Level Controls
The Company did not design and maintain effective entity-level controls as defined in theInternal Control—Integrated Framework published by the Committee of Sponsoring Organizations of the Treadway Commission(“COSO”). These deficiencies related to each of the five components of internal control as defined by COSO (control environment, risk assessment, control activities, information and communication, and monitoring). Specifically:
| | • | | The Company did not design or maintain an effective control environment that fully emphasized the establishment of adherence to effective internal controls over financial reporting throughout the Company’s management and the organization. The Company did not maintain the appropriate tone at the top and did not give special consideration to the risk of management override of internal controls, including the review and approval of journal entries. This material weakness, among others described below, resulted in the restatement of the Company’s consolidated financial statements for the years ended September 30, 2004 and 2003, the unaudited condensed consolidated financial statements for each of the fiscal quarters during those years and for the fiscal quarter ended December 31, 2004, and significant audit adjustments to the consolidated financial statements for the year ended September 30, 2005, and each of the fiscal quarters during 2005. |
97
| | • | | The Company did not conduct a fraud risk assessment to consider the risk of material misstatements due to fraud, giving consideration to potential fraud schemes, or other internal or external factors such as pressures or incentives affecting the Company. This material weakness created an environment where financial statement fraud and the misappropriation of the Company’s assets occurred that were material to the consolidated financial statements and remained undetected for a significant period of time. |
| | • | | The Company did not maintain antifraud control activities or controls to deter the misappropriation of the Company’s assets which resulted in material misstatements of the consolidated financial statements. The Company’s controls to prevent and detect management override of control activities were not adequate to prevent such activities from occurring. Additionally, the Company did not maintain the appropriate security controls or access limitation controls to the Company’s accounting system. |
| | • | | The Company did not adequately communicate to all employees of the organization information regarding the importance of internal controls over financial reporting and employees’ duties and responsibilities. |
| | • | | The Company did not maintain appropriate monitoring controls such as procedures to ensure periodic evaluations of internal controls to obtain evidence that controls were operating effectively. The Company did not maintain effective controls to ensure there was adequate monitoring and oversight of the work performed by the accounting and financial reporting personnel to ensure the accuracy and completeness of the consolidated financial statements. |
| | • | | The Company did not have a sufficient number of personnel with an appropriate level of accounting knowledge, experience, and training in the application of accounting principles generally accepted in the United States of America (“US GAAP”), along with the financial reporting requirements of the United States Securities and Exchange Commission. The Company did not maintain the appropriate number of personnel in the internal audit department given the size and complexity of the Company’s transactions. |
These conditions constitute deficiencies in both the design and operation of entity-level controls. As a result of these material weaknesses, a number of material financial statement misstatements occurred. In addition, a misappropriation of Company funds remained undetected for a significant period of time.
2) Inadequate Controls Related to the Accounting for Government Contracts
The Company did not maintain effective controls over the accounting for its government contracts subject to the Federal Acquisition Regulations. Specifically, the Company did not employ accounting personnel with adequate government contracting experience which resulted in errors in the calculation of the Company’s overhead rates used in billings to the Company’s clients. These errors include the accounting for general and administrative costs, erroneous inclusion of unallowable costs, and the overstatement of overhead rates resulting from the embezzlement scheme related to the misappropriation of the Company’s assets.
3) Inadequate Controls Related to the Closing and Financial Reporting Cycles
Several significant deficiencies in the design and operating effectiveness of internal controls over the monthly close, quarterly, and year-end reporting cycles were identified which were considered material weaknesses when aggregated. Specifically, the significant deficiencies include inaccurate account analyses, account summaries, and lack of account reconciliations. The affected accounts include fixed assets, billings in excess of costs, accrual for loss contracts, accrued wages and payroll expense, direct reimbursable expenses, direct salaries and direct costs, employee business expenses, employee advances and reimbursements, legal accruals, medical reserve, flexible spending accounts, and stockholder’s equity. Additionally, the Company did not have adequate supporting documentation including calculations, reconciliations, and basis for assumptions used to prepare the Company’s consolidated financial statements.
4) Inadequate Controls over the Cash Management Process and Safeguarding of Assets
98
The Company did not maintain adequate controls over the Company’s cash accounts. Bank reconciliations were not accurately prepared or reviewed on a timely basis. Inadequate segregation of duties existed. Management override resulted in the unauthorized initiation, approval, and execution of Company checks and wire transfers. The Company also maintained a significant number of bank accounts in its general ledger with no activity. In addition, the Company has numerous bank accounts with financial institutions which could be centralized to improve controls over cash management and safeguarding.
5) Inadequate Controls Related to Revenue Recognition Cycle
The Company did not design or implement appropriate controls related to the revenue recognition cycle. Certain project revenue did not meet the criteria for deferral under US GAAP. The Company did not adequately maintain contemporaneous information supporting the calculation and estimation of the amount of revenue recognized under a specific contract (e.g., detailed support of costs to complete). In addition, the Company did not maintain a comprehensive contract administration function to address potential operational or accounting impacts of client contracts. The controls were not adequate to ensure that revenue was properly recognized when it was earned and that other criteria necessary for revenue recognition had been met.
6) Inadequate Controls over the Expenditure Cycle
The Company did not maintain effective controls to ensure the proper recording of subcontractor liabilities in the correct reporting period. As a result, during the 2005 and 2004 interim and year-end closing, adjustments were necessary to properly state accounts payable, direct reimbursable expenses, engineering fees, and unbilled fees in the Company’s interim and annual financial statements.
7) Inadequate Controls over Accounting for Commitments and Contingencies
The Company’s controls over its accounting for commitments and contingencies were not designed or operating effectively. Accruals for legal claims and contingent liabilities were not appropriately reviewed by legal counsel and the accounting and finance department on a timely basis. This resulted in audit adjustments to the 2005 and 2004 annual and interim consolidated financial statements.
8) Inadequate Controls Related to the Income Tax Cycle
The Company’s internal controls were not adequately designed or operating in a manner to effectively support the requirements of the income tax cycle. This material weakness includes failures in the design and operating effectiveness of controls which should ensure that (i) the income tax provision is determined using a methodology and related assumptions consistently applied across the entity and accounting periods; (ii) relevant, sufficient, and reliable data necessary to record, process, and report the income tax provision and related income tax accounts is captured; (iii) disclosures are prepared in accordance with US GAAP; (iv) application of the Company’s accounting policies to the tax provision and related accounts is performed timely, appropriately documented, and independently reviewed for accuracy; (v) significant estimates and judgments are based on the latest available information and management’s understanding of the Company’s operations; and (vi) Company personnel have an appropriate understanding of the accounting for income taxes. Due to the pervasive nature of these deficiencies and the absence of other effective mitigating controls, there is a more than remote likelihood that a material misstatement of the interim and annual consolidated financial statements would not have been prevented or detected.
9) Other Misapplications of US GAAP
The Company did not perform adequate evaluations of its lease agreements in order to identify and appropriately account for its capital leases, nor did the Company record straight-line rent expense, rent holidays, or escalations for its operating leases in accordance with US GAAP.
The Company did not maintain effective controls to ensure the identification and appropriate accounting for its defined benefit plans; specifically, the obligations under such defined benefit plans were not determined on an
99
actuarial basis. This resulted in a material misstatement to the Company’s 2004 consolidated financial statements by an overstatement of general and administrative expense, an understatement of the deferred compensation liability, an understatement of intangible assets, and an understatement of other comprehensive loss.
The Company did not maintain effective controls to ensure the capture and timely recording of employee wages and employee business expense reimbursements. This resulted in a misstatement to the Company’s 2004 consolidated financial statements by an understatement of general and administrative expenses.
The Company did not maintain effective controls to ensure the identification and accounting for losses on contracts in progress. This resulted in an understatement of accounts payable and accrued expenses related to the accrual for loss contracts.
The Company included its intangible assets in other assets and did not properly disclose all billings in excess of costs, both of which are required to be presented separately in the Company’s consolidated balance sheet in accordance with US GAAP. As a result there was a material misstatements misclassification between other assets and intangible assets and a material misclassification of unbilled fees and billings in excess of cost on the Company’s consolidated balance sheet.
These matters result from design and operating deficiencies in controls relating to the application of US GAAP. Such deficiencies coupled with an absence of other effective mitigating controls create conditions where there exists more than a remote likelihood that a material misstatement of the interim and annual financial statements would not have been prevented or detected.
10) Inadequate Computer Access Controls
The Company’s computer security access controls were not operating effectively, allowing for the unauthorized access of the accounting system by the information technology department. This condition allowed former Company personnel to post fictitious journal entries, as well as to delete and manipulate the Company’s accounting records, which actions permitted the concealment of the misappropriations of the Company’s assets.
Changes in Internal Control Over Financial Reporting
Upon discovery of the misappropriations, the Company immediately began implementing additional and remedial controls to, among other things, safeguard cash assets, and segregate duties, and began documenting internal controls and identifying control weaknesses. We have taken steps to remedy these weaknesses by hiring additional qualified accounting personnel, including the hiring of a new Chief Financial Officer, Chief Ethics and Compliance Officer and Corporate Controller. In addition, the Company has hired new accounting personnel with substantial knowledge of financial accounting principles and procedures. We have improved the controls designed to safeguard our cash assets, and have implemented additional segregation of duties. We have also engaged an external firm to formally identify, assess and document our current internal control structure. The Company will continue to take additional steps necessary to remediate the material weaknesses described above.
Except as described above, there have been no changes to the Company’s internal control over financial reporting that occurred during the Company’s fiscal quarter ended September 30, 2005, that have materially affected, or are reasonably likely to affect, the Company’s internal control over financial reporting.
ITEM 9B.Other Information
None.
100
PART III
ITEM 10.Directors and Executive Officers of the Registrant
The following table sets forth certain information regarding the Company’s directors, executive officers, and certain key employees as of September 30, 2005:
| | | | |
NAME | | AGE | | POSITION |
John B. Zumwalt, III (3) | | 54 | | Director, CEO and Chairman of the Board |
Robert J. Paulsen | | 53 | | Director, Executive Vice President, COO, Secretary and Vice Chairman of the Board |
Todd J. Kenner | | 44 | | Director and President |
John S. Shearer | | 54 | | Director and Senior Vice President |
William D. Pruitt (2) | | 65 | | Director |
Phillip E. Searcy (2) | | 71 | | Director |
Frank A. Stasiowski (2) | | 57 | | Director |
Donald J. Vrana(1) | | 43 | | Senior Vice President, CFO and Treasurer |
Richard M. Grubel (1) | | 59 | | Senior Vice President and Assistant Secretary |
Becky S. Schaffer | | 60 | | Vice President and Assistant Secretary |
Richard A. Wickett (3) | | 63 | | Former Chairman of the Board |
Kathryn J. Wilson (4) | | 34 | | Former Treasurer and Assistant Secretary |
| (1) - | Effective October 31, 2005, Mr. Grubel stepped down as interim Chief Financial Officer and resumed his responsibilities as Senior Vice President and Director of Corporate Development for Post, Buckley, Schuh & Jernigan Inc. On November 1, 2005, Mr. Vrana was appointed Senior Vice President. On December 23, 2005, Mr. Vrana was appointed Treasurer. |
| (2) - | Messrs. Pruitt, Searcy and Stasiowski are non-employee members of The PBSJ Corporation Board of Directors. |
| (3) - | Mr. Zumwalt was elected as Chairman of the Board in January 2005, at which time Mr. Wickett resigned his position. |
| (4) - | Mrs. Wilson resigned her position as Assistant Secretary in November 2005. Mrs. Wilson is the daughter of Mr. Wickett, our former Chairman of the Board. |
John B. Zumwalt, III, 55, is a Director and the Chairman of the Board of Directors. He has been an officer and director of The PBSJ Corporation since 1995. He was Chief Operating Officer from 1998 to 2002; President and Chief Executive Officer from 2002 to 2005 and Chairman and Chief Executive Officer since January 2005. Mr. Zumwalt has been employed with the Company since 1973. He is the former President and Director of the Florida Engineering Society, the former President of the Florida Institute of Consulting Engineers and a Founder of the FES/FICE Leadership Institute. He has been recognized for his outstanding service to the engineering profession and has been awarded the Governor A.W. Gilchrist Award for public service. Mr. Zumwalt also serves on the Board of the Florida Chamber, serves on the Executive Committee of Florida Tax Watch and is also a member of the Florida Council of 100. He has also served as the past chair of the Florida Chamber Foundation and a past board member of Enterprise Florida. Mr. Zumwalt graduated from the University of Rhode Island with a degree in Civil and Environmental Engineering, and he was inducted into the Engineering Hall of Fame at the University of Rhode Island in 2004.
Robert J. Paulsen, 53, is Vice-Chairman and Secretary of the Board of Directors, and serves as the Chief Operating Officer (“COO”) of the subsidiary company Post, Buckley, Schuh and Jernigan, Inc. Prior to his appointment as COO, Mr. Paulsen served as the Company’s National Director of Transportation Services. He has been an officer of the Company since 1993 and a Director of the Corporation since 2000. Mr. Paulsen received his bachelor degree in Civil Engineering from Iowa State University in 1974.
Todd J. Kenner, 45, has been a director since 2001, and was appointed President of the Company in January 2005. He has been an officer of the Company since 1992, when he joined the Company through the acquisition of Church Engineering. From October 1992 through January 1998, Mr. Kenner directed the firm’s subsidiary activities in the western region of the United States. From January 1998 through January 2005, he served as a
101
Regional Director over the Company’s West Region business interests. Concurrently, Mr. Kenner serves as the Chief Marketing Officer, where he has held that position since January 2002. Mr. Kenner received a Bachelor of Science degree in Civil Engineering from the South Dakota School of Mines and Technology.
John S. Shearer, 55, was elected Director of the Company in January 2001. He has also served as the Director of Environmental Services since 1991 for the subsidiary company Post Buckley Schuh & Jernigan, Inc. Mr. Shearer worked for the Company from 1983 to 1987 returning in 1991. Mr. Shearer currently serves on the National Board of Directors of the WateReuse Association and is a member of the Board of WMFE, the Public Broadcasting Service television and National Public Radio affiliate in Orlando Florida. He received a bachelor degree in Civil Engineering from the University of South Florida in 1973.
William D. Pruitt, 65, has been a Board Member of The PBSJ Corporation since July 2005, and has been the Chairman of the Company’s Audit Committee since 2003. Mr. Pruitt also serves as Chairman of the audit committee of KOS Pharmaceuticals, Inc., a fully integrated specialty pharmaceutical company, where he has held that position since 2004. He has also been a past Chairman of the Audit Committee for Adjoined Consulting, Inc., which is was a full-service management consulting firm, since 2000. Adjoined Consulting Inc. was merged into Kanbay International, a global consulting firm with approximately 6,000 employees in February 2006. Mr. Pruitt was also the Managing Partner from 1980 to 1999 for Arthur Andersen LLP’s Florida, Caribbean and Venezuela operations. Mr. Pruitt has a Bachelor of Business Administration from the University of Miami and is a Certified Public Accountant (inactive).
Phillip E. Searcy, 72, was appointed Director of the Company in July 2005, after previously serving on the Company’s CAC. Mr. Searcy had previously been employed by the Company in November 1972 until his retirement in 1996. Throughout his career with the Company, Mr. Searcy served in several key positions including Director of Environmental Services, Chief Operating Officer, Corporate Secretary, and Chairman of the Board, a position he held for a total of nine years. Mr. Searcy is a recognized technical expert in environmental engineering and has focused much of his time to the development of organizational improvements for the Company. He is credited with creating the “Services” concept for the national expansion of the Company’s technical services. He was also instrumental in leading the firm’s Employee Incentive Program toward a more performance-based reward program. He now serves as Chairman of the Company’s Executive Compensation Committee and the Governance Committee. Mr. Searcy received his Bachelor of Science in Civil Engineering and a Master of Science in Engineering from the University of Florida. He is a registered professional engineer in Florida and Virginia.
Frank A. Stasiowski, FAIA, 57, has been a Director of the Corporation since July 2005. He also serves on the Board of Group GSA, LTD., an architectural services firm in Sydney, Australia and Rodgers Consulting, a land asset improvement consulting firm Germantown, Maryland. He is a former member of the Board of Directors of Austin Veum Robbins Partners (“AVRP”) and Cornoyer Hedrick Architects. AVRP is an architecture, interior design and engineering firm in San Diego, California and Cornoyer Hedrick Architects is an architecture firm in Phoenix, Arizona. Mr. Stasiowski is also President, Chief Executive Officer and a founding owner of PSMJ Resources, Inc., a global publishing, education, consulting and trade show company. Mr. Stasiowski is a licensed architect with degrees from the Rhode Island School of Design and a Master degree in Business Administration from Bryant University.
Donald J. Vrana, 43, is the Company’s Chief Financial Officer and Treasurer. He has been an officer and director since his hire on October 31, 2005. From 1996 to 2005, he was employed at SITEL Corporation in various positions, most recently as Chief Accounting Officer, Controller and Treasurer. SITEL is a publicly traded, leading global provider of outsourced customer support services. From 1991-1996 he was Associate Vice President and Director of Tax and Financial Reporting for FirsTier Financial, Inc., a multi-bank financial institution. From 1987 through 1991 Mr. Vrana was a Tax and Financial Analysis Project Manager for Union Pacific Railroad, and from 1983 through 1987 a Senior Supervisor of KPMG Peat Marwick. Mr. Vrana has a Bachelor of Science in Business Administration from the University of Nebraska, a Master of Business Administration degree from Creighton University, and is a Certified Public Accountant.
102
Richard M. Grubel, 59, is a Senior Vice President and Director of Corporate Development for Post, Buckley, Schuh & Jernigan Inc. Mr. Grubel also serves as an Assistant Secretary for the Company. He has been employed with the Company for the past 21 years in various capacities, including Information Technology Director, Real Estate Director and most recently interim Chief Financial Officer. His current responsibilities include the coordination of the Company’s merger and acquisition program, business planning and analysis, strategic initiatives, and special projects in support of the Board of Directors. Prior to joining the Company, Mr. Grubel held management positions at two Fortune 500 companies. Mr. Grubel received his bachelor degree in Economics and Business and his Master of Business Administration degree, both from Rutgers University.
Becky S. Schaffer, 60, has served as Corporate Counsel, handling all legal matters for the Company and Senior Vice President for Post Buckley Schuh & Jernigan, Inc. since 1994. Mrs. Schaffer also serves as Secretary for the Company. From 1989 to 1994, she was Vice President and Senior Claims Counsel for Fidelity National Title Insurance Company. From 1986 to 1989, she served as General Counsel, Vice President, Secretary and Compliance Officer for Financial Federal Savings and Loan Association of Dade County, Florida. From 1983 to 1986, Mrs. Schaffer was in general private practice with an emphasis on commercial litigation and collection and real estate. From 1983 to 1981 she held the position of staff counsel for Belcher Oil Company. Ms. Schaffer has a Bachelor of Science from Auburn University and graduated from the Nova University Center for the Study of Law. She was admitted to the Florida Bar in 1981.
Richard A. Wickett, 63, was appointed Chairman of the Board in 2002 and retired in February 2005. He previously served as the Company’s Chief Financial Officer 1993 to 2004. Mr. Wickett also serves as First Vice Chairman of the Board of Directors of Eastern Financial Federal Credit Union, a one-billion-dollar credit union serving various business interests of its members within the United States. Prior to joining the Company in 1973, he was an Audit Manager with the international firm of Coopers & Lybrand, Certified Public Accountants. He received a bachelor degree in accounting from the University of Miami in 1965 and is a Certified Public Accountant in Florida. Mr. Wickett is the father Kathryn J. Wilson, the Company’s former Treasurer and Assistant Secretary.
Kathryn J. Wilson, 34, began her career with the Company as an intern while completing her undergraduate and graduate studies. In 1999 she began her professional career with the Company as an accounting manager. In 2003, she was appointed Associate Vice President and Controller of PBS&J. Mrs. Wilson was appointed Assistant Secretary of the Company in 2004. In 2005 she was appointed as the Company’s Treasurer and Vice President of PBS&J, where she held those positions until her resignation in January 2006. Mrs. Wilson has a bachelor degree in accounting from Florida State University and a master degree in Accounting from Florida International University, and is a licensed Certified Public Accountant in Florida and South Carolina. Ms. Wilson is the daughter of Richard A. Wickett, the Company’s former Chairman of the Board.
Committees of the Board of Directors
Corporate Audit Committee
The CAC was originally established to review, act on and report to the Board of Directors on various auditing and accounting matters, including the selection of our independent auditors, the monitoring of the rotation of the partners of the independent auditors, the review of our financial statements, the scope of the annual audits, fees to be paid to the auditors, the performance of our independent auditors and our accounting practices. After the Board of Directors established the Audit Committee, the CAC was transformed into the Corporate Advisory Counsel, and is now a sub-committee of the Audit Committee.
Audit Committee
The Audit Committee consists of Messrs. Pruitt (Chairperson), Searcy and Stasiowski. Our Board of Directors has determined that Mr. Pruitt is an independent audit committee financial expert as such term is defined by the Securities and Exchange Commission. The Audit Committee’s principal functions include the oversight of the financial reports and other written financial information filed by the Company with the Securities and
103
Exchange Commission, the quality and integrity of the Company’s financial statements, the effectiveness of the Company’s internal control over financial reporting, the Company’s compliance with legal and regulatory requirements. The Audit Committee is also responsible for the oversight of various auditing and accounting matters, including the selection of our independent public accountants, determining the independence of our independent public accountants, the scope of the audit procedures, the nature of all audit and non-audit services to be performed, the fees to be paid to the independent public accountants, the performance of our independent public accountants and our accounting practices and policies. The Audit Committee also receives and reviews complaints regarding accounting and auditing matters, including anonymous submissions by employees regarding questionable accounting or auditing matters. During fiscal 2005, the Audit Committee met 25 times.
Executive Compensation Committee
The Executive Compensation Committee consists of Messrs. Searcy (Chairperson), Pruitt and Stasiowski. The Executive Compensation Committee ensures that levels of compensation for the Company’s executive officers are justifiable, have a reasonable relationship to performance, and integrate best-industry practices. The Compensation Committee determines the salaries and incentive compensation of our officers and directors and provides recommendations for the salaries and incentive compensation of our other employees. The Executive Compensation Committee met four times during fiscal 2005.
Governance Committee
The Governance Committee was established during the first quarter of fiscal 2006. The primary function of the Governance Committee is to develop and recommend to our Board all corporate governance guidelines applicable to the Company and to apply those guidelines to the Company’s overall long-term strategies and future growth plans.
Compensation Committee Interlocks and Insider Participation
During fiscal 2005, Messrs. Searcy, Pruitt and Stasiowski served on our Compensation Committee. Mr. Searcy was appointed Director of the Company in July 2005, and had previously been employed by the Company in November 1972 until his retirement in 1996. Throughout his career with the Company, Mr. Searcy served in several key positions including Director of Environmental Services, Chief Operating Officer, Corporate Secretary, and Chairman of the Board. During fiscal 2005, none of our executive officers served on the compensation committee of any other entity, any of whose respective directors or executive officers served either on our Board of Directors or on our Compensation Committee.
104
Performance Graph
The following graph shows a comparison of the five-year cumulative total shareholder return for our common stock with the S&P 500 Index and a weighted peer group index. The peer group index consists of other engineering firms the Company uses to benchmark its performance. The graph assumes a $100 investment on September 30, 2001 in our common stock, the S&P 500 Index and the peer group index.
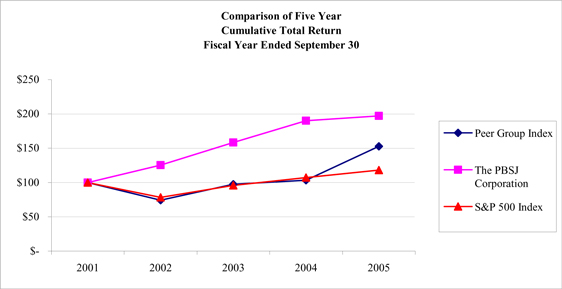 ]
]
Section 16(A) Beneficial Ownership Reporting Compliance
Section 16(a) of the Securities Exchange Act of 1934, as amended, requires the Company’s directors and executive officers, and persons who own more than 10% of the Company’s Common Stock, to file with the Securities and Exchange Commission reports of ownership and changes in ownership of Common Stock. Officers, directors and greater than 10% beneficial owners are required by Securities and Exchange Commission regulations to furnish the Company with copies of all Section 16(a) forms they file for review. Based on this review, we believe that during the 2005 fiscal year, there was no failure by any such person to timely file a report under Section 16(a) of the Exchange Act.
Code of Ethics
On September 29, 2003, the Board of Directors approved and adopted a code of ethics for the Company’s Principal Executive Officer, Principal Financial Officer, Principal Operations Officer and Principal Accounting Officer, Pursuant to 18 U.S.C. Section 1350, as adopted pursuant to Section 406 of the Sarbanes-Oxley Act of 2002.
On August 14, 2006, the Board of Directors approved and adopted The PBSJ Corporation Code of Conduct,Building for the Future: Our Values, Principles, and Standards, as a statement of the Company’s core business ethics and compliance standards and values. These standards contain the Company’s core expectations as to the manner in which employees will conduct business on behalf of The PBSJ Corporation and its subsidiaries. All of our employees are required to abide by our standards of business ethics and conduct to ensure that the Company operates in a consistent legal and ethical manner.
105
ITEM 11.Executive Compensation
The following table sets forth all compensation paid during the year ended September 30, 2005, to the Company’s Chief Executive Officer and the next four highest paid executive officers, collectively know as the “Named Officers.” Except as listed below, there are no stock options/SARS or any other compensation paid to executive officers.
| | | | | | | | | | | | |
| | | Annual Compensation | | Long-term Compensation |
Name and Principal Position | | Year | | Salary ($) | | Bonus ($) (1) | | Other Annual
Compensation (2) | | Restricted Stock
Award(s) | | All Other
Compensation |
John B. Zumwalt, III. | | 2005 | | 280,000 | | 220,000 | | * | | — | | — |
Chairman of the Board and | | 2004 | | 267,500 | | 190,000 | | * | | — | | — |
Chief Executive Officer | | 2003 | | 257,500 | | 200,000 | | * | | — | | — |
| | | | | | |
Robert J. Paulsen | | 2005 | | 270,000 | | 180,000 | | * | | — | | — |
Senior Executive Vice President | | 2004 | | 254,500 | | 190,000 | | * | | — | | — |
and Chief Operating Officer | | 2003 | | 235,000 | | 200,000 | | * | | — | | — |
| | | | | | |
Todd J. Kenner | | 2005 | | 250,000 | | 195,000 | | * | | — | | — |
President and National Service | | 2004 | | 217,500 | | 170,000 | | * | | — | | — |
Director | | 2003 | | 191,250 | | 150,000 | | * | | — | | — |
| | | | | | |
John S. Shearer | | 2005 | | 225,000 | | 135,000 | | * | | — | | — |
Executive Vice President and | | 2004 | | 216,250 | | 150,000 | | * | | — | | — |
National Service Director | | 2003 | | 201,250 | | 150,000 | | * | | — | | — |
| | | | | | |
Charles I. Homan | | 2005 | | 250,000 | | 140,000 | | * | | — | | — |
Executive Vice President and | | 2004 | | 237,500 | | 130,000 | | * | | 56,250 | | — |
National Service Director | | 2003 | | 227,500 | | 80,000 | | * | | — | | — |
| | | | | | |
Richard A. Wickett | | 2005 | | 119,000 | | — | | * | | — | | — |
Former Chairman of the Board | | 2004 | | 257,500 | | 190,000 | | * | | — | | — |
| | 2003 | | 250,000 | | 200,000 | | * | | — | | — |
| (1) | Annual bonus represent amount earned during the fiscal year. Actual cash payments may be made in a subsequent year. |
| (2) | Consists of matching payments under the 401(k), ESOP, and profit sharing plans of the PBSJ Employee Profit Sharing and Stock Ownership Plan and Trust, flex benefits and term life insurance premiums paid by us. Total value of perquisites and other personal benefits do not exceed $50,000 or 10% of the named executive officer’s reported annual salary. |
106
Director Compensation
All members of our Board of Directors, who are also executive officers of the Company, receive no additional remuneration for any services performed in the capacity of Director. Non-employee members of our Board of Directors are paid annual fees of $25,000 payable on a quarterly basis. In addition to the annual fees, each non-employee Director will receive $2,000 per day for each Board meeting and $1,000 per day for each committee meeting attended in person and $1,000 per day for each Board meeting and $750 per day for each committee meeting attended via teleconference. The Chairman of each committee receives an additional $3,000 per year, except the Audit Committee chair, who receives $5,000 per year. Non-employee Directors also receive $2,000 per year for attending the Company’s annual meeting of stockholders.
Compensation Committee Report on Executive Compensation
The Executive Compensation Committee (“the Committee”) of the Board of Directors consists of three non-employee directors; consisting of Messrs. Searcy (Chairperson), Pruitt and Stasiowski. The Executive Compensation Committee is responsible for establishing and administering the compensation policies and programs of all Company executive officers, including its Chief Executive Officer. The Committee ensures that levels of compensation for the Company’s executive officers are justifiable, have a reasonable relationship to performance, and integrate best-industry practices. The Committee reports on a regular basis to the Board of Directors on all compensation matters.
Executive Compensation Philosophy
The Company’s executive compensation program is designed to attract and retain talented executives to meet the Company’s short-term and long-term business objectives. In doing so, it aligns the Company’s executives’ interests with the interests of its shareholders by providing an adequate compensation package. This compensation package includes a base salary at a level comparable with industry best practices, relative to companies of the same size. In addition, the Company awards incentive bonuses which are linked to its performance, as well as to the individual executive officers’ performance. This package may also include long-term, stock based compensation to certain senior executives which is intended to align the performance of the Company’s senior executives with the Company’s long-term business strategies.
Base Salary
The base salary of executives is established by evaluating the range of responsibilities of the position and the impact it can have in meeting the strategic objectives of the Company. The established base salary is then benchmarked to comparable positions with that of industry best practices. Base salaries are adjusted to reflect the varying levels of position responsibilities and individual executive performance.
107
Incentive Bonus
At the beginning of each fiscal year, the Company assigns specific objectives which are aligned with the Company’s desired results for operations as well as the individual executive performance. In the case of senior executives, additional objectives are set to meet the strategic long-term objectives of the Company. Generally, incentive bonuses are paid in December after evaluating the results of the prior fiscal year.
Long-term, Stock Based Compensation
In order to attract, retain and motivate executive talent necessary to support the Company’s long-term business strategy, the Company may award certain senior executives with long-term, stock based compensation, which usually vests over a period not to exceed five years.
Post-employment Compensation
Additionally, the Company may award certain senior executives with post-employment retirement benefits, which may include “Supplemental Income Agreements” and “Consulting Agreements”.
108
ITEM 12.Security Ownership of Certain Beneficial Owners and Management and Related Stockholder Matters
The following table sets forth certain information with respect to the beneficial ownership of our common stock as of September 30, 2005 and (i) all persons who are known to us to be beneficial owners of five percent or more of the common shares, (ii) each of our Directors, (iii) the Named Officers and (iv) all current Directors and executive officers as a group.
| | | | | | |
Shareholder | | Shares of Common Stock Beneficially Owned | | | Percent of Class Beneficially Owned | |
The PBSJ Employee Profit Sharing and Stock Ownership Plan and Trust | | 3,613,252 | | | 51.5 | % |
Richard M. Grubel | | 33,706 | (1) | | * | |
Charles I. Homan | | 23,378 | (2) | | * | |
Todd J. Kenner | | 109,521 | (3) | | 1.6 | % |
Robert J. Paulsen | | 136,244 | (4) | | 1.9 | % |
William D. Pruitt(11) | | — | | | — | |
Becky S. Schaffer | | 13,999 | (5) | | * | |
Phillip E. Searcy(11) | | — | | | — | |
John S. Shearer | | 187,059 | (6) | | 2.7 | % |
Frank A. Stasiowski(11) | | — | | | — | |
John B. Zumwalt, III | | 185,194 | (7) | | 2.6 | % |
Donald J. Vrana | | — | | | — | |
Richard A. Wickett(12) | | 248,636 | (8) | | 3.5 | % |
Kathryn J. Wilson(13) | | 4,042 | (9) | | * | |
Named Officers and Directors collectively | | 1,019,034 | (10) | | 14.5 | % |
| * - | Represents less than 1% of class of beneficially owned shares |
| (1) - | Includes 12,681 shares owned via The PBSJ Employee Profit Sharing and Stock Ownership Plan and Trust |
| (2) - | Includes 1,378 shares owned via The PBSJ Employee Profit Sharing and Stock Ownership Plan and Trust |
| (3) - | Includes 13,646 shares owned via The PBSJ Employee Profit Sharing and Stock Ownership Plan and Trust |
| (4) - | Includes 26,544 shares owned via The PBSJ Employee Profit Sharing and Stock Ownership Plan and Trust |
| (5) - | Includes 3,375 shares owned via The PBSJ Employee Profit Sharing and Stock Ownership Plan and Trust |
| (6) - | Includes 21,769 shares owned via The PBSJ Employee Profit Sharing and Stock Ownership Plan and Trust |
| (7) - | Includes 94,961 shares owned via The PBSJ Employee Profit Sharing and Stock Ownership Plan and Trust |
| (8) - | Includes 156,029 shares owned via The PBSJ Employee Profit Sharing and Stock Ownership Plan and Trust |
| (9) - | Includes 448 shares owned via The PBSJ Employee Profit Sharing and Stock Ownership Plan and Trust |
| (10) - | Includes 347,251 shares owned via The PBSJ Employee Profit Sharing and Stock Ownership Plan and Trust |
| (11) - | Messrs. Pruitt,Searcy and Stasiowski are independent, non-employee members of the PBSJ Corporation Board of Directors. |
| (12) - | Mr. Wickett resigned his position as Chairman of the Board of Directors in January 2005 and resigned from the Board of Directors in June 2005. |
| (13) - | Mrs. Wilson resigned her position as Assistant Secretary and Treasurer in November 2005. |
109
ITEM 13.Certain Relationships and Related Transactions
We lease office space in a building which houses our Marietta, Georgia operations from BCE Properties, which is owned and controlled by James Belk. Mr. Belk is a former owner of Welker and a Vice-President and Project Director of ours. The lease was assumed in connection with our acquisition of Welker in March 2003. The rental cost of the space is $17,600 per month. On May 31, 2006, the lease expired and was not renewed. In June 2006, we moved our Marietta, Georgia operations to a new location.
We lease office space in a building which houses our Missoula, Montana operations from Cedar Enterprises, which is owned and controlled by Charlie K. Vandam. Mr. Vandam is a former owner of LWC and a Senior Program Manager of ours. The lease was assumed in connection with our acquisition of LWC in February 2005. The rental cost of the space is $9,500 per month.
We lease office space in a building which houses our Helena, Montana operations from Prickly Pear Enterprises, which is owned and controlled by Paul Callahan. Mr. Callahan is a former owner of LWC and a Vice-President and Senior Division Manager of ours. The lease was assumed in connection with our acquisition of LWC in February 2005. The rental cost of the space is $1,800 per month.
ITEM 14.Principal Accountant Fees and Services
The following table presents fees paid for services rendered by our current principal accountants, Deloitte & Touche LLP, and our former principal accountant PricewaterhouseCoopers LLP, with respect to the Company’s last two fiscal years:
| | | | | | |
| | | Year ended September 30, 2005 |
Type of Services | | Deloitte & Touche LLP | | PricewaterhouseCoopers LLP |
Audit fees | | | 213,650 | | | 24,500 |
Audit-related fees | | | 4,500 | | | 157,564 |
Tax fees | | | — | | | — |
All other fees | | | 284,161 | | | — |
| | | | | | |
Total | | $ | 502,311 | | $ | 182,064 |
| | | | | | |
| | | | | | |
| | | Year ended September 30, 2004 |
Type of Services | | Deloitte & Touche LLP | | PricewaterhouseCoopers LLP |
Audit fees | | | — | | | 231,959 |
Audit-related fees | | | — | | | 25,000 |
Tax fees | | | — | | | 63,500 |
All other fees | | | — | | | 34,500 |
| | | | | | |
Total | | $ | — | | $ | 354,959 |
| | | | | | |
Audit services include the audit of our annual financial statements, reviews of our quarterly financial information. Audit-related services include the audit of employee benefit plans, assistance in understanding and applying financial and accounting standards, and other services related to readiness preparation with Section 404 of the Sarbanes-Oxley Act. Tax services are tax planning, tax compliance services and tax return preparation. All other fees include audit procedures for Statements of Direct Labor, Fringe Benefits and General Overhead and Breakeven Multiplier Calculations.
110
Audit Committee Policies and Procedures for Pre-approval of Audit and Non-Audit Services
Consistent with SEC policies regarding auditor independence, the CAC is responsible for pre-approving all audit and non-audit services provided to us or our subsidiaries by our independent registered public accounting firm. During fiscal 2005, the CAC pre-approved all services provided by Deloitte & Touche LLP and PricewaterhouseCoopers LLP.
Auditor Independence
The Audit Committee has considered whether the provision of the non-audit services described above is compatible with maintaining the independence of Deloitte & Touche LLP and PricewaterhouseCoopers LLP and determined that the provision of such services was compatible with maintaining such independence.
111
PART IV
ITEM 15.Exhibits and Financial Statement Schedules
The following is a list of financial information filed as a part of this Annual Report:
| | 1. | Consolidated Financial Statements - The following financial statements of The PBSJ Corporation and its subsidiaries are contained in Item 8 of this Form 10-K: |
| | a) | Report of Deloitte & Touche LLP, Independent Registered Public Accounting Firm. |
| | b) | Report of PricewaterhouseCoopers LLP, Independent Registered Certified Public Accounting Firm. |
| | c) | Consolidated Balance Sheets at September 30, 2005 and 2004. |
| | d) | Consolidated Statements of Operations for each of the three years in the period ended September 30, 2005. |
| | e) | Consolidated Statements of Stockholders’ Equity and comprehensive income at September 30, 2005, 2004 and 2003. |
| | f) | Consolidated Statements of Cash Flows for each of the three years in the period ended September 30, 2005. |
| | g) | Notes to the Consolidated Financial Statements. |
| | 2. | Financial Statement Schedules - The financial statement schedule information is included as part of the Notes to Consolidated Financial Statements contained in Item 8 of this Form 10-K. |
| | 3. | A list of exhibits to this Annual Report is set forth in the Exhibit Index appearing elsewhere in this Annual Report and is incorporated herein by reference. |
112
SIGNATURES
Pursuant to the requirements of Section 13 or 15(d) of the Securities Exchange Act of 1934, the Registrant has duly caused this Annual Report to be signed on its behalf by the undersigned, thereunto duly authorized.
| | | | | | |
| | | | The PBSJ Corporation |
| | | |
| Date: | | January 26, 2007 | | | | /s/ Donald J. Vrana |
| | | | | | Donald J. Vrana |
| | | | | | Senior Vice President and |
| | | | | | Chief Financial Officer |
Pursuant to the requirements of the Securities Exchange Act of 1934, this Annual Report has been signed below by the following persons on behalf of The PBSJ Corporation.
| | | | | | |
| Date: | | January 26, 2007 | | | | /s/ John B. Zumwalt III |
| | | | | | John B. Zumwalt III |
| | | | | | Chairman of the Board and |
| | | | | | Chief Executive Officer |
| | | |
| Date: | | January 26, 2007 | | | | /s/ Donald J. Vrana |
| | | | | | Donald J. Vrana |
| | | | | | Senior Vice President and |
| | | | | | Chief Financial Officer |
| | | |
| Date: | | January 26, 2007 | | | | /s/ Robert J. Paulsen |
| | | | | | Robert J. Paulsen |
| | | | | | Director, Executive Vice |
| | | | | | President, Secretary and Vice |
| | | | | | Chairman of the Board |
| | | |
| Date: | | January 26, 2007 | | | | /s/ Todd J. Kenner |
| | | | | | Todd J. Kenner |
| | | | | | Director and President |
| | | |
| Date: | | January 26, 2007 | | | | /s/ John S. Shearer |
| | | | | | John S. Shearer |
| | | | | | Director and Senior Vice |
| | | | | | President |
| | | |
| Date: | | January 26, 2007 | | | | /s/ William D. Pruitt |
| | | | | | William D. Pruitt |
| | | | | | Director |
| | | |
| Date: | | January 26, 2007 | | | | /s/ Phillip E. Searcy |
| | | | | | Phillip E. Searcy |
| | | | | | Director |
| | | |
| Date: | | January 26, 2007 | | | | /s/ Frank A. Stasiowski |
| | | | | | Frank A. Stasiowski |
| | | | | | Director |
113
Exhibit Index
| | |
Exhibit
Number | | Description |
| 3.1 | | Articles of Incorporation, as amended.(1) |
| |
| 3.2 | | Amended and Restated Bylaws.(1)(4)(6) |
| |
| 4.1 | | Form of Specimen Stock Certificate.(1) |
| |
| 10.1 | | The PBSJ Employee Profit Sharing and Stock Ownership Plan and Trust, amended and restated, dated February 22, 2002.(2)(3) |
| |
| 10.1(a) | | Promissory Note previously filed as Exhibit 10.1 in Form 10-Q dated May 15, 2001; Promissory note, dated March 19, 2001, between Suntrust Bank, a Georgia corporation, and Post, Buckley, Schuh & Jernigan, Inc., the Registrant’s subsidiary. |
| |
| 10.2 | | Supplemental Income Plan effective as of January 12, 1988, as amended September 27, 1995.(1) |
| |
| 10.2(a) | | Mortgage Security Agreement previously filed as Exhibit 10.2 in Form 10-Q dated May 15, 2001; Agreement, dated March 19, 2001, between Suntrust Bank, a Georgia corporation, and Post Buckley, Schuh & Jernigan, Inc., the Registrant’s subsidiary, as amended on December 10, 2003.(4) |
| |
| 10.3 | | Consulting/Supplemental Retirement/Death Benefits Agreement, dated November 6, 1987, between the Registrant and H. Michael Dye, as amended on October 16, 1989, August 21, 1991, March 1, 1993, February 6, 1995, May 19, 1998, November 22, 1999 and January 2, 2002.(1) |
| |
| 10.3(a) | | ISDA Master Agreement previously filed as Exhibit 10.3 in Form 10-Q dated May 15, 2001; Agreement, dated March 8, 2001, between Suntrust Bank and Post Buckley, Schuh & Jernigan, Inc., the Registrant’s subsidiary.(4) |
| |
| 10.4 | | Supplemental Retirement/Death Benefits Agreement, dated December 17, 1987, between the Registrant and Robert J. Paulsen, as amended January 1, 2002 and January 1, 2004.(1) |
| |
| 10.4(a) | | Schedule to the ISDA Master Agreement previously filed as Exhibit 10.4 in Form 10-Q dated May 15, 2001; Agreement, dated March 8, 2001, between Suntrust Bank and Post Buckley, Schuh & Jernigan, Inc., the Registrant’s subsidiary. |
| |
| 10.5 | | Supplemental Income Agreement, dated as of July 29, 1996, between the Registrant and Robert J. Paulsen(1) |
| |
| 10.5(a) | | Confirmation of Interest Rate Transaction previously filed as Exhibit 10.5 in Form 10-Q dated May 15, 2001; Confirmation, dated March 9, 2001, between Suntrust Bank and Post Buckley, Schuh & Jernigan, Inc., the Registrant’s subsidiary.(4) |
| |
| 10.6 | | Employment/Retirement Benefits Agreement, dated February 15, 1999, between the Registrant and William W. Randolph.(1) |
| |
| 10.7 | | Supplemental Retirement/Death Benefits Agreement, dated December 17, 1987, between the Registrant and Richard A. Wickett, as amended on April 27, 1989, May 19, 1998, November 22, 1999 and January 2, 2002.(1) |
| |
| 10.8 | | Supplemental Retirement/Death Benefits Agreement dated December 17, 1987, between the Registrant and John B. Zumwalt, III, as amended on May 19, 1998, November 22, 1999, January 2, 2002 and January 1, 2004.(1) |
| |
| 10.9 | | Agreement, dated as of April 1, 1993, between the Registrant and John B. Zumwalt, III(1) |
| |
| 10.10 | | Split-Dollar Life Insurance Agreement dated February 1, 1999, by and between The Randolph Insurance Trust and the Registrant.(1) |
| |
| 10.11 | | Credit Agreement, dated as of June 28, 1996, by and among Nationsbank, N.A., Suntrust Bank, Miami, N.A., Post, Buckley, Schuh and Jernigan, Inc., The PBSJ Corporation, and the subsidiaries named therein, as amended on July 3, 1997, June 30, 1999, June 30, 2002 and May 6, 2003.(1)(4) |
| |
| 10.12 | | Lease Agreement, dated as of March 25, 1998, by and between Post, Buckley, Schuh & Jernigan, Inc. and Highwoods/Florida Holdings L.P. as successor in interest to Cypress-Tampa II L.P., as amended on May 26, 1998, December 26, 1998, November 29, 1999, March 1, 2000 and July 1, 2003.(1)(4) |
| |
| 10.13 | | Employment Agreement dated December 17, 1987, between the Registrant and Donald J. Vrana.(5) |
| |
| 10.14 | | The PBSJ Corporation Stock Ownership Plan.(2) |
114
| | |
| |
| 10.15 | | Lease agreement, dated as of May 30, 2000, by and between Post, Buckley, Schuh & Jernigan, Inc. and RREEF American Reit Corp. G as amended on August 12, 2002 and February 19, 2003.(4) |
| |
| 10.16 | | Amendment No. 2 to Amended and Restated Credit Agreement, dated June 27, 2005, by and among Bank of America, N.A., The PBSJ Corporation, and the subsidiaries named therein, as amended May 5, 2003 and June 30, 2002.(5) |
| |
| 10.17 | | Key Employee Supplemental Option Plan effective as of July 23, 2002, as amended August 1, 2003.(6) |
| |
| 10.18 | | Agreement, dated as of April 1, 1993, between the Registrant and John S. Shearer.(6) |
| |
| 10.19 | | Amendment to Supplemental Income Retirement Agreement, dated January 1, 2000, between the Registrant and Todd J. Kenner. (6) |
| |
| 10.20 | | Key Employee Supplemental Income Program Agreement, dated January 1, 2004, between the Registrant and Todd J. Kenner. (6) |
| |
| 10.21 | | Supplemental Retirement/Death Benefits Agreement, dated September 24, 1986, between the Registrant and Phillip E. Searcy, as amended on April 17, 1989, October 18, 1993, February 6, 1995 and May 8, 2000.(6) |
| |
| 10.22 | | Agreement, dated April 1, 2005, between the Registrant and Rosario Licata.(6) |
| |
| 10.23 | | Agreement, dated April 22, 2005, between the Registrant and William Scott DeLoach.(6) |
| |
| 10.24 | | Agreement, dated November 23, 2005, between the Registrant and Maria Marietta Garcia.(6) |
| |
| 10.25 | | Non-Negotiable Promissory Note, dated February 23, 2006, between the Registrant and Kathryn J. Wilson.(6) |
| |
| 10.26 | | Non-Negotiable Promissory Note, dated February 23, 2006, between the Registrant and Richard A. Wickett.(6) |
| |
| 10.27 | | Tolling Agreement, dated March 16, 2006, between the Registrant and Kathryn J. Wilson.(6) |
| |
| 10.28 | | Tolling Agreement, dated March 16, 2006, between the Registrant and Richard A. Wickett.(6) |
| |
| 21 | | Subsidiaries. (1) |
| |
| 31.1 | | Chief Executive Officer Certification Pursuant to 18 U.S.C. Section 1350, as adopted pursuant to Section 302 of the Sarbanes-Oxley Act of 2002.(6) |
| |
| 31.2 | | Chief Financial Officer Certification Pursuant to 18 U.S.C. Section 1350, as adopted pursuant to Section 302 of the Sarbanes-Oxley Act of 2002.(6) |
| |
| 32.1 | | Chief Executive Officer Certification and Chief Financial Officer Certification Pursuant to 18 U.S.C. Section 1350, as adopted pursuant to Section 906 of the Sarbanes-Oxley Act of 2002.(6) |
| |
| 99.3 | | Code of Ethics that applies to the Principal Executive Officer, Principal Financial Officer, Principal Operations Officer and Principal Accounting Officer Pursuant to 18 U.S.C. Section 1350, as adopted pursuant to Section 406 of the Sarbanes-Oxley Act of 2002.(4) |
| (1) | Previously filed with the Registration Statement on Form 10 filed with the Commission on June 27, 2000. |
| (2) | Previously filed with the Amended Registration Statement on Form 10A filed with the Commission on September 26, 2000. |
| (3) | Previously filed with the Form 10-Q in a prior period. |
| (4) | Previously filed with the Form 10-K in a prior period. |
| (5) | Previously filed with the Form 8-K in a prior period. |
115