UNITED STATES
SECURITIES AND EXCHANGE COMMISSION
Washington, D.C. 20549
FORM 10-K
ANNUAL REPORT PURSUANT TO SECTION 13 OR 15(d) OF
THE SECURITIES EXCHANGE ACT OF 1934
For the fiscal year ended September 30, 2008
Commission File Number 0-30911
THE PBSJ CORPORATION
(Exact name of Registrant as specified in its charter)
| | |
| Florida | | 59-1494168 |
(State or other jurisdiction of
Incorporation or organization) | | (I.R.S. Employer
Identification No.) |
5300 West Cypress Street, Suite 200
Tampa, Florida 33607
(Address of principal executive offices)
(813) 282-7275
(Registrant’s telephone number, including area code)
Securities registered pursuant to Section 12(b) of the Act: None
Securities registered pursuant to Section 12(g) of the Act:
Common Stock, Class A ($.00067 Par Value)
(Title of class)
Indicate by check mark if the registrant is a well-known seasoned issuer, as defined in Rule 405 of the Securities Act. ¨ Yes x No
Indicate by check mark if the registrant is not required to file reports pursuant to Section 13 or Section 15(d) of the Act. ¨ Yes x No
Indicate by check mark whether the registrant (1) has filed all reports required to be filed by Section 13 or 15(d) of the Securities Exchange Act of 1934 during the preceding 12 months (or for such shorter period that the registrant was required to file such reports), and (2) has been subject to such filings for the past 90 days. x Yes ¨ No
Indicate by check mark if disclosure of delinquent filers pursuant to Item 405 of Regulation S-K (§229.405 of this chapter) is not contained herein, and will not be contained, to the best of the registrant’s knowledge, in definitive proxy or information statements incorporated by reference in Part III of this Form 10-K or any amendment of this Form 10-K. ¨
Indicate by check mark whether the registrant is a large accelerated filer, an accelerated filer, a non-accelerated filer, or a smaller reporting company. See definition of “large accelerated filer,” “accelerated filer” and “smaller reporting company” in Rule 12b-2 of the Exchange Act. (Check one):
| | |
| ¨ Large accelerated filer | | ¨ Accelerated filer |
| x Non-accelerated filer (Do not check if a smaller reporting company) | | ¨ Smaller reporting company |
Indicate by check mark whether the registrant is a shell company (as defined by Rule 12b-2 of the Act). ¨ Yes x No
The aggregate value of the voting stock held by non-affiliates of the registrant based on the $29.68 price for the registrant’s Common Stock on March 31, 2008 was. Directors, executive officers and 10% or greater shareholders are considered affiliates for purposes of this calculation but should not necessarily be deemed affiliates for any other purpose. There is no public trading market for the registrant’s common stock.
As of November 30, 2008, there were 5,805,792 shares of Common Stock Class A, $.00067 par value per share, outstanding.
Documents Incorporated by Reference:
Portions of our Proxy Statement, to be mailed to shareholders on or about December 29, 2008 for the Annual Meeting to be held on January 24, 2009, are incorporated by reference in Part III hereof.
THE PBSJ CORPORATION
Form 10-K
For the Year Ended September 30, 2008
Table of Contents
2
CAUTIONARY NOTE REGARDING FORWARD-LOOKING STATEMENTS
This Annual Report and the information incorporated by reference in it include and are based on “forward-looking statements” within the meaning of Section 27A of the Securities Act of 1933 and Section 21E of the Securities Exchange Act of 1934. We intend these forward-looking statements to be covered by the safe harbor provisions for forward-looking statements in these sections. These statements can sometimes be identified by the fact that they do not relate strictly to historical or current facts and they frequently are accompanied by words such as “may,” “will,” “anticipate,” “estimate,” “expect,” “believes”, “could”, “would”, “should”, “plans” or “intend” and similar terms and expressions. Examples of forward looking statements include all statements regarding our expected financial position and operating results including backlog, our business strategy, our financing plans and forecasted demographic and economic trends relating to our industry, and all statements relating to our ability to be awarded government contracts, the adoption of certain laws by Congress, our ability to compete effectively with other firms that provide similar services, our ability to attract and retain clients, our ability to achieve future growth and success, our expectations for the public and private sector economic growth, and the outcome of the various on-going government investigations. These forward-looking statements involve known and unknown risks, uncertainties and other factors that may cause our actual results, performance or achievements to be materially different from the results, performance or achievements expressed or implied by the forward-looking statements. We cannot assure you that our expectations in such forward-looking statements will turn out to be correct. Factors that may impact such forward-looking statements include, among others, our ability to attract additional business, the timing of projects and the potential for contract cancellation by our customers, our ability to attract and retain skilled employees, our ability to comply with new laws and regulations, our insurance coverage covering certain events, the timing and amount of the spending bills adopted by the federal government and the states, the outcome of the investigation by the Federal Election Commission, timely billings to our customers and delays in collections of accounts receivable, risks of competition, changes in general economic conditions and interest rates, the risk that the Internal Revenue Service or the courts may not accept the amount or nature of one or more items of deduction, loss, income or gain we report for tax purposes and the possible outcome of pending litigation, legal proceedings and governmental investigations and our actions in connection with such litigation, proceedings and investigations, as well as certain other risks including those set forth under the heading “Risk Factors” and elsewhere in this Annual Report and in other reports filed by the us with the Securities and Exchange Commission. All forward-looking statements included herein are only made as of the date of such statements are made, and we do not undertake any obligation to update or revise publicly any forward-looking statements, whether as a result of new information, future events or otherwise. Subsequent written and oral forward-looking statements attributable to us or to persons acting on our behalf are qualified in their entirety by reference to the cautionary statements set forth above and elsewhere in this Annual Report and in other reports filed by us with the Securities and Exchange Commission.
3
PART I
General
The PBSJ Corporation, together with its subsidiaries, is an employee-owned professional services organization that provides a broad range of planning, design and construction services to a variety of public and private sector clients. Our four major business segments are transportation services, environmental services, civil engineering and construction management, representing 42.4%, 21.0%, 26.6%, and 10.0%, respectively, of our engineering fees for the fiscal year ended September 30, 2008. We utilize our expertise in engineering, planning, management, environmental, architectural and surveying disciplines to address complex problems in each of these basic service areas. We provide these services through our staff of approximately 3,800 professional, technical and support personnel. We believe our multi-disciplinary approach to problems facilitates our ability to effectively meet the needs of our clients.
Since our founding in 1960, we have grown from a small civil engineering practice with operations only in South Florida to a national design firm offering a full range of engineering, construction management, architectural and planning services throughout the United States and in the Middle East. In 2008,Engineering News-Record ranked Post, Buckley, Schuh & Jernigan, Inc., our subsidiary, twenty-ninth on its list of the top 500 engineering consulting firms and fifth on its list of the top 500 pure design firms (traditional design firms with no construction capability) in the United States, based on design revenue. During fiscal year 2008, we provided services to approximately 3,000 clients in the public and private sectors. In fiscal year 2008, we derived approximately 74% of our engineering fees from the public sector and about 26% from the private sector.
We have built an organization composed of highly skilled professionals and top-level technical and administrative personnel with a wide variety of scientific, engineering, architectural and management resources. These resources enable us to develop and implement innovative long-term solutions to our client’s complex problems, many of which are the subject of public concern and extensive governmental regulation. We assist our clients in responding to these concerns, in obtaining governmental permits and approvals and in complying with applicable laws and regulations.
We began operations on February 29, 1960. Our holding company, The PBSJ Corporation, was incorporated in 1973. We engage in business primarily through three wholly-owned subsidiaries: Post, Buckley, Schuh & Jernigan, Inc. (PBS&J Inc.), a Florida corporation (through which we provide the majority of our engineering, architectural and planning services), PBS&J Construction Services, Inc., a Florida corporation (through which we have certain large contracts for our construction management services), and PBS&J International, Inc., a Florida Company (through which we provide engineering, architectural and planning services international markets). In addition, we have three other active subsidiaries: Seminole Development Corporation and Seminole Development II, Inc. (through which we hold title to certain of our real property) PBS&J Constructors, Inc. (through which we perform design-build projects) and one consolidated affiliate, PBS&J Caribe Engineering, C.S.P. (through which we perform certain work in Puerto Rico). In this Form 10-K, all references to “PBSJ”, the “Company”, “us”, “we” or “our” operations refer to The PBSJ Corporation, its subsidiaries and affiliate and the activities of these entities on a consolidated basis. Our executive offices are located at 5300 West Cypress Street, Suite 200, Tampa, Florida.
Misappropriation Loss
In March 2005, subsequent to the issuance of our 2004 financial statements, we discovered misappropriations of our funds by our former Chief Financial Officer and two former employees who worked in our information systems and treasury departments, which we collectively refer to as the participants. The participants colluded and circumvented controls to misappropriate funds and conceal the misappropriations possibly beginning as early as 1993 until the misappropriations were discovered.
4
An investigation revealed that at least $36.6 million was misappropriated between January 1, 1998 and the discovery of the misappropriations in March 2005. We have not discovered and do not expect to discover any additional misappropriations, and therefore, we have not recorded any misappropriation losses for fiscal years 2008 and 2007. The amount misappropriated prior to January 1, 1998 could not be determined because certain data for the period prior to January 1, 1998 was unavailable.
We determined that the misappropriation scheme led to the overstatement of overhead rates that we used to determine billings in connection with certain of our government contracts. As a result, some of our government clients were overcharged for our services. During the review of the overhead rate calculations, we identified certain instances of costs erroneously included in our overhead cost pool which were unallowable under applicable regulations and an error in our calculation of our overhead rate, which related to certain general and administrative costs. Additionally, we determined that the unallowable costs and general and administrative errors also led to the overstatement of overhead rates that we used in connection with certain government contracts.
The Audit Committee, at the direction of the Corporate Board of Directors, disclosed the overstatement of our overhead rate to our clients and other appropriate government agencies, including the Department of Justice, or DOJ. We have entered into settlement agreements with most of our clients and government agencies. We are in discussions with our remaining government clients to enter into settlement agreements in order to satisfy any refund obligations, which are in various stages of settlement. At September 30, 2008 the balance in accrued reimbursement liability was $2.2 million, and this amount is expected to be settled in fiscal year 2009.
We filed a claim under our annual crime policy for policy period ended April 30, 2005, which we refer to as the 2005 Policy, to recover some of the misappropriation losses resulting from the embezzlement. In January 2007, we received $2.0 million, the stated limit under the 2005 Policy. The insurance proceeds were recognized in insurance proceeds and gain on recoveries, net of misappropriation loss in the accompanying consolidated statement of operations for the year ended September 30, 2007. In August 2007, we filed suit against our insurance carrier seeking a declaration that the insurance carrier is obligated to us for losses suffered as a result of the embezzlement for policy years 1991 through 2004. We seek an aggregate recovery in an amount equal to $17 million for such years. In August 2008, our initial motion for summary judgment was denied by the court. We have filed a notice of appeal in September 2008. At the present time, we are unable to predict the likely outcome of this legal action and accordingly have not recorded any insurance receivable.
In October 2007, the Federal Election Commission advised us that it was commencing an investigation into alleged violations of the Federal Election Campaign Act of 1971, as amended, based on alleged improper campaign contributions including improper use of political action committees. We have produced documents and other information to the Commission and fully cooperated with the authorities. We are currently unable to predict the outcome of this investigation.
Acquisitions
Throughout our history, we have made strategic acquisitions. Once we acquire a firm, it is integrated and consolidated into our existing operations and ceases to exist as a separate operating entity. We completed the following acquisitions during the last three fiscal years. The results of operations of the acquired business are included in the consolidated financial statements from the date of acquisition.
| | • | | On April 30, 2006, we acquired 100% of the stock of EIP Associates, which we refer to as EIP, for $6.0 million, net of cash acquired of approximately $15,000, composed of $5.5 million in cash, approximately $334,000 accrued additional purchase price and $200,000 held in escrow. The purchase price was allocated to the respective assets and liabilities based on their estimated fair values as of the acquisition date. The allocation of the purchase price resulted in assets of $9.0 million, including $1.5 million of intangible assets and $3.7 million of goodwill and liabilities of $3.9 million. EIP |
5
| | specializes in environmental, urban planning, water resource planning and natural resources in California. The EIP acquisition enhances our technical strength in the California environmental, water and planning markets and enhances our general presence in California. |
| | • | | On February 29, 2008, we acquired 100% of the stock of EcoScience Corporation, which we refer to as EcoScience, for $2.25 million, composed of $2.0 million in cash, 6,750 shares of the Company’s common stock, Class A valued at approximately $200,000 and $50,000 cash held in escrow. The purchase price was allocated to the respective assets and liabilities based on their estimated fair values as of the acquisition date. The allocation of the purchase price resulted in assets of $2.8 million, including approximately $790,000 of intangible assets and $1.4 million of goodwill and liabilities of approximately $593,000. EcoScience specializes in the preparation of ecological assessments and environmental impact statements, endangered species determinations, wetland delineations, storm water master planning, hydrologic and hydraulic engineering and surface or groundwater modeling primarily in North Carolina, South Carolina and the Southeast region of the U.S. EcoScience enhances our technical strength in environmental, water and planning markets and solidifies our general presence in the Southeast. |
The primary factor resulting in the recognition of goodwill in these acquisitions is the intellectual capital of the skilled professionals and senior technical personnel associated with the acquired entities which does not meet the criteria for recognition as an asset apart from goodwill. The results of operations of the above acquisitions are included from the date of acquisition. The pro forma impact of these acquisitions is not material to reported historical operations.
On December 15, 2008, the Company entered into a Stock Purchase Agreement among Judy Mitchell, John R. Stewart and Eduardo Vargas (collectively, the “Sellers”), pursuant to which the Company agreed to purchase all of the issued and outstanding shares of capital stock of Peter R. Brown Construction, Inc. (“Peter Brown”), a Florida corporation, for an aggregate purchase price of $16.0 million, subject to adjustment as provided therein. The Purchase Price will consist of (i) $12.0 million in cash and (ii) $4.0 million of restricted shares of the Company’s Class A common stock, par value $0.00067 per share, to be issued pursuant to the Company’s 2008 Employee Restricted Stock Plan. The closing is expected to take place on or about December 31, 2008. The aggregate number of shares of restricted stock to be issued to the Sellers will be based on the per share price of the Company’s Class A Common Stock as of September 30, 2008.
Business Segments
In fiscal year 2008, we restructured our internal organization to better leverage our technical capabilities in servicing the needs of our clients which resulted in a change in the composition of our reportable segments. Under the new structure, we will continue to provide segment information on four reportable segments: Transportation Services, Construction Management, Civil Engineering, and Environmental Services. Subsets of the Construction Management segment have been realigned in the Civil Engineering and Transportation Services segments. Accordingly, we have reclassified segment information for prior periods presented, as applicable, to confirm to the current reportable segment structure. We continue to evaluate performance based on operating income (loss) of the respective operating segment. The discussion that follows is a summary analysis of the primary changes in operating results by reportable segment for the years ended September 30, 2008, 2007 and 2006.
6
The following table sets forth our engineering fees from each of our four reportable segments for each of the three years ended September 30, 2008, 2007, and 2006, after restructuring, and the approximate percentage of our total engineering fees attributable to each reportable segment:
| | | | | | | | | | | | | | | |
| | | 2008 | | 2007 | | 2006 |
| (Dollars in thousands) | | Revenues | | % | | Revenues | | % | | Revenues | | % |
Transportation Services | | $ | 261,775 | | 42 | | $ | 232,600 | | 40 | | $ | 205,951 | | 38 |
Environmental Services | | | 129,910 | | 21 | | | 128,108 | | 22 | | | 108,748 | | 20 |
Civil Engineering | | | 164,177 | | 27 | | | 162,959 | | 28 | | | 140,683 | | 26 |
Construction Management | | | 62,083 | | 10 | | | 57,798 | | 10 | | | 81,860 | | 15 |
| | | | | | | | | | | | | | | |
Totals | | $ | 617,945 | | | | $ | 581,465 | | | | $ | 537,242 | | |
| | | | | | | | | | | | | | | |
Additional information concerning segment results of operations and financial information is set forth in Item 7 under the caption entitled “Management’s Discussion and Analysis of Financial Condition and Results of Operations” and in Item 8, Note 14 of “Notes to Consolidated Financial Statements” which are included herein.
Transportation Services
Industry Overview
During fiscal year 2008, the transportation industry rebounded slightly from some of the sluggishness it experienced in fiscal year 2007. Many state departments of transportation continued to experience funding shortfalls in conjunction with escalating prices in the construction arena. The industry experienced a slight upturn in aviation and transit funding while user-fee (toll road) projects continued strong growth nationally. Privatization continued to gain national focus with the news of several highly visible deals in Chicago and Texas.
Our Services
The Transportation Services segment provides services such as planning, traffic engineering, intelligent transportation systems, or ITS, corridor planning, highway design, structural design, alternate project delivery, program management, toll facility design, aviation services, multi-modal/transit systems and right-of-way.
We currently serve transportation departments in 18 states, and we perform toll services in 9 states for both public and private toll clients.
During fiscal year 2008, significant projects in the Transportation Services segment included:
| | • | | Program management and construction management services for the 7.4-mile light rail transit starter line for Hampton Roads Transit in Norfolk, Virginia. This project is currently under construction and scheduled for completion in 2011. |
| | • | | A $5 million work program for Florida’s Turnpike Enterprise. The contract is shared with another consultant for the five-year term. |
| | • | | Consulting with the Harris County (Texas) Toll Road Authority to analyze existing and proposed tolling concepts and make recommendations for improvements to increase throughput within the 103-mile system. |
| | • | | On-call professional services to the North Carolina Turnpike Authority relating to planning, developing, constructing, operating, and maintaining up to nine toll roads throughout the state. The most advanced of the nine projects, the Triangle Expressway, is located in Raleigh and is expected to start construction in 2008 and open to traffic in 2010. |
| | • | | Construction management services to the North Texas Tollway Authority, or NTTA, for Section 30 of the President George Bush Turnpike Eastern Extension, or PGBTEE, a $121 million construction |
7
| | contract. We also will provide construction management oversight services for the entire PGBTEE corridor and support to the NTTA’s Program Management Office in the form of production management, scheduling, utility coordination, and construction management services. |
| | • | | Project management and coordination of project development activities for the Texas Department of Transportation, or TxDOT, for State Highway 99, Grand Parkway corridor. |
| | • | | Expansion of Terminal D at the George Bush Intercontinental Airport in Houston. This airport improvement program will upgrade and expand the current international facilities to accommodate anticipated growth in international traffic over the next 10 years. The anticipated project scope includes code compliance and upgrades; upgrades to baggage handling system capacity; new and reconfigured aircraft gates to meet requirements; utility infrastructure upgrades; the addition of a new concourse; and upgrades to the international airside. |
| | • | | Serving as General Consultant for the Okaloosa County, Florida Airports System, which includes Okaloosa Regional Airport, Bob Sikes Airport, and Destin-Ft. Walton Beach Airport. Since our first assignment in 1996, we have completed a variety of projects involving airside civil, landside civil, terminal architecture, master planning, permitting, and environmental assessments in support of the capital improvement programs at each of the county’s three airports. |
| | • | | On-call systems operations and intelligent transportation system services for the Virginia Department of Transportation in two key regions of the state. This work is performed as a subconsultant to Iteris, Inc. |
| | • | | Design services related to closed circuit television, dynamic message signs, reversible lane signal systems and traffic signing for the new National Football League stadium being built in Arlington, Texas. We will also be designing an interactive voice response system with traveler information. |
| | • | | Engineering services for the ongoing load rating of bridge structures statewide for the Georgia Department of Transportation. Our services will include initial ratings of existing and new structures, revisions to existing ratings based on inspection findings, ratings of complex structures, preparation of repair/strengthening details and plans to address load capacity deficiencies, development of rating tools for special cases, complex structures, and routing operations; and preparation of procedures and manuals. |
| | • | | Design of a new multi-level interchange which connects the Lee Roy Selmon Crosstown Expressway to Interstate 4. The new interchange will improve traffic flow between these two major corridors and allow for a truck-exclusive access into the Port of Tampa. The design of this project includes a complex interchange and an elevated viaduct segment and represents one of the largest projects ever undertaken by the Florida Department of Transportation. |
Environmental Services
Industry Overview
Over the past thirty-five years, significant environmental laws at the federal, state, and local levels have been enacted in response to public concern over the health of the nation’s air, water, and natural resources. Those laws and their implementation through regulation affect numerous industrial and governmental actions and have been a key market driver for the Environmental Services business segment.
Two significant federal environmental laws, The Safe Drinking Water Act of 1974 and the Clean Water Act of 1972, continue to drive this segment of our business. Pursuant to these laws, Congress has allocated funds to assist state and local governments. According to the Environmental Protection Agency, as much as $23 billion a year will be needed for construction and upgrade of water and wastewater treatment facilities over the next 20 years.
8
The Environmental Services business segment, through its two operating segments, Environmental Sciences and Water, focuses on the delivery of planning, design and construction management services for private and public sector clients.
Our Services
The Environmental Services business segment focuses on the delivery of planning, permitting, and compliance services for private and public sector clients related to:
| | |
| Air Quality Management | | Ecosystem Restoration |
| Aquatic Treatment Systems | | Community and Regional Planning |
| Flood Studies | | Environmental Toxicology Analysis |
| Energy Planning | | Hazardous and Solid Waste Management |
| Cultural Resources Assessments | | Water and Wastewater Distribution and Collection Systems |
| Ecological Studies | | Water and Wastewater Treatment |
| Environmental Planning Studies | | Water Supply |
| National Environmental Policy Act | | |
During fiscal year 2008, significant projects in the Environmental Services business segment included:
| | • | | A multi-year joint venture with the U.S. Army Corps of Engineers for program management support activities on the federal portion of the Comprehensive Everglades Restoration Project, or CERP. The joint venture contract is for three years with provisions for up to five renewal periods. The CERP is budgeted to cost over $8 billion and the cost is to be shared equally between the federal government and state and local agencies. |
| | • | | Cultural resources investigations at surface mines located across north, north-central and northeast Texas. This work has included Phase I archaeological surveys, Phase II National Register testing, and Phase III mitigation. The work has been conducted to satisfy the requirements of Section 106 of the National Historic Preservation Act and the Coal Mining Regulations of the Railroad Commission of Texas. |
| | • | | Wetlands mitigation bank project that will restore, enhance, and protect approximately 19,000 acres of wetlands, upland long-leaf pine forests, and mixed pine-hardwood forests. Located in East Texas along the Neches River, the project spans Angelina, Polk, and Tyler counties and will create a protected corridor between the Davy Crockett National Forest and the Angelina National Forest. |
| | • | | Design and construction of improvements to the Little Patuxent Water Reclamation Plant in Howard County, MD that expand treatment capacity to 29 million gallons per day, improve treatment performance to achieve enhanced nutrient removal, and to treat a significant organic waste load from a large industrial discharge. |
| | • | | Improvements and expansion of the Potomac Water Filtration Plant, or WFP, for the Washington Suburban Sanitary Commission. The Potomac WFP provides drinking water for more than one million people in Montgomery and Prince George’s Counties, Maryland. We have been retained to design and manage the construction of the improvements necessary to enhance water quality, increase process reliability, and expand plant capacity to 288 million gallons per day. This project will be the largest ultraviolet disinfection facility in the United States. |
Civil Engineering
Industry Overview
During fiscal 2008, the contraction of the residential housing market that began in 2006 continued and accelerated, reducing housing starts to levels not seen since the early 1980s. In the wake of the general liquidity crisis triggered by the losses suffered by major financial institutions, the impact of the economic downturn has
9
spread to commercial development and the remainder of the private sector. The downturn has also affected states and municipalities, since tax revenues are declining. These events have caused a sharp decline in the domestic market for traditional civil engineering, architecture, planning and survey work.
Certain international markets, particularly the Middle East, have benefitted from high oil prices and remained strong through fiscal 2008, as did the energy industry domestically. Federal spending has also remained strong, especially in the Department of Defense, or DOD, and related areas. Our investment in positioning the Company to provide services to these markets has helped us to perform reasonably well despite unfavorable market conditions elsewhere. Military planning, military housing and DOD design/build alternative project delivery contracting continue to provide many opportunities.
We anticipate that the president-elect’s administration will move aggressively to stimulate the economy by various means, including much-needed investment in infrastructure that should benefit our industry over the longer term. However, we believe that recovery will not come quickly enough to produce growth in private sector engineering markets during 2009. We believe that the commercial real estate market, which has not been severely affected by the economy as yet, will likely struggle over the next two years. The recent decline in oil prices will impact the Middle East and other international markets in the short term, although the duration is unclear. State and local government market will remain weak until tax revenues improve. Near term expectations for the Federal market, however, are still very positive.
Our Services
The Civil Engineering segment provides engineering, planning, architecture and surveying as well as specialized services to public and private clients. Included in these services are site engineering and surveys, infrastructure engineering, land planning, landscape architecture, mechanical and electrical engineering, coastal and port design, master planning, disaster mitigation planning and response, infrastructure protection, asset management, information solutions, emergency management and evacuation planning.
The Civil Engineering segment will continue to focus its portfolio strategy to balance the public and private sectors with emphasis on the Federal, entertainment and hospitality, education and energy markets. National defense, disaster mitigation, response and emergency management continue to be a key public sector market. Our architecture practice continues to focus heavily on the sustainability market and the Leadership in Energy and Environmental Design, or LEED, certified design. We rely on project-specific experience, exceptional client service and advanced technologies for competitive advantage and to distinguish us from our competition. These technologies include Building Information Modeling, Geodata/Geographic Information Systems, database design and development, global positioning systems, high definition survey technology and advanced data collection systems including laser-based imaging and measurement, three dimensional imaging, and application of web collaboration tools.
During fiscal year 2008, significant projects in the Civil Engineering segment included:
| | • | | A new land and E Ticket attraction at Universal’s Islands of Adventure, which includes a new dark ride, re-theming of existing rides and new construction of retail and restaurant venues in the Lost Continent area. We provided architectural design and planning services. |
| | • | | The Fort Belvoir Base Realignment and Closure, or BRAC, 2005 Program Integration, a joint venture with another architecture and engineering firm, to plan the redevelopment of Fort Belvoir, GA. Responsibilities include site selection for major BRAC projects, master planning, transportation planning and overall integration of the implementation effort. |
| | • | | The Everglades Partners Joint Venture, a joint venture with another major engineering firm, to provide programmatic support to the Jacksonville District of the Army Corps of Engineers in its South Florida Ecosystem Restoration Program. This project has a potential term of twelve years and includes planning, project management, scheduling, scientific analysis, and fiscal and reporting management. |
10
| | • | | Military family housing projects at Bolling, Langley, Randolph, Goodfellow and Laughlin Air Force Bases. This five-year privatization project includes the design, construction operation and management of over 2,000 housing units, supporting the commitment of our government to provide more modern and comfortable housing for military personnel. |
| | • | | A new Warner Brothers theme park located in Abu Dhabi, involving architectural design, engineering and construction administration services. |
| | • | | Participation in a program management team assisting the Army Corps of Engineers, New Orleans District with New Orleans Area Hurricane Protection Measures in a five-year project. |
| | • | | Planning and design projects for Florida Power and Light and Duquesne Light and geothermal engineering studies at mines in Arizona, all part of the Company’s growing energy practice. |
| | • | | Architecture and engineering services for the new fitness center at Tyndall Air Force Base in North Florida. Incorporating numerous energy savings and sustainable features, the center is one of only two existing energy demonstration projects for the U.S. Air Force. |
| | • | | Comprehensive architectural and permitting services to Publix Super Markets, Inc. locations. The Company has assisted Publix with its renovation and expansion program since 1998. |
| | • | | Architectural services for a new seven-story, 80,000 square foot office complex for Hayes County Government Complex in San Marcos, Texas. |
| | • | | Architectural programming, concept planning, funding and appropriations coordination, contract administration, and construction oversight for the New Orlando-Orange County Expressway Authority Headquarters Building in Orlando, Florida. |
| | • | | Architectural services using Building Information Modeling for the Student Success Center at Texas A&M University, Laredo Campus. The project included the 98,000 square foot student service center, 20,000 square foot adjacent warehouse and 300-space parking lot. |
| | • | | Program management and design services for the Warrior in Transition Program for the U.S. Army. The project included area development guides, three dimensional modeling and animated flyover perspectives for 32 military installations. |
Construction Management
Industry Overview
The demand for our construction management services continues to be strong due to both legislative and industry trends. These trends should continue due to the large infrastructure projects throughout the United States, which are subject to increasingly complex governmental regulations. The market should continue to be fairly stable due to the proposed continuation of Federal Transportation Act that was passed in 2005. Additionally, we anticipate that domestic military spending should continue to be stable, and possibly slightly increase through 2008 and into 2009 with additional opportunities for the construction management business sector.
The role of the construction manager has become increasingly important to the success of these projects, requiring a new level of versatility and a wide range of skills. Both public and private sector entities are under pressure to complete these projects at accelerated schedules, resulting in a myriad of project delivery systems. With limited in-house staff, these entities must rely on experienced construction managers to complete projects on time and within budget.
Our Services
The Construction Management segment provides a wide range of services as an agent for our clients, including construction and program management, contract administration, inspection, field-testing, scheduling
11
and estimating, project controls and quality assessment services. Although we do not self-perform construction or build any projects, we may act as the program director of a project whereby, on behalf of the owner of the project, we provide scheduling, cost estimating and construction observation services for the project, or our services may be limited to providing construction consulting.
During fiscal year 2008, significant projects in the Construction Management segment included:
| | • | | Construction engineering and inspection services to the Departments of Transportation in Alabama, California, Colorado, Nevada, Florida, Georgia, North Carolina and Mississippi, as well as to various municipalities such as Cobb County Water & Sewer Department, Georgia; Collier County, Florida; Douglas County, Colorado; Fulton County, Georgia, Maricopa County, Arizona; San Diego County, California; and Clark County, Nevada. |
| | • | | Construction management services to Phoenix Valley Metro Rail, light rail transit project in Phoenix, Arizona and program management for light rail construction including design oversight to the Hampton Roads Sanitation District Hampton Roads Transit project in Norfolk, Virginia. |
| | • | | Construction management and administration services to clients such as the Clark County, Nevada, Department of Public Works, the City of Oceanside, California, the City of Dana Pointe, California and the City of Henderson, Nevada Public Works Department. |
| | • | | Construction-related services to AT&T throughout Florida and Georgia, including quality assurance inspections, verification of contractors’ invoices, damage inspections and responding to natural disasters. |
| | • | | Construction management, administration and inspection services nationally to the National Park Service and Federal Highway Administration’s Central Lands Division for the Hoover Dam Bypass Project. |
| | • | | Construction management, administration and inspection services to Los Angeles World Airport on its new baggage handling facility. |
Clients
Through our four national business segments, we provide our services to a broad range of clients, including state, local and municipal agencies, the federal government and private sector businesses. Our state and local government clients include numerous state departments of transportation, water utilities, local power generators, waste water treatment agencies, environmental protection agencies, schools and colleges, law enforcement agencies, judiciary, hospitals and other healthcare providers. During fiscal year 2008, we provided services to federal agencies, including the Army Corps of Engineers, Environmental Protection Agency, or EPA, Navy, Air Force, Coast Guard, United States Postal Service, Federal Emergency Management Administration, or FEMA, National Parks Service, and Department of Energy and local entities. Our contracts with federal, state and local entities are subject to various methods of determining fees and costs. See “Contract Pricing and Terms of Engagement” for further discussion of our pricing arrangements with governmental clients.
Our private sector clients include retail and commercial, entertainment, railroad, petro-chemical, food, telecommunications, oil and gas, power, semi-conductor, transportation, technology, public utility, mining and forest products entities. The table below indicates the revenue generated, by client type, for each of the three years ended September 30, 2008, 2007, and 2006.
| | | | | | | | | | | | | | | |
| | | Fiscal 2008 | | Fiscal 2007 | | Fiscal 2006 |
| (Dollars in thousands) | | Revenue | | % | | Revenue | | % | | Revenue | | % |
State and local agencies | | $ | 427,482 | | 69 | | $ | 395,396 | | 68 | | $ | 376,069 | | 70 |
Federal agencies | | | 29,501 | | 5 | | | 40,703 | | 7 | | | 26,862 | | 5 |
Private businesses | | | 160,962 | | 26 | | | 145,366 | | 25 | | | 134,311 | | 25 |
| | | | | | | | | | | | | | | |
Total | | $ | 617,945 | | | | $ | 581,465 | | | | $ | 537,242 | | |
| | | | | | | | | | | | | | | |
12
In fiscal year 2008, we derived approximately 18% of our engineering fees from various districts and departments of the FDOT (approximately 15% of total engineering fees) and the TxDOT (approximately 3% of total engineering fees) under numerous contracts. While we believe the loss of any individual contract would not have a material adverse effect on our results of operations and would not adversely impact our ability to continue work under our other contracts with these clients, the loss of all, or a significant portion of our contracts with either the FDOT or the TxDOT contracts would cause a material decrease in our revenues and profits and therefore have a material adverse effect on our results of operations. We do not believe that the impact of the misappropriations and the related accrued reimbursement liability will have a material adverse effect on our existing client relationships.
Marketing
Marketing activities are conducted by key operating and executive personnel, including specifically assigned business development personnel, as well as through professional personnel who develop and maintain new and existing client relationships. Our continued ability to compete successfully in the areas in which we do business is largely dependent upon aggressive marketing, the development of information regarding client requirements, the submission of responsive cost-effective proposals and the successful completion of contracts. Information concerning private and governmental requirements is obtained, during the course of contract performance, from formal and informal briefings, from participation in activities of professional organizations, and from literature published by the government and other organizations.
Contract Pricing and Terms of Engagement
We earn our revenues for the various types of services we provide through cost-plus, time-and-materials, fixed price contracts, and contracts which combine any of these methods.
Cost-Plus Contracts. Under our cost-plus contracts, we charge clients negotiated indirect rates based on direct and indirect costs in addition to a profit component. We recognize engineering fees at the time services are performed. The amount of revenue is based on our actual labor costs incurred plus a recovery of indirect costs and a profit component. In negotiating cost-plus contracts, we estimate direct labor costs and indirect costs and then add a profit component, which is a percentage of total recoverable costs, to arrive at a total dollar value for the contract. Indirect expenses are recorded as incurred and are allocated to contracts. If the actual labor costs incurred are less than estimated, the revenues from a project will be less than estimated. If the actual labor costs incurred plus a recovery of indirect costs and profit exceed the initial negotiated total contract amount, we must obtain a contract modification to receive payment for such overage. If a contract modification or change order is not approved by our client, we may be able to pursue a claim to receive payment. Engineering fees from claims are recognized when collected. For each of fiscal year 2008 and 2007, approximately 40% and 23%, respectively, of our revenues were earned from cost-plus contracts, primarily with state and local government agencies.
Our contracts with governmental entities, once executed, are not subject to renegotiation of profits at the election of the government; however, the governmental entity may elect to discontinue funding. If a governmental client elects to discontinue funding a project, our fees for work completed are generally protected because our contracts often provide that we receive periodic payments throughout the course of the project.
Time-and-Materials Contracts. Under our time-and-materials contracts, we negotiate hourly billing rates and charge our clients based on actual time expended. In addition, clients reimburse us for our actual out-of-pocket costs of materials and other direct incidental expenditures incurred in connection with performing the contract. Our profit margins on time-and-materials contracts fluctuate based on actual labor and overhead costs directly charged or allocated to contracts compared with negotiated billing rates. During each of fiscal year 2008 and 2007, approximately 34% and 47%, respectively, of our revenues were earned from time-and-materials contracts, primarily with federal, state and local agencies, as well as some private sector clients.
13
Fixed-Price Contracts. Under our fixed-price contracts, clients pay us an agreed sum negotiated in advance for the specified scope of work. Under fixed-price contracts, there are no payment adjustments if we over-estimate or under-estimate the number of labor hours required to complete the project, unless there is a change of scope in the work to be performed. Accordingly, our profit margin will increase to the extent the labor hours and other costs are below the contracted amounts. The profit margin will decrease and we may realize a loss on a project if the number of labor hours required or other costs exceed the estimate. During fiscal years 2008 and 2007, approximately 26% and 30%, respectively, of our revenues were earned from fixed-price contracts, primarily with private sector clients.
Competition
We face active competition in all areas of our business. As we provide a wide array of engineering, architectural, planning and construction management services to companies in various industries throughout the United States, we encounter a different group of competitors in each of our markets. Our competitors include (1) national and regional design firms like us that provide a wide range of design services to clients in all industries, (2) industry specific firms that provide design as well as other services to customers in a specific industry or disciplines, and (3) local firms that provide some or all of our services in one of our markets. Some of our competitors are larger, more diversified firms having substantially greater financial resources and larger professional and technical staffs than ours. Competition for major contracts is frequently intense and may entail public submittals and multiple presentations by numerous firms seeking to be awarded the contract. The extent of competition we will encounter in the future will vary depending on changing customer requirements in terms of types of projects and technological developments. It has been our experience that the principal competitive factors for the type of service business in which we engage are a firm’s demonstrated ability to perform certain types of projects, the client’s own previous experience with competing firms, the firm’s size and financial condition and the cost of the particular proposal.
No firm dominates a significant portion of the sectors in which we compete. Given the expanding demand for some of the services we provide, it is likely that additional competitors will emerge. At the same time, consolidation continues to occur in certain of the sub-segments of the industry in the United States, including the environmental-focused firms.
We believe that we will retain the ability to compete effectively with other firms that provide similar services by continuing to offer a broad range of high-quality environmental, transportation, engineering and construction management services through our network of offices. Among other things, the wide range of expertise, which we possess, permits us to remain competitive in obtaining government contracts despite shifts in governmental spending emphasis. Our multi-disciplinary capabilities enable us to compete more effectively for clients whose projects require that the expertise of professionals in a number of different disciplines be utilized in the problem solving effort. We believe that our ability to offer our services over a large part of the United States is a positive factor in enabling us to attract and retain clients who have a need for our services in different parts of the country.
Backlog
Our backlog for services was estimated to be $673.3 million and $557.5 million as of September 30, 2008 and 2007, respectively. We define backlog as contracted task orders less previously recognized revenue on such task orders. U.S. government agencies, and many state and local governmental agencies, operate under annual fiscal appropriations and fund various contracts only on an incremental basis. Our ability to realize revenues from our backlog depends on the availability of funding for various federal, state and local government agencies. We expect to realize approximately $448.7 million of this backlog during the fiscal year ending September 30, 2009.
14
A majority of our customer orders or contract awards and additions to contracts previously awarded are received or occur periodically during the year and may have varying periods of performance. The comparison of backlog amounts on the same date in successive years is not necessarily indicative of trends in our business or future revenues.
Because our business is dependent upon the reputation and experience of our personnel and adequate staffing, a reasonable backlog is important for the scheduling of operations and for the maintenance of a fully-staffed level of operations.
The following table presents the total backlog for services by reportable segment:
| | | | | | |
| | | September 30, |
| (Dollars in thousands) | | 2008 | | 2007 |
Transportation Services | | $ | 311,901 | | $ | 261,176 |
Environmental Services | | | 119,470 | | | 117,646 |
Civil Engineering | | | 151,747 | | | 82,823 |
Construction Management | | | 90,220 | | | 95,862 |
| | | | | | |
Total | | $ | 673,338 | | $ | 557,507 |
| | | | | | |
Regulation
Compliance with federal, state and local regulations, which have been enacted or adopted, including those relating to the protection of the environment, is not expected to have any material effect upon our capital expenditures, earnings and competitive position.
Personnel
We employed approximately 3,800 employees at September 30, 2008. Most of our employees are professional or technical personnel having specialized training and skills, including engineers, architects, analysts, scientists, management specialists, technical writers and skilled technicians. Although many of our personnel are highly specialized in certain areas, and while there is a nationwide shortage of certain qualified technical personnel, we are not currently experiencing any significant difficulty in obtaining the personnel we require to perform under our contracts. We believe that our future growth and success will depend, in large part, upon our continued ability to attract and retain highly qualified personnel.
Liabilities and Insurance
When we perform services for our clients, we may become liable for failure to meet the applicable standard of care in providing professional services, breach of contract, personal injury and property damage. Such claims could include improper or negligent performance or design and failure to meet specifications. Additionally, if a client were to make a claim against a subcontractor on a project for which we are the prime contractor, we would be liable if the subcontractor was not adequately insured or not financially able to settle the claim. Our clients often require us to contractually indemnify them for damage or personal injury to the client, third parties and their property and for fines and penalties caused by our negligence. Because our projects are typically large enough to affect the lives of many people, the potential damages to a client or third parties are potentially large and could include punitive and consequential damages. For example, our transportation projects involve services that affect not only our client, but also many end-users of those services.
To protect the Company from potential liability we maintain a full range of insurance coverage, including workers’ compensation, commercial general liability (which includes property coverage), commercial automobile, and professional liability (which includes pollution coverage). Our professional liability coverage is
15
on a “claims-made basis” meaning the coverage applies to claims made during a policy year regardless of when the causative action took place. All other coverage is “occurrence-basis” meaning that the policy in place when the injury or damage occurred is the policy that responds regardless of when the claim is made. Our professional liability limits per policy year are $45 million with a per claim deductible of $125,000 plus an annual aggregate retention of $3 million. This coverage would also cover the Company for a claim against a subcontractor of the Company. Based on our experience with claims and lawsuits we believe that the current levels of coverage are adequate in all cases. A successful catastrophic claim or aggregate of several large claims in amounts in excess of our insurance coverage’s in any policy year could have a material adverse effect on our financial position and results of operations.
Available Information
A copy of this Annual Report on Form 10-K, as well as our Quarterly Reports on Form 10-Q, Current Reports on Form 8-K and any amendments to those reports filed or furnished pursuant to Section 13 or 15(d) of the Securities and Exchange Act of 1934, are available free of charge on the Internet at the SEC’s web site at www.sec.gov. Our reports filed with the SEC may be read or copied at the SEC’s Public Reference Room at 100 F Street, NE, Washington, D.C. 20549. Information on the operation of the SEC’s Public Reference Room may be obtained by calling the SEC at 10800-SEC-0330.
16
In addition to the factors discussed elsewhere in Item 1, Item 7 and Item 7A, and the notes to the consolidated financial statements, the following risks and uncertainties could materially adversely affect our business, financial condition, and results of operations. Additional risks and uncertainties not presently known to us or that we currently deem immaterial also may impair our business operations and financial condition.
Certain Risks Related to Our Marketplace and Our Operations
We are involved in litigation, legal proceedings and governmental investigations, which could have a material adverse effect on our profitability and financial position.
We are involved in litigation, legal proceedings and governmental investigations that are significant and described in detail in Item 3 “Legal Proceedings”. Any such litigation, proceedings or investigations could have a material adverse effect on our profitability and financial position if decided adversely.
Downturns in the financial markets, like the present financial market downturn, and reduced federal, state and local government budget spending could cause a reduction in our revenues, operating results and liquidity.
Downturns in the financial markets, like the present financial market downturn, can impact the capital expenditures of our clients. During fiscal 2008 the contraction of the residential housing market that began in 2006 continued and accelerated, reducing housing starts to levels not seen since the early 1980s. In the wake of the general liquidity crisis triggered by the losses suffered by major financial institutions, the impact of the economic downturn spread to commercial development and the remainder of the private sector. These events have caused a sharp decline in many of the services we provide, including traditional civil engineering, architecture, planning and survey work.
Adverse economic conditions may decrease our clients’ willingness to make capital expenditures or otherwise reduce their spending to purchase our services, which could result in diminished revenues and margins for our business. In addition, adverse economic conditions could alter the overall mix of services that our clients seek to purchase, and increased competition during a period of economic decline could force us to accept contract terms that are less favorable to us than we might be able to negotiate under other circumstances. Changes in our mix of services or a less favorable contracting environment may cause our revenues and margins to decline. Moreover, our customers may experience difficult business climates from time-to-time and could delay or fail to pay our fees as a result. If a customer failed to pay a significant outstanding fee, our financial results and liquidity could be adversely affected. In addition, given the recent market turmoil and tightening of credit, our clients may have difficulty in obtaining financing, which may result in cancellations of projects or deferral of projects to a later date. Such cancellations or deferrals could result in decreased demand for our services and could materially adversely affect our revenue, operating results and liquidity.
The demand for our government related services is contingent upon the level of government funding for new and existing infrastructure projects. As such, government funding is dependent upon policy objectives being in line with infrastructure needs. In addition, in times of economic downturns our government clients may have less tax revenues for infrastructure projects. For example the present economic downturn has affected states and municipalities, since tax revenues are declining across the board. Any shift in policy away from the capital expenditure initiatives we work on or economic declines which reduce tax revenues or the availability of financing could result in decreased demand for our services and could materially adversely affect our revenue, operating results and liquidity.
The uncertainty of large-scale projects during times of economic declines makes it particularly difficult to predict whether and when we will receive a contract award or when an existing contract may be canceled. The uncertainty of contract award timing and cancelations can present difficulties in matching our workforce size with our contract needs. If an expected contract award is delayed or not received or an existing contract is canceled, we could incur costs resulting from reductions in staff or redundancy of facilities that would have a materially adversely affect our revenue, operating results and liquidity.
17
Additionally, the current downturn in the financial markets could make it more costly for the Company to obtain financing for the Company’s operations or investments and reduce the availability of capital.
We operate in a highly competitive market. If we are unable to offer competitive services, our revenues, operating results and liquidity may be adversely affected.
We have numerous competitors in the various marketplaces in which we operate. Our competitors range from large diversified firms having substantially greater financial resources and a larger technical staff than us, to smaller more specialized, low cost structure niche firms. It is not possible to estimate the extent of competition which our present or future activities will encounter because of changing competitive conditions, customer requirements, technological developments, political environments and other factors.
We continue to see significant price competition and customer demand for higher service completion levels. There is also significant price competition in the marketplace for federal, state, and local government contracts as a result of budget issues, political pressure and other factors beyond our control. Our operating results could be negatively impacted should we be unable to achieve the revenue growth necessary to sustain profitable operating margins within our service lines.
Pending or future governmental audits could result in findings which require downward adjustments of our revenue; and, under certain circumstances, could cause us to incur significant liabilities and could impair or disqualify us from obtaining future contracts.
We are party to numerous contracts with federal, state and other government agencies, which require strict compliance with applicable laws, regulations, standards and contractual requirements. Federal and many state agencies routinely conduct various types of audits of their contracts. In some cases, the agencies conducting these audits review and report instances of fraud, internal control deficiencies, and violations of regulations or provisions of the contract.
If these audits identify costs which have been incorrectly charged or billed, either directly or indirectly, to government contracts, the government agencies may not reimburse us for these costs, or if we have already been reimbursed, we may be required to refund these reimbursements.
Our internal controls may not prevent or detect specific isolated or deceitful violations of applicable laws, regulations, standards or contractual requirements. If we fail to comply with the terms of one or more of our government contracts or governmental statutes and regulations, or if any of our companies or employees are indicted or convicted on criminal charges (including misdemeanors) relating to any of our government contracts, in addition to any civil or criminal penalties and costs we may incur, we could be suspended or debarred from government contracting activities for a period of time. Some federal and state statutes and regulations provide for automatic debarment in certain circumstances, such as upon a conviction for a violation. The suspension or debarment in any particular case may be limited to the facility, contract or subsidiary involved in the violation or could be applied to all of our companies if the circumstances were deemed severe enough. Even a narrow suspension or debarment could result in negative publicity that could adversely affect our ability to renew contracts and to secure new contracts, both with governments and private customers, which could materially and adversely affect our business and results of operations.
We derive a significant portion of our engineering fees from a few clients, and the loss of these clients could have a material adverse impact on our financial performance.
In fiscal year 2008, we derived approximately 18% of our engineering fees from various districts and departments of the FDOT and the TxDOT under numerous contracts. The loss of all or a significant portion of our contracts with either the FDOT or the TxDOT contracts or a significant portion of our contracts with either of these clients would have a material adverse effect on our results of operations, resulting from a material decrease in our engineering fees and profits.
18
Our backlog is subject to cancellation and unexpected adjustments, which could have a negative impact on future revenues, operating results and liquidity.
We cannot assure that the revenues projected in our backlog will be realized or, if realized, will result in profits. Projects may remain in our backlog for an extended period of time prior to project execution and, once project execution begins, it may occur unevenly over the current and multiple future periods. In addition, our ability to earn revenues from our backlog depends on the availability of funding from various federal, state, and local government agencies. Most of our contracts have termination for convenience provisions which allow the client to terminate the contract [on short notice]. Therefore, project terminations, suspensions or reductions in scope may occur from time-to-time with respect to contracts reflected in our backlog would cause a reduction in our backlog, and adversely affect future revenues, operating results and liquidity.
If we are unable to accurately estimate the revenues, costs, time and resources on our contractual commitments, we may incur a lower profit or loss on the contract.
We generally earn revenue for the services we provide through three principal types of contracts: cost-plus, time-and-materials, and fixed price contracts. All of these contracts require estimates, which if ultimately incorrect, would lead to lower profits or losses on such contract. Cost-plus contracts are usually subject to negotiated ceiling amounts, and limit the recovery of certain specified indirect costs. If we underestimate our costs, and our costs exceed the contract ceiling amount, we may not be reimbursed for such costs. Under fixed price contracts, we receive a fixed sum negotiated in advance, regardless of actual costs incurred. If we set up the price based on underestimated costs for the specified scope of work, we may experience significant over-runs and negatively impact profit margin or realize a loss on the contract. Under fixed price contracts, we bear the inherent risk that actual performance cost may exceed the contract price. Under time-and-materials contracts, we negotiate hourly billing rates and charge our clients based on actual time expended. However, because our actual labor and overhead costs directly charged or allocated to such contracts may exceed the negotiated billing rates, even under time-and-materials contracts we run the risk that if we underestimate our total contract costs when we determine our negotiated billing rates, we may not be able to recover these costs from our client, and the project may not be profitable for us.
If we are unable to retain and recruit highly qualified personnel to fulfill our contractual obligations, our business may be adversely affected.
Our employees are our most valuable resource. Many of our technical personnel are highly specialized in their respective disciplines. Since we derive substantially all of our engineering fees from services performed by our professional staff, our failure to retain and attract professional staff could negatively impact our ability to complete our projects and secure new contracts.
Failure to meet the covenants of our existing revolving credit facility could result in the loss of use of our available line of credit.
Failure to meet any of the covenant terms of our existing revolving credit facility could result in an event of default. If an event of default occurs, and we are unable to receive a waiver of default, our lender may increase our borrowing costs, restrict our ability to obtain additional borrowings, accelerate all amounts outstanding or enforce their interest against all collateral pledged. In the past, we have obtained written waivers of default from our lender, but we may not be able to obtain any necessary waivers in the future. In addition, we can not declare dividends or incur additional debt without written approval from our lender, which could significantly restrict our ability to raise additional capital. Our inability to raise additional capital could lead to a working capital deficit that could have a materially adverse effect on our operations in future periods.
We may not be successful in growing through acquisitions or integrating effectively and efficiently any businesses and operations we may acquire.
Our success depends on our ability to continually enhance and broaden our service offerings in response to changing customer demands, technology, and competitive pressures. Numerous mergers and acquisitions in our
19
industry have resulted in a group of larger firms that offer a full complement of single-source services including studies, design, engineering, procurement, construction, operations, maintenance and, in some instances, facility ownership. To remain competitive, we may acquire new and complementary businesses to expand our portfolio of services, add value to the projects undertaken for clients or enhance our capital strength. We do not know if we will be able to complete any future acquisitions or whether we will be able to successfully integrate any acquired businesses, operate them profitably, or retain their key employees.
Even if we do identify suitable acquisition candidates, we anticipate significant competition when trying to acquire these candidates, and we may not be able to acquire such candidates at reasonable prices or on favorable terms. Some of the competing buyers may be stronger financially than we are. As a result of this competition, we may not succeed in acquiring suitable candidates or may have to pay more than we would prefer to make an acquisition. If we cannot identify or successfully acquire suitable acquisition candidates, we may not be able to successfully expand our operations. Further, we may not be able to generate sufficient cash flow from an acquisition to service any indebtedness incurred to finance such acquisitions or realize any other anticipated benefits and our profitability may not improve as a result of any one or more acquisitions. Any acquisition may involve operating risks, such as:
| | • | | the difficulty of assimilating the acquired operations and personnel and integrating them into our current business; |
| | • | | the potential disruption of our ongoing business; |
| | • | | the diversion of management’s attention and other resources; |
| | • | | the possible inability of management to maintain uniform standards, controls, procedures and policies; |
| | • | | the risks of entering markets in which we have little or no experience; |
| | • | | the potential impairment of relationships with employees; |
| | • | | the possibility that any liabilities we may incur or assume may prove to be more burdensome than anticipated; and |
| | • | | the possibility that any acquired firms do not perform as expected. |
Our inability to enforce non-competition agreements with former principals and key management of the businesses we acquire may adversely affect our operating results, cash flows and liquidity.
In connection with our acquisitions, we generally require that key management and the former principals of the businesses we acquire enter into non-competition agreements in our favor. The laws of each state differ concerning the enforceability of non-competition agreements. Generally, state courts will examine all of the facts and circumstances at the time a party seeks to enforce a non-competition agreement; consequently, we cannot predict with certainty whether, if challenged, a court will enforce any particular non-competition agreement. If one or more former principals or members of key management of the businesses we acquire leave us and the courts refuse to enforce the non-compete agreement entered into by such person or persons, we might be subject to increased competition, which could materially and adversely affect our operating results, cash flows and liquidity.
We may be unable to obtain sufficient bonding capacity to support certain service offerings and the need for performance and surety bonds may impact our ability to win projects and reduce our availability under our credit facility.
Some of our contracts require performance and surety bonds particularly in connection with our construction at risk projects. Bonding capacity in the infrastructure industry has become increasingly difficult to obtain, and bonding companies are denying or restricting coverage to an increasing number of contractors. Companies that have been successful in renewing or obtaining coverage have sometimes been required to post
20
additional collateral to secure the same amount of bonds which reduces availability under our credit facility. We may not be able to maintain a sufficient level of bonding capacity in the future, which could preclude us from being able to bid for certain contracts and successfully contract with certain client. In addition, even if we are able to successfully renew or obtain performance or payment bonds in the future, we may be required to post letters of credit in connection with the bonds which would reduce availability under our credit facility.
Most of our contracts may be canceled on short notice, so our revenue is not guaranteed.
Most of our contracts are cancelable on short notice even if we are not in default under the contract. Many of our contracts, including our service agreements, are periodically open to public bid. We may not be the successful bidder on our existing contracts that are re-bid. We also provide a significant portion of our services on a non-recurring, project-by-project basis. We could experience a reduction in our results of operations, cash flows and liquidity if:
| | • | | our clients cancel a significant number of contracts; |
| | • | | we fail to win a significant number of our existing contracts upon re-bid; or |
| | • | | we complete the required work under a significant number of our non-recurring projects and cannot replace them with similar projects. |
Our subcontractors may fail to satisfy their obligations to us or other parties, or we may be unable to maintain these relationships, either of which may have a material adverse affect our results of operations, cash flows and liquidity.
We depend on subcontractors to complete some of the work on some of our projects. There is a risk that we may have disputes with subcontractors arising from, among other things, the quality and timeliness of work performed by the subcontractor, customer concerns about the subcontractor or our failure to extend existing task orders or issue new task orders under a subcontract. In addition, if any of our subcontractors fail to deliver on a timely basis the agreed-upon services, then our ability to fulfill our obligations as a prime contractor may be jeopardized. In addition, the absence of qualified subcontractors with whom we have a satisfactory relationship could adversely affect the quality of our service and our ability to perform under some of our contracts. Any of these factors may have a material adverse effect on our results of operations, cash flows and liquidity.
Our financial results are based, in part, upon estimates and assumptions that may differ from actual results.
In preparing our consolidated financial statements in conformity with accounting principles generally accepted in the United States, a number of estimates and assumptions are made by management that affect the amounts reported in the financial statements. These estimates and assumptions must be made because certain information that is used in the preparation of our financial statements is either dependent on future events or cannot be calculated with a high degree of precision from data available. In some cases, these estimates are particularly uncertain and we must exercise significant judgment. Estimates are primarily used in our assessment of revenue recognition, allowance for doubtful accounts, accrued self insurance claims, valuation of goodwill and intangible assets, income taxes (including net deferred tax assets) and other contingencies and litigation. Actual results could differ materially from the estimates and assumptions that we use, which could have a material adverse effect on our results of operations, cash flows and liquidity.
Percentage-of-completion accounting used for our fixed price contracts can result in overstated or understated profits or losses and variations of actual results from our assumptions could reduce our profitability
The revenue for our fixed price contracts is accounted for on the percentage-of-completion method of accounting. This method of accounting requires us to calculate revenues and profit to be recognized in each reporting period for each project based on our predictions of future outcomes, including our estimates of the total cost to complete the project, project schedule and completion date, the percentage of the project that is completed and the amounts of any probable unapproved change orders. Our failure to accurately estimate these often subjective factors could result in overstated or understated profit or losses for certain contracts. Contract revenue
21
and total cost estimates are reviewed and revised periodically as the work progresses. Adjustments are reflected in contract revenue in the fiscal period when such estimates are revised. Estimates are based on management’s reasonable assumptions and experience, but are only estimates. Variation of actual results from estimates on a large project or on a number of smaller projects could be material. We immediately recognize the full amount of the estimated loss on a contract when our estimates indicate such a loss. Such adjustments and accrued losses could result in reduced profitability in the period in which such loss is identified which could negatively impact our liquidity.
Rising inflation, interest rates and/or construction costs could reduce the demand for our services as well as decrease our profit on our existing contracts, in particular with respect to our fixed price contracts.
Because a significant portion of our revenues is earned from cost-plus contracts and fixed price contracts, as well as contracts that base significant financial incentives on our ability to keep costs down, we bear some or all of the risk of rising inflation with respect to those contracts. In addition, rising inflation, interest rates and/or construction costs could reduce the demand for our services. Furthermore, if we expand our business into markets and geographic areas where fixed price work is more prevalent, inflation may have a larger impact on our results of operations in the future. Therefore, increases in inflation, interest rates and/or construction costs could have a material adverse impact on our business and financial results.
Our projects may result in liability for faulty engineering services.
Because our projects are often large and can affect many people, our failure to make judgments and recommendations in accordance with applicable professional standards could result in large damages and, perhaps, punitive damages. For example, our transportation projects involve services that affect not only our client, but also many end users of those services. Additionally, if a client were to make a claim against a subcontractor on a project for which we are the prime contractor, we would be liable if the subcontractor was not adequately insured or not financially able to settle the claim. Our clients often require us to contractually indemnify them for damage or personal injury to the client, third parties and their property and for fines and penalties caused by our negligence. Because our projects are typically large enough to affect the lives of many people, the potential damages to a client or third parties are potentially large and could include punitive and consequential damages.
We are self-insured against many potential liabilities.
Although we maintain insurance policies with respect to general liability, workers’ compensation and employee health coverage, those policies are subject to high deductibles, and we are self-insured up to the amount of the deductible. Since most claims against us do not exceed the deductibles under our insurance policies, we are effectively self-insured for substantially all claims. We actuarially determine any liabilities for unpaid claims and associated expenses, including incurred but not reported losses, and reflect those liabilities in our balance sheet as other current and non-current liabilities. The determination of such claims and expenses and the appropriateness of the liability is reviewed and updated quarterly. However, insurance liabilities are difficult to assess and estimate due to the many relevant factors, the effects of which are often unknown, including the severity of an injury, the determination of our liability in proportion to other parties, the number of incidents not reported and the effectiveness of our safety program. If our insurance claims increase or costs exceed our estimates of insurance liabilities, we could experience a decline in profitability and liquidity.
Certain Risks Related to Owning Our Stock
Because no public market exists for our stock, and we are not required to redeem stock held by our shareholders even upon retirement or other termination of employment, the ability of our shareholders to sell their common stock is limited.
There is no public market for our common stock. In order to provide some liquidity to our shareholders, we have historically maintained a limited annual stock offering period, which we call the stock window. The stock
22
window has permitted existing shareholders to offer their shares for sale back to us during a predetermined period at a price determined by an appraisal. Although the stock window is intended to provide some liquidity to shareholders, the aggregate number of shares offered for sale during the stock window may be greater than the aggregate number of shares sought to be purchased by authorized buyers. As a result, sell orders may be prorated, and shareholders may not be able to sell all of the shares they desire to sell during the stock window. In addition, we are not required to redeem stock held by our shareholders upon retirement or other termination of employment. Accordingly, shareholders may not be able to sell their stock even if they retire or otherwise leave the company. Additionally, the retirement of significant shareholders, such as that which may occur over the next five years as a result the potentially large number of employees who either are or will become during that period of retirement age, could cause constraints on the Company’s liquidity and further limit the Company’s ability to purchase shares by shareholders who wish to sell their shares.
The ability of shareholders to sell or transfer their common stock is restricted and, even upon such a sale, may not result in immediate receipt of cash consideration.
Only our employees, directors, and The PBSJ Employee Profit Sharing and Stock Ownership Plan and Trust, which we refer to as the ESOP, may own our common stock. We have incorporated significant restrictions on the transfer of our common stock which limit our shareholders’ ability to sell their stock. All shares must be initially offered for sale back to us at the price determined by an appraisal. If we decline to purchase the shares, the ESOP Plan may purchase such shares. Should the ESOP Plan decline to purchase the shares, the shareholders may offer their shares for sale to other shareholders who are employees. The other shareholders have the right to purchase such shares based on each shareholder’s proportionate ownership of all issued shares. Because our shares are subject to transfer restrictions, shareholders who desire to sell all their shares may not be able to do so.
Pursuant to our by-laws, we are permitted to repurchase stock by delivery of a promissory note to the employee. Because the principal payable pursuant to any such promissory note may be paid at any time prior to the five year anniversary of the date of issuance, a shareholder may not receive a cash payment for his shares until such five year anniversary.
Because we do not intend to pay dividends, our shareholders will benefit from an investment in our common stock only if our stock price appreciates.
We have never declared or paid dividends to holders of our common stock. We expect to retain all future earnings for investment in our business, and do not expect to pay any cash dividends in the near future. As a result, the positive return of an investment in our common stock is solely dependable on future appreciation in value of our common stock and future earnings. There is no guarantee that our stock will appreciate in value or even maintain the original price at which it was purchased.
The value of our stock may be negatively impacted by current and future governmental agency investigations.
An unfavorable resolution or outcome resulting from working with various government agencies to resolve the amount of reimbursement obligations may result in a material adverse impact to our enterprise value, and may adversely impact the future value of our share price. In addition, we are currently under investigation by the Federal Election Commission for possible irregularities relating to past political contributions made by us and certain of our employees. In the event that civil and/or criminal charges are filed against us, the future value of our share price may be impacted.
The limited market and transfer restrictions on our common stock will likely have anti-takeover effects.
Only our employees, directors, eligible consultants and employee benefit plans may own our common stock and participate in our internal market. In addition, we have imposed significant restrictions on the transfer of our common stock other than through sales during our stock window. These limitations make it extremely difficult for a potential acquirer who does not have the prior consent of our Board of Directors to acquire control of our company, regardless of the price per share an acquirer might be willing to pay and whether or not our shareholders would be willing to sell at that price.
23
| ITEM 1B. | Unresolved Staff Comments |
None.
We lease and maintain our executive offices located at 5300 W. Cypress Street, Suite 200 Tampa, FL 33607. On August 31, 2007, the Company entered into a sale-leaseback agreement of its Doral office building located at 2001 N.W. 107th Avenue, Miami, Florida 33172, which consists of approximately 100,000 square feet of office space (see Note 4 to the Consolidated Financial Statements for further information). We own our Orlando office located at 482 South Keller Road, Orlando, Florida 32810, which consists of approximately 90,000 square feet of office space. The Orlando office building is pledged as collateral under a mortgage note.
We lease 117 additional offices throughout the United States, Puerto Rico and the United Arab Emirates, all of which are used for our four major business segments. Aggregate lease payments during fiscal year 2008 were $20.5 million.
We also have title to one remaining recovered property which is held for sale and included in other non-current assets in the accompanying consolidated balance sheet at September 30, 2008 (see Note 3 to the Consolidated Financial Statements for further information). The property is a 2,000 square foot condominium located in Hollywood, Florida.
We believe that substantially all of our property and equipment are, in general, well maintained and in good operating condition and are considered adequate for present needs.
We believe that we have clear title to the properties owned and used in our business, subject to liens for current taxes and easements, restrictions and other liens, which do not materially detract from the value of the properties or our interest in the properties or the use of those properties in our business.
24
We are party to several pending legal proceedings arising from our operations. Additionally, if a client were to make a claim against a subcontractor on a project for which the Company was the prime contractor, the Company would be liable if the subcontractor was not adequately insured or not financially able to settle the claim. We believe that we have sufficient professional liability insurance such that the outcome of any of these proceedings, individually and in the aggregate, will not have a material adverse effect on our financial position or results of operations. However, if our insurance company were to deny coverage for a significant judgment or if a judgment were entered against us in an amount greater than our coverage, it could adversely affect our results of operations and financial position.
Our professional liability coverage is on a “claims-made basis” meaning the coverage applies to claims made during a policy year regardless of when the causative action took place. All other coverage are “occurrence-basis” meaning that the policy in place when the injury or damage occurred is the policy that responds regardless of when the claim is made. Our professional liability limits per policy year are $45 million with a per claim deductible of $125,000 plus an annual aggregate of $3 million. This coverage would also cover the Company for a claim against a subcontractor of the Company. Based on our experience with claims and lawsuits we believe that the current levels of coverage are adequate in all cases. A successful catastrophic claim or aggregate of several large claims in amounts in excess of our insurance coverage’s in any policy year could have a material adverse effect on our financial position and results of operation.
In July 1998, we entered into an agreement with West Frisco Development Corporation, which we refer to as WFDC, to provide various services, among which was a flood plain study to be used by WFDC, the City of Frisco and FEMA. In 2003, the City of Frisco retained the services of a third-party architecture and engineering firm in connection with the extension and widening of Teel Road which lies within the greater drainage basin included in the Company’s original flood plain study. This architecture and engineering firm’s assessment of the flood plain study determined that the Company used incorrect assumptions when calculating the size of the drainage culverts required for the increased development of the area’s transportation infrastructure. Based on this assessment, the Company has entered into negotiations with the City of Frisco to correct the drainage needs to support the Teel Road expansion project. As a result, the Company had recorded an estimated liability of $3.1 million to cover the costs associated with correcting the drainage needs of the Teel Road expansion project. Included in this estimate is the purchase of a parcel of land for $1.5 million, the remaining balance of $1.3 million and $1.6 million is reflected in other liabilities in the accompanying consolidated balance sheets as of September 30, 2008 and 2007, respectively.
In June 2007, we were served with a Summons and Complaint for a personal injury claim resulting from a bicycle accident on a bike path in Irvine, California, where we had performed services in relation to its design and construction. After several months of discovery responses, investigations and negotiations, we reached a final settlement through mediation for $3.2 million in November 2008. As a result, we recorded, at September 30, 2008, a liability of $3.2 million, which is included in accounts payable and accrued expenses in the accompanying consolidated financial statements and a receivable from the Company’s liability insurance carrier in the amount of $1.4 million, which is included in other current asset in the accompanying consolidated financial statements. The net effect of the liability and receivable of $1.8 million is included in general and administrative expense in the accompanying consolidated statement of operations for the year ended September 30, 2008.
In August 2007, we filed suit seeking a declaration that the insurance carrier is obligated to us for losses suffered as a result of the embezzlement for policy years 1991 through 2004. The amount of recovery sought for those policy years is $17 million. In August 2008, the initial motion for summary judgment was denied by the court. The Company filed a notice of appeal in September 2008. At the present time, we are unable to predict the likely outcome of this legal action and accordingly have not recorded any insurance receivable.
25
Misappropriation Loss
In March 2005, subsequent to the issuance of the Company’s 2004 financial statements, we discovered misappropriations of Company funds by our former Chief Financial Officer and two former employees who worked in our information systems and treasury departments. The participants colluded and circumvented controls to misappropriate funds and conceal the misappropriations possibly beginning as early as 1993 until the misappropriations were discovered.
An investigation revealed that at least $36.6 million was misappropriated between January 1, 1998 and the discovery of the misappropriations in March 2005. The amount misappropriated prior to January 1, 1998 could not be determined because certain data for the period prior to January 1, 1998 was unavailable. The participants in the embezzlement scheme used several methods to misappropriate the funds while engaging in conduct to conceal the misappropriated amounts. This conduct included among other things, recording and changing normal recurring journal entries and overstating accruals in prior periods to facilitate improper write-offs of misappropriated funds.
The Company determined that the misappropriation scheme led to the overstatement of overhead rates that the Company used to determine billings in connection with certain of our government contracts. During the review of the overhead rate calculations, the Company identified certain instances of costs erroneously included in our overhead cost pool which were unallowable under applicable regulations and an error in our calculation of our overhead rate, which related to certain general and administrative costs. The Company determined that the unallowable costs and general and administrative errors also led to the overstatement of overhead rates which the Company used in connection with certain government contracts. As a result, some of our government clients were overcharged for the Company’s services.
The Audit Committee, at the direction of the Corporate Board, disclosed the overstatement of our overhead rate to our clients and other appropriate government agencies, including the Department of Justice, or DOJ. We have been cooperating with our clients and such agencies to determine the amount of our reimbursement obligations and any other amounts we may be obligated to repay in order to resolve these issues. The DOJ and certain other governmental entities have investigated the misappropriations and the overstatement of overhead rates.
We have entered into settlement agreements with most of our clients and government agencies. We are in discussions with our remaining government clients to enter into settlement agreements in order to satisfy any refund obligations, which are in various stages of settlement. At September 30, 2008, the balance in accrued reimbursement liability is $2.2 million, and this amount is expected to be settled in fiscal year 2009.
Our Board of Directors, with the assistance of the Audit Committee, instituted immediate corrective actions and began implementing long-term measures to implement new financial controls and establish procedures to safeguard assets and to establish more accurate accounting and financial reporting practices. These long-term measures were incorporated into our on-going Ethics and Compliance Program.
In an effort to recover assets that were misappropriated, we instituted lawsuits against certain persons who received money from one or more of the participants in the embezzlement scheme. We continue to incur costs associated with such lawsuits, and we may not prevail in these lawsuits. In the event that the we do prevail, we may not actually recover assets from the persons we sued.
We filed a claim under our annual crime policy for policy period ended April 30, 2005, which we refer to as the 2005 Policy, to recover some of the misappropriation losses which resulted from the embezzlement. In January 2007, we received $2.0 million, the stated limit under the 2005 Policy. The insurance proceeds were recognized in insurance proceeds and gain on recoveries, net of misappropriation loss in the accompanying consolidated statement of operations for the year ended September 30, 2007. In August 2007, we filed suit against our insurance carrier seeking a declaration that the insurance carrier is obligated to us for losses suffered as a result of the embezzlement for policy years 1991 through 2004. We seek an aggregate recovery in an amount
26
equal to $17 million for such years In August 2008, our motion for summary judgment was denied by the court and we filed a notice of appeal in September 2008. We are currently, are unable to predict the outcome of this legal action and accordingly have not recorded any insurance receivable.
In the course of our investigation of the accounting irregularities and misappropriations, it was determined that there were possible violations relating to past political contributions by us and certain of our employees. The United States Attorney’s Office for the Southern District of Florida (Miami) and the Federal Bureau of Investigation have conducted an investigation relating to improper campaign contributions including improper use of political action committees. We produced documents and other information to the government and fully cooperated with the authorities. Criminal charges have been filed against two of the Company’s former chairmen. Authorities have verbally informed the Company’s external legal counsel that unless adverse additional information is discovered they do not intend to charge the Company. Therefore, we believe it unlikely that criminal charges will be filed against us in this matter, but the authorities are not precluded from bringing charges, and circumstances may change.
In October 2007, the Federal Election Commission advised us that it was commencing an investigation into alleged violations of the Federal Election Campaign Act of 1971, as amended, based on the improper campaign contributions including improper use of political action committees. We have produced documents and other information to the Commission and fully cooperated with the authorities. At the present we are unable to predict the likely outcome of this investigation.
| ITEM 4. | Submission of Matters to a Vote of Security Holders |
None.
27
PART II
| ITEM 5. | Market for Registrant’s Common Equity, Related Shareholder Matters and Issuer Purchases of Equity Securities |
There is no established public trading market for our common stock. As of September 30, 2008 there were no shares of common stock that were subject to outstanding warrants or options to purchase, or securities convertible into, our common stock, and no shares of our common stock could be sold pursuant to Rule 144 under the Securities Act.
As of November 30, 2008 there were 5,805,792 shares of common stock outstanding and held of record by 2,623 shareholders. There are no other classes of stock outstanding.
Our by-laws require that common stock held by shareholders who terminate employment with us be offered for sale at fair market value to us pursuant to a right of first refusal. Should we decline to purchase the shares, the shares must next be offered to our ESOP plan at fair market value, and then ultimately to our shareholders who are employees. Our by-laws provide that the fair market value be determined by an appraisal. Other than agreements with certain retired Directors, as of September 30, 2008 and 2007, there was no outstanding common stock held by individuals no longer employed by us.
Dividends
Each share of our common stock is entitled to share equally in any dividends declared by our Board of Directors. Pursuant to the terms of our credit agreement, we cannot declare or pay dividends in excess of 50% of our net income. We have not paid cash dividends on our common stock in the past and have no present intention of paying cash dividends on our common stock in the foreseeable future as we expect to retain any earnings for investment in our business.
We have not paid dividends for the five years ended September 30, 2008.
Issuer Purchases of Equity Securities
The following table provides information about repurchases of common stock Class A during the year ended September 30, 2008:
| | | | | | | | | |
| | | Total Number of
Shares Repurchased | | Average Price
Paid Per Share | | Total Number of Shares
Purchased as Part of
Publicly Announced
Plans or Programs | | Maximum Number of
Shares That May Be
Purchased Under the
Plans or Programs |
October 1 to June 30 | | 994,332 | | $ | 27.96 | | — | | — |
July 1 to July 31 | | — | | | — | | — | | — |
August 1 to 31 | | — | | | — | | — | | — |
September 1 to September 30 | | 361,088 | | | 29.68 | | — | | — |
| | | | | | | | | |
Total | | 1,355,420 | | $ | 28.42 | | — | | — |
| | | | | | | | | |
28
Performance Graph
The following graph shows a comparison of the five-year cumulative total shareholder return for our common stock with the S&P 500 Index and a weighted peer group index. The peer group index consist of other engineering firms the Company uses to benchmark its performance, specifically, CH2M Hill companies LTD, URS Corporation, Michael Baker Corporation, Tetra Tech Inc., and Jacobs Engineering Group, Inc. The graph assumes a $100 investment on September 30, 2003 in our common stock, the S&P 500 Index and the peer group index.
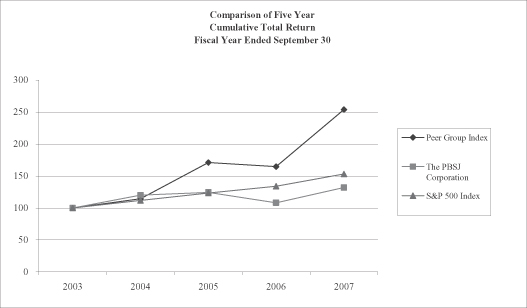
29
Equity Compensation Plan
| | | | | | | |
Plan Category | | Number of securities to be
issued upon exercise of
outstanding options,
warrants and rights | | Weighted-average
exercise price of
outstanding options,
warrants and rights | | Number of securities
remaining available for
future issuance under
equity compensation plans
(excluding securities
reflected in column (a)) |
| | | (a) | | (b) | | (c) |
Equity compensation plans approved by security holders (1) | | — | | $ | — | | 4,649,173 |
Equity compensation plans not approved by security holders (2) | | | | $ | — | | — |
| | | | | | | |
Total | | — | | $ | — | | 4,649,173 |
| | | | | | | |
| (1) | The equity compensation plans approved by security holders consist of the 2008 Employee Restricted Stock Plan, the Employee Stock Ownership and Direct Purchase Plan, and the Employee Stock Purchase Plan the purpose of which is to attract, retain, and reward high quality executives, directors, and other employees and officers who provide services to the company. |
| (2) | The equity compensation plans not approved by security holders included the Key Employee Retention Program of the Key Employee Supplemental Option Plan, pursuant to which the Company had agreements (subject to affirmation by the Board) to issue shares and a restricted stock plan under which the Board approved the issue of restricted shares of up to 2% of outstanding common stock in any year with no more than 10% of outstanding being restricted stock. Following the approval of the 2008 Employee Restricted Stock Plan, no further shares will be issued under this plan. |
30
| ITEM 6. | Selected Financial Data |
The financial data for the years ended September 30, 2008, 2007, 2006, 2005 and 2004 have been derived from our audited financial statements. You should read the information set forth below in conjunction with our consolidated financial statements, including the notes thereto, and Management’s Discussion and Analysis of Financial Condition and Results of Operations included elsewhere in this Annual Report.
| | | | | | | | | | | | | | | | | | | | |
| | | Years Ended September 30, | |
| (Dollars in thousands, except per share amounts) | | 2008 | | | 2007 | | | 2006 | | | 2005 | | | 2004 | |
Operating Data: | | | | | | | | | | | | | | | | | | | | |
Engineering fees | | $ | 617,945 | | | $ | 581,465 | | | $ | 537,242 | | | $ | 511,937 | | | $ | 448,247 | |
Net earned revenues | | | 468,249 | | | | 457,925 | | | | 431,607 | | | | 389,951 | | | | 351,875 | |
Net income | | | 15,472 | (1) | | | 19,098 | (2) | | | 5,405 | (3) | | | 21,075 | (4) | | | 14,690 | (6) |
| | | | | |
Balance Sheet Data (at end of period): | | | | | | | | | | | | | | | | | | | | |
Working capital | | | 58,644 | | | | 34,911 | | | | (1,285 | ) | | | 30,506 | | | | 20,293 | |
Total assets | | | 268,677 | | | | 258,369 | | | | 244,949 | | | | 251,647 | | | | 204,365 | |
Accrued reimbursement liability (5) | | | 2,186 | | | | 8,385 | | | | 28,183 | | | | 34,772 | | | | 24,119 | |
Long-term debt, less current portion | | | 5,885 | | | | 6,397 | | | | 6,909 | | | | 7,425 | | | | 7,828 | |
Capital leases obligations | | | 435 | | | | 705 | | | | 1,050 | | | | 853 | | | | 684 | |
Total stockholders’ equity | | | 66,251 | | | | 78,096 | | | | 58,911 | | | | 77,832 | | | | 62,703 | |
| | | | | |
Net income per share: | | | | | | | | | | | | | | | | | | | | |
Basic | | $ | 2.55 | | | $ | 3.05 | | | $ | 0.81 | | | $ | 2.92 | | | $ | 2.03 | |
Diluted | | $ | 2.51 | | | $ | 2.99 | | | $ | 0.76 | | | $ | 2.74 | | | $ | 1.91 | |
| (1) | Net income includes $1.3 million recognized on the deferred gain on the sale-leaseback of an office building, and a $2.3 million increase in revenue due to the reversal of accrued reimbursement liabilities. |
| (2) | Net income includes $2.8 million recognized on the sale-leaseback of an office building, $2.0 million in insurance proceeds, a $4.5 million increase in revenue due to the reversal of accrued reimbursement liabilities, mostly offset by $3.8 million in investigation related costs. |
| (3) | Net income includes $14.2 million in investigation related cost, offset by $1.6 million gain from recovered assets. |
| (4) | Net income includes $14.3 million gain from recovered assets, offset by $3.6 million misappropriation loss and $5.4 million in investigation related costs. |
| (5) | Over-billings to our government clients caused by the overstatement of our overhead rates as a consequence of the misappropriation loss and concealment entries and certain additional identified errors. |
| (6) | Net income includes $4.9 million misappropriation loss. |
31
| ITEM 7. | Management’s Discussion and Analysis of Financial Condition and Results of Operations |
Overview
Business Overview
We provide segment information on four reportable segments: Transportation Services, Construction Management, Civil Engineering, and Environmental Services.
We provide services to both private and public sector clients, with the public sector comprising approximately 74% of our engineering fees. During the fiscal year 2008, all segments, experienced growth in engineering fees. Transportation and Construction experience the greatest overall increase in engineering fees for the year ended September 30, 2008 as compared to the same period in 2007. The Construction Management segment increase was primarily due to expanding markets and client base in the West region, principally in the states of Colorado and Nevada, relating to highway and street projects performed. As of September 30, 2008, our engineering fee backlog was about $673.3 million as compared to $557.5 million as of September 30, 2007, representing a 20.8% increase.
Our net earned revenue, or NER, is impacted by our ability to capture our technical professional staff’s time and charge it to projects. As chargeability of our technical professionals’ time increases, engineering fees and direct salaries increase along with it, while indirect salaries decrease, as more of the technical staff’s time worked is being charged back to our clients. When chargeability decreases, there is an increase in indirect salaries and a corresponding reduction in direct salaries and engineering fees. three of the four segments experienced increases in indirect salaries during the year ended September 30, 2008, as compared to the same period in 2007. These increases were primarily due to the retention of our professional staff, during the work slow downs in anticipation of executing future contracts and investing in market development activities. In June 30, 2008 we implemented an overall reduction in force reducing staff by approximately 4%. This overall reduction and realignment of staff resulted in much improved financial performance in the last quarter of 2008.
Business Environment
The need to modernize and upgrade the transportation infrastructure in the United States has been a source of continued business for us through the last ten years. Fueling the initial growth in this market was the Intermodal Surface Transportation Efficiency Act of 1991 and subsequent legislation, the Transportation Equity Act for the 21st Century, the Safe, Accountable, Flexible, Efficient Transportation Act: A Legacy for Users. The public is beginning to recognize the potential disasters that await should our nation’s acknowledged aging infrastructure not be addressed. Increasingly complex governmental regulations faced by our clients mean additional opportunities for consultants with specialized knowledge. Despite the need for improvements, federal funds have been stretched, which when combined with the rising costs of construction materials have created some sluggishness in our industry. In some cases states have increased fuel taxes to support growing transportation needs, and, in other states, there has been a movement toward privatization or toll-funded facilities. Given that we are a leading provider of toll services, this work has grown simultaneously with a retraction in traditional transportation services.
The decline in the residential housing market intensified during 2008 as the sub-prime mortgage meltdown resulted in tighter credit and lower prices, causing buildings and developers to curtail their operations substantially. This was somewhat offset by the increase in federal spending associated with Base Realignment and Closure and U.S. Army Transformation activity, which our civil engineering services strongly support.
The state and local government markets remained weak, but the market for our specialized services in the area of risk and emergency management strengthened due in part to hurricanes and wild fires. Near-term expectations are for the Federal Department of Defense and Homeland Security sectors to remain strong.
In recent years, significant environmental laws at the federal, state and local levels have been enacted in response to public concern over the health of the nation’s air, water, and natural resources. Those laws and their
32
implementation through regulation affect numerous industrial and governmental actions and form a key market driver for the services of our Environmental Services segment. Two federal environmental laws, The Safe Drinking Water Act of 1974 and the Clean Water Act of 1972, continue to drive this segment of our business. Pursuant to these laws, Congress has authorized significant monies to assist state and local governments. According to the EPA, as much as $23 billion a year will be needed for construction and upgrade of water and wastewater treatment facilities over the next 20 years.
While we see a sluggishness or retrenchment in traditional infrastructure services, we are seeing a growth in innovative financing and delivery systems that while not fully replacing the reduction in traditional services, is providing opportunities for firms like ours that provide a broad cross section of services to many different markets.
Segment Results of Operations
In fiscal year 2008, we restructured our internal organization to better leverage our technical capabilities in servicing the needs of our clients which resulted in a change in the composition of our reportable segments. Under the new structure, we will continue to provide segment information on four reportable segments: Transportation Services, Construction Management, Civil Engineering, and Environmental Services. Subsets of the Construction Management segment have been realigned in the Civil Engineering and Transportation Services segments. Accordingly, we have reclassified segment information for prior periods presented, as applicable, to confirm to the current reportable segment structure. We continue to evaluate performance based on operating income (loss) of the respective operating segment. The discussion that follows is a summary analysis of the primary changes in operating results by reportable segment for the years ended September 30, 2008, 2007 and 2006.
Activities in the Transportation Services business segment generally involve planning, design, right of way acquisition, development and design of intelligent transportation services and program construction management services for multiple transportation modes, including interstate and primary highways, toll roads, arterials, bridges, transit systems, airports and port facilities. The Program Management group of our Transportation segment provides many of its governmental clients the necessary resources to manage large infrastructure programs from concept through construction. Services include planning, programming and contract support.
The Construction Management segment provides a wide range of services as an agent for our clients, including contract administration, inspection, field-testing, scheduling/estimating, instituting project controls and quality assessment. We provide scheduling, cost estimating and construction observation services for the project, or its services may be limited to providing construction consulting.
The Civil Engineering segment, through its two operating segments, Facilities and Federal (formerly known as Applied Technologies) provides civil engineering as well as specialized services to public and private clients. Included in these services are: site engineering and surveys, infrastructure engineering, master planning, disaster mitigation planning and response, asset assessment and management, emergency management and architectural and landscape design. The Company aggregated the Facilities and Applied Technologies operating segments into the Civil Engineering segment based on the similarities of service and clients.
The Environmental Services business segment, through its two operating segments Environment Sciences and Water, focuses on the delivery of planning, design and construction management services for private and public sector clients related to air quality management, flood insurance studies, energy planning, hazardous and solid waste management, ecological studies, wastewater treatment, water resources, environmental toxicology analysis, aquatic treatment systems, reclaimed water, and water supply and treatment. The Environmental Services segment aggregated the Environmental Science and Water operating segments based on the affinity of clients and services provided. This aggregation will allow the consolidation of the three major markets where we provide environmental services, Water, Water Resources and Science into on umbrella, where the Company can provide a full range of services to its common clients. On February 29, 2008, the Company acquired 100% of the stock of EcoScience and included its result of operation within the Environmental Services segment.
33
Net earned revenue represents the net effect of gross engineering fees less direct reimbursable expenses. Direct reimbursable expenses primarily consist of subcontractor costs and other direct non-payroll reimbursable charges including travel and travel related costs, blueprints, and equipment where we are responsible for procurement and management of such cost components on behalf of our clients. These direct reimbursable expenses are normally passed through to our clients with minimal or no mark-up. Indirect salaries represent wages earned by technical personnel not assigned to client billable projects and administrative and support personnel wages.
| | | | | | | | | | | | | | | | | | | | |
| | | Years Ended September 30, | |
| (Dollars in thousands) | | 2008 | | % of
NER | | | 2007 | | | % of
NER | | | 2006 | | | % of
NER | |
Transportation Services | | | | | | | | | | | | | | | | | | | | |
Engineering fees | | $ | 261,775 | | 142.4 | % | | $ | 232,600 | | | 133.9 | % | | $ | 205,951 | | | 130.1 | % |
Direct reimbursable expenses | | $ | 77,922 | | 42.4 | | | | 58,926 | | | 33.9 | | | | 47,668 | | | 30.1 | |
| | | | | | | | | | | | | | | | | | | | |
Net earned revenues (NER) | | | 183,853 | | 100.0 | | | | 173,674 | | | 100.0 | | | | 158,283 | | | 100.0 | |
| | | | | | | | | | | | | | | | | | | | |
Direct salaries and direct costs | | | 67,698 | | 36.8 | | | | 64,503 | | | 37.2 | | | | 58,274 | | | 36.8 | |
Indirect salaries | | | 40,266 | | 21.9 | | | | 37,502 | | | 21.6 | | | | 32,563 | | | 20.6 | |
General and administrative costs | | | 61,919 | | 33.7 | | | | 59,461 | | | 34.2 | | | | 55,757 | | | 35.2 | |
Insurance proceeds and gain on recoveries | | | — | | — | | | | (730 | ) | | (0.4 | ) | | | (566 | ) | | (0.4 | ) |
Investigation and related costs | | | — | | 0.0 | | | | 1,395 | | | 0.8 | | | | 5,000 | | | 3.2 | |
| | | | | | | | | | | | | | | | | | | | |
Total costs and expenses | | | 169,883 | | 92.4 | | | | 162,131 | | | 93.4 | | | | 151,028 | | | 95.4 | |
| | | | | | | | | | | | | | | | | | | | |
Operating income | | $ | 13,970 | | 7.6 | % | | $ | 11,543 | | | 6.6 | % | | $ | 7,255 | | | 4.6 | % |
| | | | | | | | | | | | | | | | | | | | |
Construction Management | | | | | | | | | | | | | | | | | | | | |
Engineering fees | | $ | 62,083 | | 123.8 | % | | $ | 57,798 | | | 121.6 | % | | $ | 81,860 | | | 123.4 | % |
Direct reimbursable expenses | | | 11,934 | | 23.8 | | | | 10,267 | | | 21.6 | | | | 15,499 | | | 23.4 | |
| | | | | | | | | | | | | | | | | | | | |
Net earned revenues (NER) | | | 50,149 | | 100.0 | | | | 47,531 | | | 100.0 | | | | 66,361 | | | 100.0 | |
| | | | | | | | | | | | | | | | | | | | |
Direct salaries and direct costs | | | 19,390 | | 38.7 | | | | 18,531 | | | 39.0 | | | | 26,302 | | | 39.6 | |
Indirect salaries | | | 9,371 | | 18.7 | | | | 9,415 | | | 19.8 | | | | 12,082 | | | 18.3 | |
General and administrative costs | | | 16,771 | | 33.4 | | | | 16,178 | | | 34.0 | | | | 23,724 | | | 35.7 | |
Insurance proceeds and gain on recoveries | | | — | | — | | | | (199 | ) | | (0.4 | ) | | | (241 | ) | | (0.4 | ) |
Investigation and related costs | | | — | | 0.0 | | | | 380 | | | 0.8 | | | | 2,127 | | | 3.2 | |
| | | | | | | | | | | | | | | | | | | | |
Total costs and expenses | | | 45,532 | | 90.8 | | | | 44,305 | | | 93.2 | | | | 63,994 | | | 96.4 | |
| | | | | | | | | | | | | | | | | | | | |
Operating income | | $ | 4,617 | | 9.2 | % | | $ | 3,226 | | | 6.8 | % | | $ | 2,367 | | | 3.6 | % |
| | | | | | | | | | | | | | | | | | | | |
Civil Engineering | | | | | | | | | | | | | | | | | | | | |
Engineering fees | | $ | 164,177 | | 122.4 | % | | $ | 162,959 | | | 121.4 | % | | $ | 140,683 | | | 116.8 | % |
Direct reimbursable expenses | | | 30,028 | | 22.4 | | | | 28,691 | | | 21.4 | | | | 20,236 | | | 16.8 | |
| | | | | | | | | | | | | | | | | | | | |
Net earned revenues (NER) | | | 134,149 | | 100.0 | | | | 134,268 | | | 100.0 | | | | 120,447 | | | 100.0 | |
| | | | | | | | | | | | | | | | | | | | |
Direct salaries and direct costs | | | 48,151 | | 35.9 | | | | 47,942 | | | 35.7 | | | | 44,398 | | | 36.9 | |
Indirect salaries | | | 36,115 | | 26.9 | | | | 30,502 | | | 22.7 | | | | 26,004 | | | 21.6 | |
General and administrative costs | | | 49,638 | | 37.0 | | | | 50,723 | | | 37.8 | | | | 45,784 | | | 38.0 | |
Insurance proceeds and gain on recoveries | | | — | | — | | | | (623 | ) | | (0.5 | ) | | | (465 | ) | | (0.4 | ) |
Investigation and related costs | | | — | | 0.0 | | | | 1,190 | | | 0.9 | | | | 4,105 | | | 3.4 | |
| | | | | | | | | | | | | | | | | | | | |
Total costs and expenses | | | 133,904 | | 99.8 | | | | 129,734 | | | 96.6 | | | | 119,826 | | | 99.5 | |
| | | | | | | | | | | | | | | | | | | | |
Operating income | | $ | 245 | | 0.2 | % | | $ | 4,534 | | | 3.4 | % | | $ | 621 | | | 0.5 | % |
| | | | | | | | | | | | | | | | | | | | |
Environmental Services | | | | | | | | | | | | | | | | | | | | |
Engineering fees | | $ | 129,910 | | 129.8 | % | | $ | 128,108 | | | 125.0 | % | | $ | 108,748 | | | 125.7 | % |
Direct reimbursable expenses | | | 29,812 | | 29.8 | | | | 25,656 | | | 25.0 | | | | 22,232 | | | 25.7 | |
| | �� | | | | | | | | | | | | | | | | | | |
Net earned revenues (NER) | | | 100,098 | | 100.0 | | | | 102,452 | | | 100.0 | | | | 86,516 | | | 100.0 | |
| | | | | | | | | | | | | | | | | | | | |
Direct salaries and direct costs | | | 33,590 | | 33.5 | | | | 33,788 | | | 33.0 | | | | 29,407 | | | 34.0 | |
Indirect salaries | | | 26,477 | | 26.5 | | | | 22,966 | | | 22.4 | | | | 20,703 | | | 23.9 | |
General and administrative costs | | | 37,536 | | 37.5 | | | | 35,636 | | | 34.8 | | | | 33,528 | | | 38.8 | |
Insurance proceeds and gain on recoveries | | | — | | — | | | | (437 | ) | | (0.4 | ) | | | (341 | ) | | (0.4 | ) |
Investigation and related costs | | | — | | 0.0 | | | | 837 | | | 0.8 | | | | 3,007 | | | 3.5 | |
| | | | | | | | | | | | | | | | | | | | |
Total costs and expenses | | | 97,603 | | 97.5 | | | | 92,790 | | | 90.6 | | | | 86,304 | | | 99.8 | |
| | | | | | | | | | | | | | | | | | | | |
Operating income | | $ | 2,495 | | 2.5 | % | | $ | 9,662 | | | 9.4 | % | | $ | 212 | | | 0.2 | % |
| | | | | | | | | | | | | | | | | | | | |
34
Year Ended September 30, 2008 Compared to Year Ended September 30, 2007
Engineering Fees
| | | | | | | | | | | | |
| | | Years Ended September 30, | |
| (Dollars in thousands) | | 2008 | | 2007 | | $ Change | | % Change | |
Transportation Services | | $ | 261,775 | | $ | 232,600 | | $ | 29,175 | | 12.5 | % |
Construction Management | | | 62,083 | | | 57,798 | | | 4,285 | | 7.4 | % |
Civil Engineering | | | 164,177 | | | 162,959 | | | 1,218 | | 0.7 | % |
Environmental Services | | | 129,910 | | | 128,108 | | | 1,802 | | 1.4 | % |
| | | | | | | | | | | | |
Total Engineering Fees | | $ | 617,945 | | $ | 581,465 | | $ | 36,480 | | 6.3 | % |
| | | | | | | | | | | | |
Engineering fees for the year ended September 30, 2008, were $617.9 million compared to $581.5 million in 2007, representing a 6.3% increase. All segments contributed to the increase in engineering fees in fiscal year 2008 when compared to fiscal year 2007. The backlog volumes increased by 20.8% in the year ended September 30, 2008 from $557.5 million at September 30, 2007 to $673.3 million at September 30, 2008. All segments, except Construction Management, experienced increases in backlog volumes at September 30, 2008 when compared to the backlog volumes at September 30, 2007.
Engineering fees from the Transportation Services segment increased 12.5% to $261.8 million in fiscal year 2008 from $232.6 million in fiscal year 2007. This increase was due primarily to strong markets in surface transportation in the Southeast region as well as market success in the Central transportation market. Large wins from new and existing toll clients also contributed significantly to growth during the year ended September 30, 2008. The backlog volumes for the Transportation Services segment at September 30, 2008 increased by 19.4% to $311.9 million from $261.1 million at September 30, 2007.
Our Construction Management engineering fees increased 7.4% to $62.1 million in fiscal year 2008 from $57.8 million in fiscal year 2007. This increase was due to expanding markets and client base in the West region, specifically Nevada and Colorado. Highways and streets projects were performed throughout all regions of Colorado’s DOT as well as local city and county agencies in both States. California, which has been a challenging growth area in the past, has stabilized and showed improvement in 2008. The backlog volumes for the Construction Management segment at September 30, 2008 decreased by 5.9% to $90.2 from $95.9 million at September 30, 2007.
In the Civil Engineering segment, engineering fees increased 0.7% to $164.2 million in fiscal year 2008 from $163.0 million in fiscal year 2007. Although demand for our traditional private land development engineering, planning and surveying services weakened substantially in fiscal 2008 due to the exceptionally poor market conditions, the resultant reduction in fees was offset by strong growth in our Federal and Architecture practice areas primarily attributable to additional assignments with the Department of Defense in the East Region. Also contributing to the increase in engineering fees was additional work within the Federal group, including another large contract with MEMA, which started during the first quarter of fiscal 2008. The backlog volumes for the Civil Engineering segment increased by 83.2% to $151.7 million at September 30, 2008 when compared to $82.8 million at September 30, 2007.
Engineering fees in our Environmental Services segment increased 1.4% to $129.9 million in fiscal year 2008 from $128.1 million in fiscal year 2007. The backlog volumes for the Environmental Services segment at September 30, 2008 increased by 1.6% to $119.5 million from $117.6 million at September 30, 2007.
35
Net Earned Revenues
| | | | | | | | | | | | | |
| | | Years Ended September 30, | |
| (Dollars in thousands) | | 2008 | | 2007 | | $ Change | | | % Change | |
Transportation Services | | $ | 183,853 | | $ | 173,674 | | $ | 10,179 | | | 5.9 | % |
Construction Management | | | 50,149 | | | 47,531 | | | 2,618 | | | 5.5 | % |
Civil Engineering | | | 134,149 | | | 134,268 | | | (119 | ) | | -0.1 | % |
Environmental Services | | | 100,098 | | | 102,452 | | | (2,354 | ) | | -2.3 | % |
| | | | | | | | | | | | | |
Total Net Earned Revenues | | $ | 468,249 | | $ | 457,925 | | $ | 10,324 | | | 2.3 | % |
| | | | | | | | | | | | | |
NER was $468.2 million during the year ended September 30, 2008 as compared to $457.9 million in the same period in 2006, representing a 2.3% increase. This increase was directly related to the increase in engineering fees, as previously explained.
Direct Reimbursable Expenses
| | | | | | | | | | | | |
| | | Years Ended September 30, | |
| (Dollars in thousands) | | 2008 | | % of
NER | | | 2007 | | % of
NER | |
Transportation Services | | $ | 77,922 | | 42.4 | % | | $ | 58,926 | | 33.9 | % |
Construction Management | | | 11,934 | | 23.8 | % | | | 10,267 | | 21.6 | % |
Civil Engineering | | | 30,028 | | 22.4 | % | | | 28,691 | | 21.4 | % |
Environmental Services | | | 29,812 | | 29.8 | % | | | 25,656 | | 25.0 | % |
| | | | | | | | | | | | |
Total Direct Reimbursable Expenses | | $ | 149,696 | | 32.0 | % | | $ | 123,540 | | 27.0 | % |
| | | | | | | | | | | | |
In addition, the change in our NER is affected by the fluctuation in our direct reimbursable expenses. Direct reimbursable expenses is primarily comprised of subcontractor costs and other direct non-payroll reimbursable charges including travel and travel related costs, blueprints, reproductions, CADD/computer charges and equipment where we are responsible for procurement and management of such cost components on behalf of our clients. These direct reimbursable expenses are principally passed through to our clients with minimal or no mark-up. As a percentage of NER, direct reimbursable expenses increased by 5.0% to 32.0% in the year ended September 30, 2008 from 27.0% in the same period in 2007. The increase was principally driven by Transportation Services segment, as explained below.
Direct reimbursable expenses in the Transportation Services segment experienced an increase of 32.2% in fiscal year 2008 when compared to fiscal year 2007. As a percentage of NER, direct reimbursable expenses increased by 8.5% to 42.4% in fiscal year 2008 from 33.9% in fiscal year 2007. The significant increase is primarily due to the usage of specialized consultants in various projects in the Highway Design, Aviation & Transit Sectors.
In our Construction Management segment, direct reimbursable expenses as a percentage of NER increased by 2.2% to 23.8% in fiscal year 2008 from 21.6% in fiscal year 2007. This increase correlates directly with the increase in engineering fees experienced in fiscal year 2008 when compared to fiscal year 2007.
Direct reimbursable expenses in the Civil Engineering segment increased as a percentage of NER by 1.0% to 22.4% in fiscal year 2008 from 21.4% in fiscal year 2007. The increase was due to increases in subconsultants in connection with the Department of Defense and MEMA contracts, partly offset by a decrease in subconsultants resulting from the winding down of the New Mexico FEMA contracts. The increase was also offset by a decrease in the use of subconsultants in the private sector land development services.
36
Our Environmental Services segment experienced an increase of 16.2% in direct reimbursable expenses in fiscal year 2008 when compared to fiscal year 2007. The increase was due primarily to the high usage of specialized subconsultants, primarily with water projects. As a percentage of NER, direct reimbursable expenses increased by 4.8% to 29.8% in fiscal year 2008 from 25.0% in fiscal year 2007.
Operating Income
| | | | | | | | | | | | | |
| | | Years Ended September 30, | |
| (Dollars in thousands) | | 2008 | | % of
NER | | | 2007 | | | % of
NER | |
Transportation Services | | $ | 13,970 | | 7.6 | % | | $ | 11,543 | | | 6.6 | % |
Construction Management | | | 4,617 | | 9.2 | % | | | 3,226 | | | 6.8 | % |
Civil Engineering | | | 245 | | 0.2 | % | | | 4,534 | | | 3.4 | % |
Environmental Services | | | 2,495 | | 2.5 | % | | | 9,662 | | | 9.4 | % |
| | | | | | | | | | | | | |
Total Operating Income | | | 21,327 | | 4.6 | % | | | 28,965 | | | 6.3 | % |
Insurance proceeds and gain on recoveries, net | | | — | | 0.0 | % | | | (1,989 | ) | | -0.4 | % |
Investigation and related costs | | | — | | 0.0 | % | | | 3,802 | | | 0.8 | % |
| | | | | | | | | | | | | |
Total Operating Income before Insurance Proceeds and Gain on Recoveries, net of Investigation and Related Costs | | $ | 21,327 | | 4.6 | % | | $ | 30,778 | | | 6.7 | % |
| | | | | | | | | | | | | |
Operating income was $21.3 million during the year ended September 30, 2008 as compared to $29.0 million in the same period in 2007, representing a decrease of 26.4%. The decrease in operating income was due primarily to a decrease in demand for our services caused by poor market conditions, particularly in the private sector. The weakening of services resulted in marginal increases in engineering fees with a corresponding decrease in utilization of our technical staff, which caused lower labor margins and increased indirect salaries. The Civil Engineering segment experienced substantial reduction in services from the private sector while Environmental Services had marginal growth in engineering fees, which contributed to a significant decrease in utilization of their professional and technical personnel. Also contributing to the decrease in operating income during the year ended September 30, 2008 as compared to the same period in 2007, was the recognition in the 2007 period, of $2.8 million gain recognized on the sale-leaseback of the Doral office building. The gain recognized on the sale-leaseback of the Doral property was allocated to each respective segment. The allocation is based on the segments’ proportionate share of general and administrative costs to total Company general and administrative costs. Operating income, as a percentage of NER, decreased by 1.7% to 4.6% in the year ended September 30, 2008 from 6.3% in the same period in 2007.
We believe that operating income before gain on recoveries and investigation and related costs is a useful measure in evaluating our results of operations because the gain on recoveries, and investigation and related costs are unusual items which do not reflect the costs or revenues of our provision of services in the given year. While the misappropriations occurred over a long period, the recoveries and investigation costs are realized when recovered or incurred and not in relation to the period when the misappropriations occurred. We believe this measure is helpful for us and for our investors to evaluate the results of our operations and make comparisons between periods.
Operating income before insurance proceeds and gain on recoveries, net of investigation and related costs, was $21.3 million during the year ended September 30, 2008 as compared to $30.8 million in the same period in 2007, representing a decrease of 30.7%. As a percentage of NER, operating income before insurance proceeds and gain on recoveries, net of investigation and related costs decreased by 2.1% to 4.6% in the year ended September 30, 2008 from 6.7% in the same period in 2007. The decrease in operating income before insurance proceeds and gain on recoveries, net of investigation and related costs was principally attributed to a decrease in demand for our services caused by exceptionally poor market conditions, particularly in the private sector. The weakening of services resulted in marginal increases in engineering fees with a corresponding decrease in
37
utilization of our technical staff, which caused less than desirable labor margins and increased indirect salaries. The Civil Engineering segment experienced substantial reduction in services from the private sector while Environmental Services had marginal growth in engineering fees, which contributed to a significant decrease in utilization of their professional and technical personnel. Also contributing to the decrease in operating results for the year ended September 30, 2008 was the $1.3 million recognition of deferred gain on the sale-leaseback of the Doral office building as compared to the $2.8 million gain recognized for the same period in 2007, which was offset by $3.8 million in investigation and related costs, net of $2.0 million of insurance proceeds and gain on recoveries in fiscal year 2007.
As a percentage of NER, the Transportation Services segment’s operating income increased by 1.0% to 7.6% in fiscal year 2008 from 6.6% in the same period in 2007. The increase in operating income was due to the increase in engineering fees, as previously explained. The increase in operating income also benefitted by a decrease in the allocation of investigation and related costs of $1.4 million, net of insurance proceeds and gain on recoveries of approximately $730,000 in the year ended September 30, 2008 when compared to the same period in 2007. As a percentage of NER, the Transportation Services segment’s operating income before insurance proceeds and gain on recoveries, net of investigation and related costs increased by 0.6% to 7.6% in the year ended September 30, 2008 from 7.0% in the same period in 2007.
The Construction Management segment experienced an increase in operating income, as a percentage of NER of 2.4% in the year ended September 30, 2008 when compared to the same period in 2007. The net change in operating income dollars was directly related to the overall increase in Net Earned Revenue from Construction Management contracts and the amount of related administrative expenses, including overhead labor remained stable. As a percentage of NER, operating income before insurance proceeds and gain on recoveries, net of investigation and related costs increased by 2.0% to 9.2% in fiscal year 2008 from 7.2% in the same period in 2007.
As a percentage of NER, the Civil Engineering segment operating income decreased by 3.2% to 0.2% in fiscal year 2008 from 3.4% in the same period in 2007. This decrease was primarily driven by an increase in indirect salaries due to a decrease in chargeability. As a percentage of NER, operating income before insurance proceeds and gain on recoveries, net of investigation and related costs decreased by 3.6% to 0.2% in the year ended September 30, 2008 from 3.8% in the same period in 2007.
The Environmental Services segment experienced a decrease in operating income, as a percentage of NER, of 6.9% to 2.5% in fiscal 2008 from 9.4% in the same period in 2007. The decrease in operating income was primarily due to a decrease in NER resulting from a higher increase in direct reimbursable expenses as a result of a high usage of specialized subconsultants in our water projects over the modest increase in engineering fees caused by the softening in demand for our services. Also contributing to the decrease in operating income for the year ended September 30, 2008 over the same period last year was an increase in indirect salaries resulting from lower utilization of our labor staff caused by the softening in demand for our services and increased non-chargeable activities, primarily the ERP implementation and acquisition activities. The decrease in operating income was partly offset by a decrease in the allocation of investigation and related costs of approximately $837,000, net of insurance proceeds and gain on recoveries of approximately $437,000 in the year ended September 30, 2008 when compared to the same period in 2007. As a percentage of NER, the Environmental Services segment operating income before insurance proceeds and gain on recoveries, net of investigation and related costs decreased by 7.3% to 2.5% in fiscal year 2008 from 9.8% in the same period in 2007.
Costs
Costs consist principally of direct salaries and direct costs that are chargeable to clients and overhead and general and administrative expenses.
38
Direct Salaries and Direct Costs
| | | | | | | | | | | | |
| | | Years Ended September 30, | |
| (Dollars in thousands) | | 2008 | | % of
NER | | | 2007 | | % of
NER | |
Transportation Services | | $ | 67,698 | | 36.8 | % | | $ | 64,503 | | 37.1 | % |
Construction Management | | | 19,390 | | 38.7 | % | | | 18,531 | | 39.0 | % |
Civil Engineering | | | 48,151 | | 35.9 | % | | | 47,942 | | 35.7 | % |
Environmental Services | | | 33,590 | | 33.6 | % | | | 33,788 | | 33.0 | % |
| | | | | | | | | | | | |
Direct Salaries and Direct Costs | | $ | 168,829 | | 36.1 | % | | $ | 164,764 | | 36.0 | % |
| | | | | | | | | | | | |
Direct salaries and direct costs primarily include direct salaries and to a lesser extent unreimburseable direct costs. Direct salaries include compensation earned primarily by our technical professionals, whose billable labor gets charged back to our clients. Direct costs totaled $1.8 million and $1.1 million in fiscal year 2008 and 2007, respectively. Direct salaries and direct costs were $168.8 million in the year ended September 30, 2008, as compared to $164.8 million in the same period in 2007, representing a 2.5% increase. This increase is directly related to the increase in engineering fees. As a percentage of NER, direct salaries and direct costs decreased slightly by 0.1% to 36.1% in fiscal year 2008 from 36.0% in fiscal year 2007.
Direct salaries and direct costs in the Transportation Services segment increased 5.0% to $67.7 million in the year ended September 30, 2008 from $64.5 million in the same period in 2007. As a percentage of NER, direct salaries and direct costs decreased by 0.3% to 36.8% in fiscal year 2008 from 37.1% in the same period in 2007, reflecting direct salaries changed in direct relationship to Engineering Fees.
Direct salaries and direct costs in the Construction Management segment increased 4.6% to $19.4 million in the year ended September 30, 2008 from $18.5 million in the same period in 2007. As a percentage of NER, direct salaries and direct costs decreased by 0.2% to 38.8% in fiscal year 2008 from 39.0% in the same period in 2007. This decrease was due to the efficient utilization of the professional staff as a result of the increase in fixed price contracts.
Direct salaries and direct costs in the Civil Engineering segment increased by 0.4% to $48.2 million in the year ended September 30, 2008 from $47.9 million in the same period in 2007. As a percentage of NER, direct salaries and direct costs increased slightly by 0.2% to 35.9% in fiscal year 2008 from 35.7% in the same period in 2007. The growth in direct labor costs in the segment was consistent with the growth in fees.
Direct salaries and direct costs in the Environmental Services segment decreased 0.1% compared to the same period in 2007. As a percentage of NER, direct salaries and direct costs increased by 0.7% to 33.6% in fiscal year 2008 from 33.0% in the same period in 2007.
General and Administrative Costs, including Indirect Salaries
The other component of costs is indirect costs, which include indirect salaries, and general and administrative costs.
Indirect Salaries
| | | | | | | | | | | | |
| | | Years Ended September 30, | |
| (Dollars in thousands) | | 2008 | | % of
NER | | | 2007 | | % of
NER | |
Transportation Services | | $ | 40,266 | | 21.9 | % | | $ | 37,502 | | 21.6 | % |
Construction Management | | | 9,371 | | 18.7 | % | | | 9,415 | | 19.8 | % |
Civil Engineering | | | 36,115 | | 26.9 | % | | | 30,502 | | 22.7 | % |
Environmental Services | | | 26,477 | | 26.5 | % | | | 22,966 | | 22.4 | % |
| | | | | | | | | | | | |
Total Indirect Salaries | | $ | 112,229 | | 24.0 | % | | $ | 100,385 | | 21.9 | % |
| | | | | | | | | | | | |
39
Indirect salaries include compensation primarily for administrative staff and to a lesser extent professional staff that is not chargeable to clients. Indirect salaries increased 11.8% to $112.2 million in fiscal year 2008 from $100.4 million in fiscal year 2007. Indirect salaries as a percentage of NER increased 2.1% to 24.0% in fiscal year 2008 from 21.9% in fiscal year 2007.
The Transportation Services segment experienced an increase in indirect salaries of 7.4% to $40.3 million in the year ended September 30, 2008 from $37.5 million in the same period in 2007. As a percentage of NER, indirect salaries decreased by 0.3% to 21.9% in fiscal year September 30, 2008 from 21.6% in the same period in 2007.
The Construction Management segment experienced a slight decrease in indirect salaries of 0.5% to $9.4 million in the year ended September 30, 2008 from $9.4 million in the same period in 2007. As a percentage of NER, indirect salaries decreased by 1.1% to 18.7 % in the fiscal year ended September 30, 2008 from 19.8% in the same period in 2007 primarily due to a reduction in administrative headcount.
The Civil Engineering segment experienced an increase in indirect salaries of 18.4% to $36.1 million in the year ended September 30, 2008 from $30.5 million in the same period in 2007. As a percentage of NER, indirect salaries increased by 4.2% to 26.9% in fiscal year ended September 30, 2008 from 22.7% in the same period in 2007. This increase is primarily due to labor inefficiencies.
Indirect salaries in our Environmental Services segment increased by 15.3% to $26.5 million in the year ended September 30, 2008 from $23.0 million in the same period in 2007. Indirect salaries, as a percentage of NER increased by 4.1% to 26.5% in fiscal year ended September 30, 2008 from 22.4% in the same period in 2007. The increase was primarily due to lower utilization of our professional staff, which resulted in high labor margin performance.
General and Administrative Costs
| | | | | | | | | | | | |
| | | Years Ended September 30, | |
| (Dollars in thousands) | | 2008 | | % of
NER | | | 2007 | | % of
NER | |
Transportation Services | | $ | 61,919 | | 33.7 | % | | $ | 59,461 | | 34.2 | % |
Construction Management | | | 16,771 | | 33.4 | % | | | 16,178 | | 34.0 | % |
Civil Engineering | | | 49,638 | | 37.0 | % | | | 50,723 | | 37.9 | % |
Environmental Services | | | 37,536 | | 37.5 | % | | | 35,636 | | 34.8 | % |
| | | | | | | | | | | | |
Total General and Administrative Costs | | $ | 165,864 | | 35.4 | % | | $ | 161,998 | | 35.4 | % |
| | | | | | | | | | | | |
General and administrative, or G&A, costs increased 2.4% to $165.9 million in fiscal year 2008 from $162.0 million in fiscal year 2007. The majority of the increase was related to increases in legal fees of $3.8 million, due to the claim liability case in Irvine, California and legal expenses incurred in connection with our lawsuit against our insurance carrier under our crime liability claim. Also contributing to the increase in G&A in the current period from the same period last year was the $2.8 million gain recognized on the sale-leaseback of the Doral office building recorded in fiscal year 2007 and included in G&A, increased rent expense for real estate of $1.8 million resulting primarily from the sale-leaseback of the Doral building, renewals of existing leases and new lease agreements. The settlement and curtailment of the Key Employee Supplemental Option Plan which resulted in an expense of $1.0 million also contributed to the increase in G&A. These increases in G&A were partly offset by a decreases in bonus expense of $4.4 million. Most of these costs are generally considered corporate costs which benefit all segments and are allocated to the respective segments based on the individual segments’ proportionate share of G&A costs as compared to our total G&A costs. G&A as a percentage of NER remained the same in the year ended September 30, 2008 when compared to the same period in 2007.
40
Insurance Proceeds, (Gain) loss on recoveries, and Investigation and Related Costs
As described elsewhere in this Annual Report, during fiscal year 2007, we recognized $2.0 million in insurance proceeds related to a claim we filed under our insurance policy to cover fiduciary and crime liability. Additionally, in fiscal year 2007 we incurred $3.8 million in costs to investigate and quantify the impact of the embezzlement, and in costs related to the recovery and maintenance of certain assets, we did not incur any such costs in 2008. We have not discovered and do not expect to discover any additional misappropriations, and therefore, we have not recorded any misappropriation losses for fiscal years 2008, 2007 The insurance proceeds, (gain) loss on recoveries and the investigation and related costs have been allocated to our segments based on the individual segments’ proportionate share of G&A costs to our total G&A costs.
The following table sets forth the components of the misappropriation loss for the years ended September 30, 2007, 2006, and 2005 and prior and related investigation expenses:
| | | | | | | | | | | | | | | | |
| | | Years Ended September 30, | |
| (Dollars in thousands) | | Cumulative
Total | | | 2007 | | | 2006 | | | 2005
and Prior | |
Misappropriation loss | | $ | 36,600 | | | $ | — | | | $ | — | | | $ | 36,600 | |
Insurance proceeds from misappropriation loss | | | (2,000 | ) | | | (2,000 | ) | | | — | | | | — | |
(Gain) loss on recoveries | | | (15,963 | ) | | | 11 | | | | (1,613 | ) | | | (14,361 | ) |
| | | | | | | | | | | | | | | | |
Insurance proceeds and gain on recoveries, net of misappropriation loss | | | 18,637 | | | | (1,989 | ) | | | (1,613 | ) | | | 22,239 | |
| | | | | | | | | | | | | | | | |
Legal fees | | | 9,155 | | | | 1,541 | | | | 5,270 | | | | 2,344 | |
Forensic accounting fees and related costs | | | 12,919 | | | | 2,185 | | | | 7,885 | | | | 2,849 | |
Other | | | 1,413 | | | | 76 | | | | 1,084 | | | | 253 | |
| | | | | | | | | | | | | | | | |
Investigation and related costs | | | 23,487 | | | | 3,802 | | | | 14,239 | | | | 5,446 | |
| | | | | | | | | | | | | | | | |
Total | | $ | 42,124 | | | $ | 1,813 | | | $ | 12,626 | | | $ | 27,685 | |
| | | | | | | | | | | | | | | | |
We do not expect to incur any additional expenses for legal fees or forensic accounting fees and related costs in fiscal year 2009. We expect to incur approximately $25,000 in other expenses relating to the maintenance of assets held for sale included in other non-current assets in the accompanying balance sheet as of September 30, 2008.
Year Ended September 30, 2007 Compared to Year Ended September 30, 2006
Engineering Fees
| | | | | | | | | | | | | |
| | | Years Ended September 30, | |
| (Dollars in thousands) | | 2007 | | 2006 | | $ Change | | | % Change | |
Transportation Services | | $ | 232,600 | | $ | 205,951 | | $ | 26,649 | | | 12.9 | % |
Construction Management | | | 57,798 | | | 81,860 | | | (24,062 | ) | | -29.4 | % |
Civil Engineering | | | 162,959 | | | 140,683 | | | 22,276 | | | 15.8 | % |
Environmental Services | | | 128,108 | | | 108,748 | | | 19,360 | | | 17.8 | % |
| | | | | | | | | | | | | |
Total Engineering Fees | | $ | 581,465 | | $ | 537,242 | | $ | 44,223 | | | 8.2 | % |
| | | | | | | | | | | | | |
Engineering fees for the year ended September 30, 2007, were $581.5 million compared to $537.2 million in 2006, representing an 8.2% increase. A portion of the increase in engineering fees resulted from adjustments to the accrued reimbursement liability during fiscal year 2007. Based on settlements to date and new information, the Company has changed its estimate of the accrued reimbursement liability and has recorded a reduction in the liability with a corresponding increase in engineering fees in the amount of $4.5 million during fiscal year 2007.
41
All segments, except for the Construction Management segment contributed to the increase in engineering fees in fiscal year 2007 when compared to fiscal year 2006. The backlog volumes increased by 14.5% in the year ended September 30, 2007 from $487.0 million at September 30, 2006 to $557.5 million at September 30, 2007. All segments experienced increases in backlog volumes at September 30, 2007 when compared to the backlog volumes at September 30, 2006.
Engineering fees from the Transportation Services segment increased 12.9% to $232.6 million in fiscal year 2007 from $206.0 million in fiscal year 2006. The increase in engineering fees was due primarily from an increase in workload in the National Services projects due to additional projects with the ANGB and the Western Region structures group. The increase in engineering fees during the year ended September 30, 2007 was partly offset by declining engineering fees in the Central Region resulting from the temporary work stoppage on bidding for new jobs with the TxDOT. The backlog volumes for the Transportation Services segment at September 30, 2007 increased by 8.1% to $261.2 million from $241.7 million at September 30, 2006.
Our Construction Management engineering fees decreased 29.4% to $57.8 million in fiscal year 2007 from $81.9 million in fiscal year 2006. The decrease in engineering fees was due primarily to delays in starting projects with various DOTs and the winding down of jobs in Texas and Arkansas. This decrease was partly offset by increases in engineering fees from additional work approved with the Army Corps of Engineers in New Orleans and our construction consulting practice in the Southeast Region. The backlog volumes for the Construction Management segment at September 30, 2007 increased by 33.8% to $95.9 from $71.7 million at September 30, 2006.
In the Civil Engineering segment, engineering fees increased 15.8% to $163.0 million in fiscal year 2007 from $140.7 million in fiscal year 2006. The increase in engineering fees was primarily attributable to additional work assignments on several large fixed price contracts with FEMA in New Mexico, MEMA in Mississippi and additional assignments from contracts with the Department of Defense in the East, Southeast and Gulf Coast Regions. Also contributing to the increase in engineering fees was the expansion of services in the Gulf Coast Region and additional projects in the resort and entertainment markets. The increase in engineering fees was partly offset by the slow down in business activity in the private sector residential market, especially in the California and Southwest markets, which affected the engineering components of our private sector land development services. Also partly offsetting the increase in engineering fees for the year ended September 30, 2007 when compared to the same period in 2006 was the completion, in the third quarter of fiscal 2006, of work related to the administration and management of debris removal from the large response projects resulting from the calendar years 2004 and 2005 hurricanes that hit Florida. The backlog volumes for the Civil Engineering segment increased by 39.2% to $82.8 million at September 30, 2007 when compared to $59.5 million at September 30, 2006.
Engineering fees in our Environmental Services segment increased 17.8% to $128.1 million in fiscal year 2007 from $108.7 million in fiscal year 2006. The increase was principally due to the EIP Associates acquisition, which was acquired on April 30, 2006. The year-over-year increase in engineering fees from the EIP acquisition was $12.8 million. The backlog volumes for the Environmental Services segment at September 30, 2007 increased by 3.2% to $117.6 million from $114.0 million at September 30, 2006.
Net Earned Revenues
| | | | | | | | | | | | | |
| | | Years Ended September 30, | |
| (Dollars in thousands) | | 2007 | | 2006 | | $ Change | | | % Change | |
Transportation Services | | $ | 173,674 | | $ | 158,283 | | $ | 15,391 | | | 9.7 | % |
Construction Management | | | 47,531 | | | 66,361 | | | (18,830 | ) | | -28.4 | % |
Civil Engineering | | | 134,268 | | | 120,447 | | | 13,821 | | | 11.5 | % |
Environmental Services | | | 102,452 | | | 86,516 | | | 15,936 | | | 18.4 | % |
| | | | | | | | | | | | | |
Total Net Earned Revenues | | $ | 457,925 | | $ | 431,607 | | $ | 26,318 | | | 6.1 | % |
| | | | | | | | | | | | | |
42
NER was $457.9 million during the year ended September 30, 2007 as compared to $431.6 million in the same period in 2006, representing a 6.1% increase. This increase was partly related to the increase in engineering fees, as previously explained.
| | | | | | | | | | | | |
| | | Years Ended September 30, | |
| (Dollars in thousands) | | 2007 | | % of
NER | | | 2006 | | % of
NER | |
Transportation Services | | $ | 58,926 | | 33.9 | % | | $ | 47,668 | | 30.1 | % |
Construction Management | | | 10,267 | | 21.6 | % | | | 15,499 | | 23.4 | % |
Civil Engineering | | | 28,691 | | 21.4 | % | | | 20,236 | | 16.8 | % |
Environmental Services | | | 25,656 | | 25.0 | % | | | 22,232 | | 25.7 | % |
| | | | | | | | | | | | |
Total Direct Reimbursable Expenses | | $ | 123,540 | | 27.0 | % | | $ | 105,635 | | 24.5 | % |
| | | | | | | | | | | | |
In addition, the change in our NER is affected by the fluctuation in our direct reimbursable expenses. Direct reimbursable expenses is primarily comprised of subcontractor costs and other direct non-payroll reimbursable charges including travel and travel related costs, blueprints, reproductions, CADD/computer charges and equipment where we are responsible for procurement and management of such cost components on behalf of our clients. These direct reimbursable expenses are principally passed through to our clients with minimal or no mark-up. As a percentage of NER, direct reimbursable expenses increased by 2.5% to 27.0% in the year ended September 30, 2007 from 24.5% in the same period in 2006. All segments experienced an increase except for Construction Management.
Direct reimbursable expenses in the Transportation Services segment experienced an increase of 23.6% in fiscal year 2007 when compared to fiscal year 2006. As a percentage of NER, direct reimbursable expenses increased by 3.8% to 33.93% in fiscal year 2007 from 30.1% in fiscal year 2006. The increase primarily resulted from the high usage of subconsultants in connection with the additional workload attributable to the National Services’ projects.
In our Construction Management segment, direct reimbursable expenses as a percentage of NER decreased by 1.8% to 21.6% in fiscal year 2007 from 23.4% in fiscal year 2006. This decrease was primarily due to the decrease in engineering fees experienced in fiscal year 2007 when compared to fiscal year 2006 and a market shift from direct reimbursable projects to more lump sum and all-inclusive billing rates contracts in the Central and Southeast regions. The shift started in fiscal year 2006 and has continued into fiscal year 2007.
Direct reimbursable expenses in the Civil Engineering segment increased as a percentage of NER by 4.6% to 21.4% in fiscal year 2007 from 16.8% in fiscal year 2006. The increase was primarily due to the substantial use of subconsultants in connection with the FEMA, MEMA and the Department of Defense projects. The increase was partially offset by a decrease in the use of subconsultants in the private sector land development services and a reduction in travel and meals costs as the result of the completion, in June 2006, of the work related to debris removal from the Florida hurricanes in calendar 2004 and 2005. During the year ended September 30, 2006, the Civil Engineering segment incurred direct reimbursable costs, including travel and lodging costs, for the employees overseeing debris removal in the areas affected by the disasters.
Our Environmental Services segment experienced an increase of 15.4% in direct reimbursable expenses in fiscal year 2007 when compared to fiscal year 2006. This increase was due primarily to the use of subcontractors required with the contracts acquired with the EIP acquisition. As a percentage of NER, direct reimbursable expenses decreased by 0.7% to 25.0% in fiscal year 2007 from 25.7% in fiscal year 2006. The decrease was due primarily to a proportionately higher growth in NER in relation to the increase in direct reimbursable expenses.
43
Operating Income
| | | | | | | | | | | | | | |
| | | Years Ended September 30, | |
| (Dollars in thousands) | | 2007 | | | % of
NER | | | 2006 | | | % of
NER | |
Transportation Services | | $ | 11,543 | | | 6.6 | % | | $ | 7,255 | | | 4.6 | % |
Construction Management | | | 3,226 | | | 6.8 | % | | | 2,367 | | | 3.6 | % |
Civil Engineering | | | 4,534 | | | 3.4 | % | | | 621 | | | 0.5 | % |
Environmental Services | | | 9,662 | | | 9.4 | % | | | 212 | | | 0.2 | % |
| | | | | | | | | | | | | | |
Total Operating Income | | | 28,965 | | | 6.3 | % | | | 10,455 | | | 2.4 | % |
Gain on recoveries net of misappropriation loss | | | (1,989 | ) | | -0.4 | % | | | (1,613 | ) | | -0.4 | % |
Investigation and related costs | | | 3,802 | | | 0.8 | % | | | 14,239 | | | 3.3 | % |
| | | | | | | | | | | | | | |
Total Operating Income before Gain on Recoveries net of Misappropriation Loss and Investigation and Related Costs | | $ | 30,778 | | | 6.7 | % | | $ | 23,081 | | | 5.3 | % |
| | | | | | | | | | | | | | |
Operating income was $29.0 million during the year ended September 30, 2007 as compared to $10.5 million in the same period in 2006, representing an increase of 177.0%. The increase in total operating income was primarily the result of a decrease in investigation and related costs of $10.4 million and a $2.8 million gain recognized on the sale-leaseback of the Doral office building, which is included in general and administrative costs. Also contributing to the increase in operating income for the year ended September 30, 2007 when compared to the same period in 2006 was the growth in engineering fees, principally due to the EIP acquisition. The increase in operating income was offset by a decline in business activity, especially in the residential markets of California and the Southwest, which most affected the engineering components of our private sector land development services and the temporary stoppage in bidding for new jobs with the TxDOT. Operating income was also negatively impacted by the strategic retention of professional staff to maintain our readiness response capabilities to any disaster projects and by a decrease in chargeability caused by the slowdown in business activity from the stoppage in bidding for new jobs with the TxDOT, bad winter weather and delays in starting jobs. Operating income, as a percentage of NER, increased by 3.9% to 6.3% in the year ended September 30, 2007 from 2.4% in the same period in 2006.
We believe that operating income before gain on recoveries and investigation and related costs is a useful measure in evaluating our results of operations because the gain on recoveries, and investigation and related costs are unusual items which do not reflect the costs or revenues of our provision of services in the given year. While the misappropriations occurred over a long period, the recoveries and investigation costs are realized when recovered or incurred and not in relation to the period when the misappropriations occurred. We believe this measure is helpful for us and for our investors to evaluate the results of our operations and make comparisons between periods.
Operating income before insurance proceeds and gain on recoveries, net of investigation and related costs, was $30.8 million during the year ended September 30, 2007 as compared to $23.1 million in the same period in 2006, representing an increase of 33.4%. As a percentage of NER, operating income before insurance proceeds and gain on recoveries, net of investigation and related costs increased by 1.4% to 6.7% in the year ended September 30, 2007 from 5.3% in the same period in 2006. This improvement was primarily due to the growth in engineering fees, principally due to the EIP, which accounted for a major portion of the increase in engineering fees in fiscal year 2007 when compared to the same period in 2006. Also contributing to the improvement in operating results was $2.8 million gain recognized on the sale-leaseback of the Doral office building, which is included in general and administrative costs. The improvements in operating income before insurance proceeds and gain on recoveries, net of investigation and related costs were partly offset by a decline in business activity, especially in the residential markets of California and the Southwest, which most affected the engineering components of our private sector land development services and the temporary stoppage in bidding for new jobs with the TxDOT. Also impacting operating results was the strategic retention of professional staff to maintain
44
our readiness response capabilities to any disaster projects and by a decrease in chargeability caused by the slowdown in business activity, especially in the first half of the current fiscal year. Insurance proceeds and gain on recoveries and investigation and related costs, net are treated as corporate overhead costs, and as such, are allocated to each respective segment. The gain recognized on the sale-leaseback of the Doral property has been allocated to each respective segment. The allocation is based on the segments’ proportionate share of general and administrative costs to total Company general and administrative costs.
As a percentage of NER, the Transportation Services segment’s operating income increased by 2.0% to 6.6% in fiscal year 2007 from 4.6% in the same period in 2006. This increase was primarily due to a decrease in the allocation of investigation and related costs in fiscal year 2007 as compared to the same period in 2006. The increase was partly offset by a reduction in business activity resulting from the temporary stoppage in bidding for new jobs with the TxDOT and delays in getting new contracts executed and to a lesser extent, this segment also experienced low chargeability in some groups within the National Services group. As a percentage of NER, the Transportation Services segment’s operating income before insurance proceeds and gain on recoveries, net of investigation and related costs decreased by 0.4% to 7.0% in the year ended September 30, 2007 from 7.4% in the same period in 2006.
The Construction Management segment experienced an increase in operating income, as a percentage of NER of 3.2% in the year ended September 30, 2007 when compared to the same period in 2006. This increase was primarily driven by a decrease in the allocation of investigation and related costs. Also contributing to the increase in operating income was a reduction of general and administrative costs resulting primarily from settlements of vehicle liability claims and a reduction in vehicle insurance charges. The increase in operating income was partly offset by delays in getting jobs started and the winding down of jobs in Texas and Arkansas and work stoppage from the bad winter weather, which started sooner and lasted longer than the prior year. As a percentage of NER, operating income before insurance proceeds and gain on recoveries, net of investigation and related costs increased by 3.2% to 6.8% in fiscal year 2007 from 3.6% in the same period in 2006.
As a percentage of NER, the Civil Engineering segment operating income increased by 2.9% to 3.4% in fiscal year 2007 from 0.5% in the same period in 2006. This increase was primarily driven by a decrease in the allocation of investigation and related costs. Also contributing to the increase in operating income in fiscal year 2007 over the same period in 2006 were the additional engineering fees generated from several fixed price contracts with FEMA and MEMA and additional services performed under several contracts with the Department of Defense. This increase was partly offset by a decline in the residential market, especially in the California and Southwest markets, which affected the engineering components of our private sector land development services and to an increase in indirect salaries resulting from the strategic investment in the retention of professional staff to maintain our readiness response capabilities to any disaster project and less than optimum chargeability within the engineering components of the private sector. As a percentage of NER, operating income before insurance proceeds and gain on recoveries, net of investigation and related costs increased by 2.9% to 3.4% in the year ended September 30, 2007 from 0.5% in the same period in 2006.
The Environmental Services segment experienced an increase in operating income, as a percentage of NER, of 9.2% to 9.4% in fiscal 2007 from 0.2% in the same period in 2006. This increase was principally driven by the growth in engineering fees from the EIP acquisition, as previously explained, and improvements in chargeability and utilization of the professional staff. Also contributing to the improvements in operating income was a decrease in the allocation of investigation and related costs in fiscal year 2007 over the same period in 2006. As a percentage of NER, the Environmental Services operating income before insurance proceeds and gain on recoveries, net of investigation and related costs increased by 9.2% to 9.4% in the year ended September 30, 2007 from 0.2% in the same period in 2006.
Costs
Costs consist principally of direct salaries and direct costs that are chargeable to clients and overhead and general and administrative expenses.
45
Direct Salaries and Direct Costs
| | | | | | | | | | | | |
| | | Years Ended September 30, | |
| (Dollars in thousands) | | 2007 | | % of
NER | | | 2006 | | % of
NER | |
Transportation Services | | $ | 64,503 | | 37.1 | % | | $ | 58,274 | | 36.8 | % |
Construction Management | | | 18,531 | | 39.0 | % | | | 26,302 | | 39.6 | % |
Civil Engineering | | | 47,942 | | 35.7 | % | | | 44,398 | | 36.9 | % |
Environmental Services | | | 33,788 | | 33.0 | % | | | 29,407 | | 34.0 | % |
| | | | | | | | | | | | |
Direct Salaries and Direct Costs | | $ | 164,764 | | 36.0 | % | | $ | 158,381 | | 36.7 | % |
| | | | | | | | | | | | |
Direct salaries and direct costs primarily include direct salaries and to a lesser extent unreimburseable direct costs. Direct salaries include compensation earned primarily by our technical professionals, whose billable labor gets charged back to our clients. Direct costs totaled $1.1 million and $1.7 million in fiscal year 2007 and 2006, respectively. Direct salaries and direct costs were $164.8 million in the year ended September 30, 2007, as compared to $158.4 million in the same period in 2006, representing a 4.0% increase. This increase is directly related to the increase in engineering fees. As a percentage of NER, direct salaries and direct costs decreased by 0.7% to 36.0% in fiscal year 2007 from 36.7% in fiscal year 2006.
Direct salaries and direct costs in the Transportation Services segment increased 10.7% to $64.5 million in the year ended September 30, 2007 from $58.3 million in the same period in 2006. As a percentage of NER, direct salaries and direct costs increased by 0.3% to 37.1% in fiscal year 2007 from 36.8% in the same period in 2006, reflecting direct salaries incurred in anticipation of executing new contract assignments.
Direct salaries and direct costs in the Construction Management segment decreased 29.5% to $18.5 million in the year ended September 30, 2007 from $26.3 million in the same period in 2006. This decrease was due to reduction of professional staff related to the reduction in engineering fees. As a percentage of NER, direct salaries and direct costs decreased by 1.3% to 38.2% in fiscal year 2007 from 39.5% in the same period in 2006. This decrease was due to the efficient utilization of the professional staff as a result of the increase in fixed price contracts.
Direct salaries and direct costs in the Civil Engineering segment increased by 8.0% to $47.9 million in the year ended September 30, 2007 from $44.4 million in the same period in 2006. As a percentage of NER, direct salaries and direct costs decreased by 1.2% to 35.7% in fiscal year 2007 from 36.9% in the same period in 2006. This decrease was due in part from the higher utilization of our professional staff, which resulted in high labor margin performance and a proportionately higher increase in NER in relation to the increase in direct salaries and direct costs.
Direct salaries and direct costs in the Environmental Services segment increased 14.9% to $33.8 million in the year ended September 30, 2007 from $29.4 million in the same period in 2006. This increase was due primarily to the professional staff added with the acquisitions of EIP, as previously explained. As a percentage of NER, direct salaries and direct costs decreased by 1.0% to 33.0% in fiscal year 2007 from 34.0% in the same period in 2006. This decrease was due primarily to high labor margin performance coupled with tight controls over headcount.
General and Administrative Costs, including Indirect Salaries
The other component of costs is indirect costs, which include indirect salaries, and general and administrative costs.
46
Indirect Salaries
| | | | | | | | | | | | |
| | | Years Ended September 30, | |
| (Dollars in thousands) | | 2007 | | % of
NER | | | 2006 | | % of
NER | |
Transportation Services | | $ | 37,502 | | 21.6 | % | | $ | 32,563 | | 20.6 | % |
Construction Management | | | 9,415 | | 19.8 | % | | | 12,082 | | 18.2 | % |
Civil Engineering | | | 30,502 | | 22.7 | % | | | 26,004 | | 21.6 | % |
Environmental Services | | | 22,966 | | 22.4 | % | | | 20,703 | | 23.9 | % |
| | | | | | | | | | | | |
Total Indirect Salaries | | $ | 100,385 | | 21.9 | % | | $ | 91,352 | | 21.2 | % |
| | | | | | | | | | | | |
Indirect salaries include compensation primarily for administrative staff and to a lesser extent professional staff that is not chargeable to clients. Indirect salaries increased 9.9% to $100.4 million in fiscal year 2007 from $91.4 million in fiscal year 2006. Indirect salaries as a percentage of NER increased 0.7% to 21.9% in fiscal year 2007 from 21.2% in fiscal year 2006.
The Transportation Services segment experienced an increase in indirect salaries of 15.2% to $37.5 million in the year ended September 30, 2007 from $32.6 million in the same period in 2006. As a percentage of NER, indirect salaries increased by 1.0% to 21.6% in fiscal year September 30, 2007 from 20.6% in the same period in 2006. Transportation Services segment was impacted by the temporary stoppage on bidding for new jobs with the TxDOT, the addition of professional staff in anticipation of contracts approval and expenditures in business development.
The Construction Management segment experienced a decrease in indirect salaries of 22.1% to $9.4 million in the year ended September 30, 2007 from $12.1 million in the same period in 2006. As a percentage of NER, indirect salaries increased by 1.5% to 19.8% in the fiscal year ended September 30, 2007 from 18.2% in the same period in 2006. The increase in indirect salaries was due primarily to the retention of key administrative and professional staff in anticipation of getting approvals on several contracts in the Central and Western Regions and work stoppage resulting from the severe winter weather, which started sooner and lasted longer than the prior year.
The Civil Engineering segment experienced an increase in indirect salaries of 17.3% to $30.5 million in the year ended September 30, 2007 from $26.0 million in the same period in 2006. As a percentage of NER, indirect salaries increased by 1.1% to 22.7 % in fiscal year ended September 30, 2007 from 21.6% in the same period in 2006. This increase was primarily due to the strategic retention of administrative and professional staff in maintaining our readiness capabilities to respond to disaster projects and investment in growing the Federal market program. To a lesser extent, the less than optimum chargeability within the engineering components of the private sector also contributed to the increase in indirect salaries.
Indirect salaries in our Environmental Services segment increased by 10.9 % to $23.0 million in the year ended September 30, 2007 from $20.7 million in the same period in 2006. Indirect salaries, as a percentage of NER decreased by 1.5% to 22.4% in fiscal year ended September 30, 2007 from 23.9% in the same period in 2006. The decrease was primarily due to higher utilization of our professional staff, which resulted in high labor margin performance.
47
General and Administrative Costs
| | | | | | | | | | | | |
| | | Years Ended September 30, | |
| (Dollars in thousands) | | 2007 | | % of
NER | | | 2006 | | % of
NER | |
Transportation Services | | $ | 59,461 | | 34.2 | % | | $ | 55,757 | | 35.2 | % |
Construction Management | | | 16,178 | | 34.0 | % | | | 23,724 | | 35.7 | % |
Civil Engineering | | | 50,723 | | 37.8 | % | | | 45,784 | | 38.0 | % |
Environmental Services | | | 35,636 | | 34.8 | % | | | 33,528 | | 38.8 | % |
| | | | | | | | | | | | |
Total General and Administrative Costs | | $ | 161,998 | | 35.4 | % | | $ | 158,793 | | 36.8 | % |
| | | | | | | | | | | | |
G&A costs increased 2.0% to $162.0 million in fiscal year 2007 from $158.8 million in fiscal year 2006. The majority of the increase was related to increased rent expense for real estate of $2.0 million resulting primarily from renewals of existing leases and new lease agreements. The upgrade of our financial systems contributed to increases in travel and related expenses of $1.9 million and computer software and related costs of $1.4 million. Our medical insurance premiums and flex benefits increased by $1.7 million resulting from rising costs and the provision for post retirement benefits of $1.7 million also contributed to the increase in G&A. There were also increases in vehicle and equipment leases, repairs and maintenance and payroll tax expenses. The increase in G&A in fiscal year 2007 over fiscal year 2006 was partly offset by the gain recognized on the sale-leaseback of the Doral office building of $2.8 million and decreases in legal fees and legal settlements and professional fees of $1.8 million and a decrease in incentive compensation of approximately $850,000. Most of these costs are generally considered corporate costs which benefit all segments and are allocated to the respective segments based on the individual segments’ proportionate share of G&A costs as compared to our total G&A costs. G&A as a percentage of NER decreased by 1.4% to 35.4% in the year ended September 30, 2007 from 36.8% in the same period in 2006. The decrease in G&A, as a percentage of NER, was due primarily to the decrease in legal fees and legal settlements and the gain recognized on the sale-leaseback of the Doral office building.
Insurance Proceeds, (Gain) loss on recoveries, and Investigation and Related Costs
As described elsewhere in this Annual Report, during fiscal year 2007, we recognized $2.0 million in insurance proceeds related to a claim we filed under our insurance policy to cover fiduciary and crime liability. During fiscal year 2006, we recorded a gain from recovered assets totaling $1.6 million. The gain of $1.6 million for fiscal year 2006 included $1.4 million gain related to real estate assets recovered which were classified as assets held for sale. Additionally, in fiscal year 2007 and 2006, we incurred $3.8 million and $14.2 million, respectively, in costs to investigate and quantify the impact of the embezzlement, and in costs related to the recovery and maintenance of certain assets. We have not discovered and do not expect to discover any additional misappropriations, and therefore, we have not recorded any misappropriation losses for fiscal years 2007 and 2006. The insurance proceeds, (gain) loss on recoveries and the investigation and related costs have been allocated to our segments based on the individual segments’ proportionate share of G&A costs to our total G&A costs.
Consolidated Results
Net Income:
Net income was $15.5 million, $19.1 million, and $5.4 million for fiscal years 2008, 2007, and 2006, respectively. The percentage of net income to NER was 3.3%, 4.2%, and 1.3% for fiscal years 2008, 2007, and 2006.
The decrease in net income for fiscal year 2008 as compared to fiscal year 2007 was due primarily to a decrease in demand for our services caused by exceptionally poor market conditions, particularly in the private sector. The weakening of services resulted in marginal increases in engineering fees with a corresponding
48
decrease in utilization of our technical staff, which caused less than desirable labor margins and increased indirect salaries. The decrease in net income for fiscal year 2008 as compared to fiscal year 2007 was also impacted by a net decrease of $2.2 million in engineering fees resulting from adjustments to the accrued reimbursement liability. In fiscal 2008, the Company recognized $2.3 million in engineering fees $4.5 million in fiscal year 2007 from changes in estimate of the accrued reimbursement liability. Also contributing to the decrease in net income in fiscal year 2008 as compared to fiscal year 2007 was an increase in general and administrative expenses mostly offset by a decrease in investigation and related costs of $3.8 million. The decrease in net income also benefited from a decrease in our effective tax rate. The reduction in the effective tax rate was due primarily to a decrease in non-deductible expenses, partly offset by a reduction in Federal tax credits and lower reversal of the tax contingency accrual during the year. The effective tax rate decreased to 24.1% in fiscal year 2008 from 30.7% in fiscal year 2007.
The significant improvement in net income in fiscal year 2007, as compared to fiscal year 2006, was primarily the result of a decrease in investigation and related costs of $10.4 million and $2.8 million gain recognized on the sale-leaseback of the Doral office building. The increase in net income was also impacted by a decrease in our effective tax rate. The reduction in the effective tax rate was due primarily to a decrease in non-deductible expenses, partly offset by a reduction in Federal tax credits and lower reversal of the tax contingency accrual during the year. Net income in fiscal year 2007 also benefited from an increase in engineering fees resulting primarily from the EIP acquisition and a change in estimate of the accrued reimbursement liability, which resulted in a reduction in the liability with a corresponding increase in engineering fees of $4.5 million, without any corresponding costs and expenses. The increase in net income was partly offset by a decline in business activity, especially in the residential markets of California and the Southwest, which most affected the engineering components of our private sector land development services and the temporary stoppage in bidding for new jobs with the TxDOT. Additionally, the increase in net income was partly offset by an increase in indirect labor resulting from the strategic retention of professional staff to maintain our readiness response capabilities to any disaster projects, delays in getting new jobs approved and the impact of the severe winter weather in the current year.
Income Taxes:
The income tax provision was $4.9 million and $8.4 million, or an effective tax rate of 24.1% and 30.7%, for the years ended September 30, 2008 and 2007, respectively. The reduction in the effective tax rate in fiscal year 2008 as compared to fiscal year 2007 was due primarily to the reversal of a portion of the tax contingency accrual and a decrease in the effective state income tax rate.
Our effective tax rate is based on income, statutory tax rates, and tax planning opportunities available in the various jurisdictions in which we operate. Significant judgment is required in determining the effective tax rate and in evaluating our tax positions. We established reserves when, despite our belief that the tax return positions are fully supportable, we believe that certain positions, if challenged, will likely be resolved unfavorably to us. These reserves are adjusted in light of changing facts and circumstances, such as the progress of a tax audit or current developments in tax law. Our annual tax rate includes the impact of reserve provisions and changes to reserves. While it is often difficult to predict the final outcome or the timing of resolution of any particular matter, we believe that our reserves reflect the probable outcome of known tax contingencies. Resolution of the tax contingencies would be recognized as an increase or decrease to our tax rate in the period of resolution.
During the years ended September 30, 2008 and 2007, the Federal statute of limitations expired on returns for years ended September 30, 2004 and 2003. The Company is no longer subject to U.S. Federal examination for these years. As a result, the Company reduced its tax contingency accrual by $3.0 million and $3.2 million, respectively. As a result of the implementation of FIN 48, we increased our tax accrual by $2.7 million. In addition, for the year ended September 30, 2008, we increased our tax contingency accrual by $6.9 million which included $6.3 million for which no tax benefit has been recognized. The net changes in the tax contingency accrual recorded in the tax provision reduced our effective tax rate by 11.6% and 5.3% for the years ended
49
September 30, 2008 and 2007, respectively. We have recorded a tax contingency accrual of $17.6 million and $11.0 million as of September 30, 2008 and 2007, respectively related primarily to research and development tax credits taken on our tax returns. The tax accruals are presented in the accompanying consolidated balance sheets within other liabilities.
On February 21, 2008, the Company filed an application with Internal Revenue Service to change its overall method of tax reporting from the cash method to the accrual method, effective with the tax year ending September 30, 2008. The effect of this change is to increase the estimated current taxable income by approximately $99 million on a pro rata basis over the next four years. This method change had no impact on the Company’s overall provision for income taxes. The liability for the first year of the method change is included as a component in accounts payable and accrued expenses in the accompanying consolidated balance sheet as of September 30, 2008. The liability for the second year of the method change is included in the current deferred tax asset and the liability for the third and fourth years of the method change are included in non-current deferred income tax liability, in the accompanying consolidated balance sheet as of September 30, 2008.
The income tax provision was $8.4 million and $3.3 million, or an effective tax rate of 30.7% and 37.8%, for the years ended September 30, 2007 and 2006, respectively. The reduction in the effective tax rate in fiscal year 2007 as compared to fiscal year 2006 was due primarily to a decrease in non-deductible expenses, partly offset by a reduction in Federal tax credits and lower reversal of the tax contingency accrual.
During the years ended September 30, 2007 and 2006, the Federal statute of limitations expired on returns for years ended September 30, 2003 and 2002. The Company is no longer subject to U.S. Federal examination for these years. As a result, the Company reduced its tax contingency accrual by $3.2 million and $1.0 million, respectively. This decreased the Company’s effective tax rate by 11.4% and 11.9%, respectively. We have recorded a tax contingency accrual of $11.0 million and $12.5 million as of September 30, 2007 and 2006, respectively related primarily to research and development tax credits taken on our tax returns. The tax accruals are presented in the accompanying consolidated balance sheets within accounts payable and accrued expenses.
For the past several years, we have generated research and development tax credits related to certain qualifying costs. The qualifying costs relate primarily to our project costs which we believe involve technical uncertainty. These research and development costs were incurred in the course of providing services generally under long-term client projects. Because we have been unable to utilize the entire amount of research and development tax credits we have generated each year, the balance sheets reflect a deferred tax asset of approximately $203,000 and $5.7 million at September 30, 2007 and 2006, respectively, for the unused credit carry forwards. These research and development tax credit carry-forwards will expire beginning 2017 through 2022.
Other Income (Expense):
Interest expense for the years ended September 30, 2008, 2007 and 2006 was approximately $987,000, $1.5 million and $2.1 million, respectively. The reduction in the expense in fiscal years 2008 and 2007 as compared to the preceding fiscal year, respectively, was due primarily to the decrease in the average outstanding balance of the line of credit.
Other income for the years ended September 30, 2008, 2007 and 2006 was approximately $47,000, $98,000 and $302,000, respectively. The reduction in income in fiscal year 2008 as compared to 2007 was due primarily to the decrease in cash balance. The reduction in the income in fiscal year 2007 as compared to 2006 was due primarily to the sale of marketable securities which consisted of growth funds, growth and income funds and bond funds.
50
Liquidity and Capital Resources
During the fiscal year ended September 30, 2008, our primary sources of liquidity were cash flows from operations, borrowings under our credit lines, and proceeds from the sale of stock. During the fiscal year ended September 30, 2007, our primary sources of liquidity were cash flows from operations and proceeds from the sale-leaseback of property and proceeds from the sale of stock. In fiscal year 2007, we generated $21.4 million in net proceeds from the sale- leaseback of our Doral office building. In fiscal year 2007 we did not offer any common stock for sale to our employees until the final impact of the restatement of the Company’s 2005 and prior consolidated financial statements was determined and all SEC filing regulations had been met such as, the filing of quarterly and annual reports.
Our primary uses of cash have been to fund our working capital and capital expenditure needs, service our debt obligations, and the redemption of shares of our common stock during the year. Based on our past experience, we have been able to generate sufficient cash flows from operations and cash flows available under our credit facility to fund our operating and capital expenditure requirements, as well as to service our debt obligations, including our accrued client reimbursement liability and stock redemptions. We believe that we can generate sufficient cash flows from operations and cash flows available under our credit facility to fund our operating and capital expenditure requirements, as well as to service our debt obligations, for fiscal year 2009. In the event we experience a significant adverse change in our business operations or higher than expected stock redemptions, we would likely need to secure additional sources of financing, and we may not be able to obtain additional sources of funding at reasonable rates and terms.
Cash Flows from Operating Activities
Net cash provided by operating activities totaled $27.7 million in fiscal year 2008 as compared to $4.9 million for fiscal year 2007. The increase in net cash provided by operating activities in fiscal year 2008 from fiscal year 2007 was primarily due to a decrease in payments to clients related to the accrued reimbursement liability which reflects payments made to clients in fiscal year 2007 for the overstatement of overhead rates, an increase in accounts payable and accrued expenses, partially due to a book overdraft of $5.5 million at September 30, 2008, an increase in other liabilities primarily attributable to an increase tax contingency reserves, and a slight decrease in unbilled fees during fiscal year 2008 due to a push in billings at fiscal year end compared to a large increase in fiscal 2007. The increase in net cash provided by operating activities was partly offset by an increase in accounts receivable.
Net cash provided by operating activities totaled $4.9 million in fiscal year 2007 as compared to $10.9 million for fiscal year 2006. The decrease in net cash provided by operating activities in fiscal year 2007 from fiscal year 2006 was primarily due to an increase in unbilled fees resulting from the increase in engineering fees, principally from the EIP acquisition and increase in business activity and a reduction in the accrued reimbursement liability. The decrease in net cash provided by operating activities was partly offset by a significant reduction in investigation and related costs and cash flows from projects resulting from the growth in engineering fees, as previously explained. Cash flows from projects benefited from a decrease in accounts receivable resulting from collections in excess of amounts billed during the periods.
Our operating cash flows are heavily influenced by changes in the levels of accounts receivables, unbilled fees and billings in excess of cost. Unbilled fees are created when we recognize revenue. The unbilled fees are normally invoiced the month after the revenue is recognized unless there are contractual provisions which dictate the timing of billing. Unbilled fees which are not invoiced the month following revenue are normally invoiced within the following two months. These account balances as well as days sales outstanding, or DSO, in account receivable and unbilled fees, net of billings in excess of cost, can vary based on contract terms and contractual milestones and the timing and size of cash receipts. DSO increased to 103 days for the fiscal year ended September 30, 2008, from 99 days for the fiscal year ended September 30, 2007. We calculate DSO by dividing accounts receivables, net and unbilled fees less billings in excess of cost by average daily gross revenue for the applicable period. The increase in DSO was driven by the increase in accounts receivable explained below.
51
Approximately 80% of our revenues are billed on a monthly basis. The remaining amounts are billed when we reach certain stages of completion as specified in the contract. Payment terms for accounts receivable and unbilled fees, when billed, are net 30 days. Unbilled fees were $76.7 million at September 30, 2008 which is relatively unchanged from $78.5 million at September 30, 2007.
Accounts receivable, net increased 22.8% to $102.5 million at September 30, 2008 from $83.5 million at September 30, 2007. The increase in accounts receivable is primarily related to an increase in engineering fees and billing in the fourth quarter of fiscal year 2008 compared to the same period in fiscal year 2007 and by delays in billing customers during the year due to the implementation of the ERP system. The allowance for doubtful accounts increased by 9.2% to $1.9 million, or 1.9% of accounts receivable, at September 30, 2008, from $1.8 million, or 2.1% of accounts receivable, at September 30, 2007. Overall the aging of accounts receivable at September 30, 2008 has slightly improved compared to the aging of accounts receivable at September 30, 2007 as the increase in account receivable is primarily in current balances. The increase in the allowance for doubtful accounts relates to several specific account receivable balances which aged during the current fiscal quarter. We continuously monitor collection efforts and assess the allowance of doubtful accounts. Based on this assessment at September 30, 2008, we have deemed our allowance for doubtful accounts to be adequate. Unbilled fees were $76.7 million at September 30, 2008 which is relatively unchanged from $78.5 million at September 30, 2007. As previously explained, unbilled fees remained unchanged even though revenue increased in the fourth quarter of fiscal year 2008 compared to the same period in fiscal year 2007 due to an increased emphasis on invoicing at year end in fiscal year 2008. Historically, unbilled fees are primarily related to work performed in the last month of the fiscal period. Billings usually occur in the month after we recognize the revenue of in accordance with the specific contractual provisions. Approximately 75% of the unbilled fees at September 30, 2008 were billed as of November 30, 2008. The remainder is expected to be billed within the next two months.
During fiscal year 2007, we incurred additional costs in connection with the investigations and with the restatement of our previously issued consolidated financial statements. The work related to the restatement was completed in fiscal year 2007. We did not incur any additional expenses for legal fees or forensic accounting fees and related costs related to the misappropriation in fiscal year 2008. We expect to incur approximately $25,000 in other expenses relating to the maintenance of assets held for sale included in other non-current assets in the accompanying balance sheet as of September 30, 2008. Additionally, we settled the majority of the pending client reimbursement liabilities as of September 30, 2008. At September 30, 2008 the balance in accrued reimbursement liability is $2.2 million, this amount is expected to be settled in fiscal year 2009.
Cash Flows from Investing Activities
During fiscal year 2008, net cash used in investing activities was $12.8 million, which resulted primarily from the purchases of property and equipment of $10.4 million and the acquisition of EcoScience for $2.0 million in cash. During fiscal year 2007, net cash provided from investing activities was $10.3 million, which resulted primarily from the proceeds of $21.4 million, on the sale-leaseback of the Doral office building, partly offset by purchases of property and equipment of $10.3. Purchases of property and equipment principally consist of purchases of survey equipment, computer systems, software applications, furniture and equipment and leasehold improvements.
In fiscal year 2008, we completed one acquisition. On February 29, 2008, the Company acquired 100% of the stock of EcoScience for $2.25 million, comprised of $2.0 million in cash, 6,750 shares of our common stock, Class A valued at approximately $200,000 and $50,000 held in escrow.
In fiscal year 2007, we made escrow payments relating to the EIP acquisition of approximately $200,000. There were no other payments for acquisitions, adjustments or earn-out payments on previous acquisitions. In fiscal years 2006, we made payments of $5.9 million for acquisitions and earn-out payments on a previous acquisition.
52
During fiscal year 2009, we anticipate our capital expenditures to be approximately $8.9 million, primarily for the acquisition of property and equipment.
Cash Flows from Financing Activities
Net cash used in financing activities for fiscal year 2008 was $19.3 million, as compared to $6.8 million for fiscal year 2007. The increase in net cash used in financing activities in fiscal year 2008 from fiscal year 2007 is primarily attributable to an increase in the payments for the repurchase of common stock from employees of $25.0 million, partly offset by a decrease in proceeds from sale of common stock of $2.1 million and an increase in net borrowings under the line of credit of $7.8 million.
Net cash used in financing activities for fiscal year 2007 was $6.8 million, as compared to $16.9 million for fiscal year 2006. The decrease in net cash used in financing activities in fiscal year 2007 from fiscal year 2006 is primarily attributable to a decrease in the payments for the repurchase of common stock from employees of $17.2 million, partly offset by a decrease in proceeds from sale of common stock of $4.3 million and an increase in employee shareholders’ loans of $1.6 million related to funds loaned by us to employee shareholders in connection with their purchase of stock through the internal window.
Pursuant to the terms of our credit agreement, we cannot declare or pay dividends in excess of 50% of our net income. We have not previously paid cash dividends on our common stock and have no present intention of paying cash dividends on our common stock in the foreseeable future, as we expect to retain all earnings for investment in our business.
Capital Resources
In November 2007, the Company renegotiated its existing line of credit agreement with Bank of America, N.A., which we refer to as the Bank, to increase our line of credit from $58 million to $60 million and to extend the maturity date from June 30, 2008 to October 31, 2011. As part of the extension agreement, substantially all of the terms and conditions remained the same and the minimum levels of net worth requirements were eliminated from the agreement. The line of credit agreement provides for the issuance of letters of credit. The letters of credit reduce the maximum amount available for borrowing. As of September 30, 2008 and 2007, we had letters of credit totaling $4.7 million and $1.9 million, respectively, including a letter of credit of $3.5 million in 2008 relating to bond insurance for PBSJ Constructors, Inc and $582,000 to guarantee insurance payments in both 2008 and 2007, respectively. No amounts have been drawn on any of these letters of credit. As a result of the issuance of these letters of credit, the maximum amount available for borrowing under the line of credit was $48.7 million and $56.1 million as of September 30, 2008 and 2007, respectively.
As of September 30, 2008 we had $6.6 million outstanding under the line of credit. As of September 30, 2007, there was no amount outstanding under our line of credit since the balance was paid back from the net cash flows generated from the sale-leaseback of the Doral office building. The maximum amount borrowed under our line of credit was $36.3 million and $36.0 million during fiscal year 2008 and 2007, respectively. Although our most significant source of cash has historically been generated from operations, in the event that cash flows from operations are insufficient to cover our working capital needs, we access our revolving line of credit facility.
The interest rate (3.53% and 5.85% at September 30, 2008 and 2007, respectively) ranges from LIBOR plus 50 basis points (currently in use) or Prime minus 125 basis points if our funded debt coverage ratio is less than 2.5. The range increases to LIBOR plus 75 basis points to Prime minus 100 basis points if our funded debt coverage ratio is between 2.5 to 3.0. The line of credit contains clauses requiring the maintenance of various covenants and financial ratios including a minimum coverage ratio of certain fixed charges, and a minimum leverage ratio of earnings before interest, taxes, depreciation, and amortization to funded debt. We were in compliance with all financial covenants under the line of credit as of September 30, 2008. The line of credit is collateralized by substantially all of our assets.
53
On March 19, 2001, we entered into a mortgage note with an original principal amount of $9.0 million due in monthly installments starting on April 16, 2001, with interest. Interest on the mortgage is one month LIBOR plus the floating rate margin of not less than 65 basis points and not greater than 90 basis points. A balloon payment is due on the mortgage on March 16, 2011. The effective interest rate on the mortgage note was 3.40% and 6.19% for the fiscal years ended September 30, 2008 and 2007, respectively. We were in compliance with all financial covenants and ratios as of September 30, 2008. The mortgage note is collateralized by our office building located in Orlando, Florida.
In October 2007, we negotiated a modification to the mortgage note thereby eliminating the minimum levels of net worth requirement from the mortgage note.
In October 2008, we refinanced the existing mortgage note with a new seven year mortgage note in the amount of $13.6 million due in monthly installments, including interest, over a twenty year amortization period with a balloon payment due on November 1, 2015. The interest rate on the mortgage note is based on LIBOR plus 2.27% per annum. In order to minimize the adverse impact of floating interest rate risks, we also entered into an interest rate swap agreement, which we refer to as the swap. The swap effectively converts the floating interest rate on the mortgage note to a fixed rate of 6.2%. The new mortgage note includes the same financial covenants as the line of credit.
Our capital expenditures are generally for purchases of property and equipment. We spent $10.4 million, $10.3 million, and $11.4 million on such expenditures in fiscal years 2008, 2007, and 2006, respectively. Our capital expenditures primarily consist of computer systems, software applications, furniture and equipment and leasehold improvement purchases.
We carry insurance to cover fiduciary and crime liability. These policies are renewed on an annual basis and were in effect for the periods in which the Participants misappropriated funds. We filed a claim under the annual crime policy for the period ending in April 2005, which we refer to as the 2005 Policy, to recover some of the misappropriation losses which resulted from the embezzlement. In January 2007, we received $2.0 million, the stated limit under the 2005 Policy. The insurance proceeds were recognized in insurance proceeds and gain on recoveries, net of misappropriation loss in the accompanying consolidated statement of operations for the year ended September 30, 2007. In August 2007, we filed suit seeking a declaration that the insurance carrier is obligated to us for losses suffered as a result of the embezzlement for policy years 1991 through 2004. The amount of recovery sought for those policy years is $17 million. In August 2008, the initial motion for summary judgment was denied by the court. The Company filed a notice of appeal in September 2008. At the present time, we are unable to predict the likely outcome of this legal action and accordingly have not recorded any insurance receivable.
The stock offering window usually takes place on an annual basis during the second fiscal quarter. The stock window allows full time and part time regular employees to purchase shares of Class A common stock and existing shareholders to offer shares of common stock for sale to us. Under our corporate bylaws, we have the right of first refusal to purchase these shares. If we decline to purchase the offered shares, they are offered to the Employee Profit Sharing and Stock Ownership Plan and Trust (ESOP) and then to all shareholders of the Company.
We cancelled the stock window for March 2007 because we were not current in filing our quarterly reports for fiscal 2007 with the SEC. Instead we authorized an internal market window for employee shareholders to purchase and sell shares of the Company in July 2007. We facilitated this internal window by matching employee shareholders who wished to purchase and sell. We had the option, but not the obligation, to purchase any unmatched sell shares that employee shareholders wished to sell and which did not have a matching employee shareholder purchaser. Eligible buyers were our employees and directors of the Company and the Company’s ESOP. At the end of the internal window, there were unmatched sell shares. We did not exercise our right to purchase the unmatched sell shares. The unmatched sell shares were next offered to the Company’s ESOP, which agreed to purchase all of the unmatched sell shares.
54
As a result of the internal window, the Company loaned funds for those shares that were matched to those employee shareholders who wished to sell their shares for the full amount due. Employee shareholders that wished to purchase matched shares were required to execute promissory notes and pledge share agreements as collateral for the notes. The notes were interest free and were due on December 28, 2007. At September 30, 2007, the outstanding balance of the notes was $1.9 million, of which, approximately $332,000 was classified as other current assets and the remaining balance of $1.6 million was included as a reduction of stockholders’ equity in the accompanying consolidated balance sheet. The outstanding balance of the notes at September 30, 2007 was collected in January 2008.
During the second quarter of fiscal year 2008, the Company opened the stock window for the purchase and/or redemption of shares by eligible employees and outside directors at a price of $29.68. Purchasers of shares were given several options for payment, including payroll deductions, balloon payments, up front cash or some combination thereof. The last payroll deduction will be on November 28, 2008. As a result of the stock window, the Company sold 127,418 shares, net of cancelled subscriptions, for an aggregate amount of $3.8 million. At September 30, 2008, the outstanding balance due to the Company on the shares sold was $1.5 million and is included in other current assets in the accompanying consolidated balance sheet.
During fiscal year 2008, the Company agreed to redeem 1.4 million shares held by employees who wished to redeem their shares in the fiscal year 2008 stock window or employees who terminated employment prior to September 30, 2008, for an aggregate amount of $38.5 million. As a result, the Company paid $29.0 million in cash during the year, and recorded a liability of $7.5 million and a promissory note of $2.0 million, reflected in stock redemption payable and other liabilities, respectively, in the accompanying consolidated balance sheet as of September 30, 2008.
We expect to open our fiscal year 2009 stock window in the second fiscal quarter.
We believe that our existing financial resources, together with our cash flow from operations and availability under our line of credit, will provide sufficient capital to fund our operations for fiscal year 2009.
Inflation
The rate of inflation has not had a material impact on our operations. Moreover, if inflation remains at its recent levels, it is not expected to have a material impact on our operations for the foreseeable future.
Off-Balance Sheet Arrangements
We do not have any off-balance sheet arrangements other than operating leases for most of our office facilities and certain equipment and letters of credit. Minimum operating lease obligations payable in future years are presented below in Contractual Obligations. The letters of credit reduce the maximum amount available for borrowing. As of September 30, 2008 and 2007, we had letters of credit totaling $4.7 million and $1.9 million, respectively, including a letter of credit of $3.5 million in 2008 relating to bond insurance for PBS&J Constructors, Inc and $582,000 to guarantee insurance payments in both 2008 and 2007, respectively. No amounts have been drawn on any of these letters of credit.
Related Party Transactions
We lease office space in a building which houses our Missoula, Montana operations from Cedar Enterprises, which is owned and controlled by Charlie K. Vandam. Mr. Vandam is a former owner of LWC and a Senior Group Manager of the Company. The lease was assumed in connection with our acquisition of LWC in February 2005. The lease has been extended to February 2009, and rental cost of the space is $9,900 per month.
We lease office space in a building which houses our Helena, Montana operations from Prickly Pear Enterprises, which is owned and controlled by Paul Callahan. Mr. Callahan is a former owner of LWC and a
55
Vice-President and Principle Project Director of the Company. The month-to-month lease was assumed in connection with our acquisition of LWC in February 2005. The rental cost of the space is $1,800 per month.
In fiscal year 2008 and 2007, we purchased $881 and $2,318, respectively, of products and services from PSMJ Resources, Inc. Frank A. Stasiowski, PSMJ Resources Inc.’s President and Chief Executive Officer is a member of our Board of Directors.
In fiscal year 2008 and 2007, Mr. Phillip Searcy, member of the PBSJ Board of Directors and Audit Committee, received payments from the Company totaling approximately $128,166 and $124,000 in accordance with his Supplemental Income Plan which originated when Mr. Searcy was employed with the Company. Mr. Searcy ceased full-time employment with the Company in 1996 and joined our Board of Directors in July 2005.
Pursuant to the Company’s by-laws, we are permitted to repurchase stock by delivery of a promissory note to the employee. On February 23, 2006 the Company repurchased 46,000 shares and 3,400 shares, respectively, of the Company’s stock from Richard Wickett, our former Chairman of the Board from 2002 to February 2005 and former Chief Financial Officer from 1993 to 2004, and Kathryn Wilson in the original principal amounts of $1.2 million and $92,000, respectively. The shares were repurchased for $27.00 per share which represents the September 30, 2004 share price, pending completion of the valuation of the Company’s stock as of September 30, 2005. In March 2006, we recorded an accrual of $49,400 for the difference between the purchase price and the September 30, 2005 share value of $28.00. At September 30, 2008, the notes bear interest at the rate of 7.5% per annum and such rate is adjusted to the then current prime rate of Bank of America on December 31st of each year. Accrued interest and $1 of principal is due monthly on the notes with all remaining principal and accrued interest due and payable on the five year anniversary of the date of issuance.
On February 13, 2007, we repurchased an additional 46,607 shares of our stock from Richard Wickett in the original principal amount of $1.0 million. The additional shares were purchased for $22.40 per share which represents 80% of the September 30, 2005 share price, pending completion of the valuation of our stock as of September 30, 2006. In March 2007, we recorded an accrual for the difference between the purchase price and the September 30, 2006 share value. At September 30, 2008, the notes bear interest at the rate of 7.5% per annum and such rate is adjusted to the then current prime rate of Bank of America on December 31st of each year. Accrued interest and $1 of principal is due monthly on the notes with all remaining principal and accrued interest due and payable on the five year anniversary of the date of issuance.
Both notes are subject to our right of set off, which permit us to set off all claims we may have against the payee against amounts due and owing under the notes. The balances of the notes and the accruals for the stock price differentials were $2.5 million at September 30, 2008 and 2007, respectively, and were included in other liabilities in the accompanying consolidated balance sheet.
During the third quarter of fiscal 2007, as permitted under certain conditions pursuant to the terms of the agreement, we discontinued payments, and the provision of other benefits, to Richard Wickett under his Supplemental Retirement Agreement. The agreement was determined to be forfeited by Richard Wickett due in part to his pleading guilty to a felony. As a result of the forfeiture, our projected benefit obligation, as defined under SFAS No. 158, “Employers’ Accounting for Defined Benefit Pension and Other Postretirement Plans” was reduced by $1.2 million ($809,000 after taxes) at September 30, 2007. The reduction in the liability was recognized in other comprehensive income and will be recognized as a component of net periodic pension cost based on the amortization provisions of SFAS 87. Additional information concerning Retirement Plans is set forth in Item 8, Note 8 of “Notes to Consolidated Financial Statements” which are included herein.
In November 2007, we reached a tentative agreement, which was finalized in November 2008, with a former senior executive to reduce the term of his Supplemental Retirement Agreement to five years. As a result of this agreement, the projected benefit obligation was reduced, as defined under SFAS No.158, “Employers’ Accounting for Defined Benefit Pension and Other Postretirement Plans” by approximately $415,000 ($280,000 after tax) at September 30, 2007. The reduction in the liability was recognized in other comprehensive income
56
and will be recognized as a component of net periodic pension cost based on the amortization provisions of SFAS 87. Additional information concerning Retirement Plans is set forth in Item 8, Note 8 of “Notes to Consolidated Financial Statements” which are included herein.
In July 2007, pursuant to our by-laws, we did not exercise our right of first refusal to redeem the shares offered for redemption by our former National Service Director and Senior Vice President. In accordance with our by-laws, the shares were next offered to our ESOP plan; the ESOP plan has agreed to redeem the shares over the course of five years. The first annual installment of 54,567 shares was redeemed on July 8, 2007 at the established valuation price of $24.34 for a total of $1.3 million. The ESOP redeemed the second annual installment of 10,940 shares, at the established valuation price of $29.68, on March 31, 2008. The remaining three equal installments of 33,261 shares will be redeemed in the second quarter of each fiscal year beginning with fiscal year 2009 by our ESOP plan at a price per share established by future valuations of our shares.
On August 20, 2008, Todd Kenner, a Director of the Company and the President of PBS&J Inc., submitted his written resignation. The Company and Todd Kenner entered into a Separation Agreement and Release, effective as of September 2, 2008. Under the terms of the Separation Agreement, the Company agreed to pay Mr. Kenner a cash severance benefit of $162,500 over a six month period, paid a lump sum benefit of $234,000 in exchange for termination of Mr. Kenner’s Supplemental Income benefits, and agreed to redeem Mr. Kenner’s 108,551 shares of common stock, Class A, including vested restricted stock, for $29.68 per share for a total $3.2 million. The Company paid Mr. Kenner a cash payment $1.2 million and delivered a promissory note in the amount of $2.0 million for the repurchase of the shares. The promissory note bears interest at the prime rate plus 1% (6.0% at September 30, 2008) and is adjusted on December 31st of each year. Payments begin October 1, 2008 and end on September 1, 2011.
Recent Accounting Pronouncements
In October 2008, the FASB issued FASB Staff Position Financial Accounting Standard 157-3, Determining the Fair value of a Financial Asset When the Market for That Asset Is Not Active, (“FSP 157-3”). FSP 157-3 clarifies the application of SFAS 157, “Fair Value Measurements” (“SFAS 157”) in a market that is not active and provides an example to illustrate key considerations in determining the fair value of a financial asset when the market for that financial asset is not active. FSP 157-3 is effective upon issuance and will be effective for the Company in October 2008. The Company does not believe the adoption of FSP 157-3 will have a material impact on our consolidated financial statements.
In May 2008, the FASB issued SFAS No. 162,The Hierarchy of Generally Accepted Accounting Principles (SFAS 162). SFAS 162 identifies the sources of accounting principles to be used in the preparation of nongovernmental entity financial statements and reflects the FASB’s belief that the responsibility for selecting the appropriate and relevant accounting principles rests with the entity. The FASB does not expect SFAS 162 to change current practice but in the rare circumstance there is a change from current practice, the statement includes transition provisions. This statement is effective 60 days following the SEC’s approval of the Public Company Accounting Oversight Board amendments to AU Section 411,The Meaning of Present Fairly in Conformity With Generally Accepted Accounting Principles. The Company does not expect the guidance in this standard to have a significant impact on its consolidated financial statements.
In April 2008, the FASB issued FASB Staff Position Financial Accounting Standard 142-3,Determination of the Useful Life of Intangible Assets(“FSP 142-3”). FSP 142-3 amends the factors that should be considered in developing renewal or extension assumptions used to determine the useful life of a recognized intangible asset under SFAS 142,Goodwill and Other Intangible Assets (“SFAS 142”). In developing assumptions about renewal or extensions, FSP 142-3 requires an entity to consider its own historical experience (or, if no experience, market participant assumptions) adjusted for the entity-specific factors in paragraph 11 of SFAS 142. FSP 142-3 expands the disclosure requirements of SFAS 142 and is effective for financial statements issued for fiscal years
57
beginning after December 15, 2008 and is effective for the Company at the beginning of fiscal year 2010. Early adoption is prohibited. The Company does not believe the adoption of FSP 142-3 will have a material impact on our consolidated financial statements.
In December 2007, the Financial Accounting Standard Board (“FASB”) issued Statement of Financial Accounting Standards (“SFAS”) No. 160 (“SFAS 160”),“Noncontrolling Interests in Consolidated Financial Statements” an amendment of ARB No. 51. This standard requires specific financial disclosures of consolidated noncontrolling interest with the objective of improving the relevance, comparability, and transparency of the financial information relating to noncontrolling interest in a consolidated subsidiary. The Company is required to adopt the recognition and related disclosure provisions of SFAS 160 beginning with interim periods of its fiscal year ending September 30, 2010; earlier adoption is prohibited. The Company does not believe the adoption of SFAS 160 will have a material impact on its consolidated financial statements.
In December 2007, the FASB issued SFAS No. 141 (revised 2007) (“SFAS 141(R)”),“Business Combinations”. The objective of this Statement is to improve the relevance, representational faithfulness, and comparability of the information that a reporting entity provides in its financial reports about a business combination and its effects. The Company is required to adopt the recognition and related disclosure provisions of SFAS 141(R) beginning with the interim periods of its fiscal year ending September 30, 2010; earlier adoption is prohibited. The Company is currently evaluating the impact of this statement on its consolidated financial statements.
On February 15, 2007, the Financial Accounting Standards Board (“FASB”) issued SFAS No. 159 (“SFAS 159”), “The Fair Value Option for Financial Assets and Financial Liabilities,” which allows an entity the irrevocable option to elect fair value for the initial and subsequent measurement for certain financial assets and liabilities on a contract-by-contract basis. Subsequent changes in fair value of these financial assets and liabilities would be recognized in earnings when they occur. SFAS 159 further establishes certain additional disclosure requirements. SFAS 159 is effective for the Company’s fiscal year ending September 30, 2009, with earlier adoption permitted. Management is currently evaluating the impact and timing of the adoption of SFAS 159.
In September 2006, FASB issued SFAS No. 158 (“SFAS 158”), “Employers’ Accounting for Defined Benefit Pension and Other Postretirement Plans”. This standard requires an employer to recognize the over funded or under funded status of a defined benefit postretirement plan (other than a multiemployer plan) as an asset or liability in its statement of financial position and to recognize changes in that funded status in the year in which the changes occur through comprehensive income. The Company was required to adopt the recognition and related disclosure provisions of SFAS 158 beginning with its fourth quarter of the fiscal year ended September 30, 2007. As a result, the Company recorded a pre-tax charge to accumulated other comprehensive income totaling $392,000 ($233,000 after tax). For additional information, see Note 8, “Retirement Plans.” The Company is also required to adopt the measurement provisions of SFAS 158 for the fiscal year ending September 30, 2009. This provision requires companies to measure plan assets and benefit obligations as of the date of the Company’s fiscal year-end. No change in measurement dates was necessary since the Company already meets this requirement.
In September 2006, the FASB issued SFAS No. 157. SFAS 157 prescribes a single definition of fair value as the price that would be received to sell an asset or paid to transfer a liability in an orderly transaction between market participants at the measurement date. The provisions of SFAS 157 were to be effective for the Company for the fiscal year ending September 30, 2009. In November 2007, the FASB reaffirmed the originally scheduled implementation date in accounting for financial assets and liabilities of financial institutions and provided a one year deferral for the implementation of SFAS 157 for other nonfinancial assets and liabilities. As a result, SFAS 157 is expected to be effective for the Company on October 1, 2010. The Company does not believe the adoption of SFAS 157 will have a material impact on its consolidated financial statements.
In September 2006, the SEC issued Staff Accounting Bulletin No. 108 (“SAB 108”). SAB 108 addresses how the effects of prior year uncorrected misstatements should be considered when quantifying misstatements in
58
current year financial statements. SAB 108 requires companies to quantify misstatements using a balance sheet and income statement approach and to evaluate whether either approach results in quantifying an error that is material in light of relevant quantitative and qualitative factors. When the effect of initial adoption is material, companies will record the effect as a cumulative effect adjustment to beginning of year retained earnings. SAB 108 was effective for the Company for the fiscal year ending September 30, 2007. We adopted SAB 108 in our first quarter of fiscal 2007. The adoption of SAB 108 did not have a material impact on our consolidated financial statements.
In July 2006, the FASB issued Interpretation (“FIN”) No. 48,“Accounting for Uncertainty in Income Taxes an interpretation of FASB No. 109” (“FIN 48”). This interpretation establishes guidelines and thresholds that must be met for the recognition and measurement of a tax position taken or expected to be taken on a tax return. The Company adopted FIN 48 in the first quarter of fiscal 2008, beginning on October 1, 2007. As a result of the adoption of FIN 48, the Company has recognized an increase in the liability for unrecognized tax benefits of $2.5 million and an increase of approximately $200,000 in accrued interest, which was accounted for as a reduction to the October 1, 2007 balance of retained earnings in the accompanying consolidated financial statements.
In December 2004, the FASB issued SFAS No. 123 (revised 2004),“Share-Based Payment” (“SFAS 123(R)”), which is a revision of SFAS No. 123,“Accounting for Stock-Based Compensation.” SFAS 123(R) supersedes APB Opinion No. 25, Accounting for Stock Issued to Employees. SFAS 123(R) requires all share-based payments to employees, including grants of employee stock options, to be recognized in the financial statements based on their fair values, beginning with the first annual period beginning after December 15, 2005, with early adoption encouraged. We have adopted SFAS 123(R) in our first quarter of fiscal year 2007, beginning October 1, 2006. The adoption of SFAS 123(R) resulted in the reclassification of the balance of unvested restricted stock as of September 30, 2006, in the amount of $3.1 million, as a credit to unearned compensation in stockholders’ equity and a corresponding reduction to additional paid-in capital for the same amount in the accompanying consolidated statements of stockholders’ equity for the year ended September 30, 2007.
Critical Accounting Policies
In the ordinary course of business, we make a number of estimates and assumptions relating to the reporting of results of operations and financial position in the preparation of financial statements in conformity with accounting principles generally accepted in the United States of America. Actual results could differ significantly from those estimates under different assumptions and conditions. We believe the following discussion addresses our most critical accounting policies. These policies require management to exercise judgments that are often difficult, subjective and complex due to the necessity of estimating the effect of matters that are inherently uncertain.
Revenue Recognition
We recognize engineering fees from different types of services under a variety of different types of contracts. In recognizing engineering fees, we evaluate each contractual arrangement to determine the applicable authoritative accounting methodology to apply to each contract.
In the course of providing services, we principally use three types of contracts: Cost-plus contracts, Time and Materials contracts and Fixed Price contracts.
Cost-plus Contracts. We recognize engineering fees from cost-plus contracts at the time services are performed. The amount of revenue recognized is based on our actual labor costs incurred, plus non-labor costs and the portion of the fixed negotiated fee earned to date. Included in non-labor costs are pass-through costs for client-reimbursable materials, equipment and subcontractor costs where we are responsible for engineering specifications, procurement, and management of such cost components on behalf of our clients. These direct reimbursable expenses are principally passed through to our clients with minimal or no mark-up and are included in our engineering fees. Indirect expenses are recorded as incurred and are allocated to contracts.
59
Time and Materials Contracts. We recognize engineering fees from Time and Materials contracts at the time services are performed. The amount of revenue recognized is based on the actual number of hours we spend on the projects, multiplied by contractual rates or multipliers. In addition, our clients reimburse us for our actual out-of-pocket costs of materials and other direct reimbursable expenses that we incur in connection with our performance under these contracts. The amount of NER on a time and materials contract fluctuates based on the proportion of the actual labor spent and reimbursable costs that are incurred for each contract.
Fixed Price Contracts. We recognize engineering fees from fixed price contracts based on the percentage of completion method where fees are recognized based on the estimate of the physical percent of completion of the work performed. Percentage-of-completion accounting relies on the use of significant estimates in the process of determining income earned. The cumulative impact of revisions to estimates is reflected in the period in which these changes become known. Actual results could differ materially from those estimates, which may result in a reduction or reversal of previously recorded revenue and profit. At the time a loss on a contract becomes known, we record the entire amount of the estimated loss.
Change orders that result from modification of an original contract are taken into consideration for revenue recognition when they result in a change of total contract value and are approved by our clients. Engineering fees relating to unapproved change orders are recognized when collected.
The Company’s federal government contracts are subject to the Federal Acquisition Regulations, or FAR. These regulations are partially incorporated into many local and state agency contracts. The FAR limits the recovery of certain specified indirect costs on contracts subject to such regulations. In accordance with industry practice, most of our federal government contracts are subject to termination at the discretion of the client. Contracts typically provide for reimbursement of costs incurred and payment of fees earned through the termination date.
Contracts that fall under the FAR are subject to audit by the government, primarily the Defense Contract Audit Agency, or DCAA, which reviews our overhead rates, operating systems and costs proposals. As a result of its audits, the DCAA may disallow costs if it determines that we have incorrectly or improperly accounted for such costs in a manner inconsistent with generally accepted government accounting standards.
Accrued Reimbursement Liability
The accrued reimbursement liability is an estimate related to the total impact of the overstated overhead rates previously billed under certain government contracts, primarily as a result of an error with respect to general and administrative expenses and the misappropriations previously described. This liability represents estimates of our future payment obligations associated with reimbursing clients for such overstated overhead rates. The estimate was developed through a detailed analysis, reimbursement settlements and discussions with various government client representatives and is dependent on assumptions made by management, which include the impact of the misappropriations and other items on the overhead rates, the government clients subject to reimbursement, the percentage of contracts with these identified government clients subject to reimbursement, the extent to which overhead rates used to bill these identified government contracts varied from the overhead rates, the profit earned on these identified government contracts and the assumed interest rate on the reimbursement amounts. A significant change in one or more of these assumptions could potentially have a material effect on the financial statements. Although false claims actions by certain state government agencies are possible under various State False Claims Acts, which we refer to as State FCA, we currently believe these actions are unlikely and have not accrued a liability for these actions. The State FCA allow for state and certain local government entities to recover damages from the presentation of certain false or fraudulent claims by entities in which they contract with. If false claims actions are initiated in the future by one or more of these state governmental agencies, such actions could have a material effect on our financial statements.
We are in discussions with several of our other government clients, which are in various stages of settlement. As of September 30, 2008, we had settled $35.1 million of the liability with clients, which represent
60
approximately 94% of the estimated total refund amount. Additionally, based on settlements to date and new information, we have changed our estimate of the accrued reimbursement liability and have recorded a reduction in the liability with a corresponding increase in engineering fees in the amount of $2.3 million during fiscal year 2008.
Stock Valuation
The value of the Company’s stock is required to be determined by a formal valuation analysis performed by one or more outside, independent appraisal firms. The stock price established based on the appraisers’ valuation reports is utilized for the PBSJ Employee Profit Sharing and Stock Ownership Plan and Trust or the Trust/ESOP administration purposes and to set the price for direct employee-shareholder purchases, sales and redemptions.
The Company’s current policy is to utilize three independent appraisers to provide valuation reports. The two valuations that are closest in value are averaged to produce the stock price, with each receiving a 50% weight. The remaining valuation, designated the “outlier,” is excluded from the value calculation. In order to ensure the independence and qualifications of the appraisers, they are selected each year by the Audit Committee of the Board of Directors or the Audit Committee. For the September 30, 2007 valuation, the two valuations that the Company used were prepared by Willamette Management Associates and Matheson Financial Advisors.
Consistent with generally accepted valuation methodology, the appraisers utilize the following methods:
i) income approach (discounted cash flow method);
ii) the market approach (guideline public company method and guideline merged and acquired company method); and
iii) analyses of the Company’s financial statements, interviews with key managers, and external data including comparable merger/acquisition transactions and national and regional economic reviews.
While the internal data utilized by the appraisers is factual and consistent, their valuation reports reflect their professional judgment and are based on many material assumptions regarding future business trends and market conditions.
The Valuation Committee reviews the valuation reports including assumptions used on behalf of both the Company and the Trust/ESOP and makes a recommendation to both the Trust/ESOP and the Board of Directors whether the indicated stock price should or should not be accepted.
The stock price determined for the September 30, 2007 valuation was $29.68. This stock price was utilized for the stock offering window in fiscal 2008 and has been and will be utilized for all other stock transactions until the next valuation is completed. We anticipate that the next valuation will be completed in January 2008. The valuations performed by the appraisers take into consideration forecasted financial activity for the three months subsequent to September 30, 2007. If, during the period subsequent to September 30, 2007 and prior to the date the stock price is determined, there were any significant transactions or significant variances between actual results compared to forecasted results provided to the valuation companies, these transactions or variances would be taken into consideration, as appropriate, in the valuation. Historically there have not been any significant transactions between the period that stock price is determined and the stock trading window. However, if there were a significant transaction during this period the Company would update the stock price used for the stock trading window or any other transaction in which stock is issued.
61
The material assumptions used by the two independent appraisers whose appraisals were used to determine the stock value at September 30, 2007 are:
| | | | | | |
| | | September 30, 2007 | |
| | | Appraiser 1 | | | Appraiser 2 | |
Discounted Cash Flow Method | | | | | | |
Weighted average cost of capital | | 21.76 | % | | 19.00 | % |
| | |
Guideline Public Company Method | | | | | | |
EBIT multiple | | 9.0 | % | | 7.5 | % |
EBITDA multiple | | 7.5 | % | | 6.0 | % |
Revenue multiple | | 50 | % | | 50 | % |
| | |
Guideline Merged and Acquired Company Method | | | | | | |
EBIT multiple | | 8.5 | % | | n/a | * |
EBITDA multiple | | 7.5 | % | | n/a | * |
Revenue multiple | | 55 | % | | 60 | % |
| | |
Lack of control discount factor | | 17 | % | | 15 | % |
| * | This assumption was not used by Appraiser 2 for the Guideline Merged and Acquired Company Method |
A 10% increase or decrease in any of the assumptions above would result in a range of common stock prices from $28.84 to $30.56.
Goodwill and Other Intangible Assets
Goodwill represents the excess of the purchase price over the estimated fair value of the net tangible and identifiable intangible assets of businesses acquired and accounted for under the purchase method. The Company accounts for its goodwill in accordance with SFAS No. 142, “Goodwill and Other Intangible Assets”, which requires the Company to test for goodwill impairment annually (or more frequently under certain conditions). Goodwill is evaluated for impairment at least annually, or when events or changes in circumstances indicate that the carrying value may not be recoverable. The Company conducts its impairment evaluation of Goodwill in conjunction with the annual independent valuation of the Company, as described above. In performing its evaluation of Goodwill, the Company takes into consideration the results of and the assumptions, used by the independent appraisers, the valuation of the Company in relation to the carrying value of Goodwill, any significant under-performance of each reporting unit in relation to projected operating results, significant negative industry or economic trends and the projected Company’s backlog position as of the end of the fiscal year. The Company’s reporting units for purposes of testing goodwill are the Company’s six services, Environmental Science, Water, Facilities, Federal, Transportation and Construction. The fair values of all of the Company’s reporting units are materially in excess their carrying values. Based on these annual impairment evaluations, the Company has concluded that Goodwill for the year ended September 30, 2008, 2007 and 2006 was not impaired.
Due to the variables associated with the assumptions used in the valuation process, management assessment and projections, the potential impact of industry and economic trends and as additional information becomes known; the carrying value of Goodwill could significantly be affected by impairment charges in the future.
We amortize the cost of other intangible assets over their estimated useful lives unless such lives are deemed indefinite. Amortizable intangible assets are reviewed for impairment whenever events or changes in business circumstances indicate the carrying value of the assets may not be recoverable. If assets are determined to be impaired, they are written down to their estimated fair value. No impairment was recorded during the years ended September 30, 2008, 2007, or 2006.
62
Deferred Compensation
Estimated liabilities related to defined benefit pension and postretirement programs are included in deferred compensation. These liabilities represent actuarially determined estimates of our future obligations associated with providing these benefit programs to some of our employees. The actuarial studies and estimates are dependent on assumptions made by management, which include discount rates, life expectancy of participants and rates of increase in compensation levels. These assumptions are determined based on the current economic environment at year-end.
Income Taxes
In determining net income for financial statement purposes, we must make estimates and judgments in the calculation of tax assets and liabilities and in the determination of the recoverability of deferred tax assets. Tax assets and liabilities arise from temporary differences between the tax return and the financial statement recognition of revenues and expenses.
Our effective tax rate is based on income, statutory tax rates, and tax planning opportunities available in the various jurisdictions in which we operate. Significant judgment is required in determining the effective tax rate and in evaluating our tax positions. We established reserves when, despite our belief that the tax return positions are fully supportable, we believe that certain positions, if challenged, will likely be resolved unfavorably to us. These reserves are adjusted in light of changing facts and circumstances, such as the progress of a tax audit or current developments in tax law. Our annual tax rate includes the impact of reserve provisions and changes to reserves. While it is often difficult to predict the final outcome or the timing of resolution of any particular matter, we believe that its reserves reflect the probable outcome of known tax contingencies. Resolution of the tax contingencies would be recognized as an increase or decrease to our tax rate in the period of resolution.
Contingencies
Management estimates are inherent in the assessment of our exposure to litigation and other legal claims and contingencies. Significant management judgment is utilized in determining probable and or reasonably estimable amounts to be recorded or disclosed in our financial statements (seeAccrued Reimbursement Liability above). The results of any changes in accounting estimates are reflected in the financial statements of the period in which the changes are determined.
Estimated Liability for Self-Insurance
We are self-insured up to certain limits for costs associated with general liability, workers’ compensation and employee health coverage. We also maintain a stop loss insurance policy with a third party insurer to limit our exposure to individual and aggregate claims made. Insurance claims and reserves include accruals of estimated settlements for known claims, as well as accruals of estimates of incurred but not reported claims, net of payments made. Our professional liability coverage is on a “claims-made basis” meaning the coverage applies to claims made during a policy year regardless of when the causative action took place. All other coverage are “occurrence-basis” meaning that the policy in place when the injury or damage occurred is the policy that responds regardless of when the claim is made. Our professional liability limits per policy year are $45 million with a per claim deductible of $125,000 plus an annual aggregate retention of $3 million. This coverage would also cover the Company for a claim against a subcontractor of the Company. At September 30, 2008 and 2007, we had total self-insurance accruals reflected in accounts payable and accrued expenses in our consolidated balance sheets of $9.4 million and $6.9 million, respectively. These estimates are subject to variability due to changes in trends of losses for outstanding claims and incurred but not recorded claims, including external factors such as future inflation rates, benefit level changes and claim settlement patterns.
63
Accounts Receivable
We estimate the allowance for doubtful accounts based on management’s evaluation of the contracts involved and the financial condition of its clients. The Company regularly evaluates the adequacy of the allowance for doubtful accounts by taking into consideration such factors as the type of client—governmental agencies or private sector, trends in actual and forecasted credit quality of the client, including delinquency and payment history, general economic and particular industry conditions that may affect a client’s ability to pay, and contract performance and the change order and claim analysis.
Property and Equipment
Property and equipment are stated at cost less accumulated amortization and depreciation. Certain equipment held under capital leases are classified as furniture and equipment and the related obligations are recorded as capital lease obligations. Major renewals and improvements are capitalized, while repairs and maintenance are expensed as incurred. Depreciation is computed using the straight-line method over the estimated useful lives of the related assets. The useful lives of the assets range from three to forty years. Capital leases are amortized under the straight-line method over the lesser of the estimated useful life of the asset or the duration of the lease agreement. Leasehold improvements are amortized over the shorter of the term of the leases or their estimated useful lives. Depreciation and amortization expenses are included in general and administrative expenses, or G&A, in the accompanying consolidated statements of operations.
Cost and accumulated depreciation of property and equipment retired or sold are eliminated from the accounts at the time of retirement or sale and the resulting gain or loss is included in G&A in the accompanying consolidated statements of operations.
Contractual Obligations
We are obligated under various non-cancelable leases for office facilities, furniture and equipment. Certain leases contain renewal options, escalation clauses and certain other operating expenses of the properties. In the normal course of business, leases that expire are expected to be renewed or replaced by leases for other properties.
In fiscal year 2007, we entered into a three year Microsoft Enterprise Agreement with Microsoft Licensing, GP covering all of our Microsoft based application licenses. At September 30, 2008, we had outstanding under this agreement the remaining payments of $1.1 million, all of which are included in contractual purchase obligations below.
A summary of our contractual obligations as of September 30, 2008 is as follows:
| | | | | | | | | | | | | | | |
| (Dollars in thousands) | | | | Payments due by period |
Contractual Obligations | | Total | | Less than 1
year | | 2-3 years | | 4-5 years | | More than 5
years |
Long-term debt obligations (1) | | $ | 6,397 | | $ | 512 | | $ | 1,024 | | $ | 4,861 | | $ | — |
Operating lease obligations | | | 100,630 | | | 23,999 | | | 35,598 | | | 21,330 | | | 19,703 |
Capital lease obligations | | | 537 | | | 376 | | | 161 | | | — | | | — |
Purchase obligations | | | 1,140 | | | 1,140 | | | — | | | — | | | — |
Expected retirement benefit payments | | | 5,460 | | | 797 | | | 1,603 | | | 1,258 | | | 1,802 |
Accrued client reimbursement payments | | | 2,186 | | | 2,186 | | | — | | | — | | | — |
Income tax related to tax reporting method change | | | 28,611 | | | 9,537 | | | 19,074 | | | — | | | — |
| | | | | | | | | | | | | | | |
Total | | $ | 154,498 | | $ | 38,547 | | $ | 57,460 | | $ | 36,986 | | $ | 21,505 |
| | | | | | | | | | | | | | | |
| (1) | Excludes interest which is based on a variable rate. Orlando note refinanced in October 2008. |
As of September 30, 2008 the Company has recorded $17.6 million, including $2.7 million related to the adoption of FIN 48, in other long term liabilities related to uncertain tax provisions. Due to the uncertainty regarding the timing of the resolution of these tax uncertainties, the Company is not able to determine when the uncertainties will be resolved.
64
| ITEM 7A. | Quantitative and Qualitative Disclosures about Market Risk |
We are subject to interest rate risk through outstanding balances on our variable rate debt. We may mitigate this risk by paying down additional outstanding balances on our variable rate loans, refinancing with fixed rate permanent debt or obtaining cash flow hedges. We do not hold market-risk sensitive instruments for trading purposes. We do not hold financial instruments or derivative commodity instruments to hedge any market risk, nor do we currently plan to employ them in the near future.
The interest rate on the mortgage note was 3.40% and 6.19% at September 30, 2008 and 2007, respectively. Our adjustable rate mortgage calls for an interest rate based on the 30 day LIBOR plus a margin of .065%. We estimate that a one-percentage increase in our adjustable mortgage rate for debt outstanding of $6.4 million as of September 30, 2008 would have resulted in additional annualized interest costs of approximately $64,000. This computation did not take into consideration the scheduled monthly payments due under the mortgage note.
In October 2008, we refinanced the existing mortgage note with a new seven year mortgage note in the amount of $13.6 million due in monthly installments, including interest, over a twenty year amortization period with a balloon payment due on November 1, 2015. The interest rate on the mortgage note is based on LIBOR plus 2.27% per annum. In order to minimize the adverse impact of floating interest rate risks, we also entered into an interest rate swap agreement. The swap effectively converts the floating interest rate on the mortgage note to a fixed rate of 6.2%.
The interest rate (3.53% and 5.85% at September 30, 2008 and 2007, respectively) on our revolving line of credit ranges from LIBOR plus 50 basis points (currently in use) or prime minus 125 basis points if our funded debt coverage ratio is less than 2.5. The range increases to LIBOR plus 75 basis points or prime minus 100 basis points if our funded debt coverage ratio is between 2.5 to 3.0. We estimate that a one-percentage increase in our line of credit interest rate for the balance outstanding of $6.6 million as of September 30, 2008 would have resulted in additional annualized interest costs of approximately $66,000.
We mitigate interest rate risk by continually monitoring interest rates and electing the lower of the LIBOR or prime rate option available under the line of credit.
As of September 30, 2008, the fair value of our debt approximates the outstanding principal balance due to the variable rate nature of such instruments.
The interest rates under our revolving line of credit and mortgage note are variable and accordingly we have exposure to market risk. To the extent that we have borrowings outstanding, there is market risk relating to the amount of such borrowings.
The sensitivity analysis, described above, contains certain simplifying assumptions (for example, it does not consider the impact of changes in prepayment risk or credit spread risk). Therefore, although it gives an indication of our exposure to changes in interest rates, it is not intended to predict future results and our results will likely vary.
65
| ITEM 8. | Financial Statements and Supplementary Data |
REPORT OF INDEPENDENT REGISTERED PUBLIC ACCOUNTING FIRM
To the Board of Directors and Stockholders of The PBSJ Corporation:
We have audited the accompanying consolidated balance sheets of The PBSJ Corporation and subsidiaries (the “Company”) as of September 30, 2008 and 2007, and the related consolidated statements of operations, stockholders’ equity and comprehensive income, and cash flows for each of the three years in the period ended September 30, 2008. These consolidated financial statements are the responsibility of the Company’s management. Our responsibility is to express an opinion on these consolidated financial statements based on our audits.
We conducted our audits in accordance with the standards of the Public Company Accounting Oversight Board (United States). Those standards require that we plan and perform the audit to obtain reasonable assurance about whether the consolidated financial statements are free of material misstatement. The Company is not required to have, nor were we engaged to perform, an audit of its internal control over financial reporting. Our audits included consideration of internal control over financial reporting as a basis for designing audit procedures that are appropriate in the circumstances, but not for the purpose of expressing an opinion on the effectiveness of the Company’s internal control over financial reporting. Accordingly, we express no such opinion. An audit also includes examining, on a test basis, evidence supporting the amounts and disclosures in the consolidated financial statements, assessing the accounting principles used and significant estimates made by management, as well as evaluating the overall financial statement presentation. We believe that our audits provide a reasonable basis for our opinion.
In our opinion, such consolidated financial statements present fairly, in all material respects, the financial position of The PBSJ Corporation and subsidiaries as of September 30, 2008 and 2007, and the results of their operations and their cash flows for each of the three years in the period ended September 30, 2008, in conformity with accounting principles generally accepted in the United States of America.
/s/ DELOITTE & TOUCHE LLP
Certified Public Accountants
Tampa, Florida
December 18, 2008
66
THE PBSJ CORPORATION
Consolidated Balance Sheets
| | | | | | | | |
| | | September 30, | |
| (Amounts in thousands, except shares and per share amounts) | | 2008 | | | 2007 | |
Assets | | | | | | | | |
Current Assets: | | | | | | | | |
Cash and cash equivalents | | $ | 4,049 | | | $ | 8,481 | |
Accounts receivable, net | | | 102,492 | | | | 83,485 | |
Unbilled fees | | | 76,742 | | | | 78,511 | |
Deferred income taxes, current | | | 3,598 | | | | — | |
Other current assets | | | 6,231 | | | | 3,183 | |
| | | | | | | | |
Total current assets | | | 193,112 | | | | 173,660 | |
Property and equipment, net | | | 35,945 | | | | 34,932 | |
Cash surrender value of life insurance | | | 11,227 | | | | 10,687 | |
Deferred income taxes | | | — | | | | 11,558 | |
Goodwill | | | 23,071 | | | | 21,692 | |
Intangible assets, net | | | 1,273 | | | | 886 | |
Other assets | | | 4,049 | | | | 4,954 | |
| | | | | | | | |
Total assets | | $ | 268,677 | | | $ | 258,369 | |
| | | | | | | | |
Liabilities and Stockholders’ Equity | | | | | | | | |
Current Liabilities: | | | | | | | | |
Accounts payable and accrued expenses | | $ | 98,172 | | | $ | 85,135 | |
Stock redemption payable | | | 7,522 | | | | — | |
Accrued reimbursement liability | | | 2,186 | | | | 8,385 | |
Current portion of long-term debt | | | 7,134 | | | | 512 | |
Current portion of capital leases | | | 297 | | | | 347 | |
Accrued vacation | | | 13,394 | | | | 12,518 | |
Billings in excess of costs | | | 5,763 | | | | 3,943 | |
Deferred income taxes, current | | | — | | | | 27,909 | |
| | | | | | | | |
Total current liabilities | | | 134,468 | | | | 138,749 | |
Deferred income taxes, non current | | | 9,382 | | | | — | |
Long-term debt, less current portion | | | 5,885 | | | | 6,397 | |
Capital leases, less current portion | | | 138 | | | | 358 | |
Deferred compensation | | | 12,325 | | | | 13,364 | |
Other liabilities | | | 40,228 | | | | 21,405 | |
| | | | | | | | |
Total liabilities | | | 202,426 | | | | 180,273 | |
| | | | | | | | |
Stockholders’ Equity: | | | | | | | | |
Common stock, par value $0.00067, 15,000,000 shares authorized, 6,862,009 shares issued and outstanding at September 30, 2007 | | | — | | | | 5 | |
Common stock Class A, par value $0.00067, 15,000,000 shares authorized, 5,822,649 shares issued and outstanding at September 30, 2008 | | | 4 | | | | — | |
Common stock Class B, non-voting, par value $0.00067, 5,000,000 shares authorized, no shares issued or outstanding at September 30, 2008 and 2007 | | | — | | | | — | |
Preferred stock, par value $0.001, 10,000,000 shares authorized, no shares issued or outstanding at September 30, 2008 and 2007 | | | — | | | | — | |
Retained earnings | | | 66,345 | | | | 81,040 | |
Accumulated other comprehensive loss | | | (7 | ) | | | (1,246 | ) |
Employee shareholders’ loans, unearned compensation and other | | | (91 | ) | | | (1,703 | ) |
| | | | | | | | |
Total stockholders’ equity | | | 66,251 | | | | 78,096 | |
| | | | | | | | |
Total liabilities and stockholders’ equity | | $ | 268,677 | | | $ | 258,369 | |
| | | | | | | | |
The accompanying notes are an integral part of these consolidated financial statements
67
THE PBSJ CORPORATION
Consolidated Statements of Operations
| | | | | | | | | | | | |
| | | Years Ended September 30, | |
| (Amounts in thousands, except per share amounts) | | 2008 | | | 2007 | | | 2006 | |
Earned revenues: | | | | | | | | | | | | |
Engineering fees | | $ | 617,945 | | | $ | 581,465 | | | $ | 537,242 | |
Direct reimbursable expenses | | | 149,696 | | | | 123,540 | | | | 105,635 | |
| | | | | | | | | | | | |
Net earned revenues | | | 468,249 | | | | 457,925 | | | | 431,607 | |
| | | | | | | | | | | | |
Costs and expenses: | | | | | | | | | | | | |
Direct salaries and direct costs | | | 168,829 | | | | 164,764 | | | | 158,381 | |
General and administrative expenses, including indirect salaries | | | 278,093 | | | | 262,383 | | | | 250,145 | |
Insurance proceeds and gain on recoveries, net of misappropriation loss | | | — | | | | (1,989 | ) | | | (1,613 | ) |
Investigation and related costs | | | — | | | | 3,802 | | | | 14,239 | |
| | | | | | | | | | | | |
Total costs and expenses | | | 446,922 | | | | 428,960 | | | | 421,152 | |
| | | | | | | | | | | | |
Operating income | | | 21,327 | | | | 28,965 | | | | 10,455 | |
| | | | | | | | | | | | |
Other income (expense): | | | | | | | | | | | | |
Interest expense | | | (987 | ) | | | (1,520 | ) | | | (2,066 | ) |
Other, net | | | 47 | | | | 98 | | | | 302 | |
| | | | | | | | | | | | |
Total other expense: | | | (940 | ) | | | (1,422 | ) | | | (1,764 | ) |
| | | | | | | | | | | | |
Income before income taxes | | | 20,387 | | | | 27,543 | | | | 8,691 | |
Provision for income taxes | | | 4,915 | | | | 8,445 | | | | 3,286 | |
| | | | | | | | | | | | |
Net income | | $ | 15,472 | | | $ | 19,098 | | | $ | 5,405 | |
| | | | | | | | | | | | |
Net income per share: | | | | | | | | | | | | |
Basic | | $ | 2.55 | | | $ | 3.05 | | | $ | 0.81 | |
| | | | | | | | | | | | |
Diluted | | $ | 2.51 | | | $ | 2.99 | | | $ | 0.76 | |
| | | | | | | | | | | | |
Weighted average shares outstanding: | | | | | | | | | | | | |
Basic | | | 6,062 | | | | 6,258 | | | | 6,651 | |
| | | | | | | | | | | | |
Diluted | | | 6,156 | | | | 6,390 | | | | 7,118 | |
| | | | | | | | | | | | |
The accompanying notes are an integral part of these consolidated financial statements
68
THE PBSJ CORPORATION
Consolidated Statements of Stockholders’ Equity and Comprehensive Income
For the years ended September 30, 2008, 2007 and 2006
| | | | | | | | | | | | | | | | | | | | | | | | | | | | | | | | | | | | | | | | | | | | |
| | | Common Stock | | | Common Stock,
Class A | | | Common Stock,
Class B | | Preferred Stock | | Additional
Paid-in
Capital | | | Retained
Earnings | | | Accumulated
Other
Comprehensive
Loss | | | Employee
Shareholders’
Loans,
Unearned
Compensation
and Other | | | Total
Stockholders’
Equity | |
| (Amounts in thousands, except share data) | | Shares | | | Amount | | | Shares | | | Amount | | | Shares | | Amount | | Shares | | Amount | | | | | |
Balance at September 30, 2005 | | 7,720,527 | | | $ | 5 | | | — | | | $ | — | | | — | | $ | — | | — | | $ | — | | $ | — | | | $ | 82,991 | | | $ | (1,957 | ) | | $ | (3,207 | ) | | $ | 77,832 | |
| | | | | | | | | | | | | | | | | | | | | | | | | | | | | | | | | | | | | | | | | | | | |
Comprehensive income: | | | | | | | | | | | | | | | | | | | | | | | | | | | | | | | | | | | | | | | | | | | | |
Net income | | — | | | | — | | | — | | | | — | | | — | | | — | | — | | | — | | | — | | | | 5,405 | | | | — | | | | — | | | | 5,405 | |
Unrealized gain on marketable securities, net of tax of $9 | | — | | | | — | | | — | | | | — | | | — | | | — | | — | | | — | | | — | | | | — | | | | 14 | | | | — | | | | 14 | |
Realized gain on marketable securities, net of tax of $29 | | — | | | | — | | | — | | | | — | | | — | | | — | | — | | | — | | | — | | | | — | | | | (242 | ) | | | — | | | | (242 | ) |
Unrealized loss on derivative, net of tax of $22 | | — | | | | — | | | — | | | | — | | | — | | | — | | — | | | — | | | — | | | | — | | | | 35 | | | | — | | | | 35 | |
Minimum pension liability adjustment, net of tax of $158 | | — | | | | — | | | — | | | | — | | | — | | | — | | — | | | — | | | — | | | | — | | | | 236 | | | | — | | | | 236 | |
| | | | | | | | | | | | | | | | | | | | | | | | | | | | | | | | | | | | | | | | | | | | |
Total comprehensive income | | | | | | | | | | | | | | | | | | | | | | | | | | | | | | | | | | | | | | | | | | | 5,448 | |
Shares recovered from investigation | | (19,180 | ) | | | — | | | | | | | — | | | | | | — | | | | | — | | | (11 | ) | | | (526 | ) | | | — | | | | — | | | | (537 | ) |
Shares purchased and retired | | (876,803 | ) | | | — | | | | | | | — | | | | | | — | | | | | — | | | (804 | ) | | | (23,818 | ) | | | — | | | | — | | | | (24,622 | ) |
Issuance of restricted stock, net of cancellations | | 24,670 | | | | — | | | | | | | — | | | | | | — | | | | | — | | | 815 | | | | — | | | | — | | | | (815 | ) | | | — | |
Amortization of deferred compensation | | — | | | | — | | | | | | | — | | | — | | | — | | — | | | — | | | — | | | | — | | | | — | | | | 790 | | | | 790 | |
| | | | | | | | | | | | | | | | | | | | | | | | | | | | | | | | | | | | | | | | | | | | |
Balance at September 30, 2006 | | 6,849,214 | | | | 5 | | | — | | | | — | | | — | | | — | | — | | | — | | | —�� | | | | 64,052 | | | | (1,914 | ) | | | (3,232 | ) | | | 58,911 | |
| | | | | | | | | | | | | | | | | | | | | | | | | | | | | | | | | | | | | | | | | | | | |
Comprehensive income: | | | | | | | | | | | | | | | | | | | | | | | | | | | | | | | | | | | | | | | | | | | | |
Net income | | — | | | | — | | | — | | | | — | | | — | | | — | | — | | | — | | | — | | | | 19,098 | | | | — | | | | — | | | | 19,098 | |
Minimum pension liability adjustment, net of tax of $533 | | — | | | | — | | | — | | | | — | | | — | | | — | | — | | | — | | | — | | | | — | | | | 901 | | | | — | | | | 901 | |
| | | | | | | | | | | | | | | | | | | | | | | | | | | | | | | | | | | | | | | | | | | | |
Total comprehensive income | | | | | | | | | | | | | | | | | | | | | | | | | | | | | | | | | | | | | | | | | | | 19,999 | |
Implementation of SFAS No.123(R) | | | | | | — | | | | | | | — | | | | | | — | | | | | — | | | (3,110 | ) | | | | | | | | | | | 3,110 | | | | — | |
Issuance of stock for 401(k) match | | 185,390 | | | | — | | | | | | | — | | | | | | — | | | | | — | | | 4,512 | | | | — | | | | — | | | | — | | | | 4,512 | |
Shares purchased and retired | | (206,765 | ) | | | — | | | | | | | — | | | | | | — | | | | | — | | | (3,148 | ) | | | (2,110 | ) | | | — | | | | — | | | | (5,258 | ) |
Employee shareholders’ loans | | — | | | | — | | | | | | | — | | | | | | — | | | | | — | | | — | | | | — | | | | — | | | | (1,596 | ) | | | (1,596 | ) |
Issuance of restricted stock, net of cancellations | | 34,170 | | | | — | | | | | | | — | | | | | | — | | | | | — | | | 895 | | | | — | | | | — | | | | 15 | | | | 910 | |
Tax benefit on vesting of Restricted Stock | | | | | | | | | | | | | | | | | | | | | | | | | | | 851 | | | | | | | | — | | | | | | | | 851 | |
Implementation of SFAS No.158, net of tax of $159 | | — | | | | — | | | — | | | | — | | | — | | | — | | — | | | — | | | — | | | | — | | | | (233 | ) | | | — | | | | (233 | ) |
| | | | | | | | | | | | | | | | | | | | | | | | | | | | | | | | | | | | | | | | | | | | |
Balance at September 30, 2007 | | 6,862,009 | | | | 5 | | | — | | | | — | | | — | | | — | | — | | | — | | | — | | | | 81,040 | | | | (1,246 | ) | | | (1,703 | ) | | | 78,096 | |
| | | | | | | | | | | | | | | | | | | | | | | | | | | | | | | | | | | | | | | | | | | | |
Comprehensive income: | | | | | | | | | | | | | | | | | | | | | | | | | | | | | | | | | | | | | | | | | | | | |
Net income | | — | | | | — | | | — | | | | — | | | — | | | — | | — | | | — | | | — | | | | 15,472 | | | | — | | | | — | | | | 15,472 | |
Loss recognized due to curtailment and settlement of deferred compensation plan | | — | | | | — | | | — | | | | — | | | — | | | — | | — | | | — | | | — | | | | — | | | | 1,137 | | | | — | | | | 1,137 | |
Minimum pension liability adjustment, net of tax of $28 | | — | | | | — | | | — | | | | — | | | — | | | — | | — | | | — | | | — | | | | — | | | | 102 | | | | — | | | | 102 | |
| | | | | | | | | | | | | | | | | | | | | | | | | | | | | | | | | | | | | | | | | | | | |
Total comprehensive income | | | | | | | | | | | | | | | | | | | | | | | | | | | | | | | | | | | | | | | | | | | 16,711 | |
Implementation of FIN48 Tax Provision | | — | | | | — | | | — | | | | — | | | — | | | — | | — | | | — | | | — | | | | (2,743 | ) | | | — | | | | — | | | | (2,743 | ) |
Reclassification of Stock | | (6,862,009 | ) | | | (5 | ) | | 6,862,009 | | | | 5 | | | | | | — | | | | | — | | | — | | | | — | | | | | | | | — | | | | — | |
Issuance of stock for 401(k) match | | — | | | | — | | | 171,605 | | | | — | | | — | | | — | | — | | | — | | | 5,093 | | | | — | | | | — | | | | — | | | | 5,093 | |
Sale of Stock | | — | | | | | | | 127,418 | | | | — | | | — | | | — | | — | | | — | | | 3,798 | | | | — | | | | — | | | | — | | | | 3,798 | |
Shares issued in acquisitions | | — | | | | — | | | 6,750 | | | | — | | | — | | | — | | — | | | — | | | 200 | | | | — | | | | — | | | | — | | | | 200 | |
Shares purchased and retired | | — | | | | — | | | (1,355,420 | ) | | | (1 | ) | | — | | | — | | — | | | — | | | (11,095 | ) | | | (27,424 | ) | | | — | | | | — | | | | (38,520 | ) |
Employee shareholders’ loans | | — | | | | — | | | — | | | | — | | | — | | | — | | — | | | — | | | — | | | | — | | | | — | | | | 1,595 | | | | 1,595 | |
Issuance of restricted stock, net of cancellations | | — | | | | — | | | 10,287 | | | | — | | | — | | | — | | — | | | — | | | 771 | | | | — | | | | — | | | | 17 | | | | 788 | |
Tax benefit on vesting of Restricted Stock | | — | | | | — | | | | | | | — | | | — | | | — | | — | | | — | | | 1,233 | | | | | | | | — | | | | — | | | | 1,233 | |
| | | | | | | | | | | | | | | | | | | | | | | | | | | | | | | | | | | | | | | | | | | | |
Balance at September 30, 2008 | | — | | | $ | — | | | 5,822,649 | | | $ | 4 | | | — | | $ | — | | — | | $ | — | | $ | — | | | $ | 66,345 | | | $ | (7 | ) | | $ | (91 | ) | | $ | 66,251 | |
| | | | | | | | | | | | | | | | | | | | | | | | | | | | | | | | | | | | | | | | | | | | |
The accompanying notes are an integral part of these consolidated financial statements
69
THE PBSJ CORPORATION
Consolidated Statements of Cash Flows
| | | | | | | | | | | | |
| | | Years Ended September 30, | |
| (Dollars in thousands) | | 2008 | | | 2007 | | | 2006 | |
Cash flows from operating activities: | | | | | | | | | | | | |
Net income | | $ | 15,472 | | | $ | 19,098 | | | $ | 5,405 | |
Adjustments to reconcile net income to net cash provided by operating activities: | | | | | | | | | | | | |
Decrease in cash surrender value of life insurance | | | — | | | | — | | | | 88 | |
Depreciation and amortization | | | 10,755 | | | | 11,261 | | | | 11,013 | |
Loss (gain) on sale of property and equipment | | | 22 | | | | 9 | | | | (517 | ) |
Amortization of deferred gain on sale-leaseback of office building | | | (1,331 | ) | | | (2,845 | ) | | | — | |
Gain from shares recovered | | | — | | | | — | | | | (537 | ) |
Gain from sale of marketable securities | | | — | | | | — | | | | (271 | ) |
Net loss recognized due to curtailment and settlement of deferred compensation plan | | | 329 | | | | — | | | | — | |
(Decrease) increase in provision for bad debt and unbillable amounts | | | 1,766 | | | | (15 | ) | | | 617 | |
Provision for deferred income taxes | | | (10,726 | ) | | | 7,110 | | | | 5,302 | |
Provision for and amortization of deferred compensation and other | | | 2,188 | | | | 2,536 | | | | 1,971 | |
Excess tax benefit on vesting of restricted stock | | | (1,233 | ) | | | (851 | ) | | | — | |
Reversal of accrued reimbursement liability | | | (2,382 | ) | | | (4,527 | ) | | | — | |
Change in operating assets and liabilities, net of acquisitions: | | | | | | | | | | | | |
(Increase) decrease in accounts receivable | | | (20,044 | ) | | | 1,937 | | | | (14,614 | ) |
Decrease (increase) in unbilled fees and billings in excess of cost | | | 3,344 | | | | (16,452 | ) | | | 8,424 | |
Decrease in assets held for sale | | | — | | | | 3,915 | | | | 8,612 | |
(Increase) decrease in other current assets | | | (1,246 | ) | | | 277 | | | | (1,003 | ) |
Decrease (increase) in other assets | | | 911 | | | | 797 | | | | (3,984 | ) |
Increase (decrease) in accounts payable and accrued expenses | | | 16,630 | | | | (135 | ) | | | (1,172 | ) |
Decrease in liabilities of assets held for sale | | | — | | | | (2,099 | ) | | | (4,627 | ) |
Decrease in accrued reimbursement liability | | | (3,817 | ) | | | (15,271 | ) | | | (6,589 | ) |
Increase in accrued vacation | | | 876 | | | | 345 | | | | 2,010 | |
(Decrease) increase in other liabilities | | | 16,162 | | | | (165 | ) | | | 784 | |
| | | | | | | | | | | | |
Net cash provided by operating activities | | | 27,676 | | | | 4,925 | | | | 10,912 | |
| | | | | | | | | | | | |
Cash flows from investing activities: | | | | | | | | | | | | |
Investment in life insurance policies | | | (541 | ) | | | (632 | ) | | | (541 | ) |
Acquisitions and purchase price adjustments, net of cash acquired | | | (2,000 | ) | | | (200 | ) | | | (5,876 | ) |
Dividends reinvested in marketable securities | | | — | | | | — | | | | (21 | ) |
Proceeds from the sale of property and equipment | | | 57 | | | | 90 | | | | 656 | |
Proceeds from the sale of marketable securities | | | — | | | | — | | | | 680 | |
Proceeds from the sale-leaseback of office building | | | — | | | | 21,350 | | | | — | |
Purchases of property and equipment | | | (10,364 | ) | | | (10,294 | ) | | | (11,416 | ) |
| | | | | | | | | | | | |
Net cash (used in) provided by investing activities | | | (12,848 | ) | | | 10,314 | | | | (16,518 | ) |
| | | | | | | | | | | | |
Cash flows from financing activities: | | | | | | | | | | | | |
Borrowings under line of credit | | | 175,654 | | | | 228,940 | | | | 100,662 | |
Payments under line of credit | | | (169,032 | ) | | | (230,072 | ) | | | (99,900 | ) |
Principal payments under notes and mortgage payable | | | (512 | ) | | | (512 | ) | | | (412 | ) |
Principal payments under capital lease obligations | | | (1,216 | ) | | | (379 | ) | | | (412 | ) |
Excess tax benefit on vesting of restricted stock | | | 1,233 | | | | 851 | | | | — | |
Proceeds from sale of common stock | | | 2,076 | | | | — | | | | 4,276 | |
Employee shareholders’ loans | | | 1,537 | | | | (1,596 | ) | | | — | |
Payments for repurchase of common stock | | | (29,000 | ) | | | (4,000 | ) | | | (21,154 | ) |
| | | | | | | | | | | | |
Net cash used in financing activities | | | (19,260 | ) | | | (6,768 | ) | | | (16,940 | ) |
| | | | | | | | | | | | |
Net (decrease) increase in cash and cash equivalents | | | (4,432 | ) | | | 8,471 | | | | (22,546 | ) |
Cash and cash equivalents at beginning of period | | | 8,481 | | | | 10 | | | | 22,556 | |
| | | | | | | | | | | | |
Cash and cash equivalents at end of period | | $ | 4,049 | | | $ | 8,481 | | | $ | 10 | |
| | | | | | | | | | | | |
The accompanying notes are an integral part of these consolidated financial statements
70
THE PBSJ CORPORATION
Notes to the Consolidated Financial Statements
| 1. | Organization and Summary of Significant Accounting Policies |
Organization and Principles of Consolidation
The consolidated financial statements include the accounts of The PBSJ Corporation and its consolidated subsidiaries, Post, Buckley, Schuh & Jernigan, Inc., a Florida corporation (“PBS&J”), PBS&J Construction Services, Inc., PBS&J Constructors, Inc., PBS&J International, Inc., Seminole Development Corporation and Seminole Development II, Inc. and its consolidated affiliate PBS&J Caribe Engineering, C.S.P., (collectively, the “Company”). All material inter-company transactions and accounts have been eliminated in the accompanying consolidated financial statements. In these notes to the consolidated financial statements, the words “Company”, “we”, “our” and “us” refer to The PBSJ Corporation, its consolidated subsidiaries and its affiliate.
Use of Estimates
The preparation of consolidated financial statements in conformity with accounting principles generally accepted in the United States of America requires management to make estimates and assumptions that affect the reported amounts of assets and liabilities and disclosure of contingent assets and liabilities at the date of the consolidated financial statements and the reported amounts of revenues and expenses during the reporting period. Such estimates in these consolidated financial statements include estimated cost to complete long-term fixed price contracts, allowance for doubtful accounts and unbilled fees, accruals for litigation, estimated liabilities for self-insurance, accrued reimbursement liability, valuation allowance on deferred income tax assets and tax contingencies, estimates of useful lives of intangible assets and the allocation of purchase price paid for acquired companies. Actual results could differ from those estimates.
Reclassifications
We have reclassified certain segment information items in prior-period financial statements to conform to the fiscal year 2008 reorganization of the Company’s reportable segments. For additional information, see Note 14, “Segment Reporting.” These reclassifications had no effect on the Company’s consolidated balance sheets, consolidated statements of operations, consolidated statements of stockholders’ equity and comprehensive income and consolidated statements of cash flows for the prior periods presented.
Revenue Recognition
The Company recognizes engineering fees from different types of services under a variety of different types of contracts. In recognizing engineering fees, the Company evaluates each contractual arrangement to determine the applicable authoritative accounting methodology to apply to each contract. Net earned revenue represents engineering fees less direct reimbursable expenses.
In the course of providing its services, the Company principally has three types of contracts from which it earns revenue: cost-plus contracts, time and materials contracts and fixed price contracts.
Cost-plus Contracts. Under Cost-plus contracts, the Company charges clients negotiated indirect rates based on direct and indirect costs in addition to a profit component. The Company generally recognizes engineering fees at the time services are performed. The amount of revenue is based on its actual labor costs incurred plus a recovery of indirect costs and a profit component. In negotiating cost-plus contracts, the Company estimates direct labor costs and indirect costs and then adds a profit component, which is a percentage of total recoverable costs, to arrive at a total dollar value for the contract. Indirect expenses are recorded as incurred and are allocated to contracts. If the actual labor costs incurred are less than estimated, the revenues from a project will be less than estimated. If the actual labor costs incurred plus a recovery of indirect costs and profit exceed the initial
71
negotiated total contract amount, the Company must obtain a contract modification to receive payment for such overage. If a contract modification or change order is not approved by the client, the Company may be able to pursue a claim to receive payment. Engineering fees from claims are recognized when collected.
Time and Materials Contracts. The Company recognizes engineering fees for Time and Materials contracts at the time services are performed. The amount of revenue is based on the actual number of hours it spends on the projects, multiplied by contractual rates or multipliers. In addition, the Company’s clients reimburse it for its actual out-of-pocket costs of materials and other direct reimbursable expenses that it incurs in connection with its performance under these contracts.
Fixed Price Contracts. For Fixed Price Contracts, the Company recognizes engineering fees based on the percentage-of-completion method whereby fees are recognized based on the estimate of the physical percent of completion of the work performed. In making such estimates, judgments are required to determine potential delays or changes in schedules, the costs of materials and labor, liability claims, contract disputes, or achievement of specified performance goals. At the time a loss on a contract becomes evident and estimable, the Company records the entire amount of the estimated loss.
Change orders that result from modification of an original contract are taken into consideration for revenue recognition when they result in a change of total contract value and is approved by the client. Engineering fees relating to unapproved change orders are recognized when collected.
The Company’s federal government contracts are subject to the Federal Acquisition Regulations, or FAR. These regulations are partially incorporated into many local and state agency contracts. The FAR limits the recovery of certain specified indirect costs on contracts subject to such regulations. In accordance with industry practice, most of the Company’s federal government contracts are subject to termination at the discretion of the client. Contracts typically provide for reimbursement of costs incurred and payment of fees earned through the termination date.
Contracts that are subject to FAR are generally cost-plus contracts, and are subject to audit by the government, primarily the Defense Contract Audit Agency, or DCAA, which reviews the Company’s overhead rates, operating systems and costs proposals. As a result of its audits, the DCAA may disallow costs if it determines that the Company has accounted for such costs in a manner inconsistent with generally accepted cost accounting standards.
Direct Reimbursable Expenses
Direct reimbursable expenses are primarily comprised of subcontractor costs and other direct non-payroll reimbursable charges including travel and travel-related costs, blueprints, and equipment where the Company is responsible for procurement and management of such cost components on behalf of the Company’s clients. These direct reimbursable expenses are principally passed through to our clients with minimal or no mark-up.
Capital Structure
The by-laws of the Company require that common stock held by employee-shareholders who terminate employment with the Company be offered for sale at fair market value to the Company, which has right of first refusal. Should the Company decline to purchase the shares, the shares must next be offered to the Company’s profit sharing and employee stock ownership plans at fair market value, and then ultimately to shareholders who are employees of the Company. The by-laws of the Company provide that the fair market value be determined by an appraisal. Other than certain retired Directors, as of September 30, 2008 and 2007, there is no outstanding common stock held by individuals no longer employed by the Company.
On November 3, 2007, at a special shareholders meeting, the shareholders of the Company approved certain amendments to the Company’s articles of incorporation and bylaws. The shareholders approved to reclassify the
72
total existing authorized shares of common stock as Class A Common Stock, to create a new class of non-voting common stock with 5,000,000 authorized shares titled Class B Common Stock and to authorize the issuance of up to 10,000,000 shares of Preferred Stock, with designations, preferences, right and limitations as adopted by the Board of Directors.
On January 19, 2008, at the Company’s annual meeting, the shareholders of the Company approved certain amendments to the Company’s bylaws related to the procedures for the issuance, sale and redemption of stock. The shareholders also approved the Amended and Restated 2008 Employee Stock Ownership and Direct Purchase Plan, the 2008 Employee Payroll Stock Purchase Plan, the 2008 Employee Restricted Stock Plan and the election of directors.
Pursuant to the terms of our credit agreement, we cannot declare or pay dividends in excess of 50% of our net income. We have not previously paid cash dividends on our common stock and have no present intention of paying cash dividends on our common stock in the foreseeable future. All earnings are retained for investment in our business.
Stock Valuation
The value of PBSJ stock is required to be determined by a formal valuation analysis performed by one or more outside, independent appraisal firms. The stock price established based on the appraisers’ valuation reports is utilized for the PBSJ Employee Profit Sharing and Stock Ownership Plan and Trust (Trust/ESOP) administration purposes and to set the price for direct employee-shareholder purchases, sales and redemptions.
The Company’s current policy is to utilize three independent appraisers to provide valuation reports. The two valuations that are closest in value are averaged to produce the stock price, with each receiving a 50% weight. The remaining valuation, designated the “outlier,” is excluded from the value calculation. In order to ensure the independence and qualifications of the appraisers, they are selected each year by the Audit Committee of the Board of Directors (Audit Committee). For the September 30, 2007 valuation finalized in January, 2008, the two valuations that the Company used were prepared by Willamette Management Associates and Matheson Financial Advisors.
Consistent with generally accepted valuation methodology, the appraisers utilize the following methods:
i) the income approach (discounted cash flow method);
ii) the market approach (guideline public company method and guideline merged and acquired company method); and
iii) analyses of the Company’s financial statements, interviews with key managers, and external data including comparable merger/acquisition transactions and national and regional economic reviews.
While the internal data utilized by the appraisers is factual and consistent, their valuation reports reflect their professional judgment and are based on many material assumptions regarding future business trends and market conditions.
The Valuation Committee reviews the valuation reports, including assumptions used, on behalf of both the Company and the Trust/ESOP and makes a recommendation to both the Trust/ESOP and the Board of Directors whether the indicated stock price should or should not be accepted. The Trust/ESOP Committee has the opportunity to review the valuation recommendation and make comments before the valuation is accepted.
The stock price determined for the September 30, 2007 valuation was $29.68. This stock price was utilized for the stock offering window and all other stock transactions until the next valuation is completed. We anticipate the next valuation will be completed in January 2009. The valuations performed by the appraisers take into
73
consideration forecasted financial activity for the three months subsequent to September 30, 2007. If, during the period subsequent to September 30, 2007 and prior to the date the stock price is determined, there were any significant transactions or significant variances between actual results compared to forecasted results provided to the valuation companies, these transactions or variances would be taken into consideration, as appropriate, in the valuation. Historically there have not been any significant transactions between the date that stock price is determined and the stock trading window. However, if there were a significant transaction during this period the Company would update the stock price used for the stock trading window or any other transaction in which stock is issued.
The material assumptions used by the two independent appraisers whose appraisals were used to determine the stock value at September 30, 2007 are:
| | | | | | |
| | | September 30, 2007 | |
| | | Appraiser 1 | | | Appraiser 2 | |
Discounted Cash Flow Method | | | | | | |
Weighted average cost of capital | | 21.76 | % | | 19.00 | % |
| | |
Guideline Public Company Method | | | | | | |
EBIT multiple | | 9.0 | % | | 7.5 | % |
EBITDA multiple | | 7.5 | % | | 6.0 | % |
Revenue multiple | | 50 | % | | 50 | % |
| | |
Guideline Merged and Acquired Company Method | | | | | | |
EBIT multiple | | 8.5 | % | | n/a | * |
EBITDA multiple | | 7.5 | % | | n/a | * |
Revenue multiple | | 55 | % | | 60 | % |
| | |
Lack of control discount factor | | 17 | % | | 15 | % |
| * | This assumption was not used by Appraiser 2 for the Guideline Merged and Acquired Company Method |
A 10% increase or decrease in any of the assumptions above would result in a range of common stock prices from $28.84 to $30.56.
Stock Based Compensation
Restricted stock awards are recorded at fair value on the date of issuance using the modified prospective method in accordance with Statement of Financial Accounting Standards No. 123 (revised 2004),“Share-Based Payment” (“SFAS 123(R)”), which is a revision of SFAS No. 123,“Accounting for Stock-Based Compensation”. SFAS 123(R) supersedes APB Opinion No. 25,“Accounting for Stock Issued to Employees”. The restricted stock awards are amortized over the vesting period and are included as compensation expense in general and administrative expenses in the accompanying consolidated statements of operations.
Other Employee Stock Sales and Purchases
The stock offering window usually takes place on an annual basis during the second fiscal quarter. The stock window allows full time and part time regular employees to purchase shares of Class A common stock and existing shareholders to offer shares of Class A common stock for sale to the Company. Under its bylaws, the Company has the right of first refusal to purchase these shares. If the Company declines to purchase the offered shares, they are offered to the Employee Profit Sharing and Stock Ownership Plan and Trust, or ESOP, and then to all shareholders of the Company.
During fiscal year 2007, the Company repurchased stock held by employee-shareholders who terminated employment with the Company at a per share price ranging from $22.40 to $28.00 pending completion of the
74
September 30, 2006 valuation. In May 2007, the September 30, 2006 valuation was finalized and established the price per share at $24.34. At September 30, 2007, the Company adjusted its accrual for the stock price differentials to account for the September 30, 2006 valuation by decreasing the adjusted accrual balance to approximately $579,000 at September 30, 2007, which is included in accounts payable and accrued expenses in the accompanying consolidated balance sheets.
In fiscal year 2007, the Company cancelled the stock window for March 2007 because the Company was not current in filing its quarterly reports for fiscal 2007 with the SEC. Instead the Company authorized an internal market window (“internal window”) for employee shareholders to purchase and sell shares of the Company. The Company facilitated this internal window in July 2007, by matching employee shareholders who wished to purchase and sell shares at the September 30, 2006 valuation price of $24.34. The Company had the option, but not the obligation, to purchase any unmatched sell shares that employee shareholders wished to sell and which did not have a matching employee shareholder purchaser. At the end of the internal window, there were unmatched sell shares. The Company did not exercise its right to purchase the unmatched sell shares. The unmatched sell shares were next offered to the Company’s ESOP, which agreed to purchase all of the unmatched sell shares.
As a result of the internal window, the Company loaned funds for those shares that were matched to those employee shareholders who wished to sell their shares for the full amount due. Employee shareholders that wished to purchase matched shares were required to execute promissory notes, which we refer to as the notes, and pledge share agreements as collateral for the notes. The notes were interest free and were due on December 28, 2007. At September 30, 2007, the outstanding balance of the notes was $1.9 million, of which, approximately $332,000 was classified as other current assets and the remaining balance of $1.6 million was included as a reduction of stockholders’ equity in the accompanying consolidated balance sheet. The outstanding balance of the notes at September 30, 2007 was collected in January 2008.
During the second quarter of fiscal year 2008, the Company opened the stock window for the purchase and/or redemption of shares by eligible employees and outside directors at a price of $29.68. Purchasers of shares were given several options for payment, including payroll deductions, balloon payments, up front cash or some combination thereof. The last payroll deduction will be on November 28, 2008. As a result of the stock window, the Company sold 127,418 shares, net of cancelled subscriptions, for an aggregate amount of $3.8 million. At September 30, 2008, the outstanding balance due to the Company on the shares sold was $1.5 million and is included in other current assets in the accompanying consolidated balance sheet.
During fiscal year 2008, the Company agreed to redeem 1.4 million shares held by employees who wished to redeem their shares in the fiscal year 2008 stock window or employees who terminated employment prior to September 30, 2008, for an aggregate amount of $38.5 million. As a result, the Company paid $29.0 million in cash during the year and recorded a liability of $7.5 million and a promissory note of $2.0 million, reflected in stock redemption payable and other liabilities, respectively, in the accompanying consolidated balance sheet as of September 30, 2008.
The Company expects to open its fiscal year 2009 stock window in the second fiscal quarter.
Cash and Cash Equivalents
Cash equivalents consist of all highly liquid investments with an original maturity of three months or less from their dates of purchase. As a result of the Company’s cash management system, checks issued, but presented to the banks for payment, may create negative book cash balances. Checks outstanding in excess of related book cash balances totaling $5.5 million at September 30, 2008 are included in accounts payable and accrued expenses in the accompanying consolidated balance sheet.
75
Income Taxes
The Company uses the asset and liability method in accounting for income taxes. Under this method the Company recognizes deferred tax assets and liabilities for the expected future tax consequences of temporary differences between tax bases and financial reporting carrying values of assets and liabilities based on enacted tax laws and rates applicable to the periods in which the differences are expected to affect taxable income. A valuation allowance is established when it is more likely than not that any of the deferred tax assets will not be realized.
Effective October 1, 2007, the Company adopted FASB Interpretation No. 48,Accounting for Uncertainty in Income Taxes, an Interpretation of FASB Statement No. 109 (“FIN 48” or the “Interpretation”). The Interpretation prescribes the minimum recognition threshold a tax position taken or expected to be taken in a tax return is required to meet before being recognized in the financial statements. It also provides guidance for derecognition, classification, interest and penalties, accounting in interim periods, disclosure, and transition. As a result of the implementation of FIN 48, the Company recognized an increase in the liability for unrecognized tax benefits of approximately $2.5 million and an increase of approximately $200,000 in accrued interest, which was accounted for as a reduction to the October 1, 2007 balance of retained earnings. At the adoption date of October 1, 2007, the Company had $13.7 million recorded as a liability for uncertain tax positions. At September 30, 2008, the liability for uncertain tax positions had increased to $17.6 million and is recorded in other liabilities in the accompanying consolidated balance sheet.
On February 21, 2008, the Company filed an application with Internal Revenue Service to change its overall method of tax reporting from the cash method to the accrual method, effective with the tax year ending September 30, 2008. The effect of this change is to increase the estimated current taxable income by approximately $99 million on a pro rata basis over the next four years. This method change had no impact on the Company’s overall provision of income taxes. The liability for the first year of the method change is included as a component in accounts payable and accrued expenses in the accompanying consolidated balance sheet as of September 30, 2008. The liability for the second year of the method change is included in the current deferred tax asset and the liability for the third and fourth years of the method change are included in non-current deferred income tax liabilities, in the accompanying consolidated balance sheet as of September 30, 2008.
Basic and Diluted Earnings per Share
Basic net income per share has been computed by dividing net income by the weighted average number of common shares outstanding. Diluted net income per share reflects the potential dilution that could occur assuming the inclusion of dilutive potential common shares and has been computed by dividing net income by the weighted average number of common shares and dilutive potential common shares outstanding. Dilutive potential common shares include all outstanding restricted stock awards using the treasury stock method.
A reconciliation of the number of shares used in computing basic and diluted earnings per share follows:
| | | | | | |
| | | Years Ended September 30, |
| (Shares in thousands) | | 2008 | | 2007 | | 2006 |
Weighted average shares outstanding—Basic | | 6,062 | | 6,258 | | 6,651 |
Effect of dilutive unvested restricted stock | | 94 | | 132 | | 467 |
| | | | | | |
Weighted average shares outstanding—Diluted | | 6,156 | | 6,390 | | 7,118 |
| | | | | | |
Accounts Receivable
Accounts receivable is presented net of allowance for doubtful accounts of $1.9 million and $1.8 million at September 30, 2008 and 2007, respectively. The Company estimates the allowance for doubtful accounts based on management’s evaluation of the contracts involved and the financial condition of its clients. The Company regularly evaluates the adequacy of the allowance for doubtful accounts by taking into consideration such factors
76
as the type of client—governmental agencies or private sector, trends in actual and forecasted credit quality of the client, including delinquency and payment history, general economic and particular industry conditions that may affect a client’s ability to pay, and contract performance and the change order and claim analysis. Retainer amounts were not significant as of September 30, 2008 and 2007.
Unbilled Fees and Billings in Excess of Costs
Unbilled fees represent the excess of contract revenue recognized over billings to date on contracts in process. These amounts become billable according to the contract terms, which usually consider the passage of time, achievement of certain milestones or completion of the project. Management expects that substantially all unbilled amounts will be billed and collected within one year.
Billings in excess of costs represents the excess of billings to date, per the contract terms, over revenue recognized on contracts in process.
Fair Value of Financial Instruments
The fair value of the Company’s cash equivalents, accounts receivables, unbilled fees and trade accounts payable approximates book value due to the short-term maturities of these instruments. The carrying amounts of the Company’s cash surrender value of life insurance policies are based on quoted market values or cash surrender value at the reporting date. The fair value of the Company’s debt approximates the carrying value, as such instruments are based on variable rates of interest.
Goodwill and Other Intangible Assets
Goodwill represents the excess of the purchase price over the estimated fair value of the net tangible and identifiable intangible assets of businesses acquired and accounted for under the purchase method. The Company accounts for its goodwill in accordance with SFAS No. 142, “Goodwill and Other Intangible Assets”, which requires the Company to test for goodwill impairment annually (or more frequently under certain conditions). Goodwill is evaluated for impairment at least annually, or when events or changes in circumstances indicate that the carrying value may not be recoverable. The Company conducts its impairment evaluation of Goodwill in conjunction with the annual independent valuation of the Company, as described above. In performing its evaluation of Goodwill, the Company takes into consideration the results of and the assumptions, used by the independent appraisers, the valuation of the Company in relation to the carrying value of Goodwill, any significant under-performance of each reporting unit in relation to projected operating results, significant negative industry or economic trends and the projected Company’s backlog position as of the end of the fiscal year. The Company’s reporting units for purposes of testing goodwill are the Company’s six services, Environmental Science, Water, Facilities, Federal, Transportation and Construction. The fair value of all of the Company’s reporting units are materially in excess their carrying value. Based on these annual impairment evaluations, the Company has concluded that Goodwill as of September 30, 2008, 2007 and 2006 was not impaired.
Due to the variables associated with the assumptions used in the valuation process, management assessment and projections, the potential impact of industry and economic trends and as additional information becomes known; the carrying value of Goodwill could significantly be affected by impairment charges in the future.
We amortize the cost of other intangible assets over their estimated useful lives unless such lives are deemed indefinite. Amortizable intangible assets are reviewed for impairment whenever events or changes in business circumstances indicate the carrying value of the assets may not be recoverable. If assets are determined to be impaired, they are written down to their estimated fair value. No impairment was recorded during the years ended September 30, 2008, 2007, or 2006.
77
Property and Equipment
Property and equipment are stated at cost less accumulated amortization and depreciation. Certain equipment held under capital leases is classified as furniture and equipment and the related obligations are recorded as capital lease obligations. Major renewals and improvements are capitalized, while repairs and maintenance are expensed as incurred. Depreciation is computed using the straight-line method over the estimated useful lives of the related assets. The useful lives of the assets range from three to forty years. Capital leases are amortized under the straight-line method over the lesser of the estimated useful life of the asset or the duration of the lease agreement. Leasehold improvements are amortized over the shorter of the term of the leases or their estimated useful lives. Depreciation and amortization expenses are included in general and administrative expenses, or G&A, in the accompanying consolidated statements of operations.
Cost and accumulated depreciation of property and equipment retired or sold are eliminated from the accounts at the time of retirement or sale and the resulting gain or loss is included in G&A in the accompanying consolidated statements of operations.
Long-Lived Assets
In accordance with SFAS No. 144 (“SFAS 144”),“Accounting for the Impairment or Disposal of Long-Lived Assets” long-lived assets are reviewed for impairment whenever events or changes in circumstances indicate that the carrying amount of an asset may not be recoverable. Long-lived assets are reviewed whenever events or changes in business circumstances indicate the carrying value of the assets may not be recoverable. If assets are determined to be impaired, they are written down to estimated fair value. No impairment was recorded during the years ended September 30, 2008, 2007, or 2006.
Concentrations of Credit Risk
Financial instruments, which potentially subject the Company to concentrations of credit risk, consist principally of cash, accounts receivable and unbilled fees. The Company deposits its cash with high credit quality financial institutions. At times, such deposits may be in excess of the Federal Deposit Insurance Corporation insurance limits.
Work performed for governmental entities accounted for approximately 74%, 75%, and 75%, of engineering fees for the years ended September 30, 2008, 2007, and 2006, respectively. Accounts receivable and unbilled fees from governmental entities were $67.8 million and $50.5 million, respectively at September 30, 2008, and $58.3 million and $46.1 million, respectively, at September 30, 2007. For the years ended September 30, 2008, 2007, and 2006, engineering fees of $94.0 million, $90.5 million, and $93.1 million, respectively, were derived from various districts of the Florida Department of Transportation, or FDOT, under numerous contracts. These revenues are primarily in the Transportation segment. While the loss of any individual contract would not have a material adverse effect on the Company’s results of operations and would not adversely impact the Company’s ability to continue work under other contracts with the FDOT, the loss of all, or a significant number of the FDOT contracts could have a material adverse effect on the Company’s results of operations.
Ongoing credit evaluations of customers are performed and generally no collateral is required. The Company provides an allowance for doubtful accounts based upon factors surrounding the credit risk of specific customers, historical trends and other information.
Derivative Instruments and Hedging Activities
In March 2001, the Company entered into an interest rate swap to convert the floating interest rate on the mortgage note payable to a fixed rate of 6.28%. On March 16, 2006, the swap expired. The Company accounted for the interest rate swap as a cash flow hedge in accordance with SFAS No. 133, “Accounting for Derivative Financial Instruments and Hedging Activities”. The underlying terms of the interest rate swap, including the
78
notional amount and interest rate index, were identical to those of the associated debt and therefore the hedging relationship resulted in no ineffectiveness. Changes in fair value were included as a component of other comprehensive loss in stockholders’ equity in our consolidated balance sheets. The net amounts paid or received were included in interest expense.
Estimated Liability for Self-Insurance
The Company is self-insured up to certain limits for costs associated with general liability, workers’ compensation and employee health coverage. The Company also maintains a stop loss insurance policy with a third party insurer to limit the Company’s exposure to individual and aggregate claims made. Insurance claims and reserves include accruals of estimated settlements for known claims, as well as accruals of estimates of incurred but not reported claims, net of payments made. Our professional liability coverage is on a “claims-made basis” meaning the coverage applies to claims made during a policy year regardless of when the causative action took place. All other coverages are “occurrence-basis” meaning that the policy in place when the injury or damage occurred is the policy that responds regardless of when the claim is made. Our professional liability limits per policy year are $45 million with a per claim deductible of $125,000 plus an annual aggregate retention of $3 million. This coverage would also cover the Company for a claim against a subcontractor of the Company. At September 30, 2008 and 2007, we had total self-insurance accruals reflected in accounts payable and accrued expenses in our consolidated balance sheets of $9.4 million and $6.9 million, respectively. These estimates are subject to variability due to changes in trends of losses for outstanding claims and incurred but not recorded claims, including external factors such as future inflation rates, benefit level changes and claim settlement patterns.
Comprehensive Income
Comprehensive income consists of net income and other gains and losses affecting shareholders’ investment and minimum pension liability that, under generally accepted accounting principles, are excluded from net income.
The components of other comprehensive income for the years ended September 30, 2008, 2007, and 2006 are as follows:
| | | | | | | | | | |
| | | Years Ended September 30, | |
| (Dollars in thousands) | | 2008 | | 2007 | | 2006 | |
Net income | | $ | 15,472 | | $ | 19,098 | | $ | 5,405 | |
Other comprehensive income (loss): | | | | | | | | | | |
Unrealized gain on available for sale marketable securities, net of tax | | | — | | | — | | | 14 | |
Realized gain on available for sale marketable securities, net of tax | | | — | | | — | | | (242 | ) |
Unrealized gain on derivative, net of tax | | | — | | | — | | | 35 | |
Loss recognized due to curtailment and settlement of deferred compensation plan | | | 1,137 | | | | | | | |
Minimum pension liability adjustment, net of tax | | | 102 | | | 901 | | | 236 | |
| | | | | | | | | | |
Total comprehensive income | | $ | 16,711 | | $ | 19,999 | | $ | 5,448 | |
| | | | | | | | | | |
The components in accumulated other comprehensive loss as of September 30, 2008 and 2007 are as follows:
| | | | | | | | |
| | | September 30, | |
| (Dollars in thousands) | | 2008 | | | 2007 | |
Deferred net pension loss, net of tax | | $ | (7 | ) | | $ | (1,246 | ) |
| | | | | | | | |
Accumulated other comprehensive loss | | $ | (7 | ) | | $ | (1,246 | ) |
| | | | | | | | |
79
Recent Accounting Pronouncements
In October 2008, the FASB issued FASB Staff Position Financial Accounting Standard 157-3,Determining the Fair value of a Financial Asset When the Market for That Asset Is Not Active, or FSP 157-3. FSP 157-3 clarifies the application of SFAS 157, “Fair Value Measurements” or SFAS 157 in a market that is not active and provides an example to illustrate key considerations in determining the fair value of a financial asset when the market for that financial asset is not active. FSP 157-3 is effective upon issuance and will be effective for the Company in October 2008. The Company does not believe the adoption of FSP 157-3 will have a material impact on our consolidated financial statements.
In May 2008, the FASB issued SFAS No. 162,The Hierarchy of Generally Accepted Accounting Principles or SFAS 162. SFAS 162 identifies the sources of accounting principles to be used in the preparation of nongovernmental entity financial statements and reflects the FASB’s belief that the responsibility for selecting the appropriate and relevant accounting principles rests with the entity. The FASB does not expect SFAS 162 to change current practice but in the rare circumstance there is a change from current practice, the statement includes transition provisions. This statement is effective 60 days following the SEC’s approval of the Public Company Accounting Oversight Board amendments to AU Section 411,The Meaning of Present Fairly in Conformity With Generally Accepted Accounting Principles. The Company does not expect the guidance in this standard to have a significant impact on its consolidated financial statements.
In April 2008, the FASB issued FASB Staff Position Financial Accounting Standard 142-3,Determination of the Useful Life of Intangible Assetsor FSP 142-3. FSP 142-3 amends the factors that should be considered in developing renewal or extension assumptions used to determine the useful life of a recognized intangible asset under SFAS 142,Goodwill and Other Intangible Assets, or SFAS 142. In developing assumptions about renewal or extensions, FSP 142-3 requires an entity to consider its own historical experience (or, if no experience, market participant assumptions) adjusted for the entity-specific factors in paragraph 11 of SFAS 142. FSP 142-3 expands the disclosure requirements of SFAS 142 and is effective for financial statements issued for fiscal years beginning after December 15, 2008 and is effective for the Company at the beginning of fiscal year 2010. Early adoption is prohibited. The Company does not believe the adoption of FSP 142-3 will have a material impact on our consolidated financial statements.
In December 2007, the Financial Accounting Standard Board (“FASB”) issued Statement of Financial Accounting Standards (“SFAS”) No. 160 or SFAS 160,“Noncontrolling Interests in Consolidated Financial Statements” an amendment of ARB No. 51. This standard requires specific financial disclosures of consolidated noncontrolling interest with the objective of improving the relevance, comparability, and transparency of the financial information relating to noncontrolling interest in a consolidated subsidiary. The Company is required to adopt the recognition and related disclosure provisions of SFAS 160 beginning with interim periods of its fiscal year ending September 30, 2010; earlier adoption is prohibited. The Company does not believe the adoption of SFAS 160 will have a material impact on its consolidated financial statements.
In December 2007, the FASB issued SFAS No. 141 (revised 2007) or SFAS 141(R),“Business Combinations”. The objective of this Statement is to improve the relevance, representational faithfulness, and comparability of the information that a reporting entity provides in its financial reports about a business combination and its effects. The Company is required to adopt the recognition and related disclosure provisions of SFAS 141(R) beginning with the interim periods of its fiscal year ending September 30, 2010; earlier adoption is prohibited. The Company is currently evaluating the impact of this statement on its consolidated financial statements.
On February 15, 2007, the Financial Accounting Standards Board (“FASB”) issued SFAS No. 159 or SFAS 159, “The Fair Value Option for Financial Assets and Financial Liabilities,” which allows an entity the irrevocable option to elect fair value for the initial and subsequent measurement for certain financial assets and liabilities on a contract-by-contract basis. Subsequent changes in fair value of these financial assets and liabilities
80
would be recognized in earnings when they occur. SFAS 159 further establishes certain additional disclosure requirements. SFAS 159 is effective for the Company’s fiscal year ending September 30, 2009, with earlier adoption permitted. Management is currently evaluating the impact and timing of the adoption of SFAS 159.
In September 2006, FASB issued SFAS No. 158 or SFAS 158, “Employers’ Accounting for Defined Benefit Pension and Other Postretirement Plans”. This standard requires an employer to recognize the over or under status of a defined benefit postretirement plan (other than a multiemployer plan) as an asset or liability in its statement of financial position and to recognize changes in that funded status in the year in which the changes occur through comprehensive income. The Company was required to adopt the recognition and related disclosure provisions of SFAS 158 beginning with its fourth quarter of the fiscal year ended September 30, 2007. As a result, the Company recorded a pre-tax charge to accumulated other comprehensive income totaling $392,000 ($233,000 after tax). For additional information, see Note 8, “Retirement Plans.” The Company is also required to adopt the measurement provisions of SFAS 158 for the fiscal year ending September 30, 2009. This provision requires companies to measure plan assets and benefit obligations as of the date of the Company’s fiscal year-end. No change in measurement dates was necessary since the Company already meets this requirement.
In September 2006, the FASB issued SFAS No. 157 or SFAS 157, “Fair Value Measurements.” SFAS 157 prescribes a single definition of fair value as the price that would be received to sell an asset or paid to transfer a liability in an orderly transaction between market participants at the measurement date. The provisions of SFAS 157 were to be effective for the Company for the fiscal year ending September 30, 2009. In November 2007, the FASB reaffirmed the originally scheduled implementation date in accounting for financial assets and liabilities of financial institutions and provided a one year deferral for the implementation of SFAS 157 for other nonfinancial assets and liabilities. As a result, SFAS 157 is expected to be effective for the Company on October 1, 2010. In October 2008, the FASB issued SFAS No. 157-3 (“SFAS 157-3”), “Determining the Fair Value of a Financial Asset when the Market for that Asset is Not Active.” SFAS 157-3 clarifies the methods employed in determining the fair value for financial assets when a market for such assets is not active. The Company does not believe the adoption of SFAS 157 will have a material impact on its consolidated financial statements.
In September 2006, the SEC issued Staff Accounting Bulletin No. 108 or SAB 108. SAB 108 addresses how the effects of prior year uncorrected misstatements should be considered when quantifying misstatements in current year financial statements. SAB 108 requires companies to quantify misstatements using a balance sheet and income statement approach and to evaluate whether either approach results in quantifying an error that is material in light of relevant quantitative and qualitative factors. When the effect of initial adoption is material, companies will record the effect as a cumulative effect adjustment to beginning of year retained earnings. SAB 108 was effective for the Company for the fiscal year ending September 30, 2007. We adopted SAB 108 in our first quarter of fiscal 2007. The adoption of SAB 108 did not have a material impact on our consolidated financial statements.
In July 2006, the FASB issued Interpretation (“FIN”) No. 48,“Accounting for Uncertainty in Income Taxes an interpretation of FASB No. 109” or FIN 48. This interpretation establishes guidelines and thresholds that must be met for the recognition and measurement of a tax position taken or expected to be taken on a tax return. The Company adopted FIN 48 in the first quarter of fiscal 2008, beginning on October 1, 2007. As a result of the adoption of FIN 48, the Company has recognized a change in the liability for unrecognized tax benefits of $2.5 million and an increase of approximately $200,000 in accrued interest, which was accounted for as a reduction to the October 1, 2007 balance of retained earnings in the accompanying consolidated financial statements.
In December 2004, the FASB issued SFAS No. 123 (revised 2004),“Share-Based Payment” or SFAS 123(R), which is a revision of SFAS No. 123,“Accounting for Stock-Based Compensation.” SFAS 123(R) supersedes APB Opinion No. 25, Accounting for Stock Issued to Employees. SFAS 123(R) requires all share-based payments to employees, including grants of employee stock options, to be recognized in the financial statements based on their fair values, beginning with the first annual period beginning after December 15, 2005, with early adoption encouraged. We have adopted SFAS 123(R) in our first quarter of fiscal year 2007,
81
beginning October 1, 2006. The adoption of SFAS 123(R) resulted in the reclassification of the balance of unvested restricted stock as of September 30, 2006, in the amount of $3.1 million, as a increase to unearned compensation in stockholders’ equity and a corresponding reduction to additional paid-in capital for the same amount in the accompanying consolidated statements of stockholders’ equity for the year ended September 30, 2007.
In March 2005, subsequent to the issuance of the Company’s 2004 financial statements, we discovered misappropriations of Company funds by our former Chief Financial Officer and two former employees who worked in our information systems and treasury departments, or the participants. The participants colluded and circumvented controls to misappropriate funds and conceal the misappropriations possibly beginning as early as 1993 until the misappropriations were discovered in March 2005.
An investigation revealed that at least $36.6 million was misappropriated between January 1, 1998 and the discovery of the misappropriations in March 2005. We have not discovered and do not expect to discover any additional misappropriations and, therefore, we have not recorded any misappropriation losses for fiscal years 2008 and 2007. Any amounts misappropriated prior to January 1, 1998 could not be determined because certain data for the period prior to January 1, 1998 was unavailable.
Overstatement of Amounts Billed for Overhead
The Company determined that the misappropriation scheme led to the overstatement of overhead rates that the Company used to determine billings in connection with certain of our government contracts. As a result, some of our government clients were overcharged for the Company’s services. During the review of the overhead expenses, the Company identified certain instances of costs erroneously included in our overhead cost pool which were unallowable under applicable regulations and an error in our calculation of our overhead rate, which related to certain general and administrative costs. The Company determined that the unallowable costs and general and administrative expense errors also led to the overstatement of overhead rates which the Company used in connection with certain of its government contracts. As a result, in these instances, some of our billings to our government clients relied on or incorporated the overstated overhead rates.
The Company determined corrected overhead rates considering the impact of the misappropriations and considering the impact of additional errors identified. The Company and its advisors have been working with its government clients to finalize the refund amount (See Note 12 for further discussion). The Company estimates that the cumulative refund amount, before any payments, resulting from the overstated overhead rates was $35.1 million through fiscal year 2008, including interest that the Company is required to reimburse its government clients. Based on settlements to date and new information, the Company has changed its estimate of the accrued reimbursement liability and has recorded a reduction in the liability with a corresponding increase in engineering fees in the amount of $2.3 million and $4.5 million, respectively for the fiscal years ended September 30, 2008 and 2007. At September 30, 2008 and 2007, the accrued reimbursement liability was $2.2 million and $8.4 million, respectively, in the accompanying consolidated balance sheets. The following table shows the activity in the accrued reimbursement liability during the years ended September 30, 2008 and 2007:
| | | | | | | | |
| | | Years Ended September 30, | |
| (Dollars in thousands) | | 2008 | | | 2007 | |
Balance at October 1, | | $ | 8,385 | | | | 28,183 | |
Payments | | | (3,817 | ) | | | (15,588 | ) |
Interest and other | | | (100 | ) | | | 317 | |
Adjustments | | | (2,282 | ) | | | (4,527 | ) |
| | | | | | | | |
Balance at September 30, | | $ | 2,186 | | | $ | 8,385 | |
| | | | | | | | |
82
Insurance Proceeds and Gain/Loss on Recoveries
Approximately 19,000 shares of the Company’s common stock were surrendered by the participants in fiscal years 2006. These shares were recorded at their estimated fair value, and gains on recovery of misappropriated assets of approximately $537,000 were recognized for the year ended September 30, 2006 and included in gain on recoveries, net of misappropriation loss in the accompanying consolidated statement of operations for the years ended September 30, 2006. These shares were not included in assets held for sale, as the estimated fair value of such shares was recorded as a reduction of stockholders’ equity.
The Company carries insurance to cover fiduciary and crime liability. These policies are renewed on an annual basis and were in effect for the periods in which the participants misappropriated funds. The Company filed a claim under the annual crime policy for the period ended April 2005, which is referred to as the 2005 Policy, to recover some of the misappropriation losses which resulted from the embezzlement. In January 2007, the Company received $2.0 million, the stated limit under the 2005 Policy. The insurance proceeds were recognized in insurance proceeds and gain on recoveries, net of misappropriation loss in the accompanying consolidated statement of operations for the year ended September 30, 2007. In August 2007, the Company filed suit seeking a declaration that the insurance carrier is obligated to the Company for losses suffered as a result of the embezzlement for policy years 1991 through 2004. The amount of recovery sought for those policy years is $17 million. In August 2008, the initial motion for summary judgment was denied by the court. In September 2008, the Company filed a notice of appeal. At the present time, we are unable to predict the likely outcome of this legal action and accordingly since the recovery is contingent upon the outcome, have not recorded any insurance receivable.
Gain from recovered assets has been recognized at the estimated fair value of the assets recovered, less related debt and estimated costs to sell the assets, and it is included in gain on recoveries, net of misappropriation loss in the accompanying consolidated statements of operations for fiscal years 2007 and 2006.
In addition to the misappropriation loss, the Company has incurred certain professional fees and other costs that relate to the investigation of the embezzlement and the recovery of assets. These expenses include legal fees, forensic audit fees and related costs, and other costs associated with the recovery of misappropriated assets. Collectively, these costs are stated as investigation and related costs in the accompanying consolidated statements of operations and are recorded in the period the costs are incurred.
The following table sets forth the components of the misappropriation loss for the years ended September 30, 2007, and 2006 and related investigation expenses. There were no such costs incurred in 2008:
| | | | | | | | |
| | | Years Ended September 30, | |
| (Dollars in thousands) | | 2007 | | | 2006 | |
Misappropriation loss | | $ | — | | | $ | — | |
Insurance proceeds from misappropriation loss | | | (2,000 | ) | | | — | |
(Gain) loss on recoveries | | | 11 | | | | (1,613 | ) |
| | | | | | | | |
Insurance proceeds and gain on recoveries, net of misappropriation loss | | | (1,989 | ) | | | (1,613 | ) |
| | | | | | | | |
Legal fees | | | 1,541 | | | | 5,270 | |
Forensic accounting fees and related costs | | | 2,185 | | | | 7,885 | |
Other | | | 76 | | | | 1,084 | |
| | | | | | | | |
Investigation and related costs | | | 3,802 | | | | 14,239 | |
| | | | | | | | |
Total | | $ | 1,813 | | | $ | 12,626 | |
| | | | | | | | |
83
The misappropriation loss, insurance proceeds from misappropriation loss and recorded gains and losses from recovered assets and the investigation and related costs have been allocated to our segments based on the individual segments’ proportionate share of general and administrative expenses to total Company general and administrative expenses.
During the course of the investigation described in Note 2, the Company identified and recovered certain assets acquired by the participants using misappropriated Company funds. Assets recovered during the investigation and not yet liquidated, are recorded at estimated fair value less estimated costs to sell. Certain of these assets were originally classified as held for sale.
At September 30, 2008 and 2007, the remaining assets held for sale, consisting of a condominium and jewelry, with a carrying value of approximately $393,000 and $468,000, respectively, have been included in other non-current assets in the accompanying consolidated balance sheet as such assets did not meet the criteria to be classified as assets held for sale. An impairment charge of $75,000 was recognized on the condominium during fiscal year 2008 and is included in general and administrative expenses in the accompanying consolidated statement of operations for the year ended September 30, 2008. The Company intends to sell the remaining assets as soon as practicable.
During fiscal year 2007, the Company sold a real estate asset for $3.7 million which was subject to a mortgage of $2.1 million. The Company recognized an additional $98,000 in losses, primarily due to additional unanticipated closing costs related to the sale and interest payments on the debt which is included in insurance proceeds and gain on recoveries, net of misappropriation loss in the accompanying consolidated statement of operations for the year ended September 30, 2007.
During fiscal year 2006, the Company sold assets for a total of $10.5 million which were subject to related liabilities of $4.6 million. The Company did not recognize any additional gains or losses related to the sales of these assets since they were recorded at their fair value less estimated costs to sell.
Property and equipment consisted of the following:
| | | | | | | | | | |
| | | Estimated Useful Lives | | September 30, | |
| (Dollars in thousands) | | | 2008 | | | 2007 | |
Land | | | | $ | 1,756 | | | $ | 1,756 | |
Building and building improvements | | 10 – 40 years | | | 10,431 | | | | 10,410 | |
Furniture and equipment | | 3 – 7 years | | | 37,123 | | | | 46,180 | |
Computer equipment | | 3 years | | | 31,631 | | | | 25,805 | |
Vehicles | | 3 – 10 years | | | 2,361 | | | | 2,361 | |
Leasehold improvements | | 10 years | | | 13,398 | | | | 9,629 | |
Construction in process | | | | | 134 | | | | 2,636 | |
| | | | | | | | | | |
| | | | | 96,834 | | | | 98,777 | |
Less accumulated amortization and depreciation | | | | | (60,889 | ) | | | (63,845 | ) |
| | | | | | | | | | |
Property and equipment at cost, net | | | | $ | 35,945 | | | $ | 34,932 | |
| | | | | | | | | | |
On August 31, 2007 the Company entered into an agreement to sell its Doral, Florida office building, including building improvements, which is referred to as the Doral Property, for $22.1 million in cash. The closing on the sale occurred on September 14, 2007. The gain on the sale of the Doral Property, net of $680,000 closing costs, was $16.2 million, of which $13.4 million was deferred. Simultaneous with the closing, the Company entered into a 10-year triple net lease agreement, with an option to renew the lease for additional five
84
years. Under the lease agreement, the base annual rent is $1.7 million and will escalate at the rate of 2% per year. The Company is responsible for all operating expenses, taxes, general liability insurance, repairs and maintenance and other costs of operating the premises. This lease has been accounted as an operating lease under the provisions of SFAS No.13,“Accounting for Leases”.
The Company has accounted for this transaction involving the Doral Property as a sale-leaseback transaction in accordance with the provisions of SFAS No. 98,“Accounting for Leases: Sale-Leaseback Transaction Involving Real Estate” and SFAS No.28,“Accounting for sales with Leasebacks—an amendment of FASB Statement No. 13”. As a result, the Company recognized in fiscal year 2007, $2.8 million of the total gain on the sale of the Doral Property, representing the excess of the total gain over the present value of the minimum lease payment under the sale- leaseback. The amount of gain recognized is included in general and administrative expenses in the accompanying consolidated statement of operations for the fiscal year ended September 30, 2007. The remaining gain, $13.4 million, has been deferred and will be amortized over the non-cancelable term of the lease in proportion to the related gross rental charges, including the straight-lining of the stipulated rent increases. The amortization of the deferred gain in 2008 totaling $1.4 million has been recorded as a reduction of rent expense and is included in general and administrative expenses in the accompanying consolidated statements of operations for the fiscal year ended September 30, 2008. The current portion of the deferred gain balance, $1.3 million at September 30, 2008, is included in accounts payable and accrued expenses in the accompanying consolidated balance sheet. The non-current portion of the deferred gain balance of $10.7 million is included in other non-current liabilities in the accompanying consolidated balance sheet as of September 30, 2008.
The net book value of equipment recorded under capital leases was approximately $1.2 million and $674,000 at September 30, 2008 and 2007, respectively.
Depreciation and amortization expense relating to property and equipment amounted to $10.4 million, $10.4 million, and $9.4 million, for the years ended September 30, 2008, 2007, and 2006, respectively. The Company’s purchases of property and equipment amounted to $10.4 million, $10.3 million and $11.4 million during fiscal years 2008, 2007 and 2006, respectively. Capital expenditures during fiscal year 2008, 2007 and 2006 consisted of property and equipment purchases, such as survey equipment, computer systems, software applications, furniture and equipment and leasehold improvements.
On February 29, 2008, the Company acquired 100% of the stock of EcoScience Corporation, or EcoScience, for $2.25 million, composed of $2.0 million in cash, 6,750 shares of the Company’s Class A common stock, valued at approximately $200,000 and $50,000 in cash held in escrow. The purchase price was allocated to the respective assets and liabilities based on their estimated fair values as of the acquisition date. The allocation of the purchase price resulted in assets of $2.8 million, including approximately $790,000 of intangible assets and $1.4 million of goodwill, none of which is deductible for tax purposes, and liabilities of approximately $593,000. EcoScience specializes in the preparation of ecological assessments and environmental impact statements, endangered species determinations, wetland delineations, storm water master planning, hydrologic and hydraulic engineering and surface or groundwater modeling primarily in North Carolina, South Carolina and the Southeastern region of the United States. EcoScience enhances our technical strength in environmental, water and planning markets and solidifies the Company’s general presence in the Southeast.
On April 30, 2006, we acquired 100% of the stock of EIP Associates, or EIP, for $6.0 million, net of cash acquired of approximately $15,000, comprised of $5.5 million in cash, approximately $334,000 accrued additional purchase price and $200,000 held in escrow. The purchase price was allocated to the respective assets and liabilities based on their estimated fair values as of the acquisition date. The allocation of the purchase price resulted in assets of $9.0 million, including $1.5 million of intangible assets and $3.7 million of goodwill, none of which is deductible for tax purposes, and liabilities of $3.9 million. EIP specializes in environmental, urban planning, water resource planning and natural resources in California. The EIP acquisition enhances our technical strength in the California environmental, water and planning markets and enhances our general presence in California.
85
The primary factor resulting in the recognition of goodwill in these acquisitions is the intellectual capital of the skilled professionals and senior technical personnel associated with the acquired entities which does not meet the criteria for recognition as an asset apart from goodwill. The results of operations of the above acquisitions are included from the date of acquisition. The pro forma impact of these acquisitions is not material to reported historical operations.
On December 15, 2008, the Company entered into a Stock Purchase Agreement among Judy Mitchell, John R. Stewart and Eduardo Vargas (collectively, the “Sellers”), pursuant to which the Company agreed to purchase all of the issued and outstanding shares of capital stock of Peter R. Brown Construction, Inc. (“Peter Brown”), a Florida corporation, for an aggregate purchase price of $16.0 million, subject to adjustment as provided therein. The Purchase Price will consist of (i) $12.0 million in cash and (ii) $4.0 million of restricted shares of the Company’s Class A common stock, par value $0.00067 per share, to be issued pursuant to the Company’s 2008 Employee Restricted Stock Plan. The closing is expected to take place on or about December 31, 2008. The aggregate number of shares of restricted stock to be issued to the Sellers will be based on the per share price of the Company’s Class A Common Stock as of September 30, 2008.
| 6. | Goodwill and Other Intangible Assets |
The changes in the net carrying amounts of goodwill, by segment, for the year ended September 30, 2008 are as follows:
| | | | | | | | | | | | | | | |
| | | Year Ended September 30, 2008 |
| | | Transportation
Services | | Construction
Management | | Civil
Engineering | | Environmental
Services | | Total |
Goodwill, beginning of year | | $ | 3,922 | | $ | — | | $ | 2,641 | | $ | 15,129 | | $ | 21,692 |
EcoScience acquisition | | | | | | | | | | | | 1,379 | | | 1,379 |
| | | | | | | | | | | | | | | |
Goodwill, end of year | | $ | 3,922 | | $ | — | | $ | 2,641 | | $ | 16,508 | | $ | 23,071 |
| | | | | | | | | | | | | | | |
The Company’s intangible assets consist of the following:
| | | | | | | | |
| | | | | September 30, 2008 |
| (Dollars in thousands) | | Estimated Useful
Lives | | Gross Carrying
Amount | | Accumulated
Amortization |
Client list | | 10 years | | $ | 2,613 | | $ | 1,455 |
Backlog | | 3 years | | | 2,819 | | | 2,749 |
Website | | 7 years | | | 200 | | | 166 |
Employee agreements | | 3 years | | | 67 | | | 56 |
| | | | | | | | |
| | | | $ | 5,699 | | $ | 4,426 |
| | | | | | | | |
| | |
| | | | | September 30, 2007 |
| (Dollars in thousands) | | Estimated Useful
Lives | | Gross Carrying
Amount | | Accumulated
Amortization |
Client list | | 10 years | | $ | 1,963 | | $ | 1,172 |
Backlog | | 3 years | | | 2,679 | | | 2,679 |
Website | | 7 years | | | 200 | | | 138 |
Employee agreements | | 3 years | | | 67 | | | 34 |
| | | | | | | | |
| | | | $ | 4,909 | | $ | 4,023 |
| | | | | | | | |
86
Amortization expense for intangible assets amounted to $403,000, $792,000, and $1.6 million, for the years ended September 30, 2008, 2007, and 2006, respectively and is included in G&A in the consolidated statement of operations. Estimated amortization for the future periods is as follows:
| | | |
Year Ended September 30, | | Scheduled
Amortization |
| (Dollars in thousands) | | |
2009 | | $ | 392 |
2010 | | | 268 |
2011 | | | 201 |
2012 | | | 160 |
2013 | | | 96 |
2014 | | | 156 |
| | | |
| | $ | 1,273 |
| | | |
The provision for income taxes consisted of the following:
| | | | | | | | | | | |
| | | Years Ended September 30, | |
| (Dollars in thousands) | | 2008 | | | 2007 | | 2006 | |
Current | | | | | | | | | | | |
Federal provision (benefit) | | $ | 11,921 | | | $ | 906 | | $ | (1,824 | ) |
State provision (benefit) | | | 3,720 | | | | 429 | | | (192 | ) |
Deferred | | | | | | | | | | | |
Federal provision (benefit) | | | (8,175 | ) | | | 4,828 | | | 4,797 | |
State provision (benefit) | | | (2,551 | ) | | | 2,282 | | | 505 | |
| | | | | | | | | | | |
Total provision | | $ | 4,915 | | | $ | 8,445 | | $ | 3,286 | |
| | | | | | | | | | | |
The tax effects of temporary differences that give rise to significant portions of the deferred tax assets and deferred tax liabilities consisted of the following:
| | | | | | | | |
| | | September 30, | |
| (Dollars in thousands) | | 2008 | | | 2007 | |
Deferred tax liabilities: | | | | | | | | |
Accounts receivable | | $ | — | | | $ | (33,288 | ) |
Unbilled fees | | | — | | | | (30,133 | ) |
Cash to accrual adjustment | | | (28,611 | ) | | | — | |
Fixed and intangible assets | | | (2,364 | ) | | | (2,034 | ) |
Other | | | (613 | ) | | | (1,532 | ) |
| | | | | | | | |
Gross deferred tax liabilities | | | (31,588 | ) | | | (66,987 | ) |
| | | | | | | | |
Deferred tax assets: | | | | | | | | |
Accounts payable and accrued expenses | | | 9,750 | | | | 28,529 | |
Accrued vacation | | | 3,548 | | | | 5,058 | |
Federal tax credit carry forwards | | | — | | | | 203 | |
Deferred gain on sale of office building | | | 4,577 | | | | 5,380 | |
Deferred compensation | | | 5,086 | | | | 4,327 | |
Other | | | 2,008 | | | | 3,913 | |
Accrued reimbursement liability | | | 835 | | | | 3,388 | |
| | | | | | | | |
Gross deferred tax asset | | | 25,804 | | | | 50,798 | |
Valuation allowance | | | — | | | | (162 | ) |
| | | | | | | | |
Net deferred tax asset | | | 25,804 | | | | 50,636 | |
| | | | | | | | |
Net deferred tax liability | | $ | (5,784 | ) | | $ | (16,351 | ) |
| | | | | | | | |
87
SFAS No. 109, “Accounting for Income Taxes”, requires a valuation allowance to reduce the deferred tax assets reported if it is more likely than not that some portion or all of the deferred tax assets will not be realized. The Company has recorded a valuation allowance against its deferred tax assets of $0 and approximately $162,000, for the years ended September 30, 2008 and 2007, respectively.
For the past several years, the Company has generated research and development tax credits related to certain qualifying costs. The qualifying costs relate primarily to the Company’s project costs which management believes involved technical uncertainty. These research and development costs were incurred by the Company in the course of providing services generally under long-term client projects. As of September 30, 2008 and 2007, respectively, the Company had research and development tax credit carryforwards of $300,000 and $400,000 which at September 30, 2008 were fully reserved.
On February 21, 2008, the Company filed an application with Internal Revenue Service to change its overall method of tax reporting from the cash method to the accrual method, effective with the tax year ending September 30, 2008. The effect of this change is to increase the estimated current taxable income by approximately $99 million on a pro rata basis over the next four years. This method change had no impact on the Company’s overall provision of income taxes. The liability for the first year of the method change is included as a component in accounts payable and accrued expenses in the accompanying consolidated balance sheet as of September 30, 2008. The liability for the second year of the method change is included in the current deferred tax asset and the liability for the third and fourth years of the method change are included in non-current deferred income tax liabilities, in the accompanying consolidated balance sheet as of September 30, 2008.
The deferred tax balances have been classified in the consolidated balance sheets as follows:
| | | | | | | | |
| | | September 30, | |
| (Dollars in thousands) | | 2008 | | | 2007 | |
Current assets | | $ | 13,399 | | | $ | 37,207 | |
Current liabilities | | | (9,801 | ) | | | (64,954 | ) |
Valuation allowance | | | — | | | | (162 | ) |
| | | | | | | | |
Net current tax asset (liabilities) | | | 3,598 | | | | (27,909 | ) |
| | | | | | | | |
| | |
Non-current assets | | | 12,405 | | | | 13,592 | |
Non-current liabilities | | | (21,787 | ) | | | (2,034 | ) |
| | | | | | | | |
Net non-current assets | | | (9,382 | ) | | | 11,558 | |
| | | | | | | | |
Net deferred tax liabilities | | $ | (5,784 | ) | | $ | (16,351 | ) |
| | | | | | | | |
A reconciliation of the income tax provision to taxes computed at the U.S. federal statutory rate is as follows:
| | | | | | | | | |
| | | Years Ended September 30, | |
| | | 2008 | | | 2007 | | | 2006 | |
U.S. statutory rate | | 35.0 | % | | 35.0 | % | | 35.0 | % |
Federal tax credits | | — | | | 1.0 | | | (3.4 | ) |
State taxes net of federal benefit | | 3.7 | | | 6.4 | | | 5.2 | |
Non-deductible expenses | | 3.2 | | | 2.5 | | | 14.5 | |
Change in tax reserve | | (11.6 | ) | | (5.3 | ) | | (11.9 | ) |
Change in valuation allowance | | (0.8 | ) | | (14.6 | ) | | (1.0 | ) |
Change in statutory rate | | (3.5 | ) | | 1.8 | | | — | |
Other | | (1.9 | ) | | 3.9 | | | (0.6 | ) |
| | | | | | | | | |
Effective tax rate | | 24.1 | % | | 30.7 | % | | 37.8 | % |
| | | | | | | | | |
88
The Company’s effective tax rate is based on income, statutory tax rates, and tax planning opportunities available in the various jurisdictions in which the Company operates. Significant judgment is required in determining the effective tax rate and in evaluating the Company’s tax positions. The Company established reserves when, despite its belief that the tax return positions are fully supportable, it believes that certain positions, if challenged, will likely be resolved unfavorably to us. These reserves are adjusted in light of changing facts and circumstances, such as the progress of a tax audit or current developments in tax law. The Company’s annual tax rate includes the impact of reserve provisions and changes to reserves. While it is often difficult to predict the final outcome or the timing of resolution of any particular matter, the Company believes that its reserves reflect the probable outcome of known tax contingencies. Resolution of the tax contingencies would be recognized as an increase or decrease to the Company’s tax rate in the period of resolution. During the years ended September 30, 2008 and 2007, the Federal statute of limitations expired on returns for the years ended September 30, 2004 and 2003. The Company is no longer subject to U.S. Federal examination for these years. As a result, the Company reduced its tax contingency accrual by $3.0 million and $3.2 million, respectively. As a result of the implementation of FIN 48, the Company increased its tax accrual by $2.7 million. In addition, for the year ended September 30, 2008, the Company increased its tax contingency accrual by $6.9 million which included $6.3 million for which no tax benefit has been recognized. The net changes in the tax contingency accrual recorded in the tax provision reduced the Company’s effective tax rate by 11.6% and 5.3%, respectively. The Company has recorded a tax contingency accrual of $17.6 million and $11.0 million as of September 30, 2008 and 2007, respectively, related primarily to research and development tax credits taken on the Company’s tax return. The tax contingency accruals are presented in the accompanying consolidated balance sheets within other liabilities.
Effective October 1, 2007, the Company adopted FASB Interpretation No. 48,Accounting for Uncertainty in Income Taxes, an Interpretation of FASB Statement No. 109 (“FIN 48” or the “Interpretation”). The Interpretation prescribes the minimum recognition threshold a tax position taken or expected to be taken in a tax return is required to meet before being recognized in the financial statements. It also provides guidance for derecognition, classification, interest and penalties, accounting in interim periods, disclosure, and transition. As a result of the implementation of FIN 48, the Company recognized an increase in the liability for unrecognized tax benefits of approximately $2.5 million related to research and development tax credit carryforwards, and an increase of approximately $200,000 in accrued interest, which was accounted for as a reduction to the October 1, 2007 balance of retained earnings. After the adoption date of October 1, 2007, the Company had $13.7 million recorded as a liability for uncertain tax positions. At September 30, 2008, the liability for uncertain tax positions had increased to $17.6 million related primarily to research and development tax credits taken on the Company’s tax return. The reserve for uncertain tax positions at September 30, 2008, is recorded in other liabilities in the accompanying consolidated balance sheet.
A reconciliation of the beginning and ending amount of unrecognized tax benefits as of September 30, 2008 is as follows (in thousands):
| | | | |
| | | September 30,
2008 | |
Balance at October 1, 2007 | | $ | 13.7 | |
Additions for prior year tax positions | | | — | |
Additions for current year tax positions | | | 6.9 | |
Reductions for prior year tax positions | | | — | |
Settlements | | | — | |
Reductions as a result of lapse of applicable statute of limitations | | | (3.0 | ) |
| | | | |
Balance at September 30, 2008 | | $ | 17.6 | |
| | | | |
The entire balance at September 30, 2008 of $17.6 million, if recognized would affect the effective tax rate. It is also reasonably possible that the total amount of unrecognized tax benefits at September 30, 2008, may decrease by approximately $5.2 million and related interest due to the completion of examinations or the expiration of the statute of limitations within 12 months of September 30, 2008.
89
The Company recognized interest, and penalties if applicable, related to uncertain tax positions within the provision for income taxes in the consolidated statement of operations. As of September 30, 2008, the Company had accrued $2.1 million in interest and nothing in penalties related to uncertain tax provisions.
The Company files income tax returns with the U.S. Federal Government, various state and local jurisdictions, as well as Puerto Rico. With few exceptions, the Company is no longer subject to U.S. Federal, State or Local, or Puerto Rico examination by tax authorities for years before October 1, 2004.
The Company maintains a two-tiered noncontributory, unfunded, nonqualified defined benefit pension plan.
The Key Employee Supplemental Option Plan, or KESOP, is a two-tiered plan that provides key officers and employees postretirement benefits. Tier one of the KESOP, known as the Key Employee Retention Program, or KERP, provides an annual restricted stock award equal to five percent of the participant’s annual gross salary for a period of up to ten years (see Note 10). Benefits under the KERP vest at age 56 and after ten years of continuous service with the Company. Tier two of the KESOP, known as the Supplemental Income Program, or SIP, is an unfunded plan that provides participants with retirement income for a specified period of between 5 and 15 years upon retirement, death, or disability. The plan fixes a minimum level for retirement benefits to be paid to participants based on the participants’ position at the Company and their age and service at retirement. Certain key employee agreements include an annual retainer for consulting services for a period of up to five years. Additionally, certain executive agreements have been amended to provide postretirement medical benefits, where the Company will pay and provide major medical and hospitalization insurance benefits to those employees and their spouses, at a level substantially similar to those medical and hospitalization insurance benefits paid and provided to senior executives currently employed by the Company. The insurance benefits will be provided without any further or additional services from the employee to the Company and these medical benefits will be paid for and provided for as long as the employee and spouse shall live.
On July 1, 2007, the Company adopted SFAS 158 which requires the recognition of a plan’s over or under status as an asset or liability with an offsetting adjustment to accumulated other comprehensive income, or AOCI. SFAS 158 requires the determination of the fair values of a plan’s assets at a company’s year-end and recognition of actuarial gains and losses, prior service costs or credits, and transition assets or obligations as a component of AOCI. These amounts were previously netted against the plans’ funded status in the Company’s consolidated balance sheet pursuant to the provisions of SFAS No. 87 or SFAS 87,“Employers’ Accounting for Pensions.” These amounts will be subsequently recognized as components of net periodic benefit costs. Further, actuarial gains and losses that arise in subsequent periods that are not initially recognized as a component of net periodic benefit cost will be recognized as a component of AOCI. Those amounts will subsequently be recognized as a component of net periodic benefit cost as they are amortized during future periods.
The impact of adopting the provisions of SFAS 158 on the Company’s consolidated balance sheet at September 30, 2007 is presented in the following table. The adoption of SFAS 158 had no effect on the Company’s consolidated statement of operations for the fiscal year ended September 30, 2008, or for any other years presented.
| | | | | | | | | |
| | | September 30, 2007 | |
| (Dollars in thousands) | | Before
Application of
Statement 158 | | | Adjustments | | | After
Application of
Statement 158 | |
Deferred tax asset | | 11,399 | | | 159 | | | 11,558 | |
Total assets | | 258,210 | | | 159 | | | 258,369 | |
Deferred compensation | | 12,971 | | | 393 | | | 13,364 | |
Total liabilities | | 179,880 | | | 393 | | | 180,273 | |
Accumulated OCI | | (1,479 | ) | | 233 | | | (1,246 | ) |
Total shareholders’ equity | | 78,329 | | | (233 | ) | | 78,096 | |
Total liabilities and shareholders’ equity | | 258,210 | | | 159 | | | 258,369 | |
90
The following are the weighted average discount rate assumptions used in the measurement of the projected benefit obligation, or PBO, and net periodic pension expense for the SIP:
| | | | | | | | | |
| | | Years Ended September 30, | |
| | | 2008 | | | 2007 | | | 2006 | |
Discount rate | | 7.70 | % | | 6.00 | % | | 5.75 | % |
The discount rate is used to calculate the PBO. The rate used reflects a rate of return on high-quality fixed income investments that matches the duration of expected benefit payments. The 2008 discount rate was calculated based on a yield curve constructed from a portfolio of high quality bonds for which timing and amount of cash flows approximate the estimated payouts of the plan. For 2008 and 2007, the Company used the Moody’s Aa Corporate Bond rate as of September 30th of each respective year as a benchmark for the discount rate used.
The Company uses a September 30 measurement date for its plans. The following table provides a summary of the Company’s net periodic costs related to its defined benefit retirement plan:
| | | | | | | | | | |
Years Ended September 30, | | 2008 | | | 2007 | | 2006 |
| (Dollars in thousands) | | | | | | | |
Service benefits earned during period | | $ | 462 | | | $ | 493 | | $ | 740 |
Interest cost on projected benefit obligation | | | 734 | | | | 779 | | | 691 |
Amortization: | | | | | | | | | | |
Prior service cost | | | (82 | ) | | | — | | | 325 |
Net loss from past experience | | | 205 | | | | 437 | | | 394 |
| | | | | | | | | | |
Net periodic pension cost | | $ | 1,319 | | | $ | 1,709 | | $ | 2,150 |
| | | | | | | | | | |
In 2008, 2007, and 2006, the Company recognized amortization associated with the net cumulative unrecognized losses of the pension plan. The loss is amortized over the average remaining service period for active plan participants and is subject to the applicable corridor that is based on 10% of the PBO.
Effective September 30, 2008, the Company transferred certain participants from the SIP to a new deferred compensation plan, the Key Employee Capital Accumulation Plan, or KECAP. The KECAP is a defined contribution plan which allows participants to make pre-tax contributions and allows the Company to make discretionary contributions to the plan. The employees that were transferred included all SIP participants which were current employees of Company. Those employees that were retired and receiving benefits will remain in the SIP. On September 30, 2008 the Company reduced the PBO by $8.4 million for those transferring employees out of the SIP liability and increased a defined contribution plan liability by $7.6 million to a defined contribution plan liability which is included in deferred compensation on the accompanying consolidated balance sheet at September 30, 2008. The transfer of the participants out of the SIP resulted in a settlement under SFAS No. 88 or SFAS 88,“Employers’ Accounting for Settlements and Curtailments of Defined Benefit Pension Plans and for Termination Benefits.”The settlement resulted in a recognition of $1.1 million of net actuarial loss which was previously recorded in accumulated other comprehensive income. The reduction in the deferred compensation liability for the unvested benefit obligation removed from the SIP but not transferred to the KECAP resulted in a credit to deferred compensation expense of approximately $808,000.
The PBO for post retirement medical benefits is $1.7 million as of September 30, 2008 and is included in deferred compensation in the accompanying consolidated balance sheet. The net periodic post retirement medical costs are approximately $97,000 for each of the fiscal years ended September 30, 2008, 2007 and 2006, respectively, and are included in general and administrative expenses in the accompanying consolidated statements of operations.
91
The reconciliations of the benefit obligations based on a September 30th measurement date are as follows:
| | | | | | | | |
| (Dollars in thousands) | | 2008 | | | 2007 | |
Change in benefit obligation: | | | | | | | | |
Projected benefit obligation at beginning of year | | $ | 12,682 | | | $ | 14,003 | |
Service cost earned during the year | | | 462 | | | | 493 | |
Interest cost on projected benefit obligation | | | 734 | | | | 779 | |
Plan amendments | | | (162 | ) | | | (413 | ) |
Gain from past experience | | | (673 | ) | | | (1,503 | ) |
Transfer balances to defined contribution plan | | | (8,362 | ) | | | | |
Benefits paid | | | (973 | ) | | | (677 | ) |
| | | | | | | | |
Projected benefit obligation at end of year | | $ | 3,708 | | | $ | 12,682 | |
| | | | | | | | |
| | |
Funded status | | $ | (3,708 | ) | | $ | (12,682 | ) |
| | | | | | | | |
Amounts recognized in the consolidated balance sheet consists of: | | | | | | | | |
Accrued benefit liability—current | | $ | (768 | ) | | $ | (895 | ) |
Accrued benefit liability—long term | | | (2,940 | ) | | | (11,787 | ) |
Accumulated other comprehensive income—net actuarial loss | | | — | | | | — | |
| | | | | | | | |
Net pension liability at the end of the year | | $ | (3,708 | ) | | $ | (12,682 | ) |
| | | | | | | | |
Amounts recognized in accumulated other comprehensive income: | | | | | | | | |
Net actuarial loss | | $ | 504 | | | | 2,520 | |
Prior service credit | | | (492 | ) | | | (413 | ) |
| | | | | | | | |
Net amount recognized | | $ | 12 | | | $ | 2,107 | |
| | | | | | | | |
The estimated net actuarial loss and prior service cot for the plan that will be amortized from accumulated other comprehensive income into net periodic benefit cost during the 2009 fiscal year are approximately $21,000 and $227,000.
The Company expects to fund benefits as paid. The following table summarizes the Company’s expected benefit payments to be paid for each of the following fiscal years:
| | | |
Year Ended September 30, | | Scheduled Benefit
Payments |
| (Dollars in thousands) | | |
2009 | | $ | 797 |
2010 | | | 797 |
2011 | | | 806 |
2012 | | | 661 |
2013 | | | 597 |
2014 through 2018 | | | 1,802 |
| 9. | Employee Benefit Plan and Special Programs |
The Company maintains The PBSJ Employee Profit Sharing and Stock Ownership Plan and Trust, which is a qualified contributory 401(k) plan, a profit-sharing plan and an unleveraged employee stock ownership plan, or ESOP, collectively the Plans. The Plans qualify as a deferred salary arrangement under Sections 401(a) and 401(k) of the Internal Revenue Code. Under the 401(k) plan, participating employees may elect to defer a portion of their pretax earnings, up to the maximum allowed by the Internal Revenue Service. The Company offers a discretionary matching contribution of up to 50% of the employees’ first 6% pre-tax contribution. Employees are eligible to participate in the 401(k) plan on the first date of hire. Participants in the 401(k) plan are at all times
92
100% vested in the employees’ contribution amounts. All matching contributions made by the Company generally vest ratably over five years of continued service. Under the profit-sharing plan, the Company may make a discretionary contribution to eligible employees, which is included in the participants’ retirement account, and is allocated using a ratio of the individual participant’s compensation for the year to the total compensation of all eligible participants for the year. All discretionary contributions may be made in the form of cash, stock or a combination of both.
The Company’s matching contributions to the 401(k) plan were $5.4 million, $4.5 million and $3.6 million for the years ended September 30, 2008, 2007, and 2006, respectively. The fiscal year 2008 401(k) matching contributions will be paid in fiscal year 2009. The fiscal year 2007 401(k) and fiscal year 2006 401(k) contributions were paid in stock. Additionally, the Company accrued $1.3 million at September 30, 2008 to be paid to the 401(k) plan to cure a failure a discrimination test. The Company’s matching contributions and additional accrual are included in general and administrative expenses in the accompanying consolidated statements of operations. The Company’s accrued matching contributions and additional accrual are included in accounts payable and accrued expenses in the accompanying consolidated balance sheets at September 30, 2008 and 2007.
The Company also maintains an additional incentive plan for select employees. On an annual basis, the Company makes a discretionary cash award to fund the Incentive Plan within the Company’s limits of profitability and operating guidelines. Participation in the Incentive Plan is re-confirmed on an annual basis for all participants. The related Incentive Plan expenses for the years ended September 30, 2008, 2007, and 2006 of $4.5 million, $8.6 million, and $10.4 million, respectively, were included in general and administrative expenses in the accompanying consolidated statements of operations.
Restricted stock awards are offered throughout the year and are intended to provide long-term incentives to key employees. Awards of restricted stock are subject to transfer restrictions and risk of forfeiture until they are earned. Shares of restricted stock become fully vested usually over a period of several years of continued employment and are subject to total forfeiture if the employee ceases to be employed prior to the restricted stock vesting date, except in certain limited circumstances described in the individual restricted stock award agreement. During the restriction period, holders have the rights of shareholders, including the right to vote, but cannot transfer ownership of their shares.
Restricted stock is recorded at fair value on the date of issuance. Pursuant to Company guidelines, the Company may not issue restricted stock, if after issuing the shares, the total number of restricted shares outstanding would exceed ten percent of the total shares outstanding. The Company satisfies the issuance of restricted stock with newly issued shares.
On January 19, 2008, at the Company’s annual meeting, the shareholders approved the 2008 Employee Restricted Stock Plan.
The Company maintains the following restricted stock plans:
Retention
This program awards restricted shares to key employees in middle management or higher positions for the purpose of providing long-term incentives. The awards are made on a case-by-case basis at the discretion of Senior Management. These awards are generally issued and become fully vested usually after five years of continuous service with the Company.
Acquisitions
When the Company acquires a firm, restricted stock is awarded to retain key employees who are generally not the principal owners of the acquired firm. Shares become fully vested usually after three to five years of continuous service with the Company.
93
KERP
The Key Employee Retention Program, or KERP, provides an annual restricted stock award equal to five percent of the participant’s annual gross salary for a period of up to ten years. Benefits vest at age 56 and after ten years of continuous service with the Company, or upon retirement, death or disability.
Other
The Company has one other plan under which no new grants have been awarded since fiscal year 1997. As of September 30, 2008, this plan had 68,220 shares outstanding with unrecognized compensation cost of $33,000 which will be recognized through 2017.
The following tables summarize information about restricted shares:
| | | | | | |
| | | Restricted
Stock Units | | | Weighted
Average
Grant-Date
Fair Value |
Unvested at September 30, 2007 | | 381,237 | | | $ | 14.82 |
Granted | | 57,363 | | | | 28.23 |
Vested | | (124,253 | ) | | | 10.30 |
Forfeited | | (47,076 | ) | | | 17.60 |
| | | | | | |
Unvested at September 30, 2008 | | 267,271 | | | $ | 19.52 |
| | | | | | |
| | | | | | | | | | |
September 30, 2008 | | Outstanding
Shares | | Weighted
Average
Grant Date
Fair Value | | Unrecognized
Compensation
Cost
(in thousands) | | Remaining
Weighted
Average
Period
(in years) |
Retention | | 123,902 | | $ | 25.24 | | $ | 1,913 | | 3.8 |
Acquisition | | 23,399 | | | 25.94 | | | 141 | | 1.3 |
KERP | | 51,750 | | | 24.43 | | | 968 | | 9.9 |
Other | | 68,220 | | | 3.22 | | | 33 | | 4.7 |
| | | | | | | | | | |
| | 267,271 | | $ | 19.52 | | $ | 3,055 | | 5.2 |
| | | | | | | | | | |
The weighted average grant-date fair values of shares granted during fiscal years 2008, 2007 and 2006 were $28.23, $24.34 and $28.00 respectively. The total fair value of shares vested, on the vesting dates, for fiscal years 2008, 2007 and 2006 were $3.7 million, $4.1 million and $1.5 million, respectively. The total amount of compensation expense recognized under these agreements during fiscal years 2008, 2007 and 2006 was $771,000, $911,000 and $790,000, respectively, and was included in general and administrative expenses in the accompanying consolidated statements of operations.
The income tax benefit related to compensation expense under these agreements was $221,000, $305,000 and $300,000 in fiscal years 2008, 2007 and 2006, respectively.
94
The following table lists long-term debt including the respective current portions.
| | | | | | |
| | | September 30, |
| (Dollars in thousands) | | 2008 | | 2007 |
Line of credit | | $ | 6,622 | | $ | — |
Mortgage note payable due in monthly installments starting on
April 16, 2001, with interest, collateralized by real property; unpaid principal due March 16, 2011. Interest at LIBOR plus the floating rate margin of not less than 65 basis points and not greater than 90 basis points (3.40% and 6.19% at September 30, 2008 and 2007, respectively) | | | 6,397 | | | 6,909 |
Capital lease obligations | | | 435 | | | 705 |
| | | | | | |
| | | 13,454 | | | 7,614 |
| | |
Less current portion of long-term debt | | | 7,134 | | | 512 |
Less current portion of capital lease obligations | | | 297 | | | 347 |
| | | | | | |
Long-term debt and capital lease obligations | | $ | 6,023 | | $ | 6,755 |
| | | | | | |
Scheduled maturities exclusive of capital leases and line of credit are as follows:
| | | |
Year Ending September 30, | | Scheduled Maturities |
| (Dollars in thousands) | | |
2009 | | $ | 512 |
2010 | | | 512 |
2011 | | | 5,373 |
| | | |
| | $ | 6,397 |
| | | |
In November 2007, the Company renegotiated its existing line of credit agreement with Bank of America, N.A., referred to as the Bank, to increase the line of credit from $58 million to $60 million and to extend the maturity date of June 30, 2008 to a new maturity date of October 2011. As part of the extension agreement, substantially all of the terms and conditions remained the same and the minimum levels of net worth requirements were eliminated from the agreement. The line of credit agreement provides for the issuance of letters of credit. The letters of credit reduce the maximum amount available for borrowing. As of September 30, 2008 and 2007, we had letters of credit totaling $4.7 million and $1.9 million, respectively, including a letter of credit of $3.5 million in 2008 relating to bond insurance for PBS&J Constructors, Inc and $582,000 to guarantee insurance payments in both 2008 and 2007, respectively. No amounts have been drawn on any of these letters of credit. As a result of the issuance of these letters of credit, the maximum amount available for borrowing under the line of credit was $48.7 million and $56.1 million as of September 30, 2008 and 2007, respectively. In September 2007, the Company used the proceeds from the sale-leaseback of the Doral property to repay all amounts outstanding under our line of credit as of September 30, 2007.
The interest rate (3.53% and 5.85% at September 30, 2008 and 2007, respectively) ranges from LIBOR plus 50 basis points (currently in use) or Prime minus 125 basis points if the Company’s funded debt coverage ratio is less than 2.5. The range increases to LIBOR plus 75 basis points or Prime minus 100 basis points if the Company’s funded debt coverage ratio is between 2.5 to 3.0. The line of credit contains clauses requiring the maintenance of various covenants and financial ratios including minimum levels of net worth, a minimum coverage ratio of certain fixed charges and a minimum leverage ratio of earnings before interest, taxes, depreciation and amortization to funded debt. The Company was in compliance with all financial covenants under the line of credit as of September 30, 2008. The line of credit is collateralized by substantially all of the Company’s assets.
95
On March 19, 2001, the Company entered into a mortgage note with an original principal amount of $9.0 million due in monthly installments starting on April 16, 2001, with interest. Interest on the mortgage is LIBOR plus the floating rate margin of not less than 65 basis points and not greater than 90 basis points. A balloon payment is due on the mortgage on March 16, 2011. The effective interest rate on the mortgage note was 3.40% and 6.19% at September 30, 2008 and 2007, respectively. Our adjustable rate mortgage calls for an interest rate based on the 30-day LIBOR plus a margin of .065%. The mortgage agreement contains clauses requiring the maintenance of various covenants and financial ratios. The Company was in compliance with all financial covenants and ratios as of September 30, 2008. The mortgage note is collateralized by the office building located in Maitland, Florida.
In October 2007, the Company negotiated a modification to the mortgage note thereby eliminating the minimum levels of net worth requirement from the mortgage note.
In October 2008, the Company refinanced the existing mortgage note with a new seven-year mortgage note in the amount of $13.6 million due in monthly installments, including interest, over a twenty year amortization period with a balloon payment due on November 1, 2015. The interest rate on the mortgage note is based on LIBOR plus 2.27% per annum. In order to minimize the adverse impact of floating interest rate risks, the Company also entered into an interest rate swap agreement, referred to as the swap. The swap effectively converts the floating interest rate on the mortgage note to a fixed rate of 6.2%. The new mortgage note includes the same financial covenants as the line of credit.
The Company’s capital leases consisted primarily of equipment. The interest rates used in computing the minimum lease payments range from 2.72% to 5.77%. The leases were capitalized using the lower of the present value of the minimum lease payments or the fair market value of the equipment at the inception of the lease.
| 12. | Other Long Term Liabilities |
Other long-term liabilities is comprised of the following:
| | | | | | |
| | | September 30, |
| (Dollars in thousands) | | 2008 | | 2007 |
Notes payable | | $ | 4,515 | | $ | 2,518 |
Reserve for uncertain tax positions (See note 7) | | | 17,648 | | | — |
Deferred gain, non-current portion (See note 4) | | | 10,651 | | | 11,982 |
Deferred rent, non-current portion | | | 4,184 | | | 2,157 |
Self insurance reserves, non-current portion | | | 3,230 | | | 4,715 |
Other | | | — | | | 33 |
| | | | | | |
Total other long-term liabilities | | | 40,229 | | | 21,405 |
| | | | | | |
96
| 13. | Commitments and Contingencies |
The Company is obligated under various non-cancelable leases for office facilities, furniture, and equipment. Certain leases contain renewal options, escalation clauses and payment of certain other operating expenses of the properties. In the normal course of business, leases that expire are expected to be renewed or replaced by leases for other properties. As of September 30, 2008, the future minimum annual lease commitments are as follows:
| | | | | | |
Years Ending September 30, | | Operating Leases | | Capital Leases |
| (Dollars in thousands) | | | | |
2009 | | $ | 23,999 | | $ | 376 |
2010 | | | 19,543 | | | 129 |
2011 | | | 16,055 | | | 32 |
2012 | | | 13,377 | | | — |
2013 | | | 7,953 | | | — |
Thereafter | | | 19,703 | | | — |
| | | | | | |
| | | 100,630 | | | 537 |
Less executory and other costs | | | 391 | | | 33 |
Less amount representing interest | | | — | | | 69 |
| | | | | | |
Future minimum lease payments | | $ | 100,239 | | $ | 435 |
| | | | | | |
Total rent expense included in general and administrative expenses was $21.8 million, $22.6 million, and $20.0 million for fiscal years ended 2008, 2007, and 2006, respectively.
As of September 30, 2008, there were various legal proceedings pending against the Company, where plaintiffs allege damages resulting from the Company’s engineering services. The plaintiffs’ allegations of liability in those cases seek recovery for damages caused by the Company based on various theories of negligence, contributory negligence or breach of contract. The Company accrues for contingencies when a loss is probable and the amounts can be reasonably estimated. As of September 30, 2008 and 2007, the Company had accruals of $6.5 million and $4.4 million, respectively, for all potential and existing claims, lawsuits and pending proceedings that, in management’s opinion, are probable and can be reasonably estimated. Management believes that the disposition of these matters will not have a material impact on the Company’s consolidated financial position, cash flows, liquidity or results of operations
In July 1998, we entered into an agreement with West Frisco Development Corporation, or WFDC, to provide various services, among which was a flood plain study to be used by WFDC, the City of Frisco and FEMA. In 2003, the City of Frisco retained the services of a third-party architecture and engineering firm in connection with the extension and widening of Teel Road which lies within the greater drainage basin included in the Company’s original flood plain study. This architecture and engineering firm’s assessment of the flood plain study determined that the Company used incorrect assumptions when calculating the size of the drainage culverts required for the increased development of the area’s transportation infrastructure. Based on this assessment, the Company has entered into negotiations with the City of Frisco to correct the drainage needs to support the Teel Road expansion project. As a result, the Company had recorded an estimated liability of $3.1 million to cover the costs associated with correcting the drainage needs of the Teel Road expansion project. Included in this estimate is the purchase of a parcel of land for $1.5 million, the remaining balance of $1.3 and $1.6 million is reflected in other liabilities in the accompanying consolidated balance sheets as of September 30, 2008 and 2007, respectively.
The Company expects to pay these liabilities over the next one to three years. Management believes that the disposition of these matters will not have a material impact on the Company’s consolidated financial position, cash flows, liquidity or results of operations.
97
In June 2007, the Company was served with a Summons and Complaint for a personal injury claim resulting from a bicycle accident on a bike path in Irvine, California, where the Company had performed services in relation to its design and construction. After several months of discovery responses, investigations and negotiations, the Company reached a final settlement through mediation for $3.2 million in November 2008, and is expected to be paid in December 2008. As a result, the Company recorded, at September 30, 2008, a liability of $3.2 million, which is included in accounts payable and accrued expenses in the accompanying consolidated financial statements and a receivable from the Company’s liability insurance carrier in the amount of $1.4 million, which is included in other current asset in the accompanying consolidated financial statements. The net effect of the liability and receivable of $1.8 million is included in general and administrative expenses in the accompanying consolidated statement of operations for the year ended September 30, 2008.
The Company maintains a full range of insurance coverage, including worker’s compensation, general and professional liability (including pollution liability) and property coverage. The Company’s insurance policies may offset the amount of loss exposure from legal actions.
In connection with investigation of the misappropriation described earlier, we determined that the misappropriation scheme led to the overstatement of overhead rates that we used to determine billings in connection with certain of our government contracts. As a result, some of our government clients were overcharged for our services. During the review of the overhead rate calculations, we identified certain instances of costs erroneously included in our overhead cost pool, which were unallowable under applicable regulations, and an error in our calculation of our overhead rate, which related to certain general and administrative costs. Additionally, we determined that the unallowable costs and general and administrative errors also led to the overstatement of overhead rates that we used in connection with certain government contracts.
The Audit Committee, at the direction of the Corporate Board of Directors, disclosed the overstatement of our overhead rate to our clients and other appropriate government agencies, including the Department of Justice, or DOJ. We have entered into settlement agreements with most of our clients and government agencies. We are in discussions with our remaining government clients to enter into settlement agreements in order to satisfy any refund obligations, which are in various stages of settlement. At September 30, 2008 the balance in accrued reimbursement liability is $2.2 million, this amount is expected to be settled in fiscal year 2009.
In the course of our investigation of the accounting irregularities and misappropriations, it was determined that there were possible violations relating to past political contributions by us and certain of our employees. The United States Attorney’s Office for the Southern District of Florida (Miami) and the Federal Bureau of Investigation have conducted an investigation relating to improper campaign contributions including improper use of political action committees. We produced documents and other information to the government and fully cooperated with the authorities. Criminal charges have been filed against two of the Company’s former chairmen. At the present time, we believe it unlikely that criminal charges will be filed against us in this matter, but the authorities are not precluded from bringing charges, and circumstances may change.
In October 2007, the Federal Election Commission advised us that it was commencing an investigation into alleged violations of the Federal Election Campaign Act of 1971, as amended, based on the improper campaign contributions including improper use of political action committees. We produced documents and other information to the Commission and fully cooperated with the authorities. We are currently unable to predict the outcome of this investigation.
98
| 14. | Supplemental Cash Flow Information |
| | | | | | | | | | | |
| | | Years Ended September 30, | |
| (Dollars in thousands) | | 2008 | | | 2007 | | 2006 | |
Supplemental disclosures of cash flow information: | | | | | | | | | | | |
Cash paid for interest | | $ | 1,019 | | | $ | 2,042 | | $ | 2,106 | |
| | | | | | | | | | | |
Cash paid for income taxes | | $ | 4,519 | | | $ | 3,241 | | $ | 6,582 | |
| | | | | | | | | | | |
Acquisitions: | | | | | | | | | | | |
Fair market value of assets acquired | | $ | 674 | | | $ | — | | $ | 4,731 | |
Goodwill and intangibles recorded | | | 2,169 | | | | — | | | 5,141 | |
Fair market value of liabilities assumed | | | (593 | ) | | | — | | | (3,851 | ) |
| | | | | | | | | | | |
Purchase Price | | | 2,250 | | | | — | | | 6,021 | |
Less: stock issued | | | (200 | ) | | | — | | | — | |
Less: escrow withheld | | | (50 | ) | | | 200 | | | (200 | ) |
Less: accrued additional purchase price | | | — | | | | — | | | (334 | ) |
Prior year purchase price adjustments | | | — | | | | — | | | 389 | |
Deposits paid | | | — | | | | — | | | — | |
| | | | | | | | | | | |
Cash paid | | $ | 2,000 | | | $ | 200 | | $ | 5,876 | |
| | | | | | | | | | | |
Non-cash investing and financing activities: | | | | | | | | | | | |
Prior year purchase price adjustments to goodwill | | $ | — | | | $ | — | | $ | 468 | |
Property and equipment financed under software agreement | | $ | — | | | $ | — | | $ | 731 | |
Property and equipment financed under capital leases | | $ | 946 | | | $ | 34 | | $ | 662 | |
Change in fair value of marketable securities available for sale | | $ | — | | | $ | — | | $ | 23 | |
Stock issued for 401(k) match | | $ | 5,093 | | | $ | 4,512 | | $ | — | |
Stock issued for acquisition | | $ | 200 | | | $ | — | | $ | — | |
Deferred gain on sale-leaseback of office building | | $ | — | | | $ | 13,380 | | $ | — | |
Stock window subscription receivable | | $ | 1,799 | | | $ | — | | $ | — | |
Payable to former shareholders for repurchase of stock | | $ | 7,522 | | | $ | 116 | | $ | 2,133 | |
Notes payable issued in exchange for shares | | $ | 2,000 | | | $ | 1,134 | | $ | 1,335 | |
Goodwill adjustment for Deferred Taxes of Acquisition | | $ | 303 | | | $ | — | | $ | — | |
Balance of Deferred Taxes for Acquisition | | $ | (271 | ) | | $ | — | | $ | — | |
Cancellation of Internal Market Stock | | $ | 76 | | | $ | — | | $ | — | |
Contingent Interest Accrual | | $ | 993 | | | $ | — | | $ | — | |
FIN 48 Research and Development Credit Reserve | | $ | (41 | ) | | $ | — | | $ | — | |
Adoption of FIN 48,Accounting for Uncertainty in Income Taxes | | $ | 2,743 | | | $ | — | | $ | — | |
Pension Adjustments | | $ | 835 | | | $ | — | | $ | — | |
In fiscal year 2008, we restructured our internal organization to better leverage our technical capabilities in servicing the needs of our clients which resulted in a change in the composition of our reportable segments. Under the new structure, we will continue to provide segment information on four reportable segments: Transportation Services, Construction Management, Civil Engineering, and Environmental Services. Subsets of the Construction Management segment have been realigned in the Civil Engineering and Transportation Services segments. Accordingly, we have reclassified segment information for prior periods presented, as applicable, to confirm to the current reportable segment structure. We continue to evaluate performance based on operating income (loss) of the respective operating segment. The discussion that follows is a summary analysis of the primary changes in operating results by reportable segment for the years ended September 30, 2008, 2007 and 2006.
99
Activities in the Transportation Services business segment generally involve planning, design, right of way acquisition, development and design of intelligent transportation services and program construction management services for multiple transportation modes, including interstate and primary highways, toll roads, arterials, bridges, transit systems, airports and port facilities. The Program Management group of our Transportation segment provides many of its governmental clients the necessary resources to manage large infrastructure programs from concept through construction. Services include planning, programming and contract support.
The Construction Management segment provides a wide range of services as an agent for the Company’s clients, including contract administration, inspection, field-testing, scheduling/estimating, instituting project controls and quality assessment. The Company provides scheduling, cost estimating and construction observation services for the project, or its services may be limited to providing construction consulting.
The Civil Engineering segment provides general civil engineering as well as specialized services to public and private clients. Included in these services are: site engineering and surveys, infrastructure engineering, master planning, disaster mitigation planning and response, asset assessment and management, emergency management and architectural and landscape design.
The Environmental Services business segment focuses on the delivery of planning, design and construction management services for private and public sector clients related to air quality management, flood insurance studies, energy planning, hazardous and solid waste management, ecological studies, wastewater treatment, water resources, environmental toxicology analysis, aquatic treatment systems, reclaimed water, and water supply and treatment.
In fiscal year 2008, we derived approximately 18% of our engineering fees from various districts and departments of the FDOT (approximately 15.2% of total engineering fees) and the Texas Department of Transportation, or TxDOT, (approximately 3% of total engineering fees) under numerous contracts. The majority of these revenues were earned by our Transportation Services segment.
Segment operating income includes corporate related costs which are not generally specific to the individual segments’ operations. Such costs primarily consist of indirect salaries and general and administrative costs. The amounts are allocated to the segments based on the individual segments’ proportionate share of indirect salaries and general and administrative costs compared to total Company indirect salaries and general and administrative costs, excluding any allocable costs.
100
Financial information relating to the Company’s operations by segment is as follows:
| | | | | | | | | | | | | | | |
| (Dollars in thousands) | | Transportation
Services | | Construction
Management | | Civil
Engineering | | Environmental
Services | | Total |
Year Ended September 30, 2008 | | | | | | | | | | | | | | | |
Engineering fees | | $ | 261,775 | | $ | 62,083 | | $ | 164,177 | | $ | 129,910 | | $ | 617,945 |
Net earned revenues | | | 183,853 | | | 50,149 | | | 134,149 | | | 100,098 | | | 468,249 |
Operating income | | | 13,970 | | | 4,617 | | | 245 | | | 2,495 | | | 21,327 |
Depreciation and amortization | | | 3,573 | | | 853 | | | 3,901 | | | 2,428 | | | 10,755 |
Purchases of property and equipment | | | 3,869 | | | 1,048 | | | 3,102 | | | 2,345 | | | 10,364 |
Total assets (as of September 30, 2008) | | | 113,818 | | | 26,992 | | | 71,383 | | | 56,484 | | | 268,677 |
| | | | | |
Year Ended September 30, 2007 | | | | | | | | | | | | | | | |
Engineering fees | | $ | 232,600 | | $ | 57,798 | | $ | 162,959 | | $ | 128,108 | | $ | 581,465 |
Net earned revenues | | | 173,674 | | | 47,531 | | | 134,268 | | | 102,452 | | | 457,925 |
Operating income | | | 11,543 | | | 3,226 | | | 4,534 | | | 9,662 | | | 28,965 |
Depreciation and amortization | | | 3,756 | | | 829 | | | 4,101 | | | 2,575 | | | 11,261 |
Purchases of property and equipment | | | 3,778 | | | 1,028 | | | 3,223 | | | 2,265 | | | 10,294 |
Total assets (as of September 30, 2007) | | | 103,354 | | | 25,682 | | | 72,409 | | | 56,924 | | | 258,369 |
| | | | | |
Year Ended September 30, 2006 | | | | | | | | | | | | | | | |
Engineering fees | | $ | 205,951 | | $ | 81,860 | | $ | 140,683 | | $ | 108,748 | | $ | 537,242 |
Net earned revenues | | | 158,283 | | | 66,361 | | | 120,447 | | | 86,516 | | | 431,607 |
Operating income | | | 7,255 | | | 2,367 | | | 621 | | | 212 | | | 10,455 |
Depreciation and amortization | | | 3,762 | | | 1,178 | | | 3,637 | | | 2,436 | | | 11,013 |
Purchases of property and equipment | | | 4,009 | | | 1,706 | | | 3,291 | | | 2,410 | | | 11,416 |
| 16. | Related Party Transactions |
We lease office space in a building which houses our Missoula, Montana operations from Cedar Enterprises, which is owned and controlled by Charlie K. Vandam. Mr. Vandam is a former owner of LWC and a Senior Group Manager of the Company. The lease was assumed in connection with our acquisition of LWC in February 2005. The lease has been extended to February 2008, and rental cost of the space is $9,900 per month.
We lease office space in a building which houses our Helena, Montana operations from Prickly Pear Enterprises, which is owned and controlled by Paul Callahan. Mr. Callahan is a former owner of LWC and a Vice-President and Principle Project Director of the Company. The month-to-month lease was assumed in connection with our acquisition of LWC in February 2005. The rental cost of the space is $1,800 per month.
In fiscal year 2008 and 2007, we purchased $881 and $2,318 of products and services from PSMJ Resources, Inc. Frank A. Stasiowski, PSMJ Resources Inc.’s President and Chief Executive Officer is a member of our Board of Directors and Audit Committee.
In fiscal year 2008 and 2007, Mr. Phillip Searcy received payments from the Company totaling approximately $128,000 and $124,000 in accordance with his Supplemental Income Plan which originated when Mr. Searcy was employed with the Company. Mr. Searcy ceased full-time employment with the Company in 1996 and joined our Board of Directors in July 2005.
At the annual meeting of the shareholders held on January 28, 2005, the shareholders approved a proposal to authorize the Company to execute an agreement with Richard Wickett, our former Chairman of the Board from 2002 to February 2005 and former Chief Financial Officer from 1993 to 2004, to allow him to retain his 138,607 shares of the Company’s stock, exclusive of his shares owned through the Company’s ESOP, upon retirement and offer for sale the shares, in blocks of 46,000, 46,000 and 46,607 shares in February 2005, 2006 and 2007, respectively, at a price determined at the valuation at the fiscal year end immediately preceding the redemption period.
101
Pursuant to the Company’s by-laws, the Company is permitted to repurchase stock by delivery of a promissory note to the employee. On February 23, 2006 the Company repurchased 46,000 shares and 3,400 shares, respectively, of the Company’s stock from Richard Wickett and Kathryn Wilson in the original principal amounts of $1.2 million and $92,000, respectively. The shares were repurchased for $27.00 per share which represents the September 30, 2004 share price, pending completion of the valuation of the Company’s stock as of September 30, 2005. At September 30, 2007, the Company had an accrual of $49,400 for the difference between the purchase price and the September 30, 2005 share value of $28.00. At September 30, 2007, the notes bear interest at the rate of 8.25% per annum and such rate is adjusted to the then current prime rate of Bank of America on December 31st of each year. Accrued interest and $1 of principal is due monthly on the notes with all remaining principal and accrued interest due and payable on the five year anniversary of the date of issuance.
On February 13, 2007, the Company repurchased an additional 46,607 shares of the Company’s stock from Richard Wickett in the original principal amount of $1.0 million. The additional shares were purchased for $22.40 per share which represents 80% of the September 30, 2005 share price, pending completion of the valuation of the Company’s stock as of September 30, 2006. At September 30, 2007, the Company had an accrual for the difference between the purchase price and the September 30, 2006 share value. At September 30, 2007, the notes bear interest at the rate of 8.25% per annum and such rate is adjusted to the then current prime rate of Bank of America on December 31st of each year. Accrued interest and $1 of principal is due monthly on the notes with all remaining principal and accrued interest due and payable on the five year anniversary of the date of issuance.
Both notes are subject to the Company’s right of set off, which permits the Company to set off all claims it may have against the payee against amounts due and owing under the notes. The balances of the notes and the accruals for the stock price differentials were $2.5 million at September 30, 2008 and 2007, respectively, and were included in other liabilities in the accompanying consolidated balance sheet.
During the third quarter of fiscal 2007, as permitted under certain conditions pursuant to the terms of the agreement, the Company discontinued payments, and the provision of other benefits, to Richard Wickett under his Supplemental Retirement Agreement, referred to as the Agreement. The agreement was determined to be forfeited by Richard Wickett due in part to his pleading guilty to a felony. As a result of the forfeiture, the Company’s projected benefit obligation, as defined under SFAS 158, was reduced by $1.2 million ($809,000 after taxes) at September 30, 2007. The reduction in the liability was recognized in other comprehensive income and will be recognized as a component of net periodic pension cost based on the amortization provisions of SFAS 87. Additional information concerning Retirement Plans is set forth in Note 8.
In November 2007, the Company reached a tentative agreement, which was finalized in November 2008, with a former senior executive of the Company to reduce the term of his Supplemental Retirement Agreement to five years. As a result of this agreement, the projected benefit obligation was reduced, as defined under SFAS 158, by approximately $415,000 ($280,000 after tax) at September 30, 2007. The reduction in the liability was recognized in other comprehensive income and will be recognized as a component of net periodic pension cost based on the amortization provisions of SFAS 87. Additional information concerning Retirement Plans is set forth in Note 8.
In July 2007, pursuant to the Company’s by-laws, the Company did not exercise its right of first refusal to redeem the shares offered for redemption by John Shearer, the Company’s former National Service Director and Senior Vice President. In accordance with the Company’s by-laws, the shares were next offered to our ESOP plan; the ESOP plan has agreed to redeem the shares over the course of five years. The ESOP agreed to redeem the shares in five annual installments of 54,567, 10,940, 33,261, 33,261 and 33,261 shares in the second quarter of each fiscal year beginning with fiscal year 2007 at a price per share established by future valuations of the Company’s shares.
In August 2008, Todd Kenner, a Director of the Company and the President of PBS&J Inc., submitted his written resignation. The Company and Todd Kenner entered into a Separation Agreement and Release, referred
102
to as the Separation Agreement, effective as of September 2, 2008. Under the terms of the Separation Agreement, the Company agreed to pay Mr. Kenner a cash severance benefit of $162,500 over a six month period, paid a lump sum benefit of $234,000 in exchange for termination of Mr. Kenner’s Supplemental Income benefits, and agreed to redeem Mr. Kenner’s 108,551 shares of common stock , including vested restricted stock, for $29.68 per share for a total $3.2 million. The Company paid Mr. Kenner a cash payment $1.2 million and delivered a promissory note in the amount of $2.0 million for the repurchase of the shares. The promissory note bears interest at the prime rate plus 1% (6.0% at September 30, 2008) and is adjusted on December 31st of each year and is included in other liabilities in the accompanying consolidated balance sheet at September 30, 2008. Payments on the promissory note are due quarterly beginning October 1, 2008 through September 1, 2011.
| 17. | Allowance for Doubtful Accounts |
The activity in the allowance for doubtful accounts was as follows:
| | | | | | | | | | | | |
| | | Years Ended September 30, | |
| (Dollars in thousands) | | 2008 | | | 2007 | | | 2006 | |
Balance at beginning of year | | $ | 1,785 | | | $ | 1,799 | | | $ | 1,182 | |
Additions charged to costs and expenses | | | 1,766 | | | | 177 | | | | 633 | |
Deductions | | | (1,601 | ) | | | (191 | ) | | | (16 | ) |
| | | | | | | | | | | | |
Balance at end of year | | $ | 1,950 | | | $ | 1,785 | | | $ | 1,799 | |
| | | | | | | | | | | | |
| 18. | Quarterly Financial Data (Unaudited) |
| | | | | | | | | | | | | | | | | | | | | | | | | |
| | | Fiscal 2008 | | Fiscal 2007 | |
(Dollars in thousands, except per share
amounts) | | Q4 | | Q3 | | Q2 | | Q1 | | Q4 | | Q3 | | Q2 | | Q1 | |
Operating Data: | | | | | | | | | | | | | | | | | | | | | | | | | |
Engineering fees | | $ | 162,254 | | $ | 155,482 | | $ | 155,832 | | $ | 144,377 | | $ | 154,431 | | $ | 150,150 | | $ | 147,170 | | $ | 129,714 | |
Net earned revenues | | | 123,610 | | | 114,933 | | | 118,341 | | | 111,365 | | | 119,759 | | | 117,949 | | | 119,078 | | | 101,139 | |
Operating income (loss) | | | 9,791 | | | 2,358 | | | 4,918 | | | 4,260 | | | 12,115 | | | 8,176 | | | 10,392 | | | (1,718 | ) |
Net income (loss) | | | 5,226 | | | 5,548 | | | 2,574 | | | 2,124 | | | 7,306 | | | 7,761 | | | 5,448 | | | (1,417 | ) |
Net income per common share | | | | | | | | | | | | | | | | | | | | | | | | | |
Basic | | $ | 0.91 | | $ | 0.92 | | $ | 0.42 | | $ | 0.34 | | $ | 1.14 | | $ | 1.25 | | $ | 0.88 | | $ | (0.23 | ) |
Diluted | | $ | 0.89 | | $ | 0.91 | | $ | 0.41 | | $ | 0.33 | | $ | 1.12 | | $ | 1.18 | | $ | 0.82 | | $ | (0.23 | ) |
Note: Quarterly and year-to-date computations of per share amounts are made independently; therefore, the sum of per share amounts for the quarters may not equal per share amounts for the year.
During the first quarter of fiscal year 2007, the Company experienced a decline in business activity, especially in the residential markets of California and the Southwest, which most affected the engineering components of our private sector land development services. Also contributing to the negative results were delays in starting projects and the temporary stoppage in bidding for new jobs with the TxDOT. Additionally, the operating results were negatively impacted by a decrease in chargeability across all segments caused by the slowdown in business activity.
103
| ITEM 9. | Changes in and Disagreements with Accountants on Accounting and Financial Disclosure |
Not applicable.
| ITEM 9A(T). | Controls and Procedures |
Attached as exhibits to this Form 10-K are certifications of our Chief Executive Officer and Chief Financial Officer, which are required in accordance with Rule 13a-14 of the Securities Exchange Act of 1934, as amended.
Evaluation of Disclosure Controls and Procedures
As of September 30, 2008, the end of the period covered by this report, an evaluation was performed under the supervision and with the participation of our management, including the Chief Executive Officer, or CEO, and the Chief Financial Officer, or CFO, of the Company’s disclosure controls and procedures, as such term is defined in Rules 13a-15(e) or 15d-15(e) promulgated under the Securities and Exchange Act of 1934, as amended, or the Exchange Act. Based on that evaluation, management, including the CEO and the CFO, concluded that, as of September 30, 2008, our disclosure controls and procedures were not effective because of the identification of a material weakness in our revenue recognition controls.
In light of this material weakness, the Company performed additional analyses and procedures in order to conclude that its consolidated financial statements for the year ended September 30, 2008 were presented in accordance with generally accepted accounting principles in the United States of America for such financial statements. As a result of these additional procedures, the Company believes that the consolidated financial statements, and other financial information, included in this Annual Report on Form 10-K fairly present in all material respects the financial condition, results of operations and cash flows as of, and for, the periods presented in this report.
Management’s Report on Internal Control over Financial Reporting
Our management is responsible for establishing and maintaining adequate internal control over financial reporting as defined in Rules 13a-15(f) and 15d-15(f) under the Exchange Act. This system of internal control was designed to provide reasonable assurance to our management and Board of Directors regarding the reliability of financial reporting and the preparation and fair presentation of consolidated financial statements for external purposes in accordance with generally accepted accounting principles.
All internal control systems, no matter how well designed, have inherent limitations. Our internal control over financial reporting includes those policies and procedures that: (i) pertain to the maintenance of records that, in reasonable detail, accurately and fairly reflect our transactions and dispositions of our assets; (ii) provide reasonable assurance that transactions are recorded as necessary to permit preparation of consolidated financial statements in accordance with generally accepted accounting principles, and that our receipts and expenditures are being made only in accordance with authorizations of our management and directors; and (iii) provide reasonable assurance regarding prevention or timely detection of unauthorized acquisition, use, or disposition of our assets that could have a material effect on the consolidated financial statements.
A material weakness is a deficiency, or combination of deficiencies, in internal control over financial reporting such that there is a reasonable possibility that a material misstatement of our annual or interim financial statements will not be prevented or detected on a timely basis. In our assessment of the effectiveness of internal control over financial reporting as of September 30, 2008, we found that there are deficiencies in our internal controls over the existence, completeness and accuracy relating to revenue recognition. A contributing factor is the ineffective operation of certain of our Information System controls over the revenue system which provided inaccurate data used in the performance of revenue recognition internal controls. Accordingly, management has determined that this control deficiency constitutes a material weakness.
104
This control deficiency did not result in any known financial statement misstatements. As a result of the material weakness described above, management has concluded that the Company did not maintain effective internal control over financial reporting as of September 30, 2008, based on the criteria set forth by the Committee of Sponsoring Organizations of the Treadway Commission (COSO) inInternal Control—Integrated Framework.
During the second quarter, the Company began implementation of an ERP system in order to, among other benefits, improve the Company’s internal controls over financial reporting. In connection with the implementation, the Company experienced an enhancement in its general computer controls relating to segregation of duties and system access privileges. Delays in the development and implementation of the projects module of the ERP system caused delays in the implementation of the internal controls as designed and required an abbreviated and accelerated training schedule for the individuals tasked with performing the controls.
Our management is working with the Audit Committee to identify and implement corrective actions to improve our internal controls over financial reporting, focused on internal controls surrounding revenue recognition. Specifically, our operations and project management personnel are developing and conducting extensive training programs for our project managers, division managers and contracts administration staff involved in the projects to cash cycle to ensure the accuracy of our financial reporting. Our Information Systems group is in the process of implementing additional change management processes to ensure data integrity and validation of operational reports used in the revenue recognition process. In addition, the Company will undertake reviewing and potentially reengineering the process and controls around the revenue recognition process and implementing additional policies and procedures as necessary. We believe these actions, when completely implemented, will remediate the material weakness described above. However, even after the complete implementation of these actions, a sufficient period of time will need to elapse in order to allow management sufficient time to adequately confirm, through testing, that its internal controls over financial reporting, as revised, are operating effectively.
This Annual Report on Form 10-K does not include an attestation report of the Company’s registered public accounting firm regarding internal control over financial reporting. Management’s report was not subject to attestation by the Company’s registered public accounting firm pursuant to temporary rules of the SEC that permit the Company to provide only management’s report in this Annual Report.
Changes in Internal Control over Financial Reporting
Other than the material weakness, and the related corrective actions commenced by the Company to remediate this material weakness, described above there has been no change in the Company’s internal control over financial reporting during the fourth quarter of fiscal 2008.
Inherent Limitations on Effectiveness of Controls
The Company’s management, including the CEO and CFO, does not expect that our disclosure controls or our internal control over financial reporting will prevent or detect all error and all fraud. A control system, no matter how well designed and operated, can provide only reasonable, not absolute, assurance that the control system’s objectives will be met. The design of a control system must reflect the fact that there are resource constraints, and the benefits of controls must be considered relative to their costs. Further, because of the inherent limitations in all control systems, no evaluation of controls can provide absolute assurance that misstatements due to error or fraud will not occur or that all control issues and instances of fraud, if any, within the Company have been detected. These inherent limitations include the realities that judgments in decision-making can be faulty and that breakdowns can occur because of simple error or mistake. Controls can also be circumvented by the individual acts of some persons, by collusion of two or more people, or by management override of the controls. The design of any system of controls is based in part on certain assumptions about the likelihood of future events, and there can be no assurance that any system’s design will succeed in achieving its stated goals
105
under all potential future conditions. Projections of any evaluation of a system’s control effectiveness into future periods are subject to risks. Over time, controls may become inadequate because of changes in conditions or deterioration in the degree of compliance with policies or procedures.
| ITEM 9B. | Other Information |
In October 2008, we refinanced the existing mortgage note with a new seven year mortgage note in the amount of $13.6 million due in monthly installments, including interest, over a twenty year amortization period with a balloon payment due on November 1, 2015. The interest rate on the mortgage note is based on LIBOR plus 2.27% per annum. In order to minimize the adverse impact of floating interest rate risks, we also entered into an interest rate swap agreement. The swap effectively converts the floating interest rate on the mortgage note to a fixed rate of 6.2%. The new mortgage note includes the same financial covenants as the line of credit.
On December 15, 2008, the Company entered into a Stock Purchase Agreement among Judy Mitchell, John R. Stewart and Eduardo Vargas (collectively, the “Sellers”), pursuant to which the Company agreed to purchase all of the issued and outstanding shares of capital stock of Peter R. Brown Construction, Inc. (“Peter Brown”), a Florida corporation, for an aggregate purchase price of $16.0 million, subject to adjustment as provided therein. The Purchase Price will consist of (i) $12.0 million in cash and (ii) $4.0 million of restricted shares of the Company’s Class A common stock, par value $0.00067 per share, to be issued pursuant to the Company’s 2008 Employee Restricted Stock Plan. The closing is expected to take place on or about December 31, 2008. The aggregate number of shares of restricted stock to be issued to the Sellers will be based on the per share price of the Company’s Class A Common Stock as of September 30, 2008.
106
PART III
| ITEM 10. | Directors, Executive Officers and Corporate Governance |
Incorporated herein by reference from the Company’s 2008 Proxy Statement
| ITEM 11. | Executive Compensation |
Incorporated herein by reference from the Company’s 2008 Proxy Statement.
| ITEM 12. | Security Ownership of Certain Beneficial Owners and Management and Related Stockholder Matters |
Incorporated herein by reference from the Company’s 2008 Proxy Statement and Part II - Item 5 — Market for Registrant’s Common Equity, Related Shareholder Matters and Issuer Purchases of Equity Securities.
| ITEM 13. | Certain Relationships and Related Transactions,and Director Independence |
Incorporated herein by reference from the Company’s 2008 Proxy Statement.
| ITEM 14. | Principal Accounting Fees and Services |
Incorporated herein by reference from the Company’s 2008 Proxy Statement.
107
PART IV
| ITEM 15. | Exhibits and Financial Statement Schedules |
The following is a list of financial information filed as a part of this Annual Report:
| | 1. | Consolidated Financial Statements—The following financial statements of The PBSJ Corporation and its subsidiaries are contained in Item 8 of this Form 10-K: |
| | a) | Report of Deloitte & Touche LLP, Independent Registered Public Accounting Firm. |
| | b) | Consolidated Balance Sheets at September 30, 2008 and 2007. |
| | c) | Consolidated Statements of Operations for each of the three years in the period ended September 30, 2008. |
| | d) | Consolidated Statements of Stockholders’ Equity and comprehensive income at September 30, 2008, 2007, and 2006. |
| | e) | Consolidated Statements of Cash Flows for each of the three years in the period ended September 30, 2008. |
| | f) | Notes to the Consolidated Financial Statements. |
| | 2. | Financial Statement Schedules—The financial statement schedule information is included as part of the Notes to Consolidated Financial Statements contained in Item 8 of this Form 10-K. |
| | 3. | A list of exhibits to this Annual Report is set forth in the Exhibit Index appearing elsewhere in this Annual Report and is incorporated herein by reference. |
108
SIGNATURES
Pursuant to the requirements of Section 13 or 15(d) of the Securities Exchange Act of 1934, the Registrant has duly caused this report to be signed on its behalf by the undersigned, thereunto duly authorized.
| | | | |
| | | | The PBSJ Corporation |
| | |
Date: December 18, 2008 | | | | /S/ DONALD J. VRANA |
| | | | Donald J. Vrana Senior Vice President, Treasurer and Chief Financial Officer |
Pursuant to the requirements of the Securities Exchange Act of 1934, this Annual Report has been signed below by the following persons on behalf of the registrant and in the capacities and on the dates indicated.
| | |
| |
Date: December 18, 2008 | | /S/ JOHN B. ZUMWALT III |
| | John B. Zumwalt III Chairman of the Board and Chief Executive Officer |
| |
Date: December 18, 2008 | | /S/ DONALD J. VRANA |
| | Donald J. Vrana Senior Vice President, Treasurer and Chief Financial Officer |
| |
Date: December 18, 2008 | | /S/ ROBERT J. PAULSEN |
| | Robert J. Paulsen Director, Executive Vice President, Secretary and Vice Chairman of the Board |
| |
Date: December 18, 2008 | | /S/ WAYNE J. OVERMAN |
| | Wayne J. Overman Director and Senior Vice President |
| |
Date: December 18, 2008 | | /S/ WILLIAM D. PRUITT |
| | William D. Pruitt Director |
| |
Date: December 18, 2008 | | /S/ PHILLIP E. SEARCY |
| | Phillip E. Searcy Director |
| |
Date: December 18, 2008 | | /S/ FRANK A. STASIOWSKI |
| | Frank A. Stasiowski Director |
109
Exhibit Index
| | |
Exhibit
Number | | Description |
3.1 | | Articles of Incorporation, as amended (previously filed as Exhibit 4.1 to the Registration Statement on Form S-8 (333-1488819) filed with the Commission on January 23, 2008 and incorporated by reference herein). |
| |
3.2 | | Amended and Restated Bylaws (previously filed as Exhibit 4.2 to the Registration Statement on Registration Statement on Form S-8 (333-1488819) filed with the Commission on January 23, 2008 and incorporated by reference herein). |
| |
4.1 | | Form of Specimen Stock Certificate (previously filed as Exhibit 4.1 to the Registration Statement on Form 10 filed with the Commission on June 27, 2000 and incorporated by reference herein). |
| |
10.1 | | Supplemental Income Plan effective as of January 12, 1988, as amended September 27, 1995 (previously filed as Exhibit 10.2 to the Registration Statement on Form 10 filed with the Commission on June 27, 2000 and incorporated by reference herein). |
| |
10.2 | | Future Advance, Note, and Mortgage Modification Agreement, dated October 28, 2008, between Suntrust Bank, a Georgia Corporation and Post, Buckley, Schuh & Jernigan, Inc., the Registrant’s subsidiary.(1) |
| |
10.3 | | Guaranty Agreement, dated October 28, 2008, between the registrant and Suntrust Bank, a Georgia Corporation.(1) |
| |
10.4 | | Consolidated Promisory Note, dated October 28, 2008, between Suntrust Bank, a Georgia Corporation and Post, Buckley, Schuh & Jernigan, Inc., the Registrant’s subsidiary.(1) |
| |
10.5 | | Future Advance Promisory Note, dated October 28, 2008, between Suntrust Bank, a Georgia Corporation and Post, Buckley, Schuh & Jernigan, Inc., the Registrant’s subsidiary.(1) |
| |
10.6* | | Consulting/Supplemental Retirement/Death Benefits Agreement, dated November 6, 1987, between the Registrant and H. Michael Dye, as amended on October 16, 1989, August 21, 1991, March 1, 1993, February 6, 1995, May 19, 1998, November 22, 1999 and January 2, 2002 (previously filed as Exhibit 10.3 to the Registration Statement on Form 10 filed with the Commission on June 27, 2000 and incorporated by reference herein). |
| |
10.7 | | ISDA Master Agreement, dated March 8, 2001, between Suntrust Bank and Post Buckley, Schuh & Jernigan, Inc., the Registrant’s subsidiary (previously filed as Exhibit 10.3 to the Quarterly Report on Form 10-Q for the period ended March 31, 2001 filed with the Commission on May 15, 2001 and incorporated by reference herein). |
| |
10.8* | | Supplemental Retirement/Death Benefits Agreement, dated December 17, 1987, between the Registrant and Robert J. Paulsen, as amended January 1, 2002 and January 1, 2004 (previously filed as Exhibit 10.4 to the Registration Statement on Form 10 filed with the Commission on June 27, 2000 and incorporated by reference herein). |
| |
10.9 | | Schedule to the ISDA Master Agreement, dated March 8, 2001, between Suntrust Bank and Post, Buckley, Schuh & Jernigan, Inc., the Registrant’s subsidiary (previously filed as Exhibit 10.4 to the Quarterly Report on Form 10-Q to the quarter ended March 31, 2001 and filed with the Commission on May 15, 2001 and incorporated by reference herein). |
| |
10.10 | | Supplemental Income Agreement, dated as of July 29, 1996, between the Registrant and Robert J. Paulsen (previously filed as Exhibit 10.5 to the Registration Statement on Form 10 filed with the Commission on June 26, 2000 and incorporated by reference herein). |
110
| | |
Exhibit
Number | | Description |
10.11* | | Employment/Retirement Benefits Agreement, dated February 15, 1999, between the Registrant and William W. Randolph (previously filed as Exhibit 10.6 to the Registration Statement on Form 10 filed with the Commission on June 27, 2000 and incorporated by reference herein). |
| |
10.12* | | Supplemental Retirement/Death Benefits Agreement, dated December 17, 1987, between the Registrant and Richard A. Wickett, as amended on April 27, 1989, May 19, 1998, November 22, 1999 and January 2, 2002 (previously filed as Exhibit 10.7 to the Registration Statement on Form 10 filed with the Commission on June 27, 2000 and incorporated by reference herein). |
| |
10.13* | | Supplemental Retirement/Death Benefits Agreement dated December 17,1987, between the Registrant and John B. Zumwalt, III, as amended on May 19, 1998, November 22, 1999, January 2, 2002 and January 1, 2004 (previously filed as Exhibit 10.8 to the Registration Statement on Form 10 filed with the Commission on June 27, 2000 and incorporated by reference herein). |
| |
10.14* | | Agreement, dated as of April 1, 1993, between the Registrant and John B. Zumwalt, III (previously filed as Exhibit 10.9 to the Registration Statement on Form 10 filed with the Commission on June 27, 2000 and incorporated by reference herein). |
| |
10.15* | | Split-Dollar Life Insurance Agreement, dated February 1, 1999, by and between The Randolph Insurance Trust and the Registrant (previously filed as Exhibit 10.10 to the Registration Statement on Form 10 filed with the Commission on June 27, 2000 and incorporated by reference herein). |
| |
10.16 | | Amended and Restated Credit Agreement, dated as of June 30, 2002, by and among Nationsbank, N.A., Suntrust Bank, Miami, N.A., Post, Buckley, Schuh and Jernigan, Inc., The PBSJ Corporation, and the subsidiaries named therein (previously filed as Exhibit 10.11 to the Quarterly Report on Form 10-Q filed with the Commission on August 14, 2002 and incorporated by reference herein). |
| |
10.17 | | Amendment No. 1, dated May 6, 2003, to Credit Agreement, dated as of June 28, 1996, by and among Nationsbank, N.A., Suntrust Bank, Miami, N.A., Post, Buckley, Schuh and Jernigan, Inc., The PBSJ Corporation, and the subsidiaries named therein (previously filed as Exhibit 10.11 to the Quarterly Report on Form 10-Q filed with the Commission on May 9, 2003 and incorporated by reference herein). |
| |
10.18 | | Lease Agreement, dated as of March 25, 1998, by and between Post, Buckley, Schuh & Jernigan, Inc. and Highwoods/Florida Holdings L.P. as successor in interest to Cypress-Tampa II L.P., as amended on May 26, 1998, December 26, 1998, November 29, 1999, March 1,2000 and June 13, 2003 (previously filed as Exhibit 10.12 to the Registration Statement on Form 10 filed with the Commission on June 27, 2000 and incorporated by reference herein; Seventh Amendment previously filed as Exhibit 10.12 to the Annual Report on the Form 10-K for the fiscal year ended September 30, 2003 filed with the Commission on December 19, 2003 and incorporated by reference herein). |
| |
10.19 | | Seventh Amendment, dated June 13, 2003, to Lease Agreement, dated as of March 25, 1998, by and between Post, Buckley, Schuh & Jernigan, Inc. and Highwoods/Florida Holdings L.P. as successor in interest to Cypress-Tampa II L.P. (previously filed as Exhibit 10.12 to the Annual Report on the Form 10-K for the fiscal year ended September 30, 2003 filed with the Commission on December 19, 2003 and incorporated by reference herein). |
| |
10.20* | | Employment Offer Letter dated October 7, 2005, between the Registrant and Donald J. Vrana (previously filed as Exhibit 10.1 to the Current Report on Form 8-K filed with the Commission on October 27, 2005 and incorporated by reference herein). |
| |
10.21 | | Lease Agreement, dated as of May 30, 2000, by and between Post, Buckley, Schuh & Jernigan, Inc. and RREEF American Reit Corp. G (previously filed as Exhibit 10.15 to the Annual Report on the Form 10-K filed with the Commission on December 19, 2003 and incorporated by reference herein). |
111
| | |
Exhibit
Number | | Description |
10.22 | | Amendment No. 2 to Amended and Restated Credit Agreement, dated June 27, 2005, by and among Bank of America, N.A., The PBSJ Corporation, and the subsidiaries named therein, as amended May 5, 2003 and June 30, 2002 (previously filed as Exhibit 10.1 to the Current Report on the Form 8-K filed with the Commission on July 8, 2005 and incorporated by reference herein). |
| |
10.23* | | Key Employee Supplemental Option Plan, effective as of July 23, 2002, as amended August 1, 2003 (previously filed as Exhibit 10.17 to the Annual Report on Form 10-K for the fiscal year ended September 30, 2005 filed with the Commission on January 29, 2007 and incorporated by reference herein). |
| |
10.24* | | Agreement, dated as of April 1, 1993, between the Registrant and John S. Shearer (previously filed as Exhibit 10.18 to the Annual Report on Form 10-K for the fiscal year ended September 30, 2005 filed with the Commission on January 29, 2007 and incorporated by reference herein). |
| |
10.25* | | Amendment to Supplemental Income Retirement Agreement, dated January 1, 2000, between the Registrant and Todd J. Kenner (previously filed as Exhibit 10.19 to the Annual Report on Form 10-K for the fiscal year ended September 30, 2005 filed with the Commission on January 29, 2007 and incorporated by reference herein). |
| |
10.26* | | Key Employee Supplemental Income Program Agreement, dated January 1, 2004, between the Registrant and Todd J. Kenner (previously filed as Exhibit 10.20 to the Annual Report on Form 10-K for the fiscal year ended September 30, 2005 filed with the Commission on January 29, 2007 and incorporated by reference herein). |
| |
10.27* | | Supplemental Retirement/Death Benefits Agreement, dated September 24, 1986, between the Registrant and Phillip E. Searcy, as amended on April 17, 1989, October 18, 1993, February 6, 1995 and May 8, 2000 (previously filed as Exhibit 10.21 to the Annual Report on Form 10-K for the fiscal year ended September 30, 2005 filed with the Commission on January 29, 2007). |
| |
10.28* | | Agreement, dated April 1, 2005, between the Registrant and Rosario Licata (previously filed as Exhibit 10.22 to the Annual Report on Form 10-K for the fiscal year ended September 30, 2005 filed with the Commission on January 29, 2007 and incorporated by reference herein). |
| |
10.29* | | Agreement, dated April 1, 2005, between the Registrant and Rosario Licata (previously filed as Exhibit 10.22 to the Annual Report on Form 10-K for the fiscal year ended September 30, 2005 filed with the Commission on January 29, 2007 and incorporated by reference herein). |
| |
10.30* | | Agreement, dated April 22, 2005, between the Registrant and William Scott DeLoach (previously filed as Exhibit 10.23 to the Annual Report on Form 10-K for the fiscal year ended September 30, 2005 filed with the Commission on January 29, 2007 and incorporated by reference herein). |
| |
10.31* | | Agreement, dated November 23, 2005, between the Registrant and Maria Marietta Garcia (previously filed as Exhibit 10.24 to the Annual Report on Form 10-K for the fiscal year ended September 30, 2005 filed with the Commission on January 29, 2007 and incorporated by reference herein). |
| |
10.32 | | Non-Negotiable Promissory Note, dated February 23, 2006, between the Registrant and Kathryn J. Wilson (previously filed as Exhibit 10.25 to the Annual Report on Form 10-K for the fiscal year ended September 30, 2005 filed with the Commission on January 29, 2007 and incorporated by reference herein). |
| |
10.33 | | Non-Negotiable Promissory Note, dated February 23,2006, between the Registrant and Richard A. Wickett (previously filed as Exhibit 10.26 to the Annual Report on Form 10-K for the fiscal year ended September 30, 2005 filed with the Commission on January 29, 2007 and incorporated by reference herein). |
112
| | |
Exhibit
Number | | Description |
10.34 | | Tolling Agreement, dated March 16, 2006, between the Registrant and Kathryn J. Wilson (previously filed as Exhibit 10.27 to the Annual Report on Form 10-K for the fiscal year ended September 30, 2005 filed with the Commission on January 29, 2007 and incorporated by reference herein). |
| |
10.35 | | Tolling Agreement, dated March 16, 2006, between the Registrant and Richard A. Wickett (previously filed as Exhibit 10.28 to the Annual Report on Form 10-K for the fiscal year ended September 30, 2005 filed with the Commission on January 29, 2007 and incorporated by reference herein). |
| |
10.36 | | Non-Negotiable Promissory Note, dated February 13, 2007, between the Registrant and Richard J. Wickett (previously filed as Exhibit 10.29 to the Annual Report on Form 10-K for the fiscal year ended September 30, 2006 filed with the Commission on May 29, 2007 and incorporated by reference herein). |
| |
10.37* | | The PBSJ Employee Profit Sharing and Stock Ownership Plan and Trust, amended and restated, dated January 1, 2007 (previously filed as Exhibit 10.30 to the Annual Report on Form 10-K for the fiscal year ended September 30, 2006 filed with the Commission on May 29, 2007 and incorporated by reference herein). |
| |
10.38* | | The First Amendment to the PBSJ Employee Profit Sharing and Stock Ownership Plan and Trust, amended and restated, dated January 1, 2007 (previously filed as Exhibit 10.31 to the Annual Report on Form 10-K for the fiscal year ended September 30, 2006 filed with the Commission on May 29, 2007 and incorporated by reference herein). |
| |
10.39 | | Amendment No. 4 to Amended and Restated Credit Agreement, dated November 14, 2007, by and among Bank of America, N.A., The PBSJ Corporation, and the subsidiaries named therein, as amended June 15, 2005, May 5, 2003, and June 30, 2002 (previously filed as Exhibit 10.1 to the Current Report on Form 8-K filed with the Commission on November 19, 2007 and incorporated by reference herein). |
| |
10.40 | | Third Amended and Restated Revolver Note, dated November 14, 2007, by Post, Buckley, Schuh & Jernigan, Inc. and The PBSJ Corporation in favor of Bank of America, N.A. (previously filed as Exhibit 10.1 to the Current Report on Form 8-K filed with the Commission on November 19, 2007 and incorporated by reference herein). |
| |
10.41 | | Agreement, dated as of August 31, 2007, between the Registrant and Greenebaum and Rose Associates, Inc. (previously filed as Exhibit 10.33 to the Annual Report on Form 10-K for the fiscal year ended September 30, 2007 filed with the Commission on December 18, 2007 and incorporated by reference herein). |
| |
10.42 | | The Amended and Restated The PBSJ Corporation 2008 Employee Stock Ownership and Direct Purchase Plan (previously filed as Exhibit 10.34 to the Registration Statement on Form S-8 (333-1488819) filed with the Commission on January 23, 2008 and incorporated by reference herein). |
| |
10.43 | | The PBSJ Corporation 2008 Employee Payroll Stock Purchase Plan (previously filed as Exhibit 10.35 to the Registration Statement on Form S-8 (333-1488819) filed with the Commission on January 23, 2008 and incorporated by reference herein). |
| |
10.44 | | Seperation Agreement and Release, dated September 2, 2008, between Registrant and Todd J. Kenner, P.E.(1) |
| |
10.45 | | Non-Negotiable Promissory Note, dated September 2, 2008, between the Registrant and Todd J. Kenner, P.E.(1) |
113
| | |
Exhibit
Number | | Description |
10.46 | | Stock Purchase Agreement, dated December 15, 2008, between the Registrant and Judy Mitchell, John R. Stewart and Eduardo Vargas (previously filed as Exhibit 10.1 to the Current Report on Form 8-K filed with the Commission on December 18, 2008 and incorporated by reference herein). |
| |
10.47* | | The PBSJ Corporation 2008 Employee Restricted Stock Plan (previously filed as Exhibit 10.26 to the Registration Statement on Form S-8 (333-1488819) filed with the Commission on January 23, 2008 and incorporated by reference herein). |
| |
10.48* | | Amendment to The PBSJ Corporation 2008 Employee Restricted Stock Plan (previously filed as Exhibit 10.2 to the Current Report on Form 8-K filed with the Commission on December 18, 2008 and incorporated by reference herein). |
| |
14.1 | | PBSJ Code of Conduct (previously filed as Exhibit 14.1 to the Annual Report on Form 10-K for the fiscal year ended September 30, 2006 filed with the Commission on May 29, 2007 and incorporated by reference herein). |
| |
21.1 | | Subsidiaries of the Registrant (previously filed as Exhibit 21.1 to the Annual Report on Form 10-K for the fiscal year ended September 30, 2006 filed with the Commission on May 29, 2007 and incorporated by reference herein). |
| |
23.1 | | Consent of Willamette Management Associates.(1) |
| |
23.2 | | Consent of Matheson Financial Advisors, Inc.(1) |
| |
31.1 | | Chief Executive Officer Certification Pursuant to 18 U.S.C. Section 1350, as adopted pursuant to Section 302 of the Sarbanes-Oxley Act of 2002.(1) |
| |
31.2 | | Chief Financial Officer Certification Pursuant to 18 U.S.C. Section 1350, as adopted pursuant to Section 302 of the Sarbanes-Oxley Act of 2002.(1) |
| |
32.1 | | Chief Executive Officer Certification and Chief Financial Officer Certification Pursuant to 18 U.S.C. Section 1350, as adopted pursuant to Section 906 of the Sarbanes-Oxley Act of 2002.(1) |
| * | Management contract or compensatory plan. |
114