
| EMBRAER RELEASES SECOND QUARTER 2008 RESULTS IN U.S. GAAP | |
 | The Company's operating and financial information is presented, except where otherwise stated, on a consolidated basis in United States dollars (US$) in accordance with US GAAP. The financial data presented in this document for the quarters ended June 30, 2007, March 31, 2008 and June 30, 2008, are derived from the unaudited financial statements. In order to better understand the Company’s operating performance, additional information is also presented at the end of this release, in accordance with accounting practices adopted in Brazil (“Brazilian GAAP”). São José dos Campos, July 31, 2008 – Embraer (BOVESPA: EMBR3; NYSE: ERJ), the world’s leading manufacturer of commercial jets with up to 120 seats, recorded second quarter 2008 (2Q08) net sales of US$ 1,635.0 million and net income of US$ 134.4 million, equivalent to diluted earnings per ADS of US$ 0.7427. Embraer added new customers to its firm order backlog in the second quarter of 2008 such as ETA Star Group, from Dubai and TRIP Linhas Aéreas, one more Brazilian airline that will fly Embraer jets. Embraer’s firm order backlog on June 30, 2008, reached a record high of US$ 20.7 billion, including sales to the Executive Aviation market, whose backlog is currently around US$ 6.0 billion. The EMBRAER 170/190 jet family backlog accumulated a total of 847 firm orders and 827 options. Embraer delivered 52 aircraft during 2Q08, an increase of 44.4% compared to 36 deliveries in the second quarter of 2007 (2Q07), closing out the semester with record 97 jets delivered. This result represents a 59% increase over the 61 airplanes delivered during the first semester of 2007. Embraer reaffirms its estimate of delivering 195 to 200 jets in 2008, tending toward the higher figure, as well as ten to 15 Phenom 100 jets. Net revenues for 2Q08 totaled US$ 1,635.0 million, a 47.3% increase over the US$ 1,110.0 million in net revenues for 2Q07, basically due to the increase in deliveries. The gross margin for 2Q08 totaled 21.9%, representing an increase over the 21.5% gross margin for 2Q07, despite the impact of the 16.4% decrease in the exchange rate (R$/US$) on the portion of the Company’s cost stated in reais. This increase in the gross margin is due to the higher number of deliveries in 2Q08, compared to 2Q07, and productivity gains achieved since the improvement of the Company’s industrial processes started in mid-2007. The increase in gross margin, from 20.4% for 1Q08 to 21.9% in 2Q08, is attributed to the same reasons as above and the reduction of overtime work on the production lines. Income from operations reached US$ 113.2 million in 2Q08, a significant increase over the US$ 31.2 million recorded for the same period last year. The operating margin was 6.9% in 2Q08, representing an increase over the 2.8% for 2Q07 and also an increase over the operating margin of 3.6% for 1Q08. The increased operating income resulted in growth in net income, which totaled US$ 134.4 million in 2Q08, compared to US$ 67.3 million in 2Q07. The net margin increased to 8.2% in 2Q08, compared to 6.1% in 2Q07. For the quarter ended June 30, 2008, the Company maintained its high level of liquidity, and its net cash position was US$ 524.2 million. |
 | Page 1 of 14 |
SECOND QUARTER 2008 IN PERSPECTIVE
EMBRAER ANNOUNCES EMBRAER MSJ & EMBRAER MLJ EXECUTIVE JETS
Embraer formally introduced its new Embraer midsize and Embraer midlight executive jet programs, which were recently approved by the Company’s Board of Directors. The Embraer midsize and Embraer midlight jets have been named the Legacy 500 and the Legacy 450, respectively, forming the Legacy family, along side the successful Legacy 600, already in operation. An estimated US$ 750 million will be invested in research and development for the new models, which will enter service in the second semester of 2012 and 2013, respectively.
EMBRAER ROLLS OUT THE PHENOM 300 EXECUTIVE JET
Embraer finished assembling the first Phenom 300 jet at its Gavião Peixoto plant in São Paulo, Brazil. The rollout preceded a series of ground tests to be conducted in preparation for the jet’s first flight. Two weeks after the event, the Embraer Phenom 300 successfully took to the air on its maiden flight, starting its flight test campaign. It is expected to enter service in the second semester of 2009.
EMBRAER PLANS TO EXPAND ITS OPERATIONS IN THE U.S.
Embraer announced that it plans to invest an estimated US$ 50 million for the establishment of a new facility in the United States dedicated to its executive jet business. The new 150,000-square-foot state-of-the-art facility will house a final assembly line, the first for Embraer in the U.S. It will be capable of producing both the Phenom 100 and Phenom 300 executive jet models, and will have a paint shop and a delivery and customer design center.
EMBRAER’S ERJ 145 FAMILY OBTAINS FINAL RUSSIAN CERTIFICATION
Embraer received final approval from Russia’s Interstate Aviation Committee (IAC) for the 37 to 50-seat ERJ 145 regional jet family, comprised of the 37-seat ERJ 135, the 44-seat ERJ 140, and the 50-seat ERJ 145. These regional jets now have the way open to operate in all of the CIS, which, besides Russia, includes Armenia, Azerbaijan, Belarus, Georgia, Kazakhstan, Kyrgyzstan, Moldova, Tajikistan, Ukraine, and Uzbekistan.
EMBRAER 190 AND EMBRAER 195 JETS RECEIVE CERTIFICATION IN CHINA
Embraer received certification from the Civil Aviation Administration of China (CAAC) for operating the EMBRAER 190 and EMBRAER 195 jets in mainland China.
EMBRAER SIGNS CONTRACT WITH BRAZIL’S TRIP LINHAS AÉREAS
Embraer signed a contract with TRIP Linhas Aéreas for the sale of five EMBRAER 175 jets. The deal also includes options for ten more, plus purchase rights for another 15.
EMBRAER PROVIDES EMBRAER 190 JETS TO BRAZILIAN GOVERNMENT
Embraer signed a contract for the sale of two EMBRAER 190 jets to the Brazilian Government for transporting official personnel. The aircraft will be configured specifically for this purpose and will be operated by the Special Transportation Group (Grupo de Transporte Especial – GTE) of the Brazilian Air Force (Força Aérea Brasileira – FAB), which serves the President of the Republic, Ministries, Presidential Departments, and officials from the Legislative and Judiciary Branches.
EMBRAER JOINS UNITED NATIONS GLOBAL COMPACT
Embraer has formally joined the Global Compact program developed by the United Nations (UN) for the purpose of mobilizing the international business community to adopt basic values for its business practices in the areas of human rights, labor relations, environmental protection, and anti-corruption.
| Page 2 of 14 |
INCOME STATEMENT HIGHLIGHTS
The following table presents certain items from Embraer’s unaudited consolidated statement of income for the three months ended June 30, 2007 and 2008 (2Q07 and 2Q08), and for the three months ended March 31, 2008 (1Q08).
Statement of Income | 1Q08 | 2Q07 | 2Q08 | |||||||
In US$ million, except % and earnings per ADS | (2) | (2) | (2) | |||||||
| Net Sales | 1,335.9 | 1,110.0 | 1,635.0 | |||||||
| Gross Profit | 272.0 | 238.7 | 358.1 | |||||||
Gross Margin | 20.4 | % | 21.5 | % | 21.9 | % | ||||
| Selling, general administrative, other expenses | (147.1 | ) | (149.0 | ) | (155.0 | ) | ||||
| Research and development | (76.1 | ) | (58.5 | ) | (89.8 | ) | ||||
| Income from operations | 48.7 | 31.2 | 113.2 | |||||||
| Operating margin | 3.6 | % | 2.8 | % | 6.9 | % | ||||
| Net financial income (expenses) | 20.1 | 45.7 | 64.5 | |||||||
| Foreign exchange (loss), net | (4.1 | ) | (10.6 | ) | (32.3 | ) | ||||
| Income before income taxes | 64.7 | 66.3 | 145.3 | |||||||
| Income tax benefit | 21.3 | (0.5 | ) | (9.0 | ) | |||||
| Minority interest and equity in earnings (losses) of affiliates | (1.0 | ) | 1.5 | (1.9 | ) | |||||
| Net income | 85.0 | 67.3 | 134.4 | |||||||
Net margin | 6.4 | % | 6.1 | % | 8.2 | % | ||||
| Earnings per ADS - basic | 0.4633 | 0.3639 | 0.7427 | |||||||
| Earnings per ADS - diluted | 0.4633 | 0.3628 | 0.7427 | |||||||
(2) Derived from unaudited quarterly financial information.
DELIVERIES, NET REVENUES, and GROSS MARGIN
A total of 52 jets were delivered during 2Q08, including 43 jets for the Commercial Aviation segment and nine Legacy 600 jets for the Executive Aviation segment. As a result of increased aircraft deliveries, net revenues reached US$ 1,635.0 million during 2Q08, representing a 47.3% increase over the same period in 2007.
The following table sets forth the Company’s deliveries per segment for the indicated periods.
Deliveries by Segment | 1Q08 | 2Q07 | 2Q08 | |||||||
Commercial Aviation | 38 | 27 | 43 | |||||||
| ERJ 145 | 3 | - | 2 | |||||||
| EMBRAER 170 | - | 3 | 1 | |||||||
| EMBRAER 175 | 15 | 8 | 14 | |||||||
| EMBRAER 190 | 17 | (1) | 14 | 21 | ||||||
| EMBRAER 195 | 3 | 2 | 5 | |||||||
Defense and Government | - | 2 | - | |||||||
| EMB 145 | - | 1 | - | |||||||
| Legacy 600 | - | 1 | ||||||||
Executive Aviation | 7 | 7 | 9 | |||||||
Legacy 600 | 7 | 7 | 9 | |||||||
Total | 45 | 36 | 52 | |||||||
| Deliveries identified by parenthesis were aircraft delivered under operating leases. | ||||||||||
| Page 3 of 14 |
In 2Q08, net revenues for the Commercial Aviation segment totaled US$ 1,131.6 million, representing 69.2% of total revenues for the period, compared to US$ 708.6 million and 63.8%, respectively, in 2Q07.
As a result of the higher number of Legacy 600 jets delivered, nine jets in 2Q08, compared to seven jets in 2Q07, net revenues for the Executive Aviation segment reached US$ 227.6 million in 2Q08, representing a 36.0% increase over the US$ 167.4 million in 2Q07.
Net revenues for the Defense and Government segment were stable, comparing revenues of US$ 104.1 million in 2Q08 to revenues US$ 100.6 million in 2Q07.
Net revenues for the Aviation Services segment increased by 38.2%, comparing US$ 153.8 million in revenues in 2Q08 to revenues of US$ 111.3 million in 2Q07.
Net sales | 1Q08 | 2Q07 | 2Q08 | ||||||||||||||||
by segment | (2) | (2) | (2) | ||||||||||||||||
| US$M | % | US$M | % | US$M | % | ||||||||||||||
| Commercial Aviation | 929.5 | 69.6 | 708.6 | 63.8 | 1,131.6 | 69.2 | |||||||||||||
| Defense and Government | 88.7 | 6.6 | 100.6 | 9.1 | 104.1 | 6.4 | |||||||||||||
| Executive Aviation | 173.6 | 13.0 | 167.4 | 15.1 | 227.6 | 13.9 | |||||||||||||
| Aviation Services | 126.4 | 9.5 | 111.3 | 10.0 | 153.8 | 9.4 | |||||||||||||
| Others | 17.7 | 1.3 | 22.1 | 2.0 | 17.9 | 1.1 | |||||||||||||
Total | 1,335.9 | 100.0 | 1,110.0 | 100.0 | 1,635.0 | 100.0 | |||||||||||||
(2) Derived from unaudited quarterly financial information.
The gross margin increased to 21.9% in 2Q08, compared to 21.5% for the same period in 2007, despite a 16.4% decrease in the exchange rate (R$/US$) impact on the portion of the Company’s cost of sales and services stated in reais. The increase in the gross margin is due to the higher number of deliveries in the quarter, the productivity gains achieved due to the implementation of the Lean manufacturing system in the production processes, and also the planned reduction of overtime.
OPERATING EXPENSES & INCOME FROM OPERATIONS
During 2Q08, operating expenses totaled US$ 244.9 million, increasing 18.0% compared to US$ 207.5 million in 2Q07, mainly due to increased number of deliveries, and the impact of the 16.4% decrease in the exchange rate (R$/US$) on the portion of the Company’s expenses stated in reais.
Sales expenses totaled US$ 106.2 million in 2Q08, compared to US$ 85.2 million in 2Q07, due to the increase in deliveries and consequently, variable sales expenses.
R&D expenses totaled US$ 89.8 million in 2Q08, compared to US$ 58.5 million in 2Q07. This increase is due to the development of the Phenom jets family, the certification of the Lineage 1000 jet, the 16.4% exchange rate decrease (R$/US$)and the development of new technologies and materials for future projects, focusing on increasing the competitiveness of the Company’s products.
General and administrative expenses increased 2.6% from US$ 57.6 million in 2Q07 to US$ 59.1 million in 2Q08. The 16.4% exchange rate decrease was partially offset by the P3E (Embraer Entrepreneurial Excellence) plan that focuses on optimizing resources and bringing cost savings.
Other operating expenses, changed from an expense of US$ 6.1 million in 2Q07 to an income of US$ 10.3 million in 2Q08, mainly due to royalties from spare parts delivered.
As a result of the foregoing, the Company’s operating income reached US$ 113.2 million in 2Q08 with an operating margin of 6.9%, compared to US$ 31.2 million and 2.8% in 2Q07, respectively.
| Page 4 of 14 |
NET INCOME
Net financial income totaled US$ 64.5 million in 2Q08, compared to net financial income of US$ 45.7 million for 2Q07. Foreign exchange gain/loss reflects exchange variations in monetary assets and liabilities stated in other currencies are translated into U.S. dollars at the end of each period. The Company recorded a foreign exchange expense of US$ 32.3 million in 2Q08, compared to an expense of US$ 10.7 million in 2Q07.
Net income in 2Q08 was US$ 134.4 million, representing an 8.2% net margin, compared to net income of US$ 67.3 million and a 6.1% net margin in 2Q07.
BALANCE SHEET HIGHLIGHTS
On June 30, 2008, Embraer’s cash and cash equivalents and temporary cash investments totaled US$ 2,162.9 million. On the same date, short and long-term loans (excluding non-recourse and recourse debt) totaled US$ 1,638.7 million. As a result, the Company had a net cash position (total loans minus cash and cash equivalents and temporary cash investments) of US$ 524.2 million at the end of 2Q08.
Balance Sheet Data | (2) | (2) | (2) | |||||||
(in US$ million) | 2Q07 | 1Q08 | 2Q08 | |||||||
| Cash and cash equivalents | 875.9 | 1,268.5 | 1,241.8 | |||||||
| Temporary cash investments | 1,003.7 | 978.1 | 921.1 | |||||||
| Trade accounts receivable | 328.4 | 370.5 | 401.1 | |||||||
| Customer and commercial financing | 561.1 | 408.2 | 416.5 | |||||||
| Inventories | 2,620.9 | 2,687.8 | 2,837.7 | |||||||
| Property, Plant and Equipment | 490.6 | 571.2 | 627.7 | |||||||
| Trade accounts payable | 1,098.0 | 1,111.1 | 1,145.7 | |||||||
| Loans | 1,751.5 | 1,596.7 | 1,638.7 | |||||||
| Shareholders' equity | 1,926.0 | 2,111.6 | 2,139.7 | |||||||
| Net cash (debt) * | 128.1 | 649.9 | 524.2 | |||||||
* Net cash = Cash and cash equivalents + Temporary cash investments - Loans
(2) Derived from unaudited quarterly financial information.
Cash and cash equivalents and temporary cash investments
Embraer’s cash and cash equivalents and temporary cash investments, on June 30, 2008, totaled US$ 2,162.9 million, compared to US$ 2,246.6 million, on March 31, 2008. From the total balance in cash and cash equivalents and temporary cash investments, on June 30, 2008, 53.8% is stated in U.S. dollars and the remaining 46.2% is comprised of investments primarily stated in reais. The investment strategy adopted by the Company is to maintain sufficient cash to minimize the currency and interest rate risks of its assets and liabilities. This strategy also takes into account expected future R&D and capital expenditures, most of which are stated in reais.
Trade accounts receivable and customer and commercial financing
Trade accounts receivable and customer commercial financing totaled US$ 817.6 million in 2Q08, representing a 5.0% increase compared to US$ 778.7 million in 1Q08, due to the normal course of the Company’s business.
Inventories
During 2Q08, inventories increased to US$ 2,837.7 million, compared to US$ 2,687.8 million in 1Q08. Higher inventory levels are part of Embraer’s plan to achieve committed deliveries of 195 to 200 aircraft in 2008.
| Page 5 of 14 |
Short-Term and Long-Term Loans
On June 30, 2008, Embraer’s total debt was US$ 1,638.7 million, compared to US$ 1,596.7 million on March 31, 2008. The average maturity of Embraer’s total debt was 3.6 years on June 30, 2008, below the average of 3.9 years, on March 31, 2008.
On the total debt, on June 30, 2008, 43.2% is stated in reais and indexed to the TJLP, at a weighted average interest rate of 8.29% per annuum. The remaining US$931.2 million are stated in other currencies, primarily U.S. dollars, with a weighted average interest rate of Libor + 1.06% per annuum.
Embraer’s total debt/LTM adjusted EBITDA ratio decreased from 3.41, on March 31, 2008, to 2.94x, on June 30, 2008. Embraer’s total debt/capitalization ratio remained stable at 0.43x, on June 30, 2008, and March 31, 2008. LTM Adjusted EBITDA was US$ 557.0 million in 2Q08.
Interest coverage as measured by LTM adjusted EBITDA/Interest paid (gross), increased from 3.97x, on March 31, 2008, to 4.57x, on June 30, 2008.
Certain Financial Ratios | 1Q08 | 2Q07 | 2Q08 | |||||||
| Total debt to Adjusted EBITDA (1) | 3.41 | 7.67 | 2.94 | |||||||
| Net debt to Adjusted EBITDA (2) | (1.39 | ) | (0.56 | ) | (0.94 | ) | ||||
| Total debt to capitalization (3) | 0.43 | 0.48 | 0.43 | |||||||
| Adjusted EBITDA to interest expense (gross) (4) | 3.97 | 2.46 | 4.57 | |||||||
| Adjusted EBITDA (5) | 468.2 | 228.5 | 557.0 | |||||||
(1) Total debt represents short and long-term loans and financing.
(2) Net debt represents cash and cash equivalents, plus temporary cash investments, minus short and long-term loans and financing.
(3) Total capitalization represents short and long-term loans and financing, plus shareholder equity.
(4) Interest expense (gross) includes only interest and commission on loans.
(5) The table at the end of this release sets forth the reconciliation of net income to Adjusted EBITDA, calculated on the basis of financial information prepared with U.S. GAAP data, for the indicated periods.
CAPITAL EXPENDITURES
The Company invested US$ 70.3 million to improve and modernize the Company’s industrial and engineering processes, and in property, plant, and equipment, during 2Q08, compared to US$ 73.7 million in 2Q07, mainly because of investments in the production line of the new family of business jets and investments on the after-sale support network for executive aviation.
ADDITIONAL INFORMATION UNDER BRAZILIAN GAAP
Embraer also reported its 2Q08 financial statements in accordance with the accounting practices adopted in Brazil (Brazilian GAAP), which, under Brazilian law, is the basis for calculating the distribution of dividends and interest on shareholder equity, income tax and social contributions. The following is a selection of consolidated income data in accordance with Brazilian GAAP and in reais (R$).
- Net sales during 2Q08 totaled R$ 2,695.3 million.
- Gross profit totaled R$ 398.9 million, with a gross margin of 14.8% in 2Q08.
- Income from operations for 2Q08 was R$ 91.6 million, with an operating margin of 3.4%.
- During 2Q08, income before taxes totaled R$ 256.4 million, representing 9.5% of net sales.
- Net income for 2Q08 was R$ 176.3 million, with a net margin of 6.5%.
| Page 6 of 14 |
BACKLOG & DELIVERY FORECAST
Embraer delivered 52 jets in 2Q08, representing an increase of 16 jets compared to 36 deliveries in 2Q07. Embraer reaffirms its forecast of delivering between 195 and 200 jets in 2008, tending toward the higher figure, for the Commercial Aviation, Executive Aviation and Defense and Government segments, plus 10 to 15 Phenom 100 jets.
On June 30, 2008, Embraer presented the following firm order backlog:
Aircraft Type | Firm Order | Options | Deliveries | Firm Order Backlog | |||||||||
| ERJ 135 | 108 | - | 108 | - | |||||||||
| ERJ 140 | 74 | - | 74 | - | |||||||||
| ERJ 145 | 733 | 75 | 692 | 41 | |||||||||
| EMBRAER 170 | 186 | 110 | 140 | 46 | |||||||||
| EMBRAER 175 | 134 | 173 | 88 | 46 | |||||||||
| EMBRAER 190 | 431 | 467 | 161 | 270 | |||||||||
| EMBRAER 195 | 96 | 77 | 21 | 75 | |||||||||
TOTAL | 1,762 | 902 | 1,284 | 478 | |||||||||
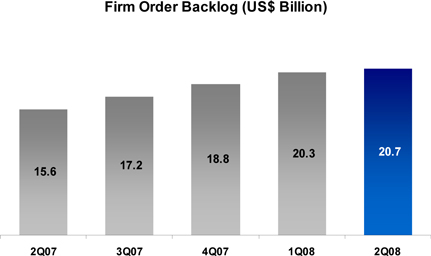
On June 30, 2008, Embraer’s firm order backlog, including the Commercial Aviation, the Executive Aviation and the Defense and Government segments, totaled a new record of US$ 20.7 billion. The following chart illustrates Embraer’s firm order backlog evolution.
INVESTOR RELATIONS
Embraer’s American Depositary Shares (ADS) traded on the New York Stock Exchange (NYSE) closed at US$ 26.50, on June 30, 2008, representing a decrease of 32.9% during the second quarter of 2008.
The Company’s common shares traded on the Bolsa de Valores de São Paulo (BOVESPA) closed at R$ 10.67, on June 30, 2008, representing a 38.9% decrease during the second quarter of 2008.
The average daily ADS trading volume during 2Q08 was US$ 33.8 million and 956,653 shares.
| Page 7 of 14 |
RECENT EVENTS
INDIAN GOVERNMENT ACQUIRED THREE EMBRAER EMB 145 AEW&C JETS
Embraer and the Indian Government signed a deal for three EMB 145 AEW&C (Airborne Early Warning & Control) jets. The contract includes a comprehensive logistics package comprised of training, technical support, spare parts, and ground support equipment.
EMBRAER SOLD FIVE EMBRAER 190 JETS TO CHINA’S KUN PENG AIRLINES
Embraer and Kun Peng Airlines Co., Ltd., one of the main operators in the Chinese regional aviation market, signed a contract for five firm orders for the EMBRAER 190 jet, marking an important expansion of Embraer’s presence in mainland China.
EMBRAER SIGNED A CONTRACT WITH NIKI AIRLINE FOR FIVE EMBRAER 190 JETS
Embraer and Austria’s NIKI Luftfarht GmbH signed a contract for five EMBRAER 190 jets. The agreement was announced at the 46th Farnborough Airshow, in England, and includes purchase rights for another five aircraft, which could be either the EMBRAER 190 or the EMBRAER 195.
EMBRAER SOLD LINEAGE 1000 JET TO THE AL HABTOOR GROUP
Embraer and Royal Jet, the latter representing the Al Habtoor Group conglomerate, from the United Arab Emirates (UAE), signed a contract to purchase one Lineage 1000 executive jet, which will be operated for private use.
EMBRAER TO CREATE TWO CENTERS OF EXCELLENCE IN PORTUGAL
In a ceremony held in Lisbon, Embraer announced plans for implementing two new industrial units dedicated to manufacturing complex airframe structures, one focused on metallic assemblies and the other on composites materials, both of which to be located in the city of Évora, Portugal.
CONFERENCE CALL INFORMATION
Embraer will host a conference call to present its 2Q08 Results in US GAAP on August 1, 2008, as described below:
(US GAAP) |
10:00 AM (NY) 11:00 AM (SP) |
Telephones: |
| +1 800 860 2442 (North America) |
| +1 412 858 4600 (International) |
| +55 11 4688 6301(Brazil) |
Code: Embraer |
Replay Number: |
| +55 11 4688 6312 |
Code: 798 |
The conference call will also be broadcasted live over the web at www.embraer.com
For additional information please contact:
Investor Relations
+55 12 3927-4404
investor.relations@embraer.com.br
| Page 8 of 14 |
ABOUT EMBRAER
Embraer (Empresa Brasileira de Aeronáutica S.A. - NYSE: ERJ; Bovespa: EMBR3) is the world’s largest manufacturer of commercial jets up to 120 seats, and one of Brazil's leading exporters. Embraer's headquarters are located in São José dos Campos, São Paulo, and it has offices, industrial operations and customer service facilities in Brazil, the United States, France, Portugal, China and Singapore. Founded in 1969, the Company designs, develops, manufactures and sells aircraft for the Commercial Aviation, Executive Aviation, and Defense and Government segments. The Company also provides after sales support and services to customers worldwide. On June 30, 2008, Embraer had a workforce of 23,855 employees and a firm order backlog of US$ 20.7 billion.
This document may contain forward-looking statements regarding circumstances or events yet to take place. Such statements are based largely on current expectations, forecasts of future events, assumptions and on financial tendencies that affect the Company’s businesses, and may prove not to be accurate and are not guarantees of performance. They are subject to risks, uncertainties and assumptions that are difficult to predict and that may include, among others: general economic, political and trade conditions in Brazil and in those markets where the Company does business; expectations on industry trends; the Company’s investment plans; its capacity to develop and deliver products on the dates previously agreed upon; and existing and future governmental regulations. The actual results can, therefore, differ substantially from those previously published as Company expectations. Further, in view of the inherent risks and uncertainties, the estimates, events and circumstances in such statements may not occur. The words “believe”, “may”, “is able”, “will be able”, “estimate”, “intend”, “continue”, “project”, “anticipate”, “expect” and other similar terms are supposed to identify such forward-looking statements. The Company is not obligated to publish updates nor to revise any such statements due to new information, future events or otherwise.
| Page 9 of 14 |
EMBRAER - EMPRESA BRASILEIRA DE AERONÁUTICA S.A.
CONDENSED CONSOLIDATED BALANCE SHEETS
(in thousands of U.S. dollars)
A S S E T S
As of March 31, | As of June 30, | ||||||
2008 | 2008 | ||||||
(2) | (2) | ||||||
| CURRENT ASSETS | |||||||
| Cash and cash equivalents | 1,268,493 | 1,241,813 | |||||
| Temporary cash investments | 978,126 | 921,087 | |||||
| Trade accounts receivable,net | 331,151 | 381,669 | |||||
| Collateralized accounts receivable | 12,646 | 11,241 | |||||
| Customer and commercial financing | 74,352 | 86,418 | |||||
| Inventories | 2,677,997 | 2,828,108 | |||||
| Deferred income taxes | 100,887 | 124,921 | |||||
| Other current assets | 259,877 | 312,882 | |||||
Total current assets | 5,703,529 | 5,908,139 | |||||
NONCURRENT ASSETS | |||||||
| Trade accounts receivable,net | 39,335 | 19,471 | |||||
| Collateralized accounts receivable | 467,269 | 465,606 | |||||
| Customer and commercial financing | 333,813 | 330,128 | |||||
| Inventories | 9,826 | 9,544 | |||||
| Property, plant and equipment, net | 571,163 | 627,692 | |||||
| Intangible Assets | 22,527 | 24,239 | |||||
| Investments | 64,597 | 65,825 | |||||
| Deferred income taxes | 200,855 | 178,172 | |||||
| Other noncurrent assets | 734,336 | 757,853 | |||||
Total noncurrent assets | 2,443,721 | 2,478,530 | |||||
TOTAL ASSETS | 8,147,250 | 8,386,669 | |||||
(2) Derived from unaudited quarterly financial information.
| Page 10 of 14 |
LIABILITIES AND SHAREHOLDERS' EQUITY
As of March 31, | As of June 30, | ||||||
2008 | 2008 | ||||||
(2) | (2) | ||||||
| CURRENT LIABILITIES | |||||||
| Loans and financing | 785,451 | 825,723 | |||||
| Capital lease obligation | 4,597 | 5,295 | |||||
| Non recourse and recourse debt | 115,314 | 115,199 | |||||
| Trade accounts payable | 1,110,982 | 1,145,656 | |||||
| Advances from customers | 904,008 | 913,611 | |||||
| Other payables and accrued liabilities | 378,326 | 360,455 | |||||
| Taxes and payroll charges payable | 95,352 | 92,922 | |||||
| Accrued taxes on income | 16,939 | 23,673 | |||||
| Deferred income taxes | 861 | 818 | |||||
| Contingencies | 11,573 | 13,714 | |||||
| Accrued dividends | 2,036 | 1,649 | |||||
| Unearned Income | 90,397 | 110,813 | |||||
Total current liabilities | 3,515,836 | 3,609,528 | |||||
LONG-TERM LIABILITIES | |||||||
| Loans and financing | 811,254 | 812,950 | |||||
| Capital lease obligation | 12,350 | 15,435 | |||||
| Non recourse and recourse debt | 374,560 | 363,265 | |||||
| Trade accounts payable | 79 | - | |||||
| Advances from customers | 402,442 | 469,977 | |||||
| Contribution from suppliers | 110,407 | 123,005 | |||||
| Taxes and payroll charges payable | 472,831 | 523,066 | |||||
| Other payables and accrued liabilities | 191,541 | 192,051 | |||||
| Deferred income taxes | 6,406 | 8,214 | |||||
| Contingencies | 50,685 | 54,741 | |||||
| Unearned Income | 14,609 | 3,304 | |||||
Total long-term liabilities | 2,447,164 | 2,566,008 | |||||
MINORITY INTEREST | 72,668 | 71,457 | |||||
SHAREHOLDERS' EQUITY | 2,111,582 | 2,139,676 | |||||
TOTAL LIABILITIES AND SHAREHOLDERS' EQUITY | 8,147,250 | 8,386,669 | |||||
(2) Derived from unaudited quarterly financial information.
| Page 11 of 14 |
EMBRAER - EMPRESA BRASILEIRA DE AERONÁUTICA S.A.
CONSOLIDATED STATEMENTS OF INCOME
In thousands of U.S.dollars except per share data
Three Months Ended | Six Months Ended | ||||||||||||
(2) | (2) | ||||||||||||
June 30, 2007 | June 30, 2008 | June 30, 2007 | June 30, 2008 | ||||||||||
Gross sales | |||||||||||||
| Domestic market | 28,471 | 57,794 | 56,302 | 99,508 | |||||||||
| Foreign market | 1,112,741 | 1,601,724 | 1,938,588 | 2,946,053 | |||||||||
| Sales deductions | (31,255 | ) | (24,544 | ) | (53,181 | ) | (74,674 | ) | |||||
Net sales | 1,109,957 | 1,634,974 | 1,941,709 | 2,970,887 | |||||||||
| Cost of sales and services | (871,237 | ) | (1,276,910 | ) | (1,516,015 | ) | (2,340,806 | ) | |||||
Gross profit | 238,720 | 358,064 | 425,694 | 630,081 | |||||||||
Operating expenses | |||||||||||||
| Selling expenses | (85,232 | ) | (106,193 | ) | (162,232 | ) | (199,491 | ) | |||||
| Research and development | (58,511 | ) | (89,841 | ) | (104,288 | ) | (165,984 | ) | |||||
| General and administrative | (57,646 | ) | (59,148 | ) | (103,543 | ) | (111,941 | ) | |||||
| Other operating expense, net | (6,138 | ) | 10,292 | (8,958 | ) | 9,236 | |||||||
Income from operations | 31,193 | 113,174 | 46,673 | 161,901 | |||||||||
| Interest(expense) income, net | 45,725 | 64,493 | 55,753 | 84,597 | |||||||||
| Foreign exchange gain (loss) ,net | (10,646 | ) | (32,327 | ) | (16,403 | ) | (36,470 | ) | |||||
Income before income taxes | 66,272 | 145,340 | 86,023 | 210,028 | |||||||||
| Income tax benefits | (481 | ) | (9,047 | ) | 4,686 | 12,211 | |||||||
Income before minority interest and results of affiliates | 65,791 | 136,293 | 90,709 | 222,239 | |||||||||
| Minority interest | 1,388 | (1,951 | ) | 2,631 | (3,097 | ) | |||||||
| Equity in earnings (losses) of affiliates | 142 | 30 | 177 | 186 | |||||||||
Net income | 67,321 | 134,372 | 93,517 | 219,328 | |||||||||
Earnings per share | |||||||||||||
| Basic | |||||||||||||
| Common | 0.0910 | 0.1857 | 0.1263 | 0.3011 | |||||||||
| Diluted | |||||||||||||
| Common | 0.0907 | - | 0.1260 | - | |||||||||
Weighted average shares (thousands of shares) | |||||||||||||
| Basic | |||||||||||||
| Common | 740,204 | 723,665 | 740,204 | 728,538 | |||||||||
| Diluted | |||||||||||||
| Common | 742,148 | 728,538 | 742,148 | 728,538 | |||||||||
Earnings per share - ADS basic (US$) | 0.3639 | 0.7427 | 0.5054 | 1.2042 | |||||||||
Earnings per share - ADS diluted (US$) | 0.3628 | 0.7427 | 0.5040 | 1.2042 | |||||||||
(2) Derived from unaudited quarterly financial information.
| Page 12 of 14 |
EMBRAER - EMPRESA BRASILEIRA DE AERONÁUTICA S.A.
CONSOLIDATED STATEMENTS OF CASH FLOWS
In thousands of U.S.dollars
Six months ended on June 30, | |||||||||||||
June 30, 2007 | June 30, 2008 | June 30, 2007 | June 30, 2008 | ||||||||||
(2) | (2) | (2) | (2) | ||||||||||
CASH FLOWS FROM OPERATING ACTIVITIES | |||||||||||||
| Net income | 67,321 | 134,372 | 93,517 | 219,328 | |||||||||
| Adjustments to reconcile net income to net cash provided by(used in) operating activities: | |||||||||||||
| Depreciation | 9,009 | 15,904 | 23,212 | 32,014 | |||||||||
| Allowance for doubtful accounts | 1,849 | 158 | 3,184 | 31 | |||||||||
| Allowance (reversal) for inventory obsolescence | (5,065 | ) | 5,481 | (8,170 | ) | (1,428 | ) | ||||||
| Loss on property, plant and equipment disposals | (185 | ) | (158 | ) | 203 | 371 | |||||||
| Accrued interest | 1,084 | 4,835 | 5,347 | 1,226 | |||||||||
| Minority interest | (1,388 | ) | 1,951 | (2,631 | ) | 3,097 | |||||||
| Foreign exchange loss, net | 10,646 | 32,327 | 16,403 | 36,470 | |||||||||
| Deferred income taxes | (4,920 | ) | 411 | (15,749 | ) | (36,636 | ) | ||||||
| Equity in earnings (losses) from affiliates | (142 | ) | (30 | ) | (177 | ) | (186 | ) | |||||
| Other | (6,932 | ) | (1,050 | ) | (7,118 | ) | (2,002 | ) | |||||
| Provision for losses,property plant and equipment | - | (365 | ) | - | (731 | ) | |||||||
Changes in assets and liabilities: | (558,443 | ) | (82,616 | ) | (690,656 | ) | 254,039 | ||||||
Net cash provided by(used in) operating activities | (487,166 | ) | 111,220 | (582,635 | ) | 505,593 | |||||||
CASH FLOW FROM INVESTING ACTIVITIES | |||||||||||||
| Proceeds from sale of property, plant and equipment | 158 | 1,467 | 1,358 | 1,617 | |||||||||
| Court-mandated escrow deposits, net of withdrawals | (12,847 | ) | (18,436 | ) | (20,353 | ) | (22,545 | ) | |||||
| Additions to property, plant and equipment | (73,725 | ) | (70,286 | ) | (118,558 | ) | (115,601 | ) | |||||
| Others | 748 | 36 | 158 | 680 | |||||||||
Net cash (used in) investing activities | (85,666 | ) | (87,219 | ) | (137,395 | ) | (135,849 | ) | |||||
CASH FLOW FROM FINANCING ACTIVITIES | |||||||||||||
| Proceeds from borrowings | 907,097 | 405,171 | 957,719 | 576,854 | |||||||||
| Repayment of borrowings | (392,445 | ) | (430,212 | ) | (586,205 | ) | (769,645 | ) | |||||
| Payments of capital lease obligations | (276 | ) | (2,311 | ) | (598 | ) | (2,879 | ) | |||||
| Proceeds from issuance of shares | 1,343 | - | 1,343 | - | |||||||||
| Dividends and/or Interest on capital paid | (25,687 | ) | (107,452 | ) | (59,367 | ) | (152,676 | ) | |||||
| Acquisition of own shares for treasury | - | 17 | - | (182,958 | ) | ||||||||
Net cash provided by (used in) financing activities | 490,032 | (134,787 | ) | 312,892 | (531,304 | ) | |||||||
Effect of exchange rate changes on cash and cash equivalents | 39,605 | 84,106 | 73,670 | 96,007 | |||||||||
Increase (decrease) in cash and cash equivalents | (43,195 | ) | (26,680 | ) | (333,468 | ) | (65,553 | ) | |||||
Cash and cash equivalents, at beginning of period | 919,122 | 1,268,493 | 1,209,396 | 1,307,366 | |||||||||
Cash and cash equivalents, at end of period | 875,927 | 1,241,813 | 875,928 | 1,241,813 | |||||||||
(2) Derived from unaudited quarterly financial information.
| Page 13 of 14 |
RECONCILIATION OF US GAAP AND “NON GAAP” INFORMATION
Adjusted EBITDA represents earnings before interest, taxation, depreciation and amortization. Adjusted EBITDA is not a financial measurement of the Company’s financial performance under U.S. GAAP. Adjusted EBITDA is presented because it is used internally as a measure to evaluate certain aspects of the business, including financial operations. We also believe that some investors find it to be a useful tool for measuring a company’s financial performance. Adjusted EBITDA should not be considered as an alternative to, in isolation from, or a substitution for analysis of the Company’s financial condition or results of operations, as reported under U.S. GAAP. Other companies in the industry may calculate Adjusted EBITDA differently than Embraer has for the purposes of its earnings releases, limiting Adjusted EBITDA’s usefulness as a comparative measure.
Adjusted EBITDA Reconciliation | 1Q08 | 2Q07 | 2Q08 | |||||||
LTM | (2) | (2) | (2) | |||||||
| Net income | 548.1 | 279.3 | 615.1 | |||||||
| Minority interest | 10.1 | 3.7 | 13.6 | |||||||
| Income tax benefit (expense) | (13.3 | ) | 6.0 | (4.8 | ) | |||||
| Interest income (expense), net | (173.5 | ) | (123.8 | ) | (192.2 | ) | ||||
| Foreign Exchange gain (loss), net | 36.1 | 17.6 | 57.7 | |||||||
| Depreciation and amortization | 60.7 | 45.7 | 67.6 | |||||||
Adjusted EBITDA | 468.2 | 228.5 | 557.0 | |||||||
(2) Derived from unaudited quarterly financial information.
LTM : Last Twelve Months
| Page 14 of 14 |