Management Discussion
Baillie Gifford International Equity Fund
1) Market Conditions and Review of performance during 2010
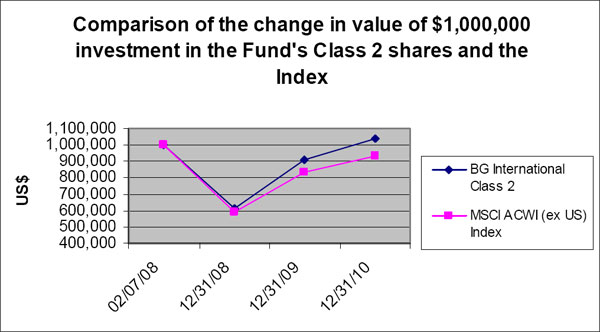
During 2010, The International Equity Fund Class 2 returned 14.65%, ahead of its benchmark, the MSCI ACWI ex US index which rose 11.60%. Corporate profitability strengthened over the year as cost cutting initiatives begun during the credit crisis combined with increasing demand from the less indebted regions. In aggregate, balance sheets remain strong, and plenty of cash remains either to be invested, or distributed to shareholders. In the emerging markets, continuing strong growth, inflows from abroad, and fears of inflation led to further tightening of policy. On the other hand, and in the clearest possible sign of the wide policy divergence which is opening up, the Federal Reserve did just the opposite, announcing a further $600 billion of quantitative easing. Throughout 2010, commentary on Europe was almost universally bleak. For Greece and Ireland, it was the year when the gap between their past spending and the cost of funding became unbridgeable without outside help, leaving them with no choice but to agree to bailouts, and the market remains nervous about the ‘European periphery’.
Stock selection was the main driver of the Fund’s relative performance during 2010. The top stock contributors came from a range of countries and sectors. They include Atlas Copco (Swedish engineer), Baidu (Chinese search engine), Massmart (South African retailer), Antofogasta (UK listed miner with assets in Chile), Seadrill (Norwegian deepwater driller) and Hong Kong Exchanges & Clearing. The main detractor from the year’s relative performance was the Brazilian oil company, Petrobras. Some of the weakness in its share price can be attributed to the size of the company’s capital-raising over the summer, although the shares also suffered earlier in the year from the general concerns over deep water drilling, following the BP disaster in the Gulf of Mexico. We believe these are short term distractions from the long term growth potential of a business with access to significant future reserves on reasonable terms. Alstom (French manufacturer of power generation equipment) also detracted from relative performance, and we have sold this company as we believe it now faces increasing competition in its growing emerging markets.
As bottom-up stock pickers, any changes to regional, country or sector weightings are as a result of individual stock decisions. Over 2010, we sold America Movil (Latin American mobile franchise which we believe is maturing), Industrial and Commercial bank of China (on concerns over asset quality) and Shinsegae (Korean retailer which we believe now has limited growth prospects). Towards the end of the year, we sold Garanti Bankasi (Turkish Bank) as we fear the Central Bank risks stoking excessive growth and inflation by relaxing monetary policy. We reduced BHP Billiton on capital allocation concerns, however as we believe the outlook for diversified miners remains robust we invested the proceeds in Rio Tinto, which has similar assets and traded on a similar valuation. In Europe, we purchased Ryanair (Irish listed short haul airline) where its competition advantage is strengthening as flag carriers retreat, and Inditex, the Spanish fashion retailer, which has an exciting global growth opportunity. Within the oil and gas sector, we purchased a new holding in Tullow Oil (UK listed oil and gas company with interests in Uganda and Ghana) and Inpex (Japanese oil and gas company). The latter was funded by the sale of Woodside Petroleum (Australian oil company) on valuation grounds.
2) Review of performance during the fourth quarter of 2010
The International Equity Fund Class 2 returned 7.79% over the final quarter of 2010, ahead of the benchmark which rose 7.3%. In the portfolio, the main contributors to performance were Atlas Copco (Swedish manufacturer of compressor and mining equipment) and Antofagasta (UK-listed copper miner), followed by TSMC (Taiwanese semiconductor
Page 1
Management Discussion
Baillie Gifford International Equity Fund
manufacturer) and Naspers (South African media group). The detractors from performance were companies which have had a strong run and where some profit taking was probably at play. OGX, the Brazilian oil company, underperformed in a quarter that saw a degree of unease about the direction of policy in Brazil following the presidential election. Baidu, widely referred to as the Chinese Google, gave up some of the huge gains it made throughout 2010 and Garanti Bankasi, the Turkish bank, also underperformed as the Central Bank took the unusual step of cutting rates, despite recent strong growth.
3) Investment Strategies used to manage the Fund
Baillie Gifford is a growth manager with a bottom up approach to stock picking. We aim to invest in companies that will generate sustainable earnings growth above that of the market over the long term. In determining the potential of a company, we analyse industry background, competitive advantage, management attitudes and financial strength, and finally we consider valuation. We meet the management of the companies within our investment universe and revisit the investment case for the portfolio’s holdings on a regular basis to ensure that our expectations are being met.
The ACWI Alpha Portfolio Construction Group is responsible for the overall strategy and stock selection process. They meet regularly to discuss both buy and sell ideas and the level of conviction for existing holdings. We will continue to monitor the long term prospects for the Fund’s holdings and make changes where appropriate.
4) Outlook
We have had a bias towards optimism for some time. We still do. There are three reasons behind it:
| |
• | Our confidence about global growth, which is being powered by the developing world. This is not a cyclical phenomenon; it will continue for years to come. |
• | The overhang of debt in the developed world means that monetary policy will remain loose for a long time. This is a good thing for businesses and real assets such as shares. |
• | Most investors refuse to recognise how favourable the investment background has become. The formation of any sort of optimistic consensus is continually being disrupted by ‘crises’ such as the Irish one. This is restraining valuations and provides a favourable background to financial investment. All the best times to invest have been suffused with gloom. |
Underlying all this is a healthy supply of good companies in which to invest, with new markets and new technologies becoming available. What could go wrong? Plenty, of course, but what are the most likely pitfalls? The first leg of our argument, the fundamental one, is the strongest one. Global growth does now look strong and sustainable. So what could go wrong with the other two legs? Easy money could lead to inflation. Indeed, inflation is a traditional escape route from debt. There is some evidence of it in the commodity markets. The prices of a wide range of raw materials and foodstuffs from copper and lumber to sugar, corn and oats have been very strong in recent months. This has contributed to price rises generally in most places, depending on how inflation is measured: food prices are more influential in China than in the US, for example; but there is no sign of inflation becoming entrenched. Consumers do not expect it; wages do not reflect it, and credit growth is still anaemic (except in China, where strenuous efforts are being made to slow it down). On balance, it looks as though deflationary forces have peaked, and that the pricing power of
Page 2
Management Discussion
Baillie Gifford International Equity Fund
commodity producers is increasing, but prices generally are not rising very much. Interest rates will probably stay low over the immediate future in the developed world and continue to rise in the emerging markets. The relative performance of developed stock markets may improve in the short term, as a result, but in the longer run the money will go to where the growth is. It is hard to dispute the claim that for the indebted developed countries the end game will involve higher inflation eventually – history, as chronicled by Rogoff and others, is fairly clear on this point – but we are not there yet. In the meantime, we are encouraged by the strong progress of most of the companies in The International Equity Fund.
| | | | | | | | |
| | | | | | | | |
Performance for the period ended 12/31/10 (Average Annual Total Return) |
| | | | | | | | |
| | One Year | | Since Inception
(February 7, 2008) | | |
| | | | | | | | |
|
The International Equity Fund | | | | | | | | |
Class 2 | | 14.65% | | | 1.42 | % | |
| | | | | | | |
MSCI ACWI (ex US) Index | | 11.60% | | | -2.35 | % | |
| | | | | | | |
Past performance is not a guarantee of future results. Returns for the International Equity Fund are before taxes and are net of all expenses, advisory fees and commission charges and include the reinvestment of the Fund’s dividends and distributions.
The MSCI ACWI (ex US) Index is a market capitalization index designed to measure equity performance in global world markets. The index is unmanaged, is not available for investment, and does not reflect sales charges, fees, commissions, taxes or other expenses of investing. The Fund’s holdings may differ from the index.
Page 3
Management Discussion
Baillie Gifford EAFE Fund
|
1) Market Conditions and Review of performance during 2010 |
|
We find it hard to recall a year in which the daily preoccupations of the market have seemed quite so divorced from either investment outcomes or global economic development. Some dissonance is usual but seldom has market and media commentary appeared so consistently out of context with unfolding events. Some countries are not in good shape: the indebted developed world has required significant debt restructuring, the implementation of strict austerity measures and a 750 billion euro bail out fund was created. However, a recovery has in fact been underway in the less indebted Northern ‘industrial’ European countries that are benefiting from the loose monetary policy required by their neighbours. In particular Germany, the industrial backbone of Europe, enjoyed its strongest growth rates since reunification and its future growth prospects are underpinned by export competitiveness, wage growth and consumer confidence. |
|
Corporate profitability strengthened over the year as cost cutting initiatives begun during the crisis combined with increasing demand of the less indebted regions. In aggregate balance sheets remain extremely strong and an unprecedented amount of cash remains to be either invested or distributed to shareholders. |
|
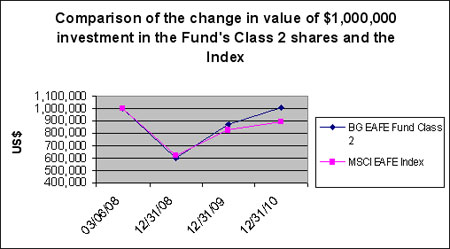
For the year ended December 31, 2010, The EAFE Fund Class 2 generated a return of 16.60%, outperforming its benchmark, the MSCI EAFE Index, which returned 8.21% for the year. The portfolio’s optimistic positioning was beneficial over the course of 2010, with both developed and emerging market holdings contributing to positive absolute and relative performance. |
|
Swedish industrial equipment companies, Atlas Copco and Sandvik, were amongst the largest contributors to performance for 2010. Similarly, Australian holdings responsible for providing the raw materials for this spate of building benefited the fund, including mining behemoth BHP and Fortescue Metals. Consumers in booming countries such as China and Singapore have been spending their wealth. European luxury goods companies have been prime beneficiaries, with France’s PPR (Gucci brand) and the Swiss Richemont (Cartier) both performing well through the year. |
|
However, it has been an uncomfortable year for European banks. The Fund’s holding in Spain’s Banco Santander has been impacted by negative sentiment. Petrobras was also a detractor from the year’s performance. Some of the weakness in its share price can be attributed to market unease at the size of the company’s capital raising over the summer, although the shares also suffered earlier in the year from concerns over deep water drilling. We believe these are short term distractions from the long term growth potential of a business with access to large future reserves on reasonable terms. |
|
2) Review of performance during the fourth quarter of 2010 |
|
The fund slightly underperformed a buoyant market during the quarter. Positive contributions to returns came from substantial holdings in industrial cyclical companies such as Atlas Copco, SMC and Fortescue Metals. The resurgence in global growth following the financial crisis has been positive to these companies over the past quarter and over the longer term. Markets have reacted strongly to the struggling economic condition of some European countries. In particular, this has negatively impacted European financial stocks and fund holdings were not immune. Banks such as Banco Santander and Standard Chartered detracted from returns. The Turkish bank Garanti Bankasi also suffered over the quarter as the market worried about the potential overheating of the Turkish economy and the government’s unorthodox policy response. We remain positive on the long term prospect of these banks due to their sensible attitude to capital allocation and their exposure to developing markets. |
Page 4
Management Discussion
Baillie Gifford EAFE Fund
|
3) Investment Strategies used to manage the Fund |
|
Baillie Gifford is a growth manager with a bottom up approach to stock picking. We aim to invest in companies that will generate sustainable earnings growth above the market over the long term. In determining the potential of a company, we analyse industry background, competitive advantage, management attitudes and financial strength, and finally we consider valuation. We meet the management of the companies within our investment universe and revisit the investment case for the portfolio’s holdings on a regular basis to ensure that our expectations are being met. |
|
The EAFE Alpha Portfolio Construction Group is responsible for the overall strategy and stock selection process. They meet regularly to discuss both buy and sell ideas and the level of conviction in their continuing holdings. |
|
As we move on into a new decade, our focus remains exactly the same; to identify exciting growth businesses in a position to grow their earnings and cash flow over the long term. |
|
4) Outlook |
|
We have had a bias towards optimism for some time. We still do. There are three reasons behind it: |
| | |
| • | Our confidence about global growth, which is being powered by the developing world. This is not a cyclical phenomenon; it will continue for years to come. |
| • | The overhang of debt in the developed world means that monetary policy will remain loose for a long time. This is a good thing for businesses and real assets such as shares. |
| • | Most investors refuse to recognise how favourable the investment background has become. Formation of any sort of optimistic consensus is continually being disrupted by ‘crises’ such as the Irish one. This is restraining valuations and provides a favourable background to financial investment. All the best times to invest have been suffused with gloom. |
Page 5
Management Discussion
Baillie Gifford EAFE Fund
| | | | | | | |
Performance for the period ended 12/31/10 (Average Annual Total Return) |
| | | | | | | |
| | One Year | | Since Inception
(March 6, 2008) | |
| | | | | | | | |
| | | | | | | |
The EAFE Fund Class 2 | | 16.60 | % | | 0.22 | % | |
| | | | | | | |
MSCI EAFE Index | | 8.21 | % | | -3.94 | % | |
Past performance is not a guarantee of future results. Returns for the EAFE Fund are before taxes and are net of all expenses, advisory fees and commission charges and include the reinvestment of the Fund’s dividends and distributions.
The MSCI EAFE Index is a market capitalization index designed to measure equity performance in global world markets. The index is unmanaged, is not available for investment, and does not reflect sales charges, fees, commissions, taxes or other expenses of investing. The Fund’s holdings may differ from the index.
Page 6
Management Discussion
Baillie Gifford EAFE Choice Fund
|
1) Market Conditions and Review of performance during 2010 |
|
Despite the gloomy tone of much commentary, often centered on the small but troubled periphery of Europe, and the lingering structural debt issues facing America and some other western countries, 2010 proved to be a year of robust growth in the global economy. This was led by large emerging markets but also helped by what appears to be a recent resurgence in Germany and, after a summer lull, improving sentiment in America too. Over the latter part of the year stock markets in developed countries generally reacted positively to the improving tone of economic data and the apparent determination of policy makers to force their economies onto a firmer footing, although part of these gains in international markets will have been mitigated by the strengthening dollar. Some emerging markets have also been more lackluster. Perhaps this reflects the recent evidence of a wide policy divergence opening up between major economies. In response to strong growth, massive inflows from abroad, and some fears about inflation, we have witnessed some tightening of policy in larger emerging economies. The Chinese authorities, for instance, raised capital reserve requirements six times during the year for the largest banks while Brazil and others have introduced policy measures to curtail strong capital inflows. In contrast, the Federal Reserve did just the opposite, authorizing a further $600bn in quantitative easing, whilst in countries such as the UK interest rates seem set to remain at exceptionally low levels despite some surprisingly ‘sticky’ inflation indicators. |
|
The Fund’s portfolio benefited from the prosperous global economy. Although we have a relatively low direct exposure to buoyant commodity prices, several of the holdings in the industrial sector and the service industries to the oil and mining companies thrived in the favorable operating conditions. Atlas Copco, which manufactures compressors for industrial applications, was a prominent beneficiary of the high and rapidly rising levels of capital spending across the industry. Other investments such as Weir Group, which makes a range of pumps and valves for the oil industry, also performed well. Beyond the narrow area of commodities, holdings such as Schindler and Kone, which supply escalators and elevators, also delivered good returns on the back of strong demand in developing economies. In most cases we believe that these share price moves are justified by operational performance which surpassed even our starting expectations. |
|
A low exposure to many of the larger troubled European financials also helped. Whilst not completely without sin, we had very low exposure to the large integrated European banks or insurance conglomerates, where concerns over sovereign debt exposures around the European periphery weighed on equity values. Fortunately, most of those European banks that we did own, such as the Swedish retail bank Svenska Handelsbanken or the Danish Jyske Bank, were rewarded for their more conservative lending and more stable funding positions. Elsewhere in the portfolio, the other main bank holdings, such as Bank of China (Hong Kong) and the Asian focused Standard Chartered, also benefited from their better growth prospects and superior asset quality, and each made a helpful contribution. |
Page 7
Management Discussion
Baillie Gifford EAFE Choice Fund
|
A third favorable theme was some fortunate stock selection within the energy sector. We had no exposure to BP and the disaster in the Gulf of Mexico earlier in the year. More importantly though, we held a collection of some of the smaller service companies, such as Wood Group and AMEC which provide engineering and other services to the large oil companies, and their share prices responded well to the large and growing levels of capital spending from major customers. |
|
We construct the portfolio on a ‘bottom up’ stock by stock basis, so there was more to 2010 than the admittedly strong themes of commodities, China, and other emerging markets. Encouragingly, investment performance in 2010 was spread over a number of other names, too. For instance, ASOS, the UK based internet apparel retailer, enjoyed a terrific year of progress in what looks to be a very exciting retail category, whilst Nestlé, the international consumer brand business, added to its long history of compounding steady, long term, profitable growth. |
|
2) Review of performance during the fourth quarter of 2010 |
|
The Fund outperformed its benchmark, with European stocks held in the portfolio performing very strongly. Industrial stocks performed particularly well over the quarter, with Atlas Copco (Swedish engineering company), Geberit (Swiss manufacturer of advanced plumbing and plastics equipment) as well as SMC Corp (Japanese manufacturer of pneumatics equipment) among the top contributors to the fund’s performance. Other top contributors included ASOS (UK online fashion retailer) and the Health Care stocks, Cochlear (Australian ear implant manufacturer) and Mettler Toledo (Swiss manufacturer of precision weighing and measuring equipment). Overall, Developed Asian holdings, such as Aristocrat Leisure (Australian gaming machine manufacturer) and Esprit Holdings (Hong Kong based producer of clothing/footwear and accessories), detracted from performance, as did the portfolio’s underweight position in Materials. |
|
3) Investment Strategies used to manage the Fund |
|
Baillie Gifford is a growth manager with a bottom up approach to stock picking. We aim to invest in companies that will generate sustainable earnings growth above the market over the long term. In determining the potential of a company, we analyse industry background, competitive advantage, management attitudes and financial strength, and finally we consider valuation. We meet the management of the companies within our investment universe and revisit the investment case for the portfolio’s holdings on a regular basis to ensure that our expectations are being met. |
|
The International Focus Portfolio Construction Group (PCG) is responsible for the overall strategy and stock selection process used to select investments for the fund. This process shares the long-term, bottom up approach to investing that is applied across the firm whilst attempting to develop a comparatively more diversified portfolio. The PCG meets regularly to discuss both buy and sell ideas and the level of conviction in existing holdings. |
|
As we move on into a new decade, our focus remains exactly the same; to identify exciting growth businesses in a position to grow their earnings and cash flow over the long term. |
Page 8
Management Discussion
Baillie Gifford EAFE Choice Fund
|
4) Outlook |
The gyrations of world stock markets over the last three years perhaps highlight the futility of indulging in short term predictions. We are nevertheless still optimistic, based on the evidence we see in the real global economy. The much improved health and confidence of most international companies underpins our conviction that we will see another year of robust global growth powered by the developing world. Conditions are clearly more fragile in some debt laden parts of the developed world, although improvement is tangible and, in any case, a period of very loose monetary policy seems likely to continue until the recovery appears stronger. There are considerable uncertainties and risks regarding the future inflationary impacts of such a massive and largely untested policy response, but such a large dose of monetary stimulus is usually good for real assets such as equities. Finally, valuations still do not appear excessive, especially when considered in the context of current and future levels of profits and cash flows rather than the unusually depressed levels of markets a couple of years ago. |
|
It is still unclear how the smaller parts of the eurozone periphery will drag themselves out of their current mess whilst coexisting with a thriving Germany and without the assistance of some more explicit, yet politically controversial, fiscal transfer. The portfolio continues to have very low exposure to the economically sensitive areas of that eurozone periphery. In part, this reflects some concern that it may prove to be a long hard slog for those relatively tiny countries. Mainly though, it is simply because we still feel confident in identifying a range of exciting growth investments in other more promising and interesting areas of international markets, and we are encouraged by the operational progress of most companies in the portfolio. |
Page 9
Management Discussion
Baillie Gifford EAFE Choice Fund
| | | | |
Performance for the period ended 12/31/10 (Average Annual Total Return) |
| | | |
| | Since Inception
(January 15, 2010) | |
| | | | |
The EAFE Choice | | | | |
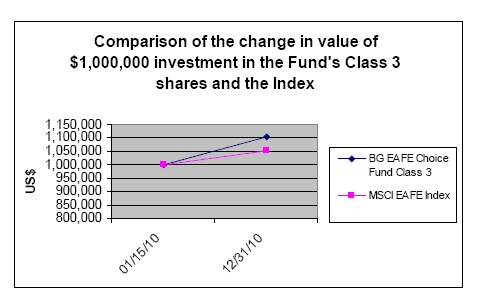
Fund Class 3 | | 10.40 | % | |
| | | | |
MSCI EAFE Index | | 5.14 | % | |
Past performance is not a guarantee of future results. Returns for the EAFE Choice Fund are before taxes and are net of all expenses, advisory fees and commission charges and include the reinvestment of the Fund’s dividends and distributions.
The MSCI EAFE Index is a market capitalization index designed to measure equity performance in global world markets. The index is unmanaged, is not available for investment, and does not reflect sales charges, fees, commissions, taxes or other expenses of investing. The Fund’s holdings may differ from the index.
Page 10
Management Discussion
Baillie Gifford Emerging Markets Fund
|
1) Market Conditions and Review of performance during 2010 |
|
2010 was a year of polarised performance in the Emerging Market universe. Leading the charge were some of the smaller, more peripheral stock markets. Thailand was the star performer, with Peru, Chile and Indonesia following closely behind. In marked contrast, China and Brazil were amongst the worst performing markets, beaten only by the Czech Republic and Hungary which both delivered negative returns. |
|
The smaller emerging market indices have been huge beneficiaries of continuing strong economic growth and massive capital inflows from abroad. Whilst this has also been true of China and Brazil, in China, the market remains fixated with the severity of any cooling measures as the government wrestles with containing the burgeoning money supply. In Brazil, the huge equity issuance by Petrobras hampered the market but flows were still strong enough to push the government to raise the tax on foreign bondholders to 6%. The broad policy actions so far appear reasonable, but we must acknowledge that the risk of a policy error is increasing. |
|
Throughout 2010 loose policy in developed markets, made possible by wide output gaps and spare capacity, has been fuelling potential asset price bubbles in the emerging market universe. Inflation expectations in Asia especially have been increasing as a result, and with real yields negative, wages and rents are rising too. Food inflation has regularly reared its ugly head due to a variety of causes from droughts in Russia to snow storms in China and the ensuing hoarding of stores in the hope of further price rises. |
|
Perhaps unsurprisingly, strong growth and an uncertain outlook have seen the dispersion of stock valuations widen significantly during the course of 2010. As such, the team remains focused on picking those companies that will benefit from the pockets of superior growth, wherever they may be. |
|
For the year ended December 31, 2010, The Emerging Markets Fund Class III generated a return of 19.73%, outperforming its benchmark, the MSCI Emerging Markets Index, which returned 19.20% for the year. Stock selection in Indonesia and Brazil was the main contributor to the outperformance. The Indonesian index delivered strong returns on the back of foreign investor flows, healthy GDP growth and the perception that infrastructure improvements are on track, aided by increased investment from the Chinese. Relative performance was helped by the overweight positions in Astra International (conglomerate), Bumi Resources (coal miner) and the two banks, Mandiri and Rakyat. In Brazil, an underweight position in Petrobras and a holding in E&P company OGX added value for the Fund. |
|
The Chinese market performed relatively poorly amidst monetary policy concerns. However, relative performance was boosted by the holding in Baidu; this Chinese internet search engine extended its dominance in the market over Google and online advertising spend in China is still at a very nascent stage. Conversely, the overweight positions in BYD (battery |
Page 11
Management Discussion
Baillie Gifford Emerging Markets Fund
|
and auto producer), China Longyuan Power (wind farm operator) and Evergrande Real Estate (high end property developer) all detracted from relative performance. |
|
Throughout the year there has been a slight shift in the shape of the portfolio. Though it maintains its bias towards the more pro-cyclical sectors such as Consumer Discretionary, the scale of these overweights has decreased. This is most true of the Financials sector which is now an underweight position, having been the fund’s top sector overweight twelve months ago. A number of our bank positions have been trimmed following sharp rebounds in their share prices from the lows of March 2009. Conversely the fund’s exposure to the Materials sector has been increased with the purchase of a variety of companies from the South African platinum producer Impala Platinum to Russian gold miner Petropavlovsk. |
|
2) Review of performance during the fourth quarter of 2010 |
|
The Emerging Markets Fund Class III returned 6.50% during the quarter, slightly underperforming the MSCI Emerging Markets Index which rose 7.4%. Stock selection in some of the frontier countries was helpful and there was notable strength in the Materials sector, with some of the Information Technology holdings also enjoying a good quarter. However, this was more than offset by stock selection in the Energy and Financials sectors. Turkey was noticeably weak over the quarter, suffering negative absolute returns versus a buoyant index. |
|
Stock selection in the Materials sector was the top contributor to performance over the period. A diverse range of holdings from the Mozambique mineral sands miner Kenmare Resources, to the Russian steel company Evraz, and South African gold miner Gold Fields, to cement company Cemex, performed strongly. |
|
However, this was more than offset by the lacklustre performance of some of the fund’s energy holdings. Cairn Energy, the UK listed oil E&P company, released drilling results in Greenland that disappointed the market but we remain optimistic regarding the longer term drilling programme; the same was true of the market’s reaction to Desire Petroleum’s drilling off the Falklands Islands. |
|
In stark contrast to the previous quarter the fund’s holdings in the two Turkish banks, Garanti and Isbank, were unhelpful. The country is facing a worsening macroeconomic backdrop with a rising oil price driving the current account deficit wider which has prompted the central bank to lower interest rates, partly to stop further Lira appreciation, but to hike reserve requirements. Given these macro risks and the strong performance of the banks in recent months, we have been trimming the holdings. |
Page 12
Management Discussion
Baillie Gifford Emerging Markets Fund
|
3) Investment Strategies used to manage the Fund |
|
Baillie Gifford is a growth manager with a bottom up approach to stock picking. We aim to invest in companies that will generate sustainable earnings growth above the market over the long term. In determining the potential of a company, we analyse the industry background, competitive advantage, management attitudes and financial strength, and finally we consider valuation. We meet the management of the companies within our investment universe and revisit the investment case for the portfolio’s holdings on a regular basis to ensure that our expectations are being met. |
|
The Emerging Markets investment team is responsible for the overall strategy and stock selection process, led by the most senior investment managers. The team meets regularly to discuss both buy and sell ideas and the level of conviction in the Fund’s continuing holdings. |
|
4) Outlook |
|
We remain excited about the long-term outlook for the stocks that make up the core of the portfolio. Where we struggle is anticipating where the voting machines will head in the short-term. Much of the sell-side discussion on Emerging Markets has focused recently on parallels with the early 90s, when U.S. Federal Reserve rates were slashed in the wake of the savings and loans crisis, and easy money in search of higher growth and yields sent emerging markets asset prices temporarily parabolic. Nearly 20 years later, there are many who argue that the recipe for another liquidity-fuelled emerging bubble has been concocted from similar macro ingredients: a dual-speed global economy; profound monetary stimulus in developed markets; and an understandable reluctance on the part of emerging policy makers to completely destroy their export industries. But the parallels are imprecise. This time, policymakers in emerging markets have made it quite clear that they are not going to allow themselves to be overwhelmed by the destabilising influence of cross-border flows. |
|
Capital controls have been put in place in a number of countries as a means of allowing currency appreciation to occur at an orderly pace. And while significant interest rate hikes have yet to take place across emerging markets, active use of credit controls suggest that monetary policy is probably rather more proactive than a cursory glance at real rates might suggest. As one would expect in such a diverse region, the challenge differs from country to country. On balance, the broad policy response so far appears a sensible step in the long-term aim of allowing growth to adjust towards a more sustainable level. However, easy money in search of the ‘emerging bubble redux’ may be sorely disappointed. |
|
In this sense, we remain open to the possibility that positive surprises in the near-term may be more likely to come from developed markets rather than our own. The apparent dichotomy of ebullient sentiment in emerging markets, and profound misery on the global outlook, can be seen as the broader context for recent additions to our North Asian tech holdings, or the purchase of stocks like Cemex; at the margin, these have tended to be funded by reductions to some of the strongest-performing domestically-focused stocks. However, exposure to domestic emerging growth remains the dominant theme in the portfolio. We will remain fully-invested, resolutely committed to seeking out long-term winners. |
Page 13
Management Discussion
Baillie Gifford Emerging Markets Fund
| | | | | | | | | | |
Performance for the period ended 12/31/10 (Average Annual Total Return) |
| | | | | | | | | | |
| | One Year | | Five Year | | Since Inception
(April 4, 2003) | |
| | | | | | | | | | |
| | | | | | | | | | |
The Emerging Markets | | | | | | | | | | |
Fund Class III | | 19.73 | % | | 15.95 | % | | 25.60 | % | |
| | | | | | | | | | |
MSCI Emerging Markets Index | | 19.20 | % | | 15.88 | % | | 22.61 | % | |
Past performance is not a guarantee of future results. Returns for the Emerging Markets Fund are before taxes and are net of all expenses, advisory fees and commission charges and include the reinvestment of the Fund’s dividends and distributions.
The MSCI Emerging Markets Index is a market capitalization index designed to measure equity performance in global world markets. The index is unmanaged, is not available for investment, and does not reflect sales charges, fees, commissions, taxes or other expenses of investing. The Fund’s holdings may differ from the index.
Page 14
Fund Expenses (unaudited)
As a shareholder of the Baillie Gifford International Equity Fund, the Baillie Gifford EAFE Fund, the Baillie Gifford EAFE Choice Fund and/or the Baillie Gifford Emerging Markets Fund (together, the “Funds”), you incur two types of costs: (1) transaction costs, which may include purchase premiums and redemption fees and (2) ongoing costs, including management fees, shareholder service fees and other Fund expenses. This example is intended to help you understand your ongoing costs (in dollars) of investing in the Funds and to compare these costs with the ongoing costs of investing in the other mutual funds.
The example is based on an investment of $1,000 invested at the beginning of the period and held for the entire period from July 1, 2010 to December 31, 2010.
Actual Expenses
The first line of each table provides information about actual account values and actual expenses. You may use the information in this line, together with the amount you invested, to estimate the expenses that you paid over the period. Simply divide the account value by $1,000 (for example, an $8,600 account value divided by $1,000 = 8.6), then multiply the result by the number in the first line under the heading entitled “Expenses Paid During Period” to estimate the expenses you paid on your account during this period.
Hypothetical Example for Comparison Purposes
The second line of each table below provides information about hypothetical account values and hypothetical expenses based on the Fund’s actual expense ratio and an assumed annual rate of return of 5% before expenses, which is not the Fund’s actual return. The hypothetical account values and expenses may not be used to estimate the actual ending account balance or expenses you paid for the period. You may use this information to compare the ongoing costs of investing in the Fund and other funds by comparing this 5% hypothetical example with the 5% hypothetical examples that appear in the shareholder reports of other funds.
Please note that the expenses shown in the table are meant to highlight your ongoing costs only and do not reflect any transactional costs, such as purchase premiums and redemption fees. Therefore, the second line of the table is useful in comparing ongoing costs only, and will not help you determine the relative total costs of owning different funds. In addition, if these transactional costs were included, your costs would have been higher.
Page 15
Fund Expenses (unaudited) (continued)
| | | | | | | | | |
| | | Beginning
Account
Value
7/01/10 | | Ending
Account
Value
12/31/10 | | Annualized
Expense Ratio
Based on Period
7/01/10 to
12/31/10 | | Expenses Paid
During Period
7/01/10 to
12/31/10 |
| | | | | | | | | |
Baillie Gifford International Equity Fund - Class 1 | | | | | | | | |
| Actual | | $1,000.00 | | $1,276.97 | | 0.86% | | $4.95 |
| Hypothetical (5% return before expenses) | | $1,000.00 | | $1,020.86 | | 0.86% | | $4.39 |
| | | | | | | | | |
Baillie Gifford International Equity Fund - Class 2 | | | | | | | | |
| Actual | | $1,000.00 | | $1,278.12 | | 0.69% | | $3.93 |
| Hypothetical (5% return before expenses) | | $1,000.00 | | $1,021.75 | | 0.69% | | $3.49 |
| | | | | | | | | |
Baillie Gifford International Equity Fund - Class 3 (a) | | | | | | | | |
| Actual | | $1,000.00 | | $1,201.86 | | 0.61% | | $2.23 |
| Hypothetical (5% return before expenses) | | $1,000.00 | | $1,022.13 | | 0.61% | | $3.11 |
| | | | | | | | | |
Baillie Gifford International Equity Fund - Class 4 (b) | | | | | | | | |
| Actual | | $1,000.00 | | $1,163.84 | | 0.58% | | $2.62 |
| Hypothetical (5% return before expenses) | | $1,000.00 | | $1,022.26 | | 0.58% | | $2.98 |
| | | | | | | | | |
Baillie Gifford EAFE Fund - Class 1 | | | | | | | | |
| Actual | | $1,000.00 | | $1,271.69 | | 0.79% | | $4.53 |
| Hypothetical (5% return before expenses) | | $1,000.00 | | $1,021.22 | | 0.79% | | $4.03 |
| | | | | | | | | |
Baillie Gifford EAFE Fund - Class 2 | | | | | | | | |
| Actual | | $1,000.00 | | $1,273.14 | | 0.62% | | $3.57 |
| Hypothetical (5% return before expenses) | | $1,000.00 | | $1,022.07 | | 0.62% | | $3.17 |
| | | | | | | | | |
Baillie Gifford EAFE Fund - Class 3 | | | | | | | | |
| Actual | | $1,000.00 | | $1,274.88 | | 0.55% | | $3.16 |
| Hypothetical (5% return before expenses) | | $1,000.00 | | $1,022.43 | | 0.55% | | $2.81 |
| | | | | | | | | |
Baillie Gifford EAFE Fund - Class 4 | | | | | | | | |
| Actual | | $1,000.00 | | $1,274.52 | | 0.52% | | $2.98 |
| Hypothetical (5% return before expenses) | | $1,000.00 | | $1,022.58 | | 0.52% | | $2.65 |
| | | | | | | | | |
Baillie Gifford EAFE Choice Fund - Class 2 | | | | | | | | |
| Actual | | $1,000.00 | | $1,273.19 | | 0.73% | | $4.16 |
| Hypothetical (5% return before expenses) | | $1,000.00 | | $1,021.54 | | 0.73% | | $3.70 |
| | | | | | | | | |
Baillie Gifford EAFE Choice Fund - Class 3 | | | | | | | | |
| Actual | | $1,000.00 | | $1,274.19 | | 0.66% | | $3.76 |
| Hypothetical (5% return before expenses) | | $1,000.00 | | $1,021.90 | | 0.66% | | $3.34 |
| | | | | | | | | |
Baillie Gifford Emerging Markets Fund - Class III | | | | | | | | |
| Actual | | $1,000.00 | | $1,272.92 | | 0.80% | | $4.57 |
| Hypothetical (5% return before expenses) | | $1,000.00 | | $1,021.18 | | 0.80% | | $4.06 |
(a) Commencement of investment operations is September 1, 2010.
(b) Commencement of investment operations is July 30, 2010.
Page 16
Fund Expenses (unaudited) (concluded)
Expenses are calculated using the annualized expense ratio for the Funds, which represents the ongoing expenses as a percentage of net assets for the six-months ended 12/31/10. Expenses are calculated by multiplying the annualized expense ratio by the average account value for the period; then multiplying the result by the number of days in the most recent fiscal half-year; and then dividing that result by the number of days in the calendar year. Expense ratios for the most recent fiscal half-year may differ from expense ratios based on the one-year data in the financial highlights.
Page 17
| |
INDUSTRY DIVERSIFICATION TABLE | |
December 31, 2010 (unaudited) | Baillie Gifford International Equity Fund |
| |
| | | | | | | | |
| | Value | | % of Total
Net Assets | |
| | | | |
| | | | | | | | |
Airlines | | $ | 6,059,997 | | | | 0.9 | % |
Apparel | | | 14,227,033 | | | | 2.1 | |
Auto Manufacturers | | | 4,481,733 | | | | 0.7 | |
Banks | | | 48,972,011 | | | | 7.1 | |
Beverages, Food & Tobacco | | | 41,726,762 | | | | 6.0 | |
Biotechnology | | | 9,221,435 | | | | 1.3 | |
Commercial Services | | | 30,248,019 | | | | 4.4 | |
Construction & Building Materials | | | 11,516,597 | | | | 1.7 | |
Distribution/Wholesale | | | 13,876,775 | | | | 2.0 | |
Diversified Financial Services | | | 41,898,919 | | | | 6.0 | |
Diversified Industrials | | | 12,803,358 | | | | 1.8 | |
Electronic & Electrical Equipment | | | 36,316,689 | | | | 5.2 | |
Engineering & Machinery | | | 39,915,010 | | | | 5.8 | |
Food Producers & Processors | | | 27,661,251 | | | | 4.0 | |
Healthcare - Products | | | 18,739,568 | | | | 2.7 | |
Insurance | | | 13,529,490 | | | | 2.0 | |
Internet | | | 23,035,028 | | | | 3.3 | |
Investment Companies | | | 4,942,988 | | | | 0.7 | |
Media & Photography | | | 15,110,821 | | | | 2.2 | |
Mining & Metals | | | 78,020,285 | | | | 11.2 | |
Office/Business Equipment | | | 9,892,952 | | | | 1.4 | |
Oil & Gas | | | 72,583,060 | | | | 10.4 | |
Pharmaceuticals | | | 20,395,902 | | | | 2.9 | |
Real Estate | | | 9,339,355 | | | | 1.3 | |
Retailers - General | | | 24,484,366 | | | | 3.5 | |
Semiconductors | | | 23,723,484 | | | | 3.4 | |
Software | | | 5,780,344 | | | | 0.8 | |
Telecommunication Services | | | 5,909,340 | | | | 0.9 | |
Toys/Games/Hobbies | | | 3,678,592 | | | | 0.5 | |
Transportation | | | 21,082,470 | | | | 3.0 | |
| | | | | | | | |
| | | | | | | | |
Total Value of Investments | | | 689,173,634 | | | | 99.2 | |
Other assets less liabilities | | | 5,588,180 | | | | 0.8 | |
| | | | | | | | |
Net Assets | | $ | 694,761,814 | | | | 100.0 | % |
| | | | | | | | |
Page 18
| |
PORTFOLIO OF INVESTMENTS | |
December 31, 2010 | Baillie Gifford International Equity Fund |
| |
| | | | | | | |
| | Shares | | Value | |
| | | | | | |
| | | | | | | |
COMMON STOCKS - 95.8% | | | | | | | |
ARGENTINA - 0.8% | | | | | | | |
MercadoLibre, Inc. (a) | | | 84,200 | | $ | 5,611,930 | |
| | | | | | | |
| | | | | | | |
AUSTRALIA - 3.6% | | | | | | | |
Brambles Ltd. | | | 1,528,876 | | | 11,136,470 | |
Cochlear Ltd. | | | 79,666 | | | 6,558,059 | |
Woolworths Ltd. | | | 257,414 | | | 7,108,441 | |
| | | | | | | |
| | | | | | 24,802,970 | |
| | | | | | | |
BELGIUM - 0.8% | | | | | | | |
Groupe Bruxelles Lambert SA | | | 67,685 | | | 5,694,917 | |
| | | | | | | |
| | | | | | | |
BERMUDA - 1.7% | | | | | | | |
Seadrill Ltd. | | | 347,173 | | | 11,843,183 | |
| | | | | | | |
| | | | | | | |
BRAZIL - 4.7% | | | | | | | |
All America Latina Logistica | | | 530,260 | | | 4,791,506 | |
BM&F BOVESPA SA | | | 954,100 | | | 7,546,586 | |
OGX Petroleo e Gas Participacoes SA (a) | | | 648,400 | | | 7,812,048 | |
Petroleo Brasileiro SA ADR | | | 331,800 | | | 12,555,312 | |
| | | | | | | |
| | | | | | 32,705,452 | |
| | | | | | | |
CANADA - 5.1% | | | | | | | |
Cenovus Energy, Inc. | | | 127,557 | | | 4,269,433 | |
Eldorado Gold Corp. | | | 443,458 | | | 8,251,004 | |
EnCana Corp. | | | 122,143 | | | 3,573,509 | |
Fairfax Financial Holdings Ltd. | | | 23,867 | | | 9,817,323 | |
IAMGOLD Corp. | | | 262,182 | | | 4,680,409 | |
Ritchie Bros. Auctioneers, Inc. | | | 204,010 | | | 4,702,655 | |
| | | | | | | |
| | | | | | 35,294,333 | |
| | | | | | | |
CHINA - 8.1% | | | | | | | |
Baidu, Inc. ADR (a) | | | 97,650 | | | 9,426,154 | |
Cheung Kong (Holdings) Ltd. | | | 606,000 | | | 9,339,355 | |
China Shenhua Energy Co., Ltd., Class H | | | 1,738,500 | | | 7,285,945 | |
Hang Seng Bank Ltd. | | | 467,500 | | | 7,681,181 | |
Hong Kong Exchanges & Clearing Ltd. | | | 573,400 | | | 13,000,510 | |
Kunlun Energy Co., Ltd. | | | 3,998,000 | | | 6,201,830 | |
Pacific Basin Shipping Ltd. | | | 4,848,000 | | | 3,221,133 | |
| | | | | | | |
| | | | | | 56,156,108 | |
| | | | | | | |
DENMARK - 3.2% | | | | | | | |
A P Moller - Maersk AS, B Shares | | | 713 | | | 6,455,249 | |
DSV AS | | | 298,399 | | | 6,614,582 | |
Novozymes AS, B Shares | | | 66,088 | | | 9,221,435 | |
| | | | | | | |
| | | | | | 22,291,266 | |
| | | | | | | |
FINLAND - 2.3% | | | | | | | |
Kone Oyj, B Shares | | | 200,460 | | | 11,134,037 | |
Sampo Oyj, A Shares | | | 188,674 | | | 5,045,070 | |
| | | | | | | |
| | | | | | 16,179,107 | |
| | | | | | | |
FRANCE - 1.8% | | | | | | | |
CFAO | | | 132,575 | | | 5,774,679 | |
Essilor International SA | | | 110,811 | | | 7,139,660 | |
| | | | | | | |
| | | | | | 12,914,339 | |
| | | | | | | |
The accompanying notes are an integral part of the financial statements.
Page 19
| |
PORTFOLIO OF INVESTMENTS (continued) | |
December 31, 2010 | Baillie Gifford International Equity Fund |
| |
| | | | | | | |
| | Shares | | Value | |
| | | | | | |
| | | | | | | |
GERMANY - 2.9% | | | | | | | |
Aixtron SE | | | 164,668 | | $ | 6,136,469 | |
Celesio AG | | | 165,823 | | | 4,132,394 | |
Deutsche Boerse AG | | | 146,442 | | | 10,117,836 | |
| | | | | | | |
| | | | | | 20,386,699 | |
| | | | | | | |
INDIA - 1.5% | | | | | | | |
Infrastructure Development Finance Co., Ltd. | | | 1,210,891 | | | 4,942,988 | |
Jindal Steel & Power Ltd. | | | 252,160 | | | 4,013,410 | |
Reliance Capital Ltd. | | | 94,807 | | | 1,416,664 | |
| | | | | | | |
| | | | | | 10,373,062 | |
| | | | | | | |
IRELAND - 2.5% | | | | | | | |
CRH Plc. | | | 283,872 | | | 5,888,351 | |
James Hardie Industries SE CDI (a) | | | 811,666 | | | 5,628,246 | |
Ryanair Holdings Plc. ADR | | | 197,009 | | | 6,059,997 | |
| | | | | | | |
| | | | | | 17,576,594 | |
| | | | | | | |
ISRAEL - 0.8% | | | | | | | |
Teva Pharmaceutical Industries Ltd. ADR | | | 103,500 | | | 5,395,455 | |
| | | | | | | |
| | | | | | | |
JAPAN - 9.6% | | | | | | | |
Canon, Inc. | | | 192,600 | | | 9,892,952 | |
Chugai Pharmaceutical Co., Ltd. | | | 224,300 | | | 4,107,045 | |
Fast Retailing Co., Ltd. | | | 46,300 | | | 7,344,174 | |
INPEX Corp. | | | 982 | | | 5,734,282 | |
Japan Tobacco, Inc. | | | 1,883 | | | 6,953,111 | |
Mitsui & Co., Ltd. | | | 388,500 | | | 6,392,345 | |
Nintendo Co., Ltd. | | | 12,600 | | | 3,678,592 | |
Olympus Corp. | | | 222,400 | | | 6,696,495 | |
Rakuten, Inc. (a) | | | 9,556 | | | 7,996,944 | |
SMC Corp. | | | 44,700 | | | 7,627,891 | |
| | | | | | | |
| | | | | | 66,423,831 | |
| | | | | | | |
NETHERLANDS - 1.7% | | | | | | | |
ASML Holding NV | | | 101,841 | | | 3,905,825 | |
Heineken Holding NV | | | 178,329 | | | 7,755,432 | |
| | | | | | | |
| | | | | | 11,661,257 | |
| | | | | | | |
PORTUGAL - 0.5% | | | | | | | |
Galp Energia, SGPS, SA, B Shares | | | 182,934 | | | 3,508,306 | |
| | | | | | | |
| | | | | | | |
RUSSIA - 2.0% | | | | | | | |
Mobile TeleSystems ADR | | | 283,150 | | | 5,909,341 | |
X5 Retail Group NV GDR Reg S (a) | | | 176,950 | | | 8,196,150 | |
| | | | | | | |
| | | | | | 14,105,491 | |
| | | | | | | |
SINGAPORE - 2.7% | | | | | | | |
DBS Group Holdings Ltd. | | | 731,000 | | | 8,159,100 | |
United Overseas Bank Ltd. | | | 755,000 | | | 10,714,182 | |
| | | | | | | |
| | | | | | 18,873,282 | |
| | | | | | | |
SOUTH AFRICA - 3.7% | | | | | | | |
Massmart Holdings Ltd. | | | 472,034 | | | 10,513,537 | |
Naspers Ltd., N Shares | | | 256,301 | | | 15,110,821 | |
| | | | | | | |
| | | | | | 25,624,358 | |
| | | | | | | |
SOUTH KOREA - 2.6% | | | | | | | |
Hyundai Mobis (a) | | | 17,900 | | | 4,481,733 | |
Samsung Electronics Co., Ltd. | | | 16,092 | | | 13,439,012 | |
| | | | | | | |
| | | | | | 17,920,745 | |
| | | | | | | |
The accompanying notes are an integral part of the financial statements.
Page 20
| |
PORTFOLIO OF INVESTMENTS (continued) | |
December 31, 2010 | Baillie Gifford International Equity Fund |
| |
| | | | | | | |
| | Shares | | Value | |
| | | | | | |
| | | | | | | |
SPAIN - 1.5% | | | | | | | |
Banco Santander SA | | | 329,238 | | $ | 3,508,303 | |
Industria de Diseno Textil SA | | | 91,951 | | | 6,882,858 | |
| | | | | | | |
| | | | | | 10,391,161 | |
| | | | | | | |
SWEDEN - 4.8% | | | | | | | |
Atlas Copco AB, B Shares | | | 934,435 | | | 21,153,082 | |
Svenska Handelsbanken AB, A Shares | | | 385,158 | | | 12,311,777 | |
| | | | | | | |
| | | | | | 33,464,859 | |
| | | | | | | |
SWITZERLAND - 4.1% | | | | | | | |
Nestle SA | | | 366,171 | | | 21,451,642 | |
Roche Holding AG | | | 46,121 | | | 6,761,008 | |
| | | | | | | |
| | | | | | 28,212,650 | |
| | | | | | | |
TAIWAN - 4.0% | | | | | | | |
Hon Hai Precision Industry Co., Ltd. GDR Reg S | | | 827,764 | | | 6,622,112 | |
MediaTek, Inc. | | | 514,371 | | | 7,362,277 | |
Taiwan Semiconductor Manufacturing Co., Ltd. ADR | | | 1,091,004 | | | 13,681,190 | |
| | | | | | | |
| | | | | | 27,665,579 | |
| | | | | | | |
TURKEY - 2.0% | | | | | | | |
Anadolu Efes Biracilik ve Malt Sanayii AS | | | 504,430 | | | 7,618,787 | |
BIM Birlesik Magazalar AS | | | 183,025 | | | 6,209,609 | |
| | | | | | | |
| | | | | | 13,828,396 | |
| | | | | | | |
UNITED KINGDOM - 16.8% | | | | | | | |
Amlin Plc. | | | 1,329,000 | | | 8,484,420 | |
Antofagasta Plc. | | | 451,463 | | | 11,423,374 | |
BG Group Plc. | | | 373,760 | | | 7,581,799 | |
BHP Billiton Plc. | | | 240,707 | | | 9,684,046 | |
British American Tobacco Plc. | | | 296,305 | | | 11,397,658 | |
Capita Group Plc. | | | 563,670 | | | 6,130,199 | |
Experian Plc. | | | 664,679 | | | 8,278,695 | |
Premier Farnell Plc. | | | 491,120 | | | 2,196,793 | |
Rio Tinto Plc. | | | 223,200 | | | 15,909,997 | |
Sage Group Plc. (The) | | | 1,353,251 | | | 5,780,344 | |
Smith & Nephew Plc. | | | 477,500 | | | 5,041,849 | |
Tesco Plc. | | | 1,206,719 | | | 8,001,774 | |
Tullow Oil Plc. | | | 481,244 | | | 9,503,358 | |
Wolseley Plc. (a) | | | 233,800 | | | 7,484,430 | |
| | | | | | | |
| | | | | | 116,898,736 | |
| | | | | | | |
Total Common Stocks | | | | | | | |
(cost $544,815,348) | | | | | | 665,804,066 | |
| | | | | | | |
| | | | | | | |
PREFERRED STOCKS - 3.4% | | | | | | | |
BRAZIL - 3.4% | | | | | | | |
Itau Unibanco Holding SA ADR | | | 274,780 | | | 6,597,468 | |
Vale SA ADR | | | 555,000 | | | 16,772,100 | |
| | | | | | | |
| | | | | | | |
Total Preferred Stocks | | | | | | | |
(cost $17,404,070) | | | | | | 23,369,568 | |
| | | | | | | |
| | | | | | | |
TOTAL INVESTMENTS - 99.2% | | | | | | | |
(cost $562,219,418) | | | | | | 689,173,634 | |
Other assets less liabilities - 0.8% | | | | | | 5,588,180 | |
| | | | | | | |
NET ASSETS - 100.0% | | | | | $ | 694,761,814 | |
| | | | | | | |
The accompanying notes are an integral part of the financial statements.
Page 21
| |
PORTFOLIO OF INVESTMENTS (concluded) | |
December 31, 2010 | Baillie Gifford International Equity Fund |
| |
(a) Non-income producing security.
CDI - Chess Depository Interest.
GDR - Global Depositary Receipt.
ADR - American Depositary Receipt.
Reg S - is a safe harbor that defines when an offering of securities will be deemed to come to rest abroad and therefore is not subject to the registration obligations imposed under Section 5 of the 1933 Act. The regulation includes two safe harbor provisions: an issuer safe harbor and a resale safe harbor. In each case, the regulation demands that offers and sales of the securities be made outside the United States and that no offering participant (which includes the issuer, the banks assisting with the offer and their respective affiliates) engage in “directed” selling efforts. In the case of issuers for whose securities there is substantial U.S. market interest, the regulation also requires that no offers and sales be made to U.S. persons (including U.S. persons physically located outside the United States).
The accompanying notes are an integral part of the financial statements.
Page 22
| |
STATEMENT OF ASSETS AND LIABILITIES | |
December 31, 2010 | Baillie Gifford International Equity Fund |
| | |
| | | | |
ASSETS | | | | |
Investments, at value (cost $562,219,418) | | $ | 689,173,634 | |
Cash | | | 1,106,095 | |
Foreign cash, at value (cost $6,084,080) | | | 6,194,310 | |
Dividends receivable | | | 346,686 | |
Tax reclaims receivable | | | 158,032 | |
Capital shares sold receivable | | | 37,850 | |
| | | | |
| | | | |
Total Assets | | | 697,016,607 | |
| | | | |
| | | | |
LIABILITIES | | | | |
Payable for investments purchased | | | 949,962 | |
Management fee payable | | | 499,023 | |
Servicing fee payable | | | 452,023 | |
Distributions payable | | | 201,706 | |
Accrued expenses | | | 152,079 | |
| | | | |
| | | | |
Total Liabilities | | | 2,254,793 | |
| | | | |
| | | | |
NET ASSETS | | $ | 694,761,814 | |
| | | | |
| | | | |
| | | | |
COMPOSITION OF NET ASSETS | | | | |
Paid-in capital | | $ | 573,419,814 | |
Distributions in excess of net investment income | | | (3,215,796 | ) |
Accumulated net realized loss on investments and foreign currency transactions | | | (2,516,601 | ) |
Net unrealized appreciation in value of investments and foreign currencies | | | 127,074,397 | |
| | | | |
| | $ | 694,761,814 | |
| | | | |
| | | | |
NET ASSET VALUE, PER SHARE | | | | |
| | | | |
Class 1 ($72,365,556 / 7,257,461 shares outstanding), | | | | |
unlimited authorized, no par value | | $ | 9.97 | |
| | | | |
Maximum Purchase Price Per Share (Note D) | | $ | 9.99 | |
| | | | |
Minimum Redemption Price Per Share (Note D) | | $ | 9.96 | |
| | | | |
| | | | |
Class 2 ($447,232,444 / 44,961,120 shares outstanding), | | | | |
unlimited authorized, no par value | | $ | 9.95 | |
| | | | |
Maximum Purchase Price Per Share (Note D) | | $ | 9.97 | |
| | | | |
Minimum Redemption Price Per Share (Note D) | | $ | 9.94 | |
| | | | |
| | | | |
Class 3 ($154,209,203 / 15,329,438 shares outstanding), | | | | |
unlimited authorized, no par value | | $ | 10.06 | |
| | | | |
Maximum Purchase Price Per Share (Note D) | | $ | 10.08 | |
| | | | |
Minimum Redemption Price Per Share (Note D) | | $ | 10.04 | |
| | | | |
| | | | |
Class 4 ($20,954,611 / 2,038,935 shares outstanding), | | | | |
unlimited authorized, no par value | | $ | 10.28 | |
| | | | |
Maximum Purchase Price Per Share (Note D) | | $ | 10.30 | |
| | | | |
Minimum Redemption Price Per Share (Note D) | | $ | 10.26 | |
| | | | |
The accompanying notes are an integral part of the financial statements.
Page 23
| |
STATEMENT OF OPERATIONS | |
For the Year Ended December 31, 2010 | Baillie Gifford International Equity Fund |
| | |
| | | | |
INVESTMENT INCOME | | | | |
Dividends (net of foreign withholding taxes of $678,459) | | $ | 8,818,190 | |
Interest | | | 3,596 | |
| | | | |
Total Investment Income | | | 8,821,786 | |
| | | | |
| | | | |
EXPENSES | | | | |
Management fee (Note B) | | | 1,304,343 | |
Shareholder Servicing fees - Class 1 Shares (Note B) | | | 299,807 | |
Shareholder Servicing fees - Class 2 Shares (Note B) | | | 836,382 | |
Shareholder Servicing fees - Class 3 Shares (Note B) | | | 96,479 | |
Shareholder Servicing fees - Class 4 Shares (Note B) | | | 13,637 | |
Fund Accounting | | | 258,995 | |
Custody | | | 85,782 | |
Legal | | | 45,042 | |
Transfer Agency | | | 24,203 | |
Professional fees | | | 23,166 | |
Trustees’ fees | | | 16,210 | |
Insurance | | | 13,733 | |
Miscellaneous | | | 14,390 | |
| | | | |
Total Expenses | | | 3,032,169 | |
| | | | |
| | | | |
Net Investment Income | | | 5,789,617 | |
| | | | |
| | | | |
REALIZED AND UNREALIZED GAIN (LOSS) ON INVESTMENTS AND FOREIGN CURRENCY TRANSACTIONS | | | | |
Net realized gain (loss) from: | | | | |
Investments | | | 9,188,527 | |
Foreign currency transactions | | | (373,813 | ) |
| | | | |
| | | 8,814,714 | |
| | | | |
| | | | |
Net change in unrealized appreciation on: | | | | |
Investments | | | 70,472,047 | |
Translation of assets and liabilities in foreign currencies | | | 161,065 | |
| | | | |
| | | 70,633,112 | |
| | | | |
| | | | |
Net realized and unrealized gain on investments and foreign currency transactions | | | 79,447,826 | |
| | | | |
NET INCREASE IN NET ASSETS FROM OPERATIONS | | $ | 85,237,443 | |
| | | | |
The accompanying notes are an integral part of the financial statements.
Page 24
| |
STATEMENTS OF CHANGES IN NET ASSETS | Baillie Gifford International Equity Fund |
| | |
| | | | | | | | |
| | For the
Year Ended
December 31, 2010 | | | For the
Year Ended
December 31, 2009 | |
| | | | | | |
INCREASE IN NET ASSETS FROM OPERATIONS | | | | | | | | |
Net investment income | | $ | 5,789,617 | | | $ | 3,055,724 | |
Net realized gain (loss) from investments and foreign currency transactions | | | 8,814,714 | | | | (1,399,037 | ) |
Net change in unrealized appreciation on investments and translation of assets and liabilities in foreign currencies | | | 70,633,112 | | | | 72,412,809 | |
| | | | | | | | |
Net increase in net assets from operations | | | 85,237,443 | | | | 74,069,496 | |
| | | | | | | | |
| | | | | | | | |
DIVIDENDS TO SHAREHOLDERS FROM: | | | | | | | | |
Net investment income: | | | | | | | | |
Class 1 | | | (1,213,165 | ) | | | (635,724 | ) |
Class 2 | | | (7,775,994 | ) | | | (2,951,387 | ) |
Class 3 | | | (2,843,440 | ) | | | - | |
Class 4 | | | (383,650 | ) | | | - | |
| | | | | | | | |
| | | | | | | | |
Total Dividends | | | (12,216,249 | ) | | | (3,587,111 | ) |
| | | | | | | | |
| | | | | | | | |
| | | | | | | | |
TRANSACTIONS IN SHARES OF BENEFICIAL INTEREST | | | | | | | | |
Net proceeds from shares subscribed: | | | | | | | | |
Class 1 | | | 58,565,548 | | | | 118,875,750 | |
Class 2 | | | 197,769,223 | | | | 158,653,946 | |
Class 3 | | | 128,255,931 | | | | - | |
Class 4 | | | 18,009,486 | | | | - | |
Purchase premiums: | | | | | | | | |
Class 1 | | | 90,426 | | | | 110,922 | |
Class 2 | | | 346,429 | | | | 76,723 | |
Class 3 | | | 98,509 | | | | - | |
Class 4 | | | 13,573 | | | | - | |
Redemption fees: | | | | | | | | |
Class 1 | | | 4,011 | | | | 1,726 | |
Class 2 | | | 16,205 | | | | 2,030 | |
Class 3 | | | 2,837 | | | | - | |
Class 4 | | | 983 | | | | - | |
Dividends reinvested: | | | | | | | | |
Class 1 | | | 980,900 | | | | 635,723 | |
Class 2 | | | 7,775,994 | | | | 2,951,387 | |
Class 3 | | | 2,843,440 | | | | - | |
Class 4 | | | 383,650 | | | | - | |
Cost of shares redeemed: | | | | | | | | |
Class 1 | | | (61,133,453 | ) | | | (160,156,199 | ) |
Class 2 | | | (11,517,276 | ) | | | (26,242,512 | ) |
| | | | | | | | |
|
Increase in Net Assets from Transactions in Shares of Beneficial Interest | | | 342,506,416 | | | | 94,909,496 | |
| | | | | | | | |
| | | | | | | | |
Total Increase in Net Assets | | | 415,527,610 | | | | 165,391,881 | |
| | | | | | | | |
NET ASSETS | | | | | | | | |
Beginning of year | | | 279,234,204 | | | | 113,842,323 | |
| | | | | | | | |
End of year (including distributions in excess of net investment income of $3,215,796 and $1,673,895, respectively) | | $ | 694,761,814 | | | $ | 279,234,204 | |
| | | | | | | | |
The accompanying notes are an integral part of the financial statements.
Page 25
| |
| |
FINANCIAL HIGHLIGHTS | Baillie Gifford International Equity Fund |
| | |
| |
Selected data for a Class 1 Share outstanding throughout each period: | |
| | | | | | | |
| | For the
Year Ended
December 31, 2010 | | For the
Year Ended
December 31, 2009 | | For the Period
July 1, 2008(a)
through
December 31, 2008 | |
| | | | | | | |
Net asset value, beginning of period | | $8.86 | | $6.07 | | $10.52 | |
| | | | | | | |
| | | | | | | |
From Investment Operations | | | | | | | |
Net investment income(b) | | 0.12 | | 0.16 | | 0.03 | |
Net realized and unrealized gain (loss) on investments and foreign currency transactions | | 1.15 | | 2.70 | | (4.42) | |
| | | | | | | |
Net increase (decrease) in net asset value from investment operations | | 1.27 | | 2.86 | | (4.39) | |
| | | | | | | |
| | | | | | | |
Dividends to Shareholders | | | | | | | |
Dividends from net investment income | | (0.17) | | (0.08) | | (0.08) | |
| | | | | | | |
| | | | | | | |
Proceeds from Purchase Premiums and Redemption Fees | | 0.01 | | 0.01 | | 0.02 | |
| | | | | | | |
| | | | | | | |
Net asset value, end of period | | $9.97 | | $8.86 | | $6.07 | |
| | | | | | | |
| | | | | | | |
Total Return | | | | | | | |
Total investment return based on net asset value(c) | | 14.44% | | 47.24% | | (41.51)% | |
| | | | | | | |
Ratios/Supplemental Data | | | | | | | |
Net assets, end of period (000’s omitted) | | $72,366 | | $64,512 | | $63,086 | |
Ratio of net expenses to average net assets, after waiver | | 0.86% | | 0.93%(d) | | 0.90% *(d) | |
Ratio of net expenses to average net assets, before waiver | | 0.86% | | 0.94%(d) | | 1.05% *(d) | |
Ratio of net investment income to average net assets | | 1.36% | | 2.17% | | 1.14%* | |
Portfolio turnover rate | | 24% | | 17% | | 71% | |
| |
* | Annualized. |
(a) | Commencement of investment operations. |
(b) | Calculated based upon average shares outstanding during the period. |
(c) | Total investment return is calculated assuming an initial investment made at the net asset value at the beginning of the period, reinvestment of all dividends and distributions, if any, at net asset value during the period, and redemption on the last day of the period. Total return is not annualized for periods less than one year. |
(d) | Baillie Gifford Overseas Limited had contractually agreed to waive its fees and/or bear other expenses through March 31, 2009 to the extent that such Fund’s total annual operating expenses (excluding interest, taxes and extraordinary expenses) exceeded 0.90% for Class 1 Shares. |
The accompanying notes are an integral part of the financial statements.
Page 26
| |
| |
FINANCIAL HIGHLIGHTS | Baillie Gifford International Equity Fund |
| | |
| |
Selected data for a Class 2 Share outstanding throughout each period: | |
| | | | | | | |
| | For the
Year Ended
December 31, 2010 | | For the
Year Ended
December 31, 2009 | | For the Period
February 7, 2008(a)
through
December 31, 2008 | |
| | | | | | | |
Net asset value, beginning of period | | $8.84 | | $6.07 | | $10.00 | |
| | | | | | | |
| | | | | | | |
From Investment Operations | | | | | | | |
Net investment income(b) | | 0.13 | | 0.09 | | 0.16 | |
Net realized and unrealized gain (loss) on investments and foreign currency transactions | | 1.15 | | 2.80 | | (4.03) | |
| | | | | | | |
Net increase (decrease) in net asset value from investment operations | | 1.28 | | 2.89 | | (3.87) | |
| | | | | | | |
| | | | | | | |
Dividends to Shareholders | | | | | | | |
Dividends from net investment income | | (0.18) | | (0.13) | | (0.08) | |
| | | | | | | |
| | | | | | | |
Proceeds from Purchase Premiums and Redemption Fees | | 0.01 | | 0.01 | | 0.02 | |
| | | | | | | |
| | | | | | | |
Net asset value, end of period | | $9.95 | | $8.84 | | $6.07 | |
| | | | | | | |
| | | | | | | |
Total Return | | | | | | | |
Total investment return based on net asset value(c) | | 14.65% | | 47.76% | | (38.51)% | |
| | | | | | | |
Ratios/Supplemental Data | | | | | | | |
Net assets, end of period (000’s omitted) | | $447,232 | | $214,722 | | $50,756 | |
Ratio of net expenses to average net assets, after waiver | | 0.68% | | 0.70%(d) | | 0.72% *(d) | |
Ratio of net expenses to average net assets, before waiver | | 0.68% | | 0.70%(d) | | 0.94%*(d) | |
Ratio of net investment income to average net assets | | 1.43% | | 1.12% | | 1.84% * | |
Portfolio turnover rate | | 24% | | 17% | | 71% | |
| |
* | Annualized. |
(a) | Commencement of investment operations. |
(b) | Calculated based upon average shares outstanding during the period. |
(c) | Total investment return is calculated assuming an initial investment made at the net asset value at the beginning of the period, reinvestment of all dividends and distributions, if any, at net asset value during the period, and redemption on the last day of the period. Total return is not annualized for periods less than one year. |
(d) | Baillie Gifford Overseas Limited had contractually agreed to waive its fees and/or bear other expenses through March 31, 2009 to the extent that such Fund’s total annual operating expenses (excluding interest, taxes and extraordinary expenses) exceeded 0.72% for Class 2 Shares. |
The accompanying notes are an integral part of the financial statements.
Page 27
| |
FINANCIAL HIGHLIGHTS | Baillie Gifford International Equity Fund |
Selected data for a Class 3 Share outstanding throughout the period:
| | |
| | For the Period
September 1, 2010(a)
through
December 31, 2010 |
Net asset value, beginning of period | | $ 8.53 |
| | |
From Investment Operations | | |
Net investment income(b) | | 0.02 |
Net realized and unrealized gain on investments and foreign currency transactions | | 1.69 |
Net increase in net asset value from investment operations | | 1.71 |
| | |
Dividends to Shareholders | | |
Dividends from net investment income | | (0.19) |
| | |
Proceeds from Purchase Premiums and Redemption Fees | | 0.01 |
| | |
Net asset value, end of period | | $10.06 |
| | |
Total Return | | |
Total investment return based on net asset value(c) | | 20.19% |
| | |
Ratios/Supplemental Data | | |
Net assets, end of period (000’s omitted) | | $154,209 |
Ratio of net expenses to average net assets | | 0.61%* |
Ratio of net investment income to average net assets | | 0.76%* |
Portfolio turnover rate | | 24% |
| |
* | Annualized. |
(a) | Commencement of investment operations. |
(b) | Calculated based upon average shares outstanding during the period. |
(c) | Total investment return is calculated assuming an initial investment made at the net asset value at the beginning of the period, reinvestment of all dividends and distributions, if any, at net asset value during the period, and redemption on the last day of the period. Total return is not annualized for periods less than one year. |
The accompanying notes are an integral part of the financial statements.
Page 28
| |
FINANCIAL HIGHLIGHTS | Baillie Gifford International Equity Fund |
Selected data for a Class 4 Share outstanding throughout the period:
| | |
| | For the Period
July 30, 2010(a)
through
December 31, 2010 |
Net asset value, beginning of period | | $9.00 |
| | |
From Investment Operations | | |
Net investment income(b) | | 0.04 |
Net realized and unrealized gain on investments and foreign currency transactions | | 1.42 |
Net increase in net asset value from investment operations | | 1.46 |
| | |
Dividends to Shareholders | | |
Dividends from net investment income | | (0.19) |
| | |
Proceeds from Purchase Premiums and Redemption Fees | | 0.01 |
| | |
Net asset value, end of period | | $10.28 |
| | |
Total Return | | |
Total investment return based on net asset value(c) | | 16.38% |
| | |
Ratios/Supplemental Data | | |
Net assets, end of period (000’s omitted) | | $20,955 |
Ratio of net expenses to average net assets | | 0.58%* |
Ratio of net investment income to average net assets | | 0.97%* |
Portfolio turnover rate | | 24% |
| |
* | Annualized. |
(a) | Commencement of investment operations. |
(b) | Calculated based upon average shares outstanding during the period. |
(c) | Total investment return is calculated assuming an initial investment made at the net asset value at the beginning of the period, reinvestment of all dividends and distributions, if any, at net asset value during the period, and redemption on the last day of the period. Total return is not annualized for periods less than one year. |
The accompanying notes are an integral part of the financial statements.
Page 29
| |
INDUSTRY DIVERSIFICATION TABLE | |
December 31, 2010 (unaudited) | Baillie Gifford EAFE Fund |
| | | | | | | | |
| | Value | | | % of Total
Net Assets | |
| | | | | | | | |
Aerospace/Defense | | $ | 43,475,367 | | | | 2.8 | % |
Apparel | | | 55,662,281 | | | | 3.6 | |
Auto Manufacturers | | | 8,814,631 | | | | 0.5 | |
Banks | | | 188,681,719 | | | | 12.1 | |
Beverages, Food & Tobacco | | | 109,431,655 | | | | 7.0 | |
Biotechnology | | | 21,125,913 | | | | 1.3 | |
Chemicals | | | 25,494,730 | | | | 1.6 | |
Commercial Services | | | 29,187,564 | | | | 1.9 | |
Construction & Building Materials | | | 42,312,771 | | | | 2.7 | |
Cosmetics/Personal Care | | | 35,395,315 | | | | 2.3 | |
Distribution/Wholesale | | | 10,861,395 | | | | 0.7 | |
Diversified Financial Services | | | 56,679,205 | | | | 3.6 | |
Diversified Industrials | | | 40,010,290 | | | | 2.6 | |
Electronic & Electrical Equipment | | | 48,682,060 | | | | 3.1 | |
Energy - Alternate Sources | | | 20,428,729 | | | | 1.3 | |
Engineering & Machinery | | | 128,275,580 | | | | 8.2 | |
Healthcare - Products | | | 24,623,196 | | | | 1.6 | |
Insurance | | | 25,731,423 | | | | 1.6 | |
Internet | | | 112,428,135 | | | | 7.2 | |
Investment Companies | | | 683,796 | | | | 0.0 | |
Mining & Metals | | | 80,197,756 | | | | 5.1 | |
Motorcycles | | | 14,978,205 | | | | 1.0 | |
Office/Business Equipment | | | 24,752,927 | | | | 1.6 | |
Oil & Gas | | | 107,913,920 | | | | 6.9 | |
Pharmaceuticals | | | 42,221,887 | | | | 2.7 | |
Retailers - General | | | 113,782,118 | | | | 7.3 | |
Semiconductors | | | 25,935,573 | | | | 1.7 | |
Software | | | 46,683,726 | | | | 3.0 | |
Toys/Games/Hobbies | | | 35,530,525 | | | | 2.3 | |
Travel & Leisure | | | 12,355,649 | | | | 0.8 | |
| | | | | | | | |
Total Value of Investments | | | 1,532,338,041 | | | | 98.1 | |
Other assets less liabilities | | | 30,315,790 | | | | 1.9 | |
Net Assets | | $ | 1,562,653,831 | | | | 100.0 | % |
Page 30
| |
PORTFOLIO OF INVESTMENTS | |
December 31, 2010 | Baillie Gifford EAFE Fund |
| | | | | | | |
| | Shares | | Value | |
| | | | | | | |
COMMON STOCKS - 94.1% | | | | | | | |
AUSTRALIA - 6.1% | | | | | | | |
Brambles Ltd. | | | 4,007,030 | | $ | 29,187,565 | |
Fortescue Metals Group Ltd. (a) | | | 2,234,646 | | | 14,979,625 | |
Woodside Petroleum Ltd. | | | 631,708 | | | 27,517,544 | |
Woolworths Ltd. | | | 831,720 | | | 22,967,799 | |
| | | | | | 94,652,533 | |
BRAZIL - 2.2% | | | | | | | |
B2W Companhia Global do Varejo | | | 428,500 | | | 8,131,175 | |
BM&F BOVESPA SA | | | 1,506,500 | | | 11,915,871 | |
OGX Petroleo e Gas Participacoes SA (a) | | | 1,242,100 | | | 14,965,060 | |
| | | | | | 35,012,106 | |
CHINA - 8.8% | | | | | | | |
Baidu, Inc. ADR (a) | | | 505,700 | | | 48,815,221 | |
China Merchants Bank Co., Ltd., Class H | | | 5,522,000 | | | 13,929,481 | |
CNOOC Ltd. | | | 6,109,000 | | | 14,541,420 | |
Hong Kong Exchanges & Clearing Ltd. | | | 915,200 | | | 20,750,030 | |
Li & Fung Ltd. | | | 1,872,000 | | | 10,861,395 | |
Ports Design Ltd. | | | 1,078,000 | | | 2,974,426 | |
Tencent Holdings Ltd. | | | 1,175,000 | | | 25,508,596 | |
| | | | | | 137,380,569 | |
DENMARK - 3.2% | | | | | | | |
Novo Nordisk AS, B Shares | | | 203,697 | | | 22,949,426 | |
Novozymes AS, B Shares | | | 99,518 | | | 13,886,012 | |
Vestas Wind Systems AS (a) | | | 433,940 | | | 13,743,006 | |
| | | | | | 50,578,444 | |
FRANCE - 5.8% | | | | | | | |
Essilor International SA | | | 382,164 | | | 24,623,196 | |
L’Oreal SA | | | 236,246 | | | 26,268,610 | |
PPR | | | 247,726 | | | 39,440,895 | |
| | | | | | 90,332,701 | |
GERMANY - 5.6% | | | | | | | |
Adidas AG | | | 385,561 | | | 25,080,417 | |
Aixtron SE | | | 229,300 | | | 8,545,026 | |
HeidelbergCement AG | | | 204,842 | | | 12,856,487 | |
Q-Cells SE (a) | | | 288,421 | | | 964,890 | |
SAP AG | | | 417,870 | | | 21,312,483 | |
SMA Solar Technology AG | | | 61,880 | | | 5,720,833 | |
TUI AG (a) | | | 880,781 | | | 12,355,649 | |
| | | | | | 86,835,785 | |
INDIA - 1.0% | | | | | | | |
Housing Development Finance Corp. | | | 510,900 | | | 8,317,555 | |
Reliance Capital Ltd. | | | 461,400 | | | 6,894,518 | |
| | | | | | 15,212,073 | |
IRELAND - 0.5% | | | | | | | |
James Hardie Industries SE CDI (a) | | | 1,242,501 | | | 8,615,737 | |
| | | | | | | |
ISRAEL - 1.2% | | | | | | | |
Teva Pharmaceutical Industries Ltd. ADR | | | 369,700 | | | 19,272,461 | |
The accompanying notes are an integral part of the financial statements.
Page 31
| |
PORTFOLIO OF INVESTMENTS (continued) | |
December 31, 2010 | Baillie Gifford EAFE Fund |
| | | | | | | |
| | Shares | | Value | |
| | | | | | | |
JAPAN - 13.9% | | | | | | | |
Canon, Inc. | | | 481,900 | | $ | 24,752,927 | |
Hoya Corp. | | | 530,000 | | | 12,814,973 | |
Japan Tobacco, Inc. | | | 5,175 | | | 19,109,055 | |
Kyocera Corp. | | | 67,500 | | | 6,857,829 | |
Nintendo Co., Ltd. | | | 121,700 | | | 35,530,525 | |
Rakuten, Inc. | | | 45,533 | | | 38,104,318 | |
Rohm Co., Ltd. | | | 159,700 | | | 10,385,720 | |
SMC Corp. | | | 173,300 | | | 29,573,010 | |
Trend Micro, Inc. | | | 298,000 | | | 9,789,867 | |
Yamada Denki Co., Ltd. | | | 226,440 | | | 15,404,988 | |
Yamaha Motor Co., Ltd. (a) | | | 923,000 | | | 14,978,205 | |
| | | | | | 217,301,417 | |
LUXEMBOURG - 0.6% | | | | | | | |
Oriflame Cosmetics SA | | | 173,337 | | | 9,126,705 | |
Reinet Investments SCA (a) | | | 39,281 | | | 683,796 | |
| | | | | | 9,810,501 | |
MEXICO - 0.5% | | | | | | | |
Wal-Mart de Mexico SAB de CV, Series V | | | 2,727,200 | | | 7,792,946 | |
| | | | | | | |
SINGAPORE - 0.6% | | | | | | | |
Singapore Exchange Ltd. | | | 1,342,000 | | | 8,801,232 | |
| | | | | | | |
SOUTH AFRICA - 0.7% | | | | | | | |
Impala Platinum Holdings Ltd. | | | 299,900 | | | 10,621,534 | |
| | | | | | | |
SOUTH KOREA - 1.7% | | | | | | | |
Celltrion, Inc. (a) | | | 245,607 | | | 7,239,901 | |
Samsung Electronics Co., Ltd. | | | 22,300 | | | 18,623,538 | |
| | | | | | 25,863,439 | |
SPAIN - 4.8% | | | | | | | |
Banco Santander SA | | | 4,112,502 | | | 43,822,104 | |
Industria de Diseno Textil SA | | | 408,556 | | | 30,581,864 | |
| | | | | | 74,403,968 | |
SWEDEN - 8.3% | | | | | | | |
Alfa Laval AB | | | 807,204 | | | 17,042,491 | |
Atlas Copco AB, A Shares | | | 2,201,730 | | | 55,579,315 | |
Sandvik AB | | | 1,328,343 | | | 25,918,576 | |
Svenska Handelsbanken AB, A Shares | | | 955,843 | | | 30,554,022 | |
| | | | | | 129,094,404 | |
SWITZERLAND - 6.1% | | | | | | | |
ABB Ltd. (a) | | | 770,546 | | | 17,204,679 | |
Compagnie Financiere Richemont SA, Br A | | | 551,769 | | | 32,446,130 | |
Geberit AG | | | 90,132 | | | 20,840,546 | |
Syngenta AG | | | 86,973 | | | 25,494,730 | |
| | | | | | 95,986,085 | |
TAIWAN - 1.1% | | | | | | | |
Taiwan Semiconductor Manufacturing Co., Ltd. ADR | | | 1,386,806 | | | 17,390,547 | |
| | | | | | | |
TURKEY - 1.4% | | | | | | | |
Turkiye Garanti Bankasi AS | | | 4,385,821 | | | 22,150,123 | |
The accompanying notes are an integral part of the financial statements.
Page 32
| |
PORTFOLIO OF INVESTMENTS (concluded) | |
December 31, 2010 | Baillie Gifford EAFE Fund |
| | | | | | | |
| | Shares | | Value | |
| | | | | | | |
UNITED KINGDOM - 20.0% | | | | | | | |
Autonomy Corp. Plc. (a) | | | 662,300 | | $ | 15,581,376 | |
BG Group Plc. | | | 888,251 | | | 18,018,356 | |
BHP Billiton Plc. | | | 1,357,055 | | | 54,596,597 | |
British American Tobacco Plc. | | | 912,659 | | | 35,106,311 | |
Lloyds Banking Group Plc. (a) | | | 13,015,080 | | | 13,435,463 | |
Meggitt Plc. | | | 3,038,769 | | | 17,581,349 | |
Prudential Plc. | | | 2,463,000 | | | 25,731,423 | |
Rolls-Royce Group Plc., C Shares (a) | | | 168,364,864 | | | 262,496 | |
Rolls-Royce Group Plc. (a) | | | 2,630,701 | | | 25,631,522 | |
SABMiller Plc. | | | 791,000 | | | 27,866,197 | |
Signet Jewelers Ltd. (a) | | | 176,359 | | | 7,591,558 | |
Standard Chartered Plc. | | | 1,611,780 | | | 43,510,943 | |
Tesco Plc. | | | 4,124,570 | | | 27,350,092 | |
| | | | | | 312,263,683 | |
Total Common Stocks | | | | | | | |
(cost $1,124,425,171) | | | | | | 1,469,372,288 | |
| | | | | | | |
PREFERRED STOCKS - 4.0% | | | | | | | |
BRAZIL - 3.5% | | | | | | | |
Itau Unibanco Holding SA ADR | | | 886,280 | | | 21,279,583 | |
Petroleo Brasileiro SA ADR | | | 962,000 | | | 32,871,540 | |
| | | | | | 54,151,123 | |
| | | | | | | |
GERMANY - 0.5% | | | | | | | |
Porsche Automobil Holding SE | | | 110,353 | | | 8,814,630 | |
| | | | | | | |
Total Preferred Stocks | | | | | | | |
(cost $50,090,649) | | | | | | 62,965,753 | |
| | | | | | | |
TOTAL INVESTMENTS - 98.1% | | | | | | | |
(cost $1,174,515,820) | | | | | | 1,532,338,041 | |
Other assets less liabilities - 1.9% | | | | | | 30,315,790 | |
NET ASSETS - 100.0% | | | | | $ | 1,562,653,831 | |
(a) Non-income producing security.
ADR - American Depositary Receipt.
CDI - Chess Depository Interest.
Reg S - is a safe harbor that defines when an offering of securities will be deemed to come to rest abroad and therefore is not subject to the registration obligations imposed under Section 5 of the 1933 Act. The regulation includes two safe harbor provisions: an issuer safe harbor and a resale safe harbor. In each case, the regulation demands that offers and sales of the securities be made outside the United States and that no offering participant (which includes the issuer, the banks assisting with the offer and their respective affiliates) engage in “directed” selling efforts. In the case of issuers for whose securities there is substantial U.S. market interest, the regulation also requires that no offers and sales be made to U.S. persons (including U.S. persons physically located outside the United States).
The accompanying notes are an integral part of the financial statements.
Page 33
| |
STATEMENT OF ASSETS AND LIABILITIES | |
December 31, 2010 | Baillie Gifford EAFE Fund |
| | |
| | | | |
ASSETS | | | | |
Investments, at value (cost $1,174,515,820) | | $ | 1,532,338,041 | |
Cash | | | 33,461,208 | |
Foreign cash, at value (cost $374,889) | | | 376,672 | |
Dividends receivable | | | 949,890 | |
Tax reclaims receivable | | | 441,781 | |
| | | | |
| | | | |
Total Assets | | | 1,567,567,592 | |
| | | | |
| | | | |
LIABILITIES | | | | |
Distributions payable | | | 1,943,215 | |
Management fee payable | | | 925,529 | |
Servicing fee payable | | | 875,217 | |
Payable for investments purchased | | | 751,413 | |
Payable for deferred Indian capital gains tax | | | 62,596 | |
Accrued expenses | | | 355,791 | |
| | | | |
| | | | |
Total Liabilities | | | 4,913,761 | |
| | | | |
| | | | |
NET ASSETS | | $ | 1,562,653,831 | |
| | | | |
| | | | |
COMPOSITION OF NET ASSETS | | | | |
Paid-in capital | | $ | 1,253,490,299 | |
Distributions in excess of net investment income | | | (10,810,628 | ) |
Accumulated net realized loss on investments and foreign currency transactions | | | (37,826,909 | ) |
Net unrealized appreciation in value of investments and foreign currencies (net of deferred Indian capital gains tax) | | | 357,801,069 | |
| | | | |
| | $ | 1,562,653,831 | |
| | | | |
| | | | |
NET ASSET VALUE, PER SHARE | | | | |
| | | | |
Class 1 ($22,567,083 / 2,318,352 shares outstanding), | | | | |
unlimited authorized, no par value | | $ | 9.73 | |
| | | | |
Maximum Purchase Price Per Share (Note D) | | $ | 9.75 | |
| | | | |
Minimum Redemption Price Per Share (Note D) | | $ | 9.72 | |
| | | | |
| | | | |
Class 2 ($923,722,595 / 95,183,371 shares outstanding), unlimited authorized, no par value | | $ | 9.70 | |
| | | | |
Maximum Purchase Price Per Share (Note D) | | $ | 9.72 | |
| | | | |
Minimum Redemption Price Per Share (Note D) | | $ | 9.69 | |
| | | | |
| | | | |
Class 3 ($139,343,692 / 14,331,714 shares outstanding), unlimited authorized, no par value | | $ | 9.72 | |
| | | | |
Maximum Purchase Price Per Share (Note D) | | $ | 9.74 | |
| | | | |
Minimum Redemption Price Per Share (Note D) | | $ | 9.71 | |
| | | | |
| | | | |
Class 4 ($477,020,461 / 48,966,452 shares outstanding), unlimited authorized, no par value | | $ | 9.74 | |
| | | | |
Maximum Purchase Price Per Share (Note D) | | $ | 9.76 | |
| | | | |
Minimum Redemption Price Per Share (Note D) | | $ | 9.73 | |
| | | | |
The accompanying notes are an integral part of the financial statements.
Page 34
| |
STATEMENT OF OPERATIONS | |
For the Year Ended December 31, 2010 | Baillie Gifford EAFE Fund |
| | |
| | | | |
INVESTMENT INCOME | | | | |
Dividends (net of foreign withholding taxes of $1,679,541) | | $ | 21,125,211 | |
Interest | | | 1,559 | |
| | | | |
Total Investment Income | | | 21,126,770 | |
| | | | |
| | | | |
EXPENSES | | | | |
Management fee (Note B) | | | 2,872,552 | |
Shareholder Servicing fees - Class 1 Shares (Note B) | | | 270,466 | |
Shareholder Servicing fees - Class 2 Shares (Note B) | | | 1,625,511 | |
Shareholder Servicing fees - Class 3 Shares (Note B) | | | 160,632 | |
Shareholder Servicing fees - Class 4 Shares (Note B) | | | 688,260 | |
Fund Accounting | | | 607,393 | |
Custody | | | 182,142 | |
Legal | | | 123,048 | |
Professional fees | | | 72,116 | |
Trustees’ fees | | | 46,129 | |
Insurance | | | 33,127 | |
Transfer Agency | | | 28,439 | |
Miscellaneous | | | 23,215 | |
| | | | |
Total Expenses | | | 6,733,030 | |
| | | | |
| | | | |
Net Investment Income | | | 14,393,740 | |
| | | | |
| | | | |
REALIZED AND UNREALIZED GAIN (LOSS) ON INVESTMENTS AND FOREIGN CURRENCY TRANSACTIONS | | | | |
Net realized loss from: | | | | |
Investments | | | (7,107,741 | ) |
Foreign currency transactions | | | (460,171 | ) |
| | | | |
| | | (7,567,912 | ) |
| | | | |
| | | | |
Net change in unrealized appreciation on: | | | | |
Investments (net of deferred Indian capital gains tax of $62,596) | | | 215,058,357 | |
Translation of assets and liabilities in foreign currencies | | | 57,949 | |
| | | | |
| | | 215,116,306 | |
| | | | |
| | | | |
Net realized and unrealized gain on investments and foreign currency transactions | | | 207,548,394 | |
| | | | |
NET INCREASE IN NET ASSETS FROM OPERATIONS | | $ | 221,942,134 | |
| | | | |
The accompanying notes are an integral part of the financial statements.
Page 35
| |
STATEMENTS OF CHANGES IN NET ASSETS | Baillie Gifford EAFE Fund |
| | |
| | | | | | | | |
| | For the
Year Ended
December 31, 2010 | | | For the
Year Ended
December 31, 2009 | |
| | | | | | |
INCREASE IN NET ASSETS FROM OPERATIONS | | | | | | | | |
Net investment income | | $ | 14,393,740 | | | $ | 7,775,047 | |
Net realized loss from investments and foreign currency transactions | | | (7,567,912 | ) | | | (8,014,032 | ) |
Net change in unrealized appreciation on investments and translation of assets and liabilities in foreign currencies | | | 215,116,306 | | | | 214,809,270 | |
| | | | | | | | |
Net increase in net assets from operations | | | 221,942,134 | | | | 214,570,285 | |
| | | | | | | | |
| | | | | | | | |
DIVIDENDS TO SHAREHOLDERS FROM: | | | | | | | | |
Net investment income: | | | | | | | | |
Class 1 | | | (352,363 | ) | | | (224,816 | ) |
Class 2 | | | (13,025,637 | ) | | | (4,958,513 | ) |
Class 3 | | | (2,057,412 | ) | | | - | |
Class 4 | | | (7,188,225 | ) | | | (3,763,419 | ) |
| | | | | | | | |
| | | | | | | | |
Total Dividends | | | (22,623,637 | ) | | | (8,946,748 | ) |
| | | | | | | | |
| | | | | | | | |
TRANSACTIONS IN SHARES OF BENEFICIAL INTEREST | | | | | | | | |
Net proceeds from shares subscribed: | | | | | | | | |
Class 1 | | | 51,397,000 | | | | 167,748,280 | |
Class 2 | | | 421,789,035 | | | | 377,378,652 | |
Class 3 | | | 124,954,270 | | | | - | |
Class 4 | | | 29,940,000 | | | | 280,794,053 | |
Purchase premiums: | | | | | | | | |
Class 1 | | | 45,179 | | | | 119,713 | |
Class 2 | | | 453,389 | | | | 291,783 | |
Class 3 | | | 69,127 | | | | - | |
Class 4 | | | 297,723 | | | | 381,067 | |
Redemption fees: | | | | | | | | |
Class 1 | | | 1,369 | | | | 94 | |
Class 2 | | | 12,409 | | | | 526 | |
Class 3 | | | 1,217 | | | | - | |
Class 4 | | | 8,149 | | | | 672 | |
Dividends reinvested: | | | | | | | | |
Class 1 | | | 352,363 | | | | 224,816 | |
Class 2 | | | 10,917,409 | | | | 4,037,336 | |
Class 3 | | | 2,057,412 | | | | - | |
Class 4 | | | 7,188,225 | | | | 3,763,419 | |
Cost of shares redeemed: | | | | | | | | |
Class 1 | | | (83,366,730 | ) | | | (159,438,020 | ) |
Class 2 | | | (122,918,227 | ) | | | (40,961,159 | ) |
Class 3 | | | - | | | | (230,894,385 | ) |
| | | | | | | | |
Increase in Net Assets from Transactions in Shares of Beneficial Interest | | | 443,199,319 | | | | 403,446,847 | |
| | | | | | | | |
| | | | | | | | |
Total Increase in Net Assets | | | 642,517,816 | | | | 609,070,384 | |
| | | | | | | | |
NET ASSETS | | | | | | | | |
Beginning of year | | | 920,136,015 | | | | 311,065,631 | |
| | | | | | | | |
End of year (including distributions in excess of net investment income of $10,810,628 and $2,123,072, respectively) | | $ | 1,562,653,831 | | | $ | 920,136,015 | |
| | | | | | | | |
The accompanying notes are an integral part of the financial statements.
Page 36
| |
FINANCIAL HIGHLIGHTS | Baillie Gifford EAFE Fund |
| | |
| |
Selected data for a Class 1 Share outstanding throughout each period: |
| | | | | |
| | For the
Year Ended
December 31, 2010 | | For the Period
January 2, 2009(a)
through
December 31, 2009 | |
| | | | | |
Net asset value, beginning of period | | $8.47 | | $6.01 | |
| | | | | |
| | | | | |
From Investment Operations | | | | | |
Net investment income(b) | | 0.14 | | 0.12 | |
Net realized and unrealized gain on investments and foreign currency transactions | | 1.23 | | 2.36 | |
| | | | | |
Net increase in net asset value from investment operations | | 1.37 | | 2.48 | |
| | | | | |
| | | | | |
Dividends to Shareholders | | | | | |
Dividends from net investment income | | (0.12) | | (0.03) | |
| | | | | |
| | | | | |
Proceeds from Purchase Premiums and Redemption Fees | | 0.01 | | 0.01 | |
| | | | | |
| | | | | |
Net asset value, end of period | | $9.73 | | $8.47 | |
| | | | | |
| | | | | |
Total Return | | | | | |
Total investment return based on net asset value(c) | | 16.36% | | 41.49% | |
| | | | | |
Ratios/Supplemental Data | | | | | |
Net assets, end of period (000’s omitted) | | $22,567 | | $41,798 | |
Ratio of net expenses to average net assets | | 0.79% | | 0.84%*(d) | |
Ratio of net investment income to average net assets | | 1.52% | | 1.61%* | |
Portfolio turnover rate | | 13% | | 9% | |
| |
* | Annualized. |
(a) | Commencement of investment operations. |
(b) | Calculated based upon average shares outstanding during the period. |
(c) | Total investment return is calculated assuming an initial investment made at the net asset value at the beginning of the period, reinvestment of all dividends and distributions, if any, at net asset value during the period, and redemption on the last day of the period. Total return is not annualized for periods less than one year. |
(d) | The Manager had contractually agreed to waive its fees and/or bear other expenses through March 31, 2009 to the extent that such Fund’s total annual operating expenses (excluding interest, taxes and extraordinary expenses) exceeded 0.98% for Class 1 Shares. |
The accompanying notes are an integral part of the financial statements.
Page 37
| |
FINANCIAL HIGHLIGHTS | Baillie Gifford EAFE Fund |
| | |
| |
Selected data for a Class 2 Share outstanding throughout each period: |
| | | | | | | |
| | For the
Year Ended
December 31, 2010 | | For the
Year Ended
December 31, 2009 | | For the Period
March 6, 2008(a)
through
December 31, 2008 | |
| | | | | | | |
Net asset value, beginning of period | | $8.44 | | $5.85 | | $10.00 | |
| | | | | | | |
| | | | | | | |
From Investment Operations | | | | | | | |
Net investment income(b) | | 0.10 | | 0.07 | | 0.10 | |
| | | | | | | |
Net realized and unrealized gain (loss) on investments and foreign currency transactions | | 1.29 | | 2.60 | | (4.20) | |
| | | | | | | |
Net increase (decrease) in net asset value from investment operations | | 1.39 | | 2.67 | | (4.10) | |
| | | | | | | |
| | | | | | | |
Dividends to Shareholders | | | | | | | |
Dividends from net investment income | | (0.14) | | (0.09) | | (0.07) | |
| | | | | | | |
| | | | | | | |
Proceeds from Purchase Premiums and Redemption Fees | | 0.01 | | 0.01 | | 0.02 | |
| | | | | | | |
| | | | | | | |
Net asset value, end of period | | $9.70 | | $8.44 | | $5.85 | |
| | | | | | | |
| | | | | | | |
Total Return | | | | | | | |
Total investment return based on net asset value(c) | | 16.60% | | 45.75% | | (40.79)% | |
| | | | | | | |
Ratios/Supplemental Data | | | | | | | |
Net assets, end of period (000’s omitted) | | $923,723 | | $499,797 | | $86,508 | |
Ratio of net expenses to average net assets | | 0.62% | | 0.65%(d) | | 0.75%*(d) | |
Ratio of net investment income to average net assets | | 1.14% | | 0.95% | | 1.75%* | |
Portfolio turnover rate | | 13% | | 9% | | 16% | |
| |
* | Annualized. |
(a) | Commencement of investment operations. |
(b) | Calculated based upon average shares outstanding during the period. |
(c) | Total investment return is calculated assuming an initial investment made at the net asset value at the beginning of the period, reinvestment of all dividends and distributions, if any, at net asset value during the period, and redemption on the last day of the period. Total return is not annualized for periods less than one year. |
(d) | The Manager had contractually agreed to waive its fees and/or bear other expenses through March 31, 2009 to the extent that such Fund’s total annual operating expenses (excluding interest, taxes and extraordinary expenses) exceeded 0.80% for Class 2 Shares. |
The accompanying notes are an integral part of the financial statements.
Page 38
| |
FINANCIAL HIGHLIGHTS | Baillie Gifford EAFE Fund |
| | |
| |
Selected data for a Class 3 Share outstanding throughout each period: |
| | | | | | | |
| | For the Period
April 19, 2010(c)
through
December 31, 2010 | | For the Period
January 1, 2009
through
January 5, 2009(b) | | For the Period
April 28, 2009
through
December 31, 2009(a) | |
| | | | | | | |
Net asset value, beginning of period | | $8.87 | | $5.86 | | $10.67 | |
| | | | | | | |
| | | | | | | |
From Investment Operations | | | | | | | |
Net investment income (loss)(d) | | 0.08 | | (0.00)(f) | | 0.09 | |
Net realized and unrealized gain on investments and foreign currency transactions | | 0.91 | | 0.17 | | (4.85) | |
| | | | | | | |
Net increase in net asset value from investment operations | | 0.99 | | 0.17 | | (4.76) | |
| | | | | | | |
| | | | | | | |
Dividends to Shareholders | | | | | | | |
Dividends from net investment income | | (0.15) | | - | | (0.08) | |
| | | | | | | |
| | | | | | | |
Proceeds from Purchase Premiums | | 0.01 | | - | | 0.03 | |
| | | | | | | |
| | | | | | | |
Net asset value, end of period | | $9.72 | | $6.03(b) | | $5.86 | |
| | | | | | | |
| | | | | | | |
Total Return | | | | | | | |
Total investment return based on net asset value(e) | | 11.25% | | 2.90% | | (44.37)% | |
| | | | | | | |
Ratios/Supplemental Data | | | | | | | |
Net assets, end of period (000’s omitted) | | $139,344 | | $ -(b) | | $224,557 | |
Ratio of net expenses to average net assets | | 0.56%* | | 0.57%* | | 0.67%* | |
Ratio of net investment income (loss) to average net assets | | 1.26%* | | (0.21)%* | | 1.85%* | |
Portfolio turnover rate | | 13% | | 9% | | 16% | |
| |
* | Annualized. |
(a) | Commencement of investment operations. |
(b) | Class had no shareholders from January 6, 2009 to April 18, 2010. All shares of this class were redeemed at $6.03 on January 5, 2009. New shares were issued at $8.87 on April 19, 2010. |
(c) | Recommencement of investment operations. |
(d) | Calculated based upon average shares outstanding during the period. |
(e) | Total investment return is calculated assuming an initial investment made at the net asset value at the beginning of the period, reinvestment of all dividends and distributions, if any, at net asset value during the period, and redemption on the last day of the period. Total return is not annualized for periods less than one year. |
(f) | Rounds to less than $0.005 per share. |
The accompanying notes are an integral part of the financial statements.
Page 39
| |
FINANCIAL HIGHLIGHTS | Baillie Gifford EAFE Fund |
| | |
| |
Selected data for a Class 4 Share outstanding throughout each period: |
| | | | | |
| | For the
Year Ended
December 31, 2010 | | For the Period
January 2, 2009(a)
through
December 31, 2009 | |
| | | | | |
Net asset value, beginning of period | | $8.47 | | $6.03 | |
| | | | | |
| | | | | |
From Investment Operations | | | | | |
Net investment income(b) | | 0.12 | | 0.11 | |
Net realized and unrealized gain on investments and foreign currency transactions | | 1.29 | | 2.41 | |
| | | | | |
| | | | | |
Net increase in net asset value from investment operations | | 1.41 | | 2.52 | |
| | | | | |
| | | | | |
Dividends to Shareholders | | | | | |
Dividends from net investment income | | (0.15) | | (0.09) | |
| | | | | |
| | | | | |
Proceeds from Purchase Premiums and Redemption Fees | | 0.01 | | 0.01 | |
| | | | | |
| | | | | |
Net asset value, end of period | | $9.74 | | $8.47 | |
| | | | | |
| | | | | |
Total Return | | | | | |
Total investment return based on net asset value(c) | | 16.77% | | 41.89% | |
| | | | | |
Ratios/Supplemental Data | | | | | |
Net assets, end of period (000’s omitted) | | $477,020 | | $378,541 | |
Ratio of net expenses to average net assets | | 0.52% | | 0.55%*(d) | |
Ratio of net investment income to average net assets | | 1.38% | | 1.67%* | |
Portfolio turnover rate | | 13% | | 9% | |
| |
* | Annualized. |
(a) | Commencement of investment operations. |
(b) | Calculated based upon average shares outstanding during the period. |
(c) | Total investment return is calculated assuming an initial investment made at the net asset value at the beginning of the period, reinvestment of all dividends and distributions, if any, at net asset value during the period, and redemption on the last day of the period. Total return is not annualized for periods less than one year. |
(d) | The Manager had contractually agreed to waive its fees and/or bear other expenses through March 31, 2009 to the extent that such Fund’s total annual operating expenses (excluding interest, taxes and extraordinary expenses) exceeded 0.70% for Class 4 Shares. |
The accompanying notes are an integral part of the financial statements.
Page 40
| |
INDUSTRY DIVERSIFICATION TABLE | |
December 31, 2010 (unaudited) | Baillie Gifford EAFE Choice Fund |
| | | | | | | | |
| | Value | | | % of Total
Net Assets | |
| | | | | | | | |
Apparel | | $ | 3,543,423 | | | | 3.5 | % |
Auto Manufacturers | | | 2,387,467 | | | | 2.3 | |
Banks | | | 11,129,236 | | | | 10.9 | |
Beverages, Food & Tobacco | | | 5,456,852 | | | | 5.3 | |
Biotechnology | | | 1,933,116 | | | | 1.9 | |
Chemicals | | | 1,115,095 | | | | 1.1 | |
Commercial Services | | | 3,573,205 | | | | 3.5 | |
Construction & Building Materials | | | 1,529,999 | | | | 1.5 | |
Cosmetics/Personal Care | | | 1,711,322 | | | | 1.7 | |
Distribution/Wholesale | | | 941,554 | | | | 0.9 | |
Diversified Financial Services | | | 2,739,026 | | | | 2.7 | |
Diversified Industrials | | | 3,372,398 | | | | 3.3 | |
Electronic & Electrical Equipment | | | 6,134,254 | | | | 6.0 | |
Engineering & Machinery | | | 7,394,617 | | | | 7.2 | |
Food Producers & Processors | | | 4,291,118 | | | | 4.2 | |
Healthcare - Products | | | 3,644,534 | | | | 3.5 | |
Insurance | | | 654,022 | | | | 0.6 | |
Internet | | | 2,833,119 | | | | 2.8 | |
Investment Companies | | | 2,068,790 | | | | 2.0 | |
Media & Photography | | | 1,206,397 | | | | 1.2 | |
Mining & Metals | | | 2,350,255 | | | | 2.3 | |
Motorcycles | | | 1,215,458 | | | | 1.2 | |
Office/Business Equipment | | | 2,820,043 | | | | 2.8 | |
Oil & Gas | | | 8,766,982 | | | | 8.6 | |
Pharmaceuticals | | | 5,617,197 | | | | 5.5 | |
Real Estate | | | 2,467,170 | | | | 2.4 | |
Retailers - General | | | 2,147,124 | | | | 2.1 | |
Semiconductors | | | 2,793,269 | | | | 2.7 | |
Software | | | 1,017,454 | | | | 1.0 | |
Telecommunication Services | | | 975,138 | | | | 0.9 | |
Toys/Games/Hobbies | | | 1,202,660 | | | | 1.2 | |
Transportation | | | 1,238,011 | | | | 1.2 | |
Travel & Leisure | | | 1,177,506 | | | | 1.1 | |
| | | | | | | | |
Total Value of Investments | | | 101,447,811 | | | | 99.1 | |
Other assets less liabilities | | | 961,009 | | | | 0.9 | |
Net Assets | | $ | 102,408,820 | | | | 100.0 | % |
Page 41
| |
PORTFOLIO OF INVESTMENTS | |
December 31, 2010 | Baillie Gifford EAFE Choice Fund |
| | | | | | | | |
| | Shares | | | Value | |
| | | | | | | | |
COMMON STOCKS - 97.7% | | | | | | | | |
AUSTRALIA - 5.7% | | | | | | | | |
Aristocrat Leisure Ltd. | | | 384,745 | | | $ | 1,177,506 | |
Billabong International Ltd. | | | 116,049 | | | | 967,731 | |
Brambles Ltd. | | | 192,355 | | | | 1,401,131 | |
Cochlear Ltd. | | | 17,536 | | | | 1,443,553 | |
Woolworths Ltd. | | | 30,971 | | | | 855,259 | |
| | | | | | | 5,845,180 | |
BELGIUM - 2.7% | | | | | | | | |
Colruyt SA | | | 21,375 | | | | 1,086,989 | |
Groupe Bruxelles Lambert SA | | | 19,954 | | | | 1,678,900 | |
| | | | | | | 2,765,889 | |
BERMUDA - 1.1% | | | | | | | | |
Midland Holdings Ltd. | | | 238,000 | | | | 195,052 | |
Seadrill Ltd. | | | 26,858 | | | | 916,212 | |
| | | | | | | 1,111,264 | |
CHINA - 3.6% | | | | | | | | |
BOC Hong Kong (Holdings) Ltd. | | | 299,000 | | | | 1,016,757 | |
China Merchants Bank Co., Ltd., Class H | | | 167,000 | | | | 421,265 | |
Esprit Holdings Ltd. | | | 149,100 | | | | 709,254 | |
Hang Lung Properties Ltd. | | | 196,000 | | | | 916,109 | |
Hong Kong Exchanges & Clearing Ltd. | | | 28,600 | | | | 648,438 | |
| | | | | | | 3,711,823 | |
DENMARK - 6.1% | | | | | | | | |
A P Moller - Maersk AS, B Shares | | | 63 | | | | 570,380 | |
Carlsberg AS, Class B | | | 16,963 | | | | 1,702,670 | |
Danisco AS | | | 9,457 | | | | 867,306 | |
Jyske Bank AS (a) | | | 28,626 | | | | 1,335,931 | |
Novo Nordisk AS, B Shares | | | 9,500 | | | | 1,070,313 | |
Novozymes AS, B Shares | | | 4,742 | | | | 661,664 | |
| | | | | | | 6,208,264 | |
FINLAND - 2.1% | | | | | | | | |
Kone Oyj, Class B | | | 20,605 | | | | 1,144,452 | |
Nokia Corp. | | | 94,136 | | | | 975,138 | |
| | | | | | | 2,119,590 | |
FRANCE - 5.0% | | | | | | | | |
BioMerieux | | | 8,327 | | | | 821,776 | |
Legrand SA | | | 21,826 | | | | 890,283 | |
L’Oreal SA | | | 7,753 | | | | 862,070 | |
Neopost SA | | | 10,544 | | | | 919,528 | |
Total SA | | | 30,034 | | | | 1,599,687 | |
| | | | | | | 5,093,344 | |
GERMANY - 3.7% | | | | | | | | |
Adidas AG | | | 16,988 | | | | 1,105,055 | |
Celesio AG | | | 54,007 | | | | 1,345,882 | |
Deutsche Boerse AG | | | 9,275 | | | | 640,820 | |
Deutsche Post AG | | | 39,353 | | | | 667,632 | |
| | | | | | | 3,759,389 | |
INDIA - 1.0% | | | | | | | | |
Mahindra & Mahindra Ltd. GDR | | | 57,886 | | | | 1,027,477 | |
| | | | | | | | |
ITALY - 0.4% | | | | | | | | |
Intesa Sanpaolo SpA | | | 136,338 | | | | 370,654 | |
The accompanying notes are an integral part of the financial statements.
Page 42
| |
PORTFOLIO OF INVESTMENTS (continued) | |
December 31, 2010 | Baillie Gifford EAFE Choice Fund |
| | | | | | | | |
| | Shares | | | Value | |
| | | | | | | | |
JAPAN - 18.9% | | | | | | | | |
Asahi Breweries Ltd. | | | 23,700 | | | $ | 457,425 | |
Canon, Inc. | | | 37,000 | | | | 1,900,515 | |
Chugai Pharmaceutical Co., Ltd. | | | 37,700 | | | | 690,306 | |
Fast Retailing Co., Ltd. | | | 4,800 | | | | 761,383 | |
Hitachi High-Technologies Corp. | | | 17,600 | | | | 410,092 | |
INPEX Corp. | | | 178 | | | | 1,039,412 | |
Japan Tobacco, Inc. | | | 475 | | | | 1,753,971 | |
Kao Corp. | | | 31,600 | | | | 849,252 | |
Kyocera Corp. | | | 8,600 | | | | 873,738 | |
Mitsubishi Electric Corp. | | | 80,000 | | | | 835,942 | |
Mitsui & Co., Ltd. | | | 32,300 | | | | 531,462 | |
MS&AD Insurance Group Holdings, Inc. | | | 26,200 | | | | 654,022 | |
NAMCO BANDAI Holdings, Inc. | | | 112,200 | | | | 1,202,660 | |
Olympus Corp. | | | 19,600 | | | | 590,159 | |
Rakuten, Inc. (a) | | | 1,097 | | | | 918,025 | |
Rohm Co., Ltd. | | | 14,300 | | | | 929,967 | |
SMC Corp. | | | 5,400 | | | | 921,490 | |
Sumitomo Realty & Development Co., Ltd. | | | 57,000 | | | | 1,356,009 | |
THK Co., Ltd. | | | 42,200 | | | | 965,233 | |
Trend Micro, Inc. (a) | | | 14,500 | | | | 476,352 | |
Yamaha Motor Co., Ltd. (a) | | | 74,900 | | | | 1,215,458 | |
| | | | | | | 19,332,873 | |
NETHERLANDS - 1.5% | | | | | | | | |
ASML Holding NV | | | 15,225 | | | | 583,912 | |
QIAGEN NV (a) | | | 46,062 | | | | 904,056 | |
| | | | | | | 1,487,968 | |
SINGAPORE - 3.1% | | | | | | | | |
DBS Group Holdings Ltd. | | | 80,000 | | | | 892,925 | |
Keppel Corp., Ltd. | | | 95,000 | | | | 838,239 | |
United Overseas Bank Ltd. | | | 105,000 | | | | 1,490,052 | |
| | | | | | | 3,221,216 | |
SOUTH AFRICA - 1.5% | | | | | | | | |
Clicks Group Ltd. | | | 160,968 | | | | 1,060,136 | |
Lonmin Plc. (a) | | | 14,814 | | | | 456,008 | |
| | | | | | | 1,516,144 | |
SOUTH KOREA - 0.9% | | | | | | | | |
Samsung Electronics Co., Ltd. GDR Reg S (a) | | | 2,300 | | | | 961,627 | |
| | | | | | | | |
SPAIN - 1.7% | | | | | | | | |
Banco Popular Espanol SA | | | 134,109 | | | | 691,513 | |
Corporacion Financiera Alba SA | | | 21,110 | | | | 1,085,626 | |
| | | | | | | 1,777,139 | |
SWEDEN - 7.1% | | | | | | | | |
Atlas Copco AB, B Shares | | | 119,574 | | | | 2,706,832 | |
Investor AB, B Shares | | | 45,946 | | | | 983,164 | |
Scania AB, B Shares | | | 59,081 | | | | 1,359,990 | |
Svenska Handelsbanken AB, A Shares | | | 70,420 | | | | 2,251,012 | |
| | | | | | | 7,300,998 | |
SWITZERLAND - 9.4% | | | | | | | | |
Geberit AG | | | 6,617 | | | | 1,529,999 | |
Nestle SA | | | 42,288 | | | | 2,477,386 | |
Roche Holding AG | | | 17,127 | | | | 2,510,696 | |
Schindler Holding AG | | | 14,004 | | | | 1,656,610 | |
UBS AG (a) | | | 88,300 | | | | 1,449,768 | |
| | | | | | | 9,624,459 | |
The accompanying notes are an integral part of the financial statements.
Page 43
| |
PORTFOLIO OF INVESTMENTS (continued) | |
December 31, 2010 | Baillie Gifford EAFE Choice Fund |
| | | | | | | | |
| | Shares | | | Value | |
| | | | | | | | |
TAIWAN - 2.2% | | | | | | | | |
Hon Hai Precision Industry Co., Ltd. GDR Reg S | | | 121,352 | | | $ | 970,816 | |
Taiwan Semiconductor Manufacturing Co., Ltd. ADR | | | 99,500 | | | | 1,247,730 | |
| | | | | | | 2,218,546 | |
TURKEY - 0.9% | | | | | | | | |
Turkiye Garanti Bankasi AS | | | 178,400 | | | | 900,990 | |
| | | | | | | | |
UNITED KINGDOM - 16.4% | | | | | | | | |
AMEC Plc. | | | 41,000 | | | | 737,341 | |
ASOS Plc. (a) | | | 46,800 | | | | 1,164,961 | |
Autonomy Corp. Plc. (a) | | | 23,000 | | | | 541,102 | |
BG Group Plc. | | | 58,000 | | | | 1,176,542 | |
BHP Billiton Plc. | | | 25,000 | | | | 1,005,792 | |
Cairn Energy Plc. (a) | | | 198,160 | | | | 1,300,944 | |
Capita Group Plc. | | | 69,000 | | | | 750,410 | |
Hays Plc. | | | 238,500 | | | | 481,578 | |
Imperial Tobacco Group Plc. | | | 34,000 | | | | 1,045,146 | |
Intertek Group Plc. | | | 34,000 | | | | 940,086 | |
John Wood Group Plc. | | | 146,800 | | | | 1,286,108 | |
Johnson Matthey Plc. | | | 35,000 | | | | 1,115,095 | |
Kazakhmys Plc. | | | 35,000 | | | | 888,455 | |
Pearson Plc. | | | 46,000 | | | | 724,919 | |
Reed Elsevier Plc. | | | 57,000 | | | | 481,478 | |
Rightmove Plc. | | | 61,640 | | | | 750,133 | |
Smith & Nephew Plc. | | | 45,000 | | | | 475,148 | |
Standard Chartered Plc. | | | 38,000 | | | | 1,025,832 | |
Unilever Plc. | | | 30,812 | | | | 946,425 | |
| | | | | | | 16,837,495 | |
UNITED STATES - 2.7% | | | | | | | | |
Central European Distribution Corp. (a) | | | 21,731 | | | | 497,640 | |
Mettler-Toledo International, Inc. (a) | | | 6,900 | | | | 1,043,349 | |
Protalix BioTherapeutics, Inc. (a) | | | 127,400 | | | | 1,271,452 | |
| | | | | | | 2,812,441 | |
Total Common Stocks
(cost $89,749,016) | | | | | | | 100,004,770 | |
| | | | | | | | |
PREFERRED STOCKS - 1.4% | | | | | | | | |
BRAZIL - 1.4% | | | | | | | | |
Itau Unibanco Holding SA ADR | | | 30,500 | | | | 732,305 | |
Petroleo Brasileiro SA ADR | | | 20,800 | | | | 710,736 | |
| | | | | | | | |
Total Preferred Stocks
(cost $1,497,391) | | | | | | | 1,443,041 | |
| | | | | | | | |
TOTAL INVESTMENTS - 99.1%
(cost $91,246,407) | | | | | | | 101,447,811 | |
Other assets less liabilities - 0.9% | | | | | | | 961,009 | |
NET ASSETS - 100.0% | | | | | | $ | 102,408,820 | |
(a) Non-income producing security.
ADR - American Depositary Receipt.
GDR - Global Depositary Receipt.
The accompanying notes are an integral part of the financial statements.
Page 44
| |
PORTFOLIO OF INVESTMENTS (concluded) | |
December 31, 2010 | Baillie Gifford EAFE Choice Fund |
Reg S - is a safe harbor that defines when an offering of securities will be deemed to come to rest abroad and therefore is not subject to the registration obligations imposed under Section 5 of the 1933 Act. The regulation includes two safe harbor provisions: an issuer safe harbor and a resale safe harbor. In each case, the regulation demands that offers and sales of the securities be made outside the United States and that no offering participant (which includes the issuer, the banks assisting with the offer and their respective affiliates) engage in “directed” selling efforts. In the case of issuers for whose securities there is substantial U.S. market interest, the regulation also requires that no offers and sales be made to U.S. persons (including U.S. persons physically located outside the United States).
The accompanying notes are an integral part of the financial statements.
Page 45
| |
STATEMENT OF ASSETS AND LIABILITIES | |
December 31, 2010 | Baillie Gifford EAFE Choice Fund |
| |
| | | | |
ASSETS | | | | |
Investments, at value (cost $91,246,407) | | $ | 101,447,811 | |
Cash | | | 390,356 | |
Foreign cash, at value (cost $778,607) | | | 789,974 | |
Dividends receivable | | | 90,468 | |
Tax reclaims receivable | | | 68,913 | |
| | | | |
| | | | |
Total Assets | | | 102,787,522 | |
| | | | |
| | | | |
LIABILITIES | | | | |
Payable for investments purchased | | | 219,976 | |
Management fee payable | | | 62,274 | |
Servicing fee payable | | | 57,735 | |
Accrued expenses | | | 38,717 | |
| | | | |
| | | | |
Total Liabilities | | | 378,702 | |
| | | | |
| | | | |
NET ASSETS | | $ | 102,408,820 | |
| | | | |
| | | | |
COMPOSITION OF NET ASSETS | | | | |
Paid-in capital | | $ | 92,203,226 | |
Distributions in excess of net investment income | | | (205,045 | ) |
Accumulated net realized gain on investments and foreign currency transactions | | | 193,451 | |
Net unrealized appreciation in value of investments and foreign currencies | | | 10,217,188 | |
| | | | |
| | $ | 102,408,820 | |
| | | | |
| | | | |
NET ASSET VALUE, PER SHARE | | | | |
| | | | |
Class 2 ($46,487,222 / 4,135,077 shares outstanding), | | | | |
unlimited authorized, no par value | | $ | 11.24 | |
| | | | |
Maximum Purchase Price Per Share (Note D) | | $ | 11.26 | |
| | | | |
Minimum Redemption Price Per Share (Note D) | | $ | 11.22 | |
| | | | |
| | | | |
Class 3 ($55,921,598 / 4,895,591 shares outstanding), | | | | |
unlimited authorized, no par value | | $ | 11.42 | |
| | | | |
Maximum Purchase Price Per Share (Note D) | | $ | 11.44 | |
| | | | |
Minimum Redemption Price Per Share (Note D) | | $ | 11.40 | |
| | | | |
The accompanying notes are an integral part of the financial statements.
Page 46
| |
STATEMENT OF OPERATIONS | |
For the Year Ended December 31, 2010 | Baillie Gifford EAFE Choice Fund |
| |
| | | | |
INVESTMENT INCOME | | | | |
Dividends (net of foreign withholding taxes of $164,804) | | $ | 1,670,715 | |
Interest | | | 782 | |
| | | | |
Total Investment Income | | | 1,671,497 | |
| | | | |
| | | | |
EXPENSES | | | | |
Management fee (Note B) | | | 186,563 | |
Shareholder Servicing fees - Class 2 Shares (Note B) | | | 87,556 | |
Shareholder Servicing fees - Class 3 Shares (Note B) | | | 82,515 | |
Fund Accounting | | | 65,012 | |
Custody | | | 30,007 | |
Legal | | | 14,111 | |
Transfer Agency | | | 11,989 | |
Trustees’ fees | | | 3,177 | |
Professional fees | | | 2,440 | |
Insurance | | | 2,132 | |
Miscellaneous | | | 2,813 | |
| | | | |
Total Expenses | | | 488,315 | |
| | | | |
| | | | |
Net Investment Income | | | 1,183,182 | |
| | | | |
| | | | |
REALIZED AND UNREALIZED GAIN (LOSS) ON INVESTMENTS AND FOREIGN CURRENCY TRANSACTIONS | | | | |
Net realized gain (loss) from: | | | | |
Investments | | | 233,254 | |
Foreign currency transactions | | | (87,253 | ) |
| | | | |
| | | 146,001 | |
| | | | |
| | | | |
Net change in unrealized appreciation on: | | | | |
Investments | | | 9,709,904 | |
Translation of assets and liabilities in foreign currencies | | | 16,008 | |
| | | | |
| | | 9,725,912 | |
| | | | |
| | | | |
| | | | |
Net realized and unrealized gain on investments and foreign currency transactions | | | 9,871,913 | |
| | | | |
NET INCREASE IN NET ASSETS FROM OPERATIONS | | $ | 11,055,095 | |
| | | | |
The accompanying notes are an integral part of the financial statements.
Page 47
| |
STATEMENTS OF CHANGES IN NET ASSETS | Baillie Gifford EAFE Choice Fund |
| |
| | | | | | | | |
| | For the
Year Ended
December 31, 2010 | | | For the Period
December 17, 2009*
through
December 31, 2009 | |
| | | | |
INCREASE IN NET ASSETS FROM OPERATIONS | | | | | | | | |
Net investment income | | $ | 1,183,182 | | | $ | 5,114 | |
Net realized gain (loss) from investments and foreign currency transactions | | | 146,001 | | | | (42,665 | ) |
Net change in unrealized appreciation on investments and translation of assets and liabilities in foreign currencies | | | 9,725,912 | | | | 491,276 | |
| | | | | | | | |
Net increase in net assets from operations | | | 11,055,095 | | | | 453,725 | |
| | | | | | | | |
| | | | | | | | |
DIVIDENDS TO SHAREHOLDERS FROM: | | | | | | | | |
Net investment income: | | | | | | | | |
Class 2 | | | (578,172 | ) | | | (7,407 | ) |
Class 3 | | | (717,647 | ) | | | - | |
| | | | | | | | |
| | | | | | | | |
Total Dividends | | | (1,295,819 | ) | | | (7,407 | ) |
| | | | | | | | |
| | | | | | | | |
TRANSACTIONS IN SHARES OF BENEFICIAL INTEREST | | | | | | | | |
Net proceeds from shares subscribed: | | | | | | | | |
Class 2 | | | 41,317,200 | | | | 30,000,000 | |
Class 3 | | | 50,906,024 | | | | - | |
Purchase premiums: | | | | | | | | |
Class 2 | | | 53,804 | | | | - | |
Class 3 | | | 58,067 | | | | - | |
Dividends reinvested: | | | | | | | | |
Class 2 | | | 578,172 | | | | 7,407 | |
Class 3 | | | 717,647 | | | | - | |
Cost of shares redeemed: | | | | | | | | |
Class 2 | | | (31,435,095 | ) | | | - | |
| | | | | | | | |
| | | | | | | | |
| | | | | | | | |
Increase in Net Assets from Transactions in Shares of Beneficial Interest | | | 62,195,819 | | | | 30,007,407 | |
| | | | | | | | |
| | | | | | | | |
Total Increase in Net Assets | | | 71,955,095 | | | | 30,453,725 | |
| | | | | | | | |
NET ASSETS | | | | | | | | |
Beginning of period | | | 30,453,725 | | | | - | |
| | | | | | | | |
End of period (including distributions in excess of net investment income of $205,045 and $44,958, respectively) | | $ | 102,408,820 | | | $ | 30,453,725 | |
| | | | | | | | |
* Commencement of investment operations.
The accompanying notes are an integral part of the financial statements.
Page 48
| |
FINANCIAL HIGHLIGHTS | Baillie Gifford EAFE Choice Fund |
| |
Selected data for a Class 2 Share outstanding throughout each period:
| | | | |
| | For the
Period Ended
December 31, 2010(a) | | For the Period
December 17, 2009(b)
through
December 31, 2009 |
| | | | |
Net asset value, beginning of period | | $10.15 | | $10.00 |
| | | | |
| | | | |
From Investment Operations | | | | |
Net investment income(c) | | 0.13 | | 0.00@ |
Net realized and unrealized gain on investments and foreign currency transactions | | 1.37 | | 0.15 |
| | | | |
| | | | |
Net increase in net asset value from investment operations | | 1.50 | | 0.15 |
| | | | |
| | | | |
Change in NAV During Period of Inactivity(a) | | (0.28) | | - |
| | | | |
| | | | |
Dividends to Shareholders | | | | |
Dividends from net investment income | | (0.14) | | (0.00)@ |
| | | | |
| | | | |
Proceeds from Purchase Premiums | | 0.01 | | - |
| | | | |
| | | | |
Net asset value, end of period | | $11.24 | | $10.15 |
| | | | |
Total Return | | | | |
Total investment return based on net asset value(d) | | 15.22% | | 1.52% |
| | | | |
Ratios/Supplemental Data | | | | |
Net assets, end of period (000’s omitted) | | $46,487 | | $30,454 |
Ratio of net expenses to average net assets | | 0.71%* | | 0.82%* |
Ratio of net investment income to average net assets | | 1.53%* | | 0.41%* |
Portfolio turnover rate | | 20% | | 0% |
| |
* | Annualized. |
@ | Amount is less than $0.005. |
(a) | For the period January 1, 2010 to January 15, 2010 and March 25, 2010 to December 31, 2010. Class had no shareholders from January 16, 2010 to March 24, 2010. All shares of this Class were redeemed at $10.48 on January 19, 2010. New shares were issued at $10.20 on March 25, 2010. |
(b) | Commencement of investment operations. |
(c) | Calculated based upon average shares outstanding during the period. |
(d) | Total investment return is calculated assuming an initial investment made at the net asset value at the beginning of the period, reinvestment of all dividends and distributions, if any, at net asset value during the period, and redemption on the last day of the period. Total return is not annualized for periods less than one year. |
The accompanying notes are an integral part of the financial statements.
Page 49
| |
FINANCIAL HIGHLIGHTS | Baillie Gifford EAFE Choice Fund |
| |
Selected data for a Class 3 Share outstanding throughout the period:
| | |
| | For the Period
January 15, 2010(a)
through
December 31, 2010 |
| | |
Net asset value, beginning of period | | $10.48 |
| | |
| | |
From Investment Operations | | |
Net investment income(b) | | 0.16 |
Net realized and unrealized gain on investments and foreign currency transactions | | 0.92 |
| | |
| | |
Net increase in net asset value from investment operations | | 1.08 |
| | |
| | |
Dividends to Shareholders | | |
Dividends from net investment income | | (0.15) |
| | |
| | |
Proceeds from Purchase Premiums | | 0.01 |
| | |
| | |
Net asset value, end of period | | $11.42 |
| | |
| | |
Total Return | | |
Total investment return based on net asset value(c) | | 10.40% |
| | |
Ratios/Supplemental Data | | |
Net assets, end of period (000’s omitted) | | $55,922 |
Ratio of net expenses to average net assets | | 0.63%* |
Ratio of net investment income to average net assets | | 1.66%* |
Portfolio turnover rate | | 20% |
| |
* | Annualized. |
(a) | Commencement of investment operations. |
(b) | Calculated based upon average shares outstanding during the period. |
(c) | Total investment return is calculated assuming an initial investment made at the net asset value at the beginning of the period, reinvestment of all dividends and distributions, if any, at net asset value during the period, and redemption on the last day of the period. Total return is not annualized for periods less than one year. |
The accompanying notes are an integral part of the financial statements.
Page 50
| |
INDUSTRY DIVERSIFICATION TABLE | |
December 31, 2010 (unaudited) | Baillie Gifford Emerging Markets Fund |
| | |
| | | | | | | | | |
| | Value | | % of Total
Net Assets | |
| | | | | |
| | | | | | | |
Auto Manufacturers | | $ | | 22,012,437 | | | 4.7 | % | |
Banks | | | | 57,790,066 | | | 12.3 | | |
Computers | | | | 3,952,461 | | | 0.8 | | |
Construction & Building Materials | | | | 20,223,153 | | | 4.3 | | |
Diversified Financial Services | | | | 21,626,947 | | | 4.6 | | |
Diversified Industrials | | | | 3,576,750 | | | 0.8 | | |
Electronic & Electrical Equipment | | | | 61,697,386 | | | 13.2 | | |
Energy - Alternate Sources | | | | 1,297,133 | | | 0.3 | | |
Food Producers & Processors | | | | 9,629,109 | | | 2.0 | | |
Insurance | | | | 25,175,607 | | | 5.4 | | |
Internet | | | | 15,875,039 | | | 3.4 | | |
Investment Companies | | | | 11,832,196 | | | 2.5 | | |
Media & Photography | | | | 5,005,477 | | | 1.1 | | |
Mining & Metals | | | | 64,963,763 | | | 13.9 | | |
Motorcycles | | | | 4,512,567 | | | 1.0 | | |
Oil & Gas | | | | 66,956,214 | | | 14.3 | | |
Real Estate | | | | 4,217,824 | | | 0.9 | | |
Retailers - General | | | | 29,688,549 | | | 6.3 | | |
Telecommunication Services | | | | 16,602,329 | | | 3.5 | | |
Transportation | | | | 14,658,116 | | | 3.1 | | |
| | | | | | | | | |
| | | | | | | | | |
Total Value of Investments | | | | 461,293,123 | | | 98.4 | | |
Other assets less liabilities | | | | 7,360,394 | | | 1.6 | | |
| | | | | | | | | |
Net Assets | | $ | | 468,653,517 | | | 100.0 | % | |
| | | | | | | | | |
Page 51
| |
PORTFOLIO OF INVESTMENTS | |
December 31, 2010 | Baillie Gifford Emerging Markets Fund |
| | |
| | | | | | | |
| | Shares | | Value | |
| | | | | | |
| | | | | | | |
COMMON STOCKS - 90.2% | | | | | | | |
ARGENTINA - 0.6% | | | | | | | |
MercadoLibre, Inc. (a) | | | 45,400 | | $ | 3,025,910 | |
| | | | | | | |
| | | | | | | |
BRAZIL - 8.8% | | | | | | | |
All America Latina Logistica | | | 507,510 | | | 4,585,934 | |
BM&F BOVESPA SA | | | 291,100 | | | 2,302,496 | |
Lojas Renner SA | | | 15,700 | | | 533,422 | |
OGX Petroleo e Gas Participacoes SA (a) | | | 384,200 | | | 4,628,916 | |
Petroleo Brasileiro SA ADR | | | 528,400 | | | 19,994,656 | |
Vale SA ADR | | | 267,100 | | | 9,233,647 | |
| | | | | | | |
| | | | | | 41,279,071 | |
| | | | | | | |
CHINA - 17.2% | | | | | | | |
Alibaba.com Ltd. | | | 1,906,500 | | | 3,418,148 | |
Baidu, Inc. ADR (a) | | | 97,700 | | | 9,430,981 | |
Bank of China Ltd., Class H | | | 11,320,200 | | | 5,967,747 | |
BYD Co., Ltd., Class H | | | 309,500 | | | 1,625,202 | |
China Construction Bank Corp., Class H | | | 9,038,290 | | | 8,096,925 | |
China Life Insurance Co., Ltd., Class H | | | 687,000 | | | 2,797,199 | |
China Longyuan Power Group Corp., Class H (a) | | | 1,419,000 | | | 1,297,133 | |
China Merchants Bank Co., Ltd., Class H | | | 1,460,523 | | | 3,684,232 | |
China Mobile Ltd. | | | 932,500 | | | 9,245,607 | |
China Railway Construction Corp. Ltd., Class H | | | 4,539,000 | | | 5,458,399 | |
China Shenhua Energy Co., Ltd., Class H | | | 885,500 | | | 3,711,075 | |
China Taiping Insurance Holdings Co., Ltd. (a) | | | 1,300,000 | | | 3,993,022 | |
CSR Corp., Ltd., Class H | | | 3,883,000 | | | 5,101,723 | |
Parkson Retail Group Ltd. | | | 1,515,000 | | | 2,333,300 | |
Ping An Insurance Co. of China Ltd., Class H | | | 644,000 | | | 7,188,113 | |
Renhe Commercial Holdings Co., Ltd. | | | 15,016,000 | | | 2,625,482 | |
Want Want China Holdings Ltd. | | | 5,475,000 | | | 4,794,808 | |
| | | | | | | |
| | | | | | 80,769,096 | |
| | | | | | | |
GUERNSEY - 0.4% | | | | | | | |
Chariot Oil & Gas Ltd. (a) | | | 642,608 | | | 1,883,411 | |
| | | | | | | |
|
INDIA - 7.8% | | | | | | | |
ACC Ltd. | | | 120,700 | | | 2,902,808 | |
GAIL India Ltd. | | | 409,393 | | | 4,693,905 | |
Hero Honda Motors Ltd. | | | 101,500 | | | 4,512,567 | |
Housing Development Finance Corp. | | | 339,600 | | | 5,528,756 | |
IFCI Ltd. | | | 918,914 | | | 1,382,896 | |
Infrastructure Development Finance Co., Ltd. | | | 899,500 | | | 3,671,856 | |
IVRCL Infrastructures & Projects Ltd. | | | 725,500 | | | 2,084,738 | |
Mahindra & Mahindra Ltd. | | | 424,522 | | | 7,387,243 | |
Tata Power Co., Ltd. | | | 142,800 | | | 4,360,398 | |
| | | | | | | |
| | | | | | 36,525,167 | |
| | | | | | | |
INDONESIA - 6.1% | | | | | | | |
PT Astra International Tbk | | | 1,032,500 | | | 6,239,835 | |
PT Bakrieland Development Tbk | | | 91,631,000 | | | 1,592,342 | |
PT Bank Mandiri | | | 4,497,500 | | | 3,234,083 | |
PT Bank Rakyat Indonesia | | | 2,789,000 | | | 3,244,260 | |
PT Bumi Resources Tbk | | | 23,028,000 | | | 7,714,489 | |
PT Semen Gresik Persero Tbk | | | 3,091,500 | | | 3,237,396 | |
PT Tambang Batubara Bukit Asam Tbk | | | 1,335,000 | | | 3,394,281 | |
| | | | | | | |
| | | | | | 28,656,686 | |
| | | | | | | |
The accompanying notes are an integral part of the financial statements.
Page 52
| |
PORTFOLIO OF INVESTMENTS (continued) | |
December 31, 2010 | Baillie Gifford Emerging Markets Fund |
| | |
| | | | | | | |
| | Shares | | Value | |
| | | | | | |
| | | | | | | |
IRELAND - 1.1% | | | | | | | |
Kenmare Resources Plc. (a) | | | 10,172,676 | | $ | 5,211,490 | |
| | | | | | | |
| | | | | | | |
KAZAKHSTAN - 0.2% | | | | | | | |
KazMunaiGas Exploration Production | | | 40,962 | | | 807,676 | |
| | | | | | | |
| | | | | | | |
LUXEMBOURG - 0.9% | | | | | | | |
Evraz Group SA GDR Reg S (a) | | | 113,400 | | | 4,071,487 | |
| | | | | | | |
| | | | | | | |
MALAYSIA - 0.6% | | | | | | | |
Public Bank Bhd | | | 634,900 | | | 2,676,731 | |
| | | | | | | |
| | | | | | | |
MEXICO - 4.5% | | | | | | | |
America Movil SAB de CV, Series L ADR | | | 128,300 | | | 7,356,722 | |
Cemex SAB de CV ADR (a) | | | 521,000 | | | 5,579,910 | |
Grupo Financiero Banorte SA de CV, Class O | | | 505,204 | | | 2,401,253 | |
Wal-Mart de Mexico SA de CV, Series V | | | 2,075,660 | | | 5,931,177 | |
| | | | | | | |
| | | | | | 21,269,062 | |
| | | | | | | |
PERU - 0.6% | | | | | | | |
Credicorp Ltd. | | | 23,400 | | | 2,782,494 | |
| | | | | | | |
| | | | | | | |
RUSSIA - 2.9% | | | | | | | |
Petropavlovsk Plc. | | | 286,300 | | | 5,126,976 | |
Severstal GDR Reg S | | | 255,100 | | | 4,305,934 | |
X5 Retail Group NV GDR Reg S (a) | | | 87,300 | | | 4,043,650 | |
| | | | | | | |
| | | | | | 13,476,560 | |
| | | | | | | |
SOUTH AFRICA - 6.9% | | | | | | | |
AngloGold Ashanti Ltd. | | | 40,900 | | | 2,028,997 | |
Gold Fields Ltd. | | | 406,600 | | | 7,438,531 | |
Gold Fields Ltd. ADR | | | 142,100 | | | 2,576,273 | |
Impala Platinum Holdings Ltd. | | | 162,400 | | | 5,751,708 | |
Lonmin Plc. (a) | | | 142,903 | | | 4,398,875 | |
Massmart Holdings Ltd. | | | 234,928 | | | 5,232,514 | |
Naspers Ltd., N Shares | | | 84,900 | | | 5,005,477 | |
| | | | | | | |
| | | | | | 32,432,375 | |
| | | | | | | |
SOUTH KOREA - 10.8% | | | | | | | |
Cheil Industries, Inc. | | | 36,600 | | | 3,576,750 | |
Glovis Co., Ltd. | | | 37,926 | | | 4,970,459 | |
Hyundai Development Co. | | | 32,060 | | | 959,902 | |
Hyundai Mobis | | | 27,000 | | | 6,760,156 | |
KB Financial Group, Inc. | | | 83,813 | | | 4,408,096 | |
NHN Corp. (a) | | | 19,800 | | | 3,952,461 | |
Samsung Electronics Co., Ltd. | | | 18,450 | | | 15,408,263 | |
Samsung Fire & Marine Insurance Co., Ltd. | | | 26,800 | | | 5,302,913 | |
Shinsegae Co., Ltd. | | | 9,750 | | | 5,274,914 | |
| | | | | | | |
| | | | | | 50,613,914 | |
| | | | | | | |
TAIWAN - 9.3% | | | | | | | |
Advanced Semiconductor Engineering, Inc. | | | 3,017,038 | | | 3,479,349 | |
China Life Insurance Co., Ltd. | | | 5,533,513 | | | 5,894,360 | |
Far Eastern Department Stores Ltd. | | | 3,795,122 | | | 6,339,572 | |
Hon Hai Precision Industry Co., Ltd. | | | 2,801,769 | | | 11,286,312 | |
MediaTek, Inc. | | | 458,680 | | | 6,565,162 | |
Taiwan Semiconductor Manufacturing Co., Ltd. | | | 4,101,310 | | | 9,983,818 | |
| | | | | | | |
| | | | | | 43,548,573 | |
| | | | | | | |
The accompanying notes are an integral part of the financial statements.
Page 53
| |
PORTFOLIO OF INVESTMENTS (continued) | |
December 31, 2010 | Baillie Gifford Emerging Markets Fund |
| | |
| | | | | | | |
| | Shares | | Value | |
| | | | | | |
| | | | | | | |
THAILAND - 1.5% | | | | | | | |
Bank of Ayudhya PCL NVDR | | | 8,341,000 | | $ | 7,114,178 | |
| | | | | | | |
|
TURKEY - 2.5% | | | | | | | |
Turkiye Garanti Bankasi AS | | | 1,175,323 | | | 5,935,844 | |
Turkiye Is Bankasi, Class C | | | 1,635,562 | | | 5,809,590 | |
| | | | | | | |
| | | | | | 11,745,434 | |
| | | | | | | |
TURKMENISTAN - 2.8% | | | | | | | |
Dragon Oil Plc. (a) | | | 1,546,545 | | | 12,972,267 | |
| | | | | | | |
|
UNITED KINGDOM - 4.7% | | | | | | | |
Cairn Energy Plc. (a) | | | 1,577,573 | | | 10,356,954 | |
Desire Petroleum Plc. (a) | | | 591,596 | | | 445,576 | |
Gulf Keystone Petroleum Ltd. (a) | | | 826,000 | | | 2,190,341 | |
Rockhopper Exploration Plc. (a) | | | 778,121 | | | 4,458,364 | |
Tullow Oil Plc. | | | 229,100 | | | 4,524,148 | |
| | | | | | | |
| | | | | | 21,975,383 | |
| | | | | | | |
Total Common Stocks | | | | | | | |
(cost $311,580,035) | | | | | | 422,836,965 | |
| | | | | | | |
| | | | | | | |
PREFERRED STOCKS - 8.2% | | | | | | | |
BRAZIL - 6.8% | | | | | | | |
Banco Bradesco SA | | | 346,390 | | | 6,813,032 | |
Bradespar SA | | | 312,700 | | | 8,160,340 | |
Companhia Brasileira de Distribuicao Grupo Pao de Acucar | | | 115,800 | | | 4,834,301 | |
Companhia Energetica de Minas Gerais | | | 257,542 | | | 4,143,944 | |
Itausa - Investimentos Itau SA | | | 1,006,652 | | | 8,004,703 | |
| | | | | | | |
| | | | | | 31,956,320 | |
| | | | | | | |
SOUTH KOREA - 1.4% | | | | | | | |
Samsung Electronics Co., Ltd. | | | 11,335 | | | 6,470,140 | |
| | | | | | | |
| | | | | | | |
Total Preferred Stocks | | | | | | | |
(cost $25,654,445) | | | | | | 38,426,460 | |
| | | | | | | |
| | | | | | | |
RIGHTS(a) - 0.0% | | | | | | | |
BRAZIL - 0.0% | | | | | | | |
Banco Bradesco SA | | | | | | | |
expiring on 1/31/11 | | | | | | | |
(cost $0) | | | 5,739 | | | 29,698 | |
| | | | | | | |
| | | | | | | |
TOTAL INVESTMENTS - 98.4% | | | | | | | |
(cost $337,234,480) | | | | | | 461,293,123 | |
Other assets less liabilities - 1.6% | | | | | | 7,360,394 | |
| | | | | | | |
NET ASSETS - 100.0% | | | | | $ | 468,653,517 | |
| | | | | | | |
| | | | | | | |
(a) Non-income producing security. | | | | | | | |
ADR - American Depositary Receipt. | | | | | | | |
GDR - Global Depositary Receipt. | | | | | | | |
NVDR - Non Voting Depositary Receipt. | | | | | | | |
PCL - Public Company Limited. | | | | | | | |
The accompanying notes are an integral part of the financial statements.
Page 54
| |
PORTFOLIO OF INVESTMENTS (concluded) | |
December 31, 2010 | Baillie Gifford Emerging Markets Fund |
| | |
Reg S - is a safe harbor that defines when an offering of securities will be deemed to come to rest abroad and therefore is not subject to the registration obligations imposed under Section 5 of the 1933 Act. The regulation includes two safe harbor provisions: an issuer safe harbor and a resale safe harbor. In each case, the regulation demands that offers and sales of the securities be made outside the United States and that no offering participant (which includes the issuer, the banks assisting with the offer and their respective affiliates) engage in “directed” selling efforts. In the case of issuers for whose securities there is substantial U.S. market interest, the regulation also requires that no offers and sales be made to U.S. persons (including U.S. persons physically located outside the United States).
The accompanying notes are an integral part of the financial statements.
Page 55
| |
STATEMENT OF ASSETS AND LIABILITIES | |
December 31, 2010 | Baillie Gifford Emerging Markets Fund |
| | |
| | | | |
ASSETS | | | | |
Investments, at value (cost $337,234,480) | | $ | 461,293,123 | |
Cash | | | 4,917,756 | |
Foreign cash, at value (cost $1,892,137) | | | 1,919,545 | |
Receivable for investments sold | | | 1,259,455 | |
Dividends and interest receivable | | | 335,836 | |
| | | | |
| | | | |
Total Assets | | | 469,725,715 | |
| | | | |
| | | | |
LIABILITIES | | | | |
Management fee payable | | | 579,356 | |
Payable for investments purchased | | | 161,358 | |
Servicing fee payable | | | 120,351 | |
Payable for deferred Indian capital gains tax | | | 4,552 | |
Accrued expenses | | | 206,581 | |
| | | | |
| | | | |
Total Liabilities | | | 1,072,198 | |
| | | | |
| | | | |
NET ASSETS | | $ | 468,653,517 | |
| | | | |
| | | | |
COMPOSITION OF NET ASSETS | | | | |
Paid-in capital | | $ | 343,993,479 | |
Distributions in excess of net investment income | | | (3,657,400 | ) |
Accumulated net realized gain on investments and foreign currency transactions (net of Indian capital gains tax) | | | 4,234,149 | |
Net unrealized appreciation in value of investments and foreign currencies (net of deferred Indian capital gains tax) | | | 124,083,289 | |
| | | | |
| | $ | 468,653,517 | |
| | | | |
| | | | |
NET ASSET VALUE, PER SHARE | | | | |
| | | | |
Class III ($468,653,517 / 25,052,527 shares outstanding), unlimited authorized, no par value | | $ | 18.71 | |
| | | | |
Maximum Purchase Price Per Share (Note D) | | $ | 18.81 | |
| | | | |
Minimum Redemption Price Per Share (Note D) | | $ | 18.66 | |
| | | | |
The accompanying notes are an integral part of the financial statements.
Page 56
| |
STATEMENT OF OPERATIONS | |
For the Year Ended December 31, 2010 | Baillie Gifford Emerging Markets Fund |
| | |
| | | | |
INVESTMENT INCOME | | | | |
Dividends (net of foreign withholding taxes of $727,090) | | $ | 5,975,808 | |
Interest | | | 8,556 | |
| | | | |
Total Investment Income | | | 5,984,364 | |
| | | | |
| | | | |
EXPENSES | | | | |
Management fee (Note B) | | | 1,953,682 | |
Shareholder Servicing fees - Class I Shares (Note B) | | | 8,043 | |
Shareholder Servicing fees - Class II Shares (Note B) | | | 91,522 | |
Shareholder Servicing fees - Class III Shares (Note B) | | | 347,713 | |
Custody | | | 266,850 | |
Fund Accounting | | | 247,775 | |
Legal | | | 62,888 | |
Professional fees | | | 61,269 | |
Trustees’ fees | | | 15,835 | |
Transfer Agency | | | 14,781 | |
Insurance | | | 9,531 | |
Miscellaneous | | | 25,377 | |
| | | | |
Total Expenses | | | 3,105,266 | |
| | | | |
| | | | |
Net Investment Income | | | 2,879,098 | |
| | | | |
| | | | |
REALIZED AND UNREALIZED GAIN ON INVESTMENTS AND FOREIGN CURRENCY TRANSACTIONS | | | | |
Net realized gain from: | | | | |
Investments (net of Indian capital gains tax of $494,922) | | | 37,214,132 | |
Foreign currency transactions | | | 44,048 | |
| | | | |
| | | 37,258,180 | |
| | | | |
| | | | |
Net change in unrealized appreciation on: | | | | |
Investments (net of reversal of deferred Indian capital gains tax of $1,128,217) | | | 36,076,156 | |
Translation of assets and liabilities in foreign currencies | | | 24,079 | |
| | | | |
| | | 36,100,235 | |
| | | | |
| | | | |
Net realized and unrealized gain on investments and foreign currency transactions | | | 73,358,415 | |
| | | | |
| | | | |
NET INCREASE IN NET ASSETS FROM OPERATIONS | | $ | 76,237,513 | |
| | | | |
The accompanying notes are an integral part of the financial statements.
Page 57
| |
STATEMENTS OF CHANGES IN NET ASSETS | Baillie Gifford Emerging Markets Fund |
| | |
| | | | | | | | |
| | For the
Year Ended
December 31, 2010 | | | For the
Year Ended
December 31, 2009 | |
| | | | | | |
| | | | | | | | |
INCREASE IN NET ASSETS FROM OPERATIONS | | | | | | | | |
Net investment income | | $ | 2,879,098 | | | $ | 1,442,175 | |
Net realized gain from investments and foreign currency transactions | | | 37,258,180 | | | | 3,156,678 | |
Net change in unrealized appreciation on investments and translation of assets and liabilities in foreign currencies | | | 36,100,235 | | | | 129,538,327 | |
| | | | | | | | |
Net increase in net assets from operations | | | 76,237,513 | | | | 134,137,180 | |
| | | | | | | | |
| | | | | | | | |
DIVIDENDS AND DISTRIBUTIONS TO SHAREHOLDERS FROM: | | | | | | | | |
Net investment income: | | | | | | | | |
Class I | | | - | | | | (912,924 | ) |
Class II | | | (305,494 | ) | | | (720,769 | ) |
Class III | | | (12,226,712 | ) | | | (3,692,251 | ) |
Capital gains: | | | | | | | | |
Class III | | | (11,767,673 | ) | | | - | |
| | | | | | | | |
| | | | | | | | |
Total Dividends and Distributions | | | (24,299,879 | ) | | | (5,325,944 | ) |
| | | | | | | | |
| | | | | | | | |
TRANSACTIONS IN SHARES OF BENEFICIAL INTEREST | | | | | | | | |
Net proceeds from shares subscribed: | | | | | | | | |
Class I | | | - | | | | 39,900,000 | |
Class II | | | - | | | | 23,374,000 | |
Class III | | | 191,123,814 | | | | 9,869,439 | |
Purchase premiums: | | | | | | | | |
Class I | | | - | | | | 18,118 | |
Class II | | | 25,949 | | | | 18,528 | |
Class III | | | 185,582 | | | | 88,355 | |
Redemption fees: | | | | | | | | |
Class III | | | 20,050 | | | | - | |
Dividends and distributions reinvested: | | | | | | | | |
Class I | | | - | | | | 912,924 | |
Class II | | | 305,494 | | | | 720,769 | |
Class III | | | 23,994,385 | | | | 3,692,251 | |
Cost of shares redeemed: | | | | | | | | |
Class I | | | (54,124,301 | ) | | | - | |
Class II | | | (51,710,765 | ) | | | - | |
Class III | | | (8,020,050 | ) | | | (23,374,000 | ) |
| | | | | | | | |
| | | | | | | | |
Increase in Net Assets from Transactions in Shares of Beneficial Interest | | | 101,800,158 | | | | 55,220,384 | |
| | | | | | | | |
| | | | | | | | |
Total Increase in Net Assets | | | 153,737,792 | | | | 184,031,620 | |
| | | | | | | | |
NET ASSETS | | | | | | | | |
Beginning of year | | | 314,915,725 | | | | 130,884,105 | |
| | | | | | | | |
End of year (including distributions in excess of net investment income of $6,722,587 and $3,816,195, respectively) | | $ | 468,653,517 | | | $ | 314,915,725 | |
| | | | | | | | |
The accompanying notes are an integral part of the financial statements.
Page 58
| |
FINANCIAL HIGHLIGHTS | Baillie Gifford Emerging Markets Fund |
| | |
| |
Selected data for a Class III Share outstanding throughout each year: |
| | | | | | | | | | | |
| | For the Year
Ended
December 31,
2010 | | For the Year
Ended
December 31,
2009 | | For the Year
Ended
December 31,
2008 | | For the Year
Ended
December 31,
2007 | | For the Year
Ended
December 31,
2006 | |
| | | | | | | | | | | |
Net asset value, beginning of year | | $16.49 | | $8.47 | | $22.17 | | $21.42 | | $19.78 | |
| | | | | | | | | | | |
| | | | | | | | | | | |
From Investment Operations | | | | | | | | | | | |
Net investment income(a) | | 0.13 | | 0.09 | | 0.16 | | 0.38 | | 0.25 | |
Net realized and unrealized gain (loss) on investments and foreign currency transactions | | 3.09 | | 8.21 | | (12.15) | | 9.45 | | 7.24 | |
| | | | | | | | | | | |
Net increase (decrease) in net asset value from investment operations | | 3.22 | | 8.30 | | (11.99) | | 9.83 | | 7.49 | |
| | | | | | | | | | | |
| | | | | | | | | | | |
Dividends and Distributions to Shareholders | | | | | | | | | | | |
Dividends from net investment income | | (0.52) | | (0.29) | | (0.21) | | (0.50) | | (0.18) | |
Distributions from net realized gain on investments | | (0.49) | | - | | (1.48) | | (8.61) | | (5.68) | |
Return of capital | | - | | - | | (0.03) | | - | | - | |
| | | | | | | | | | | |
Total Dividends and Distributions | | (1.01) | | (0.29) | | (1.72) | | (9.11) | | (5.86) | |
| | | | | | | | | | | |
| | | | | | | | | | | |
Proceeds from Purchase Premiums and Redemption Fees | | 0.01 | | 0.01 | | 0.01 | | 0.03 | | 0.01 | |
| | | | | | | | | | | |
Net asset value, end of year | | $18.71 | | $16.49 | | $8.47 | | $22.17 | | $21.42 | |
| | | | | | | | | | | |
| | | | | | | | | | | |
Total Return | | | | | | | | | | | |
Total investment return based on net asset value(b) | | 19.73% | | 98.09% | | (56.41)% | | 46.59% | | 38.30% | |
| | | | | | | | | | | |
Ratios/Supplemental Data | | | | | | | | | | | |
Net assets, end of year (000’s omitted) | | $468,654 | | $216,394 | | $124,412 | | $209,920 | | $161,874 | |
Ratio of net expenses to average net assets | | 0.79% | | 0.80% | | 0.87% | | 0.87% | | 0.88% | |
Ratio of net investment income to average net assets | | 0.75% | | 0.76% | | 1.04% | | 1.48% | | 1.10% | |
Portfolio turnover rate | | 40% | | 56% | | 61% | | 61% | | 50% | |
| |
(a) | Calculated based upon average shares outstanding during the year. |
(b) | Total investment return is calculated assuming an initial investment made at the net asset value at the beginning of the year, reinvestment of all dividends and distributions, if any, at net asset value during the year, and redemption on the last day of the year. |
The accompanying notes are an integral part of the financial statements.
Page 59
NOTES TO FINANCIAL STATEMENTS
December 31, 2010
Note A – Organization and Accounting Policies
Each of Baillie Gifford International Equity Fund (“International Equity Fund”), Baillie Gifford EAFE Fund (“EAFE Fund”), Baillie Gifford EAFE Choice Fund (“EAFE Choice Fund”) and Baillie Gifford Emerging Markets Fund (“Emerging Markets Fund”) (each, a “Fund”, and collectively, the “Funds”) is a series of Baillie Gifford Funds (the “Trust”). The Trust is a diversified open-end management investment company registered under the Investment Company Act of 1940, as amended. The Trust is organized as a Massachusetts business trust under the laws of Massachusetts pursuant to an Amended and Restated Agreement and Declaration of Trust dated August 17, 2001, as subsequently amended. International Equity Fund, EAFE Fund and EAFE Choice Fund offer four classes of shares, Class 1, Class 2, Class 3 and Class 4 shares, and Emerging Markets Fund offers three classes of shares, Class I, Class II and Class III shares (an unlimited number of shares are authorized, without par value). At December 31, 2010, shares issued and outstanding for the International Equity Fund were of Class 1, Class 2, Class 3 and Class 4 shares, shares issued and outstanding for the EAFE Fund were of Class 1, Class 2, Class 3 and Class 4 shares, shares issued and outstanding for the EAFE Choice Fund were of Class 2 and Class 3 shares and shares issued and outstanding for the Emerging Markets Fund were of Class III.
The financial statements of the Funds have been prepared in conformity with accounting principles generally accepted in the United States of America (“GAAP”). Management is required to make certain estimates and assumptions that affect the reported amounts of assets and liabilities for the Funds and disclosure of contingent assets and liabilities for the Funds at the date of the financial statements and the reported amounts of increases and decreases in net assets from operations for the Funds during the reporting period. Actual results could differ from those estimates.
Investment income, expenses (other than those specific to a particular class of shares), and realized and unrealized gains and losses on investments are allocated to the separate classes of shares based upon their relative net asset value on the date income is earned or expensed and realized and unrealized gains and losses are incurred.
The following is a summary of significant accounting policies followed by the Funds.
Valuation of Investments
Equity securities listed on an established securities exchange are normally valued at their last sale price on the exchange where primarily traded. Equity securities listed on the NASDAQ National Market System are valued at the NASDAQ Official Closing Price. Equity securities listed on an established securities exchange or on the NASDAQ National Market System for which there is no reported sale during the day, and in the case of over-the-counter securities not so listed, are valued at the mean
Page 60
NOTES TO FINANCIAL STATEMENTS (continued)
between the last available bid and asked prices. Other securities for which current market quotations are not readily available (or for which quotations are not believed to be reliable due to market changes that occur after the most recent available quotations are obtained or any other reason), and all other assets, are taken at fair value as determined in good faith by Baillie Gifford Overseas Limited (the “Manager”), pursuant to procedures approved by the trustees of the Trust (the “Trustees”). The actual calculations may be made by persons acting pursuant to the direction of the Trustees or by pricing services.
Generally, trading in foreign securities markets is substantially completed each day at various times prior to close of regular trading on the New York Stock Exchange. Occasionally, events affecting the value of foreign fixed income securities and of equity securities of non-U.S. issuers not traded on a U.S. exchange may occur between the completion of substantial trading of such securities for the day and the close of regular trading on the New York Stock Exchange, which events may not be reflected in the computation of a Funds’ net asset values. If events materially affecting the value of the Funds’ portfolio securities occur during such period, then these securities will be valued at their fair value as determined in good faith by the Manager, pursuant to procedures approved by the Trustees. The Funds utilize a third party pricing service which for all equity securities, except those traded on a Canadian, Latin American or U.S. exchange, applies a fair value adjustment that seeks to reflect changes in such securities’ market prices since the close of the market on which they are traded. To the extent that securities are valued using this service, they will be classified as Level 2 securities in the fair value measurement framework described below.
The Funds invest in obligations of foreign entities and securities denominated in foreign currencies. Such investments involve risk not typically involved with domestic investments. Such risks include fluctuations in foreign exchange rates, inability to convert proceeds into U.S. dollars, application of foreign tax laws, foreign investment restrictions, less publicly available information about foreign financial instruments, less liquidity resulting from substantially less trading volume, more volatile prices, and generally less government supervision of foreign securities markets and issuers.
Fair Value Measurement
The Funds are subject to fair value accounting standards that define fair value, establish a framework for measuring fair value in accordance with GAAP and require certain disclosures about fair value measurements. Various inputs are used in determining the value of the Funds’ investments. These inputs are summarized in the three broad levels listed below.
| |
| Level 1 — quoted prices in active markets for identical securities |
| Level 2 — other significant observable inputs (including quoted prices in inactive markets for identical securities and for similar securities in active and inactive markets) |
| Level 3 — significant unobservable inputs (including each Fund’s assumptions in determining the fair value of investments) |
Page 61
NOTES TO FINANCIAL STATEMENTS (continued)
The following is a summary of the inputs used as of December 31, 2010 in valuing the Funds’ assets carried at fair value:
| | | | | | | | | | |
International Equity Fund | | Level 1 | | Level 2 | | Level 3 | |
| | | | | | | | |
Investments in Securities | | | | | | | | | | |
Common Stocks | | $ | 102,752,617 | | $ | 563,051,449 | | $ | - | |
Preferred Stocks | | | 23,369,568 | | | - | | | - | |
| | | | | | | | | | |
Total | | $ | 126,122,185 | | $ | 563,051,449 | | $ | - | |
| | | | | | | | | | |
| | | | | | | | | | |
EAFE Fund | | Level 1 | | Level 2 | | Level 3 | |
| | | | | | | | |
Investments in Securities | | | | | | | | | | |
Common Stocks | | $ | 93,271,176 | | $ | 1,376,101,112 | | $ | - | |
Preferred Stocks | | | 54,151,123 | | | 8,814,630 | | | - | |
| | | | | | | | | | |
Total | | $ | 147,422,299 | | $ | 1,384,915,742 | | $ | - | |
| | | | | | | | | | |
| | | | | | | | | | |
EAFE Choice Fund | | Level 1 | | Level 2 | | Level 3 | |
| | | | | | | | |
Investments in Securities | | | | | | | | | | |
Common Stocks | | $ | 7,020,090 | | $ | 92,984,680 | | $ | - | |
Preferred Stocks | | | 1,443,041 | | | - | | | - | |
| | | | | | | | | | |
Total | | $ | 8,463,131 | | $ | 92,984,680 | | $ | - | |
| | | | | | | | | | |
| | | | | | | | | | |
Emerging Markets Fund | | Level 1 | | Level 2 | | Level 3 | |
| | | | | | | | |
Investments in Securities | | | | | | | | | | |
Common Stocks | | $ | 86,551,331 | | $ | 336,285,634 | | $ | - | |
Preferred Stocks | | | - | | | 38,426,460 | | | - | |
Rights | | | - | | | 29,698 | | | - | |
| | | | | | | | | | |
Total | | $ | 86,551,331 | | $ | 374,741,792 | | $ | - | |
| | | | | | | | | | |
For the International Equity Fund fair value of Level 2 and Level 1 investments at 12/31/09 was $211,622,047 and $61,450,193, respectively. $2,550,433 was transferred out of Level 2 into Level 1 and $5,694,084 was transferred out of Level 1 into Level 2 during the fiscal year ended 12/31/10.
For the EAFE Fund fair value of Level 2 and Level 1 investments at 12/31/09 was $799,874,804 and $101,977,110, respectively. $36,001,780 was transferred out of Level 2 into Level 1 and $12,477,427 was transferred out of Level 1 into Level 2 during the fiscal year ended 12/31/10.
For the EAFE Choice Fund fair value of Level 2 investments at 12/31/09 was $28,202,800. $1,111,596 was transferred out of Level 2 into Level 1 during the fiscal year ended 12/31/10.
For the Emerging Markets Fund fair value of Level 2 and Level 1 investments at 12/31/09 was $217,488,443 and $92,355,288, respectively. $8,078,868 was transferred out of Level 2 into Level 1 and $37,234,740 was transferred out of Level 1 into Level 2 during the fiscal year ended 12/31/10.
These transfers were all as a result of using third-party vendor modeling tools to reflect any (lack of) significant market movements between the time at which the Funds valued their securities and the earlier closing of foreign markets.
Page 62
NOTES TO FINANCIAL STATEMENTS (continued)
It is the Fund’s policy to recognize transfers in and transfers out at the fair value as of the beginning of period.
Derivative and Hedging Disclosure
GAAP requires qualitative disclosures about objectives and strategies for using derivatives, quantitative disclosures about fair value amounts of gains and losses on derivative instruments, and disclosures about credit-risk-related contingent features in derivative agreements. The Funds did not utilize derivatives for the year ended December 31, 2010.
Foreign Currency Translation
The accounting records of the Funds are maintained in U.S. dollars. Foreign currency amounts are translated into U.S. dollars at the applicable rate of exchange to determine the value of investments, assets, and liabilities. For the Funds, purchases and sales of securities, and income and expenses are translated at the prevailing rate of exchange on the respective dates of such transactions. The Funds do not isolate that portion of net realized and unrealized gains and losses on investments resulting from changes in foreign exchange rates from the impact arising from changes in market prices. Such fluctuations are included with net realized and unrealized gain or loss from investments.
Net realized foreign exchange gains and losses arise from sales of foreign currencies, currency gains or losses realized between the trade and settlement dates on securities transactions, and the differences between the amounts of dividends, interest, and foreign withholding taxes recorded on the Funds’ books and the U.S. dollar equivalent of the amounts actually received or paid. Net unrealized foreign exchange gains and losses arise from changes in the value of assets and liabilities, other than investments in securities, resulting from changes in the exchange rates.
Forward Foreign Currency Contracts
The Funds may enter into forward foreign currency contracts in connection with planned purchases or sales of securities, or to hedge against changes in currency exchange rates affecting the values of securities denominated in a particular currency. A forward exchange currency contract is a commitment to purchase or sell a foreign currency at a future date at a negotiated forward rate. Fluctuations in the value of forward foreign currency exchange contracts are recorded for book purposes as unrealized gains or losses on foreign currency related transactions by a Fund. When forward contracts are closed, the Funds record realized gains or losses equal to the differences between the values of such forward contracts at the time each was opened and the value at the time each was closed. Such amounts are recorded in net realized gain or loss on foreign currency related transactions.
The Funds’ maximum risk of loss from counterparty credit risk is the net value of the cash flows to be received from the counterparty at the end of the contract’s life. This risk may be mitigated by having a master netting arrangement between the Funds and the counterparty which may permit the Funds to offset amounts payable by the Funds to the same counterparty against amounts to be received; and by the receipt of collateral from the counterparty by the Funds to cover the Funds’ exposure to the counterparty. However, there is no assurance that such mitigating factors are easily enforceable.
The Funds may be party to financial instruments with off-balance-sheet risk, primarily forward contracts, in order to minimize the impact of adverse changes in the relationship between the U.S. dollar and various foreign currencies. These instruments involve market risk in excess of the amount recognized in the Statement of Assets and Liabilities. Risks arise from the possible inability of counter-parties to meet the terms of their contracts, future adverse movement in currency values and contract
Page 63
NOTES TO FINANCIAL STATEMENTS (continued)
positions that are not exact offsets. The contract amount indicates the extent of the Funds’ involvement in such currencies.
At December 31, 2010, the Funds did not have any forward currency contracts.
Securities Transactions and Investment Income
The Funds’ securities transactions are recorded on the trade date. Realized gains or losses on sales of investments are determined on the basis of identified cost. Dividend income is recorded on the ex-dividend date and interest income is recorded on an accrual basis.
Federal Taxes
Each Fund intends to qualify to be taxed as a “regulated investment company” under the provisions of the U.S. Internal Revenue Code of 1986, as amended (the “Code”), and as such will not be subject to U.S. federal income tax on income (including any net realized capital gains) which is distributed in accordance with the provisions of the Code to the Funds’ shareholders. Therefore, no U.S. federal income tax provision is required.
Investment income received from investments in foreign currencies may be subject to foreign withholding tax. Whenever possible, the Funds will attempt to operate so as to qualify for reduced tax rates or tax exemptions in those countries with which the United States has a tax treaty.
In addition to the requirements of the Code, the Funds may also be subject to capital gains tax in India on gains realized upon sale of Indian securities, payable upon repatriation of sales proceeds. Any realized losses in excess of gains may be carried forward to offset future gains. Funds with exposure to Indian securities accrue a deferred liability for unrealized gains in excess of available carryforwards on Indian securities based on existing tax rates and holding periods of the securities. As of December 31, 2010, the Emerging Markets Fund and EAFE Fund have recorded a deferred payable of $4,552 and $62,596, respectively, as an estimate for potential future India capital gains taxes.
The Funds are subject to tax accounting standards that provide guidance for how certain and uncertain tax positions should be recognized, measured, presented and disclosed in the financial statements. These standards require the evaluation of tax positions taken or expected to be taken in the course of preparing the Funds’ tax returns to determine whether the tax positions are “more-likely-than-not” of being sustained by the applicable tax authority. Tax positions not deemed to meet the “more-likely-than-not” threshold would be recorded as a reduction in a tax benefit or expense in the current year. Management has evaluated the application of these standards and has determined no liabilities for income tax related expenses are required in the financial statements of the Funds. For the Emerging Markets Fund tax years 2007 through present remain subject to examination by the Internal Revenue Service. For the International Equity Fund and EAFE Fund the tax periods 2008 through present remain subject to examination. For the EAFE Choice Fund, the tax periods 2009 through present remain subject to examination.
At December 31, 2010, for Federal income tax purposes, the following Funds have capital loss carryforwards available to offset future capital gains through the years indicated. To the extent that these loss carryforwards are utilized, capital gains so offset will not be distributed to shareholders.
Page 64
NOTES TO FINANCIAL STATEMENTS (continued)
| | | | | | | | | | | | | | | | | |
| | | | | | | | | | | | | |
Fund | | | Capital Loss
Available
Through 2016 | | | Capital Loss
Available
Through 2017 | | | Capital Loss
Available
Through 2018 | | | Capital Loss
Available
Total | |
International Equity | | | $ | - | | | $ | 1,319,983 | | | $ | - | | | $ | 1,319,983 | |
EAFE | | | | 16,918,201 | | | | 3,833,395 | | | | 10,342,233 | | | | 31,093,829 | |
During the year ended December 31, 2010, $7,478,181 and $9,363,747 of capital loss carryforwards were utilized by International Equity Fund and Emerging Markets Fund, respectively.
Realized capital losses, currency losses and passive foreign investment company (“PFIC”) losses incurred after October 31 (“post-October losses”) within the taxable year are deemed to arise on the first business day of each Fund’s next taxable year. During the year ended December 31, 2010, the Funds shown below incurred and will elect to defer net post-October losses as indicated.
At December 31, 2010, the components of accumulated earnings on tax basis were as follows:
| | | | | | | | | | | | | | | | | | | | | | | | | | | | | | | | | |
Fund | | | Undistributed
Net Ordinary
Income | | | Post
October
Currency
Losses | | | Capital
Loss
Carryforwards | | | Post
October
PFIC
Losses | | | Post
October
Capital
Losses | | | Undistributed
Long-Term
Capital Gain | | | Net Unrealized
Appreciation on
Investments
and Foreign
Currencies | | | Total
Accumulated
Earnings | |
International Equity | | | $ | - | | | $ | (116,906 | ) | | $ | (1,319,983 | ) | | $ | (302,468 | ) | | $ | - | | | $ | - | | | $ | 123,081,357 | | | $ | 121,342,000 | |
EAFE | | | | 305,939 | | | | (475,502 | ) | | | (31,093,829 | ) | | | - | | | | (1,942,262 | ) | | | - | | | | 342,369,186 | | | | 309,163,532 | |
EAFE Choice | | | | 213,527 | | | | (24,450 | ) | | | - | | | | - | | | | - | | | | 39,483 | | | | 9,977,034 | | | | 10,205,594 | |
Emerging Markets | | | | - | | | | (47,344 | ) | | | - | | | | - | | | | - | | | | 8,786,193 | | | | 115,921,189 | | | | 124,660,038 | |
The differences between the components of distributable earnings on a tax basis and the amounts reflected in the Statements of Assets and Liabilities are primarily due to the differing book/tax treatment of realized losses on wash sales and mark to market income on securities categorized as PFICs.
For the year ended December 31, 2010, the following reclassifications have been made on the Statement of Assets and Liabilities as a result of certain differences in the computation of net investment income and net realized capital gains under U.S. federal income tax rules and regulations versus GAAP, such as the treatment of foreign currency gains and losses and the redesignation of dividends:
Page 65
NOTES TO FINANCIAL STATEMENTS (continued)
| | | | | | |
| | | | | | |
Fund | | Undistributed
(Distributions in
Excess of) Net
Investment
Income | | Accumulated Net
Realized Gains
(Losses) on
Investments and
Foreign Currencies | | Paid-in
Capital |
International Equity | | $4,884,731 | | $(1,506,858) | | $(3,377,873) |
EAFE | | (457,659) | | 460,171 | | (2,512) |
EAFE Choice | | (47,450) | | 47,450 | | - |
Emerging Markets | | 6,746,716 | | (6,728,881) | | (17,835) |
Dividends and Distributions to Shareholders
The Funds intend to distribute each year, as dividends, substantially all net investment income and net capital gains realized. All such dividends or distributions are credited in the form of additional shares of the Funds at net asset value on the ex-dividend date unless the shareholder elects to receive dividends and distributions in cash. Currently, the Funds’ policies are to distribute net investment income and net capital gains on an annual basis. Such distributions are determined in conformity with U.S. federal income tax regulations, which may differ from GAAP.
For the years ended December 31, 2010 and December 31, 2009, the tax character of the dividends paid, as reflected in the Statements of Changes in Net Assets, were:
| | | | | | | | |
| | | | |
Fund | | Ordinary Income | | Long-Term Capital
Gains |
| | 2010 | | 2009 | | 2010 | | 2009 |
International Equity | | $12,216,249 | | $3,587,111 | | $ - | | $ - |
EAFE | | 22,623,637 | | 8,946,748 | | - | | - |
EAFE Choice | | 1,295,819 | | 7,407 | | - | | - |
Emerging Markets | | 12,532,206 | | 5,325,944 | | 11,767,673 | | - |
For tax purposes, short-term capital gain distributions, if any, are considered ordinary income distributions.
Page 66
NOTES TO FINANCIAL STATEMENTS (continued)
Note B – Investment Management and Other Services
The Funds are advised and managed by the Manager. The Manager, an investment adviser registered with the SEC, is a wholly owned subsidiary of Baillie Gifford & Co.
Under an investment advisory agreement between the Manager and the Trust on behalf of the Funds, each Fund pays the Manager a quarterly management fee, in arrears, at the following annual rate of the respective Fund’s average net assets (calculated by taking the average of all determinations of net asset value made at the end of each month).
| |
Fund | Management Fee |
| |
International Equity | 0.30% |
EAFE | 0.25% |
EAFE Choice | 0.25% |
Emerging Markets | 0.50% |
For the year ended December 31, 2010, the Funds incurred management fees as follows:
| | |
Fund | Management Fee |
| | |
International Equity | $1,304,343 | |
EAFE | 2,872,552 | |
EAFE Choice | 186,563 | |
Emerging Markets | 1,953,682 | |
Each Fund has adopted a Shareholder Servicing Plan providing that the Fund may pay the Manager, or any other entity that acts from time to time as the shareholder servicing agent with respect to a class of Fund shares, for services rendered and expenses borne in connection with the provision of services provided to Fund investors and/or the maintenance of shareholder accounts. For these services, the Funds pay the Manager a fee at the annualized rate of the Funds’ average daily net assets attributed to each class of share as follows:
| | | | |
| International
Equity | EAFE | EAFE
Choice | Emerging
Markets* |
Class 1/I | 0.45% | 0.45% | 0.45% | 0.30% |
Class 2/II | 0.27% | 0.27% | 0.27% | 0.25% |
Class 3/III | 0.20% | 0.20% | 0.20% | 0.10% |
Class 4 | 0.17% | 0.17% | 0.17% | N/A |
* Emerging Markets Fund Class I was redeemed on January 15, 2010 and Class II was redeemed on October 20, 2010.
Page 67
NOTES TO FINANCIAL STATEMENTS (continued)
For the year ended December 31, 2010, the Funds incurred shareholder servicing fees for each class of share as follows:
| | | | | | | | | | | | | | | | | |
| | | International
Equity | | | EAFE | | | EAFE
Choice | | | Emerging
Markets* | |
Class 1/I | | | $ | 299,807 | | | $ | 270,466 | | | $ | N/A | | | $ | 8,043 | |
Class 2/II | | | | 836,382 | | | | 1,625,511 | | | | 87,556 | | | | 91,522 | |
Class 3/III | | | | 96,479 | | | | 160,632 | | | | 82,515 | | | | 347,713 | |
Class 4 | | | | 13,637 | | | | 688,260 | | | | N/A | | | | N/A | |
* Emerging Markets Fund Class I was redeemed on January 15, 2010 and Class II was redeemed on October 20, 2010.
Note C – Investment Transactions
Purchases and proceeds from sales of securities (excluding short-term securities), were as follows:
| | | | | | | | | |
Fund | | | Purchases | | | Sales | |
| | | | | | | | | |
International Equity | | | $ | 328,262,413 | | | $ | 100,234,682 | |
EAFE | | | | 558,231,885 | | | | 141,139,749 | |
EAFE Choice | | | | 76,280,399 | | | | 14,533,145 | |
Emerging Markets | | | | 228,745,442 | | | | 149,953,044 | |
The Funds’ cost of investments and gross unrealized appreciation/(depreciation) at December 31, 2010 for U.S. federal income tax purposes were as follows:
| | | | | | | | | | | | | | | | | |
| | | | | | | | | | | | | |
Fund | | | Cost of
Investments | | | Gross
Appreciation | | | Gross
Depreciation | | | Net
Appreciation | |
International Equity | | | $ | 566,212,458 | | | $ | 132,010,253 | | | $ | (9,049,077 | ) | | $ | 122,961,176 | |
EAFE | | | | 1,189,947,703 | | | | 391,421,122 | | | | (49,030,784 | ) | | | 342,390,338 | |
EAFE Choice | | | | 91,486,561 | | | | 12,887,869 | | | | (2,926,619 | ) | | | 9,961,250 | |
Emerging Markets | | | | 345,396,580 | | | | 124,716,977 | | | | (8,820,434 | ) | | | 115,896,543 | |
Page 68
NOTES TO FINANCIAL STATEMENTS (continued)
Note D – Transactions in Shares of Beneficial Interest
| | | | | | | | | | | | | | | | | |
| | International Equity Fund | | |
| | | | | | |
| | Class 1 Shares
For the Year Ended
December 31, 2010 | | Class 2 Shares
For the Year Ended
December 31, 2010 | | |
| | | | | | | |
| | Shares | | | Amount | | | Shares | | | Amount | | |
| | | | | | | | | | | | | |
| | | | | | | | | | | | | | | | | |
Shares sold | | | 6,429,370 | | | $ | 58,565,548 | | | | 21,187,358 | | | $ | 197,769,223 | | |
| | | | | | | | | | | | | | | | | |
Redemption fees | | | - | | | | 4,011 | | | | - | | | | 16,205 | | |
| | | | | | | | | | | | | | | | | |
Purchase premium | | | - | | | | 90,426 | | | | - | | | | 346,429 | | |
| | | | | | | | | | | | | | | | | |
Shares issued in reinvestment of dividends and distributions | | | 100,220 | | | | 980,900 | | | | 791,115 | | | | 7,775,994 | | |
| | | | | | | | | | | | | | | | | |
Shares redeemed | | | (6,555,138 | ) | | | (61,133,453 | ) | | | (1,318,563 | ) | | | (11,517,276 | ) | |
| | | | | | | | | | | | | | | | | |
| | | | | | | | | | | | | | | | | |
Net increase (decrease) | | | (25,548 | ) | | $ | (1,492,568 | ) | | | 20,659,910 | | | $ | 194,390,575 | | |
| | | | | | | | | | | | | | | | | |
| | | | | | | | | | | | | | | | | |
| | International Equity Fund | | |
| | | | | | |
| | Class 3 Shares
For the Period September 1, 2010*
through December 31, 2010 | | Class 4 Shares
For the Period July 30, 2010*
through December 31, 2010 | | |
| | | | | | | |
| | Shares | | | Amount | | | Shares | | | Amount | | |
| | | | | | | | | | | | | |
| | | | | | | | | | | | | | | | | |
Shares sold | | | 15,042,567 | | | $ | 128,255,931 | | | | 2,001,054 | | | $ | 18,009,486 | | |
| | | | | | | | | | | | | | | | | |
Redemption fees | | | - | | | | 2,837 | | | | - | | | | 983 | | |
| | | | | | | | | | | | | | | | | |
Purchase premium | | | - | | | | 98,509 | | | | - | | | | 13,573 | | |
| | | | | | | | | | | | | | | | | |
Shares issued in reinvestment of dividends and distributions | | | 286,871 | | | | 2,843,440 | | | | 37,881 | | | | 383,650 | | |
| | | | | | | | | | | | | | | | | |
| | | | | | | | | | | | | | | | | |
Net increase | | | 15,329,438 | | | $ | 131,200,717 | | | | 2,038,935 | | | $ | 18,407,692 | | |
| | | | | | | | | | | | | | | | | |
|
* Commencement of investment operations. | | | | | | | | | | | | | | | | | |
Page 69
NOTES TO FINANCIAL STATEMENTS (continued)
| | | | | | | | | | | | | | | | | |
| | International Equity Fund | | |
| | | | | | |
| | Class 1 Shares
For the Year Ended
December 31, 2009 | | Class 2 Shares
For the Year Ended
December 31, 2009 | | |
| | | | | | | |
| | Shares | | | Amount | | | Shares | | | Amount | | |
| | | | | | | | | | | | | |
| | | | | | | | | | | | | | | | | |
Shares sold | | | 16,839,697 | | | $ | 118,875,750 | | | | 19,805,222 | | | $ | 158,653,946 | | |
| | | | | | | | | | | | | | | | | |
Redemption fees | | | - | | | | 1,726 | | | | - | | | | 2,030 | | |
| | | | | | | | | | | | | | | | | |
Purchase premium | | | - | | | | 110,922 | | | | - | | | | 76,723 | | |
| | | | | | | | | | | | | | | | | |
Shares issued in reinvestment of dividends and distributions | | | 73,043 | | | | 635,723 | | | | 334,946 | | | | 2,951,387 | | |
| | | | | | | | | | | | | | | | | |
Shares redeemed | | | (20,029,358 | ) | | | (160,156,199 | ) | | | (4,197,505 | ) | | | (26,242,512 | ) | |
| | | | | | | | | | | | | | | | | |
| | | | | | | | | | | | | | | | | |
Net increase (decrease) | | | (3,116,618 | ) | | $ | (40,532,078 | ) | | | 15,942,663 | | | $ | 135,441,574 | | |
| | | | | | | | | | | | | | | | | |
| | | | | | | | | | | | | | | | | |
| | EAFE Fund | | |
| | | | | | |
| | Class 1 Shares
For the Year Ended
December 31, 2010 | | Class 2 Shares
For the Year Ended
December 31, 2010 | | |
| | | | | | | |
| | Shares | | | Amount | | | Shares | | | Amount | | |
| | | | | | | | | | | | | |
| | | | | | | | | | | | | | | | | |
Shares sold | | | 6,277,444 | | | $ | 51,397,000 | | | | 48,708,526 | | | $ | 421,789,035 | | |
| | | | | | | | | | | | | | | | | |
Redemption fees | | | - | | | | 1,369 | | | | - | | | | 12,409 | | |
| | | | | | | | | | | | | | | | | |
Purchase premium | | | - | | | | 45,179 | | | | - | | | | 453,389 | | |
| | | | | | | | | | | | | | | | | |
Shares issued in reinvestment of dividends and distributions | | | 37,102 | | | | 352,363 | | | | 1,132,791 | | | | 10,917,409 | | |
| | | | | | | | | | | | | | | | | |
Shares redeemed | | | (8,931,336 | ) | | | (83,366,730 | ) | | | (13,859,539 | ) | | | (122,918,227 | ) | |
| | | | | | | | | | | | | | | | | |
| | | | | | | | | | | | | | | | | |
Net increase (decrease) | | | (2,616,790 | ) | | $ | (31,570,819 | ) | | | 35,981,778 | | | $ | 310,254,015 | | |
| | | | | | | | | | | | | | | | | |
Page 70
NOTES TO FINANCIAL STATEMENTS (continued)
| | | | | | | | | | | | | | | | | |
| | EAFE Fund | | |
| | | | | | | | | | |
| | Class 3 Shares
For the Period April 19, 2010*
through December 31, 2010 | | Class 4 Shares
For the Year Ended
December 31, 2010 | | |
| | | | | | | |
| | Shares | | | Amount | | | Shares | | | Amount | | |
| | | | | | | | | | | | | |
| | | | | | | | | | | | | | | | | |
Shares sold | | | 14,118,529 | | | $ | 124,954,270 | | | | 3,547,856 | | | $ | 29,940,000 | | |
| | | | | | | | | | | | | | | | | |
Redemption fees | | | - | | | | 1,217 | | | | - | | | | 8,149 | | |
| | | | | | | | | | | | | | | | | |
Purchase premium | | | - | | | | 69,127 | | | | - | | | | 297,723 | | |
| | | | | | | | | | | | | | | | | |
Shares issued in reinvestment of dividends and distributions | | | 213,185 | | | | 2,057,412 | | | | 743,569 | | | | 7,188,225 | | |
| | | | | | | | | | | | | | | | | |
| | | | | | | | | | | | | | | | | |
Net increase | | | 14,331,714 | | | $ | 127,082,026 | | | | 4,291,425 | | | $ | 37,434,097 | | |
| | | | | | | | | | | | | | | | | |
| | | | | | | | | | | | | | | | | |
* Recommencement of investment operations. | | | | | | | | | | | | | | | | | |
| | | | | | | | | | | | | | | | |
| | | | | | | | | | | | | | | | | |
| | EAFE Fund | | |
| | | | | | | | | | |
| | Class 1 Shares
For the Period January 2, 2009*
through December 31, 2009 | | Class 2 Shares
For the Year Ended
December 31, 2009 | | |
| | | | | | | |
| | Shares | | | Amount | | | Shares | | | Amount | | |
| | | | | | | | | | | | | |
| | | | | | | | | | | | | | | | | |
Shares sold | | | 24,831,777 | | | $ | 167,748,280 | | | | 50,720,953 | | | $ | 377,378,652 | | |
| | | | | | | | | | | | | | | | | |
Redemption fees | | | - | | | | 94 | | | | - | | | | 526 | | |
| | | | | | | | | | | | | | | | | |
Purchase premium | | | - | | | | 119,713 | | | | - | | | | 291,783 | | |
| | | | | | | | | | | | | | | | | |
Shares issued in reinvestment of dividends and distributions | | | 26,950 | | | | 224,816 | | | | 478,869 | | | | 4,037,336 | | |
| | | | | | | | | | | | | | | | | |
Shares redeemed | | | (19,923,585 | ) | | | (159,438,020 | ) | | | (6,773,671 | ) | | | (40,961,159 | ) | |
| | | | | | | | | | | | | | | | | |
| | | | | | | | | | | | | | | | | |
Net increase | | | 4,935,142 | | | $ | 8,654,883 | | | | 44,426,151 | | | $ | 340,747,138 | | |
| | | | | | | | | | | | | | | | | |
| | | | | | | | | | | | | | | | | |
* Commencement of investment operations. | | | | | | | | | | | | | | | | | |
Page 71
NOTES TO FINANCIAL STATEMENTS (continued)
| | | | | | | | | | | | | | | | |
| | EAFE Fund | |
| | | | | |
| | Class 3 Shares
For the Period January 1, 2009
through January 5, 2009 | | Class 4 Shares
For the Period January 2, 2009*
through December 31, 2009 | |
| | | | | |
| | Shares | | | Amount | | | Shares | | | Amount | |
| | | | | | | | | | | | |
| | | | | | | | | | | | |
Shares sold | | | - | | | $ | - | | | | 44,230,029 | | | $ | 280,794,053 | |
| | | | | | | | | | | | | | | | |
Redemption fees | | | - | | | | - | | | | - | | | | 672 | |
| | | | | | | | | | | | | | | | |
Purchase premium | | | - | | | | - | | | | - | | | | 381,067 | |
| | | | | | | | | | | | | | | | |
Shares issued in reinvestment of dividends and distributions | | | - | | | | - | | | | 444,998 | | | | 3,763,419 | |
| | | | | | | | | | | | | | | | |
Shares redeemed | | | (38,309,540 | ) | | | (230,894,385 | ) | | | - | | | | - | |
| | | | | | | | | | | | | | | | |
| | | | | | | | | | | | | | | | |
Net increase (decrease) | | | (38,309,540 | ) | | $ | (230,894,385 | ) | | | 44,675,027 | | | $ | 284,939,211 | |
| | | | | | | | | | | | | | | | |
* Commencement of investment operations.
| | | | | | | | | | | | | | | | |
| | EAFE Choice Fund | |
| | | |
| | Class 2 Shares
For the Period Ended
December 31, 2010** | | Class 3 Shares
For the Period January 15, 2010*
through December 31, 2010 | |
| | | | | |
| | Shares | | | Amount | | | Shares | | | Amount | |
| | | | | | | | | | | | |
| | | | | | | | | | | | |
Shares sold | | | 4,083,379 | | | $ | 41,317,200 | | | | 4,832,454 | | | $ | 50,906,024 | |
| | | | | | | | | | | | | | | | |
Purchase premium | | | - | | | | 53,804 | | | | - | | | | 58,067 | |
| | | | | | | | | | | | | | | | |
Shares issued in reinvestment of dividends and distributions | | | 51,698 | | | | 578,172 | | | | 63,137 | | | | 717,647 | |
| | | | | | | | | | | | | | | | |
Shares redeemed | | | (3,000,728 | ) | | | (31,435,095 | ) | | | - | | | | - | |
| | | | | | | | | | | | | | | | |
| | | | | | | | | | | | | | | | |
Net increase | | | 1,134,349 | | | $ | 10,514,081 | | | | 4,895,591 | | | $ | 51,681,738 | |
| | | | | | | | | | | | | | | | |
* Commencement of investment operations.
**For the Period January 1, 2010 to January 15, 2010 and March 25, 2010 through December 31, 2010.
Page 72
NOTES TO FINANCIAL STATEMENTS (continued)
| | | | | | | | |
| | EAFE Choice Fund | |
| | | |
| | Class 2 Shares
For the Period December 17, 2009*
through December 31, 2009 | |
| | | |
| | Shares | | | Amount | |
| | | | | | |
| | | | | | | | |
Shares sold | | | 3,000,000 | | | $ | 30,000,000 | |
| | | | | | | | |
Shares issued in reinvestment of dividends and distributions | | | 728 | | | | 7,407 | |
| | | | | | | | |
| | | | | | | | |
Net increase | | | 3,000,728 | | | $ | 30,007,407 | |
| | | | | | | | |
* Commencement of investment operations.
| | | | | | | | | | | | | | | | |
| | Emerging Markets Fund | |
| | | | | | | | | | | |
| | Class I Shares
For the Period
January 1, 2010
to January 15, 2010 | | Class II Shares
For the Period
January 1, 2010
To October 20, 2010 | |
| | | | | |
| | Shares | | | Amount | | | Shares | | | Amount | |
| | | | | | | | | | | | |
| | | | | | | | | | | | |
Purchase premium | | | - | | | $ | - | | | | - | | | $ | 25,949 | |
| | | | | | | | | | | | | | | | |
Shares issued in reinvestment of dividends and distributions | | | - | | | | - | | | | 17,369 | | | | 305,494 | |
| | | | | | | | | | | | | | | | |
Shares redeemed | | | (3,223,085 | ) | | | (54,124,301 | ) | | | (2,751,773 | ) | | | (51,710,765 | ) |
| | | | | | | | | | | | | | | | |
| | | | | | | | | | | | | | | | |
Net decrease | | | (3,223,085 | ) | | $ | (54,124,301 | ) | | | (2,734,404 | ) | | $ | (51,379,322 | ) |
| | | | | | | | | | | | | | | | |
Page 73
NOTES TO FINANCIAL STATEMENTS (continued)
| | | | | | | | |
| | Emerging Markets Fund | |
| | | | | | |
| | Class III Shares
For the Year Ended
December 31, 2010 | |
| | | |
| | Shares | | | Amount | |
| | | | | | |
| | | | | | | | |
Shares sold | | | 11,050,026 | | | $ | 191,123,814 | |
| | | | | | | | |
Redemption fees | | | - | | | | 20,050 | |
| | | | | | | | |
Purchase premium | | | - | | | | 185,582 | |
| | | | | | | | |
Shares issued in reinvestment of dividends and distributions | | | 1,295,798 | | | | 23,994,385 | |
| | | | | | | | |
Shares redeemed | | | (417,973 | ) | | | (8,020,050 | ) |
| | | | | | | | |
| | | | | | | | |
Net increase | | | 11,927,851 | | | $ | 207,303,781 | |
| | | | | | | | |
| | | | | | | | | | | | | | | | |
| | Emerging Markets Fund | |
| | | | | |
| | Class I Shares
For the Year Ended
December 31, 2009 | | Class II Shares
For the Period January 2, 2009*
through December 31, 2009 | |
| | | | | |
| | Shares | | | Amount | | | Shares | | | Amount | |
| | | | | | | | | | | | |
| | | | | | | | | | | | | | | | |
Shares sold | | | 2,407,516 | | | $ | 39,900,000 | | | | 2,690,563 | | | $ | 23,374,000 | |
| | | | | | | | | | | | | | | | |
Purchase premium | | | - | | | | 18,118 | | | | - | | | | 18,528 | |
| | | | | | | | | | | | | | | | |
Shares issued in reinvestment of dividends and distributions | | | 55,468 | | | | 912,924 | | | | 43,841 | | | | 720,769 | |
| | | | | | | | | | | | | | | | |
| | | | | | | | | | | | | | | | |
Net increase (decrease) | | | 2,462,984 | | | $ | 40,831,042 | | | | 2,734,404 | | | $ | 24,113,297 | |
| | | | | | | | | | | | | | | | |
* Commencement of investment operations.
Page 74
NOTES TO FINANCIAL STATEMENTS (continued)
| | | | | | | | |
| | Emerging Markets Fund | |
| | | |
| | Class III Shares
For the Year Ended
December 31, 2009 | |
| | | |
| | Shares | | | Amount | |
| | | | | | |
| | | | | | | | |
Shares sold | | | 905,178 | | | $ | 9,869,439 | |
| | | | | | | | |
Purchase premium | | | - | | | | 88,355 | |
| | | | | | | | |
Shares issued in reinvestment of dividends and distributions | | | 225,128 | | | | 3,692,251 | |
| | | | | | | | |
Shares redeemed | | | (2,698,048 | ) | | | (23,374,000 | ) |
| | | | | | | | |
| | | | | | | | |
Net decrease | | | (1,567,742 | ) | | $ | (9,723,955 | ) |
| | | | | | | | |
The International Equity Fund charges purchase premiums (20 basis points) in the case of share subscriptions and redemption fees (15 basis points) in the case of cash redemptions; the EAFE Fund charges purchase premiums (20 basis points) in the case of share subscriptions and redemption fees (15 basis points) in the case of cash redemptions; the EAFE Choice Fund charges purchase premiums (20 basis points) in the case of share subscriptions and redemption fees (15 basis points) in the case of redemptions and the Emerging Markets Fund charges purchase premiums (55 basis points) in the case of share subscriptions and redemption fees (25 basis points) in the case of cash redemptions. The purchase premiums and redemption fees may be waived or reduced by the Manager if the brokerage and transaction costs in connection with the purchase or redemption are minimal or in other circumstances in the Manager’s discretion.
Note E – Beneficial Ownership
The beneficial ownership, either directly or indirectly, of more than 25% of the voting securities of a Fund creates a presumption of control under Section 2(a)(9) of the 1940 Act. As of December 31, 2010, Kentucky Teachers’ Retirement System owned 30.53% of the EAFE Fund; the Guardian Life Insurance Company owned 54.61% and Graphic Packaging Holdings Company owned 45.39% of the EAFE Choice Fund; and Nebraska State Investment Council owned 30.72% of the Emerging Markets Fund. Purchase and redemption activity of these accounts may have a significant effect on the operation of the Fund.
Page 75
NOTES TO FINANCIAL STATEMENTS (concluded)
Note F – Commitments and Contingencies
Each of the Funds indemnifies the Trust’s officers and Trustees for certain liabilities that might arise from their performance of their duties to the Fund. Additionally, in the normal course of business, each Fund enters into contracts that contain a variety of representations and warranties and which provide general indemnifications. The Funds’ maximum exposure under these arrangements is unknown, as this would involve future claims that may be made against the Funds that have not yet occurred. However, based on experience, the Funds expect the risk of loss to be remote.
Note G – Affiliated Parties and Transactions
The affiliated holding is a foreign mutual fund which is managed by the Manager or an affiliate of the Manager. Transactions with the affiliated company for the year ended December 31, 2010 are as follows:
| | | | | | | | | | | | | | | | | | | | | | | | | |
| | Balance of
Shares
Held | | Value at | | Purchases/ | | Sales/ | | Balance of
Shares
Held | | Value at | | Dividend | | Realized | |
Affiliated Fund Name | | 12/31/2009 | | 12/31/2009 | | Additions | | Reductions | | 12/31/2010 | | 12/31/2010 | | Income | | Gain | |
EAFE Choice Fund | | | | | | | | | | | | | | | | | | | | | | | | | |
Baillie Gifford Japanese Smaller Cos. Fund | | | 31,987 | | $ | 509,883 | | | - | | | 31,987 | | | - | | $ | - | | $ | - | | $ | 19,583 | |
Note H – New Accounting Pronouncement
In January 2010, the Financial Accounting Standards Board (“FASB”) issued Accounting Standards Update (“ASU”) No. 2010-06 “Improving Disclosures about Fair Value Measurements.” ASU No. 2010-06 amends FASB Accounting Standards Codification Topic 820, Fair Value Measurements and Disclosures, to clarify existing disclosures and to require additional disclosures regarding fair value measurements. These additional disclosures required by ASU No. 2010-06 are effective for fiscal years beginning after December 15, 2010, and for interim periods within those fiscal years. Management is presently evaluating the impact is on the financial statements of these disclosure requirements.
Note I – Subsequent Events
Events or transactions that occur after the financial statement date but before the financial statements are issued are categorized as recognized or non-recognized for financial statement purposes. Management of the Funds has evaluated subsequent events and has determined there were no events that required recognition or disclosure in the Funds’ financial statements.
Page 76
REPORT OF INDEPENDENT REGISTERED PUBLIC ACCOUNTING FIRM
To the Board of Trustees of Baillie Gifford Funds
and Shareholders of Baillie Gifford International Equity Fund,
Baillie Gifford EAFE Fund, Baillie Gifford EAFE Choice Fund and
Baillie Gifford Emerging Markets Fund
We have audited the accompanying statements of assets and liabilities of Baillie Gifford International Equity Fund, Baillie Gifford EAFE Fund, Baillie Gifford EAFE Choice Fund and Baillie Gifford Emerging Markets Fund, each a series of shares of beneficial interest of Baillie Gifford Funds, including the portfolios of investments, as of December 31, 2010, and the related statements of operations for the year then ended and the statements of changes in net assets for each of the years and periods presented in the two-year period then ended and the financial highlights for each of the years and periods presented in the five-year period then ended. These financial statements and financial highlights are the responsibility of the Funds’ management. Our responsibility is to express an opinion on these financial statements and financial highlights based on our audits.
We conducted our audits in accordance with the standards of the Public Company Accounting Oversight Board (United States). Those standards require that we plan and perform the audits to obtain reasonable assurance about whether the financial statements and financial highlights are free of material misstatement. An audit includes examining, on a test basis, evidence supporting the amounts and disclosures in the financial statements. Our procedures included confirmation of securities owned as of December 31, 2010 by correspondence with the custodian and brokers or by other appropriate auditing procedures where replies from brokers were not received. An audit also includes assessing the accounting principles used and significant estimates made by management, as well as evaluating the overall financial statement presentation. We believe that our audits provide a reasonable basis for our opinion.
In our opinion, the financial statements and financial highlights referred to above present fairly, in all material respects, the financial position of Baillie Gifford International Equity Fund, Baillie Gifford EAFE Fund, Baillie Gifford EAFE Choice Fund and Baillie Gifford Emerging Markets Fund as of December 31, 2010, the results of their operations for the year then ended, the changes in their net assets for each of the years and periods presented in the two-year period then ended, and their financial highlights for each of the years and periods presented in the five-year period then ended, in conformity with accounting principles generally accepted in the United States of America.
| |
| 
|
| |
| BBD, LLP |
Philadelphia, Pennsylvania
February 24, 2011
Page 77
Supplemental Information (unaudited)
Qualified dividend income of as much as $7,070,906, $20,793,762, $1,444,045 and $3,802,154 was taxable to the International Equity, EAFE, EAFE Choice and Emerging Markets Funds, respectively, through December 31, 2010. The Funds intend to designate the maximum amount of dividends that qualify for the reduced tax rate pursuant to the Jobs and Growth Tax Relief Reconciliation Act of 2003.
For the year ended December 31, 2010, Emerging Markets Fund designates $11,767,673 as long-term capital gains dividends.
In February 2011, you will be advised on IRS Form 1099 DIV or substitute 1099 DIV as to the U.S. federal tax status of distributions received by you in the calendar year 2010.
Page 78
Supplemental Information (unaudited)
MANAGEMENT OF THE TRUST
The following tables set forth the Trustees and Officers of the Trust, their principal occupations during the past five years, and certain other information.
| | | | | �� | | | | | | | | |
Name and Age(1) | | | Position(s)
Held with
Trust | | | Length of
Time
Served(2) | | | Principal Occupation During Past 5 Years(3) | | | Number of Funds in
Fund complex
overseen by Trustee | |
Trustees |
John G. Barrie, Jr.
Age: 70 | | | Trustee | | | Since 2000 | | | Retired. Formerly: Assistant Treasurer, Dominion Resources, Inc. (electric and gas utility).
| | | 4 | |
George W. Browning
Age: 69 | | | Trustee | | | Since 2007 | | | Retired. Formerly: Managing Director, Client Service, Babson Capital Management, LLC (investment manager). | | | 4 | |
Bruce C. Long
Age: 65 | | | Trustee | | | Since 2009 | | | Consultant, Carpenter Group (financial services); Consultant, DALBAR, Inc., (financial measurements). Formerly: Executive Vice President, Guardian Life Insurance (financial services) and director of various entities. | | | 4 | |
Interested Trustee |
Peter Hadden(4)
Age: 53 | | | Trustee, Chairman of the Board, and President | | | Since 2009 | | | Partner, Baillie Gifford & Co. (investment manager); Director, Baillie Gifford Overseas Ltd. (investment adviser). | | | 4 | |
Officers (other than Officers who are also Trustees) |
Edward H. Hocknell
Age: 50 | | | Vice President | | | Since 2000 | | | Partner, Baillie Gifford & Co. (investment manager); Director, Baillie Gifford Overseas Limited (investment adviser). | | | N/A | |
Alan Paterson
Age: 43
| | | Vice President | | | Since 2000 | | | Partner, Baillie Gifford & Co. (investment manager). | | | N/A | |
Dickson Jackson
Age: 39 | | | Vice President | | | Since 2005 | | | Director, Investment Operations, Baillie Gifford & Co. (investment manager); Director, Baillie Gifford Overseas Limited (investment adviser). | | | N/A | |
Andrew Telfer
Age: 43 | | | Vice President | | | Since 2008 | | | Partner, Baillie Gifford & Co. (investment manager); Director, Baillie Gifford Overseas Limited (investment adviser). | | | N/A | |
Peter Cooke
Age: 45 | | | Vice President | | | Since 2008 | | | Partner, Baillie Gifford & Co. (investment manager); Chief Executive, Baillie Gifford Overseas Limited (investment adviser). | | | N/A | |
Nigel Cessford
Age: 47 | | | Treasurer | | | Since 2005 | | | Head of Overseas Institutional Clients Accounting Department, Baillie Gifford & Co. (investment manager). | | | N/A | |
Angus N.G. Macdonald
Age: 45 | | | Secretary | | | Since 2000 | | | Head of Legal for the Baillie Gifford Group (investment manager). | | | N/A | |
Graham Laybourn
Age: 44 | | | Chief Compliance Officer | | | Since 2005 | | | Compliance Officer, Baillie Gifford Group (investment manager). | | | N/A | |
Page 79
Supplemental Information (unaudited)(concluded)
| |
(1) | The address of each trustee and Officer of the Trust is c/o Baillie Gifford Funds, Calton Square, 1 Greenside Row, Edinburgh, Scotland EH1 3AN. |
| |
(2) | There is no stated term of office for the trustees. The Chairman of the Board, President, Secretary, and Treasurer of the Trust are elected annually by the Trustees. Other officers may be elected or appointed by the trustees at any time. |
| |
(3) | Previous positions during the past five years with Baillie Gifford & Co., the Manager and Baillie Gifford Group are omitted if not materially different from the positions listed. |
| |
(4) | Mr. Hadden is an “interested person” (as defined in the 1940 Act) of the Trust or the Manager due to his positions with the Manager (Baillie Gifford Overseas Ltd.) and his role as an officer of the Trust. |
Additional information regarding the Trustees is in the Funds’ Statement of Additional Information and is available upon request, without charge, by calling Baillie Gifford Overseas Limited at 011-44-131-275-2000.
A description of the Funds’ proxy voting policies and procedures related to portfolio securities is available without charge, upon request, by calling Baillie Gifford Overseas Limited at 011-44-131-275-2000 or on the SEC’s website at http://www.sec.gov. Shareholders may submit to the Trust claim for reimbursement of telephone charges incurred in placing such calls.
Information regarding how the Funds’ voted proxies relating to portfolio securities during the most recent 12-month period ended June 30 is also available without charge upon request by calling Baillie Gifford Overseas Limited at 011-44-131-275-2000 or by accessing the Fund’s Form N-PX on the SEC’s website at http://www.sec.gov. Shareholders may submit to the Trust claim for reimbursement of telephone charges incurred in placing such calls.
Each of the Funds files its complete schedule of portfolio holdings with the SEC for the first and third quarters of each fiscal year on Form N-Q. The Funds’ Form N-Q is available on the SEC’s website at http://www.sec.gov. The Funds’ Form N-Q may also be viewed and copied at the SEC’s Public Reference Room in Washington, DC; information on the operation of the Public Reference Room may be obtained by calling (800) SEC-0330.
Page 80
Item 2. Code of Ethics.
| |
(a) | As of December 31, 2010, the registrant has adopted a code of ethics (the “Code of Ethics”) that applies to its principal executive officer, principal financial officer, principal accounting officer or controller, or persons performing similar functions. |
| |
(b) | Not applicable. |
| |
(c) | The registrant has not amended its Code of Ethics during the period covered by the shareholder report presented in Item 1 hereto. |
| |
(d) | The registrant has not granted a waiver or an implicit waiver from a provision of its Code of Ethics during the period. |
| |
(e) | Not applicable. |
| |
(f) | The registrant’s Code of Ethics is attached hereto as an exhibit |
Item 3. Audit Committee Financial Expert.
The registrant’s Board of Trustees has determined that Mr. John G. Barrie, Jr., a member of the Board’s Audit Oversight Committee, is an audit committee financial expert. Mr. Barrie is “independent” for purposes of this Item 3 of Form N-CSR. Mr. Barrie formerly served in various supervisory and managerial positions in accounting and finance at Dominion Resources, Inc. and affiliates. In these positions, Mr. Barrie was extensively involved in the preparation, analysis and use of corporate financial statements. In the capacity of Assistant Treasurer of Dominion Resources, Inc., Mr. Barrie had principal responsibility for administering the investment of over $1 billion of retirement plan assets, and was involved with internal and external auditors in establishing internal controls and procedures relating to the administration and reporting of retirement plan investments.
Item 4. Principal Accountant Fees and Services.
(a) - (d)
Fees for Services Rendered to the Registrant
| | | | | | | | | |
| Fiscal Year | | Audit Fees | | Audit-Related Fees | | Tax Fees | | All Other Fees |
| | | | | | | | | |
| 2009 | | $67,300 | | $8,400 | | $16,000 | | $0 |
| | | | | | | | | |
| 2010 | | $76,000 | | $0 | | $16,000 | | $0 |
Audit fees include amounts for auditing and reporting on the financial statements and the financial highlights included in the Funds annual report to the shareholders, issuance of the auditor’s consent to be included in the Funds’ annual amendment to the Registration Statement on Form N-1A, issuance of the auditor’s report on internal controls for inclusion in form N-SAR and provision of comments on the Funds’ interim financial statements (as requested). The audit fees above represent the amounts billed for services provided for the fiscal year indicated, not the amounts billed during such year.
Audit-related fees include amounts billed for assurance and related services rendered to the registrant, including consultations related to financial accounting and reporting standards. The audit-related fees above represent the amounts billed during the fiscal year indicated.
Tax fees include amounts for services rendered to the registrant for tax compliance, tax planning and tax advice, including tax return preparation and review of and participation in determining required income and capital gains distributions. The tax fees above represent the amounts billed during the fiscal year indicated.
(e) (1) Engagements that are required to be pre-approved by the registrant’s Audit Oversight Committee, “the Committee”, may be pre-approved (i) at any regular or special meeting of the Committee or (ii) by the Chairman of the Committee or any other member of the Committee who is an independent trustee of the registrant if the estimated dollar amount of the fee for the particular service does not exceed a certain threshold.
(e) (2) Not applicable.
(f) Not applicable.
(g) The aggregate non-audit fees billed by the registrant’s accountant for services rendered to the registrant and rendered to the registrant’s investment adviser and any entity controlling, controlled by, or under common control with the adviser that provides ongoing services to the registrant were as follows:
2009: $25,000
2010: $16,000
The amount set forth for each fiscal year includes: (i) the aggregate of amounts disclosed in Item 4 (b), (c), and (d) above for Audit-Related Fees, Tax Fees and All Other Fees, plus (ii) the aggregate amount of any non-audit fees billed to the registrant’s investment adviser and any entity controlling, controlled by, or under common control with the adviser that provides ongoing services to the registrant. This additional amount under clause (ii) for the 2009 fiscal year totaled $600 and for the 2010 fiscal year totaled $0.
(h) In evaluating the independence of the registrant’s accountant, the Audit Oversight Committee of the registrant’s Board of Trustees considered the provision of non-audit services, which were not pre-approved pursuant to Rule 2-01(c)(7)(ii) of Regulation S-X, rendered to the registrant’s investment adviser and any entity controlling, controlled by or under common control with the investment adviser that provides ongoing services to the registrant and determined that the
provision of such services, if any, is compatible with maintaining the principal accountant’s independence.
Item 5. Audit Committee of Listed Registrants.
Not applicable.
Item 6. Investments.
(a) The schedule of investments is included as part of the report to shareholders filed under Item 1 of this form.
(b) Not applicable.
Item 7. Disclosure of Proxy Voting Policies and Procedures for Closed-End Management Investment Companies.
Not applicable.
Item 8. Portfolio Managers of Closed-End Management Investment Companies.
Not applicable.
Item 9. Purchases of Equity Securities by Closed-End Management Investment Company and Affiliated Purchasers.
Not applicable.
Item 10. Submission of Matters to a Vote of Security Holders.
Not applicable.
Item 11. Controls and Procedures.
(a) The President and Treasurer of the registrant have concluded, based on their evaluation of the effectiveness of the registrant’s disclosure controls and procedures (as defined in Rule 30a-3(c) under the Act) as of a date within 90 days of the filing date of this report on Form N-CSR, that to the best of their knowledge the design and operation of such procedures provide reasonable assurance that information required to be disclosed by the registrant in this report on Form N-CSR is recorded, processed, summarized, and reported within the time periods specified in the Securities and Exchange Commission’s rules and forms.
(b) There has been no change in the registrant’s internal controls over financial reporting (as defined in Rule 30a-3(d) under the Act) that occurred during the second fiscal quarter of the period covered by this report that has materially affected, or is reasonably likely to materially affect, the registrant’s internal control over financial reporting.
Item 12. Exhibits
(a)(1) Code of Ethics.
(a)(2)(i) Certification of the Principal Executive Officer required by Rule 30a-2 under the Act.
(a)(2)(ii) Certification of the Principal Financial Officer required by Rule 30a-2 under the Act.
(a)(3) Not applicable.
(b) Not applicable.
SIGNATURES
Pursuant to the requirements of the Investment Company Act of 1940, the registrant has duly caused this report to be signed on its behalf by the undersigned, thereunto duly authorized.
| |
(Registrant) | BAILLIE GIFFORD FUNDS |
| | |
By | /s/ Peter Hadden | |
| Peter Hadden, President | |
Pursuant to the requirements of the Investment Company Act of 1940, this report has been signed below by the following persons on behalf of the registrant and in the capacities and on the dates indicated.
| | |
By | /s/ Peter Hadden | |
| Peter Hadden, President | |
| | |
By | /s/ Nigel Cessford | |
| Nigel Cessford, Treasurer | |