Management Discussion
The International Equity Fund
Market Conditions and Review of Performance During 2012
The final quarter proved to be a strong finish to 2012 which was an eventful year; markets were mainly driven by macroeconomic factors, and the resultant swing of the investment pendulum between the “risk on and risk off” trade has made it at times, turbulent. However for equity investors, it will be remembered as a positive year. Despite media articles proclaiming “the death of equities”, the MSCI ACWI ex U.S. Index rose sharply.
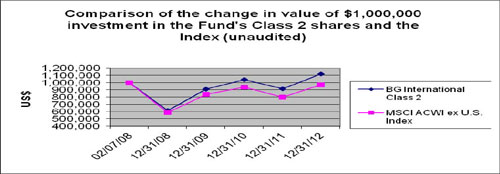
The International Equity Fund Class 2 shares returned 22.33% during 2012, outperforming the MSCI ACWI ex U.S. Index which returned 17.39% for the year.
The first three months of 2012 got off to a healthy start, as the aura of panic that had prevailed during 2011 appeared to dissipate. As we moved into the second quarter of 2012, we saw the unwelcome return of the fear and risk aversion that has repeatedly come to the fore since the onset of the global financial crisis. Developments in the Eurozone, a moderation of growth in the U.S., and signs of a slowdown in China coincided to renew investors’ worry about synchronized economic weakness. In this cautious environment, the prices of equities ranging from Spanish banks to American retailers to Chinese consumer companies fell in unison. As we moved into the third quarter, we saw global stock markets rally strongly, the initial catalysts being policy action to avert the unlikely but disastrous scenario of Eurozone breakup, and another round of stimulus from the Federal Reserve. Central bankers sought to convince investors that tail risks would not be allowed to come to pass, and to create an atmosphere of confidence more conducive to economic growth. Against a backdrop of increased confidence and risk appetite, the fourth quarter proved to be a strong finish to an eventful, yet positive year, for international equities. Perhaps the ‘landmark’ event of the year for stock markets was European Central Bank President Draghi’s commitment, declared during the second half of 2012, to “do whatever it takes to preserve the Euro”. This statement almost certainly calmed the market’s concerns about the tail risks for the Eurozone; with the financial crisis so fresh in investors’ memories, the impact of ‘panic’ in such an interconnected world should not be understated. Draghi’s bold rhetoric has been followed up by productive discussions on banking union and continued support for Greece.
The portfolio outperformed its benchmark over the year, with the majority of relative outperformance attributable to stock selection, particularly in Continental Europe and Emerging Markets. Among the top stock contributors were Magnit (Russian food retailer), Samsung Electronics (South Korean electronics manufacturer), Inditex (Spanish fashion retailer), BIM (Turkish hard discount food retailer), Aker Solutions (Norwegian oil service company) and Kone (Finnish escalator and elevator manufacturer). Inditex is an example of a stock that demonstrates that it is company fundamentals that matter; Inditex being Spanish listed and with a quarter of group sales coming from Spain. Stocks that detracted from the fund’s relative performance over the year include Fairfax Financial Holdings (Canadian insurer), Rakuten (Japanese online shopping mall), Baidu (Chinese internet search engine) and Tullow Oil (UK oil exploration and production company).
We continue to find exciting investment opportunities for the portfolio. For example, we have taken holdings in NHN (South Korea’s dominant search engine), Burberry (UK listed international clothing designer and retailer), Westport Innovations (a Canadian company which makes technology that enables diesel engines to use natural gas) and ARM Holdings (a UK company that designs chips that are licensed to semiconductor and technology hardware companies). The portfolio is dominated by well-financed businesses with attractive long-term growth prospects, and retains a bias towards companies that are well placed to benefit from rising domestic consumption in Emerging Markets. The portfolio has limited direct exposure to European banks, with Svenska Handelsbanken, a traditional well capitalised Swedish bank, the only such holding. A sharp recovery in lower quality financials remains a risk to the portfolio, but we remain committed to our style of investing in well
1
Management Discussion
The International Equity Fund
managed growth businesses. The portfolio comprises a diverse range of companies, but on the whole the attributes of a strong industry background, durable competitive advantage, good management and strong financial characteristics are important aspects of the holdings, and this should stand the portfolio in good stead over the longer term.
Investment Strategies used to Manage the Fund
Baillie Gifford is a growth manager with a bottom up approach to stock picking. We aim to invest in companies that will generate sustainable earnings growth above that of the market over the long term. In determining the potential of a company, we analyse industry background, competitive advantage, management attitudes and financial strength, and finally we consider valuation. We meet the management of the companies within our investment universe and revisit the investment case for the portfolio’s holdings on a regular basis to ensure that our expectations are being met.
The ACWI ex US Alpha Portfolio Construction Group is responsible for the overall strategy and stock selection process. They meet regularly to discuss both buy and sell ideas and the level of conviction for existing holdings and will continue to monitor the long term prospects for the Fund’s holdings and make changes where appropriate.
Outlook
Whilst many of the issues that have caused stock market volatility over the last few years remain, there are reasons to be optimistic; globally, monetary policy has never been looser, central banks have demonstrated that they can act aggressively, China is moving towards relying more on domestic consumption, and the double-digit returns from U.S. equities show that there is a belief that the recovery which has started in the housing market may spread more widely in 2013. In the longer term, the abundant supplies of cheap energy from shale deposits should provide a boost to expenditure and investment across the whole of North America. Against this backdrop, there are some outstanding growth businesses, and our focus, as ever, will be on investing in well managed growth companies that should outperform over the longer term. And if markets remain volatile, this should present opportunities, given our long-term approach to investing.
| |
| | | |
Fund Performance for periods ended 12/31/12 (Average Annual Total Returns) |
| | | | | |
| | One Year | | Since Inception
(February 7, 2008) | |
| | | | | |
The International Equity | | | | | |
Fund Class 2 | | 22.33% | | 2.38% | |
| | | | | |
MSCI ACWI ex U.S. Index | | 17.39% | | -1.03% | |
| | | | | |
The returns for Class 2 shares have been provided. One-year return figures for other share classes are as follows: 22.17% for Class 1, 22.50% for Class 3, and 22.51% for Class 4. Additional year-over-year returns for each class are available in the Financial Highlights section.
2
Management Discussion
The International Equity Fund
3
Management Discussion
International Choice Fund
Market Conditions and Review of Performance During 2012
Not applicable: The International Choice Fund was initially funded in September 2012.
Investment Strategies used to Manage the Fund
Baillie Gifford is a growth manager with a bottom up approach to stock picking. We aim to invest in companies that will generate sustainable earnings growth above the market over the long term. In determining the potential of a company, we analyse industry background, competitive advantage, management attitudes and financial strength, and finally we consider valuation. We meet the management of the companies within our investment universe and revisit the investment case for the portfolio’s holdings on a regular basis to ensure that our expectations are being met.
The International Focus Portfolio Construction Group (PCG) is responsible for the overall strategy and stock selection process. They meet regularly to discuss both buy and sell ideas and the level of conviction for existing holdings and will continue to monitor the long term prospects for the Fund’s holdings and make changes where appropriate.
Outlook
We remain alert to the argument that there is still plenty to worry about in Europe. Most of the Eurozone currency bloc countries remain in recession, some of the larger banks remain potentially vulnerable to further capital shocks, and there are forthcoming elections in Italy and Germany which add a degree of uncertainty. As austerity constrains the public purse in most Western economies, the economic outlook may depend more than usual on a pick up in confidence in the private sector.
For all that, we remain unapologetically optimistic on the long term outlook for equity markets and for the portfolio. We accept that the long term impact on the real economy from the unprecedented monetary easing of recent years is uncertain. We can however observe that policymakers in the US, Europe and elsewhere, given both their determined actions to date and indications of future intent, are highly unlikely to sit idly by in the face of the economic challenges ahead. We are also encouraged by the early signs of a recovery in the US housing market from a low base and after a long wait. We would also observe that, even without a significant US recovery, the global economy continues to expand at a reasonable and possibly accelerating rate into 2013. Finally, and most important of all, we remain excited by the many long term growth opportunities available to the individual businesses in which we invest on your behalf. We are hopeful that they have the potential to exploit some terrific opportunities in large and expanding markets and that, in aggregate, they will deliver impressive earnings growth over the long term.
4
Management Discussion
The EAFE Fund
Market Conditions and Review of Performance During 2012
During 2012, our conviction was reinforced that the world economy will continue to recover slowly from the depredations of the financial crisis. In particular we believe that while various tail risks might continue to dominate discussion, the likelihood that they will disrupt the recovery has dramatically receded. As we look beyond the current business cycle, we believe that powerful long term forces such as globalisation and technological change make it appropriate for us to prioritise growth above stability, and to hunt for the relatively small number of winning companies that can make a real difference to our clients’ investment returns.
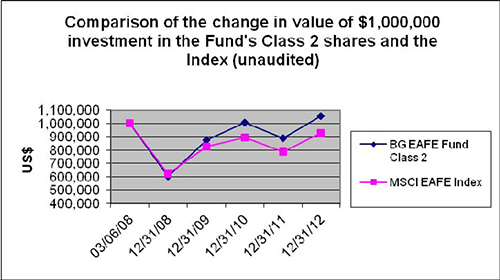
The EAFE Fund Class 2 shares produced a return of 18.78% during 2012, compared to the MSCI EAFE Index which returned 17.90% for the year.
We aim to invest in companies with significant growth opportunities and the competitive strength to make substantial profits from those opportunities. We observe several economic and social trends, such as the ongoing development of China, the increasing reach of the internet and the increasing commonality of consumer taste around the world, which should help to drive the growth of our investments. Tencent and Inditex are two companies that benefit from these trends and have performed strongly during the year. The Chinese social network company, Tencent, is successfully monetising its vast user base and moving into the mobile arena. Spanish-based clothing retailer Inditex also defied tough conditions in its home market to perform exceptionally well as its global expansion continued.
The Fund’s luxury goods holdings performed well, with Richemont particularly strong. The allure of luxury goods to the Chinese continues to drive profits in this sector. Strong sales continue despite fears regarding the slowing of the Chinese economy.
In contrast, Brazilian oil explorer OGX was the main detractor from relative performance, after disappointing production news and a management reshuffle. In addition, Japanese technology holdings, Gree and Rakuten, underperformed during 2012. Gree, the online gaming company, performed poorly following a well publicised regulatory crackdown on the so called ‘kompu gacha’ payment method for online games. We think the market’s reaction has been excessive with Gree having many opportunities, both home and overseas. Rakuten, the e-commerce company, also has international aspirations. However, it underperformed during the year as competition from Amazon Japan intensified.
Investment Strategies used to Manage the Fund
Baillie Gifford is a growth manager with a bottom up approach to stock picking. We aim to invest in companies that will generate sustainable earnings growth above the market over the long term. In determining the potential of a company, we analyse industry background, competitive advantage, management attitudes and financial strength, and finally we consider valuation. We meet the management of the companies within our investment universe and revisit the investment case for the portfolio’s holdings on a regular basis to ensure that our expectations are being met.
The EAFE Alpha Portfolio Construction Group is responsible for the overall strategy and stock selection process. They meet regularly to discuss both buy and sell ideas and the level of conviction in their continuing holdings.
5
Management Discussion
The EAFE Fund
Outlook
The current gloomy and nervous market, where stability is prized above long term growth prospects, offers many opportunities for the patient investor:
| |
1. | The powerful long term forces of globalisation and technological change make it appropriate for us to prioritise growth above stability. |
2. | The positive reforms in Europe are being drowned out by negative coverage of the region. We made several investments in attractive European businesses during the year and continue to research beneficiaries of positive change in Europe. |
3. | The rising prosperity of the citizens of many emerging market countries has been a vital factor in the world economy in the past two decades. We believe it will continue, with the area of most rapid change shifting from China to Africa, where falling child mortality and lower birth rates presage greater prosperity. |
| |
| | | |
Fund Performance for periods ended 12/31/12 (Average Annual Total Returns) |
| | | | | |
| | One Year | | Since Inception
(March 6, 2008) | |
| | | | | |
| | | | | |
The EAFE | | | | | |
Fund Class 2 | | 18.78% | | 1.12% | |
| | | | | |
MSCI EAFE Index | | 17.90% | | -1.48% | |
| | | | | |
The returns for Class 2 shares have been provided. One-year return figures for other share classes are as follows: 18.50% for Class 1 and 18.82% for Class 3.
Additional year-over-year returns for each class are available in the Financial Highlights section.
6
Management Discussion
EAFE Choice Fund
Market Conditions and Review of Performance During 2012
It may not have felt likely at times but, as 2012 draws to a close, it looks as if the rather low key final quarter has capped off a better than respectable year for equity returns. Helped by a recovery in the Euro from the depressed levels of the summer, the MSCI EAFE Index benchmark delivered a return of 17.90% over the 12 months when measured in dollars. Given the recurring bouts of collective macroeconomic angst during the year – on everything from the stop-start US economy, the sustainability of the Euro to the (so far unjustified) fears of a Chinese hard landing – such a solid outcome is reassuring to those of us more interested in companies rather than countries as the true driver of long term equity returns.
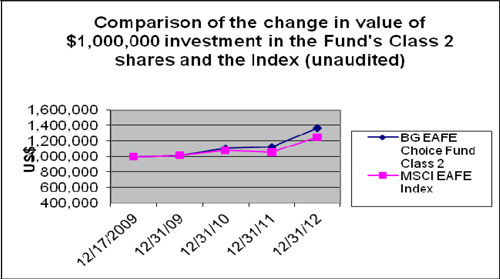
The EAFE Choice Fund Class 2 shares produced a return of 21.81% during 2012, outperforming the MSCI EAFE Index benchmark which returned 17.90% for the year.
ASOS (the UK online fashion retailer) performed well, helped by good operational performance in its domestic market, and encouraging evidence that it can sustain rapid growth in other international markets. When measured against short term levels of profitability its valuation can be a source of some angst, but taking a longer term view than the market, we believe this business has the potential to be many times larger in the future. Three financial stocks appeared among the top contributors to relative performance over the year; Garanti Bankasi, the Turkish bank, Svenska Handelsbanken the Swedish bank and Hargreaves Lansdown, the UK online financial services company.
Several of the Japanese holdings detracted from relative performance over the year. Holdings like the games developer Namco Bandai, the e-commerce business Rakuten, the electronics company Rohm, the oil company Inpex and the games machine manufacturer Sankyo all detracted. As far as we are aware nothing has gone especially wrong here, but a pronounced feature of the Japanese market of late has been the weakening of the Yen. As can often happen there, this seems to have prompted a sharp rotation in that market towards previously unloved currency sensitive exporters, away from some of the longer term quality growth businesses which we still think will be more rewarding investments over the longer term. We made modest additions to names like bicycle equipment leader, Shimano, to take advantage of what we view as a temporary blip in the markets’ assessment of its long term prospects.
Investment Strategies used to Manage the Fund
Baillie Gifford is a growth manager with a bottom up approach to stock picking. We aim to invest in companies that will generate sustainable earnings growth above the market over the long term. In determining the potential of a company, we analyse industry background, competitive advantage, management attitudes and financial strength, and finally we consider valuation. We meet the management of the companies within our investment universe and revisit the investment case for the portfolio’s holdings on a regular basis to ensure that our expectations are being met.
The International Focus Portfolio Construction Group (PCG) is responsible for the overall strategy and stock selection process. They meet regularly to discuss both buy and sell ideas and the level of conviction for existing holdings and will continue to monitor the long term prospects for the Fund’s holdings and make changes where appropriate.
7
Management Discussion
EAFE Choice Fund
Outlook
We remain alert to the argument that there is still plenty to worry about in Europe. Most of the Eurozone currency bloc countries remain in recession, some of the larger banks remain potentially vulnerable to further capital shocks, and there are forthcoming elections in Italy and Germany which add a degree of uncertainty. As austerity constrains the public purse in most Western economies, the economic outlook may depend more than usual on a pick up in confidence in the private sector.
For all that, we remain unapologetically optimistic on the long term outlook for equity markets and for the portfolio. We accept that the long term impact on the real economy from the unprecedented monetary easing of recent years is uncertain. We can however observe that policymakers in the US, Europe and elsewhere, given both their determined actions to date and indications of future intent, are highly unlikely to sit idly by in the face of the economic challenges ahead. We are also encouraged by the early signs of a recovery in the US housing market from a low base and after a long wait. We would also observe that, even without a significant US recovery, the global economy continues to expand at a reasonable and possibly accelerating rate into 2013. Finally, and most important of all, we remain excited by the many long term growth opportunities available to the individual businesses in which we invest on your behalf. We are hopeful that they have the potential to exploit some terrific opportunities in large and expanding markets and that, in aggregate, they will deliver impressive earnings growth over the long term.
| |
| | | |
Fund Performance for periods ended 12/31/12 (Average Annual Total Returns) |
| | | | | |
| | One Year | | Since Inception
(December 17,
2009)* | |
| | | | | |
| | | | | |
The EAFE Choice | | | | | |
Fund Class 2 | | 21.81% | | 8.04% | |
| | | | | |
MSCI EAFE Index | | 17.90% | | 4.03% | |
| | | | | |
*Class 2 had no shareholders from January 16, 2010 to March 24, 2010. All shares of this class were redeemed at $10.48 on January 15, 2010. New shares were issued at $10.20 on March 25, 2010.
8
Management Discussion
EAFE Choice Fund
9
Management Discussion
The Emerging Markets Fund
Market Conditions and Review of Performance During 2012
Over the past 12 months, Emerging Markets posted strong absolute returns, outperforming Developed Markets as China’s economy stubbornly refused to collapse, political transitions affecting over half of the region’s population went relatively smoothly and the Arab Spring did not spread to Russia.
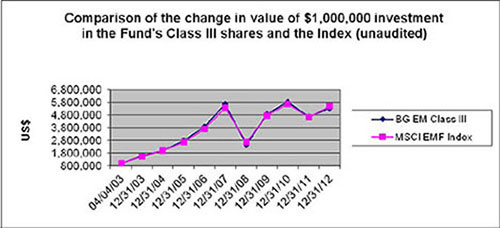
The Emerging Markets Fund Class III shares returned 13.94% during 2012, underperforming the MSCI Emerging Markets Index which returned 18.63% for the year.
The Turkish market was the best-performing market in the MSCI Emerging Markets Index over the year on the back of sustained economic growth. With the ratings agencies raising Turkish government bonds to investment grade, it appears that the unorthodox monetary policies implemented during 2010–2011 may have averted the economic hard landing that many feared. The Thai market also performed well on the back of a rebound in domestic demand and investor confidence following the devastation of the floods in 2011. However, concerns regarding a slowdown in growth in the Chinese economy impacted commodity-driven markets such as Brazil, Indonesia and Russia. The Brazilian market notably underperformed the rest of the index suffering from not only a decline in demand for its key commodities, but also a slowdown in GDP growth. After a very strong 2011, the Indonesian stock market also underperformed the index this year. Its economy posted a record trade deficit and the rupiah had a difficult time on the back of poor demand for Indonesia’s key exports of coal, tin, and palm oil, combined with high domestic demand for fuel imports. With subsequent improvements in the sentiment surrounding the macroeconomic environment towards the end of the year, the MSCI Emerging Markets index rebounded. The Chinese and South Korean markets, two large index constituents, both closed 2012 ahead of the index, the latter assisted by the stellar rise of technology stocks such as Samsung Electronics. The Indian market also had a strong second half of the year as there were some signs that the government is implementing more market-friendly policies. However, we remain skeptical as we feel there is still much to be done.
Despite a strong year of absolute returns, gloom remains the dominant sentiment among investors and commentators. Combined with relentless pressure on pension funds from regulators and accounting standards, we have seen a great premium placed on near-term earnings predictability. This has meant a significant stylistic challenge to our investment approach over the past couple of years, which has left performance this year significantly behind where we would like it to be.
Stock selection in the energy sector was the largest drag on relative performance over the year. The Fund continues to have meaningful exposure to frontier oil exploration and production (E&P) companies, which we believe provide some of the most undervalued growth prospects available to the emerging market investor. Tullow Oil is the largest of these holdings. The shares fell this year, however, after some individual well results in Ghana, Kenya, and French Guiana disappointed the market. Given the number of wells still to be drilled, the proven reserves already accounted for, and the assets already in production, it seems extraordinary to us that the market is now valuing this company at such a low level. Niko Resources is another E&P company that has suffered severely this year. The market has penalized the shares for the downgrade to its Indian gas reserves. In our view the attraction of this company is the potential in its significant Indonesian license area. Similarly, with regard to Gulf Keystone Petroleum, the market has been disappointed by negative news flow, but we would point to the company having upgraded the proven reserve estimates of its Shaikan field from 3.1 billion to 12.4 billion barrels over the last 12 months. By their nature, these stocks are volatile and can often present binary outcomes. For example, the Fund’s top performer of the year was another oil E&P company, African Petroleum Corp, due to a significant oil discovery in Liberia.
On the positive side, several of the Fund’s financial sector holdings performed well during the year, in particular the Turkish bank Garanti. GDP growth in Turkey has recently slowed, however, and with
10
Management Discussion
The Emerging Markets Fund
the recent quarterly figure below expectations, it was unsurprising in our view to see the central bank revert to more conventional policies, cutting its policy interest rate by 25 basis points in order to stimulate the economy.
The Fund’s holdings in two Chinese rail companies, China Railway Construction and CSR Corp., have also been among the top positive contributors over the year. Orders have picked up again from 2011, and the announcement of a significant investment into subways and inter-city rail projects returned confidence to these stocks.
Investment Strategies used to Manage the Fund
Baillie Gifford is a growth manager with a bottom up approach to stock picking. We aim to invest in companies that will generate sustainable earnings growth above the market over the long term. In determining the potential of a company, we analyse industry background, competitive advantage, management attitudes and financial strength, and finally we consider valuation. We meet the management of the companies within our investment universe and revisit the investment case for the portfolio’s holdings on a regular basis to ensure that our expectations are being met.
The Emerging Markets investment team is responsible for the overall strategy and stock selection process, led by the most senior investment managers. The team meets regularly to discuss both buy and sell ideas and to determine the level of conviction in the Fund’s holdings.
Outlook
2012 will always remind us of the frustrations of investment management. While some of the strong operational performance of the market leading global Information Technology players has been partly recognised by the market, the relative performance of the fund has been dominated by short-term noise and rumours surrounding the E&P holdings. We remain positive about the longer-term prospects for these companies given that many of them are still at an early stage of their exploration programmes or have exciting drilling programmes in distinct unrelated geographic areas. In addition to this, our relative caution on the outlook for large chunks of the MSCI Emerging Markets index where investors are willing to pay a substantial premium for stability of earnings is not at odds with our excitement about the portfolio. It is precisely by focusing on individual corporate innovators that we retain our optimism. We can rarely recall such extreme divergence of valuations within emerging markets between the apparently stable and durable business of the past, and the uncertain growth opportunities of the future. The world is not coming to an end. And we shall continue to embrace the uncertainty.
| | | | | | | |
Fund Performance for periods ended 12/31/12 (Average Annual Total Returns) |
|
| | One Year | | Five Year | | Since Inception
(April 4, 2003) | |
| | | | | | | |
| | | | | | | |
The Emerging Markets Fund Class III | | 13.94% | | -1.23% | | 18.70% | |
| | | | | | | |
MSCI Emerging Markets Index | | 18.63% | | -0.61% | | 17.19% | |
| | | | | | | |
11
Management Discussion
The Emerging Markets Fund
12
Management Discussion
The Global Alpha Equity Fund
Market Conditions and Review of Performance During 2012
Equity markets performed well over 2012. In Europe, a key event in 2012 occurred when the European Central Bank’s Chairman, Mario Draghi, said in late July, “Within our mandate, the ECB is ready to do whatever it takes to preserve the Euro”. Such bold rhetoric has been followed up by productive discussions on banking union.
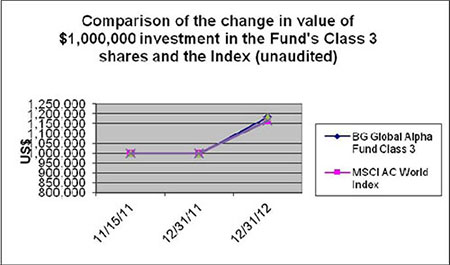
The Global Alpha Fund Class 3 shares produced a return of 18.69% during 2012, outperforming the MSCI AC World Index which returned 16.80% for the year.
The Fund’s relative performance was driven primarily by stock selection. Amongst the top performers were eBay (online auction site) and Svenska Handelsbanken (Swedish retail bank). eBay is a business that benefits from strong network effects. Its online payments system, PayPal, is growing rapidly. Svenska Handelsbanken is the leading Swedish retail bank which has been expanding into other parts of Northern Europe. The investment case centres on disciplined long-term counter cyclical lending, their ability to deploy capital when competitors are retrenching and a culture of equity ownership that sees management and employees tie up significant amounts of personal wealth through an aligned share ownership scheme. It had a good year, helped by strong growth outside of Sweden (particularly in the UK).
The largest detractor from relative performance was OGX, a Brazilian listed oil and gas company which was sold towards the end of the year. OGX’s share price fell following the announcement of disappointing well flow data from its Tubarao Azul field. The market also reacted adversely to the news of the departure of its CEO, Paulo Mendonca. Fairfax Financial (Canadian insurance company) also underperformed during the year.
Investment Strategies used to Manage the Fund
Baillie Gifford is a growth manager with a bottom up approach to stock picking. We aim to invest in companies that will generate sustainable earnings growth above the market over the long term. In determining the potential of a company, we analyse industry background, competitive advantage, management attitudes and financial strength, and finally we consider valuation. We meet the management of the companies within our investment universe and revisit the investment case for the portfolio’s holdings on a regular basis to ensure that our expectations are being met.
The Global Alpha Portfolio Construction Group is responsible for the overall strategy and stock selection process. They meet regularly to discuss both buy and sell ideas and the level of conviction in their continuing holdings.
Outlook
Whilst many of the issues that have caused stock market volatility over the last few years remain, there are reasons to be optimistic; globally, monetary policy has never been looser, central banks have demonstrated that they can act aggressively, China is moving towards relying more on domestic consumption, and the double-digit returns from U.S. equities show that there is a belief that the recovery which has started in the housing market will spread more widely in 2013. In the longer term, the abundant supplies of cheap energy from shale deposits should provide a boost to expenditure and investment across the whole of North America. Against this backdrop, there are some outstanding growth businesses, and our focus, as ever, will be on investing in well managed growth companies that should outperform over the longer term. And if markets remain volatile, this should present opportunities, given our long-term approach to investing.
13
Management Discussion
The Global Alpha Equity Fund
| | | | | |
Fund Performance for periods ended 12/31/12 (Average Annual Total Returns) | |
| | | | | |
| | One Year | | Since Inception
(November 15,
2011) | |
| | | | | |
| | | | | |
The Global Alpha Fund Class 3 | | 18.69% | | 15.14% | |
| | | | | |
MSCI AC World Index | | 16.80% | | 15.17% | |
| | | | | |
14
Fund Expenses (unaudited)
As a shareholder of the Baillie Gifford International Equity Fund, the Baillie Gifford International Choice Fund, the Baillie Gifford EAFE Fund, the Baillie Gifford EAFE Choice Fund, the Baillie Gifford Emerging Markets Fund and/or the Baillie Gifford Global Alpha Equity Fund (together, the “Funds”), you incur two types of costs: (1) transaction costs, which may include purchase premiums and redemption fees and (2) ongoing costs, including management fees, shareholder service fees and other Fund expenses. This example is intended to help you understand your ongoing costs (in dollars) of investing in the Funds and to compare these costs with the ongoing costs of investing in the other mutual funds.
The example is based on an investment of $1,000 invested at the beginning of the period and held for the entire period from July 1, 2012 to December 31, 2012.
Actual Expenses
The first line of each table provides information about actual account values and actual expenses. You may use the information in this line, together with the amount you invested, to estimate the expenses that you paid over the period. Simply divide the account value by $1,000 (for example, an $8,600 account value divided by $1,000 = 8.6), then multiply the result by the number in the first line under the heading entitled “Expenses Paid During the Period” to estimate the expenses you paid on your account during this period.
Hypothetical Example for Comparison Purposes
The second line of each table on the following page provides information about hypothetical account values and hypothetical expenses based on the Fund’s actual expense ratio and an assumed annual rate of return of 5% before expenses, which is not the Fund’s actual return. The hypothetical account values and expenses may not be used to estimate the actual ending account balance or expenses you paid for the period. You may use this information to compare the ongoing costs of investing in the Fund and other funds by comparing this 5% hypothetical example with the 5% hypothetical examples that appear in the shareholder reports of other funds.
Please note that the expenses shown in the table are meant to highlight your ongoing costs only and do not reflect any transactional costs, such as purchase premiums and redemption fees. Therefore, the second line of the table is useful in comparing ongoing costs only, and will not help you determine the relative total costs of owning different funds. In addition, if these transactional costs were included, your costs would have been higher.
15
Fund Expenses (unaudited)(continued)
| | | | | | | | | |
| | Beginning
Account
Value
7/01/12 | | Ending
Account
Value
12/31/12 | | Annualized
Expense Ratio
Based on the
Period
7/01/12 to
12/31/12 | | Expenses Paid
During the
Period
7/01/12 to
12/31/12 | |
| | | | | | | | | |
Baillie Gifford International Equity Fund - Class 1 | | | | | | | | | |
Actual | | $1,000.00 | | $1,148.65 | | 0.83% | | $4.48 | |
Hypothetical (5% return before expenses) | | $1,000.00 | | $1,020.96 | | 0.83% | | $4.22 | |
| | | | | | | | | |
Baillie Gifford International Equity Fund - Class 2 | | | | | | | | | |
Actual | | $1,000.00 | | $1,149.98 | | 0.64% | | $3.46 | |
Hypothetical (5% return before expenses) | | $1,000.00 | | $1,021.92 | | 0.64% | | $3.25 | |
| | | | | | | | | |
Baillie Gifford International Equity Fund - Class 3 | | | | | | | | | |
Actual | | $1,000.00 | | $1,151.18 | | 0.58% | | $3.14 | |
Hypothetical (5% return before expenses) | | $1,000.00 | | $1,022.22 | | 0.58% | | $2.95 | |
| | | | | | | | | |
Baillie Gifford International Equity Fund - Class 4 | | | | | | | | | |
Actual | | $1,000.00 | | $1,150.28 | | 0.54% | | $2.92 | |
Hypothetical (5% return before expenses) | | $1,000.00 | | $1,022.42 | | 0.54% | | $2.75 | |
| | | | | | | | | |
Baillie Gifford International Choice Fund - Class 1** | | | | | | | | | |
Actual | | $1,000.00 | | $1,033.26 | | 0.85% | | $2.31 | |
Hypothetical (5% return before expenses) | | $1,000.00 | | $1,020.86 | | 0.85% | | $4.32 | |
| | | | | | | | | |
Baillie Gifford EAFE Fund - Class 1 | | | | | | | | | |
Actual | | $1,000.00 | | $1,139.07 | | 0.79% | | $4.25 | |
Hypothetical (5% return before expenses) | | $1,000.00 | | $1,021.17 | | 0.79% | | $4.01 | |
| | | | | | | | | |
Baillie Gifford EAFE Fund - Class 2 | | | | | | | | | |
Actual | | $1,000.00 | | $1,140.31 | | 0.61% | | $3.28 | |
Hypothetical (5% return before expenses) | | $1,000.00 | | $1,022.07 | | 0.61% | | $3.10 | |
| | | | | | | | | |
Baillie Gifford EAFE Fund - Class 3 | | | | | | | | | |
Actual | | $1,000.00 | | $1,140.79 | | 0.54% | | $2.91 | |
Hypothetical (5% return before expenses) | | $1,000.00 | | $1,022.42 | | 0.54% | | $2.75 | |
| | | | | | | | | |
Baillie Gifford EAFE Fund - Class 5* | | | | | | | | | |
Actual | | $1,000.00 | | $1,157.17 | | 0.46% | | $2.24 | |
Hypothetical (5% return before expenses) | | $1,000.00 | | $1,022.82 | | 0.46% | | $2.34 | |
| | | | | | | | | |
Baillie Gifford EAFE Choice Fund - Class 2 | | | | | | | | | |
Actual | | $1,000.00 | | $1,142.00 | | 0.64% | | $3.45 | |
Hypothetical (5% return before expenses) | | $1,000.00 | | $1,021.92 | | 0.64% | | $3.25 | |
| | | | | | | | | |
Baillie Gifford EAFE Choice Fund - Class 3 | | | | | | | | | |
Actual | | $1,000.00 | | $1,142.37 | | 0.57% | | $3.07 | |
Hypothetical (5% return before expenses) | | $1,000.00 | | $1,022.27 | | 0.57% | | $2.90 | |
| | | | | | | | | |
Baillie Gifford Emerging Markets Fund - Class III | | | | | | | | | |
Actual | | $1,000.00 | | $1,090.83 | | 0.73% | | $3.84 | |
Hypothetical (5% return before expenses) | | $1,000.00 | | $1,021.47 | | 0.73% | | $3.71 | |
| | | | | | | | | |
Baillie Gifford Global Alpha Equity Fund - Class 1 | | | | | | | | | |
Actual | | $1,000.00 | | $1,119.40 | | 0.89% | | $4.74 | |
Hypothetical (5% return before expenses) | | $1,000.00 | | $1,020.66 | | 0.89% | | $4.52 | |
16
Fund Expenses (unaudited)(concluded)
| | | | | | | | | |
Baillie Gifford Global Alpha Equity Fund – Class 3 | | | | | | | | | |
Actual | | $1,000.00 | | $1,120.94 | | 0.64% | | $3.41 | |
Hypothetical (5% return before expenses) | | $1,000.00 | | $1,021.92 | | 0.64% | | $3.25 | |
|
* Commencement of investment operations was July 19, 2012. |
** Commencement of investment operations was September 25, 2012. |
Expenses are calculated using the annualized expense ratio for the Funds, which represents the ongoing expenses as a percentage of net assets for the six-months ended 12/31/12. Expenses are calculated by multiplying the annualized expense ratio by the average account value for the period; then multiplying the result by the number of days in the most recent fiscal half-year; and then dividing that result by the number of days in the calendar year. Expense ratios for the most recent fiscal half-year may differ from expense ratios based on the one-year data in the financial highlights.
17
| |
INDUSTRY DIVERSIFICATION TABLE | |
December 31, 2012 (unaudited) | Baillie Gifford International Equity Fund |
| | |
| | | | | | | |
| | Value | | % of Total
Net Assets | |
| | | | | |
| | | | | | | |
Airlines | | $ | 24,077,106 | | | 1.1 | % |
Apparel | | | 72,444,678 | | | 3.4 | |
Auto Manufacturers | | | 59,702,789 | | | 2.8 | |
Banks | | | 201,748,248 | | | 9.5 | |
Beverages, Food & Tobacco | | | 80,175,736 | | | 3.8 | |
Biotechnology | | | 18,817,132 | | | 0.9 | |
Commercial Services | | | 116,529,787 | | | 5.5 | |
Construction & Building Materials | | | 59,094,678 | | | 2.8 | |
Distribution/Wholesale | | | 44,243,957 | | | 2.1 | |
Diversified Financial Services | | | 88,177,906 | | | 4.1 | |
Diversified Industrials | | | 20,600,958 | | | 1.0 | |
Electronic & Electrical Equipment | | | 113,583,151 | | | 5.3 | |
Engineering & Construction | | | 22,751,899 | | | 1.1 | |
Engineering & Machinery | | | 130,092,432 | | | 6.1 | |
Food Producers & Processors | | | 169,198,279 | | | 8.0 | |
Healthcare - Products | | | 57,179,613 | | | 2.7 | |
Insurance | | | 108,204,648 | | | 5.1 | |
Internet | | | 84,485,961 | | | 4.0 | |
Investment Companies | | | 20,368,585 | | | 1.0 | |
Media & Photography | | | 49,997,171 | | | 2.3 | |
Mining & Metals | | | 161,436,630 | | | 7.6 | |
Office/Business Equipment | | | 13,282,968 | | | 0.6 | |
Oil & Gas | | | 162,101,302 | | | 7.6 | |
Real Estate | | | 18,749,086 | | | 0.9 | |
Retailers - General | | | 29,234,216 | | | 1.4 | |
Semiconductors | | | 117,186,650 | | | 5.5 | |
Software | | | 13,324,861 | | | 0.6 | |
Transportation | | | 23,805,953 | | | 1.1 | |
Travel & Leisure | | | 13,837,551 | | | 0.6 | |
| | | | | | | |
| | | | | | | |
Total Value of Investments | | | 2,094,433,931 | | | 98.5 | |
Other assets less liabilities | | | 32,045,278 | | | 1.5 | |
| | | | | | | |
Net Assets | | $ | 2,126,479,209 | | | 100.0 | % |
| | | | | | | |
The accompanying notes are an integral part of the financial statements.
18
| |
PORTFOLIO OF INVESTMENTS | |
December 31, 2012 | Baillie Gifford International Equity Fund |
| | |
| | | | | | | |
| | Shares | | Value | |
| | | | | | |
| | | | | | | |
COMMON STOCKS - 96.8% | | | | | | | |
ARGENTINA - 1.3% | | | | | | | |
MercadoLibre, Inc. | | | 342,100 | | $ | 26,878,797 | |
| | | | | | | |
| | | | | | | |
AUSTRALIA - 3.2% | | | | | | | |
Brambles Ltd. | | | 3,075,592 | | | 24,387,349 | |
Cochlear Ltd. | | | 287,715 | | | 23,851,547 | |
Woolworths Ltd. | | | 671,512 | | | 20,600,958 | |
| | | | | | | |
| | | | | | 68,839,854 | |
| | | | | | | |
BELGIUM - 0.7% | | | | | | | |
Groupe Bruxelles Lambert SA | | | 188,912 | | | 15,066,999 | |
| | | | | | | |
| | | | | | | |
BERMUDA - 0.6% | | | | | | | |
Seadrill Ltd. | | | 352,961 | | | 13,003,759 | |
| | | | | | | |
| | | | | | | |
BRAZIL - 0.7% | | | | | | | |
Petroleo Brasileiro SA ADR | | | 793,300 | | | 15,445,551 | |
| | | | | | | |
| | | | | | | |
CANADA - 4.1% | | | | | | | |
Cenovus Energy, Inc. | | | 349,956 | | | 11,712,109 | |
Eldorado Gold Corp. | | | 1,270,632 | | | 16,350,749 | |
Fairfax Financial Holdings Ltd. | | | 91,216 | | | 32,879,760 | |
Ritchie Bros. Auctioneers, Inc. | | | 802,706 | | | 16,762,068 | |
Westport Innovations, Inc. (a) | | | 327,979 | | | 8,678,403 | |
| | | | | | | |
| | | | | | 86,383,089 | |
| | | | | | | |
CHINA - 9.3% | | | | | | | |
Baidu, Inc. ADR (a) | | | 259,064 | | | 25,981,528 | |
Cheung Kong Holdings Ltd. | | | 1,205,000 | | | 18,749,086 | |
China Shenhua Energy Co., Ltd., H Shares, Class H | | | 6,590,000 | | | 29,518,709 | |
Hang Seng Bank Ltd. | | | 1,557,900 | | | 24,049,231 | |
Hong Kong Exchanges and Clearing Ltd. | | | 2,142,300 | | | 37,075,011 | |
Kunlun Energy Co., Ltd. | | | 16,744,000 | | | 35,402,535 | |
Want Want China Holdings Ltd. | | | 18,552,000 | | | 25,998,882 | |
| | | | | | | |
| | | | | | 196,774,982 | |
| | | | | | | |
DENMARK - 2.0% | | | | | | | |
DSV A/S | | | 920,128 | | | 23,805,953 | |
Novozymes A/S, B Shares | | | 662,887 | | | 18,817,132 | |
| | | | | | | |
| | | | | | 42,623,085 | |
| | | | | | | |
FINLAND - 3.1% | | | | | | | |
Kone Oyj, B Shares | | | 556,329 | | | 41,146,166 | |
Sampo Oyj, A Shares | | | 751,052 | | | 24,323,455 | |
| | | | | | | |
| | | | | | 65,469,621 | |
| | | | | | | |
FRANCE - 3.5% | | | | | | | |
Compagnie Generale d’Optique Essilor International SA | | | 330,446 | | | 33,328,066 | |
Edenred | | | 641,467 | | | 19,839,612 | |
Lafarge SA | | | 325,566 | | | 21,022,657 | |
| | | | | | | |
| | | | | | 74,190,335 | |
| | | | | | | |
GERMANY - 2.4% | | | | | | | |
Aixtron SE NA | | | 527,907 | | | 6,295,431 | |
Continental AG | | | 168,173 | | | 19,601,230 | |
Deutsche Boerse AG | | | 400,303 | | | 24,547,507 | |
| | | | | | | |
| | | | | | 50,444,168 | |
| | | | | | | |
INDIA - 1.0% | | | | | | | |
IDFC, Ltd. | | | 6,421,969 | | | 20,368,585 | |
| | | | | | | |
The accompanying notes are an integral part of the financial statements.
19
| |
PORTFOLIO OF INVESTMENTS (continued) | |
December 31, 2012 | Baillie Gifford International Equity Fund |
| | |
| | | | | | | |
| | Shares | | Value | |
| | | | | | |
| | | | | | | |
IRELAND - 2.9% | | | | | | | |
CRH Plc. | | | 833,819 | | $ | 17,225,932 | |
James Hardie Industries SE CDI | | | 2,153,102 | | | 20,846,089 | |
Ryanair Holdings Plc. ADR | | | 702,366 | | | 24,077,106 | |
| | | | | | | |
| | | | | | 62,149,127 | |
| | | | | | | |
JAPAN - 8.1% | | | | | | | |
Canon, Inc. | | | 342,700 | | | 13,282,968 | |
Fast Retailing Co., Ltd. | | | 111,300 | | | 28,404,970 | |
Inpex Corp. | | | 2,873 | | | 15,365,839 | |
Mitsui & Co., Ltd. | | | 1,013,200 | | | 15,186,719 | |
Olympus Corp. (a) | | | 821,300 | | | 15,933,808 | |
Rakuten, Inc. | | | 2,546,300 | | | 19,857,202 | |
Shimano, Inc. | | | 216,100 | | | 13,837,551 | |
SMC Corp. | | | 131,000 | | | 23,796,737 | |
Tokyo Electron Ltd. | | | 286,100 | | | 13,195,293 | |
Trend Micro, Inc. | | | 441,000 | | | 13,324,861 | |
| | | | | | | |
| | | | | | 172,185,948 | |
| | | | | | | |
NETHERLANDS - 2.8% | | | | | | | |
Heineken Holding NV | | | 483,408 | | | 26,617,865 | |
Unilever NV CVA | | | 848,682 | | | 32,473,812 | |
| | | | | | | |
| | | | | | 59,091,677 | |
| | | | | | | |
NORWAY - 1.1% | | | | | | | |
Aker Solutions ASA | | | 1,098,667 | | | 22,751,899 | |
| | | | | | | |
| | | | | | | |
PERU - 1.5% | | | | | | | |
Credicorp Ltd. | | | 224,766 | | | 32,941,705 | |
| | | | | | | |
| | | | | | | |
PORTUGAL - 0.3% | | | | | | | |
Galp Energia, SGPS, SA | | | 482,230 | | | 7,485,513 | |
| | | | | | | |
| | | | | | | |
RUSSIA – 1.9% | | | | | | | |
Magnit OJSC GDR Reg S | | | 723,720 | | | 29,423,394 | |
Sberbank of Russia ADR | | | 958,998 | | | 12,023,043 | |
| | | | | | | |
| | | | | | 41,446,437 | |
| | | | | | | |
SINGAPORE - 2.9% | | | | | | | |
DBS Group Holdings Ltd. | | | 2,051,120 | | | 25,180,614 | |
United Overseas Bank Ltd. | | | 2,169,175 | | | 35,583,239 | |
| | | | | | | |
| | | | | | 60,763,853 | |
| | | | | | | |
SOUTH AFRICA - 3.2% | | | | | | | |
Massmart Holdings Ltd. | | | 803,921 | | | 18,227,007 | |
Naspers Ltd., N Shares | | | 774,060 | | | 49,997,171 | |
| | | | | | | |
| | | | | | 68,224,178 | |
| | | | | | | |
SOUTH KOREA - 4.4% | | | | | | | |
Hyundai Mobis | | | 59,368 | | | 16,107,075 | |
NHN Corp. | | | 55,401 | | | 11,768,434 | |
Samsung Electronics Co., Ltd. | | | 45,529 | | | 65,416,060 | |
| | | | | | | |
| | | | | | 93,291,569 | |
| | | | | | | |
SPAIN - 1.7% | | | | | | | |
Inditex SA | | | 252,176 | | | 35,432,516 | |
| | | | | | | |
| | | | | | | |
SWEDEN - 6.0% | | | | | | | |
Atlas Copco AB, B Shares | | | 2,654,127 | | | 65,149,529 | |
Svenska Handelsbanken AB, A Shares | | | 1,321,176 | | | 47,498,775 | |
Volvo AB, B Shares | | | 1,110,736 | | | 15,316,081 | |
| | | | | | | |
| | | | | | 127,964,385 | |
| | | | | | | |
The accompanying notes are an integral part of the financial statements.
20
| |
PORTFOLIO OF INVESTMENTS (continued) | |
December 31, 2012 | Baillie Gifford International Equity Fund |
| | |
| | | | | | | |
| | Shares | | Value | |
| | | | | | |
| | | | | | | |
SWITZERLAND - 2.8% | | | | | | | |
Nestle SA | | | 929,759 | | $ | 60,660,705 | |
| | | | | | | |
| | | | | | | |
TAIWAN - 3.7% | | | | | | | |
Hon Hai Precision Industry Co., Ltd. GDR Reg S | | | 3,230,073 | | | 19,412,739 | |
Taiwan Semiconductor Manufacturing Co., Ltd. | | | 17,860,000 | | | 59,738,315 | |
| | | | | | | |
| | | | | | 79,151,054 | |
| | | | | | | |
TURKEY - 2.0% | | | | | | | |
Anadolu Efes Biracilik ve Malt Sanayii A/S | | | 768,767 | | | 11,080,522 | |
BIM Birlesik Magazalar A/S | | | 420,957 | | | 20,641,486 | |
Turkiye Garanti Bankasi A/S | | | 2,076,580 | | | 10,838,564 | |
| | | | | | | |
| | | | | | 42,560,572 | |
| | | | | | | |
UNITED KINGDOM - 19.1% | | | | | | | |
Amlin Plc. | | | 3,722,822 | | | 23,143,671 | |
Antofagasta Plc. | | | 1,183,764 | | | 25,942,263 | |
ARM Holdings Plc. | | | 3,005,638 | | | 37,957,611 | |
BG Group Plc. | | | 1,075,648 | | | 17,941,691 | |
BHP Billiton Plc. | | | 625,699 | | | 22,070,694 | |
British American Tobacco Plc. | | | 835,589 | | | 42,477,349 | |
Burberry Group Plc. | | | 428,185 | | | 8,607,192 | |
Capita Plc. | | | 2,043,258 | | | 25,248,474 | |
Experian Plc. | | | 1,879,523 | | | 30,292,284 | |
Hargreaves Lansdown Plc. | | | 1,027,172 | | | 11,488,389 | |
Petrofac Ltd. | | | 494,142 | | | 13,206,478 | |
Premier Farnell Plc. | | | 4,024,480 | | | 12,820,544 | |
Prudential Plc. | | | 1,952,544 | | | 27,857,762 | |
Rio Tinto Plc. | | | 768,166 | | | 44,804,005 | |
Tullow Oil Plc. | | | 1,560,753 | | | 32,537,827 | |
Wolseley Plc. | | | 607,651 | | | 29,057,238 | |
| | | | | | | |
| | | | | | 405,453,472 | |
| | | | | | | |
UNITED STATES - 0.5% | | | | | | | |
PriceSmart, Inc. | | | 142,858 | | | 11,007,209 | |
| | | | | | | |
| | | | | | | |
Total Common Stocks
(cost $1,762,225,293) | | | | | | 2,058,050,644 | |
| | | | | | | |
| | | | | | | |
PREFERRED STOCKS - 1.7% | | | | | | | |
BRAZIL - 1.7% | | | | | | | |
Itau Unibanco Holding SA ADR | | | 828,255 | | | 13,633,077 | |
Vale SA ADR | | | 1,120,700 | | | 22,750,210 | |
| | | | | | | |
Total Preferred Stocks
(cost $40,729,844) | | | | | | 36,383,287 | |
| | | | | | | |
| | | | | | | |
TOTAL INVESTMENTS - 98.5%
(cost $1,802,955,137) | | | | | | 2,094,433,931 | |
Other assets less liabilities - 1.5% | | | | | | 32,045,278 | |
| | | | | | | |
NET ASSETS - 100.0% | | | | | $ | 2,126,479,209 | |
| | | | | | | |
|
(a) Non-income producing security. |
ADR - American Depositary Receipt. |
CDI – Chess Depositary Interest. |
GDR - Global Depositary Receipt. |
The accompanying notes are an integral part of the financial statements.
21
| |
PORTFOLIO OF INVESTMENTS (concluded) | |
December 31, 2012 | Baillie Gifford International Equity Fund |
| | |
Reg S - is a safe harbor that defines when an offering of securities will be deemed to come to rest abroad and therefore is not subject to the registration obligations imposed under Section 5 of the 1933 Act. The regulation includes two safe harbor provisions: an issuer safe harbor and a resale safe harbor. In each case, the regulation demands that offers and sales of the securities be made outside the United States and that no offering participant (which includes the issuer, the banks assisting with the offer and their respective affiliates) engage in “directed” selling efforts. In the case of issuers for whose securities there is substantial U.S. market interest, the regulation also requires that no offers and sales be made to U.S. persons (including U.S. persons physically located outside the United States).
The accompanying notes are an integral part of the financial statements.
22
| |
STATEMENT OF ASSETS AND LIABILITIES | |
December 31, 2012 | Baillie Gifford International Equity Fund |
| | |
| | | | |
ASSETS | | | | |
Investments, at value (cost $1,802,955,137) | | $ | 2,094,433,931 | |
Cash | | | 19,985,349 | |
Foreign cash, at value (cost $12,786,596) | | | 13,118,217 | |
Dividends receivable | | | 1,128,595 | |
Tax reclaims receivable | | | 980,935 | |
Other assets | | | 3,541 | |
| | | | |
Total Assets | | | 2,129,650,568 | |
| | | | |
| | | | |
LIABILITIES | | | | |
Management fee payable | | | 1,276,309 | |
Servicing fee payable | | | 1,138,069 | |
Distributions payable | | | 229,069 | |
Accrued expenses | | | 527,912 | |
| | | | |
Total Liabilities | | | 3,171,359 | |
| | | | |
| | | | |
NET ASSETS | | $ | 2,126,479,209 | |
| | | | |
| | | | |
COMPOSITION OF NET ASSETS | | | | |
Paid-in capital | | $ | 1,856,388,946 | |
Distributions in excess of net investment income | | | (1,926,053 | ) |
Accumulated net realized loss on investments and foreign currency transactions | | | (19,798,765 | ) |
Net unrealized appreciation in value of investments and foreign currencies | | | 291,815,081 | |
| | | | |
| | $ | 2,126,479,209 | |
| | | | |
NET ASSET VALUE, PER SHARE | | | | |
| | | | |
| | | | |
Class 1 ($61,939,706 / 5,944,133 shares outstanding),
unlimited authorized, no par value | | $ | 10.42 | |
| | | | |
Maximum Purchase Price Per Share (Note D) | | $ | 10.44 | |
| | | | |
Minimum Redemption Price Per Share (Note D) | | $ | 10.40 | |
| | | | |
| | | | |
Class 2 ($682,452,092 / 65,653,425 shares outstanding),
unlimited authorized, no par value | | $ | 10.39 | |
| | | | |
Maximum Purchase Price Per Share (Note D) | | $ | 10.41 | |
| | | | |
Minimum Redemption Price Per Share (Note D) | | $ | 10.37 | |
| | | | |
| | | | |
Class 3 ($862,591,302 / 81,987,680 shares outstanding),
unlimited authorized, no par value | | $ | 10.52 | |
| | | | |
Maximum Purchase Price Per Share (Note D) | | $ | 10.54 | |
| | | | |
Minimum Redemption Price Per Share (Note D) | | $ | 10.50 | |
| | | | |
| | | | |
Class 4 ($519,496,109 / 48,320,337 shares outstanding),
unlimited authorized, no par value | | $ | 10.75 | |
| | | | |
Maximum Purchase Price Per Share (Note D) | | $ | 10.77 | |
| | | | |
Minimum Redemption Price Per Share (Note D) | | $ | 10.73 | |
| | | | |
The accompanying notes are an integral part of the financial statements.
23
| |
STATEMENT OF OPERATIONS | |
For the Year Ended December 31, 2012 | Baillie Gifford International Equity Fund |
| | |
| | | | |
INVESTMENT INCOME | | | | |
Dividends (net of foreign withholding taxes of $4,076,509) | | $ | 47,557,049 | |
Interest | | | 3,980 | |
| | | | |
Total Investment Income | | | 47,561,029 | |
| | | | |
| | | | |
EXPENSES | | | | |
Management fee (Note B) | | | 5,081,253 | |
Shareholder Servicing fees - Class 1 Shares (Note B) | | | 351,213 | |
Shareholder Servicing fees - Class 2 Shares (Note B) | | | 2,102,796 | |
Shareholder Servicing fees - Class 3 Shares (Note B) | | | 1,218,787 | |
Shareholder Servicing fees - Class 4 Shares (Note B) | | | 557,959 | |
Fund Accounting | | | 846,728 | |
Custody | | | 422,367 | |
Legal | | | 224,286 | |
Professional fees | | | 75,121 | |
Trustees’ fees | | | 45,080 | |
Transfer Agency | | | 37,985 | |
Insurance | | | 20,057 | |
Miscellaneous | | | 8,348 | |
| | | | |
Total Expenses | | | 10,991,980 | |
| | | | |
Fees waived (Note B) | | | (409,097 | ) |
| | | | |
Net Expenses | | | 10,582,883 | |
| | | | |
Net Investment Income | | | 36,978,146 | |
| | | | |
| | | | |
REALIZED AND UNREALIZED GAIN (LOSS) ON INVESTMENTS AND FOREIGN CURRENCY TRANSACTIONS | | | | |
Net realized loss from: | | | | |
Investments | | | (26,699,215 | ) |
Foreign currency transactions | | | (1,293,426 | ) |
| | | | |
| | | (27,992,641 | ) |
| | | | |
| | | | |
Net change in unrealized appreciation (depreciation) on: | | | | |
Investments | | | 319,027,161 | |
Translation of assets and liabilities in foreign currencies | | | 744,015 | |
| | | | |
| | | 319,771,176 | |
| | | | |
| | | | |
Net realized and unrealized gain on investments and foreign currency transactions | | | 291,778,535 | |
| | | | |
NET INCREASE IN NET ASSETS FROM OPERATIONS | | $ | 328,756,681 | |
| | | | |
The accompanying notes are an integral part of the financial statements.
24
| |
STATEMENTS OF CHANGES IN NET ASSETS | Baillie Gifford International Equity Fund |
| | |
| | | | | | | |
| | For the
Year Ended
December 31, 2012 | | For the
Year Ended
December 31, 2011 | |
| | | | | |
INCREASE (DECREASE) IN NET ASSETS FROM OPERATIONS | | | | | | | |
Net investment income | | $ | 36,978,146 | | $ | 17,265,734 | |
Net realized loss from investments and foreign currency transactions | | | (27,992,641 | ) | | (4,904,998 | ) |
Net change in unrealized appreciation (depreciation) on investments and translation of assets and liabilities in foreign currencies | | | 319,771,176 | | | (155,030,492 | ) |
| | | | | | | |
Net increase (decrease) in net assets from operations | | | 328,756,681 | | | (142,669,756 | ) |
| | | | | | | |
| | | | | | | |
DIVIDENDS AND DISTRIBUTIONS TO SHAREHOLDERS FROM | | | | | | | |
Net investment income: | | | | | | | |
Class 1 | | | (854,941 | ) | | (778,756 | ) |
Class 2 | | | (10,667,156 | ) | | (11,585,292 | ) |
Class 3 | | | (13,666,431 | ) | | (5,308,632 | ) |
Class 4 | | | (8,324,082 | ) | | (245,693 | ) |
Capital gains: | | | | | | | |
Class 1 | | | — | | | (68,430 | ) |
Class 2 | | | — | | | (888,373 | ) |
Class 3 | | | — | | | (387,865 | ) |
Class 4 | | | — | | | (17,595 | ) |
| | | | | | | |
Total Dividends and Distributions | | | (33,512,610 | ) | | (19,280,636 | ) |
| | | | | | | |
| | | | | | | |
TRANSACTIONS IN SHARES OF BENEFICIAL INTEREST | | | | | | | |
Net proceeds from shares subscribed: | | | | | | | |
Class 1 | | | 57,372,832 | | | 3,193,600 | |
Class 2 | | | 310,822,024 | | | 569,743,090 | |
Class 3 | | | 691,940,811 | | | 264,227,433 | |
Class 4 | | | 458,126,968 | | | — | |
Purchase premiums: | | | | | | | |
Class 1 | | | 79,717 | | | 92,442 | |
Class 2 | | | 652,621 | | | 770,898 | |
Class 3 | | | 386,643 | | | 413,391 | |
Class 4 | | | 197,554 | | | 26,649 | |
Redemption fees: | | | | | | | |
Class 1 | | | 6,852 | | | 661 | |
Class 2 | | | 59,689 | | | 5,972 | |
Class 3 | | | 41,412 | | | 3,008 | |
Class 4 | | | 21,095 | | | 187 | |
Dividends and distributions reinvested: | | | | | | | |
Class 1 | | | 621,138 | | | 660,671 | |
Class 2 | | | 10,667,156 | | | 12,473,665 | |
Class 3 | | | 13,666,431 | | | 5,696,497 | |
Class 4 | | | 8,324,082 | | | 263,288 | |
Cost of shares redeemed: | | | | | | | |
Class 1 | | | (72,816,528 | ) | | (2,503,755 | ) |
Class 2 | | | (615,053,580 | ) | | (107,151,339 | ) |
Class 3 | | | (302,097,134 | ) | | — | |
Class 4 | | | (11,067,960 | ) | | (1,444,465 | ) |
| | | | | | | |
| | | | | | | |
Increase in Net Assets from Transactions in Shares of Beneficial Interest | | | 551,951,823 | | | 746,471,893 | |
| | | | | | | |
| | | | | | | |
Total Increase in Net Assets | | | 847,195,894 | | | 584,521,501 | |
| | | | | | | |
NET ASSETS | | | | | | | |
Beginning of year | | | 1,279,283,315 | | | 694,761,814 | |
| | | | | | | |
End of year (including distributions in excess of net investment income of $1,926,053 and $4,311,735, respectively) | | $ | 2,126,479,209 | | $ | 1,279,283,315 | |
| | | | | | | |
The accompanying notes are an integral part of the financial statements.
25
| |
FINANCIAL HIGHLIGHTS | Baillie Gifford International Equity Fund |
| | |
|
Selected data for a Class 1 Share outstanding throughout each period: | |
| | | | | | | | | | | | | | | | |
| | For the
Year Ended
December 31, 2012 | | For the
Year Ended
December 31, 2011 | | For the
Year Ended
December 31, 2010 | | For the
Year Ended
December 31, 2009 | | For the Period
July 1, 2008(a)
through
December 31, 2008 | |
| | | | | | | | | | | |
Net asset value, beginning of period | | $ | 8.65 | | $ | 9.97 | | $ | 8.86 | | $ | 6.07 | | $ | 10.52 | |
| | | | | | | | | | | | | | | | |
| | | | | | | | | | | | | | | | |
From Investment Operations | | | | | | | | | | | | | | | | |
Net investment income(b) | | | 0.21 | | | 0.17 | | | 0.12 | | | 0.16 | | | 0.03 | |
Net realized and unrealized gain (loss) on investments and foreign currency transactions | | | 1.70 | | | (1.38 | ) | | 1.15 | | | 2.70 | | | (4.42 | ) |
| | | | | | | | | | | | | | | | |
Net increase (decrease) in net asset value from investment operations | | | 1.91 | | | (1.21 | ) | | 1.27 | | | 2.86 | | | (4.39 | ) |
| | | | | | | | | | | | | | | | |
| | | | | | | | | | | | | | | | |
Dividends and Distributions to Shareholders | | | | | | | | | | | | | | | | |
Dividends from net investment income | | | (0.15 | ) | | (0.11 | ) | | (0.17 | ) | | (0.08 | ) | | (0.08 | ) |
Distributions from net realized gain on investments | | | — | | | (0.01 | ) | | — | | | — | | | — | |
| | | | | | | | | | | | | | | | |
Total Dividends and Distributions | | | (0.15 | ) | | (0.12 | ) | | (0.17 | ) | | (0.08 | ) | | (0.08 | ) |
| | | | | | | | | | | | | | | | |
| | | | | | | | | | | | | | | | |
Proceeds from Purchase Premiums and Redemption Fees(b) | | | 0.01 | | | 0.01 | | | 0.01 | | | 0.01 | | | 0.02 | |
| | | | | | | | | | | | | | | | |
| | | | | | | | | | | | | | | | |
Net asset value, end of period | | $ | 10.42 | | $ | 8.65 | | $ | 9.97 | | $ | 8.86 | | $ | 6.07 | |
| | | | | | | | | | | | | | | | |
| | | | | | | | | | | | | | | | |
Total Return | | | | | | | | | | | | | | | | |
Total investment return based on net asset value(c) | | | 22.17 | % | | (12.07 | )% | | 14.44 | % | | 47.24 | % | | (41.51 | )% |
| | | | | | | | | | | | | | | | |
Ratios/Supplemental Data | | | | | | | | | | | | | | | | |
Net assets, end of period (000’s omitted) | | $ | 61,940 | | $ | 63,868 | | $ | 72,366 | | $ | 64,512 | | $ | 63,086 | |
Ratio of net expenses to average net assets, after waiver | | | 0.80 | %(e) | | 0.84 | % | | 0.86 | % | | 0.93 | %(d) | | 0.90 | %*(d) |
Ratio of net expenses to average net assets, before waiver | | | 0.83 | %(e) | | 0.84 | % | | 0.86 | % | | 0.94 | %(d) | | 1.05 | %*(d) |
Ratio of net investment income to average net assets | | | 2.19 | % | | 1.72 | % | | 1.36 | % | | 2.17 | % | | 1.14 | %* |
Portfolio turnover rate | | | 13 | % | | 11 | % | | 24 | % | | 17 | % | | 71 | % |
| |
* | Annualized. |
(a) | Commencement of investment operations. |
(b) | Calculated based upon average shares outstanding during the period. |
(c) | Total investment return is calculated assuming an initial investment made at the net asset value at the beginning of the period, reinvestment of all dividends and distributions, if any, at net asset value during the period, and redemption on the last day of the period. Total return is not annualized for periods less than one year. |
(d) | Baillie Gifford Overseas Limited had contractually agreed to waive its fees and/or bear other expenses through March 31, 2009 to the extent that such Fund’s total annual operating expenses (excluding interest, taxes and extraordinary expenses) exceeded 0.90% for Class 1 Shares. |
(e) | Baillie Gifford Overseas Limited had voluntarily agreed to waive a portion of the management fee through June 30, 2012, during which time Baillie Gifford Overseas Limited received an annual management fee equal to 0.25% of the Fund’s average net assets. |
|
The accompanying notes are an integral part of the financial statements. |
26 |
| |
FINANCIAL HIGHLIGHTS (continued) | Baillie Gifford International Equity Fund |
| | |
|
Selected data for a Class 2 Share outstanding throughout each period: | |
| | | | | | | | | | | | | | | | |
| | For the
Year Ended
December 31, 2012 | | For the
Year Ended
December 31, 2011 | | For the
Year Ended
December 31, 2010 | | For the
Year Ended
December 31, 2009 | | For the Period
February 7, 2008(a)
through
December 31, 2008 | |
| | | | | | | | | | | |
Net asset value, beginning of period | | $ | 8.63 | | $ | 9.95 | | $ | 8.84 | | $ | 6.07 | | $ | 10.00 | |
| | | | | | | | | | | | | | | | |
| | | | | | | | | | | | | | | | |
From Investment Operations | | | | | | | | | | | | | | | | |
Net investment income(b) | | | 0.22 | | | 0.16 | | | 0.13 | | | 0.09 | | | 0.16 | |
Net realized and unrealized gain (loss) on investments and foreign currency transactions | | | 1.69 | | | (1.36 | ) | | 1.15 | | | 2.80 | | | (4.03 | ) |
| | | | | | | | | | | | | | | | |
Net increase (decrease) in net asset value from investment operations | | | 1.91 | | | (1.20 | ) | | 1.28 | | | 2.89 | | | (3.87 | ) |
| | | | | | | | | | | | | | | | |
| | | | | | | | | | | | | | | | |
Dividends and Distributions to Shareholders | | | | | | | | | | | | | | | | |
Dividends from net investment income | | | (0.16 | ) | | (0.12 | ) | | (0.18 | ) | | (0.13 | ) | | (0.08 | ) |
Distributions from net realized gain on investments | | | — | | | (0.01 | ) | | — | | | — | | | — | |
| | | | | | | | | | | | | | | | |
Total Dividends and Distributions | | | (0.16 | ) | | (0.13 | ) | | (0.18 | ) | | (0.13 | ) | | (0.08 | ) |
| | | | | | | | | | | | | | | | |
| | | | | | | | | | | | | | | | |
Proceeds from Purchase Premiums and Redemption Fees(b) | | | 0.01 | | | 0.01 | | | 0.01 | | | 0.01 | | | 0.02 | |
| | | | | | | | | | | | | | | | |
| | | | | | | | | | | | | | | | |
Net asset value, end of period | | $ | 10.39 | | $ | 8.63 | | $ | 9.95 | | $ | 8.84 | | $ | 6.07 | |
| | | | | | | | | | | | | | | | |
| | | | | | | | | | | | | | | | |
Total Return | | | | | | | | | | | | | | | | |
Total investment return based on net asset value (c) | | | 22.33 | % | | (11.94 | )% | | 14.65 | % | | 47.76 | % | | (38.51 | )% |
| | | | | | | | | | | | | | | | |
Ratios/Supplemental Data | | | | | | | | | | | | | | | | |
Net assets, end of period (000’s omitted) | | $ | 682,452 | | $ | 831,065 | | $ | 447,232 | | $ | 214,722 | | $ | 50,756 | |
Ratio of net expenses to average net assets, after waiver | | | 0.62 | %(e) | | 0.67 | % | | 0.68 | % | | 0.70 | %(d) | | 0.72 | %*(d) |
Ratio of net expenses to average net assets, before waiver | | | 0.64 | %(e) | | 0.67 | % | | 0.68 | % | | 0.70 | %(d) | | 0.94 | %*(d) |
Ratio of net investment income to average net assets | | | 2.27 | % | | 1.74 | % | | 1.43 | % | | 1.12 | % | | 1.84 | %* |
Portfolio turnover rate | | | 13 | % | | 11 | % | | 24 | % | | 17 | % | | 71 | % |
| |
* | Annualized. |
(a) | Commencement of investment operations. |
(b) | Calculated based upon average shares outstanding during the period. |
(c) | Total investment return is calculated assuming an initial investment made at the net asset value at the beginning of the period, reinvestment of all dividends and distributions, if any, at net asset value during the period, and redemption on the last day of the period. Total return is not annualized for periods less than one year. |
(d) | Baillie Gifford Overseas Limited had contractually agreed to waive its fees and/or bear other expenses through March 31, 2009 to the extent that such Fund’s total annual operating expenses (excluding interest, taxes and extraordinary expenses) exceeded 0.72% for Class 2 Shares. |
(e) | Baillie Gifford Overseas Limited had voluntarily agreed to waive a portion of the management fee through June 30, 2012, during which time Baillie Gifford Overseas Limited received an annual management fee equal to 0.25% of the Fund’s average net assets. |
|
The accompanying notes are an integral part of the financial statements. |
27 |
| |
FINANCIAL HIGHLIGHTS (continued) | Baillie Gifford International Equity Fund |
| | |
|
Selected data for a Class 3 Share outstanding throughout each period: | |
| | | | | | | | | | |
| | For the
Year Ended
December 31, 2012 | | For the
Year Ended
December 31, 2011 | | For the Period
September 1, 2010(a)
through
December 31, 2010 | |
| | | | | | | |
Net asset value, beginning of period | | $ | 8.73 | | $ | 10.06 | | $ | 8.53 | |
| | | | | | | | | | |
| | | | | | | | | | |
From Investment Operations | | | | | | | | | | |
Net investment income(b) | | | 0.17 | | | 0.17 | | | 0.02 | |
Net realized and unrealized gain (loss) on investments and foreign currency transactions | | | 1.78 | | | (1.37 | ) | | 1.69 | |
| | | | | | | | | | |
Net increase (decrease) in net asset value from investment operations | | | 1.95 | | | (1.20 | ) | | 1.71 | |
| | | | | | | | | | |
| | | | | | | | | | |
Dividends and Distributions to Shareholders | | | | | | | | | | |
Dividends from net investment income | | | (0.17 | ) | | (0.13 | ) | | (0.19 | ) |
Distributions from net realized gain on investments | | | — | | | (0.01 | ) | | — | |
| | | | | | | | | | |
Total Dividends and Distributions | | | (0.17 | ) | | (0.14 | ) | | (0.19 | ) |
| | | | | | | | | | |
| | | | | | | | | | |
Proceeds from Purchase Premiums and Redemption Fees(b) | | | 0.01 | | | 0.01 | | | 0.01 | |
| | | | | | | | | | |
| | | | | | | | | | |
Net asset value, end of period | | $ | 10.52 | | $ | 8.73 | | $ | 10.06 | |
| | | | | | | | | | |
| | | | | | | | | | |
Total Return | | | | | | | | | | |
Total investment return based on net asset value(c) | | | 22.50 | % | | (11.85 | )% | | 20.19 | % |
| | | | | | | | | | |
Ratios/Supplemental Data | | | | | | | | | | |
Net assets, end of period (000’s omitted) | | $ | 862,591 | | $ | 367,327 | | $ | 154,209 | |
Ratio of net expenses to average net assets, after waiver | | | 0.56 | %(d) | | 0.60 | % | | 0.61 | %* |
Ratio of net expenses to average net assets, before waiver | | | 0.58 | %(d) | | 0.60 | % | | 0.61 | %* |
Ratio of net investment income to average net assets | | | 1.71 | % | | 1.75 | % | | 0.76 | %* |
Portfolio turnover rate | | | 13 | % | | 11 | % | | 24 | % |
| |
* | Annualized. |
(a) | Commencement of investment operations. |
(b) | Calculated based upon average shares outstanding during the period. |
(c) | Total investment return is calculated assuming an initial investment made at the net asset value at the beginning of the period, reinvestment of all dividends and distributions, if any, at net asset value during the period, and redemption on the last day of the period. Total return is not annualized for periods less than one year. |
(d) | Baillie Gifford Overseas Limited had voluntarily agreed to waive a portion of the management fee through June 30, 2012, during which time Baillie Gifford Overseas Limited received an annual management fee equal to 0.25% of the Fund’s average net assets. |
|
The accompanying notes are an integral part of the financial statements. |
28 |
| |
FINANCIAL HIGHLIGHTS (concluded) | Baillie Gifford International Equity Fund |
| | |
|
Selected data for a Class 4 Share outstanding throughout each period: | |
| | | | | | | | | | |
| | For the
Year Ended
December 31, 2012 | | For the
Year Ended
December 31, 2011 | | For the Period
July 30, 2010(a)
through
December 31, 2010 | |
| | | | | | | |
Net asset value, beginning of period | | $ | 8.92 | | $ | 10.28 | | $ | 9.00 | |
| | | | | | | | | | |
| | | | | | | | | | |
From Investment Operations | | | | | | | | | | |
Net investment income(b) | | | 0.22 | | | 0.20 | | | 0.04 | |
Net realized and unrealized gain (loss) on investments and foreign currency transactions | | | 1.77 | | | (1.43 | ) | | 1.42 | |
| | | | | | | | | | |
Net increase (decrease) in net asset value from investment operations | | | 1.99 | | | (1.23 | ) | | 1.46 | |
| | | | | | | | | | |
| | | | | | | | | | |
Dividends and Distributions to Shareholders | | | | | | | | | | |
Dividends from net investment income | | | (0.17 | ) | | (0.13 | ) | | (0.19 | ) |
Distributions from net realized gain on investments | | | — | | | (0.01 | ) | | — | |
| | | | | | | | | | |
Total Dividends and Distributions | | | (0.17 | ) | | (0.14 | ) | | (0.19 | ) |
| | | | | | | | | | |
| | | | | | | | | | |
Proceeds from Purchase Premiums and Redemption Fees(b) | | | 0.01 | | | 0.01 | | | 0.01 | |
| | | | | | | | | | |
| | | | | | | | | | |
Net asset value, end of period | | $ | 10.75 | | $ | 8.92 | | $ | 10.28 | |
| | | | | | | | | | |
| | | | | | | | | | |
Total Return | | | | | | | | | | |
Total investment return based on net asset value(c) | | | 22.51 | % | | (11.86 | )% | | 16.38 | % |
| | | | | | | | | | |
Ratios/Supplemental Data | | | | | | | | | | |
Net assets, end of period (000’s omitted) | | $ | 519,496 | | $ | 17,024 | | $ | 20,955 | |
Ratio of net expenses to average net assets, after waiver | | | 0.53 | %(d) | | 0.56 | % | | 0.58 | %* |
Ratio of net expenses to average net assets, before waiver | | | 0.54 | %(d) | | 0.56 | % | | 0.58 | %* |
Ratio of net investment income to average net assets | | | 2.20 | % | | 2.03 | % | | 0.97 | %* |
Portfolio turnover rate | | | 13 | % | | 11 | % | | 24 | % |
| |
* | Annualized. |
(a) | Commencement of investment operations. |
(b) | Calculated based upon average shares outstanding during the period. |
(c) | Total investment return is calculated assuming an initial investment made at the net asset value at the beginning of the period, reinvestment of all dividends and distributions, if any, at net asset value during the period, and redemption on the last day of the period. Total return is not annualized for periods less than one year. |
(d) | Baillie Gifford Overseas Limited had voluntarily agreed to waive a portion of the management fee through June 30, 2012, during which time Baillie Gifford Overseas Limited received an annual management fee equal to 0.25% of the Fund’s average net assets. |
|
The accompanying notes are an integral part of the financial statements. |
29 |
| |
INDUSTRY DIVERSIFICATION TABLE | |
December 31, 2012 (unaudited) | Baillie Gifford International Choice Fund |
| | |
| | | | | | | |
| | Value | | % of Total
Net Assets | |
| | | | | |
| | | | | |
Apparel | | $ | 501,264 | | | 2.0 | % |
Auto Manufacturers | | | 988,082 | | | 4.0 | |
Banks | | | 2,339,769 | | | 9.4 | |
Beverages, Food & Tobacco | | | 2,321,083 | | | 9.4 | |
Biotechnology | | | 341,216 | | | 1.4 | |
Chemicals | | | 537,669 | | | 2.2 | |
Commercial Services | | | 618,348 | | | 2.5 | |
Construction & Building Materials | | | 265,789 | | | 1.1 | |
Cosmetics/Personal Care | | | 325,719 | | | 1.3 | |
Distribution/Wholesale | | | 281,500 | | | 1.1 | |
Diversified Financial Services | | | 473,587 | | | 1.9 | |
Diversified Industrials | | | 238,678 | | | 1.0 | |
Electronic & Electrical Equipment | | | 1,001,049 | | | 4.0 | |
Engineering & Machinery | | | 1,844,943 | | | 7.4 | |
Entertainment | | | 527,495 | | | 2.1 | |
Food Producers & Processors | | | 981,465 | | | 4.0 | |
Healthcare - Products | | | 965,996 | | | 3.9 | |
Holding Companies - Diversified | | | 519,043 | | | 2.1 | |
Insurance | | | 679,586 | | | 2.7 | |
Internet | | | 1,186,925 | | | 4.8 | |
Investment Companies | | | 653,771 | | | 2.6 | |
Media & Photography | | | 496,928 | | | 2.0 | |
Mining & Metals | | | 826,425 | | | 3.3 | |
Motorcycles | | | 104,131 | | | 0.4 | |
Oil & Gas | | | 1,361,092 | | | 5.5 | |
Pharmaceuticals | | | 1,076,888 | | | 4.3 | |
Real Estate Investment Trusts | | | 2,424 | | | 0.0 | |
Retailers - General | | | 1,303,044 | | | 5.3 | |
Semiconductors | | | 188,760 | | | 0.8 | |
Toys/Games/Hobbies | | | 233,320 | | | 1.0 | |
Travel & Leisure | | | 352,182 | | | 1.4 | |
Utilities | | | 152,675 | | | 0.6 | |
| | | | | | | |
| | | | | | | |
Total Value of Investments | | | 23,690,846 | | | 95.5 | |
Other assets less liabilities | | | 1,120,533 | | | 4.5 | |
| | | | | | | |
Net Assets | | $ | 24,811,379 | | | 100.0 | % |
| | | | | | | |
The accompanying notes are an integral part of the financial statements.
30
| |
PORTFOLIO OF INVESTMENTS | |
December 31, 2012 | Baillie Gifford International Choice Fund |
| | |
| | | | | | | |
| | Shares | | Value | |
| | | | | | |
| | | | | | | |
COMMON STOCKS - 94.6% | | | | | | | |
AUSTRALIA - 7.5% | | | | | | | |
Aristocrat Leisure Ltd. | | | 103,128 | | $ | 340,999 | |
Brambles Ltd. | | | 33,139 | | | 262,770 | |
Cochlear Ltd. | | | 5,625 | | | 466,312 | |
Mesoblast Ltd. (a) | | | 17,876 | | | 99,945 | |
Seek Ltd. | | | 28,346 | | | 209,474 | |
Shopping Centres Australasia Property Group (a) | | | 1,556 | | | 2,424 | |
Treasury Wine Estates Ltd. | | | 49,163 | | | 241,978 | |
Woolworths Ltd. | | | 7,780 | | | 238,678 | |
| | | | | | | |
| | | | | | 1,862,580 | |
| | | | | | | |
BELGIUM - 0.6% | | | | | | | |
Colruyt SA | | | 3,016 | | | 149,287 | |
| | | | | | | |
| | | | | | | |
BRAZIL - 1.8% | | | | | | | |
Petroleo Brasileiro SA ADR | | | 6,000 | | | 116,820 | |
Vale SA ADR | | | 15,200 | | | 318,592 | |
| | | | | | | |
| | | | | | 435,412 | |
| | | | | | | |
CANADA - 2.1% | | | | | | | |
Cenovus Energy, Inc. | | | 4,635 | | | 155,121 | |
Fairfax Financial Holdings Ltd. | | | 623 | | | 224,567 | |
Potash Corp. of Saskatchewan, Inc. | | | 3,559 | | | 144,836 | |
| | | | | | | |
| | | | | | 524,524 | |
| | | | | | | |
CHINA - 5.4% | | | | | | | |
Baidu, Inc. ADR (a) | | | 1,600 | | | 160,464 | |
BOC Hong Kong Holdings Ltd. | | | 54,000 | | | 169,872 | |
Cafe de Coral Holdings Ltd. | | | 86,000 | | | 245,250 | |
Jardine Strategic Holdings Ltd. | | | 8,000 | | | 286,227 | |
Li & Fung Ltd. | | | 156,000 | | | 281,500 | |
Mindray Medical International Ltd. ADR | | | 5,812 | | | 190,053 | |
| | | | | | | |
| | | | | | 1,333,366 | |
| | | | | | | |
DENMARK - 4.2% | | | | | | | |
Carlsberg A/S, B Shares | | | 6,785 | | | 668,434 | |
Novo Nordisk A/S, B Shares | | | 1,717 | | | 279,590 | |
Novozymes A/S, B Shares | | | 3,652 | | | 103,668 | |
| | | | | | | |
| | | | | | 1,051,692 | |
| | | | | | | |
FINLAND - 1.2% | | | | | | | |
Kone Oyj, B Shares | | | 4,124 | | | 305,012 | |
| | | | | | | |
| | | | | | | |
FRANCE - 2.2% | | | | | | | |
BioMerieux | | | 1,656 | | | 157,876 | |
Legrand SA | | | 4,034 | | | 171,188 | |
Total SA | | | 4,031 | | | 209,746 | |
| | | | | | | |
| | | | | | 538,810 | |
| | | | | | | |
GERMANY - 1.3% | | | | | | | |
Adidas AG | | | 2,185 | | | 195,011 | |
Celesio AG | | | 6,729 | | | 116,553 | |
| | | | | | | |
| | | | | | 311,564 | |
| | | | | | | |
INDIA - 1.5% | | | | | | | |
Gail India Ltd. GDR Reg S | | | 3,908 | | | 152,675 | |
Mahindra & Mahindra Ltd. GDR | | | 12,995 | | | 220,967 | |
| | | | | | | |
| | | | | | 373,642 | |
| | | | | | | |
The accompanying notes are an integral part of the financial statements.
31
| |
PORTFOLIO OF INVESTMENTS (continued) | |
December 31, 2012 | Baillie Gifford International Choice Fund |
| | |
| | | | | | | |
| | Shares | | Value | |
| | | | | | |
| | | | | | | |
INDONESIA - 0.8% | | | | | | | |
Bank Negara Indonesia Persero Tbk PT | | | 511,500 | | $ | 197,138 | |
| | | | | | | |
| | | | | | | |
ITALY - 2.4% | | | | | | | |
EXOR SpA | | | 9,238 | | | 232,816 | |
Fiat Industrial SpA | | | 32,985 | | | 361,371 | |
| | | | | | | |
| | | | | | 594,187 | |
| | | | | | | |
JAPAN - 13.7% | | | | | | | |
Asahi Group Holdings Ltd. | | | 16,200 | | | 344,942 | |
Fast Retailing Co., Ltd. | | | 1,200 | | | 306,253 | |
Inpex Corp. | | | 40 | | | 213,935 | |
Kao Corp. | | | 12,500 | | | 325,719 | |
MS&AD Insurance Group Holdings, Inc. | | | 22,800 | | | 455,019 | |
Namco Bandai Holdings, Inc. | | | 18,000 | | | 233,320 | |
Olympus Corp. (a) | | | 11,600 | | | 225,048 | |
Rakuten, Inc. | | | 17,400 | | | 135,693 | |
Sankyo Co., Ltd. | | | 4,700 | | | 186,496 | |
Shimano, Inc. | | | 5,500 | | | 352,182 | |
SMC Corp. | | | 1,000 | | | 181,654 | |
THK Co., Ltd. | | | 18,200 | | | 327,340 | |
Yamaha Motor Co., Ltd. | | | 9,400 | | | 104,131 | |
| | | | | | | |
| | | | | | 3,391,732 | |
| | | | | | | |
MEXICO - 1.1% | | | | | | | |
Wal-Mart de Mexico SAB de CV, Series V | | | 85,700 | | | 279,649 | |
| | | | | | | |
| | | | | | | |
NETHERLANDS - 0.6% | | | | | | | |
QIAGEN NV (a) | | | 8,356 | | | 151,755 | |
| | | | | | | |
| | | | | | | |
PHILIPPINES - 0.4% | | | | | | | |
Puregold Price Club, Inc. | | | 132,400 | | | 106,404 | |
| | | | | | | |
| | | | | | | |
SINGAPORE - 1.3% | | | | | | | |
United Overseas Bank Ltd. | | | 19,000 | | | 311,677 | |
| | | | | | | |
| | | | | | | |
SOUTH AFRICA - 2.3% | | | | | | | |
Clicks Group Ltd. (a) | | | 37,316 | | | 287,550 | |
Naspers Ltd., N Shares | | | 4,374 | | | 282,520 | |
| | | | | | | |
| | | | | | 570,070 | |
| | | | | | | |
SPAIN - 2.2% | | | | | | | |
Corporacion Financiera Alba SA | | | 3,144 | | | 148,132 | |
Distribuidora Internacional de Alimentacion SA | | | 61,705 | | | 394,245 | |
| | | | | | | |
| | | | | | 542,377 | |
| | | | | | | |
SWEDEN - 8.1% | | | | | | | |
Atlas Copco AB, B Shares | | | 22,236 | | | 545,816 | |
Investment AB Kinnevik, B Shares | | | 11,005 | | | 230,196 | |
Investor AB, B Shares | | | 10,485 | | | 275,443 | |
Scania AB, B Shares | | | 19,515 | | | 405,744 | |
Svenska Handelsbanken AB, A Shares | | | 15,538 | | | 558,620 | |
| | | | | | | |
| | | | | | 2,015,819 | |
| | | | | | | |
The accompanying notes are an integral part of the financial statements.
32
| |
PORTFOLIO OF INVESTMENTS (continued) | |
December 31, 2012 | Baillie Gifford International Choice Fund |
| | |
| | | | | | | |
| | Shares | | Value | |
| | | | | | |
| | | | | | | |
SWITZERLAND - 7.8% | | | | | | | |
Geberit AG (a) | | | 1,199 | | $ | 265,789 | |
Nestle SA | | | 8,104 | | | 528,733 | |
Roche Holding AG - Genusschein | | | 3,367 | | | 680,744 | |
Schindler Holding AG, Participating Certificates | | | 2,071 | | | 299,582 | |
UBS AG (a) | | | 10,966 | | | 171,606 | |
| | | | | | | |
| | | | | | 1,946,454 | |
| | | | | | | |
TAIWAN - 2.1% | | | | | | | |
Hon Hai Precision Industry Co., Ltd. GDR Reg S | | | 57,150 | | | 343,471 | |
Taiwan Semiconductor Manufacturing Co., Ltd. ADR | | | 11,000 | | | 188,760 | |
| | | | | | | |
| | | | | | 532,231 | |
| | | | | | | |
TURKEY - 2.5% | | | | | | | |
Turkiye Garanti Bankasi A/S ADR | | | 59,548 | | | 309,650 | |
Turkiye Is Bankasi GDR Reg S | | | 86,800 | | | 300,571 | |
| | | | | | | |
| | | | | | 610,221 | |
| | | | | | | |
UNITED KINGDOM - 18.4% | | | | | | | |
AMEC Plc. | | | 6,000 | | | 99,186 | |
ASOS Plc. (a) | | | 7,937 | | | 350,088 | |
BG Group Plc. | | | 17,000 | | | 283,558 | |
BHP Billiton Plc. | | | 10,000 | | | 352,736 | |
Hargreaves Lansdown Plc. | | | 27,000 | | | 301,981 | |
Imperial Tobacco Group Plc. | | | 8,000 | | | 310,174 | |
Intertek Group Plc. | | | 7,000 | | | 355,578 | |
John Wood Group Plc. | | | 23,650 | | | 282,726 | |
Johnson Matthey Plc. | | | 10,000 | | | 392,833 | |
Kazakhmys Plc. | | | 12,000 | | | 155,097 | |
Mitchells & Butlers Plc. (a) | | | 44,195 | | | 234,904 | |
Pearson Plc. | | | 11,000 | | | 214,408 | |
Rightmove Plc. | | | 14,088 | | | 331,206 | |
Standard Chartered Plc. | | | 10,434 | | | 270,031 | |
Unilever Plc. | | | 11,647 | | | 452,732 | |
Weir Group Plc. (The) | | | 6,000 | | | 185,540 | |
| | | | | | | |
| | | | | | 4,572,778 | |
| | | | | | | |
UNITED STATES - 3.1% | | | | | | | |
Coca-Cola Enterprises, Inc. | | | 11,387 | | | 361,310 | |
Mettler-Toledo International, Inc. (a) | | | 1,352 | | | 261,342 | |
Protalix BioTherapeutics, Inc. (a) | | | 26,513 | | | 137,603 | |
| | | | | | | |
| | | | | | 760,255 | |
| | | | | | | |
Total Common Stocks
(cost $22,705,707) | | | | | | 23,468,636 | |
| | | | | | | |
| | | | | | | |
PREFERRED STOCKS - 0.9% | | | | | | | |
BRAZIL - 0.9% | | | | | | | |
Itau Unibanco Holding SA ADR
(cost $220,957) | | | 13,500 | | | 222,210 | |
| | | | | | | |
| | | | | | | |
TOTAL INVESTMENTS - 95.5%
(cost $22,926,664) | | | | | | 23,690,846 | |
Other assets less liabilities - 4.5% | | | | | | 1,120,533 | |
| | | | | | | |
NET ASSETS - 100.0% | | | | | $ | 24,811,379 | |
| | | | | | | |
The accompanying notes are an integral part of the financial statements.
33
| |
PORTFOLIO OF INVESTMENTS (concluded) | |
December 31, 2012 | Baillie Gifford International Choice Fund |
| | |
(a) Non-income producing security.
ADR - American Depositary Receipt.
GDR - Global Depositary Receipt.
Reg S - is a safe harbor that defines when an offering of securities will be deemed to come to rest abroad and therefore is not subject to the registration obligations imposed under Section 5 of the 1933 Act. The regulation includes two safe harbor provisions: an issuer safe harbor and a resale safe harbor. In each case, the regulation demands that offers and sales of the securities be made outside the United States and that no offering participant (which includes the issuer, the banks assisting with the offer and their respective affiliates) engage in “directed” selling efforts. In the case of issuers for whose securities there is substantial U.S. market interest, the regulation also requires that no offers and sales be made to U.S. persons (including U.S. persons physically located outside the United States).
The accompanying notes are an integral part of the financial statements.
34
| |
STATEMENT OF ASSETS AND LIABILITIES | |
December 31, 2012 | Baillie Gifford International Choice Fund |
| | |
| | | | |
ASSETS | | | | |
Investments, at value (cost $22,926,664) | | $ | 23,690,846 | |
Cash | | | 1,095,467 | |
Foreign cash, at value (cost $29,678) | | | 28,458 | |
Due from Manager | | | 20,127 | |
Dividends receivable | | | 15,224 | |
Tax reclaims receivable | | | 773 | |
| | | | |
| | | | |
Total Assets | | | 24,850,895 | |
| | | | |
| | | | |
LIABILITIES | | | | |
Servicing fee payable | | | 25,061 | |
Accrued expenses | | | 14,455 | |
| | | | |
| | | | |
Total Liabilities | | | 39,516 | |
| | | | |
| | | | |
NET ASSETS | | $ | 24,811,379 | |
| | | | |
| | | | |
| | | | |
COMPOSITION OF NET ASSETS | | | | |
Paid-in capital | | $ | 24,065,032 | |
Undistributed net investment income | | | 6,965 | |
Net realized loss on investments and foreign currency transactions | | | (23,530 | ) |
Net unrealized appreciation in value of investments and foreign currencies | | | 762,912 | |
| | | | |
| | $ | 24,811,379 | |
| | | | |
| | | | |
NET ASSET VALUE, PER SHARE | | | | |
| | | | |
Class 1 ($24,811,379 / 2,403,571 shares outstanding),
unlimited authorized, no par value | | $ | 10.32 | |
| | | | |
Maximum Purchase Price Per Share (Note D) | | $ | 10.34 | |
| | | | |
Minimum Redemption Price Per Share (Note D) | | $ | 10.30 | |
| | | | |
The accompanying notes are an integral part of the financial statements.
35
| |
STATEMENT OF OPERATIONS | |
For the Period September 24, 2012* through December 31, 2012 | Baillie Gifford International Choice Fund |
| | |
| | | | |
INVESTMENT INCOME | | | | |
Dividends (net of foreign withholding taxes of $4,399) | | $ | 63,138 | |
| | | | |
Total Investment Income | | | 63,138 | |
| | | | |
| | | | |
EXPENSES | | | | |
Management fee (Note B) | | | 14,679 | |
Shareholder Servicing fees - Class 1 Shares (Note B) | | | 26,422 | |
Legal | | | 27,944 | |
Fund Accounting | | | 8,000 | |
Custody | | | 4,000 | |
Transfer Agency | | | 1,504 | |
Professional fees | | | 653 | |
Trustees’ fees | | | 531 | |
Insurance | | | 68 | |
Miscellaneous | | | 158 | |
| | | | |
Total Expenses | | | 83,959 | |
| | | | |
Fees waived and expenses reimbursed by Manager (Note B) | | | (34,050 | ) |
| | | | |
Net Expenses | | | 49,909 | |
| | | | |
| | | | |
Net Investment Income | | | 13,229 | |
| | | | |
| | | | |
REALIZED AND UNREALIZED GAIN (LOSS) ON INVESTMENTS AND FOREIGN CURRENCY TRANSACTIONS | | | | |
Net realized gain (loss) from: | | | | |
Investments | | | (23,530 | ) |
Foreign currency transactions | | | 23,768 | |
| | | | |
| | | 238 | |
| | | | |
| | | | |
Net change in unrealized appreciation (depreciation) on: | | | | |
Investments | | | 764,182 | |
Translation of assets and liabilities in foreign currencies | | | (1,270 | ) |
| | | | |
| | | 762,912 | |
| | | | |
| | | | |
Net realized and unrealized gain on investments and foreign currency transactions | | | 763,150 | |
| | | | |
NET INCREASE IN NET ASSETS FROM OPERATIONS | | $ | 776,379 | |
| | | | |
* Commencement of investment operations.
The accompanying notes are an integral part of the financial statements.
36
| |
STATEMENT OF CHANGES IN NET ASSETS | Baillie Gifford International Choice Fund |
| | |
| | | | |
| | For the Period
September 24, 2012*
through
December 31, 2012 | |
| | | |
| | | | |
INCREASE IN NET ASSETS FROM OPERATIONS | | | | |
Net investment income | | $ | 13,229 | |
Net realized gain from investments and foreign currency transactions | | | 238 | |
Net change in unrealized appreciation (depreciation) on investments and translation of assets and liabilities in foreign currencies | | | 762,912 | |
| | | | |
Net increase in net assets from operations | | | 776,379 | |
| | | | |
| | | | |
DIVIDENDS TO SHAREHOLDERS FROM | | | | |
Net investment income: | | | | |
Class 1 | | | (30,032 | ) |
| | | | |
| | | | |
| | | | |
TRANSACTIONS IN SHARES OF BENEFICIAL INTEREST | | | | |
Net proceeds from shares subscribed: | | | | |
Class 1 | | | 23,986,930 | |
Purchase premiums: | | | | |
Class 1 | | | 48,070 | |
Dividends reinvested: | | | | |
Class 1 | | | 30,032 | |
| | | | |
| | | | |
Increase in Net Assets from Transactions in Shares of Beneficial Interest | | | 24,065,032 | |
| | | | |
| | | | |
Total Increase in Net Assets | | | 24,811,379 | |
| | | | |
NET ASSETS | | | | |
Beginning of period | | | — | |
| | | | |
End of period (including undistributed net investment income of $6,965) | | $ | 24,811,379 | |
| | | | |
* Commencement of investment operations.
The accompanying notes are an integral part of the financial statements.
37
| |
FINANCIAL HIGHLIGHTS | Baillie Gifford International Choice Fund |
| | |
| |
Selected data for a Class 1 Share outstanding throughout the period: | |
| | | | |
| | For the Period
September 24, 2012(a)
through
December 31, 2012 | |
| | | |
Net asset value, beginning of period | | $ | 10.00 | |
| | | | |
| | | | |
From Investment Operations | | | | |
Net investment income(b) | | | 0.01 | |
Net realized and unrealized gain on investments and foreign currency transactions | | | 0.30 | |
| | | | |
Net increase in net asset value from investment operations | | | 0.31 | |
| | | | |
| | | | |
Dividends to Shareholders | | | | |
Dividends from net investment income | | | (0.01 | ) |
| | | | |
| | | | |
Proceeds from Purchase Premiums(b) | | | 0.02 | |
| | | | |
| | | | |
Net asset value, end of period | | $ | 10.32 | |
| | | | |
| | | | |
Total Return | | | | |
Total investment return based on net asset value(c) | | | 3.33 | % |
| | | | |
Ratios/Supplemental Data | | | | |
Net assets, end of period (000’s omitted) | | $ | 24,811 | |
Ratio of net expenses to average net assets, after waiver and reimbursement | | | 0.85 | %*(d) |
Ratio of net expenses to average net assets, before waiver and reimbursement | | | 1.43 | %*(d) |
Ratio of net investment income to average net assets | | | 0.23 | %* |
Portfolio turnover rate | | | 2 | % |
| |
* | Annualized |
(a) | Commencement of investment operations. |
(b) | Calculated based upon average shares outstanding during the period. |
(c) | Total investment return is calculated assuming an initial investment made at the net asset value at the beginning of the period, reinvestment of all dividends and distributions, if any, at net asset value during the period, and redemption on the last day of the period. Total return is not annualized for periods less than one year. |
(d) | Baillie Gifford Overseas Limited had contractually agreed to waive its fees and/or bear other expenses through April 30, 2013 to the extent that such Fund’s total annual operating expenses (excluding interest, taxes and extraordinary expenses) exceeded 0.85% for Class 1 shares. |
The accompanying notes are an integral part of the financial statements.
38
| |
INDUSTRY DIVERSIFICATION TABLE | |
December 31, 2012 (unaudited) | Baillie Gifford EAFE Fund |
| | |
| | | | | | | |
| | Value | | % of Total
Net Assets | |
| | | | | |
| | | | | |
Aerospace/Defense | | $ | 83,341,087 | | | 4.0 | % |
Apparel | | | 98,163,907 | | | 4.7 | |
Auto Manufacturers | | | 82,722,262 | | | 4.0 | |
Banks | | | 227,429,069 | | | 10.9 | |
Beverages, Food & Tobacco | | | 73,147,684 | | | 3.5 | |
Biotechnology | | | 31,674,393 | | | 1.5 | |
Chemicals | | | 68,857,250 | | | 3.3 | |
Commercial Services | | | 48,891,071 | | | 2.3 | |
Construction & Building Materials | | | 55,448,793 | | | 2.7 | |
Cosmetics/Personal Care | | | 63,641,838 | | | 3.0 | |
Diversified Financial Services | | | 63,226,936 | | | 3.0 | |
Diversified Industrials | | | 24,813,191 | | | 1.2 | |
Electronic & Electrical Equipment | | | 47,452,351 | | | 2.3 | |
Energy - Alternate Sources | | | 4,370,441 | | | 0.2 | |
Engineering & Machinery | | | 174,436,402 | | | 8.3 | |
Food Producers & Processors | | | 11,115,816 | | | 0.5 | |
Healthcare - Products | | | 59,767,346 | | | 2.9 | |
Insurance | | | 110,655,104 | | | 5.3 | |
Internet | | | 266,309,856 | | | 12.8 | |
Investment Companies | | | 786,444 | | | 0.0 | |
Media & Photography | | | 16,539,342 | | | 0.8 | |
Mining & Metals | | | 99,691,555 | | | 4.8 | |
Oil & Gas | | | 62,453,893 | | | 3.0 | |
Pharmaceuticals | | | 53,949,901 | | | 2.6 | |
Retailers - General | | | 130,134,898 | | | 6.2 | |
Semiconductors | | | 85,170,444 | | | 4.1 | |
Telecommunication Services | | | 22,325,503 | | | 1.1 | |
Toys/Games/Hobbies | | | 9,800,875 | | | 0.5 | |
| | | | | | | |
| | | | | | | |
Total Value of Investments | | | 2,076,317,652 | | | 99.5 | |
Other assets less liabilities | | | 11,454,578 | | | 0.5 | |
| | | | | | | |
Net Assets | | $ | 2,087,772,230 | | | 100.0 | % |
| | | | | | | |
The accompanying notes are an integral part of the financial statements.
39
| |
PORTFOLIO OF INVESTMENTS | |
December 31, 2012 | Baillie Gifford EAFE Fund |
| |
| | | | | | | |
| | Shares | | Value | |
| |
| | | | | | | |
COMMON STOCKS - 97.3% | | | | | | | |
ARGENTINA - 0.6% | | | | | | | |
MercadoLibre, Inc. | | | 150,300 | | $ | 11,809,071 | |
| | | | | | | |
| | | | | | | |
AUSTRALIA - 5.2% | | | | | | | |
Brambles Ltd. | | | 3,659,630 | | | 29,018,373 | |
Cochlear Ltd. | | | 143,913 | | | 11,930,375 | |
Fortescue Metals Group Ltd. | | | 7,249,196 | | | 36,126,067 | |
Woodside Petroleum Ltd. | | | 850,175 | | | 30,296,130 | |
| | | | | | | |
| | | | | | 107,370,945 | |
| | | | | | | |
BRAZIL - 1.0% | | | | | | | |
BM&F Bovespa SA | | | 2,510,000 | | | 17,162,393 | |
OGX Petroleo e Gas Participacoes SA (a) | | | 1,428,400 | | | 3,055,625 | |
| | | | | | | |
| | | | | | 20,218,018 | |
| | | | | | | |
CHILE - 0.5% | | | | | | | |
Sociedad Quimica y Minera de Chile SA ADR | | | 189,500 | | | 10,922,780 | |
| | | | | | | |
| | | | | | | |
CHINA - 11.8% | | | | | | | |
AIA Group Ltd. | | | 10,859,200 | | | 43,071,228 | |
Baidu, Inc. ADR (a) | | | 851,500 | | | 85,396,935 | |
CNOOC Ltd. | | | 4,539,000 | | | 9,999,476 | |
Hong Kong Exchanges and Clearing Ltd. | | | 1,254,000 | | | 21,701,939 | |
New Oriental Education & Technology Group ADR | | | 482,000 | | | 9,365,260 | |
Tencent Holdings Ltd. | | | 2,033,000 | | | 66,675,706 | |
Youku Tudou, Inc. ADR (a) | | | 501,166 | | | 9,141,268 | |
| | | | | | | |
| | | | | | 245,351,812 | |
| | | | | | | |
DENMARK - 3.5% | | | | | | | |
Novo Nordisk A/S, B Shares | | | 331,313 | | | 53,949,901 | |
Novozymes A/S, B Shares | | | 699,090 | | | 19,844,814 | |
| | | | | | | |
| | | | | | 73,794,715 | |
| | | | | | | |
FRANCE - 6.8% | | | | | | | |
Compagnie Generale d’Optique Essilor International SA | | | 327,766 | | | 33,057,767 | |
L’Oreal SA | | | 400,158 | | | 55,679,288 | |
PPR | | | 281,004 | | | 52,775,856 | |
| | | | | | | |
| | | | | | 141,512,911 | |
| | | | | | | |
GERMANY - 3.7% | | | | | | | |
Adidas AG | | | 224,315 | | | 20,020,046 | |
Aixtron SE NA | | | 854,909 | | | 10,195,017 | |
Axel Springer AG | | | 136,192 | | | 5,830,395 | |
HeidelbergCement AG | | | 247,975 | | | 15,174,103 | |
SMA Solar Technology AG | | | 172,524 | | | 4,370,441 | |
Volkswagen AG | | | 101,016 | | | 21,914,254 | |
| | | | | | | |
| | | | | | 77,504,256 | |
| | | | | | | |
INDIA - 0.6% | | | | | | | |
Housing Development Finance Corp. | | | 744,200 | | | 11,369,000 | |
| | | | | | | |
| | | | | | | |
IRELAND - 0.6% | | | | | | | |
James Hardie Industries SE CDI | | | 1,292,501 | | | 12,513,848 | |
| | | | | | | |
| | | | | | | |
ITALY - 3.2% | | | | | | | |
Fiat SpA (a) | | | 6,880,309 | | | 34,659,148 | |
UniCredit SpA (a) | | | 6,476,783 | | | 31,894,805 | |
| | | | | | | |
| | | | | | 66,553,953 | |
| | | | | | | |
The accompanying notes are an integral part of the financial statements.
40
| |
PORTFOLIO OF INVESTMENTS (continued) | |
December 31, 2012 | Baillie Gifford EAFE Fund |
| |
| | | | | | | |
| | Shares | | Value | |
| |
| | | | | | | |
JAPAN - 7.2% | | | | | | | |
Gree, Inc. | | | 1,490,900 | | $ | 23,138,050 | |
Kyocera Corp. | | | 141,000 | | | 12,783,808 | |
Rakuten, Inc. | | | 5,260,700 | | | 41,025,324 | |
Sanrio Co., Ltd. | | | 307,200 | | | 9,800,875 | |
SMC Corp. | | | 195,000 | | | 35,422,624 | |
Softbank Corp. | | | 609,300 | | | 22,325,503 | |
Yamada Denki Co., Ltd. | | | 148,670 | | | 5,746,244 | |
| | | | | | | |
| | | | | | 150,242,428 | |
| | | | | | | |
LUXEMBOURG - 0.4% | | | | | | | |
Oriflame Cosmetics SA SDR | | | 248,959 | | | 7,962,550 | |
Reinet Investments SCA (a) | | | 43,081 | | | 786,444 | |
| | | | | | | |
| | | | | | 8,748,994 | |
| | | | | | | |
NORWAY - 0.5% | | | | | | | |
Schibsted ASA | | | 250,414 | | | 10,708,947 | |
| | | | | | | |
| | | | | | | |
PERU - 0.8% | | | | | | | |
Credicorp Ltd. | | | 112,887 | | | 16,544,719 | |
| | | | | | | |
| | | | | | | |
PORTUGAL - 1.0% | | | | | | | |
Jeronimo Martins SGPS SA | | | 1,027,937 | | | 19,876,707 | |
| | | | | | | |
| | | | | | | |
RUSSIA - 0.5% | | | | | | | |
Mail.ru Group Ltd. GDR Reg S | | | 306,205 | | | 10,695,191 | |
| | | | | | | |
| | | | | | | |
SINGAPORE - 0.6% | | | | | | | |
Singapore Exchange Ltd. | | | 2,236,000 | | | 12,993,604 | |
| | | | | | | |
| | | | | | | |
SOUTH AFRICA - 0.3% | | | | | | | |
Impala Platinum Holdings Ltd. | | | 356,300 | | | 7,125,690 | |
| | | | | | | |
| | | | | | | |
SOUTH KOREA - 3.1% | | | | | | | |
Celltrion, Inc. | | | 484,426 | | | 11,829,579 | |
NHN Corp. | | | 86,753 | | | 18,428,312 | |
Samsung Electronics Co., Ltd. | | | 24,129 | | | 34,668,543 | |
| | | | | | | |
| | | | | | 64,926,434 | |
| | | | | | | |
SPAIN - 6.3% | | | | | | | |
Banco Santander SA | | | 5,278,710 | | | 42,900,374 | |
Distribuidora Internacional de Alimentacion SA | | | 1,635,685 | | | 10,450,693 | |
Inditex SA | | | 556,156 | | | 78,143,861 | |
| | | | | | | |
| | | | | | 131,494,928 | |
| | | | | | | |
SWEDEN - 9.3% | | | | | | | |
Alfa Laval AB | | | 1,186,678 | | | 24,813,191 | |
Atlas Copco AB, A Shares | | | 2,997,444 | | | 83,119,970 | |
Elekta AB, B Shares | | | 947,844 | | | 14,779,204 | |
Sandvik AB | | | 1,909,943 | | | 30,696,151 | |
Svenska Handelsbanken AB, A Shares | | | 1,153,243 | | | 41,461,266 | |
| | | | | | | |
| | | | | | 194,869,782 | |
| | | | | | | |
The accompanying notes are an integral part of the financial statements.
41
| |
PORTFOLIO OF INVESTMENTS (continued) | |
December 31, 2012 | Baillie Gifford EAFE Fund |
| |
| | | | | | | |
| | Shares | | Value | |
| |
| | | | | | | |
SWITZERLAND - 8.7% | | | | | | | |
ABB Ltd. (a) | | | 1,215,075 | | $ | 25,197,657 | |
Compagnie Financiere Richemont SA, Br A | | | 785,669 | | | 61,671,527 | |
Geberit AG (a) | | | 125,232 | | | 27,760,842 | |
Swatch Group AG (The) | | | 19,604 | | | 9,941,271 | |
Syngenta AG | | | 143,407 | | | 57,934,470 | |
| | | | | | | |
| | | | | | 182,505,767 | |
| | | | | | | |
TAIWAN - 0.7% | | | | | | | |
Taiwan Semiconductor Manufacturing Co., Ltd. ADR | | | 876,406 | | | 15,039,127 | |
| | | | | | | |
| | | | | | | |
TURKEY - 1.4% | | | | | | | |
BIM Birlesik Magazalar A/S | | | 226,693 | | | 11,115,816 | |
Turkiye Garanti Bankasi A/S | | | 3,615,759 | | | 18,872,201 | |
| | | | | | | |
| | | | | | 29,988,017 | |
| | | | | | | |
UNITED KINGDOM - 19.0% | | | | | | | |
Aggreko Plc. | | | 368,182 | | | 10,507,438 | |
ARM Holdings Plc. | | | 4,746,000 | | | 59,936,300 | |
BG Group Plc. | | | 1,145,251 | | | 19,102,662 | |
BHP Billiton Plc. | | | 1,600,055 | | | 56,439,798 | |
British American Tobacco Plc. | | | 842,335 | | | 42,820,284 | |
Meggitt Plc. | | | 4,748,189 | | | 29,732,122 | |
Prudential Plc. | | | 4,736,938 | | | 67,583,876 | |
Rolls-Royce Holdings Plc. (a) | | | 3,737,520 | | | 53,608,965 | |
Standard Chartered Plc. | | | 2,193,638 | | | 56,771,069 | |
| | | | | | | |
| | | | | | 396,502,514 | |
| | | | | | | |
Total Common Stocks | | | | | | | |
(cost $1,597,283,901) | | | | | | 2,031,184,158 | |
| | | | | | | |
| | | | | | | |
PREFERRED STOCKS - 2.2% | | | | | | | |
BRAZIL - 0.9% | | | | | | | |
Itau Unibanco Holding SA ADR | | | 1,153,380 | | | 18,984,635 | |
| | | | | | | |
| | | | | | | |
GERMANY - 1.3% | | | | | | | |
Porsche Automobil Holding SE | | | 317,667 | | | 26,148,859 | |
| | | | | | | |
| | | | | | | |
Total Preferred Stocks | | | | | | | |
(cost $42,200,337) | | | | | | 45,133,494 | |
| | | | | | | |
| | | | | | | |
TOTAL INVESTMENTS - 99.5% | | | | | | | |
(cost $1,639,484,238) | | | | | | 2,076,317,652 | |
Other assets less liabilities - 0.5% | | | | | | 11,454,578 | |
| | | | | | | |
NET ASSETS - 100.0% | | | | | $ | 2,087,772,230 | |
| | | | | | | |
(a) Non-income producing security.
ADR - American Depositary Receipt.
CDI - Chess Depositary Interest.
GDR - Global Depositary Receipt.
SDR - Swedish Depository Receipt.
The accompanying notes are an integral part of the financial statements.
42
| |
PORTFOLIO OF INVESTMENTS (concluded) | |
December 31, 2012 | Baillie Gifford EAFE Fund |
| |
Reg S - is a safe harbor that defines when an offering of securities will be deemed to come to rest abroad and therefore is not subject to the registration obligations imposed under Section 5 of the 1933 Act. The regulation includes two safe harbor provisions: an issuer safe harbor and a resale safe harbor. In each case, the regulation demands that offers and sales of the securities be made outside the United States and that no offering participant (which includes the issuer, the banks assisting with the offer and their respective affiliates) engage in “directed” selling efforts. In the case of issuers for whose securities there is substantial U.S. market interest, the regulation also requires that no offers and sales be made to U.S. persons (including U.S. persons physically located outside the United States).
The accompanying notes are an integral part of the financial statements.
43
| |
STATEMENT OF ASSETS AND LIABILITIES | |
December 31, 2012 | Baillie Gifford EAFE Fund |
| |
| | | | |
ASSETS | | | | |
Investments, at value (cost $1,639,484,238) | | $ | 2,076,317,652 | |
Cash | | | 14,108,862 | |
Foreign cash, at value (cost $2,290,405) | | | 2,293,176 | |
Receivable for investments sold | | | 461,430 | |
Tax reclaims receivable | | | 1,746,480 | |
Dividends receivable | | | 373,851 | |
Other assets | | | 7,139 | |
| | | | |
Total Assets | | | 2,095,308,590 | |
| | | | |
| | | | |
LIABILITIES | | | | |
Payable for investments purchased | | | 2,976,136 | |
Distributions payable | | | 1,699,342 | |
Management fee payable | | | 1,252,365 | |
Servicing fee payable | | | 1,068,660 | |
Accrued expenses | | | 539,857 | |
| | | | |
Total Liabilities | | | 7,536,360 | |
| | | | |
| | | | |
NET ASSETS | | $ | 2,087,772,230 | |
| | | | |
| | | | |
| | | | |
COMPOSITION OF NET ASSETS | | | | |
Paid-in capital | | $ | 1,737,869,435 | |
Distributions in excess of net investment income | | | (18,074,322 | ) |
Accumulated net realized loss on investments and foreign currency transactions (net of Indian capital gains tax) | | | (68,863,260 | ) |
Net unrealized appreciation in value of investments and foreign currencies | | | 436,840,377 | |
| | | | |
| | $ | 2,087,772,230 | |
| | | | |
| | | | |
NET ASSET VALUE, PER SHARE | | | | |
| | | | |
Class 1 ($44,007,779 / 4,442,107 shares outstanding),
unlimited authorized, no par value | | $ | 9.91 | |
| | | | |
Maximum Purchase Price Per Share (Note D) | | $ | 9.93 | |
| | | | |
Minimum Redemption Price Per Share (Note D) | | $ | 9.90 | |
| | | | |
| | | | |
Class 2 ($936,351,777 / 94,799,046 shares outstanding),
unlimited authorized, no par value | | $ | 9.88 | |
| | | | |
Maximum Purchase Price Per Share (Note D) | | $ | 9.90 | |
| | | | |
Minimum Redemption Price Per Share (Note D) | | $ | 9.87 | |
| | | | |
| | | | |
Class 3 ($490,822,158 / 49,600,450 shares outstanding),
unlimited authorized, no par value | | $ | 9.90 | |
| | | | |
Maximum Purchase Price Per Share (Note D) | | $ | 9.92 | |
| | | | |
Minimum Redemption Price Per Share (Note D) | | $ | 9.89 | |
| | | | |
| | | | |
Class 5 ($616,590,516 / 62,165,186 shares outstanding),
unlimited authorized, no par value | | $ | 9.92 | |
| | | | |
Maximum Purchase Price Per Share (Note D) | | $ | 9.94 | |
| | | | |
Minimum Redemption Price Per Share (Note D) | | $ | 9.91 | |
| | | | |
The accompanying notes are an integral part of the financial statements.
44
| |
STATEMENT OF OPERATIONS | |
For the Year Ended December 31, 2012 | Baillie Gifford EAFE Fund |
| |
| | | | |
INVESTMENT INCOME | | | | |
Dividends (net of foreign withholding taxes of $3,101,950) | | $ | 33,653,241 | |
Interest | | | 15,195 | |
| | | | |
Total Investment Income | | | 33,668,436 | |
| | | | |
| | | | |
EXPENSES | | | | |
Management fee (Note B) | | | 4,689,805 | |
Shareholder Servicing fees - Class 1 Shares (Note B) | | | 178,666 | |
Shareholder Servicing fees - Class 2 Shares (Note B) | | | 2,235,286 | |
Shareholder Servicing fees - Class 3 Shares (Note B) | | | 910,321 | |
Shareholder Servicing fees - Class 4 Shares (Note B) | | | 476,191 | |
Shareholder Servicing fees - Class 5 Shares (Note B) | | | 313,866 | |
Fund Accounting | | | 884,789 | |
Custody | | | 339,296 | |
Legal | | | 211,865 | |
Professional fees | | | 103,234 | |
Trustees’ fees | | | 45,490 | |
Transfer Agency | | | 33,226 | |
Insurance | | | 20,271 | |
Miscellaneous | | | 5,349 | |
| | | | |
Total Expenses | | | 10,447,655 | |
| | | | |
| | | | |
Net Investment Income | | | 23,220,781 | |
| | | | |
| | | | |
| | | | |
REALIZED AND UNREALIZED GAIN (LOSS) ON INVESTMENTS AND FOREIGN CURRENCY TRANSACTIONS | | | | |
Net realized gain (loss) from: | | | | |
Investments (net of Indian capital gains tax $35,858) | | | (36,783,688 | ) |
Foreign currency transactions | | | 404,959 | |
| | | | |
| | | (36,378,729 | ) |
| | | | |
| | | | |
Net change in unrealized appreciation (depreciation) on: | | | | |
Investments | | | 336,627,932 | |
Translation of assets and liabilities in foreign currencies | | | (3,199 | ) |
| | | | |
| | | 336,624,733 | |
| | | | |
| | | | |
Net realized and unrealized gain on investments and foreign currency transactions | | | 300,246,004 | |
| | | | |
NET INCREASE IN NET ASSETS FROM OPERATIONS | | $ | 323,466,785 | |
| | | | |
The accompanying notes are an integral part of the financial statements.
45
| |
STATEMENTS OF CHANGES IN NET ASSETS | Baillie Gifford EAFE Fund |
| |
| | | | | | | |
| | For the
Year Ended
December 31, 2012 | | For the
Year Ended
December 31, 2011 | |
| | | | | | | |
INCREASE (DECREASE) IN NET ASSETS FROM OPERATIONS | | | | | | | |
Net investment income | | $ | 23,220,781 | | $ | 23,139,319 | |
Net realized gain (loss) from investments and foreign currency transactions | | | (36,378,729 | ) | | 5,850,300 | |
Net change in unrealized appreciation (depreciation) on investments and translation of assets and liabilities in foreign currencies | | | 336,624,733 | | | (257,585,425 | ) |
| | | | | | | |
Net increase (decrease) in net assets from operations | | | 323,466,785 | | | (228,595,806 | ) |
| | | | | | | |
| | | | | | | |
DIVIDENDS TO SHAREHOLDERS FROM | | | | | | | |
Net investment income: | | | | | | | |
Class 1 | | | (346,140 | ) | | (346,240 | ) |
Class 2 | | | (9,050,478 | ) | | (13,101,782 | ) |
Class 3 | | | (5,075,670 | ) | | (10,003,634 | ) |
Class 4 | | | — | | | (9,427,671 | ) |
Class 5 | | | (6,828,751 | ) | | — | |
| | | | | | | |
Total Dividends | | | (21,301,039 | ) | | (32,879,327 | ) |
| | | | | | | |
| | | | | | | |
TRANSACTIONS IN SHARES OF BENEFICIAL INTEREST | | | | | | | |
Net proceeds from shares subscribed: | | | | | | | |
Class 1 | | | 20,956,314 | | | — | |
Class 2 | | | 161,201,621 | | | 80,411,056 | |
Class 3 | | | 7,485,000 | | | 455,761,252 | |
Class 4 | | | 49,900,000 | | | 49,900,000 | |
Class 5 | | | 532,921,389 | | | — | |
Purchase premiums: | | | | | | | |
Class 1 | | | 3,667 | | | 9,732 | |
Class 2 | | | 75,854 | | | 340,633 | |
Class 3 | | | 40,423 | | | 198,341 | |
Class 4 | | | 35,418 | | | 210,125 | |
Class 5 | | | 15,109 | | | — | |
Redemption fees: | | | | | | | |
Class 1 | | | 1,742 | | | 721 | |
Class 2 | | | 36,183 | | | 25,164 | |
Class 3 | | | 19,378 | | | 14,429 | |
Class 4 | | | 4,000 | | | 15,257 | |
Class 5 | | | 20,052 | | | — | |
Dividends reinvested: | | | | | | | |
Class 1 | | | 346,140 | | | 346,240 | |
Class 2 | | | 8,327,874 | | | 11,867,864 | |
Class 3 | | | 4,098,931 | | | 8,388,124 | |
Class 4 | | | — | | | 9,427,671 | |
Class 5 | | | 6,828,751 | | | — | |
Cost of shares redeemed: | | | | | | | |
Class 1 | | | (2,503,756 | ) | | — | |
Class 2 | | | (42,719,584 | ) | | (234,455,958 | ) |
Class 3 | | | (102,190,959 | ) | | (10,015,023 | ) |
Class 4 | | | (532,921,389 | ) | | — | |
| | | | | | | |
| | | | | | | |
Increase in Net Assets from Transactions in Shares of Beneficial Interest | | | 111,982,158 | | | 372,445,628 | |
| | | | | | | |
| | | | | | | |
Total Increase in Net Assets | | | 414,147,904 | | | 110,970,495 | |
| | | | | | | |
NET ASSETS | | | | | | | |
Beginning of year | | | 1,673,624,326 | | | 1,562,653,831 | |
| | | | | | | |
End of year (including distributions in excess of net investment income of $18,074,322 and $20,363,165, respectively) | | $ | 2,087,772,230 | | $ | 1,673,624,326 | |
| | | | | | | |
The accompanying notes are an integral part of the financial statements.
46
| |
FINANCIAL HIGHLIGHTS | Baillie Gifford EAFE Fund |
| |
Selected data for a Class 1 Share outstanding throughout each period:
| | | | | | | | | | | | | |
| | For the
Year Ended
December 31, 2012 | | For the
Year Ended
December 31, 2011 | | For the
Year Ended
December 31, 2010 | | For the Period
January 2, 2009(a)
through
December 31, 2009 | |
| | | | | | | | | |
Net asset value, beginning of period | | $ | 8.43 | | $ | 9.73 | | $ | 8.47 | | $ | 6.01 | |
| | | | | | | | | | | | | |
| | | | | | | | | | | | | |
From Investment Operations | | | | | | | | | | | | | |
Net investment income(b) | | | 0.10 | | | 0.11 | | | 0.14 | | | 0.12 | |
Net realized and unrealized gain (loss) on investments and foreign currency transactions | | | 1.46 | | | (1.26 | ) | | 1.23 | | | 2.36 | |
| | | | | | | | | | | | | |
Net increase (decrease) in net asset value from investment operations | | | 1.56 | | | (1.15 | ) | | 1.37 | | | 2.48 | |
| | | | | | | | | | | | | |
| | | | | | | | | | | | | |
Dividends to Shareholders | | | | | | | | | | | | | |
Dividends from net investment income | | | (0.08 | ) | | (0.15 | ) | | (0.12 | ) | | (0.03 | ) |
| | | | | | | | | | | | | |
| | | | | | | | | | | | | |
Proceeds from Purchase Premiums and Redemption Fees(b) | | | (0.00 | )(c) | | (0.00 | )(c) | | 0.01 | | | 0.01 | |
| | | | | | | | | | | | | |
| | | | | | | | | | | | | |
Net asset value, end of period | | $ | 9.91 | | $ | 8.43 | | $ | 9.73 | | $ | 8.47 | |
| | | | | | | | | | | | | |
| | | | | | | | | | | | | |
Total Return | | | | | | | | | | | | | |
Total investment return based on net asset value(d) | | | 18.50 | % | | (11.82 | )% | | 16.36 | % | | 41.49 | % |
| | | | | | | | | | | | | |
Ratios/Supplemental Data | | | | | | | | | | | | | |
Net assets, end of period (000’s omitted) | | $ | 44,008 | | $ | 19,880 | | $ | 22,567 | | $ | 41,798 | |
Ratio of net expenses to average net assets | | | 0.79 | % | | 0.78 | % | | 0.79 | % | | 0.84 | %* (e) |
Ratio of net investment income to average net assets | | | 1.10 | % | | 1.16 | % | | 1.52 | % | | 1.61 | * |
Portfolio turnover rate | | | 18 | % | | 11 | % | | 13 | % | | 9 | % |
| |
* | Annualized. |
(a) | Commencement of investment operations. |
(b) | Calculated based upon average shares outstanding during the period. |
(c) | Rounds to less than $0.005 per share. |
(d) | Total investment return is calculated assuming an initial investment made at the net asset value at the beginning of the period, reinvestment of all dividends and distributions, if any, at net asset value during the period, and redemption on the last day of the period. Total return is not annualized for periods less than one year. |
(e) | Baillie Gifford Overseas Limited had contractually agreed to waive its fees and/or bear other expenses through March 31, 2009 to the extent that such Fund’s total annual operating expenses (excluding interest, taxes and extraordinary expenses) exceeded 0.98% for Class 1 Shares. |
The accompanying notes are an integral part of the financial statements.
47
| |
FINANCIAL HIGHLIGHTS (continued) | Baillie Gifford EAFE Fund |
| |
Selected data for a Class 2 Share outstanding throughout each period:
| | | | | | | | | | | | | | | | |
| | For the
Year Ended
December 31, 2012 | | For the
Year Ended
December 31, 2011 | | For the
Year Ended
December 31, 2010 | | For the
Year Ended
December 31, 2009 | | For the Period
March 6, 2008(a)
through
December 31, 2008 | |
| | | | | | | | | | | |
Net asset value, beginning of period | | $ | 8.40 | | $ | 9.70 | | $ | 8.44 | | $ | 5.85 | | $ | 10.00 | |
| | | | | | | | | | | | | | | | |
| | | | | | | | | | | | | | | | |
From Investment Operations | | | | | | | | | | | | | | | | |
Net investment income(b) | | | 0.11 | | | 0.13 | | | 0.10 | | | 0.07 | | | 0.10 | |
Net realized and unrealized gain (loss) on investments and foreign currency transactions | | | 1.47 | | | (1.27 | ) | | 1.29 | | | 2.60 | | | (4.20 | ) |
| | | | | | | | | | | | | | | | |
Net increase (decrease) in net asset value from investment operations | | | 1.58 | | | (1.14 | ) | | 1.39 | | | 2.67 | | | (4.10 | ) |
| | | | | | | | | | | | | | | | |
| | | | | | | | | | | | | | | | |
Dividends to Shareholders | | | | | | | | | | | | | | | | |
Dividends from net investment income | | | (0.10 | ) | | (0.16 | ) | | (0.14 | ) | | (0.09 | ) | | (0.07 | ) |
| | | | | | | | | | | | | | | | |
| | | | | | | | | | | | | | | | |
Proceeds from Purchase Premiums and Redemption Fees(b) | | | (0.00 | )(c) | | (0.00 | )(c) | | 0.01 | | | 0.01 | | | 0.02 | |
| | | | | | | | | | | | | | | | |
| | | | | | | | | | | | | | | | |
Net asset value, end of period | | $ | 9.88 | | $ | 8.40 | | $ | 9.70 | | $ | 8.44 | | $ | 5.85 | |
| | | | | | | | | | | | | | | | |
| | | | | | | | | | | | | | | | |
Total Return | | | | | | | | | | | | | | | | |
Total investment return based on net asset value(d) | | | 18.78 | % | | (11.70 | )% | | 16.60 | % | | 45.75 | % | | (40.79 | )% |
| | | | | | | | | | | | | | | | |
Ratios/Supplemental Data | | | | | | | | | | | | | | | | |
Net assets, end of period (000’s omitted) | | $ | 936,352 | | $ | 682,295 | | $ | 923,723 | | $ | 499,797 | | $ | 86,508 | |
Ratio of net expenses to average net assets | | | 0.61 | % | | 0.60 | % | | 0.62 | % | | 0.65 | (e) | | 0.75 | %*(e) |
Ratio of net investment income to average net assets | | | 1.20 | % | | 1.33 | % | | 1.14 | % | | 0.95 | % | | 1.75 | %* |
Portfolio turnover rate | | | 18 | % | | 11 | % | | 13 | % | | 9 | % | | 16 | % |
| |
* | Annualized. |
(a) | Commencement of investment operations. |
(b) | Calculated based upon average shares outstanding during the period. |
(c) | Rounds to less than $0.005 per share. |
(d) | Total investment return is calculated assuming an initial investment made at the net asset value at the beginning of the period, reinvestment of all dividends and distributions, if any, at net asset value during the period, and redemption on the last day of the period. Total return is not annualized for periods less than one year. |
(e) | Baillie Gifford Overseas Limited had contractually agreed to waive its fees and/or bear other expenses through March 31, 2009 to the extent that such Fund’s total annual operating expenses (excluding interest, taxes and extraordinary expenses) exceeded 0.80% for Class 2 Shares. |
The accompanying notes are an integral part of the financial statements.
48
| |
FINANCIAL HIGHLIGHTS (continued) | Baillie Gifford EAFE Fund |
| |
Selected data for a Class 3 Share outstanding throughout each period:
| | | | | | | | | | | | | | | | |
| | For the
Year Ended
December 31, 2012 | | For the
Year Ended
December 31, 2011 | | For the Period
April 19, 2010(c)
through
December 31, 2010 | | For the Period
January 1, 2009
through
January 5, 2009(b) | | For the Period
April 28. 2008(a)
through
December 31, 2008 | |
| | | | | | | | | | | |
Net asset value, beginning of period | | $ | 8.42 | | $ | 9.72 | | $ | 8.87 | | $ | 5.86 | | $ | 10.67 | |
| | | | | | | | | | | | | | | | |
| | | | | | | | | | | | | | | | |
From Investment Operations | | | | | | | | | | | | | | | | |
Net investment income (loss)(d) | | | 0.12 | | | 0.13 | | | 0.08 | | | (0.00 | )(e) | | 0.09 | |
Net realized and unrealized gain (loss) on investments and foreign currency transactions | | | 1.46 | | | (1.26 | ) | | 0.91 | | | 0.17 | | | (4.85 | ) |
| | | | | | | | | | | | | | | | |
Net increase (decrease) in net asset value from investment operations | | | 1.58 | | | (1.13 | ) | | 0.99 | | | 0.17 | | | (4.76 | ) |
| | | | | | | | | | | | | | | | |
| | | | | | | | | | | | | | | | |
Dividends to Shareholders | | | | | | | | | | | | | | | | |
Dividends from net investment income | | | (0.10 | ) | | (0.17 | ) | | (0.15 | ) | | — | | | (0.08 | ) |
| | | | | | | | | | | | | | | | |
| | | | | | | | | | | | | | | | |
Proceeds from Purchase Premiums and Redemption Fees(d) | | | (0.00 | )(e) | | (0.00 | )(e) | | 0.01 | | | — | | | 0.03 | |
| | | | | | | | | | | | | | | | |
| | | | | | | | | | | | | | | | |
Net asset value, end of period | | $ | 9.90 | | $ | 8.42 | | $ | 9.72 | | $ | 6.03 | (b) | $ | 5.86 | |
| | | | | | | | | | | | | | | | |
| | | | | | | | | | | | | | | | |
Total Return | | | | | | | | | | | | | | | | |
Total investment return based on net asset value(f) | | | 18.82 | % | | (11.61 | )% | | 11.25 | % | | 2.90 | % | | (44.37 | )% |
| | | | | | | | | | | | | | | | |
Ratios/Supplemental Data | | | | | | | | | | | | | | | | |
Net assets, end of period (000’s omitted) | | $ | 490,822 | | $ | 502,187 | | $ | 139,344 | | $ | — | (b) | $ | 224,557 | |
Ratio of net expenses to average net assets | | | 0.54 | % | | 0.54 | % | | 0.56 | %* | | 0.57 | %* | | 0.67 | %* |
Ratio of net investment income (loss) to average net assets | | | 1.26 | % | | 1.35 | % | | 1.26 | %* | | (0.21 | )%* | | 1.85 | %* |
Portfolio turnover rate | | | 18 | % | | 11 | % | | 13 | % | | 9 | % | | 16 | % |
| |
* | Annualized. |
(a) | Commencement of investment operations. |
(b) | Class had no shareholders from January 6, 2009 to April 18, 2010. All shares of this class were redeemed at $6.03 on January 5, 2009. New shares were issued at $8.87 on April 19, 2010. |
(c) | Recommencement of investment operations. |
(d) | Calculated based upon average shares outstanding during the period. |
(e) | Rounds to less than $0.005 per share. |
(f) | Total investment return is calculated assuming an initial investment made at the net asset value at the beginning of the period, reinvestment of all dividends and distributions, if any, at net asset value during the period, and redemption on the last day of the period. Total return is not annualized for periods less than one year. |
The accompanying notes are an integral part of the financial statements.
49
| |
FINANCIAL HIGHLIGHTS (concluded) | Baillie Gifford EAFE Fund |
| |
Selected data for a Class 5 Share outstanding throughout the period:
| | | | |
| | For the Period
July 18, 2012(a)
through
December 31, 2012 | |
| | | |
Net asset value, beginning of period | | $ | 8.67 | |
| | | | |
| | | | |
From Investment Operations | | | | |
Net investment income(b) | | | 0.03 | |
Net realized and unrealized gain on investments and foreign currency transactions | | | 1.33 | |
| | | | |
Net increase in net asset value from investment operations | | | 1.36 | |
| | | | |
| | | | |
Dividends to Shareholders | | | | |
Dividends from net investment income | | | (0.11 | ) |
| | | | |
| | | | |
Proceeds from Purchase Premiums and Redemption Fees(b) | | | (0.00 | )(c) |
| | | | |
| | | | |
Net asset value, end of period | | $ | 9.92 | |
| | | | |
| | | | |
Total Return | | | | |
Total investment return based on net asset value(d) | | | 15.72 | % |
| | | | |
Ratios/Supplemental Data | | | | |
Net assets, end of period (000’s omitted) | | $ | 616,590 | |
Ratio of net expenses to average net assets | | | 0.46 | %* |
Ratio of net investment income to average net assets | | | 0.70 | %* |
Portfolio turnover rate | | | 18 | % |
| |
* | Annualized. |
(a) | Commencement of investment operations. |
(b) | Calculated based upon average shares outstanding during the period. |
(c) | Rounds to less than $0.005 per share. |
(d) | Total investment return is calculated assuming an initial investment made at the net asset value at the beginning of the period, reinvestment of all dividends and distributions, if any, at net asset value during the period, and redemption on the last day of the period. Total return is not annualized for periods less than one year. |
The accompanying notes are an integral part of the financial statements.
50
| |
INDUSTRY DIVERSIFICATION TABLE |
December 31, 2012 (unaudited) | Baillie Gifford EAFE Choice Fund |
| | |
| | | | | | | |
| | Value | | % of Total
Net Assets | |
| | | | | |
| | | | | | | |
Apparel | | $ | 4,162,229 | | | 2.3 | % |
Auto Manufacturers | | | 7,408,544 | | | 4.0 | |
Banks | | | 14,943,118 | | | 8.1 | |
Beverages, Food & Tobacco | | | 15,613,059 | | | 8.5 | |
Biotechnology | | | 3,360,050 | | | 1.8 | |
Chemicals | | | 3,320,579 | | | 1.8 | |
Commercial Services | | | 5,145,219 | | | 2.8 | |
Construction & Building Materials | | | 1,975,792 | | | 1.1 | |
Cosmetics/Personal Care | | | 2,326,939 | | | 1.3 | |
Distribution/Wholesale | | | 2,504,627 | | | 1.4 | |
Diversified Financial Services | | | 4,155,425 | | | 2.3 | |
Diversified Industrials | | | 1,439,158 | | | 0.8 | |
Electronic & Electrical Equipment | | | 8,098,924 | | | 4.4 | |
Engineering & Machinery | | | 16,899,422 | | | 9.2 | |
Entertainment | | | 3,363,996 | | | 1.8 | |
Food Producers & Processors | | | 7,509,348 | | | 4.1 | |
Healthcare - Products | | | 9,286,168 | | | 5.1 | |
Holding Companies - Diversified | | | 5,768,717 | | | 3.1 | |
Insurance | | | 3,997,383 | | | 2.2 | |
Internet | | | 8,917,851 | | | 4.9 | |
Investment Companies | | | 6,044,420 | | | 3.3 | |
Media & Photography | | | 1,590,518 | | | 0.9 | |
Mining & Metals | | | 4,865,615 | | | 2.6 | |
Motorcycles | | | 872,925 | | | 0.5 | |
Oil & Gas | | | 11,510,659 | | | 6.3 | |
Pharmaceuticals | | | 9,938,269 | | | 5.4 | |
Real Estate Investment Trusts | | | 14,614 | | | 0.0 | |
Retailers - General | | | 7,196,952 | | | 3.9 | |
Semiconductors | | | 4,479,435 | | | 2.4 | |
Toys/Games/Hobbies | | | 1,698,048 | | | 0.9 | |
Travel & Leisure | | | 2,542,114 | | | 1.4 | |
| | | | | | | |
| | | | | | | |
Total Value of Investments | | | 180,950,117 | | | 98.6 | |
Other assets less liabilities | | | 2,645,173 | | | 1.4 | |
| | | | | | | |
Net Assets | | $ | 183,595,290 | | | 100.0 | % |
| | | | | | | |
The accompanying notes are an integral part of the financial statements.
51
| |
PORTFOLIO OF INVESTMENTS |
December 31, 2012 | Baillie Gifford EAFE Choice Fund |
| | |
| | | | | | | |
| | Shares | | Value | |
| | | | | | |
| | | | | | | |
COMMON STOCKS – 97.7% | | | | | | | |
AUSTRALIA - 7.9% | | | | | | | |
Aristocrat Leisure Ltd. | | | 616,558 | | $ | 2,038,685 | |
Brambles Ltd. | | | 258,106 | | | 2,046,605 | |
Cochlear Ltd. | | | 53,410 | | | 4,427,684 | |
Mesoblast Ltd. (a) | | | 135,884 | | | 759,732 | |
Seek Ltd. | | | 261,347 | | | 1,931,330 | |
Shopping Centres Australasia Property Group (a) | | | 9,382 | | | 14,614 | |
Treasury Wine Estates Ltd. | | | 371,007 | | | 1,826,080 | |
Woolworths Ltd. | | | 46,911 | | | 1,439,157 | |
| | | | | | | |
| | | | | | 14,483,887 | |
| | | | | | | |
BELGIUM - 0.6% | | | | | | | |
Colruyt SA | | | 22,217 | | | 1,099,707 | |
| | | | | | | |
| | | | | | | |
CHINA - 5.9% | | | | | | | |
BOC Hong Kong Holdings Ltd. | | | 498,500 | | | 1,568,173 | |
Cafe de Coral Holdings Ltd. | | | 668,000 | | | 1,904,965 | |
Jardine Strategic Holdings Ltd. | | | 80,400 | | | 2,876,584 | |
Li & Fung Ltd. | | | 1,388,000 | | | 2,504,627 | |
Mindray Medical International Ltd. ADR | | | 59,700 | | | 1,952,190 | |
| | | | | | | |
| | | | | | 10,806,539 | |
| | | | | | | |
DENMARK - 4.8% | | | | | | | |
Carlsberg A/S, B Shares | | | 46,494 | | | 4,580,423 | |
Novo Nordisk A/S, B Shares | | | 16,223 | | | 2,641,699 | |
Novozymes A/S, B Shares | | | 53,070 | | | 1,506,479 | |
| | | | | | | |
| | | | | | 8,728,601 | |
| | | | | | | |
FINLAND - 1.9% | | | | | | | |
Kone Oyj, B Shares | | | 47,522 | | | 3,514,733 | |
| | | | | | | |
| | | | | | | |
FRANCE - 3.3% | | | | | | | |
BioMerieux | | | 16,252 | | | 1,549,395 | |
Legrand SA | | | 45,867 | | | 1,946,426 | |
Total SA | | | 50,687 | | | 2,637,406 | |
| | | | | | | |
| | | | | | 6,133,227 | |
| | | | | | | |
GERMANY - 1.8% | | | | | | | |
Adidas AG | | | 21,758 | | | 1,941,895 | |
Celesio AG | | | 74,159 | | | 1,284,510 | |
| | | | | | | |
| | | | | | 3,226,405 | |
| | | | | | | |
INDIA - 0.9% | | | | | | | |
Mahindra & Mahindra Ltd. GDR | | | 96,122 | | | 1,634,458 | |
| | | | | | | |
| | | | | | | |
ITALY - 3.1% | | | | | | | |
EXOR SpA | | | 114,758 | | | 2,892,133 | |
Fiat Industrial SpA | | | 247,509 | | | 2,711,618 | |
| | | | | | | |
| | | | | | 5,603,751 | |
| | | | | | | |
The accompanying notes are an integral part of the financial statements.
52
| |
PORTFOLIO OF INVESTMENTS (continued) |
December 31, 2012 | Baillie Gifford EAFE Choice Fund |
| | |
| | | | | | | |
| | Shares | | Value | |
| | | | | | |
| | | | | | | |
JAPAN - 14.1% | | | | | | | |
Asahi Group Holdings Ltd. | | | 100,900 | | $ | 2,148,437 | |
Fast Retailing Co., Ltd. | | | 8,700 | | | 2,220,335 | |
Inpex Corp. | | | 279 | | | 1,492,193 | |
Kao Corp. | | | 89,300 | | | 2,326,939 | |
MS&AD Insurance Group Holdings, Inc. | | | 200,300 | | | 3,997,383 | |
Namco Bandai Holdings, Inc. | | | 131,000 | | | 1,698,048 | |
Olympus Corp. (a) | | | 89,200 | | | 1,730,544 | |
Rakuten, Inc. | | | 152,500 | | | 1,189,264 | |
Sankyo Co., Ltd. | | | 33,400 | | | 1,325,311 | |
Shimano, Inc. | | | 39,700 | | | 2,542,114 | |
SMC Corp. | | | 9,500 | | | 1,725,718 | |
THK Co., Ltd. | | | 150,100 | | | 2,699,653 | |
Yamaha Motor Co., Ltd. | | | 78,800 | | | 872,925 | |
| | | | | | | |
| | | | | | 25,968,864 | |
| | | | | | | |
NETHERLANDS - 0.7% | | | | | | | |
QIAGEN NV (a) | | | 74,714 | | | 1,356,899 | |
| | | | | | | |
| | | | | | | |
SINGAPORE - 1.5% | | | | | | | |
United Overseas Bank Ltd. | | | 165,163 | | | 2,709,341 | |
| | | | | | | |
| | | | | | | |
SOUTH AFRICA - 1.1% | | | | | | | |
Clicks Group Ltd. (a) | | | 272,045 | | | 2,096,325 | |
| | | | | | | |
| | | | | | | |
SOUTH KOREA - 1.3% | | | | | | | |
Samsung Electronics Co., Ltd. GDR Reg S (a) | | | 3,300 | | | 2,368,755 | |
| | | | | | | |
| | | | | | | |
SPAIN - 2.2% | | | | | | | |
Corporacion Financiera Alba SA | | | 33,976 | | | 1,600,805 | |
Distribuidora Internacional de Alimentacion SA | | | 386,620 | | | 2,470,186 | |
| | | | | | | |
| | | | | | 4,070,991 | |
| | | | | | | |
SWEDEN - 9.1% | | | | | | | |
Atlas Copco AB, B Shares | | | 198,803 | | | 4,879,918 | |
Investment AB Kinnevik, B Shares | | | 82,492 | | | 1,725,520 | |
Investor AB, B Shares | | | 103,467 | | | 2,718,095 | |
Scania AB, B Shares | | | 147,295 | | | 3,062,468 | |
Svenska Handelsbanken AB, A Shares | | | 122,255 | | | 4,395,298 | |
| | | | | | | |
| | | | | | 16,781,299 | |
| | | | | | | |
SWITZERLAND - 9.2% | | | | | | | |
Geberit AG (a) | | | 8,913 | | | 1,975,792 | |
Nestle SA | | | 70,470 | | | 4,597,708 | |
Roche Holding AG - Genusschein | | | 29,736 | | | 6,012,060 | |
Schindler Holding AG, Participating Certificates | | | 15,802 | | | 2,285,851 | |
UBS AG (a) | | | 126,172 | | | 1,974,451 | |
| | | | | | | |
| | | | | | 16,845,862 | |
| | | | | | | |
TAIWAN - 2.3% | | | | | | | |
Hon Hai Precision Industry Co., Ltd. GDR Reg S | | | 361,967 | | | 2,175,422 | |
Taiwan Semiconductor Manufacturing Co., Ltd. ADR | | | 123,000 | | | 2,110,680 | |
| | | | | | | |
| | | | | | 4,286,102 | |
| | | | | | | |
TURKEY - 1.4% | | | | | | | |
Turkiye Garanti Bankasi A/S | | | 493,407 | | | 2,575,303 | |
| | | | | | | |
The accompanying notes are an integral part of the financial statements.
53
| |
PORTFOLIO OF INVESTMENTS (concluded) |
December 31, 2012 | Baillie Gifford EAFE Choice Fund |
| | |
| | | | | | | |
| | Shares | | Value | |
| | | | | | |
| | | | | | | |
UNITED KINGDOM - 21.6% | | | | | | | |
AMEC Plc. | | | 67,321 | | $ | 1,112,887 | |
ASOS Plc. (a) | | | 74,239 | | | 3,274,565 | |
BG Group Plc. | | | 149,033 | | | 2,485,854 | |
BHP Billiton Plc. | | | 98,000 | | | 3,456,819 | |
Hargreaves Lansdown Plc. | | | 195,000 | | | 2,180,974 | |
Imperial Tobacco Group Plc. | | | 62,200 | | | 2,411,603 | |
Intertek Group Plc. | | | 61,000 | | | 3,098,614 | |
John Wood Group Plc. | | | 258,432 | | | 3,089,449 | |
Johnson Matthey Plc. | | | 84,529 | | | 3,320,579 | |
Kazakhmys Plc. | | | 109,000 | | | 1,408,797 | |
Mitchells & Butlers Plc. (a) | | | 394,334 | | | 2,095,955 | |
Pearson Plc. | | | 81,600 | | | 1,590,518 | |
Rightmove Plc. | | | 107,304 | | | 2,522,692 | |
Standard Chartered Plc. | | | 111,356 | | | 2,881,879 | |
Unilever Plc. | | | 74,905 | | | 2,911,640 | |
Weir Group Plc. (The) | | | 58,000 | | | 1,793,549 | |
| | | | | | | |
| | | | | | 39,636,374 | |
| | | | | | | |
UNITED STATES - 3.0% | | | | | | | |
Coca-Cola Enterprises, Inc. | | | 68,589 | | | 2,176,329 | |
Mettler-Toledo International, Inc. (a) | | | 11,622 | | | 2,246,532 | |
Protalix BioTherapeutics, Inc. (a) | | | 210,759 | | | 1,093,839 | |
| | | | | | | |
| | | | | | 5,516,700 | |
| | | | | | | |
Total Common Stocks
(cost $158,320,489) | | | | | | 179,444,123 | |
| | | | | | | |
| | | | | | | |
PREFERRED STOCKS - 0.8% | | | | | | | |
BRAZIL - 0.8% | | | | | | | |
Itau Unibanco Holding SA ADR | | | 49,400 | | | 813,124 | |
Petroleo Brasileiro SA ADR | | | 35,900 | | | 692,870 | |
| | | | | | | |
Total Preferred Stocks
(cost $2,275,120) | | | | | | 1,505,994 | |
| | | | | | | |
| | | | | | | |
TOTAL INVESTMENTS - 98.5%
(cost $160,595,609) | | | | | | 180,950,117 | |
Other assets less liabilities - 1.5% | | | | | | 2,645,173 | |
| | | | | | | |
NET ASSETS - 100.0% | | | | | $ | 183,595,290 | |
| | | | | | | |
(a) Non-income producing security.
ADR - American Depositary Receipt.
GDR - Global Depositary Receipt.
Reg S - is a safe harbor that defines when an offering of securities will be deemed to come to rest abroad and therefore is not subject to the registration obligations imposed under Section 5 of the 1933 Act. The regulation includes two safe harbor provisions: an issuer safe harbor and a resale safe harbor. In each case, the regulation demands that offers and sales of the securities be made outside the United States and that no offering participant (which includes the issuer, the banks assisting with the offer and their respective affiliates) engage in “directed” selling efforts. In the case of issuers for whose securities there is substantial U.S. market interest, the regulation also requires that no offers and sales be made to U.S. persons (including U.S. persons physically located outside the United States).
The accompanying notes are an integral part of the financial statements.
54
| |
STATEMENT OF ASSETS AND LIABILITIES |
December 31, 2012 | Baillie Gifford EAFE Choice Fund |
| | |
| | | | |
ASSETS | | | | |
Investments, at value (cost $160,595,609) | | $ | 180,950,117 | |
Cash | | | 2,495,044 | |
Foreign cash, at value (cost $14,647) | | | 14,648 | |
Tax reclaims receivable | | | 318,907 | |
Dividends receivable | | | 109,798 | |
Other assets | | | 779 | |
| | | | |
| | | | |
Total Assets | | | 183,889,293 | |
| | | | |
| | | | |
LIABILITIES | | | | |
Servicing fee payable | | | 115,778 | |
Management fee payable | | | 111,450 | |
Accrued expenses | | | 66,775 | |
| | | | |
| | | | |
Total Liabilities | | | 294,003 | |
| | | | |
| | | | |
NET ASSETS | | $ | 183,595,290 | |
| | | | |
| | | | |
| | | | |
COMPOSITION OF NET ASSETS | | | | |
Paid-in capital | | $ | 179,189,392 | |
Distributions in excess of net investment income | | | (1,278,811 | ) |
Accumulated net realized loss on investments and foreign currency transactions | | | (14,674,122 | ) |
Net unrealized appreciation in value of investments and foreign currencies | | | 20,358,831 | |
| | | | |
| | $ | 183,595,290 | |
| | | | |
| | | | |
NET ASSET VALUE, PER SHARE | | | | |
| | | | |
Class 2 ($156,037,865 / 13,945,159 shares outstanding),
unlimited authorized, no par value | | $ | 11.19 | |
| | | | |
Maximum Purchase Price Per Share (Note D) | | $ | 11.21 | |
| | | | |
Minimum Redemption Price Per Share (Note D) | | $ | 11.17 | |
| | | | |
| | | | |
| | | | |
Class 3 ($27,557,425 / 2,455,456 shares outstanding),
unlimited authorized, no par value | | $ | 11.22 | |
| | | | |
Maximum Purchase Price Per Share (Note D) | | $ | 11.24 | |
| | | | |
Minimum Redemption Price Per Share (Note D) | | $ | 11.20 | |
| | | | |
The accompanying notes are an integral part of the financial statements.
55
| |
STATEMENT OF OPERATIONS |
For the Year Ended December 31, 2012 | Baillie Gifford EAFE Choice Fund |
| | |
| | | | |
INVESTMENT INCOME | | | | |
Dividends (net of foreign withholding taxes of $357,089) | | $ | 5,009,994 | |
Interest | | | 119 | |
| | | | |
Total Investment Income | | | 5,010,113 | |
| | | | |
| | | | |
EXPENSES | | | | |
Management fee (Note B) | | | 433,422 | |
Shareholder Servicing fees - Class 2 Shares (Note B) | | | 370,632 | |
Shareholder Servicing fees - Class 3 Shares (Note B) | | | 60,997 | |
Shareholder Servicing fees - Class 4 Shares (Note B) | | | 4,258 | |
Fund Accounting | | | 119,225 | |
Custody | | | 34,308 | |
Legal | | | 19,867 | |
Transfer Agency | | | 13,575 | |
Professional fees | | | 6,630 | |
Trustees’ fees | | | 4,093 | |
Insurance | | | 1,996 | |
Miscellaneous | | | 814 | |
| | | | |
Total Expenses | | | 1,069,817 | |
| | | | |
| | | | |
Net Investment Income | | | 3,940,296 | |
| | | | |
| | | | |
| | | | |
REALIZED AND UNREALIZED GAIN (LOSS) ON INVESTMENTS AND FOREIGN CURRENCY TRANSACTIONS | | | | |
Net realized loss from: | | | | |
Investments | | | (10,707,766 | ) |
Foreign currency transactions | | | (52,770 | ) |
| | | | |
| | | (10,760,536 | ) |
| | | | |
| | | | |
Net change in unrealized appreciation (depreciation) on: | | | | |
Investments | | | 40,705,660 | |
Translation of assets and liabilities in foreign currencies | | | 5,700 | |
| | | | |
| | | 40,711,360 | |
| | | | |
| | | | |
Net realized and unrealized gain on investments and foreign currency transactions | | | 29,950,824 | |
| | | | |
NET INCREASE IN NET ASSETS FROM OPERATIONS | | $ | 33,891,120 | |
| | | | |
The accompanying notes are an integral part of the financial statements.
56
| |
STATEMENTS OF CHANGES IN NET ASSETS | Baillie Gifford EAFE Choice Fund |
| | |
| | | | | | | |
| | For the
Year Ended
December 31, 2012 | | For the
Year Ended
December 31, 2011 | |
| | | | | |
| | | | | | | |
INCREASE (DECREASE) IN NET ASSETS FROM OPERATIONS | | | | | | | |
Net investment income | | $ | 3,940,296 | | $ | 3,052,743 | |
Net realized loss from investments and foreign currency transactions | | | (10,760,536 | ) | | (1,111,604 | ) |
Net change in unrealized appreciation (depreciation) on investments and translation of assets and liabilities in foreign currencies | | | 40,711,360 | | | (30,569,717 | ) |
| | | | | | | |
Net increase (decrease) in net assets from operations | | | 33,891,120 | | | (28,628,578 | ) |
| | | | | | | |
| | | | | | | |
DIVIDENDS AND DISTRIBUTIONS TO SHAREHOLDERS FROM | | | | | | | |
Net investment income: | | | | | | | |
Class 2 | | | (4,309,208 | ) | | (2,470,163 | ) |
Class 3 | | | (777,295 | ) | | — | |
Class 4 | | | — | | | (857,019 | ) |
Capital gains: | | | | | | | |
Class 2 | | | — | | | (1,996,170 | ) |
Class 4 | | | — | | | (660,614 | ) |
| | | | | | | |
| | | | | | | |
Total Dividends and Distributions | | | (5,086,503 | ) | | (5,983,966 | ) |
| | | | | | | |
| | | | | | | |
TRANSACTIONS IN SHARES OF BENEFICIAL INTEREST | | | | | | | |
Net proceeds from shares subscribed: | | | | | | | |
Class 2 | | | 16,067,800 | | | 94,603,761 | |
Class 3 | | | 42,471,000 | | | 12,974,210 | |
Class 4 | | | — | | | 85,142,331 | |
Purchase premiums: | | | | | | | |
Class 2 | | | 26,992 | | | 112,132 | |
Class 3 | | | 7,208 | | | 15,513 | |
Class 4 | | | — | | | 48,523 | |
Redemption fees: | | | | | | | |
Class 2 | | | 26,712 | | | 46,700 | |
Class 3 | | | 5,436 | | | 2,949 | |
Class 4 | | | — | | | 14,196 | |
Dividends and distributions reinvested: | | | | | | | |
Class 2 | | | 4,309,208 | | | 4,466,333 | |
Class 3 | | | 777,295 | | | — | |
Class 4 | | | — | | | 1,517,633 | |
Cost of shares redeemed: | | | | | | | |
Class 2 | | | (1,902,854 | ) | | (3,204,807 | ) |
Class 3 | | | (19,529,294 | ) | | (70,172,331 | ) |
Class 4 | | | (41,473,001 | ) | | (39,359,248 | ) |
| | | | | | | |
| | | | | | | |
| | | | | | | |
Increase in Net Assets from Transactions in Shares of Beneficial Interest | | | 786,502 | | | 86,207,895 | |
| | | | | | | |
| | | | | | | |
Total Increase in Net Assets | | | 29,591,119 | | | 51,595,351 | |
| | | | | | | |
NET ASSETS | | | | | | | |
Beginning of year | | | 154,004,171 | | | 102,408,820 | |
| | | | | | | |
End of year (including distributions in excess of net investment income of $1,278,811 and $456,421, respectively) | | $ | 183,595,290 | | $ | 154,004,171 | |
| | | | | | | |
The accompanying notes are an integral part of the financial statements.
57
| |
FINANCIAL HIGHLIGHTS | Baillie Gifford EAFE Choice Fund |
| | |
| |
Selected data for a Class 2 Share outstanding throughout each period: |
| | | | | | | | | | | | | |
| | For the
Year Ended
December 31, 2012 | | For the
Year Ended
December 31, 2011 | | For the
Year Ended
December 31, 2010(b) | | For the Period
December 17, 2009(a)
through
December 31, 2009 | |
| | | | | | | | | |
Net asset value, beginning of period | | $ | 9.45 | | $ | 11.24 | | $ | 10.15 | | $ | 10.00 | |
| | | | | | | | | | | | | |
| | | | | | | | | | | | | |
From Investment Operations | | | | | | | | | | | | | |
Net investment income(c) | | | 0.23 | | | 0.21 | | | 0.13 | | | 0.00 | (d) |
Net realized and unrealized gain (loss) on investments and foreign currency transactions | | | 1.83 | | | (1.64 | ) | | 1.37 | | | 0.15 | |
| | | | | | | | | | | | | |
Net increase (decrease) in net asset value from investment operations | | | 2.06 | | | (1.43 | ) | | 1.50 | | | 0.15 | |
| | | | | | | | | | | | | |
| | | | | | | | | | | | | |
Change in NAV During Period of Inactivity(b) | | | — | | | — | | | (0.28 | ) | | — | |
| | | | | | | | | | | | | |
| | | | | | | | | | | | | |
Dividends and Distributions to Shareholders | | | | | | | | | | | | | |
Dividends from net investment income | | | (0.32 | ) | | (0.21 | ) | | (0.14 | ) | | 0.00 | (d) |
Distributions from net realized gain on investments | | | — | | | (0.17 | ) | | — | | | — | |
| | | | | | | | | | | | | |
Total Dividends and Distributions | | | (0.32 | ) | | (0.38 | ) | | (0.14 | ) | | 0.00 | (d) |
| | | | | | | | | | | | | |
| | | | | | | | | | | | | |
Proceeds from Purchase Premiums and Redemption Fees(c) | | | (0.00 | )(d) | | 0.02 | | | 0.01 | | | — | |
| | | | | | | | | | | | | |
| | | | | | | | | | | | | |
Net asset value, end of period | | $ | 11.19 | | $ | 9.45 | | $ | 11.24 | | $ | 10.15 | |
| | | | | | | | | | | | | |
| | | | | | | | | | | | | |
Total Return | | | | | | | | | | | | | |
Total investment return based on net asset value(e) | | | 21.81 | % | | (12.54 | )% | | 15.22 | % | | 1.52 | % |
| | | | | | | | | | | | | |
Ratios/Supplemental Data | | | | | | | | | | | | | |
Net assets, end of period (000’s omitted) | | $ | 156,038 | | $ | 115,242 | | $ | 46,487 | | $ | 30,454 | |
Ratio of net expenses to average net assets | | | 0.64 | % | | 0.65 | % | | 0.71 | %* | | 0.82 | %* |
Ratio of net investment income to average net assets | | | 2.23 | % | | 1.97 | % | | 1.53 | %* | | 0.41 | %* |
Portfolio turnover rate | | | 21 | % | | 46 | % | | 20 | % | | 0 | % |
| |
* | Annualized. |
(a) | Commencement of investment operations. |
(b) | For the periods January 1, 2010 to January 15, 2010 and March 25, 2010 to December 31, 2010. Class had no shareholders from January 16, 2010 to March 24, 2010. All shares of this class were redeemed at $10.48 on January 15, 2010. New shares were issued at $10.20 on March 25, 2010. |
(c) | Calculated based upon average shares outstanding during the period. |
(d) | Amount is less than $0.005. |
(e) | Total investment return is calculated assuming an initial investment made at the net asset value at the beginning of the period, reinvestment of all dividends and distributions, if any, at net asset value during the period, and redemption on the last day of the period. Total return is not annualized for periods less than one year. |
The accompanying notes are an integral part of the financial statements.
58
| |
FINANCIAL HIGHLIGHTS (concluded) | Baillie Gifford EAFE Choice Fund |
| | |
| |
Selected data for a Class 3 Share outstanding throughout each period: |
| | | | | | | | | | |
| | For the Period
January 23, 2012(c)
through
December 31, 2012 | | For the Period
January 1, 2011
through
April 18, 2011(b) | | For the Period
January 15, 2010(a)
through
December 31, 2010 | |
| | | | | | | |
Net asset value, beginning of period | | $ | 10.15 | | $ | 11.42 | | $ | 10.48 | |
| | | | | | | | | | |
| | | | | | | | | | |
From Investment Operations | | | | | | | | | | |
Net investment income(d) | | | 0.28 | | | 0.09 | | | 0.16 | |
Net realized and unrealized gain on investments and foreign currency transactions | | | 1.12 | | | 0.15 | | | 0.92 | |
| | | | | | | | | | |
Net increase in net asset value from investment operations | | | 1.40 | | | 0.24 | | | 1.08 | |
| | | | | | | | | | |
| | | | | | | | | | |
Dividends to Shareholders | | | | | | | | | | |
Dividends from net investment income | | | (0.33 | ) | | — | | | (0.15 | ) |
| | | | | | | | | | |
| | | | | | | | | | |
Proceeds from Purchase Premiums and Redemption Fees(d) | | | (0.00 | )(e) | | (0.00 | )(e) | | 0.01 | |
| | | | | | | | | | |
| | | | | | | | | | |
Net asset value, end of period | | $ | 11.22 | | $ | 11.66 | | $ | 11.42 | |
| | | | | | | | | | |
| | | | | | | | | | |
Total Return | | | | | | | | | | |
Total investment return based on net asset value(f) | | | 13.79 | % | | 2.10 | %** | | 10.40 | %** |
| | | | | | | | | | |
Ratios/Supplemental Data | | | | | | | | | | |
Net assets, end of period (000’s omitted) | | $ | 27,557 | | | — | (b) | $ | 55,922 | |
Ratio of net expenses to average net assets | | | 0.57 | %* | | 0.57 | %* | | 0.63 | %* |
Ratio of net investment income to average net assets | | | 2.86 | %* | | 2.50 | %* | | 1.66 | %* |
Portfolio turnover rate | | | 21 | % | | 46 | % | | 20 | % |
| |
* | Annualized. |
** | Not annualized. |
(a) | Commencement of investment operations. |
(b) | Class had no shareholders from April 19, 2011 to January 22, 2012. All shares of this class were redeemed at $11.66 on April 18, 2011. New shares were issued at $10.15 on January 23, 2012. |
(c) | Recommencement of investment operations. |
(d) | Calculated based upon average shares outstanding during the period. |
(e) | Amount is less than $0.005. |
(f) | Total investment return is calculated assuming an initial investment made at the net asset value at the beginning of the period, reinvestment of all dividends and distributions, if any, at net asset value during the period, and redemption on the last day of the period. Total return is not annualized for periods less than one year. |
The accompanying notes are an integral part of the financial statements.
59
| |
INDUSTRY DIVERSIFICATION TABLE | |
December 31, 2012 (unaudited) | Baillie Gifford Emerging Markets Fund |
| | |
| | | | | | | |
| | Value | | % of Total
Net Assets | |
| | | | | |
| | | | | | | |
Aerospace/Defense | | $ | 6,359,640 | | | 1.3 | % |
Auto Manufacturers | | | 23,225,637 | | | 4.7 | |
Banks | | | 66,450,107 | | | 13.6 | |
Beverages, Food & Tobacco | | | 2,676,341 | | | 0.6 | |
Biotechnology | | | 2,011,629 | | | 0.4 | |
Computers | | | 9,780,587 | | | 2.0 | |
Construction & Building Materials | | | 8,247,556 | | | 1.7 | |
Cosmetics/Personal Care | | | 2,732,858 | | | 0.6 | |
Diversified Financial Services | | | 12,410,952 | | | 2.5 | |
Diversified Industrials | | | 5,408,118 | | | 1.1 | |
Electronic & Electrical Equipment | | | 54,357,525 | | | 11.1 | |
Food Producers & Processors | | | 12,799,417 | | | 2.6 | |
Healthcare - Products | | | 4,630,326 | | | 0.9 | |
Insurance | | | 22,077,510 | | | 4.5 | |
Internet | | | 25,145,733 | | | 5.1 | |
Investment Companies | | | 5,487,689 | | | 1.1 | |
Machinery - Diversified | | | 3,306,037 | | | 0.7 | |
Media & Photography | | | 6,262,661 | | | 1.3 | |
Oil & Gas | | | 85,341,670 | | | 17.4 | |
Real Estate | | | 6,954,195 | | | 1.4 | |
Retailers - General | | | 31,986,376 | | | 6.5 | |
Semiconductors | | | 15,571,130 | | | 3.2 | |
Software | | | 14,875,733 | | | 3.0 | |
Telecommunication Services | | | 33,954,530 | | | 6.9 | |
Transportation | | | 9,258,215 | | | 1.9 | |
Utilities | | | 2,514,891 | | | 0.5 | |
| | | | | | | |
| | | | | | | |
Total Value of Investments | | | 473,827,063 | | | 96.6 | |
Other assets less liabilities | | | 16,418,977 | | | 3.4 | |
| | | | | | | |
Net Assets | | $ | 490,246,040 | | | 100.0 | % |
| | | | | | | |
The accompanying notes are an integral part of the financial statements.
60
| |
PORTFOLIO OF INVESTMENTS | |
December 31, 2012 | Baillie Gifford Emerging Markets Fund |
| | |
| | | | | | | |
| | Shares | | Value | |
| | | | | | |
| | | | | | | |
COMMON STOCKS – 91.7% | | | | | | | |
ARGENTINA - 1.2% | | | | | | | |
Arcos Dorados Holdings, Inc., Class A | | | 213,391 | | $ | 2,552,156 | |
MercadoLibre, Inc. | | | 41,200 | | | 3,237,084 | |
| | | | | | | |
| | | | | | 5,789,240 | |
| | | | | | | |
AUSTRALIA - 1.3% | | | | | | | |
African Petroleum Corp., Ltd. (a) | | | 5,211,000 | | | 6,223,091 | |
| | | | | | | |
|
BRAZIL – 3.0% | | | | | | | |
Embraer SA ADR | | | 223,067 | | | 6,359,640 | |
JBS SA (a) | | | 1,980,000 | | | 5,802,198 | |
Tractebel Energia SA | | | 154,400 | | | 2,514,891 | |
| | | | | | | |
| | | | | | 14,676,729 | |
| | | | | | | |
CANADA - 0.6% | | | | | | | |
Niko Resources Ltd. | | | 276,759 | | | 2,963,188 | |
| | | | | | | |
|
CHINA - 17.5% | | | | | | | |
Beijing Enterprises Holdings Ltd. | | | 425,000 | | | 2,787,693 | |
China Mobile Ltd. | | | 1,931,500 | | | 22,729,316 | |
China Petroleum & Chemical Corp., Class H | | | 4,188,000 | | | 4,821,537 | |
China Railway Construction Corp. Ltd., Class H | | | 448,000 | | | 518,264 | |
China Resources Enterprise Ltd. | | | 1,368,000 | | | 5,006,545 | |
China Taiping Insurance Holdings Co., Ltd. (a) | | | 1,484,000 | | | 3,041,880 | |
CNOOC Ltd. | | | 3,330,000 | | | 7,336,034 | |
CSR Corp., Ltd., Class H | | | 3,713,000 | | | 3,306,037 | |
Hang Lung Properties Ltd. | | | 1,728,000 | | | 6,954,195 | |
Hengan International Group Co., Ltd. | | | 507,000 | | | 4,630,326 | |
Kunlun Energy Co., Ltd. | | | 2,950,000 | | | 6,237,307 | |
Lenovo Group Ltd. | | | 5,312,000 | | | 4,897,983 | |
Tencent Holdings Ltd. | | | 194,000 | | | 6,362,561 | |
Want Want China Holdings Ltd. | | | 4,993,000 | | | 6,997,220 | |
| | | | | | | |
| | | | | | 85,626,898 | |
| | | | | | | |
COLOMBIA - 0.4% | | | | | | | |
Ecopetrol SA ADR | | | 37,163 | | | 2,217,516 | |
| | | | | | | |
|
EGYPT - 0.9% | | | | | | | |
Commercial International Bank Egypt SAE | | | 249,338 | | | 1,355,285 | |
Egyptian Financial Group - Hermes Holding SAE (a) | | | 1,654,626 | | | 2,864,376 | |
| | | | | | | |
| | | | | | 4,219,661 | |
| | | | | | | |
GUERNSEY - 0.1% | | | | | | | |
Chariot Oil & Gas Ltd. (a) | | | 844,099 | | | 381,942 | |
| | | | | | | |
|
INDIA - 10.3% | | | | | | | |
ACC Ltd. | | | 135,687 | | | 3,579,094 | |
Axis Bank Ltd. | | | 256,258 | | | 6,438,728 | |
HCL Technologies Ltd. | | | 658,476 | | | 7,480,258 | |
Housing Development Finance Corp. | | | 399,600 | | | 6,104,612 | |
IDFC, Ltd. | | | 1,730,202 | | | 5,487,689 | |
Mahindra & Mahindra Ltd. | | | 637,324 | | | 10,944,973 | |
Satyam Computer Services Ltd. (a) | | | 1,109,956 | | | 2,182,697 | |
Tech Mahindra Ltd. | | | 306,318 | | | 5,212,778 | |
Titan Industries Ltd. | | | 598,406 | | | 3,136,561 | |
| | | | | | | |
| | | | | | 50,567,390 | |
| | | | | | | |
The accompanying notes are an integral part of the financial statements.
61
| |
PORTFOLIO OF INVESTMENTS (continued) | |
December 31, 2012 | Baillie Gifford Emerging Markets Fund |
| |
| | | | | | | |
| | Shares | | Value | |
| | | | | | |
| | | | | | | |
INDONESIA - 2.6% | | | | | | | |
Bank Mandiri Persero Tbk PT | | | 3,238,500 | | $ | 2,735,606 | |
Bank Negara Indonesia Persero Tbk PT | | | 8,287,000 | | | 3,193,904 | |
Perusahaan Gas Negara Persero Tbk PT | | | 5,957,500 | | | 2,852,707 | |
Semen Gresik Persero Tbk PT | | | 2,512,500 | | | 4,150,198 | |
| | | | | | | |
| | | | | | 12,932,415 | |
| | | | | | | |
MALAYSIA - 2.6% | | | | | | | |
CIMB Group Holdings Bhd | | | 2,341,300 | | | 5,860,559 | |
Public Bank Bhd | | | 303,100 | | | 1,617,253 | |
Public Bank Bhd - Foreign Market | | | 998,600 | | | 5,322,819 | |
| | | | | | | |
| | | | | | 12,800,631 | |
| | | | | | | |
MEXICO - 3.9% | | | | | | | |
America Movil SAB de CV, Series L ADR | | | 485,100 | | | 11,225,214 | |
Wal-Mart de Mexico SAB de CV, Series V | | | 2,453,360 | | | 8,005,595 | |
| | | | | | | |
| | | | | | 19,230,809 | |
| | | | | | | |
PANAMA - 0.8% | | | | | | | |
Copa Holdings SA, Class A | | | 41,866 | | | 4,163,574 | |
| | | | | | | |
|
RUSSIA - 4.4% | | | | | | | |
NovaTek OAO GDR Reg S | | | 55,277 | | | 6,753,061 | |
Sberbank of Russia ADR | | | 963,237 | | | 12,076,188 | |
X5 Retail Group NV GDR Reg S (a) | | | 147,850 | | | 2,676,341 | |
| | | | | | | |
| | | | | | 21,505,590 | |
| | | | | | | |
SOUTH AFRICA - 2.9% | | | | | | | |
Africa Oil Corp. (a) | | | 733,500 | | | 5,154,484 | |
Massmart Holdings Ltd. | | | 115,227 | | | 2,612,500 | |
Naspers Ltd., N Shares | | | 96,959 | | | 6,262,661 | |
| | | | | | | |
| | | | | | 14,029,645 | |
| | | | | | | |
SOUTH KOREA - 17.7% | | | | | | | |
Celltrion, Inc. | | | 82,377 | | | 2,011,629 | |
Cheil Industries, Inc. | | | 61,180 | | | 5,408,118 | |
Daum Communications Corp. | | | 52,802 | | | 4,498,276 | |
E-Mart Co., Ltd. | | | 26,664 | | | 5,927,588 | |
Fila Korea Ltd. | | | 19,665 | | | 1,178,943 | |
Hankook Tire Co. Ltd. (a) | | | 46,302 | | | 2,032,734 | |
Hyundai Glovis Co., Ltd. | | | 24,477 | | | 5,094,641 | |
Hyundai Marine & Fire Insurance Co., Ltd. | | | 130,760 | | | 4,081,730 | |
Hyundai Mobis | | | 17,196 | | | 4,665,430 | |
Hyundai Wia Corp. | | | 14,979 | | | 2,439,856 | |
LG Household & Health Care Ltd. | | | 4,461 | | | 2,732,858 | |
Mando Corp. | | | 25,966 | | | 3,142,644 | |
NCSoft Corp. | | | 19,340 | | | 2,736,771 | |
NHN Corp. | | | 39,125 | | | 8,311,041 | |
Samsung Electronics Co., Ltd. | | | 18,041 | | | 25,921,306 | |
Samsung Fire & Marine Insurance Co., Ltd. | | | 31,497 | | | 6,398,540 | |
| | | | | | | |
| | | | | | 86,582,105 | |
| | | | | | | |
TAIWAN - 10.1% | | | | | | | |
China Life Insurance Co., Ltd. | | | 9,414,064 | | | 8,555,360 | |
Delta Electronics, Inc. | | | 1,559,000 | | | 5,745,586 | |
Far Eastern Department Stores Co., Ltd. | | | 3,413,502 | | | 3,566,488 | |
Hon Hai Precision Industry Co., Ltd. | | | 3,602,839 | | | 11,151,938 | |
HTC Corp. | | | 283,000 | | | 2,956,045 | |
Quanta Computer, Inc. | | | 814,000 | | | 1,926,559 | |
Taiwan Semiconductor Manufacturing Co., Ltd. | | | 4,655,310 | | | 15,571,130 | |
| | | | | | | |
| | | | | | 49,473,106 | |
| | | | | | | |
The accompanying notes are an integral part of the financial statements.
62
| |
PORTFOLIO OF INVESTMENTS (concluded) | |
December 31, 2012 | Baillie Gifford Emerging Markets Fund |
| |
| | | | | | | |
| | Shares | | Value | |
| | | | | | |
| | | | | | | |
THAILAND - 1.9% | | | | | | | |
Kasikornbank PCL NVDR | | | 870,800 | | $ | 5,541,346 | |
Siam Commercial Bank PCL NVDR | | | 637,000 | | | 3,801,372 | |
| | | | | | | |
| | | | | | 9,342,718 | |
| | | | | | | |
TURKEY - 1.9% | | | | | | | |
Turkiye Garanti Bankasi A/S | | | 1,305,393 | | | 6,813,407 | |
Turkiye Is Bankasi, Class C | | | 716,644 | | | 2,499,452 | |
| | | | | | | |
| | | | | | 9,312,859 | |
| | | | | | | |
TURKMENISTAN - 3.6% | | | | | | | |
Dragon Oil Plc. | | | 1,987,251 | | | 17,916,540 | |
| | | | | | | |
|
UNITED KINGDOM - 4.0% | | | | | | | |
Gulf Keystone Petroleum Ltd. (a) | | | 2,972,878 | | | 8,736,236 | |
Tullow Oil Plc. | | | 525,738 | | | 10,960,333 | |
| | | | | | | |
| | | | | | 19,696,569 | |
| | | | | | | |
Total Common Stocks
(cost $378,522,571) | | | | | | 449,652,216 | |
| | | | | | | |
|
PREFERRED STOCKS - 4.9% | | | | | | | |
BRAZIL – 3.1% | | | | | | | |
Banco Bradesco SA | | | 389,529 | | | 6,690,957 | |
Companhia Energetica de Minas Gerais | | | 248,652 | | | 2,744,584 | |
Itau Unibanco Holding SA | | | 153,500 | | | 2,503,231 | |
Itausa - Investimentos Itau SA | | | 727,288 | | | 3,441,964 | |
| | | | | | | |
| | | | | | 15,380,736 | |
| | | | | | | |
SOUTH KOREA - 1.8% | | | | | | | |
Samsung Electronics Co., Ltd. | | | 10,944 | | | 8,794,111 | |
| | | | | | | |
|
Total Preferred Stocks
(cost $16,413,147) | | | | | | 24,174,847 | |
| | | | | | | |
TOTAL INVESTMENTS - 96.6%
(cost $394,935,718) | | | | | | 473,827,063 | |
Other assets less liabilities - 3.4% | | | | | | 16,418,977 | |
| | | | | | | |
NET ASSETS - 100.0% | | | | | $ | 490,246,040 | |
| | | | | | | |
|
(a) Non-income producing security. |
ADR - American Depositary Receipt. |
GDR - Global Depositary Receipt. |
NVDR – Non-Voting Depositary Receipt. |
PCL – Public Company Limited. |
Reg S - is a safe harbor that defines when an offering of securities will be deemed to come to rest abroad and therefore is not subject to the registration obligations imposed under Section 5 of the 1933 Act. The regulation includes two safe harbor provisions: an issuer safe harbor and a resale safe harbor. In each case, the regulation demands that offers and sales of the securities be made outside the United States and that no offering participant (which includes the issuer, the banks assisting with the offer and their respective affiliates) engage in “directed” selling efforts. In the case of issuers for whose securities there is substantial U.S. market interest, the regulation also requires that no offers and sales be made to U.S. persons (including U.S. persons physically located outside the United States).
The accompanying notes are an integral part of the financial statements.
63
| |
STATEMENT OF ASSETS AND LIABILITIES | |
December 31, 2012 | Baillie Gifford Emerging Markets Fund |
| | |
| | | | |
ASSETS | | | | |
Investments, at value (cost $394,935,718) | | $ | 473,827,063 | |
Cash | | | 60,237,620 | |
Foreign cash, at value (cost $16,703,027) | | | 16,723,603 | |
Receivable for investments sold | | | 147,678 | |
Dividends receivable | | | 579,577 | |
Receivable for Indian capital gains tax refund | | | 238,421 | |
Other assets | | | 1,849 | |
| | | | |
| | | | |
Total Assets | | | 551,755,811 | |
| | | | |
| | | | |
LIABILITIES | | | | |
Payable for investments purchased | | | 60,300,479 | |
Management fee payable | | | 525,043 | |
Payable for deferred Indian capital gains tax | | | 389,081 | |
Servicing fee payable | | | 105,261 | |
Accrued expenses | | | 189,907 | |
| | | | |
|
Total Liabilities | | | 61,509,771 | |
| | | | |
| | | | |
NET ASSETS | | $ | 490,246,040 | |
| | | | |
| | | | |
COMPOSITION OF NET ASSETS | | | | |
Paid-in capital | | $ | 423,871,153 | |
Undistributed net investment income | | | 3,712,091 | |
Accumulated net realized loss on investments and foreign currency transactions | | | (15,826,519 | ) |
Net unrealized appreciation in value of investments and foreign currencies
(net of deferred Indian capital gains tax) | | | 78,489,315 | |
| | | | |
| | $ | 490,246,040 | |
| | | | |
| | | | |
NET ASSET VALUE, PER SHARE | | | | |
| | | | |
Class III ($490,246,040 / 29,897,612 shares outstanding),
unlimited authorized, no par value | | $ | 16.40 | |
| | | | |
Maximum Purchase Price Per Share (Note D) | | $ | 16.49 | |
| | | | |
Minimum Redemption Price Per Share (Note D) | | $ | 16.36 | |
| | | | |
The accompanying notes are an integral part of the financial statements.
64
| |
STATEMENT OF OPERATIONS | |
For the Year Ended December 31, 2012 | Baillie Gifford Emerging Markets Fund |
| | |
| | | | |
INVESTMENT INCOME | | | | |
Dividends (net of foreign withholding taxes of $860,511) | | $ | 8,069,341 | |
Interest | | | 2,473 | |
| | | | |
Total Investment Income | | | 8,071,814 | |
| | | | |
| | | | |
EXPENSES | | | | |
Management fee (Note B) | | | 2,123,525 | |
Shareholder Servicing fees - Class II Shares (Note B) | | | 30,487 | |
Shareholder Servicing fees - Class III Shares (Note B) | | | 407,870 | |
Fund Accounting | | | 261,777 | |
Custody | | | 220,260 | |
Legal | | | 45,095 | |
Professional fees | | | 41,403 | |
Transfer Agency | | | 10,513 | |
Trustees’ fees | | | 9,867 | |
Insurance | | | 5,002 | |
Miscellaneous | | | 263 | |
| | | | |
Total Expenses | | | 3,156,062 | |
| | | | |
| | | | |
Net Investment Income | | | 4,915,752 | |
| | | | |
| | | | |
REALIZED AND UNREALIZED GAIN (LOSS) ON INVESTMENTS
AND FOREIGN CURRENCY TRANSACTIONS | | | | |
Net realized gain (loss) from: | | | | |
Investments | | | 151,921 | |
Foreign currency transactions | | | (461,599 | ) |
| | | | |
| | | (309,678 | ) |
| | | | |
| | | | |
Net change in unrealized appreciation (depreciation) on: | | | | |
Investments (net of deferred Indian capital gains tax of $396,646) | | | 47,695,137 | |
Translation of assets and liabilities in foreign currencies | | | (6,239 | ) |
| | | | |
| | | 47,688,898 | |
| | | | |
| | | | |
Net realized and unrealized gain on investments and foreign currency transactions | | | 47,379,220 | |
| | | | |
NET INCREASE IN NET ASSETS FROM OPERATIONS | | $ | 52,294,972 | |
| | | | |
The accompanying notes are an integral part of the financial statements.
65
| |
STATEMENTS OF CHANGES IN NET ASSETS | Baillie Gifford Emerging Markets Fund |
| | |
| | | | | | | |
| | For the
Year Ended
December 31, 2012 | | For the
Year Ended
December 31, 2011 | |
| | | | | |
INCREASE (DECREASE) IN NET ASSETS FROM OPERATIONS | | | | | | | |
Net investment income | | $ | 4,915,752 | | $ | 4,489,209 | |
Net realized loss from investments and foreign currency transactions | | | (309,678 | ) | | (7,027,535 | ) |
Net change in unrealized appreciation (depreciation) on investments
and translation of assets and liabilities in foreign currencies | | | 47,688,898 | | | (93,282,872 | ) |
| | | | | | | |
Net increase (decrease) in net assets from operations | | | 52,294,972 | | | (95,821,198 | ) |
| | | | | | | |
| | | | | | | |
DIVIDENDS AND DISTRIBUTIONS TO SHAREHOLDERS FROM | | | | | | | |
Net investment income: | | | | | | | |
Class III | | | (5,972,731 | ) | | — | |
Capital gains: | | | | | | | |
Class III | | | — | | | (8,786,194 | ) |
| | | | | | | |
| | | | | | | |
Total Dividends and Distributions | | | (5,972,731 | ) | | (8,786,194 | ) |
| | | | | | | |
| | | | | | | |
TRANSACTIONS IN SHARES OF BENEFICIAL INTEREST | | | | | | | |
Net proceeds from shares subscribed: | | | | | | | |
Class II | | | 47,197,419 | | | | |
Class III | | | 144,762,741 | | | 4,972,500 | |
Purchase premiums: | | | | | | | |
Class II | | | 12,799 | | | — | |
Class III | | | 512,451 | | | 27,500 | |
Redemption fees: | | | | | | | |
Class III | | | 77,647 | | | 11,027 | |
Dividends and distributions reinvested: | | | | | | | |
Class III | | | 5,972,731 | | | 8,786,194 | |
Cost of shares redeemed: | | | | | | | |
Class II | | | (49,787,991 | ) | | — | |
Class III | | | (78,256,316 | ) | | (4,411,028 | ) |
| | | | | | | |
| | | | | | | |
Increase in Net Assets from Transactions in Shares of Beneficial Interest | | | 70,491,481 | | | 9,386,193 | |
| | | | | | | |
| | | | | | | |
Total Increase (Decrease) in Net Assets | | | 116,813,722 | | | (95,221,199 | ) |
| | | | | | | |
NET ASSETS | | | | | | | |
Beginning of year | | | 373,432,318 | | | 468,653,517 | |
| | | | | | | |
End of year (including undistributed (distributions in excess of) net
investment income of $3,712,091 and $(648,079), respectively) | | $ | 490,246,040 | | $ | 373,432,318 | |
| | | | | | | |
The accompanying notes are an integral part of the financial statements.
66
| |
FINANCIAL HIGHLIGHTS | Baillie Gifford Emerging Markets Fund |
| | |
Selected data for a Class III Share outstanding throughout each year:
| | | | | | | | | | | | | | | | |
| | For the
Year Ended
December 31, 2012 | | For the
Year Ended
December 31, 2011 | | For the
Year Ended
December 31, 2010 | | For the
Year Ended
December 31, 2009 | | For the
Year Ended
December 31, 2008 | |
| | | | | | | | | | | |
Net asset value, beginning of year | | $ | 14.60 | | $ | 18.71 | | $ | 16.49 | | $ | 8.47 | | $ | 22.17 | |
| | | | | | | | | | | | | | | | |
| | | | | | | | | | | | | | | | |
From Investment Operations | | | | | | | | | | | | | | | | |
Net investment income(a) | | | 0.19 | | | 0.18 | | | 0.13 | | | 0.09 | | | 0.16 | |
Net realized and unrealized gain (loss) on investments and foreign currency transactions | | | 1.82 | | | (3.94 | ) | | 3.09 | | | 8.21 | | | (12.15 | ) |
| | | | | | | | | | | | | | | | |
Net increase (decrease) in net asset value from investment operations | | | 2.01 | | | (3.76 | ) | | 3.22 | | | 8.30 | | | (11.99 | ) |
| | | | | | | | | | | | | | | | |
| | | | | | | | | | | | | | | | |
Dividends and Distributions to Shareholders | | | | | | | | | | | | | | | | |
Dividends from net investment income | | | (0.23 | ) | | — | | | (0.52 | ) | | (0.29 | ) | | (0.21 | ) |
Distributions from net realized gain on investments | | | — | | | (0.35 | ) | | (0.49 | ) | | — | | | (1.48 | ) |
Return of capital | | | — | | | — | | | — | | | — | | | (0.03 | ) |
| | | | | | | | | | | | | | | | |
Total Dividends and Distributions | | | (0.23 | ) | | (0.35 | ) | | (1.01 | ) | | (0.29 | ) | | (1.72 | ) |
| | | | | | | | | | | | | | | | |
| | | | | | | | | | | | | | | | |
Proceeds from Purchase Premiums and
Redemption Fees(a) | | | 0.02 | | | (0.00 | )(b) | | 0.01 | | | 0.01 | | | 0.01 | |
| | | | | | | | | | | | | | | | |
| | | | | | | | | | | | | | | | |
Net asset value, end of year | | $ | 16.40 | | $ | 14.60 | | $ | 18.71 | | $ | 16.49 | | $ | 8.47 | |
| | | | | | | | | | | | | | | | |
| | | | | | | | | | | | | | | | |
Total Return | | | | | | | | | | | | | | | | |
Total investment return based on net asset value(c) | | | 13.94 | % | | (20.20 | )% | | 19.73 | % | | 98.09 | % | | (56.41 | )% |
| | | | | | | | | | | | | | | | |
Ratios/Supplemental Data | | | | | | | | | | | | | | | | |
Net assets, end of year (000’s omitted) | | $ | 490,246 | | $ | 373,432 | | $ | 468,654 | | $ | 216,394 | | $ | 124,412 | |
Ratio of net expenses to average net assets | | | 0.75 | % | | 0.73 | % | | 0.79 | % | | 0.80 | % | | 0.87 | % |
Ratio of net investment income to average net assets | | | 1.18 | % | | 1.05 | % | | 0.75 | % | | 0.76 | % | | 1.04 | % |
Portfolio turnover rate | | | 51 | % | | 41 | % | | 40 | % | | 56 | % | | 61 | % |
| |
(a) | Calculated based upon average shares outstanding during the year. |
(b) | Rounds to less than $0.005 per share. |
(c) | Total investment return is calculated assuming an initial investment made at the net asset value at the beginning of the period, reinvestment of all dividends and distributions, if any, at net asset value during the period, and redemption on the last day of the period. |
The accompanying notes are an integral part of the financial statements.
67
| |
INDUSTRY DIVERSIFICATION TABLE | |
December 31, 2012 (unaudited) | Baillie Gifford Global Alpha Equity Fund |
| |
| | | | | | | |
| | | Value | | | % of Total
Net Assets | |
| | | | | | | |
| | | | | | | |
Advertising | | $ | 3,301,607 | | | 1.3 | % |
Aerospace/Defense | | | 3,643,382 | | | 1.4 | |
Agriculture | | | 2,485,279 | | | 1.0 | |
Airlines | | | 2,455,511 | | | 1.0 | |
Auto Manufacturers | | | 1,232,017 | | | 0.5 | |
Banks | | | 20,276,641 | | | 8.0 | |
Beverages, Food & Tobacco | | | 14,534,542 | | | 5.7 | |
Biotechnology | | | 2,501,276 | | | 1.0 | |
Chemicals | | | 2,198,084 | | | 0.9 | |
Commercial Services | | | 19,385,578 | | | 7.6 | |
Construction & Building Materials | | | 899,620 | | | 0.4 | |
Distribution/Wholesale | | | 5,155,027 | | | 2.0 | |
Diversified Financial Services | | | 7,324,651 | | | 2.9 | |
Diversified Industrials | | | 2,820,336 | | | 1.1 | |
Electronic & Electrical Equipment | | | 7,994,124 | | | 3.1 | |
Engineering & Machinery | | | 7,702,508 | | | 3.0 | |
Food Producers & Processors | | | 7,201,731 | | | 2.8 | |
Healthcare - Products | | | 8,206,505 | | | 3.2 | |
Healthcare - Services | | | 3,099,411 | | | 1.2 | |
Insurance | | | 16,464,599 | | | 6.5 | |
Internet | | | 18,641,900 | | | 7.3 | |
Investment Companies | | | 2,473,835 | | | 1.0 | |
Machinery - Diversified | | | 2,082,203 | | | 0.8 | |
Media & Photography | | | 9,920,909 | | | 3.9 | |
Mining & Metals | | | 4,447,574 | | | 1.8 | |
Motorcycles | | | 5,396,755 | | | 2.1 | |
Oil & Gas | | | 12,728,917 | | | 5.0 | |
Pharmaceuticals | | | 7,672,352 | | | 3.0 | |
Retailers - General | | | 15,999,873 | | | 6.3 | |
Semiconductors | | | 16,950,233 | | | 6.7 | |
Software | | | 939,305 | | | 0.4 | |
Telecommunication Services | | | 6,610,543 | | | 2.6 | |
Textiles | | | 3,124,291 | | | 1.2 | |
Toys/Games/Hobbies | | | 1,791,376 | | | 0.7 | |
Travel & Leisure | | | 2,930,222 | | | 1.2 | |
| | | | | | | |
| | | | | | | |
Total Value of Investments | | | 250,592,717 | | | 98.6 | |
Other assets less liabilities | | | 3,420,602 | | | 1.4 | |
| | | | | | | |
Net Assets | | $ | 254,013,319 | | | 100.0 | % |
| | | | | | | |
The accompanying notes are an integral part of the financial statements.
68
| |
PORTFOLIO OF INVESTMENTS | |
December 31, 2012 | Baillie Gifford Global Alpha Equity Fund |
| |
| | | | | | | |
| | | Shares | | | Value | |
| | | | | | | | |
| | | | | | | |
COMMON STOCKS – 96.8% | | | | | | | |
ARGENTINA - 0.5% | | | | | | | |
Arcos Dorados Holdings, Inc., Class A | | | 114,460 | | $ | 1,368,942 | |
| | | | | | | |
| | | | | | | |
AUSTRALIA - 1.5% | | | | | | | |
Brambles Ltd. | | | 349,781 | | | 2,773,525 | |
Cochlear Ltd. | | | 14,135 | | | 1,171,790 | |
| | | | | | | |
| | | | | | 3,945,315 | |
| | | | | | | |
BRAZIL – 1.7% | | | | | | | |
BM&F Bovespa SA | | | 416,400 | | | 2,847,179 | |
Odontoprev SA | | | 283,200 | | | 1,484,120 | |
| | | | | | | |
| | | | | | 4,331,299 | |
| | | | | | | |
CANADA - 2.7% | | | | | | | |
Fairfax Financial Holdings Ltd. | | | 8,602 | | | 3,105,322 | |
Ritchie Bros. Auctioneers, Inc. | | | 83,321 | | | 1,740,576 | |
Ultra Petroleum Corp. (a) | | | 104,824 | | | 1,900,459 | |
| | | | | | | |
| | | | | | 6,746,357 | |
| | | | | | | |
CHINA - 5.4% | | | | | | | |
Baidu, Inc. ADR (a) | | | 10,900 | | | 1,093,161 | |
China Mobile Ltd. | | | 200,500 | | | 2,359,424 | |
China Resources Enterprise Ltd. | | | 362,000 | | | 1,324,831 | |
Jardine Matheson Holdings Ltd. | | | 45,200 | | | 2,820,336 | |
Mindray Medical International Ltd. ADR | | | 102,687 | | | 3,357,865 | |
Shandong Weigao Group Medical Polymer Co., Ltd., Class H | | | 1,420,000 | | | 1,424,820 | |
Tsingtao Brewery Co. Ltd., Class H | | | 226,000 | | | 1,347,025 | |
| | | | | | | |
| | | | | | 13,727,462 | |
| | | | | | | |
DENMARK - 1.6% | | | | | | | |
Carlsberg A/S, B Shares | | | 32,120 | | | 3,164,348 | |
Jyske Bank A/S (a) | | | 37,199 | | | 1,037,994 | |
| | | | | | | |
| | | | | | 4,202,342 | |
| | | | | | | |
GERMANY - 0.8% | | | | | | | |
Deutsche Boerse AG | | | 31,503 | | | 1,931,837 | |
| | | | | | | |
| | | | | | | |
GREECE - 1.6% | | | | | | | |
Coca-Cola Hellenic Bottling Co. SA (a) | | | 174,458 | | | 4,075,906 | |
| | | | | | | |
| | | | | | | |
INDONESIA - 0.4% | | | | | | | |
Bank Negara Indonesia Persero Tbk PT | | | 2,333,000 | | | 899,165 | |
| | | | | | | |
| | | | | | | |
IRELAND - 1.3% | | | | | | | |
CRH Plc. | | | 43,546 | | | 899,620 | |
Ryanair Holdings Plc. ADR | | | 71,631 | | | 2,455,511 | |
| | | | | | | |
| | | | | | 3,355,131 | |
| | | | | | | |
JAPAN - 4.5% | | | | | | | |
Inpex Corp. | | | 567 | | | 3,032,520 | |
Namco Bandai Holdings, Inc. | | | 138,200 | | | 1,791,376 | |
Olympus Corp. (a) | | | 68,000 | | | 1,319,249 | |
Rohm Co., Ltd. | | | 35,500 | | | 1,160,489 | |
Tokyo Electron Ltd. | | | 31,000 | | | 1,429,759 | |
Yamaha Motor Co., Ltd. | | | 233,200 | | | 2,583,327 | |
| | | | | | | |
| | | | | | 11,316,720 | |
| | | | | | | |
MEXICO - 0.9% | | | | | | | |
America Movil SAB de CV Series L ADR | | | 97,300 | | | 2,251,522 | |
| | | | | | | |
The accompanying notes are an integral part of the financial statements.
69
| |
PORTFOLIO OF INVESTMENTS (continued) | |
December 31, 2012 | Baillie Gifford Global Alpha Equity Fund |
| |
| | | | | | | |
| | | Shares | | | Value | |
| | | | | | | | |
| | | | | | | |
NETHERLANDS - 1.1% | | | | | | | |
QIAGEN NV (a) | | | 70,800 | | $ | 1,285,020 | |
VistaPrint NV (a) | | | 47,894 | | | 1,573,797 | |
| | | | | | | |
| | | | | | 2,858,817 | |
| | | | | | | |
NORWAY - 1.1% | | | | | | | |
Norsk Hydro ASA | | | 279,940 | | | 1,420,844 | |
Schibsted ASA | | | 34,934 | | | 1,493,951 | |
| | | | | | | |
| | | | | | 2,914,795 | |
| | | | | | | |
SINGAPORE - 1.0% | | | | | | | |
DBS Group Holdings Ltd. | | | 199,000 | | | 2,443,027 | |
| | | | | | | |
| | | | | | | |
SOUTH AFRICA - 3.4% | | | | | | | |
Clicks Group Ltd. (a) | | | 397,123 | | | 3,060,152 | |
Naspers Ltd., N Shares | | | 86,179 | | | 5,566,372 | |
| | | | | | | |
| | | | | | 8,626,524 | |
| | | | | | | |
SOUTH KOREA - 1.9% | | | | | | | |
Samsung Electronics Co., Ltd. GDR 144A | | | 6,766 | | | 4,856,666 | |
| | | | | | | |
| | | | | | | |
SWEDEN - 5.5% | | | | | | | |
Atlas Copco AB, B Shares | | | 151,696 | | | 3,723,606 | |
Investor AB, B Shares | | | 94,169 | | | 2,473,835 | |
Svenska Handelsbanken AB, A Shares | | | 183,207 | | | 6,586,638 | |
Volvo AB, B Shares | | | 89,347 | | | 1,232,017 | |
| | | | | | | |
| | | | | | 14,016,096 | |
| | | | | | | |
SWITZERLAND - 7.9% | | | | | | | |
Compagnie Financiere Richemont SA, Br A | | | 74,647 | | | 5,859,458 | |
Nestle SA | | | 78,722 | | | 5,136,097 | |
Roche Holding AG - Genusschein | | | 25,451 | | | 5,145,713 | |
Schindler Holding AG, Participating Certificates | | | 27,506 | | | 3,978,902 | |
| | | | | | | |
| | | | | | 20,120,170 | |
| | | | | | | |
TAIWAN - 1.5% | | | | | | | |
Taiwan Semiconductor Manufacturing Co., Ltd. ADR | | | 222,800 | | | 3,823,248 | |
| | | | | | | |
| | | | | | | |
TURKEY - 1.5% | | | | | | | |
BIM Birlesik Magazalar A/S | | | 42,126 | | | 2,065,634 | |
Turkiye Garanti Bankasi A/S ADR | | | 323,211 | | | 1,680,697 | |
| | | | | | | |
| | | | | | 3,746,331 | |
| | | | | | | |
TURKMENISTAN - 0.5% | | | | | | | |
Dragon Oil Plc. | | | 146,089 | | | 1,317,101 | |
| | | | | | | |
| | | | | | | |
UNITED KINGDOM - 11.2% | | | | | | | |
Aggreko Plc. | | | 43,186 | | | 1,232,473 | |
British American Tobacco Plc. | | | 50,462 | | | 2,565,247 | |
Bunzl Plc. | | | 179,701 | | | 2,974,379 | |
Hays Plc. | | | 883,723 | | | 1,201,841 | |
HSBC Holdings Plc. | | | 246,795 | | | 2,615,243 | |
Prudential Plc. | | | 487,019 | | | 6,948,504 | |
Rolls-Royce Holdings Plc. (a) | | | 254,010 | | | 3,643,382 | |
Vodafone Group Plc. | | | 794,349 | | | 1,999,597 | |
Wolseley Plc. | | | 107,803 | | | 5,155,027 | |
| | | | | | | |
| | | | | | 28,335,693 | |
| | | | | | | |
The accompanying notes are an integral part of the financial statements.
70
| |
PORTFOLIO OF INVESTMENTS (continued) | |
December 31, 2012 | Baillie Gifford Global Alpha Equity Fund |
| | |
| | | | | | | |
| | Shares | | Value | |
| | | | | | |
| | | | | | | |
UNITED STATES - 37.3% | | | | | | | |
Altera Corp. | | | 50,290 | | $ | 1,731,988 | |
Amazon.com, Inc. (a) | | | 23,646 | | | 5,938,456 | |
Bed Bath & Beyond, Inc. (a) | | | 26,847 | | | 1,501,016 | |
CarMax, Inc. (a) | | | 76,864 | | | 2,885,475 | |
Deere & Co. | | | 24,094 | | | 2,082,203 | |
Dolby Laboratories, Inc., Class A | | | 43,854 | | | 1,286,238 | |
eBay, Inc. (a) | | | 114,532 | | | 5,843,423 | |
EOG Resources, Inc. | | | 26,180 | | | 3,162,282 | |
Express Scripts Holding Co. (a) | | | 23,798 | | | 1,285,092 | |
First Republic Bank | | | 67,094 | | | 2,199,341 | |
FLIR Systems, Inc. | | | 117,907 | | | 2,630,505 | |
Google, Inc., Class A (a) | | | 5,831 | | | 4,136,336 | |
Harley-Davidson, Inc. | | | 57,605 | | | 2,813,428 | |
Illumina, Inc. (a) | | | 23,502 | | | 1,306,476 | |
Intuitive Surgical, Inc. (a) | | | 1,972 | | | 967,010 | |
Life Technologies Corp. (a) | | | 51,480 | | | 2,526,638 | |
Markel Corp. (a) | | | 8,395 | | | 3,638,561 | |
Mastercard, Inc., Class A | | | 8,969 | | | 4,406,290 | |
Mohawk Industries, Inc. (a) | | | 34,534 | | | 3,124,291 | |
Moody’s Corp. | | | 69,211 | | | 3,482,698 | |
National Oilwell Varco, Inc. | | | 25,397 | | | 1,735,885 | |
New York Community Bancorp, Inc. | | | 214,850 | | | 2,814,535 | |
Omnicom Group, Inc. | | | 66,085 | | | 3,301,607 | |
PepsiCo, Inc. | | | 49,423 | | | 3,382,016 | |
Philip Morris International, Inc. | | | 29,714 | | | 2,485,279 | |
Praxair, Inc. | | | 20,083 | | | 2,198,084 | |
Progressive Corp. (The) | | | 61,047 | | | 1,288,092 | |
Royal Caribbean Cruises Ltd. | | | 86,183 | | | 2,930,222 | |
Seattle Genetics, Inc. (a) | | | 51,500 | | | 1,194,800 | |
Teradata Corp. (a) | | | 15,177 | | | 939,305 | |
Teradyne, Inc. (a) | | | 89,073 | | | 1,504,443 | |
TripAdvisor, Inc. (a) | | | 38,859 | | | 1,630,524 | |
Visa, Inc., Class A | | | 16,794 | | | 2,545,635 | |
Walt Disney Co. (The) | | | 57,453 | | | 2,860,585 | |
Waters Corp. (a) | | | 31,659 | | | 2,758,132 | |
WellPoint, Inc. | | | 29,782 | | | 1,814,319 | |
Xilinx, Inc. | | | 68,068 | | | 2,443,641 | |
| | | | | | | |
| | | | | | 94,774,851 | |
| | | | | | | |
Total Common Stocks
(cost $216,819,099) | | | | | | 245,985,317 | |
| | | | | | | |
| | | | | | | |
PREFERRED STOCKS – 1.8% | | | | | | | |
BRAZIL – 1.8% | | | | | | | |
Petroleo Brasileiro SA ADR | | | 81,900 | | | 1,580,670 | |
Vale SA ADR | | | 149,100 | | | 3,026,730 | |
| | | | | | | |
Total Preferred Stocks
(cost $4,908,681) | | | | | | 4,607,400 | |
| | | | | | | |
| | | | | | | |
TOTAL INVESTMENTS - 98.6%
(cost $221,727,780) | | | | | | 250,592,717 | |
Other assets less liabilities - 1.4% | | | | | | 3,420,602 | |
| | | | | | | |
NET ASSETS - 100.0% | | | | | $ | 254,013,319 | |
| | | | | | | |
The accompanying notes are an integral part of the financial statements.
71
| |
PORTFOLIO OF INVESTMENTS (concluded) | |
December 31, 2012 | Baillie Gifford Global Alpha Equity Fund |
| | |
|
(a) Non-income producing security. |
ADR - American Depositary Receipt. |
GDR - Global Depositary Receipt. |
144A - Securities are exempt from registration under Rule 144A under the Securities Act of 1933, as amended. These securities may be resold in transactions exempt from registration, normally to qualified institutional buyers. Prices are obtained daily from the London International Stock Exchange, therefore, fair valuation is typically not required. At December 31, 2012, the securities amounted to $4,856,666 or 1.9% of net assets.
The accompanying notes are an integral part of the financial statements.
72
| |
STATEMENT OF ASSETS AND LIABILITIES | |
December 31, 2012 | Baillie Gifford Global Alpha Equity Fund |
| | |
| | | | |
ASSETS | | | | |
Investments, at value (cost $221,727,780) | | $ | 250,592,717 | |
Cash | | | 3,084,602 | |
Foreign cash, at value (cost $469,207) | | | 470,890 | |
Receivable for investments sold | | | 31,360 | |
Dividends receivable | | | 143,306 | |
Tax reclaims receivable | | | 81,206 | |
| | | | |
| | | | |
Total Assets | | | 254,404,081 | |
| | | | |
| | | | |
LIABILITIES | | | | |
Management fee payable | | | 186,156 | |
Servicing fee payable | | | 139,933 | |
Accrued expenses | | | 64,673 | |
| | | | |
| | | | |
Total Liabilities | | | 390,762 | |
| | | | |
| | | | |
NET ASSETS | | $ | 254,013,319 | |
| | | | |
| | | | |
COMPOSITION OF NET ASSETS | | | | |
Paid-in capital | | $ | 227,176,189 | |
Distributions in excess of net investment income | | | (229,855 | ) |
Accumulated net realized loss on investments and foreign currency transactions | | | (1,803,594 | ) |
Net unrealized appreciation in value of investments and foreign currencies | | | 28,870,579 | |
| | | | |
| | $ | 254,013,319 | |
| | | | |
| | | | |
NET ASSET VALUE, PER SHARE | | | | |
| | | | |
Class 1 ($22,855,661 / 2,045,772 shares outstanding),
unlimited authorized, no par value | | $ | 11.17 | |
| | | | |
Maximum Purchase Price Per Share (Note D) | | $ | 11.19 | |
| | | | |
Minimum Redemption Price Per Share (Note D) | | $ | 11.15 | |
| | | | |
| | | | |
Class 3 ($231,157,658 / 19,990,540 shares outstanding),
unlimited authorized, no par value | | $ | 11.56 | |
| | | | |
Maximum Purchase Price Per Share (Note D) | | $ | 11.58 | |
| | | | |
Minimum Redemption Price Per Share (Note D) | | $ | 11.54 | |
| | | | |
The accompanying notes are an integral part of the financial statements.
73
| |
STATEMENT OF OPERATIONS | |
For the Year Ended December 31, 2012 | Baillie Gifford Global Alpha Equity Fund |
| | |
| | | | |
INVESTMENT INCOME | | | | |
Dividends (net of foreign withholding taxes of $218,691) | | $ | 3,891,784 | |
Interest | | | 620 | |
| | | | |
Total Investment Income | | | 3,892,404 | |
| | | | |
| | | | |
EXPENSES | | | | |
Management fee (Note B) | | | 499,355 | |
Shareholder Servicing fees - Class 1 Shares (Note B) | | | 62,185 | |
Shareholder Servicing fees - Class 2 Shares (Note B) | | | 51,402 | |
Shareholder Servicing fees - Class 3 Shares (Note B) | | | 278,418 | |
Fund Accounting | | | 105,737 | |
Custody | | | 46,589 | |
Legal | | | 39,906 | |
Transfer Agency | | | 12,946 | |
Professional fees | | | 6,282 | |
Trustees’ fees | | | 4,307 | |
Insurance | | | 1,275 | |
Miscellaneous | | | 995 | |
| | | | |
Total Expenses | | | 1,109,397 | |
| | | | |
| | | | |
Net Investment Income | | | 2,783,007 | |
| | | | |
| | | | |
REALIZED AND UNREALIZED GAIN (LOSS) ON INVESTMENTS AND FOREIGN CURRENCY TRANSACTIONS | | | | |
Net realized loss from: | | | | |
Investments | | | (1,752,247 | ) |
Foreign currency transactions | | | (5,833 | ) |
| | | | |
| | | (1,758,080 | ) |
| | | | |
| | | | |
Net change in unrealized appreciation (depreciation) on: | | | | |
Investments | | | 30,243,873 | |
Translation of assets and liabilities in foreign currencies | | | 3,219 | |
| | | | |
| | | 30,247,092 | |
| | | | |
| | | | |
Net realized and unrealized gain on investments and foreign currency transactions | | | 28,489,012 | |
| | | | |
NET INCREASE IN NET ASSETS FROM OPERATIONS | | $ | 31,272,019 | |
| | | | |
The accompanying notes are an integral part of the financial statements.
74
| |
STATEMENTS OF CHANGES IN NET ASSETS | Baillie Gifford Global Alpha Equity Fund |
| | |
| | | | | | | |
| | For the
Year Ended
December 31, 2012 | | For the Period
November 15, 2011*
through
December 31, 2011 | |
| | | | | |
| | | | | |
INCREASE (DECREASE) IN NET ASSETS FROM OPERATIONS | | | | | | | |
Net investment income | | $ | 2,783,007 | | $ | 145,848 | |
Net realized loss from investments and foreign currency transactions | | | (1,758,080 | ) | | (44,686 | ) |
Net change in unrealized appreciation (depreciation) on investments and translation of assets and liabilities in foreign currencies | | | 30,247,092 | | | (1,376,513 | ) |
| | | | | | | |
Net increase (decrease) in net assets from operations | | | 31,272,019 | | | (1,275,351 | ) |
| | | | | | | |
| | | | | | | |
DIVIDENDS TO SHAREHOLDERS FROM | | | | | | | |
Net investment income: | | | | | | | |
Class 1 | | | (226,914 | ) | | — | |
Class 3 | | | (2,780,220 | ) | | (158,199 | ) |
| | | | | | | |
Total Dividends | | | (3,007,134 | ) | | (158,199 | ) |
| | | | | | | |
| | | | | | | |
TRANSACTIONS IN SHARES OF BENEFICIAL INTEREST | | | | | | | |
Net proceeds from shares subscribed: | | | | | | | |
Class 1 | | | 21,556,800 | | | — | |
Class 2 | | | 96,384,748 | | | — | |
Class 3 | | | 104,146,842 | | | 105,996,135 | |
Purchase premiums: | | | | | | | |
Class 1 | | | 9,241 | | | — | |
Class 2 | | | 15,959 | | | — | |
Class 3 | | | 53,768 | | | — | |
Dividends reinvested: | | | | | | | |
Class 1 | | | 226,914 | | | — | |
Class 3 | | | 2,780,220 | | | 158,199 | |
Cost of shares redeemed: | | | | | | | |
Class 2 | | | (104,146,842 | ) | | — | |
| | | | | | | |
| | | | | | | |
| | | | | | | |
Increase in Net Assets from Transactions in Shares of Beneficial Interest | | | 121,027,650 | | | 106,154,334 | |
| | | | | | | |
| | | | | | | |
Total Increase in Net Assets | | | 149,292,535 | | | 104,720,784 | |
| | | | | | | |
NET ASSETS | | | | | | | |
Beginning of period | | | 104,720,784 | | | — | |
| | | | | | | |
End of period (including distributions in excess of net investment income of $229,855 and $0, respectively) | | $ | 254,013,319 | | $ | 104,720,784 | |
| | | | | | | |
* Commencement of investment operations.
The accompanying notes are an integral part of the financial statements.
75
| |
FINANCIAL HIGHLIGHTS | Baillie Gifford Global Alpha Equity Fund |
| | |
Selected data for a Class 1 Share outstanding throughout the period:
| | | | |
| | For the Period
May 3, 2012(a)
through
December 31, 2012 | |
| | | |
Net asset value, beginning of period | | $ | 10.70 | |
| | | | |
| | | | |
From Investment Operations | | | | |
Net investment income(b) | | | 0.07 | |
Net realized and unrealized gain on investments and foreign currency transactions | | | 0.51 | |
| | | | |
Net increase in net asset value from investment operations | | | 0.58 | |
| | | | |
| | | | |
Dividends to Shareholders | | | | |
Dividends from net investment income | | | (0.11 | ) |
| | | | |
| | | | |
Proceeds from Purchase Premiums(b) | | | 0.00 | (c) |
| | | | |
| | | | |
Net asset value, end of period | | $ | 11.17 | |
| | | | |
| | | | |
Total Return | | | | |
Total investment return based on net asset value(d) | | | 5.45 | % |
| | | | |
Ratios/Supplemental Data | | | | |
Net assets, end of period (000’s omitted) | | $ | 22,856 | |
Ratio of net expenses to average net assets | | | 0.88 | %* |
Ratio of net investment income to average net assets | | | 0.96 | %* |
Portfolio turnover rate | | | 15 | % |
| |
* | Annualized. |
(a) | Commencement of investment operations. |
(b) | Calculated based upon average shares outstanding during the period. |
(c) | Amount is less than $0.005 per share. |
(d) | Total investment return is calculated assuming an initial investment made at the net asset value at the beginning of the period, reinvestment of all dividends and distributions, if any, at net asset value during the period, and redemption on the last day of the period. Total return is not annualized for periods less than one year. |
The accompanying notes are an integral part of the financial statements.
76
| |
FINANCIAL HIGHLIGHTS (concluded) | Baillie Gifford Global Alpha Equity Fund |
| | |
Selected data for a Class 3 Share outstanding throughout each period:
| | | | | | | |
| | For the
Year Ended
December 31, 2012 | | For the Period
November 15, 2011(a)
through
December 31, 2011 | |
| | | | | |
Net asset value, beginning of period | | $ | 9.86 | | $ | 10.00 | |
| | | | | | | |
| | | | | | | |
From Investment Operations | | | | | | | |
Net investment income(b) | | | 0.19 | | | 0.01 | |
Net realized and unrealized gain (loss) on investments and foreign currency transactions | | | 1.65 | | | (0.14 | ) |
| | | | | | | |
Net increase (decrease) in net asset value from investment operations | | | 1.84 | | | (0.13 | ) |
| | | | | | | |
| | | | | | | |
Dividends to Shareholders | | | | | | | |
Dividends from net investment income | | | (0.14 | ) | | (0.01 | ) |
| | | | | | | |
| | | | | | | |
Proceeds from Purchase Premiums(b) | | | 0.00 | (c) | | — | |
| | | | | | | |
| | | | | | | |
Net asset value, end of period | | $ | 11.56 | | $ | 9.86 | |
| | | | | | | |
| | | | | | | |
Total Return | | | | | | | |
Total investment return based on net asset value(d) | | | 18.69 | % | | (1.25 | )% |
| | | | | | | |
Ratios/Supplemental Data | | | | | | | |
Net assets, end of period (000’s omitted) | | $ | 231,157 | | $ | 104,721 | |
Ratio of net expenses to average net assets | | | 0.63 | % | | 0.64 | %* |
Ratio of net investment income to average net assets | | | 1.76 | % | | 1.12 | %* |
Portfolio turnover rate | | | 15 | % | | 3 | % |
| |
* | Annualized. |
(a) | Commencement of investment operations. |
(b) | Calculated based upon average shares outstanding during the period. |
(c) | Amount is less than $0.005 per share. |
(d) | Total investment return is calculated assuming an initial investment made at the net asset value at the beginning of the period, reinvestment of all dividends and distributions, if any, at net asset value during the period, and redemption on the last day of the period. Total return is not annualized for periods less than one year. |
The accompanying notes are an integral part of the financial statements.
77
NOTES TO FINANCIAL STATEMENTS
December 31, 2012
Note A – Organization and Accounting Policies
Each of Baillie Gifford International Equity Fund (“International Equity Fund”), Baillie Gifford International Choice Fund (“International Choice Fund”), Baillie Gifford EAFE Fund (“EAFE Fund”), Baillie Gifford EAFE Choice Fund (“EAFE Choice Fund”), Baillie Gifford Emerging Markets Fund (“Emerging Markets Fund”) and Baillie Gifford Global Alpha Equity Fund (“Global Alpha Equity Fund”) (each, a “Fund”, and collectively, the “Funds”) is a series of Baillie Gifford Funds (the “Trust”). The Trust is a diversified open-end management investment company registered under the Investment Company Act of 1940, as amended. The Trust is organized as a Massachusetts business trust under the laws of Massachusetts pursuant to an Amended and Restated Agreement and Declaration of Trust dated August 17, 2001, as subsequently amended. International Equity Fund, International Choice Fund, EAFE Fund, EAFE Choice Fund and Global Alpha Equity Fund offer five classes of shares, Class 1, Class 2, Class 3, Class 4 and Class 5 shares, and Emerging Markets Fund offers three classes of shares, Class I, Class II and Class III shares (an unlimited number of shares are authorized, without par value). At December 31, 2012, shares issued and outstanding for the International Equity Fund were of Class 1, Class 2, Class 3 and Class 4 shares, shares issued and outstanding for the International Choice Fund was of Class 1, shares issued and outstanding for the EAFE Fund were of Class 1, Class 2, Class 3 and Class 5 shares, shares issued and outstanding for the EAFE Choice Fund were of Class 2 and Class 3 shares, shares issued and outstanding for the Emerging Markets Fund were of Class III and shares issued outstanding for Global Alpha Equity Fund were of Class 1 and Class 3 shares.
The financial statements of the Funds have been prepared in conformity with accounting principles generally accepted in the United States of America (“GAAP”). Management is required to make certain estimates and assumptions that affect the reported amounts of assets and liabilities for the Funds and disclosure of contingent assets and liabilities for the Funds at the date of the financial statements and the reported amounts of increases and decreases in net assets from operations for the Funds during the reporting period. Actual results could differ from those estimates.
The following is a summary of significant accounting policies followed by the Funds.
|
Valuation of Investments |
Equity securities listed on an established securities exchange are normally valued at their last sale price on the exchange where primarily traded adjusted for any fair value adjustments described below. Equity securities listed on the NASDAQ National Market System are valued at the NASDAQ Official Closing Price. Equity securities listed on an established securities exchange or on the NASDAQ National Market System for which there is no reported sale during the day, and in the case of over-the-counter securities not so listed, are valued at the mean between the last available bid and asked prices. Other securities for which current market quotations are not readily available (or for which quotations are not believed to be reliable due to market changes that occur after the most recent available quotations are obtained or any other reason), and all other assets, are taken at fair value as determined in good faith by Baillie Gifford Overseas Limited (the “Manager”), pursuant to procedures approved by the trustees of the Trust (the “Trustees”). The actual calculations may be made by persons acting pursuant to the direction of the Trustees or by pricing services. |
78
NOTES TO FINANCIAL STATEMENTS (continued)
Generally, trading in foreign securities markets is substantially completed each day at various times prior to close of regular trading on the New York Stock Exchange. Occasionally, events affecting the value of foreign fixed income securities and of equity securities of non-U.S. issuers not traded on a U.S. exchange may occur between the completion of substantial trading of such securities for the day and the close of regular trading on the New York Stock Exchange, which events may not be reflected in the computation of a Funds’ net asset values. If events materially affecting the value of the Funds’ portfolio securities occur during such period, then these securities will be valued at their fair value as determined in good faith by the Manager, pursuant to procedures approved by the Trustees. The Funds utilize a third party pricing service which for all equity securities, except those traded on a Canadian, Latin American or U.S. exchange, applies a fair value adjustment that seeks to reflect changes in such securities’ market prices since the close of the market on which they are traded. To the extent that securities are valued using this service, they will be classified as Level 2 securities in the fair value measurement framework described below.
The Funds invest in obligations of foreign entities and securities denominated in foreign currencies. Such investments involve risk not typically involved with domestic investments. Such risks include fluctuations in foreign exchange rates, inability to convert proceeds into U.S. dollars, application of foreign tax laws, foreign investment restrictions, less publicly available information about foreign financial instruments, less liquidity resulting from substantially less trading volume, more volatile prices, and generally less government supervision of foreign securities markets and issuers.
|
Fair Value Measurement |
GAAP provides guidance on fair value measurements and defines fair value as the price that the Trust would receive to sell an investment or pay to transfer a liability in a timely transaction with an independent buyer in the principal market, or in the absence of a principal market the most advantageous market for the investment or liability. It establishes a single definition of fair value, creates a three-tier hierarchy as a framework for measuring fair value based on inputs used to value the Trust’s investments, and requires additional disclosure about fair value. The hierarchy of inputs is summarized below: |
| | |
| Level 1 - | unadjusted quoted prices in active markets for identical investments |
| Level 2 - | other significant observable inputs (including quoted prices for similar investments, interest rates, prepayment speeds, credit risk, etc.) |
| Level 3 - | significant unobservable inputs (including the Trust’s own assumptions in determining the fair value of investments) |
For Level 1 inputs, the Funds use unadjusted quoted prices in active markets for assets or liabilities with sufficient frequency and volume to provide pricing information as the most reliable evidence of fair value.
The Funds’ Level 2 valuation techniques include inputs other than quoted prices within Level 1 that are observable for an asset or liability, either directly or indirectly. Level 2 observable inputs may include quoted prices for similar assets and liabilities in active markets or quoted prices for identical or similar assets or liabilities in markets that are not active in which there are few transactions, the prices are not current, or price quotations vary substantially over time or among market participants. Inputs that are observable for the asset or liability in Level 2 include such factors as interest rates, yield curves, prepayment speeds, credit risk, and default rates for similar liabilities.
79
NOTES TO FINANCIAL STATEMENTS (continued)
For Level 3 valuation techniques, the Funds use unobservable inputs that reflect assumptions market participants would be expected to use in pricing the asset or liability. Unobservable inputs are used to measure fair value to the extent that observable inputs are not available and are developed based on the best information available under the circumstances. In developing unobservable inputs, market participant assumptions are used if they are reasonably available without undue cost and effort.
The inputs or methodology used for valuing securities are not necessarily an indication of the risk associated with investing in those securities. The following is a summary of the inputs used as of December 31, 2012 in valuing the Funds’ investments carried at fair value:
International Equity Fund
| | | | | | | | | | | | | |
| | Level 1 | | Level 2 | | Level 3 | | Total | |
| | | | | | | | | |
Investments in Securities | | | | | | | | | | | | | |
Common Stocks | | | | | | | | | | | | | |
Argentina | | $ | 26,878,797 | | $ | — | | $ | — | | $ | 26,878,797 | |
Australia | | | — | | | 68,839,854 | | | — | | | 68,839,854 | |
Belgium | | | — | | | 15,066,999 | | | — | | | 15,066,999 | |
Bermuda | | | — | | | 13,003,759 | | | — | | | 13,003,759 | |
Brazil | | | 15,445,551 | | | — | | | — | | | 15,445,551 | |
Canada | | | 86,383,089 | | | — | | | — | | | 86,383,089 | |
China | | | 25,981,528 | | | 170,793,454 | | | — | | | 196,774,982 | |
Denmark | | | — | | | 42,623,085 | | | — | | | 42,623,085 | |
Finland | | | — | | | 65,469,621 | | | — | | | 65,469,621 | |
France | | | — | | | 74,190,335 | | | — | | | 74,190,335 | |
Germany | | | — | | | 50,444,168 | | | — | | | 50,444,168 | |
India | | | — | | | 20,368,585 | | | — | | | 20,368,585 | |
Ireland | | | 24,077,106 | | | 38,072,021 | | | — | | | 62,149,127 | |
Japan | | | — | | | 172,185,948 | | | — | | | 172,185,948 | |
Netherlands | | | — | | | 59,091,677 | | | — | | | 59,091,677 | |
Norway | | | — | | | 22,751,899 | | | — | | | 22,751,899 | |
Peru | | | 32,941,705 | | | — | | | — | | | 32,941,705 | |
Portugal | | | 7,485,513 | | | — | | | — | | | 7,485,513 | |
Russia | | | — | | | 41,446,437 | | | — | | | 41,446,437 | |
Singapore | | | — | | | 60,763,853 | | | — | | | 60,763,853 | |
South Africa | | | — | | | 68,224,178 | | | — | | | 68,224,178 | |
South Korea | | | — | | | 93,291,569 | | | — | | | 93,291,569 | |
Spain | | | — | | | 35,432,516 | | | — | | | 35,432,516 | |
Sweden | | | — | | | 127,964,385 | | | — | | | 127,964,385 | |
Switzerland | | | — | | | 60,660,705 | | | — | | | 60,660,705 | |
Taiwan | | | 19,412,739 | | | 59,738,315 | | | — | | | 79,151,054 | |
Turkey | | | — | | | 42,560,572 | | | — | | | 42,560,572 | |
United Kingdom | | | — | | | 405,453,472 | | | — | | | 405,453,472 | |
United States | | | 11,007,209 | | | — | | | — | | | 11,007,209 | |
| | | | | | | | | | | | | |
Total Common Stocks | | | 249,613,237 | | | 1,808,437,407 | | | — | | | 2,058,050,644 | |
| | | | | | | | | | | | | |
Preferred Stocks | | | | | | | | | | | | | |
Brazil | | | 36,383,287 | | | — | | | — | | | 36,383,287 | |
| | | | | | | | | | | | | |
Total | | $ | 285,996,524 | | $ | 1,808,437,407 | | $ | — | | $ | 2,094,433,931 | |
| | | | | | | | | | | | | |
80
NOTES TO FINANCIAL STATEMENTS (continued)
International Choice Fund
| | | | | | | | | | | | | |
| | Level 1 | | Level 2 | | Level 3 | | Total | |
| | | | | | | | | |
Investments in Securities | | | | | | | | | | | | | |
Common Stocks | | | | | | | | | | | | | |
Australia | | $ | 2,424 | | $ | 1,860,156 | | $ | — | | $ | 1,862,580 | |
Belgium | | | 149,287 | | | — | | | — | | | 149,287 | |
Brazil | | | 435,412 | | | — | | | — | | | 435,412 | |
Canada | | | 524,524 | | | — | | | — | | | 524,524 | |
China | | | 350,517 | | | 982,849 | | | — | | | 1,333,366 | |
Denmark | | | — | | | 1,051,692 | | | — | | | 1,051,692 | |
Finland | | | — | | | 305,012 | | | — | | | 305,012 | |
France | | | — | | | 538,810 | | | — | | | 538,810 | |
Germany | | | — | | | 311,564 | | | — | | | 311,564 | |
India | | | 373,642 | | | — | | | — | | | 373,642 | |
Indonesia | | | — | | | 197,138 | | | — | | | 197,138 | |
Italy | | | — | | | 594,187 | | | — | | | 594,187 | |
Japan | | | — | | | 3,391,732 | | | — | | | 3,391,732 | |
Mexico | | | 279,649 | | | — | | | — | | | 279,649 | |
Netherlands | | | — | | | 151,755 | | | — | | | 151,755 | |
Philippines | | | 106,404 | | | — | | | — | | | 106,404 | |
Singapore | | | — | | | 311,677 | | | — | | | 311,677 | |
South Africa | | | — | | | 570,070 | | | — | | | 570,070 | |
Spain | | | — | | | 542,377 | | | — | | | 542,377 | |
Sweden | | | — | | | 2,015,819 | | | — | | | 2,015,819 | |
Switzerland | | | — | | | 1,946,454 | | | — | | | 1,946,454 | |
Taiwan | | | 532,231 | | | — | | | — | | | 532,231 | |
Turkey | | | 610,221 | | | — | | | — | | | 610,221 | |
United Kingdom | | | — | | | 4,572,778 | | | — | | | 4,572,778 | |
United States | | | 760,255 | | | — | | | — | | | 760,255 | |
| | | | | | | | | | | | | |
Total Common Stocks | | | 4,124,566 | | | 19,344,070 | | | — | | | 23,468,636 | |
| | | | | | | | | | | | | |
Preferred Stocks | | | | | | | | | | | | | |
Brazil | | | 222,210 | | | — | | | — | | | 222,210 | |
| | | | | | | | | | | | | |
Total | | $ | 4,346,776 | | $ | 19,344,070 | | $ | — | | $ | 23,690,846 | |
| | | | | | | | | | | | | |
81
NOTES TO FINANCIAL STATEMENTS (continued)
EAFE Fund
| | | | | | | | | | | | | |
| | Level 1 | | Level 2 | | Level 3 | | Total | |
| | | | | | | | | |
Investments in Securities | | | | | | | | | | | | | |
Common Stocks | | | | | | | | | | | | | |
Argentina | | $ | 11,809,071 | | $ | — | | $ | — | | $ | 11,809,071 | |
Australia | | | — | | | 107,370,945 | | | — | | | 107,370,945 | |
Brazil | | | 20,218,018 | | | — | | | — | | | 20,218,018 | |
Chile | | | 10,922,780 | | | — | | | — | | | 10,922,780 | |
China | | | 103,903,463 | | | 141,448,349 | | | — | | | 245,351,812 | |
Denmark | | | — | | | 73,794,715 | | | — | | | 73,794,715 | |
France | | | — | | | 141,512,911 | | | — | | | 141,512,911 | |
Germany | | | — | | | 77,504,256 | | | — | | | 77,504,256 | |
India | | | — | | | 11,369,000 | | | — | | | 11,369,000 | |
Ireland | | | — | | | 12,513,848 | | | — | | | 12,513,848 | |
Italy | | | — | | | 66,553,953 | | | — | | | 66,553,953 | |
Japan | | | — | | | 150,242,428 | | | — | | | 150,242,428 | |
Luxembourg | | | 786,444 | | | 7,962,550 | | | — | | | 8,748,994 | |
Norway | | | — | | | 10,708,947 | | | — | | | 10,708,947 | |
Peru | | | 16,544,719 | | | — | | | — | | | 16,544,719 | |
Portugal | | | — | | | 19,876,707 | | | — | | | 19,876,707 | |
Russia | | | — | | | 10,695,191 | | | — | | | 10,695,191 | |
Singapore | | | — | | | 12,993,604 | | | — | | | 12,993,604 | |
South Africa | | | — | | | 7,125,690 | | | — | | | 7,125,690 | |
South Korea | | | — | | | 64,926,434 | | | — | | | 64,926,434 | |
Spain | | | — | | | 131,494,928 | | | — | | | 131,494,928 | |
Sweden | | | 14,779,204 | | | 180,090,578 | | | — | | | 194,869,782 | |
Switzerland | | | — | | | 182,505,767 | | | — | | | 182,505,767 | |
Taiwan | | | 15,039,127 | | | — | | | — | | | 15,039,127 | |
Turkey | | | — | | | 29,988,017 | | | — | | | 29,988,017 | |
United Kingdom | | | — | | | 396,502,514 | | | — | | | 396,502,514 | |
| | | | | | | | | | | | | |
Total Common Stocks | | | 194,002,826 | | | 1,837,181,332 | | | — | | | 2,031,184,158 | |
| | | | | | | | | | | | | |
Preferred Stocks | | | | | | | | | | | | | |
Brazil | | | 18,984,635 | | | — | | | — | | | 18,984,635 | |
Germany | | | — | | | 26,148,859 | | | — | | | 26,148,859 | |
| | | | | | | | | | | | | |
Total Preferred Stocks | | | 18,984,635 | | | 26,148,859 | | | — | | | 45,133,494 | |
| | | | | | | | | | | | | |
Total | | $ | 212,987,461 | | $ | 1,863,330,191 | | $ | — | | $ | 2,076,317,652 | |
| | | | | | | | | | | | | |
82
NOTES TO FINANCIAL STATEMENTS (continued)
EAFE Choice Fund
| | | | | | | | | | | | | |
| | Level 1 | | Level 2 | | Level 3 | | Total | |
| | | | | | | | | |
Investments in Securities | | | | | | | | | | | | | |
Common Stocks | | | | | | | | | | | | | |
Australia | | $ | 14,614 | | $ | 14,469,273 | | $ | — | | $ | 14,483,887 | |
Belgium | | | 1,099,707 | | | — | | | — | | | 1,099,707 | |
China | | | 1,952,190 | | | 8,854,349 | | | — | | | 10,806,539 | |
Denmark | | | — | | | 8,728,601 | | | — | | | 8,728,601 | |
Finland | | | — | | | 3,514,733 | | | — | | | 3,514,733 | |
France | | | — | | | 6,133,227 | | | — | | | 6,133,227 | |
Germany | | | — | | | 3,226,405 | | | — | | | 3,226,405 | |
India | | | 1,634,458 | | | — | | | — | | | 1,634,458 | |
Italy | | | — | | | 5,603,751 | | | — | | | 5,603,751 | |
Japan | | | — | | | 25,968,864 | | | — | | | 25,968,864 | |
Netherlands | | | — | | | 1,356,899 | | | — | | | 1,356,899 | |
Singapore | | | — | | | 2,709,341 | | | — | | | 2,709,341 | |
South Africa | | | — | | | 2,096,325 | | | — | | | 2,096,325 | |
South Korea | | | — | | | 2,368,755 | | | — | | | 2,368,755 | |
Spain | | | — | | | 4,070,991 | | | — | | | 4,070,991 | |
Sweden | | | — | | | 16,781,299 | | | — | | | 16,781,299 | |
Switzerland | | | — | | | 16,845,862 | | | — | | | 16,845,862 | |
Taiwan | | | 4,286,102 | | | — | | | — | | | 4,286,102 | |
Turkey | | | — | | | 2,575,303 | | | — | | | 2,575,303 | |
United Kingdom | | | — | | | 39,636,374 | | | — | | | 39,636,374 | |
United States | | | 5,516,700 | | | — | | | — | | | 5,516,700 | |
| | | | | | | | | | | | | |
Total Common Stocks | | | 14,503,771 | | | 164,940,352 | | | — | | | 179,444,123 | |
| | | | | | | | | | | | | |
Preferred Stocks | | | | | | | | | | | | | |
Brazil | | | 1,505,994 | | | — | | | — | | | 1,505,994 | |
| | | | | | | | | | | | | |
Total | | $ | 16,009,765 | | $ | 164,940,352 | | $ | — | | $ | 180,950,117 | |
| | | | | | | | | | | | | |
83
NOTES TO FINANCIAL STATEMENTS (continued)
Emerging Markets Fund
| | | | | | | | | | | | | |
| | Level 1 | | Level 2 | | Level 3 | | Total | |
| | | | | | | | | |
Investments in Securities | | | | | | | | | | | | | |
Common Stocks | | | | | | | | | | | | | |
Argentina | | $ | 5,789,240 | | $ | — | | $ | — | | $ | 5,789,240 | |
Australia | | | 6,223,091 | | | — | | | — | | | 6,223,091 | |
Brazil | | | 14,676,729 | | | — | | | — | | | 14,676,729 | |
Canada | | | 2,963,188 | | | — | | | — | | | 2,963,188 | |
China | | | — | | | 85,626,898 | | | — | | | 85,626,898 | |
Colombia | | | 2,217,516 | | | — | | | — | | | 2,217,516 | |
Egypt | | | 4,219,661 | | | — | | | — | | | 4,219,661 | |
Guernsey | | | — | | | 381,942 | | | — | | | 381,942 | |
India | | | — | | | 50,567,390 | | | — | | | 50,567,390 | |
Indonesia | | | — | | | 12,932,415 | | | — | | | 12,932,415 | |
Malaysia | | | 5,322,819 | | | 7,477,812 | | | — | | | 12,800,631 | |
Mexico | | | 19,230,809 | | | — | | | — | | | 19,230,809 | |
Panama | | | 4,163,574 | | | — | | | — | | | 4,163,574 | |
Russia | | | — | | | 21,505,590 | | | — | | | 21,505,590 | |
South Africa | | | 5,154,484 | | | 8,875,161 | | | — | | | 14,029,645 | |
South Korea | | | 2,032,734 | | | 84,549,371 | | | — | | | 86,582,105 | |
Taiwan | | | — | | | 49,473,106 | | | — | | | 49,473,106 | |
Thailand | | | — | | | 9,342,718 | | | — | | | 9,342,718 | |
Turkey | | | — | | | 9,312,859 | | | — | | | 9,312,859 | |
Turkmenistan | | | 17,916,540 | | | — | | | — | | | 17,916,540 | |
United Kingdom | | | — | | | 19,696,569 | | | — | | | 19,696,569 | |
| | | | | | | | | | | | | |
Total Common Stocks | | | 89,910,385 | | | 359,741,831 | | | — | | | 449,652,216 | |
| | | | | | | | | | | | | |
Preferred Stocks | | | | | | | | | | | | | |
Brazil | | | 15,380,736 | | | — | | | — | | | 15,380,736 | |
South Korea | | | — | | | 8,794,111 | | | — | | | 8,794,111 | |
| | | | | | | | | | | | | |
Total Preferred Stocks | | | 15,380,736 | | | 8,794,111 | | | — | | | 24,174,847 | |
| | | | | | | | | | | | | |
Total | | $ | 105,291,121 | | $ | 368,535,942 | | $ | — | | $ | 473,827,063 | |
| | | | | | | | | | | | | |
84
NOTES TO FINANCIAL STATEMENTS (continued)
Global Alpha Equity Fund
| | | | | | | | | | | | | |
| | Level 1 | | Level 2 | | Level 3 | | Total | |
| | | | | | | | | |
Investments in Securities | | | | | | | | | | | | | |
Common Stocks | | | | | | | | | | | | | |
Argentina | | $ | 1,368,942 | | $ | — | | $ | — | | $ | 1,368,942 | |
Australia | | | — | | | 3,945,315 | | | — | | | 3,945,315 | |
Brazil | | | 4,331,299 | | | — | | | — | | | 4,331,299 | |
Canada | | | 6,746,357 | | | — | | | — | | | 6,746,357 | |
China | | | 4,451,026 | | | 9,276,436 | | | — | | | 13,727,462 | |
Denmark | | | — | | | 4,202,342 | | | — | | | 4,202,342 | |
Germany | | | — | | | 1,931,837 | | | — | | | 1,931,837 | |
Greece | | | 4,075,906 | | | — | | | — | | | 4,075,906 | |
Indonesia | | | — | | | 899,165 | | | — | | | 899,165 | |
Ireland | | | 2,455,511 | | | 899,620 | | | — | | | 3,355,131 | |
Japan | | | — | | | 11,316,720 | | | — | | | 11,316,720 | |
Mexico | | | 2,251,522 | | | — | | | — | | | 2,251,522 | |
Netherlands | | | 2,858,817 | | | — | | | — | | | 2,858,817 | |
Norway | | | — | | | 2,914,795 | | | — | | | 2,914,795 | |
Singapore | | | — | | | 2,443,027 | | | — | | | 2,443,027 | |
South Africa | | | — | | | 8,626,524 | | | — | | | 8,626,524 | |
South Korea | | | — | | | 4,856,666 | | | — | | | 4,856,666 | |
Sweden | | | — | | | 14,016,096 | | | — | | | 14,016,096 | |
Switzerland | | | — | | | 20,120,170 | | | — | | | 20,120,170 | |
Taiwan | | | 3,823,248 | | | — | | | — | | | 3,823,248 | |
Turkey | | | 1,680,697 | | | 2,065,634 | | | — | | | 3,746,331 | |
Turkmenistan | | | 1,317,101 | | | — | | | — | | | 1,317,101 | |
United Kingdom | | | — | | | 28,335,693 | | | — | | | 28,335,693 | |
United States | | | 94,774,851 | | | — | | | — | | | 94,774,851 | |
| | | | | | | | | | | | | |
Total Common Stocks | | | 130,135,277 | | | 115,850,040 | | | — | | | 245,985,317 | |
| | | | | | | | | | | | | |
Preferred Stocks | | | | | | | | | | | | | |
Brazil | | | 4,607,400 | | | — | | | — | | | 4,607,400 | |
| | | | | | | | | | | | | |
Total | | $ | 134,742,677 | | $ | 115,850,040 | | $ | — | | $ | 250,592,717 | |
| | | | | | | | | | | | | |
It is the Trust’s policy to recognize transfers in and transfers out at the fair value as of the beginning of period. The portfolio may hold securities which are periodically fair valued in accordance with the Funds’ fair value procedures. This may result in movements between Levels 1, 2, and 3 throughout the period.
For the International Equity Fund fair value of Level 2 at 12/31/11 was $999,345,962. $7,485,513 was transferred out of Level 2 into Level 1 during the year ended 12/31/12.
For the EAFE Fund fair value of Level 2 investments at 12/31/11 was $1,462,351,446. $786,444 was transferred out of Level 2 into Level 1 during the year ended 12/31/12.
For the EAFE Choice Fund fair value of Level 2 and Level 1 investments at 12/31/11 was $136,828,451 and $13,361,369, respectively. $1,099,706 was transferred out of Level 2 into Level 1 and $2,368,755 was transferred out of Level 1 into Level 2 during the year ended 12/31/12.
85
NOTES TO FINANCIAL STATEMENTS (continued)
For the Emerging Markets Fund fair value of Level 2 investments at 12/31/11 was $277,855,682. $27,459,021 was transferred out of Level 2 into Level 1 during the year ended 12/31/12.
For the Global Alpha Equity Fund fair value of Level 2 and Level 1 investments at 12/31/11 was $51,748,839 and $51,715,811. $1,317,101 was transferred out of Level 2 into Level 1 and $4,856,666 was transferred out of Level 1 into Level 2 during the year ended 12/31/12.
These transfers were all as a result of using third-party vendor modeling tools to reflect any (lack of) significant market movements between the time at which the Funds valued their securities and the earlier closing of foreign markets. With regard to the transfers from Level 1 into Level 2, quotations were still obtained from the Funds’ third party pricing vendor. Pursuant to the Funds’ fair value procedures noted previously, equity securities (including exchange traded securities and open-end regulated investment companies) and exchange traded derivatives (i.e. futures contracts and options) are generally categorized as Level 1 securities in the fair value hierarchy. Fixed income securities, non-exchange traded derivatives and money market instruments are generally categorized as Level 2 securities in the fair value hierarchy. Investments for which there are no such quotations, or for which quotations do not appear reliable, are valued at fair value as determined in accordance with procedures established by and under the supervision of the Trustees. These valuations are typically categorized as Level 2 or Level 3 securities in the fair value hierarchy.
|
Derivative and Hedging Disclosure |
GAAP requires qualitative disclosures about objectives and strategies for using derivatives, quantitative disclosures about fair value amounts of gains and losses on derivative instruments, and disclosures about credit-risk-related contingent features in derivative agreements. The Funds did not utilize derivatives for the year ended December 31, 2012. |
|
Foreign Currency Translation |
The accounting records of the Funds are maintained in U.S. dollars. Foreign currency amounts are translated into U.S. dollars at the applicable rate of exchange to determine the value of investments, assets and liabilities. For the Funds, purchases and sales of securities, and income and expenses are translated at the prevailing rate of exchange on the respective dates of such transactions. The Funds do not isolate that portion of net realized and unrealized gains and losses on investments resulting from changes in foreign exchange rates from the impact arising from changes in market prices. Such fluctuations are included with net realized and unrealized gain or loss from investments. |
Net realized foreign exchange gains and losses arise from sales of foreign currencies, currency gains or losses realized between the trade and settlement dates on securities transactions, and the differences between the amounts of dividends, interest, and foreign withholding taxes recorded on the Funds’ books and the U.S. dollar equivalent of the amounts actually received or paid. Net unrealized foreign exchange gains and losses arise from changes in the value of assets and liabilities, other than investments in securities, resulting from changes in the exchange rates.
|
Forward Foreign Currency Contracts |
The Funds may enter into forward foreign currency contracts in connection with planned purchases or sales of securities, or to hedge against changes in currency exchange rates affecting the values of securities denominated in a particular currency. A forward exchange currency contract is a commitment to purchase or sell a foreign currency at a future date at a negotiated forward rate. Fluctuations in the |
86
NOTES TO FINANCIAL STATEMENTS (continued)
value of forward foreign currency exchange contracts are recorded for book purposes as unrealized gains or losses on foreign currency related transactions by a Fund. When forward contracts are closed, the Funds record realized gains or losses equal to the differences between the values of such forward contracts at the time each was opened and the value at the time each was closed. Such amounts are recorded in net realized gain or loss on foreign currency related transactions.
The Funds’ maximum risk of loss from counterparty credit risk is the net value of the cash flows to be received from the counterparty at the end of the contract’s life. This risk may be mitigated by having a master netting arrangement between the Funds and the counterparty which may permit the Funds to offset amounts payable by the Funds to the same counterparty against amounts to be received; and by the receipt of collateral from the counterparty by the Funds to cover the Funds’ exposure to the counterparty. However, there is no assurance that such mitigating factors are easily enforceable.
The Funds may be party to financial instruments with off-balance-sheet risk, primarily forward contracts, in order to minimize the impact of adverse changes in the relationship between the U.S. dollar and various foreign currencies. These instruments involve market risk in excess of the amount recognized in the Statement of Assets and Liabilities. Risks arise from the possible inability of counter parties to meet the terms of their contracts, future adverse movement in currency values and contract positions that are not exact offsets. The contract amount indicates the extent of the Funds’ involvement in such currencies. At December 31, 2012, the Funds did not have any forward foreign currency contracts.
|
Securities Transactions and Investment Income |
The Funds’ securities transactions are recorded on the trade date. Realized gains or losses on sales of investments are determined on the basis of identified cost. Dividend income is recorded on the ex-dividend date and interest income is recorded on an accrual basis. |
Investment income, expenses (other than those specific to a particular class of shares), and realized and unrealized gains and losses on investments are allocated to the separate classes of shares based upon their relative net asset value on the date income is earned or expensed and realized and unrealized gains and losses are incurred.
|
Federal Taxes |
Each Fund intends to qualify to be taxed as a “regulated investment company” under the provisions of the U.S. Internal Revenue Code of 1986, as amended (the “Code”), and as such will not be subject to U.S. federal income tax on income (including any net realized capital gains) which is distributed in accordance with the provisions of the Code to the Funds’ shareholders. Therefore, no U.S. federal income tax provision is required. |
Investment income received from investments in foreign currencies may be subject to foreign withholding tax. Whenever possible, the Funds will attempt to operate so as to qualify for reduced tax rates or tax exemptions in those countries with which the United States has a tax treaty.
In addition to the requirements of the Code, the Funds may also be subject to capital gains tax in India on gains realized upon sale of Indian securities, payable upon repatriation of sales proceeds. Any realized losses in excess of gains may be carried forward to offset future gains. Funds with exposure to Indian securities accrue a deferred liability for unrealized gains in excess of available carryforwards on
87
NOTES TO FINANCIAL STATEMENTS (continued)
Indian securities based on existing tax rates and holding periods of the securities. As of December 31, 2012, the Emerging Markets Fund recorded a receivable for Indian capital gains tax refund of $238,421 and a deferred liability for potential future India capital gains taxes of $389,081.
The Funds are subject to tax accounting standards that provide guidance for how certain and uncertain tax positions should be recognized, measured, presented and disclosed in the financial statements. These standards require the evaluation of tax positions taken or expected to be taken in the course of preparing the Funds’ tax returns to determine whether the tax positions are “more-likely-than-not” of being sustained by the applicable tax authority. Tax positions not deemed to meet the “more-likely-than-not” threshold would be recorded as a reduction in a tax benefit or expense in the current year. Management has evaluated the application of these standards and has determined no liabilities for income tax related expenses are required in the financial statements of the Funds. For the International Equity Fund, EAFE Fund and Emerging Markets Fund the tax periods 2009 through present remain subject to examination by the Internal Revenue Service. For the EAFE Choice Fund, the tax periods 2010 through present remain subject to examination. For the Global Alpha Equity Fund, the tax periods 2011 through present remain subject to examination. For the International Choice Fund, the present tax period remains subject to examination.
At December 31, 2012, for Federal income tax purposes, the following Funds had capital loss carryforwards available to offset future capital gains through the years indicated. To the extent that these loss carryforwards are utilized, capital gains so offset will not be distributed to shareholders.
| | | | | | | | | | | | | | | | |
Fund | | Capital Loss
Available
Through
2016 | | Capital Loss
Available
Through
2017 | | Capital Loss
Available
Through
2018 | | Capital Loss
No Expiration | | Capital
Loss
Available
Total | |
| | | | | | | | | | | | |
International Equity | | $ | — | | $ | — | | $ | — | | $ | 14,497,529 | | $ | 14,497,529 | |
EAFE | | | 7,597,549 | | | 3,833,395 | | | 10,342,232 | | | 42,086,057 | | | 63,859,233 | |
EAFE Choice | | | — | | | — | | | — | | | 11,482,322 | | | 11,482,322 | |
Emerging Markets | | | — | | | — | | | — | | | 14,611,272 | | | 14,611,272 | |
Global Alpha Equity | | | — | | | — | | | — | | | 516,037 | | | 516,037 | |
The Regulated Investment Company Modernization Act of 2010 eliminated the eight-year carryover period for capital losses that arise in taxable years beginning after its enactment date of December 22, 2010. Consequently, these capital losses can be carried forward for an unlimited period. However, capital losses with an expiration period may not be used to offset capital gains until all net capital losses without an expiration date have been utilized. Additionally, post-enactment capital loss carryovers will retain their character as either short-term or long-term capital losses instead of as short-term capital losses as under prior law. The amounts in the table below are characterized as short-term capital losses and have no expiration.
88
NOTES TO FINANCIAL STATEMENTS (continued)
| | | | |
Fund | | Short-Term
Capital Losses | |
| | | | |
International Equity | | $ | 14,497,529 | |
EAFE | | | 968,931 | |
EAFE Choice | | | 3,582,961 | |
Emerging Markets | | | 14,611,272 | |
Global Alpha Equity | | | 516,037 | |
Realized capital losses, currency losses and passive foreign investment company (“PFIC”) losses incurred after October 31 (“post-October losses/Late-Year Specified”) within the taxable year are deemed to arise on the first business day of each Fund’s next taxable year. During the year ended December 31, 2012, the Funds shown below incurred and will elect to defer net post-October losses as indicated.
At December 31, 2012, the components of accumulated earnings on tax basis were as follows:
| | | | | | | | | | | | | | | | | | | |
Fund | | Undistributed
Net Ordinary
Income | | Late-Year
Specified
Losses | | Capital
Loss
Carryforwards | | Post
October
Capital
Losses | | Net Unrealized
Appreciation on
Investments
and Foreign
Currencies | | Total
Accumulated
Earnings | |
| | | | | | | | | | | | | | |
International Equity | | $ | 3,439,816 | | $ | — | | $ | (14,497,529 | ) | $ | — | | $ | 281,147,976 | | $ | 270,090,263 | |
International Choice | | | 79,854 | | | — | | | — | | | (23,530 | ) | | 690,023 | | | 746,347 | |
EAFE | | | 383,315 | | | — | | | (63,859,233 | ) | | — | | | 413,378,713 | | | 349,902,795 | |
EAFE Choice | | | 439,291 | | | — | | | (11,482,322 | ) | | (1,213,927 | ) | | 16,662,856 | | | 4,405,898 | |
Emerging Markets | | | 6,418,872 | | | (658,817 | ) | | (14,611,272 | ) | | — | | | 75,226,104 | | | 66,374,887 | |
Global Alpha Equity | | | 392,466 | | | — | | | (516,037 | ) | | (1,189,899 | ) | | 28,150,600 | | | 26,837,130 | |
The differences between the components of distributable earnings on a tax basis and the amounts reflected in the Statements of Assets and Liabilities are primarily due to the differing book/tax treatment of realized losses on wash sales and mark to market income on securities categorized as PFICs.
For the year ended December 31, 2012, the following reclassifications have been made on the Statement of Assets and Liabilities as a result of certain differences in the computation of net investment income and net realized capital gains under U.S. federal income tax rules and regulations versus GAAP, such as the treatment of foreign currency gains and losses and the redesignation of dividends:
89
NOTES TO FINANCIAL STATEMENTS (continued)
| | | | | | | | | | |
Fund | | Undistributed
(Distributions
in Excess of)
Net Investment
Income | | Accumulated Net
Realized Gains
(Losses) on
Investments and
Foreign Currency
Transactions | | Paid-in
Capital | |
| | | | | | | | |
International Equity | | $ | (1,079,854 | ) | $ | 16,534,438 | | $ | (15,454,584 | ) |
International Choice | | | 23,768 | | | (23,768 | ) | | — | |
EAFE | | | 369,101 | | | (369,101 | ) | | — | |
EAFE Choice | | | 323,817 | | | (323,817 | ) | | — | |
Emerging Markets | | | 5,417,149 | | | (5,417,149 | ) | | — | |
Global Alpha Equity | | | (5,728 | ) | | 5,728 | | | — | |
Dividends and Distributions to Shareholders
The Funds intend to distribute each year substantially all net investment income and net capital gains realized. All such dividends or distributions are credited in the form of additional shares of the Funds at net asset value on the ex-dividend date unless the shareholder elects to receive dividends and distributions in cash. Currently, the Funds’ policies are to distribute net investment income and net capital gains on an annual basis. Such distributions are determined in conformity with U.S. federal income tax regulations, which may differ from GAAP.
For the years ended December 31, 2012 and December 31, 2011, the tax character of the dividends paid were:
| | | | | | | | | | | | | |
Fund | | Ordinary
Income | | Long-Term
Capital
Gains | |
| | | | | | |
| | 2012 | | 2011 | | 2012 | | 2011 | |
| | | | | | | | | |
International Equity | | $ | 33,512,610 | | $ | 18,258,723 | | $ | — | | $ | 1,021,913 | |
International Choice | | | 30,032 | | | N/A | | | — | | | N/A | |
EAFE | | | 21,301,039 | | | 32,879,327 | | | — | | | — | |
EAFE Choice | | | 5,086,503 | | | 3,327,188 | | | — | | | 2,656,778 | |
Emerging Markets | | | 5,972,731 | | | — | | | — | | | 8,786,194 | |
Global Alpha Equity | | | 3,007,134 | | | 158,199 | | | — | | | — | |
For tax purposes, short-term capital gain distributions, if any, are considered ordinary income distributions.
Note B – Investment Management and Other Services
The Funds are advised and managed by the Manager. The Manager, an investment adviser registered with the Securities & Exchange Commission, is a wholly owned subsidiary of Baillie Gifford & Co.
90
NOTES TO FINANCIAL STATEMENTS (continued)
Under an investment advisory agreement between the Manager and the Trust on behalf of the Funds, each Fund pays the Manager a quarterly management fee, in arrears, at the following annual rate of the respective Fund’s average net assets.
| | | |
Fund | | Management
Fee | |
| | | | |
International Equity* | | 0.25% | |
International Choice | | 0.25% | |
EAFE | | 0.25% | |
EAFE Choice | | 0.25% | |
Emerging Markets | | 0.50% | |
Global Alpha Equity | | 0.30% | |
*The management fee figure for the International Equity Fund shown in the table reflects a reduction in the annual management fee from 0.30% to 0.25% of the Fund’s average net assets that took effect on July 1, 2012. During the period from January 1, 2012 through June 30, 2012, the contractual management fee remained 0.30% per annum of the Fund’s average net assets, but the Manager voluntarily waived a portion of that contractual fee such that the Fund paid an annual management fee equal to 0.25% of its average net assets.
For the year ended December 31, 2012, the Funds incurred gross management fees and had management fees waived/expenses reimbursed as follows:
| | | | | | | |
Fund | | Management
Fee | | Management Fee
Waiver/Expenses
Reimbursed | |
| | | | | | |
International Equity | | $ | 5,081,253 | | $ | 409,097 | |
International Choice* | | | 14,679 | | | 34,050 | |
EAFE | | | 4,689,805 | | | — | |
EAFE Choice | | | 433,422 | | | — | |
Emerging Markets | | | 2,123,525 | | | — | |
Global Alpha Equity | | | 499,355 | | | — | |
*Effective September 25, 2012, the Manager has contractually agreed to waive its fees and/or bear other expenses through April 30, 2013 to the extent that such Fund’s total annual operating expenses (excluding interest, taxes and extraordinary expenses) exceed 0.85%.
Each Fund has adopted a Shareholder Servicing Plan providing that the Fund may pay the Manager, or any other entity that acts from time to time as the shareholder servicing agent with respect to a class of Fund shares, for services rendered and expenses borne in connection with the provision of services provided to Fund investors and/or the maintenance of shareholder accounts. For these services, the Funds pay the Manager a fee at the annualized rate of the Funds’ average daily net assets attributed to each class of share as follows:
91
NOTES TO FINANCIAL STATEMENTS (continued)
| | | | | | | | | | | | | | | | | | | |
| | International
Equity | | International
Choice | | EAFE* | | EAFE
Choice** | | Emerging
Markets*** | | Global Alpha
Equity**** | |
| | | | | | | | | | | | | |
Class 1/I | | | 0.45 | % | | 0.45 | % | | 0.45 | % | | 0.45 | % | | 0.30 | % | | 0.45 | % |
Class 2/II | | | 0.27 | % | | 0.27 | % | | 0.27 | % | | 0.27 | % | | 0.25 | % | | 0.27 | % |
Class 3/III | | | 0.20 | % | | 0.20 | % | | 0.20 | % | | 0.20 | % | | 0.10 | % | | 0.20 | % |
Class 4 | | | 0.17 | % | | 0.17 | % | | 0.17 | % | | 0.17 | % | | N/A | | | 0.17 | % |
Class 5 | | | 0.12 | % | | 0.12 | % | | 0.12 | % | | 0.12 | % | | N/A | | | 0.12 | % |
| |
* | EAFE Fund Class 4 was redeemed on July 18, 2012. |
** | EAFE Choice Fund Class 4 was redeemed on January 23, 2012. |
*** | Emerging Markets Fund Class II was redeemed on April 19, 2012. |
**** | Global Alpha Equity Fund Class 2 was redeemed on October 8, 2012. |
For the year ended December 31, 2012, the Funds incurred shareholder servicing fees for each class of share as follows:
| | | | | | | | | | | | | | | | | | | |
| | International
Equity | | International
Choice | | EAFE* | | EAFE
Choice** | | Emerging
Markets*** | | Global Alpha
Equity**** | |
| | | | | | | | | | | | | |
Class 1/I | | $ | 351,213 | | $ | 26,422 | | $ | 178,666 | | | N/A | | | N/A | | $ | 62,185 | |
Class 2/II | | | 2,102,796 | | | N/A | | | 2,235,286 | | $ | 370,632 | | $ | 30,487 | | | 51,402 | |
Class 3/III | | | 1,218,787 | | | N/A | | | 910,321 | | | 60,997 | | | 407,870 | | | 278,418 | |
Class 4 | | | 557,959 | | | N/A | | | 476,191 | | | 4,258 | | | N/A | | | N/A | |
Class 5 | | | N/A | | | N/A | | | 313,866 | | | N/A | | | N/A | | | N/A | |
| |
* | EAFE Fund Class 4 was redeemed on July 18, 2012. |
** | EAFE Choice Fund Class 4 was redeemed on January 23, 2012. |
*** | Emerging Markets Fund Class II was redeemed on April 19, 2012. |
**** | Global Alpha Equity Fund Class 2 was redeemed on October 8, 2012. |
Note C – Investment Transactions
Purchases and proceeds from sales of securities (excluding in-kind purchases and redemptions and short-term securities) for the year ended December 31, 2012 were as follows:
| | | | | | | |
Fund | | Purchases | | Sales | |
| | | | | | |
International Equity | | $ | 777,459,967 | | $ | 236,799,039 | |
International Choice | | | 23,443,661 | | | 493,467 | |
EAFE | | | 392,778,879 | | | 340,156,074 | |
EAFE Choice | | | 35,718,645 | | | 34,956,241 | |
Emerging Markets | | | 272,035,984 | | | 211,640,825 | |
Global Alpha Equity | | | 54,380,923 | | | 25,093,336 | |
For the year ended December 31, 2012, the cost of in-kind purchases and the proceeds from in-kind redemptions were as follows:
92
NOTES TO FINANCIAL STATEMENTS (continued)
| | | | | | | |
Fund | | Purchases | | Sales | |
| | | | | | |
International Equity | | $ | 85,691,663 | | $ | 84,171,470 | |
International Choice | | | — | | | — | |
EAFE | | | 68,155,460 | | | — | |
EAFE Choice | | | — | | | — | |
Emerging Markets | | | — | | | — | |
Global Alpha Equity | | | 89,391,772 | | | — | |
Gains and losses on in-kind redemptions are not recognized at the Fund level for tax purposes. For the International Equity Fund, $15,344,227 in realized losses is related to the $84,171,470 of sales proceeds from redemption in-kind transactions.
The Funds’ cost of investments and gross unrealized appreciation (depreciation) at December 31, 2012 for U.S. federal income tax purposes were as follows:
| | | | | | | | | | | | | |
Fund | | Cost of
Investments | | Gross
Appreciation | | Gross
Depreciation | | Net
Appreciation
(Depreciation) | |
| | | | | | | | | | |
| | | | | | | | | | | | | |
International Equity | | $ | 1,813,622,242 | | $ | 361,952,156 | | $ | (81,140,467 | ) | $ | 280,811,689 | |
International Choice | | | 22,999,553 | | | 1,303,290 | | | (611,997 | ) | | 691,293 | |
EAFE | | | 1,662,945,902 | | | 547,982,693 | | | (134,610,943 | ) | | 413,371,750 | |
EAFE Choice | | | 164,291,584 | | | 25,981,367 | | | (9,322,834 | ) | | 16,658,533 | |
Emerging Markets | | | 398,198,929 | | | 96,724,600 | | | (21,096,466 | ) | | 75,628,134 | |
Global Alpha Equity | | | 222,447,759 | | | 34,057,801 | | | (5,912,843 | ) | | 28,144,958 | |
Note D – Transactions in Shares of Beneficial Interest
| | | | | | | | | | | | | |
| | International Equity Fund | |
| | Class 1 Shares
For the
Year Ended
December 31, 2012 | | Class 2 Shares
For the
Year Ended
December 31, 2012 | |
| | | | | |
| | Shares | | Amount | | Shares | | Amount | |
| | | | | | | | | |
| | | | | | | | | | | | | |
Shares sold | | | 6,237,448 | | $ | 57,372,832 | | | 32,047,741 | | $ | 310,822,024 | |
Redemption fees | | | — | | | 6,852 | | | — | | | 59,689 | |
Purchase premiums | | | — | | | 79,717 | | | — | | | 652,621 | |
Shares issued in reinvestment of dividends and distributions | | | 60,511 | | | 621,138 | | | 1,041,817 | | | 10,667,156 | |
Shares redeemed | | | (7,740,481 | ) | | (72,816,528 | ) | | (63,787,178 | ) | | (615,053,580 | ) |
| | | | | | | | | | | | | |
Net decrease | | | (1,442,522 | ) | $ | (14,735,989 | ) | | (30,697,620 | ) | $ | (292,852,090 | ) |
| | | | | | | | | | | | | |
93
NOTES TO FINANCIAL STATEMENTS (continued)
| | | | | | | | | | | | | |
| | International Equity Fund | |
| | Class 3 Shares
For the
Year Ended
December 31, 2012 | | Class 4 Shares
For the
Year Ended
December 31, 2012 | |
| | | | | |
| | Shares | | Amount | | Shares | | Amount | |
| | | | | | | | | |
|
Shares sold | | | 71,453,072 | | $ | 691,940,811 | | | 46,724,347 | | $ | 458,126,968 | |
Redemption fees | | | — | | | 41,412 | | | — | | | 21,095 | |
Purchase premiums | | | — | | | 386,643 | | | — | | | 197,554 | |
Shares issued in reinvestment of dividends and distributions | | | 1,318,383 | | | 13,666,431 | | | 785,893 | | | 8,324,082 | |
Shares redeemed | | | (32,872,204 | ) | | (302,097,134 | ) | | (1,099,140 | ) | | (11,067,960 | ) |
| | | | | | | | | | | | | |
Net increase | | | 39,899,251 | | $ | 403,938,163 | | | 46,411,100 | | $ | 455,601,739 | |
| | | | | | | | | | | | | |
| | | | | | | | | | | | | |
| | International Equity Fund | |
| | Class 1 Shares
For the
Year Ended
December 31, 2011 | | Class 2 Shares
For the
Year Ended
December 31, 2011 | |
| | | | | |
| | Shares | | Amount | | Shares | | Amount | |
| | | | | | | | | |
| | | | | | | | | | | | | |
Shares sold | | | 317,744 | | $ | 3,193,600 | | | 60,511,350 | | $ | 569,743,090 | |
Redemption fees | | | — | | | 661 | | | — | | | 5,972 | |
Purchase premiums | | | — | | | 92,442 | | | — | | | 770,898 | |
Shares issued in reinvestment of dividends and distributions | | | 76,588 | | | 660,671 | | | 1,449,533 | | | 12,473,665 | |
Shares redeemed | | | (265,138 | ) | | (2,503,755 | ) | | (10,570,958 | ) | | (107,151,339 | ) |
| | | | | | | | | | | | | |
Net increase | | | 129,194 | | $ | 1,443,619 | | | 51,389,925 | | $ | 475,842,286 | |
| | | | | | | | | | | | | |
| | | | | | | | | | | | | |
| | International Equity Fund | |
| | Class 3 Shares
For the
Year Ended
December 31, 2011 | | Class 4 Shares
For the
Year Ended
December 31, 2011 | |
| | | | | |
| | Shares | | Amount | | Shares | | Amount | |
| | | | | | | | | |
|
Shares sold | | | 26,104,755 | | $ | 264,227,433 | | | — | | $ | — | |
Redemption fees | | | — | | | 3,008 | | | — | | | 187 | |
Purchase premiums | | | — | | | 413,391 | | | — | | | 26,649 | |
Shares issued in reinvestment of dividends and distributions | | | 654,236 | | | 5,696,497 | | | 29,598 | | | 263,288 | |
Shares redeemed | | | — | | | — | | | (159,296 | ) | | (1,444,465 | ) |
| | | | | | | | | | | | | |
Net increase (decrease) | | | 26,758,991 | | $ | 270,340,329 | | | (129,698 | ) | $ | (1,154,341 | ) |
| | | | | | | | | | | | | |
94
NOTES TO FINANCIAL STATEMENTS (continued)
| | | | | | | |
| | International Choice Fund
Class 1 Shares
For the Period
September 24, 2012*
through
December 31, 2012 | |
| | | |
| | Shares | | Amount | |
| | | | | |
|
Shares sold | | | 2,400,632 | | $ | 23,986,930 | |
Purchase premiums | | | — | | | 48,070 | |
Shares issued in reinvestment of dividends | | | 2,939 | | | 30,032 | |
| | | | | | | |
Net increase | | | 2,403,571 | | $ | 24,065,032 | |
| | | | | | | |
*Commencement of investment operations.
| | | | | | | | | | | | | |
| | EAFE Fund | |
| | Class 1 Shares
For the
Year Ended
December 31, 2012 | | Class 2 Shares
For the
Year Ended
December 31, 2012 | |
| | | | | |
| | Shares | | Amount | | Shares | | Amount | |
| | | | | | | | | |
|
Shares sold | | | 2,316,280 | | $ | 20,956,314 | | | 17,391,014 | | $ | 161,201,621 | |
Redemption fees | | | — | | | 1,742 | | | — | | | 36,183 | |
Purchase premiums | | | — | | | 3,667 | | | — | | | 75,854 | |
Shares issued in reinvestment of dividends and distributions | | | 35,425 | | | 346,140 | | | 854,869 | | | 8,327,874 | |
Shares redeemed | | | (269,143 | ) | | (2,503,756 | ) | | (4,669,419 | ) | | (42,719,584 | ) |
| | | | | | | | | | | | | |
Net increase | | | 2,082,562 | | $ | 18,804,107 | | | 13,576,464 | | $ | 126,921,948 | |
| | | | | | | | | | | | | |
| | | | | | | | | | | | | |
| | EAFE Fund | |
| | Class 3 Shares
For the
Year Ended
December 31, 2012 | | Class 4 Shares
For the Period
January 1, 2012
through
July 18, 2012* | |
| | | | | |
| | Shares | | Amount | | Shares | | Amount | |
| | | | | | | | | |
|
Shares sold | | | 784,074 | | $ | 7,485,000 | | | 5,853,166 | | $ | 49,900,000 | |
Redemption fees | | | — | | | 19,378 | | | — | | | 4,000 | |
Purchase premiums | | | — | | | 40,423 | | | — | | | 35,418 | |
Shares issued in reinvestment of dividends and distributions | | | 419,985 | | | 4,098,931 | | | — | | | — | |
Shares redeemed | | | (11,276,683 | ) | | (102,190,959 | ) | | (61,504,009 | ) | | (532,921,389 | ) |
| | | | | | | | | | | | | |
Net decrease | | | (10,072,624 | ) | $ | (90,547,227 | ) | | (55,650,843 | ) | $ | (482,981,971 | ) |
| | | | | | | | | | | | | |
*EAFE Fund Class 4 was redeemed on July 18, 2012.
95
NOTES TO FINANCIAL STATEMENTS (continued)
| | | | | | | |
| | EAFE Fund
Class 5 Shares
For the Period
July 18, 2012*
through
December 31, 2012 | |
| | | |
| | Shares | | Amount | |
| | | | | |
Shares sold | | | 61,467,121 | | $ | 532,921,389 | |
Redemption fees | | | — | | | 20,052 | |
Purchase premiums | | | — | | | 15,109 | |
Shares issued in reinvestment of dividends and distributions | | | 698,065 | | | 6,828,751 | |
| | | | | | | |
Net increase | | | 62,165,186 | | $ | 539,785,301 | |
| | | | | | | |
*Commencement of investment operations.
| | | | | | | | | | | | | |
| | EAFE Fund | |
| | Class 1 Shares
For the
Year Ended
December 31, 2011 | | Class 2 Shares
For the
Year Ended
December 31, 2011 | |
| | | | | |
| | Shares | | Amount | | Shares | | Amount | |
| | | | | | | | | |
| | | | | | | | | | | | | |
Shares sold | | | — | | $ | — | | | 8,255,508 | | $ | 80,411,056 | |
| | | | | | | | | | | | | |
Redemption fees | | | — | | | 721 | | | — | | | 25,164 | |
| | | | | | | | | | | | | |
Purchase premiums | | | — | | | 9,732 | | | — | | | 340,633 | |
Shares issued in reinvestment of dividends and distributions | | | 41,193 | | | 346,240 | | | 1,416,156 | | | 11,867,864 | |
| | | | | | | | | | | | | |
Shares redeemed | | | — | | | — | | | (23,632,453 | ) | | (234,455,958 | ) |
| | | | | | | | | | | | | |
Net increase (decrease) | | | 41,193 | | $ | 356,693 | | | (13,960,789 | ) | $ | (141,811,241 | ) |
| | | | | | | | | | | | | |
96
NOTES TO FINANCIAL STATEMENTS (continued)
| | | | | | | | | | | | | |
| | EAFE Fund | |
| | Class 3 Shares
For the
Year Ended
December 31, 2011 | | Class 4 Shares
For the
Year Ended
December 31, 2011 | |
| | | | | |
| | Shares | | Amount | | Shares | | Amount | |
| | | | | | | | | |
|
Shares sold | | | 45,553,346 | | $ | 455,761,252 | | | 5,563,608 | | $ | 49,900,000 | |
Redemption fees | | | — | | | 14,429 | | | — | | | 15,257 | |
Purchase premiums | | | — | | | 198,341 | | | — | | | 210,125 | |
Shares issued in reinvestment of dividends and distributions | | | 999,123 | | | 8,388,124 | | | 1,120,783 | | | 9,427,671 | |
Shares redeemed | | | (1,211,109 | ) | | (10,015,023 | ) | | — | | | — | |
| | | | | | | | | | | | | |
Net increase | | | 45,341,360 | | $ | 454,347,123 | | | 6,684,391 | | $ | 59,553,053 | |
| | | | | | | | | | | | | |
| | | | | | | | | | | | | |
| | EAFE Choice Fund | |
| | Class 2 Shares | | Class 3 Shares | |
| | For the
Year Ended
December 31, 2012 | | For the Period
January 23, 2012*
through
December 31, 2012 | |
| | | | | |
| | Shares | | Amount | | Shares | | Amount | |
| | | | | | | | | |
|
Shares sold | | | 1,535,934 | | $ | 16,067,800 | | | 4,181,134 | | $ | 42,471,000 | |
Redemption fees | | | — | | | 26,712 | | | — | | | 5,436 | |
Purchase premiums | | | — | | | 26,992 | | | — | | | 7,208 | |
Shares issued in reinvestment of dividends and distributions | | | 389,332 | | | 4,309,208 | | | 70,018 | | | 777,295 | |
Shares redeemed | | | (169,016 | ) | | (1,902,854 | ) | | (1,795,696 | ) | | (19,529,294 | ) |
| | | | | | | | | | | | | |
Net increase | | | 1,756,250 | | $ | 18,527,858 | | | 2,455,456 | | $ | 23,731,645 | |
| | | | | | | | | | | | | |
*Commencement of investment operations.
| | | | | | | | | | | | | |
| | EAFE Choice Fund | | | | | | | |
| | Class 4 Shares | | | | | | | |
| | For the Period
January 1, 2012
through
January 23, 2012* | | | | | | | |
| | | | | | | | | |
| | Shares | | Amount | | | | | | | |
| | | | | | | | | | | |
Shares redeemed | | | (4,032,673 | ) | $ | (41,473,001 | ) | | | | | | |
| | | | | | | | | | | | | |
Net decrease | | | (4,032,673 | ) | $ | (41,473,001 | ) | | | | | | |
| | | | | | | | | | | | | |
*EAFE Choice Fund Class 4 was redeemed on January 23, 2012.
97
NOTES TO FINANCIAL STATEMENTS (continued)
| | | | | | | | | | | | | |
| | EAFE Choice Fund | |
| | Class 2 Shares
For the
Year Ended
December 31, 2011 | | Class 3 Shares
For the Period
January 1, 2011
through
April 18, 2011* | |
| | | | | |
| | Shares | | Amount | | Shares | | Amount | |
| | | | | | | | | |
|
Shares sold | | | 7,863,808 | | $ | 94,603,761 | | | 1,123,961 | | $ | 12,974,210 | |
Redemption fees | | | — | | | 46,700 | | | — | | | 2,949 | |
Purchase premiums | | | — | | | 112,132 | | | — | | | 15,513 | |
Shares issued in reinvestment of dividends and distributions | | | 472,068 | | | 4,466,333 | | | — | | | — | |
Shares redeemed | | | (282,044 | ) | | (3,204,807 | ) | | (6,019,552 | ) | | (70,172,331 | ) |
| | | | | | | | | | | | | |
Net increase (decrease) | | | 8,053,832 | | $ | 96,024,119 | | | (4,895,591 | ) | $ | (57,179,659 | ) |
| | | | | | | | | | | | | |
*EAFE Choice Fund Class 3 was redeemed on April 18, 2011.
| | | | | | | | | | | | | |
| | EAFE Choice Fund | | | | | | | |
| | Class 4 Shares | | | | | | | |
| | For the Period
April 18, 2011*
through
December 31, 2011 | | | | | | | |
| | | | | | | | | |
| | Shares | | Amount | | | | | | | |
| | | | | | | | | | | |
|
Shares sold | | | 7,485,386 | | $ | 85,142,331 | | | | | | | |
Redemption fees | | | — | | | 14,196 | | | | | | | |
Purchase premiums | | | — | | | 48,523 | | | | | | | |
Shares issued in reinvestment of dividends and distributions | | | 157,773 | | | 1,517,633 | | | | | | | |
Shares redeemed | | | (3,610,486 | ) | | (39,359,248 | ) | | | | | | |
| | | | | | | | | | | | | |
Net increase | | | 4,032,673 | | $ | 47,363,435 | | | | | | | |
| | | | | | | | | | | | | |
*Commencement of investment operations.
98
NOTES TO FINANCIAL STATEMENTS (continued)
| | | | | | | | | | | | | |
| | Emerging Markets Fund | |
| | Class II Shares
For the Period
January 23, 2012*
through
April 19, 2012** | | Class III Shares
For the
Year Ended
December 31, 2012 | |
| | | | | |
| | Shares | | Amount | | Shares | | Amount | |
| | | | | | | | | |
|
Shares sold | | | 2,974,300 | | $ | 47,197,419 | | | 8,818,329 | | $ | 144,762,741 | |
Redemption fees | | | — | | | — | | | — | | | 77,647 | |
Purchase premiums | | | — | | | 12,799 | | | — | | | 512,451 | |
Shares issued in reinvestment of dividends and distributions | | | — | | | — | | | 379,183 | | | 5,972,731 | |
Shares redeemed | | | (2,974,300 | ) | | (49,787,991 | ) | | (4,884,951 | ) | | (78,256,316 | ) |
| | | | | | | | | | | | | |
Net increase (decrease) | | | — | | $ | (2,577,773 | ) | | 4,312,561 | | $ | 73,069,254 | |
| | | | | | | | | | | | | |
*Commencement of investment operations.
** Emerging Markets Fund Class II was redeemed on April 19, 2012.
| | | | | | | | | | | | | |
| | Emerging Markets Fund | | | | | | | |
| | Class III Shares
For the
Year Ended
December 31, 2011 | | | | | | | |
| | | | | | | | | |
| | Shares | | Amount | | | | | | | |
| | | | | | | | | | | |
|
Shares sold | | | 296,721 | | $ | 4,972,500 | | | | | | | |
Redemption fees | | | — | | | 11,027 | | | | | | | |
Purchase premiums | | | — | | | 27,500 | | | | | | | |
Shares issued in reinvestment of dividends and distributions | | | 573,613 | | | 8,786,194 | | | | | | | |
| | | | | | | | | | | | | |
Shares redeemed | | | (337,810 | ) | | (4,411,028 | ) | | | | | | |
| | | | | | | | | | | | | |
Net increase | | | 532,524 | | $ | 9,386,193 | | | | | | | |
| | | | | | | | | | | | | |
99
NOTES TO FINANCIAL STATEMENTS (continued)
| | | | | | | | | | | | | |
| | Global Alpha Equity Fund | |
| | Class 1 Shares
For the Period
May 3, 2012*
through
December 31, 2012 | | Class 2 Shares
For the Period
July 31, 2012*
through
October 8, 2012** | |
| | | | | |
| | Shares | | Amount | | Shares | | Amount | |
| | | | | | | | | |
|
Shares sold | | | 2,025,187 | | $ | 21,556,800 | | | 9,294,664 | | $ | 96,384,748 | |
Purchase premiums | | | — | | | 9,241 | | | — | | | 15,959 | |
Shares issued in reinvestment of dividends and distributions | | | 20,585 | | | 226,914 | | | — | | | — | |
Shares redeemed | | | — | | | — | | | (9,294,664 | ) | | (104,146,842 | ) |
| | | | | | | | | |
Net increase (decrease) | | | 2,045,772 | | $ | 21,792,955 | | | — | | $ | (7,746,135 | ) |
| | | | | | | | | |
*Commencement of investment operations.
**Global Alpha Equity Fund Class 2 was redeemed on October 8, 2012.
| | | | | | | | | | | | | |
| | Global Alpha Equity Fund | | | | | | | |
| | Class 3 Shares
For the
Year Ended
December 31, 2012 | | | | | | | |
| | | | | | | | | |
| | Shares | | Amount | | | | | | | |
| | | | | | | | | | | |
|
Shares sold | | | 9,131,191 | | $ | 104,146,842 | | | | | | | |
Purchase premiums | | | — | | | 53,768 | | | | | | | |
Shares issued in reinvestment of dividends | | | 243,680 | | | 2,780,220 | | | | | | | |
| | | | | | | | | | | | | |
Net increase | | | 9,374,871 | | $ | 106,980,830 | | | | | | | |
| | | | | | | | | | | | | |
| | | | | | | | | | | | | |
| | Global Alpha Equity Fund | | | | | | | |
| | Class 3 Shares
For the Period
November 15, 2011*
through
December 31, 2011 | | | | | | | |
| | | | | | | | | |
| | Shares | | Amount | | | | | | | |
| | | | | | | | | | | |
|
Shares sold | | | 10,599,613 | | $ | 105,996,135 | | | | | | | |
Shares issued in reinvestment of dividends and distributions | | | 16,056 | | | 158,199 | | | | | | | |
| | | | | | | | | | | | | |
Net increase | | | 10,615,669 | | $ | 106,154,334 | | | | | | | |
| | | | | | | | | | | | | |
*Commencement of investment operations.
100
NOTES TO FINANCIAL STATEMENTS (continued)
Funds charge purchase premiums and redemption fees as follows:
| | | | | | | |
Fund | | Purchase Premium | | Redemption Fee | |
| | | | | | |
| | (Basis Point) | | (Basis Point) | |
| | | | | |
International Equity | | | 20 | | | 15 | |
International Choice | | | 20 | | | 15 | |
EAFE | | | 20 | | | 15 | |
EAFE Choice | | | 20 | | | 15 | |
Emerging Markets | | | 55 | | | 25 | |
Global Alpha Equity | | | 20 | | | 15 | |
The purchase premiums and redemption fees may be waived or reduced by the Manager if the brokerage and transaction costs in connection with the purchase or redemption are minimal or in other circumstances in the Manager’s discretion.
Note E – Beneficial Ownership
The beneficial ownership, either directly or indirectly, of more than 25% of the voting securities of a Fund creates a presumption of control under Section 2(a)(9) of the 1940 Act. As of December 31, 2012, Kentucky Teachers’ Retirement System owned 29.53% of the EAFE Fund; Graphic Packaging Holdings Company owned 30.46% and the Municipal Fire & Police Retirement System of Iowa owned 48.93% of the EAFE Choice Fund; Nebraska State Investment Council owned 41.48% of the Emerging Markets Fund; Freeport McMoran Corporation Defined Benefit Master Trust owned 48.92% and ProMedica Health System Trust owned 42.08% of the Global Alpha Equity Fund and Daughters of Charity Health System owned 100% of the International Choice Fund. Purchase and redemption activity of these accounts may have a significant effect on the operation of each of the Funds.
Note F – Commitments and Contingencies
Each of the Funds indemnifies the Trust’s officers and Trustees for certain liabilities that might arise from the performance of their duties to the Fund. Additionally, in the normal course of business, each Fund enters into contracts that contain a variety of representations and warranties and which provide general indemnifications. The Funds’ maximum exposure under these arrangements is unknown, as this would involve future claims that may be made against the Funds that have not yet occurred. However, based on experience, the Funds expect the risk of loss to be remote.
Note G – New Accounting Pronouncements
In December 2011, the Financial Accounting Standards Board (“FASB”) issued ASU No. 2011-11 regarding “Disclosures about Offsetting Assets and Liabilities.” The amendments, which will be effective for annual reporting periods beginning on or after January 1, 2013 and interim periods within those annual periods, require an entity to disclose information about offsetting and related arrangements for assets and liabilities, financial instruments and derivatives that are either currently offset in accordance with current requirements or are subject to enforceable master netting arrangements or similar agreements. At this time, management is evaluating the implications of ASU No. 2011-11 and its impact on the financial statements has not yet been determined.
101
NOTES TO FINANCIAL STATEMENTS (concluded)
Note H – Subsequent Events
Events or transactions that occur after the financial statement date but before the financial statements are issued are categorized as recognized or non-recognized for financial statement purposes. Management of the Funds has evaluated subsequent events and has determined there were no events that required recognition or disclosure in the Funds’ financial statements.
102
REPORT OF INDEPENDENT REGISTERED PUBLIC ACCOUNTING FIRM
To the Board of Trustees of Baillie Gifford Funds
and Shareholders of Baillie Gifford International Equity Fund,
Baillie Gifford International Choice Fund, Baillie Gifford EAFE Fund,
Baillie Gifford EAFE Choice Fund, Baillie Gifford Emerging Markets Fund
and Baillie Gifford Global Alpha Equity Fund
We have audited the accompanying statements of assets and liabilities of Baillie Gifford International Equity Fund, Baillie Gifford International Choice Fund, Baillie Gifford EAFE Fund, Baillie Gifford EAFE Choice Fund, Baillie Gifford Emerging Markets Fund and Baillie Gifford Global Alpha Equity Fund, each a series of shares of beneficial interest of Baillie Gifford Funds, including the portfolios of investments, as of December 31, 2012, and the related statements of operations for the year and period then ended and the statements of changes in net assets for each of the years and periods presented in the two-year period then ended and the financial highlights for each of the years and periods presented in the five-year period then ended. These financial statements and financial highlights are the responsibility of the Funds’ management. Our responsibility is to express an opinion on these financial statements and financial highlights based on our audits.
We conducted our audits in accordance with the standards of the Public Company Accounting Oversight Board (United States). Those standards require that we plan and perform the audits to obtain reasonable assurance about whether the financial statements and financial highlights are free of material misstatement. An audit includes examining, on a test basis, evidence supporting the amounts and disclosures in the financial statements. Our procedures included confirmation of securities owned as of December 31, 2012 by correspondence with the custodian and brokers. An audit also includes assessing the accounting principles used and significant estimates made by management, as well as evaluating the overall financial statement presentation. We believe that our audits provide a reasonable basis for our opinion.
In our opinion, the financial statements and financial highlights referred to above present fairly, in all material respects, the financial position of Baillie Gifford International Equity Fund, Baillie Gifford International Choice Fund, Baillie Gifford EAFE Fund, Baillie Gifford EAFE Choice Fund, Baillie Gifford Emerging Markets Fund and Baillie Gifford Global Alpha Equity Fund as of December 31, 2012, the results of their operations for the year and period then ended, the changes in their net assets for each of the years and periods presented in the two-year period then ended, and their financial highlights for each of the years and periods presented in the five-year period then ended, in conformity with accounting principles generally accepted in the United States of America.
| | |
| 
| |
| BBD, LLP | |
Philadelphia, Pennsylvania
February 28, 2013
103
Supplemental Information (unaudited)
SHAREHOLDER MEETING RESULTS
The Trust held a special meeting of shareholders on behalf of Emerging Markets Fund, International Equity Fund, EAFE Fund, EAFE Choice Fund, and Global Alpha Equity Fund on October 31, 2012. The shareholders of the funds voted on the following proposal:
Approval of an amendment to the advisory agreement between the Trust, on behalf of each fund, and the Manager, to change the manner in which the management fee is calculated.
The amendment changes the method of calculating each fund’s management fee from a percentage of the net asset values of each fund at the end of each month to a percentage of average daily net asset values of each fund.
The funds’ shareholders voted as indicated below:
| | | | | | | | | | | | |
Fund | | Votes For | | Votes
Against | | Abstentions | | Percentage of
Total Shares
Voting in
Favor | | Percentage of
Shares Present
Voting in
Favor | |
| | | | | | | | | | | | |
Emerging Markets | | | 22,807,516.915 | | None | | None | | 87.07% | | 100.00% | |
International Equity | | | 120,477,828.353 | | None | | None | | 60.79% | | 100.00% | |
EAFE | | | 160,954,748.238 | | None | | None | | 76.18% | | 100.00% | |
EAFE Choice | | | 10,189,783.944 | | None | | None | | 64.15% | | 100.00% | |
Global Alpha Equity | | | 19,910,333.411 | | None | | None | | 90.76% | | 100.00% | |
104
Supplemental Information (unaudited) (continued)
FEDERAL INCOME TAX INFORMATION
Qualified dividend income was taxable to the Funds listed in the table below through December 31, 2012. The Funds intend to designate the maximum amount of dividends that qualify for the reduced tax rate pursuant to the Jobs and Growth Tax Relief Reconciliation Act of 2003.
| | | | |
Fund | | Qualified
Dividend Income | |
| | | | |
International Equity | | $ | 41,022,309 | |
International Choice | | | 65,591 | |
EAFE | | | 33,985,861 | |
EAFE Choice | | | 4,893,787 | |
Emerging Markets | | | 4,703,285 | |
Global Alpha Equity | | | 3,459,029 | |
For corporate shareholders, the percentage of ordinary income distributions for the year ended December 31, 2012 qualified for the corporate dividends-received deduction for each Fund is:
| | | | |
Fund | | Dividends-received
Deductions | |
| | | | |
International Equity | | | 4.11 | % |
International Choice | | | 1.30 | % |
EAFE | | | 0.00 | % |
EAFE Choice | | | 0.79 | % |
Emerging Markets | | | 0.00 | % |
Global Alpha Equity | | | 34.99 | % |
In January 2013, you will be advised on IRS Form 1099 DIV or substitute 1099 DIV as to the U.S. federal tax status of distributions received by you in the calendar year 2012.
105
Supplemental Information (unaudited) (continued)
MANAGEMENT OF THE TRUST
The following tables set forth the Trustees and Officers of the Trust, their principal occupations during the past five years, and certain other information.
| | | | | | | | |
Name and Age(1) | | Position(s)
Held with
Trust | | Length of
Time
Served(2) | | Principal Occupation During Past 5 Years(3) | | Number of Funds in
Fund complex
overseen by
Trustee(4) |
| | | | | | | | | |
Trustees | | | | | | | | |
John G. Barrie, Jr.
Age: 72 | | Trustee | | Since 2000 | | Retired. Formerly: Assistant Treasurer, Dominion Resources, Inc. (electric and gas utility). | | 7 |
| | | | | | | | |
George W. Browning
Age: 70 | | Trustee | | Since 2007 | | Retired. Formerly: Managing Director, Client Service, Babson Capital Management, LLC (investment manager). | | 7 |
Bruce C. Long
Age: 67 | | Trustee | | Since 2009 | | CEO of K STREAM LLC (financial services); Consultant, Carpenter Group (financial services); Consultant, DALBAR, Inc., (financial measurements). Formerly: Executive Vice President, Guardian Life Insurance (financial services) and director of various entities. | | 7 |
Interested Trustee |
Peter Hadden(5)
Age: 55 | | Trustee,
Chairman of the
Board and
President | | Since 2009 | | Partner, Baillie Gifford & Co. (investment manager); Director, Baillie Gifford Overseas Ltd. (investment adviser). | | 7 |
Officers (other than Officers who are also Trustees) |
Dickson Jackson
Age: 41 | | Vice President | | Since 2005 | | Director, Investment Operations, Baillie Gifford & Co. (investment manager); Director, Baillie Gifford Overseas Limited (investment adviser). | | N/A |
Andrew Telfer
Age: 45 | | Vice President | | Since 2008 | | Partner, Baillie Gifford & Co. (investment manager); Director, Baillie Gifford Overseas Limited (investment adviser). | | N/A |
Peter Cooke
Age: 48 | | Vice President | | Since 2008 | | Partner, Baillie Gifford & Co. (investment manager). | | N/A |
Michael Stirling-Aird
Age: 35 | | Vice President | | Since 2012 | | Client Service Director, Baillie Gifford Overseas Limited (investment adviser). | | N/A |
Julie Wilson
Age: 37 | | Vice President | | Since 2012 | | Assistant Manager, Overseas Institutional Clients Accounting Department, Baillie Gifford & Co. (investment adviser). | | N/A |
Nigel Cessford
Age: 49 | | Treasurer | | Since 2005 | | Head of Overseas Institutional Clients Accounting Department, Baillie Gifford & Co. (investment manager). | | N/A |
Angus N.G.
Macdonald
Age: 47 | | Secretary | | Since 2000 | | Head of Legal for the Baillie Gifford Group (investment manager). | | N/A |
Graham Laybourn
Age: 45 | | Chief
Compliance
Officer | | Since 2005 | | Chief Compliance Officer, Baillie Gifford Overseas Limited (investment adviser). | | N/A |
106
Supplemental Information (unaudited) (concluded)
| |
(1) | The address of each trustee and Officer of the Trust is c/o Baillie Gifford Funds, Calton Square, 1 Greenside Row, Edinburgh, Scotland EH1 3AN. |
(2) | There is no stated term of office for the trustees. The Chairman of the Board, President, Secretary, and Treasurer of the Trust are elected annually by the Trustees. Other officers may be elected or appointed by the trustees at any time. |
(3) | Previous positions during the past five years with Baillie Gifford & Co., the Manager and Baillie Gifford Group are omitted if not materially different from the positions listed. |
(4) | The number of Funds in the Fund complex overseen by the Trustee includes North American Equity Fund, a series of the Trust which has not yet commenced operations. |
(5) | Mr. Hadden is an “interested person” (as defined in the 1940 Act) of the Trust or the Manager due to his positions with the Manager (Baillie Gifford Overseas Ltd.) and his role as an officer of the Trust. |
Additional information regarding the Trustees is in the Funds’ Statement of Additional Information and is available upon request, without charge, by calling Baillie Gifford Overseas Limited at 011-44-131-275-2000.
A description of the Funds’ proxy voting policies and procedures related to portfolio securities is available without charge, upon request, by calling Baillie Gifford Overseas Limited at 011-44-131-275-2000 or on the SEC’s website at http://www.sec.gov. Shareholders may submit to the Trust claim for reimbursement of telephone charges incurred in placing such calls.
Information regarding how the Funds’ voted proxies relating to portfolio securities during the most recent 12-month period ended June 30 is also available without charge upon request by calling Baillie Gifford Overseas Limited at 011-44-131-275-2000 or by accessing the Fund’s Form N-PX on the SEC’s website at http://www.sec.gov. Shareholders may submit to the Trust claim for reimbursement of telephone charges incurred in placing such calls.
Each of the Funds files its complete schedule of portfolio holdings with the SEC for the first and third quarters of each fiscal year on Form N-Q. The Funds’ Form N-Q is available on the SEC’s website at http://www.sec.gov. The Funds’ Form N-Q may also be viewed and copied at the SEC’s Public Reference Room in Washington, DC; information on the operation of the Public Reference Room may be obtained by calling (800) SEC-0330.
107
INVESTMENT ADVISORY AGREEMENT APPROVAL (unaudited)
Approval of the Advisory Agreement for the Baillie Gifford International Choice Fund
On June 21, 2012, the Board of Trustees (the “Board”) of the Baillie Gifford Funds (the “Trust”), including those trustees who are not interested persons as defined by the Investment Company Act of 1940 (the “Independent Trustees”), approved the investment advisory agreement between the Trust on behalf of the International Choice Fund, a new series of the Trust (the “Fund”) and Baillie Gifford Overseas Limited (the “Manager”) (the “Advisory Agreement”). As part of the review process, the Independent Trustees, prior to the Board meeting, met independently of Trust management and of the interested trustee of the Board to consider the approval of the Advisory Agreement. During the review process, the Independent Trustees were represented by independent legal counsel. The Independent Trustees reviewed materials received from the Manager, Lipper Inc. (an independent provider of mutual fund data, “Lipper”) and independent legal counsel with respect to the Advisory Agreement. After reviewing the information received, the Independent Trustees presented their findings and recommendations to the Board.
Based upon the findings and recommendations of the Independent Trustees, the Board concluded that it was in the best interests of the Fund to approve the Advisory Agreement. In reaching this conclusion for the Fund, the Board did not identify any single factor as determinative in its analysis, but rather the Board considered a variety of factors, including those discussed below.
The Board considered the nature, extent and quality of services expected to be provided by the Manager to the Fund. The Board noted that, pursuant to the Advisory Agreement, the Manager will provide portfolio management services to the Fund and will receive a management fee and that, pursuant to a separate Shareholder Service Plan, the Manager will provide services to shareholders of the Fund and will receive a shareholder service fee. The Board considered the background and qualifications of the personnel who would provide portfolio management and shareholder servicing for the Fund. The Board also considered the compliance regime created by the Manager and the quality of the services provided by the Manager to the existing funds of the Trust. The Board considered the proposed investment strategies and investment process for the Fund and reviewed performance information for a composite of accounts managed by the Manager using a similar strategy as proposed for the Fund. The Board concluded that the nature, extent and quality of the services to be provided by the Manager to the Fund were expected to be satisfactory.
The Board reviewed the Fund’s proposed management fee (plus shareholder service fee for Class 1) and estimated total expense ratio and compared them to the average management fees and expense ratios of a separate expense group and expense universe of funds based on data provided by Lipper. The comparable fund information showed that the Fund’s proposed management fee (plus the shareholder service fee for Class 1) was below the average management fee of both the expense group and the expense universe. The Board also considered that the Manager proposed to cap total expenses for the Fund through April 30, 2013. On the basis of the information provided, the Board concluded that the proposed management fee was reasonable.
The Board noted that since the Fund was newly organized and thus generated no management fees for the Manager, that there were no profits to consider. The Board considered other benefits that would be derived by the Manager from its relationship to the Fund, including the shareholder service fee (which will vary among classes) and the potential use of soft dollars to pay for research services for the Fund or
108
INVESTMENT ADVISORY AGREEMENT APPROVAL (unaudited)(concluded)
other clients of the Manager. The Board considered whether there were economies of scale with respect to management of the Fund and whether the Fund would benefit from any economies of scale. The Board considered that the Fund was not yet operational and that the management fee was on the low end of the spectrum of the Lipper peer group of funds.
Based upon all the information considered and the conclusions reached, the Board determined that the terms of the Advisory Agreement were reasonable and fair and that the approval of the Advisory Agreement was in the best interests of the Fund.
109
Item 2. Code of Ethics.
| |
(a) | As of December 31, 2012, the registrant has adopted a code of ethics (the “Code of Ethics”) that applies to its principal executive officer, principal financial officer, principal accounting officer or controller, or persons performing similar functions. |
|
(b) | Not applicable. |
|
(c) | The registrant has not amended its Code of Ethics during the period covered by the shareholder report presented in Item 1 hereto. |
|
(d) | The registrant has not granted a waiver or an implicit waiver from a provision of its Code of Ethics during the period. |
|
(e) | Not applicable. |
|
(f) | The registrant’s Code of Ethics is attached hereto as an exhibit |
Item 3. Audit Committee Financial Expert.
The registrant’s Board of Trustees has determined that Mr. John G. Barrie, Jr., a member of the Board’s Audit Oversight Committee, is an audit committee financial expert. Mr. Barrie is “independent” for purposes of this Item 3 of Form N-CSR. Mr. Barrie formerly served in various supervisory and managerial positions in accounting and finance at Dominion Resources, Inc. and affiliates. In these positions, Mr. Barrie was extensively involved in the preparation, analysis and use of corporate financial statements. In the capacity of Assistant Treasurer of Dominion Resources, Inc., Mr. Barrie had principal responsibility for administering the investment of over $1 billion of retirement plan assets, and was involved with internal and external auditors in establishing internal controls and procedures relating to the administration and reporting of retirement plan investments.
Item 4. Principal Accountant Fees and Services.
(a) - (d)
Fees for Services Rendered to the Registrant
| | | | | | | | | | | | | |
Fiscal Year | | | Audit Fees | | | Audit-Related Fees | | | Tax Fees | | | All Other Fees | |
2011 | | $ | 86,000 | | $ | 0 | | $ | 20,000 | | $ | 0 | |
2012 | | $ | 105,500 | | $ | 0 | | $ | 24,000 | | $ | 0 | |
Audit fees include amounts for auditing and reporting on the financial statements and the financial highlights included in the Funds annual report to the shareholders, issuance of the auditor’s consent to be included in the Funds’ annual amendment to the Registration Statement on Form N-1A, issuance of the auditor’s report on internal controls for inclusion in form N-SAR and provision of comments on the Funds’ interim financial statements (as requested). The audit fees above represent the amounts billed for services provided for the fiscal year indicated, not the amounts billed during such year.
Audit-related fees include amounts billed for assurance and related services rendered to the registrant, including consultations related to financial accounting and reporting standards. The audit-related fees above represent the amounts billed during the fiscal year indicated.
Tax fees include amounts for services rendered to the registrant for tax compliance, tax planning and tax advice, including tax return preparation and review of and participation in determining required income and capital gains distributions. The tax fees above represent the amounts billed during the fiscal year indicated.
(e) (1) Engagements that are required to be pre-approved by the registrant’s Audit Oversight Committee, “the Committee”, may be pre-approved (i) at any regular or special meeting of the Committee or (ii) by any member of the Committee, provided that such member must report, for informational purposes only, any pre-approval decisions to the Board at its next regularly scheduled meeting.
(e) (2) Not applicable.
(f) Not applicable.
(g) The aggregate non-audit fees billed by the registrant’s accountant for services rendered to the registrant and rendered to the registrant’s investment adviser and any entity controlling, controlled by, or under common control with the adviser that provides ongoing services to the registrant were as follows:
The amount set forth for each fiscal year includes: (i) the aggregate of amounts disclosed in Item 4 (b), (c), and (d) above for Audit-Related Fees, Tax Fees and All Other Fees, plus (ii) the aggregate amount of any non-audit fees billed to the registrant’s investment adviser and any entity controlling, controlled by, or under common control with the adviser that provides ongoing services to the registrant. This additional amount under clause (ii) for the 2011 fiscal year totaled $0 and for the 2012 fiscal year totaled $0.
(h) In evaluating the independence of the registrant’s accountant, the Audit Oversight Committee of the registrant’s Board of Trustees considered the provision of non-audit services, which were not pre-approved pursuant to Rule 2-01(c)(7)(ii) of Regulation S-X, rendered to the registrant’s investment adviser and any entity controlling, controlled by or under common control with the investment adviser that provides ongoing services to the registrant and determined that the provision of such services, if any, is compatible with maintaining the principal accountant’s independence.
Item 5. Audit Committee of Listed Registrants.
Not applicable.
Item 6. Investments.
(a) The schedule of investments is included as part of the report to shareholders filed under Item 1 of this form.
(b) In accordance with Section 13(c) of the Investment Company Act of 1940, the registrant has divested itself of the following securities since the filing of its last report on Form N-CSR:
Emerging Markets Fund
| | | | | | | | | | | | |
Name
of Issuer | | Exchange
Ticker
Symbol | | Security
Identifier
(CUSIP
number) | | Total
number of
shares
divested | | Date
securities
were
divested | | Amount
Held on
Filing Date | | Statute |
| | | | | | | | | | | | | |
China Petroleum & Chemical Corp. | | 386 HK | | 6291819 | | 454,000 | | 09/24/2012 | | 4,188,000 | | Sudan Accountability and Divestment Act of 2007; Comprehensive Iran Sanctions, Accountability, and Divestment Act of 2010 |
Item 7. Disclosure of Proxy Voting Policies and Procedures for Closed-End Management Investment Companies.
Not applicable.
Item 8. Portfolio Managers of Closed-End Management Investment Companies.
Not applicable.
Item 9. Purchases of Equity Securities by Closed-End Management Investment Company and Affiliated Purchasers.
Not applicable.
Item 10. Submission of Matters to a Vote of Security Holders.
Not applicable.
Item 11. Controls and Procedures.
(a) The President and Treasurer of the registrant have concluded, based on their evaluation of the effectiveness of the registrant’s disclosure controls and procedures (as defined in Rule 30a-3(c) under the Act) as of a date within 90 days of the filing date of this report on Form N-CSR, that to the best of their knowledge the design and operation of such procedures provide reasonable assurance that information required to be disclosed by the registrant in this report on Form N-CSR is recorded, processed, summarized, and reported within the time periods specified in the Securities and Exchange Commission’s rules and forms.
(b) There has been no change in the registrant’s internal controls over financial reporting (as defined in Rule 30a-3(d) under the Act) that occurred during the second fiscal quarter of the period covered by this report that has materially affected, or is reasonably likely to materially affect, the registrant’s internal control over financial reporting.
Item 12. Exhibits.
(a)(1) Code of Ethics.
(a)(2)(i) Certification of the Principal Executive Officer required by Rule 30a-2 under the Act.
(a)(2)(ii) Certification of the Principal Financial Officer required by Rule 30a-2 under the Act.
(a)(3) Not applicable.
(b) Not applicable.
SIGNATURES
Pursuant to the requirements of the Investment Company Act of 1940, the registrant has duly caused this report to be signed on its behalf by the undersigned, thereunto duly authorized.
| | | | | |
(Registrant) | BAILLIE GIFFORD FUNDS | |
| | | | |
| | | | | |
By | /s/ Peter Hadden | | |
| | | |
| Peter Hadden, President | | |
| | | | |
Date | April 10, 2013 | | |
| | | |
Pursuant to the requirements of the Investment Company Act of 1940, this report has been signed below by the following persons on behalf of the registrant and in the capacities and on the dates indicated.
| | | | | |
By | /s/ Peter Hadden | | |
| | |
| Peter Hadden, President | |
| | | | | |
Date | April 10, 2013 | | |
| | | |
| | | | | |
By | /s/ Nigel Cessford | | |
| | |
| Nigel Cessford, Treasurer | |
| | | | | |
Date | April 10, 2013 | | |
| | | |