UNITED STATES
SECURITIES AND EXCHANGE COMMISSION
Washington, D.C. 20549
FORM N-CSR
CERTIFIED SHAREHOLDER REPORT OF REGISTERED
MANAGEMENT INVESTMENT COMPANIES
Investment Company Act file number | 811-10145 |
|
Baillie Gifford Funds |
(Exact name of registrant as specified in charter) |
|
1 Greenside Row
Edinburgh, Scotland, UK, | | EH1 3AN |
(Address of principal executive offices) | | (Zip code) |
|
Angus NG Macdonald
1 Greenside Row
Edinburgh, Scotland, UK, EH1 3AN |
(Name and address of agent for service) |
|
Registrant’s telephone number, including area code: | 011-44-131-275-2000 | |
|
Date of fiscal year end: | December 31 | |
|
Date of reporting period: | December 31, 2014 | |
| | | | | | | | |
The registrant, an open-end investment company registered pursuant to Section 8(b) of the Investment Company Act of 1940 (the “Act”), has not filed a registration statement that has gone effective under the Securities Act of 1933 (the “1933 Act”) because beneficial interests in the registrant are issued and sold solely in private transactions that do not involve any public offering within the meaning of Section 4(2) of the 1933 Act. Accordingly, this report is not filed under Section 13(a) or Section 15(d) of the Securities Exchange Act of 1934.
Item 1. Reports to Stockholders.
The Report to Shareholders is attached herewith.
BAILLIE GIFFORD FUNDS
International Equity Fund
International Choice Fund
EAFE Fund
EAFE Choice Fund
Emerging Markets Fund
Global Alpha Equity Fund
EAFE Pure Fund
Long Term Global Growth Equity Fund
Annual Report
December 31, 2014

Index
Page Number | | | |
| | 01 | | | Management Discussion | |
| | 17 | | | Fund Expenses | |
| | | International Equity Fund | |
| | 21 | | | Industry Diversification Table | |
| | 23 | | | Portfolio of Investments | |
| | 28 | | | Statement of Assets and Liabilities | |
| | 30 | | | Statement of Operations | |
| | 31 | | | Statements of Changes in Net Assets | |
| | | Financial Highlights | |
| | 33 | | | Selected Data for Class 1 | |
| | 34 | | | Selected Data for Class 2 | |
| | 35 | | | Selected Data for Class 3 | |
| | 36 | | | Selected Data for Class 4 | |
| | 37 | | | Selected Data for Class 5 | |
| | | International Choice Fund | |
| | 38 | | | Industry Diversification Table | |
| | 40 | | | Portfolio of Investments | |
| | 44 | | | Statement of Assets and Liabilities | |
| | 45 | | | Statement of Operations | |
| | 46 | | | Statements of Changes in Net Assets | |
| | | Financial Highlights | |
| | 47 | | | Selected Data for Class 1 | |
| | 48 | | | Selected Data for Class 2 | |
| | 49 | | | Selected Data for Class 3 | |
| | | EAFE Fund | |
| | 50 | | | Industry Diversification Table | |
| | 52 | | | Portfolio of Investments | |
| | 56 | | | Statement of Assets and Liabilities | |
| | 58 | | | Statement of Operations | |
| | 59 | | | Statements of Changes in Net Assets | |
| | | Financial Highlights | |
| | 61 | | | Selected Data for Class 2 | |
| | 62 | | | Selected Data for Class 3 | |
| | 63 | | | Selected Data for Class 4 | |
| | 64 | | | Selected Data for Class 5 | |
| | | EAFE Choice Fund | |
| | 65 | | | Industry Diversification Table | |
| | 67 | | | Portfolio of Investments | |
| | 71 | | | Statement of Assets and Liabilities | |
| | 72 | | | Statement of Operations | |
| | 73 | | | Statements of Changes in Net Assets | |
| | | Financial Highlights | |
| | 74 | | | Selected Data for Class 1 | |
| | 75 | | | Selected Data for Class 2 | |
| | 76 | | | Selected Data for Class 3 | |
Page Number | | | |
| | | Emerging Markets Fund | |
| | 77 | | | Industry Diversification Table | |
| | 78 | | | Portfolio of Investments | |
| | 82 | | | Statement of Assets and Liabilities | |
| | 83 | | | Statement of Operations | |
| | 84 | | | Statements of Changes in Net Assets | |
| | | Financial Highlights | |
| | 85 | | | Selected Data for Class 3 | |
| | | Global Alpha Equity Fund | |
| | 86 | | | Industry Diversification Table | |
| | 88 | | | Portfolio of Investments | |
| | 93 | | | Statement of Assets and Liabilities | |
| | 94 | | | Statement of Operations | |
| | 95 | | | Statements of Changes in Net Assets | |
| | | Financial Highlights | |
| | 96 | | | Selected Data for Class 2 | |
| | 97 | | | Selected Data for Class 3 | |
| | | EAFE Pure Fund | |
| | 98 | | | Industry Diversification Table | |
| | 99 | | | Portfolio of Investments | |
| | 102 | | | Statement of Assets and Liabilities | |
| | 103 | | | Statement of Operations | |
| | 104 | | | Statements of Changes in Net Assets | |
| | | Financial Highlights | |
| | 105 | | | Selected Data for Class 2 | |
| | | Long Term Global Growth Equity Fund | |
| | 106 | | | Industry Diversification Table | |
| | 107 | | | Portfolio of Investments | |
| | 109 | | | Statement of Assets and Liabilities | |
| | 110 | | | Statement of Operations | |
| | 111 | | | Statement of Changes in Net Assets | |
| | | Financial Highlights | |
| | 112 | | | Selected Data for Class 2 | |
| | 113 | | | Notes to Financial Statements | |
| | 138 | | | Report of Independent Registered Public Accounting Firm | |
| | | Supplemental Information | |
| | 139 | | | Shareholder Meeting Results | |
| | 141 | | | Federal Income Tax Information | |
| | 142 | | | Management of the Trust | |
| | 144 | | | Board Considerations Regarding Contract Approval | |

Annual Report December 31, 2014
International Equity Fund
Market Conditions and Review of Performance during 2014
During 2014, markets were jittery, and the MSCI ACWI ex U.S. Index fell 3.44%. Much of the headlines were dominated by news surrounding growth prospects for the Eurozone, sanctions against Russia, and latterly the sharp fall in the oil price. While markets inevitably move on such news, our approach during turbulent periods is to remember that the long-term value of businesses is rarely altered by macroeconomic newsflow, and that the markets tend to overreact to headlines. Instead, we focus on company fundamentals, and often view market volatility as an inefficiency to exploit by investing in/adding to companies that may have been unfairly punished in share price terms.
The International Equity Fund Class 2 returned -2.93% during 2014, outperforming the MSCI ACWI ex U.S. Index which returned -3.44% for the year.
A range of companies contributed to this relative outperformance, including holdings in Ryanair (Irish low cost airline), Fairfax Financial Holdings (a financial services holding company engaged in insurance) and Hong Kong Exchanges and Clearing. There were also several Information Technology companies that contributed strongly to performance, for example Naspers (the South African media business which owns a stake in Tencent, China's internet service portal), TSMC (the dominant Taiwanese semiconductor manufacturer) and Baidu (the Chinese search engine).
The falling oil price had an effect on relative performance with energy related holdings among the more significant detractors over the year. These included Tullow Oil (oil exploration and production company), Seadrill (offshore drilling company) and Petrofac (oil services contractor). Also of note, was the underperformance of the Russian holdings. With sanctions against Russia, and the lower oil price, the Russian market has been weak, and holdings in retailer Magnit, internet search company Yandex and Sberbank, all detracted. Despite Sberbank retaining many of the bottom-up attractions that first drew us to the stock (including a dominant market share), we chose to exit the holding in the fourth quarter due to the deterioration in the industry backdrop.
We continue to find exciting investment opportunities for the portfolio. For example, we have taken holdings in Copa Holdings, Richemont and Yandex: Copa Holdings is a Panamanian-based airline operating flights between North,
Central and South America. It flies mainly to secondary cities where competition is weaker. As most flights connect through Panama, the shorter route length allows Copa to use smaller planes and hence achieve relatively high load factors. Copa is able to charge a premium for many of its routes which have few, if any, competing alternatives. Much of the network is immature and Copa is seeking to add new routes and increase both frequency of flights and load factors over time. Richemont is the world's leading hard luxury goods company which has strong positions in jewellery and watches. It has strong brands, such as Cartier, that create barriers to entry and give it pricing power. We also believe that minority shareholders have been closely aligned with the key shareholder, the Rupert family (who have a substantial amount of their wealth invested in Richemont and control 50% of the voting rights). We do not think that the market fully appreciates the durability of both the brands and the returns of this business. Yandex is the dominant search engine in Russia and has around 70% market share, deriving the majority of its revenues from advertising. It should benefit from an ongoing shift of advertising spending to online channels, which will take a bigger share of the overall advertising market, and we like the fact that the founder and CEO has an 11% stake and therefore some alignment with shareholders' interests. Its e-commerce platform (Yandex.Market), although in its infancy, has the potential to become Russia's eBay.
During the year we sold several holdings for stock specific reasons, including Aker Solutions, the Norwegian oil service group, where we felt that the bulk of the restructuring had been completed and that the operational improvements may be hindered by a softer market environment. We sold Garanti Bankasi, Turkey's second largest bank, because the industry backdrop had deteriorated with the Central Bank allowing credit to rise too fast, and in our view the valuation did not reflect a potential deterioration in credit quality. China Mobile was sold because voice revenues were hit hard by the rapid progress of 'over-the-top' services which bypass mobile operators; this is a threat that we had underestimated. Towards the end of the year, we also sold Trend Micro, the manufacturer of anti virus software, and security software for the server market, because of concerns about the durability of its core antivirus business; operating systems now have more protection built in to their platforms, and hence fewer customers are willing to pay for anti-malware. Woolworths, the Australian food retailer, was sold due to concerns that the market for food retail has now matured, and over the risk of competition from discounters.
01
Annual Report December 31, 2014
The portfolio comprises a diverse range of growth companies, but we remain focussed on those that have durable competitive advantages, good management, and strong financial characteristics.
Investment Strategies used to manage the Fund
Baillie Gifford is a growth manager with a bottom-up approach to stock picking. We aim to invest in companies that will generate sustainable earnings growth above that of the market over the long term. In determining the potential of a company, we analyse industry background, competitive advantage, management attitudes and financial strength, and finally we consider valuation. We meet the management of companies within our investment universe and revisit the investment case for the portfolio's holdings on a regular basis to ensure that our expectations are being met.
The ACWI ex U.S. Alpha Portfolio Construction Group is responsible for the overall strategy and stock selection process. It meets regularly to discuss both buy and sell ideas and the level of conviction for existing holdings and will continue to monitor the long-term prospects for the Fund's holdings and make changes where appropriate.
Outlook
As stock pickers, our focus, as always, remains on company fundamentals. The Portfolio Construction Group will continue to work hard on monitoring the investment case for existing holdings, and look out for new long-term growth opportunities for the Fund.
Fund Performance for periods ended 12/31/14 (Average Annual Total Returns) (unaudited)
| | One Year | | Five Year | | Since Inception
% p.a.
(February 7, 2008) | |
The International Equity Fund Class 2* | | | -2.93 | % | | | 6.70 | % | | | 3.37 | % | |
MSCI ACWI ex U.S. Index | | | -3.44 | % | | | 4.89 | % | | | 0.90 | % | |
* The returns for Class 2 shares have been provided. The 2014 return figures for the other share classes are as follows: -3.10% for Class 1, -2.83% for Class 3 and -2.82% for Class 4. Additional calendar year returns for each class are available in the Financial Highlights section.
Comparison of the change in value of $1,000,000 investment in the Fund's Class 2 shares and the Index
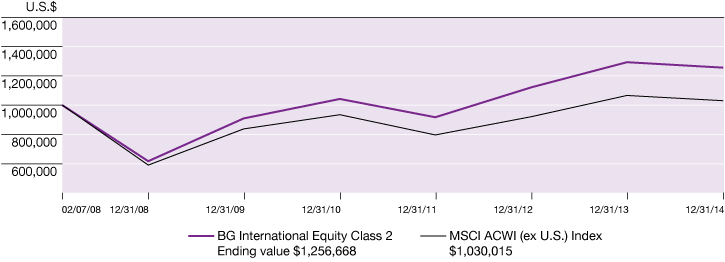
Past performance does not predict future performance. The graph and the table above do not reflect the deduction of taxes that a shareholder would pay on Fund distributions or redemptions of Fund shares.
02
Annual Report December 31, 2014
International Choice Fund
Market Conditions and Review of Performance during 2014
2014 proved to be an eventful period in terms of news. The main themes through the year were a strong U.S., a soggy Europe, a pick-up in the UK and a slowing in China. The end of 2014 saw markets jitter on the back of a significant weakening in the oil price, while geopolitics came to the fore in markets such as Russia. The International Focus team prefers to concentrate on individual companies and what we think is likely to happen to their fortunes over long periods of time, rather than short-term macro events.
The International Choice Fund Class 2 produced a return of -3.29% during 2014, marginally outperforming the benchmark which returned -3.44% for the year.
Despite the Japanese economy falling back into recession during the third quarter, Shimano, the cycling component company, was the top contributor during 2014. Great operating results were the main contributing factor. The market continues to grow attractively and the combination of Shimano's competitive advantage, strong brand and commitment to Research & Development should promote continued growth in the future. It is also a good example of one of the many exceptionally well-managed companies held in the Fund. The company remains under the careful stewardship of the Shimano family, with Yozo Shimano, President/CEO since 2001, having worked for the company since 1974.
Cochlear enjoyed a good set of results in the second half of 2014, which came in ahead of consensus. Incidentally, the Australian hearing implant company's founder, Graeme Clark, has since jointly received the 2015 Russ Prize (one of the world's top prizes for engineering) for his life's work with cochlear implants. Cochlear recently oversaw a successful launch of its next generation implant, supporting our belief that this company can continue to innovate and deliver long-term growth.
ASOS, the online fashion retailer, had a difficult year, with operational missteps and a fire at its principal distribution facility doing little to help the shares. We remain enthusiastic about the long-term potential of this business, which continues to grow its sales at a rapid rate.
Some of the Fund's holdings in energy companies underperformed on the back of lower energy prices. Of particular note was the holding in BG Group, the energy exploration and production company. However, we remain excited by the developments it has underway in Australia
and Brazil. The company recently loaded its first cargo of liquefied natural gas in Australia, and the ramp up in production both there and in Brazil remain on track. We continue to think these should lead to material profit growth over the years to come. It is worth highlighting that the Fund does not hold many energy stocks.
Carlsberg, the Danish brewing company, also featured among the top detractors from performance in 2014, reflecting concerns over the company's Russian operations. It is evident that Russia is facing some very strong headwinds at the moment, and we are mindful of, and continue to monitor, Carlsberg's exposure to the region. However, Russia is one of a number of strings to Carlsberg's investment bow and we continue to be excited about the long-term growth opportunity that Carlsberg can capitalise on. For example, some fast-growing Asian markets give significant cause for optimism.
Investment Strategies used to manage the Fund
Baillie Gifford is a growth manager with a bottom-up approach to stock picking. We aim to invest in companies that will generate sustainable earnings growth above the market over the long term. In determining the potential of a company, we analyse industry background, competitive advantage, management attitudes and financial strength, and finally we consider valuation. We meet the management of the companies within our investment universe and revisit the investment case for the Fund's holdings on a regular basis to ensure that our expectations are being met.
The International Focus Portfolio Construction Group is responsible for the overall strategy and stock selection process. It meets regularly to discuss both buy and sell ideas and the level of conviction for existing holdings and will continue to monitor the long-term prospects for the Fund's holdings and make changes where appropriate.
Outlook
We prefer to set the goalposts for our investments based on fundamental research and not to change the parameters based on shorter-term predictions or pure guesswork, although we will review and ask ourselves 'what would make us sell?'. As long-term investors, we remain optimistic and confident that the Fund contains a range of exciting businesses with great potential.
03
Annual Report December 31, 2014
Fund Performance for periods ended 12/31/14 (Average Annual Total Returns) (unaudited)
| | One Year | | Since Inception
% p.a.
(April 9, 2013) | |
The International Choice Fund Class 2* | | | -3.29 | % | | | 4.60 | % | |
MSCI ACWI ex U.S. Index | | | -3.44 | % | | | 7.05 | % | |
* The returns for Class 2 shares have been provided. The 2014 return figures for other share classes are as follows: -3.26% for Class 3. Additional calendar year returns for each class are available in the Financial Highlights section.
Comparison of the change in value of $1,000,000 investment in the Fund's Class 2 shares and the Index
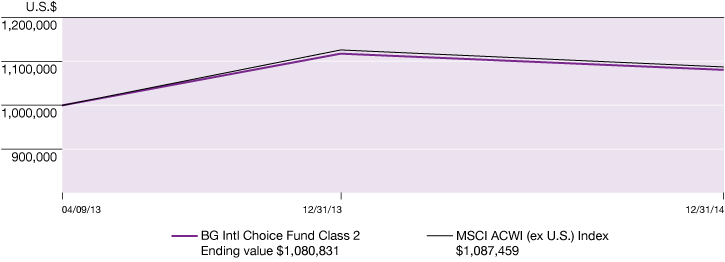
Past performance does not predict future performance. The graph and the table above do not reflect the deduction of taxes that a shareholder would pay on Fund distributions or redemptions of Fund shares.
04
Annual Report December 31, 2014
EAFE Fund
Market Conditions and Review of performance during 2014
The end of 2014 saw more than its fair share of dramatic events, from cyber terrorism to currency collapse in Russia and a plunge in the price of oil. While markets inevitably move on from such news, our mentality during turbulent periods is to remember that the long-term value of equities is rarely altered by single events, and that markets tend to overreact to headlines. Indeed, we often view such periods as an opportunity to add to companies we already hold and admire.
The EAFE Fund Class 2 produced a return of -6.98% during 2014, underperforming the MSCI EAFE Index which returned -4.48%.
It was a good year for the Information Technology sector, in particular the Asian internet titans Baidu and Tencent which are growing rapidly and making considerable progress in monetizing their increasingly mobile users. Fiat, the Italian car maker which completed the purchase of Chrysler last year, also performed well and we continue to admire the ambition of the company, led by Sergio Marchionne. The absence of any oil companies in the portfolio also contributed positively to performance with the collapse in the oil price resulting in the energy sector being the worst performing sector over the year.
In terms of detractors, the most significant weakness came from the Japanese internet and telecom company Softbank. The value of its 31.4% stake in Alibaba continued to appreciate, but its U.S. cellphone operator Sprint underperformed after U.S. antitrust authorities blocked its bid to merge with T-Mobile. We also experienced disappointing performance from two of the Fund's larger UK investments, Standard Chartered and Rolls-Royce. In both cases operational management and capital allocation have caused concern. We have since reduced the position in Standard Chartered.
Over the last twelve months, we have continued to invest in companies where change is driving growth and we believe the potential returns can make a significant difference to the Fund. We have participated in the IPOs of two exciting founder-driven online companies, China's Alibaba and Berlin-based Rocket Internet. We have also taken a new holding in German antibody research company Morphosys. These purchases were funded by the sale of several long-term holdings,
including the exchange business BM&F Bovespa, semi-conductor company TSMC and British American Tobacco, which we consider to be increasingly mature businesses.
Investment Strategies used to manage the Fund
Baillie Gifford is a growth manager with a bottom-up approach to stock picking. We aim to invest in companies that will generate sustainable earnings growth above the market over the long term. In determining the potential of a company, we analyse industry background, competitive advantage, management attitudes and financial strength, and finally we consider valuation. We meet the management of the companies within our investment universe and revisit the investment case for the Fund's holdings on a regular basis to ensure that our expectations are being met.
The EAFE Alpha Portfolio Construction Group is responsible for the overall strategy and stock selection process. It meets regularly to discuss both buy and sell ideas and the level of conviction in its continuing holdings.
Outlook
We look into 2015 with enthusiasm about the opportunity for international growth investment and believe that many of the long-term trends reflected in the Fund are highly durable: the growth of a productive and competitive China; the emergence of a consuming and saving middle class in Asia; reform and recovery in Europe; and the vital force of technological change. In our search for beneficiaries of such trends, we are focussed on finding innovative companies with the chance to become multiples of their current size, or companies with long duration opportunities where we believe special cultures and management are strongly embedded.
05
Annual Report December 31, 2014
Fund Performance for periods ended 12/31/14 (Average Annual Total Returns) (unaudited)
| | One Year | | Five Year | | Since Inception
% p.a.
(March 6, 2008) | |
The EAFE Fund Class 2* | | | -6.98 | % | | | 7.93 | % | | | 3.49 | % | |
MSCI EAFE Index | | | -4.48 | % | | | 5.80 | % | | | 1.38 | % | |
* The returns for Class 2 shares have been provided. The 2014 return figures for the other share classes are as follows: -6.94% for Class 3, -6.82% for Class 4 and -6.85% for Class 5. Additional calendar year returns for each class are available in the Financial Highlights section.
Comparison of the change in value of $1,000,000 investment in the Fund's Class 2 shares and the Index
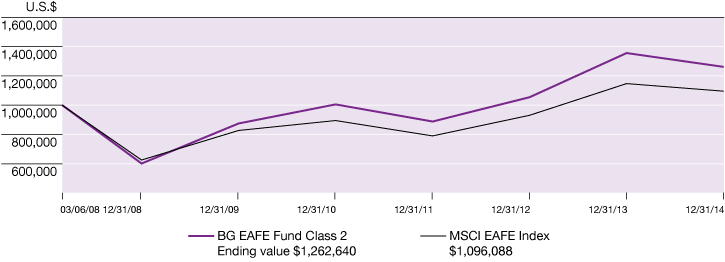
Past performance does not predict future performance. The graph and the table above do not reflect the deduction of taxes that a shareholder would pay on Fund distributions or redemptions of Fund shares.
06
Annual Report December 31, 2014
EAFE Choice Fund
Market Conditions and Review of Performance during 2014
2014 proved to be an eventful period in terms of news. The main themes through the year were a strong U.S., a soggy Europe, a pick-up in the UK and a slowing in China. The end of 2014 saw markets jitter on the back of a significant weakening in the oil price, while geopolitics came to the fore in markets such as Russia. The International Focus team prefers to concentrate on individual companies and what we think is likely to happen to their fortunes over long periods of time, rather than short-term macro events.
The EAFE Choice Fund Class 2 produced a return of -4.25% during 2014, marginally outperforming the benchmark which returned -4.48% for the year.
Despite the Japanese economy falling back into recession during the third quarter, Shimano, the cycling component company, was the top contributor during 2014. Great operating results were the main contributing factor. The market continues to grow attractively and the combination of Shimano's competitive advantage, strong brand and commitment to Research & Development should promote continued growth in the future. It is also a good example of one of the many exceptionally well-managed companies held in the Fund. The company remains under the careful stewardship of the Shimano family, with Yozo Shimano, President/CEO since 2001, having worked for the company since 1974.
Cochlear enjoyed a good set of results in the second half of 2014, which came in ahead of consensus. Incidentally, the Australian hearing implant company's founder, Graeme Clark, has since jointly received the 2015 Russ Prize (one of the world's top prizes for engineering) for his life's work with cochlear implants. Cochlear recently oversaw a successful launch of its next generation implant, supporting our belief that this company can continue to innovate and deliver long-term growth.
ASOS, the online fashion retailer, had a difficult year, with operational missteps and a fire at its principal distribution facility doing little to help the shares. We remain enthusiastic about the long-term potential of this business, which continues to grow its sales at a rapid rate.
Some of the Fund's holdings in energy companies underperformed on the back of lower energy prices. Of particular note was the holding in BG Group, the energy exploration and production company. However, we remain excited by the developments it has underway in Australia
and Brazil. The company recently loaded its first cargo of liquefied natural gas in Australia, and the ramp up in production both there and in Brazil remain on track. We continue to think these should lead to material profit growth over the years to come. It is worth highlighting that the Fund does not hold many energy stocks.
Carlsberg, the Danish brewing company, also featured among the top detractors to performance in 2014, reflecting concerns over the company's Russian operations. It is evident that Russia is facing some very strong headwinds at the moment, and we are mindful of, and continue to monitor, Carlsberg's exposure to the region. However, Russia is one of a number of strings to Carlsberg's investment bow and we continue to be excited about the long-term growth opportunity that Carlsberg can capitalise on. For example, some fast-growing Asian markets give significant cause for optimism.
Investment Strategies used to manage the Fund
Baillie Gifford is a growth manager with a bottom-up approach to stock picking. We aim to invest in companies that will generate sustainable earnings growth above the market over the long term. In determining the potential of a company, we analyse industry background, competitive advantage, management attitudes and financial strength, and finally we consider valuation. We meet the management of the companies within our investment universe and revisit the investment case for the Fund's holdings on a regular basis to ensure that our expectations are being met.
The International Focus Portfolio Construction Group is responsible for the overall strategy and stock selection process. It meets regularly to discuss both buy and sell ideas and the level of conviction for existing holdings and will continue to monitor the long-term prospects for the Fund's holdings and make changes where appropriate.
Outlook
We prefer to set the goalposts for our investments based on fundamental research and not to change the parameters based on shorter-term predictions or pure guesswork, although we will review and ask ourselves 'what would make us sell?'. As long-term investors, we remain optimistic and confident that the Fund contains a range of exciting businesses with great potential.
07
Annual Report December 31, 2014
Fund Performance for periods ended 12/31/14 (Average Annual Total Returns) (unaudited)
| | One Year | | Five Year | | Since Inception
% p.a.
(December 17,2009) | |
The EAFE Choice Fund Class 2* | | | -4.25 | % | | | 6.75 | % | | | 8.03 | % | |
MSCI EAFE Index | | | -4.48 | % | | | 5.80 | % | | | 5.80 | % | |
* The returns for Class 2 shares have been provided. The 2014 return figures for the other share classes are as follows: -4.46% for Class 1. Additional calendar year returns for each class are available in the Financial Highlights section.
Comparison of the change in value of $1,000,000 investment in the Fund's Class 2 shares and the Index

Past performance does not predict future performance. The graph and the table above do not reflect the deduction of taxes that a shareholder would pay on Fund distributions or redemptions of Fund shares.
08
Annual Report December 31, 2014
Emerging Markets Fund
Market Conditions and Review of Performance during 2014
Emerging Market economies had mixed fortunes over 2014 as they adjusted to a slowdown in the pace of growth and experienced periods of uncertainty created by a range of economic and political factors. Sanctions imposed by the EU and U.S. in response to the Ukraine crisis, in conjunction with both plunging oil prices and a heavily depressed currency, have been an unwanted cocktail for Russia, as it ended the year as the worst performing market in U.S. dollar terms. With the 50% fall in oil prices, other oil producing countries, such as Mexico and Brazil, have unsurprisingly come under increased pressure. Brazil also faces other structural challenges; weak growth, inflation and a lack of reform, which make large parts of the Brazilian stock market unattractive from a growth perspective. However, some countries do appear to be bucking the trend. Narendra Modi's convincing election victory in India will perhaps be the catalyst the country has been waiting for — the first majority pro-reform party in India's post war history. India has been through a long and painful cycle which has seen its currency collapse in recent years. However, economic activity is recovering, while monetary policy is easing (helped by lower inflation). Of course, structural issues remain — there is still a high budget deficit and very little low-end manufacturing job creation. It is too early to determine whether Modi is making much difference in any of these areas, but we will continue to watch with interest. For stock specific reasons, the Fund has a sizeable overweight in this country.
The Emerging Markets Fund Class III returned 0.26% during 2014, outperforming the MSCI Emerging Markets Index which returned -1.82%.
India was one of the strongest markets over 2014, driven by the high expectations for reform being placed on Prime Minister, Narendra Modi. The Fund benefitted from its overweight position and stock selection in India, with the IT services companies Tech Mahindra and HCL Technologies notable contributors, both reporting good results as developing country demand has improved. Axis Bank (private sector bank), Shriram Transport (transport finance company) and Mahindra & Mahindra (SUV and tractor manufacturer) also boosted Fund performance. Axis Bank has been one of the stand out performers over 2014 as it has continued to see robust loan growth. The bank is also well capitalised and has done well to keep its non-performing assets low, the polar opposite of its inefficient state owned competitors.
Events in Russia attracted headlines for much of the period. Upon further reflection on the likely long term challenges for the Russian economy, we sold the Fund's holding in Sberbank (Russian bank) during December. Unfortunately this was not enough to prevent it being amongst the top detractors from performance over the year. Other detractors included Cemex (Mexican cement company) and LG Chem (Korea's largest chemical company), both indirectly affected by the falling oil price. Cemex saw share price weakness given its exposure to oil and gas infrastructure in the U.S., with LG Chem seeing price cuts in the major chemicals it produces.
Elsewhere, the stand-out sector performer over the year was Information Technology. Two of the top contributors to performance were names added in recent months; Alibaba Group and Rocket Internet. Both companies operate in the online retail space, albeit with very different corporate structures and geographic footprints. The latter boasts a portfolio of leading internet businesses across Emerging Market countries, all benefiting from vast growth opportunities and a common management support structure. Other strong performers included TSMC, the Taiwanese foundry business. TSMC has shown its continued willingness to invest in Research & Development which, along with its significant scale advantage, should help cement its already dominant market position. SK Hynix (memory semiconductor company) also boosted the Fund's performance, showing continued strength in its Dynamic Random Access Memory operations.
Investment Strategies used to manage the Fund
Baillie Gifford is a growth manager with a bottom-up approach to stock picking. We aim to invest in companies that will generate sustainable earnings growth above the market over the long term. In determining the potential of a company, we analyse the industry background, competitive advantage, management attitudes and financial strength, and finally we consider valuation. We meet the management of the companies within our investment universe and revisit the investment case for the Fund's holdings on a regular basis to ensure that our expectations are being met.
The Emerging Markets investment team is responsible for the overall strategy and stock selection process, led by the most senior investment managers. The team meets regularly to discuss both buy and sell ideas and to determine the level of conviction in the Fund's holdings.
09
Annual Report December 31, 2014
Outlook
Continued pressures across much of the Emerging Markets universe are apparent, however we remain resolutely upbeat for the prospects for the Fund's holdings. We are finding a wealth of opportunities in Asia, and more particularly in the very broad technology sector where valuations and fundamentals remain attractive. Over the past year the team has been spending time deepening their understanding of a number of these tech companies, aiming to challenge the significant overweight position in this sector. The growth drivers behind these companies, however, are very diverse, as technology now infiltrates so many different aspects of our lives. The Fund's technology holdings include some of the more traditional hardware exporters, many of which are now the global leaders in their field. An
increasing proportion of the Fund has also been invested in companies that are capturing online consumption, where we continue to be surprised by market analysis which simply extrapolates developed country consumption trends to those we should expect from many Emerging Market countries. We believe the opportunity for Emerging Market companies such as Alibaba or Tencent is likely to be far greater than that of their global peers; the legacy competition they face in their domestic markets is far less developed than in the West. It is exactly this type of inefficiency which we aim to exploit. And when these new internet champions trade on similar PE multiples to many 'stable' consumer staples companies (whose very existence they are now threatening), we believe such disruptive internet companies remain extremely attractive.
Fund Performance for periods ended 12/31/14 (Average Annual Total Returns) (unaudited)
| | One Year | | Five Year | | Ten Year | | Since Inception
% p.a.
(April 4, 2003) | |
The Emerging Markets Fund Class III* | | | 0.26 | % | | | 2.56 | % | | | 10.81 | % | | | 15.69 | % | |
MSCI Emerging Markets Index | | | -1.82 | % | | | 2.11 | % | | | 8.78 | % | | | 13.65 | % | |
* Returns for the Class III shares have been provided. Additional calendar year returns for each class are available in the Financial Highlights section.
Comparison of the change in value of $1,000,000 investment in the Fund's Class III shares and the Index
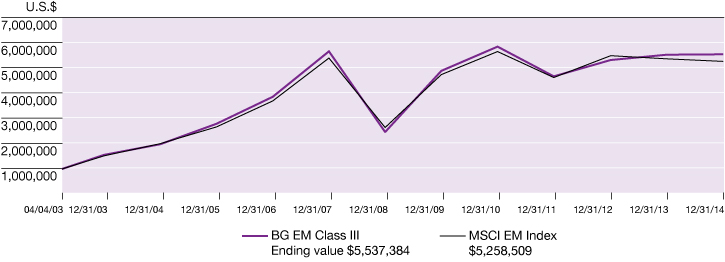
Past performance does not predict future performance. The graph and the table above do not reflect the deduction of taxes that a shareholder would pay on Fund distributions or redemptions of Fund shares.
10
Annual Report December 31, 2014
Global Alpha Equity Fund
Market Conditions and Review of Performance during 2014
Global markets were volatile over the twelve months to December 2014 but ultimately finished up. The MSCI All Country World Index returned 4.71% over the reporting period, while the Global Alpha Equity Fund Class 3 produced a return of 4.48% for the period, slightly behind the index.
One of the most notable features of 2014 was the dramatic shift in many commodity markets. Crude oil ended the year some 45% cheaper than it started, with the price of a barrel of Brent crude falling from $113 at the end of June to close the year at just $61. The Russian economy, heavily reliant on commodity exports and already creaking under the strain of international sanctions, suffered more than most. The rest of Europe continued to be dogged by the spectre of both deflation and low growth. Meanwhile, U.S. growth continued to surprise on the upside. Buoyant industrial output, rising payrolls, lower fuel costs and growing consumer confidence all combined to push GDP growth in the third quarter to an annual rate of 3.9%.
As we would expect, the majority of performance of the Fund was driven by stock selection. Amongst the top performers were Royal Caribbean Cruises (holiday cruises), Ryanair (budget airline), Naspers (South African pay TV and social media), and CarMax (used car retailer). Royal Caribbean has continued to see strong yield growth driven by three main factors: 1) an improving economic outlook (particularly in its domestic U.S. market); 2) global capacity growth is set to decelerate to 4% in 2015 from 5.2% in 2014; and 3) positive pricing trends resulting from slowing capacity growth. Ryanair was also a strong contributor. Its unit operating cost advantage, combined with a new customer friendly service offering, means it is taking share from heavily burdened national flag carriers. Naspers has a significant stake in the Chinese gaming and e-commerce site, Tencent, and its share price is highly correlated to Tencent's. Tencent continues to deliver strong revenue and profit growth. Its market share remains at very high levels with around 40% of Chinese mobile gaming users and its pipeline of future games appears to be solid. The company was also the first of the large internet players to receive a private banking licence from China's banking regulators in July which will be crucial in driving forward the integration of its e-commerce services. Finally, CarMax, the U.S. based used car retailer, has seen a rebound in its share price as it
benefits from a strengthening U.S. economy. A doubling of its store base and potential market share gains to the 15% level it enjoys in its best markets could drive a huge increase in sales over the next ten years.
The two largest stock detractors were Rolls-Royce (UK engineering company) and Ultra Petroleum (low cost U.S. gas producer). Rolls-Royce has seen an extended period of share price weakness following guidance in February of flat revenues and profits for 2014. This was followed later in the year by management guiding down revenues by 4% for 2014 and falling revenues and profits for 2015 on the back of weak sales in its Energy and Power Systems divisions. We remain confident in the long-term prospects for Rolls-Royce as the order book for the Aerospace division is sizable and, as the installed base increases, aftercare service contracts provide an opportunity for margin growth. Ultra Petroleum was a significant detractor as its share price behaves as a proxy for sentiment on both natural gas and oil prices. However we remain confident in the investment thesis, with the company having an excellent production track record.
Being long-term investors, portfolio turnover remains low, so changes from one year to the next tend not to be dramatic. In the year to the end of December 2014, the average stock holding period was slightly more than 5 years. We have continued to sell companies where we think the outlook is uninspiring — these include Deere (tractor manufacturer), Investor (Swedish holding company) and Progressive (auto insurance). We have also sold holdings where the investment case has played out as we had hoped and where valuations now look stretched, for example Walt Disney (media conglomerate) and Namco Bandai (Japanese games producer).
We have re-invested some of the proceeds in companies that demonstrate disruptive innovation and that are often led by charismatic founders who run the businesses for the long-term. In this regard we participated in the Alibaba IPO (Chinese ecommerce business) in September. We also purchased CyberAgent, a Japanese online advertising and blogging platform. We remain excited by previously unloved industries that are undergoing structural change. This led us to take a holding in SK Hynix (South Korean semiconductor manufacturer) which should benefit from supply-side consolidation and positive pricing trends. And finally, our view on Emerging Markets has shifted away from those countries whose economies are reliant on commodities (for example Brazil and South Africa), to those in Asia which have harnessed the power of innovation and reform and are being boosted
11
Annual Report December 31, 2014
by a burgeoning, consumption focused middle class, a factor behind taking a stake in the Asian life insurer, AIA.
Investment Strategies used to manage the Fund
Baillie Gifford is a growth manager with a bottom-up approach to stock picking. We aim to invest in companies that will generate sustainable earnings growth above the market over the long term. In determining the potential of a company, we analyse industry background, competitive advantage, management attitudes and financial strength, and finally we consider valuation. We meet the management of the companies within our investment universe and revisit the investment case for the portfolio's holdings on a regular basis to ensure that our expectations are being met.
The Global Alpha investment team is responsible for the overall strategy and stock selection process. It meets regularly as part of a Portfolio Review Group, along with representatives from each of Baillie Gifford's regional
investment teams, to discuss both buy and sell ideas and the level of conviction in the current holdings.
Outlook
We continue to find that the many of the companies held in the Fund are still reporting strong growth. Equities are a volatile asset class, and markets are not always logical, so it is reasonable to expect that, looking forward to 2015, there will be further periods when fundamentals and share prices become disconnected. Guarding against the myopic short-termism of the market, our job is to closely monitor the fundamentals of the Fund's holdings, and review the progress they are making towards the goals we think they can achieve. The headlines will no doubt be filled with seemingly important macro-economic news, but we think that long-term corporate value lies in fundamentals. It is our adherence to this philosophy that gives us confidence that we can continue to deliver very worthwhile active equity returns over the long term.
Fund Performance for periods ended 12/31/14 (Average Annual Total Returns) (unaudited)
| | One Year | | Since Inception
% p.a.
(November 15, 2011) | |
The Global Alpha Fund Class 3* | | | 4.48 | % | | | 15.65 | % | |
MSCI AC World Index | | | 4.71 | % | | | 14.21 | % | |
* The returns for Class 3 shares have been provided. The 2014 return figures for the other share classes are as follows: 4.49% for Class 2. Additional calendar year returns for each class are available in the Financial Highlights section.
Comparison of the change in value of $1,000,000 investment in the Fund's Class 3 shares and the Index

Past performance does not predict future performance. The graph and the table above do not reflect the deduction of taxes that a shareholder would pay on Fund distributions or redemptions of Fund shares.
12
Annual Report December 31, 2014
EAFE Pure Fund
Market Conditions and Review of Performance during 2014
2014 proved to be an eventful period in terms of news. The main themes through the year were a strong U.S., a soggy Europe, a pick-up in the UK and a slowing in China. The end of 2014 saw markets jitter on the back of a significant weakening in the oil price, while geopolitics came to the fore in markets such as Russia. The International Focus team prefers to concentrate on individual companies and what we think is likely to happen to their fortunes over long periods of time, rather than short-term macro events.
The EAFE Pure Fund Class 2 produced a return of -5.79% since inception (15th April 2014), underperforming the benchmark which fell by -3.74% over the same time period.
Despite the Japanese economy falling back into recession during the third quarter, Shimano, the cycling component company, was the top contributor during 2014. Great operating results were the main contributing factor. The market continues to grow attractively and the combination of Shimano's competitive advantage, strong brand and commitment to Research & Development should promote continued growth in the future. It is also a good example of one of the many exceptionally well-managed companies held in the Fund. The company remains under the careful stewardship of the Shimano family, with Yozo Shimano, President/CEO since 2001, having worked for the company since 1974.
Cochlear enjoyed a good set of results in the second half of 2014, which came in ahead of consensus. Incidentally, the Australian hearing implant company's founder, Graeme Clark, has since jointly received the 2015 Russ Prize (one of the world's top prizes for engineering) for his life's work with cochlear implants. Cochlear recently oversaw a successful launch of its next generation implant, supporting our belief that this company can continue to innovate and deliver long-term growth.
ASOS, the online fashion retailer, had a difficult year, with operational missteps and a fire at its principal distribution facility doing little to help the shares. We remain enthusiastic about the long-term potential of this business, which continues to grow its sales at a rapid rate.
Some of the Fund's holdings in energy companies underperformed on the back of lower energy prices. Of particular note was the holding in BG Group, the energy exploration and production company. However, we remain
excited by the developments it has underway in Australia and Brazil. The company recently loaded its first cargo of liquefied natural gas in Australia, and the ramp up in production both there and in Brazil remain on track. We continue to think these should lead to material profit growth over the years to come. It is worth highlighting that the Fund does not hold many energy stocks.
Carlsberg, the Danish brewing company, also featured among the top detractors to performance in 2014, reflecting concerns over the company's Russian operations. It is evident that Russia is facing some very strong headwinds at the moment, and we are mindful of, and continue to monitor, Carlsberg's exposure to the region. However, Russia is one of a number of strings to Carlsberg's investment bow and we continue to be excited about the long-term growth opportunity that Carlsberg can capitalise on. For example, some fast-growing Asian markets give significant cause for optimism.
Investment Strategies used to manage the Fund
Baillie Gifford is a growth manager with a bottom-up approach to stock picking. We aim to invest in companies that will generate sustainable earnings growth above the market over the long term. In determining the potential of a company, we analyse industry background, competitive advantage, management attitudes and financial strength, and finally we consider valuation. We meet the management of the companies within our investment universe and revisit the investment case for the Fund's holdings on a regular basis to ensure that our expectations are being met.
The International Focus Portfolio Construction Group is responsible for the overall strategy and stock selection process. They meet regularly to discuss both buy and sell ideas and the level of conviction for existing holdings and will continue to monitor the long-term prospects for the Fund's holdings and make changes where appropriate.
Outlook
We prefer to set the goalposts for our investments based on fundamental research and not to change the parameters based on shorter-term predictions or pure guesswork, although we will review and ask ourselves 'what would make us sell?'. As long-term investors, we remain optimistic and confident that the Fund contains a range of exciting and interesting businesses with great potential.
13
Annual Report December 31, 2014
Fund Performance for the period ended 12/31/14 (Average Annual Total Return) (unaudited)
| | Since Inception
% p.a.
(April 15, 2014) | |
The EAFE Pure Fund Class 2 | | | -5.79 | % | |
MSCI EAFE Index | | | -3.74 | % | |
Comparison of the change in value of $1,000,000 investment in the Fund's Class 2 shares and the Index (unaudited)

Past performance does not predict future performance. The graph and the table above do not reflect the deduction of taxes that a shareholder would pay on the Fund distributions or redemption of Fund shares.
14
Annual Report December 31, 2014
Long Term Global Growth Equity Fund
Market Conditions and Review of Performance during 2014
As long-term investors, we focus on companies and their prospects over five to ten years, so we place more emphasis on performance attribution over much longer periods than the inception date of the Fund (10th June 2014) currently allows. The Long Term Global Growth Equity Fund Class 2 returned 4.39% since the Fund's inception on 10th June 2014, whereas the MSCI All Countries World Index returned -1.20% over that short period.
The Chinese search engine, Baidu, was the top performer over this time period, following excellent results. Highlights included a 60% increase in revenue year-on-year, a significant increase given that the company already generates over $5bn in revenue. Perhaps most intriguing of all is revenue derived from mobile now accounts for over 30% of the total. In 2012 there was a lot of angst as market participants questioned Baidu's ability to embrace the platform shift to mobile; this has proved to be misplaced. With mobile search expected to surpass PC search this year in China, Baidu is the clear leader in mobile search and is in an excellent position to maintain its already substantial share of the Chinese market. Intuitive Surgical also rebounded from a period of weakness on the back of an improvement in the volume of procedures carried out by its surgical robots. The social network businesses, LinkedIn and Facebook, also did well after reporting increases in revenues and proving that they can continue to expand their respective user bases.
In contrast, Amazon endured a volatile period as it continued to disappoint the market with its desire to invest for the future at the expense of short-term margins. We remain encouraged by the company's focus on the long term and desire to experiment but we are reflecting on its struggles to break into the Chinese market. Although we feel that Ctrip has a formidable position as the travel agent for business people in China, mass market travel is proving to be a highly competitive area and its shares were weak on the back of concerns that this will impact margins.
Although we expect stock market performance to remain volatile, we remain confident in the prospects for substantial growth in the Fund's holdings over the longer term.
Investment Strategies used to manage the Fund
Baillie Gifford is a growth manager with a bottom-up approach to stock picking. We aim to invest in companies that will generate sustainable earnings growth above the market over the long term. In determining the potential of a company, we analyse industry background, competitive advantage, management attitudes and financial strength, and finally we consider valuation. We meet the management of the companies within our investment universe and revisit the investment case for the portfolio's holdings on a regular basis to ensure that our expectations are being met.
The Long Term Global Growth team is responsible for the overall strategy and stock selection process. It meets regularly to discuss both buy and sell ideas and the level of conviction for existing holdings and will continue to monitor the long-term prospects for the Fund's holdings and make changes where appropriate.
Outlook
In recent years, our focus on identifying companies with the potential to deliver a high level of sustained growth has led us to focus on areas where change is taking place, often underpinned by rapid technological progress. This has drawn us to companies in the consumer internet area and despite the success of companies such as Alibaba, Amazon and Facebook, we believe the addressable opportunity for such companies remains very large indeed. Amazon is only just beginning to tap into the grocery market for example, whilst Facebook still commands only a fraction of the global advertising market.
Technological progress is also creating opportunities in an increasingly broad range of areas beyond the consumer internet. Tesla's progress in electric vehicles is revolutionising the automotive industry. Illumina's continued progress in genomics has extensive ramifications for global healthcare systems whilst stocks such as Lending Club and Stratasys are revolutionising the banking and manufacturing sectors.
15
Annual Report December 31, 2014
Fund Performance for the period ended 12/31/14 (Average Annual Total Return) (unaudited)
| | Since Inception
% p.a.
(June 10, 2014) | |
The Long Term Global Growth Equity Class 2 | | | 4.39 | % | |
MSCI EAFE Index | | | -1.20 | % | |
Comparison of the change in value of $1,000,000 investment in the Fund's Class 2 shares and the Index (unaudited)
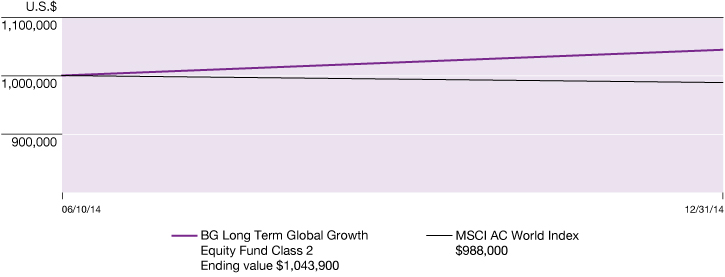
Past performance does not predict future performance. The graph and the table above do not reflect the deduction of taxes that a shareholder would pay on the Fund distributions or redemption of Fund shares.
16
Annual Report December 31, 2014
Fund Expenses (unaudited)
As a shareholder of the Baillie Gifford International Equity Fund, the Baillie Gifford International Choice Fund, the Baillie Gifford EAFE Fund, the Baillie Gifford EAFE Choice Fund, the Baillie Gifford Emerging Markets Fund, the Baillie Gifford Global Alpha Equity Fund, the Baillie Gifford EAFE Pure Fund and/or the Baillie Gifford Long Term Global Growth Equity Fund (together, the "Funds") you incur two types of costs: (1) transaction costs, which may include purchase premiums and redemption fees and (2) ongoing costs, including management fees, shareholder service fees and other Fund expenses. This example is intended to help you understand your ongoing costs (in dollars) of investing in the Funds and to compare these costs with the ongoing costs of investing in the other mutual funds.
The example is based on an investment of $1,000 invested at the beginning of the period and held for the entire period from July 1, 2014 to December 31, 2014.
Actual Expenses
The first line of each table provides information about actual account values and actual expenses. You may use the information in this line, together with the amount you invested, to estimate the expenses that you paid over the period. Simply divide the account value by $1,000 (for example, an $8,600 account value divided by $1,000 = 8.6), then multiply the result by the number in the first line under the heading entitled "Expenses Paid During the Period" to estimate the expenses you paid on your account during this period.
Hypothetical Example for Comparison Purposes
The second line of each table on the following page provides information about hypothetical account values and hypothetical expenses based on the Fund's actual expense ratio and an assumed annual rate of return of 5% before expenses, which is not the Fund's actual return. The hypothetical account values and expenses may not be used to estimate the actual ending account balance or expenses you paid for the period. You may use this information to compare the ongoing costs of investing in the Fund and other funds by comparing this 5% hypothetical example with the 5% hypothetical examples that appear in the shareholder reports of other funds.
Please note that the expenses shown in the table are meant to highlight your ongoing costs only and do not reflect any transactional costs, such as purchase premiums and redemption fees. Therefore, the second line of the table is useful in comparing ongoing costs only, and will not help you determine the relative total costs of owning different funds. In addition, if these transactional costs were included, your costs would have been higher.
17
Fund Expenses (unaudited)
Annual Report December 31, 2014
| | | Beginning
Account Value
7/01/14 | | Ending
Account
Value
12/31/14 | | Annualized
Expense Ratios
Based on the Period
7/01/14 to12/31/14 | | Expenses Paid
During Period | |
Baillie Gifford International Equity Fund — Class 1 | |
Actual | | $ | 1,000 | | | $ | 938.80 | | | | 0.80 | % | | $ | 3.91 | | |
Hypothetical (5% return before expenses) | | $ | 1,000 | | | $ | 1,021.17 | | | | 0.80 | % | | $ | 4.08 | | |
Baillie Gifford International Equity Fund — Class 2 | |
Actual | | $ | 1,000 | | | $ | 939.60 | | | | 0.62 | % | | $ | 3.03 | | |
Hypothetical (5% return before expenses) | | $ | 1,000 | | | $ | 1,022.08 | | | | 0.62 | % | | $ | 3.16 | | |
Baillie Gifford International Equity Fund — Class 3 | |
Actual | | $ | 1,000 | | | $ | 939.40 | | | | 0.55 | % | | $ | 2.69 | | |
Hypothetical (5% return before expenses) | | $ | 1,000 | | | $ | 1,022.43 | | | | 0.55 | % | | $ | 2.80 | | |
Baillie Gifford International Equity Fund — Class 4 | |
Actual | | $ | 1,000 | | | $ | 940.20 | | | | 0.52 | % | | $ | 2.54 | | |
Hypothetical (5% return before expenses) | | $ | 1,000 | | | $ | 1,022.58 | | | | 0.52 | % | | $ | 2.65 | | |
Baillie Gifford International Equity Fund — Class 5 | |
Actual | | $ | 1,000 | | | $ | 940.30 | | | | 0.47 | % | | $ | 2.30 | | |
Hypothetical (5% return before expenses) | | $ | 1,000 | | | $ | 1,022.84 | | | | 0.47 | % | | $ | 2.40 | | |
Baillie Gifford International Choice Fund — Class 1 | |
Actual | | $ | 1,000 | | | $ | 918.70 | | | | 0.86 | % | | $ | 4.16 | | |
Hypothetical (5% return before expenses) | | $ | 1,000 | | | $ | 1,020.87 | | | | 0.86 | % | | $ | 4.38 | | |
Baillie Gifford International Choice Fund — Class 2 | |
Actual | | $ | 1,000 | | | $ | 918.90 | | | | 0.68 | % | | $ | 3.29 | | |
Hypothetical (5% return before expenses) | | $ | 1,000 | | | $ | 1,021.78 | | | | 0.68 | % | | $ | 3.47 | | |
Baillie Gifford International Choice Fund — Class 3 | |
Actual | | $ | 1,000 | | | $ | 919.60 | | | | 0.61 | % | | $ | 2.95 | | |
Hypothetical (5% return before expenses) | | $ | 1,000 | | | $ | 1,022.13 | | | | 0.61 | % | | $ | 3.11 | | |
Baillie Gifford EAFE Fund — Class 2 | |
Actual | | $ | 1,000 | | | $ | 920.30 | | | | 0.62 | % | | $ | 3.00 | | |
Hypothetical (5% return before expenses) | | $ | 1,000 | | | $ | 1,022.08 | | | | 0.62 | % | | $ | 3.16 | | |
18
Fund Expenses (unaudited)
Annual Report December 31, 2014
| | | Beginning
Account Value
7/01/14 | | Ending
Account
Value
12/31/14 | | Annualized
Expense Ratios
Based on the Period
7/01/14 to12/31/14 | | Expenses Paid
During Period | |
Baillie Gifford EAFE Fund — Class 3 | |
Actual | | $ | 1,000 | | | $ | 920.40 | | | | 0.55 | % | | $ | 2.66 | | |
Hypothetical (5% return before expenses) | | $ | 1,000 | | | $ | 1,022.43 | | | | 0.55 | % | | $ | 2.80 | | |
Baillie Gifford EAFE Fund — Class 4 | |
Actual | | $ | 1,000 | | | $ | 920.80 | | | | 0.52 | % | | $ | 2.52 | | |
Hypothetical (5% return before expenses) | | $ | 1,000 | | | $ | 1,022.58 | | | | 0.52 | % | | $ | 2.65 | | |
Baillie Gifford EAFE Fund — Class 5 | |
Actual | | $ | 1,000 | | | $ | 920.60 | | | | 0.47 | % | | $ | 2.28 | | |
Hypothetical (5% return before expenses) | | $ | 1,000 | | | $ | 1,022.84 | | | | 0.47 | % | | $ | 2.40 | | |
Baillie Gifford EAFE Choice Fund — Class 1 | |
Actual | | $ | 1,000 | | | $ | 912.00 | | | | 0.83 | % | | $ | 4.00 | | |
Hypothetical (5% return before expenses) | | $ | 1,000 | | | $ | 1,021.02 | | | | 0.83 | % | | $ | 4.23 | | |
Baillie Gifford EAFE Choice Fund — Class 2 | |
Actual | | $ | 1,000 | | | $ | 913.00 | | | | 0.65 | % | | $ | 3.13 | | |
Hypothetical (5% return before expenses) | | $ | 1,000 | | | $ | 1,021.93 | | | | 0.65 | % | | $ | 3.31 | | |
Baillie Gifford EAFE Choice Fund — Class 3* | |
Actual | | $ | 1,000 | | | $ | 910.40 | | | | 0.58 | % | | $ | 2.69 | | |
Hypothetical (5% return before expenses) | | $ | 1,000 | | | $ | 1,022.28 | | | | 0.58 | % | | $ | 2.96 | | |
Baillie Gifford Emerging Markets Fund — Class III | |
Actual | | $ | 1,000 | | | $ | 922.10 | | | | 0.75 | % | | $ | 3.63 | | |
Hypothetical (5% return before expenses) | | $ | 1,000 | | | $ | 1,021.42 | | | | 0.75 | % | | $ | 3.82 | | |
Baillie Gifford Global Alpha Equity Fund — Class 2 | |
Actual | | $ | 1,000 | | | $ | 987.40 | | | | 0.69 | % | | $ | 3.46 | | |
Hypothetical (5% return before expenses) | | $ | 1,000 | | | $ | 1,021.73 | | | | 0.69 | % | | $ | 3.52 | | |
Baillie Gifford Global Alpha Equity Fund — Class 3 | |
Actual | | $ | 1,000 | | | $ | 987.70 | | | | 0.61 | % | | $ | 3.06 | | |
Hypothetical (5% return before expenses) | | $ | 1,000 | | | $ | 1,022.13 | | | | 0.61 | % | | $ | 3.11 | | |
19
Fund Expenses (unaudited)
Annual Report December 31, 2014
| | | Beginning
Account Value
7/01/14 | | Ending
Account
Value
12/31/14 | | Annualized
Expense Ratios
Based on the Period
7/01/14 to12/31/14 | | Expenses Paid
During Period | |
Baillie Gifford EAFE Pure Fund — Class 2 | |
Actual | | $ | 1,000 | | | $ | 905.80 | | | | 0.68 | % | | $ | 3.27 | | |
Hypothetical (5% return before expenses) | | $ | 1,000 | | | $ | 1,021.78 | | | | 0.68 | % | | $ | 3.47 | | |
Baillie Gifford Long Term Global Growth Equity Fund — Class 2 | |
Actual | | $ | 1,000 | | | $ | 1,006.70 | | | | 0.80 | % | | $ | 4.05 | | |
Hypothetical (5% return before expenses) | | $ | 1,000 | | | $ | 1,021.17 | | | | 0.80 | % | | $ | 4.08 | | |
* Commencement of operations on July 7, 2014.
Expenses are calculated using the annualized expense ratio for the Funds, which represents the ongoing expenses as a percentage of net assets for the six-months ended December 31, 2014. Expenses are calculated by multiplying the annualized expense ratio by the average account value for the period; then multiplying the result
by the number of days in the most recent fiscal half-year; and then dividing that result by the number of days in the calendar year. Expense ratios for the most recent fiscal half-year may differ from expense ratios based on the one-year data in the financial highlights.
20
Industry Diversification Table
Annual Report December 31, 2014
December 31, 2014 (unaudited)
Baillie Gifford International Equity Fund
| | | Value | | % of Total
Net Assets | |
Aerospace | | $ | 17,014,649 | | | | 0.7 | % | |
Aerospace/Defense | | | 37,237,355 | | | | 1.6 | | |
Airlines | | | 66,186,741 | | | | 2.9 | | |
Apparel | | | 27,546,863 | | | | 1.2 | | |
Apparel Retailers | | | 45,509,531 | | | | 2.0 | | |
Asset Managers | | | 22,019,475 | | | | 1.0 | | |
Auto Manufacturers | | | 45,528,104 | | | | 2.0 | | |
Banks | | | 179,277,082 | | | | 7.8 | | |
Beverages, Food & Tobacco | | | 70,334,071 | | | | 3.1 | | |
Biotechnology | | | 23,783,199 | | | | 1.0 | | |
Chemicals | | | 21,848,772 | | | | 1.0 | | |
Clothing & Accessories | | | 31,185,980 | | | | 1.4 | | |
Commercial Services | | | 93,955,031 | | | | 4.1 | | |
Construction & Building Materials | | | 75,446,446 | | | | 3.3 | | |
Containers & Packaging | | | 24,872,418 | | | | 1.1 | | |
Distillers & Vintners | | | 11,825,586 | | | | 0.5 | | |
Distribution/Wholesale | | | 24,082,448 | | | | 1.1 | | |
Diversified Financial Services | | | 76,698,310 | | | | 3.3 | | |
Electronic & Electrical Equipment | | | 87,873,603 | | | | 3.8 | | |
Exploration & Production | | | 12,623,358 | | | | 0.6 | | |
Food Producers & Processors | | | 67,925,986 | | | | 3.0 | | |
Food Products | | | 62,077,401 | | | | 2.7 | | |
Food Retailers & Wholesalers | | | 23,164,923 | | | | 1.0 | | |
General Mining | | | 13,238,146 | | | | 0.6 | | |
General Retailers | | | 6,876,676 | | | | 0.3 | | |
Healthcare — Products | | | 30,327,085 | | | | 1.3 | | |
Industrial Engineering | | | 15,876,495 | | | | 0.7 | | |
Industrial Machinery | | | 108,260,276 | | | | 4.7 | | |
Industrial Suppliers | | | 33,547,969 | | | | 1.5 | | |
Insurance | | | 169,632,186 | | | | 7.4 | | |
Integrated Oil & Gas | | | 13,845,380 | | | | 0.6 | | |
Internet | | | 118,882,866 | | | | 5.2 | | |
Investment Companies | | | 14,790,808 | | | | 0.6 | | |
Investment Services | | | 32,633,339 | | | | 1.4 | | |
Machinery — Diversified | | | 21,995,044 | | | | 1.0 | | |
Media & Photography | | | 89,319,727 | | | | 3.9 | | |
Medical Equipment | | | 18,705,823 | | | | 0.8 | | |
Mining & Metals | | | 56,008,519 | | | | 2.4 | | |
Mobile Telecommunications | | | 25,792,334 | | | | 1.1 | | |
Oil & Gas | | | 27,842,712 | | | | 1.2 | | |
21
Industry Diversification Table
Annual Report December 31, 2014
| | | Value | | % of Total
Net Assets | |
Pharmaceuticals | | $ | 21,996,650 | | | | 1.0 | % | |
Recreational Products | | | 26,616,707 | | | | 1.2 | | |
Retailers — General | | | 29,874,848 | | | | 1.3 | | |
Semiconductors | | | 138,772,290 | | | | 6.1 | | |
Software & Computer Services | | | 28,249,213 | | | | 1.2 | | |
Specialized Consumer Services | | | 33,885,686 | | | | 1.5 | | |
Transportation | | | 28,049,044 | | | | 1.2 | | |
Total Value of Investments | | | 2,253,037,155 | | | | 98.4 | | |
Other assets less liabilities | | | 36,177,629 | | | | 1.6 | | |
Net Assets | | $ | 2,289,214,784 | | | | 100.0 | % | |
22
Annual Report December 31, 2014
December 31, 2014
Baillie Gifford International Equity Fund
| | | Shares | | Value | |
COMMON STOCKS — 97.6% | |
ARGENTINA — 1.6% | |
MercadoLibre, Inc. | | | 294,209 | | | $ | 37,561,663 | | |
AUSTRALIA — 2.4% | |
Brambles Ltd. | | | 2,887,363 | | | | 24,872,418 | | |
Cochlear Ltd. | | | 296,509 | | | | 18,705,823 | | |
Treasury Wine Estates Ltd. | | | 3,063,803 | | | | 11,825,586 | | |
| | | | | | 55,403,827 | | |
BERMUDA — 0.2% | |
Seadrill Ltd. | | | 354,612 | | | | 4,102,920 | | |
BRAZIL — 1.0% | |
Embraer SA ADR | | | 641,932 | | | | 23,661,614 | | |
CANADA — 2.9% | |
Cenovus Energy, Inc. | | | 354,663 | | | | 7,317,328 | | |
Fairfax Financial Holdings Ltd. | | | 87,275 | | | | 45,731,860 | | |
Ritchie Bros. Auctioneers, Inc. | | | 533,550 | | | | 14,347,160 | | |
| | | | | | 67,396,348 | | |
CHINA — 6.0% | |
Baidu, Inc. ADR (a) | | | 192,864 | | | | 43,967,206 | | |
Hang Seng Bank Ltd. | | | 1,469,800 | | | | 24,428,767 | | |
Hong Kong Exchanges and Clearing Ltd. | | | 1,929,100 | | | | 42,588,224 | | |
Sun Art Retail Group Ltd. | | | 6,916,500 | | | | 6,876,676 | | |
Want Want China Holdings Ltd. | | | 14,398,000 | | | | 18,923,467 | | |
| | | | | | 136,784,340 | | |
DENMARK — 3.2% | |
DSV A/S | | | 921,181 | | | | 28,049,044 | | |
Novo Nordisk A/S, B Shares | | | 520,018 | | | | 21,996,650 | | |
Novozymes A/S, B Shares | | | 565,008 | | | | 23,783,199 | | |
| | | | | | 73,828,893 | | |
FINLAND — 1.5% | |
Sampo Oyj, A Shares | | | 722,479 | | | | 33,822,509 | | |
The accompanying notes are an integral part of the financial statements.
23
Annual Report December 31, 2014
December 31, 2014
Baillie Gifford International Equity Fund
| | | Shares | | Value | |
FRANCE — 4.8% | |
Compagnie Generale d'Optique Essillor International SA | | | 271,944 | | | $ | 30,327,085 | | |
Edenred | | | 650,851 | | | | 17,999,985 | | |
Kone Oyj, B Shares | | | 680,035 | | | | 30,960,535 | | |
Lafarge SA | | | 421,756 | | | | 29,607,389 | | |
| | | | | | 108,894,994 | | |
GERMANY — 6.4% | |
Brenntag AG | | | 390,783 | | | | 21,848,772 | | |
Continental AG | | | 159,778 | | | | 33,700,910 | | |
Deutsche Boerse AG | | | 480,004 | | | | 34,110,086 | | |
MTU Aero Engines AG | | | 156,212 | | | | 13,575,741 | | |
SAP SE | | | 404,551 | | | | 28,249,213 | | |
Sky Deutschland AG (a) | | | 1,963,362 | | | | 15,860,312 | | |
| | | | | | 147,345,034 | | |
INDIA — 0.7% | |
IDFC Ltd. | | | 5,975,174 | | | | 14,790,808 | | |
IRELAND — 4.1% | |
CRH Plc. | | | 922,552 | | | | 22,121,713 | | |
James Hardie Industries Plc. SE CDI | | | 2,221,712 | | | | 23,717,344 | | |
Ryanair Holdings Plc. ADR (a) | | | 666,006 | | | | 47,466,248 | | |
| | | | | | 93,305,305 | | |
JAPAN — 9.7% | |
FANUC Corp. | | | 133,400 | | | | 21,995,044 | | |
Fast Retailing Co., Ltd. | | | 75,700 | | | | 27,546,863 | | |
Japan Exchange Group, Inc. | | | 1,399,900 | | | | 32,633,339 | | |
Rakuten, Inc. | | | 2,436,800 | | | | 33,885,686 | | |
Shimano, Inc. | | | 205,500 | | | | 26,616,707 | | |
SMC Corp. | | | 123,200 | | | | 32,306,008 | | |
Tokyo Electron Ltd. | | | 290,100 | | | | 21,998,345 | | |
Toyota Tsusho Corp. | | | 1,036,700 | | | | 24,082,448 | | |
| | | | | | 221,064,440 | | |
The accompanying notes are an integral part of the financial statements.
24
Annual Report December 31, 2014
December 31, 2014
Baillie Gifford International Equity Fund
| | | Shares | | Value | |
NETHERLANDS — 3.2% | |
Heineken Holding NV | | | 478,235 | | | $ | 29,938,327 | | |
Unilever NV CVA | | | 796,714 | | | | 31,165,728 | | |
Yandex NV, Class A (a) | | | 684,045 | | | | 12,285,448 | | |
| | | | | | 73,389,503 | | |
PERU — 0.9% | |
Credicorp Ltd. | | | 126,686 | | | | 20,292,563 | | |
PORTUGAL — 0.2% | |
Galp Energia, SGPS, SA | | | 477,745 | | | | 4,851,516 | | |
RUSSIA — 1.0% | |
Magnit OJSC GDR Reg S | | | 512,578 | | | | 23,164,923 | | |
SINGAPORE — 1.7% | |
United Overseas Bank Ltd. | | | 2,100,204 | | | | 38,757,279 | | |
SOUTH AFRICA — 3.7% | |
Massmart Holdings Ltd. | | | 915,459 | | | | 11,218,899 | | |
Naspers Ltd., N Shares | | | 567,889 | | | | 73,459,415 | | |
| | | | | | 84,678,314 | | |
SOUTH KOREA — 5.3% | |
Hyundai Mobis Co., Ltd. (a) | | | 55,281 | | | | 11,827,194 | | |
NAVER Corp. (a) | | | 39,143 | | | | 25,068,549 | | |
Samsung Electronics Co., Ltd. | | | 48,631 | | | | 58,466,352 | | |
SK Telecom Co., Ltd. | | | 105,450 | | | | 25,792,334 | | |
| | | | | | 121,154,429 | | |
SPAIN — 1.6% | |
Inditex SA | | | 1,251,446 | | | | 35,698,081 | | |
SWEDEN — 5.0% | |
Atlas Copco AB, B Shares | | | 1,757,717 | | | | 44,993,733 | | |
Svenska Handelsbanken AB, A Shares | | | 1,162,909 | | | | 54,410,043 | | |
Volvo AB, B Shares | | | 1,472,296 | | | | 15,876,495 | | |
| | | | | | 115,280,271 | | |
The accompanying notes are an integral part of the financial statements.
25
Annual Report December 31, 2014
December 31, 2014
Baillie Gifford International Equity Fund
| | | Shares | | Value | |
SWITZERLAND — 3.4% | |
Compagnie Financiere Richemont SA | | | 185,000 | | | $ | 16,401,846 | | |
Nestle SA | | | 851,530 | | | | 62,077,401 | | |
| | | | | | 78,479,247 | | |
TAIWAN — 4.0% | |
Hon Hai Precision Industry Co., Ltd. GDR Reg S | | | 3,472,420 | | | | 19,480,276 | | |
Taiwan Semiconductor Manufacturing Co., Ltd. | | | 16,392,000 | | | | 72,214,488 | | |
| | | | | | 91,694,764 | | |
TURKEY — 0.8% | |
BIM Birlesik Magazalar A/S | | | 834,084 | | | | 17,836,791 | | |
UNITED KINGDOM — 20.7% | |
Amlin Plc. | | | 3,517,822 | | | | 26,094,602 | | |
Antofagasta Plc. | | | 1,126,890 | | | | 13,130,517 | | |
ARM Holdings Plc. | | | 2,900,551 | | | | 44,559,457 | | |
ASOS Plc. (a) | | | 246,780 | | | | 9,811,449 | | |
BG Group Plc. | | | 1,034,648 | | | | 13,845,380 | | |
BHP Billiton Plc. | | | 617,699 | | | | 13,238,146 | | |
British American Tobacco Plc. | | | 745,432 | | | | 40,395,744 | | |
Burberry Group Plc. | | | 582,700 | | | | 14,784,134 | | |
Capita Plc. | | | 1,896,258 | | | | 31,795,914 | | |
Experian Plc. | | | 1,768,523 | | | | 29,811,972 | | |
Hargreaves Lansdown Plc. | | | 1,407,272 | | | | 22,019,475 | | |
Petrofac Ltd. | | | 1,062,142 | | | | 11,570,948 | | |
Premier Farnell Plc. | | | 3,631,434 | | | | 9,926,974 | | |
Prudential Plc. | | | 1,813,569 | | | | 41,928,859 | | |
Rio Tinto Plc. | | | 930,166 | | | | 42,878,002 | | |
Rolls-Royce Holdings Plc. | | | 1,266,549 | | | | 17,014,649 | | |
St James's Place Plc. | | | 1,749,108 | | | | 22,054,357 | | |
Standard Chartered Plc. | | | 1,458,024 | | | | 21,806,103 | | |
Tullow Oil Plc. | | | 1,958,820 | | | | 12,623,358 | | |
Wolseley Plc. | | | 586,791 | | | | 33,547,969 | | |
| | | | | | 472,838,009 | | |
The accompanying notes are an integral part of the financial statements.
26
Annual Report December 31, 2014
December 31, 2014
Baillie Gifford International Equity Fund
| | | Shares | | Value | |
UNITED STATES — 1.6% | |
Copa Holdings SA, Class A | | | 180,630 | | | $ | 18,720,493 | | |
PriceSmart, Inc. | | | 204,516 | | | | 18,655,950 | | |
| | | | | | 37,376,443 | | |
Total Common Stocks | |
(cost $1,777,867,686) | | | | | 2,233,454,828 | | |
PREFERRED STOCKS — 0.8% | |
BRAZIL — 0.8% | |
Itau Unibanco Holding SA ADR (cost $23,013,055) | | | 1,505,175 | | | | 19,582,327 | | |
TOTAL INVESTMENTS — 98.4% | |
(cost $1,800,880,741) | | | | $ | 2,253,037,155 | | |
Other assets less liabilities — 1.6% | | | | | 36,177,629 | | |
NET ASSETS — 100.0% | | | | $ | 2,289,214,784 | | |
(a) Non-income producing security.
ADR — American Depositary Receipt.
CDI — Chess Depositary Interest.
CVA — Certificate Van Aandelen (Bearer).
GDR — Global Depositary Receipt.
Reg S — Regulation S ("Reg S") of the securities Act of 1933, as amended ("1933 Act") is a safe harbor that defines when an offering of securities will be deemed to come to rest abroad and therefore is not subject to the registration obligations imposed under Section 5 of the 1933 Act. The regulation includes two safe harbor provisions: an issuer safe harbor and a resale safe harbor. In each case, the regulation demands that offers and sales of the securities be made outside the United States and that no offering participant (which includes the issuer, the banks assisting with the offer and their respective affiliates) engage in "directed" selling efforts. In the case of issuers for whose securities there is substantial U.S. market interest, the regulation also requires that no offers and sales be made to U.S. persons (including U.S. persons physically located outside the United States).
The accompanying notes are an integral part of the financial statements.
27
Statement of Assets and Liabilities
Annual Report December 31, 2014
December 31, 2014
Baillie Gifford International Equity Fund
ASSETS | |
Investments, at value (cost $1,800,880,741) | | $ | 2,253,037,155 | | |
Cash | | | 34,826,983 | | |
Foreign cash, at value (cost $179,105) | | | 177,664 | | |
Receivable for investments sold | | | 2,428,683 | | |
Dividends receivable | | | 2,119,166 | | |
Tax reclaims receivable | | | 1,785,439 | | |
Total Assets | | | 2,294,375,090 | | |
LIABILITIES | |
Payable for investments purchased | | | 1,571,854 | | |
Distribution payable | | | 347,437 | | |
Management fee payable | | | 1,442,498 | | |
Servicing fee payable | | | 1,174,868 | | |
Trustee fee payable | | | 20,947 | | |
Accrued expenses | | | 602,702 | | |
Total Liabilities | | | 5,160,306 | | |
NET ASSETS | | $ | 2,289,214,784 | | |
COMPOSITION OF NET ASSETS | |
Paid-in capital | | $ | 1,851,200,591 | | |
Distributions in excess of net investment income | | | (1,917,295 | ) | |
Accumulated net realized loss on investments and foreign currency transactions | | | (12,030,998 | ) | |
Net unrealized appreciation in value of investments and foreign currencies | | | 451,962,486 | | |
NET ASSETS | | $ | 2,289,214,784 | | |
NET ASSET VALUE, PER SHARE | |
| Class 1 ($18,067,538 / 1,609,379 shares outstanding), unlimited authorized, no par value | | $ | 11.23 | | |
Maximum Purchase Price Per Share (Note D) | | $ | 11.26 | | |
Minimum Redemption Price Per Share (Note D) | | $ | 11.21 | | |
| Class 2 ($542,943,024 / 48,489,384 shares outstanding), unlimited authorized, no par value | | $ | 11.20 | | |
Maximum Purchase Price Per Share (Note D) | | $ | 11.23 | | |
Minimum Redemption Price Per Share (Note D) | | $ | 11.18 | | |
| Class 3 ($1,078,665,243 / 95,130,618 shares outstanding), unlimited authorized, no par value | | $ | 11.34 | | |
Maximum Purchase Price Per Share (Note D) | | $ | 11.37 | | |
Minimum Redemption Price Per Share (Note D) | | $ | 11.32 | | |
The accompanying notes are an integral part of the financial statements.
28
Statement of Assets and Liabilities
Annual Report December 31, 2014
| Class 4 ($352,889,781 / 30,430,226 shares outstanding), unlimited authorized, no par value | | $ | 11.60 | | |
Maximum Purchase Price Per Share (Note D) | | $ | 11.63 | | |
Minimum Redemption Price Per Share (Note D) | | $ | 11.58 | | |
| Class 5 ($296,649,198 / 25,425,829 shares outstanding), unlimited authorized, no par value | | $ | 11.67 | | |
Maximum Purchase Price Per Share (Note D) | | $ | 11.71 | | |
Minimum Redemption Price Per Share (Note D) | | $ | 11.65 | | |
The accompanying notes are an integral part of the financial statements.
29
Annual Report December 31, 2014
For the Year Ended December 31, 2014
Baillie Gifford International Equity Fund
INVESTMENT INCOME | |
Dividends (net of foreign withholding taxes of $6,819,124) | | $ | 55,215,097 | | |
Interest | | | 822 | | |
Total Investment Income | | | 55,215,919 | | |
EXPENSES | |
Management fee (Note B) | | | 6,112,336 | | |
Shareholder servicing fees — Class 1 Shares (Note B) | | | 106,213 | | |
Shareholder servicing fees — Class 2 Shares (Note B) | | | 1,436,283 | | |
Shareholder servicing fees — Class 3 Shares (Note B) | | | 2,472,481 | | |
Shareholder servicing fees — Class 4 Shares (Note B) | | | 728,366 | | |
Shareholder servicing fees — Class 5 Shares (Note B) | | | 269,621 | | |
Fund accounting | | | 1,195,919 | | |
Custody | | | 397,854 | | |
Legal | | | 286,080 | | |
Trustees' fees | | | 86,436 | | |
Professional fees | | | 81,157 | | |
Transfer agency | | | 47,341 | | |
Insurance | | | 29,628 | | |
Miscellaneous | | | 66,816 | | |
Total Expenses | | | 13,316,531 | | |
Net Investment Income | | | 41,899,388 | | |
REALIZED AND UNREALIZED GAIN (LOSS) ON INVESTMENTS
AND FOREIGN CURRENCY TRANSACTIONS | |
Net realized gain (loss) from: | |
Investments | | | 28,730,742 | | |
Foreign currency transactions | | | (720,786 | ) | |
| | | | 28,009,956 | | |
Net increase (decrease) in unrealized appreciation (depreciation) on: | |
Investments | | | (138,306,187 | ) | |
Translation of assets and liabilities in foreign currencies | | | (249,240 | ) | |
| | | | (138,555,427 | ) | |
Net realized and unrealized loss on investments and foreign currency transactions | | | (110,545,471 | ) | |
NET DECREASE IN NET ASSETS FROM OPERATIONS | | $ | (68,646,083 | ) | |
The accompanying notes are an integral part of the financial statements.
30
Statements of Changes in Net Assets
Annual Report December 31, 2014
Baillie Gifford International Equity Fund
| | | For the
Year Ended
December 31,
2014 | | For the
Year Ended
December 31,
2013 | |
INCREASE (DECREASE) IN NET ASSETS FROM OPERATIONS | |
Net investment income | | $ | 41,899,388 | | | $ | 39,350,100 | | |
Net realized gain (loss) from investments, in-kind and foreign currency transactions | | | 28,009,956 | | | | (9,043,353 | ) | |
Net increase (decrease) in unrealized appreciation (depreciation) on investments
and translation of assets and liabilities in foreign currencies | | | (138,555,427 | ) | | | 298,702,832 | | |
Net increase (decrease) in net assets from operations | | | (68,646,083 | ) | | | 329,009,579 | | |
DIVIDENDS AND DISTRIBUTIONS TO SHAREHOLDERS FROM: | |
Net investment income: | |
Class 1 | | | (283,889 | ) | | | (453,185 | ) | |
Class 2 | | | (9,390,129 | ) | | | (10,361,979 | ) | |
Class 3 | | | (19,194,094 | ) | | | (20,845,482 | ) | |
Class 4 | | | (6,244,218 | ) | | | (10,043,073 | ) | |
Class 5 | | | (5,362,838 | ) | | | — | | |
Capital gains: | |
Class 1 | | | (79,843 | ) | | | — | | |
Class 2 | | | (2,356,308 | ) | | | — | | |
Class 3 | | | (4,620,754 | ) | | | — | | |
Class 4 | | | (1,478,334 | ) | | | — | | |
Class 5 | | | (1,234,770 | ) | | | — | | |
Total Dividends and Distributions | | | (50,245,177 | ) | | | (41,703,719 | ) | |
TRANSACTIONS IN SHARES OF BENEFICIAL INTEREST | |
Net proceeds from shares subscribed: | |
Class 1 | | | 255,949 | | | | 681,659 | | |
Class 2 | | | 136,831,273 | | | | 91,672,424 | | |
Class 3 | | | 220,966,910 | | | | 276,657,991 | | |
Class 4 | | | 54,835,000 | | | | 49,900,000 | | |
Class 5 | | | 304,629,645 | | | | — | | |
Purchase premiums: | |
Class 1 | | | 3,626 | | | | 9,434 | | |
Class 2 | | | 67,788 | | | | 102,972 | | |
Class 3 | | | 179,891 | | | | 160,708 | | |
Class 4 | | | 72,418 | | | | 81,798 | | |
Class 5 | | | 18,147 | | | | — | | |
Redemption fees: | |
Class 1 | | | 5,368 | | | | 2,939 | | |
Class 2 | | | 122,868 | | | | 32,530 | | |
Class 3 | | | 306,728 | | | | 49,264 | | |
Class 4 | | | 106,695 | | | | 25,715 | | |
Class 5 | | | 47,408 | | | | — | | |
Dividends reinvested: | |
Class 1 | | | — | | | | 177,440 | | |
Class 2 | | | 11,746,437 | | | | 10,361,979 | | |
Class 3 | | | 23,814,848 | | | | 20,845,482 | | |
Class 4 | | | 7,722,552 | | | | 10,043,073 | | |
Class 5 | | | 6,597,607 | | | | — | | |
The accompanying notes are an integral part of the financial statements.
31
Statements of Changes in Net Assets
Annual Report December 31, 2014
Baillie Gifford International Equity Fund
| | For the
Year Ended
December 31,
2014 | | For the
Year Ended
December 31,
2013 | |
Cost of shares redeemed: | |
Class 1 | | $ | (8,566,950 | ) | | $ | (41,887,651 | ) | |
Class 2 | | | (211,341,046 | ) | | | (226,837,755 | ) | |
Class 3 | | | (380,295,118 | ) | | | (26,039,059 | ) | |
Class 4 | | | (304,629,645 | ) | | | (35,218,367 | ) | |
Class 5 | | | — | | | | — | | |
Increase (Decrease) in Net Assets from Transactions in Shares of Beneficial Interest | | | (136,501,601 | ) | | | 130,822,576 | | |
Total Increase (Decrease) in Net Assets | | | (255,392,861 | ) | | | 418,128,436 | | |
NET ASSETS | |
Beginning of year | | | 2,544,607,645 | | | | 2,126,479,209 | | |
End of year (including distributions in excess of net investment income of
$1,917,295 and $2,620,701, respectively) | | $ | 2,289,214,784 | | | $ | 2,544,607,645 | | |
The accompanying notes are an integral part of the financial statements.
32
Annual Report December 31, 2014
Baillie Gifford International Equity Fund
Selected data for a Class 1 Share outstanding throughout each year:
| | | For the
Year Ended
December 31,
2014 | | For the
Year Ended
December 31,
2013 | | For the
Year Ended
December 31,
2012 | | For the
Year Ended
December 31,
2011 | | For the
Year Ended
December 31,
2010 | |
Net asset value, beginning of year | | $ | 11.82 | | | $ | 10.42 | | | $ | 8.65 | | | $ | 9.97 | | | $ | 8.86 | | |
From Investment Operations | |
Net investment income(a) | | | 0.18 | | | | 0.18 | | | | 0.21 | | | | 0.17 | | | | 0.12 | | |
Net realized and unrealized gain/(loss) on
investments and foreign currency transactions | | | (0.54 | ) | | | 1.39 | | | | 1.70 | | | | (1.38 | ) | | | 1.15 | | |
Net increase (decrease) in net asset value from
investment operations | | | (0.36) | | | | 1.57 | | | | 1.91 | | | | (1.21) | | | | 1.27 | | |
Dividends and Distributions to Shareholders | | | | | | | | | | | | | | | | | | | | | |
Dividends from net investment income | | | (0.18 | ) | | | (0.17 | ) | | | (0.15 | ) | | | (0.11 | ) | | | (0.17 | ) | |
Distributions from net realized gain on investments | | | (0.05 | ) | | | — | | | | — | | | | (0.01 | ) | | | — | | |
Total Dividends and Distributions | | | (0.23 | ) | | | (0.17 | ) | | | (0.15 | ) | | | (0.12 | ) | | | (0.17 | ) | |
Proceeds from Purchase Premiums and
Redemption Fees(a) | | | 0.00 | (b) | | | 0.00 | (b) | | | 0.01 | | | | 0.01 | | | | 0.01 | | |
Net asset value, end of year | | $ | 11.23 | | | $ | 11.82 | | | $ | 10.42 | | | $ | 8.65 | | | $ | 9.97 | | |
Total Return | |
Total investment return based on net asset value(c) | | | (3.10 | )% | | | 15.10 | % | | | 22.17 | % | | | (12.07 | )% | | | 14.44 | % | |
Ratios/Supplemental Data | |
Net assets, end of year (000's omitted) | | $ | 18,068 | | | $ | 27,187 | | | $ | 61,940 | | | $ | 63,868 | | | $ | 72,366 | | |
Ratio of net expenses to average net assets | | | 0.79 | % | | | 0.79 | % | | | 0.80 | %(d) | | | 0.84 | % | | | 0.86 | % | |
Ratio of net expenses to average net assets,
before waiver | | | 0.79 | % | | | 0.79 | % | | | 0.83 | %(d) | | | 0.84 | % | | | 0.86 | % | |
Ratio of net investment income to average net assets | | | 1.56 | % | | | 1.65 | % | | | 2.19 | % | | | 1.72 | % | | | 1.36 | % | |
Portfolio turnover rate | | | 11 | % | | | 16 | % | | | 13 | % | | | 11 | % | | | 24 | % | |
(a) Calculated based upon average shares outstanding during the year.
(b) Amount is less than $0.005 per share.
(c) Total investment return is calculated assuming an initial investment made at the net asset value at the beginning of the period, reinvestment of all dividends and distributions, if any, at net asset value during the period, and redemption on the last day of the period.
(d) Effective January 1, 2012, Baillie Gifford Overseas Limited had voluntarily agreed to waive a portion of the management fee through June 30, 2012, during which time Baillie Gifford Overseas Limited received annual management fee equal to 0.25% of the Fund's average net assets.
The accompanying notes are an integral part of the financial statements.
33
Annual Report December 31, 2014
Baillie Gifford International Equity Fund
Selected data for a Class 2 Share outstanding throughout each year:
| | | For the
Year Ended
December 31,
2014 | | For the
Year Ended
December 31,
2013 | | For the
Year Ended
December 31,
2012 | | For the
Year Ended
December 31,
2011 | | For the
Year Ended
December 31,
2010 | |
Net asset value, beginning of year | | $ | 11.79 | | | $ | 10.39 | | | $ | 8.63 | | | $ | 9.95 | | | $ | 8.84 | | |
From Investment Operations | |
Net investment income(a) | | | 0.18 | | | | 0.19 | | | | 0.22 | | | | 0.16 | | | | 0.13 | | |
Net realized and unrealized gain/(loss) on
investments and foreign currency transactions | | | (0.52 | ) | | | 1.40 | | | | 1.69 | | | | (1.36 | ) | | | 1.15 | | |
Net increase (decrease) in net asset value from
investment operations | | | (0.34) | | | | 1.59 | | | | 1.91 | | | | (1.20) | | | | 1.28 | | |
Dividends and Distributions to Shareholders | | | | | | | | | | | | | | | | | | | | | |
Dividends from net investment income | | | (0.20 | ) | | | (0.19 | ) | | | (0.16 | ) | | | (0.12 | ) | | | (0.18 | ) | |
Distributions from net realized gain on investments | | | (0.05 | ) | | | — | | | | — | | | | (0.01 | ) | | | — | | |
Total Dividends and Distributions | | | (0.25 | ) | | | (0.19 | ) | | | (0.16 | ) | | | (0.13 | ) | | | (0.18 | ) | |
Proceeds from Purchase Premiums and
Redemption Fees(a) | | | 0.00 | (b) | | | 0.00 | (b) | | | 0.01 | | | | 0.01 | | | | 0.01 | | |
Net asset value, end of year | | $ | 11.20 | | | $ | 11.79 | | | $ | 10.39 | | | $ | 8.63 | | | $ | 9.95 | | |
Total Return | |
Total investment return based on net asset value(c) | | | (2.93 | )% | | | 15.35 | % | | | 22.33 | % | | | (11.94 | )% | | | 14.65 | % | |
Ratios/Supplemental Data | |
Net assets, end of year (000's omitted) | | $ | 542,943 | | | $ | 637,144 | | | $ | 682,452 | | | $ | 831,065 | | | $ | 447,232 | | |
Ratio of net expenses to average net assets | | | 0.61 | % | | | 0.61 | % | | | 0.62 | %(d) | | | 0.67 | % | | | 0.68 | % | |
Ratio of net expenses to average net assets,
before waiver | | | 0.61 | % | | | 0.61 | % | | | 0.64 | %(d) | | | 0.67 | % | | | 0.68 | % | |
Ratio of net investment income to average net assets | | | 1.57 | % | | | 1.72 | % | | | 2.27 | % | | | 1.74 | % | | | 1.43 | % | |
Portfolio turnover rate | | | 11 | % | | | 16 | % | | | 13 | % | | | 11 | % | | | 24 | % | |
(a) Calculated based upon average shares outstanding during the year.
(b) Amount is less than $0.005 per share.
(c) Total investment return is calculated assuming an initial investment made at the net asset value at the beginning of the period, reinvestment of all dividends and distributions, if any, at net asset value during the period, and redemption on the last day of the period.
(d) Baillie Gifford Overseas Limited had voluntarily agreed to waive its fees and/or bear other expenses through June 30, 2012, during which time Baillie Gifford Overseas Limited received annual management fee equal to 0.25% of the Fund's average net assets.
The accompanying notes are an integral part of the financial statements.
34
Annual Report December 31, 2014
Baillie Gifford International Equity Fund
Selected data for a Class 3 Share outstanding throughout each period:
| | | For the
Year Ended
December 31,
2014 | | For the
Year Ended
December 31,
2013 | | For the
Year Ended
December 31,
2012 | | For the
Year Ended
December 31,
2011 | | For the Period
September 1,
2010(a)
through
December 31,
2010 | |
Net asset value, beginning of period | | $ | 11.93 | | | $ | 10.52 | | | $ | 8.73 | | | $ | 10.06 | | | $ | 8.53 | | |
From Investment Operations | |
Net investment income(b) | | | 0.21 | | | | 0.19 | | | | 0.17 | | | | 0.17 | | | | 0.02 | | |
Net realized and unrealized gain/(loss) on
investments and foreign currency transactions | | | (0.54 | ) | | | 1.42 | | | | 1.78 | | | | (1.37 | ) | | | 1.69 | | |
Net increase (decrease) in net asset value from
investment operations | | | (0.33) | | | | 1.61 | | | | 1.95 | | | | (1.20) | | | | 1.71 | | |
Dividends and Distributions to Shareholders | | | | | | | | | | | | | | | | | | | | | |
Dividends from net investment income | | | (0.21 | ) | | | (0.20 | ) | | | (0.17 | ) | | | (0.13 | ) | | | (0.19 | ) | |
Distributions from net realized gain on investments | | | (0.05 | ) | | | — | | | | — | | | | (0.01 | ) | | | — | | |
Total Dividends and Distributions | | | (0.26 | ) | | | (0.20 | ) | | | (0.17 | ) | | | (0.14 | ) | | | (0.19 | ) | |
Proceeds from Purchase Premiums and
Redemption Fees(b) | | | 0.00 | (c) | | | 0.00 | (c) | | | 0.01 | | | | 0.01 | | | | 0.01 | | |
Net asset value, end of period | | $ | 11.34 | | | $ | 11.93 | | | $ | 10.52 | | | $ | 8.73 | | | $ | 10.06 | | |
Total Return | |
Total investment return based on net asset value(d) | | | (2.83 | )% | | | 15.34 | % | | | 22.50 | % | | | (11.85 | )% | | | 20.19 | % | |
Ratios/Supplemental Data | |
Net assets, end of period (000's omitted) | | $ | 1,078,665 | | | $ | 1,268,490 | | | $ | 862,591 | | | $ | 367,327 | | | $ | 154,209 | | |
Ratio of net expenses to average net assets | | | 0.54 | % | | | 0.54 | % | | | 0.56 | %(e) | | | 0.60 | % | | | 0.61 | %* | |
Ratio of net expenses to average net assets,
before waiver | | | 0.54 | % | | | 0.54 | % | | | 0.58 | %(e) | | | 0.60 | % | | | 0.61 | %* | |
Ratio of net investment income to average net assets | | | 1.76 | % | | | 1.75 | % | | | 1.71 | % | | | 1.75 | % | | | 0.76 | %* | |
Portfolio turnover rate | | | 11 | % | | | 16 | % | | | 13 | % | | | 11 | % | | | 24 | % | |
* Annualized.
(a) Commencement of investment operations.
(b) Calculated based upon average shares outstanding during the year.
(c) Amount is less than $0.005 per share.
(d) Total investment return is calculated assuming an initial investment made at the net asset value at the beginning of the period, reinvestment of all dividends and distributions, if any, at net asset value during the period, and redemption on the last day of the period. Total return is not annualized for periods less than one year.
(e) Baillie Gifford Overseas Limited had voluntarily agreed to waive its fees and/or bear other expenses through June 30, 2012, during which time Baillie Gifford Overseas Limited received annual management fee equal to 0.25% of the Fund's average net assets.
The accompanying notes are an integral part of the financial statements.
35
Annual Report December 31, 2014
Baillie Gifford International Equity Fund
Selected data for a Class 4 Share outstanding throughout each period:
| | | For the
Year Ended
December 31,
2014 | | For the
Year Ended
December 31,
2013 | | For the
Year Ended
December 31,
2012 | | For the
Year Ended
December 31,
2011 | | For the Period
July 30,
2010(a)
through
December 31,
2010 | |
Net asset value, beginning of period | | $ | 12.20 | | | $ | 10.75 | | | $ | 8.92 | | | $ | 10.28 | | | $ | 9.00 | | |
From Investment Operations | |
Net investment income(b) | | | 0.22 | | | | 0.20 | | | | 0.22 | | | | 0.20 | | | | 0.04 | | |
Net realized and unrealized gain/(loss) on
investments and foreign currency transactions | | | (0.57 | ) | | | 1.45 | | | | 1.77 | | | | (1.43 | ) | | | 1.42 | | |
Net increase (decrease) in net asset value from
investment operations | | | (0.35) | | | | 1.65 | | | | 1.99 | | | | (1.23) | | | | 1.46 | | |
Dividends and Distributions to Shareholders | | | | | | | | | | | | | | | | | | | | | |
Dividends from net investment income | | | (0.21 | ) | | | (0.20 | ) | | | (0.17 | ) | | | (0.13 | ) | | | (0.19 | ) | |
Distributions from net realized gain on investments | | | (0.05 | ) | | | — | | | | — | | | | (0.01 | ) | | | — | | |
Total Dividends and Distributions | | | (0.26 | ) | | | (0.20 | ) | | | (0.17 | ) | | | (0.14 | ) | | | (0.19 | ) | |
Proceeds from Purchase Premiums and
Redemption Fees(b) | | | 0.01 | | | | 0.00 | (c) | | | 0.01 | | | | 0.01 | | | | 0.01 | | |
Net asset value, end of period | | $ | 11.60 | | | $ | 12.20 | | | $ | 10.75 | | | $ | 8.92 | | | $ | 10.28 | | |
Total Return | |
Total investment return based on net asset value(d) | | | (2.82 | )% | | | 15.42 | % | | | 22.51 | % | | | (11.86 | )% | | | 16.38 | % | |
Ratios/Supplemental Data | |
Net assets, end of period (000's omitted) | | $ | 352,890 | | | $ | 611,786 | | | $ | 519,496 | | | $ | 17,024 | | | $ | 20,955 | | |
Ratio of net expenses to average net assets | | | 0.51 | % | | | 0.51 | % | | | 0.53 | %(e) | | | 0.56 | % | | | 0.58 | %* | |
Ratio of net expenses to average net assets,
before waiver | | | 0.51 | % | | | 0.51 | % | | | 0.54 | %(e) | | | 0.56 | % | | | 0.58 | %* | |
Ratio of net investment income to average net assets | | | 1.82 | % | | | 1.77 | % | | | 2.20 | % | | | 2.03 | % | | | 0.97 | %* | |
Portfolio turnover rate | | | 11 | % | | | 16 | % | | | 13 | % | | | 11 | % | | | 24 | % | |
* Annualized.
(a) Commencement of investment operations.
(b) Calculated based upon average shares outstanding during the year.
(c) Amount is less than $0.005 per share.
(d) Total investment return is calculated assuming an initial investment made at the net asset value at the beginning of the period, reinvestment of all dividends and distributions, if any, at net asset value during the period, and redemption on the last day of the period. Total return is not annualized for periods less than one year.
(e) Baillie Gifford Overseas Limited had voluntarily agreed to waive its fees and/or bear other expenses through June 30, 2012, during which time Baillie Gifford Overseas Limited received annual management fee equal to 0.25% of the Fund's average net assets.
The accompanying notes are an integral part of the financial statements.
36
Annual Report December 31, 2014
Baillie Gifford International Equity Fund
Selected data for a Class 5 Share outstanding throughout the period:
| | | For the Period
April 7, 2014(a)
through
December 31, 2014 | |
Net asset value, beginning of period | | $ | 12.25 | | |
From Investment Operations | |
Net investment income(b) | | | 0.15 | | |
Net realized and unrealized loss on investments and foreign currency transactions | | | (0.46 | ) | |
Net decrease in net asset value from investment operations | | | (0.31 | ) | |
Dividends and Distributions to Shareholders | |
Dividends from net investment income | | | (0.22 | ) | |
Distributions from net realized gain on investments | | | (0.05 | ) | |
Total Dividends and Distributions | | | (0.27 | ) | |
Proceeds from Purchase Premiums and Redemption Fees(b) | | | 0.00 | (c) | |
Net asset value, end of period | | $ | 11.67 | | |
Total Return | |
Total investment return based on net asset value(d) | | | (2.60 | )% | |
Ratios/Supplemental Data | |
Net assets, end of period (000's omitted) | | $ | 296,649 | | |
Ratio of net expenses to average net assets | | | 0.47 | %* | |
Ratio of net investment income to average net assets | | | 1.61 | %* | |
Portfolio turnover rate(e) | | | 11 | % | |
* Annualized.
(a) Commencement of investment operations.
(b) Calculated based upon average shares outstanding during the period.
(c) Amount is less than $0.005 per share.
(d) Total investment return is calculated assuming an initial investment made at the net asset value at the beginning of the period, reinvestment of all dividends and distributions, if any, at net asset value during the period, and redemption on the last day of the period. Total return is not annualized for periods less than one year.
(e) Portfolio turnover rate calculated at Fund level.
The accompanying notes are an integral part of the financial statements.
37
Industry Diversification Table
Annual Report December 31, 2014
December 31, 2014 (unaudited)
Baillie Gifford International Choice Fund
| | | Value | | % of Total
Net Assets | |
Apparel Retailers | | $ | 11,100,347 | | | | 3.0 | % | |
Asset Managers | | | 8,818,628 | | | | 2.4 | | |
Auto Manufacturers | | | 5,314,217 | | | | 1.5 | | |
Banks | | | 35,236,640 | | | | 9.6 | | |
Beverages, Food & Tobacco | | | 4,006,942 | | | | 1.1 | | |
Biotechnology | | | 4,077,982 | | | | 1.1 | | |
Brewers | | | 10,754,290 | | | | 2.9 | | |
Broadline Retailers | | | 1,566,578 | | | | 0.4 | | |
Building Materials & Fixtures | | | 4,827,243 | | | | 1.3 | | |
Bus, Train & Employment | | | 4,699,080 | | | | 1.3 | | |
Business Support Services | | | 3,209,334 | | | | 0.9 | | |
Clothing & Accessories | | | 1,882,916 | | | | 0.5 | | |
Commercial Vehicles & Trucks | | | 3,550,341 | | | | 1.0 | | |
Containers & Packaging | | | 4,190,178 | | | | 1.1 | | |
Distillers & Vintners | | | 1,616,172 | | | | 0.4 | | |
Diversified Industrials | | | 5,468,793 | | | | 1.5 | | |
Drug Retailers | | | 2,036,892 | | | | 0.6 | | |
Electrical Components & Equipment | | | 3,027,682 | | | | 0.8 | | |
Electronic & Electrical Equipment | | | 6,036,803 | | | | 1.6 | | |
Electronic Equipment | | | 4,907,716 | | | | 1.3 | | |
Food Products | | | 13,678,248 | | | | 3.7 | | |
Food Retailers & Wholesalers | | | 5,680,471 | | | | 1.5 | | |
Footwear | | | 3,697,984 | | | | 1.0 | | |
Gambling | | | 1,866,128 | | | | 0.5 | | |
General Mining | | | 6,006,839 | | | | 1.6 | | |
Healthcare — Products | | | 1,871,786 | | | | 0.5 | | |
Holding Companies — Diversified | | | 2,482,531 | | | | 0.7 | | |
Industrial Machinery | | | 27,573,041 | | | | 7.5 | | |
Integrated Oil & Gas | | | 9,099,708 | | | | 2.5 | | |
Internet | | | 8,412,093 | | | | 2.3 | | |
Investment Companies | | | 1,640,306 | | | | 0.4 | | |
Media & Photography | | | 8,645,716 | | | | 2.4 | | |
Media Agencies | | | 4,986,523 | | | | 1.4 | | |
Medical Equipment | | | 13,035,118 | | | | 3.6 | | |
Nondurable Household Products | | | 6,794,575 | | | | 1.9 | | |
Nonlife Insurance | | | 7,010,904 | | | | 1.9 | | |
Oil Equipment & Services | | | 2,646,524 | | | | 0.7 | | |
Personal Products | | | 5,360,414 | | | | 1.5 | | |
Pharmaceuticals | | | 19,769,914 | | | | 5.4 | | |
Property & Casualty Insurance | | | 7,289,571 | | | | 2.0 | | |
38
Industry Diversification Table
Annual Report December 31, 2014
| | | Value | | % of Total
Net Assets | |
Recreational Products | | $ | 9,623,461 | | | | 2.6 | % | |
Restaurants & Bars | | | 3,157,771 | | | | 0.9 | | |
Retailers — General | | | 10,001,775 | | | | 2.7 | | |
Semiconductors | | | 16,462,000 | | | | 4.5 | | |
Soft Drinks | | | 4,635,715 | | | | 1.3 | | |
Speciality Chemicals | | | 6,854,619 | | | | 1.9 | | |
Speciality Finance | | | 19,196,961 | | | | 5.2 | | |
Specialized Consumer Services | | | 10,456,108 | | | | 2.8 | | |
Total Value of Investments | | | 364,265,578 | | | | 99.2 | | |
Other assets less liabilities | | | 3,077,116 | | | | 0.8 | | |
Net Assets | | $ | 367,342,694 | | | | 100.0 | % | |
39
Annual Report December 31, 2014
December 31, 2014
Baillie Gifford International Choice Fund
| | | Shares | | Value | |
COMMON STOCKS — 98.4% | |
AUSTRALIA — 5.4% | |
Brambles Ltd. | | | 486,425 | | | $ | 4,190,178 | | |
Cochlear Ltd. | | | 129,439 | | | | 8,165,901 | | |
Mesoblast Ltd. (a) | | | 359,292 | | | | 1,276,866 | | |
Seek Ltd. | | | 336,994 | | | | 4,699,080 | | |
Treasury Wine Estates Ltd. | | | 418,722 | | | | 1,616,172 | | |
| | | | | | 19,948,197 | | |
CHINA — 5.6% | |
Baidu, Inc. ADR (a) | | | 36,900 | | | | 8,412,093 | | |
Cafe de Coral Holdings Ltd. | | | 680,298 | | | | 2,353,709 | | |
Jardine Strategic Holdings Ltd. | | | 73,000 | | | | 2,482,531 | | |
JD.com, Inc. ADR (a) | | | 67,700 | | | | 1,566,578 | | |
Mindray Medical International Ltd. ADR | | | 70,901 | | | | 1,871,786 | | |
Tsingtao Brewery Co., Ltd., Class H | | | 594,057 | | | | 4,006,942 | | |
| | | | | | 20,693,639 | | |
DENMARK — 4.6% | |
Carlsberg A/S, B Shares | | | 78,397 | | | | 6,020,878 | | |
Novo Nordisk A/S, B Shares | | | 193,778 | | | | 8,196,768 | | |
Novozymes A/S, B Shares | | | 66,545 | | | | 2,801,116 | | |
| | | | | | 17,018,762 | | |
FRANCE — 2.8% | |
Kone Oyj, B Shares | | | 103,362 | | | | 4,705,850 | | |
Legrand SA | | | 57,716 | | | | 3,027,682 | | |
Total SA | | | 47,947 | | | | 2,456,428 | | |
| | | | | | 10,189,960 | | |
GERMANY — 1.0% | |
adidas AG | | | 53,250 | | | | 3,697,984 | | |
HONG KONG — 1.3% | |
BOC Hong Kong Holdings Ltd. | | | 854,040 | | | | 2,845,781 | | |
Li & Fung Ltd. | | | 1,931,218 | | | | 1,808,030 | | |
| | | | | | 4,653,811 | | |
The accompanying notes are an integral part of the financial statements.
40
Annual Report December 31, 2014
December 31, 2014
Baillie Gifford International Choice Fund
| | | Shares | | Value | |
INDIA — 1.5% | |
Mahindra & Mahindra Ltd. GDR | | | 266,711 | | | $ | 5,314,217 | | |
ISRAEL — 0.2% | |
Protalix BioTherapeutics, Inc. (a) | | | 329,319 | | | | 605,947 | | |
ITALY — 2.2% | |
CNH Industrial NV | | | 438,579 | | | | 3,550,341 | | |
EXOR SpA | | | 112,391 | | | | 4,611,614 | | |
| | | | | | 8,161,955 | | |
JAPAN — 15.8% | |
Asahi Group Holdings Ltd. | | | 153,000 | | | | 4,733,412 | | |
Kao Corp. | | | 172,300 | | | | 6,794,575 | | |
MS&AD Insurance Group Holdings, Inc. | | | 307,600 | | | | 7,289,571 | | |
Olympus Corp. (a) | | | 139,000 | | | | 4,869,218 | | |
Rakuten, Inc. | | | 511,200 | | | | 7,108,652 | | |
Sankyo Co., Ltd. | | | 54,400 | | | | 1,866,128 | | |
Shimano, Inc. | | | 74,300 | | | | 9,623,462 | | |
Shiseido Co., Ltd. | | | 253,300 | | | | 3,552,383 | | |
SMC Corp. | | | 14,900 | | | | 3,907,139 | | |
SUGI Holdings Co., Ltd. | | | 49,900 | | | | 2,036,892 | | |
THK Co., Ltd. | | | 251,600 | | | | 6,046,425 | | |
| | | | | | 57,827,857 | | |
MEXICO — 0.6% | |
Wal-Mart de Mexico SAB de CV, Series V | | | 1,025,900 | | | | 2,205,646 | | |
NEW ZEALAND — 0.9% | |
Trade Me Group Ltd. | | | 1,178,556 | | | | 3,347,456 | | |
PHILIPPINES — 0.6% | |
Puregold Price Club, Inc. (a) | | | 2,569,500 | | | | 2,201,070 | | |
SINGAPORE — 3.5% | |
Jardine Matheson Holdings Ltd. | | | 90,000 | | | | 5,468,793 | | |
United Overseas Bank Ltd. | | | 401,011 | | | | 7,400,279 | | |
| | | | | | 12,869,072 | | |
The accompanying notes are an integral part of the financial statements.
41
Annual Report December 31, 2014
December 31, 2014
Baillie Gifford International Choice Fund
| | | Shares | | Value | |
SOUTH AFRICA — 3.2% | |
Clicks Group Ltd. | | | 463,598 | | | $ | 3,241,350 | | |
Naspers Ltd., N Shares | | | 66,837 | | | | 8,645,716 | | |
| | | | | | 11,887,066 | | |
SOUTH KOREA — 3.6% | |
Samsung Electronics Co., Ltd. GDR Reg S | | | 10,513 | | | | 6,310,402 | | |
Samsung Fire & Marine Insurance Co., Ltd. (a) | | | 27,278 | | | | 7,010,904 | | |
| | | | | | 13,321,306 | | |
SPAIN — 3.5% | |
Corporacion Financiera Alba SA | | | 33,550 | | | | 1,640,306 | | |
Distribuidora Internacional de Alimentacion SA | | | 838,310 | | | | 5,680,471 | | |
Inditex SA | | | 190,575 | | | | 5,436,241 | | |
| | | | | | 12,757,018 | | |
SWEDEN — 8.4% | |
Atlas Copco AB, B Shares | | | 275,773 | | | | 7,059,189 | | |
Investment AB Kinnevik, B Shares | | | 308,623 | | | | 10,036,182 | | |
Investor AB, B Shares | | | 125,122 | | | | 4,549,165 | | |
Svenska Handelsbanken AB, A Shares | | | 196,531 | | | | 9,195,268 | | |
| | | | | | 30,839,804 | | |
SWITZERLAND — 9.1% | |
Geberit AG | | | 14,269 | | | | 4,827,243 | | |
Mettler-Toledo International, Inc. (a) | | | 16,226 | | | | 4,907,716 | | |
Nestle SA | | | 95,113 | | | | 6,933,834 | | |
Roche Holding AG — Genusschein | | | 40,478 | | | | 10,967,199 | | |
Schindler Holding AG, Participating Certificates | | | 24,842 | | | | 3,586,295 | | |
UBS Group AG (a) | | | 129,432 | | | | 2,224,897 | | |
| | | | | | 33,447,184 | | |
TAIWAN — 3.6% | |
Hon Hai Precision Industry Co., Ltd. GDR Reg S | | | 1,076,079 | | | | 6,036,803 | | |
Taiwan Semiconductor Manufacturing Co., Ltd. ADR | | | 325,141 | | | | 7,276,656 | | |
| | | | | | 13,313,459 | | |
TURKEY — 1.4% | |
Turkiye Garanti Bankasi A/S ADR | | | 1,328,694 | | | | 5,274,915 | | |
The accompanying notes are an integral part of the financial statements.
42
Annual Report December 31, 2014
December 31, 2014
Baillie Gifford International Choice Fund
| | | Shares | | Value | |
UNITED KINGDOM — 18.3% | |
ASOS Plc. (a) | | | 142,465 | | | $ | 5,664,106 | | |
BG Group Plc. | | | 496,444 | | | | 6,643,280 | | |
BHP Billiton Plc. | | | 148,721 | | | | 3,187,297 | | |
Burberry Group Plc. | | | 74,213 | | | | 1,882,916 | | |
Hargreaves Lansdown Plc. | | | 443,333 | | | | 6,936,797 | | |
Imagination Technologies Group Plc. (a) | | | 814,900 | | | | 2,874,942 | | |
Intertek Group Plc. | | | 88,675 | | | | 3,209,334 | | |
John Wood Group Plc. | | | 286,079 | | | | 2,646,524 | | |
Johnson Matthey Plc. | | | 130,289 | | | | 6,854,619 | | |
Jupiter Fund Management Plc. | | | 333,253 | | | | 1,881,831 | | |
KAZ Minerals Plc. (a) | | | 706,612 | | | | 2,819,542 | | |
Mitchells & Butlers Plc. (a) | | | 530,107 | | | | 3,157,771 | | |
Rightmove Plc. | | | 142,990 | | | | 4,986,523 | | |
Standard Chartered Plc. | | | 358,790 | | | | 5,366,038 | | |
Unilever Plc. | | | 166,003 | | | | 6,744,413 | | |
Weir Group Plc. (The) | | | 79,096 | | | | 2,268,143 | | |
| | | | | | 67,124,076 | | |
UNITED STATES — 1.3% | |
Coca-Cola Enterprises, Inc. | | | 104,833 | | | | 4,635,715 | | |
Total Common Stocks | |
(cost $356,774,160) | | | | | 361,336,116 | | |
PREFERRED STOCKS — 0.8% | |
BRAZIL — 0.8% | |
Itau Unibanco Holding SA ADR (cost $2,898,141) | | | 225,170 | | | | 2,929,462 | | |
TOTAL INVESTMENTS — 99.2% | |
(cost $359,672,301) | | | | $ | 364,265,578 | | |
Other assets less liabilities — 0.8% | | | | | 3,077,116 | | |
NET ASSETS — 100.0% | | | | $ | 367,342,694 | | |
(a) Non-income producing security.
ADR — American Depositary Receipt.
GDR — Global Depositary Receipt.
Reg S — Regulation S ("Reg S") of the securities Act of 1933, as amended ("1933 Act") is a safe harbor that defines when an offering of securities will be deemed to come to rest abroad and therefore is not subject to the registration obligations imposed under Section 5 of the 1933 Act. The regulation includes two safe harbor provisions: an issuer safe harbor and a resale safe harbor. In each case, the regulation demands that offers and sales of the securities be made outside the United States and that no offering participant (which includes the issuer, the banks assisting with the offer and their respective affiliates) engage in "directed" selling efforts. In the case of issuers for whose securities there is substantial U.S. market interest, the regulation also requires that no offers and sales be made to U.S. persons (including U.S. persons physically located outside the United States).
The accompanying notes are an integral part of the financial statements.
43
Statement of Assets and Liabilities
Annual Report December 31, 2014
December 31, 2014
Baillie Gifford International Choice Fund
ASSETS | |
Investments, at value (cost $359,672,301) | | $ | 364,265,578 | | |
Cash | | | 3,277,272 | | |
Foreign cash, at value (cost $44) | | | 44 | | |
Receivable for investments sold | | | 468,048 | | |
Dividends receivable | | | 233,347 | | |
Tax reclaims receivable | | | 196,563 | | |
Total Assets | | | 368,440,852 | | |
LIABILITIES | |
Payable for investments purchased | | | 492,955 | | |
Servicing fee payable | | | 239,744 | | |
Management fee payable | | | 232,695 | | |
Trustee fee payable | | | 3,403 | | |
Accrued expenses | | | 129,361 | | |
Total Liabilities | | | 1,098,158 | | |
NET ASSETS | | $ | 367,342,694 | | |
COMPOSITION OF NET ASSETS | |
Paid-in capital | | $ | 364,090,622 | | |
Distributions in excess of net investment income | | | (1,089,282 | ) | |
Accumulated net realized loss on investments and foreign currency transactions | | | (227,183 | ) | |
Net unrealized appreciation in value of investments and foreign currencies | | | 4,568,537 | | |
NET ASSETS | | $ | 367,342,694 | | |
NET ASSET VALUE, PER SHARE | |
| Class 1 ($15,934,169 / 1,397,811 shares outstanding), unlimited authorized, no par value | | $ | 11.40 | | |
Maximum Purchase Price Per Share (Note D) | | $ | 11.43 | | |
Minimum Redemption Price Per Share (Note D) | | $ | 11.38 | | |
| Class 2 ($245,205,986 / 21,296,695 shares outstanding), unlimited authorized, no par value | | $ | 11.51 | | |
Maximum Purchase Price Per Share (Note D) | | $ | 11.54 | | |
Minimum Redemption Price Per Share (Note D) | | $ | 11.49 | | |
| Class 3 ($106,202,539 / 9,130,111 shares outstanding), unlimited authorized, no par value | | $ | 11.63 | | |
Maximum Purchase Price Per Share (Note D) | | $ | 11.66 | | |
Minimum Redemption Price Per Share (Note D) | | $ | 11.61 | | |
The accompanying notes are an integral part of the financial statements.
44
Annual Report December 31, 2014
For the Year Ended December 31, 2014
Baillie Gifford International Choice Fund
INVESTMENT INCOME | |
Dividends (net of foreign withholding taxes of $836,252) | | $ | 7,301,484 | | |
Interest | | | 321 | | |
Total Investment Income | | | 7,301,805 | | |
EXPENSES | |
Management fee (Note B) | | | 931,433 | | |
Shareholder servicing fees — Class 1 Shares (Note B) | | | 54,846 | | |
Shareholder servicing fees — Class 2 Shares (Note B) | | | 673,979 | | |
Shareholder servicing fees — Class 3 Shares (Note B) | | | 221,526 | | |
Fund accounting | | | 243,473 | | |
Custody | | | 62,457 | | |
Legal | | | 48,392 | | |
Transfer agency | | | 21,311 | | |
Trustees' fees | | | 12,201 | | |
Professional fees | | | 11,415 | | |
Insurance | | | 4,565 | | |
Miscellaneous | | | 9,453 | | |
Total Expenses | | | 2,295,051 | | |
Net Investment Income | | | 5,006,754 | | |
REALIZED AND UNREALIZED GAIN (LOSS) ON INVESTMENTS
AND FOREIGN CURRENCY TRANSACTIONS | |
Net realized gain (loss) from: | |
Investments | | | 3,771,543 | | |
Foreign currency transactions | | | (171,910 | ) | |
| | | | 3,599,633 | | |
Net increase (decrease) in unrealized appreciation (depreciation) on: | |
Investments | | | (18,038,267 | ) | |
Translation of assets and liabilities in foreign currencies | | | (31,106 | ) | |
| | | | (18,069,373 | ) | |
Net realized and unrealized loss on investments and foreign currency transactions | | | (14,469,740 | ) | |
NET DECREASE IN NET ASSETS FROM OPERATIONS | | $ | (9,462,986 | ) | |
The accompanying notes are an integral part of the financial statements.
45
Statements of Changes in Net Assets
Annual Report December 31, 2014
Baillie Gifford International Choice Fund
| | | For the
Year Ended
December 31,
2014 | | For the
Year Ended
December 31,
2013 | |
INCREASE (DECREASE) IN NET ASSETS FROM OPERATIONS | |
Net investment income | | $ | 5,006,754 | | | $ | 1,453,133 | | |
Net realized gain (loss) from investments and foreign currency transactions | | | 3,599,633 | | | | (163,305 | ) | |
Net increase (decrease) in unrealized appreciation (depreciation) on investments
and translation of assets and liabilities in foreign currencies | | | (18,069,373 | ) | | | 21,874,998 | | |
Net increase (decrease) in net assets from operations | | | (9,462,986 | ) | | | 23,164,826 | | |
DIVIDENDS AND DISTRIBUTIONS TO SHAREHOLDERS FROM: | |
Net investment income: | |
Class 1 | | | (204,051 | ) | | | — | | |
Class 2 | | | (3,555,055 | ) | | | (1,243,112 | ) | |
Class 3 | | | (1,598,567 | ) | | | (897,173 | ) | |
Capital gains: | |
Class 1 | | | (166,643 | ) | | | — | | |
Class 2 | | | (2,534,923 | ) | | | — | | |
Class 3 | | | (1,086,259 | ) | | | — | | |
Total Dividends and Distributions | | | (9,145,498 | ) | | | (2,140,285 | ) | |
TRANSACTIONS IN SHARES OF BENEFICIAL INTEREST | |
Net proceeds from shares subscribed: | |
Class 1 | | | 16,949,000 | | | | — | | |
Class 2 | | | 83,102,298 | | | | 156,103,614 | | |
Class 3 | | | — | | | | 101,519,199 | | |
Purchase premiums: | |
Class 1 | | | 2,204 | | | | — | | |
Class 2 | | | 158,176 | | | | 140,612 | | |
Class 3 | | | 72,187 | | | | 141,798 | | |
Redemption fees: | |
Class 1 | | | 174 | | | | — | | |
Class 2 | | | 3,597 | | | | — | | |
Class 3 | | | 1,732 | | | | — | | |
Dividends reinvested: | |
Class 1 | | | 370,694 | | | | — | | |
Class 2 | | | 6,089,979 | | | | 1,243,112 | | |
Class 3 | | | 2,684,825 | | | | 897,173 | | |
Cost of shares redeemed: | |
Class 1 | | | — | | | | (26,363,614 | ) | |
Class 2 | | | (3,001,502 | ) | | | — | | |
Class 3 | | | — | | | | — | | |
Increase in Net Assets from Transactions in Shares of Beneficial Interest | | | 106,433,364 | | | | 233,681,894 | | |
Total Increase in Net Assets | | | 87,824,880 | | | | 254,706,435 | | |
NET ASSETS | |
Beginning of year | | | 279,517,814 | | | | 24,811,379 | | |
End of year (including distributions in excess of net investment income of
$1,089,282 and $661,626, respectively) | | $ | 367,342,694 | | | $ | 279,517,814 | | |
| | | | | | |
The accompanying notes are an integral part of the financial statements.
46
Annual Report December 31, 2014
Baillie Gifford International Choice Fund
Selected data for a Class 1 Share outstanding throughout the period:
| | | For the Period
April 9, 2014(a)
through
December 31, 2014 | |
Net asset value, beginning of period | | $ | 12.41 | | |
From Investment Operations | |
Net investment income(b) | | | 0.08 | | |
Net realized and unrealized loss on investments and foreign currency transactions | | | (0.82 | ) | |
Net decrease in net asset value from investment operations | | | (0.74 | ) | |
Dividends and Distributions to Shareholders | |
Dividends from net investment income | | | (0.15 | ) | |
Distributions from net realized gain on investments | | | (0.12 | ) | |
Total Dividends and Distributions | | | (0.27 | ) | |
Proceeds from Purchase Premiums and Redemption Fees(b) | | | 0.00 | (c) | |
Net asset value, end of period | | $ | 11.40 | | |
Total Return | |
Total investment return based on net asset value(d) | | | (5.98 | )% | |
Ratios/Supplemental Data | |
Net assets, end of period (000's omitted) | | $ | 15,934 | | |
Ratio of net expenses to average net assets, before waiver | | | 0.83 | %* | |
Ratio of net expenses to average net assets, after waiver | | | 0.83 | %* | |
Ratio of net investment income to average net assets | | | 0.91 | %* | |
Portfolio turnover rate(e) | | | 9 | % | |
* Annualized.
(a) Commencement of investment operations.
(b) Calculated based upon average shares outstanding during the period.
(c) Amount is less than $0.005 per share.
(d) Total investment return is calculated assuming an initial investment made at the net asset value at the beginning of the period, reinvestment of all dividends and distributions, if any, at net asset value during the period, and redemption on the last day of the period. Total return is not annualized for periods less than one year.
(e) Portfolio turnover rate calculated at Fund level.
The accompanying notes are an integral part of the financial statements.
47
Annual Report December 31, 2014
Baillie Gifford International Choice Fund
Selected data for a Class 2 Share outstanding throughout each period:
| | | For the
Year Ended
December 31,
2014 | | For the Period
April 9, 2013(a)
through
December 31,
2013 | |
Net asset value, beginning of period | | $ | 12.20 | | | $ | 11.00 | | |
From Investment Operations | |
Net investment income(b) | | | 0.17 | | | | 0.08 | | |
Net realized and unrealized gain/(loss) on investments and foreign currency transactions | | | (0.58 | ) | | | 1.19 | | |
Net increase (decrease) in net asset value from investment operations | | | (0.41 | ) | | | 1.27 | | |
Dividends and Distributions to Shareholders | | | | | | | | | |
Dividends from net investment income | | | (0.17 | ) | | | (0.09 | ) | |
Distributions from net realized gain on investments | | | (0.12 | ) | | | — | | |
Total Dividends and Distributions | | | (0.29 | ) | | | (0.09 | ) | |
Proceeds from Purchase Premiums and Redemption Fees(b) | | | 0.01 | | | | 0.02 | | |
Net asset value, end of period | | $ | 11.51 | | | $ | 12.20 | | |
Total Return | |
Total investment return based on net asset value(c) | | | (3.29 | )% | | | 11.76 | % | |
Ratios/Supplemental Data | |
Net assets, end of period (000's omitted) | | $ | 245,206 | | | $ | 169,778 | | |
Ratio of net expenses to average net assets, before waiver | | | 0.63 | % | | | 0.67 | %* | |
Ratio of net expenses to average net assets, after waiver | | | 0.63 | % | | | 0.66 | %* | |
Ratio of net investment income to average net assets | | | 1.35 | % | | | 0.98 | %* | |
Portfolio turnover rate | | | 9 | % | | | 11 | % | |
* Annualized.
(a) Commencement of investment operations.
(b) Calculated based upon average shares outstanding during the period.
(c) Total investment return is calculated assuming an initial investment made at the net asset value at the beginning of the period, reinvestment of all dividends and distributions, if any, at net asset value during the period, and redemption on the last day of the period. Total return is not annualized for periods less than one year.
The accompanying notes are an integral part of the financial statements.
48
Annual Report December 31, 2014
Baillie Gifford International Choice Fund
Selected data for a Class 3 Share outstanding throughout each period:
| | | For the
Year Ended
December 31,
2014 | | For the Period
April 30, 2013(a)
through
December 31,
2013 | |
Net asset value, beginning of period | | $ | 12.33 | | | $ | 11.50 | | |
From Investment Operations | |
Net investment income(b) | | | 0.17 | | | | 0.09 | | |
Net realized and unrealized gain/(loss) on investments and foreign currency transactions | | | (0.58 | ) | | | 0.82 | | |
Net increase (decrease) in net asset value from investment operations | | | (0.41 | ) | | | 0.91 | | |
Dividends and Distributions to Shareholders | | | | | | | | | |
Dividends from net investment income | | | (0.18 | ) | | | (0.10 | ) | |
Distributions from net realized gain on investments | | | (0.12 | ) | | | — | | |
Total Dividends and Distributions | | | (0.30 | ) | | | (0.10 | ) | |
Proceeds from Purchase Premiums and Redemption Fees(b) | | | 0.01 | | | | 0.02 | | |
Net asset value, end of period | | $ | 11.63 | | | $ | 12.33 | | |
Total Return | |
Total investment return based on net asset value(c) | | | (3.26 | )% | | | 8.11 | % | |
Ratios/Supplemental Data | |
Net assets, end of period (000's omitted) | | $ | 106,203 | | | $ | 109,740 | | |
Ratio of net expenses to average net assets, before waiver | | | 0.56 | % | | | 0.58 | %* | |
Ratio of net expenses to average net assets, after waiver | | | 0.56 | % | | | 0.58 | %* | |
Ratio of net investment income to average net assets | | | 1.38 | % | | | 1.10 | %* | |
Portfolio turnover rate | | | 9 | % | | | 11 | % | |
* Annualized.
(a) Commencement of investment operations.
(b) Calculated based upon average shares outstanding during the period.
(c) Total investment return is calculated assuming an initial investment made at the net asset value at the beginning of the period, reinvestment of all dividends and distributions, if any, at net asset value during the period, and redemption on the last day of the period. Total return is not annualized for periods less than one year.
The accompanying notes are an integral part of the financial statements.
49
Industry Diversification Table
Annual Report December 31, 2014
December 31, 2014 (Unaudited)
Baillie Gifford EAFE Fund
| | | Value | | % of Total
Net Assets | |
Aerospace | | $ | 45,218,646 | | | | 2.0 | % | |
Aerospace/Defense | | | 21,684,577 | | | | 1.0 | | |
Apparel Retailers | | | 100,693,251 | | | | 4.5 | | |
Auto Manufacturers | | | 28,112,432 | | | | 1.3 | | |
Automobiles | | | 86,399,004 | | | | 3.9 | | |
Banks | | | 282,900,524 | | | | 12.6 | | |
Beverages, Food & Tobacco | | | 9,941,624 | | | | 0.4 | | |
Biotechnology | | | 64,394,653 | | | | 2.9 | | |
Broadcasting & Entertainment | | | 8,925,766 | | | | 0.4 | | |
Broadline Retailers | | | 50,346,567 | | | | 2.3 | | |
Building Materials & Fixtures | | | 24,316,871 | | | | 1.1 | | |
Business Support Services | | | 35,118,220 | | | | 1.6 | | |
Chemicals | | | 53,467,199 | | | | 2.4 | | |
Computers | | | 9,356,566 | | | | 0.4 | | |
Construction & Building Materials | | | 26,801,476 | | | | 1.2 | | |
Diversified Financial Services | | | 50,488,782 | | | | 2.3 | | |
Diversified Industrials | | | 24,213,898 | | | | 1.1 | | |
Energy — Alternate Sources | | | 3,122,588 | | | | 0.1 | | |
Engineering & Machinery | | | 17,849,479 | | | | 0.8 | | |
Food & Drug Retailers | | | 13,906,703 | | | | 0.6 | | |
Food Producers & Processors | | | 12,353,428 | | | | 0.6 | | |
Food Retailers & Wholesalers | | | 25,480,895 | | | | 1.1 | | |
General Financial | | | 12,654,084 | | | | 0.6 | | |
General Retailers | | | 13,233,797 | | | | 0.6 | | |
Healthcare — Products | | | 49,260,805 | | | | 2.2 | | |
Industrial Engineering | | | 13,350,376 | | | | 0.6 | | |
Industrial Machinery | | | 108,650,390 | | | | 4.9 | | |
Insurance | | | 58,937,919 | | | | 2.6 | | |
Internet | | | 271,550,487 | | | | 12.1 | | |
Life Insurance | | | 76,974,971 | | | | 3.4 | | |
Media | | | 12,927,149 | | | | 0.6 | | |
Media & Photography | | | 25,502,005 | | | | 1.1 | | |
Medical Equipment | | | 9,079,020 | | | | 0.4 | | |
Mining & Metals | | | 16,033,003 | | | | 0.7 | | |
Personal Goods | | | 41,061,534 | | | | 1.8 | | |
Personal Products | | | 60,970,717 | | | | 2.7 | | |
Pharmaceuticals | | | 44,297,519 | | | | 2.0 | | |
Retailers — General | | | 8,709,204 | | | | 0.4 | | |
Semiconductors | | | 89,898,286 | | | | 4.0 | | |
Software | | | 17,473,757 | | | | 0.8 | | |
50
Industry Diversification Table
Annual Report December 31, 2014
| | | Value | | % of Total
Net Assets | |
Speciality Finance | | $ | 78,522,236 | | | | 3.5 | % | |
Specialized Consumer Services | | | 121,018,682 | | | | 5.4 | | |
Telecommunication Services | | | 89,165,893 | | | | 4.0 | | |
Toys/Games/Hobbies | | | 5,499,914 | | | | 0.2 | | |
Total Value of Investments | | | 2,219,864,897 | | | | 99.2 | | |
Other assets less liabilities | | | 18,210,072 | | | | 0.8 | | |
Net Assets | | $ | 2,238,074,969 | | | | 100.0 | % | |
51
Annual Report December 31, 2014
December 31, 2014
Baillie Gifford EAFE Fund
| | | Shares | | Value | |
COMMON STOCKS — 98.8% | |
ARGENTINA — 1.4% | |
MercadoLibre, Inc. | | | 250,300 | | | $ | 31,955,801 | | |
AUSTRALIA — 1.1% | |
Cochlear Ltd. | | | 143,913 | | | | 9,079,020 | | |
Fortescue Metals Group Ltd. | | | 7,302,199 | | | | 16,033,003 | | |
| | | | | | 25,112,023 | | |
CHILE — 0.5% | |
Sociedad Quimica y Minera de Chile SA ADR | | | 443,100 | | | | 10,581,228 | | |
CHINA — 13.5% | |
Alibaba Group Holding Ltd. ADR (a) | | | 375,028 | | | | 38,980,410 | | |
Baidu, Inc. ADR (a) | | | 512,246 | | | | 116,776,721 | | |
Hong Kong Exchanges and Clearing Ltd. | | | 1,128,201 | | | | 24,906,991 | | |
JD.com, Inc. ADR (a) | | | 385,200 | | | | 8,913,528 | | |
New Oriental Education & Technology Group, Inc. ADR (a) | | | 726,200 | | | | 14,821,742 | | |
Tencent Holdings Ltd. | | | 6,128,300 | | | | 88,669,948 | | |
Youku Tudou, Inc. ADR (a) | | | 501,166 | | | | 8,925,766 | | |
| | | | | | 301,995,106 | | |
DENMARK — 3.8% | |
Chr. Hansen Holding A/S | | | 318,100 | | | | 14,092,904 | | |
Novo Nordisk A/S, B Shares | | | 1,047,228 | | | | 44,297,519 | | |
Novozymes A/S, B Shares | | | 643,490 | | | | 27,086,785 | | |
| | | | | | 85,477,208 | | |
FRANCE — 6.2% | |
Compagnie Generale d'Optique Essillor International SA | | | 318,046 | | | | 35,468,361 | | |
Kering | | | 215,605 | | | | 41,433,039 | | |
L'Oreal SA | | | 364,282 | | | | 60,970,717 | | |
| | | | | | 137,872,117 | | |
GERMANY — 3.5% | |
Aixtron SE NA (a) | | | 789,310 | | | | 8,872,713 | | |
HeidelbergCement AG | | | 199,875 | | | | 14,107,199 | | |
MorphoSys AG (a) | | | 111,513 | | | | 10,388,232 | | |
Rocket Internet AG 144A (a) | | | 280,998 | | | | 17,473,757 | | |
The accompanying notes are an integral part of the financial statements.
52
Annual Report December 31, 2014
December 31, 2014
Baillie Gifford EAFE Fund
| | | Shares | | Value | |
SMA Solar Technology AG (a) | | | 172,524 | | | $ | 3,122,588 | | |
Volkswagen AG | | | 89,829 | | | | 19,475,298 | | |
Zalando SE (a) | | | 156,271 | | | | 4,821,953 | | |
| | | | | | 78,261,740 | | |
HONG KONG — 3.4% | |
AIA Group Ltd. | | | 13,956,200 | | | | 76,974,971 | | |
INDIA — 0.6% | |
Housing Development Finance Corp. Ltd. | | | 693,500 | | | | 12,436,089 | | |
IRELAND — 1.6% | |
Bank of Ireland (a) | | | 61,751,104 | | | | 23,139,795 | | |
James Hardie Industries Plc. SE CDI | | | 1,189,131 | | | | 12,694,278 | | |
| | | | | | 35,834,073 | | |
ITALY — 7.8% | |
EXOR SpA | | | 621,769 | | | | 25,512,350 | | |
Fiat Chrysler Automobiles NV (a) | | | 7,435,527 | | | | 86,399,004 | | |
UniCredit SpA | | | 9,707,161 | | | | 62,180,474 | | |
| | | | | | 174,091,828 | | |
JAPAN — 11.1% | |
Don Quijote Holdings Co., Ltd. | | | 192,500 | | | | 13,233,797 | | |
M3, Inc. | | | 772,600 | | | | 12,927,149 | | |
Rakuten, Inc. | | | 4,833,700 | | | | 67,216,530 | | |
Sanrio Co., Ltd. | | | 222,600 | | | | 5,499,914 | | |
SBI Holdings, Inc. | | | 1,158,200 | | | | 12,654,084 | | |
SMC Corp. | | | 179,100 | | | | 46,964,334 | | |
SoftBank Corp. | | | 1,498,000 | | | | 89,165,893 | | |
| | | | | | 247,661,701 | | |
NETHERLANDS — 1.3% | |
| ASML Holding NV | | | 185,552 | | | | 20,048,476 | | |
Gemalto NV | | | 114,646 | | | | 9,356,566 | | |
| | | | | | 29,405,042 | | |
NORWAY — 1.1% | |
Schibsted ASA | | | 402,117 | | | | 25,502,005 | | |
The accompanying notes are an integral part of the financial statements.
53
Annual Report December 31, 2014
December 31, 2014
Baillie Gifford EAFE Fund
| | | Shares | | Value | |
PERU — 1.0% | |
Credicorp Ltd. | | | 134,516 | | | $ | 21,546,773 | | |
PORTUGAL — 0.4% | |
Jeronimo Martins SGPS SA | | | 992,137 | | | | 9,941,624 | | |
RUSSIA — 0.7% | |
Magnit OJSC GDR Reg S | | | 239,858 | | | | 10,839,896 | | |
Mail.ru Group Ltd. GDR Reg S (a) | | | 274,238 | | | | 4,427,348 | | |
| | | | | | 15,267,244 | | |
SINGAPORE — 0.6% | |
Singapore Exchange Ltd. | | | 2,236,000 | | | | 13,145,702 | | |
SOUTH KOREA — 1.9% | |
Celltrion, Inc. (a) | | | 365,190 | | | | 12,826,732 | | |
NAVER Corp. | | | 46,407 | | | | 29,720,669 | | |
| | | | | | 42,547,401 | | |
SPAIN — 9.2% | |
Banco Popular Espanol SA | | | 13,367,107 | | | | 66,632,944 | | |
Banco Santander SA | | | 4,593,748 | | | | 38,555,977 | | |
Distribuidora Internacional de Alimentacion SA | | | 2,160,683 | | | | 14,640,999 | | |
Inditex SA | | | 3,024,406 | | | | 86,272,593 | | |
| | | | | | 206,102,513 | | |
SWEDEN — 10.4% | |
Alfa Laval AB | | | 1,280,494 | | | | 24,213,898 | | |
Atlas Copco AB, A Shares | | | 2,216,876 | | | | 61,686,056 | | |
Elekta AB, B Shares | | | 1,349,055 | | | | 13,792,444 | | |
Investment AB Kinnevik, B Shares | | | 1,630,109 | | | | 53,009,886 | | |
Sandvik AB | | | 1,835,784 | | | | 17,849,479 | | |
Svenska Handelsbanken AB, A Shares | | | 1,047,443 | | | | 49,007,634 | | |
Volvo AB, B Shares | | | 1,238,038 | | | | 13,350,376 | | |
| | | | | | 232,909,773 | | |
SWITZERLAND — 5.2% | |
Compagnie Financiere Richemont SA | | | 463,142 | | | | 41,061,534 | | |
Geberit AG | | | 71,879 | | | | 24,316,871 | | |
The accompanying notes are an integral part of the financial statements.
54
Annual Report December 31, 2014
December 31, 2014
Baillie Gifford EAFE Fund
| | | Shares | | Value | |
Swatch Group AG (The) | | | 19,604 | | | $ | 8,709,204 | | |
Syngenta AG | | | 133,328 | | | | 42,885,971 | | |
| | | | | | 116,973,580 | | |
TURKEY — 0.6% | |
BIM Birlesik Magazalar A/S | | | 577,671 | | | | 12,353,428 | | |
UNITED KINGDOM — 11.9% | |
Aggreko Plc. | | | 1,505,925 | | | | 35,118,220 | | |
ARM Holdings Plc. | | | 3,969,240 | | | | 60,977,097 | | |
ASOS Plc. (a) | | | 241,429 | | | | 9,598,705 | | |
Meggitt Plc. | | | 2,695,658 | | | | 21,684,577 | | |
Ocado Group Plc. (a) | | | 2,246,669 | | | | 13,906,703 | | |
Prudential Plc. | | | 2,549,270 | | | | 58,937,918 | | |
Rolls-Royce Holdings Plc. | | | 3,366,019 | | | | 45,218,646 | | |
Standard Chartered Plc. | | | 1,460,085 | | | | 21,836,927 | | |
| | | | | | 267,278,793 | | |
Total Common Stocks | |
(cost $1,611,416,304) | | | | | 2,211,227,763 | | |
PREFERRED STOCKS — 0.4% | |
GERMANY — 0.4% | |
Porsche Automobil Holding SE (cost $5,834,498) | | | 106,799 | | | | 8,637,134 | | |
TOTAL INVESTMENTS — 99.2% | |
(cost $1,617,250,802) | | | | $ | 2,219,864,897 | | |
Other assets less liabilities — 0.8% | | | | | 18,210,072 | | |
NET ASSETS — 100.0% | | | | $ | 2,238,074,969 | | |
(a) Non-income producing security.
ADR — American Depositary Receipt.
CDI — Chess Depositary Interest.
GDR — Global Depositary Receipt.
Reg S — Regulation S ("Reg S") of the securities Act of 1933, as amended ("1933 Act") is a safe harbor that defines when an offering of securities will be deemed to come to rest abroad and therefore is not subject to the registration obligations imposed under Section 5 of the 1933 Act. The regulation includes two safe harbor provisions: an issuer safe harbor and a resale safe harbor. In each case, the regulation demands that offers and sales of the securities be made outside the United States and that no offering participant (which includes the issuer, the banks assisting with the offer and their respective affiliates) engage in "directed" selling efforts. In the case of issuers for whose securities there is substantial U.S. market interest, the regulation also requires that no offers and sales be made to U.S. persons (including U.S. persons physically located outside the United States).
144 A — Securities are exempt from registration under Rule 144A under the Securities Act of 1933, as amended. These securities may be resold in transactions exempt from registration, normally to qualified institutional buyers. Prices are obtained daily from the London International Stock Exchange; therefore, Fair valuation is typically not required. At December 31, 2014, the net value of these securities was $17,473,757, representing 0.78% of net assets.
The accompanying notes are an integral part of the financial statements.
55
Statement of Assets and Liabilities
Annual Report December 31, 2014
December 31, 2014
Baillie Gifford EAFE Fund
ASSETS | |
Investments, at value (cost $1,617,250,802) | | $ | 2,219,864,897 | | |
Cash | | | 19,488,146 | | |
Foreign cash, at value (cost $471,751) | | | 472,192 | | |
Receivable for investments sold | | | 479,005 | | |
Dividends receivable | | | 426,459 | | |
Tax reclaims receivable | | | 1,645,090 | | |
Total Assets | | | 2,242,375,789 | | |
LIABILITIES | |
Management fee payable | | | 1,425,434 | | |
Servicing fee payable | | | 1,098,300 | | |
Payable for investments purchased | | | 77,393 | | |
Distribution payable | | | 1,054,151 | | |
Trustee fee payable | | | 20,751 | | |
Accrued expenses | | | 624,791 | | |
Total Liabilities | | | 4,300,820 | | |
NET ASSETS | | $ | 2,238,074,969 | | |
COMPOSITION OF NET ASSETS | |
Paid-in capital | | $ | 1,640,977,450 | | |
Distributions in excess of net investment income | | | (17,950,728 | ) | |
Accumulated net realized gain on investments and foreign currency transactions (net of Indian capital gains tax) | | | 12,587,492 | | |
Net unrealized appreciation in value of investments and foreign currencies | | | 602,460,755 | | |
NET ASSETS | | $ | 2,238,074,969 | | |
NET ASSET VALUE, PER SHARE | |
| Class 2 ($754,209,565 / 67,890,258 shares outstanding), unlimited authorized, no par value | | $ | 11.11 | | |
Maximum Purchase Price Per Share (Note D) | | $ | 11.14 | | |
Minimum Redemption Price Per Share (Note D) | | $ | 11.09 | | |
| Class 3 ($487,942,626 / 43,830,521 shares outstanding), unlimited authorized, no par value | | $ | 11.13 | | |
Maximum Purchase Price Per Share (Note D) | | $ | 11.16 | | |
Minimum Redemption Price Per Share (Note D) | | $ | 11.11 | | |
The accompanying notes are an integral part of the financial statements.
56
Statement of Assets and Liabilities
Annual Report December 31, 2014
| Class 4 ($205,227,583 / 18,410,472 shares outstanding), unlimited authorized, no par value | | $ | 11.15 | | |
Maximum purchase price per share (Note D) | | $ | 11.18 | | |
Minimum redemption price per share (Note D) | | $ | 11.13 | | |
| Class 5 ($790,695,195 / 70,848,878 shares outstanding), unlimited authorized, no par value | | $ | 11.16 | | |
Maximum purchase price per share (Note D) | | $ | 11.19 | | |
Minimum redemption price per share (Note D) | | $ | 11.14 | | |
The accompanying notes are an integral part of the financial statements.
57
Annual Report December 31, 2014
For the Year Ended December 31, 2014
Baillie Gifford EAFE Fund
INVESTMENT INCOME | |
Dividends (net of foreign withholding taxes of $4,732,223) | | $ | 42,038,350 | | |
Interest | | | 483 | | |
Total Investment Income | | | 42,038,833 | | |
EXPENSES | |
Management fee (Note B) | | | 5,931,630 | | |
Shareholder servicing fees — Class 1 Shares (Note B) | | | 3,864 | | |
Shareholder servicing fees — Class 2 Shares (Note B) | | | 2,187,304 | | |
Shareholder servicing fees — Class 3 Shares (Note B) | | | 1,029,677 | | |
Shareholder servicing fees — Class 4 Shares (Note B) | | | 366,799 | | |
Shareholder servicing fees — Class 5 Shares (Note B) | | | 997,293 | | |
Fund accounting | | | 1,162,594 | | |
Custody | | | 380,254 | | |
Legal | | | 279,991 | | |
Trustees' fees | | | 84,049 | | |
Professional fees | | | 79,710 | | |
Transfer agency | | | 39,794 | | |
Insurance | | | 28,220 | | |
Miscellaneous | | | 64,275 | | |
Total Expenses | | | 12,635,454 | | |
Net Investment Income | | | 29,403,379 | | |
REALIZED AND UNREALIZED GAIN (LOSS) ON INVESTMENTS
AND FOREIGN CURRENCY TRANSACTIONS | |
Net realized gain from: | |
Investments | | | 121,535,043 | | |
Foreign currency transactions | | | 125,831 | | |
| | | | 121,660,874 | | |
Net increase (decrease) in unrealized appreciation (depreciation) on: | |
Investments (net of deferred Indian capital gains tax of $1,403) | | | (316,097,668 | ) | |
Translation of assets and liabilities in foreign currencies | | | (225,284 | ) | |
| | | | (316,322,952 | ) | |
Net realized and unrealized loss on investments and foreign currency transactions | | | (194,662,078 | ) | |
NET DECREASE IN NET ASSETS FROM OPERATIONS | | $ | (165,258,699 | ) | |
The accompanying notes are an integral part of the financial statements.
58
Statements of Changes in Net Assets
Annual Report December 31, 2014
Baillie Gifford EAFE Fund
| | | For the
Year Ended
December 31,
2014 | | For the
Year Ended
December 31,
2013 | |
INCREASE (DECREASE) IN NET ASSETS FROM OPERATIONS | |
Net investment income | | $ | 29,403,379 | | | $ | 26,733,348 | | |
Net realized gain from investments and foreign currency transactions | | | 121,660,874 | | | | 48,569,137 | | |
Net increase (decrease) in unrealized appreciation (depreciation) on investments
and translation of assets and liabilities in foreign currencies | | | (316,322,952 | ) | | | 481,943,330 | | |
Net increase (decrease) in net assets from operations | | | (165,258,699 | ) | | | 557,245,815 | | |
DIVIDENDS AND DISTRIBUTIONS TO SHAREHOLDERS FROM: | |
Net investment income: | |
Class 1 | | | — | | | | (233,655 | ) | |
Class 2 | | | (9,320,741 | ) | | | (8,729,182 | ) | |
Class 3 | | | (6,352,405 | ) | | | (5,941,859 | ) | |
Class 4 | | | (2,730,027 | ) | | | (2,487,636 | ) | |
Class 5 | | | (10,901,354 | ) | | | (10,105,932 | ) | |
Capital Gains: | |
Class 1 | | | — | | | | — | | |
Class 2 | | | (29,768,962 | ) | | | — | | |
Class 3 | | | (19,181,263 | ) | | | — | | |
Class 4 | | | (8,054,995 | ) | | | — | | |
Class 5 | | | (30,984,381 | ) | | | — | | |
Total Dividends and Distributions | | | (117,294,128 | ) | | | (27,498,264 | ) | |
TRANSACTIONS IN SHARES OF BENEFICIAL INTEREST | |
Net proceeds from shares subscribed: | |
Class 2 | | | 45,528,771 | | | | 47,777,796 | | |
Class 3 | | | 2,346,938 | | | | 217,132,949 | | |
Class 4 | | | — | | | | 201,540,630 | | |
Class 5 | | | — | | | | 49,900,000 | | |
Purchase premiums: | |
Class 1 | | | — | | | | 2,951 | | |
Class 2 | | | 21,985 | | | | 51,231 | | |
Class 3 | | | 14,081 | | | | 36,622 | | |
Class 4 | | | 5,903 | | | | 1,789 | | |
Class 5 | | | 22,738 | | | | 47,607 | | |
Redemption fees: | |
Class 1 | | | — | | | | 8,131 | | |
Class 2 | | | 47,221 | | | | 147,441 | | |
Class 3 | | | 30,074 | | | | 105,792 | | |
Class 4 | | | 12,616 | | | | 4,975 | | |
Class 5 | | | 48,592 | | | | 125,165 | | |
Dividends reinvested: | |
Class 1 | | | — | | | | 233,655 | | |
Class 2 | | | 38,035,551 | | | | 7,780,515 | | |
Class 3 | | | 25,533,668 | | | | 5,941,859 | | |
Class 4 | | | 10,785,022 | | | | 2,487,636 | | |
Class 5 | | | 41,885,735 | | | | 10,105,932 | | |
The accompanying notes are an integral part of the financial statements.
59
Statements of Changes in Net Assets
Annual Report December 31, 2014
Baillie Gifford EAFE Fund
| | For the
Year Ended
December 31,
2014 | | For the
Year Ended
December 31,
2013 | |
Cost of shares redeemed: | |
Class 1 | | $ | (26,371,394 | ) | | $ | (27,717,996 | ) | |
Class 2 | | | (62,864,979 | ) | | | (360,935,125 | ) | |
Class 3 | | | (8,013,523 | ) | | | (318,740,539 | ) | |
Increase (Decrease) in Net Assets from Transactions in Shares of Beneficial Interest | | | 67,068,999 | | | | (163,960,984 | ) | |
Total Increase (Decrease) in Net Assets | | | (215,483,828 | ) | | | 365,786,567 | | |
NET ASSETS | |
Beginning of year | | | 2,453,558,797 | | | | 2,087,772,230 | | |
End of year (including distributions in excess of net investment income
of $17,950,728 and $18,175,411, respectively) | | $ | 2,238,074,969 | | | $ | 2,453,558,797 | | |
| | | | | | |
The accompanying notes are an integral part of the financial statements.
60
Annual Report December 31, 2014
Baillie Gifford EAFE Fund
Selected data for a Class 2 Shares outstanding throughout each year:
| | | For the
Year Ended
December 31,
2014 | | For the
Year Ended
December 31,
2013 | | For the
Year Ended
December 31,
2012 | | For the
Year Ended
December 31,
2011 | | For the
Year Ended
December 31,
2010 | |
Net asset value, beginning of year | | $ | 12.58 | | | $ | 9.88 | | | $ | 8.40 | | | $ | 9.70 | | | $ | 8.44 | | |
From Investment Operations | |
Net investment income(a) | | | 0.14 | | | | 0.13 | | | | 0.11 | | | | 0.13 | | | | 0.10 | | |
Net realized and unrealized gain/(loss) on
investments and foreign currency transactions | | | (1.01 | ) | | | 2.70 | | | | 1.47 | | | | (1.27 | ) | | | 1.29 | | |
Net increase (decrease) in net asset value from
investment operations | | | (0.87 | ) | | | 2.83 | | | | 1.58 | | | | (1.14 | ) | | | 1.39 | | |
Dividends and Distributions to Shareholders | | | | | | | | | | | | | | | | | | | | | |
Dividends from net investment income | | | (0.14 | ) | | | (0.13 | ) | | | (0.10 | ) | | | (0.16 | ) | | | (0.14 | ) | |
Distributions from net realized capital gains | | | (0.46 | ) | | | — | | | | — | | | | — | | | | — | | |
Total Dividends and Distributions | | | (0.60 | ) | | | (0.13 | ) | | | (0.10 | ) | | | (0.16 | ) | | | (0.14 | ) | |
Proceeds from Purchase Premiums and
Redemption Fees(a) | | | 0.00 | (b) | | | 0.00 | (b) | | | 0.00 | (b) | | | 0.00 | (b) | | | 0.01 | | |
Net asset value, end of year | | $ | 11.11 | | | $ | 12.58 | | | $ | 9.88 | | | $ | 8.40 | | | $ | 9.70 | | |
Total Return | |
Total investment return based on net asset value(c) | | | (6.98 | )% | | | 28.69 | % | | | 18.78 | % | | | (11.70 | )% | | | 16.60 | % | |
Ratios/Supplemental Data | |
Net assets, end of year (000's omitted) | | $ | 754,210 | | | $ | 828,208 | | | $ | 936,352 | | | $ | 682,295 | | | $ | 923,723 | | |
Ratio of net expenses to average net assets | | | 0.61 | % | | | 0.61 | % | | | 0.61 | % | | | 0.60 | % | | | 0.62 | % | |
Ratio of net investment income to average net assets | | | 1.18 | % | | | 1.21 | % | | | 1.20 | % | | | 1.33 | % | | | 1.14 | % | |
Portfolio turnover rate | | | 18 | % | | | 15 | % | | | 18 | % | | | 11 | % | | | 13 | % | |
(a) Calculated based upon average shares outstanding during the year.
(b) Rounds to less than $0.005 per share.
(c) Total investment return is calculated assuming an initial investment made at the net asset value at the beginning of the period, reinvestment of all dividends and distributions, if any, at net asset value during the period, and redemption on the last day of the period. Total return is not annualized for periods less than one year.
The accompanying notes are an integral part of the financial statements.
61
Annual Report December 31, 2014
Baillie Gifford EAFE Fund
Selected data for a Class 3 Shares outstanding throughout each period:
| | | For the
Year Ended
December 31,
2014 | | For the
Year Ended
December 31,
2013 | | For the
Year Ended
December 31,
2012 | | For the
Year Ended
December 31,
2011 | | For the Period
April 19,
2010(a)
through
December 31,
2010 | | For the Period
January 1,
2009
through
January 5,
2009(e) | |
Net asset value, beginning of period | | $ | 12.61 | | | $ | 9.90 | | | $ | 8.42 | | | $ | 9.72 | | | $ | 8.87 | | | $ | 5.86 | | |
From Investment Operations | |
Net investment income(b) | | | 0.15 | | | | 0.14 | | | | 0.12 | | | | 0.13 | | | | 0.08 | | | | 0.00 | (c) | |
Net realized and unrealized gain/(loss)
on investments and foreign currency
transactions | | | (1.02 | ) | | | 2.71 | | | | 1.46 | | | | (1.26 | ) | | | 0.91 | | | | 0.17 | | |
Net increase (decrease) in net asset
value from investment operations | | | (0.87 | ) | | | 2.85 | | | | 1.58 | | | | (1.13 | ) | | | 0.99 | | | | 0.17 | | |
Dividends and Distributions to
Shareholders | | | | | | | | | | | | | |
Dividends from net investment income | | | (0.15 | ) | | | (0.14 | ) | | | (0.10 | ) | | | (0.17 | ) | | | (0.15 | ) | | | — | | |
Distributions from net realized
capital gains | | | (0.46 | ) | | | — | | | | — | | | | — | | | | — | | | | — | | |
Total Dividends and Distributions | | | (0.61 | ) | | | (0.14 | ) | | | (0.10 | ) | | | (0.17 | ) | | | (0.15 | ) | | | — | | |
Proceeds from Purchase Premiums
and Redemption Fees(b) | | | 0.00 | (c) | | | 0.00 | (c) | | | 0.00 | (c) | | | 0.00 | (c) | | | 0.01 | | | | — | | |
Net asset value, end of period | | $ | 11.13 | | | $ | 12.61 | | | $ | 9.90 | | | $ | 8.42 | | | $ | 9.72 | | | $ | 6.03 | (e) | |
Total Return | |
Total investment return based on net
asset value(d) | | | (6.91 | )% | | | 28.83 | % | | | 18.82 | % | | | (11.61 | )% | | | 11.25 | % | | | 2.90 | % | |
Ratios/Supplemental Data | |
Net assets, end of period (000's omitted) | | $ | 487,943 | | | $ | 530,001 | | | $ | 490,822 | | | $ | 502,187 | | | $ | 139,344 | | | $ | 0 | (e) | |
Ratio of net expenses to average
net assets | | | 0.54 | % | | | 0.54 | % | | | 0.54 | % | | | 0.54 | % | | | 0.56 | %* | | | 0.57 | %* | |
Ratio of net investment income to
average net assets | | | 1.23 | % | | | 1.30 | % | | | 1.26 | % | | | 1.35 | % | | | 1.26 | %* | | | 0.21 | %* | |
Portfolio turnover rate | | | 18 | % | | | 15 | % | | | 18 | % | | | 11 | % | | | 13 | % | | | 9 | % | |
* Annualized.
(a) Recommencement of Operations.
(b) Calculated based upon average shares outstanding during the period.
(c) Rounds to less than $0.005 per share.
(d) Total investment return is calculated assuming an initial investment made at the net asset value at the beginning of the period, reinvestment of all dividends and distributions, if any, at net asset value during the period, and redemption on the last day of the period. Total return is not annualized for periods less than one year.
(e) Class had no shareholders from January 6, 2009 to April 18, 2010. All shares of this class were redeemed at $6.03 on January 5, 2009. New shares were issued at $8.87 on April 19, 2010
The accompanying notes are an integral part of the financial statements.
62
Annual Report December 31, 2014
Baillie Gifford EAFE Fund
Selected data for a Class 4 Shares outstanding throughout each period:
| | | For the
Year Ended
December 31,
2014 | | For the Period
October 10,
2013(a)
through
December 31,
2013 | |
Net asset value, beginning of period | | $ | 12.62 | | | $ | 11.68 | | |
From Investment Operations | |
Net investment income(b) | | | 0.16 | | | | 0.00 | (c) | |
Net realized and unrealized gain/(loss) on investments and foreign currency transactions | | | (1.01 | ) | | | 1.08 | | |
Net increase (decrease) in net asset value from investment operations | | | (0.85 | ) | | | 1.08 | | |
Dividends and Distributions to Shareholders | | | | | |
Dividends from net investment income | | | (0.16 | ) | | | (0.14 | ) | |
Distributions from net realized capital gains | | | (0.46 | ) | | | — | | |
Total Dividends and Distributions | | | (0.62 | ) | | | (0.14 | ) | |
Proceeds from Purchase Premiums and Redemption Fees(b) | | | 0.00 | (c) | | | 0.00 | (c) | |
Net asset value, end of period | | $ | 11.15 | | | $ | 12.62 | | |
Total Return | |
Total investment return based on net asset value(d) | | | (6.88 | )% | | | 9.29 | % | |
Ratios/Supplemental Data | |
Net assets, end of period (000's omitted) | | $ | 205,228 | | | $ | 220,388 | | |
Ratio of net expenses to average net assets | | | 0.51 | % | | | 0.52 | %* | |
Ratio of net investment income to average net assets | | | 1.26 | % | | | 0.03 | %* | |
Portfolio turnover rate | | | 18 | % | | | 15 | % | |
* Annualized.
(a) Commencement of operations.
(b) Calculated based upon average shares outstanding during the period.
(c) Rounds to less than $0.005 per share.
(d) Total investment return is calculated assuming an initial investment made at the net asset value at the beginning of the period, reinvestment of all dividends and distributions, if any, at net asset value during the period, and redemption on the last day of the period. Total return is not annualized for periods less than one year.
The accompanying notes are an integral part of the financial statements.
63
Annual Report December 31, 2014
Baillie Gifford EAFE Fund
Selected data for a Class 5 Shares outstanding throughout each period:
| | | For the
Year Ended
December 31,
2014 | | For the
Year Ended
December 31,
2013 | | For the Period
July 18, 2012(a)
through
December 31,
2012 | |
Net asset value, beginning of period | | $ | 12.64 | | | $ | 9.92 | | | $ | 8.67 | | |
From Investment Operations | |
Net investment income(b) | | | 0.16 | | | | 0.14 | | | | 0.03 | | |
Net realized and unrealized gain/(loss) on
investments and foreign currency transactions | | | (1.02 | ) | | | 2.73 | | | | 1.33 | | |
Net increase (decrease) in net asset value from investment operations | | | (0.86 | ) | | | 2.87 | | | | 1.36 | | |
Dividends and Distributions to Shareholders | | | | | | | |
Dividends from net investment income | | | (0.16 | ) | | | (0.15 | ) | | | (0.11 | ) | |
Distributions from net realized capital gains | | | (0.46 | ) | | | — | | | | — | | |
Total Dividends and Distributions | | | (0.62 | ) | | | (0.15 | ) | | | (0.11 | ) | |
Proceeds from Purchase Premiums and Redemption Fees(b) | | | 0.00 | (c) | | | 0.00 | (c) | | | 0.00 | (c) | |
Net asset value, end of period | | $ | 11.16 | | | $ | 12.64 | | | $ | 9.92 | | |
Total Return | |
Total investment return based on net asset value(d) | | | (6.83 | )% | | | 28.97 | % | | | 15.72 | % | |
Ratios/Supplemental Data | |
Net assets, end of period (000's omitted) | | $ | 790,695 | | | $ | 848,681 | | | $ | 616,590 | | |
Ratio of net expenses to average net assets | | | 0.46 | % | | | 0.46 | % | | | 0.46 | %* | |
Ratio of net investment income to average net assets | | | 1.30 | % | | | 1.28 | % | | | 0.70 | %* | |
Portfolio turnover rate | | | 18 | % | | | 15 | % | | | 18 | % | |
* Annualized.
(a) Commencement of operations.
(b) Calculated based upon average shares outstanding during the period.
(c) Rounds to less than $0.005 per share.
(d) Total investment return is calculated assuming an initial investment made at the net asset value at the beginning of the period, reinvestment of all dividends and distributions, if any, at net asset value during the period, and redemption on the last day of the period. Total return is not annualized for periods less than one year.
The accompanying notes are an integral part of the financial statements.
64
Industry Diversification Table
Annual Report December 31, 2014
December 31, 2014 (Unaudited)
Baillie Gifford EAFE Choice Fund
| | | Value | | % of Total
Net Assets | |
Apparel Retailers | | $ | 3,787,480 | | | | 2.6 | % | |
Asset Managers | | | 4,073,672 | | | | 2.8 | | |
Auto Manufacturers | | | 2,209,683 | | | | 1.5 | | |
Banks | | | 13,931,341 | | | | 9.4 | | |
Beverages, Food & Tobacco | | | 1,443,055 | | | | 1.0 | | |
Biotechnology | | | 2,132,091 | | | | 1.4 | | |
Brewers | | | 4,591,346 | | | | 3.1 | | |
Broadline Retailers | | | 615,524 | | | | 0.4 | | |
Building Materials & Fixtures | | | 2,036,922 | | | | 1.4 | | |
Bus, Train & Employment | | | 2,460,507 | | | | 1.7 | | |
Business Support Services | | | 1,459,446 | | | | 1.0 | | |
Clothing & Accessories | | | 1,507,895 | | | | 1.0 | | |
Commercial Vehicles & Trucks | | | 1,452,925 | | | | 1.0 | | |
Containers & Packaging | | | 1,530,844 | | | | 1.0 | | |
Distillers & Vintners | | | 954,719 | | | | 0.6 | | |
Electrical Components & Equipment | | | 1,646,036 | | | | 1.1 | | |
Electronic & Electrical Equipment | | | 1,713,507 | | | | 1.2 | | |
Electronic Equipment | | | 2,393,366 | | | | 1.6 | | |
Food & Drug Retailers | | | 808,226 | | | | 0.5 | | |
Food Products | | | 5,785,675 | | | | 3.9 | | |
Food Retailers & Wholesalers | | | 1,778,102 | | | | 1.2 | | |
Footwear | | | 1,453,846 | | | | 1.0 | | |
Gambling | | | 747,824 | | | | 0.5 | | |
General Industrials | | | 2,503,492 | | | | 1.7 | | |
General Mining | | | 2,199,064 | | | | 1.5 | | |
Healthcare — Products | | | 1,078,519 | | | | 0.7 | | |
Holding Companies — Diversified | | | 676,745 | | | | 0.5 | | |
Industrial Machinery | | | 12,006,498 | | | | 8.1 | | |
Integrated Oil & Gas | | | 4,326,466 | | | | 2.9 | | |
Internet | | | 2,279,700 | | | | 1.5 | | |
Investment Companies | | | 973,330 | | | | 0.7 | | |
Media & Photography | | | 2,058,171 | | | | 1.4 | | |
Media Agencies | | | 1,881,585 | | | | 1.3 | | |
Medical Equipment | | | 5,149,262 | | | | 3.5 | | |
Nondurable Household Products | | | 2,425,225 | | | | 1.6 | | |
Nonlife Insurance | | | 2,137,095 | | | | 1.4 | | |
Oil Equipment & Services | | | 1,638,292 | | | | 1.1 | | |
Personal Products | | | 3,063,925 | | | | 2.1 | | |
Pharmaceuticals | | | 4,592,931 | | | | 3.1 | | |
Pharmaceuticals & Biotechnology | | | 3,313,384 | | | | 2.2 | | |
65
Industry Diversification Table
Annual Report December 31, 2014
| | | Value | | % of Total
Net Assets | |
Property & Casualty Insurance | | $ | 3,140,014 | | | | 2.1 | % | |
Recreational Products | | | 3,484,133 | | | | 2.4 | | |
Restaurants & Bars | | | 1,595,502 | | | | 1.1 | | |
Retailers — General | | | 2,396,330 | | | | 1.6 | | |
Semiconductors | | | 5,041,153 | | | | 3.4 | | |
Soft Drinks | | | 2,099,123 | | | | 1.4 | | |
Speciality Chemicals | | | 3,064,058 | | | | 2.1 | | |
Speciality Finance | | | 7,270,588 | | | | 4.9 | | |
Specialized Consumer Services | | | 3,887,120 | | | | 2.6 | | |
Total Value of Investments | | | 144,795,737 | | | | 97.8 | | |
Other assets less liabilities | | | 3,311,690 | | | | 2.2 | | |
Net Assets | | $ | 148,107,427 | | | | 100.0 | % | |
66
Annual Report December 31, 2014
December 31, 2014
Baillie Gifford EAFE Choice Fund
| | | Shares | | Value | |
COMMON STOCKS — 96.9% | |
AUSTRALIA — 5.7% | |
Brambles Ltd. | | | 177,711 | | | $ | 1,530,844 | | |
Cochlear Ltd. | | | 47,306 | | | | 2,984,387 | | |
Mesoblast Ltd. (a) | | | 142,540 | | | | 506,564 | | |
Seek Ltd. | | | 176,455 | | | | 2,460,507 | | |
Treasury Wine Estates Ltd. | | | 247,351 | | | | 954,719 | | |
| | | | | | 8,437,021 | | |
CHINA — 4.8% | |
Baidu, Inc. ADR (a) | | | 10,000 | | | | 2,279,700 | | |
Cafe de Coral Holdings Ltd. | | | 299,702 | | | | 1,036,915 | | |
Jardine Strategic Holdings Ltd. | | | 19,900 | | | | 676,745 | | |
JD.com, Inc. ADR (a) | | | 26,600 | | | | 615,524 | | |
Mindray Medical International Ltd. ADR | | | 40,853 | | | | 1,078,519 | | |
Tsingtao Brewery Co. Ltd., Class H | | | 213,943 | | | | 1,443,055 | | |
| | | | | | 7,130,458 | | |
DENMARK — 5.0% | |
Carlsberg A/S, B Shares | | | 31,424 | | | | 2,413,358 | | |
Novo Nordisk A/S, B Shares | | | 78,331 | | | | 3,313,384 | | |
Novozymes A/S, B Shares | | | 38,617 | | | | 1,625,527 | | |
| | | | | | 7,352,269 | | |
FRANCE — 3.9% | |
Kone Oyj, B Shares | | | 51,074 | | | | 2,325,290 | | |
Legrand SA | | | 31,378 | | | | 1,646,036 | | |
Total SA | | | 34,928 | | | | 1,789,437 | | |
| | | | | | 5,760,763 | | |
GERMANY — 1.0% | |
adidas AG | | | 20,935 | | | | 1,453,846 | | |
HONG KONG — 1.4% | |
BOC Hong Kong Holdings Ltd. | | | 348,960 | | | | 1,162,784 | | |
Li & Fung Ltd. | | | 956,782 | | | | 895,751 | | |
| | | | | | 2,058,535 | | |
The accompanying notes are an integral part of the financial statements.
67
Annual Report December 31, 2014
December 31, 2014
Baillie Gifford EAFE Choice Fund
| | | Shares | | Value | |
INDIA — 1.5% | |
Mahindra & Mahindra Ltd. GDR | | | 110,900 | | | $ | 2,209,683 | | |
ISRAEL — 0.2% | |
Protalix BioTherapeutics, Inc. (a) | | | 137,636 | | | | 253,250 | | |
ITALY — 2.2% | |
CNH Industrial NV | | | 179,482 | | | | 1,452,925 | | |
EXOR SpA | | | 44,348 | | | | 1,819,682 | | |
| | | | | | 3,272,607 | | |
JAPAN — 16.1% | |
Asahi Group Holdings Ltd. | | | 70,400 | | | | 2,177,988 | | |
Kao Corp. | | | 61,500 | | | | 2,425,225 | | |
MS&AD Insurance Group Holdings, Inc. | | | 132,500 | | | | 3,140,014 | | |
Olympus Corp. (a) | | | 61,800 | | | | 2,164,875 | | |
Rakuten, Inc. | | | 182,000 | | | | 2,530,858 | | |
Sankyo Co., Ltd. | | | 21,800 | | | | 747,824 | | |
Shimano, Inc. | | | 26,900 | | | | 3,484,133 | | |
Shiseido Co., Ltd. | | | 154,600 | | | | 2,168,174 | | |
SMC Corp. | | | 6,600 | | | | 1,730,679 | | |
SUGI Holdings Co., Ltd. | | | 19,800 | | | | 808,226 | | |
THK Co., Ltd. | | | 101,900 | | | | 2,448,850 | | |
| | | | | | 23,826,846 | | |
NEW ZEALAND — 0.9% | |
Trade Me Group Ltd. | | | 477,506 | | | | 1,356,262 | | |
SINGAPORE — 3.6% | |
Jardine Matheson Holdings Ltd. | | | 41,200 | | | | 2,503,492 | | |
United Overseas Bank Ltd. | | | 152,162 | | | | 2,808,006 | | |
| | | | | | 5,311,498 | | |
SOUTH AFRICA — 2.3% | |
Clicks Group Ltd. | | | 194,432 | | | | 1,359,415 | | |
Naspers Ltd., N Shares | | | 15,911 | | | | 2,058,171 | | |
| | | | | | 3,417,586 | | |
The accompanying notes are an integral part of the financial statements.
68
Annual Report December 31, 2014
December 31, 2014
Baillie Gifford EAFE Choice Fund
| | | Shares | | Value | |
SOUTH KOREA — 2.4% | |
Samsung Electronics Co., Ltd. GDR Reg S | | | 2,387 | | | $ | 1,432,791 | | |
Samsung Fire & Marine Insurance Co., Ltd. | | | 8,315 | | | | 2,137,095 | | |
| | | | | | 3,569,886 | | |
SPAIN — 2.9% | |
Corporacion Financiera Alba SA | | | 19,908 | | | | 973,330 | | |
Distribuidora Internacional de Alimentacion SA | | | 262,408 | | | | 1,778,102 | | |
Inditex SA | | | 54,585 | | | | 1,557,063 | | |
| | | | | | 4,308,495 | | |
SWEDEN — 8.3% | |
Atlas Copco AB, B Shares | | | 107,600 | | | | 2,754,326 | | |
Investment AB Kinnevik, B Shares | | | 120,367 | | | | 3,914,242 | | |
Investor AB, B Shares | | | 42,265 | | | | 1,536,664 | | |
Svenska Handelsbanken AB, A Shares | | | 88,442 | | | | 4,138,013 | | |
| | | | | | 12,343,245 | | |
SWITZERLAND — 10.4% | |
Geberit AG | | | 6,021 | | | | 2,036,922 | | |
Mettler-Toledo International, Inc. (a) | | | 7,913 | | | | 2,393,366 | | |
Nestle SA | | | 50,204 | | | | 3,659,923 | | |
Roche Holding AG — Genusschein | | | 16,017 | | | | 4,339,681 | | |
Schindler Holding AG, Participating Certificates | | | 11,303 | | | | 1,631,749 | | |
UBS Group AG (a) | | | 82,574 | | | | 1,419,422 | | |
| | | | | | 15,481,063 | | |
TAIWAN — 2.9% | |
Hon Hai Precision Industry Co., Ltd. GDR Reg S | | | 305,438 | | | | 1,713,507 | | |
Taiwan Semiconductor Manufacturing Co., Ltd. ADR | | | 115,059 | | | | 2,575,020 | | |
| | | | | | 4,288,527 | | |
TURKEY — 1.0% | |
Turkiye Garanti Bankasi A/S | | | 353,965 | | | | 1,421,926 | | |
UNITED KINGDOM — 19.0% | |
ASOS Plc. (a) | | | 56,100 | | | | 2,230,417 | | |
BG Group Plc. | | | 189,589 | | | | 2,537,029 | | |
BHP Billiton Plc. | | | 68,279 | | | | 1,463,314 | | |
Burberry Group Plc. | | | 59,432 | | | | 1,507,895 | | |
The accompanying notes are an integral part of the financial statements.
69
Annual Report December 31, 2014
December 31, 2014
Baillie Gifford EAFE Choice Fund
| | | Shares | | Value | |
Hargreaves Lansdown Plc. | | | 173,667 | | | $ | 2,717,354 | | |
Imagination Technologies Group Plc. (a) | | | 292,900 | | | | 1,033,342 | | |
Intertek Group Plc. | | | 40,325 | | | | 1,459,446 | | |
John Wood Group Plc. | | | 177,093 | | | | 1,638,292 | | |
Johnson Matthey Plc. | | | 58,240 | | | | 3,064,058 | | |
Jupiter Fund Management Plc. | | | 240,190 | | | | 1,356,318 | | |
KAZ Minerals Plc. (a) | | | 184,388 | | | | 735,750 | | |
Mitchells & Butlers Plc. (a) | | | 267,843 | | | | 1,595,502 | | |
Rightmove Plc. | | | 53,955 | | | | 1,881,585 | | |
Standard Chartered Plc. | | | 116,667 | | | | 1,744,863 | | |
Unilever Plc. | | | 52,322 | | | | 2,125,752 | | |
Weir Group Plc. (The) | | | 38,904 | | | | 1,115,604 | | |
| | | | | | 28,206,521 | | |
UNITED STATES — 1.4% | |
Coca-Cola Enterprises, Inc. | | | 47,470 | | | | 2,099,123 | | |
Total Common Stocks | |
(cost $132,043,595) | | | | | 143,559,410 | | |
PREFERRED STOCKS — 0.9% | |
BRAZIL — 0.9% | |
Itau Unibanco Holding SA ADR (cost $1,239,139) | | | 95,029 | | | | 1,236,327 | | |
TOTAL INVESTMENTS — 97.8% | |
(cost $133,282,734) | | | | $ | 144,795,737 | | |
Other assets less liabilities — 2.2% | | | | | 3,311,690 | | |
NET ASSETS — 100.0% | | | | $ | 148,107,427 | | |
(a) Non-income producing security.
ADR — American Depositary Receipt.
GDR — Global Depositary Receipt.
Reg S — Regulation S ("Reg S") of the securities Act of 1933, as amended ("1933 Act") is a safe harbor that defines when an offering of securities will be deemed to come to rest abroad and therefore is not subject to the registration obligations imposed under Section 5 of the 1933 Act. The regulation includes two safe harbor provisions: an issuer safe harbor and a resale safe harbor. In each case, the regulation demands that offers and sales of the securities be made outside the United States and that no offering participant (which includes the issuer, the banks assisting with the offer and their respective affiliates) engage in "directed" selling efforts. In the case of issuers for whose securities there is substantial U.S. market interest, the regulation also requires that no offers and sales be made to U.S. persons (including U.S. persons physically located outside the United States).
The accompanying notes are an integral part of the financial statements.
70
Statement of Assets and Liabilities
Annual Report December 31, 2014
December 31, 2014
Baillie Gifford EAFE Choice Fund
ASSETS | |
Investments, at value (cost $133,282,734) | | $ | 144,795,737 | | |
Cash | | | 3,224,424 | | |
Foreign cash, at value (cost $46) | | | 46 | | |
Receivable for investments sold | | | 173,037 | | |
Dividends receivable | | | 90,365 | | |
Tax reclaims receivable | | | 289,972 | | |
Total Assets | | | 148,573,581 | | |
LIABILITIES | |
Payable for investments purchased | | | 207,184 | | |
Servicing fee payable | | | 106,240 | | |
Management fee payable | | | 93,267 | | |
Trustee fee payable | | | 1,340 | | |
Accrued expenses | | | 58,123 | | |
Total Liabilities | | | 466,154 | | |
NET ASSETS | | $ | 148,107,427 | | |
COMPOSITION OF NET ASSETS | |
Paid-in capital | | $ | 140,235,097 | | |
Distributions in excess of net investment income | | | (789,502 | ) | |
Accumulated net realized loss on investments and foreign currency transactions | | | (2,824,018 | ) | |
Net unrealized appreciation in value of investments and foreign currencies | | | 11,485,850 | | |
NET ASSETS | | $ | 148,107,427 | | |
NET ASSET VALUE, PER SHARE | |
| Class 1 ($19,115,223 / 1,551,111 shares outstanding), unlimited authorized, no par value | | $ | 12.32 | | |
Maximum Purchase Price Per Share (Note D) | | $ | 12.36 | | |
Minimum Redemption Price Per Share (Note D) | | $ | 12.30 | | |
| Class 2 ($110,234,384 / 8,868,154 shares outstanding), unlimited authorized, no par value | | $ | 12.43 | | |
Maximum Purchase Price Per Share (Note D) | | $ | 12.47 | | |
Minimum Redemption Price Per Share (Note D) | | $ | 12.41 | | |
| Class 3 ($18,757,820 / 1,495,701 shares outstanding), unlimited authorized, no par value | | $ | 12.54 | | |
Maximum Purchase Price Per Share (Note D) | | $ | 12.58 | | |
Minimum Redemption Price Per Share (Note D) | | $ | 12.51 | | |
The accompanying notes are an integral part of the financial statements.
71
Annual Report December 31, 2014
For the Year Ended December 31, 2014
Baillie Gifford EAFE Choice Fund
INVESTMENT INCOME | |
Dividends (net of foreign withholding taxes of $281,546) | | $ | 2,515,719 | | |
Interest | | | 330 | | |
Total Investment Income | | | 2,516,049 | | |
EXPENSES | |
Management fee (Note B) | | | 338,032 | | |
Shareholder servicing fees — Class 1 Shares (Note B) | | | 90,432 | | |
Shareholder servicing fees — Class 2 Shares (Note B) | | | 287,757 | | |
Shareholder servicing fees — Class 3 Shares (Note B) | | | 17,082 | | |
Fund accounting | | | 102,914 | | |
Custody | | | 33,629 | | |
Transfer agency | | | 17,639 | | |
Legal | | | 16,704 | | |
Trustees' fees | | | 5,040 | | |
Professional fees | | | 4,633 | | |
Insurance | | | 1,389 | | |
Miscellaneous | | | 3,465 | | |
Total Expenses | | | 918,716 | | |
Net Investment Income | | | 1,597,333 | | |
REALIZED AND UNREALIZED GAIN (LOSS) ON INVESTMENTS
AND FOREIGN CURRENCY TRANSACTIONS | |
Net realized gain (loss) from: | |
Investments | | | 6,431,831 | | |
Foreign currency transactions | | | (43,993 | ) | |
| | | | 6,387,838 | | |
Net increase (decrease) in unrealized appreciation (depreciation) on: | |
Investments | | | (16,164,928 | ) | |
Translation of assets and liabilities in foreign currencies | | | (35,796 | ) | |
| | | | (16,200,724 | ) | |
Net realized and unrealized loss on investments and foreign currency transactions | | | (9,812,886 | ) | |
NET DECREASE IN NET ASSETS FROM OPERATIONS | | $ | (8,215,553 | ) | |
The accompanying notes are an integral part of the financial statements.
72
Statements of Changes in Net Assets
Annual Report December 31, 2014
Baillie Gifford EAFE Choice Fund
| | | For the
Year Ended
December 31,
2014 | | For the
Year Ended
December 31,
2013 | |
INCREASE (DECREASE) IN NET ASSETS FROM OPERATIONS | |
Net investment income | | $ | 1,597,333 | | | $ | 1,961,406 | | |
Net realized gain from investments and foreign currency transactions | | | 6,387,838 | | | | 16,129,228 | | |
Net increase (decrease) in unrealized appreciation (depreciation) on investments
and translation of assets and liabilities in foreign currencies | | | (16,200,724 | ) | | | 7,327,743 | | |
Net increase (decrease) in net assets from operations | | | (8,215,553 | ) | | | 25,418,377 | | |
DIVIDENDS AND DISTRIBUTIONS TO SHAREHOLDERS FROM: | |
Net investment income: | |
Class 1 | | | (186,113 | ) | | | (509,094 | ) | |
Class 2 | | | (1,264,099 | ) | | | (2,998,953 | ) | |
Class 3 | | | (224,951 | ) | | | — | | |
Total Dividends and Distributions | | | (1,675,163 | ) | | | (3,508,047 | ) | |
TRANSACTIONS IN SHARES OF BENEFICIAL INTEREST | |
Net proceeds from shares subscribed: | |
Class 1 | | | — | | | | 19,159,986 | | |
Class 2 | | | 61,146,066 | | | | 29,551,683 | | |
Class 3 | | | 20,531,631 | | | | 90,951,574 | | |
Purchase premiums: | |
Class 1 | | | 26,546 | | | | 6,680 | | |
Class 2 | | | 165,327 | | | | 31,967 | | |
Class 3 | | | 1,586 | | | | — | | |
Redemption fees: | |
Class 1 | | | 9,582 | | | | — | | |
Class 2 | | | 36,836 | | | | 40,517 | | |
Class 3 | | | 10 | | | | 14,152 | | |
Dividends reinvested: | |
Class 1 | | | 186,113 | | | | 509,094 | | |
Class 2 | | | 1,264,099 | | | | 2,998,953 | | |
Class 3 | | | 224,951 | | | | — | | |
Cost of shares redeemed: | |
Class 2 | | | (40,487,027 | ) | | | (107,856,932 | ) | |
Class 3 | | | (45,090 | ) | | | (125,975,781 | ) | |
Increase (Decrease) in Net Assets from Transactions in Shares of Beneficial Interest | | | 43,060,630 | | | | (90,568,107 | ) | |
Total Increase (Decrease) in Net Assets | | | 33,169,914 | | | | (68,657,777 | ) | |
NET ASSETS | |
Beginning of year | | | 114,937,513 | | | | 183,595,290 | | |
End of year (including distributions in excess of net investment income
of $789,502 and $888,922, respectively) | | $ | 148,107,427 | | | $ | 114,937,513 | | |
| | | | | | |
The accompanying notes are an integral part of the financial statements.
73
Annual Report December 31, 2014
Baillie Gifford EAFE Choice Fund
Selected data for a Class 1 Shares outstanding throughout each period:
| | | For the
Year Ended
December 31,
2014 | | For the Period
December 17,
2013(a)
through
December 31,
2013 | |
Net asset value, beginning of period | | $ | 13.02 | | | $ | 12.80 | | |
From Investment Operations | |
Net investment income(b) | | | 0.15 | | | | 0.00 | (d) | |
Net realized and unrealized gain/(loss) on investments and foreign currency transactions | | | (0.75 | ) | | | 0.56 | | |
Net increase (decrease) in net asset value from investment operations | | | (0.60 | ) | | | 0.56 | | |
Dividends and Distributions to Shareholders | | | | | |
Dividends from net investment income | | | (0.12 | ) | | | (0.34 | ) | |
Proceeds from Purchase Premiums and Redemption Fees(b) | | | 0.02 | | | | 0.00 | (d) | |
Net asset value, end of period | | $ | 12.32 | | | $ | 13.02 | | |
Total Return | |
Total investment return based on net asset value(c) | | | (4.46 | )% | | | 4.39 | % | |
Ratios/Supplemental Data | |
Net assets, end of period (000's omitted) | | $ | 19,115 | | | $ | 19,995 | | |
Ratio of net expenses to average net assets | | | 0.84 | % | | | 0.27 | %* | |
Ratio of net investment income to average net assets | | | 1.12 | % | | | 0.61 | %* | |
Portfolio turnover rate | | | 23 | % | | | 25 | % | |
* Annualized.
(a) Commencement of operations.
(b) Calculated based upon average shares outstanding during the period.
(c) Total investment return is calculated assuming an initial investment made at the net asset value at the beginning of the period, reinvestment of all dividends and distributions, if any, at net asset value during the period, and redemption on the last day of the period. Total return is not annualized for periods less than one year.
(d) Amount is less than $0.005 per share.
The accompanying notes are an integral part of the financial statements.
74
Annual Report December 31, 2014
Baillie Gifford EAFE Choice Fund
Selected data for a Class 2 Shares outstanding throughout each period:
| | | For the
Year Ended
December 31,
2014 | | For the
Year Ended
December 31,
2013 | | For the
Year Ended
December 31,
2012 | | For the
Year Ended
December 31,
2011 | | For the
Year/Period
Ended
December 31,
2010(a) | |
Net asset value, beginning of year/period | | $ | 13.13 | | | $ | 11.19 | | | $ | 9.45 | | | $ | 11.24 | | | $ | 10.15 | | |
From Investment Operations | |
Net investment income(b) | | | 0.16 | | | | 0.17 | | | | 0.23 | | | | 0.21 | | | | 0.13 | | |
Net realized and unrealized gain/(loss) on
investments and foreign currency transactions | | | (0.75 | ) | | | 2.19 | | | | 1.83 | | | | (1.64 | ) | | | 1.37 | | |
Net increase (decrease) in net asset value from
investment operations | | | (0.59 | ) | | | 2.36 | | | | 2.06 | | | | (1.43 | ) | | | 1.50 | | |
Change in NAV During Period of Inactivity(a) | | | — | | | | — | | | | — | | | | — | | | | (0.28 | ) | |
Dividends and Distributions to Shareholders | | | | | | | | | | | |
Dividends from net investment income | | | (0.14 | ) | | | (0.43 | ) | | | (0.32 | ) | | | (0.21 | ) | | | (0.14 | ) | |
Distributions from net realized gain on investments | | | — | | | | — | | | | — | | | | (0.17 | ) | | | — | | |
Total Dividends and Distributions | | | (0.14 | ) | | | (0.43 | ) | | | (0.32 | ) | | | (0.38 | ) | | | (0.14 | ) | |
Proceeds from Purchase Premiums and
Redemption Fees(b) | | | 0.03 | | | | 0.01 | | | | 0.00 | (d) | | | 0.02 | | | | 0.01 | | |
Net asset value, end of year/period | | $ | 12.43 | | | $ | 13.13 | | | $ | 11.19 | | | $ | 9.45 | | | $ | 11.24 | | |
Total Return | |
Total investment return based on net asset value(c) | | | (4.25 | )% | | | 21.20 | % | | | 21.81 | % | | | (12.54 | )% | | | 15.22 | % | |
Ratios/Supplemental Data | |
Net assets, end of period (000's omitted) | | $ | 110,234 | | | $ | 94,942 | | | $ | 156,038 | | | $ | 115,242 | | | $ | 46,487 | | |
Ratio of net expenses to average net assets | | | 0.66 | % | | | 0.67 | % | | | 0.64 | % | | | 0.65 | % | | | 0.71 | %* | |
Ratio of net investment income to average net assets | | | 1.23 | % | | | 1.41 | % | | | 2.23 | % | | | 1.97 | % | | | 1.53 | %* | |
Portfolio turnover rate | | | 23 | % | | | 25 | % | | | 21 | % | | | 46 | % | | | 20 | % | |
* Annualized.
(a) For the periods January 1, 2010 to January 15, 2010 and March 25, 2010 to December 31, 2010. Class had no shareholders from January 16, 2010 to March 24, 2010. All shares of this class were redeemed at $10.48 on January 15, 2010. New shares were issued at $10.20 on March 25, 2010.
(b) Calculated based upon average shares outstanding during the period.
(c) Total investment return is calculated assuming an initial investment made at the net asset value at the beginning of the period, reinvestment of all dividends and distributions, if any, at net asset value during the period, and redemption on the last day of the period. Total return is not annualized for periods less than one year.
(d) Amount is less than $0.005 per share
The accompanying notes are an integral part of the financial statements.
75
Annual Report December 31, 2014
Baillie Gifford EAFE Choice Fund
Selected data for a Class 3 Shares outstanding throughout each period:
| | | For the Period
July 7, 2014(e)
through
December 31,
2014 | | For the Period
January 1,
2013
through
April 16,
2013(d) | | For the Period
January 23,
2012(e)
through
December 31,
2012 | | For the Period
January 1,
2011
through
April 18,
2011(d) | | For the Period
January 15,
2010(a)
through
December 31,
2010 | |
Net asset value, beginning of period | | $ | 14.08 | | | $ | 11.22 | | | $ | 10.15 | | | $ | 11.42 | | | $ | 10.48 | | |
From Investment Operations | |
Net investment income(b) | | | 0.05 | | | | 0.07 | | | | 0.28 | | | | 0.09 | | | | 0.16 | | |
Net realized and unrealized gain/(loss) on
investments and foreign currency transactions | | | (1.44 | ) | | | 0.79 | | | | 1.12 | | | | 0.15 | | | | 0.92 | | |
Net increase (decrease) in net asset value from
investment operations | | | (1.39 | ) | | | 0.86 | | | | 1.40 | | | | 0.24 | | | | 1.08 | | |
Dividends and Distributions to Shareholders | | | | | | | | | | | |
Dividends from net investment income | | | (0.15 | ) | | | — | | | | (0.33 | ) | | | — | | | | (0.15 | ) | |
Proceeds from Purchase Premiums and
Redemption Fees(b) | | | 0.00 | (f) | | | 0.00 | (f) | | | 0.00 | (f) | | | 0.00 | (f) | | | 0.01 | | |
Net asset value, end of period | | $ | 12.54 | | | $ | 12.08 | | | $ | 11.22 | | | $ | 11.66 | | | $ | 11.42 | | |
Total Return | |
Total investment return based on net asset value(c) | | | (9.86 | )%** | | | 7.66 | %** | | | 13.79 | %** | | | 2.10 | %** | | | 10.40 | %** | |
Ratios/Supplemental Data | |
Net assets, end of period (000's omitted) | | $ | 18,758 | | | $ | — | (d) | | $ | 27,557 | | | $ | — | (d) | | $ | 55,922 | | |
Ratio of net expenses to average net assets | | | 0.58 | %* | | | 0.55 | %* | | | 0.57 | %* | | | 0.57 | %* | | | 0.63 | %* | |
Ratio of net investment income to average net assets | | | 0.71 | %* | | | 2.29 | %* | | | 2.86 | %* | | | 2.50 | %* | | | 1.66 | %* | |
Portfolio turnover rate(g) | | | 23 | % | | | 5 | % | | | 21 | % | | | 46 | % | | | 20 | % | |
* Annualized.
** Not annualized.
(a) Commencement of operations.
(b) Calculated based upon average shares outstanding during the period.
(c) Total investment return is calculated assuming an initial investment made at the net asset value at the beginning of the period, reinvestment of all dividends and distributions, if any, at net asset value during the period, and redemption on the last day of the period. Total return is not annualized for periods less than one year.
(d) Class had no shareholders from April 19, 2011 to January 22, 2012 and from April 17, 2013 to July 6, 2014. All shares of this class were redeemed at $11.66 on April 18, 2011. New shares were issued at $10.15 on January 23, 2012. All shares of this class were redeemed at $12.08 on April 16,2013. New shares were issued at $14.08 on July 7, 2014.
(e) Recommencement of investment operations
(f) Amount is less than $0.005.
(g) Portfolio turnover rate calculated at Fund level.
The accompanying notes are an integral part of the financial statements.
76
Industry Diversification Table
Annual Report December 31, 2014
December 31, 2014 (Unaudited)
Baillie Gifford Emerging Markets Fund
| | | Value | | % of Total
Net Assets | |
Aerospace/Defense | | $ | 10,282,724 | | | | 2.1 | % | |
Airlines | | | 4,598,092 | | | | 0.9 | | |
Auto Manufacturers | | | 24,856,810 | | | | 5.1 | | |
Automobiles & Parts | | | 2,592,637 | | | | 0.5 | | |
Banks | | | 32,357,205 | | | | 6.7 | | |
Broadcasting & Entertainment | | | 1,968,005 | | | | 0.4 | | |
Broadline Retailers | | | 6,386,640 | | | | 1.3 | | |
Commercial Vehicles & Trucks | | | 2,122,589 | | | | 0.4 | | |
Commodity Chemicals | | | 6,359,041 | | | | 1.3 | | |
Computers | | | 5,781,256 | | | | 1.2 | | |
Construction & Building Materials | | | 13,403,844 | | | | 2.8 | | |
Diversified Financial Services | | | 14,381,098 | | | | 3.0 | | |
Electronic & Electrical Equipment | | | 47,377,213 | | | | 9.8 | | |
Food Producers & Processors | | | 8,179,851 | | | | 1.7 | | |
Household Goods | | | 6,035,582 | | | | 1.2 | | |
Industrial Engineering | | | 4,337,845 | | | | 0.9 | | |
Insurance | | | 19,829,075 | | | | 4.1 | | |
Internet | | | 38,482,103 | | | | 7.9 | | |
Investment Companies | | | 4,146,261 | | | | 0.9 | | |
Leisure Goods | | | 7,635,340 | | | | 1.6 | | |
Media & Photography | | | 11,701,345 | | | | 2.4 | | |
Nonlife Insurance | | | 7,568,844 | | | | 1.6 | | |
Oil & Gas | | | 41,620,946 | | | | 8.6 | | |
Retailers — General | | | 11,249,143 | | | | 2.3 | | |
Semiconductors | | | 38,453,343 | | | | 7.9 | | |
Software | | | 35,304,252 | | | | 7.3 | | |
Software & Computer Services | | | 11,353,170 | | | | 2.3 | | |
Specialized Consumer Services | | | 11,893,958 | | | | 2.5 | | |
Technology Hardware/Equipment | | | 33,412,067 | | | | 6.9 | | |
Telecommunications | | | 2,404,074 | | | | 0.5 | | |
Transportation | | | 6,318,233 | | | | 1.3 | | |
Travel & Leisure | | | 2,934,848 | | | | 0.6 | | |
Travel & Tourism | | | 1,307,780 | | | | 0.3 | | |
Total Value of Investments | | | 476,635,214 | | | | 98.3 | | |
Other assets less liabilities | | | 8,430,745 | | | | 1.7 | | |
Net Assets | | $ | 485,065,959 | | | | 100.0 | % | |
77
Annual Report December 31, 2014
December 31, 2014
Baillie Gifford Emerging Markets Fund
| | | Shares | | Value | |
COMMON STOCKS — 94.6% | |
ARGENTINA — 1.0% | |
MercadoLibre, Inc. | | | 39,900 | | | $ | 5,094,033 | | |
BRAZIL — 3.8% | |
Embraer SA ADR | | | 278,967 | | | | 10,282,724 | | |
JBS SA | | | 1,941,400 | | | | 8,179,851 | | |
| | | | | | 18,462,575 | | |
CAYMAN ISLANDS — 0.3% | |
Qunar Cayman Islands Ltd. ADR (a) | | | 46,000 | | | | 1,307,780 | | |
CHILE — 0.6% | |
Latam Airlines Group SA ADR (a) | | | 244,979 | | | | 2,934,848 | | |
CHINA — 17.1% | |
Alibaba Group Holding Ltd. ADR (a) | | | 114,431 | | | | 11,893,958 | | |
Baidu, Inc. ADR (a) | | | 10,100 | | | | 2,302,497 | | |
Beijing Enterprises Holdings Ltd. | | | 401,500 | | | | 3,140,015 | | |
China Petroleum & Chemical Corp., Class H | | | 12,344,000 | | | | 9,996,654 | | |
China Taiping Insurance Holdings Co., Ltd. (a) | | | 1,695,210 | | | | 4,817,473 | | |
Dongfeng Motor Group Co., Ltd., Class H | | | 1,070,000 | | | | 1,496,740 | | |
Geely Automobile Holdings Ltd. | | | 8,200,000 | | | | 2,592,637 | | |
Haier Electronics Group Co., Ltd. | | | 2,551,300 | | | | 6,035,582 | | |
JD.com, Inc. ADR (a) | | | 276,000 | | | | 6,386,640 | | |
Lenovo Group Ltd. | | | 4,428,000 | | | | 5,781,256 | | |
Sohu.com, Inc. (a) | | | 97,572 | | | | 5,188,879 | | |
Tencent Holdings Ltd. | | | 1,120,000 | | | | 16,205,202 | | |
Youku Tudou, Inc. ADR (a) | | | 110,500 | | | | 1,968,005 | | |
ZTE Corp., Class H | | | 2,292,800 | | | | 4,960,891 | | |
| | | | | | 82,766,429 | | |
EGYPT — 1.5% | |
Commercial International Bank Egypt SAE | | | 436,357 | | | | 2,977,319 | | |
Egyptian Financial Group — Hermes Holding SAE (a) | | | 1,981,031 | | | | 4,230,922 | | |
| | | | | | 7,208,241 | | |
GERMANY — 1.4% | |
Rocket Internet AG 144A (a)(b) | | | 107,458 | | | | 6,682,236 | | |
The accompanying notes are an integral part of the financial statements.
78
Annual Report December 31, 2014
December 31, 2014
Baillie Gifford Emerging Markets Fund
| | | Shares | | Value | |
INDIA — 18.4% | |
Axis Bank Ltd. | | | 578,290 | | | $ | 4,577,120 | | |
HCL Technologies Ltd. | | | 366,876 | | | | 9,265,618 | | |
Housing Development Finance Corp., Ltd. | | | 206,600 | | | | 3,704,825 | | |
ICICI Bank Ltd. | | | 1,828,750 | | | | 10,176,892 | | |
IDFC Ltd. | | | 1,675,002 | | | | 4,146,261 | | |
Infosys Ltd. | | | 235,220 | | | | 7,298,329 | | |
Just Dial Ltd. | | | 115,469 | | | | 2,460,509 | | |
Mahindra & Mahindra Ltd. | | | 633,224 | | | | 12,328,112 | | |
Oracle Financial Services Software Ltd. | | | 32,800 | | | | 1,741,543 | | |
Reliance Industries Ltd. | | | 671,944 | | | | 9,448,902 | | |
Shriram Transport Finance Co., Ltd. | | | 367,900 | | | | 6,445,351 | | |
Tech Mahindra Ltd. | | | 429,660 | | | | 17,614,855 | | |
| | | | | | 89,208,317 | | |
MALAYSIA — 1.4% | |
Public Bank Bhd | | | 1,292,940 | | | | 6,754,705 | | |
MEXICO — 3.7% | |
Cemex SAB de CV ADR, Participating Certificates (a) | | | 1,315,392 | | | | 13,403,844 | | |
| Corp. GEO SAB de CV, Series B (a)* | | | 3,528,000 | | | | 0 | | |
Wal-Mart de Mexico SAB de CV, Series V | | | 2,125,460 | | | | 4,569,658 | | |
| | | | | | 17,973,502 | | |
NETHERLANDS — 0.2% | |
Yandex NV, Class A (a) | | | 56,900 | | | | 1,021,924 | | |
SOUTH AFRICA — 2.4% | |
Naspers Ltd., N Shares | | | 90,459 | | | | 11,701,345 | | |
SOUTH KOREA — 18.0% | |
Dongbu Insurance Co., Ltd. | | | 42,470 | | | | 2,120,859 | | |
E-Mart Co., Ltd. | | | 22,464 | | | | 4,157,129 | | |
Fila Korea Ltd. | | | 24,865 | | | | 2,522,356 | | |
Hankook Tire Co., Ltd. | | | 44,802 | | | | 2,129,062 | | |
Hyundai Glovis Co., Ltd. | | | 23,877 | | | | 6,318,233 | | |
Hyundai Marine & Fire Insurance Co., Ltd. | | | 156,960 | | | | 3,713,648 | | |
Hyundai Mipo Dockyard Co., Ltd. | | | 33,800 | | | | 2,122,589 | | |
Hyundai Mobis Co., Ltd. | | | 17,196 | | | | 3,679,030 | | |
Hyundai Wia Corp. | | | 32,675 | | | | 5,223,866 | | |
The accompanying notes are an integral part of the financial statements.
79
Annual Report December 31, 2014
December 31, 2014
Baillie Gifford Emerging Markets Fund
| | | Shares | | Value | |
Interpark Corp. | | | 192,200 | | | $ | 1,594,332 | | |
LG Chem Ltd. | | | 31,300 | | | | 5,118,255 | | |
NAVER Corp. | | | 9,148 | | | | 5,858,700 | | |
NCSoft Corp. | | | 17,140 | | | | 2,810,868 | | |
Samsung Electronics Co., Ltd. | | | 13,644 | | | | 16,403,424 | | |
Samsung Fire & Marine Insurance Co., Ltd. | | | 21,197 | | | | 5,447,985 | | |
Samsung SDI Co., Ltd. | | | 22,994 | | | | 2,404,074 | | |
SK Hynix, Inc. (a) | | | 363,600 | | | | 15,538,600 | | |
| | | | | | 87,163,010 | | |
TAIWAN — 20.0% | |
Advanced Semiconductor Engineering, Inc. | | | 2,083,000 | | | | 2,473,828 | | |
Advantech Co., Ltd. | | | 458,463 | | | | 3,365,749 | | |
Airtac International Group | | | 244,000 | | | | 2,189,703 | | |
Asustek Computer, Inc. | | | 539,000 | | | | 5,881,034 | | |
China Life Insurance Co., Ltd. | | | 13,676,555 | | | | 11,297,954 | | |
Delta Electronics, Inc. | | | 1,538,000 | | | | 9,088,407 | | |
Hiwin Technologies Corp. | | | 259,560 | | | | 2,148,142 | | |
Hon Hai Precision Industry Co., Ltd. | | | 4,810,696 | | | | 13,284,805 | | |
Largan Precision Co., Ltd. | | | 102,000 | | | | 7,635,340 | | |
MediaTek, Inc. | | | 726,000 | | | | 10,554,174 | | |
Novatek Microelectronics Corp. | | | 656,000 | | | | 3,665,793 | | |
Taiwan Semiconductor Manufacturing Co., Ltd. | | | 5,771,310 | | | | 25,425,341 | | |
| | | | | | 97,010,270 | | |
TURKMENISTAN — 3.9% | |
Dragon Oil Plc. | | | 2,272,204 | | | | 19,035,375 | | |
UNITED STATES — 0.9% | |
Copa Holdings SA, Class A | | | 44,366 | | | | 4,598,092 | | |
Total Common Stocks | |
(cost $379,803,198) | | | | | 458,922,682 | | |
PREFERRED STOCKS — 3.7% | |
BRAZIL — 1.6% | |
Banco Bradesco SA | | | 596,781 | | | | 7,871,169 | | |
The accompanying notes are an integral part of the financial statements.
80
Annual Report December 31, 2014
December 31, 2014
Baillie Gifford Emerging Markets Fund
| | | Shares | | Value | |
SOUTH KOREA — 2.1% | |
LG Chem Ltd. | | | 9,718 | | | $ | 1,240,786 | | |
Samsung Electronics Co., Ltd. | | | 9,144 | | | | 8,600,577 | | |
| | | | | | 9,841,363 | | |
Total Preferred Stocks | |
(cost $13,865,630) | | | | | 17,712,532 | | |
TOTAL INVESTMENTS — 98.3% | |
(cost $393,668,828) | | | | $ | 476,635,214 | | |
Other assets less liabilities — 1.7% | | | | | 8,430,745 | | |
NET ASSETS — 100.0% | | | | $ | 485,065,959 | | |
(a) Non-income producing security.
(b) 144A — Securities are exempt from registration under Rule 144A under the Securities Act of 1933, as amended. These securities may be resold in transactions exempt from registration, normally to qualified institutional buyers. Prices are obtained daily from the London International Stock Exchange; therefore, Fair valuation is typically not required. At December 31, 2014, the net value of these securities was $6,682,236, representing 1.38% of net assets.
* Security is being fair valued by the Advisor's valuation committee.
ADR — American Depositary Receipt.
The accompanying notes are an integral part of the financial statements.
81
Statement of Assets and Liabilities
Annual Report December 31, 2014
December 31, 2014
Baillie Gifford Emerging Markets Fund
ASSETS | |
Investments, at value (cost $393,668,828) | | $ | 476,635,214 | | |
Cash | | | 3,520,047 | | |
Foreign cash, at value (cost $5,006,463) | | | 5,005,365 | | |
Receivable for Indian capital gains tax | | | 206,948 | | |
Dividends receivable | | | 942,020 | | |
Tax reclaims receivable | | | 90,888 | | |
Total Assets | | | 486,400,482 | | |
LIABILITIES | |
Management fee payable | | | 624,822 | | |
Payable for deferred Indian capital gains tax | | | 372,642 | | |
Servicing fee payable | | | 124,964 | | |
Trustee fee payable | | | 4,644 | | |
Accrued expenses | | | 207,451 | | |
Total Liabilities | | | 1,334,523 | | |
NET ASSETS | | $ | 485,065,959 | | |
COMPOSITION OF NET ASSETS | |
Paid-in capital | | $ | 421,873,852 | | |
Undistributed net investment income | | | 3,953,078 | | |
Accumulated net realized loss on investments and foreign currency transactions
(net of deferred Indian capital gains tax) | | | (23,315,022 | ) | |
Net unrealized appreciation in value of investments and foreign currencies
(net of deferred Indian capital gains tax) | | | 82,554,051 | | |
NET ASSETS | | $ | 485,065,959 | | |
NET ASSET VALUE, PER SHARE | |
| Class III ($485,065,959 / 28,944,005 shares outstanding), unlimited authorized, no par value | | $ | 16.76 | | |
Maximum Purchase Price Per Share (Note D) | | $ | 16.82 | | |
Minimum Redemption Price Per Share (Note D) | | $ | 16.70 | | |
The accompanying notes are an integral part of the financial statements.
82
Annual Report December 31, 2014
For the Year Ended December 31, 2014
Baillie Gifford Emerging Markets Fund
INVESTMENT INCOME | |
Dividends (net of foreign withholding taxes of $1,043,251) | | $ | 7,885,283 | | |
Total Investment Income | | | 7,885,283 | | |
EXPENSES | |
Management fee (Note B) | | | 2,263,759 | | |
Shareholder servicing fees — Class II Shares (Note B) | | | 8,207 | | |
Shareholder servicing fees — Class III Shares (Note B) | | | 449,469 | | |
Fund accounting | | | 279,070 | | |
Custody | | | 238,308 | | |
Legal | | | 57,242 | | |
Professional fees | | | 45,010 | | |
Trustees' fees | | | 16,993 | | |
Transfer agency | | | 11,975 | | |
Insurance | | | 4,211 | | |
Miscellaneous | | | 12,072 | | |
Total Expenses | | | 3,386,316 | | |
Net Investment Income | | | 4,498,967 | | |
REALIZED AND UNREALIZED (LOSS) ON INVESTMENTS
AND FOREIGN CURRENCY TRANSACTIONS | |
Net realized loss from: | |
Investments (net of Indian capital gains tax $2,125) | | | (8,657,016 | ) | |
Foreign currency transactions | | | (274,538 | ) | |
| | | | (8,931,554 | ) | |
Net increase (decrease) in unrealized appreciation (depreciation) on: | |
Investments (net of deferred Indian capital gains tax of $273,285) | | | 938,134 | | |
Translation of assets and liabilities in foreign currencies | | | (45,995 | ) | |
| | | | 892,139 | | |
Net realized and unrealized loss on investments and foreign currency transactions | | | (8,039,415 | ) | |
NET DECREASE IN NET ASSETS FROM OPERATIONS | | $ | (3,540,448 | ) | |
The accompanying notes are an integral part of the financial statements.
83
Statements of Changes in Net Assets
Annual Report December 31, 2014
Baillie Gifford Emerging Markets Fund
| | | For the
Year Ended
December 31,
2014 | | For the
Year Ended
December 31,
2013 | |
INCREASE (DECREASE) IN NET ASSETS FROM OPERATIONS | |
Net investment income | | $ | 4,498,967 | | | $ | 3,606,959 | | |
Net realized gain (loss) from investments and foreign currency transactions | | | (8,931,554 | ) | | | 716,445 | | |
Net increase (decrease) in unrealized appreciation on investments
and translation of assets and liabilities in foreign currencies | | | 892,139 | | | | 3,172,597 | | |
Net increase (decrease) in net assets from operations | | | (3,540,448 | ) | | | 7,496,001 | | |
DIVIDENDS AND DISTRIBUTIONS TO SHAREHOLDERS FROM: | |
Net investment income: | |
Class II | | | — | | | | (880,017 | ) | |
Class III | | | (719,470 | ) | | | (5,538,846 | ) | |
Total Dividends and Distributions | | | (719,470 | ) | | | (6,418,863 | ) | |
TRANSACTIONS IN SHARES OF BENEFICIAL INTEREST | |
Net proceeds from shares subscribed: | |
Class II | | | 9,232,291 | | | | 47,294,135 | | |
Class III | | | 186,487,716 | | | | — | | |
Purchase premiums: | |
Class II | | | 9,767 | | | | — | | |
Class III | | | 470,589 | | | | — | | |
Redemption fees: | |
Class II | | | 643 | | | | 34,688 | | |
Class III | | | 59,170 | | | | 285,790 | | |
Dividends reinvested: | |
Class II | | | — | | | | 880,017 | | |
Class III | | | 719,470 | | | | 4,102,273 | | |
Cost of shares redeemed: | |
Class II | | | (59,760,469 | ) | | | — | | |
Class III | | | (16,328,088 | ) | | | (175,485,293 | ) | |
Increase (Decrease) in Net Assets from Transactions in Shares of Beneficial Interest | | | 120,891,089 | | | | (122,888,390 | ) | |
Total Increase (Decrease) in Net Assets | | | 116,631,171 | | | | (121,811,252 | ) | |
NET ASSETS | |
Beginning of year | | | 368,434,788 | | | | 490,246,040 | | |
End of year (including undistributed net investment income
of $3,953,078 and $239,528, respectively) | | $ | 485,065,959 | | | $ | 368,434,788 | | |
| | | | | | |
The accompanying notes are an integral part of the financial statements.
84
Annual Report December 31, 2014
Baillie Gifford Emerging Markets Fund
Selected data for a Class III Shares outstanding throughout each year:
| | | For the
Year Ended
December 31,
2014 | | For the
Year Ended
December 31,
2013 | | For the
Year Ended
December 31,
2012 | | For the
Year Ended
December 31,
2011 | | For the
Year Ended
December 31,
2010 | |
Net asset value, beginning of year | | $ | 16.74 | | | $ | 16.40 | | | $ | 14.60 | | | $ | 18.71 | | | $ | 16.49 | | |
From Investment Operations | |
Net investment income(a) | | | 0.17 | | | | 0.14 | | | | 0.19 | | | | 0.18 | | | | 0.13 | | |
Net realized and unrealized gain/(loss) on
investments and foreign currency transactions | | | (0.15 | ) | | | 0.48 | | | | 1.82 | | | | (3.94 | ) | | | 3.09 | | |
Net increase (decrease) in net asset value from
investment operations | | | 0.02 | | | | 0.62 | | | | 2.01 | | | | (3.76 | ) | | | 3.22 | | |
Dividends and Distributions to Shareholders | | | | | | | | | | | |
Dividends from net investment income | | | (0.02 | ) | | | (0.29 | ) | | | (0.23 | ) | | | — | | | | (0.52 | ) | |
Distributions from net realized gain on investments | | | — | | | | — | | | | — | | | | (0.35 | ) | | | (0.49 | ) | |
Total Dividends and Distributions | | | (0.02 | ) | | | (0.29 | ) | | | (0.23 | ) | | | (0.35 | ) | | | (1.01 | ) | |
Proceeds from Purchase Premiums and
Redemption Fees(a) | | | 0.02 | | | | 0.01 | | | | 0.02 | | | | 0.00 | (b) | | | 0.01 | | |
Net asset value, end of year | | $ | 16.76 | | | $ | 16.74 | | | $ | 16.40 | | | $ | 14.60 | | | $ | 18.71 | | |
Total Return | |
Total investment return based on net asset value(c) | | | 0.26 | % | | | 3.98 | % | | | 13.94 | % | | | (20.20 | )% | | | 19.73 | % | |
Ratios/Supplemental Data | |
Net assets, end of year (000's omitted) | | $ | 485,066 | | | $ | 317,406 | | | $ | 490,246 | | | $ | 373,432 | | | $ | 468,654 | | |
Ratio of net expenses to average net assets | | | 0.75 | % | | | 0.74 | % | | | 0.75 | % | | | 0.73 | % | | | 0.79 | % | |
Ratio of net investment income to average net assets | | | 1.00 | % | | | 0.88 | % | | | 1.18 | % | | | 1.05 | % | | | 0.75 | % | |
Portfolio turnover rate | | | 26 | % | | | 33 | % | | | 51 | % | | | 41 | % | | | 40 | % | |
(a) Calculated based upon average shares outstanding during the year.
(b) Rounds to less than $0.005 per share.
(c) Total investment return is calculated assuming an initial investment made at the net asset value at the beginning of the period, reinvestment of all dividends and distributions, if any, at net asset value during the period, and redemption on the last day of the period. Total return is not annualized for periods less than one year.
The accompanying notes are an integral part of the financial statements.
85
Industry Diversification Table
Annual Report December 31, 2014
December 31, 2014 (unaudited)
Baillie Gifford Global Alpha Equity Fund
| | | Value | | % of Total
Net Assets | |
Aerospace | | $ | 6,543,784 | | | | 1.1 | % | |
Airlines | | | 13,769,934 | | | | 2.2 | | |
Asset Managers | | | 559,142 | | | | 0.1 | | |
Automobiles | | | 9,303,013 | | | | 1.5 | | |
Banks | | | 46,406,667 | | | | 7.4 | | |
Beverages | | | 2,407,529 | | | | 0.4 | | |
Beverages, Food & Tobacco | | | 2,644,058 | | | | 0.4 | | |
Biotechnology | | | 3,042,711 | | | | 0.5 | | |
Brewers | | | 4,476,356 | | | | 0.7 | | |
Broadline Retailers | | | 11,521,123 | | | | 1.8 | | |
Business Support Services | | | 1,708,566 | | | | 0.3 | | |
Chemicals | | | 5,018,247 | | | | 0.8 | | |
Commercial Services | | | 30,491,432 | | | | 4.9 | | |
Construction & Building Materials | | | 5,176,333 | | | | 0.8 | | |
Construction & Materials | | | 5,441,755 | | | | 0.9 | | |
Containers & Packaging | | | 5,557,920 | | | | 0.9 | | |
Diversified Financial Services | | | 27,332,605 | | | | 4.4 | | |
Diversified Industrials | | | 4,569,480 | | | | 0.7 | | |
Electronic & Electrical Equipment | | | 21,075,130 | | | | 3.4 | | |
Engineering & Machinery | | | 6,536,812 | | | | 1.1 | | |
Exploration & Production | | | 1,065,712 | | | | 0.2 | | |
Farming & Fishing | | | 6,566,549 | | | | 1.1 | | |
Financial Services | | | 6,157,852 | | | | 1.0 | | |
Fixed Line Telecommunications | | | 3,176,914 | | | | 0.5 | | |
Food Products | | | 10,676,427 | | | | 1.7 | | |
Food Retailers & Wholesalers | | | 4,521,839 | | | | 0.7 | | |
Healthcare — Products | | | 9,532,849 | | | | 1.5 | | |
Healthcare Providers | | | 12,111,698 | | | | 1.9 | | |
Household Goods & Home Construction | | | 6,691,296 | | | | 1.1 | | |
Industrial Engineering | | | 3,182,123 | | | | 0.5 | | |
Industrial Machinery | | | 25,725,732 | | | | 4.1 | | |
Industrial Suppliers | | | 8,450,296 | | | | 1.4 | | |
Insurance | | | 37,667,315 | | | | 6.0 | | |
Internet | | | 30,296,183 | | | | 4.9 | | |
Investment Services | | | 2,976,839 | | | | 0.5 | | |
Life Insurance | | | 9,902,471 | | | | 1.6 | | |
Media & Photography | | | 27,676,686 | | | | 4.4 | | |
Medical Equipment | | | 6,711,884 | | | | 1.1 | | |
Mining & Metals | | | 2,758,796 | | | | 0.4 | | |
Motorcycles | | | 10,146,251 | | | | 1.6 | | |
86
Industry Diversification Table
Annual Report December 31, 2014
| | | Value | | % of Total
Net Assets | |
Oil & Gas | | $ | 22,766,562 | | | | 3.6 | % | |
Oil Equipment & Services | | | 5,049,744 | | | | 0.8 | | |
Personal Goods | | | 4,997,243 | | | | 0.8 | | |
Pharmaceuticals | | | 12,521,866 | | | | 2.0 | | |
Pharmaceuticals, Biotechnology & Life Sciences | | | 6,616,359 | | | | 1.1 | | |
Property & Casualty Insurance | | | 1,888,748 | | | | 0.3 | | |
Real Estate | | | 2,582,316 | | | | 0.4 | | |
Retailers — General | | | 13,898,640 | | | | 2.2 | | |
Semiconductors | | | 46,124,616 | | | | 7.4 | | |
Software | | | 6,415,664 | | | | 1.0 | | |
Software & Computer Services | | | 5,468,833 | | | | 0.9 | | |
Specialized Consumer Services | | | 11,463,872 | | | | 1.8 | | |
Technology Hardware & Equipment | | | 9,463,864 | | | | 1.5 | | |
Travel & Leisure | | | 25,034,980 | | | | 4.0 | | |
Total Value of Investments | | | 613,871,616 | | | | 98.3 | | |
Other assets less liabilities | | | 10,547,794 | | | | 1.7 | | |
Net Assets | | $ | 624,419,410 | | | | 100.0 | % | |
87
Annual Report December 31, 2014
December 31, 2014
Baillie Gifford Global Alpha Equity Fund
| | | Shares | | Value | |
COMMON STOCKS — 98.3% | |
ARGENTINA — 0.2% | |
Arcos Dorados Holdings, Inc., Class A | | | 189,578 | | | $ | 1,025,617 | | |
AUSTRALIA — 0.9% | |
Brambles Ltd. | | | 645,202 | | | | 5,557,920 | | |
BRAZIL — 0.4% | |
BM&FBovespa SA | | | 699,600 | | | | 2,592,378 | | |
CANADA — 2.4% | |
Fairfax Financial Holdings Ltd. | | | 12,831 | | | | 6,723,444 | | |
Ritchie Bros. Auctioneers, Inc. | | | 144,136 | | | | 3,875,817 | | |
Ultra Petroleum Corp. (a) | | | 322,172 | | | | 4,239,784 | | |
| | | | | | 14,839,045 | | |
CHINA — 4.2% | |
Alibaba Group Holding Ltd. ADR (a) | | | 31,804 | | | | 3,305,708 | | |
Baidu, Inc. ADR (a) | | | 46,100 | | | | 10,509,417 | | |
China Resources Enterprise Ltd. | | | 1,474,000 | | | | 3,079,304 | | |
Mindray Medical International Ltd. ADR | | | 170,891 | | | | 4,511,522 | | |
Shandong Weigao Group Medical Polymer Co., Ltd., Class H | | | 2,512,000 | | | | 2,027,831 | | |
Tsingtao Brewery Co., Ltd., Class H | | | 392,000 | | | | 2,644,058 | | |
| | | | | | 26,077,840 | | |
DENMARK — 1.3% | |
Carlsberg A/S, B Shares | | | 58,286 | | | | 4,476,356 | | |
Jyske Bank A/S (a) | | | 68,232 | | | | 3,448,881 | | |
| | | | | | 7,925,237 | | |
GERMANY — 1.5% | |
Deutsche Boerse AG | | | 55,771 | | | | 3,963,204 | | |
SAP SE | | | 78,318 | | | | 5,468,833 | | |
| | | | | | 9,432,037 | | |
HONG KONG — 1.6% | |
AIA Group Ltd. | | | 1,795,400 | | | | 9,902,471 | | |
The accompanying notes are an integral part of the financial statements.
88
Annual Report December 31, 2014
December 31, 2014
Baillie Gifford Global Alpha Equity Fund
| | | Shares | | Value | |
INDIA — 1.2% | |
ICICI Bank Ltd. ADR | | | 627,500 | | | $ | 7,247,625 | | |
IRELAND — 4.0% | |
Bank of Ireland (a) | | | 16,842,935 | | | | 6,311,500 | | |
CRH Plc. | | | 215,871 | | | | 5,176,333 | | |
Ryanair Holdings Plc. ADR (a) | | | 193,208 | | | | 13,769,934 | | |
| | | | | | 25,257,767 | | |
ITALY — 0.6% | |
Fiat Chrysler Automobiles NV (a) | | | 328,573 | | | | 3,817,938 | | |
JAPAN — 6.9% | |
CyberAgent, Inc. | | | 90,300 | | | | 3,385,390 | | |
Inpex Corp. | | | 717,500 | | | | 7,987,907 | | |
Japan Exchange Group, Inc. | | | 127,700 | | | | 2,976,839 | | |
MS&AD Insurance Group Holdings, Inc. | | | 79,700 | | | | 1,888,748 | | |
Olympus Corp. (a) | | | 135,900 | | | | 4,760,624 | | |
Rohm Co., Ltd. | | | 69,500 | | | | 4,187,602 | | |
SMC Corp. | | | 22,900 | | | | 6,004,932 | | |
THK Co., Ltd. | | | 230,800 | | | | 5,546,562 | | |
Tokyo Electron Ltd. | | | 85,800 | | | | 6,506,232 | | |
| | | | | | 43,244,836 | | |
NETHERLANDS — 0.5% | |
QIAGEN NV (a) | | | 127,600 | | | | 2,993,496 | | |
NORWAY — 1.7% | |
Norsk Hydro ASA | | | 489,753 | | | | 2,758,796 | | |
Schibsted ASA | | | 119,639 | | | | 7,587,430 | | |
| | | | | | 10,346,226 | | |
RUSSIA — 0.2% | |
Sberbank of Russia ADR | | | 360,251 | | | | 1,455,450 | | |
SINGAPORE — 0.7% | |
Jardine Matheson Holdings Ltd. | | | 75,200 | | | | 4,569,480 | | |
SOUTH AFRICA — 3.2% | |
Naspers Ltd., N Shares | | | 155,303 | | | | 20,089,256 | | |
The accompanying notes are an integral part of the financial statements.
89
Annual Report December 31, 2014
December 31, 2014
Baillie Gifford Global Alpha Equity Fund
| | | Shares | | Value | |
SOUTH KOREA — 2.2% | |
Samsung Electronics Co., Ltd. GDR Reg S | | | 17,116 | | | $ | 10,273,837 | | |
SK Hynix, Inc. (a) | | | 77,090 | | | | 3,294,474 | | |
| | | | | | 13,568,311 | | |
SPAIN — 0.7% | |
Distribuidora Internacional de Alimentacion SA | | | 667,322 | | | | 4,521,839 | | |
SWEDEN — 3.0% | |
Atlas Copco AB, B Shares | | | 290,416 | | | | 7,434,018 | | |
Svenska Handelsbanken AB, A Shares | | | 178,583 | | | | 8,355,519 | | |
Volvo AB, B Shares | | | 295,092 | | | | 3,182,123 | | |
| | | | | | 18,971,660 | | |
SWITZERLAND — 6.0% | |
Coca-Cola HBC AG (a) | | | 126,449 | | | | 2,407,529 | | |
Compagnie Financiere Richemont SA | | | 56,365 | | | | 4,997,243 | | |
Nestle SA | | | 146,451 | | | | 10,676,427 | | |
Roche Holding AG — Genusschein | | | 46,216 | | | | 12,521,866 | | |
Schindler Holding AG, Participating Certificates | | | 46,689 | | | | 6,740,220 | | |
| | | | | | 37,343,285 | | |
TAIWAN — 2.2% | |
Taiwan Semiconductor Manufacturing Co., Ltd. ADR | | | 622,800 | | | | 13,938,264 | | |
TURKMENISTAN — 0.3% | |
Dragon Oil Plc. | | | 239,496 | | | | 2,006,376 | | |
UNITED KINGDOM — 7.6% | |
Aggreko Plc. | | | 73,266 | | | | 1,708,566 | | |
Bunzl Plc. | | | 209,701 | | | | 5,732,650 | | |
Hays Plc. | | | 1,585,724 | | | | 3,567,679 | | |
Prudential Plc. | | | 884,917 | | | | 20,458,863 | | |
Rolls-Royce Holdings Plc. | | | 487,111 | | | | 6,543,784 | | |
Tullow Oil Plc. | | | 165,371 | | | | 1,065,712 | | |
Wolseley Plc. | | | 147,805 | | | | 8,450,296 | | |
| | | | | | 47,527,550 | | |
The accompanying notes are an integral part of the financial statements.
90
Annual Report December 31, 2014
December 31, 2014
Baillie Gifford Global Alpha Equity Fund
| | | Shares | | Value | |
UNITED STATES — 44.8% | |
Amazon.com, Inc. (a) | | | 37,123 | | | $ | 11,521,123 | | |
American Express Co. | | | 66,185 | | | | 6,157,852 | | |
Anthem, Inc. | | | 96,377 | | | | 12,111,698 | | |
CarMax, Inc. (a) | | | 147,097 | | | | 9,793,718 | | |
Colgate-Palmolive Co. | | | 96,709 | | | | 6,691,296 | | |
Dolby Laboratories, Inc., Class A | | | 159,621 | | | | 6,882,858 | | |
eBay, Inc. (a) | | | 145,370 | | | | 8,158,164 | | |
EOG Resources, Inc. | | | 92,674 | | | | 8,532,495 | | |
Facebook, Inc., Class A (a) | | | 48,192 | | | | 3,759,940 | | |
Financial Engines, Inc. | | | 15,298 | | | | 559,142 | | |
First Republic Bank | | | 186,372 | | | | 9,713,709 | | |
FLIR Systems, Inc. | | | 221,764 | | | | 7,165,195 | | |
Google, Inc., Class C (a) | | | 21,483 | | | | 11,308,651 | | |
Harley-Davidson, Inc. | | | 153,941 | | | | 10,146,251 | | |
Howard Hughes Corp. (The) (a) | | | 19,800 | | | | 2,582,316 | | |
Intuitive Surgical, Inc. (a) | | | 3,689 | | | | 1,951,260 | | |
Leucadia National Corp. | | | 141,700 | | | | 3,176,914 | | |
Lincoln Electric Holdings, Inc. | | | 94,613 | | | | 6,536,812 | | |
M&T Bank Corp. | | | 78,602 | | | | 9,873,983 | | |
Markel Corp. (a) | | | 15,355 | | | | 10,485,008 | | |
Martin Marietta Materials, Inc. | | | 49,327 | | | | 5,441,755 | | |
MasterCard, Inc., Class A | | | 94,626 | | | | 8,152,976 | | |
Monsanto Co. | | | 54,964 | | | | 6,566,549 | | |
Moody's Corp. | | | 95,630 | | | | 9,162,310 | | |
Myriad Genetics, Inc. (a) | | | 194,256 | | | | 6,616,359 | | |
NOW, Inc. (a) | | | 196,259 | | | | 5,049,744 | | |
Praxair, Inc. | | | 38,733 | | | | 5,018,247 | | |
QUALCOMM, Inc. | | | 83,000 | | | | 6,169,390 | | |
Royal Caribbean Cruises Ltd. | | | 303,712 | | | | 25,034,980 | | |
Seattle Genetics, Inc. (a) | | | 94,700 | | | | 3,042,711 | | |
TD Ameritrade Holding Corp. | | | 351,047 | | | | 12,560,462 | | |
Teradata Corp. (a) | | | 46,874 | | | | 2,047,456 | | |
Teradyne, Inc. | | | 293,000 | | | | 5,798,470 | | |
Tesla Motors, Inc. (a) | | | 24,662 | | | | 5,485,075 | | |
TripAdvisor, Inc. (a) | | | 58,508 | | | | 4,368,207 | | |
Twitter, Inc. (a) | | | 37,156 | | | | 1,332,786 | | |
Visa, Inc., Class A | | | 31,337 | | | | 8,216,561 | | |
The accompanying notes are an integral part of the financial statements.
91
Annual Report December 31, 2014
December 31, 2014
Baillie Gifford Global Alpha Equity Fund
| | | Shares | | Value | |
Waters Corp. (a) | | | 62,341 | | | $ | 7,027,078 | | |
Xilinx, Inc. | | | 125,207 | | | | 5,420,211 | | |
| | | | | | 279,619,712 | | |
TOTAL INVESTMENTS — 98.3% | |
(cost $519,553,670) | | | | $ | 613,871,616 | | |
Other assets less liabilities — 1.7% | | | | | 10,547,794 | | |
NET ASSETS — 100.0% | | | | $ | 624,419,410 | | |
(a) Non-income producing security.
ADR — American Depositary Receipt.
GDR — Global Depositary Receipt.
Reg S — Regulation S ("Reg S") of the securities Act of 1933, as amended ("1933 Act") is a safe harbor that defines when an offering of securities will be deemed to come to rest abroad and therefore is not subject to the registration obligations imposed under Section 5 of the 1933 Act. The regulation includes two safe harbor provisions: an issuer safe harbor and a resale safe harbor. In each case, the regulation demands that offers and sales of the securities be made outside the United States and that no offering participant (which includes the issuer, the banks assisting with the offer and their respective affiliates) engage in "directed" selling efforts. In the case of issuers for whose securities there is substantial U.S. market interest, the regulation also requires that no offers and sales be made to U.S. persons (including U.S. persons physically located outside the United States).
The accompanying notes are an integral part of the financial statements.
92
Statement of Assets and Liabilities
Annual Report December 31, 2014
December 31, 2014
Baillie Gifford Global Alpha Equity Fund
ASSETS | |
Investments, at value (cost $519,553,670) | | $ | 613,871,616 | | |
Cash | | | 11,248,299 | | |
Foreign cash, at value (cost $6,769,213) | | | 6,783,303 | | |
Dividends receivable | | | 168,911 | | |
Tax reclaims receivable | | | 362,994 | | |
Total Assets | | | 632,435,123 | | |
LIABILITIES | |
Capital shares payable | | | 7,000,000 | | |
Management fee payable | | | 441,492 | | |
Servicing fee payable | | | 324,585 | | |
Payable for investments purchased | | | 67,421 | | |
Trustee fee payable | | | 5,151 | | |
Accrued expenses | | | 177,064 | | |
Total Liabilities | | | 8,015,713 | | |
NET ASSETS | | $ | 624,419,410 | | |
COMPOSITION OF NET ASSETS | |
Paid-in capital | | $ | 526,829,143 | | |
Distributions in excess of net investment income | | | (1,074,984 | ) | |
Accumulated net realized gain on investments and foreign currency transactions | | | 4,371,034 | | |
Net unrealized appreciation in value of investments and foreign currencies | | | 94,294,217 | | |
NET ASSETS | | $ | 624,419,410 | | |
NET ASSET VALUE, PER SHARE | |
| Class 2 ($213,425,939 / 15,246,030 shares outstanding), unlimited authorized, no par value | | $ | 14.00 | | |
Maximum Purchase Price Per Share (Note D) | | $ | 14.03 | | |
Minimum Redemption Price Per Share (Note D) | | $ | 13.98 | | |
| Class 3 ($410,993,471 / 28,818,737 shares outstanding), unlimited authorized, no par value | | $ | 14.26 | | |
Maximum Purchase Price Per Share (Note D) | | $ | 14.29 | | |
Minimum Redemption Price Per Share (Note D) | | $ | 14.24 | | |
The accompanying notes are an integral part of the financial statements.
93
Annual Report December 31, 2014
For the Year Ended December 31, 2014
Baillie Gifford Global Alpha Equity Fund
INVESTMENT INCOME | |
Dividends (net of foreign withholding taxes of $698,223) | | $ | 8,364,320 | | |
Interest | | | 322 | | |
Total Investment Income | | | 8,364,642 | | |
EXPENSES | |
Management fee (Note B) | | | 1,690,959 | | |
Shareholder servicing fees — Class 2 Shares (Note B) | | | 375,945 | | |
Shareholder servicing fees — Class 3 Shares (Note B) | | | 848,828 | | |
Fund accounting | | | 323,093 | | |
Custody | | | 70,977 | | |
Legal | | | 69,463 | | |
Transfer agency | | | 17,879 | | |
Trustees' fees | | | 17,761 | | |
Professional fees | | | 17,608 | | |
Insurance | | | 6,498 | | |
Miscellaneous | | | 13,981 | | |
Total Expenses | | | 3,452,992 | | |
Net Investment Income | | | 4,911,650 | | |
REALIZED AND UNREALIZED GAIN (LOSS) ON INVESTMENTS
AND FOREIGN CURRENCY TRANSACTIONS | |
Net realized gain (loss) from: | |
Investments | | | 28,161,986 | | |
Foreign currency transactions | | | (139,738 | ) | |
| | | | 28,022,248 | | |
Net increase (decrease) in unrealized appreciation (depreciation) on: | |
Investments | | | (8,244,666 | ) | |
Translation of assets and liabilities in foreign currencies | | | (38,317 | ) | |
| | | | (8,282,983 | ) | |
Net realized and unrealized gain on investments and foreign currency transactions | | | 19,739,265 | | |
NET INCREASE IN NET ASSETS FROM OPERATIONS | | $ | 24,650,915 | | |
The accompanying notes are an integral part of the financial statements.
94
Statements of Changes in Net Assets
Annual Report December 31, 2014
Baillie Gifford Global Alpha Equity Fund
| | | For the
Year Ended
December 31,
2014 | | For the
Year Ended
December 31,
2013 | |
INCREASE (DECREASE) IN NET ASSETS FROM OPERATIONS | |
Net investment income | | $ | 4,911,650 | | | $ | 3,834,940 | | |
Net realized gain from investments and foreign currency transactions | | | 28,022,248 | | | | 14,584,011 | | |
Net increase (decrease) in unrealized appreciation (depreciation) on investments
and translation of assets and liabilities in foreign currencies | | | (8,282,983 | ) | | | 73,706,621 | | |
Net increase in net assets from operations | | | 24,650,915 | | | | 92,125,572 | | |
DIVIDENDS AND DISTRIBUTIONS TO SHAREHOLDERS FROM: | |
Net investment income: | |
Class 2 | | | (1,935,270 | ) | | | (1,390,265 | ) | |
Class 3 | | | (4,118,562 | ) | | | (3,607,790 | ) | |
Capital gains: | |
Class 2 | | | (8,447,239 | ) | | | (2,747,721 | ) | |
Class 3 | | | (17,020,345 | ) | | | (6,756,158 | ) | |
Total Dividends and Distributions | | | (31,521,416 | ) | | | (14,501,934 | ) | |
TRANSACTIONS IN SHARES OF BENEFICIAL INTEREST | |
Net proceeds from shares subscribed: | |
Class 1 | | | — | | | | 299,481 | | |
Class 2 | | | 88,622,400 | | | | 103,403,236 | | |
Class 3 | | | 139,720,000 | | | | 1,497,000 | | |
Purchase premiums: | |
Class 1 | | | — | | | | 11,713 | | |
Class 2 | | | 114,452 | | | | 28,494 | | |
Class 3 | | | 343,148 | | | | 118,949 | | |
Redemption fees: | |
Class 2 | | | 17,680 | | | | 3,002 | | |
Class 3 | | | 54,051 | | | | 7,514 | | |
Dividends reinvested: | |
Class 2 | | | 10,382,509 | | | | 4,137,986 | | |
Class 3 | | | 21,138,906 | | | | 10,363,948 | | |
Cost of shares redeemed: | |
Class 1 | | | — | | | | (25,780,688 | ) | |
Class 2 | | | — | | | | (7,010,597 | ) | |
Class 3 | | | (47,820,230 | ) | | | — | | |
Increase in Net Assets from Transactions in Shares of Beneficial Interest | | | 212,572,916 | | | | 87,080,038 | | |
Total Increase in Net Assets | | | 205,702,415 | | | | 164,703,676 | | |
NET ASSETS | |
Beginning of year | | | 418,716,995 | | | | 254,013,319 | | |
End of year (including distributions in excess of net investment income of
$1,074,984 and $1,474,481, respectively) | | $ | 624,419,410 | | | $ | 418,716,995 | | |
| | | | | | |
The accompanying notes are an integral part of the financial statements.
95
Annual Report December 31, 2014
Baillie Gifford Global Alpha Equity Fund
Selected data for a Class 2 Share outstanding throughout each period:
| | | For the
Year Ended
December 31,
2014 | | For the Period
January 6,
2013(a)
through
December 31,
2013 | |
Net asset value, beginning of period | | $ | 14.10 | | | $ | 11.55 | | |
From Investment Operations | |
Net investment income(b) | | | 0.11 | | | | 0.12 | | |
Net realized and unrealized gain on investments and foreign currency transactions | | | 0.53 | | | | 2.94 | | |
Net increase in net asset value from investment operations | | | 0.64 | | | | 3.06 | | |
Dividends and Distributions to Shareholders | | | | | |
Dividends from net investment income | | | (0.14 | ) | | | (0.17 | ) | |
Distributions from net realized gain on investments | | | (0.61 | ) | | | (0.34 | ) | |
Total Dividends and Distributions | | | (0.75 | ) | | | (0.51 | ) | |
Proceeds from Purchase Premiums and Redemption Fees(b) | | | 0.01 | | | | 0.00 | (c) | |
Net asset value, end of period | | $ | 14.00 | | | $ | 14.10 | | |
Total Return | |
Total investment return based on net asset value(d) | | | 4.49 | % | | | 26.48 | % | |
Ratios/Supplemental Data | |
Net assets, end of period (000's omitted) | | $ | 213,426 | | | $ | 119,535 | | |
Ratio of net expenses to average net assets | | | 0.67 | % | | | 0.68 | %* | |
Ratio of net investment income to average net assets | | | 0.74 | % | | | 1.00 | %* | |
Portfolio turnover rate | | | 26 | % | | | 20 | % | |
* Annualized.
(a) Commencement of operations.
(b) Calculated based upon average shares outstanding during the year.
(c) Amount is less than $0.005 per share.
(d) Total investment return is calculated assuming an initial investment made at the net asset value at the beginning of the period, reinvestment of all dividends and distributions, if any, at net asset value during the period, and redemption on the last day of the period. Total return is not annualized for periods less than one year.
The accompanying notes are an integral part of the financial statements.
96
Annual Report December 31, 2014
Baillie Gifford Global Alpha Equity Fund
Selected data for a Class 3 Share outstanding throughout each period:
| | | For the
Year Ended
December 31,
2014 | | For the
Year Ended
December 31,
2013 | | For the
Year Ended
December 31,
2012 | | For the Period
November 15,
2011(a)
through
December 31,
2011 | |
Net asset value, beginning of period | | $ | 14.36 | | | $ | 11.56 | | | $ | 9.86 | | | $ | 10.00 | | |
From Investment Operations | |
Net investment income(b) | | | 0.13 | | | | 0.14 | | | | 0.19 | | | | 0.01 | | |
Net realized and unrealized gain/(loss) on investments and
foreign currency transactions | | | 0.52 | | | | 3.17 | | | | 1.65 | | | | (0.14 | ) | |
Net increase (decrease) in net asset value from
investment operations | | | 0.65 | | | | 3.31 | | | | 1.84 | | | | (0.13 | ) | |
Dividends and Distributions to Shareholders | | | | | | | | | |
Dividends from net investment income | | | (0.15 | ) | | | (0.18 | ) | | | (0.14 | ) | | | (0.01 | ) | |
Distributions from net realized gain on investments | | | (0.61 | ) | | | (0.34 | ) | | | — | | | | — | | |
Total Dividends and Distributions | | | (0.76 | ) | | | (0.52 | ) | | | (0.14 | ) | | | (0.01 | ) | |
Proceeds from Purchase Premiums and
Redemption Fees(b) | | | 0.01 | | | | 0.01 | | | | 0.00 | (c) | | | — | | |
Net asset value, end of period | | $ | 14.26 | | | $ | 14.36 | | | $ | 11.56 | | | $ | 9.86 | | |
Total Return | |
Total investment return based on net asset value(d) | | | 4.48 | % | | | 28.71 | % | | | 18.69 | % | | | (1.25 | )% | |
Ratios/Supplemental Data | |
Net assets, end of period (000's omitted) | | $ | 410,993 | | | $ | 299,182 | | | $ | 231,157 | | | $ | 104,721 | | |
Ratio of net expenses to average net assets | | | 0.59 | % | | | 0.61 | % | | | 0.63 | % | | | 0.64 | %* | |
Ratio of net investment income to average net assets | | | 0.91 | % | | | 1.05 | % | | | 1.76 | % | | | 1.12 | %* | |
Portfolio turnover rate | | | 26 | % | | | 20 | % | | | 15 | % | | | 3 | % | |
* Annualized.
(a) Commencement of operations.
(b) Calculated based upon average shares outstanding during the period.
(c) Amount is less than $0.005 per share.
(d) Total investment return is calculated assuming an initial investment made at the net asset value at the beginning of the period, reinvestment of all dividends and distributions, if any, at net asset value during the period, and redemption on the last day of the period. Total return is not annualized for periods less than one year.
The accompanying notes are an integral part of the financial statements.
97
Industry Diversification Table
Annual Report December 31, 2014
December 31, 2014 (unaudited)
Baillie Gifford EAFE Pure Fund
| | | Value | | % of Total
Net Assets | |
Apparel Retailers | | $ | 1,515,230 | | | | 3.5 | % | |
Asset Managers | | | 1,200,780 | | | | 2.8 | | |
Banks | | | 4,134,302 | | | | 9.6 | | |
Biotechnology | | | 325,509 | | | | 0.7 | | |
Brewers | | | 1,590,932 | | | | 3.7 | | |
Building Materials & Fixtures | | | 913,418 | | | | 2.1 | | |
Bus, Train & Employment | | | 782,264 | | | | 1.8 | | |
Business Support Services | | | 506,689 | | | | 1.2 | | |
Clothing & Accessories | | | 397,398 | | | | 0.9 | | |
Commercial Vehicles & Trucks | | | 549,657 | | | | 1.3 | | |
Containers & Packaging | | | 553,034 | | | | 1.3 | | |
Distillers & Vintners | | | 296,431 | | | | 0.7 | | |
Diversified Industrials | | | 1,069,453 | | | | 2.5 | | |
Drug Retailers | | | 257,163 | | | | 0.6 | | |
Electrical Components & Equipment | | | 493,108 | | | | 1.1 | | |
Electronic Equipment | | | 756,150 | | | | 1.7 | | |
Food Products | | | 2,308,331 | | | | 5.3 | | |
Food Retailers & Wholesalers | | | 714,878 | | | | 1.7 | | |
Footwear | | | 435,216 | | | | 1.0 | | |
Gambling | | | 260,709 | | | | 0.6 | | |
General Mining | | | 689,473 | | | | 1.6 | | |
Industrial Machinery | | | 4,061,513 | | | | 9.4 | | |
Integrated Oil & Gas | | | 1,376,704 | | | | 3.2 | | |
Media Agencies | | | 788,135 | | | | 1.8 | | |
Medical Equipment | | | 1,761,115 | | | | 4.1 | | |
Nondurable Household Products | | | 1,392,040 | | | | 3.2 | | |
Oil Equipment & Services | | | 522,683 | | | | 1.2 | | |
Personal Products | | | 789,487 | | | | 1.8 | | |
Pharmaceuticals | | | 2,522,836 | | | | 5.8 | | |
Property & Casualty Insurance | | | 1,002,434 | | | | 2.3 | | |
Recreational Products | | | 1,321,121 | | | | 3.1 | | |
Restaurants & Bars | | | 376,283 | | | | 0.9 | | |
Semiconductors | | | 337,627 | | | | 0.8 | | |
Soft Drinks | | | 1,149,720 | | | | 2.7 | | |
Speciality Chemicals | | | 1,262,661 | | | | 2.9 | | |
Speciality Finance | | | 3,121,417 | | | | 7.2 | | |
Specialized Consumer Services | | | 1,322,710 | | | | 3.1 | | |
Total Value of Investments | | | 42,858,611 | | | | 99.2 | | |
Other assets less liabilities | | | 364,173 | | | | 0.8 | | |
Net Assets | | $ | 43,222,784 | | | | 100.0 | % | |
98
Annual Report December 31, 2014
December 31, 2014
Baillie Gifford EAFE Pure Fund
| | | Shares | | Value | |
COMMON STOCKS — 99.2% | |
AUSTRALIA — 6.4% | |
Brambles Ltd. | | | 64,200 | | | $ | 553,034 | | |
Cochlear Ltd. | | | 15,200 | | | | 958,920 | | |
Mesoblast Ltd. (a) | | | 45,400 | | | | 161,344 | | |
Seek Ltd. | | | 56,100 | | | | 782,264 | | |
Treasury Wine Estates Ltd. | | | 76,800 | | | | 296,431 | | |
| | | | | | 2,751,993 | | |
CHINA — 1.9% | |
BOC Hong Kong Holdings Ltd. | | | 162,500 | | | | 541,473 | | |
Li & Fung Ltd. | | | 304,000 | | | | 284,609 | | |
| | | | | | 826,082 | | |
DENMARK — 4.6% | |
Carlsberg A/S, B Shares | | | 10,000 | | | | 767,998 | | |
Novo Nordisk A/S, B Shares | | | 25,000 | | | | 1,057,495 | | |
Novozymes A/S, B Shares | | | 3,900 | | | | 164,165 | | |
| | | | | | 1,989,658 | | |
FRANCE — 4.2% | |
Kone Oyj, B Shares | | | 16,600 | | | | 755,762 | | |
Legrand SA | | | 9,400 | | | | 493,108 | | |
Total SA | | | 11,200 | | | | 573,800 | | |
| | | | | | 1,822,670 | | |
GERMANY — 1.0% | |
adidas AG | | | 6,267 | | | | 435,216 | | |
ISRAEL — 0.2% | |
Protalix BioTherapeutics, Inc. (a) | | | 45,400 | | | | 83,536 | | |
ITALY — 2.6% | |
CNH Industrial NV | | | 67,900 | | | | 549,657 | | |
EXOR SpA | | | 14,200 | | | | 582,653 | | |
| | | | | | 1,132,310 | | |
The accompanying notes are an integral part of the financial statements.
99
Annual Report December 31, 2014
December 31, 2014
Baillie Gifford EAFE Pure Fund
| | | Shares | | Value | |
JAPAN — 19.8% | |
Asahi Group Holdings Ltd. | | | 26,600 | | | $ | 822,933 | | |
Kao Corp. | | | 35,300 | | | | 1,392,040 | | |
MS&AD Insurance Group Holdings, Inc. | | | 42,300 | | | | 1,002,435 | | |
Olympus Corp. (a) | | | 22,900 | | | | 802,195 | | |
Rakuten, Inc. | | | 62,500 | | | | 869,113 | | |
Sankyo Co., Ltd. | | | 7,600 | | | | 260,709 | | |
Shimano, Inc. | | | 10,200 | | | | 1,321,121 | | |
Shiseido Co., Ltd. | | | 36,000 | | | | 504,879 | | |
SMC Corp. | | | 2,000 | | | | 524,448 | | |
SUGI Holdings Co., Ltd. | | | 6,300 | | | | 257,163 | | |
THK Co., Ltd. | | | 34,000 | | | | 817,084 | | |
| | | | | | 8,574,120 | | |
NEW ZEALAND — 1.1% | |
Trade Me Group Ltd. | | | 159,700 | | | | 453,596 | | |
SINGAPORE — 4.9% | |
Jardine Matheson Holdings Ltd. | | | 17,600 | | | | 1,069,453 | | |
United Overseas Bank Ltd. | | | 57,433 | | | | 1,059,872 | | |
| | | | | | 2,129,325 | | |
SPAIN — 3.5% | |
Distribuidora Internacional de Alimentacion SA | | | 105,500 | | | | 714,878 | | |
Inditex SA | | | 28,000 | | | | 798,713 | | |
| | | | | | 1,513,591 | | |
SWEDEN — 11.5% | |
Atlas Copco AB, B Shares | | | 35,100 | | | | 898,484 | | |
Investment AB Kinnevik, B Shares | | | 39,050 | | | | 1,269,876 | | |
Investor AB, B Shares | | | 34,900 | | | | 1,268,888 | | |
Svenska Handelsbanken AB, A Shares | | | 32,600 | | | | 1,525,285 | | |
| | | | | | 4,962,533 | | |
SWITZERLAND — 12.9% | |
Geberit AG | | | 2,700 | | | | 913,418 | | |
Mettler-Toledo International, Inc. (a) | | | 2,500 | | | | 756,150 | | |
Nestle SA | | | 18,400 | | | | 1,341,379 | | |
Roche Holding AG — Genusschein | | | 5,100 | | | | 1,381,805 | | |
The accompanying notes are an integral part of the financial statements.
100
Annual Report December 31, 2014
December 31, 2014
Baillie Gifford EAFE Pure Fund
| | | Shares | | Value | |
Schindler Holding AG, Participating Certificates | | | 4,800 | | | $ | 692,948 | | |
UBS Group AG (a) | | | 29,300 | | | | 503,658 | | |
| | | | | | 5,589,358 | | |
UNITED KINGDOM — 21.9% | |
ASOS Plc. (a) | | | 18,022 | | | | 716,516 | | |
BG Group Plc. | | | 60,000 | | | | 802,904 | | |
BHP Billiton Plc. | | | 21,000 | | | | 450,059 | | |
Burberry Group Plc. | | | 15,663 | | | | 397,398 | | |
Hargreaves Lansdown Plc. | | | 57,000 | | | | 891,875 | | |
Imagination Technologies Group Plc. (a) | | | 95,700 | | | | 337,627 | | |
Intertek Group Plc. | | | 14,000 | | | | 506,689 | | |
John Wood Group Plc. | | | 56,500 | | | | 522,683 | | |
Johnson Matthey Plc. | | | 24,000 | | | | 1,262,661 | | |
Jupiter Fund Management Plc. | | | 54,704 | | | | 308,905 | | |
KAZ Minerals Plc. (a) | | | 60,000 | | | | 239,414 | | |
Mitchells & Butlers Plc. (a) | | | 63,168 | | | | 376,283 | | |
Rightmove Plc. | | | 22,600 | | | | 788,135 | | |
Standard Chartered Plc. | | | 33,700 | | | | 504,015 | | |
Unilever Plc. | | | 23,800 | | | | 966,953 | | |
Weir Group Plc. (The) | | | 13,000 | | | | 372,786 | | |
| | | | | | 9,444,903 | | |
UNITED STATES — 2.7% | |
Coca-Cola Enterprises, Inc. | | | 26,000 | | | | 1,149,720 | | |
TOTAL INVESTMENTS — 99.2% | |
(cost $45,814,219) | | | | $ | 42,858,611 | | |
Other assets less liabilities — 0.8% | | | | | 364,173 | | |
NET ASSETS — 100.0% | | | | $ | 43,222,784 | | |
(a) Non-income producing security.
The accompanying notes are an integral part of the financial statements.
101
Statement of Assets and Liabilities
Annual Report December 31, 2014
December 31, 2014
Baillie Gifford EAFE Pure Fund
ASSETS | |
Investments, at value (cost $45,814,219) | | $ | 42,858,611 | | |
Cash | | | 411,978 | | |
Foreign cash, at value (cost $6) | | | 6 | | |
Receivable for investments sold | | | 61,553 | | |
Dividends receivable | | | 28,605 | | |
Tax reclaims receivable | | | 11,922 | | |
Total Assets | | | 43,372,675 | | |
LIABILITIES | |
Payable for investments purchased | | | 68,585 | | |
Servicing fee payable | | | 29,533 | | |
Management fee payable | | | 18,310 | | |
Trustee fee payable | | | 403 | | |
Accrued expenses | | | 33,060 | | |
Total Liabilities | | | 149,891 | | |
NET ASSETS | | $ | 43,222,784 | | |
COMPOSITION OF NET ASSETS | |
Paid-in capital | | $ | 46,282,881 | | |
Distribution in excess of investment income | | | (22,395 | ) | |
Accumulated net realized loss on investments and foreign currency transactions | | | (80,793 | ) | |
Net unrealized depreciation in value of investments and foreign currencies | | | (2,956,909 | ) | |
NET ASSETS | | $ | 43,222,784 | | |
NET ASSET VALUE, PER SHARE | |
| Class 2 ($43,222,784 / 4,615,994 shares outstanding), unlimited authorized, no par value | | $ | 9.36 | | |
Maximum Purchase Price Per Share (Note D) | | $ | 9.39 | | |
Minimum Redemption Price Per Share (Note D) | | $ | 9.34 | | |
The accompanying notes are an integral part of the financial statements.
102
Annual Report December 31, 2014
For the Period of April 15, 2014 through December 31, 2014(a)
Baillie Gifford EAFE Pure Fund
INVESTMENT INCOME | |
Dividends (net of foreign withholding taxes of $48,931) | | $ | 598,909 | | |
Interest | | | 12 | | |
Total Investment Income | | | 598,921 | | |
EXPENSES | |
Management fee (Note B) | | | 81,284 | | |
Shareholder servicing fees — Class 2 Shares (Note B) | | | 87,787 | | |
Fund accounting | | | 37,025 | | |
Custody | | | 8,030 | | |
Transfer agency | | | 4,352 | | |
Legal | | | 4,269 | | |
Professional fees | | | 1,423 | | |
Trustees' fees | | | 1,206 | | |
Insurance | | | 550 | | |
Miscellaneous | | | 849 | | |
Total Expenses | | | 226,775 | | |
Fees waived (Note B) | | | (9,035 | ) | |
Net Expenses | | | 217,740 | | |
Net Investment Income | | | 381,181 | | |
REALIZED AND UNREALIZED GAIN (LOSS) ON INVESTMENTS
AND FOREIGN CURRENCY TRANSACTIONS | |
Net realized loss from: | |
Investments | | | (61,620 | ) | |
Foreign currency transactions | | | (139,868 | ) | |
| | | | (201,488 | ) | |
Net increase (decrease) in unrealized appreciation (depreciation) on: | |
Investments | | | (2,955,608 | ) | |
Translation of assets and liabilities in foreign currencies | | | (1,301 | ) | |
| | | | (2,956,909 | ) | |
Net realized and unrealized loss on investments and foreign currency transactions | | | (3,158,397 | ) | |
NET DECREASE IN NET ASSETS FROM OPERATIONS | | $ | (2,777,216 | ) | |
(a) Commencement of investment operations.
The accompanying notes are an integral part of the financial statements.
103
Statement of Changes in Net Assets
Annual Report December 31, 2014
Baillie Gifford EAFE Pure Fund
| | | For the Period
April 15, 2014(a)
through
December 31, 2014 | |
INCREASE (DECREASE) IN NET ASSETS FROM OPERATIONS | |
Net investment income | | $ | 381,181 | | |
Net realized loss from investments and foreign currency transactions | | | (201,488 | ) | |
Net increase (decrease) in unrealized depreciation on investments and translation of
assets and liabilities in foreign currencies | | | (2,956,909 | ) | |
Net decrease in net assets from operations | | | (2,777,216 | ) | |
DIVIDENDS AND DISTRIBUTIONS TO SHAREHOLDERS FROM: | |
Net investment income: | |
Class 2 | | | (263,706 | ) | |
Capital gains: | |
Class 2 | | | (19,175 | ) | |
Total Dividends and Distributions | | | (282,881 | ) | |
TRANSACTIONS IN SHARES OF BENEFICIAL INTEREST | |
Net proceeds from shares subscribed: | |
Class 2 | | | 45,862,000 | | |
Purchase premiums: | |
Class 2 | | | 138,000 | | |
Dividends reinvested: | |
Class 2 | | | 282,881 | | |
Increase in Net Assets from Transactions in Shares of Beneficial Interest | | | 46,282,881 | | |
Total Increase in Net Assets | | | 43,222,784 | | |
NET ASSETS | |
Beginning of period | | | — | | |
End of period (including distributions in excess of net investment income of $22,395) | | $ | 43,222,784 | | |
(a) Commencement of investment operations
The accompanying notes are an integral part of the financial statements.
104
Annual Report December 31, 2014
Baillie Gifford EAFE Pure Fund
Selected data for a Class 2 Share outstanding throughout the period:
| | | For the Period
April 15, 2014(a)
through
December 31, 2014 | |
Net asset value, beginning of period | | $ | 10.00 | | |
From Investment Operations | |
Net investment income(b) | | | 0.08 | | |
Net realized and unrealized loss on investments and foreign currency transactions | | | (0.69 | ) | |
Net decrease in net asset value from investment operations | | | (0.61 | ) | |
Dividends and Distributions to Shareholders | |
Dividends from net investment income | | | (0.06 | ) | |
Distributions from net realized gain on investments | | | (0.00 | )(c) | |
Total Dividends and Distributions | | | (0.06 | ) | |
Proceeds from Purchase Premiums and Redemption Fees(b) | | | 0.03 | | |
Net asset value, end of period | | $ | 9.36 | | |
Total Return | |
Total investment return based on net asset value(d) | | | (5.79 | )% | |
Ratios/Supplemental Data | |
Net assets, end of period (000's omitted) | | $ | 43,223 | | |
Ratio of net expenses to average net assets, before waiver | | | 0.70 | %* | |
Ratio of net expenses to average net assets, after waiver(e) | | | 0.67 | %* | |
Ratio of net investment income to average net assets | | | 1.17 | %* | |
Portfolio turnover rate(e) | | | 5 | % | |
* Annualized.
(a) Commencement of investment operations.
(b) Calculated based upon average shares outstanding during the period.
(c) Amount is less than $0.005 per share.
(d) Total investment return is calculated assuming an initial investment made at the net asset value at the beginning of the period, reinvestment of all dividends and distributions, if any, at net asset value during the period, and redemption on the last day of the period. Total return is not annualized for periods less than one year.
(e) Not annualized.
(e) Fund has an expense cap of 0.67%.
The accompanying notes are an integral part of the financial statements.
105
Industry Diversification Table
Annual Report December 31, 2014
December 31, 2014 (unaudited)
Baillie Gifford Long Term Global Growth Equity Fund
| | | Value | | % of Total
Net Assets | |
Apparel Retailers | | $ | 1,163,982 | | | | 4.5 | % | |
Automobiles | | | 979,716 | | | | 3.8 | | |
Biotechnology | | | 3,074,647 | | | | 11.8 | | |
Broadline Retailers | | | 2,987,352 | | | | 11.5 | | |
Bus, Train & Employment | | | 732,545 | | | | 2.8 | | |
Clothing & Accessories | | | 970,970 | | | | 3.7 | | |
Computer Hardware | | | 382,306 | | | | 1.5 | | |
Consumer Finance | | | 101,200 | | | | 0.4 | | |
Food Retailers & Wholesalers | | | 919,711 | | | | 3.5 | | |
Industrial Machinery | | | 598,808 | | | | 2.3 | | |
Internet | | | 7,787,608 | | | | 29.8 | | |
Life Insurance | | | 552,650 | | | | 2.1 | | |
Medical Equipment | | | 1,159,966 | | | | 4.4 | | |
Personal products | | | 389,308 | | | | 1.5 | | |
Semiconductors | | | 525,886 | | | | 2.0 | | |
Software | | | 2,093,559 | | | | 8.0 | | |
Specialized Consumer Services | | | 661,266 | | | | 2.5 | | |
Travel & Tourism | | | 547,729 | | | | 2.1 | | |
Total Value of Investments | | | 25,629,209 | | | | 98.2 | | |
Other assets less liabilities | | | 465,644 | | | | 1.8 | | |
Net Assets | | $ | 26,094,853 | | | | 100.0 | % | |
106
Annual Report December 31, 2014
December 31, 2014
Baillie Gifford Long Term Global Growth Equity Fund
| | | Shares | | Value | |
COMMON STOCKS — 98.2% | |
CHINA — 21.8% | |
Alibaba Group Holding Ltd. ADR (a) | | | 3,554 | | | $ | 369,403 | | |
Baidu, Inc. ADR (a) | | | 10,566 | | | | 2,408,731 | | |
Ctrip.com International Ltd. ADR (a) | | | 12,038 | | | | 547,729 | | |
New Oriental Education & Technology Group, Inc. ADR (a) | | | 14,300 | | | | 291,863 | | |
Tencent Holdings Ltd. | | | 143,300 | | | | 2,073,398 | | |
| | | | | | 5,691,124 | | |
DENMARK — 2.7% | |
Novozymes A/S, B Shares | | | 17,070 | | | | 718,537 | | |
FRANCE — 6.7% | |
Hermes International | | | 1,435 | | | | 510,980 | | |
Kering | | | 4,402 | | | | 845,937 | | |
L'Oreal SA | | | 2,326 | | | | 389,308 | | |
| | | | | | 1,746,225 | | |
GERMANY — 1.4% | |
Rocket Internet AG 144A (a)(b) | | | 5,990 | | | | 372,486 | | |
HONG KONG — 2.1% | |
AIA Group Ltd. | | | 100,200 | | | | 552,650 | | |
SPAIN — 4.5% | |
Inditex SA | | | 40,805 | | | | 1,163,982 | | |
SWEDEN — 2.3% | |
Atlas Copco AB, A Shares | | | 21,520 | | | | 598,808 | | |
UNITED KINGDOM — 3.8% | |
ARM Holdings Plc. | | | 34,232 | | | | 525,886 | | |
Burberry Group Plc. | | | 18,130 | | | | 459,990 | | |
| | | | | | 985,876 | | |
UNITED STATES — 52.9% | |
Amazon.com, Inc. (a) | | | 6,900 | | | | 2,141,415 | | |
Facebook, Inc., Class A (a) | | | 19,712 | | | | 1,537,930 | | |
Google, Inc., Class C (a) | | | 2,945 | | | | 1,550,248 | | |
The accompanying notes are an integral part of the financial statements.
107
Annual Report December 31, 2014
December 31, 2014
Baillie Gifford Long Term Global Growth Equity Fund
| | | Shares | | Value | |
Illumina, Inc. (a) | | | 11,024 | | | $ | 2,034,810 | | |
Intuitive Surgical, Inc. (a) | | | 2,193 | | | | 1,159,966 | | |
LendingClub Corp. (a) | | | 4,000 | | | | 101,200 | | |
LinkedIn Corp., Class A (a) | | | 3,189 | | | | 732,545 | | |
salesforce.com, Inc. (a) | | | 8,954 | | | | 531,062 | | |
Seattle Genetics, Inc. (a) | | | 10,000 | | | | 321,300 | | |
Splunk, Inc. (a) | | | 7,177 | | | | 423,084 | | |
Stratasys Ltd. (a) | | | 4,600 | | | | 382,306 | | |
Tesla Motors, Inc. (a) | | | 4,405 | | | | 979,716 | | |
TripAdvisor, Inc. (a) | | | 5,032 | | | | 375,689 | | |
Twitter, Inc. (a) | | | 6,058 | | | | 217,301 | | |
Whole Foods Market, Inc. | | | 18,241 | | | | 919,711 | | |
Workday, Inc., Class A (a) | | | 4,794 | | | | 391,238 | | |
| | | | | | 13,799,521 | | |
TOTAL INVESTMENTS — 98.2% | |
(cost $24,724,221) | | | | $ | 25,629,209 | | |
Other assets less liabilities — 1.8% | | | | | 465,644 | | |
NET ASSETS — 100.0% | | | | $ | 26,094,853 | | |
(a) Non-income producing security.
(b) 144A securities are exempt from registration under Rule 144A under the Securities Act of 1933, as amended. These securities may be resold in transactions exempt from registration, normally to qualified institutional buyers. Prices are obtained daily from the London International Stock Exchange; therefore, Fair valuation is typically not required. At December 31, 2014, the net value of these securities was $372,486, representing 1.43% of net assets.
ADR — American Depositary Receipt.
The accompanying notes are an integral part of the financial statements.
108
Statement of Assets and Liabilities
Annual Report December 31, 2014
December 31, 2014
Baillie Gifford Long Term Global Growth Equity Fund
ASSETS | |
Investments, at value (cost $24,724,221) | | $ | 25,629,209 | | |
Cash | | | 555,890 | | |
Dividend receivable | | | 2,741 | | |
Tax reclaims receivable | | | 717 | | |
Total Assets | | | 26,188,557 | | |
LIABILITIES | |
Payable for investments purchased | | | 41,359 | | |
Management fee payable | | | 18,260 | | |
Servicing fee payable | | | 11,227 | | |
Trustee fee payable | | | 237 | | |
Accrued expenses | | | 22,621 | | |
Total Liabilities | | | 93,704 | | |
NET ASSETS | | $ | 26,094,853 | | |
COMPOSITION OF NET ASSETS | |
Paid-in capital | | $ | 25,023,988 | | |
Accumulated net realized gain on investments and foreign currency transactions | | | 165,887 | | |
Net unrealized appreciation in value of investments and foreign currencies | | | 904,978 | | |
NET ASSETS | | $ | 26,094,853 | | |
NET ASSET VALUE, PER SHARE | |
| Class 2 ($26,094,853 / 2,502,275 shares outstanding), unlimited authorized, no par value | | $ | 10.43 | | |
Maximum Purchase Price Per Share (Note D) | | $ | 10.45 | | |
Minimum Redemption Price Per Share (Note D) | | $ | 10.41 | | |
The accompanying notes are an integral part of the financial statements.
109
Annual Report December 31, 2014
For the Period June 10, 2014 through December 31, 2014(a)
Baillie Gifford Long Term Global Growth Equity Fund
INVESTMENT INCOME | |
Dividends (net of foreign withholding taxes of $2,007) | | $ | 32,994 | | |
Total Investment Income | | | 32,994 | | |
EXPENSES | |
Management fee (Note B) | | | 69,881 | | |
Shareholder servicing fees — Class 2 Shares (Note B) | | | 24,882 | | |
Fund accounting | | | 18,782 | | |
Legal | | | 4,871 | | |
Custody | | | 4,362 | | |
Transfer agency | | | 3,344 | | |
Trustees' fees | | | 692 | | |
Professional fees | | | 814 | | |
Miscellaneous | | | 547 | | |
Total Expenses | | | 128,175 | | |
Fees waived (Note B) | | | (11,458 | ) | |
Net Expenses | | | 116,717 | | |
Net Investment Loss | | | (83,723 | ) | |
REALIZED AND UNREALIZED GAIN (LOSS) ON INVESTMENTS
AND FOREIGN CURRENCY TRANSACTIONS | |
Net realized gain from: | |
Investments | | | 272,960 | | |
Foreign currency transactions | | | 638 | | |
| | | | 273,598 | | |
Net increase (decrease) in unrealized appreciation (depreciation) on: | |
Investments | | | 904,988 | | |
Translation of assets and liabilities in foreign currencies | | | (10 | ) | |
| | | | 904,978 | | |
Net realized and unrealized gain on investments and foreign currency transactions | | | 1,178,576 | | |
NET INCREASE IN NET ASSETS FROM OPERATIONS | | $ | 1,094,853 | | |
(a) Commencement of investment operations.
The accompanying notes are an integral part of the financial statements.
110
Statement of Changes in Net Assets
Annual Report December 31, 2014
Baillie Gifford Long Term Global Growth Equity Fund
| | | For the Period
June 10, 2014(a)
through
December 31, 2014 | |
INCREASE (DECREASE) IN NET ASSETS FROM OPERATIONS | |
Net investment loss | | $ | (83,723 | ) | |
Net realized gain from investments and foreign currency transactions | | | 273,598 | | |
Net increase (decrease) in unrealized appreciation on investments
and translation of assets and liabilities in foreign currencies | | | 904,978 | | |
Net increase in net assets from operations | | | 1,094,853 | | |
DIVIDENDS AND DISTRIBUTIONS TO SHAREHOLDERS FROM: | |
Capital gains: | | | |
Class 2 | | | (23,988 | ) | |
TRANSACTIONS IN SHARES OF BENEFICIAL INTEREST | |
Net proceeds from shares subscribed: | | | |
Class 2 | | | 25,000,000 | | |
Dividends reinvested: | | | |
Class 2 | | | 23,988 | | |
Increase in Net Assets from Transactions in Shares of Beneficial Interest | | | 25,023,988 | | |
Total Increase in Net Assets | | | 26,094,853 | | |
NET ASSETS | |
Beginning of period | | | — | | |
End of period (including undistributed net investment income of $—) | | $ | 26,094,853 | | |
(a) Commencement of investment operations.
The accompanying notes are an integral part of the financial statements.
111
Annual Report December 31, 2014
Baillie Gifford Long Term Global Growth Equity Fund
Selected data for a Class 2 Share outstanding throughout the period:
| | | For the Period
June 10, 2014(a)
through
December 31, 2014 | |
Net asset value, beginning of period | | $ | 10.00 | | |
From Investment Operations | |
Net investment loss(b) | | | (0.03 | ) | |
Net realized and unrealized gain on investments and foreign currency transactions | | | 0.47 | | |
Net increase in net asset value from investment operations | | | 0.44 | | |
Dividends and Distributions to Shareholders | |
Distributions from net realized gain on investments | | | (0.01 | ) | |
Net asset value, end of period | | $ | 10.43 | | |
Total Return | |
Total investment return based on net asset value(c) | | | 4.39 | % | |
Ratios/Supplemental Data | |
Net assets, end of period (000's omitted) | | $ | 26,095 | | |
Ratio of net expenses to average net assets, before waiver | | | 0.88 | %* | |
Ratio of net expenses to average net assets, after waiver(e) | | | 0.80 | %* | |
Ratio of net investment loss to average net assets | | | (0.57 | )%* | |
Portfolio turnover rate(d) | | | 8 | % | |
* Annualized.
(a) Commencement of operations.
(b) Calculated based upon average shares outstanding during the period.
(c) Total investment return is calculated assuming an initial investment made at the net asset value at the beginning of the period, reinvestment of all dividends and distributions, if any, at net asset value during the period, and redemption on the last day of the period. Total return is not annualized for periods less than one year.
(d) Not annualized.
(e) Fund had an expense cap of 0.82% up to October 1, 2014. After October 1, 2014 the expense changed to 0.77%.
The accompanying notes are an integral part of the financial statements.
112
Notes to Financial Statements
Annual Report December 31, 2014
Note A — Organization and Accounting Policies
Each of Baillie Gifford International Equity Fund ("International Equity Fund"), Baillie Gifford International Choice Fund ("International Choice Fund"), Baillie Gifford EAFE Fund ("EAFE Fund"), Baillie Gifford EAFE Choice Fund ("EAFE Choice Fund"), Baillie Gifford Emerging Markets Fund ("Emerging Markets Fund"), Baillie Gifford Global Alpha Equity Fund ("Global Alpha Equity Fund"), Baillie Gifford EAFE Pure Fund ("EAFE Pure Fund") and Baillie Gifford Long Term Global Growth Equity Fund ("Long Term Global Growth Equity Fund") (each, a "Fund", and collectively, the "Funds") is a series of Baillie Gifford Funds (the "Trust"). Baillie Gifford Emerging Markets Bond Fund and Baillie Gifford North American Equity Fund, two other series of the Trust, are currently unfunded. The Trust is a diversified open-end management investment company registered under the Investment Company Act of 1940, as amended. The Trust is organized as a Massachusetts business trust under the laws of Massachusetts pursuant to an Amended and Restated Agreement and Declaration of Trust dated December 31, 2014. As of December 31, 2014, all Funds except for the Emerging Markets Fund offered five classes of shares; Class 1, Class 2, Class 3, Class 4, and Class 5 shares. Emerging Markets Fund offered three classes of shares: Class I, Class II, and Class III shares. At December 31, 2014, shares issued and outstanding for the International Equity Fund were Class 1, Class 2, Class 3, Class 4 and Class 5 shares, shares issued and outstanding for the EAFE Fund were Class 2, Class 3, Class 4 and Class 5 shares, shares issued and outstanding for the International Choice Fund were Class 1, Class 2 and Class 3 shares, shares issued and outstanding for the EAFE Choice Fund were Class 1, Class 2 and Class 3 shares, shares issued and outstanding for the Global Alpha Equity Fund were Class 2 and Class 3 shares, shares issued outstanding for Emerging Markets Fund were Class III shares, and shares issued and outstanding for the EAFE Pure Fund and Long Term Global Growth Equity Fund were Class 2 shares.
The financial statements of the Funds have been prepared in conformity with accounting principles generally accepted in the United States of America ("GAAP"). Management is required to make certain estimates and assumptions that affect the reported amounts of assets and liabilities for the Funds and disclosure of contingent assets and liabilities for the
Funds at the date of the financial statements and the reported amounts of increases and decreases in net assets from operations for the Funds during the reporting period. Actual results could differ from those estimates.
The following is a summary of significant accounting policies followed by the Funds:
Valuation of Investments
Equity securities listed on an established securities exchange are normally valued at their last sale price on the exchange where primarily traded. Equity securities listed on the NASDAQ National Market System are valued at the NASDAQ Official Closing Price. Equity securities listed on an established securities exchange or on the NASDAQ National Market System for which there is no reported sale during the day, and in the case of over-the-counter securities not so listed, are valued at the most recent quoted bid price. Other securities for which current market quotations are not readily available (or for which quotations are not believed to be reliable due to market changes that occur after the most recent available quotations are obtained or any other reason), and all other assets, are taken at fair value as determined in good faith by Baillie Gifford Overseas Limited (the "Manager"), pursuant to procedures approved by the trustees of the Trust (the "Trustees"). The actual calculations may be made by persons acting pursuant to the direction of the Trustees or by pricing services.
Generally, trading in foreign securities markets is substantially completed each day at various times prior to close of regular trading on the New York Stock Exchange. Occasionally, events affecting the value of foreign fixed income securities and of equity securities of non-U.S. issuers not traded on a U.S. exchange may occur between the completion of substantial trading of such securities for the day and the close of regular trading on the New York Stock Exchange, which events may not be reflected in the computation of a Funds' net asset values. If events materially affecting the value of the Funds' portfolio securities occur during such period, then these securities will be valued at their fair value as determined in good faith by the Manager, pursuant to procedures approved by the Trustees. The Funds utilize a third party pricing service which for all equity securities, except those traded on a Canadian, Latin American or U.S. exchange, applies a fair value adjustment that seeks to reflect changes in such securities' market prices since the close of the market on which they are traded. To the
113
Notes to Financial Statements
Annual Report December 31, 2014
extent that securities are valued using this service, they will be classified as Level 2 securities in the fair value measurement framework described below.
The Funds invest in obligations of foreign entities and securities denominated in foreign currencies. Such investments involve risk not typically involved with domestic investments. Such risks include fluctuations in foreign exchange rates, inability to convert proceeds into U.S. dollars, application of foreign tax laws, foreign investment restrictions, less publicly available information about foreign financial instruments, less liquidity resulting from substantially less trading volume, more volatile prices, and generally less government supervision of foreign securities markets and issuers.
Fair Value Measurement
GAAP provides guidance on fair value measurements and defines fair value as the price that the Funds would receive to sell an investment or pay to transfer a liability in a timely transaction with an independent buyer in the principal market, or in the absence of a principal market the most advantageous market for the investment or liability. It establishes a single definition of fair value, creates a three-tier hierarchy as a framework for measuring fair value based on inputs used to value the Funds' investments, and requires additional disclosure about fair value. The hierarchy of inputs is summarized below:
Level 1 — unadjusted quoted prices in active markets for identical investments
Level 2 — other significant observable inputs (including quoted prices for similar
investments, interest rates, prepayment speeds, credit risk, etc.)
Level 3 — significant unobservable inputs (including the Trust's own assumptions in determining the fair value of investments)
For Level 1 inputs, the Funds' use unadjusted quoted prices in active markets for assets or liabilities with sufficient frequency and volume to provide pricing information as the most reliable evidence of fair value.
The Funds' Level 2 valuation techniques include inputs other than quoted prices within Level 1 that are observable for an asset or liability, either directly or indirectly. Level 2 observable inputs may include quoted prices for similar assets and liabilities in active markets or quoted prices for identical or similar assets or liabilities in markets that are not active in which there are few transactions, the prices are not current, or price quotations vary substantially over time or among market participants. Inputs that are observable for the asset or liability in Level 2 include such factors as interest rates, yield curves, prepayment speeds, credit risk, and default rates for similar liabilities.
For Level 3 valuation techniques, the Funds use unobservable inputs that reflect assumptions market participants would be expected to use in pricing the asset or liability. Unobservable inputs are used to measure fair value to the extent that observable inputs are not available and are developed based on the best information available under the circumstances. In developing unobservable inputs, market participant assumptions are used if they are reasonably available without undue cost and effort.
The inputs or methodology used for valuing securities are not necessarily an indication of the risk associated with investing in those securities. The following is a summary of the inputs used as of December 31, 2014 in valuing the Funds' investments carried at fair value:
International Equity Fund
Investments in Securities | | Level 1 | | Level 2 | | Level 3 | | Total | |
Common Stocks | |
Argentina | | $ | 37,561,663 | | | $ | — | | | $ | — | | | $ | 37,561,663 | | |
Australia | | | — | | | | 55,403,827 | | | | — | | | | 55,403,827 | | |
Bermuda | | | — | | | | 4,102,920 | | | | — | | | | 4,102,920 | | |
Brazil | | | 23,661,614 | | | | — | | | | — | | | | 23,661,614 | | |
Canada | | | 67,396,348 | | | | — | | | | — | | | | 67,396,348 | | |
114
Notes to Financial Statements
Annual Report December 31, 2014
Investments in Securities | | Level 1 | | Level 2 | | Level 3 | | Total | |
Common Stocks | |
China | | $ | 50,843,882 | | | $ | 85,940,458 | | | $ | — | | | $ | 136,784,340 | | |
Denmark | | | — | | | | 73,828,893 | | | | — | | | | 73,828,893 | | |
Finland | | | — | | | | 33,822,509 | | | | — | | | | 33,822,509 | | |
France | | | — | | | | 108,894,994 | | | | — | | | | 108,894,994 | | |
Germany | | | — | | | | 147,345,034 | | | | — | | | | 147,345,034 | | |
India | | | — | | | | 14,790,808 | | | | — | | | | 14,790,808 | | |
Ireland | | | 47,466,248 | | | | 45,839,057 | | | | — | | | | 93,305,305 | | |
Japan | | | — | | | | 221,064,440 | | | | — | | | | 221,064,440 | | |
Netherlands | | | 12,285,448 | | | | 61,104,055 | | | | — | | | | 73,389,503 | | |
Peru | | | 20,292,563 | | | | — | | | | — | | | | 20,292,563 | | |
Portugal | | | — | | | | 4,851,516 | | | | — | | | | 4,851,516 | | |
Russia | | | — | | | | 23,164,923 | | | | — | | | | 23,164,923 | | |
Singapore | | | — | | | | 38,757,279 | | | | — | | | | 38,757,279 | | |
South Africa | | | — | | | | 84,678,314 | | | | — | | | | 84,678,314 | | |
South Korea | | | — | | | | 121,154,429 | | | | — | | | | 121,154,429 | | |
Spain | | | — | | | | 35,698,081 | | | | — | | | | 35,698,081 | | |
Sweden | | | — | | | | 115,280,271 | | | | — | | | | 115,280,271 | | |
Switzerland | | | — | | | | 78,479,247 | | | | — | | | | 78,479,247 | | |
Taiwan | | | 19,480,276 | | | | 72,214,488 | | | | — | | | | 91,694,764 | | |
Turkey | | | — | | | | 17,836,791 | | | | — | | | | 17,836,791 | | |
United Kingdom | | | — | | | | 472,838,009 | | | | — | | | | 472,838,009 | | |
United States | | | 37,376,443 | | | | — | | | | — | | | | 37,376,443 | | |
Total Common Stocks | | | 316,364,485 | | | | 1,917,090,343 | | | | — | | | | 2,233,454,828 | | |
Preferred Stocks | |
Brazil | | | 19,582,327 | | | | — | | | | — | | | | 19,582,327 | | |
Total | | $ | 335,946,812 | | | $ | 1,917,090,343 | | | $ | — | | | $ | 2,253,037,155 | | |
International Choice Fund
Investments in Securities | | Level 1 | | Level 2 | | Level 3 | | Total | |
Common Stocks | |
Australia | | $ | — | | | $ | 19,948,197 | | | $ | — | | | $ | 19,948,197 | | |
China | | | 11,850,457 | | | | 8,843,182 | | | | — | | | | 20,693,639 | | |
Denmark | | | — | | | | 17,018,762 | | | | — | | | | 17,018,762 | | |
France | | | — | | | | 10,189,960 | | | | — | | | | 10,189,960 | | |
Germany | | | — | | | | 3,697,984 | | | | — | | | | 3,697,984 | | |
Hong Kong | | | 1,808,030 | | | | 2,845,781 | | | | — | | | | 4,653,811 | | |
India | | | 5,314,217 | | | | — | | | | — | | | | 5,314,217 | | |
Israel | | | 605,947 | | | | — | | | | — | | | | 605,947 | | |
Italy | | | — | | | | 8,161,955 | | | | — | | | | 8,161,955 | | |
115
Notes to Financial Statements
Annual Report December 31, 2014
Investments in Securities | | Level 1 | | Level 2 | | Level 3 | | Total | |
Common Stocks | |
Japan | | $ | — | | | $ | 57,827,857 | | | $ | — | | | $ | 57,827,857 | | |
Mexico | | | 2,205,646 | | | | — | | | | — | | | | 2,205,646 | | |
New Zealand | | | — | | | | 3,347,456 | | | | — | | | | 3,347,456 | | |
Philippines | | | — | | | | 2,201,070 | | | | — | | | | 2,201,070 | | |
Singapore | | | — | | | | 12,869,072 | | | | — | | | | 12,869,072 | | |
South Africa | | | — | | | | 11,887,066 | | | | — | | | | 11,887,066 | | |
South Korea | | | 7,010,904 | | | | 6,310,402 | | | | — | | | | 13,321,306 | | |
Spain | | | — | | | | 12,757,018 | | | | — | | | | 12,757,018 | | |
Sweden | | | — | | | | 30,839,804 | | | | — | | | | 30,839,804 | | |
Switzerland | | | 7,132,613 | | | | 26,314,571 | | | | — | | | | 33,447,184 | | |
Taiwan | | | 13,313,459 | | | | — | | | | — | | | | 13,313,459 | | |
Turkey | | | 5,274,915 | | | | — | | | | — | | | | 5,274,915 | | |
United Kingdom | | | — | | | | 67,124,076 | | | | — | | | | 67,124,076 | | |
United States | | | 4,635,715 | | | | — | | | | — | | | | 4,635,715 | | |
Total Common Stocks | | | 59,151,903 | | | | 302,184,213 | | | | — | | | | 361,336,116 | | |
Preferred Stocks | |
Brazil | | | 2,929,462 | | | | — | | | | — | | | | 2,929,462 | | |
Total | | $ | 62,081,365 | | | $ | 302,184,213 | | | $ | — | | | $ | 364,265,578 | | |
EAFE Fund
Investments in Securities | | Level 1 | | Level 2 | | Level 3 | | Total | |
Common Stocks | |
Argentina | | $ | 31,955,801 | | | $ | — | | | $ | — | | | $ | 31,955,801 | | |
Australia | | | — | | | | 25,112,023 | | | | — | | | | 25,112,023 | | |
Chile | | | 10,581,228 | | | | — | | | | — | | | | 10,581,228 | | |
China | | | 188,418,167 | | | | 113,576,939 | | | | — | | | | 301,995,106 | | |
Denmark | | | — | | | | 85,477,208 | | | | — | | | | 85,477,208 | | |
France | | | — | | | | 137,872,117 | | | | — | | | | 137,872,117 | | |
Germany | | | 22,295,710 | | | | 55,966,030 | | | | — | | | | 78,261,740 | | |
Hong Kong | | | — | | | | 76,974,971 | | | | — | | | | 76,974,971 | | |
India | | | — | | | | 12,436,089 | | | | — | | | | 12,436,089 | | |
Ireland | | | — | | | | 35,834,073 | | | | — | | | | 35,834,073 | | |
Italy | | | — | | | | 174,091,828 | | | | — | | | | 174,091,828 | | |
Japan | | | — | | | | 247,661,701 | | | | — | | | | 247,661,701 | | |
Netherlands | | | — | | | | 29,405,042 | | | | — | | | | 29,405,042 | | |
Norway | | | — | | | | 25,502,005 | | | | — | | | | 25,502,005 | | |
Peru | | | 21,546,773 | | | | — | | | | — | | | | 21,546,773 | | |
Portugal | | | — | | | | 9,941,624 | | | | — | | | | 9,941,624 | | |
Russia | | | — | | | | 15,267,244 | | | | — | | | | 15,267,244 | | |
Singapore | | | — | | | | 13,145,702 | | | | — | | | | 13,145,702 | | |
116
Notes to Financial Statements
Annual Report December 31, 2014
Investments in Securities | | Level 1 | | Level 2 | | Level 3 | | Total | |
Common Stocks | |
South Korea | | $ | — | | | $ | 42,547,401 | | | $ | — | | | $ | 42,547,401 | | |
Spain | | | — | | | | 206,102,513 | | | | — | | | | 206,102,513 | | |
Sweden | | | 13,792,444 | | | | 219,117,329 | | | | — | | | | 232,909,773 | | |
Switzerland | | | — | | | | 116,973,580 | | | | — | | | | 116,973,580 | | |
Turkey | | | — | | | | 12,353,428 | | | | — | | | | 12,353,428 | | |
United Kingdom | | | — | | | | 267,278,793 | | | | — | | | | 267,278,793 | | |
Total Common Stocks | | | 288,590,123 | | | | 1,922,637,640 | | | | — | | | | 2,211,227,763 | | |
Preferred Stocks | |
Germany | | | — | | | | 8,637,134 | | | | — | | | | 8,637,134 | | |
Total Preferred Stocks | | | — | | | | 8,637,134 | | | | — | | | | 8,637,134 | | |
Total | | $ | 288,590,123 | | | $ | 1,931,274,774 | | | $ | — | | | $ | 2,219,864,897 | | |
EAFE Choice Fund
Investments in Securities | | Level 1 | | Level 2 | | Level 3 | | Total | |
Common Stocks | |
Australia | | $ | — | | | $ | 8,437,021 | | | $ | — | | | $ | 8,437,021 | | |
China | | | 3,973,743 | | | | 3,156,715 | | | | — | | | | 7,130,458 | | |
Denmark | | | — | | | | 7,352,269 | | | | — | | | | 7,352,269 | | |
France | | | — | | | | 5,760,763 | | | | — | | | | 5,760,763 | | |
Germany | | | — | | | | 1,453,846 | | | | — | | | | 1,453,846 | | |
Hong Kong | | | 895,751 | | | | 1,162,784 | | | | — | | | | 2,058,535 | | |
India | | | 2,209,683 | | | | — | | | | — | | | | 2,209,683 | | |
Israel | | | 253,250 | | | | — | | | | — | | | | 253,250 | | |
Italy | | | — | | | | 3,272,607 | | | | — | | | | 3,272,607 | | |
Japan | | | — | | | | 23,826,846 | | | | — | | | | 23,826,846 | | |
New Zealand | | | — | | | | 1,356,262 | | | | — | | | | 1,356,262 | | |
Singapore | | | — | | | | 5,311,498 | | | | — | | | | 5,311,498 | | |
South Africa | | | — | | | | 3,417,586 | | | | — | | | | 3,417,586 | | |
South Korea | | | 2,137,095 | | | | 1,432,791 | | | | — | | | | 3,569,886 | | |
Spain | | | — | | | | 4,308,495 | | | | — | | | | 4,308,495 | | |
Sweden | | | — | | | | 12,343,245 | | | | — | | | | 12,343,245 | | |
Switzerland | | | 3,812,788 | | | | 11,668,275 | | | | — | | | | 15,481,063 | | |
Taiwan | | | 4,288,527 | | | | — | | | | — | | | | 4,288,527 | | |
Turkey | | | — | | | | 1,421,926 | | | | — | | | | 1,421,926 | | |
United Kingdom | | | — | | | | 28,206,521 | | | | — | | | | 28,206,521 | | |
United States | | | 2,099,123 | | | | — | | | | — | | | | 2,099,123 | | |
Total Common Stocks | | | 19,669,960 | | | | 123,889,450 | | | | — | | | | 143,559,410 | | |
Preferred Stocks | |
Brazil | | | 1,236,327 | | | | — | | | | — | | | | 1,236,327 | | |
Total | | $ | 20,906,287 | | | $ | 123,889,450 | | | $ | — | | | $ | 144,795,737 | | |
117
Notes to Financial Statements
Annual Report December 31, 2014
Emerging Markets Fund
Investments in Securities | | Level 1 | | Level 2 | | Level 3 | | Total | |
Common Stocks | |
Argentina | | $ | 5,094,033 | | | $ | — | | | $ | — | | | $ | 5,094,033 | | |
Brazil | | | 18,462,575 | | | | — | | | | — | | | | 18,462,575 | | |
Cayman Islands | | | 1,307,780 | | | | — | | | | — | | | | 1,307,780 | | |
Chile | | | 2,934,848 | | | | — | | | | — | | | | 2,934,848 | | |
China | | | 27,739,979 | | | | 55,026,450 | | | | — | | | | 82,766,429 | | |
Egypt | | | — | | | | 7,208,241 | | | | — | | | | 7,208,241 | | |
Germany | | | 6,682,236 | | | | — | | | | — | | | | 6,682,236 | | |
India | | | — | | | | 89,208,317 | | | | — | | | | 89,208,317 | | |
Malaysia | | | — | | | | 6,754,705 | | | | — | | | | 6,754,705 | | |
Mexico* | | | 17,973,502 | | | | — | | | | — | | | | 17,973,502 | | |
Netherlands | | | 1,021,924 | | | | — | | | | — | | | | 1,021,924 | | |
South Africa | | | — | | | | 11,701,345 | | | | — | | | | 11,701,345 | | |
South Korea | | | 7,970,341 | | | | 79,192,669 | | | | — | | | | 87,163,010 | | |
Taiwan | | | — | | | | 97,010,270 | | | | — | | | | 97,010,270 | | |
Turkmenistan | | | 19,035,375 | | | | — | | | | — | | | | 19,035,375 | | |
United States | | | 4,598,092 | | | | — | | | | — | | | | 4,598,092 | | |
Total Common Stocks | | | 112,820,685 | | | | 346,101,997 | | | | — | | | | 458,922,682 | | |
Preferred Stocks | |
Brazil | | | 7,871,169 | | | | — | | | | — | | | | 7,871,169 | | |
South Korea | | | — | | | | 9,841,363 | | | | — | | | | 9,841,363 | | |
Total Preferred Stocks | | | 7,871,169 | | | | 9,841,363 | | | | — | | | | 17,712,532 | | |
Total | | $ | 120,691,854 | | | $ | 355,943,360 | | | $ | — | | | $ | 476,635,214 | | |
* Includes a Level 3 Security with a $0 fair market value.
Global Alpha Equity Fund
Investments in Securities | | Level 1 | | Level 2 | | Level 3 | | Total | |
Common Stocks | |
Argentina | | $ | 1,025,617 | | | $ | — | | | $ | — | | | $ | 1,025,617 | | |
Australia | | | — | | | | 5,557,920 | | | | — | | | | 5,557,920 | | |
Brazil | | | 2,592,378 | | | | — | | | | — | | | | 2,592,378 | | |
Canada | | | 14,839,045 | | | | — | | | | — | | | | 14,839,045 | | |
China | | | 20,354,478 | | | | 5,723,362 | | | | — | | | | 26,077,840 | | |
Denmark | | | — | | | | 7,925,237 | | | | — | | | | 7,925,237 | | |
Germany | | | — | | | | 9,432,037 | | | | — | | | | 9,432,037 | | |
Hong Kong | | | — | | | | 9,902,471 | | | | — | | | | 9,902,471 | | |
India | | | 7,247,625 | | | | — | | | | — | | | | 7,247,625 | | |
Ireland | | | 13,769,934 | | | | 11,487,833 | | | | — | | | | 25,257,767 | | |
Italy | | | — | | | | 3,817,938 | | | | — | | | | 3,817,938 | | |
118
Notes to Financial Statements
Annual Report December 31, 2014
Investments in Securities | | Level 1 | | Level 2 | | Level 3 | | Total | |
Common Stocks | |
Japan | | $ | — | | | $ | 43,244,836 | | | $ | — | | | $ | 43,244,836 | | |
Netherlands | | | 2,993,496 | | | | — | | | | — | | | | 2,993,496 | | |
Norway | | | — | | | | 10,346,226 | | | | — | | | | 10,346,226 | | |
Russia | | | — | | | | 1,455,450 | | | | — | | | | 1,455,450 | | |
Singapore | | | — | | | | 4,569,480 | | | | — | | | | 4,569,480 | | |
South Africa | | | — | | | | 20,089,256 | | | | — | | | | 20,089,256 | | |
South Korea | | | — | | | | 13,568,311 | | | | — | | | | 13,568,311 | | |
Spain | | | — | | | | 4,521,839 | | | | — | | | | 4,521,839 | | |
Sweden | | | — | | | | 18,971,660 | | | | — | | | | 18,971,660 | | |
Switzerland | | | — | | | | 37,343,285 | | | | — | | | | 37,343,285 | | |
Taiwan | | | 13,938,264 | | | | — | | | | — | | | | 13,938,264 | | |
Turkmenistan | | | 2,006,376 | | | | — | | | | — | | | | 2,006,376 | | |
United Kingdom | | | — | | | | 47,527,550 | | | | — | | | | 47,527,550 | | |
United States | | | 279,619,712 | | | | — | | | | — | | | | 279,619,712 | | |
Total | | $ | 358,386,925 | | | $ | 255,484,691 | | | $ | — | | | $ | 613,871,616 | | |
EAFE Pure Fund
Investments in Securities | | Level 1 | | Level 2 | | Level 3 | | Total | |
Common Stocks | |
Australia | | $ | — | | | $ | 2,751,993 | | | $ | — | | | $ | 2,751,993 | | |
China | | | 284,609 | | | | 541,473 | | | | — | | | | 826,082 | | |
Denmark | | | — | | | | 1,989,658 | | | | — | | | | 1,989,658 | | |
France | | | — | | | | 1,822,670 | | | | — | | | | 1,822,670 | | |
Germany | | | — | | | | 435,216 | | | | — | | | | 435,216 | | |
Israel | | | 83,536 | | | | — | | | | — | | | | 83,536 | | |
Italy | | | — | | | | 1,132,310 | | | | — | | | | 1,132,310 | | |
Japan | | | — | | | | 8,574,120 | | | | — | | | | 8,574,120 | | |
New Zealand | | | — | | | | 453,596 | | | | — | | | | 453,596 | | |
Singapore | | | — | | | | 2,129,325 | | | | — | | | | 2,129,325 | | |
Spain | | | — | | | | 1,513,591 | | | | — | | | | 1,513,591 | | |
Sweden | | | — | | | | 4,962,533 | | | | — | | | | 4,962,533 | | |
Switzerland | | | 1,259,808 | | | | 4,329,550 | | | | — | | | | 5,589,358 | | |
United Kingdom | | | — | | | | 9,444,903 | | | | — | | | | 9,444,903 | | |
United States | | | 1,149,720 | | | | — | | | | — | | | | 1,149,720 | | |
Total | | $ | 2,777,673 | | | $ | 40,080,938 | | | $ | — | | | $ | 42,858,611 | | |
119
Notes to Financial Statements
Annual Report December 31, 2014
Long Term Global Growth Fund
Investments in Securities | | Level 1 | | Level 2 | | Level 3 | | Total | |
Common Stocks | |
China | | $ | 3,617,726 | | | $ | 2,073,398 | | | $ | — | | | $ | 5,691,124 | | |
Denmark | | | — | | | | 718,537 | | | | — | | | | 718,537 | | |
France | | | — | | | | 1,746,225 | | | | — | | | | 1,746,225 | | |
Germany | | | 372,486 | | | | — | | | | — | | | | 372,486 | | |
Hong Kong | | | — | | | | 552,650 | | | | — | | | | 552,650 | | |
Spain | | | — | | | | 1,163,982 | | | | — | | | | 1,163,982 | | |
Sweden | | | — | | | | 598,808 | | | | — | | | | 598,808 | | |
United Kingdom | | | — | | | | 985,876 | | | | — | | | | 985,876 | | |
United States | | | 13,799,521 | | | | — | | | | — | | | | 13,799,521 | | |
Total | | $ | 17,789,733 | | | $ | 7,839,476 | | | $ | — | | | $ | 25,629,209 | | |
It is the Funds' policy to recognize transfers in and transfers out at the fair value as of the beginning of the period. The portfolio may hold securities which are periodically fair valued in accordance with the Funds' fair value procedures. This may result in movements between Levels 1, 2, and 3 throughout the period.
For the International Equity Fund fair value of Level 2 and Level 1 investments at December 31, 2013 was $2,194,347,328 and $301,817,826, respectively. $9,768,021 was transferred out of Level 2 into Level 1 and $17,150,391 was transferred out of Level 1 into Level 2 during the year ended December 31, 2014.
For the International Choice Fund fair value of Level 2 and Level 1 investments at December 31, 2013 was $232,612,335 and $43,398,118, respectively. $7,651,356 was transferred out of Level 2 into Level 1 and $7,832,010 was transferred out of Level 1 into Level 2 during the year ended December 31, 2014.
For the EAFE Fund fair value of Level 2 and Level 1 investments at December 31, 2013 was $2,089,839,075 and $330,530,505, respectively. $13,231,760 was transferred out of Level 2 into Level 1 and $25,834,780 was transferred out of Level 1 into Level 2 during the year ended December 31, 2014.
For the EAFE Choice Fund fair value of Level 2 and Level 1 investments at December 31, 2013 was $98,967,906 and $14,501,211, respectively. $2,128,481 was transferred out of Level 2 into Level 1 and $3,591,288 was transferred out of Level 1 to Level 2 during the year ended December 31, 2014.
For the Emerging Markets Fund fair value of Level 2 and Level 1 investments at December 31, 2013 was
$324,027,229 and $43,043,829, respectively. $31,310,268 was transferred out of Level 2 into Level 1 and $1,322,353 was transferred out of Level 1 into Level 2 during the year ended December 31, 2014.
For the Global Alpha Equity Fund fair value of Level 2 and Level 1 investments at December 31, 2013 was $179,757,292 and $233,618,651, respectively. $6,790,492 was transferred out of Level 2 into Level 1 during the year ended December 31, 2014.
These transfers were all as a result of using third-party vendor modeling tools to reflect any (lack of) significant market movements between the time at which the Funds valued their securities and the earlier closing of foreign markets. With regard to the transfers from Level 1 into Level 2, quotations were still obtained from the Funds' third party pricing vendor. Pursuant to the Funds' fair value procedures noted previously, equity securities (including exchange traded securities and open-end regulated investment companies) and exchange traded derivatives (i.e. futures contracts and options) are generally categorized as Level 1 or Level 2 securities in the fair value hierarchy. Fixed income securities, non-exchange traded derivatives and money market instruments are generally categorized as Level 2 securities in the fair value hierarchy. Investments for which there are no such quotations, or for which quotations do not appear reliable, are valued at fair value as determined in accordance with procedures established by and under the supervision of the Trustees. These valuations are typically categorized as Level 2 or Level 3 securities in the fair value hierarchy.
120
Notes to Financial Statements
Annual Report December 31, 2014
Derivative and Hedging Disclosure
GAAP requires qualitative disclosures about objectives and strategies for using derivatives, quantitative disclosures about fair value amounts of gains and losses on derivative instruments, and disclosures about credit-risk-related contingent features in derivative agreements. The Funds did not utilize derivatives for the year ended December 31, 2014.
Foreign Currency Translation
The accounting records of the Funds are maintained in U.S. dollars. Foreign currency amounts are translated into U.S. dollars at the applicable rate of exchange to determine the value of investments, assets and liabilities. For the Funds, purchases and sales of securities, and income and expenses are translated at the prevailing rate of exchange on the respective dates of such transactions. The Funds do not isolate that portion of net realized and unrealized gains and losses on investments resulting from changes in foreign exchange rates from the impact arising from changes in market prices. Such fluctuations are included with net realized and unrealized gain or loss from investments.
Net realized foreign exchange gains and losses arise from sales of foreign currencies, currency gains or losses realized between the trade and settlement dates on securities transactions, and the differences between the amounts of dividends, interest, and foreign withholding taxes recorded on the Funds' books and the U.S. dollar equivalent of the amounts actually received or paid. Net unrealized foreign exchange gains and losses arise from changes in the value of assets and liabilities, other than investments in securities, resulting from changes in the exchange rates.
Forward Foreign Currency Contracts
The Funds may enter into forward foreign currency contracts in connection with planned purchases or sales of securities, or to hedge against changes in currency exchange rates affecting the values of securities denominated in a particular currency. A forward exchange currency contract is a commitment to purchase or sell a foreign currency at a future date at a negotiated forward rate. Fluctuations in the value of forward foreign currency exchange contracts are recorded for book
purposes as unrealized gains or losses on foreign currency related transactions by a Fund. When forward contracts are closed, the Funds record realized gains or losses equal to the differences between the values of such forward contracts at the time each was opened and the value at the time each was closed. Such amounts are recorded in net realized gain or loss on foreign currency related transactions.
The Funds' maximum risk of loss from counterparty credit risk is the net value of the cash flows to be received from the counterparty at the end of the contract's life. This risk may be mitigated by having a master netting arrangement between the Funds and the counterparty which may permit the Funds to offset amounts payable by the Funds to the same counterparty against amounts to be received; and by the receipt of collateral from the counterparty by the Funds to cover the Funds' exposure to the counterparty. However, there is no assurance that such mitigating factors are easily enforceable.
The Funds may be party to financial instruments with off-balance-sheet risk, primarily forward contracts, in order to minimize the impact of adverse changes in the relationship between the U.S. dollar and various foreign currencies. These instruments involve market risk in excess of the amount recognized in the Statements of Assets and Liabilities. Risks arise from the possible inability of counter parties to meet the terms of their contracts, future adverse movement in currency values and contract positions that are not exact offsets. The contract amount indicates the extent of the Funds' involvement in such currencies. At December 31, 2014, the Funds did not have any forward foreign currency contracts.
Securities Transactions and Investment Income
The Funds' securities transactions are recorded on the trade date. Realized gains or losses on sales of investments are determined on the basis of identified cost. Dividend income is recorded on the ex-dividend date and interest income is recorded on an accrual basis.
Investment income, expenses (other than those specific to a particular class of shares), and realized and unrealized gains and losses on investments are allocated to the separate classes of shares based upon their relative net asset value on the date income is earned or expensed and realized and unrealized gains and losses are incurred.
121
Notes to Financial Statements
Annual Report December 31, 2014
Federal Taxes
Each Fund intends to continue to qualify to be taxed as a "regulated investment company" under the provisions of the U.S. Internal Revenue Code of 1986, as amended (the "Code"), and as such will not be subject to U.S. federal income tax on income (including any net realized capital gains) which is distributed in accordance with the provisions of the Code to the Funds' shareholders. Therefore, no U.S. federal income tax provision is required.
Investment income received from investments in foreign currencies may be subject to foreign withholding tax. Whenever possible, the Funds will attempt to operate so as to qualify for reduced tax rates or tax exemptions in those countries with which the United States has a tax treaty.
In addition to the requirements of the Code, the Funds may also be subject to capital gains tax in India on gains realized upon sale of Indian securities, payable upon repatriation of sales proceeds. Any realized losses in excess of gains may be carried forward to offset future gains. Funds with exposure to Indian securities accrue a deferred liability for unrealized gains in excess of available carryforwards on Indian securities based on existing tax rates and holding periods of the securities. As of December 31, 2014, the Emerging Markets Fund recorded a receivable for Indian capital gains tax refund of $206,948 and a deferred liability for potential future Indian capital gains taxes of $372,642.
The Funds are subject to tax accounting standards that provide guidance for how certain and uncertain tax positions should be recognized, measured, presented and disclosed in the financial statements. These standards require the evaluation of tax positions taken or expected to be taken in the course of preparing the Funds' tax returns to determine whether the tax positions are "more-likely-than-not" of being sustained by the applicable tax authority. Tax positions not deemed to meet the "more-likely-than-not" threshold would be recorded as a reduction in a tax benefit or expense in the current year. Management has evaluated the application of these standards and has determined no liabilities for income tax related expenses are required in the financial statements of the Funds. For the International Equity Fund, EAFE Fund, EAFE Choice Fund and Emerging Markets Fund the tax periods 2011 through present remain subject to examination by the Internal Revenue Service. For the Global Alpha Equity Fund, the tax periods 2013 through present remain subject to examination. For the International Choice Fund, the tax periods 2012 through the present remains subject to examination.
At December 31, 2014 for Federal income tax purposes, the following Funds had capital loss carryforwards available to offset future capital gains through the years indicated. To the extent that these loss carryforwards are utilized, capital gains so offset will not be distributed to shareholders.
| Fund | | Capital Loss
No Expiration | | Capital
Loss
Available
Total | |
International Equity | | $ | — | | | $ | — | | |
International Choice | | | — | | | | — | | |
EAFE | | | — | | | | — | | |
EAFE Choice | | | 1,249,803 | | | | 1,249,803 | | |
Emerging Markets | | | 12,415,672 | | | | 12,415,672 | | |
Global Alpha Equity | | | — | | | | — | | |
EAFE Pure | | | — | | | | — | | |
Long Term Global Growth Equity | | | — | | | | — | | |
The Regulated Investment Company Modernization Act of 2010 eliminated the eight-year carryover period for capital losses that arise in taxable years beginning after its enactment date of December 22, 2010. Consequently,
these capital losses can be carried forward for an unlimited period. However, capital losses with an expiration period may not be used to offset capital gains until all net capital losses without an expiration date have
122
Notes to Financial Statements
Annual Report December 31, 2014
been utilized. Additionally, post-enactment capital loss carryovers will retain their character as either short-term or long-term capital losses instead of as short-term
capital losses as under prior law. The amounts in the table below are characterized as short-term and long-term capital losses and have no expiration.
| Fund | | Short-Term
Capital Losses | | Long-Term
Capital Losses | |
International Equity | | $ | — | | | $ | — | | |
International Choice | | | — | | | | — | | |
EAFE | | | — | | | | — | | |
EAFE Choice | | | 1,249,803 | | | | — | | |
Emerging Markets | | | 12,415,672 | | | | — | | |
Global Alpha Equity | | | — | | | | — | | |
EAFE Pure | | | — | | | | — | | |
Long Term Global Growth Equity | | | — | | | | — | | |
Realized capital losses, currency losses and passive foreign investment company ("PFIC") losses incurred after October 31 ("post-October losses/Late-Year Specified") within the taxable year are deemed to arise on the first business day of each Fund's next taxable
year. During the year ended December 31, 2014, the Funds shown below incurred and will elect to defer net post-October losses as indicated.
At December 31, 2014, the components of accumulated earnings on tax basis were as follows:
| Fund | | Undistributed
Net Ordinary
Income | | Long Term
Capital
Gains | | Capital
Loss
Carryforwards | | Post October
Capital/Currency
Losses | | Net Unrealized
Appreciation
(Depreciation)
on
Investments
and Foreign
Currencies | | Total
Accumulated
Earnings | |
International Equity | | $ | 2,767,528 | | | $ | — | | | $ | — | | | $ | (8,614,511 | ) | | $ | 443,861,176 | | | $ | 438,014,193 | | |
International Choice | | | — | | | | — | | | | — | | | | (410,046 | ) | | | 3,662,118 | | | | 3,252,072 | | |
EAFE | | | 101,094 | | | | 13,726,475 | | | | — | | | | — | | | | 583,269,950 | | | | 597,097,519 | | |
EAFE Choice | | | — | | | | — | | | | (1,249,803 | ) | | | (197,116 | ) | | | 9,319,249 | | | | 7,872,330 | | |
Emerging Markets | | | 4,012,193 | | | | — | | | | (12,415,672 | ) | | | (9,866,908 | ) | | | 81,462,494 | | | | 63,192,107 | | |
Global Alpha Equity | | | — | | | | 4,538,129 | | | | — | | | | (2,970 | ) | | | 93,055,108 | | | | 97,590,267 | | |
EAFE Pure | | | 9,290 | | | | — | | | | — | | | | (80,793 | ) | | | (2,988,594 | ) | | | (3,060,097 | ) | |
Long Term Global
Growth Equity | | | 165,887 | | | | — | | | | — | | | | — | | | | 904,978 | | | | 1,070,865 | | |
The differences between the components of distributable earnings on a tax basis and the amounts reflected in the Statements of Assets and Liabilities are primarily due to the differing book/tax treatment of realized losses on wash sales and mark to market income on securities categorized as PFICs.
For the year ended December 31, 2014, the following reclassifications have been made on the Statements of Assets and Liabilities as a result of certain differences in the computation of net investment income and net realized capital gains under U.S. federal income tax rules and regulations versus GAAP, such as the treatment of foreign currency gains and losses and the redesignation of dividends.
123
Notes to Financial Statements
Annual Report December 31, 2014
Fund | | Undistributed
(Distributions in
Excess of) Net
Investment Income | | Accumulated Net
Realized Gains
(Losses) on
Investments and
Foreign Currency
Transactions | | Paid-in
Capital | |
International Equity | | $ | (720,814 | ) | | $ | 720,814 | | | $ | — | | |
International Choice | | | (76,737 | ) | | | 166,405 | | | | (89,668 | ) | |
EAFE | | | 125,831 | | | | (125,831 | ) | | | — | | |
EAFE Choice | | | 177,250 | | | | (139,332 | ) | | | (37,918 | ) | |
Emerging Markets | | | (65,947 | ) | | | 65,947 | | | | — | | |
Global Alpha Equity | | | 1,541,679 | | | | (1,541,679 | ) | | | — | | |
EAFE Pure | | | (139,870 | ) | | | 139,870 | | | | — | | |
Long Term Global Growth Equity | | | 83,723 | | | | (83,723 | ) | | | — | | |
Dividends and Distributions to Shareholders
The Funds intend to distribute each year, as dividends, substantially all net investment income and net capital gains realized. All such dividends or distributions are credited in the form of additional shares of the Funds at net asset value on the ex-dividend date unless the
shareholder elects to receive dividends and distributions in cash. Currently, the Funds' policies are to distribute net investment income and net capital gains on an annual basis. Such distributions are determined in conformity with U.S. federal income tax regulations, which may differ from GAAP.
For the years or periods ended December 31, 2014 and December 31, 2013, the tax characters of the dividends paid were:
| Fund | | Ordinary
Income
2014 | | Return of
Capital
2014 | | Ordinary
Income
2013 | | Long Term
Capital Gains
2014 | | Long Term
Capital Gains
2013 | |
International Equity | | $ | 40,475,196 | | | $ | — | | | $ | 41,703,719 | | | $ | 9,769,981 | | | $ | — | | |
International Choice | | | 8,177,435 | | | | 89,668 | | | | 2,140,285 | | | | 878,395 | | | | | | |
EAFE | | | 29,304,527 | | | | — | | | | 27,498,264 | | | | 87,989,601 | | | | — | | |
EAFE Choice | | | 1,637,245 | | | | 37,918 | | | | 3,508,047 | | | | — | | | | — | | |
Emerging Markets | | | 719,470 | | | | — | | | | 6,418,863 | | | | — | | | | — | | |
Global Alpha Equity | | | 7,018,819 | | | | — | | | | 8,122,250 | | | | 24,502,597 | | | | 6,379,684 | | |
EAFE Pure | | | 282,881 | | | | — | | | | — | | | | — | | | | — | | |
Long Term Global Growth Equity | | | 23,988 | | | | — | | | | — | | | | — | | | | — | | |
For tax purposes, short-term capital gain distributions, if any, are considered ordinary income distributions.
Note B — Investment Management and Other Services
The Funds are advised and managed by Baillie Gifford Overseas Limited (the "Manager"). The Manager, an investment adviser registered with the Securities and Exchange Commission (the "SEC"), is a wholly owned subsidiary of Baillie Gifford & Co.
Under an investment advisory agreement between the Manager and the Trust on behalf of the Funds, each Fund paid the Manager a quarterly management fee, in arrears, at the following annual rate of the respective Fund's average net assets. Peter Hadden is an officer and trustee of the Funds and also an officer and director of the Manager.
124
Notes to Financial Statements
Annual Report December 31, 2014
Fund | | Management Fee | |
| International Equity* | | | 0.25 | % | |
| International Choice* | | | 0.25 | % | |
| EAFE* | | | 0.25 | % | |
| EAFE Choice* | | | 0.25 | % | |
| Emerging Markets* | | | 0.50 | % | |
| Global Alpha Equity* | | | 0.30 | % | |
| EAFE Pure* | | | 0.25 | % | |
| Long Term Global Growth Equity** | | | 0.45 | % | |
* New rate change effective January 1, 2015. See note G subsequent events.
** Change effective October 1, 2014. Note previous rate of .50%.
For the year or periods ended December 31, 2014, the Funds incurred management fees as follows:
Fund | | Management Fee | | Management Fees
Waived/Expenses
Reimbursed | |
International Equity | | $ | 6,112,336 | | | $ | — | | |
International Choice | | | 931,433 | | | | — | | |
EAFE | | | 5,931,630 | | | | — | | |
EAFE Choice | | | 338,032 | | | | — | | |
Emerging Markets | | | 2,263,759 | | | | — | | |
Global Alpha Equity | | | 1,690,959 | | | | — | | |
EAFE Pure(a) | | | 81,284 | | | | (9,035 | ) | |
Long Term Global Growth Equity(b) | | | 69,881 | | | | (11,458 | ) | |
(a) Class 2 has an expense cap of 0.67%.
(b) Class 2 had an expense cap of 0.82% up to October 1, 2014. After October 1, 2014 the expense cap changed to 0.77%.
Each Fund has adopted a Shareholder Servicing Plan providing that the Fund may pay the Manager, or any other entity that acts from time to time as the shareholder servicing agent with respect to a class of Fund shares, for services rendered and expenses borne in connection with the provision of services provided to Fund investors
and/or the maintenance of shareholder accounts. For these services, the Funds paid the Manager a fee at the annualized rate of the Funds' average daily net assets attributed to each class of share as of December 31, 2014 as follows:
| | | International
Equity | | International
Choice | | EAFE | | EAFE
Choice | | Emerging
Markets | | Global Alpha
Equity | | EAFE Pure | | Long Term
Global
Growth
Equity | |
Class 1/Class I | | | 0.45 | % | | | 0.45 | % | | | 0.45 | % | | | 0.45 | % | | | 0.30 | % | | | 0.45 | % | | | 0.45 | % | | | 0.25 | % | |
Class 2/Class II | | | 0.27 | % | | | 0.27 | % | | | 0.27 | % | | | 0.27 | % | | | 0.25 | % | | | 0.27 | % | | | 0.27 | % | | | 0.17 | % | |
Class 3/Class III | | | 0.20 | % | | | 0.20 | % | | | 0.20 | % | | | 0.20 | % | | | 0.10 | % | | | 0.20 | % | | | 0.20 | % | | | 0.10 | % | |
Class 4 | | | 0.17 | % | | | 0.17 | % | | | 0.17 | % | | | 0.17 | % | | | N/A | | | | 0.17 | % | | | 0.17 | % | | | 0.07 | % | |
Class 5 | | | 0.12 | % | | | 0.12 | % | | | 0.12 | % | | | 0.12 | % | | | N/A | | | | 0.12 | % | | | 0.12 | % | | | 0.02 | % | |
125
Notes to Financial Statements
Annual Report December 31, 2014
For the year or period ended December 31, 2014, the Funds incurred shareholder servicing fees for each class of shares as follows:
| | | International
Equity | | International
Choice | | EAFE | | EAFE
Choice | | Emerging
Markets | | Global Alpha
Equity | | EAFE Pure | | Long Term
Global
Growth
Equity | |
Class 1 | | $ | 106,213 | | | $ | 54,846 | | | $ | 3,864 | * | | $ | 90,432 | | | | N/A | | | | N/A | | | | N/A | | | | N/A | | |
Class 2 | | | 1,436,283 | | | | 673,979 | | | | 2,187,304 | | | | 287,757 | | | | 8,207 | * | | | 375,945 | | | | 87,787 | | | | 24,882 | | |
Class 3 | | | 2,472,481 | | | | 221,526 | | | | 1,029,677 | | | | 17,082 | | | | 449,469 | | | | 848,828 | | | | N/A | | | | N/A | | |
Class 4 | | | 728,366 | | | | N/A | | | | 366,799 | | | | N/A | | | | N/A | | | | N/A | | | | N/A | | | | N/A | | |
Class 5 | | | 269,621 | | | | N/A | | | | 997,293 | | | | N/A | | | | N/A | | | | N/A | | | | N/A | | | | N/A | | |
* Shares were redeemed in full during the past year.
Note C — Investment Transactions
Purchases and proceeds from sales of securities (excluding in-kind purchases and redemptions and short-term securities) for the year ended December 31, 2014 were as follows:
Fund | | Purchases | | Sales | |
International Equity | | $ | 272,617,699 | | | $ | 395,055,665 | | |
International Choice | | | 135,995,580 | | | | 33,473,731 | | |
EAFE | | | 419,299,397 | | | | 423,994,906 | | |
EAFE Choice | | | 71,100,231 | | | | 30,040,514 | | |
Emerging Markets | | | 233,391,250 | | | | 115,832,430 | | |
Global Alpha Equity | | | 321,418,442 | | | | 140,849,804 | | |
EAFE Pure | | | 48,296,095 | | | | 2,420,256 | | |
Long Term Global Growth Equity | | | 26,511,142 | | | | 2,059,882 | | |
The Funds' cost of investments and gross unrealized appreciation (depreciation) at December 31, 2014 for U.S. federal income tax purposes were as follows:
Fund | | Cost of
Investments | | Gross
Appreciation | | Gross
Depreciation | | Net
Appreciation
(Depreciation) | |
International Equity | | $ | 1,808,982,051 | | | $ | 608,816,457 | | | $ | (164,761,353 | ) | | $ | 444,055,104 | | |
International Choice | | | 360,578,720 | | | | 36,089,207 | | | | (32,402,349 | ) | | | 3,686,858 | | |
EAFE | | | 1,636,441,607 | | | | 755,214,784 | | | | (171,791,494 | ) | | | 583,423,290 | | |
EAFE Choice | | | 135,449,335 | | | | 21,195,349 | | | | (11,848,947 | ) | | | 9,346,402 | | |
Emerging Markets | | | 394,760,385 | | | | 112,726,150 | | | | (30,851,321 | ) | | | 81,874,829 | | |
Global Alpha Equity | | | 520,792,779 | | | | 121,688,645 | | | | (28,609,808 | ) | | | 93,078,837 | | |
EAFE Pure | | | 45,845,904 | | | | 1,632,284 | | | | (4,619,577 | ) | | | (2,987,293 | ) | |
Long Term Global Growth Equity | | | 24,724,221 | | | | 2,074,103 | | | | (1,169,115 | ) | | | 904,988 | | |
126
Notes to Financial Statements
Annual Report December 31, 2014
Note D — Transactions in Shares of Beneficial Interest
| | | International Equity Fund | |
| | | Class 1 Shares
For the
Year Ended
December 31, 2014 | | Class 2 Shares
For the
Year Ended
December 31, 2014 | |
| | | Shares | | Amount | | Shares | | Amount | |
Shares sold | | | 22,544 | | | $ | 255,949 | | | | 11,613,043 | | | $ | 136,831,273 | | |
Purchase premiums | | | — | | | | 3,626 | | | | — | | | | 67,788 | | |
Redemption fees | | | — | | | | 5,368 | | | | — | | | | 122,868 | | |
Shares issued in reinvestment of dividends and distributions | | | — | | | | — | | | | 1,035,276 | | | | 11,746,437 | | |
Shares redeemed | | | (713,734 | ) | | | (8,566,950 | ) | | | (18,208,701 | ) | | | (211,341,046 | ) | |
Net decrease | | | (691,190 | ) | | $ | (8,302,007 | ) | | | (5,560,382 | ) | | $ | (62,572,680 | ) | |
| | | International Equity Fund | |
| | | Class 3 Shares
For the
Year Ended
December 31, 2014 | | Class 4 Shares
For the
Year Ended
December 31, 2014 | |
| | | Shares | | Amount | | Shares | | Amount | |
Shares sold | | | 18,794,822 | | | $ | 220,966,910 | | | | 4,642,038 | | | $ | 54,835,000 | | |
Purchase premiums | | | — | | | | 179,891 | | | | — | | | | 72,418 | | |
Redemption fees | | | — | | | | 306,728 | | | | — | | | | 106,695 | | |
Shares issued in reinvestment of dividends and distributions | | | 2,072,763 | | | | 23,814,848 | | | | 657,222 | | | | 7,722,552 | | |
Shares redeemed | | | (32,031,621 | ) | | | (380,295,118 | ) | | | (25,018,860 | ) | | | (304,629,645 | ) | |
Net decrease | | | (11,164,036 | ) | | $ | (135,026,741 | ) | | | (19,719,600 | ) | | $ | (241,892,980 | ) | |
| | | International Equity Fund | |
| | Class 5 Shares
For the Period
April 7, 2014*
through
12/31/2014 | |
| | | Shares | | Amount | |
Shares sold | | | 24,867,726 | | | $ | 304,629,645 | | |
Purchase premiums | | | — | | | | 18,147 | | |
Redemption fees | | | — | | | | 47,408 | | |
Shares issued in reinvestment of dividends and distributions | | | 558,103 | | | | 6,597,607 | | |
Shares redeemed | | | — | | | | — | | |
Net increase | | | 25,425,829 | | | $ | 311,292,807 | | |
* Commencement of investment operations.
127
Notes to Financial Statements
Annual Report December 31, 2014
| | International Equity Fund | |
| | Class 1 Shares
For the
Year Ended
December 31, 2013 | | Class 2 Shares
For the
Year Ended
December 31, 2013 | |
| | Shares | | Amount | | Shares | | Amount | |
Shares sold | | | 61,435 | | | $ | 681,659 | | | | 8,340,648 | | | $ | 91,672,424 | | |
Purchase premiums | | | — | | | | 9,434 | | | | — | | | | 102,972 | | |
Redemption fees | | | — | | | | 2,939 | | | | — | | | | 32,530 | | |
Shares issued in reinvestment of dividends and distributions | | | 15,399 | | | | 177,440 | | | | 889,432 | | | | 10,361,979 | | |
Shares redeemed | | | (3,720,398 | ) | | | (41,887,651 | ) | | | (20,833,739 | ) | | | (226,837,755 | ) | |
Net decrease | | | (3,643,564 | ) | | $ | (41,016,179 | ) | | | (11,603,659 | ) | | $ | (124,667,850 | ) | |
| | International Equity Fund | |
| | Class 3 Shares
For the
Year Ended
December 31, 2013 | | Class 4 Shares
For the
Year Ended
December 31, 2013 | |
| | Shares | | Amount | | Shares | | Amount | |
Shares sold | | | 25,042,293 | | | $ | 276,657,991 | | | | 4,196,981 | | | $ | 49,900,000 | | |
Purchase premiums | | | — | | | | 160,708 | | | | — | | | | 81,798 | | |
Redemption fees | | | — | | | | 49,264 | | | | — | | | | 25,715 | | |
Shares issued in reinvestment of dividends and distributions | | | 1,765,855 | | | | 20,845,482 | | | | 832,318 | | | | 10,043,073 | | |
Shares redeemed | | | (2,501,174 | ) | | | (26,039,059 | ) | | | (3,199,810 | ) | | | (35,218,367 | ) | |
Net increase | | | 24,306,974 | | | $ | 271,674,386 | | | | 1,829,489 | | | $ | 24,832,219 | | |
| | | International Choice Fund | |
| | | Class 1 Shares
For the Period
April 9, 2014*
through
December 31, 2014 | | Class 2 Shares
For the
Year Ended
December 31, 2014 | |
| | | Shares | | Amount | | Shares | | Amount | |
Shares sold | | | 1,365,731 | | | $ | 16,949,000 | | | | 7,104,551 | | | $ | 83,102,298 | | |
Purchase premiums | | | — | | | | 2,204 | | | | — | | | | 158,176 | | |
Redemption fees | | | — | | | | 174 | | | | — | | | | 3,597 | | |
Shares issued in reinvestment of dividends and distributions | | | 32,080 | | | | 370,694 | | | | 521,832 | | | | 6,089,979 | | |
Shares redeemed | | | — | | | | — | | | | (250,607 | ) | | | (3,001,502 | ) | |
Net increase | | | 1,397,811 | | | $ | 17,322,072 | | | | 7,375,776 | | | $ | 86,352,548 | | |
* Commencement of investments operations.
128
Notes to Financial Statements
Annual Report December 31, 2014
| | | International Choice Fund | |
| | | Class 3 Shares
For the
Year Ended
December 31, 2014 | |
| | | Shares | | Amount | |
Shares sold | | | — | | | $ | — | | |
Purchase premiums | | | — | | | | 72,187 | | |
Redemption fees | | | — | | | | 1,732 | | |
Shares issued in reinvestment of dividends and distributions | | | 227,721 | | | | 2,684,825 | | |
Net increase | | | 227,721 | | | $ | 2,758,744 | | |
| | International Choice Fund | |
| | Class 1 Shares
For the Period
January 1, 2013
through
April 9, 2013* | | Class 2 Shares
For the Period
April 9, 2013**
through
December 31, 2013 | |
| | Shares | | Amount | | Shares | | Amount | |
Shares sold | | | — | | | $ | — | | | | 13,808,255 | | | $ | 156,103,614 | | |
Purchase premiums | | | — | | | | — | | | | — | | | | 140,612 | | |
Shares issued in reinvestment of dividends and distributions | | | — | | | | — | | | | 102,664 | | | | 1,243,112 | | |
Shares redeemed | | | (2,403,571 | ) | | | (26,363,614 | ) | | | — | | | | — | | |
Net increase (decrease) | | | (2,403,571 | ) | | $ | (26,363,614 | ) | | | 13,910,919 | | | $ | 157,487,338 | | |
* International Choice Fund Class 1 was redeemed on April 9, 2013.
** Commencement of investments operations.
| | International Choice Fund | |
| | Class 3 Shares
For the Period
May 1, 2013**
through
December 31, 2013 | |
| | Shares | | Amount | |
Shares sold | | | 8,829,014 | | | $ | 101,519,199 | | |
Purchase premiums | | | — | | | | 141,798 | | |
Shares issued in reinvestment of dividends and distributions | | | 73,376 | | | | 897,173 | | |
Net increase | | | 8,902,390 | | | $ | 102,558,170 | | |
** Commencement of investments operations.
129
Notes to Financial Statements
Annual Report December 31, 2014
| | EAFE Fund | |
| | | Class 1 Shares
For the
Year Ended
December 31, 2014 | | Class 2 Shares
For the
Year Ended
December 31, 2014 | |
| | | Shares | | Amount | | Shares | | Amount | |
Shares sold | | | — | | | $ | — | | | | 3,704,676 | | | $ | 45,528,771 | | |
Purchase premiums | | | — | | | | — | | | | — | | | | 21,985 | | |
Redemption fees | | | — | | | | — | | | | — | | | | 47,221 | | |
Shares issued in reinvestment of dividends and distributions | | | — | | | | — | | | | 3,373,022 | | | | 38,035,551 | | |
Shares redeemed | | | (2,081,948 | ) | | | (26,371,394 | ) | | | (5,002,148 | ) | | | (62,864,979 | ) | |
Net increase (decrease) | | | (2,081,948 | ) | | $ | (26,371,394 | ) | | | 2,075,550 | | | $ | 20,768,549 | | |
| | | EAFE Fund | |
| | | Class 3 Shares
For the
Year Ended
December 31, 2014 | | Class 4 Shares
For the
Year Ended
December 31, 2014 | | Class 5 Shares
For the
Year Ended
December 31, 2014 | |
| | | Shares | | Amount | | Shares | | Amount | | Shares | | Amount | |
Shares sold | | | 190,672 | | | $ | 2,346,938 | | | | — | | | $ | — | | | | — | | | $ | — | | |
Purchase premiums | | | — | | | | 14,081 | | | | — | | | | 5,903 | | | | — | | | | 22,738 | | |
Redemption fees | | | — | | | | 30,074 | | | | — | | | | 12,616 | | | | — | | | | 48,592 | | |
Shares issued in reinvestment of dividends
and distributions | | | 2,259,637 | | | | 25,533,668 | | | | 953,161 | | | | 10,785,022 | | | | 3,697,507 | | | | 41,885,735 | | |
Shares redeemed | | | (655,116 | ) | | | (8,013,523 | ) | | | — | | | | — | | | | — | | | | — | | |
Net increase | | | 1,795,193 | | | $ | 19,911,238 | | | | 953,161 | | | $ | 10,803,541 | | | | 3,697,507 | | | $ | 41,957,065 | | |
| | EAFE Fund | |
| | Class 1 Shares
For the
Year Ended
December 31, 2013 | | Class 2 Shares
For the
Year Ended
December 31, 2013 | |
| | Shares | | Amount | | Shares | | Amount | |
Shares sold | | | — | | | $ | — | | | | 4,147,779 | | | $ | 47,777,796 | | |
Purchase premiums | | | — | | | | 2,951 | | | | — | | | | 51,231 | | |
Redemption fees | | | — | | | | 8,131 | | | | — | | | | 147,441 | | |
Shares issued in reinvestment of dividends and distributions | | | 18,721 | | | | 233,655 | | | | 624,383 | | | | 7,780,515 | | |
Shares redeemed | | | (2,378,880 | ) | | | (27,717,996 | ) | | | (33,756,500 | ) | | | (360,935,125 | ) | |
Net decrease | | | (2,360,159 | ) | | $ | (27,473,259 | ) | | | (28,984,338 | ) | | $ | (305,178,142 | ) | |
130
Notes to Financial Statements
Annual Report December 31, 2014
| | EAFE Fund | |
| | Class 3 Shares
For the
Year Ended
December 31, 2013 | | Class 4 Shares
For the Period
October 10, 2013*
through
December 31, 2013 | | Class 5 Shares
For the
Year Ended
December 31, 2013 | |
| | Shares | | Amount | | Shares | | Amount | | Shares | | Amount | |
Shares sold | | | 20,109,528 | | | $ | 217,132,949 | | | | 17,258,589 | | | $ | 201,540,630 | | | | 4,178,915 | | | $ | 49,900,000 | | |
Purchase premiums | | | — | | | | 36,622 | | | | — | | | | 1,789 | | | | — | | | | 47,607 | | |
Redemption fees | | | — | | | | 105,792 | | | | — | | | | 4,975 | | | | — | | | | 125,165 | | |
Shares issued in reinvestment of dividends
and distributions | | | 475,961 | | | | 5,941,859 | | | | 198,722 | | | | 2,487,636 | | | | 807,270 | | | | 10,105,932 | | |
Shares redeemed | | | (28,150,611 | ) | | | (318,740,539 | ) | | | — | | | | — | | | | — | | | | — | | |
Net increase (decrease) | | | (7,565,122 | ) | | $ | (95,523,317 | ) | | | 17,457,311 | | | $ | 204,035,030 | | | | 4,986,185 | | | $ | 60,178,704 | | |
* Commencement of investment operations.
| | | EAFE Choice Fund | |
| | | Class 1 Shares
For the
Year Ended
December 31, 2014 | | Class 2 Shares
For the
Year Ended
December 31, 2014 | |
| | | Shares | | Amount | | Shares | | Amount | |
Shares sold | | | — | | | $ | — | | | | 4,465,602 | | | $ | 61,146,066 | | |
Purchase premiums | | | — | | | | 26,546 | | | | — | | | | 165,327 | | |
Redemption fees | | | — | | | | 9,582 | | | | — | | | | 36,836 | | |
Shares issued in reinvestment of dividends and distributions | | | 14,886 | | | | 186,113 | | | | 100,267 | | | | 1,264,099 | | |
Shares redeemed | | | — | | | | — | | | | (2,930,025 | ) | | | (40,487,027 | ) | |
Net increase | | | 14,886 | | | $ | 222,241 | | | | 1,635,844 | | | $ | 22,125,301 | | |
| | | EAFE Choice Fund | |
| | | Class 3 Shares
For the period
July 7, 2014
through
December 31, 2014* | |
| | | Shares | | Amount | |
Shares sold | | | 1,481,333 | | | $ | 20,531,631 | | |
Purchase premiums | | | — | | | | 1,586 | | |
Redemption fees | | | — | | | | 10 | | |
Shares issued in reinvestment of dividends and distributions | | | 17,692 | | | | 224,951 | | |
Shares redeemed | | | (3,324 | ) | | | (45,090 | ) | |
Net increase | | | 1,495,701 | | | $ | 20,713,088 | | |
* There were no shareholders for the period January 1, 2014 through July 6, 2014.
131
Notes to Financial Statements
Annual Report December 31, 2014
| | EAFE Choice Fund | |
| | Class 1 Shares
For the Period
12/17/2013*
through
December 31, 2013 | | Class 2 Shares
For the
Year Ended
December 31, 2013 | | Class 3 Shares
For the Period
January 1, 2013
through
April 16, 2013** | |
| | Shares | | Amount | | Shares | | Amount | | Shares | | Amount | |
Shares sold | | | 1,496,874 | | | $ | 19,159,986 | | | | 2,472,715 | | | $ | 29,551,683 | | | | 8,004,328 | | | $ | 90,951,574 | | |
Purchase premiums | | | — | | | | 6,680 | | | | — | | | | 31,967 | | | | — | | | | — | | |
Redemption fees | | | — | | | | — | | | | — | | | | 40,517 | | | | — | | | | 14,152 | | |
Shares issued in reinvestment of dividends
and distributions | | | 39,351 | | | | 509,094 | | | | 230,706 | | | | 2,998,953 | | | | — | | | | — | | |
Shares redeemed | | | — | | | | — | | | | (9,416,270 | ) | | | (107,856,932 | ) | | | (10,459,784 | ) | | | (125,975,781 | ) | |
Net increase (decrease) | | | 1,536,225 | | | $ | 19,675,760 | | | | (6,712,849 | ) | | $ | (75,233,812 | ) | | | (2,455,456 | ) | | $ | (35,010,055 | ) | |
* Commencement of investment operations.
** EAFE Choice Fund Class 3 was redeemed on April 16, 2013.
| | | Emerging Markets Fund | |
| | Class II Shares
For the Period
January 1, 2014
through
June 9, 2014* | | Class III Shares
For the
Year Ended
December 31, 2014 | |
| | | Shares | | Amount | | Shares | | Amount | |
Shares sold | | | 559,872 | | | $ | 9,232,291 | | | | 10,924,314 | | | $ | 186,487,716 | | |
Purchase premiums | | | — | | | | 9,767 | | | | — | | | | 470,589 | | |
Redemption fees | | | — | | | | 643 | | | | — | | | | 59,170 | | |
Shares issued in reinvestment of dividends and distributions | | | — | | | | — | | | | 39,176 | | | | 719,470 | | |
Shares redeemed | | | (3,648,913 | ) | | | (59,760,469 | ) | | | (981,162 | ) | | | (16,328,088 | ) | |
Net increase (decrease) | | | (3,089,041 | ) | | $ | (50,517,768 | ) | | | 9,982,328 | | | $ | 171,408,857 | | |
* Emerging Market Fund Class II was redeemed on June 9, 2014.
| | Emerging Markets Fund | |
| | Class II Shares
For the Period
April 9, 2013*
through
December 31, 2013 | | Class III Shares
For the
Year Ended
December 31, 2013 | |
| | Shares | | Amount | | Shares | | Amount | |
Shares sold | | | 3,031,676 | | | $ | 47,294,135 | | | | — | | | $ | — | | |
Purchase premiums | | | — | | | | — | | | | — | | | | — | | |
Redemption fees | | | — | | | | 34,688 | | | | — | | | | 285,790 | | |
Shares issued in reinvestment of dividends and distributions | | | 57,365 | | | | 880,017 | | | | 264,017 | | | | 4,102,273 | | |
Shares redeemed | | | — | | | | — | | | | (11,199,952 | ) | | | (175,485,293 | ) | |
Net increase (decrease) | | | 3,089,041 | | | $ | 48,208,840 | | | | (10,935,935 | ) | | $ | (171,097,230 | ) | |
* Commencement of investment operations.
132
Notes to Financial Statements
Annual Report December 31, 2014
| | | Global Alpha Equity Fund | |
| | | Class 2 Shares
For the
Year Ended
December 31, 2014 | | Class 3 Shares
For the
Year Ended
December 31, 2014 | |
| | | Shares | | Amount | | Shares | | Amount | |
Shares sold | | | 6,042,155 | | | $ | 88,622,400 | | | | 9,808,974 | | | $ | 139,720,000 | | |
Purchase premiums | | | — | | | | 114,452 | | | | — | | | | 343,148 | | |
Redemption fees | | | — | | | | 17,680 | | | | — | | | | 54,051 | | |
Shares issued in reinvestment of dividends and distributions | | | 729,080 | | | | 10,382,509 | | | | 1,455,220 | | | | 21,138,906 | | |
Shares redeemed | | | — | | | | — | | | | (3,285,458 | ) | | | (47,820,230 | ) | |
Net increase | | | 6,771,235 | | | $ | 99,137,041 | | | | 7,978,736 | | | $ | 113,435,875 | | |
| | Global Alpha Equity Fund | |
| | Class 1 Shares
For the Period
January 3, 2013
through
July 9, 2013** | | Class 2 Shares
For the Period
January 3, 2013*
through
December 31, 2013 | |
| | Shares | | Amount | | Shares | | Amount | |
Shares sold | | | 25,033 | | | $ | 299,481 | | | | 8,676,328 | | | $ | 103,403,236 | | |
Purchase premiums | | | — | | | | 11,713 | | | | — | | | | 28,494 | | |
Redemption fees | | | — | | | | — | | | | — | | | | 3,002 | | |
Shares issued in reinvestment of dividends and distributions | | | — | | | | — | | | | 295,638 | | | | 4,137,986 | | |
Shares redeemed | | | (2,070,805 | ) | | | (25,780,688 | ) | | | (497,171 | ) | | | (7,010,597 | ) | |
Net increase (decrease) | | | (2,045,772 | ) | | $ | (25,469,494 | ) | | | 8,474,795 | | | $ | 100,562,121 | | |
* Commencement of investment operations.
** Global Alpha Equity Fund Class 1 was redeemed on July 9, 2013.
| | Global Alpha Equity Fund | |
| | Class 3 Shares
For the
Year Ended
December 31, 2013 | |
| | Shares | | Amount | |
Shares sold | | | 122,034 | | | $ | 1,497,000 | | |
Purchase premiums | | | — | | | | 118,949 | | |
Redemption fees | | | — | | | | 7,514 | | |
Shares issued in reinvestment of dividends and distributions | | | 727,427 | | | | 10,363,948 | | |
Net increase | | | 849,461 | | | $ | 11,987,411 | | |
133
Notes to Financial Statements
Annual Report December 31, 2014
| | | EAFE Pure Fund | |
| | | Class 2 Shares
For the Period
April 15, 2014*
through
December 31, 2014 | |
| | | Shares | | Amount | |
Shares sold | | | 4,586,200 | | | $ | 45,862,000 | | |
Purchase premiums | | | — | | | | 138,000 | | |
Redemption fees | | | — | | | | — | | |
Shares issued in reinvestment of dividends and distributions | | | 29,794 | | | | 282,881 | | |
Shares redeemed | | | — | | | | — | | |
Net increase | | | 4,615,994 | | | $ | 46,282,881 | | |
* Commencement of investment operations.
| | Long Term Global Growth Equity | |
| | Class 2 Shares
For the Period
June 10, 2014*
through
December 31, 2014 | |
| | | Shares | | Amount | |
Shares sold | | | 2,500,000 | | | $ | 25,000,000 | | |
Purchase premiums | | | — | | | | — | | |
Redemption fees | | | — | | | | — | | |
Shares issued in reinvestment of dividends and distributions | | | 2,275 | | | | 23,988 | | |
Shares redeemed | | | — | | | | — | | |
Net increase | | | 2,502,275 | | | $ | 25,023,988 | | |
* Commencement of investment operations.
Funds charged the following purchase premiums and redemption fees as of December 31, 2014:
Fund | | Purchase Premium
(Basis Point) | | Redemption Fee
(Basis Point) | |
International Equity | | | 30 | | | | 20 | | |
International Choice | | | 30 | | | | 20 | | |
EAFE | | | 30 | | | | 20 | | |
EAFE Choice | | | 30 | | | | 20 | | |
Emerging Markets | | | 35 | | | | 35 | | |
Global Alpha Equity | | | 20 | | | | 15 | | |
EAFE Pure | | | 30 | | | | 20 | | |
Long Term Global Growth Equity | | | 20 | | | | 15 | | |
134
Notes to Financial Statements
Annual Report December 31, 2014
The purchase premiums and redemption fees may be waived or reduced by the Manager if the brokerage and transaction costs in connection with the purchase or redemption are minimal or in other circumstances in the Manager's discretion.
Note E — Beneficial Ownership
The beneficial ownership, either directly or indirectly, of more than 25% of the voting securities of a Fund creates a presumption of control under Section 2(a)(9) of the 1940 Act. As of December 31, 2014, Kentucky Teachers' Retirement System owned 35.33% of the EAFE Fund; Riverwood International Corporate Master Pension Trust owned 41.43% and Lexington-Fayette Urban Country Government PFRF owned 33% of the EAFE Choice Fund; the Municipal Fire & Police Retirement System of Iowa owned 100% of the International Choice Fund; Nebraska State Investment Council owned 41.18% of the Emerging Markets Fund; the U.S. Army Non-Appropriated Fund owned 100% of the EAFE Pure Fund; and the Longwood Foundation, Inc. owned 100% of the Long Term Global Growth Equity Fund. Purchase and redemption activity of these accounts may have a significant effect on the operation of each Fund.
Note F — Commitments and Contingencies
Each of the Funds indemnifies the Trust's officers and Trustees for certain liabilities that might arise from the performance of their duties to the Fund. Additionally, in the normal course of business, each Fund enters into
contracts that contain a variety of representations and warranties and which provide general indemnifications. The Funds' maximum exposure under these arrangements is unknown, as this would involve future claims that may be made against the Funds that have not yet occurred. However, based on experience, the Funds expect the risk of loss to be remote.
Note G — Subsequent Events
Events or transactions that occur after the financial statement date but before the financial statements are issued are categorized as recognized or non-recognized for financial statement purposes. Effective January 1, 2015, Howard W. Chin joined the Board of Trustees of the Trust as a Disinterested Trustee.
Effective January 1, 2015, the share class structure of the Emerging Markets Fund was changed as follows: Class I shares were converted into Class 1 shares; Class II shares were converted into Class 2 shares; and Class III shares were converted into Class 5 shares. The Fund also added Class 3 and Class 4 shares. The purpose of these changes was to standardize the Funds' share classes such that all Funds offer the same Class 1, Class 2, Class 3, Class 4, and Class 5 shares.
On December 10, 2014, the Trust filed an initial registration statement under the securities Act of 1933, as amended (the "1933 Act") with the Securities and Exchange Commission (the "SEC") for the purpose of registering for public offer and sale the shares of all Funds except for the International Choice Fund. As of the date of this annual report, the SEC has not declared the registration statement effective under the 1933 Act.
135
Notes to Financial Statements
Annual Report December 31, 2014
Effective January 1, 2015, the management fees and shareholder servicing fees for certain Funds changed as follows:
Baillie Gifford Funds — Updated Management Charges From 01 January 2015
The International Equity Fund
| | Class 1 | | Class 2 | | Class 3 | | Class 4 | | Class 5 | |
Management Fees | | | 0.35 | % | | | 0.35 | % | | | 0.35 | % | | | 0.35 | % | | | 0.35 | % | |
Service Fees | | | 0.25 | % | | | 0.17 | % | | | 0.10 | % | | | 0.07 | % | | | 0.02 | % | |
The International Choice Fund
| | Class 1 | | Class 2 | | Class 3 | | Class 4 | | Class 5 | |
Management Fees | | | 0.35 | % | | | 0.35 | % | | | 0.35 | % | | | 0.35 | % | | | 0.35 | % | |
Service Fees | | | 0.25 | % | | | 0.17 | % | | | 0.10 | % | | | 0.07 | % | | | 0.02 | % | |
The EAFE Fund
| | Class 1 | | Class 2 | | Class 3 | | Class 4 | | Class 5 | |
Management Fees | | | 0.35 | % | | | 0.35 | % | | | 0.35 | % | | | 0.35 | % | | | 0.35 | % | |
Service Fees | | | 0.25 | % | | | 0.17 | % | | | 0.10 | % | | | 0.07 | % | | | 0.02 | % | |
The EAFE Choice Fund
| | Class 1 | | Class 2 | | Class 3 | | Class 4 | | Class 5 | |
Management Fees | | | 0.35 | % | | | 0.35 | % | | | 0.35 | % | | | 0.35 | % | | | 0.35 | % | |
Service Fees | | | 0.25 | % | | | 0.17 | % | | | 0.10 | % | | | 0.07 | % | | | 0.02 | % | |
The EAFE Pure Fund
| | Class 1 | | Class 2 | | Class 3 | | Class 4 | | Class 5 | |
Management Fees | | | 0.35 | % | | | 0.35 | % | | | 0.35 | % | | | 0.35 | % | | | 0.35 | % | |
Service Fees | | | 0.25 | % | | | 0.17 | % | | | 0.10 | % | | | 0.07 | % | | | 0.02 | % | |
The Emerging Markets Fund
| | Class 1 | | Class 2 | | Class 3 | | Class 4 | | Class 5 | |
Management Fees | | | 0.55 | % | | | 0.55 | % | | | 0.55 | % | | | 0.55 | % | | | 0.55 | % | |
Service Fees | | | 0.25 | % | | | 0.17 | % | | | 0.10 | % | | | 0.07 | % | | | 0.02 | % | |
136
Notes to Financial Statements
Annual Report December 31, 2014
The Long Term Global Growth Equity Fund*
| | Class 1 | | Class 2 | | Class 3 | | Class 4 | | Class 5 | |
Management Fees | | | 0.45 | % | | | 0.45 | % | | | 0.45 | % | | | 0.45 | % | | | 0.45 | % | |
Service Fees | | | 0.25 | % | | | 0.17 | % | | | 0.10 | % | | | 0.07 | % | | | 0.02 | % | |
The Global Alpha Equity Fund
| | Class 1 | | Class 2 | | Class 3 | | Class 4 | | Class 5 | |
Management Fees | | | 0.40 | % | | | 0.40 | % | | | 0.40 | % | | | 0.40 | % | | | 0.40 | % | |
Service Fees | | | 0.25 | % | | | 0.17 | % | | | 0.10 | % | | | 0.07 | % | | | 0.02 | % | |
137
Report of Independent Registered Public Accounting Firm
Annual Report December 31, 2014
To the Board of Trustees of Baillie Gifford Funds
and the Shareholders of Baillie Gifford International Equity Fund,
Baillie Gifford International Choice Fund, Baillie Gifford EAFE Fund,
Baillie Gifford EAFE Choice Fund, Baillie Gifford Emerging Markets Fund,
Baillie Gifford Global Alpha Equity Fund, Baillie Gifford EAFE Pure Fund
and Baillie Gifford Long Term Global Growth Equity Fund
We have audited the accompanying statements of assets and liabilities of Baillie Gifford International Equity Fund, Baillie Gifford International Choice Fund, Baillie Gifford EAFE Fund, Baillie Gifford EAFE Choice Fund, Baillie Gifford Emerging Markets Fund, Baillie Gifford Global Alpha Equity Fund, Baillie Gifford EAFE Pure Fund and Baillie Gifford Long Term Global Growth Equity Fund (the "Funds"), each a series of shares of beneficial interest in the Baillie Gifford Funds, including the portfolios of investments, as of December 31, 2014, and the related statements of operations for the year or periods then ended, the statements of changes in net assets for each of the years or periods in the two-year period then ended and the financial highlights for each of the years or periods presented in the five-year period then ended. These financial statements and financial highlights are the responsibility of the Funds' management. Our responsibility is to express an opinion on these financial statements and financial highlights based on our audits.
We conducted our audits in accordance with the standards of the Public Company Accounting Oversight Board (United States). Those standards require that we plan and perform the audits to obtain reasonable assurance about whether the financial statements and financial highlights are free of material misstatement. An audit includes examining, on a test basis, evidence supporting the amounts and disclosures in the financial statements. Our procedures included confirmation of securities owned as of December 31, 2014 by correspondence with the custodian and brokers. An audit also includes assessing the accounting principles used and significant estimates made by management, as well as evaluating the overall financial statement presentation. We believe that our audits provide a reasonable basis for our opinion.
In our opinion, the financial statements and financial highlights referred to above present fairly, in all material respects, the financial position of Baillie Gifford International Equity Fund, Baillie Gifford International Choice Fund, Baillie Gifford EAFE Fund, Baillie Gifford EAFE Choice Fund, Baillie Gifford Emerging Markets Fund, Baillie Gifford Global Alpha Equity Fund, Baillie Gifford EAFE Pure Fund and Baillie Gifford Long Term Global Growth Equity Fund as of December 31, 2014 , and the results of their operations for the year or periods then ended, the changes in their net assets for each of the years or periods in the two-year period then ended and their financial highlights for each of the years or periods presented in the five-year period then ended in conformity with accounting principles generally accepted in the United States of America.

BBD, LLP
Philadelphia, Pennsylvania
February 25, 2015
138
Supplemental Information (unaudited)
Annual Report December 31, 2014
Shareholder Meeting Results
The Trust held a special meeting of shareholders on behalf of The International Equity Fund, The International Choice Fund, The EAFE Fund, The EAFE Choice Fund, The EAFE Pure Fund, The Emerging Markets Fund, The Global Alpha Equity Fund, and The Long Term Global Growth Equity Fund (the "Funds") on December 3, 2014. The meeting considered the following proposals pursuant to notice duly sent, in connection with a proxy statement dated October 24, 2014:
Sub-Proposal 1.A: Amendment and Restatement of Advisory Agreements to Change the Management Fees for Certain Funds
| Fund | | Votes For | | Votes Against | | Abstentions | | Percentage of
Total Shares
Voting in Favor | | Percentage of
Shares Present
Voting in Favor | |
EAFE Choice Fund | | | 6,038,519.011 | | | | 0 | | | | 0 | | | | 52.67 | % | | | 100 | % | |
EAFE Fund | | | 161,873,505.199 | | | | 0 | | | | 0 | | | | 85.13 | % | | | 100 | % | |
EAFE Pure Fund | | | 4,586,200.000 | | | | 0 | | | | 0 | | | | 100 | % | | | 100 | % | |
Emerging Markets Fund | | | 28,944,005.480 | | | | 0 | | | | 0 | | | | 100 | % | | | 100 | % | |
Global Alpha Equity | | | 32,611,447.018 | | | | 0 | | | | 0 | | | | 84.71 | % | | | 100 | % | |
International Choice Fund | | | 20,937,866.114 | | | | 0 | | | | 0 | | | | 67.40 | % | | | 100 | % | |
International Equity Fund | | | 142,882,515.854 | | | | 0 | | | | 0 | | | | 72.11 | % | | | 100 | % | |
Accordingly, the proposal with respect to certain Funds as described in the proxy statement and listed above regarding the amendment and restatement of the advisory agreements between the Trust, on behalf of such Funds, and BGO to change management fees for such Funds was approved by the shareholders of such Funds.
Sub-Proposal 1.B: Amendment and Restatement of Advisory Agreements to Make Certain Other Changes as Described in the Proxy Statement
| Fund | | Votes For | | Votes Against | | Abstentions | | Percentage of
Total Shares
Voting in Favor | | Percentage of
Shares Present
Voting in Favor | |
EAFE Choice Fund | | | 6,038,519.011 | | | | 0 | | | | 0 | | | | 52.67 | % | | | 100 | % | |
EAFE Fund | | | 161,873,505.199 | | | | 0 | | | | 0 | | | | 85.13 | % | | | 100 | % | |
EAFE Pure Fund | | | 4,586,200.000 | | | | 0 | | | | 0 | | | | 100 | % | | | 100 | % | |
Emerging Markets Fund | | | 28,944,005.480 | | | | 0 | | | | 0 | | | | 100 | % | | | 100 | % | |
Global Alpha Equity | | | 32,611,447.018 | | | | 0 | | | | 0 | | | | 84.71 | % | | | 100 | % | |
International Choice Fund | | | 20,937,866.114 | | | | 0 | | | | 0 | | | | 67.40 | % | | | 100 | % | |
International Equity Fund | | | 134,718,052.415 | | | | 0 | | | | 8,164,463.439 | | | | 67.99 | % | | | 94.29 | % | |
Long Term Global Growth Fund | | | 2,500,000.000 | | | | 0 | | | | 0 | | | | 100 | % | | | 100 | % | |
Accordingly, the proposal regarding the amendment and restatement of the advisory agreements between the Trust, on behalf of each Fund, and BGO to make certain other changes as described in the proxy statement was approved by the shareholders of each Fund.
139
Supplemental Information (unaudited)
Annual Report December 31, 2014
Proposal 2: Approving the Amendment and Restatement of the Amended and Restated Agreement and Declaration of Trust
| Votes For | | Votes Against | | Percentage of
Total Shares
Abstentions | | Percentage of
Shares Present
Voting in Favor | | Voting in Favor | |
| | 328,292,934.184 | | | | 63,916,661.053 | | | | 8,164,463.439 | | | | 64.96 | % | | | 82.00 | % | |
Accordingly, the proposal to approve an amendment and restatement of the Amended and Restated Agreement and Declaration of Trust of the Trust was approved by a majority of the Trust's shares present at the meeting in person or by proxy.
Proposal 3: Election of Trustees
| Director | | Votes For | | Votes Withheld | | Abstentions | | Percentage of
Total Shares
Voting in Favor | | Percentage of
Shares Present
Voting in Favor | |
Peter C. Hadden | | | 400,374,058.676 | | | | 0 | | | | 0 | | | | 77.98 | % | | | 100 | % | |
John G. Barrie, Jr. | | | 370,575,551.468 | | | | 29,798,507.208 | | | | 0 | | | | 72.08 | % | | | 92.56 | % | |
George W. Browning | | | 400,374,058.676 | | | | 0 | | | | 0 | | | | 77.98 | % | | | 100 | % | |
Bruce C. Long | | | 400,374,058.676 | | | | 0 | | | | 0 | | | | 77.98 | % | | | 100 | % | |
Robert. C. Rigsby | | | 400,374,058.676 | | | | 0 | | | | 0 | | | | 77.98 | % | | | 100 | % | |
Howard W. Chin | | | 400,374,058.676 | | | | 0 | | | | 0 | | | | 77.98 | % | | | 100 | % | |
Accordingly, each director nominee was approved by the holders of a plurality of the Trust's shares present at the meeting in person or by proxy.
140
Supplemental Information (unaudited)
Annual Report December 31, 2014
Federal Income Tax Information
Qualified dividend income was taxable to the Funds listed in the table below through December 31, 2014. The Funds intend to designate the maximum amount of dividends that qualify for the reduced tax rate pursuant to the Jobs and Growth Tax Relief Reconciliation Act of 2003.
| Fund | | Qualified
Dividend Income | |
International Equity | | $ | 53,054,569 | | |
International Choice | | | 7,392,337 | | |
EAFE | | | 43,714,360 | | |
EAFE Choice | | | 2,550,472 | | |
Emerging Markets | | | 5,424,017 | | |
Global Alpha Equity | | | 8,516,425 | | |
EAFE Pure | | | 563,925 | | |
Long Term Global Growth Equity | | | 32,934 | | |
For corporate shareholders, the percentage of ordinary income distributions for the year ended December 31, 2014 qualified for the corporate dividends-received deduction for each Fund is:
| Fund | | Dividends-received
Deductions | |
International Equity | | | 0.24 | % | |
International Choice | | | 1.34 | % | |
EAFE | | | 0.00 | % | |
EAFE Choice | | | 2.59 | % | |
Emerging Markets | | | 0.00 | % | |
Global Alpha Equity | | | 39.27 | % | |
EAFE Pure | | | 6.67 | % | |
Long Term Global Growth Equity | | | 9.06 | % | |
In January 2015, you will be advised on IRS Form 1099 DIV or substitute 1099 DIV as to the U.S. federal tax status of distributions received by you in the calendar year 2014.
141
Supplemental Information (unaudited)
Annual Report December 31, 2014
Management of the Trust
The following tables set forth the Trustees and Officers of the Trust, their principal occupations during the past five years, and certain other information.
| Name and Age(1) | | Position(s)
Held with
Trust | | Length of
Time
Served(2) | | Principal Occupation and Other Directorships Held During Past 5 Years(3) | |
Disinterested Trustees | | | | | | | |
John G. Barrie, Jr.
Age 74 | | Trustee | | Since 2000 | | Retired. Formerly: Assistant Treasurer, Dominion Resources, Inc. (electric and gas utility). | |
George W. Browning
Age 73 | | Trustee | | Since 2007 | | Retired. Formerly: Managing Director, Client Service, Babson Capital Management, LLC (investment adviser). | |
Howard W. Chin
Age 62 | | Trustee | | Since 2015 | | Retired. Formerly: Managing Director, Investments, Guardian Life Insurance (financial services). | |
Bruce C. Long
Age 69 | | Trustee | | Since 2009 | | Global Financial Consultant. Formerly: Executive Vice President and director of various entities, Guardian Life Insurance (financial services). | |
Robert E. Rigsby
Age 65 | | Trustee | | Since 2014 | | Retired. Formerly: President & COO, Delivery Business at Dominion Resources, Inc. (electric and gas utility). | |
Interested Trustee | | | | | | | |
Peter Hadden
Age 56 | | Trustee, Chairman of the Board, and President | | Since 2009 | | Partner, Baillie Gifford & Co. (investment adviser); Director, Baillie Gifford Overseas Ltd. (investment adviser); Formerly, Vice President of the Trust (2008 to 2009). | |
Name and Age(1) | | Position(s)
Held with
Trust | | Length of
Time
Served(2) | | Principal Occupation During Past 5 Years(3) | | Number of Funds in
Fund complex
overseen by
Trustee(4) | |
Officers (other than Officers who are also Trustees) | | | | | | | | | |
Andrew Telfer
Age 47 | | Vice President | | Since 2008 | | Managing Partner, Baillie Gifford & Co. (investment adviser). | | | 10 | | |
Michael Stirling-Aird
Age 37 | | Vice President | | Since 2012 | | Client Service Director, Baillie Gifford Overseas Limited (investment adviser). | | | 10 | | |
Julie Paul
Age 39 | | Vice President | | Since 2012 | | Assistant Manager, Overseas Institutional Clients Accounting Department, Baillie Gifford & Co. (investment adviser). | | | 10 | | |
Tim Campbell
Age 39 | | Vice President | | Since 2014 | | Partner, Baillie Gifford & Co. (investment adviser); Manager, Baillie Gifford International LLC with oversight of marketing performed in North America. | | | 10 | | |
David Salter
Age 39 | | Vice President | | Since 2014 | | Partner, Baillie Gifford & Co. (investment adviser); Client Services Director, Baillie Gifford Overseas Limited with oversight of products offered to the North American market. | | | 10 | | |
Lindsay Cockburn
Age 36 | | Treasurer | | Since 2015 | | Manager, Institutional Accounting Department, Baillie Gifford & Co. (investment adviser). | | | 10 | | |
Angus N.G. Macdonald
Age 49 | | Secretary | | Since 2000 | | Head of Group Legal for the Baillie Gifford Group (investment adviser). | | | 10 | | |
142
Supplemental Information (unaudited)
Annual Report December 31, 2014
Name and Age(1) | | Position(s)
Held with
Trust | | Length of
Time
Served(2) | | Principal Occupation During Past 5 Years(3) | | Number of Funds in
Fund complex
overseen by
Trustee(4) | |
Officers (other than Officers who are also Trustees) | | | | | | | | | |
Graham Laybourn
Age 48 | | Chief Compliance Officer | | Since 2005 | | Partner, Baillie Gifford & Co. (investment adviser); Group Compliance Officer, Director of Compliance and Legal, Baillie Gifford Group (investment adviser). | | | N/A | | |
Evan Delaney
Age 44 | | Chief Risk Officer | | Since 2013 | | Group Chief Risk Officer, Director of Business Risk and Internal Audit, Baillie Gifford Group (investment adviser). | | | |
(1) The address of each Trustee and Officer of the Trust is c/o Baillie Gifford Funds, Calton Square, 1 Greenside Row, Edinburgh, Scotland EH1 3AN.
(2) There is no stated term of office for the Trustees and a Trustee may serve until such Trustee reaches the age of 75 years. Thereafter, such Trustee offers to tender his or her resignation from the Board, and the Nominating and Governance Committee, at its discretion, makes a recommendation to the Board whether to accept or reject such resignation annually. The Chairman of the Board and President of the Trust are elected annually by the Board of Trustees. Other officers may be elected or appointed by the Trustees at any time.
(3) Previous positions during the past five years with Baillie Gifford & Co., the Manager and Baillie Gifford Group are omitted if not materially different from the positions listed.
(4) The number of Funds in the Fund complex overseen by the Trustee includes the North American Equity Fund and the Emerging Markets Bond Fund, two series of the Trust which have not yet commenced operations.
(5) Mr. Hadden is an "interested person" (as defined in the 1940 Act) of the Trust or the Manager due to his positions with the Manager (Baillie Gifford Overseas Ltd.) and his role as an officer of the Trust.
Additional information regarding the Trustees is in the Funds' Statement of Additional Information and is available upon request, without charge, by calling Baillie Gifford Overseas Limited at 011-44-131-275-2000.
A description of the Funds' proxy voting policies and procedures related to portfolio securities is available without charge, upon request, by calling Baillie Gifford Overseas Limited at 011-44-131-275-2000 or on the SEC's website at http://www.sec.gov. Shareholders may submit to the Trust claims for reimbursement of telephone charges incurred in placing such calls.
Information regarding how the Funds voted proxies relating to portfolio securities during the most recent 12-month period ended June 30 is also available without charge upon request by calling Baillie Gifford Overseas
Limited at 011-44-131-275-2000 or by accessing the Fund's Form N-PX on the SEC's website at http://www.sec.gov. Shareholders may submit to the Trust claims for reimbursement of telephone charges incurred in placing such calls.
Each of the Funds files its complete schedule of portfolio holdings with the SEC for the first and third quarters of each fiscal year on Form N-Q. The Funds' Form N-Q is available on the SEC's website at http://www.sec.gov. The Funds' Form N-Q may also be viewed and copied at the SEC's Public Reference Room in Washington, DC; information on the operation of the Public Reference Room may be obtained by calling (800) SEC-0330.
143
BOARD CONSIDERATION REGARDING
CONTRACT APPROVAL (unaudited)
Annual Report December 31, 2014
On September 26, 2014, the Board of Trustees (the "Board") of the Baillie Gifford Funds (the "Trust"), including those trustees who are not "interested persons" as defined by the Investment Company Act of 1940 (the "Independent Trustees"), approved the proposed Amended and Restated Investment Advisory Agreement (the "Advisory Agreement") between the Trust, on behalf of the International Equity Fund, the International Choice Fund, the EAFE Fund, the EAFE Choice Fund, the EAFE Pure Fund, the Emerging Markets Fund, the Global Alpha Equity Fund and the Long Term Global Growth Equity Fund, respectively, (each a "Fund" and collectively, the "Funds") and Baillie Gifford Overseas Limited (the "Manager"). The Board considered that the Manager asked the Board to approve the Advisory Agreement as part of a plan to effect the registration of each Fund's shares (other than the International Choice Fund's shares) under the Securities Act of 1933. The Board considered that it had approved the renewal of the current investment advisory agreements for the International Equity Fund, the International Choice Fund, the EAFE Fund, the EAFE Choice Fund, the EAFE Pure Fund, the Emerging Markets Fund and the Global Alpha Equity Fund at its June 19, 2014 meeting (the "June Renewals"). The Board considered that it had approved the current investment advisory agreement for the Long Term Global Growth Equity Fund at its March 20, 2014 meeting. As part of the review process with respect to the Advisory Agreement, the Independent Trustees met independently of Trust management and of the interested trustee of the Board to consider the approval of the Advisory Agreement. During the review process, the Independent Trustees were represented by independent legal counsel. The Independent Trustees reviewed materials, including materials received in connection with the June Renewals, from the Manager, Lipper Inc. (an independent provider of mutual fund data, "Lipper") and independent legal counsel and then presented their findings to the Board.
The Board concluded that it was in the best interests of each Fund to approve the Advisory Agreement and agreed to submit it to shareholders for approval. In reaching this conclusion for each Fund, the Board did not identify any single factor as determinative in its analysis, but rather the Board considered a variety of factors, including those discussed below. The Board did not allot a particular weight to any one factor or group of factors.
The Board considered the nature, extent and quality of the services provided or to be provided by the Manager to the Funds. The Board noted that, pursuant to the Advisory Agreement, the Manager would provide portfolio management services to the Funds and receive a management fee and that, pursuant to a separate Shareholder Service Plan and Shareholder Service Agreement, the Manager would receive a shareholder service fee. The Board noted that these arrangements were similar to the existing arrangements, although the management fee for each Fund except the Long Term Global Growth Equity Fund was proposed to be increased and the shareholder service fee for each share class was proposed to be decreased with the result that, in the aggregate, the proposed management and shareholder service fees to be charged were expected to be the same or lower for each class. With respect to the Long Term Global Growth Equity Fund, the Board noted that the management fee to be charged was proposed to be decreased and the shareholder service fee for each share class was proposed to stay the same with the result that, in the aggregate, the proposed management and shareholder service fees to be charged were expected to be lower for each class. The Board considered the background and qualifications of the investment and compliance personnel involved in the management and oversight of the Trust, reviewed information regarding each Fund's performance, and considered the experience of the Manager in providing services to each Fund. The Board concluded that the nature, extent and quality of the services provided by the Manager to each Fund were satisfactory and were expected to continue to be satisfactory under the Advisory Agreement.
With respect to the International Equity Fund, the International Choice Fund, the EAFE Fund, the EAFE Choice Fund, the Emerging Markets Fund and the Global Alpha Equity Fund, the Board considered that it had reviewed total return information for the one-, three- and five-year periods ended March 31, 2014, as applicable, for each Fund compared to its respective benchmark index and an average of the total return of a performance universe of funds provided by Lipper in connection with the June Renewals and had concluded that each Fund's performance was satisfactory. The Board considered that the Performance Committee of the Board had reviewed the performance of the International Equity Fund, the International Choice Fund, the EAFE Fund, the EAFE Choice Fund, the Emerging Markets Fund and the Global Alpha Equity Fund, as of June 30, 2014 at its July 24, 2014 meeting. With respect to the EAFE Pure Fund and the Long Term Global Growth Equity Fund, the Board considered total return information provided at the September meeting for the period from each Fund's inception on April 15, 2014 and June 10, 2014, respectively, to July 31, 2014 compared to each Fund's benchmark index and an average of the total return of a
144
BOARD CONSIDERATION REGARDING
CONTRACT APPROVAL (unaudited)
Annual Report December 31, 2014
performance universe of funds provided by Lipper. The Board concluded that the performance of each Fund was satisfactory.
The Board reviewed each Fund's proposed management fee and projected total expense ratio under the revised contractual arrangements and compared them to the average management fees and expense ratios of an expense group and expense universe of funds based on data provided by Lipper. In assessing the comparative data, the Board considered not only the proposed management fee for each Fund, but also the aggregate of each Fund's proposed management fee and proposed Class 1 shareholder service fee. The Board considered that for the International Equity Fund, the International Choice Fund, the EAFE Fund, the EAFE Choice Fund, the Emerging Markets Fund and the Global Alpha Equity Fund, each Fund's proposed management fee (plus its proposed Class 1 shareholder service fee) was below the average management fee of both of the applicable Lipper expense group and Lipper expense universe and that for the EAFE Pure Fund and the Long Term Global Growth Equity Fund, each Fund's proposed management fee (plus its proposed Class 1 shareholder service fee) was above the average management fee of the applicable Lipper expense group and below the applicable Lipper expense universe. The Board also reviewed the fee schedules for separately managed accounts of the Manager with similar investment mandates to the Funds, as applicable, noting that each Fund's proposed management fee plus proposed shareholder service fees were within range of the separately managed account fee schedules. On the basis of the information provided, the Board concluded that each Fund's proposed management fee was reasonable.
The Board considered whether there were economies of scale with respect to management of each Fund and whether the Funds would benefit from any economies of scale. The Board considered that each Fund's management fee was on the low end of the spectrum of the applicable Lipper expense group and that any economies of scale were appropriately shared with investors.
The Board reviewed the Manager's anticipated revenues with respect to the Funds and the nature of the Manager's resources expended in providing advisory services to the Funds. The Board considered the Manager's estimated profitability with respect to the Funds and noted that due to the proposed increase in the management fee rates for certain Funds, management fee revenues were expected to increase and that due to the proposed reduction in the shareholder service fee rates for certain Funds, aggregate shareholder service fee revenues were expected to decrease but that total revenues were expected to remain stable. The Board concluded that each Fund's estimated profitability was not unreasonable.
The Board considered other benefits derived by the Manager from its relationship to the Funds, including receipt of the shareholder service fee (which varies among the share classes) and the use of soft dollars to pay for research services for the Funds or other clients of the Manager and concluded that the proposed management fees were reasonable in light of these other benefits.
Based upon all the information considered and the conclusions reached, the Board determined that the terms of the Advisory Agreement were reasonable and fair and that the approval of the Advisory Agreement was in the best interests of each respective Fund.
145
Item 2. Code of Ethics.
(a) The registrant, as of the end of the period covered by this report, has adopted a code of ethics that applies to the registrant’s principal executive officer, principal financial officer, principal accounting officer or controller, or persons performing similar functions, regardless of whether these individuals are employed by the registrant or a third party.
(b) Not applicable.
(c) There have been no amendments, during the period covered by this report, to a provision of the code of ethics that applies to the registrant’s principal executive officer, principal financial officer, principal accounting officer or controller, or persons performing similar functions, regardless of whether these individuals are employed by the registrant or a third party, and that relate to any element of the code of ethics definition enumerated in paragraph (b) of this item’s instructions.
(d) The registrant has not granted any waivers, including an implicit waiver, from a provision of the code of ethics that applies to the registrant’s principal executive officer, principal financial officer, principal accounting officer or controller, or persons performing similar functions, regardless of whether these individuals are employed by the registrant or a third party, that relates to one or more of the items set forth in paragraph (b) of this item’s instructions.
(e) Not applicable.
(f) The registrant’s Code of Ethics is attached hereto as an exhibit.
Item 3. Audit Committee Financial Expert.
As of the end of the period covered by the report, the registrant’s Board of Trustees has determined that Mr. Robert E. Rigsby, is qualified to serve as an audit committee financial expert serving on its audit committee and that he is “independent,” as defined by Item 3 of Form N-CSR.
Item 4. Principal Accountant Fees and Services.
Audit Fees
(a) The aggregate fees billed for each of the last two fiscal years for professional services rendered by the principal accountant for the audit of the registrant’s annual financial statements or services that are normally provided by the accountant in connection with statutory and regulatory filings or engagements for those fiscal years are $114,000 for 2013 and $144,000 for 2014.
Audit-Related Fees
(b) The aggregate fees billed in each of the last two fiscal years for assurance and related services by the principal accountant that are reasonably related to the performance of the audit of the registrant’s financial statements and are not reported under paragraph (a) of this Item are $0 for 2013 and $0 for 2014.
Tax Fees
(c) The aggregate fees billed in each of the last two fiscal years for professional services rendered by the principal accountant for tax compliance, tax advice, and tax planning are $24,000 for 2013 and $32,000 for 2014.
All Other Fees
(d) The aggregate fees billed in each of the last two fiscal years for products and services provided by the principal accountant, other than the services reported in paragraphs (a) through (c) of this Item are $0 for 2013 and $0 for 2014.
(e)(1) Engagements that are required to be pre-approved by the registrant’s Audit Oversight Committee, “the Committee”, may be pre-approved (i) at any regular or special meeting of the Committee or (ii) by the Committee Chair (or any other Committee member who is a disinterested trustee under the 1940 Act to whom this responsibility has been delegated), as long as the estimated fee for the particular services for which pre-approval is sought does not exceed $75,000 (for audit services) or $100,000 (for audit-related services) and provided that such member must report, for informational purposes only, any pre-approval decisions to the Board at its next regularly scheduled meeting.
(e)(2) The percentage of services described in each of paragraphs (b) through (d) of this Item that were approved by the audit committee pursuant to paragraph (c)(7)(i)(C) of Rule 2-01 of Regulation S-X are as follows:
(b) Not Applicable.
(c) 100%
(d) Not Applicable.
(f) Not applicable.
(g) The aggregate non-audit fees billed by the registrant’s accountant for services rendered to the registrant, and rendered to the registrant’s investment adviser (not including any sub-adviser whose role is primarily portfolio management and is subcontracted with or overseen by another investment adviser), and any entity controlling, controlled by, or under common control with the adviser that provides ongoing services to the registrant for each of the last two fiscal years of the registrant was $0 for 2013 and $0 for 2014.
(h) Not applicable.
Item 5. Audit Committee of Listed Registrants.
Not applicable.
Item 6. Investments.
(a) Schedule of Investments in securities of unaffiliated issuers as of the close of the reporting period is included as part of the report to shareholders filed under Item 1 of this form.
(b) In accordance with Section 13(c) of the Investment Company Act of 1940, the registrant has divested itself of the following securities since the filing of its last report on Form N-CSR:
The Emerging Markets Fund
Name
of Issuer | | Exchange
Ticker
Symbol | | Security
Identifier
(CUSIP
number) | | Total
number of
shares
divested | | Date
securities
were
divested | | Amount
Held on
Filing Date | | Statute | |
Donfeng Motor GP. ‘H’ | | 489 | | B0PH5N3 | | 382,000 | | 09/19/2014 | | 1,070,000 | | Sudan Accountability and Divestment Act of 2007; Comprehensive Iran Sanctions, Accountability, and Divestment Act of 2010 | |
Name
of Issuer | | Exchange
Ticker
Symbol | | Security
Identifier
(CUSIP
number) | | Total
number of
shares
divested | | Date
securities
were
divested | | Amount
Held on
Filing Date | | Statute | |
China Petroleum & Chemical Corp. | | 386 | | 6291819 | | 6,466,000 | | 12/11/2014 | | 12,344,000 | | Sudan Accountability and Divestment Act of 2007; Comprehensive Iran Sanctions, Accountability, and Divestment Act of 2010 | |
Item 7. Disclosure of Proxy Voting Policies and Procedures for Closed-End Management Investment Companies.
Not applicable.
Item 8. Portfolio Managers of Closed-End Management Investment Companies.
Not applicable.
Item 9. Purchases of Equity Securities by Closed-End Management Investment Company and Affiliated Purchasers.
Not applicable.
Item 10. Submission of Matters to a Vote of Security Holders.
Not applicable.
Item 11. Controls and Procedures.
(a) The registrant’s principal executive and principal financial officers, or persons performing similar functions, have concluded that the registrant’s disclosure controls and procedures (as defined in Rule 30a-3(c) under the Investment Company Act of 1940, as amended (the “1940 Act”) (17 CFR 270.30a-3(c))) are effective, as of a date within 90 days of the filing date of the report that includes the disclosure required by this paragraph, based on their evaluation of these controls and procedures required by Rule 30a-3(b) under the 1940 Act (17 CFR 270.30a-3(b)) and Rules 13a-15(b) or 15d-15(b) under the Securities Exchange Act of 1934, as amended (17 CFR 240.13a-15(b) or 240.15d-15(b)).
(b) There were no changes in the registrant’s internal control over financial reporting (as defined in Rule 30a-3(d) under the 1940 Act (17 CFR 270.30a-3(d)) that occurred during the registrant’s second fiscal quarter of the period covered by this report that has materially affected, or is reasonably likely to materially affect, the registrant’s internal control over financial reporting.
Item 12. Exhibits.
(a)(1) | Code of ethics, or any amendment thereto, that is the subject of disclosure required by Item 2 is attached hereto. |
| |
(a)(2) | Certifications pursuant to Rule 30a-2(a) under the 1940 Act and Section 302 of the Sarbanes-Oxley Act of 2002 are attached hereto. |
| |
(a)(3) | Not applicable. |
| |
(b) | Certifications pursuant to Rule 30a-2(b) under the 1940 Act and Section 906 of the Sarbanes-Oxley Act of 2002 are attached hereto. |
SIGNATURES
Pursuant to the requirements of the Securities Exchange Act of 1934 and the Investment Company Act of 1940, the registrant has duly caused this report to be signed on its behalf by the undersigned, thereunto duly authorized.
(Registrant) | Baillie Gifford Funds | |
| |
By (Signature and Title)* | /s/ Peter Hadden | |
| Peter Hadden, President | |
| (principal executive officer) | |
| |
Date | March 6, 2015 | |
| | | | |
Pursuant to the requirements of the Securities Exchange Act of 1934 and the Investment Company Act of 1940, this report has been signed below by the following persons on behalf of the registrant and in the capacities and on the dates indicated.
By (Signature and Title)* | /s/ Peter Hadden | |
| Peter Hadden, President | |
| (principal executive officer) | |
| |
Date | March 6, 2015 | |
| |
By (Signature and Title)* | /s/ Lindsay Cockburn | |
| Lindsay Cockburn, Treasurer | |
| (principal financial officer) | |
| |
Date | March 6, 2015 | |
| | | | |
* Print the name and title of each signing officer under his or her signature.