UNITED STATES
SECURITIES AND EXCHANGE COMMISSION
Washington, D.C. 20549
FORM N-CSR
CERTIFIED SHAREHOLDER REPORT OF REGISTERED
MANAGEMENT INVESTMENT COMPANIES
Investment Company Act file number | 811-10145 |
|
Baillie Gifford Funds |
(Exact name of registrant as specified in charter) |
|
1 Greenside Row Edinburgh, Scotland, UK | | EH1 3AN |
(Address of principal executive offices) | | (Zip code) |
|
Gareth Griffiths 1 Greenside Row Edinburgh, Scotland, UK, EH1 3AN |
(Name and address of agent for service) |
|
Registrant’s telephone number, including area code: | 011-44-131-275-2000 | |
|
Date of fiscal year end: | December 31 | |
|
Date of reporting period: | December 31, 2017 | |
| | | | | | | | |
Form N-CSR is to be used by management investment companies to file reports with the Commission not later than 10 days after the transmission to stockholders of any report that is required to be transmitted to stockholders under Rule 30e-1 under the Investment Company Act of 1940 (17 CFR 270.30e-1). The Commission may use the information provided on Form N-CSR in its regulatory, disclosure review, inspection, and policymaking roles.
A registrant is required to disclose the information specified by Form N-CSR, and the Commission will make this information public. A registrant is not required to respond to the collection of information contained in Form N-CSR unless the Form displays a currently valid Office of Management and Budget (“OMB”) control number. Please direct comments concerning the accuracy of the information collection burden estimate and any suggestions for reducing the burden to Secretary, Securities and Exchange Commission, 450 Fifth Street, NW, Washington, DC 20549-0609. The OMB has reviewed this collection of information under the clearance requirements of 44 U.S.C. § 3507.
Item 1. Reports to Stockholders.
The Report to Shareholders is attached herewith.
BAILLIE GIFFORD FUNDS
EAFE Fund
EAFE Choice Fund
EAFE Pure Fund
Emerging Markets Fund
Global Alpha Equity Fund
Global Select Equity Fund
International Concentrated Growth Fund
International Equity Fund
Long Term Global Growth Equity Fund
Positive Change Equity Fund
U.S. Equity Growth Fund
International Choice Fund
Annual Report
December 31, 2017


Index
Page Number | | | |
| | 01 | | | Management Discussion | |
| | 21 | | | Fund Expenses | |
| | | EAFE Fund | |
| | 28 | | | Industry Diversification Table | |
| | 29 | | | Portfolio of Investments | |
| | 34 | | | Statement of Assets and Liabilities | |
| | 35 | | | Statement of Operations | |
| | 36 | | | Statements of Changes in Net Assets | |
| | | Financial Highlights | |
| | 38 | | | Selected Data for Class 2 | |
| | 39 | | | Selected Data for Class 3 | |
| | 40 | | | Selected Data for Class 4 | |
| | 41 | | | Selected Data for Class 5 | |
| | 42 | | | Selected Data for Class K | |
| | 43 | | | Selected Data for Institutional Class | |
| | | EAFE Choice Fund | |
| | 44 | | | Industry Diversification Table | |
| | 46 | | | Portfolio of Investments | |
| | 51 | | | Statement of Assets and Liabilities | |
| | 52 | | | Statement of Operations | |
| | 53 | | | Statements of Changes in Net Assets | |
| | | Financial Highlights | |
| | 54 | | | Selected Data for Class 2 | |
| | 55 | | | Selected Data for Class 3 | |
| | 56 | | | Selected Data for Class K | |
| | 57 | | | Selected Data for Institutional Class | |
| | | EAFE Pure Fund | |
| | 58 | | | Industry Diversification Table | |
| | 59 | | | Portfolio of Investments | |
| | 63 | | | Statement of Assets and Liabilities | |
| | 64 | | | Statement of Operations | |
| | 65 | | | Statements of Changes in Net Assets | |
| | | Financial Highlights | |
| | 66 | | | Selected Data for Class 2 | |
| | 67 | | | Selected Data for Class 3 | |
| | 68 | | | Selected Data for Class K | |
| | 69 | | | Selected Data for Institutional Class | |
| | | Emerging Markets Fund | |
| | 70 | | | Industry Diversification Table | |
| | 71 | | | Portfolio of Investments | |
| | 76 | | | Statement of Assets and Liabilities | |
| | 77 | | | Statement of Operations | |
| | 78 | | | Statements of Changes in Net Assets | |
| | | Financial Highlights | |
| | 80 | | | Selected Data for Class 2 | |
| | 81 | | | Selected Data for Class 3 | |
| | 82 | | | Selected Data for Class 5 | |
| | 83 | | | Selected Data for Class K | |
| | 84 | | | Selected Data for Institutional Class | |
| | | Global Alpha Equity Fund | |
| | 85 | | | Industry Diversification Table | |
| | 87 | | | Portfolio of Investments | |
| | 93 | | | Statement of Assets and Liabilities | |
| | 94 | | | Statement of Operations | |
| | 95 | | | Statements of Changes in Net Assets | |
| | | Financial Highlights | |
| | 97 | | | Selected Data for Class 2 | |
| | 98 | | | Selected Data for Class 3 | |
| | 99 | | | Selected Data for Class 4 | |
| | 100 | | | Selected Data for Class K | |
| | 101 | | | Selected Data for Institutional Class | |
| | | Global Select Equity Fund | |
| | 102 | | | Industry Diversification Table | |
| | 104 | | | Portfolio of Investments | |
| | 109 | | | Statement of Assets and Liabilities | |
| | 110 | | | Statement of Operations | |
| | 111 | | | Statements of Changes in Net Assets | |
| | | Financial Highlights | |
| | 112 | | | Selected Data for Class K | |
| | 113 | | | Selected Data for Institutional Class | |
| | | International Concentrated Growth Fund | |
| | 114 | | | Industry Diversification Table | |
| | 115 | | | Portfolio of Investments | |
| | 118 | | | Statement of Assets and Liabilities | |
Page Number | | | |
| | 119 | | | Statement of Operations | |
| | 120 | | | Statements of Changes in Net Assets | |
| | | Financial Highlights | |
| | 121 | | | Selected Data for Class K | |
| | 122 | | | Selected Data for Institutional Class | |
| | | International Equity Fund | |
| | 123 | | | Industry Diversification Table | |
| | 125 | | | Portfolio of Investments | |
| | 131 | | | Statement of Assets and Liabilities | |
| | 132 | | | Statement of Operations | |
| | 133 | | | Statements of Changes in Net Assets | |
| | | Financial Highlights | |
| | 135 | | | Selected Data for Class 2 | |
| | 136 | | | Selected Data for Class 3 | |
| | 137 | | | Selected Data for Class 4 | |
| | 138 | | | Selected Data for Class 5 | |
| | 139 | | | Selected Data for Class K | |
| | 140 | | | Selected Data for Institutional Class | |
| | | Long Term Global Growth Equity Fund | |
| | 141 | | | Industry Diversification Table | |
| | 142 | | | Portfolio of Investments | |
| | 145 | | | Statement of Assets and Liabilities | |
| | 146 | | | Statement of Operations | |
| | 147 | | | Statements of Changes in Net Assets | |
| | | Financial Highlights | |
| | 148 | | | Selected Data for Class 2 | |
| | 149 | | | Selected Data for Class 4 | |
| | 150 | | | Selected Data for Class K | |
| | 151 | | | Selected Data for Institutional Class | |
| | | Positive Change Equity Fund | |
| | 152 | | | Industry Diversification Table | |
| | 153 | | | Portfolio of Investments | |
| | 156 | | | Statement of Assets and Liabilities | |
| | 157 | | | Statement of Operations | |
| | 158 | | | Statements of Changes in Net Assets | |
| | | Financial Highlights | |
| | 159 | | | Selected Data for Class K | |
| | 160 | | | Selected Data for Institutional Class | |
| | | U.S. Equity Growth Fund | |
| | 161 | | | Industry Diversification Table | |
| | 162 | | | Portfolio of Investments | |
| | 164 | | | Statement of Assets and Liabilities | |
| | 165 | | | Statement of Operations | |
| | 166 | | | Statements of Changes in Net Assets | |
| | | Financial Highlights | |
| | 167 | | | Selected Data for Class K | |
| | 168 | | | Selected Data for Institutional Class | |
| | | International Choice Fund | |
| | 169 | | | Industry Diversification Table | |
| | 171 | | | Portfolio of Investments | |
| | 176 | | | Statement of Assets and Liabilities | |
| | 177 | | | Statement of Operations | |
| | 178 | | | Statements of Changes in Net Assets | |
| | | Financial Highlights | |
| | 179 | | | Selected Data for Class 2 | |
| | 180 | | | Selected Data for Class 3 | |
| | 181 | | | Selected Data for Class 4 | |
| | 182 | | | Notes to Financial Statements | |
| | 210 | | | Report of Independent Registered Public Accounting Firm | |
| | | Supplemental Information | |
| | 211 | | | Federal Income Tax Information | |
| | 213 | | | Management of the Trust | |
| | 215 | | | Board Considerations Regarding New Funds' Advisory Agreement Approval | |

Management Discussion (unaudited)
Annual Report December 31, 2017
EAFE Fund
Market Conditions and review of performance during 2017
International equity markets enjoyed a very strong year with the MSCI EAFE index producing a return of 25.62% and the EAFE Fund returning 46.09% for class 2 shares. This is an impressive return by any standards. Equity markets have been underpinned by improving global growth, accommodative central banks, and strong corporate operating performance. While the political backdrop retains the capability to cause periodic disruptions to markets, the growth opportunities available around the world remain abundant.
We invest for the Fund in companies that we believe can grow significantly faster than the market for many years, possibly decades. These opportunities are quite rare, and owning them requires patience. But we think it pays to back our convictions, so the Fund has become a little more concentrated over the last 12 months. We need to be supportive long-term shareholders and encourage great growth-oriented companies to put long-term goals before the market's obsession with short-term targets.
A new breed of company has emerged in recent years that has little need of capital and benefits from the effects of having a large network. For example, in Tencent and Alibaba, we own companies that exemplify these traits and are now capable of dominating across different parts of the economy. Although these companies have contributed well to returns over many years, we believe the prospects for patient shareholders remain good. Both Tencent and Alibaba contributed to a notably strong period of performance for the Fund. Stock selection was the key driver of relative performance and these two Chinese internet companies were significant contributors, once again thanks to strong operating fundamentals.
In Tencent's case, the most recent set of results saw revenue growth accelerate from the mid 50s to over 60% year on year. Smartphone games were the key driver, based on the huge popularity of games such as Honour of Kings. Elsewhere, the WeChat app continues to grow the number of active users, and interestingly is being used as a payment option in physical stores three times as often as this time last year. And its YouTube equivalent, Tencent Video, now has the largest paying subscriber base of any video streaming service.
Alibaba too is achieving the feat of generating accelerating revenue growth from an already high base,
at very similar rates to Tencent. The core e-commerce business goes from strength to strength. Its 'Singles Day' event on November 11th lived up to its reputation as the world's biggest twenty-four hour shopping event, with a 39% increase in sales over the same period in 2016.
Luxury car manufacturer Ferrari also performed exceptionally well. The company has been liberated following the spin off from Fiat Chrysler Automobiles, and the share price has responded to strong performance in both volumes and margins. The company has set out a long-term growth plan, with the intention of increasing annual sales from 8,000 to 14,000 cars per year.
Amongst the negative contributors were Spanish based global retailer Inditex, Swedish bank Svenska Handelsbanken and Japanese e-commerce stock Rakuten. The share price of the first two actually rose over the year, but simply lagged a strong index, while Rakuten's share price saw a single digit decline.
Inditex, the owner of the Zara retail chain, is a remarkable company with strong growth prospects as its 'fast fashion' model remains attractive around the globe, both offline and online. In the shorter term, however, it has been facing some currency headwinds. Svenska Handelsbanken has underperformed despite very stable profitability and robust capital ratios. Return on equity in its core domestic market sits at the mid-teens level, for example. This is a conservatively run bank however, and it has typically been more in favour during periods of higher volatility. We remain admirers of its distinctive business model. Rakuten meanwhile has delivered generally insipid results. Most recently, gross merchandise volume in the domestic ecommerce business grew 14%, which was at the low end of expectations. In the Fintech segment, top line growth was solid, but there were increased costs associated with the introduction of new systems in the Rakuten Card business. More recently, some sell side analysts have been worrying about the potential costs associated with the company's reported intention to acquire domestic telecoms wireless spectrum. We watch with interest to see if CEO Mikitani can execute with what he calls 'last mobile carrier advantage', given that they have little of the legacy baggage of incumbent wireless providers.
Investment Strategies used to manage the Fund
The investment strategy remains unchanged. The Fund invests in growth stocks based on bottom-up company analysis. In determining the potential of a company, we
01
Management Discussion (unaudited)
Annual Report December 31, 2017
analyse industry background, competitive advantage, management attitudes, financial strength, and valuation. We also consider whether we have a different view from the wider market. We think that the market, in general, is too short term and inward looking. Our ability to add value is derived from having a much longer time horizon and from our differentiated sources of information.
Annual turnover in the fund was 9% last year, which implies a typical holding period of over seven years. We believe that our ability to be patient, and our reputation as a long-term investor, allows us to develop much deeper relationships with management teams and to have more meaningful conversations with company leaders. Additionally, when formulating an investment opinion we
pay little heed to broker research, preferring to listen to alternative voices such as academia, authors, and independent experts.
Trading over the period
Our new buy and complete sale decisions, which are a result of our bottom up stock research are listed below:
New Buys:
Delivery Hero, Nidec, Umicore, Wix.Com
Complete Sales:
Aggreko, Celltrion, JD.Com, NAVER, Novo Nordisk
Fund Performance for the periods ended 12/31/17 (Average Annual Total Returns)
| | | One Year | | % p.a.
Five Year | | Since Inception
% p.a.
(March 6, 2008) | |
EAFE Fund Class 2* | | | 46.09 | % | | | 11.44 | % | | | 6.25 | % | |
MSCI EAFE Index | | | 25.62 | % | | | 8.39 | % | | | 3.48 | % | |
* The returns for Class 2 shares have been provided. One-year return figures for the other share classes are as follows: 46.20% for Class 3, 46.24% for Class 4, 46.31% for Class 5, 22.62% for Class K and 22.62% for Institutional Class, returns for Class K and Institutional Class are from Class inception date 04/28/2017. Additional year-over-year returns for each class are available in the Financial Highlights section.
Comparison of the change in value of $10,000 Investment in the Fund's Class 2 share and the index.

Past performance does not predict future performance. The graph and the table above do not reflect the deduction of taxes that a shareholder would pay on the Fund distributions or redemption of Fund shares.
02
Management Discussion (unaudited)
Annual Report December 31, 2017
EAFE Choice Fund
Market Conditions and Review of Performance during 2017
The past year once again demonstrated our belief that it is very difficult to predict short term market outcomes, and therefore not worthwhile trying to do so. As we reflect on 2017 and look forward to the future we continue to focus on the individual companies and the long term investment opportunities they present in international equity markets. This is not always an easy endeavour but we think it remains a very worthwhile one and one that will become increasingly so as the world changes around us at an ever faster rate. For those prepared to think optimistically about the long term it could be argued that there has seldom been a more exciting time, as new technologies enable the creation of new business models and set on course structural growth trends that could play out over decades. From ecommerce to artificial intelligence, electric vehicles to personalised medicine, the prizes for the winners could be vast, and the disruption for the losers catastrophic.
After three years of lacklustre returns, 2017 delivered a more encouraging year in international equity markets. The MSCI EAFE index returned 25.62% for the year as a whole, with returns for the Fund meaningfully ahead of this at 31.28% for class 2 shares.
Your portfolio's performance continues to be driven by stock selection rather than thematic or sector views; exactly as we would expect given our bottom-up stock picking approach to investment. Over the last year this has been particularly notable in the Consumer Staples and Healthcare sectors. Whilst both sectors have lagged behind the broader market at the index level, your holdings have contributed strongly to your portfolio's performance.
A number of technology innovators and enablers contributed favourably to performance over the past year. Continued robust operational delivery from companies such as Australian hearing implant manufacturer Cochlear, SMC — the Japanese factory automation component manufacturer, and Hargreaves Lansdown — the UK online savings platform have been strongly supportive to performance.
Over the year, the main detractors included Japanese manufacturer of bicycle components Shimano, Australian pallet pool operator Brambles, and UK online vehicle retail platform Auto Trader. Shimano has downgraded its
earnings forecasts; we believe that this reflects weakness in the overall bicycle market rather than a loss of share or competitiveness at the company itself. Brambles has seen challenges in its US business, where its main competitor has been pricing more aggressively, and where cheaper 'white wood' pallets have become more prevalent. Auto Trader's weakness reflects some cyclical concerns about the market for both new and used cars following the recent challenges in the diesel market.
The Fund holdings continue to offer exposure to a range of growing consumer franchises across the globe. This includes those such as luxury goods company Richemont, where centuries of history and heritage create a barrier to entry, to those such as online fashion retailer Zalando that are disrupting the established order in industries where an attachment to the past could prove a terminal disadvantage. With structural growth opportunities such as those highlighted above, and worldwide economic indicators looking as encouraging as at any time in recent years, there would appear to be plenty of reason to enter 2018 with an optimistic outlook. We believe that the Fund holds some of the most interesting growth companies across international markets, steered by high quality management teams, and we see the long-term opportunity for growth in these businesses as being undervalued by the short-term market valuations attached to them.
Investment Strategies used to manage the Fund
Baillie Gifford is a growth manager with a bottom-up approach to stock picking. Bottom-up investing is an investment approach that focuses on the analysis of individual stocks and deemphasizes the significant of economic cycles and market cycles. We aim to invest in companies that will generate sustainable earnings growth above the market over the long-term. In determining the potential of a company, we analyze industry background, competitive advantages, management capabilities, financial strength and valuation. From the outset, we also consider aspects which may derail the investment case and revisit the thesis for the Fund's holdings on a regular basis to ensure that our expectations are being met. The International Focus Portfolio Construction Group is responsible for the overall strategy and stock selection process. It meets regularly to discuss both buy and sell ideas and the level of conviction for existing holdings. Ongoing monitoring of the long-term prospects for the Fund's holdings enables appropriate changes to be made where applicable.
03
Management Discussion (unaudited)
Annual Report December 31, 2017
Trading over the period
Our new buy and complete sale decisions, which are a result of our bottom up stock research are listed below:
New Buys:
AIA, ASML, Advantest, MakeMyTrip, Raia Drogasil, Sartorius, Softbank, U-Blox
Complete Sales:
Asahi, Imagination Technologies, Pax Global Technology, Roche, Samsung Fire & Marine Insurance, Swatch, Unilever
Fund Performance for the periods ended 12/31/17 (Average Annual Total Returns)
| | | One Year | | % p.a.
Five Year | | Since Inception
% p.a.
(December 17, 2009) | |
EAFE Choice Fund Class 2* | | | 31.28 | % | | | 9.38 | % | | | 8.94 | % | |
MSCI EAFE Index | | | 25.62 | % | | | 8.39 | % | | | 6.98 | % | |
* The returns for Class 2 shares have been provided. One-year return figures for the other share classes are as follows: 31.37% for Class 3, 15.63% for Class K and 15.68% for Institutional Class, returns for Class K and Institutional Class are from Class inception date 04/28/2017. Additional year-over-year returns for each class are available in the Financial Highlights section.
Comparison of the change in value of $10,000 Investment in the Fund's Class 2 share and the index.

Past performance does not predict future performance. The graph and the table above do not reflect the deduction of taxes that a shareholder would pay on the Fund distributions or redemption of Fund shares.
04
Management Discussion (unaudited)
Annual Report December 31, 2017
EAFE Pure Fund
Market Conditions and Review of Performance during 2017
The past year once again demonstrated our belief that it is very difficult to predict short term market outcomes, and therefore not worthwhile trying to do so. As we reflect on 2017 and look forward to the future we continue to focus on the individual companies and the long term investment opportunities they present in international equity markets. This is not always an easy endeavour but we think it remains a very worthwhile one and one that will become increasingly so as the world changes around us at an ever faster rate. For those prepared to think optimistically about the long term it could be argued that there has seldom been a more exciting time, as new technologies enable the creation of new business models and set on course structural growth trends that could play out over decades. From ecommerce to artificial intelligence, electric vehicles to personalised medicine, the prizes for the winners could be vast, and the disruption for the losers catastrophic.
After three years of lacklustre returns, 2017 delivered a more encouraging year in international equity markets. The MSCI EAFE index returned 25.62% for the year as a whole, with returns for the Fund meaningfully ahead of this at 28.59% for class 2 shares.
Your portfolio's performance continues to be driven by stock selection rather than thematic or sector views; exactly as we would expect given our bottom-up stock picking approach to investment. Over the last year this has been particularly notable in the Consumer Staples and Healthcare sectors. Whilst both sectors have lagged behind the broader market at the index level, your holdings have contributed strongly to your portfolio's performance.
A number of technology innovators and enablers contributed favourably to performance over the past year. Continued robust operational delivery from companies such as Australian hearing implant manufacturer Cochlear, SMC — the Japanese factory automation component manufacturer, and Hargreaves Lansdown — the UK online savings platform have been strongly supportive to performance.
Over the year, the main detractors included Japanese manufacturer of bicycle components Shimano, Australian pallet pool operator Brambles, and UK online vehicle retail platform Auto Trader. Shimano has downgraded its
earnings forecasts; we believe that this reflects weakness in the overall bicycle market rather than a loss of share or competitiveness at the company itself. Brambles has seen challenges in its US business, where its main competitor has been pricing more aggressively, and where cheaper 'white wood' pallets have become more prevalent. Auto Trader's weakness reflects some cyclical concerns about the market for both new and used cars following the recent challenges in the diesel market.
The Fund holdings continue to offer exposure to a range of growing consumer franchises across the globe. This includes those such as luxury goods company Richemont, where centuries of history and heritage create a barrier to entry, to those such as online fashion retailer Zalando that are disrupting the established order in industries where an attachment to the past could prove a terminal disadvantage. With structural growth opportunities such as those highlighted above, and worldwide economic indicators looking as encouraging as at any time in recent years, there would appear to be plenty of reason to enter 2018 with an optimistic outlook. We believe that the Fund holds some of the most interesting growth companies across international markets, steered by high quality management teams, and we see the long-term opportunity for growth in these businesses as being undervalued by the short-term market valuations attached to them.
Investment Strategies used to manage the Fund
Baillie Gifford is a growth manager with a bottom-up approach to stock picking. Bottom-up investing is an investment approach that focuses on the analysis of individual stocks and deemphasizes the significant of economic cycles and market cycles. We aim to invest in companies that will generate sustainable earnings growth above the market over the long-term. In determining the potential of a company, we analyze industry background, competitive advantages, management capabilities, financial strength and valuation. From the outset, we also consider aspects which may derail the investment case and revisit the thesis for the Fund's holdings on a regular basis to ensure that our expectations are being met. The International Focus Portfolio Construction Group is responsible for the overall strategy and stock selection process. It meets regularly to discuss both buy and sell ideas and the level of conviction for existing holdings. Ongoing monitoring of the long-term prospects for the Fund's holdings enables appropriate changes to be made where applicable.
05
Management Discussion (unaudited)
Annual Report December 31, 2017
Trading over the period
Our new buy and complete sale decisions, which are a result of our bottom up stock research are listed below:
New Buys:
AIA, ASML, Advantest, Sartorius, Softbank, U-Blox
Complete Sales:
Asahi, Imagination Technologies, Roche, Swatch, Unilever
Fund Performance for the periods ended 12/31/17 (Average Annual Total Returns)
| | | One Year | | Since Inception
% p.a.
(April 15, 2014) | |
EAFE Pure Fund Class 2* | | | 28.59 | % | | | 6.54 | % | |
MSCI EAFE Index | | | 25.62 | % | | | 5.57 | % | |
* The returns for Class 2 shares have been provided. One-year return figures for the other share classes are as follows: 18.25% for Class 3 return for Class 3 is from inception date of 03/24/2017, 14.39% for Class K, and 14.39% for Institutional Class, returns for Class K and Institutional Class are from Class inception date 04/28/2017. Additional year-over-year returns for each class are available in the Financial Highlights section.
Comparison of the change in value of $10,000 Investment in the Fund's Class 2 share and the index.

Past performance does not predict future performance. The graph and the table above do not reflect the deduction of taxes that a shareholder would pay on the Fund distributions or redemption of Fund shares.
06
Management Discussion (unaudited)
Annual Report December 31, 2017
Emerging Markets Fund
Market Conditions and Review of Performance during 2017
We conclude 2017 in a positive vein, happy that the strong operational performance exhibited by many companies in the portfolio has been well rewarded by the market. However, with a weak 2016 still relatively fresh in mind, we remind ourselves that short term volatility is a prerequisite in the pursuit of long term returns in the Emerging Markets Fund, and ask shareholders to continue to judge performance over 3-5 years and beyond, which is the investment horizon of the fund.
The conditions for EM investors have been strong and sentiment to the asset class has significantly improved as a result: relatively stable commodities and EM currencies, combined with a strong global growth tailwind are very appealing conditions for US$ based EM equity investors.
The way we operate remains unchanged. There have been no changes to the investment managers running the fund and no change to our investment beliefs. We continue to seek out companies that we believe can double their earnings over five years and have faith that returns will follow.
Over 2017, the portfolio returned 53.25% for class 5 shares in US$ terms, significantly more than the MSCI EM index, which returned 37.75%. Many technology companies continued to perform well both operationally and in share price terms. Tencent and Alibaba were all amongst the leading lights. Both continue to display operational excellence within their core businesses of gaming and ecommerce, as well as in other 'non-core' operations.
Amongst this year's detractors were a number of stocks where further patience will be required. Cemex continues its slow deleveraging but cement remains a business with a unique attraction; it is heavy, but relatively low cost, making it uneconomic to transport long distances. It therefore lends itself to local and regional monopoly pricing. Magnit, the Russian convenience store retailer, has spent much of the year investing in a total refurbishment of its stores. This has crimped margins and sales in the short term, but should lead to a significant uplift in profitability when completed.
The improved prevailing conditions across Emerging Markets do mean that the number of attractive opportunities across the region has increased, in our view. This has meant that whilst we retain enthusiasm for many
of the structural growth stories in the Fund, the portfolio changes in 2017 have seen some more cyclical growth stocks enter the Fund, such as banks in several countries. We are enthusiastic on the prospects for credit growth in a low inflation and low (and in many countries, falling) interest rate environment.
Hopefully, 2018 will be a quieter year than 2017. This would allow the markets to focus on economic and company fundamentals, rather than the newest sound bite or the latest outbreak of 'fake news'. In terms of the fundamentals, a continued improvement in the global economy would be helpful to the emerging markets asset class and provide a broader range of potential investments. However, whatever the environment, we will continue to scour the emerging markets for the best long-term growth opportunities, wherever we may find them.
Investment Strategies used to manage the Fund
Baillie Gifford is a growth manager with a bottom-up approach to stock picking. We aim to invest in companies that will generate sustainable earnings growth above the market over the long term. In determining the potential of a company, we analyse the industry background, competitive advantage, management attitudes and financial strength, and finally we consider valuation. We meet the management of the companies within our investment universe and revisit the investment case for the Fund's holdings on a regular basis to ensure that our expectations are being met. The emerging markets investment team is responsible for the overall strategy and stock selection process, led by the most senior investment managers. The team meets regularly to discuss both buy and sell ideas and to determine the level of conviction in the Fund's holdings.
Trading over the period
Our new buy and complete sale decisions, which are a result of our bottom up stock research are listed below:
New Buys:
Bank Mandiri, Bank Rakyat Indonesia, BM&F Bovespa, China Merchants Bank, CNOOC, Garanti Bankasi, Grupo Financiero Banorte, Kasikorn Bank, Kroton Educacional, Maruti Suzuki, Minth Group, Netmarble Games, Norilsk Nickel, SEA Ltd, Siam Commercial Bank
07
Management Discussion (unaudited)
Annual Report December 31, 2017
Complete Sales:
Axis Bank, China Life Insurance (Taiwan), China Overseas Land, China Pacific Insurance, CTBC Financial Holding Co Ltd, Ctrip.com International, Delta Electronics, Embraer, Fubon Financial Holding Co,
Infosys Ltd, Interpark, Oracle Financial Services, Orion Holdings, POWSZECHNY ZAKLAD UBEZPIECZE, President Chain Store, Samsung SDI Co Ltd, SEA Ltd ADR, X5 Retail Group GDR
Fund Performance for the periods ended 12/31/17 (Average Annual Total Returns)
| | | One Year | | % p.a.
Five Year | | % p.a.
Ten Year | | Since Inception
% p.a.
(April 4, 2003) | |
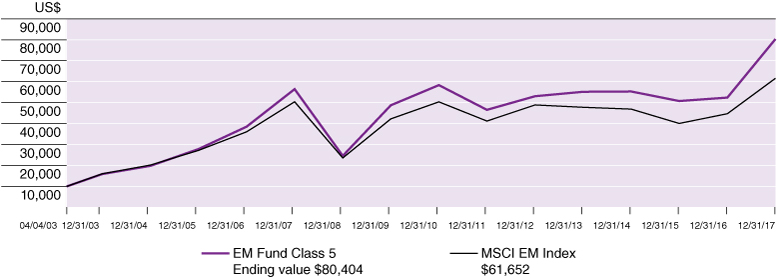
Emerging Markets Fund Class 5* | | | 53.25 | % | | | 8.64 | % | | | 3.59 | % | | | 15.19 | % | |
MSCI Emerging Markets Index | | | 37.75 | % | | | 4.73 | % | | | 2.02 | % | | | 13.13 | % | |
* The returns for Class 5 shares have been provided. Effective January 1, 2015, the share class structure of The Emerging Markets Fund was changed, and shares previously designated as Class III shares were converted to Class 5 shares. The performance information provided in the Fund Summary for Class 5 reflects the performance for Class III for periods prior to January 1, 2015. Class III shares were subject to a higher shareholder service fee than Class 5 shares, and no adjustment has been made to the performance information shown for Class 5 to reflect its different expense structure. One-year return figures for the other share classes are as follows: 53.02% for Class 2, 53.13% for Class 3, 27.57% for Class K and 27.61% for Institutional Class, returns for Class K and Institutional Class are from Class inception date 04/28/2017. Additional year-over-year returns for each class are available in the Financial Highlights section.
Comparison of the change in value of $10,000 Investment in the Fund's Class 5 share and the index.
Past performance does not predict future performance. The graph and the table above do not reflect the deduction of taxes that a shareholder would pay on the Fund distributions or redemption of Fund shares.
08
Management Discussion (unaudited)
Annual Report December 31, 2017
The Global Alpha Equity Fund
Market Conditions and Review of Performance during 2017
Some good things happened in the world during 2017. A quick look at the website for the Brookings Institution (a US-based think tank) lists, among other things, the unprecedented rate at which people entered the global middle class, falling poverty in the US, the extension of the limits of human longevity and an increasing number of countries in the world who have managed to grow their economies, whilst simultaneously reducing their emissions of greenhouse gasses. You may have missed some of these stories. The media seem to have a preference for more arresting headlines focussing on dysfunctional politics, natural disasters, conflicts and a 'little rocket man' with his finger on a nuclear button.
This mood music may have contributed to the sense that the dramatic gains we have seen in global equity markets since their nadir in the aftermath of the global financial crisis, have constituted the most unloved bull market in history. While the MSCI AC World index has returned over 185% (in USD) since the start of 2009, this has seemingly been accompanied by remarkably little enthusiasm. The one area of notable exception, has been in relation to a small number of companies loosely categorised as 'technology stocks'. This group, including companies such as Facebook, Amazon, and Alphabet in the US and Alibaba and Tencent in China, have been responsible for an outsized share of the overall market gains. As bottom-up optimistic investors the operational progress that many of these companies are reporting is not a surprise. Whilst a broadening of the global economic recovery has been supportive, they continue to prosper more by their own endeavours: identifying growth markets, retaining strong competitive positions through differentiated products and services, and maintaining a flexible managerial approach.
In the context of strong relative performance throughout 2017, a number of the portfolio's 'technology stocks' once again saw strong share price gains, most notably Amazon and Naspers. Amazon's latest results show that both e-commerce and Amazon Web Services' sales continue apace, and Alexa (voice activated personal assistant) has expanded its user base by more than 5x over the last year. Furthermore, success in sales of its own brand range of products (Amazon Essentials), the launch of its core ecommerce offering in Australia and promising signs of growth at Whole Foods Market (which it acquired last year) have all supported the share price. Naspers has been selling non-core assets to focus on its most attractive growth opportunities, indeed, 77% of Naspers' revenues is now derived online, up from 11% in 2007. These assets are
often in Emerging Markets where growth is supported by expanding middle classes, for example Naspers holdings in Tencent (China) and Mail.ru (Russia). The former continues to go from strength to strength. Tencent's payment platform (TenPay) more than tripled volumes last year, WeChat (social media) now has more than 900m monthly active users and Tencent's gaming business continues to grow its revenues handsomely.
Of course not everything goes to plan and the Fund's biggest detractors over the period include Apache (oil and gas exploration company) and First Republic Bank (US financial institution). The market has been growing increasingly impatient with Apache's operational performance. Whilst the most recent set of results showed a return to profitability, volumes were down, in part, the consequence of the company's cut in spending across 2016. Looking longer term, we believe Apache possesses an attractive asset base and the company will continue to leverage its advanced drilling techniques to support its return-focused approach. First Republic Bank's (FRB) customer base is predominantly high net worth individuals. Under US tax law, individuals are permitted to deduct mortgage interest payments from their taxable income. President Trump's recent tax legislation reduced the maximum loan amount that could qualify for deductibility to $750k from $1m. The market is now predicting a slowdown in the bank's loan book growth. We maintain enthusiasm for FRB's ability to prudently grow book value over the long term (+16% CAGR since 2010) and maintain its differentiating high-touch service model whilst expanding into new markets out with its Californian homeland.
Given the strong momentum enjoyed by a number of the Fund's holdings over the last year or so, we have continuously re-evaluated our enthusiasm. We have considered the remaining opportunities available to these businesses and ensured that we still retain a sufficiently differentiated view. Where we believe the market has caught up with our assessment, we have reinvested this capital elsewhere. Over the course of 2017, we have reduced the weightings of a number of the Fund's US-exposed cyclical companies. These include Martin Marietta Materials (construction aggregates and cement), Lincoln Electric (welding equipment and consumables), CarMax (second hand autos) and TD Ameritrade (online broking). Some of this capital has been put to work in the Fund's increasing exposure to Emerging Markets. In the past twelve months there were additions to two Indian financial holdings, ICICI Bank and HDFC. We made initial purchases of Banco Bradesco, one of the leading private sector banks in Brazil and 58.com, a Chinese online company that specialises in classified advertising for small businesses and individuals.
Overall, Fund turnover remains low. In the last twelve months it has been 15% on average with annual rate of 27%,
09
Management Discussion (unaudited)
Annual Report December 31, 2017
which implies that we own companies for 6-7 years on average.
We continue to cast the net widely for new ideas, with investment trips to Russia, India, China, Japan, Brazil, Europe and the US punctuating last year's research efforts. We fully expect there to more underappreciated good news stories during 2018. Our task is to continue to build a diverse collection of companies that see ongoing change in the world as an opportunity rather than a challenge.
Investment Strategies used to manage the Fund
We aim to invest in companies that will generate sustainable earnings growth above the market over the long term. In determining the potential of a company, we analyse industry background, competitive advantage, management attitudes and financial strength, and finally we consider valuation. We meet the management of the companies within our investment universe and revisit the investment case for the Fund's holdings on a regular basis
to ensure that our expectations are being met. The Global Alpha investment team is responsible for the overall strategy and stock selection process. They meet regularly as part of a Portfolio Review Group, along with representatives from each of Baillie Gifford's regional investment teams, to discuss both buy and sell ideas and the level of conviction in their continuing holdings.
Trading over the period
Our new buy and complete sale decisions, which are a result of our bottom up stock research are listed below:
New Buys: 58.Com, ABIOMED, Advanced Micro Devices, Advantest, AJ Gallagher & Co, AP Moller Maersk, Banco Bradesco, Infineon Technologies, Pernod Ricard, Persol Holdings, Philips Lighting, Siteone Landscape Supply, Thermo Fisher Scientific,
Complete Sales: Brambles, Carlsberg, Colgate-Palmolive, Ferrari, Intuitive Surgical, Monsanto, Qiagen, Rolls-Royce, TripAdvisor, Wolseley
Fund Performance for the periods ended 12/31/17 (Average Annual Total Returns)
| | | One Year | | % p.a.
Five Year | | Since Inception
% p.a.
(November 15, 2011) | |
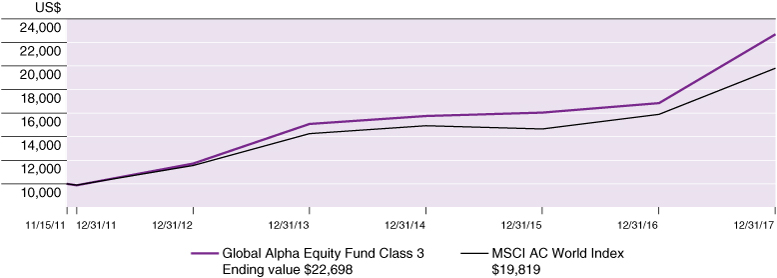
Global Alpha Equity Fund Class 3* | | | 34.65 | % | | | 14.13 | % | | | 14.32 | % | |
MSCI AC World Index | | | 24.62 | % | | | 11.40 | % | | | 11.81 | % | |
* The returns for Class 3 shares have been provided. One-year return figures for the other share classes are as follows: 34.56% for Class 2, 12.87% for Class 4, return for Class 4 is from inception date of 07/10/2017, 17.97% for Class K, and 18.03% for Institutional Class, returns for Class K and Institutional Class are from Class inception date 04/28/2017. Additional year-over-year returns for each class are available in the Financial Highlights section.
Comparison of the change in value of $10,000 Investment in the Fund's Class 3 share and the index.
Past performance does not predict future performance. The graph and the table above do not reflect the deduction of taxes that a shareholder would pay on the Fund distributions or redemption of Fund shares.
10
Management Discussion (unaudited)
Annual Report December 31, 2017
The International Equity Fund
Market Conditions and Review of Performance during 2017
2017 was an exceptional year for international equity markets. The MSCI ACWI ex U.S. Index rose 27.77%, its strongest performance since 2009, with all regions posting positive returns. Emerging Markets led the way, followed by Europe, Developed Asia, the UK and Canada.
The global economy gained momentum over the year, supported by notable pick ups in investment, trade, and industrial production, coupled with strengthening business and consumer confidence. The period was marked by a revival of the interest rate cycle with tightening from the low rates implemented in the wake of the financial crisis taking place in several markets, including the U.S. and the U.K.. Central banks have been lessening support of liquidity with quantitative easing programs ending or scaling back. Inflation has increased across most of the developed markets, though wage growth generally remains muted, despite tighter labor markets. GDP growth has been positive with Europe, a laggard in recovering from the financial crisis, experiencing an acceleration over the year and Japan continuing to experience strong growth in the wake of the 'Abenomics' stimulus. Despite concerns over geopolitical risks, Emerging Markets also fared well over 2017, outstripping their developed market counterparts in the international indices. In China, higher domestic demand has driven growth and emerging Europe and Russia also gained momentum. In Brazil, strong export performance and a diminished pace of contraction in domestic demand allowed the economy to return to positive growth after a protracted period of decline.
All good news, and the International Equity Fund generated substantial outperformance over the period. However, it is important for future expectations to remain well grounded. In the investment world we have a habit of dividing performance into quarters and years for reporting purposes. In reality, investment is a long game with no distinct finishing line. When researching potential investments for inclusion in the fund, we look out at least five years. It takes time for businesses to execute their long-term plans, to reap the enduring rewards, and for the stock market to recognise this success. Performance should be assessed over a similarly long period, and indeed, the fund has delivered strong
outperformance over three and five years, as it has since inception (February 7, 2008).
The International Equity Fund Class 2 returned 34.96% during 2017, outperforming the MSCI ACWI ex U.S. Index which returned 27.77% for the year.
A number of stocks contributed to this relative outperformance, lead by Naspers, the South African media conglomerate. One of the key challenges for the market remains establishing the value of the diverse investments held within the group beyond its large and listed Tencent (China) stake. To address this, the company focused its December capital markets day on various steps it plans to take to lower the share price discount to Net Asset Value (NAV). The company plans to improve disclosure around the Internal Rates of Return (IRR) it has achieved on investments outside of Tencent. Greater transparency should help investors better value the company's Portfolio of assets and more fully reflect the skill management have demonstrated in allocating capital.
Other contributors to outperformance include MercadoLibre, the South American e-commerce platform with an associated payments business. In order to avert the competitive threat posed by Amazon entering some of their markets, MercadoLibre has introduced a number of initiatives. Free delivery, akin to Amazon Prime, has proven the most successful of these, with the corresponding increase in Gross Merchandise Value (GMV) topping 68% in Brazil and 128% in Mexico year over year. Whilst this rollout has impacted short term margins (much as when Amazon launched Prime) we believe that the investment is a sensible one.
Samsung Electronics, the electronics company, was also among the top contributors to outperformance. Having also performed very well through 2016, on the back of anticipated corporate changes, namely increased pay-outs and share buybacks, a number of earnings reports through 2017 have highlighted rising memory prices and higher content in low and mid-end smartphones.
In terms of stocks which detracted from performance over the year, the Russian food retailer, Magnit, was first amongst these. The company is currently undergoing a new store roll out program in addition to an existing store refurbishment program. Both of these initiatives will be detrimental to near term margins for the benefit of long term margins and profitability. This has been known to us for some time.
Svenska Handelsbanken, the Swedish universal bank, produced strong financial numbers during the fourth
11
Management Discussion (unaudited)
Annual Report December 31, 2017
quarter but the stock has nevertheless been under pressure for much for the past year and detracted from performance. There was little negative news of long term significance, with the 'macro' picture cited as the biggest on-going concern. Swedish house prices are falling and housing starts are rising, which in combination could put pressure on mortgage volumes. Costs are rising as the bank invests more in information technology and in preparation for Brexit, as it transforms its U.K. operation from a branch structure to a subsidiary. We believe that both of these are temporary factors.
Another detractor is Shimano, the Japanese leisure company, which has built an enviable market share position in bicycle components, fishing equipment and related leisure pursuits, but like many stocks, now looks to China as its main growth market. Having grown strongly between 2011 and 2014, the market turned down in subsequent years. The key to further growth relies on higher component share per bicycle and the higher value of those components as new cycling enthusiasts trade up. With 70% share of the world market, we still believe Shimano is best positioned to exploit this opportunity.
Investment Strategies used to manage the Fund
Baillie Gifford is a growth manager with a bottom-up approach to stock picking. We aim to invest in companies that will generate sustainable earnings growth above that of the market over the long term. In determining the potential of a company, we analyse industry background, competitive advantage, management attitudes and financial strength, and finally we consider valuation. We
meet the management of companies within our investment universe and revisit the investment case for the portfolio's holdings on a regular basis to ensure that our expectations are being met.
The ACWI ex US Alpha Portfolio Construction Group is responsible for the overall strategy and stock selection process. They meet regularly to discuss both buy and sell ideas and the level of conviction for existing holdings and will continue to monitor the long-term prospects for the Fund's holdings and make changes where appropriate.
Trading over the period:
The new buys and complete sales for International Equity Fund during 2017, in alphabetical order are as follows:
New Buys:
Boohoo
Discovery
Grifols
Credit Suisse Group
Kingspan Group
Kroton Educacional
Complete sales:
LafargeHolcim
MS&AD Insurance
Tullow Oil
Volvo
Yandex
12
Management Discussion (unaudited)
Annual Report December 31, 2017
Fund Performance for the periods ended 12/31/17 (Average Annual Total Returns)
| | | One Year | | % p.a.
Five Year | | Since Inception
% p.a.
(February 7, 2008) | |
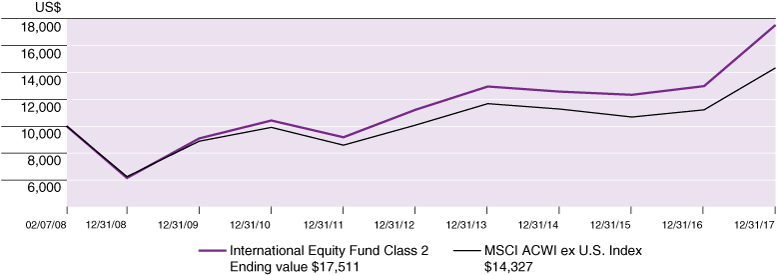
International Equity Fund Class 2* | | | 34.96 | % | | | 9.29 | % | | | 5.82 | % | |
MSCI ACWI Ex U.S. Index | | | 27.77 | % | | | 7.29 | % | | | 3.70 | % | |
* The returns for Class 2 shares have been provided. One-year return figures for the other share classes are as follows: 35.05% for Class 3, 12.60% for Class 4, return for Class 4 is from inception date of 07/10/2017, 35.16% for Class 5, 18.19% for Class K and 18.25% for Institutional Class, returns for Class K and Institutional Class are from Class inception date 04/28/2017. Additional year-over-year returns for each class are available in the Financial Highlights section.
Comparison of the change in value of $10,000 Investment in the Fund's Class 2 share and the index.
Past performance does not predict future performance. The graph and the table above do not reflect the deduction of taxes that a shareholder would pay on the Fund distributions or redemption of Fund shares.
13
Management Discussion (unaudited)
Annual Report December 31, 2017
The Long Term Global Growth Equity Fund
Market Conditions and Review of Performance during 2017
The operational performance of the portfolio has been remarkably strong over the past 12 months. While headlines during the year raised the spectre of nuclear war with North Korea, the return of the far-right in Germany's parliament and the ongoing uncertainty of Brexit (to cite just a few), we have endeavoured to ignore short-term market noise and focus instead on the long-term business fundamentals and opportunities for the holdings in the Fund.
Tencent and Alibaba were among the key positive contributors to performance. Tencent continues to impress and the most recent set of results has seen revenue growth accelerate to over 60% year on year. While games continue to account for around half of total sales, the company's ubiquitous WeChat social messaging platform (the largest of its kind in China) is also expanding its functionality, extending from chat to service use, to payments, and — most recently — to gaming. With so much on offer, this is an example of a large innovative company growing by broadening its scope into new areas.
Alibaba too is accomplishing the feat of generating accelerating revenue growth from an already high base: its most recent results report total revenues growing at over 60% year on year, and interestingly international ecommerce revenues (albeit relatively small) growing at 115%. 'Singles' Day' lived up to its reputation as the world's biggest 24 hour shopping bonanza. But while e-commerce remains the dominant top-line driver, Alibaba is also expanding into other areas: for instance, revenue growth of its cloud computing services is growing at nearly 100% year on year.
Among the key detractors from performance over the 12 month period, Under Armour's share price suffered last year following slowing sales growth in its domestic US market. Underlying these numbers is a shift away from wholesale customers and an increase in direct-to-consumer sales, which should be a long-term positive for the brand. We met with founder and CEO, Kevin Plank, and we were impressed with how receptive he was to our constructive feedback. Whilst we still admire the strength of the brand that he helped to cultivate through differentiated technical sports products and an astute recruitment of sporting talent, we think there is scope for
improvement in several areas, including board composition. As the largest outside shareholder of the company we can, and should, help Under Armour to address these areas through a combination of support and pressure for evolution. International sales, though only just over 1/5th of total sales continue to grow strongly at 35% year on year. We added on weakness in Q2 2017.
Also among the key detractors was Inditex, whose share price fell approximately 10% in 2017. The stronger Euro impacted the company's international revenues and profits. Nevertheless, its most recent results report sales growth at a group level of around 11% year on year, and positive across all geographies, with net income rising by 6%. Inditex now operates over 7,500 stores in 94 markets and continues to expand the regions covered by its online platform — notably launching Zara online in India in October 2017, and Singapore, Malaysia, Thailand and Vietnam earlier in the year. Zara accounts for about two-thirds of total sales with Oysho, Uterque, Bershka and Pull&Bear also performing strongly last year.
As ever, our focus remains on finding and holding companies that can appreciate five-fold over the next five or so years; this is a high bar, but we aim to own a small number of exceptional growth companies. Global equity markets continue to reach new highs, but generally operational performance among their constituents remains weak — as illustrated by the MSCI ACWI delivering 24.62% performance in 2017 while the compound annual revenue growth of its constituents has stagnated over the past five years. In contrast, the Fund continues to experience strong share price performance (the LTGG Fund Class 2 NAV performance was 54.07% in 2017), but which is outpaced by the strong aggregate operational performance of its holdings. In this environment, our role as stock-pickers therefore remains as relevant as ever in order to identify the small number of companies with the most compelling operational performance and opportunities for long-term growth.
Investment Strategies used to manage the Fund
Baillie Gifford is a growth manager with a bottom-up approach to stock picking. We aim to invest in companies that will generate sustainable earnings growth over the long term. In determining the potential of a company, we analyse industry background, competitive advantage, management attitudes and financial strength, and finally we consider valuation. We meet the management of the companies within our investment universe and revisit the
14
Management Discussion (unaudited)
Annual Report December 31, 2017
investment case for the Fund's holdings on a regular basis to ensure that our expectations are being met.
The Long Term Global Growth team is responsible for the overall strategy and stock selection process. They interact regularly to discuss both buy and sell ideas and the level of conviction for existing holdings and will continue to monitor the long-term prospects for the Fund's holdings and make changes where appropriate.
Trading over the period:
Our new buy and complete sale decisions, which are a result of our bottom-up stock research, are listed below:
New Buys: ASML, NetEase
Complete Sales: Splunk, TripAdvisor
Fund Performance for the periods ended 12/31/17 (Average Annual Total Returns)
| | | One Year | | Since Inception
% p.a.
(June 10, 2014) | |
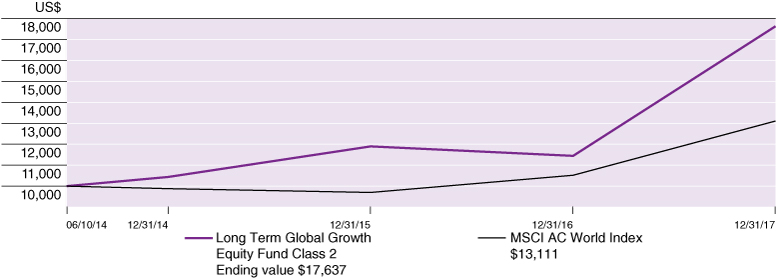
Long Term Global Growth Equity Fund Class 2* | | | 54.07 | % | | | 17.28 | % | |
MSCI AC World Index | | | 24.62 | % | | | 7.91 | % | |
* The returns for Class 2 shares have been provided. One-year return figures for the other share classes are as follows: 54.22% for Class 4, 24.21% for Class K, and 24.21% for Institutional Class, returns for Class K and Institutional Class are from Class inception date 04/28/2017. Additional year-over-year returns for each class are available in the Financial Highlights section.
Comparison of the change in value of $10,000 Investment in the Fund's Class 2 share and the index.
Past performance does not predict future performance. The graph and the table above do not reflect the deduction of taxes that a shareholder would pay on the Fund distributions or redemption of Fund shares.
15
Management Discussion (unaudited)
Annual Report December 31, 2017
The U.S. Equity Growth Fund
Market Conditions and Review of Performance during 2017
2017 was a year of firsts: the first year of President Trump; the first time the Dow Jones industrial average rose 5,000 points in a year in its 121 year history. 2017 witnessed the most radical reform to U.S. tax legislation for a generation; and the first time since 2004 that annualised U.S. GDP figures were above 3% for consecutive quarters. Yet it was also the first time in 60 years that the Doomsday Clock was reset to 2 minutes, 30 seconds to midnight reflecting the ominous developments in North Korea's nuclear weapon capabilities, and the President's responses through twitter diplomacy, "fire and fury" statements and eventual UN-backed sanctions. And it was the year that saw the first country announce that it was pulling out of the Paris climate change agreement (the U.S.). Dramatic though this backdrop undoubtedly is, as stock-pickers we focus on the progression of a few exceptional businesses which are often disrupting their markets, creating new industries and changing the way we consume, or improving our chances of living longer, healthier lives.
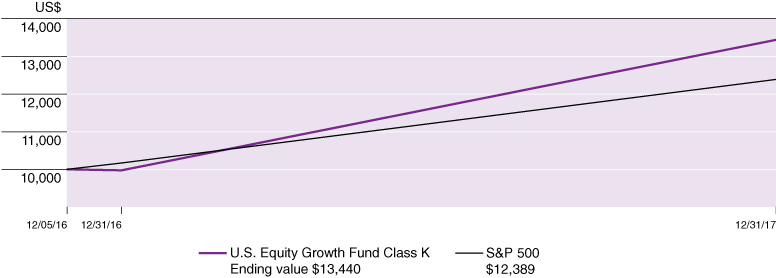
2017 marked the first full year of investment returns for Baillie Gifford's U.S. Equity Growth Fund. We launched the U.S. Equity Growth Fund because we believe the U.S. equity market to be one of the most attractive asset classes for growth investors. The U.S. economy grew at a decent rate in 2017, unemployment is low and there are few signs of inflation which allows the Federal Reserve to gradually raise interest rates and withdraw stimulus. Most importantly from a stock market perspective, company level revenue and earnings growth have been strong which has contributed to healthy returns for investors. The Fund's K class share returned 34.75%, significantly outperforming the S&P 500 index return of 21.83%. While we are quietly pleased with this level of performance, it is still a short term performance number and must be viewed in the context of our five year investment horizon.
We construct the Fund's portfolio on a 'bottom-up' basis. As a result the majority of performance was driven by stock selection. Two of the top performing holdings in the Fund in 2017 were innovative ecommerce platforms: Amazon and Grubhub. Amazon, the internet platform and cloud computing behemoth, continued to grow its revenues in its major business segments: ecommerce, Prime membership and Amazon Web Services. And the
company continues with its high-investment, low-profit strategy. Amazon's $13.7bn acquisition of healthy grocery store chain, Whole Foods, in August, was seen by many in the market as a significant strategic move that could have far reaching consequences for other grocery companies, retailers, food delivery companies and even restaurant chains. Furthermore, developments such as Amazon Echo, Amazon's smart speaker product with its virtual assistant Alexa, offer exciting new avenues of growth with tens of thousands of developers now integrating Alexa into their products.
Grubhub, the online food ordering company, saw its share price appreciate particularly strongly. The main drivers for this were some key acquisitions of rival food ordering companies, such as Eat24, Foodler and OrderUp, and the announcement of a strategic long-term partnership with Yelp, the online crowd-sourced review app and booking service, which should be beneficial for both companies. Following these acquisitions, Grubhub now has access to over 75,000 restaurants in the U.S. and is four times larger than the next biggest online food delivery platform. We believe Grubhub is both benefiting from, and helping to direct, the secular shift in food consumption behaviours in America.
Holdings in the Healthcare sector contributed to outperformance. We've invested in a number of innovative health care businesses who are at the leading edge of data-driven, machine learning and/or therapeutic research which offers reduced costs, earlier diagnosis and significantly improved outcomes for patients. One notable contributor to performance this year was Alnylam Pharmaceuticals. It announced positive results for the Phase 3 trial of Patisiran, an RNA inhibitor (RNAi) treatment which effectively 'silences' a disease-causing gene in a rare debilitating genetic disease. The trial results demonstrated the best-case scenario in terms of both efficacy and safety. The results are exciting because they potentially herald a new era of highly targeted and specific interventions in genetic diseases.
Two of the main detractors to the Fund's performance were the sports apparel company, Under Armour, and the San Francisco-based bank, First Republic. Under Armour faced significant headwinds during the year, and its share price suffered as a result. Bankruptcies in several sportswear chains in 2016 led to an excess of inventory, which in turn led to a significant discounting of products. As a result, it released disappointing 2016 earnings data. The company's fortunes didn't improve during the year: it struggled in its traditional market, North America, with its sports apparel seemingly off-trend as rivals took
16
Management Discussion (unaudited)
Annual Report December 31, 2017
market share; October saw its first quarterly sales decline since it became a public company in 2005. While the opportunity in the footwear market and international expansion offer growth opportunities for Under Armour, we are watching it closely to see how it progresses.
First Republic Bank underperformed. The market reacted negatively to its announcement that it wasn't earning as much money from loans as anticipated and that expenses were higher than expected. We view the market's reaction as overly short term: compression in the net interest margin was largely due to increased deposit costs, which management view as a one-off adjustment to catch up with the interest rates being offered at other banks; the higher than expected expense growth was driven by investments in new initiatives (such as the student loan business, which we expect to drive faster growth in the long term) and higher technology spending.
One other notable detractor was online travel site, TripAdvisor. The investment case for TripAdvisor was based on the network effect of the community of reviewers creating strong content which would attract other travellers. The company has been trying to change its business model so that more users book directly through its site, however this transition has encountered several difficulties exacerbated by more users engaging via mobile devices. With strong competitors in the shape of Priceline and Expedia, we became increasingly worried that the costs of driving such user changes will keep margins significantly lower for longer. We think growth rates going forward are unlikely to match those achieved historically therefore decided to sell the holding at the end of 2017.
Over the past year we have invested in a wide range of innovative growth companies which meet our requirements of possessing a differentiated culture and
sustainable competitive advantage while at the same time addressing a large growth opportunity.
Investment strategies used to manage the fund
The Fund seeks to meet its objective by identifying the exceptional growth businesses and owning them for long enough that the advantages of their business models and cultural strengths become the dominant drivers of their stock prices. Our long-term time horizon allows us to capture the disproportionate impact of successful investments, harnessing the asymmetry of returns inherent in equity markets.
In our terms, an exceptional growth business has a special culture, addresses a large market opportunity and possesses an edge that will allow it to deliver high future returns. Such opportunities are rare. The Fund is concentrated as we do not want to dilute the impact of exceptional companies in the name of diversification.
Trading over the period
Our new buy and complete sale decisions, which are a result of our bottom up stock research are listed below:
New Buys:
Activision Blizzard, Denali Therapeutics, Glaukos Corp, HEICO, New Relic, Redfin, Shopify, Stitch Fix
Complete Sales:
Bristol Myers Squibb, Brown-Forman, CarMax, Chipotle Mexican Grill, Harley-Davidson, M&T Bank, O'Reilly Automotive, TripAdvisor
17
Management Discussion (unaudited)
Annual Report December 31, 2017
Fund Performance for the periods ended 12/31/17 (Average Annual Total Returns)
| | | One Year | | Since Inception
% p.a.
(December 5, 2016) | |
U.S. Equity Growth Fund Class K* | | | 34.75 | % | | | 31.79 | % | |
S&P 500 | | | 21.83 | % | | | 22.26 | % | |
* The returns for Class K shares have been provided. The inception date for The U.S. Equity Growth Fund is December 5, 2016, when Baillie Gifford International, LLC purchased Class 1 shares. Classes 1-5 of The U.S. Equity Growth Fund were terminated effective May 1, 2017, and Class 1 was converted to Class K. For the purposes of the total return data and other data reflected in the Fund's management discussion, the Fund has used December 5, 2016 as its inception date for Class K. One-year return figures for the other share classes are as follows: 17.01% for Institutional Class, return for Institutional Class is from Class inception date 04/28/2017. Additional year-over-year returns for each class are available in the Financial Highlights section.
Comparison of the change in value of $10,000 Investment in the Fund's Class K share and the index.
Past performance does not predict future performance. The graph and the table above do not reflect the deduction of taxes that a shareholder would pay on the Fund distributions or redemption of Fund shares.
18
Management Discussion (unaudited)
Annual Report December 31, 2017
International Choice Fund
Market Conditions and Review of Performance during 2017
The past year once again demonstrated our belief that it is very difficult to predict short term market outcomes, and therefore not worthwhile trying to do so. As we reflect on 2017 and look forward to the future we continue to focus on the individual companies and the long term investment opportunities they present in international equity markets. This is not always an easy endeavour but we think it remains a very worthwhile one and one that will become increasingly so as the world changes around us at an ever faster rate. For those prepared to think optimistically about the long term it could be argued that there has seldom been a more exciting time, as new technologies enable the creation of new business models and set on course structural growth trends that could play out over decades. From ecommerce to artificial intelligence, electric vehicles to personalised medicine, the prizes for the winners could be vast, and the disruption for the losers catastrophic.
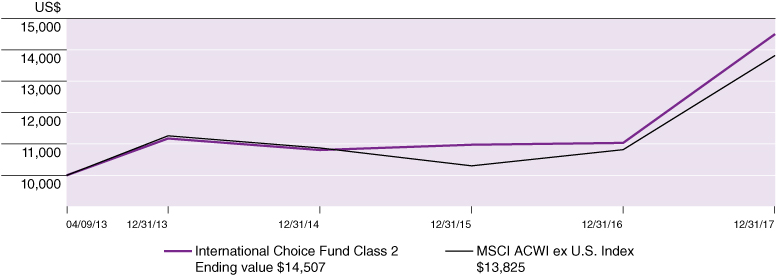
After three years of lacklustre returns, 2017 delivered a more encouraging year in international equity markets. The MSCI ACWI ex US index returned 27.77% for the year, with returns for the Fund meaningfully ahead of this at 31.45% for class 2 shares.
Your portfolio's performance continues to be driven by stock selection rather than thematic or sector views; exactly as we would expect given our bottom-up stock picking approach to investment. Over the last year this has been particularly notable in the Consumer Staples and Healthcare sectors. Whilst both sectors have lagged behind the broader market at the index level, your holdings have contributed strongly to your portfolio's performance.
A number of technology innovators and enablers contributed favourably to performance over the past year. Continued robust operational delivery from companies such as Australian hearing implant manufacturer Cochlear, SMC — the Japanese factory automation component manufacturer, and Hargreaves Lansdown — the UK online savings platform have been strongly supportive to performance.
Over the year, the main detractors included Japanese manufacturer of bicycle components Shimano, Australian pallet pool operator Brambles, and UK online vehicle retail platform Auto Trader. Shimano has downgraded its
earnings forecasts; we believe that this reflects weakness in the overall bicycle market rather than a loss of share or competitiveness at the company itself. Brambles has seen challenges in its US business, where its main competitor has been pricing more aggressively, and where cheaper 'white wood' pallets have become more prevalent. Auto Trader's weakness reflects some cyclical concerns about the market for both new and used cars following the recent challenges in the diesel market.
The Fund holdings continue to offer exposure to a range of growing consumer franchises across the globe. This includes those such as luxury goods company Richemont, where centuries of history and heritage create a barrier to entry, to those such as online fashion retailer Zalando that are disrupting the established order in industries where an attachment to the past could prove a terminal disadvantage. With structural growth opportunities such as those highlighted above, and worldwide economic indicators looking as encouraging as at any time in recent years, there would appear to be plenty of reason to enter 2018 with an optimistic outlook. We believe that the Fund holds some of the most interesting growth companies across international markets, steered by high quality management teams, and we see the long-term opportunity for growth in these businesses as being undervalued by the short-term market valuations attached to them.
Investment Strategies used to manage the Fund
Baillie Gifford is a growth manager with a bottom-up approach to stock picking. Bottom-up investing is an investment approach that focuses on the analysis of individual stocks and deemphasizes the significant of economic cycles and market cycles. We aim to invest in companies that will generate sustainable earnings growth above the market over the long-term. In determining the potential of a company, we analyze industry background, competitive advantages, management capabilities, financial strength and valuation. From the outset, we also consider aspects which may derail the investment case and revisit the thesis for the Fund's holdings on a regular basis to ensure that our expectations are being met. The International Focus Portfolio Construction Group is responsible for the overall strategy and stock selection process. It meets regularly to discuss both buy and sell ideas and the level of conviction for existing holdings. Ongoing monitoring of the long-term prospects for the Fund's holdings enables appropriate changes to be made where applicable.
19
Management Discussion (unaudited)
Annual Report December 31, 2017
Trading over the period
Our new buy and complete sale decisions, which are a result of our bottom up stock research are listed below:
New Buys:
AIA, ASML, Advantest, Asian Paints, Fairfax, HDFC, Magnit, MakeMyTrip, Naver, Raia Drogasil, Sartorius, Shopify, Softbank, U-Blox
Complete Sales:
Asahi, Imagination Technologies, Pax Global Technology, Roche, Swatch, Unilever
Fund Performance for the periods ended 12/31/17 (Average Annual Total Returns)
| | | One Year | | Since Inception
% p.a.
(April 9, 2013) | |
International Choice Fund Class 2* | | | 31.45 | % | | | 8.20 | % | |
MSCI ACWI ex U.S. Index | | | 27.77 | % | | | 7.78 | % | |
* The returns for Class 2 shares have been provided. One-year return figures for the other share classes are as follows: 31.54% for Class 3 and 19.56% for Class 4, return for Class 4 is from inception date of 04/03/2017. Additional year-over-year returns for each class are available in the Financial Highlights section.
Comparison of the change in value of $10,000 Investment in the Fund's Class 2 share and the index.
Past performance does not predict future performance. The graph and the table above do not reflect the deduction of taxes that a shareholder would pay on the Fund distributions or redemption of Fund shares.
20
Fund Expenses (unaudited)
Annual Report December 31, 2017
As a shareholder of the Baillie Gifford EAFE Fund, the Baillie Gifford EAFE Choice Fund, the Baillie Gifford EAFE Pure Fund, the Baillie Gifford Emerging Markets Fund, the Baillie Gifford Global Alpha Equity Fund, the Baillie Gifford Global Select Equity Fund, the Baillie Gifford International Concentrated Growth Fund, the Baillie Gifford International Equity Fund, the Baillie Gifford Long Term Global Growth Equity Fund, the Baillie Gifford Positive Change Equity Fund, the Baillie Gifford U.S. Equity Growth Fund and the Baillie Gifford International Choice Fund (together, the "Funds") you incur ongoing costs, including management fees, shareholder service fees and other Fund expenses. This example is intended to help you understand your ongoing costs (in dollars) of investing in the Funds and to compare these costs with the ongoing costs of investing in the other mutual funds.
The example is based on an investment of $1,000 invested at the beginning of the period and held for the entire period from July 1, 2017 to December 31, 2017.
Actual Expenses
The first line of each table provides information about actual account values and actual expenses. You may use the information in this line, together with the amount you invested, to estimate the expenses that you paid over the period. Simply divide the account value by $1,000 (for example, an $8,600 account value divided by $1,000 = 8.6), then multiply the result by the number in the first line under the heading entitled "Expenses Paid During the Period" to estimate the expenses you paid on your account during this period.
Hypothetical Example for Comparison Purposes
The second line of each table on the following page provides information about hypothetical account values and hypothetical expenses based on the Fund's actual expense ratio and an assumed annual rate of return of 5% before expenses, which is not the Fund's actual return.
The hypothetical account values and expenses may not be used to estimate the actual ending account balance or expenses you paid for the period. You may use this information to compare the ongoing costs of investing in the Fund and other funds by comparing this 5% hypothetical example with the 5% hypothetical examples that appear in the shareholder reports of other funds.
Please note that the expenses shown in the table are meant to highlight your ongoing costs only and do not reflect any transactional costs. Therefore, the second line of the table is useful in comparing ongoing costs only, and will not help you determine the relative total costs of owning different funds. In addition, if these transactional costs were included, your costs would have been higher.
21
Fund Expenses (unaudited)
Annual Report December 31, 2017
| | | Beginning
Account Value
7/01/17 | | Ending
Account
Value
12/31/17 | | Annualized
Expense Ratios
Based on the Period
7/01/17 to 12/31/17 | | Expenses Paid(1)
During Period | |
Baillie Gifford EAFE Fund — Class 2 | |
Actual | | $ | 1,000 | | | $ | 1,165.00 | | | | 0.61 | % | | $ | 3.33 | | |
Hypothetical (5% return before expenses) | | $ | 1,000 | | | $ | 1,022.13 | | | | 0.61 | % | | $ | 3.11 | | |
Baillie Gifford EAFE Fund — Class 3 | |
Actual | | $ | 1,000 | | | $ | 1,165.40 | | | | 0.54 | % | | $ | 2.95 | | |
Hypothetical (5% return before expenses) | | $ | 1,000 | | | $ | 1,022.48 | | | | 0.54 | % | | $ | 2.75 | | |
Baillie Gifford EAFE Fund — Class 4 | |
Actual | | $ | 1,000 | | | $ | 1,165.60 | | | | 0.51 | % | | $ | 2.78 | | |
Hypothetical (5% return before expenses) | | $ | 1,000 | | | $ | 1,022.63 | | | | 0.51 | % | | $ | 2.60 | | |
Baillie Gifford EAFE Fund — Class 5 | |
Actual | | $ | 1,000 | | | $ | 1,165.90 | | | | 0.46 | % | | $ | 2.51 | | |
Hypothetical (5% return before expenses) | | $ | 1,000 | | | $ | 1,022.89 | | | | 0.46 | % | | $ | 2.35 | | |
Baillie Gifford EAFE Fund — Class K | |
Actual | | $ | 1,000 | | | $ | 1,165.20 | | | | 0.61 | % | | $ | 3.33 | | |
Hypothetical (5% return before expenses) | | $ | 1,000 | | | $ | 1,022.13 | | | | 0.61 | % | | $ | 3.11 | | |
Baillie Gifford EAFE Fund — Institutional Class | |
Actual | | $ | 1,000 | | | $ | 1,165.20 | | | | 0.61 | % | | $ | 3.33 | | |
Hypothetical (5% return before expenses) | | $ | 1,000 | | | $ | 1,022.13 | | | | 0.61 | % | | $ | 3.11 | | |
Baillie Gifford EAFE Choice Fund — Class 2 | |
Actual | | $ | 1,000 | | | $ | 1,097.50 | | | | 0.69 | % | | $ | 3.65 | | |
Hypothetical (5% return before expenses) | | $ | 1,000 | | | $ | 1,021.73 | | | | 0.69 | % | | $ | 3.52 | | |
Baillie Gifford EAFE Choice Fund — Class 3 | |
Actual | | $ | 1,000 | | | $ | 1,097.80 | | | | 0.63 | % | | $ | 3.33 | | |
Hypothetical (5% return before expenses) | | $ | 1,000 | | | $ | 1,022.03 | | | | 0.63 | % | | $ | 3.21 | | |
Baillie Gifford EAFE Choice Fund — Class K | |
Actual | | $ | 1,000 | | | $ | 1,097.40 | | | | 0.70 | % | | $ | 3.70 | | |
Hypothetical (5% return before expenses) | | $ | 1,000 | | | $ | 1,021.68 | | | | 0.70 | % | | $ | 3.57 | | |
22
Fund Expenses (unaudited)
Annual Report December 31, 2017
| | | Beginning
Account Value
7/01/17 | | Ending
Account
Value
12/31/17 | | Annualized
Expense Ratios
Based on the Period
7/01/17 to 12/31/17 | | Expenses Paid(1)
During Period | |
Baillie Gifford EAFE Choice Fund — Institutional Class | |
Actual | | $ | 1,000 | | | $ | 1,097.80 | | | | 0.80 | % | | $ | 4.23 | | |
Hypothetical (5% return before expenses) | | $ | 1,000 | | | $ | 1,021.17 | | | | 0.80 | % | | $ | 4.08 | | |
Baillie Gifford EAFE Pure Fund — Class 2 | |
Actual | | $ | 1,000 | | | $ | 1,086.10 | | | | 0.67 | % | | $ | 3.52 | | |
Hypothetical (5% return before expenses) | | $ | 1,000 | | | $ | 1,021.83 | | | | 0.67 | % | | $ | 3.41 | | |
Baillie Gifford EAFE Pure Fund — Class 3 | |
Actual | | $ | 1,000 | | | $ | 1,086.50 | | | | 0.60 | % | | $ | 3.16 | | |
Hypothetical (5% return before expenses) | | $ | 1,000 | | | $ | 1,022.18 | | | | 0.60 | % | | $ | 3.06 | | |
Baillie Gifford EAFE Pure Fund — Class K | |
Actual | | $ | 1,000 | | | $ | 1,087.20 | | | | 0.67 | % | | $ | 3.52 | | |
Hypothetical (5% return before expenses) | | $ | 1,000 | | | $ | 1,021.83 | | | | 0.67 | % | | $ | 3.41 | | |
Baillie Gifford EAFE Pure Fund — Institutional Class | |
Actual | | $ | 1,000 | | | $ | 1,087.20 | | | | 0.67 | % | | $ | 3.52 | | |
Hypothetical (5% return before expenses) | | $ | 1,000 | | | $ | 1,021.83 | | | | 0.67 | % | | $ | 3.41 | | |
Baillie Gifford Emerging Markets Fund — Class 2 | |
Actual | | $ | 1,000 | | | $ | 1,204.40 | | | | 0.85 | % | | $ | 4.72 | | |
Hypothetical (5% return before expenses) | | $ | 1,000 | | | $ | 1,020.92 | | | | 0.85 | % | | $ | 4.33 | | |
Baillie Gifford Emerging Markets Fund — Class 3 | |
Actual | | $ | 1,000 | | | $ | 1,204.80 | | | | 0.78 | % | | $ | 4.33 | | |
Hypothetical (5% return before expenses) | | $ | 1,000 | | | $ | 1,021.27 | | | | 0.78 | % | | $ | 3.97 | | |
Baillie Gifford Emerging Markets Fund — Class 5 | |
Actual | | $ | 1,000 | | | $ | 1,205.30 | | | | 0.70 | % | | $ | 3.89 | | |
Hypothetical (5% return before expenses) | | $ | 1,000 | | | $ | 1,021.68 | | | | 0.70 | % | | $ | 3.57 | | |
Baillie Gifford Emerging Markets Fund — Class K | |
Actual | | $ | 1,000 | | | $ | 1,204.30 | | | | 0.86 | % | | $ | 4.78 | | |
Hypothetical (5% return before expenses) | | $ | 1,000 | | | $ | 1,020.87 | | | | 0.86 | % | | $ | 4.38 | | |
23
Fund Expenses (unaudited)
Annual Report December 31, 2017
| | | Beginning
Account Value
7/01/17 | | Ending
Account
Value
12/31/17 | | Annualized
Expense Ratios
Based on the Period
7/01/17 to 12/31/17 | | Expenses Paid(1)
During Period | |
Baillie Gifford Emerging Markets Fund — Institutional Class | |
Actual | | $ | 1,000 | | | $ | 1,204.60 | | | | 0.86 | % | | $ | 4.78 | | |
Hypothetical (5% return before expenses) | | $ | 1,000 | | | $ | 1,020.87 | | | | 0.86 | % | | $ | 4.38 | | |
Baillie Gifford Global Alpha Equity Fund — Class 2 | |
Actual | | $ | 1,000 | | | $ | 1,132.20 | | | | 0.68 | % | | $ | 3.65 | | |
Hypothetical (5% return before expenses) | | $ | 1,000 | | | $ | 1,021.78 | | | | 0.68 | % | | $ | 3.47 | | |
Baillie Gifford Global Alpha Equity Fund — Class 3 | |
Actual | | $ | 1,000 | | | $ | 1,132.60 | | | | 0.61 | % | | $ | 3.28 | | |
Hypothetical (5% return before expenses) | | $ | 1,000 | | | $ | 1,022.13 | | | | 0.61 | % | | $ | 3.11 | | |
Baillie Gifford Global Alpha Equity Fund — Class 4 | |
Actual* | | $ | 1,000 | | | $ | 1,128.70 | | | | 0.58 | % | | $ | 2.96 | | |
Hypothetical (5% return before expenses) | | $ | 1,000 | | | $ | 1,022.28 | | | | 0.58 | % | | $ | 2.96 | | |
Baillie Gifford Global Alpha Equity Fund — Class K | |
Actual | | $ | 1,000 | | | $ | 1,131.80 | | | | 0.69 | % | | $ | 3.71 | | |
Hypothetical (5% return before expenses) | | $ | 1,000 | | | $ | 1,021.73 | | | | 0.69 | % | | $ | 3.52 | | |
Baillie Gifford Global Alpha Equity Fund — Institutional Class | |
Actual | | $ | 1,000 | | | $ | 1,132.40 | | | | 0.68 | % | | $ | 3.65 | | |
Hypothetical (5% return before expenses) | | $ | 1,000 | | | $ | 1,021.78 | | | | 0.68 | % | | $ | 3.47 | | |
Baillie Gifford Global Select Equity Fund — Class K | |
Actual** | | $ | 1,000 | | | $ | 1,015.00 | | | | 0.65 | % | | $ | 0.32 | | |
Hypothetical (5% return before expenses) | | $ | 1,000 | | | $ | 1,021.93 | | | | 0.65 | % | | $ | 3.31 | | |
Baillie Gifford Global Select Equity Fund — Institutional Class | |
Actual** | | $ | 1,000 | | | $ | 1,015.00 | | | | 0.80 | % | | $ | 0.40 | | |
Hypothetical (5% return before expenses) | | $ | 1,000 | | | $ | 1,021.17 | | | | 0.80 | % | | $ | 4.08 | | |
Baillie Gifford International Concentrated Growth Fund — Class K | |
Actual** | | $ | 1,000 | | | $ | 1,005.00 | | | | 0.72 | % | | $ | 0.36 | | |
Hypothetical (5% return before expenses) | | $ | 1,000 | | | $ | 1,021.58 | | | | 0.72 | % | | $ | 3.67 | | |
24
Fund Expenses (unaudited)
Annual Report December 31, 2017
| | | Beginning
Account Value
7/01/17 | | Ending
Account
Value
12/31/17 | | Annualized
Expense Ratios
Based on the Period
7/01/17 to 12/31/17 | | Expenses Paid(1)
During Period | |
Baillie Gifford International Concentrated Growth Fund — Institutional Class | |
Actual** | | $ | 1,000 | | | $ | 1,005.00 | | | | 0.87 | % | | $ | 0.43 | | |
Hypothetical (5% return before expenses) | | $ | 1,000 | | | $ | 1,020.82 | | | | 0.87 | % | | $ | 4.43 | | |
Baillie Gifford International Equity Fund — Class 2 | |
Actual | | $ | 1,000 | | | $ | 1,123.80 | | | | 0.62 | % | | $ | 3.32 | | |
Hypothetical (5% return before expenses) | | $ | 1,000 | | | $ | 1,022.08 | | | | 0.62 | % | | $ | 3.16 | | |
Baillie Gifford International Equity Fund — Class 3 | |
Actual | | $ | 1,000 | | | $ | 1,124.20 | | | | 0.55 | % | | $ | 2.94 | | |
Hypothetical (5% return before expenses) | | $ | 1,000 | | | $ | 1,022.43 | | | | 0.55 | % | | $ | 2.80 | | |
Baillie Gifford International Equity Fund — Class 4 | |
Actual* | | $ | 1,000 | | | $ | 1,126.00 | | | | 0.53 | % | | $ | 2.70 | | |
Hypothetical (5% return before expenses) | | $ | 1,000 | | | $ | 1,022.53 | | | | 0.53 | % | | $ | 2.70 | | |
Baillie Gifford International Equity Fund — Class 5 | |
Actual | | $ | 1,000 | | | $ | 1,124.60 | | | | 0.47 | % | | $ | 2.52 | | |
Hypothetical (5% return before expenses) | | $ | 1,000 | | | $ | 1,022.84 | | | | 0.47 | % | | $ | 2.40 | | |
Baillie Gifford International Equity Fund — Class K | |
Actual | | $ | 1,000 | | | $ | 1,123.20 | | | | 0.65 | % | | $ | 3.48 | | |
Hypothetical (5% return before expenses) | | $ | 1,000 | | | $ | 1,021.93 | | | | 0.65 | % | | $ | 3.31 | | |
Baillie Gifford International Equity Fund — Institutional Class | |
Actual | | $ | 1,000 | | | $ | 1,123.80 | | | | 0.62 | % | | $ | 3.32 | | |
Hypothetical (5% return before expenses) | | $ | 1,000 | | | $ | 1,022.08 | | | | 0.62 | % | | $ | 3.16 | | |
Baillie Gifford Long Term Global Growth Equity Fund — Class 2 | |
Actual | | $ | 1,000 | | | $ | 1,172.70 | | | | 0.77 | % | | $ | 4.42 | | |
Hypothetical (5% return before expenses) | | $ | 1,000 | | | $ | 1,021.32 | | | | 0.77 | % | | $ | 3.92 | | |
Baillie Gifford Long Term Global Growth Equity Fund — Class 4 | |
Actual | | $ | 1,000 | | | $ | 1,173.30 | | | | 0.67 | % | | $ | 3.67 | | |
Hypothetical (5% return before expenses) | | $ | 1,000 | | | $ | 1,021.83 | | | | 0.67 | % | | $ | 3.41 | | |
25
Fund Expenses (unaudited)
Annual Report December 31, 2017
| | | Beginning
Account Value
7/01/17 | | Ending
Account
Value
12/31/17 | | Annualized
Expense Ratios
Based on the Period
7/01/17 to 12/31/17 | | Expenses Paid(1)
During Period | |
Baillie Gifford Long Term Global Growth Equity Fund — Class K | |
Actual | | $ | 1,000 | | | $ | 1,172.40 | | | | 0.77 | % | | $ | 4.22 | | |
Hypothetical (5% return before expenses) | | $ | 1,000 | | | $ | 1,021.32 | | | | 0.77 | % | | $ | 3.92 | | |
Baillie Gifford Long Term Global Growth Equity Fund — Institutional Class | |
Actual | | $ | 1,000 | | | $ | 1,172.40 | | | | 0.80 | % | | $ | 4.38 | | |
Hypothetical (5% return before expenses) | | $ | 1,000 | | | $ | 1,021.17 | | | | 0.80 | % | | $ | 4.08 | | |
Baillie Gifford Positive Change Equity Fund — Class K | |
Actual** | | $ | 1,000 | | | $ | 1,016.00 | | | | 0.65 | % | | $ | 0.32 | | |
Hypothetical (5% return before expenses) | | $ | 1,000 | | | $ | 1,021.93 | | | | 0.65 | % | | $ | 3.31 | | |
Baillie Gifford Positive Change Equity Fund — Institutional Class | |
Actual** | | $ | 1,000 | | | $ | 1,016.00 | | | | 0.80 | % | | $ | 0.40 | | |
Hypothetical (5% return before expenses) | | $ | 1,000 | | | $ | 1,021.17 | | | | 0.80 | % | | $ | 4.08 | | |
Baillie Gifford U.S. Equity Growth Fund — Class K | |
Actual | | $ | 1,000 | | | $ | 1,104.70 | | | | 0.57 | % | | $ | 3.02 | | |
Hypothetical (5% return before expenses) | | $ | 1,000 | | | $ | 1,022.33 | | | | 0.57 | % | | $ | 2.91 | | |
Baillie Gifford U.S. Equity Growth Fund — Institutional Class | |
Actual | | $ | 1,000 | | | $ | 1,104.70 | | | | 0.72 | % | | $ | 3.82 | | |
Hypothetical (5% return before expenses) | | $ | 1,000 | | | $ | 1,021.58 | | | | 0.72 | % | | $ | 3.67 | | |
Baillie Gifford International Choice Fund — Class 2 | |
Actual | | $ | 1,000 | | | $ | 1,095.00 | | | | 0.66 | % | | $ | 3.49 | | |
Hypothetical (5% return before expenses) | | $ | 1,000 | | | $ | 1,021.88 | | | | 0.66 | % | | $ | 3.36 | | |
Baillie Gifford International Choice Fund — Class 3 | |
Actual | | $ | 1,000 | | | $ | 1,095.40 | | | | 0.59 | % | | $ | 3.12 | | |
Hypothetical (5% return before expenses) | | $ | 1,000 | | | $ | 1,022.23 | | | | 0.59 | % | | $ | 3.01 | | |
26
Fund Expenses (unaudited)
Annual Report December 31, 2017
| | | Beginning
Account Value
7/01/17 | | Ending
Account
Value
12/31/17 | | Annualized
Expense Ratios
Based on the Period
7/01/17 to 12/31/17 | | Expenses Paid(1)
During Period | |
Baillie Gifford International Choice Fund — Class 4 | |
Actual | | $ | 1,000 | | | $ | 1,095.60 | | | | 0.56 | % | | $ | 2.96 | | |
Hypothetical (5% return before expenses) | | $ | 1,000 | | | $ | 1,022.38 | | | | 0.56 | % | | $ | 2.85 | | |
* Commencement of operations on July 10, 2017. Expenses are calculated using the Fund's annualized expense ratio, multiplied by the ending value for the period, multiplied by 175/365 (to reflect recommencement of operation).
** Commencement of operations on December 14, 2017. Expenses are calculated using the Fund's annualized expense ratio, multiplied by the ending value for the period, multiplied by 18/365 (to reflect commencement of operation).
(1) Unless otherwise indicated, expenses are calculated using the Fund's annualized expense ratio, multiplied by the average account value for the period, multiplied by 184/365 (to reflect the six-month period).
Expenses are calculated using the annualized expense ratio for the Funds, which represents the ongoing expenses as a percentage of net assets for the year or period end December 31, 2017. Expenses are calculated by multiplying the annualized expense ratio by the average account value for the period; then multiplying
the result by the number of days in the most recent fiscal half-year; and then dividing that result by the number of days in the calendar year. Expense ratios for the most recent fiscal year may differ from expense ratios based on the one-year data in the financial highlights.
27
Industry Diversification Table
Annual Report December 31, 2017
December 31, 2017
Baillie Gifford EAFE Fund
| | | Value | | % of Total
Net Assets | |
Aerospace & Defense | | $ | 69,547,908 | | | | 2.5 | % | |
Apparel Retailers | | | 208,020,034 | | | | 7.4 | | |
Automobiles | | | 219,740,933 | | | | 7.9 | | |
Banks | | | 141,578,593 | | | | 5.1 | | |
Biotechnology | | | 125,439,036 | | | | 4.5 | | |
Broadline Retailers | | | 98,705,083 | | | | 3.5 | | |
Chemicals | | | 35,724,612 | | | | 1.3 | | |
Clothing & Accessories | | | 45,958,033 | | | | 1.7 | | |
Commodity Chemicals | | | 47,568,512 | | | | 1.7 | | |
Computers | | | 13,810,151 | | | | 0.5 | | |
Diversified Financial Services | | | 30,303,829 | | | | 1.1 | | |
Diversified Industrials | | | 26,005,259 | | | | 0.9 | | |
Electrical Components & Equipment | | | 44,539,424 | | | | 1.6 | | |
Food & Drug Retailers | | | 14,638,571 | | | | 0.5 | | |
Food Retailers & Wholesalers | | | 25,392,538 | | | | 0.9 | | |
General Financial | | | 24,520,224 | | | | 0.9 | | |
General Retailers | | | 49,950,212 | | | | 1.8 | | |
Healthcare — Products | | | 36,637,488 | | | | 1.4 | | |
Hotels Restaurants and Leisure | | | 17,533,939 | | | | 0.6 | | |
Industrial Engineering | | | 12,063,991 | | | | 0.4 | | |
Industrial Machinery | | | 154,848,491 | | | | 5.5 | | |
Internet, Software & Services | | | 331,975,333 | | | | 12.0 | | |
Life Insurance | | | 120,118,457 | | | | 4.3 | | |
Media & Photography | | | 92,181,599 | | | | 3.3 | | |
Medical Equipment | | | 29,955,762 | | | | 1.1 | | |
Mortgage Finance | | | 13,064,955 | | | | 0.5 | | |
Personal Products | | | 99,260,960 | | | | 3.5 | | |
Publishing | | | 7,861,237 | | | | 0.3 | | |
Semiconductors | | | 73,833,031 | | | | 2.6 | | |
Speciality Finance | | | 49,418,958 | | | | 1.8 | | |
Specialized Consumer Services | | | 249,509,757 | | | | 8.9 | | |
Technology Hardware & Equipment | | | 142,685,218 | | | | 5.1 | | |
Telecommunication Services | | | 109,801,676 | | | | 3.9 | | |
Total Value of Investments | | | 2,762,193,804 | | | | 99.0 | | |
Other assets less liabilities | | | 28,211,465 | | | | 1.0 | | |
Net Assets | | $ | 2,790,405,269 | | | | 100.0 | % | |
28
Annual Report December 31, 2017
December 31, 2017
Baillie Gifford EAFE Fund
| | | Shares | | Value | |
COMMON STOCKS — 98.6% | |
ARGENTINA — 1.4% | |
MercadoLibre, Inc. | | | 122,762 | | | $ | 38,628,291 | | |
AUSTRIA — 1.7% | |
ams AG (a) | | | 536,657 | | | | 48,616,756 | | |
BELGIUM — 1.3% | |
Umicore SA | | | 754,498 | | | | 35,724,612 | | |
CHINA — 15.9% | |
Alibaba Group Holding Ltd. ADR (a) | | | 700,558 | | | | 120,797,216 | | |
Baidu, Inc. ADR (a) | | | 509,398 | | | | 119,306,106 | | |
Ctrip.com International Ltd. ADR (a) | | | 397,595 | | | | 17,533,939 | | |
New Oriental Education & Technology Group, Inc. ADR | | | 504,828 | | | | 47,453,832 | | |
Tencent Holdings Ltd. | | | 2,675,700 | | | | 138,488,760 | | |
| | | | | | 443,579,853 | | |
DENMARK — 3.9% | |
Chr. Hansen Holding A/S | | | 287,735 | | | | 26,989,503 | | |
Genmab A/S (a) | | | 298,881 | | | | 49,567,030 | | |
Novozymes A/S, B Shares | | | 552,683 | | | | 31,551,201 | | |
| | | | | | 108,107,734 | | |
FRANCE — 7.1% | |
Essilor International SA | | | 175,744 | | | | 24,207,182 | | |
Kering | | | 209,687 | | | | 98,705,083 | | |
L'Oreal SA | | | 340,849 | | | | 75,525,395 | | |
| | | | | | 198,437,660 | | |
GERMANY — 8.2% | |
Aixtron SE (a) | | | 1,148,158 | | | | 15,870,130 | | |
BASF SE | | | 433,896 | | | | 47,568,512 | | |
Delivery Hero AG 144A (a)(b) | | | 481,588 | | | | 19,068,444 | | |
Dialog Semiconductor PLC (a) | | | 301,806 | | | | 9,346,145 | | |
MorphoSys AG (a) | | | 189,625 | | | | 17,331,302 | | |
Rocket Internet SE 144A (a)(b) | | | 702,864 | | | | 17,720,136 | | |
Zalando SE 144A (a)(b) | | | 1,923,468 | | | | 101,420,001 | | |
| | | | | | 228,324,670 | | |
The accompanying notes are an integral part of the financial statements.
29
Annual Report December 31, 2017
December 31, 2017
Baillie Gifford EAFE Fund
| | | Shares | | Value | |
HONG KONG — 5.4% | |
AIA Group Ltd. | | | 14,122,200 | | | $ | 120,118,457 | | |
Hong Kong Exchanges & Clearing Ltd. | | | 990,701 | | | | 30,303,829 | | |
| | | | | | 150,422,286 | | |
INDIA — 0.5% | |
Housing Development Finance Corp., Ltd. | | | 487,887 | | | | 13,064,955 | | |
ISRAEL — 0.6% | |
Wix.com Ltd. (a) | | | 309,853 | | | | 17,832,040 | | |
ITALY — 8.0% | |
EXOR NV | | | 57,074 | | | | 3,499,330 | | |
Ferrari NV | | | 1,122,328 | | | | 117,597,537 | | |
Fiat Chrysler Automobiles NV (a) | | | 5,721,275 | | | | 102,143,396 | | |
| | | | | | 223,240,263 | | |
JAPAN — 15.7% | |
Don Quijote Holdings Co., Ltd. | | | 592,400 | | | | 30,881,768 | | |
M3, Inc. | | | 2,366,700 | | | | 82,962,700 | | |
Nidec Corp. | | | 318,100 | | | | 44,539,424 | | |
Pigeon Corp. | | | 624,700 | | | | 23,735,565 | | |
Rakuten, Inc. | | | 3,908,600 | | | | 35,727,243 | | |
SBI Holdings, Inc. | | | 1,008,900 | | | | 21,020,894 | | |
SMC Corp. | | | 145,900 | | | | 59,875,084 | | |
SoftBank Group Corp. | | | 1,386,900 | | | | 109,801,676 | | |
Sysmex Corp. | | | 381,500 | | | | 29,955,762 | | |
| | | | | | 438,500,116 | | |
NETHERLANDS — 5.6% | |
| ASML Holding NV | | | 820,700 | | | | 142,685,218 | | |
Gemalto NV | | | 233,201 | | | | 13,810,151 | | |
| | | | | | 156,495,369 | | |
NORWAY — 0.6% | |
Schibsted ASA, Class A | | | 322,112 | | | | 9,218,899 | | |
Schibsted ASA, Class B | | | 295,741 | | | | 7,861,237 | | |
| | | | | | 17,080,136 | | |
The accompanying notes are an integral part of the financial statements.
30
Annual Report December 31, 2017
December 31, 2017
Baillie Gifford EAFE Fund
| | | Shares | | Value | |
PORTUGAL — 0.6% | |
Jeronimo Martins SGPS SA | | | 802,592 | | | $ | 15,595,577 | | |
SPAIN — 5.7% | |
Banco Bilbao Vizcaya Argentaria SA | | | 5,136,219 | | | | 43,648,562 | | |
Distribuidora Internacional de Alimentacion SA | | | 1,899,507 | | | | 9,796,961 | | |
Inditex SA | | | 3,065,714 | | | | 106,600,033 | | |
| | | | | | 160,045,556 | | |
SWEDEN — 9.0% | |
Alfa Laval AB | | | 1,099,436 | | | | 26,005,259 | | |
Atlas Copco AB, A Shares | | | 2,200,696 | | | | 94,973,407 | | |
Elekta AB, B Shares | | | 1,505,361 | | | | 12,430,306 | | |
Kinnevik AB, B Shares | | | 1,462,495 | | | | 49,418,958 | | |
Svenska Handelsbanken AB, A Shares | | | 4,908,132 | | | | 67,074,747 | | |
| | | | | | 249,902,677 | | |
SWITZERLAND — 1.7% | |
Compagnie Financiere Richemont SA | | | 507,443 | | | | 45,958,033 | | |
UNITED KINGDOM — 4.1% | |
Ocado Group PLC (a) | | | 2,741,504 | | | | 14,638,571 | | |
Rolls-Royce Holdings PLC (a) | | | 6,058,562 | | | | 69,144,891 | | |
Rolls-Royce Holdings PLC Entitlement (a)(c) | | | 298,498,370 | | | | 403,017 | | |
Standard Chartered PLC (a) | | | 2,938,161 | | | | 30,855,284 | | |
| | | | | | 115,041,763 | | |
UNITED STATES — 1.6% | |
TAL Education Group ADR | | | 1,532,530 | | | | 45,531,466 | | |
Total Common Stocks | |
(cost $1,469,558,900) | | | | | 2,750,129,813 | | |
PREFERRED STOCKS — 0.4% | |
GERMANY — 0.4% | |
Sartorius AG (cost $13,120,093) | | | 127,000 | | | | 12,063,991 | | |
The accompanying notes are an integral part of the financial statements.
31
Annual Report December 31, 2017
December 31, 2017
Baillie Gifford EAFE Fund
| | | Value | |
TOTAL INVESTMENTS — 99.0% | |
(cost $1,482,678,993) | | $ | 2,762,193,804 | | |
Other assets less liabilities — 1.0% | | | 28,211,465 | | |
NET ASSETS — 100.0% | | $ | 2,790,405,269 | | |
(a) Non-income producing security.
(b) 144A — Securities are exempt from registration under Rule 144A of the Securities Act of 1933, as amended. These securities may be resold in transactions exempt from registration, normally to qualified institutional buyers. Prices are obtained daily from the London International Stock Exchange; therefore, fair valuation is typically not required. At December 31, 2017, the net value of these securities was $138,208,581 representing 5.0% of net assets.
(c) Investment was valued using significant unobservable inputs.
ADR — American Depositary Receipt.
Fair Value Measurement
The following is a summary of the inputs used as of December 31, 2017 in valuing the Fund's investments carried at fair value:
Investments in Securities | | Level 1 | | Level 2 | | Level 3 | | Total | |
Common Stocks | |
Argentina | | $ | 38,628,291 | | | $ | — | | | $ | — | | | $ | 38,628,291 | | |
Austria | | | — | | | | 48,616,756 | | | | — | | | | 48,616,756 | | |
Belgium | | | — | | | | 35,724,612 | | | | — | | | | 35,724,612 | | |
China | | | 305,091,093 | | | | 138,488,760 | | | | — | | | | 443,579,853 | | |
Denmark | | | 76,556,533 | | | | 31,551,201 | | | | — | | | | 108,107,734 | | |
France | | | — | | | | 198,437,660 | | | | — | | | | 198,437,660 | | |
Germany | | | 19,068,444 | | | | 209,256,226 | | | | — | | | | 228,324,670 | | |
Hong Kong | | | — | | | | 150,422,286 | | | | — | | | | 150,422,286 | | |
India | | | — | | | | 13,064,955 | | | | — | | | | 13,064,955 | | |
Israel | | | 17,832,040 | | | | — | | | | — | | | | 17,832,040 | | |
Italy | | | 3,499,330 | | | | 219,740,933 | | | | — | | | | 223,240,263 | | |
Japan | | | — | | | | 438,500,116 | | | | — | | | | 438,500,116 | | |
Netherlands | | | — | | | | 156,495,369 | | | | — | | | | 156,495,369 | | |
Norway | | | — | | | | 17,080,136 | | | | — | | | | 17,080,136 | | |
Portugal | | | 15,595,577 | | | | — | | | | — | | | | 15,595,577 | | |
Spain | | | — | | | | 160,045,556 | | | | — | | | | 160,045,556 | | |
Sweden | | | — | | | | 249,902,677 | | | | — | | | | 249,902,677 | | |
Switzerland | | | — | | | | 45,958,033 | | | | — | | | | 45,958,033 | | |
United Kingdom | | | — | | | | 114,638,746 | | | | 403,017 | | | | 115,041,763 | | |
United States | | | 45,531,466 | | | | — | | | | — | | | | 45,531,466 | | |
Total Common Stocks | | | 521,802,774 | | | | 2,227,924,022 | | | | 403,017 | | | | 2,750,129,813 | | |
Preferred Stocks | |
Germany | | | — | | | | 12,063,991 | | | | — | | | | 12,063,991 | | |
Total | | $ | 521,802,774 | | | $ | 2,239,988,013 | | | $ | 403,017 | | | $ | 2,762,193,804 | | |
The accompanying notes are an integral part of the financial statements.
32
Annual Report December 31, 2017
December 31, 2017
Baillie Gifford EAFE Fund
For the EAFE Fund, fair value of Level 3, Level 2 and Level 1 investments at December 31, 2016 was $390,165, $1,855,983,398 and $292,437,851, respectively. $118,870,648 was transferred out of Level 2 into Level 1 and $10,322,368 was transferred out of Level 1 into Level 2 during the year ended December 31, 2017. Transfers into Level 2 and out of Level 1 resulted from foreign securities which were priced using inputs from a third-party vendor modeling tool to reflect any significant market movements between the time at which the Fund valued its securities and the earlier closing of foreign markets. Transfers into Level 1 and out of Level 2 resulted when pricing was based on quoted market prices.
It is the Fund's policy to recognize transfers in and transfers out at the fair value as of the beginning of the period.
The following is a reconciliation of the Fund's Level 3 investments for which significant unobservable inputs were used in determining value:
Balance at December 31, 2016 | | $ | 390,165 | | |
Purchases | | | 1,020,285 | | |
Sales | | | (1,012,558 | ) | |
Realized gain (loss) | | | (7 | ) | |
Change in unrealized gain (loss) | | | 5,132 | | |
Transfers into Level 3 | | | — | | |
Transfers out of Level 3 | | | — | | |
Balance at December 31, 2017 | | $ | 403,017 | * | |
Change in unrealized gain (loss) related to Investments still held at December 31, 2017 | | $ | 7,492 | | |
* Value of the security based on the amount it was known that it would be redeemed at, due to halt in market.
The Trust has made the determination to price these shares at their redemption value. As the fair value is based on management's own assumption, the Trust has determined this to be a level 3 security.
The accompanying notes are an integral part of the financial statements.
33
Statement of Assets and Liabilities
Annual Report December 31, 2017
December 31, 2017
Baillie Gifford EAFE Fund
ASSETS | |
Investments, at value (cost $1,482,678,993) | | $ | 2,762,193,804 | | |
Cash | | | 27,193,733 | | |
Dividends receivable | | | 249,165 | | |
Tax reclaims receivable | | | 2,217,814 | | |
Capital shares sold receivable | | | 4,800,000 | | |
Prepaid assets | | | 33,261 | | |
Total Assets | | | 2,796,687,777 | | |
LIABILITIES | |
Advisory fee payable | | | 2,450,664 | | |
Due to Custodian | | | 644 | | |
Servicing fee payable | | | 622,372 | | |
Capital shares purchased payable | | | 2,000,000 | | |
Trustee payable | | | 33,182 | | |
Accrued expenses | | | 1,175,646 | | |
Total Liabilities | | | 6,282,508 | | |
NET ASSETS | | $ | 2,790,405,269 | | |
COMPOSITION OF NET ASSETS | |
Paid-in capital | | $ | 1,486,913,917 | | |
Distributions in excess of net investment income | | | (17,654,071 | ) | |
Accumulated net realized gain on investments and foreign currency transactions | | | 41,556,227 | | |
Net unrealized appreciation in value of investments and foreign currencies | | | 1,279,589,196 | | |
| | | $ | 2,790,405,269 | | |
NET ASSET VALUE, PER SHARE | |
| Class 2 ($746,817,361 / 51,890,604 shares outstanding), unlimited authorized, no par value | | $ | 14.39 | | |
| Class 3 ($601,548,841 / 41,714,466 shares outstanding), unlimited authorized, no par value | | $ | 14.42 | | |
| Class 4 ($302,473,646 / 20,961,363 shares outstanding), unlimited authorized, no par value | | $ | 14.43 | | |
| Class 5 ($1,139,553,157 / 78,817,054 shares outstanding), unlimited authorized, no par value | | $ | 14.46 | | |
| Class K ($6,132 / 426 shares outstanding), unlimited authorized, no par value | | $ | 14.38 | * | |
| Institutional Class ($6,132 / 426 shares outstanding), unlimited authorized, no par value | | $ | 14.38 | * | |
* Net assets divided by shares does not recalculate using values rounded to the dollar.
The accompanying notes are an integral part of the financial statements.
34
Annual Report December 31, 2017
For the Year Ended December 31, 2017
Baillie Gifford EAFE Fund
INVESTMENT INCOME | |
Dividends (net of foreign withholding taxes of $3,173,836) | | $ | 26,074,304 | | |
Interest | | | 10,050 | | |
Total Investment Income | | | 26,084,354 | | |
EXPENSES | |
Advisory fee (Note B) | | | 9,108,847 | | |
Shareholder Servicing fees — Class 1 Shares (Note B) | | | 12,838 | | |
Shareholder Servicing fees — Class 2 Shares (Note B) | | | 1,517,938 | | |
Shareholder Servicing fees — Class 3 Shares (Note B) | | | 506,588 | | |
Shareholder Servicing fees — Class 4 Shares (Note B) | | | 185,705 | | |
Shareholder Servicing fees — Class 5 Shares (Note B) | | | 198,802 | | |
Administration & Supervisory Fee — Class K Shares (Note B) | | | 6 | | |
Administration & Supervisory Fee — Institutional Class Shares (Note B) | | | 6 | | |
Fund accounting | | | 1,241,042 | | |
Custody | | | 467,162 | | |
Legal | | | 411,490 | | |
Trustees' fees | | | 119,502 | | |
Transfer agency | | | 97,844 | | |
Professional fees | | | 60,435 | | |
Insurance | | | 18,863 | | |
Miscellaneous | | | 69,106 | | |
Total Expenses | | | 14,016,174 | | |
Net Investment Income | | | 12,068,180 | | |
REALIZED AND UNREALIZED GAIN (LOSS) ON INVESTMENTS
AND FOREIGN CURRENCY TRANSACTIONS | |
Net realized gain from: | |
Investments | | | 98,583,871 | | |
Foreign currency transactions | | | 304,295 | | |
| | | | 98,888,166 | | |
Net change in unrealized appreciation on: | |
Investments | | | 870,018,263 | | |
Translation of assets and liabilities denominated in foreign currencies | | | 246,279 | | |
| | | | 870,264,542 | | |
Net realized and unrealized gain on investments and foreign currency transactions | | | 969,152,708 | | |
NET INCREASE IN NET ASSETS FROM OPERATIONS | | $ | 981,220,888 | | |
The accompanying notes are an integral part of the financial statements.
35
Statements of Changes in Net Assets
Annual Report December 31, 2017
Baillie Gifford EAFE Fund
| | | For the
Year Ended
December 31,
2017 | | For the
Year Ended
December 31,
2016 | |
INCREASE (DECREASE) IN NET ASSETS FROM OPERATIONS | |
Net investment income | | $ | 12,068,180 | | | $ | 19,672,297 | | |
Net realized gain from investments and foreign currency transactions | | | 98,888,166 | | | | 93,864,524 | | |
Net change in unrealized appreciation (depreciation) on investments and translation of
assets and liabilities in foreign currencies | | | 870,264,542 | | | | (83,622,730 | ) | |
Net increase in net assets from operations | | | 981,220,888 | | | | 29,914,091 | | |
DIVIDENDS AND DISTRIBUTIONS TO SHAREHOLDERS FROM: | |
Net investment income: | |
Class 1 | | | — | | | | (97,628 | ) | |
Class 2 | | | (2,877,997 | ) | | | (4,641,903 | ) | |
Class 3 | | | (3,036,187 | ) | | | (2,905,636 | ) | |
Class 4 | | | (1,594,302 | ) | | | (1,575,312 | ) | |
Class 5 | | | (6,491,622 | ) | | | (6,037,428 | ) | |
Class K | | | (30 | ) | | | — | | |
Institutional Class | | | (30 | ) | | | — | | |
Capital gains: | |
Class 1 | | | — | | | | (871,988 | ) | |
Class 2 | | | (14,593,795 | ) | | | (34,439,596 | ) | |
Class 3 | | | (11,762,424 | ) | | | (20,659,320 | ) | |
Class 4 | | | (5,909,324 | ) | | | (9,130,203 | ) | |
Class 5 | | | (22,211,065 | ) | | | (36,373,689 | ) | |
Class K | | | (120 | ) | | | — | | |
Institutional Class | | | (120 | ) | | | — | | |
Total Dividends and Distributions | | | (68,477,016 | ) | | | (116,732,703 | ) | |
TRANSACTIONS IN SHARES OF BENEFICIAL INTEREST | |
Net proceeds from shares subscribed: | |
Class 1 | | | 1,508 | | | | 47,348,253 | | |
Class 2* | | | 109,733,985 | | | | 63,886,179 | | |
Class 3 | | | 110,142,876 | | | | 197,212,132 | | |
Class 4 | | | 25,000,000 | | | | 217,043,346 | | |
Class K | | | 5,000 | | | | — | | |
Institutional Class | | | 5,000 | | | | | | |
Purchase fees: | |
Class 1 | | | 279 | | | | 1,029 | | |
Class 2 | | | 11,880 | | | | 34,321 | | |
Class 3 | | | 6,994 | | | | 28,671 | | |
Class 4 | | | 3,256 | | | | 2,941 | | |
Class 5 | | | 12,563 | | | | 36,592 | | |
Redemption fees: | |
Class 1 | | | 100 | | | | 1,595 | | |
Class 2 | | | 16,484 | | | | 32,039 | | |
Class 3 | | | 8,105 | | | | 27,583 | | |
Class 4 | | | 4,201 | | | | 2,280 | | |
Class 5 | | | 16,205 | | | | 34,541 | | |
The accompanying notes are an integral part of the financial statements.
36
Statements of Changes in Net Assets
Annual Report December 31, 2017
| | | For the
Year Ended
December 31,
2017 | | For the
Year Ended
December 31,
2016 | |
Dividends reinvested: | |
Class 1 | | | — | | | | 969,616 | | |
Class 2 | | | 17,464,610 | | | | 38,642,083 | | |
Class 3 | | | 14,798,611 | | | | 23,564,955 | | |
Class 4 | | | 7,503,626 | | | | 10,705,515 | | |
Class 5 | | | 28,702,684 | | | | 42,410,685 | | |
Class K | | | 150 | | | | — | | |
Institutional Class | | | 150 | | | | — | | |
Cost of shares redeemed: | | | | | | | |
| Class 1* | | | (20,817,261 | ) | | | (30,384,500 | ) | |
Class 2 | | | (437,863,539 | ) | | | (72,383,976 | ) | |
Class 3 | | | (122,361,558 | ) | | | (284,259,708 | ) | |
Class 4 | | | (20,000,000 | ) | | | (191,724,888 | ) | |
Increase (Decrease) in Net Assets from Transactions in Shares of Beneficial Interest | | | (287,604,091 | ) | | | 63,231,284 | | |
Total Increase (Decrease) in Net Assets | | | 625,139,781 | | | | (23,587,328 | ) | |
NET ASSETS | |
Beginning of year | | | 2,165,265,488 | | | | 2,188,852,816 | | |
End of year (including distributions in excess of net investment income of
$17,654,071 and $17,506,993, respectively) | | $ | 2,790,405,269 | | | $ | 2,165,265,488 | | |
| | | | | | |
* Class 1 shareholders were converted to Class 2 during the period. Please refer to Notes A and D.
The accompanying notes are an integral part of the financial statements.
37
Annual Report December 31, 2017
Baillie Gifford EAFE Fund
Selected data for a Class 2 Share outstanding throughout each year:
| | | For the
Year Ended
December 31,
2017 | | For the
Year Ended
December 31,
2016 | | For the
Year Ended
December 31,
2015 | | For the
Year Ended
December 31,
2014 | | For the
Year Ended
December 31,
2013 | |
Net asset value, beginning of year | | $ | 10.09 | | | $ | 10.52 | | | $ | 11.11 | | | $ | 12.58 | | | $ | 9.88 | | |
From Investment Operations | |
Net investment income(a) | | | 0.05 | | | | 0.08 | | | | 0.09 | | | | 0.14 | | | | 0.13 | | |
Net realized and unrealized gain (loss) on
investments and foreign currency
transactions | | | 4.60 | | | | 0.06 | | | | (0.42 | ) | | | (1.01 | ) | | | 2.70 | | |
Net increase (decrease) in net asset
value from investment operations | | | 4.65 | | | | 0.14 | | | | (0.33 | ) | | | (0.87 | ) | | | 2.83 | | |
Dividends and Distributions to
Shareholders | | | | | | | | | | | |
Dividends from net investment income | | | (0.06 | ) | | | (0.07 | ) | | | (0.09 | ) | | | (0.14 | ) | | | (0.13 | ) | |
Distributions from net realized gain on
investments | | | (0.29 | ) | | | (0.50 | ) | | | (0.17 | ) | | | (0.46 | ) | | | — | | |
Total Dividends and Distributions | | | (0.35 | ) | | | (0.57 | ) | | | (0.26 | ) | | | (0.60 | ) | | | (0.13 | ) | |
Proceeds from Purchase Fees and
Redemption Fees(a) | | | 0.00 | (b) | | | 0.00 | (b) | | | 0.00 | (b) | | | 0.00 | (b) | | | 0.00 | (b) | |
Net asset value, end of year | | $ | 14.39 | | | $ | 10.09 | | | $ | 10.52 | | | $ | 11.11 | | | $ | 12.58 | | |
Total Return | |
Total return based on net asset value(c) | | | 46.09 | % | | | 1.34 | % | | | (3.07 | )% | | | (6.98 | )% | | | 28.69 | % | |
Ratios/Supplemental Data | |
Net assets, end of year (000's omitted) | | $ | 746,817 | | | $ | 732,160 | | | $ | 732,135 | | | $ | 754,210 | | | $ | 828,208 | | |
Ratio of net expenses to average net assets | | | 0.61 | % | | | 0.61 | % | | | 0.62 | % | | | 0.61 | % | | | 0.61 | % | |
Ratio of net investment income to average
net assets | | | 0.42 | % | | | 0.81 | % | | | 0.78 | % | | | 1.18 | % | | | 1.21 | % | |
Portfolio turnover rate(d) | | | 9 | % | | | 18 | % | | | 17 | % | | | 18 | % | | | 15 | % | |
(a) Calculated based upon average shares outstanding during the year.
(b) Amount is less than $0.005 per share.
(c) Total investment return is calculated assuming an initial investment made at the net asset value at the beginning of the year, reinvestment of all dividends and distributions, if any, at net asset value during the period, and redemption on the last day of the year. Total return is not annualized for periods less than one year.
(d) Portfolio turnover rate calculated at Fund level.
The accompanying notes are an integral part of the financial statements.
38
Annual Report December 31, 2017
Baillie Gifford EAFE Fund
Selected data for a Class 3 Share outstanding throughout each year:
| | | For the
Year Ended
December 31,
2017 | | For the
Year Ended
December 31,
2016 | | For the
Year Ended
December 31,
2015 | | For the
Year Ended
December 31,
2014 | | For the
Year Ended
December 31,
2013 | |
Net asset value, beginning of year | | $ | 10.11 | | | $ | 10.54 | | | $ | 11.13 | | | $ | 12.61 | | | $ | 9.90 | | |
From Investment Operations | |
Net investment income(a) | | | 0.05 | | | | 0.11 | | | | 0.10 | | | | 0.15 | | | | 0.14 | | |
Net realized and unrealized gain (loss) on
investments and foreign currency
transactions | | | 4.62 | | | | 0.03 | | | | (0.43 | ) | | | (1.02 | ) | | | 2.71 | | |
Net increase (decrease) in net asset
value from investment operations | | | 4.67 | | | | 0.14 | | | | (0.33 | ) | | | (0.87 | ) | | | 2.85 | | |
Dividends and Distributions to
Shareholders | | | | | | | | | | | |
Dividends from net investment income | | | (0.07 | ) | | | (0.07 | ) | | | (0.09 | ) | | | (0.15 | ) | | | (0.14 | ) | |
Distributions from net realized gain on
investments | | | (0.29 | ) | | | (0.50 | ) | | | (0.17 | ) | | | (0.46 | ) | | | — | | |
Total Dividends and Distributions | | | (0.36 | ) | | | (0.57 | ) | | | (0.26 | ) | | | (0.61 | ) | | | (0.14 | ) | |
Proceeds from Purchase Fees and
Redemption Fees(a) | | | 0.00 | (b) | | | 0.00 | (b) | | | 0.00 | (b) | | | 0.00 | (b) | | | 0.00 | (b) | |
Net asset value, end of year | | $ | 14.42 | | | $ | 10.11 | | | $ | 10.54 | | | $ | 11.13 | | | $ | 12.61 | | |
Total Return | |
Total return based on net asset value(c) | | | 46.20 | % | | | 1.41 | % | | | (3.02 | )% | | | (6.91 | )% | | | 28.83 | % | |
Ratios/Supplemental Data | |
Net assets, end of year (000's omitted) | | $ | 601,549 | | | $ | 433,860 | | | $ | 490,218 | | | $ | 487,943 | | | $ | 530,001 | | |
Ratio of net expenses to average net assets | | | 0.54 | % | | | 0.54 | % | | | 0.55 | % | | | 0.54 | % | | | 0.54 | % | |
Ratio of net investment income to average
net assets | | | 0.41 | % | | | 1.04 | % | | | 0.85 | % | | | 1.23 | % | | | 1.30 | % | |
Portfolio turnover rate(d) | | | 9 | % | | | 18 | % | | | 17 | % | | | 18 | % | | | 15 | % | |
(a) Calculated based upon average shares outstanding during the year.
(b) Amount is less than $0.005 per share.
(c) Total investment return is calculated assuming an initial investment made at the net asset value at the beginning of the year, reinvestment of all dividends and distributions, if any, at net asset value during the period, and redemption on the last day of the year. Total return is not annualized for periods less than one year.
(d) Portfolio turnover rate calculated at Fund level.
The accompanying notes are an integral part of the financial statements.
39
Annual Report December 31, 2017
Baillie Gifford EAFE Fund
Selected data for a Class 4 Share outstanding throughout each period:
| | | For the
Year Ended
December 31,
2017 | | For the Period
October 10,
2016(b)
through
December 31,
2016 | | For the Period
January 1,
2016(b)
through
April 11,
2016 | | For the
Year Ended
December 31,
2015 | | For the
Year Ended
December 31,
2014 | | For the Period
October 10,
2013(a)
through
December 31,
2013 | |
Net asset value, beginning
of period | | $ | 10.12 | | | $ | 11.49 | | | $ | 10.55 | | | $ | 11.15 | | | $ | 12.62 | | | $ | 11.68 | | |
From Investment Operations | |
Net investment income(c) | | | 0.06 | | | | 0.00 | (d) | | | 0.02 | | | | 0.10 | | | | 0.16 | | | | 0.00 | (d) | |
Net realized and unrealized
gain (loss) on investments and
foreign currency transactions | | | 4.62 | | | | (0.81 | ) | | | (0.41 | ) | | | (0.43 | ) | | | (1.01 | ) | | | 1.08 | | |
Net increase (decrease) in
net asset value from
investment operations | | | 4.68 | | | | (0.81 | ) | | | (0.39 | ) | | | (0.33 | ) | | | (0.85 | ) | | | 1.08 | | |
Dividends and Distributions
to Shareholders | | | | | | | | | | | | | |
Dividends from net investment
income | | | (0.08 | ) | | | (0.08 | ) | | | — | | | | (0.10 | ) | | | (0.16 | ) | | | (0.14 | ) | |
Distributions from net realized
gain on investments | | | (0.29 | ) | | | (0.48 | ) | | | — | | | | (0.17 | ) | | | (0.46 | ) | | | — | | |
Total Dividends and Distributions | | | (0.37 | ) | | | (0.56 | ) | | | — | | | | (0.27 | ) | | | (0.62 | ) | | | (0.14 | ) | |
Proceeds from Purchase
Fees and Redemption Fees(c) | | | 0.00 | (d) | | | 0.00 | (d) | | | — | | | | 0.00 | (d) | | | 0.00 | (d) | | | 0.00 | (d) | |
Net asset value, end of period | | $ | 14.43 | | | $ | 10.12 | | | $ | 10.16 | | | $ | 10.55 | | | $ | 11.15 | | | $ | 12.62 | | |
Total Return | |
Total return based on net
asset value(e) | | | 46.24 | % | | | (6.97 | )% | | | (3.71 | )% | | | (2.99 | )% | | | (6.88 | )% | | | 9.29 | % | |
Ratios/Supplemental Data | |
Net assets, end of period
(000's omitted) | | $ | 302,474 | | | $ | 201,923 | | | $ | 191,724 | | | $ | 199,086 | | | $ | 205,228 | | | $ | 220,388 | | |
Ratio of net expenses to
average net assets | | | 0.51 | % | | | 0.52 | %* | | | 0.51 | %* | | | 0.52 | % | | | 0.51 | % | | | 0.52 | %* | |
Ratio of net investment income
to average net assets | | | 0.45 | % | | | 0.05 | %* | | | 0.65 | %* | | | 0.89 | % | | | 1.26 | % | | | 0.03 | %* | |
Portfolio turnover rate(f) | | | 9 | % | | | 18 | % | | | 18 | % | | | 17 | % | | | 18 | % | | | 15 | % | |
* Annualized.
(a) Commencement of investment operations.
(b) Recommencement of investment operations. Class had no shareholders from April 11, 2016 to October 9, 2016. All shares of this class were redeemed on April 11, 2016 at $10.16. New shares were issued at $11.49 on October 10, 2016.
(c) Calculated based upon average shares outstanding during the period.
(d) Amount is less than $0.005 per share.
(e) Total investment return is calculated assuming an initial investment made at the net asset value at the beginning of the period, reinvestment of all dividends and distributions, if any, at net asset value during the period, and redemption on the last day of the period. Total return is not annualized for periods less than one year.
(f) Portfolio turnover rate calculated at Fund level.
The accompanying notes are an integral part of the financial statements.
40
Annual Report December 31, 2017
Baillie Gifford EAFE Fund
Selected data for a Class 5 Share outstanding throughout each year:
| | | For the
Year Ended
December 31,
2017 | | For the
Year Ended
December 31,
2016 | | For the
Year Ended
December 31,
2015 | | For the
Year Ended
December 31,
2014 | | For the
Year Ended
December 31,
2013 | |
Net asset value, beginning of year | | $ | 10.14 | | | $ | 10.56 | | | $ | 11.16 | | | $ | 12.64 | | | $ | 9.92 | | |
From Investment Operations | |
Net investment income(a) | | | 0.07 | | | | 0.10 | | | | 0.11 | | | | 0.16 | | | | 0.14 | | |
Net realized and unrealized gain (loss) on
investments and foreign currency
transactions | | | 4.62 | | | | 0.06 | | | | (0.44 | ) | | | (1.02 | ) | | | 2.73 | | |
Net increase (decrease) in net asset
value from investment operations | | | 4.69 | | | | 0.16 | | | | (0.33 | ) | | | (0.86 | ) | | | 2.87 | | |
Dividends and Distributions to
Shareholders | | | | | | | | | | | |
Dividends from net investment income | | | (0.08 | ) | | | (0.08 | ) | | | (0.10 | ) | | | (0.16 | ) | | | (0.15 | ) | |
Distributions from net realized gain on
investments | | | (0.29 | ) | | | (0.50 | ) | | | (0.17 | ) | | | (0.46 | ) | | | — | | |
Total Dividends and Distributions | | | (0.37 | ) | | | (0.58 | ) | | | (0.27 | ) | | | (0.62 | ) | | | (0.15 | ) | |
Proceeds from Purchase Fees and
Redemption Fees(a) | | | 0.00 | (b) | | | 0.00 | (b) | | | 0.00 | (b) | | | 0.00 | (b) | | | 0.00 | (b) | |
Net asset value, end of year | | $ | 14.46 | | | $ | 10.14 | | | $ | 10.56 | | | $ | 11.16 | | | $ | 12.64 | | |
Total Return | |
Total return based on net asset value(c) | | | 46.31 | % | | | 1.49 | % | | | (2.94 | )% | | | (6.83 | )% | | | 28.97 | % | |
Ratios/Supplemental Data | |
Net assets, end of year (000's omitted) | | $ | 1,139,553 | | | $ | 778,857 | | | $ | 767,415 | | | $ | 790,695 | | | $ | 848,681 | | |
Ratio of net expenses to average net assets | | | 0.46 | % | | | 0.46 | % | | | 0.47 | % | | | 0.46 | % | | | 0.46 | % | |
Ratio of net investment income to average
net assets | | | 0.51 | % | | | 0.98 | % | | | 0.94 | % | | | 1.30 | % | | | 1.28 | % | |
Portfolio turnover rate(d) | | | 9 | % | | | 18 | % | | | 17 | % | | | 18 | % | | | 15 | % | |
(a) Calculated based upon average shares outstanding during the year.
(b) Amount is less than $0.005 per share.
(c) Total investment return is calculated assuming an initial investment made at the net asset value at the beginning of the period, reinvestment of all dividends and distributions, if any, at net asset value during the period, and redemption on the last day of the period. Total return is not annualized for periods less than one year.
(d) Portfolio turnover rate calculated at Fund level.
The accompanying notes are an integral part of the financial statements.
41
Annual Report December 31, 2017
Baillie Gifford EAFE Fund
Selected data for a Class K Share outstanding throughout the period:
| | | For the Period
April 28, 2017(a)
through
December 31,
2017 | |
Net asset value, beginning of period | | $ | 12.02 | | |
From Investment Operations | |
Net investment income(b) | | | 0.01 | | |
Net realized and unrealized gain on investments and foreign currency transactions | | | 2.71 | | |
Net increase in net asset value from investment operations | | | 2.72 | | |
Dividends and Distributions to Shareholders | |
Dividends from net investment income | | | (0.07 | ) | |
Distributions from net realized gain on investments | | | (0.29 | ) | |
Total Dividends and Distributions | | | (0.36 | ) | |
Net asset value, end of period | | $ | 14.38 | | |
Total Return | |
Total return based on net asset value(c) | | | 22.62 | % | |
Ratios/Supplemental Data | |
Net assets, end of period (000's omitted) | | $ | 6 | | |
Ratio of net expenses to average net assets | | | 0.60 | %* | |
Ratio of net investment income to average net assets | | | 0.14 | %* | |
Portfolio turnover rate(d) | | | 9 | % | |
* Annualized.
(a) Commencement of investment operations.
(b) Calculated based upon average shares outstanding during the period.
(c) Total investment return is calculated assuming an initial investment made at the net asset value at the beginning of the period, reinvestment of all dividends and distributions, if any, at net asset value during the period, and redemption on the last day of the period. Total return is not annualized for periods less than one year.
(d) Portfolio turnover rate calculated at Fund level.
The accompanying notes are an integral part of the financial statements.
42
Annual Report December 31, 2017
Baillie Gifford EAFE Fund
Selected data for an Institutional Class Share outstanding throughout the period:
| | | For the Period
April 28, 2017(a)
through
December 31,
2017 | |
Net asset value, beginning of period | | $ | 12.02 | | |
From Investment Operations | |
Net investment income(b) | | | 0.01 | | |
Net realized and unrealized gain on investments and foreign currency transactions | | | 2.71 | | |
Net increase in net asset value from investment operations | | | 2.72 | | |
Dividends and Distributions to Shareholders | |
Dividends from net investment income | | | (0.07 | ) | |
Distributions from net realized gain on investments | | | (0.29 | ) | |
Total Dividends and Distributions | | | (0.36 | ) | |
Net asset value, end of period | | $ | 14.38 | | |
Total Return | |
Total return based on net asset value(c) | | | 22.62 | % | |
Ratios/Supplemental Data | |
Net assets, end of period (000's omitted) | | $ | 6 | | |
Ratio of net expenses to average net assets | | | 0.60 | %* | |
Ratio of net investment income to average net assets | | | 0.14 | %* | |
Portfolio turnover rate(d) | | | 9 | % | |
* Annualized.
(a) Commencement of investment operations.
(b) Calculated based upon average shares outstanding during the period.
(c) Total investment return is calculated assuming an initial investment made at the net asset value at the beginning of the period, reinvestment of all dividends and distributions, if any, at net asset value during the period, and redemption on the last day of the period. Total return is not annualized for periods less than one year.
(d) Portfolio turnover rate calculated at Fund level.
The accompanying notes are an integral part of the financial statements.
43
Industry Diversification Table
Annual Report December 31, 2017
December 31, 2017
Baillie Gifford EAFE Choice Fund
| | | Value | | % of Total
Net Assets | |
Apparel Retailers | | $ | 19,137,841 | | | | 6.1 | % | |
Asset Managers | | | 11,422,218 | | | | 3.7 | | |
Auto Parts | | | 5,050,310 | | | | 1.6 | | |
Banks | | | 15,115,587 | | | | 4.9 | | |
Beverages, Food & Tobacco | | | 2,640,688 | | | | 0.9 | | |
Biotechnology | | | 6,716,620 | | | | 2.2 | | |
Brewers | | | 5,340,010 | | | | 1.8 | | |
Broadline Retailers | | | 2,687,827 | | | | 0.9 | | |
Business Support Services | | | 4,779,813 | | | | 1.6 | | |
Chemicals | | | 4,497,256 | | | | 1.5 | | |
Clothing & Accessories | | | 7,409,985 | | | | 2.4 | | |
Commercial Services & Supplies | | | 3,809,917 | | | | 1.2 | | |
Containers & Packaging | | | 5,057,622 | | | | 1.6 | | |
Distillers & Vintners | | | 4,026,326 | | | | 1.3 | | |
Electronic & Electrical Equipment | | | 17,368,422 | | | | 5.6 | | |
Food & Drug Retailers/Wholesalers | | | 13,621,528 | | | | 4.5 | | |
Food Products | | | 6,476,248 | | | | 2.1 | | |
Footwear | | | 5,530,301 | | | | 1.8 | | |
General Industries | | | 4,491,522 | | | | 1.5 | | |
General Retailers | | | 5,499,974 | | | | 1.8 | | |
Hotels Restaurants and Leisure | | | 2,836,292 | | | | 0.9 | | |
Industrial Engineering | | | 4,515,504 | | | | 1.5 | | |
Industrial Machinery | | | 25,588,918 | | | | 8.2 | | |
Internet | | | 3,723,939 | | | | 1.2 | | |
Investment Services | | | 2,501,894 | | | | 0.8 | | |
Leisure Goods | | | 3,435,377 | | | | 1.1 | | |
Life Insurance | | | 6,283,973 | | | | 2.0 | | |
Media & Photography | | | 12,853,210 | | | | 4.2 | | |
Medical Equipment | | | 10,868,405 | | | | 3.6 | | |
Nondurable Household Products | | | 6,797,502 | | | | 2.2 | | |
Oil Equipment & Services | | | 2,705,151 | | | | 0.9 | | |
Personal Products | | | 12,212,754 | | | | 3.9 | | |
Pharmaceuticals | | | 6,852,941 | | | | 2.2 | | |
Property & Casualty Insurance | | | 6,300,849 | | | | 2.1 | | |
Recreational Products | | | 4,258,926 | | | | 1.4 | | |
Semiconductors | | | 6,071,604 | | | | 2.0 | | |
Speciality Finance | | | 4,944,146 | | | | 1.6 | | |
Specialized Consumer Services | | | 15,934,433 | | | | 5.2 | | |
Support Services | | | 2,387,591 | | | | 0.8 | | |
Technology Hardware & Equipment | | | 8,606,818 | | | | 2.8 | | |
44
Industry Diversification Table
Annual Report December 31, 2017
| | | Value | | % of Total
Net Assets | |
Telecommunication Services | | $ | 3,356,833 | | | | 1.1 | % | |
Travel & Leisure | | | 1,048,959 | | | | 0.4 | | |
Total Value of Investments | | | 304,766,034 | | | | 99.1 | | |
Other assets less liabilities | | | 2,860,426 | | | | 0.9 | | |
Net Assets | | $ | 307,626,460 | | | | 100.0 | % | |
45
Annual Report December 31, 2017
December 31, 2017
Baillie Gifford EAFE Choice Fund
| | | Shares | | Value | |
COMMON STOCKS — 98.6% | |
AUSTRALIA — 6.5% | |
Brambles Ltd. | | | 645,346 | | | $ | 5,057,622 | | |
Cochlear Ltd. | | | 52,260 | | | | 6,966,394 | | |
Mesoblast Ltd. (a) | | | 173,450 | | | | 197,588 | | |
SEEK Ltd. | | | 257,641 | | | | 3,809,917 | | |
Treasury Wine Estates Ltd. | | | 324,469 | | | | 4,026,326 | | |
| | | | | | 20,057,847 | | |
BRAZIL — 1.0% | |
Raia Drogasil SA | | | 114,700 | | | | 3,173,077 | | |
CHINA — 5.5% | |
Alibaba Group Holding Ltd. ADR (a) | | | 29,456 | | | | 5,079,098 | | |
Baidu, Inc. ADR (a) | | | 15,900 | | | | 3,723,939 | | |
Ctrip.com International Ltd. ADR (a) | | | 64,315 | | | | 2,836,292 | | |
JD.com, Inc. ADR (a) | | | 64,892 | | | | 2,687,827 | | |
Tsingtao Brewery Co., Ltd., Class H | | | 511,943 | | | | 2,640,688 | | |
| | | | | | 16,967,844 | | |
DENMARK — 6.1% | |
Carlsberg A/S, B Shares | | | 44,523 | | | | 5,340,010 | | |
Novo Nordisk A/S, B Shares | | | 127,531 | | | | 6,852,941 | | |
Novozymes A/S, B Shares | | | 114,194 | | | | 6,519,032 | | |
| | | | | | 18,711,983 | | |
FINLAND — 1.4% | |
Kone Oyj, B Shares | | | 79,868 | | | | 4,289,118 | | |
FRANCE — 1.9% | |
Legrand SA | | | 76,161 | | | | 5,855,159 | | |
GERMANY — 5.5% | |
adidas AG | | | 27,653 | | | | 5,530,301 | | |
Infineon Technologies AG | | | 179,913 | | | | 4,899,775 | | |
Zalando SE 144A (a)(b) | | | 124,282 | | | | 6,553,101 | | |
| | | | | | 16,983,177 | | |
The accompanying notes are an integral part of the financial statements.
46
Annual Report December 31, 2017
December 31, 2017
Baillie Gifford EAFE Choice Fund
| | | Shares | | Value | |
HONG KONG — 2.4% | |
AIA Group Ltd. | | | 738,800 | | | $ | 6,283,973 | | |
Cafe de Coral Holdings Ltd. | | | 421,702 | | | | 1,157,773 | | |
| | | | | | 7,441,746 | | |
INDIA — 1.4% | |
Mahindra & Mahindra Ltd. GDR | | | 133,399 | | | | 3,108,197 | | |
MakeMytrip Ltd. (a) | | | 35,141 | | | | 1,048,959 | | |
| | | | | | 4,157,156 | | |
JAPAN — 21.3% | |
Advantest Corp. | | | 172,000 | | | | 3,173,285 | | |
DENSO Corp. | | | 84,300 | | | | 5,050,310 | | |
Japan Exchange Group, Inc. | | | 144,200 | | | | 2,501,894 | | |
Kakaku.com, Inc. | | | 213,700 | | | | 3,607,400 | | |
Kao Corp. | | | 100,600 | | | | 6,797,502 | | |
MS&AD Insurance Group Holdings, Inc. | | | 186,800 | | | | 6,300,849 | | |
Olympus Corp. | | | 102,000 | | | | 3,902,011 | | |
Pigeon Corp. | | | 108,500 | | | | 4,122,473 | | |
Rakuten, Inc. | | | 293,400 | | | | 2,681,874 | | |
Shimano, Inc. | | | 30,300 | | | | 4,258,926 | | |
Shiseido Co., Ltd. | | | 167,900 | | | | 8,090,281 | | |
SMC Corp. | | | 17,500 | | | | 7,181,727 | | |
SoftBank Group Corp. | | | 42,400 | | | | 3,356,833 | | |
Sugi Holdings Co., Ltd. | | | 34,600 | | | | 1,762,623 | | |
Suruga Bank Ltd. | | | 130,400 | | | | 2,788,262 | | |
| | | | | | 65,576,250 | | |
NETHERLANDS — 0.9% | |
| ASML Holding NV | | | 16,496 | | | | 2,867,961 | | |
PORTUGAL — 2.1% | |
Jeronimo Martins SGPS SA | | | 325,246 | | | | 6,320,022 | | |
SINGAPORE — 3.5% | |
Jardine Matheson Holdings Ltd. | | | 48,000 | | | | 2,912,280 | | |
Jardine Strategic Holdings Ltd. | | | 39,900 | | | | 1,579,242 | | |
United Overseas Bank Ltd. | | | 315,273 | | | | 6,214,982 | | |
| | | | | | 10,706,504 | | |
The accompanying notes are an integral part of the financial statements.
47
Annual Report December 31, 2017
December 31, 2017
Baillie Gifford EAFE Choice Fund
| | | Shares | | Value | |
SOUTH AFRICA — 3.7% | |
Clicks Group Ltd. | | | 296,604 | | | $ | 4,342,201 | | |
Naspers Ltd., N Shares | | | 25,181 | | | | 6,976,480 | | |
| | | | | | 11,318,681 | | |
SOUTH KOREA — 1.1% | |
Samsung Electronics Co., Ltd. GDR 144A (b) | | | 2,901 | | | | 3,435,377 | | |
SPAIN — 3.0% | |
Distribuidora Internacional de Alimentacion SA | | | 458,700 | | | | 2,365,806 | | |
Inditex SA | | | 199,492 | | | | 6,936,673 | | |
| | | | | | 9,302,479 | | |
SWEDEN — 5.8% | |
Atlas Copco AB, B Shares | | | 180,311 | | | | 6,910,794 | | |
Investor AB, B Shares | | | 108,406 | | | | 4,944,146 | | |
Svenska Handelsbanken AB, A Shares | | | 447,265 | | | | 6,112,343 | | |
| | | | | | 17,967,283 | | |
SWITZERLAND — 8.2% | |
Compagnie Financiere Richemont SA | | | 47,456 | | | | 4,297,989 | | |
Mettler-Toledo International, Inc. (a) | | | 13,462 | | | | 8,339,978 | | |
Nestle SA | | | 75,326 | | | | 6,476,248 | | |
Schindler Holding AG, Participating Certificates | | | 22,979 | | | | 5,284,953 | | |
u-blox Holding AG (a) | | | 4,263 | | | | 839,082 | | |
| | | | | | 25,238,250 | | |
TAIWAN — 2.0% | |
Taiwan Semiconductor Manufacturing Co., Ltd. ADR | | | 153,130 | | | | 6,071,604 | | |
UNITED KINGDOM — 15.3% | |
| ASOS PLC (a) | | | 62,606 | | | | 5,648,067 | | |
Auto Trader Group PLC 144A (b) | | | 958,588 | | | | 4,566,061 | | |
Burberry Group PLC | | | 129,076 | | | | 3,111,996 | | |
Capita PLC | | | 441,893 | | | | 2,387,591 | | |
Hargreaves Lansdown PLC | | | 310,745 | | | | 7,546,670 | | |
Intertek Group PLC | | | 68,348 | | | | 4,779,813 | | |
John Wood Group PLC | | | 309,174 | | | | 2,705,151 | | |
Johnson Matthey PLC | | | 108,529 | | | | 4,497,256 | | |
Jupiter Fund Management PLC | | | 458,023 | | | | 3,875,548 | | |
The accompanying notes are an integral part of the financial statements.
48
Annual Report December 31, 2017
December 31, 2017
Baillie Gifford EAFE Choice Fund
| | | Shares | | Value | |
Rightmove PLC | | | 96,839 | | | $ | 5,876,730 | | |
Weir Group PLC (The) | | | 67,065 | | | | 1,922,326 | | |
| | | | | | 46,917,209 | | |
Total Common Stocks | |
(cost $216,014,088) | | | | | 303,358,727 | | |
PREFERRED STOCKS — 0.5% | |
GERMANY — 0.5% | |
Sartorius AG (cost $1,513,799) | | | 14,815 | | | | 1,407,307 | | |
TOTAL INVESTMENTS — 99.1% | |
(cost $217,527,887) | | | | $ | 304,766,034 | | |
Other assets less liabilities — 0.9% | | | | | 2,860,426 | | |
NET ASSETS — 100.0% | | | | $ | 307,626,460 | | |
(a) Non-income producing security.
(b) 144A — Securities are exempt from registration under Rule 144A of the Securities Act of 1933, as amended. These securities may be resold in transactions exempt from registration, normally to qualified institutional buyers. Prices are obtained daily from the London International Stock Exchange; therefore, fair valuation is typically not required. At December 31, 2017, the net value of these securities was $14,554,539 representing 4.7% of net assets.
ADR — American Depositary Receipt.
GDR — Global Depositary Receipt.
The accompanying notes are an integral part of the financial statements.
49
Annual Report December 31, 2017
December 31, 2017
Baillie Gifford EAFE Choice Fund
Fair Value Measurement
The following is a summary of the inputs used as of December 31, 2017 in valuing the Fund's investments carried at fair value:
Investments in Securities | | Level 1 | | Level 2 | | Level 3 | | Total | |
Common Stocks | |
Australia | | $ | 197,588 | | | $ | 19,860,259 | | | $ | — | | | $ | 20,057,847 | | |
Brazil | | | — | | | | 3,173,077 | | | | — | | | | 3,173,077 | | |
China | | | 16,967,844 | | | | — | | | | — | | | | 16,967,844 | | |
Denmark | | | — | | | | 18,711,983 | | | | — | | | | 18,711,983 | | |
Finland | | | — | | | | 4,289,118 | | | | — | | | | 4,289,118 | | |
France | | | — | | | | 5,855,159 | | | | — | | | | 5,855,159 | | |
Germany | | | — | | | | 16,983,177 | | | | — | | | | 16,983,177 | | |
Hong Kong | | | — | | | | 7,441,746 | | | | — | | | | 7,441,746 | | |
India | | | 4,157,156 | | | | — | | | | — | | | | 4,157,156 | | |
Japan | | | — | | | | 65,576,250 | | | | — | | | | 65,576,250 | | |
Netherlands | | | — | | | | 2,867,961 | | | | — | | | | 2,867,961 | | |
Portugal | | | 6,320,022 | | | | — | | | | — | | | | 6,320,022 | | |
Singapore | | | 1,579,242 | | | | 9,127,262 | | | | — | | | | 10,706,504 | | |
South Africa | | | 4,342,201 | | | | 6,976,480 | | | | — | | | | 11,318,681 | | |
South Korea | | | — | | | | 3,435,377 | | | | — | | | | 3,435,377 | | |
Spain | | | — | | | | 9,302,479 | | | | — | | | | 9,302,479 | | |
Sweden | | | — | | | | 17,967,283 | | | | — | | | | 17,967,283 | | |
Switzerland | | | 9,179,060 | | | | 16,059,190 | | | | — | | | | 25,238,250 | | |
Taiwan | | | 6,071,604 | | | | — | | | | — | | | | 6,071,604 | | |
United Kingdom | | | 6,488,387 | | | | 40,428,822 | | | | — | | | | 46,917,209 | | |
Total Common Stocks | | | 55,303,104 | | | | 248,055,623 | | | | — | | | | 303,358,727 | | |
Preferred Stocks | |
Germany | | | — | | | | 1,407,307 | | | | — | | | | 1,407,307 | | |
Total | | $ | 55,303,104 | | | $ | 249,462,930 | | | $ | — | | | $ | 304,766,034 | | |
For the EAFE Choice Fund, fair value of Level 2 and Level 1 investments at December 31, 2016 was $258,450,244 and $30,759,359, respectively. $19,613,711 was transferred out of Level 2 into Level 1 during the year ended December 31, 2017. Transfers into Level 1 and out of Level 2 resulted when pricing was based on quoted market prices.
It is the Fund's policy to recognize transfers in and transfers out at the fair value as of the beginning of the period.
The accompanying notes are an integral part of the financial statements.
50
Statement of Assets and Liabilities
Annual Report December 31, 2017
December 31, 2017
Baillie Gifford EAFE Choice Fund
ASSETS | |
Investments, at value (cost $217,527,887) | | $ | 304,766,034 | | |
Cash | | | 2,868,111 | | |
Dividends receivable | | | 158,245 | | |
Tax reclaims receivable | | | 481,438 | | |
Prepaid assets | | | 30,682 | | |
Total Assets | | | 308,304,510 | | |
LIABILITIES | |
Advisory fee payable | | | 293,117 | | |
Servicing fee payable | | | 137,706 | | |
Trustee fee payable | | | 3,876 | | |
Accrued expenses | | | 243,351 | | |
Total Liabilities | | | 678,050 | | |
NET ASSETS | | $ | 307,626,460 | | |
COMPOSITION OF NET ASSETS | |
Paid-in capital | | $ | 222,001,469 | | |
Distributions in excess of net investment income | | | (1,798,467 | ) | |
Accumulated net realized gain on investments and foreign currency transactions | | | 168,925 | | |
Net unrealized appreciation in value of investments and foreign currencies | | | 87,254,533 | | |
| | | $ | 307,626,460 | | |
NET ASSET VALUE, PER SHARE | |
| Class 2 ($280,488,443 / 17,407,495 shares outstanding), unlimited authorized, no par value | | $ | 16.11 | | |
| Class 3 ($26,931,505 / 1,656,041 shares outstanding), unlimited authorized, no par value | | $ | 16.26 | | |
| Class K ($5,783 / 359 shares outstanding), unlimited authorized, no par value | | $ | 16.10 | * | |
| Institutional Class ($200,729 / 12,477 shares outstanding), unlimited authorized, no par value | | $ | 16.09 | | |
* Net assets divided by shares does not recalculate using values rounded to the dollar.
The accompanying notes are an integral part of the financial statements.
51
Annual Report December 31, 2017
For the Year Ended December 31, 2017
Baillie Gifford EAFE Choice Fund
INVESTMENT INCOME | |
Dividends (net of foreign withholding taxes of $534,414) | | $ | 5,721,814 | | |
Interest | | | 719 | | |
Total Investment Income | | | 5,722,533 | | |
EXPENSES | |
Advisory fee (Note B) | | | 1,159,935 | | |
Shareholder Servicing fees — Class 1 Shares (Note B) | | | 3 | | |
Shareholder Servicing fees — Class 2 Shares (Note B) | | | 522,536 | | |
Shareholder Servicing fees — Class 3 Shares (Note B) | | | 24,015 | | |
Administration & Supervisory Fee — Class K Shares (Note B) | | | 6 | | |
Administration & Supervisory Fee — Institutional Class Shares (Note B) | | | 27 | | |
Fund accounting | | | 189,861 | | |
Custody | | | 68,939 | | |
Transfer agency | | | 59,355 | | |
Legal | | | 53,259 | | |
Professional fees | | | 86,194 | | |
Trustees' fees | | | 14,663 | | |
Insurance | | | 2,427 | | |
Miscellaneous | | | 21,659 | | |
Total Expenses | | | 2,202,879 | | |
Net Investment Income | | | 3,519,654 | | |
REALIZED AND UNREALIZED GAIN (LOSS) ON INVESTMENTS
AND FOREIGN CURRENCY TRANSACTIONS | |
Net realized gain (loss) from: | |
Investments | | | 10,793,199 | | |
Foreign currency transactions | | | (67,452 | ) | |
| | | | 10,725,747 | | |
Net change in unrealized appreciation on: | |
Investments | | | 74,228,563 | | |
Translation of assets and liabilities denominated in foreign currencies | | | 34,346 | | |
| | | | 74,262,909 | | |
Net realized and unrealized gain on investments and foreign currency transactions | | | 84,988,656 | | |
NET INCREASE IN NET ASSETS FROM OPERATIONS | | $ | 88,508,310 | | |
The accompanying notes are an integral part of the financial statements.
52
Statements of Changes in Net Assets
Annual Report December 31, 2017
Baillie Gifford EAFE Choice Fund
| | | For the
Year Ended
December 31,
2017 | | For the
Year Ended
December 31,
2016 | |
INCREASE (DECREASE) IN NET ASSETS FROM OPERATIONS | |
Net investment income | | $ | 3,519,654 | | | $ | 4,427,859 | | |
Net realized gain (loss) from investments and foreign currency transactions | | | 10,725,747 | | | | (3,576,184 | ) | |
Net change in unrealized appreciation on investments
and translation of assets and liabilities in foreign currencies | | | 74,262,909 | | | | 1,919,705 | | |
Net increase in net assets from operations | | | 88,508,310 | | | | 2,771,380 | | |
DIVIDENDS AND DISTRIBUTIONS TO SHAREHOLDERS FROM: | |
Net investment income: | |
Class 1 | | | — | | | | (39 | ) | |
Class 2 | | | (4,282,724 | ) | | | (3,413,749 | ) | |
Class 3 | | | (432,754 | ) | | | (260,142 | ) | |
Class K | | | (92 | ) | | | — | | |
Institutional Class | | | (3,468 | ) | | | — | | |
Total Dividends and Distributions | | | (4,719,038 | ) | | | (3,673,930 | ) | |
TRANSACTIONS IN SHARES OF BENEFICIAL INTEREST | |
Net proceeds from shares subscribed: | |
Class 1 | | | 1,497 | | | | 10,978,072 | | |
| Class 2* | | | 2,010,737 | | | | 64,883,358 | | |
Class 3 | | | 2,591,699 | | | | 2,715,447 | | |
Class K | | | 5,000 | | | | — | | |
Institutional Class | | | 199,000 | | | | — | | |
Purchase fees: | |
Class 1 | | | — | | | | 7,278 | | |
Class 2 | | | 1,361 | | | | 100,782 | | |
Class 3 | | | 100 | | | | 8,214 | | |
Redemption fees: | |
Class 1 | | | — | | | | 781 | | |
Class 2 | | | 4,257 | | | | 24,442 | | |
Class 3 | | | 317 | | | | 1,724 | | |
Dividends reinvested: | |
Class 1 | | | — | | | | 39 | | |
Class 2 | | | 4,282,725 | | | | 3,413,749 | | |
Class 3 | | | 432,754 | | | | 260,142 | | |
Class K | | | 92 | | | | — | | |
Institutional Class | | | 98 | | | | — | | |
Cost of shares redeemed: | |
| Class 1* | | | (4,741 | ) | | | (30,703,470 | ) | |
Class 2 | | | (76,008,120 | ) | | | (24,097,363 | ) | |
Class 3 | | | (1,910,571 | ) | | | (2,710,863 | ) | |
Increase (Decrease) in Net Assets from Transactions in Shares of Beneficial Interest | | | (68,393,795 | ) | | | 24,882,332 | | |
Total Increase in Net Assets | | | 15,395,477 | | | | 23,979,782 | | |
NET ASSETS | |
Beginning of year | | | 292,230,983 | | | | 268,251,201 | | |
End of year (including distributions in excess of net investment income of
$1,798,467 and $591,434, respectively) | | $ | 307,626,460 | | | $ | 292,230,983 | | |
| | | | | | |
* Class 1 shareholders were converted to Class 2 during the period. Please refer to Notes A and D.
The accompanying notes are an integral part of the financial statements.
53
Annual Report December 31, 2017
Baillie Gifford EAFE Choice Fund
Selected data for a Class 2 Share outstanding throughout each year:
| | | For the
Year Ended
December 31,
2017 | | For the
Year Ended
December 31,
2016 | | For the
Year Ended
December 31,
2015 | | For the
Year Ended
December 31,
2014 | | For the
Year Ended
December 31,
2013 | |
Net asset value, beginning of year | | $ | 12.46 | | | $ | 12.55 | | | $ | 12.43 | | | $ | 13.13 | | | $ | 11.19 | | |
From Investment Operations | |
Net investment income(a) | | | 0.16 | | | | 0.19 | | | | 0.17 | | | | 0.16 | | | | 0.17 | | |
Net realized and unrealized gain (loss) on
investments and foreign currency
transactions | | | 3.74 | | | | (0.13 | ) | | | 0.09 | (e) | | | (0.75 | ) | | | 2.19 | | |
Net increase (decrease) in net asset
value from investment operations | | | 3.90 | | | | 0.06 | | | | 0.26 | | | | (0.59 | ) | | | 2.36 | | |
Dividends and Distributions to
Shareholders | | | | | | | | | | | |
Dividends from net investment income | | | (0.25 | ) | | | (0.16 | ) | | | (0.15 | ) | | | (0.14 | ) | | | (0.43 | ) | |
Total Dividends and Distributions | | | (0.25 | ) | | | (0.16 | ) | | | (0.15 | ) | | | (0.14 | ) | | | (0.43 | ) | |
Proceeds from Purchase Fees and
Redemption Fees(a) | | | 0.00 | (b) | | | 0.01 | | | | 0.01 | | | | 0.03 | | | | 0.01 | | |
Net asset value, end of year | | $ | 16.11 | | | $ | 12.46 | | | $ | 12.55 | | | $ | 12.43 | | | $ | 13.13 | | |
Total Return | |
Total return based on net asset value(c) | | | 31.28 | % | | | 0.59 | % | | | 2.16 | % | | | (4.25 | )% | | | 21.20 | % | |
Ratios/Supplemental Data | |
Net assets, end of year (000's omitted) | | $ | 280,488 | | | $ | 272,338 | | | $ | 229,032 | | | $ | 110,234 | | | $ | 94,942 | | |
Ratio of net expenses to average net assets | | | 0.67 | % | | | 0.65 | % | | | 0.65 | % | | | 0.66 | % | | | 0.67 | % | |
Ratio of net investment income to average
net assets | | | 1.06 | % | | | 1.46 | % | | | 1.29 | % | | | 1.23 | % | | | 1.41 | % | |
Portfolio turnover rate(d) | | | 12 | % | | | 23 | % | | | 16 | % | | | 23 | % | | | 25 | % | |
(a) Calculated based upon average shares outstanding during the year.
(b) Amount is less than $0.005 per share.
(c) Total investment return is calculated assuming an initial investment made at the net asset value at the beginning of the period, reinvestment of all dividends and distributions, if any, at net asset value during the period, and redemption on the last day of the period. Total return is not annualized for periods less than one year.
(d) Portfolio turnover rate calculated at Fund level.
(e) Calculation of the net gain per share (both realized and unrealized) does not correlate to the aggregate realized and unrealized losses presented in the Statement of Operations due to the timing of sales and repurchases of Class shares in relation to fluctuating market values of the investments of the Fund.
The accompanying notes are an integral part of the financial statements.
54
Annual Report December 31, 2017
Baillie Gifford EAFE Choice Fund
Selected data for a Class 3 Share outstanding throughout each period:
| | | For the
Year Ended
December 31,
2017 | | For the
Year Ended
December 31,
2016 | | For the
Year Ended
December 31,
2015 | | For the Period
July 7, 2014(c)
through
December 31,
2014 | | For the Period
January 1, 2013(c)
through
April 16,
2013 | |
Net asset value, beginning of period | | $ | 12.58 | | | $ | 12.67 | | | $ | 12.54 | | | $ | 14.08 | | | $ | 11.22 | | |
From Investment Operations | |
Net investment income(a) | | | 0.16 | | | | 0.20 | | | | 0.20 | | | | 0.05 | | | | 0.07 | | |
Net realized and unrealized gain (loss) on
investments and foreign currency
transactions | | | 3.79 | | | | (0.13 | ) | | | 0.07 | (f) | | | (1.44 | ) | | | 0.79 | | |
Net increase (decrease) in net asset
value from investment operations | | | 3.95 | | | | 0.07 | | | | 0.27 | | | | (1.39 | ) | | | 0.86 | | |
Dividends and Distributions to
Shareholders | | | | | | | | | | | |
Dividends from net investment income | | | (0.27 | ) | | | (0.17 | ) | | | (0.16 | ) | | | (0.15 | ) | | | — | | |
Total Dividends and Distributions | | | (0.27 | ) | | | (0.17 | ) | | | (0.16 | ) | | | (0.15 | ) | | | — | | |
Proceeds from Purchase Fees and
Redemption Fees(a) | | | 0.00 | (d) | | | 0.01 | | | | 0.02 | | | | 0.00 | (d) | | | 0.00 | (d) | |
Net asset value, end of period | | $ | 16.26 | | | $ | 12.58 | | | $ | 12.67 | | | $ | 12.54 | | | $ | 12.08 | | |
Total Return | |
Total return based on net asset value(b) | | | 31.37 | % | | | 0.66 | % | | | 2.25 | % | | | (9.86 | )% | | | 7.66 | % | |
Ratios/Supplemental Data | |
Net assets, end of period (000's omitted) | | $ | 26,932 | | | $ | 19,890 | | | $ | 19,703 | | | $ | 18,758 | | | $ | — | (d) | |
Ratio of net expenses to average net assets | | | 0.60 | % | | | 0.58 | % | | | 0.58 | % | | | 0.58 | %* | | | 0.55 | %* | |
Ratio of net investment income to average
net assets | | | 1.09 | % | | | 1.59 | % | | | 1.51 | % | | | 0.71 | %* | | | 2.29 | %* | |
Portfolio turnover rate(e) | | | 12 | % | | | 23 | % | | | 16 | % | | | 23 | % | | | 5 | % | |
* Annualized.
(a) Calculated based upon average shares outstanding during the period.
(b) Total investment return is calculated assuming an initial investment made at the net asset value at the beginning of the period, reinvestment of all dividends and distributions, if any, at net asset value during the period, and redemption on the last day of the period. Total return is not annualized for periods less than one year.
(c) Recommencement of investment operations. Class had no shareholders from April 17, 2013 to July 6, 2014. All shares of this class were redeemed at $12.08 on April 16, 2013. New shares were issued at $14.08 on July 7, 2014.
(d) Amount is less than $0.005 per share.
(e) Portfolio turnover rate calculated at Fund level.
(f) Calculation of the net gain per share (both realized and unrealized) does not correlate to the aggregate realized and unrealized losses presented in the Statement of Operations due to the timing of sales and repurchases of Class shares in relation to fluctuating market values of the investments of the Fund.
The accompanying notes are an integral part of the financial statements.
55
Annual Report December 31, 2017
Baillie Gifford EAFE Choice Fund
Selected data for a Class K Share outstanding throughout the period:
| | | For the Period
April 28, 2017(a)
through
December 31, 2017 | |
Net asset value, beginning of period | | $ | 14.15 | | |
From Investment Operations | |
Net investment income(b) | | | 0.08 | | |
Net realized and unrealized gain on investments and foreign currency transactions | | | 2.13 | | |
Net increase in net asset value from investment operations | | | 2.21 | | |
Dividends and Distributions to Shareholders | |
Dividends from net investment income | | | (0.26 | ) | |
Total Dividends and Distributions | | | (0.26 | ) | |
Net asset value, end of period | | $ | 16.10 | | |
Total Return | |
Total return based on net asset value(c) | | | 15.63 | % | |
Ratios/Supplemental Data | |
Net assets, end of period (000's omitted) | | $ | 6 | | |
Ratio of net expenses to average net assets | | | 0.68 | %* | |
Ratio of net investment income to average net assets | | | 0.73 | %* | |
Portfolio turnover rate(d) | | | 12 | % | |
* Annualized.
(a) Commencement of operations.
(b) Calculated based upon average shares outstanding during the period.
(c) Total investment return is calculated assuming an initial investment made at the net asset value at the beginning of the period, reinvestment of all dividends and distributions, if any, at net asset value during the period, and redemption on the last day of the period. Total return is not annualized for periods less than one year.
(d) Portfolio turnover rate calculated at Fund level.
The accompanying notes are an integral part of the financial statements.
56
Annual Report December 31, 2017
Baillie Gifford EAFE Choice Fund
Selected data for an Institutional Class Share outstanding throughout the period:
| | | For the Period
April 28, 2017(a)
through
December 31,
2017 | |
Net asset value, beginning of period | | $ | 14.15 | | |
From Investment Operations | |
Net investment income(b) | | | 0.01 | | |
Net realized and unrealized gain on investments and foreign currency transactions | | | 2.21 | | |
Net increase in net asset value from investment operations | | | 2.22 | | |
Dividends and Distributions to Shareholders | |
Dividends from net investment income | | | (0.28 | ) | |
Total Dividends and Distributions | | | (0.28 | ) | |
Net asset value, end of period | | $ | 16.09 | | |
Total Return | |
Total return based on net asset value(c) | | | 15.68 | % | |
Ratios/Supplemental Data | |
Net assets, end of period (000's omitted) | | $ | 201 | | |
Ratio of net expenses to average net assets | | | 0.68 | %* | |
Ratio of net investment income to average net assets | | | 0.14 | %* | |
Portfolio turnover rate(d) | | | 12 | % | |
* Annualized.
(a) Commencement of operations.
(b) Calculated based upon average shares outstanding during the period.
(c) Total investment return is calculated assuming an initial investment made at the net asset value at the beginning of the period, reinvestment of all dividends and distributions, if any, at net asset value during the period, and redemption on the last day of the period. Total return is not annualized for periods less than one year.
(d) Portfolio turnover rate calculated at Fund level.
The accompanying notes are an integral part of the financial statements.
57
Industry Diversification Table
Annual Report December 31, 2017
December 31, 2017
Baillie Gifford EAFE Pure Fund
| | | Value | | % of Total
Net Assets | |
Apparel Retailers | | $ | 23,969,162 | | | | 7.9 | % | |
Asset Managers | | | 14,212,334 | | | | 4.6 | | |
Auto Parts | | | 5,649,398 | | | | 1.9 | | |
Banks | | | 17,929,660 | | | | 5.9 | | |
Biotechnology | | | 6,884,006 | | | | 2.3 | | |
Brewers | | | 5,369,875 | | | | 1.8 | | |
Business Support Services | | | 6,244,849 | | | | 2.1 | | |
Chemicals | | | 6,067,767 | | | | 2.0 | | |
Clothing & Accessories | | | 10,089,818 | | | | 3.3 | | |
Commercial Services & Supplies | | | 4,432,893 | | | | 1.5 | | |
Containers & Packaging | | | 4,400,225 | | | | 1.4 | | |
Distillers & Vintners | | | 5,048,899 | | | | 1.7 | | |
Electronic & Electrical Equipment | | | 18,241,178 | | | | 5.9 | | |
Food & Drug Retailers | | | 1,757,529 | | | | 0.6 | | |
Food Products | | | 8,092,086 | | | | 2.7 | | |
Food Retailers & Wholesalers | | | 10,041,315 | | | | 3.3 | | |
Footwear | | | 6,872,429 | | | | 2.2 | | |
General Industries | | | 5,272,441 | | | | 1.8 | | |
Industrial Engineering | | | 1,501,159 | | | | 0.5 | | |
Industrial Machinery | | | 27,436,311 | | | | 9.0 | | |
Investment Services | | | 2,246,847 | | | | 0.7 | | |
Life Insurance | | | 6,938,907 | | | | 2.3 | | |
Media Agencies | | | 7,493,090 | | | | 2.5 | | |
Medical Equipment | | | 12,744,201 | | | | 4.2 | | |
Nondurable Household Products | | | 8,513,770 | | | | 2.8 | | |
Oil Equipment & Services | | | 2,611,329 | | | | 0.9 | | |
Personal Products | | | 12,120,183 | | | | 4.0 | | |
Pharmaceuticals | | | 7,386,535 | | | | 2.4 | | |
Property & Casualty Insurance | | | 7,943,522 | | | | 2.6 | | |
Recreational Products | | | 6,592,199 | | | | 2.2 | | |
Speciality Finance | | | 8,015,229 | | | | 2.6 | | |
Specialized Consumer Services | | | 11,974,283 | | | | 4.0 | | |
Support Services | | | 2,518,400 | | | | 0.8 | | |
Technology Hardware & Equipment | | | 10,171,716 | | | | 3.3 | | |
Telecommunication Services | | | 4,029,782 | | | | 1.3 | | |
Total Value of Investments | | | 300,813,327 | | | | 99.0 | | |
Other assets less liabilities | | | 3,037,154 | | | | 1.0 | | |
Net Assets | | $ | 303,850,481 | | | | 100.0 | % | |
58
Annual Report December 31, 2017
December 31, 2017
Baillie Gifford EAFE Pure Fund
| | | Shares | | Value | |
COMMON STOCKS — 98.5% | |
AUSTRALIA — 7.3% | |
Brambles Ltd. | | | 561,463 | | | $ | 4,400,225 | | |
Cochlear Ltd. | | | 59,846 | | | | 7,977,627 | | |
Mesoblast Ltd. (a) | | | 181,023 | | | | 206,215 | | |
SEEK Ltd. | | | 299,769 | | | | 4,432,893 | | |
Treasury Wine Estates Ltd. | | | 406,875 | | | | 5,048,899 | | |
| | | | | | 22,065,859 | | |
DENMARK — 6.4% | |
Carlsberg A/S, B Shares | | | 44,772 | | | | 5,369,875 | | |
Novo Nordisk A/S, B Shares | | | 137,461 | | | | 7,386,535 | | |
Novozymes A/S, B Shares | | | 116,975 | | | | 6,677,791 | | |
| | | | | | 19,434,201 | | |
FINLAND — 1.6% | |
Kone Oyj, B Shares | | | 89,189 | | | | 4,789,680 | | |
FRANCE — 2.0% | |
Legrand SA | | | 80,839 | | | | 6,214,797 | | |
GERMANY — 6.5% | |
adidas AG | | | 34,364 | | | | 6,872,429 | | |
Infineon Technologies AG | | | 200,993 | | | | 5,473,870 | | |
Zalando SE 144A (a)(b) | | | 142,617 | | | | 7,519,863 | | |
| | | | | | 19,866,162 | | |
HONG KONG — 2.3% | |
AIA Group Ltd. | | | 815,800 | | | | 6,938,907 | | |
JAPAN — 24.6% | |
Advantest Corp. | | | 184,500 | | | | 3,403,902 | | |
DENSO Corp. | | | 94,300 | | | | 5,649,398 | | |
Japan Exchange Group, Inc. | | | 129,500 | | | | 2,246,847 | | |
Kakaku.com, Inc. | | | 229,600 | | | | 3,875,803 | | |
Kao Corp. | | | 126,000 | | | | 8,513,770 | | |
MS&AD Insurance Group Holdings, Inc. | | | 235,500 | | | | 7,943,522 | | |
Olympus Corp. | | | 124,600 | | | | 4,766,574 | | |
Pigeon Corp. | | | 108,600 | | | | 4,126,272 | | |
The accompanying notes are an integral part of the financial statements.
59
Annual Report December 31, 2017
December 31, 2017
Baillie Gifford EAFE Pure Fund
| | | Shares | | Value | |
Rakuten, Inc. | | | 368,800 | | | $ | 3,371,081 | | |
Shimano, Inc. | | | 46,900 | | | | 6,592,199 | | |
Shiseido Co., Ltd. | | | 165,900 | | | | 7,993,911 | | |
SMC Corp. | | | 18,000 | | | | 7,386,919 | | |
SoftBank Group Corp. | | | 50,900 | | | | 4,029,782 | | |
Sugi Holdings Co., Ltd. | | | 34,500 | | | | 1,757,529 | | |
Suruga Bank Ltd. | | | 141,200 | | | | 3,019,192 | | |
| | | | | | 74,676,701 | | |
NETHERLANDS — 1.2% | |
| ASML Holding NV | | | 21,750 | | | | 3,781,410 | | |
PORTUGAL — 2.3% | |
Jeronimo Martins SGPS SA | | | 365,841 | | | | 7,108,844 | | |
SINGAPORE — 4.2% | |
Jardine Matheson Holdings Ltd. | | | 86,900 | | | | 5,272,441 | | |
United Overseas Bank Ltd. | | | 372,089 | | | | 7,334,997 | | |
| | | | | | 12,607,438 | | |
SPAIN — 3.8% | |
Distribuidora Internacional de Alimentacion SA | | | 568,569 | | | | 2,932,471 | | |
Inditex SA | | | 243,126 | | | | 8,453,900 | | |
| | | | | | 11,386,371 | | |
SWEDEN — 7.5% | |
Atlas Copco AB, A Shares | | | 138,119 | | | | 5,960,674 | | |
Atlas Copco AB, B Shares | | | 35,100 | | | | 1,345,281 | | |
Investor AB, B Shares | | | 175,743 | | | | 8,015,229 | | |
Svenska Handelsbanken AB, A Shares | | | 554,328 | | | | 7,575,471 | | |
| | | | | | 22,896,655 | | |
SWITZERLAND — 9.8% | |
Compagnie Financiere Richemont SA | | | 67,634 | | | | 6,125,468 | | |
Mettler-Toledo International, Inc. (a) | | | 13,918 | | | | 8,622,479 | | |
Nestle SA | | | 94,120 | | | | 8,092,086 | | |
Schindler Holding AG | | | 26,246 | | | | 6,036,332 | | |
u-blox Holding AG (a) | | | 4,656 | | | | 916,436 | | |
| | | | | | 29,792,801 | | |
The accompanying notes are an integral part of the financial statements.
60
Annual Report December 31, 2017
December 31, 2017
Baillie Gifford EAFE Pure Fund
| | | Shares | | Value | |
UNITED KINGDOM — 19.0% | |
| ASOS PLC (a) | | | 88,625 | | | $ | 7,995,399 | | |
Auto Trader Group PLC 144A (b) | | | 992,459 | | | | 4,727,399 | | |
Burberry Group PLC | | | 164,429 | | | | 3,964,350 | | |
Capita PLC | | | 466,103 | | | | 2,518,400 | | |
Hargreaves Lansdown PLC | | | 404,098 | | | | 9,813,817 | | |
Intertek Group PLC | | | 89,297 | | | | 6,244,849 | | |
John Wood Group PLC | | | 298,451 | | | | 2,611,329 | | |
Johnson Matthey PLC | | | 146,429 | | | | 6,067,767 | | |
Jupiter Fund Management PLC | | | 519,829 | | | | 4,398,517 | | |
Rightmove PLC | | | 123,474 | | | | 7,493,090 | | |
Weir Group PLC (The) | | | 66,894 | | | | 1,917,425 | | |
| | | | | | 57,752,342 | | |
Total Common Stocks | |
(cost $249,146,900) | | | | | 299,312,168 | | |
PREFERRED STOCKS — 0.5% | |
GERMANY — 0.5% | |
Sartorius AG (cost $1,541,845) | | | 15,803 | | | | 1,501,159 | | |
TOTAL INVESTMENTS — 99.0% | |
(cost $250,688,745) | | | | $ | 300,813,327 | | |
Other assets less liabilities — 1.0% | | | | | 3,037,154 | | |
NET ASSETS — 100.0% | | | | $ | 303,850,481 | | |
(a) Non-income producing security.
(b) 144A — Securities are exempt from registration under Rule 144A of the Securities Act of 1933, as amended. These securities may be resold in transactions exempt from registration, normally to qualified institutional buyers. Prices are obtained daily from the London International Stock Exchange; therefore, fair valuation is typically not required. At December 31, 2017, the net value of these securities was $12,247,262 representing 4.0% of net assets.
The accompanying notes are an integral part of the financial statements.
61
Annual Report December 31, 2017
December 31, 2017
Baillie Gifford EAFE Pure Fund
Fair Value Measurement
The following is a summary of the inputs used as of December 31, 2017 in valuing the Fund's investments carried at fair value:
Investments in Securities | | Level 1 | | Level 2 | | Level 3 | | Total | |
Common Stocks | |
Australia | | $ | 206,215 | | | $ | 21,859,644 | | | $ | — | | | $ | 22,065,859 | | |
Denmark | | | — | | | | 19,434,201 | | | | — | | | | 19,434,201 | | |
Finland | | | — | | | | 4,789,680 | | | | — | | | | 4,789,680 | | |
France | | | — | | | | 6,214,797 | | | | — | | | | 6,214,797 | | |
Germany | | | — | | | | 19,866,162 | | | | — | | | | 19,866,162 | | |
Hong Kong | | | — | | | | 6,938,907 | | | | — | | | | 6,938,907 | | |
Japan | | | — | | | | 74,676,701 | | | | — | | | | 74,676,701 | | |
Netherlands | | | — | | | | 3,781,410 | | | | — | | | | 3,781,410 | | |
Portugal | | | 7,108,844 | | | | — | | | | — | | | | 7,108,844 | | |
Singapore | | | — | | | | 12,607,438 | | | | — | | | | 12,607,438 | | |
Spain | | | — | | | | 11,386,371 | | | | — | | | | 11,386,371 | | |
Sweden | | | — | | | | 22,896,655 | | | | — | | | | 22,896,655 | | |
Switzerland | | | 9,538,915 | | | | 20,253,886 | | | | — | | | | 29,792,801 | | |
United Kingdom | | | 6,644,824 | | | | 51,107,518 | | | | — | | | | 57,752,342 | | |
Total Common Stocks | | | 23,498,798 | | | | 275,813,370 | | | | — | | | | 299,312,168 | | |
Preferred Stocks | |
Germany | | | — | | | | 1,501,159 | | | | — | | | | 1,501,159 | | |
Total | | $ | 23,498,798 | | | $ | 277,314,529 | | | $ | — | | | $ | 300,813,327 | | |
For the EAFE Pure Fund, fair value of Level 2 and Level 1 investments at December 31, 2016 was $165,001,501 and $5,124,866, respectively. $7,845,222 was transferred out of Level 2 into Level 1 during the year ended December 31, 2017. Transfers into Level 1 and out of Level 2 resulted when pricing was based on quoted market prices.
It is the Fund's policy to recognize transfers in and transfers out at the fair value as of the beginning of the period.
The accompanying notes are an integral part of the financial statements.
62
Statement of Assets and Liabilities
Annual Report December 31, 2017
December 31, 2017
Baillie Gifford EAFE Pure Fund
ASSETS | |
Investments, at value (cost $250,688,745) | | $ | 300,813,327 | | |
Cash | | | 2,982,693 | | |
Tax reclaims receivable | | | 422,837 | | |
Dividends receivable | | | 190,137 | | |
Prepaid assets | | | 30,646 | | |
Total Assets | | | 304,439,640 | | |
LIABILITIES | |
Advisory fee payable | | | 274,579 | | |
Servicing fee payable | | | 119,071 | | |
Trustee fee payable | | | 3,551 | | |
Accrued expenses | | | 191,958 | | |
Total Liabilities | | | 589,159 | | |
NET ASSETS | | $ | 303,850,481 | | |
COMPOSITION OF NET ASSETS | |
Paid-in capital | | $ | 253,944,507 | | |
Distributions in excess of net investment income | | | (1,994,694 | ) | |
Accumulated net realized gain on investments and foreign currency transactions | | | 1,761,444 | | |
Net unrealized appreciation in value of investments and foreign currencies | | | 50,139,224 | | |
| | | $ | 303,850,481 | | |
NET ASSET VALUE, PER SHARE | |
| Class 2 ($221,316,011 / 18,357,044 shares outstanding), unlimited authorized, no par value | | $ | 12.06 | | |
| Class 3 ($82,523,036 / 6,778,981 shares outstanding), unlimited authorized, no par value | | $ | 12.17 | | |
| Class K ($5,717 / 474 shares outstanding), unlimited authorized, no par value | | $ | 12.06 | | |
| Institutional Class ($5,717 / 474 shares outstanding), unlimited authorized, no par value | | $ | 12.06 | | |
The accompanying notes are an integral part of the financial statements.
63
Annual Report December 31, 2017
For the Year Ended December 31, 2017
Baillie Gifford EAFE Pure Fund
INVESTMENT INCOME | |
Dividends (net of foreign withholding taxes of $477,877) | | $ | 5,203,228 | | |
Interest | | | 176 | | |
Total Investment Income | | | 5,203,404 | | |
EXPENSES | |
Advisory fee (Note B) | | | 967,251 | | |
Shareholder Servicing fees — Class 1 Shares (Note B) | | | 3 | | |
Shareholder Servicing fees — Class 2 Shares (Note B) | | | 366,038 | | |
Shareholder Servicing fees — Class 3 Shares (Note B) | | | 61,032 | | |
Administration & Supervisory Fee — Class K Shares (Note B) | | | 6 | | |
Administration & Supervisory Fee — Institutional Class Shares (Note B) | | | 6 | | |
Fund accounting | | | 170,447 | | |
Custody | | | 41,224 | | |
Transfer agency | | | 55,564 | | |
Legal | | | 45,193 | | |
Professional fees | | | 28,149 | | |
Trustees' fees | | | 12,456 | | |
Insurance | | | 2,140 | | |
Miscellaneous | | | 20,624 | | |
Total Expenses | | | 1,770,133 | | |
Net Investment Income | | | 3,433,271 | | |
REALIZED AND UNREALIZED GAIN (LOSS) ON INVESTMENTS
AND FOREIGN CURRENCY TRANSACTIONS | |
Net realized gain (loss) from: | |
Investments | | | 5,875,452 | | |
Foreign currency transactions | | | (123,473 | ) | |
| | | | 5,751,979 | | |
Net change in unrealized appreciation on: | |
Investments | | | 56,315,923 | | |
Translation of assets and liabilities denominated in foreign currencies | | | 31,467 | | |
| | | | 56,347,390 | | |
Net realized and unrealized gain on investments and foreign currency transactions | | | 62,099,369 | | |
NET INCREASE IN NET ASSETS FROM OPERATIONS | | $ | 65,532,640 | | |
The accompanying notes are an integral part of the financial statements.
64
Statements of Changes in Net Assets
Annual Report December 31, 2017
Baillie Gifford EAFE Pure Fund
| | | For the
Year Ended
December 31,
2017 | | For the
Year Ended
December 31,
2016 | |
INCREASE (DECREASE) IN NET ASSETS FROM OPERATIONS | |
Net investment income | | $ | 3,433,271 | | | $ | 3,001,397 | | |
Net realized gain (loss) from investments and foreign currency transactions | | | 5,751,979 | | | | (2,342,946 | ) | |
Net change in unrealized appreciation (depreciation) on investments
and translation of assets and liabilities in foreign currencies | | | 56,347,390 | | | | (1,001,654 | ) | |
Net increase (decrease) in net assets from operations | | | 65,532,640 | | | | (343,203 | ) | |
DIVIDENDS AND DISTRIBUTIONS TO SHAREHOLDERS FROM: | |
Net investment income: | |
Class 1 | | | — | | | | (44 | ) | |
Class 2 | | | (3,944,235 | ) | | | (2,430,620 | ) | |
Class 3 | | | (1,529,526 | ) | | | — | | |
Class K | | | (105 | ) | | | — | | |
Institutional Class | | | (105 | ) | | | — | | |
Total Dividends and Distributions | | | (5,473,971 | ) | | | (2,430,664 | ) | |
TRANSACTIONS IN SHARES OF BENEFICIAL INTEREST | |
Net proceeds from shares subscribed: | |
Class 1 | | | 1,497 | | | | 2,994 | | |
| Class 2* | | | 19,968,711 | | | | — | | |
Class 3 | | | 74,325,352 | | | | — | | |
Class K | | | 5,000 | | | | — | | |
Institutional Class | | | 5,000 | | | | — | | |
Purchase fees: | |
Class 1 | | | 5 | | | | — | | |
Class 2 | | | 198,413 | | | | 6 | | |
Class 3 | | | 1 | | | | — | | |
Redemption fees: | |
Class 2 | | | 3,003 | | | | — | | |
Dividends reinvested: | |
Class 1 | | | — | | | | 44 | | |
Class 2 | | | 3,944,235 | | | | 2,430,621 | | |
Class 3 | | | 1,529,525 | | | | — | | |
Class K | | | 105 | | | | — | | |
Institutional Class | | | 105 | | | | — | | |
Cost of shares redeemed: | |
| Class 1* | | | (4,715 | ) | | | — | | |
Class 2 | | | (23,503,003 | ) | | | — | | |
Class 3 | | | (5,000,000 | ) | | | — | | |
Increase in Net Assets from Transactions in Shares of Beneficial Interest | | | 71,473,234 | | | | 2,433,665 | | |
Total Increase (Decrease) in Net Assets | | | 131,531,903 | | | | (340,202 | ) | |
NET ASSETS | |
Beginning of year | | | 172,318,578 | | | | 172,658,780 | | |
End of year (including distributions in excess of net investment income of
$1,994,694 and $28,102, respectively) | | $ | 303,850,481 | | | $ | 172,318,578 | | |
| | | | | | |
* Class 1 shareholders were converted to Class 2 during the period. Please refer to Notes A and D.
The accompanying notes are an integral part of the financial statements.
65
Annual Report December 31, 2017
Baillie Gifford EAFE Pure Fund
Selected data for a Class 2 Share outstanding throughout each period:
| | | For the
Year Ended
December 31,
2017 | | For the
Year Ended
December 31,
2016 | | For the
Year Ended
December 31,
2015 | | For the Period
April 15,
2014(a)
through
December 31,
2014 | |
Net asset value, beginning of period | | $ | 9.55 | | | $ | 9.70 | | | $ | 9.36 | | | $ | 10.00 | | |
From Investment Operations | |
Net investment income(b) | | | 0.14 | | | | 0.17 | | | | 0.13 | | | | 0.08 | | |
Net realized and unrealized gain (loss) on investments and
foreign currency transactions | | | 2.58 | | | | (0.18 | ) | | | 0.27 | (f) | | | (0.69 | ) | |
Net increase (decrease) in net asset value from investment
operations | | | 2.72 | | | | (0.01 | ) | | | 0.40 | | | | (0.61 | ) | |
Dividends and Distributions to Shareholders | |
Dividends from net investment income | | | (0.22 | ) | | | (0.14 | ) | | | (0.09 | ) | | | (0.06 | ) | |
Distributions from net realized gain on investments | | | — | | | | — | | | | — | | | | (0.00 | )(c) | |
Total Dividends and Distributions | | | (0.22 | ) | | | (0.14 | ) | | | (0.09 | ) | | | (0.06 | ) | |
Proceeds from Purchase Fees and Redemption Fees(b) | | | 0.01 | | | | (0.00 | )(c) | | | 0.03 | | | | 0.03 | | |
Net asset value, end of period | | $ | 12.06 | | | $ | 9.55 | | | $ | 9.70 | | | $ | 9.36 | | |
Total Return | |
Total return based on net asset value(d) | | | 28.59 | % | | | (0.20 | )% | | | 4.61 | % | | | (5.79 | )% | |
Ratios/Supplemental Data | |
Net assets, end of period (000's omitted) | | $ | 221,316 | | | $ | 172,316 | | | $ | 172,659 | | | $ | 43,223 | | |
Ratio of expenses to average net assets, before waiver | | | 0.66 | % | | | 0.66 | % | | | 0.66 | % | | | 0.70 | %* | |
Ratio of net expenses to average net assets, after waiver | | | 0.66 | % | | | 0.66 | % | | | 0.66 | % | | | 0.67 | %* | |
Ratio of net investment income to average net assets | | | 1.22 | % | | | 1.73 | % | | | 1.36 | % | | | 1.17 | %* | |
Portfolio turnover rate(e) | | | 21 | % | | | 13 | % | | | 18 | % | | | 5 | % | |
* Annualized.
(a) Commencement of investment operations.
(b) Calculated based upon average shares outstanding during the period.
(c) Amount is less than $0.005 per share.
(d) Total investment return is calculated assuming an initial investment made at the net asset value at the beginning of the period, reinvestment of all dividends and distributions, if any, at net asset value during the period, and redemption on the last day of the period. Total return is not annualized for periods less than one year.
(e) Portfolio turnover rate calculated at Fund level.
(f) Calculation of the net gain per share (both realized and unrealized) does not correlate to the aggregate realized and unrealized losses presented in the Statement of Operations due to the timing of sales and repurchases of Class shares in relation to fluctuating market values of the investments of the Fund.
The accompanying notes are an integral part of the financial statements.
66
Annual Report December 31, 2017
Baillie Gifford EAFE Pure Fund
Selected data for a Class 3 Share outstanding throughout the period:
| | | For the Period
March 24, 2017(a)
through
December 31,
2017 | |
Net asset value, beginning of period | | $ | 10.49 | | |
From Investment Operations | |
Net investment income(b) | | | 0.12 | | |
Net realized and unrealized gain on investments and foreign currency transactions | | | 1.79 | | |
Net increase in net asset value from investment operations | | | 1.91 | | |
Dividends and Distributions to Shareholders | |
Dividends from net investment income | | | (0.23 | ) | |
Total Dividends and Distributions | | | (0.23 | ) | |
Proceeds from Purchase Fees and Redemption Fees(b) | | | 0.00 | (c) | |
Net asset value, end of period | | $ | 12.17 | | |
Total Return | |
Total return based on net asset value(d) | | | 18.25 | % | |
Ratios/Supplemental Data | |
Net assets, end of period (000's omitted) | | $ | 82,523 | | |
Ratio of net expenses to average net assets | | | 0.58 | %* | |
Ratio of net investment income to average net assets | | | 1.32 | %* | |
Portfolio turnover rate(e) | | | 21 | % | |
* Annualized.
(a) Commencement of investment operations.
(b) Calculated based upon average shares outstanding during the period.
(c) Amount is less than $0.005 per share.
(d) Total investment return is calculated assuming an initial investment made at the net asset value at the beginning of the period, reinvestment of all dividends and distributions, if any, at net asset value during the period, and redemption on the last day of the period. Total return is not annualized for periods less than one year.
(e) Portfolio turnover rate calculated at Fund level.
The accompanying notes are an integral part of the financial statements.
67
Annual Report December 31, 2017
Baillie Gifford EAFE Pure Fund
Selected data for a Class K Share outstanding throughout the period:
| | | For the Period
April 28, 2017(a)
through
December 31,
2017 | |
Net asset value, beginning of period | | $ | 10.74 | | |
From Investment Operations | |
Net investment income(b) | | | 0.07 | | |
Net realized and unrealized gain on investments and foreign currency transactions | | | 1.47 | | |
Net increase in net asset value from investment operations | | | 1.54 | | |
Dividends and Distributions to Shareholders | |
Dividends from net investment income | | | (0.22 | ) | |
Total Dividends and Distributions | | | (0.22 | ) | |
Net asset value, end of period | | $ | 12.06 | | |
Total Return | |
Total return based on net asset value(c) | | | 14.39 | % | |
Ratios/Supplemental Data | |
Net assets, end of period (000's omitted) | | $ | 6 | | |
Ratio of net expenses to average net assets | | | 0.66 | %* | |
Ratio of net investment income to average net assets | | | 0.87 | %* | |
Portfolio turnover rate(d) | | | 21 | % | |
* Annualized.
(a) Commencement of investment operations.
(b) Calculated based upon average shares outstanding during the period.
(c) Total investment return is calculated assuming an initial investment made at the net asset value at the beginning of the period, reinvestment of all dividends and distributions, if any, at net asset value during the period, and redemption on the last day of the period. Total return is not annualized for periods less than one year.
(d) Portfolio turnover rate calculated at Fund level.
The accompanying notes are an integral part of the financial statements.
68
Annual Report December 31, 2017
Baillie Gifford EAFE Pure Fund
Selected data for an Institutional Class Share outstanding throughout the period:
| | | For the Period
April 28, 2017(a)
through
December 31,
2017 | |
Net asset value, beginning of period | | $ | 10.74 | | |
From Investment Operations | |
Net investment income(b) | | | 0.07 | | |
Net realized and unrealized gain on investments and foreign currency transactions | | | 1.47 | | |
Net increase in net asset value from investment operations | | | 1.54 | | |
Dividends and Distributions to Shareholders | |
Dividends from net investment income | | | (0.22 | ) | |
Total Dividends and Distributions | | | (0.22 | ) | |
Net asset value, end of period | | $ | 12.06 | | |
Total Return | |
Total return based on net asset value(c) | | | 14.39 | % | |
Ratios/Supplemental Data | |
Net assets, end of period (000's omitted) | | $ | 6 | | |
Ratio of net expenses to average net assets | | | 0.66 | %* | |
Ratio of net investment income to average net assets | | | 0.87 | %* | |
Portfolio turnover rate(d) | | | 21 | % | |
* Annualized.
(a) Commencement of investment operations.
(b) Calculated based upon average shares outstanding during the period.
(c) Total investment return is calculated assuming an initial investment made at the net asset value at the beginning of the period, reinvestment of all dividends and distributions, if any, at net asset value during the period, and redemption on the last day of the period. Total return is not annualized for periods less than one year.
(d) Portfolio turnover rate calculated at Fund level.
The accompanying notes are an integral part of the financial statements.
69
Industry Diversification Table
Annual Report December 31, 2017
December 31, 2017
Baillie Gifford Emerging Markets Fund
| | | Value | | % of Total
Net Assets | |
Auto Manufacturers | | $ | 17,218,227 | | | | 1.0 | % | |
Automobiles & Parts | | | 70,748,527 | | | | 4.1 | | |
Banks | | | 327,629,789 | | | | 19.2 | | |
Broadline Retailers | | | 36,664,733 | | | | 2.1 | | |
Building Materials & Fixtures | | | 17,940,048 | | | | 1.1 | | |
Commodity Chemicals | | | 18,968,474 | | | | 1.1 | | |
Computer Services | | | 19,819,096 | | | | 1.2 | | |
Construction & Building Materials | | | 32,863,311 | | | | 1.9 | | |
Electronic & Electrical Equipment | | | 164,529,622 | | | | 9.7 | | |
Food & Staples | | | 6,393,665 | | | | 0.4 | | |
Food Producers & Processors | | | 9,204,876 | | | | 0.5 | | |
General Financial | | | 9,300,767 | | | | 0.5 | | |
General Industrials | | | 10,704,597 | | | | 0.6 | | |
General Retailers | | | 7,171,340 | | | | 0.4 | | |
Household Goods | | | 16,039,292 | | | | 0.9 | | |
Industrial Engineering | | | 10,893,340 | | | | 0.6 | | |
Insurance | | | 27,139,876 | | | | 1.6 | | |
Internet, Software & Services | | | 210,259,282 | | | | 12.5 | | |
Leisure Goods | | | 26,259,392 | | | | 1.5 | | |
Life Insurance | | | 80,217,582 | | | | 4.7 | | |
Media & Photography | | | 54,450,123 | | | | 3.2 | | |
Metals & Mining | | | 24,490,780 | | | | 1.4 | | |
Mortgage Finance | | | 45,912,635 | | | | 2.7 | | |
Nonlife Insurance | | | 24,329,315 | | | | 1.4 | | |
Oil, Gas & Consumable fuels | | | 138,065,410 | | | | 8.1 | | |
Personal Goods | | | 8,751,429 | | | | 0.5 | | |
Real Estate Holding & Development | | | 38,108,025 | | | | 2.3 | | |
Semiconductors | | | 86,381,255 | | | | 5.1 | | |
Specialized Consumer Services | | | 88,761,964 | | | | 5.2 | | |
Technology Hardware & Equipment | | | 37,781,910 | | | | 2.2 | | |
Textiles and Apparel | | | 4,775,705 | | | | 0.3 | | |
Toys | | | 11,440,332 | | | | 0.7 | | |
Transportation Services | | | 13,666,935 | | | | 0.8 | | |
Total Value of Investments | | | 1,696,881,654 | | | | 99.5 | | |
Other assets less liabilities | | | 8,908,581 | | | | 0.5 | | |
Net Assets | | $ | 1,705,790,235 | | | | 100.0 | % | |
70
Annual Report December 31, 2017
December 31, 2017
Baillie Gifford Emerging Markets Fund
| | | Shares | | Value | |
COMMON STOCKS — 95.3% | |
ARGENTINA — 1.4% | |
MercadoLibre, Inc. | | | 74,073 | | | $ | 23,307,810 | | |
BRAZIL — 4.4% | |
B3 SA — Brasil Bolsa Balcao | | | 1,355,200 | | | | 9,300,767 | | |
Banco Bradesco SA ADR | | | 3,087,835 | | | | 31,619,431 | | |
Kroton Educacional SA | | | 1,292,400 | | | | 7,171,340 | | |
Petroleo Brasileiro SA ADR (a) | | | 2,626,015 | | | | 27,021,694 | | |
| | | | | | 75,113,232 | | |
CHINA — 30.1% | |
Alibaba Group Holding Ltd. ADR (a) | | | 514,771 | | | | 88,761,964 | | |
Baidu, Inc. ADR (a) | | | 42,086 | | | | 9,856,962 | | |
China Merchants Bank Co., Ltd., Class H | | | 9,249,000 | | | | 36,617,370 | | |
China Vanke Co., Ltd., Class H | | | 6,279,000 | | | | 24,987,200 | | |
CNOOC Ltd. | | | 30,694,000 | | | | 44,064,831 | | |
Geely Automobile Holdings Ltd. | | | 4,505,000 | | | | 15,517,029 | | |
JD.com, Inc. ADR (a) | | | 558,719 | | | | 23,142,141 | | |
Minth Group Ltd. | | | 2,336,000 | | | | 14,047,517 | | |
Ping An Insurance Group Co. of China Ltd., Class H | | | 7,734,000 | | | | 80,217,582 | | |
Shenzhou International Group Holdings Ltd. | | | 919,000 | | | | 8,751,429 | | |
SINA Corp. (a) | | | 95,160 | | | | 9,545,500 | | |
Sohu.com, Inc. (a) | | | 144,558 | | | | 6,266,589 | | |
Tencent Holdings Ltd. | | | 2,373,800 | | | | 122,863,033 | | |
ZTE Corp., Class H (a) | | | 7,761,800 | | | | 29,011,657 | | |
| | | | | | 513,650,804 | | |
HONG KONG — 5.6% | |
AAC Technologies Holdings, Inc. | | | 1,070,000 | | | | 18,937,353 | | |
Brilliance China Automotive Holdings Ltd. | | | 7,084,000 | | | | 18,825,045 | | |
China Taiping Insurance Holdings Co., Ltd. | | | 4,157,610 | | | | 15,517,689 | | |
Haier Electronics Group Co., Ltd. (a) | | | 5,884,300 | | | | 16,039,292 | | |
Kingsoft Corp. Ltd. | | | 3,453,000 | | | | 11,440,332 | | |
Sunny Optical Technology Group Co., Ltd. | | | 1,173,000 | | | | 14,893,883 | | |
| | | | | | 95,653,594 | | |
The accompanying notes are an integral part of the financial statements.
71
Annual Report December 31, 2017
December 31, 2017
Baillie Gifford Emerging Markets Fund
| | | Shares | | Value | |
INDIA — 13.2% | |
Ambuja Cements Ltd. | | | 1,981,244 | | | $ | 8,444,596 | | |
Asian Paints Ltd. | | | 638,409 | | | | 11,571,674 | | |
Housing Development Finance Corp., Ltd. | | | 1,714,524 | | | | 45,912,635 | | |
ICICI Bank Ltd. | | | 4,713,129 | | | | 23,099,365 | | |
Mahindra & Mahindra Ltd. | | | 1,465,590 | | | | 17,218,227 | | |
Maruti Suzuki India Ltd. | | | 146,838 | | | | 22,358,936 | | |
Reliance Industries Ltd. | | | 4,646,677 | | | | 66,978,885 | | |
Tata Consultancy Services Ltd. | | | 468,737 | | | | 19,819,096 | | |
UltraTech Cement Ltd. | | | 140,450 | | | | 9,495,452 | | |
| | | | | | 224,898,866 | | |
INDONESIA — 2.1% | |
Bank Mandiri Persero Tbk PT | | | 20,583,700 | | | | 12,120,844 | | |
Bank Rakyat Indonesia Persero Tbk PT | | | 89,047,000 | | | | 23,890,258 | | |
| | | | | | 36,011,102 | | |
MEXICO — 3.8% | |
Alfa SAB de CV, Class A | | | 9,721,900 | | | | 10,704,597 | | |
Cemex SAB de CV ADR (a) | | | 2,838,885 | | | | 21,291,637 | | |
Grupo Financiero Banorte SAB de CV, Class O | | | 3,592,000 | | | | 19,716,952 | | |
Wal-Mart de Mexico SAB de CV | | | 5,514,060 | | | | 13,522,592 | | |
| | | | | | 65,235,778 | | |
PHILIPPINES — 0.8% | |
Ayala Land, Inc. | | | 6,596,100 | | | | 5,884,347 | | |
SM Prime Holdings, Inc. | | | 9,633,200 | | | | 7,236,478 | | |
| | | | | | 13,120,825 | | |
RUSSIA — 6.7% | |
Magnit PJSC GDR Reg S | | | 234,920 | | | | 6,393,665 | | |
MMC Norilsk Nickel PJSC ADR | | | 1,312,489 | | | | 24,490,780 | | |
Sberbank of Russia PJSC ADR | | | 4,940,210 | | | | 83,269,907 | | |
| | | | | | 114,154,352 | | |
SOUTH AFRICA — 3.2% | |
Naspers Ltd., N Shares | | | 196,533 | | | | 54,450,123 | | |
The accompanying notes are an integral part of the financial statements.
72
Annual Report December 31, 2017
December 31, 2017
Baillie Gifford Emerging Markets Fund
| | | Shares | | Value | |
SOUTH KOREA — 10.9% | |
DB Insurance Co., Ltd. (a) | | | 161,333 | | | $ | 10,729,914 | | |
Doosan Bobcat, Inc. (a) | | | 326,306 | | | | 10,893,340 | | |
Hyundai Marine & Fire Insurance Co., Ltd. (a) | | | 264,999 | | | | 11,622,187 | | |
LG Chem Ltd. | | | 50,140 | | | | 18,968,474 | | |
NAVER Corp. (a) | | | 24,460 | | | | 19,870,807 | | |
NCSoft Corp. (a) | | | 38,378 | | | | 16,042,366 | | |
Netmarble Games Corp. 144A (a)(b) | | | 70,016 | | | | 12,299,327 | | |
Orion Corp. (a) | | | 94,461 | | | | 9,204,876 | | |
Samsung Electronics Co., Ltd. | | | 26,397 | | | | 62,716,930 | | |
Samsung Fire & Marine Insurance Co., Ltd. (a) | | | 54,541 | | | | 13,599,401 | | |
| | | | | | 185,947,622 | | |
TAIWAN — 8.3% | |
Advanced Semiconductor Engineering, Inc. | | | 5,371,332 | | | | 6,875,471 | | |
Eclat Textile Co., Ltd. | | | 479,360 | | | | 4,775,705 | | |
Hon Hai Precision Industry Co., Ltd. | | | 8,734,848 | | | | 27,773,231 | | |
Largan Precision Co., Ltd. | | | 104,000 | | | | 13,960,065 | | |
Pegatron Corp. | | | 3,640,000 | | | | 8,770,253 | | |
Taiwan Semiconductor Manufacturing Co., Ltd. | | | 10,383,310 | | | | 79,505,784 | | |
| | | | | | 141,660,509 | | |
THAILAND — 3.7% | |
Airports of Thailand PCL NVDR | | | 6,563,500 | | | | 13,666,935 | | |
Kasikornbank PCL NVDR | | | 2,896,900 | | | | 20,574,720 | | |
Siam Commercial Bank PCL NVDR | | | 6,112,200 | | | | 28,054,815 | | |
| | | | | | 62,296,470 | | |
TURKEY — 1.0% | |
Turkiye Garanti Bankasi AS | | | 6,317,484 | | | | 17,852,213 | | |
UNITED STATES — 0.1% | |
Weibo Corp. ADR (a) | | | 24,224 | | | | 2,506,215 | | |
Total Common Stocks | |
(cost $1,032,936,887) | | | | | 1,625,859,515 | | |
The accompanying notes are an integral part of the financial statements.
73
Annual Report December 31, 2017
December 31, 2017
Baillie Gifford Emerging Markets Fund
| | | Shares | | Value | |
PREFERRED STOCKS — 4.2% | |
BRAZIL — 1.8% | |
Banco Bradesco SA | | | 3,021,929 | | | $ | 30,813,914 | | |
SOUTH KOREA — 2.4% | |
Samsung Electronics Co., Ltd. | | | 20,647 | | | | 40,208,225 | | |
Total Preferred Stocks | |
(cost $37,975,665) | | | | | 71,022,139 | | |
TOTAL INVESTMENTS — 99.5% | |
(cost $1,070,912,552) | | | | $ | 1,696,881,654 | | |
Other assets less liabilities — 0.5% | | | | | 8,908,581 | | |
NET ASSETS — 100.0% | | | | $ | 1,705,790,235 | | |
(a) Non-income producing security.
(b) 144A — Securities are exempt from registration under Rule 144A of the Securities Act of 1933, as amended. These securities may be resold in transactions exempt from registration, normally to qualified institutional buyers. Prices are obtained daily from the London International Stock Exchange; therefore, fair valuation is typically not required. At December 31, 2017, the net value of these securities was $12,299,327 representing 0.7% of net assets.
ADR — American Depositary Receipt.
GDR — Global Depositary Receipt.
NVDR — Non-Voting Depositary Receipt.
Reg S — Regulation S ("Reg S") under the Securities Act of 1933, as amended ("1933 Act") is a safe harbor that defines when an offering of securities will be deemed to come to rest abroad and therefore is not subject to the registration obligations imposed under Section 5 of the 1933 Act. The regulation includes two safe harbor provisions: an issuer safe harbor and a resale safe harbor. In each case, the regulation demands that offers and sales of the securities be made outside the United States and that no offering participant (which includes the issuer, the banks assisting with the offer and their respective affiliates) engage in "directed" selling efforts. In the case of issuers for whose securities there is substantial U.S. market interest, the regulation also requires that no offers and sales be made to U.S. persons (including U.S. persons physically located outside the United States).
The accompanying notes are an integral part of the financial statements.
74
Annual Report December 31, 2017
December 31, 2017
Baillie Gifford Emerging Markets Fund
Fair Value Measurement
The following is a summary of the inputs used as of December 31, 2017 in valuing the Fund's investments carried at fair value:
Investments in Securities | | Level 1 | | Level 2 | | Level 3 | | Total | |
Common Stocks | |
Argentina | | $ | 23,307,810 | | | $ | — | | | $ | — | | | $ | 23,307,810 | | |
Brazil | | | 58,641,125 | | | | 16,472,107 | | | | — | | | | 75,113,232 | | |
China | | | 146,324,585 | | | | 367,326,219 | | | | — | | | | 513,650,804 | | |
Hong Kong | | | — | | | | 95,653,594 | | | | — | | | | 95,653,594 | | |
India | | | 8,444,596 | | | | 216,454,270 | | | | — | | | | 224,898,866 | | |
Indonesia | | | 23,890,258 | | | | 12,120,844 | | | | — | | | | 36,011,102 | | |
Mexico | | | 54,531,181 | | | | 10,704,597 | | | | — | | | | 65,235,778 | | |
Philippines | | | 7,236,478 | | | | 5,884,347 | | | | — | | | | 13,120,825 | | |
Russia | | | — | | | | 114,154,352 | | | | — | | | | 114,154,352 | | |
South Africa | | | — | | | | 54,450,123 | | | | — | | | | 54,450,123 | | |
South Korea | | | 45,740,754 | | | | 140,206,868 | | | | — | | | | 185,947,622 | | |
Taiwan | | | — | | | | 141,660,509 | | | | — | | | | 141,660,509 | | |
Thailand | | | — | | | | 62,296,470 | | | | — | | | | 62,296,470 | | |
Turkey | | | — | | | | 17,852,213 | | | | — | | | | 17,852,213 | | |
United States | | | 2,506,215 | | | | — | | | | — | | | | 2,506,215 | | |
Total Common Stocks | | | 370,623,002 | | | | 1,255,236,513 | | | | — | | | | 1,625,859,515 | | |
Preferred Stocks | |
Brazil | | | — | | | | 30,813,914 | | | | — | | | | 30,813,914 | | |
South Korea | | | — | | | | 40,208,225 | | | | — | | | | 40,208,225 | | |
Total Preferred Stocks | | | — | | | | 71,022,139 | | | | — | | | | 71,022,139 | | |
Total | | $ | 370,623,002 | | | $ | 1,326,258,652 | | | $ | — | | | $ | 1,696,881,654 | | |
For the Emerging Markets Fund, fair value of Level 2 and Level 1 investments at December 31, 2016 was $1,052,849,853 and $275,066,835, respectively. $61,015,389 was transferred out of Level 2 into Level 1 and $18,263,769 was transferred out of Level 1 into Level 2 during the year ended December 31, 2017. Transfers into Level 2 and out of Level 1 resulted from foreign securities which were priced using inputs from a third-party vendor modeling tool to reflect any significant market movements between the time at which the Fund valued its securities and the earlier closing of foreign markets. Transfers into Level 1 and out of Level 2 resulted when pricing was based on quoted market prices.
It is the Fund's policy to recognize transfers in and transfers out at the fair value as of the beginning of the period.
The accompanying notes are an integral part of the financial statements.
75
Statement of Assets and Liabilities
Annual Report December 31, 2017
December 31, 2017
Baillie Gifford Emerging Markets Fund
ASSETS | |
Investments, at value (cost $ 1,070,912,552) | | $ | 1,696,881,654 | | |
Cash | | | 33,625,321 | | |
Foreign cash, at value (cost $12) | | | 12 | | |
Capital shares sold receivable | | | 322,000 | | |
Dividends receivable | | | 3,132,255 | | |
Tax reclaims receivable | | | 34,837 | | |
Prepaid assets | | | 32,111 | | |
Total Assets | | | 1,734,028,190 | | |
LIABILITIES | |
Advisory fee payable | | | 2,723,938 | | |
Capital shares purchased payable | | | 16,000,000 | | |
Servicing fee payable | | | 254,676 | | |
Trustee fee payable | | | 23,232 | | |
Payable for deferred Indian capital gains tax | | | 8,334,973 | | |
Accrued expenses | | | 901,136 | | |
Total Liabilities | | | 28,237,955 | | |
NET ASSETS | | $ | 1,705,790,235 | | |
COMPOSITION OF NET ASSETS | |
Paid-in capital | | $ | 1,014,092,971 | | |
Distributions in excess of net investment income | | | (5,795,490 | ) | |
Accumulated net realized gain on investments and foreign currency transactions | | | 80,139,817 | | |
Net unrealized appreciation in value of investments and foreign currencies (net of deferred Indian capital gain tax) | | | 617,352,937 | | |
| | | $ | 1,705,790,235 | | |
NET ASSET VALUE, PER SHARE | |
| Class 2 ($203,830,413 / 8,931,922 shares outstanding), unlimited authorized, no par value | | $ | 22.82 | | |
| Class 3 ($196,468,249 / 8,541,401 shares outstanding), unlimited authorized, no par value | | $ | 23.00 | | |
| Class 5 ($1,232,136,514 / 52,324,644 shares outstanding), unlimited authorized, no par value | | $ | 23.55 | | |
| Class K ($73,348,678 / 3,218,338 shares outstanding), unlimited authorized, no par value | | $ | 22.79 | | |
| Institutional Class ($6,381 / 280 shares outstanding), unlimited authorized, no par value | | $ | 22.80 | * | |
* Net assets divided by shares does not recalculate using values rounded to the dollar.
The accompanying notes are an integral part of the financial statements.
76
Annual Report December 31, 2017
For the Year Ended December 31, 2017
Baillie Gifford Emerging Markets Fund
INVESTMENT INCOME | |
Dividends (net of foreign withholding taxes of $3,608,806) | | $ | 28,052,375 | | |
Interest | | | 1,810 | | |
Total Investment Income | | | 28,054,185 | | |
EXPENSES | |
Advisory fee (Note B) | | | 9,630,373 | | |
Shareholder Servicing fees — Class 1 Shares (Note B) | | | 5,638 | | |
Shareholder Servicing fees — Class 2 Shares (Note B) | | | 338,977 | | |
Shareholder Servicing fees — Class 3 Shares (Note B) | | | 166,969 | | |
Shareholder Servicing fees — Class 5 Shares (Note B) | | | 269,181 | | |
Administration & Supervisory Fee — Class K Shares (Note B) | | | 62,469 | | |
Administration & Supervisory Fee — Institutional Class Shares (Note B) | | | 7 | | |
Fund accounting | | | 830,519 | | |
Custody | | | 810,337 | | |
Legal | | | 286,003 | | |
Transfer agency | | | 75,230 | | |
Professional fees | | | 82,949 | | |
Trustees' fees | | | 79,837 | | |
Insurance | | | 12,100 | | |
Miscellaneous | | | 55,413 | | |
Total Expenses | | | 12,706,002 | | |
Net Investment Income | | | 15,348,183 | | |
REALIZED AND UNREALIZED GAIN (LOSS) ON INVESTMENTS
AND FOREIGN CURRENCY TRANSACTIONS | |
Net realized gain from: | |
Investments (net of Indian capital gains refund $24,542) | | | 156,016,079 | | |
Foreign currency transactions | | | 376,810 | | |
| | | | 156,392,889 | | |
Net change in unrealized appreciation on: | |
Investments (net of deferred Indian capital gains tax $8,631,321) | | | 537,907,737 | | |
Translation of assets and liabilities denominated in foreign currencies | | | 33,353 | | |
| | | | 537,941,090 | | |
Net realized and unrealized gain on investments and foreign currency transactions | | | 694,333,979 | | |
NET INCREASE IN NET ASSETS FROM OPERATIONS | | $ | 709,682,162 | | |
The accompanying notes are an integral part of the financial statements.
77
Statements of Changes in Net Assets
Annual Report December 31, 2017
Baillie Gifford Emerging Markets Fund
| | | For the
Year Ended
December 31,
2017 | | For the
Year Ended
December 31,
2016 | |
INCREASE (DECREASE) IN NET ASSETS FROM OPERATIONS | |
Net investment income | | $ | 15,348,183 | | | $ | 10,187,956 | | |
Net realized gain (loss) from investments and foreign currency transactions | | | 156,392,889 | | | | (36,740,744 | ) | |
Net change in unrealized appreciation on investments and translation
of assets and liabilities in foreign currencies | | | 537,941,090 | | | | 62,816,124 | | |
Net increase in net assets from operations | | | 709,682,162 | | | | 36,263,336 | | |
DIVIDENDS AND DISTRIBUTIONS TO SHAREHOLDERS FROM: | |
Net investment income: | |
Class 1 | | | — | | | | (63,550 | ) | |
Class 2 | | | (2,175,573 | ) | | | (1,102,014 | ) | |
Class 3 | | | (2,236,030 | ) | | | (1,191,919 | ) | |
Class 5 | | | (14,640,063 | ) | | | (10,344,713 | ) | |
Class K | | | (811,639 | ) | | | — | | |
Institutional Class | | | (72 | ) | | | — | | |
Capital gains: | |
Class 2 | | | (1,598,271 | ) | | | — | | |
Class 3 | | | (1,527,382 | ) | | | — | | |
Class 5 | | | (9,476,620 | ) | | | — | | |
Class K | | | (555,567 | ) | | | — | | |
Institutional Class | | | (50 | ) | | | — | | |
Total Dividends and Distributions | | | (33,021,267 | ) | | | (12,702,196 | ) | |
TRANSACTIONS IN SHARES OF BENEFICIAL INTEREST | |
Net proceeds from shares subscribed: | |
Class 1 | | | 5,696 | | | | 7,035,259 | | |
Class 2* | | | 49,650,731 | | | | 69,655,261 | | |
Class 3 | | | — | | | | 122,132,513 | | |
Class 5 | | | — | | | | 119,060,276 | | |
Class K | | | 98,891,235 | | | | — | | |
Institutional Class | | | 5,000 | | | | — | | |
Purchase fees: | |
Class 1 | | | 281 | | | | 809 | | |
Class 2 | | | 4,567 | | | | 35,040 | | |
Class 3 | | | 4,814 | | | | 13,857 | | |
Class 4 | | | — | | | | 46,053 | | |
Class 5 | | | 40,345 | | | | 439,341 | | |
Redemption fees: | |
Class 1 | | | — | | | | 14 | | |
Class 2 | | | 4,199 | | | | 1,637 | | |
Class 3 | | | 3,560 | | | | 241 | | |
Class 4 | | | — | | | | 2,003 | | |
Class 5 | | | 29,835 | | | | 21,089 | | |
Dividends reinvested: | |
Class 1 | | | — | | | | 63,550 | | |
Class 2 | | | 3,767,062 | | | | 1,102,014 | | |
Class 3 | | | 3,756,892 | | | | 1,191,919 | | |
Class 5 | | | 24,075,158 | | | | 10,344,713 | | |
Class K | | | 1,339,105 | | | | — | | |
Institutional Class | | | 121 | | | | — | | |
The accompanying notes are an integral part of the financial statements.
78
Statements of Changes in Net Assets
Annual Report December 31, 2017
| | | For the
Year Ended
December 31,
2017 | | For the
Year Ended
December 31,
2016 | |
Cost of shares redeemed: | |
Class 1* | | $ | (8,699,086 | ) | | $ | — | | |
Class 2 | | | (45,405,788 | ) | | | (13,454,743 | ) | |
Class 4 | | | — | | | | (110,086,301 | ) | |
Class 5 | | | (396,049,578 | ) | | | (1,002,506 | ) | |
Class K | | | (35,000,000 | ) | | | — | | |
Increase (decrease) in Net Assets from Transactions in Shares of Beneficial Interest | | | (303,575,851 | ) | | | 206,602,039 | | |
Total Increase in Net Assets | | | 373,085,044 | | | | 230,163,179 | | |
NET ASSETS | |
Beginning of year | | | 1,332,705,191 | | | | 1,102,542,012 | | |
End of year (including distributions in excess of net investment income of
$5,795,490 and $3,550,429 respectively) | | $ | 1,705,790,235 | | | $ | 1,332,705,191 | | |
| | | | | | |
* Class 1 shareholders were converted to Class 2 during the period. Please refer to Notes A and D.
The accompanying notes are an integral part of the financial statements.
79
Annual Report December 31, 2017
Baillie Gifford Emerging Markets Fund
Selected data for a Class 2 Share outstanding throughout each period:
| | | For the
Year Ended
December 31,
2017 | | For the
Year Ended
December 31,
2016 | | For the Period
March 3, 2015(a)
through
December 31,
2015 | | For the Period
April 8, 2014(a)
through
June 9,
2014 | | For the Period
January 1, 2014(a)
through
January 12,
2014 | | For the Period
April 9, 2013(b)
through
December 31,
2013 | |
Net asset value, beginning
of period | | $ | 15.20 | | | $ | 14.88 | | | $ | 17.24 | | | $ | 16.64 | | | $ | 16.52 | | | $ | 15.60 | | |
From Investment Operations | |
Net investment income (loss)(c) | | | 0.16 | | | | 0.07 | | | | 0.13 | | | | 0.01 | | | | (0.00 | )(d) | | | 0.10 | | |
Net realized and unrealized
gain (loss) on investments and
foreign currency transactions | | | 7.89 | | | | 0.38 | | | | (2.38 | ) | | | 1.18 | | | | (0.41 | ) | | | 1.10 | | |
Net increase (decrease) in
net asset value from
investment operations | | | 8.05 | | | | 0.45 | | | | (2.25 | ) | | | 1.19 | | | | (0.41 | ) | | | 1.20 | | |
Dividends and Distributions
to Shareholders | |
Dividends from net investment
income | | | (0.25 | ) | | | (0.14 | ) | | | (0.17 | ) | | | — | | | | — | | | | (0.29 | ) | |
Distributions from net realized
gain on investments | | | (0.18 | ) | | | — | | | | (0.00 | )(d) | | | — | | | | — | | | | — | | |
Total Dividends and Distributions | | | (0.43 | ) | | | (0.14 | ) | | | (0.17 | ) | | | — | | | | — | | | | (0.29 | ) | |
Proceeds from Purchase
Fees and Redemption Fees(c) | | | (0.00 | )(d) | | | 0.01 | | | | 0.06 | | | | 0.02 | | | | — | | | | 0.01 | | |
Net asset value, end of period | | $ | 22.82 | | | $ | 15.20 | | | $ | 14.88 | | | $ | 17.85 | | | $ | 16.11 | | | $ | 16.52 | | |
Total Return | |
Total return based on net
asset value(e) | | | 53.02 | % | | | 3.10 | % | | | (12.68 | )% | | | 7.27 | % | | | (2.48 | )% | | | 7.90 | % | |
Ratios/Supplemental Data | |
Net assets, end of period
(000's omitted) | | $ | 203,830 | | | $ | 121,739 | | | $ | 69,091 | | | $ | 9,994 | | | $ | 49,767 | | | $ | 51,029 | | |
Ratio of net expenses to
average net assets | | | 0.85 | % | | | 0.87 | % | | | 0.87 | %* | | | 0.90 | %* | | | 0.92 | %* | | | 0.89 | %* | |
Ratio of net investment income
(loss) to average net assets | | | 0.82 | % | | | 0.52 | % | | | 0.95 | %* | | | 0.46 | %* | | | (0.90 | )%* | | | 0.90 | %* | |
Portfolio turnover rate(f) | | | 33 | % | | | 24 | % | | | 46 | % | | | 26 | % | | | 26 | % | | | 33 | % | |
* Annualized.
(a) Recommencement of investment operations. Class had no shareholders from January 13, 2014 to April 7, 2014 and from June 10, 2014 to March 2, 2015. All shares of this class were redeemed at $16.11 on January 12, 2014. New shares were issued at $16.64 on April 8, 2014. All shares of this class were redeemed at $17.85 on June 9, 2014. New shares were issued at $17.24 on March 3, 2015.
(b) Commencement of investment operations.
(c) Calculated based upon average shares outstanding during the period.
(d) Amount is less than 0.005 per share.
(e) Total investment return is calculated assuming an initial investment made at the net asset value at the beginning of the period, reinvestment of all dividends and distributions, if any, at net asset value during the period, and redemption on the last day of the period. Total return is not annualized for periods less than one year.
(f) Portfolio turnover rate calculated at Fund level.
The accompanying notes are an integral part of the financial statements.
80
Annual Report December 31, 2017
Baillie Gifford Emerging Markets Fund
Selected data for a Class 3 Share outstanding throughout each period:
| | | For the
Year Ended
December 31,
2017 | | For the Period
April 01, 2016(b)
through
December 31,
2016 | | For the
Year Ended
December 31,
2014 | | For the
Year Ended
December 31,
2013 | | For the
Year Ended
December 31,
2012 | |
Net asset value, beginning of period | | $ | 15.32 | | | $ | 14.72 | | | $ | 16.74 | | | $ | 16.40 | | | $ | 14.60 | | |
From Investment Operations | |
Net investment income(a) | | | 0.17 | | | | 0.12 | | | | 0.17 | | | | 0.14 | | | | 0.19 | | |
Net realized and unrealized gain (loss) on
investments and foreign currency transactions | | | 7.96 | | | | 0.62 | | | | (0.15 | ) | | | 0.48 | | | | 1.82 | | |
Net increase in net asset value from
investment operations | | | 8.13 | | | | 0.74 | | | | 0.02 | | | | 0.62 | | | | 2.01 | | |
Dividends and Distributions to
Shareholders | |
Dividends from net investment income | | | (0.27 | ) | | | (0.14 | ) | | | (0.02 | ) | | | (0.29 | ) | | | (0.23 | ) | |
Distributions from net realized gain on
investments | | | (0.18 | ) | | | — | | | | — | | | | — | | | | — | | |
Total Dividends and Distributions | | | (0.45 | ) | | | (0.14 | ) | | | (0.02 | ) | | | (0.29 | ) | | | (0.23 | ) | |
Proceeds from Purchase Fees and
Redemption Fees(a) | | | 0.00 | (c) | | | 0.00 | (c) | | | 0.02 | | | | 0.01 | | | | 0.02 | | |
Net asset value, end of period | | $ | 23.00 | | | $ | 15.32 | | | $ | 16.76 | | | $ | 16.74 | | | $ | 16.40 | | |
Total Return | |
Total return based on net asset value(d) | | | 53.13 | % | | | 5.05 | % | | | 0.26 | % | | | 3.98 | % | | | 13.94 | % | |
Ratios/Supplemental Data | |
Net assets, end of period (000's omitted) | | $ | 196,468 | | | $ | 128,303 | | | $ | 485,066 | | | $ | 317,406 | | | $ | 490,246 | | |
Ratio of net expenses to average net assets | | | 0.78 | % | | | 0.80 | %* | | | 0.75 | % | | | 0.74 | % | | | 0.75 | % | |
Ratio of net investment income to
average net assets | | | 0.84 | % | | | 1.09 | %* | | | 1.00 | % | | | 0.88 | % | | | 1.18 | % | |
Portfolio turnover rate(e) | | | 33 | % | | | 24 | % | | | 26 | % | | | 33 | % | | | 51 | % | |
* Annualized.
(a) Calculated based upon average shares outstanding during the period.
(b) Recommencement of investment operations. Class had no shareholders from December 31, 2014 to March 31, 2016. All shares of this class were redeemed on December 31, 2014 at $16.76. New shares were issued at $14.72 on April 01, 2016.
(c) Amount is less than $0.005 per share.
(d) Total investment return is calculated assuming an initial investment made at the net asset value at the beginning of the period, reinvestment of all dividends and distributions, if any, at net asset value during the period, and redemption on the last day of the period. Total return is not annualized for periods less than one year.
(e) Portfolio turnover rate calculated at Fund level.
The accompanying notes are an integral part of the financial statements.
81
Annual Report December 31, 2017
Baillie Gifford Emerging Markets Fund
Selected data for a Class 5 Share outstanding throughout each period:
| | | For the
Year Ended
December 31,
2017 | | For the
Year Ended
December 31,
2016 | | For the
Year Ended
December 31,
2015 | |
Net asset value, beginning of year | | $ | 15.67 | | | $ | 15.33 | | | $ | 16.93 | | |
From Investment Operations | |
Net investment income(a) | | | 0.19 | | | | 0.13 | | | | 0.14 | | |
Net realized and unrealized gain (loss) on investments and foreign currency
transactions | | | 8.15 | | | | 0.35 | | | | (1.60 | ) | |
Net increase (decrease) in net asset value from investment operations | | | 8.34 | | | | 0.48 | | | | (1.46 | ) | |
Dividends and Distributions to Shareholders | |
Dividends from net investment income | | | (0.28 | ) | | | (0.15 | ) | | | (0.19 | ) | |
Distributions from net realized gain on investments | | | (0.18 | ) | | | — | | | | (0.00 | )(b) | |
Total Dividends and Distributions | | | (0.46 | ) | | | (0.15 | ) | | | (0.19 | ) | |
Proceeds from Purchase Fees and Redemption Fees(a) | | | 0.00 | (b) | | | 0.01 | | | | 0.05 | | |
Net asset value, end of year | | $ | 23.55 | | | $ | 15.67 | | | $ | 15.33 | | |
Total Return | |
Total return based on net asset value(c) | | | 53.25 | % | | | 3.24 | % | | | (8.24 | )% | |
Ratios/Supplemental Data | |
Net assets, end of year (000's omitted) | | $ | 1,232,137 | | | $ | 1,075,176 | | | $ | 935,177 | | |
Ratio of net expenses to average net assets | | | 0.70 | % | | | 0.71 | % | | | 0.71 | % | |
Ratio of net investment income to average net assets | | | 0.91 | % | | | 0.83 | % | | | 0.89 | % | |
Portfolio turnover rate(d) | | | 33 | % | | | 24 | % | | | 46 | % | |
(a) Calculated based upon average shares outstanding during the period.
(b) Amount is less than $0.005 per share.
(c) Total investment return is calculated assuming an initial investment made at the net asset value at the beginning of the period, reinvestment of all dividends and distributions, if any, at net asset value during the period, and redemption on the last day of the period. Total return is not annualized for periods less than one year.
(d) Portfolio turnover rate calculated at Fund level.
The accompanying notes are an integral part of the financial statements.
82
Annual Report December 31, 2017
Baillie Gifford Emerging Markets Fund
Selected data for a Class K Share outstanding throughout the period:
| | | For the Period
April 28, 2017(a)
through
December 31,
2017 | |
Net asset value, beginning of period | | $ | 18.22 | | |
From Investment Operations | |
Net investment income(b) | | | 0.02 | | |
Net realized and unrealized gain on investments and foreign currency transactions | | | 5.00 | | |
Net increase in net asset value from investment operations | | | 5.02 | | |
Dividends and Distributions to Shareholders | |
Dividends from net investment income | | | (0.27 | ) | |
Distributions from net realized gain on investments | | | (0.18 | ) | |
Total Dividends and Distributions | | | (0.45 | ) | |
Net asset value, end of period | | $ | 22.79 | | |
Total Return | |
Total return based on net asset value(c) | | | 27.57 | % | |
Ratios/Supplemental Data | |
Net assets, end of period (000's omitted) | | $ | 73,349 | | |
Ratio of net expenses to average net assets | | | 0.85 | %* | |
Ratio of net investment income to average net assets | | | 0.18 | %* | |
Portfolio turnover rate(d) | | | 33 | % | |
* Annualized.
(a) Commencement of investment operations.
(b) Calculated based upon average shares outstanding during the period.
(c) Total investment return is calculated assuming an initial investment made at the net asset value at the beginning of the period, reinvestment of all dividends and distributions, if any, at net asset value during the period, and redemption on the last day of the period. Total return is not annualized for periods less than one year.
(d) Portfolio turnover rate calculated at Fund level.
The accompanying notes are an integral part of the financial statements.
83
Annual Report December 31, 2017
Baillie Gifford Emerging Markets Fund
Selected data for an Institutional Class Share outstanding throughout the period:
| | | For the Period
April 28, 2017(a)
through
December 31,
2017 | |
Net asset value, beginning of period | | $ | 18.22 | | |
From Investment Operations | |
Net investment income(b) | | | 0.16 | | |
Net realized and unrealized gain on investments and foreign currency transactions | | | 4.86 | | |
Net increase in net asset value from investment operations | | | 5.02 | | |
Dividends and Distributions to Shareholders | |
Dividends from net investment income | | | (0.26 | ) | |
Distributions from net realized gain on investments | | | (0.18 | ) | |
Total Dividends and Distributions | | | (0.44 | ) | |
Net asset value, end of period | | $ | 22.80 | | |
Total Return | |
Total return based on net asset value(c) | | | 27.61 | % | |
Ratios/Supplemental Data | |
Net assets, end of period (000's omitted) | | $ | 6 | | |
Ratio of net expenses to average net assets | | | 0.85 | %* | |
Ratio of net investment income to average net assets | | | 1.13 | %* | |
Portfolio turnover rate(d) | | | 33 | % | |
* Annualized.
(a) Commencement of investment operations.
(b) Calculated based upon average shares outstanding during the period.
(c) Total investment return is calculated assuming an initial investment made at the net asset value at the beginning of the period, reinvestment of all dividends and distributions, if any, at net asset value during the period, and redemption on the last day of the period. Total return is not annualized for periods less than one year.
(d) Portfolio turnover rate calculated at Fund level.
The accompanying notes are an integral part of the financial statements.
84
Industry Diversification Table
Annual Report December 31, 2017
December 31, 2017
Baillie Gifford Global Alpha Equity Fund
| | | Value | | % of Total
Net Assets | |
Aerospace & Defense | | $ | 38,281 | | | | 0.0 | % | |
Airlines | | | 14,426,772 | | | | 1.2 | | |
Asset Managers | | | 3,844,131 | | | | 0.3 | | |
Automobiles & Parts | | | 23,843,773 | | | | 2.1 | | |
Banks | | | 68,848,299 | | | | 6.1 | | |
Beverages, Food & Tobacco | | | 15,205,853 | | | | 1.3 | | |
Business Support Services | | | 11,092,539 | | | | 1.0 | | |
Clothing & Accessories | | | 11,133,146 | | | | 1.0 | | |
Commercial Services | | | 35,127,040 | | | | 3.1 | | |
Construction & Building Materials | | | 29,456,492 | | | | 2.6 | | |
Diversified Financial Services | | | 17,241,534 | | | | 1.5 | | |
Electronic & Electrical Equipment | | | 12,681,107 | | | | 1.1 | | |
Engineering & Machinery | | | 4,808,133 | | | | 0.4 | | |
Equipment & Supplies | | | 11,668,126 | | | | 1.0 | | |
Financial Services | | | 2,893,485 | | | | 0.3 | | |
Fixed Line Telecommunications | | | 9,067,342 | | | | 0.8 | | |
Food Retailers & Wholesalers | | | 4,286,514 | | | | 0.4 | | |
Gambling | | | 5,283,130 | | | | 0.5 | | |
General Financial | | | 55,605,905 | | | | 4.9 | | |
General Industries | | | 6,146,125 | | | | 0.5 | | |
General Retailers | | | 71,531,303 | | | | 6.2 | | |
Health Care Equipment, Supplies & Services | | | 28,405,584 | | | | 2.5 | | |
Healthcare Providers | | | 27,517,148 | | | | 2.4 | | |
Hotels Restaurants and Leisure | | | 8,970,822 | | | | 0.8 | | |
Industrial Engineering | | | 8,164,986 | | | | 0.7 | | |
Industrial Machinery | | | 45,813,412 | | | | 4.0 | | |
Industrial Transportation | | | 8,822,999 | | | | 0.8 | | |
Information and Communications | | | 4,279,843 | | | | 0.4 | | |
Insurance | | | 49,213,535 | | | | 4.3 | | |
Internet Software & Services | | | 108,472,756 | | | | 9.5 | | |
Investment Services | | | 3,931,549 | | | | 0.3 | | |
Leisure Goods | | | 22,296,201 | | | | 2.0 | | |
Life Insurance | | | 24,651,068 | | | | 2.1 | | |
Marine Expoloration | | | 5,383,813 | | | | 0.5 | | |
Media & Photography | | | 57,373,115 | | | | 5.1 | | |
Medical Equipment | | | 10,688,449 | | | | 0.9 | | |
Mobile Telecommunications | | | 2,717,819 | | | | 0.2 | | |
Mortgage Finance | | | 15,163,115 | | | | 1.3 | | |
Nonlife Insurance | | | 25,798,102 | | | | 2.2 | | |
Oil & Gas | | | 25,791,661 | | | | 2.2 | | |
85
Industry Diversification Table
Annual Report December 31, 2017
| | | Value | | % of Total
Net Assets | |
Oil Equipment & Services | | $ | 2,833,243 | | | | 0.2 | % | |
Pharmaceuticals, Biotechnology & Life Sciences | | | 37,518,047 | | | | 3.3 | | |
Property & Casualty Insurance | | | 17,087,848 | | | | 1.5 | | |
Publishing | | | 3,698,629 | | | | 0.3 | | |
Real Estate | | | 5,396,904 | | | | 0.5 | | |
Real Estate Holding & Development | | | 4,522,937 | | | | 0.4 | | |
Semiconductors | | | 48,402,443 | | | | 4.2 | | |
Speciality Chemicals | | | 5,669,911 | | | | 0.5 | | |
Specialized Consumer Services | | | 26,208,670 | | | | 2.3 | | |
Support Services | | | 16,588,945 | | | | 1.5 | | |
Technology Hardware & Equipment | | | 22,813,157 | | | | 2.0 | | |
Telecommunications Equipment | | | 3,281,805 | | | | 0.3 | | |
Travel & Leisure | | | 28,629,228 | | | | 2.5 | | |
Trucking | | | 10,254,259 | | | | 0.9 | | |
Waste & Disposal | | | 4,562,333 | | | | 0.4 | | |
Total Value of Investments | | | 1,135,153,366 | | | | 99.3 | | |
Other assets less liabilities | | | 8,159,466 | | | | 0.7 | | |
Net Assets | | $ | 1,143,312,832 | | | | 100.0 | % | |
86
Annual Report December 31, 2017
December 31, 2017
Baillie Gifford Global Alpha Equity Fund
| | | Shares | | Value | |
COMMON STOCKS — 98.3% | |
BRAZIL — 0.6% | |
B3 SA — Brasil Bolsa Balcao | | | 1,013,000 | | | $ | 6,952,241 | | |
CANADA — 1.6% | |
Fairfax Financial Holdings Ltd. | | | 24,236 | | | | 12,905,429 | | |
Ritchie Bros. Auctioneers, Inc. | | | 177,820 | | | | 5,322,153 | | |
| | | | | | 18,227,582 | | |
CHINA — 5.7% | |
58.com, Inc. ADR (a) | | | 119,434 | | | | 8,547,891 | | |
Alibaba Group Holding Ltd. ADR (a) | | | 151,996 | | | | 26,208,670 | | |
Baidu, Inc. ADR (a) | | | 59,131 | | | | 13,849,072 | | |
China Biologic Products Holdings, Inc. (a) | | | 34,194 | | | | 2,693,461 | | |
Ctrip.com International Ltd. ADR (a) | | | 203,420 | | | | 8,970,822 | | |
NetEase, Inc. | | | 6,739 | | | | 2,325,427 | | |
Tsingtao Brewery Co., Ltd., Class H | | | 580,000 | | | | 2,991,738 | | |
| | | | | | 65,587,081 | | |
DENMARK — 1.8% | |
A P Moller — Maersk A/S, B Shares | | | 5,062 | | | | 8,822,999 | | |
Novo Nordisk A/S, B Shares | | | 218,582 | | | | 11,745,611 | | |
| | | | | | 20,568,610 | | |
FRANCE — 2.0% | |
Bureau Veritas SA | | | 406,132 | | | | 11,092,539 | | |
Pernod Ricard SA | | | 77,229 | | | | 12,214,115 | | |
| | | | | | 23,306,654 | | |
GERMANY — 3.7% | |
Deutsche Boerse AG | | | 65,959 | | | | 7,634,437 | | |
Infineon Technologies AG | | | 246,533 | | | | 6,714,113 | | |
SAP SE | | | 246,807 | | | | 27,611,542 | | |
| | | | | | 41,960,092 | | |
HONG KONG — 2.6% | |
AIA Group Ltd. | | | 2,898,200 | | | | 24,651,068 | | |
Sands China Ltd. | | | 1,026,400 | | | | 5,283,130 | | |
| | | | | | 29,934,198 | | |
The accompanying notes are an integral part of the financial statements.
87
Annual Report December 31, 2017
December 31, 2017
Baillie Gifford Global Alpha Equity Fund
| | | Shares | | Value | |
INDIA — 3.1% | |
Housing Development Finance Corp., Ltd. | | | 566,239 | | | $ | 15,163,115 | | |
ICICI Bank Ltd. | | | 4,032,535 | | | | 19,763,728 | | |
| | | | | | 34,926,843 | | |
IRELAND — 3.9% | |
Bank of Ireland Group PLC (a) | | | 1,324,180 | | | | 11,272,626 | | |
CRH PLC | | | 540,143 | | | | 19,385,689 | | |
Ryanair Holdings PLC ADR (a) | | | 138,466 | | | | 14,426,772 | | |
| | | | | | 45,085,087 | | |
ITALY — 1.3% | |
Fiat Chrysler Automobiles NV (a) | | | 806,326 | | | | 14,395,546 | | |
JAPAN — 7.5% | |
Advantest Corp. | | | 405,700 | | | | 7,484,894 | | |
CyberAgent, Inc. | | | 222,100 | | | | 8,655,832 | | |
Japan Exchange Group, Inc. | | | 226,600 | | | | 3,931,549 | | |
Kansai Paint Co., Ltd. | | | 218,500 | | | | 5,669,911 | | |
LINE Corp. (a) | | | 104,800 | | | | 4,279,843 | | |
MS&AD Insurance Group Holdings, Inc. | | | 506,600 | | | | 17,087,848 | | |
Olympus Corp. | | | 279,400 | | | | 10,688,449 | | |
Persol Holdings Co., Ltd. | | | 255,800 | | | | 6,404,305 | | |
Rohm Co., Ltd. | | | 86,800 | | | | 9,562,041 | | |
SMC Corp. | | | 28,700 | | | | 11,778,032 | | |
| | | | | | 85,542,704 | | |
NETHERLANDS — 1.0% | |
Philips Lighting NV 144A (b) | | | 141,676 | | | | 5,196,213 | | |
Yandex NV, Class A (a) | | | 206,839 | | | | 6,773,977 | | |
| | | | | | 11,970,190 | | |
NORWAY — 0.9% | |
Schibsted ASA, Class A | | | 224,374 | | | | 6,421,621 | | |
Schibsted ASA, Class B | | | 139,143 | | | | 3,698,629 | | |
| | | | | | 10,120,250 | | |
RUSSIA — 0.7% | |
Sberbank of Russia PJSC ADR | | | 490,822 | | | | 8,273,070 | | |
The accompanying notes are an integral part of the financial statements.
88
Annual Report December 31, 2017
December 31, 2017
Baillie Gifford Global Alpha Equity Fund
| | | Shares | | Value | |
SINGAPORE — 0.5% | |
Jardine Matheson Holdings Ltd. | | | 101,300 | | | $ | 6,146,125 | | |
SOUTH AFRICA — 4.7% | |
MTN Group Ltd. | | | 246,171 | | | | 2,717,819 | | |
Naspers Ltd., N Shares | | | 183,905 | | | | 50,951,494 | | |
| | | | | | 53,669,313 | | |
SOUTH KOREA — 2.0% | |
Samsung Electronics Co., Ltd. GDR 144A (b) | | | 18,828 | | | | 22,296,201 | | |
SPAIN — 0.4% | |
Distribuidora Internacional de Alimentacion SA | | | 831,101 | | | | 4,286,514 | | |
SWEDEN — 2.0% | |
Atlas Copco AB, B Shares | | | 353,827 | | | | 13,561,156 | | |
Svenska Handelsbanken AB, A Shares | | | 674,128 | | | | 9,212,663 | | |
| | | | | | 22,773,819 | | |
SWITZERLAND — 2.8% | |
Compagnie Financiere Richemont SA | | | 122,926 | | | | 11,133,146 | | |
OC Oerlikon Corp. AG (a) | | | 365,214 | | | | 6,164,671 | | |
Schindler Holding AG, Participating Certificates | | | 62,218 | | | | 14,309,553 | | |
| | | | | | 31,607,370 | | |
TAIWAN — 3.0% | |
HTC Corp. (a) | | | 1,336,000 | | | | 3,281,805 | | |
Taiwan Semiconductor Manufacturing Co., Ltd. ADR | | | 787,576 | | | | 31,227,389 | | |
| | | | | | 34,509,194 | | |
UNITED KINGDOM — 3.8% | |
Hays PLC. | | | 2,199,628 | | | | 5,417,501 | | |
Prudential PLC | | | 1,479,130 | | | | 37,880,910 | | |
Rolls-Royce Holdings PLC Entitlement (a)(c) | | | 28,353,480 | | | | 38,281 | | |
| | | | | | 43,336,692 | | |
UNITED STATES — 42.7% | |
ABIOMED, Inc. (a) | | | 35,684 | | | | 6,687,538 | | |
Advanced Micro Devices, Inc. (a) | | | 364,962 | | | | 3,751,809 | | |
Alnylam Pharmaceuticals, Inc. (a) | | | 49,467 | | | | 6,284,782 | | |
The accompanying notes are an integral part of the financial statements.
89
Annual Report December 31, 2017
December 31, 2017
Baillie Gifford Global Alpha Equity Fund
| | | Shares | | Value | |
Alphabet, Inc., Class C (a) | | | 26,401 | | | $ | 27,626,006 | | |
Amazon.com, Inc. (a) | | | 37,003 | | | | 43,273,898 | | |
Anthem, Inc. | | | 122,293 | | | | 27,517,148 | | |
Apache Corp. | | | 300,839 | | | | 12,701,423 | | |
Arthur J Gallagher & Co. | | | 179,087 | | | | 11,332,625 | | |
Autohome, Inc. ADR (a) | | | 86,474 | | | | 5,592,274 | | |
C.H. Robinson Worldwide, Inc. | | | 115,100 | | | | 10,254,259 | | |
CarMax, Inc. (a) | | | 41,835 | | | | 2,682,879 | | |
EOG Resources, Inc. | | | 121,307 | | | | 13,090,238 | | |
Facebook, Inc., Class A (a) | | | 90,891 | | | | 16,038,626 | | |
Financial Engines, Inc. | | | 126,869 | | | | 3,844,131 | | |
First Republic Bank | | | 99,437 | | | | 8,615,222 | | |
GrubHub, Inc. (a) | | | 129,779 | | | | 9,318,132 | | |
Howard Hughes Corp. (The) (a) | | | 41,113 | | | | 5,396,904 | | |
Interactive Brokers Group, Inc., Class A | | | 106,070 | | | | 6,280,405 | | |
Kirby Corp. (a) | | | 80,596 | | | | 5,383,813 | | |
LendingTree, Inc. (a) | | | 8,499 | | | | 2,893,485 | | |
Leucadia National Corp. | | | 342,293 | | | | 9,067,342 | | |
Lincoln Electric Holdings, Inc. | | | 52,502 | | | | 4,808,133 | | |
Markel Corp. (a) | | | 11,318 | | | | 12,892,673 | | |
MarketAxess Holdings, Inc. | | | 41,053 | | | | 8,282,443 | | |
Martin Marietta Materials, Inc. | | | 45,561 | | | | 10,070,803 | | |
Mastercard, Inc., Class A | | | 115,494 | | | | 17,481,172 | | |
Moody's Corp. | | | 165,215 | | | | 24,387,386 | | |
Myriad Genetics, Inc. (a) | | | 237,148 | | | | 8,144,848 | | |
NOW, Inc. (a) | | | 256,867 | | | | 2,833,243 | | |
NVIDIA Corp. | | | 63,810 | | | | 12,347,235 | | |
ResMed, Inc. | | | 123,118 | | | | 10,426,863 | | |
Royal Caribbean Cruises Ltd. | | | 240,017 | | | | 28,629,228 | | |
Seattle Genetics, Inc. (a) | | | 161,670 | | | | 8,649,345 | | |
SiteOne Landscape Supply, Inc. (a) | | | 100,502 | | | | 7,708,503 | | |
Stericycle, Inc. (a) | | | 67,103 | | | | 4,562,333 | | |
TD Ameritrade Holding Corp. | | | 175,537 | | | | 8,975,207 | | |
Teradyne, Inc. | | | 181,825 | | | | 7,613,013 | | |
Tesla, Inc. (a) | | | 30,346 | | | | 9,448,227 | | |
Thermo Fisher Scientific, Inc. | | | 61,450 | | | | 11,668,126 | | |
Verisk Analytics, Inc. (a) | | | 106,090 | | | | 10,184,640 | | |
Visa, Inc., Class A | | | 151,215 | | | | 17,241,534 | | |
Wabtec Corp. | | | 100,270 | | | | 8,164,986 | | |
Waters Corp. (a) | | | 58,446 | | | | 11,291,183 | | |
The accompanying notes are an integral part of the financial statements.
90
Annual Report December 31, 2017
December 31, 2017
Baillie Gifford Global Alpha Equity Fund
| | | Shares | | Value | |
Zillow Group, Inc., Class A (a) | | | 7,909 | | | $ | 322,213 | | |
Zillow Group, Inc., Class C (a) | | | 102,657 | | | | 4,200,724 | | |
| | | | | | 487,967,000 | | |
Total Common Stocks | |
(cost $767,062,191) | | | | | 1,123,442,376 | | |
PREFERRED STOCKS — 1.0% | |
BRAZIL — 1.0% | |
Banco Bradesco SA (cost $11,002,186) | | | 1,148,500 | | | | 11,710,990 | | |
TOTAL INVESTMENTS — 99.3% | |
(cost $778,064,377) | | | | $ | 1,135,153,366 | | |
Other assets less liabilities — 0.7% | | | | | 8,159,466 | | |
NET ASSETS — 100.0% | | | | $ | 1,143,312,832 | | |
(a) Non-income producing security.
(b) 144A — Securities are exempt from registration under Rule 144A of the Securities Act of 1933, as amended. These securities may be resold in transactions exempt from registration, normally to qualified institutional buyers. Prices are obtained daily from the London International Stock Exchange; therefore, fair valuation is typically not required. At December 31, 2017, the net value of these securities was $27,492,414 representing 2.4% of net assets.
(c) Investment was valued using significant unobservable inputs.
ADR — American Depositary Receipt.
GDR — Global Depositary Receipt.
Fair Value Measurement
The following is a summary of the inputs used as of December 31, 2017 in valuing the Fund's investments carried at fair value:
Investments in Securities | | Level 1 | | Level 2 | | Level 3 | | Total | |
Common Stocks | |
Brazil | | $ | — | | | $ | 6,952,241 | | | $ | — | | | $ | 6,952,241 | | |
Canada | | | 18,227,582 | | | | — | | | | — | | | | 18,227,582 | | |
China | | | 65,587,081 | | | | — | | | | — | | | | 65,587,081 | | |
Denmark | | | — | | | | 20,568,610 | | | | — | | | | 20,568,610 | | |
France | | | — | | | | 23,306,654 | | | | — | | | | 23,306,654 | | |
Germany | | | — | | | | 41,960,092 | | | | — | | | | 41,960,092 | | |
Hong Kong | | | — | | | | 29,934,198 | | | | — | | | | 29,934,198 | | |
India | | | — | | | | 34,926,843 | | | | — | | | | 34,926,843 | | |
Ireland | | | 25,699,398 | | | | 19,385,689 | | | | — | | | | 45,085,087 | | |
Italy | | | — | | | | 14,395,546 | | | | — | | | | 14,395,546 | | |
Japan | | | — | | | | 85,542,704 | | | | — | | | | 85,542,704 | | |
The accompanying notes are an integral part of the financial statements.
91
Annual Report December 31, 2017
Investments in Securities | | Level 1 | | Level 2 | | Level 3 | | Total | |
Common Stocks | |
Netherlands | | $ | 6,773,977 | | | $ | 5,196,213 | | | $ | — | | | $ | 11,970,190 | | |
Norway | | | — | | | | 10,120,250 | | | | — | | | | 10,120,250 | | |
Russia | | | — | | | | 8,273,070 | | | | — | | | | 8,273,070 | | |
Singapore | | | — | | | | 6,146,125 | | | | — | | | | 6,146,125 | | |
South Africa | | | — | | | | 53,669,313 | | | | — | | | | 53,669,313 | | |
South Korea | | | — | | | | 22,296,201 | | | | — | | | | 22,296,201 | | |
Spain | | | — | | | | 4,286,514 | | | | — | | | | 4,286,514 | | |
Sweden | | | — | | | | 22,773,819 | | | | — | | | | 22,773,819 | | |
Switzerland | | | — | | | | 31,607,370 | | | | — | | | | 31,607,370 | | |
Taiwan | | | 34,509,194 | | | | — | | | | — | | | | 34,509,194 | | |
United Kingdom | | | — | | | | 43,298,411 | | | | 38,281 | | | | 43,336,692 | | |
United States | | | 487,967,000 | | | | — | | | | — | | | | 487,967,000 | | |
Total Common Stocks | | | 638,764,232 | | | | 484,639,863 | | | | 38,281 | | | | 1,123,442,376 | | |
Preferred Stocks | |
Brazil | | | — | | | | 11,710,990 | | | | — | | | | 11,710,990 | | |
Total | | $ | 638,764,232 | | | $ | 496,350,853 | | | $ | 38,281 | | | $ | 1,135,153,366 | | |
For the Global Alpha Equity Fund, fair value of Level 3, Level 2 and Level 1 investments at December 31, 2016 was $28,397, $321,032,702 and $490,031,410, respectively. $5,064,049 was transferred out of Level 2 into Level 1 during the year ended December 31, 2017. Transfers into Level 1 and out of Level 2 resulted when pricing was based on quoted market prices.
It is the Fund's policy to recognize transfers in and transfers out at the fair value as of the beginning of the period.
The following is a reconciliation of the Fund's Level 3 investments for which significant unobservable inputs were used in determining value:
Balance at December 31, 2016 | | $ | 28,397 | | |
Purchases | | | 92,243 | | |
Sales | | | (82,940 | ) | |
Realized gain (loss) | | | 41 | | |
Change in unrealized gain | | | 540 | | |
Transfers into Level 3 | | | — | | |
Transfers out of Level 3 | | | — | | |
Balance at December 31, 2017 | | $ | 38,281 | * | |
Change in unrealized gain related to Investments still held at December 31, 2017 | | $ | 711 | | |
* Value of the security is based on the amount it was known that it would be redeemed at, due to halt in market.
The Trust has made the determination to price these shares at their redemption value. As the fair value is based on management's own assumption, the Trust has determined this to be a level 3 security.
The accompanying notes are an integral part of the financial statements.
92
Statement of Assets and Liabilities
Annual Report December 31, 2017
December 31, 2017
Baillie Gifford Global Alpha Equity Fund
ASSETS | |
Investments, at value (cost $778,064,377) | | $ | 1,135,153,366 | | |
Cash | | | 9,393,500 | | |
Dividends receivable | | | 513,463 | | |
Tax reclaims receivable | | | 496,771 | | |
Prepaid assets | | | 31,646 | | |
Total Assets | | | 1,145,588,746 | | |
LIABILITIES | |
Advisory fee payable | | | 1,161,906 | | |
Capital shares purchased payable | | | 66,672 | | |
Servicing fee payable | | | 303,553 | | |
Payable for deferred Indian capital gains tax | | | 247,657 | | |
Trustee fee payable | | | 13,192 | | |
Accrued expenses | | | 482,934 | | |
Total Liabilities | | | 2,275,914 | | |
NET ASSETS | | $ | 1,143,312,832 | | |
COMPOSITION OF NET ASSETS | |
Paid-in capital | | $ | 777,286,526 | | |
Distributions in excess of net investment income | | | (3,511,772 | ) | |
Accumulated net realized gain on investments and foreign currency transactions | | | 12,682,335 | | |
Net unrealized appreciation in value of investments and foreign currencies (net of deferred Indian capital gains tax) | | | 356,855,743 | | |
| | | $ | 1,143,312,832 | | |
NET ASSET VALUE, PER SHARE | |
| Class 2 ($154,522,644 / 8,195,849 shares outstanding), unlimited authorized, no par value | | $ | 18.85 | | |
| Class 3 ($564,713,603 / 29,388,019 shares outstanding), unlimited authorized, no par value | | $ | 19.22 | | |
| Class 4 ($367,908,176 / 18,791,721 shares outstanding), unlimited authorized, no par value | | $ | 19.58 | | |
| Class K ($56,162,509 / 2,983,440 shares outstanding), unlimited authorized, no par value | | $ | 18.82 | | |
| Institutional Class ($5,900 / 313 shares outstanding), unlimited authorized, no par value | | $ | 18.84 | * | |
* Net assets divided by shares does not recalculate using values rounded to the dollar.
The accompanying notes are an integral part of the financial statements.
93
Annual Report December 31, 2017
For the Year Ended December 31, 2017
Baillie Gifford Global Alpha Equity Fund
INVESTMENT INCOME | |
Dividends (net of foreign withholding taxes of $904,200) | | $ | 11,432,949 | | |
Interest | | | 2,106 | | |
Total Investment Income | | | 11,435,055 | | |
EXPENSES | |
Advisory fee (Note B) | | | 3,986,135 | | |
Shareholder Servicing fees — Class 1 Shares (Note B) | | | 3 | | |
Shareholder Servicing fees — Class 2 Shares (Note B) | | | 359,494 | | |
Shareholder Servicing fees — Class 3 Shares (Note B) | | | 650,783 | | |
Shareholder Servicing fees — Class 4 Shares (Note B) | | | 79,958 | | |
Administration & Supervisory Fee — Class K Shares (Note B) | | | 34,091 | | |
Administration & Supervisory Fee — Institutional Class Shares (Note B) | | | 6 | | |
Fund accounting | | | 494,862 | | |
Legal | | | 153,990 | | |
Custody | | | 162,755 | | |
Trustees' fees | | | 45,867 | | |
Transfer agency | | | 68,380 | | |
Professional fees | | | 37,192 | | |
Insurance | | | 6,720 | | |
Miscellaneous | | | 34,846 | | |
Total Expenses | | | 6,115,082 | | |
Net Investment Income | | | 5,319,973 | | |
REALIZED AND UNREALIZED GAIN (LOSS) ON INVESTMENTS
AND FOREIGN CURRENCY TRANSACTIONS | |
Net realized gain (loss) from: | |
Investments (net of Indian capital gains tax $19,529) | | | 65,020,158 | | |
Foreign currency transactions | | | (15,066 | ) | |
| | | | 65,005,092 | | |
Net change in unrealized appreciation on: | |
Investments (net of deferred Indian capital gains tax $57,975) | | | 216,624,056 | | |
Translation of assets and liabilities denominated in foreign currencies | | | 38,117 | | |
| | | | 216,662,173 | | |
Net realized and unrealized gain on investments and foreign currency transactions | | | 281,667,265 | | |
NET INCREASE IN NET ASSETS FROM OPERATIONS | | $ | 286,987,238 | | |
The accompanying notes are an integral part of the financial statements.
94
Statements of Changes in Net Assets
Annual Report December 31, 2017
Baillie Gifford Global Alpha Equity Fund
| | | For the
Year Ended
December 31,
2017 | | For the
Year Ended
December 31,
2016 | |
INCREASE (DECREASE) IN NET ASSETS FROM OPERATIONS | |
Net investment income | | $ | 5,319,973 | | | $ | 5,140,233 | | |
Net realized gain (loss) from investments and foreign currency transactions | | | 65,005,092 | | | | (19,504,514 | ) | |
Net change in unrealized appreciation on investments and translation of assets
and liabilities in foreign currencies | | | 216,662,173 | | | | 49,198,844 | | |
Net increase in net assets from operations | | | 286,987,238 | | | | 34,834,563 | | |
DIVIDENDS AND DISTRIBUTIONS TO SHAREHOLDERS FROM: | |
Net investment income: | |
Class 1 | | | — | | | | (21 | ) | |
Class 2 | | | (901,464 | ) | | | (1,209,257 | ) | |
Class 3 | | | (3,868,548 | ) | | | (3,840,716 | ) | |
Class 4 | | | (2,809,108 | ) | | | — | | |
Class K | | | (424,261 | ) | | | — | | |
Institutional Class | | | (41 | ) | | | — | | |
Capital gains: | |
Class 1 | | | — | | | | (6 | ) | |
Class 2 | | | (4,497,059 | ) | | | (1,167,950 | ) | |
Class 3 | | | (16,117,596 | ) | | | (1,386,910 | ) | |
Class 4 | | | (10,303,488 | ) | | | — | | |
Class K | | | (1,634,655 | ) | | | — | | |
Institutional Class | | | (172 | ) | | | — | | |
Total Dividends and Distributions | | | (40,556,392 | ) | | | (7,604,860 | ) | |
TRANSACTIONS IN SHARES OF BENEFICIAL INTEREST | |
Net proceeds from shares subscribed: | |
Class 1 | | | 1,498 | | | | 2,996 | | |
| Class 2* | | | 20,191,462 | | | | 102,389,191 | | |
Class 3 | | | 167,078,422 | | | | 206,629,056 | | |
Class 4 | | | 352,706,903 | | | | — | | |
Class K | | | 75,400,530 | | | | — | | |
Institutional Class | | | 5,000 | | | | — | | |
Purchase fees: | |
Class 1 | | | — | | | | 1 | | |
Class 2 | | | 5,472 | | | | 50,495 | | |
Class 3 | | | 14,033 | | | | 107,459 | | |
Redemption fees: | |
Class 2 | | | 6,754 | | | | 12,291 | | |
Class 3 | | | 17,770 | | | | 21,142 | | |
Dividends reinvested: | |
Class 1 | | | — | | | | 26 | | |
Class 2 | | | 5,398,523 | | | | 2,377,207 | | |
Class 3 | | | 19,986,144 | | | | 5,227,626 | | |
Class 4 | | | 13,112,596 | | | | — | | |
Class K | | | 2,058,917 | | | | — | | |
Institutional Class | | | 213 | | | | — | | |
The accompanying notes are an integral part of the financial statements.
95
Statements of Changes in Net Assets
Annual Report December 31, 2017
| | | For the
Year Ended
December 31,
2017 | | For the
Year Ended
December 31,
2016 | |
Cost of shares redeemed: | |
| Class 1* | | $ | (4,965 | ) | | $ | — | | |
Class 2 | | | (154,903,521 | ) | | | (108,680,958 | ) | |
Class 3 | | | (388,729,425 | ) | | | (128,628,662 | ) | |
Class 4 | | | (10,500,000 | ) | | | — | | |
Class K | | | (23,575,015 | ) | | | — | | |
Increase in Net Assets from Transactions in Shares of Beneficial Interest | | | 78,271,311 | | | | 79,507,870 | | |
Total Increase in Net Assets | | | 324,702,157 | | | | 106,737,573 | | |
NET ASSETS | |
Beginning of year | | | 818,610,675 | | | | 711,873,102 | | |
End of year (including distributions in excess of net investment income of
$3,511,772 and $967,445 respectively) | | $ | 1,143,312,832 | | | $ | 818,610,675 | | |
| | | | | | |
* Class 1 shareholders were converted to Class 2 during the period. Please refer to Notes A and D.
The accompanying notes are an integral part of the financial statements.
96
Annual Report December 31, 2017
Baillie Gifford Global Alpha Equity Fund
Selected data for a Class 2 Share outstanding throughout each period:
| | | For the
Year Ended
December 31,
2017 | | For the
Year Ended
December 31,
2016 | | For the
Year Ended
December 31,
2015 | | For the
Year Ended
December 31,
2014 | | For the Period
January 6, 2013(a)
through
December 31,
2013 | |
Net asset value, beginning of period | | $ | 14.52 | | | $ | 13.96 | | | $ | 14.00 | | | $ | 14.10 | | | $ | 11.55 | | |
From Investment Operations | |
Net investment income(b) | | | 0.10 | | | | 0.10 | | | | 0.12 | | | | 0.11 | | | | 0.12 | | |
Net realized and unrealized gain on
investments and foreign currency transactions | | | 4.91 | | | | 0.59 | | | | 0.11 | (f) | | | 0.53 | | | | 2.94 | | |
Net increase in net asset value from
investment operations | | | 5.01 | | | | 0.69 | | | | 0.23 | | | | 0.64 | | | | 3.06 | | |
Dividends and Distributions to Shareholders | | | | | | | | | | | |
Dividends from net investment income | | | (0.11 | ) | | | (0.08 | ) | | | (0.11 | ) | | | (0.14 | ) | | | (0.17 | ) | |
Distributions from net realized gain on
investments | | | (0.57 | ) | | | (0.05 | ) | | | (0.17 | ) | | | (0.61 | ) | | | (0.34 | ) | |
Total Dividends and Distributions | | | (0.68 | ) | | | (0.13 | ) | | | (0.28 | ) | | | (0.75 | ) | | | (0.51 | ) | |
Proceeds from Purchase Fees and
Redemption Fees(b) | | | 0.00 | (c) | | | 0.00 | (c) | | | 0.01 | | | | 0.01 | | | | 0.00 | (c) | |
Net asset value, end of period | | $ | 18.85 | | | $ | 14.52 | | | $ | 13.96 | | | $ | 14.00 | | | $ | 14.10 | | |
Total Return | |
Total return based on net asset value(d) | | | 34.56 | % | | | 4.95 | % | | | 1.75 | % | | | 4.49 | % | | | 26.48 | % | |
Ratios/Supplemental Data | |
Net assets, end of period (000's omitted) | | $ | 154,523 | | | $ | 225,095 | | | $ | 210,890 | | | $ | 213,426 | | | $ | 119,535 | | |
Ratio of net expenses to average net assets | | | 0.67 | % | | | 0.67 | % | | | 0.66 | % | | | 0.67 | % | | | 0.68 | %* | |
Ratio of net investment income to average
net assets | | | 0.59 | % | | | 0.69 | % | | | 0.83 | % | | | 0.74 | % | | | 1.00 | %* | |
Portfolio turnover rate(e) | | | 27 | % | | | 20 | % | | | 16 | % | | | 26 | % | | | 20 | % | |
* Annualized.
(a) Commencement of investment operations.
(b) Calculated based upon average shares outstanding during the period.
(c) Amount is less than $0.005 per share.
(d) Total investment return is calculated assuming an initial investment made at the net asset value at the beginning of the period, reinvestment of all dividends and distributions, if any, at net asset value during the period, and redemption on the last day of the period. Total return is not annualized for periods less than one year.
(e) Portfolio turnover rate calculated at Fund level and excludes the value of portfolio securities received in-kind in connection with Fund capital shares sold.
(f) Calculation of the net gain per share (both realized and unrealized) does not correlate to the aggregate realized and unrealized losses presented in the Statement of Operations due to the timing of sales and repurchases of Class shares in relation to fluctuating market values of the investments of the Fund.
The accompanying notes are an integral part of the financial statements.
97
Annual Report December 31, 2017
Baillie Gifford Global Alpha Equity Fund
Selected data for a Class 3 Share outstanding throughout each period:
| | | For the
Year Ended
December 31,
2017 | | For the
Year Ended
December 31,
2016 | | For the
Year Ended
December 31,
2015 | | For the
Year Ended
December 31,
2014 | | For the
Year Ended
December 31,
2013 | |
Net asset value, beginning of year | | $ | 14.79 | | | $ | 14.23 | | | $ | 14.26 | | | $ | 14.36 | | | $ | 11.56 | | |
From Investment Operations | |
Net investment income(a) | | | 0.10 | | | | 0.10 | | | | 0.13 | | | | 0.13 | | | | 0.14 | | |
Net realized and unrealized gain on
investments and foreign currency transactions | | | 5.04 | | | | 0.61 | | | | 0.12 | (b) | | | 0.52 | | | | 3.17 | | |
Net increase in net asset value from
investment operations | | | 5.14 | | | | 0.71 | | | | 0.25 | | | | 0.65 | | | | 3.31 | | |
Dividends and Distributions to Shareholders | | | | | | | | | | | |
Dividends from net investment income | | | (0.14 | ) | | | (0.10 | ) | | | (0.12 | ) | | | (0.15 | ) | | | (0.18 | ) | |
Distributions from net realized gain on
investments | | | (0.57 | ) | | | (0.05 | ) | | | (0.17 | ) | | | (0.61 | ) | | | (0.34 | ) | |
Total Dividends and Distributions | | | (0.71 | ) | | | (0.15 | ) | | | (0.29 | ) | | | (0.76 | ) | | | (0.52 | ) | |
Proceeds from Purchase Fees and
Redemption Fees(a) | | | 0.00 | (c) | | | 0.00 | (c) | | | 0.01 | | | | 0.01 | | | | 0.01 | | |
Net asset value, end of year | | $ | 19.22 | | | $ | 14.79 | | | $ | 14.23 | | | $ | 14.26 | | | $ | 14.36 | | |
Total Return | |
Total return based on net asset value(d) | | | 34.65 | % | | | 5.02 | % | | | 1.84 | % | | | 4.48 | % | | | 28.71 | % | |
Ratios/Supplemental Data | |
Net assets, end of year (000's omitted) | | $ | 564,714 | | | $ | 593,513 | | | $ | 500,983 | | | $ | 410,993 | | | $ | 299,182 | | |
Ratio of net expenses to average net assets | | | 0.60 | % | | | 0.60 | % | | | 0.59 | % | | | 0.59 | % | | | 0.61 | % | |
Ratio of net investment income to average
net assets | | | 0.60 | % | | | 0.75 | % | | | 0.85 | % | | | 0.91 | % | | | 1.05 | % | |
Portfolio turnover rate(e) | | | 27 | % | | | 20 | % | | | 16 | % | | | 26 | % | | | 20 | % | |
(a) Calculated based upon average shares outstanding during the year.
(b) Calculation of the net gain per share (both realized and unrealized) does not correlate to the aggregate realized and unrealized losses presented in the Statement of Operations due to the timing of sales and repurchases of Class shares in relation to fluctuating market values of the investments of the Fund.
(c) Amount is less than $0.005 per share.
(d) Total investment return is calculated assuming an initial investment made at the net asset value at the beginning of the year, reinvestment of all dividends and distributions, if any, at net asset value during the period, and redemption on the last day of the year. Total return is not annualized for periods less than one year.
(e) Portfolio turnover rate calculated at Fund level and excludes the value of portfolio securities received in-kind in connection with Fund capital shares sold.
The accompanying notes are an integral part of the financial statements.
98
Annual Report December 31, 2017
Baillie Gifford Global Alpha Equity Fund
Selected data for a Class 4 Share outstanding throughout the period:
| | | For the Period
July 10, 2017(a)
through
December 31,
2017 | |
Net asset value, beginning of period | | $ | 17.99 | | |
From Investment Operations | |
Net investment income(b) | | | 0.01 | | |
Net realized and unrealized gain on investments and foreign currency transactions | | | 2.31 | | |
Net increase in net asset value from investment operations | | | 2.32 | | |
Dividends and Distributions to Shareholders | | | |
Dividends from net investment income | | | (0.16 | ) | |
Distributions from net realized gain on investments | | | (0.57 | ) | |
Total Dividends and Distributions | | | (0.73 | ) | |
Net asset value, end of period | | $ | 19.58 | | |
Total Return | |
Total return based on net asset value(c) | | | 12.87 | % | |
Ratios/Supplemental Data | |
Net assets, end of period (000's omitted) | | $ | 367,908 | | |
Ratio of net expenses to average net assets | | | 0.58 | %* | |
Ratio of net investment income to average net assets | | | 0.15 | %* | |
Portfolio turnover rate(d) | | | 27 | % | |
* Annualized.
(a) Commencement of operations.
(b) Calculated based upon average shares outstanding during the period.
(c) Total investment return is calculated assuming an initial investment made at the net asset value at the beginning of the period, reinvestment of all dividends and distributions, if any, at net asset value during the period, and redemption on the last day of the period. Total return is not annualized for periods less than one year.
(d) Portfolio turnover rate calculated at Fund level and excludes the value of portfolio securities received in-kind in connection with Fund capital shares sold.
The accompanying notes are an integral part of the financial statements.
99
Annual Report December 31, 2017
Baillie Gifford Global Alpha Equity Fund
Selected data for a Class K Share outstanding throughout the period:
| | | For the Period
April 28, 2017(a)
through
December 31,
2017 | |
Net asset value, beginning of period | | $ | 16.56 | | |
From Investment Operations | |
Net investment income(b) | | | 0.02 | | |
Net realized and unrealized gain on investments and foreign currency transactions | | | 2.96 | | |
Net increase in net asset value from investment operations | | | 2.98 | | |
Dividends and Distributions to Shareholders | | | |
Dividends from net investment income | | | (0.15 | ) | |
Distributions from net realized gain on investments | | | (0.57 | ) | |
Total Dividends and Distributions | | | (0.72 | ) | |
Net asset value, end of period | | $ | 18.82 | | |
Total Return | |
Total return based on net asset value(c) | | | 17.97 | % | |
Ratios/Supplemental Data | |
Net assets, end of period (000's omitted) | | $ | 56,163 | | |
Ratio of net expenses to average net assets | | | 0.68 | %* | |
Ratio of net investment income to average net assets | | | 0.17 | %* | |
Portfolio turnover rate(d) | | | 27 | % | |
* Annualized.
(a) Commencement of operations.
(b) Calculated based upon average shares outstanding during the period.
(c) Total investment return is calculated assuming an initial investment made at the net asset value at the beginning of the period, reinvestment of all dividends and distributions, if any, at net asset value during the period, and redemption on the last day of the period. Total return is not annualized for periods less than one year.
(d) Portfolio turnover rate calculated at Fund level and excludes the value of portfolio securities received in-kind in connection with Fund capital shares sold.
The accompanying notes are an integral part of the financial statements.
100
Annual Report December 31, 2017
Baillie Gifford Global Alpha Equity Fund
Selected data for an Institutional Class Share outstanding throughout the period:
| | | For the Period
April 28, 2017(a)
through
December 31,
2017 | |
Net asset value, beginning of period | | $ | 16.56 | | |
From Investment Operations | |
Net investment income(b) | | | 0.04 | | |
Net realized and unrealized gain on investments and foreign currency transactions | | | 2.95 | | |
Net increase in net asset value from investment operations | | | 2.99 | | |
Dividends and Distributions to Shareholders | | | |
Dividends from net investment income | | | (0.14 | ) | |
Distributions from net realized gain on investments | | | (0.57 | ) | |
Total Dividends and Distributions | | | (0.71 | ) | |
Net asset value, end of period | | $ | 18.84 | | |
Total Return | |
Total return based on net asset value(c) | | | 18.03 | % | |
Ratios/Supplemental Data | |
Net assets, end of period (000's omitted) | | $ | 6 | | |
Ratio of net expenses to average net assets | | | 0.67 | %* | |
Ratio of net investment income to average net assets | | | 0.35 | %* | |
Portfolio turnover rate(d) | | | 27 | % | |
* Annualized.
(a) Commencement of operations.
(b) Calculated based upon average shares outstanding during the period.
(c) Total investment return is calculated assuming an initial investment made at the net asset value at the beginning of the period, reinvestment of all dividends and distributions, if any, at net asset value during the period, and redemption on the last day of the period. Total return is not annualized for periods less than one year.
(d) Portfolio turnover rate calculated at Fund level and excludes the value of portfolio securities received in-kind in connection with Fund capital shares sold.
The accompanying notes are an integral part of the financial statements.
101
Industry Diversification Table
Annual Report December 31, 2017
December 31, 2017
Baillie Gifford Global Select Equity Fund
| | | Value | | % of Total
Net Assets | |
Aerospace & Defense | | $ | 18,524 | | | | 0.6 | % | |
Airlines | | | 50,740 | | | | 1.7 | | |
Apparel Retailers | | | 46,815 | | | | 1.6 | | |
Asset Managers | | | 42,184 | | | | 1.4 | | |
Automobiles & Parts | | | 29,267 | | | | 1.0 | | |
Banks | | | 124,345 | | | | 4.1 | | |
Biotechnology | | | 29,514 | | | | 1.0 | | |
Broadline Retailers | | | 50,367 | | | | 1.7 | | |
Chemicals | | | 41,325 | | | | 1.4 | | |
Clothing & Accessories | | | 31,971 | | | | 1.0 | | |
Construction & Materials | | | 85,545 | | | | 2.8 | | |
Consumer Electronics | | | 36,010 | | | | 1.2 | | |
Diversified Financial Services | | | 27,530 | | | | 0.9 | | |
Electronic & Electrical Equipment | | | 69,878 | | | | 2.2 | | |
Financial Services | | | 70,814 | | | | 2.3 | | |
Food Producers & Processors | | | 25,266 | | | | 0.8 | | |
Footwear | | | 44,597 | | | | 1.5 | | |
General Financial | | | 236,677 | | | | 7.8 | | |
General Industrials | | | 29,953 | | | | 1.0 | | |
General Retailers | | | 240,743 | | | | 7.9 | | |
Health Care Equipment, Supplies & Services | | | 96,507 | | | | 3.2 | | |
Hotels Restaurants and Leisure | | | 22,227 | | | | 0.7 | | |
Household Goods | | | 55,430 | | | | 1.8 | | |
Industrial Machinery | | | 126,923 | | | | 4.2 | | |
Industrial Transportation — Marine Transportation | | | 16,617 | | | | 0.5 | | |
Insurance | | | 84,417 | | | | 2.7 | | |
Internet, Software & Services | | | 349,258 | | | | 11.3 | | |
Life Insurance | | | 69,865 | | | | 2.3 | | |
Machinery | | | 23,471 | | | | 0.8 | | |
Machinery — Diversified | | | 47,979 | | | | 1.6 | | |
Multiline Retail | | | 28,902 | | | | 1.0 | | |
Nonlife Insurance | | | 26,200 | | | | 0.9 | | |
Oil & Gas | | | 86,064 | | | | 2.9 | | |
Personal Goods | | | 9,604 | | | | 0.3 | | |
Pharmaceuticals & Biotechnology | | | 136,517 | | | | 4.5 | | |
Retailer | | | 27,488 | | | | 0.9 | | |
Semiconductors | | | 59,951 | | | | 2.0 | | |
Speciality Retailer | | | 84,112 | | | | 2.7 | | |
Specialized Consumer Services | | | 68,282 | | | | 2.2 | | |
Support Services | | | 18,584 | | | | 0.6 | | |
102
Industry Diversification Table
Annual Report December 31, 2017
| | | Value | | % of Total
Net Assets | |
Technology Hardware & Equipment | | $ | 57,001 | | | | 1.8 | % | |
Telecommunication Services | | | 47,502 | | | | 1.6 | | |
Textiles and apparel | | | 34,952 | | | | 1.2 | | |
Trading Companies & Distributors | | | 30,900 | | | | 1.0 | | |
Trucking | | | 26,816 | | | | 0.9 | | |
Wholesale Trade | | | 37,742 | | | | 1.2 | | |
Total Value of Investments | | | 3,005,376 | | | | 98.7 | | |
Other assets less liabilities | | | 39,827 | | | | 1.3 | | |
Net Assets | | $ | 3,045,203 | | | | 100.0 | % | |
103
Annual Report December 31, 2017
December 31, 2017
Baillie Gifford Global Select Equity Fund
| | | Shares | | Value | |
COMMON STOCKS — 98.7% | |
CANADA — 0.6% | |
Shopify, Inc., Class A (a) | | | 184 | | | $ | 18,584 | | |
CHINA — 7.8% | |
Alibaba Group Holding Ltd. ADR (a) | | | 396 | | | | 68,282 | | |
Baidu, Inc. ADR (a) | | | 129 | | | | 30,213 | | |
Ctrip.com International Ltd. ADR (a) | | | 504 | | | | 22,227 | | |
JD.com, Inc. ADR (a) | | | 1,216 | | | | 50,367 | | |
Tencent Holdings Ltd. | | | 1,300 | | | | 67,285 | | |
| | | | | | 238,374 | | |
DENMARK — 1.0% | |
Novozymes A/S, B Shares | | | 517 | | | | 29,514 | | |
FRANCE — 1.0% | |
Sartorius Stedim Biotech | | | 416 | | | | 30,093 | | |
GERMANY — 2.5% | |
adidas AG | | | 223 | | | | 44,597 | | |
Zalando SE 144A (a)(b) | | | 570 | | | | 30,055 | | |
| | | | | | 74,652 | | |
HONG KONG — 2.2% | |
AIA Group Ltd. | | | 4,800 | | | | 40,827 | | |
Hong Kong Exchanges & Clearing Ltd. | | | 900 | | | | 27,530 | | |
| | | | | | 68,357 | | |
IRELAND — 1.7% | |
Ryanair Holdings PLC ADR (a) | | | 487 | | | | 50,740 | | |
ISRAEL — 1.4% | |
Frutarom Industries Ltd. | | | 441 | | | | 41,325 | | |
ITALY — 2.2% | |
COSMO Pharmaceuticals NV | | | 207 | | | | 31,099 | | |
Yoox Net-A-Porter Group SpA (a) | | | 1,002 | | | | 34,952 | | |
| | | | | | 66,051 | | |
The accompanying notes are an integral part of the financial statements.
104
Annual Report December 31, 2017
December 31, 2017
Baillie Gifford Global Select Equity Fund
| | | Shares | | Value | |
JAPAN — 12.6% | |
CyberAgent, Inc. | | | 800 | | | $ | 31,178 | | |
FANUC Corp. | | | 200 | | | | 47,979 | | |
Gree, Inc. | | | 2,600 | | | | 16,297 | | |
Inpex Corp. | | | 4,600 | | | | 57,252 | | |
Kubota Corp. | | | 1,200 | | | | 23,471 | | |
MISUMI Group, Inc. | | | 1,300 | | | | 37,742 | | |
Mitsui O.S.K. Lines Ltd. | | | 500 | | | | 16,617 | | |
Nintendo Co., Ltd. | | | 100 | | | | 36,010 | | |
SoftBank Group Corp. | | | 600 | | | | 47,502 | | |
Sumitomo Mitsui Trust Holdings, Inc. | | | 900 | | | | 35,610 | | |
Yaskawa Electric Corp. | | | 800 | | | | 35,052 | | |
| | | | | | 384,710 | | |
SOUTH KOREA — 0.5% | |
NAVER Corp. (a) | | | 20 | | | | 16,248 | | |
SPAIN — 0.6% | |
Inditex SA | | | 482 | | | | 16,760 | | |
SWEDEN — 2.1% | |
Atlas Copco AB, B Shares | | | 1,038 | | | | 39,784 | | |
Svenska Handelsbanken AB, A Shares | | | 1,808 | | | | 24,708 | | |
| | | | | | 64,492 | | |
SWITZERLAND — 4.7% | |
Aryzta AG (a) | | | 637 | | | | 25,266 | | |
Compagnie Financiere Richemont SA | | | 353 | | | | 31,971 | | |
OC Oerlikon Corp. AG (a) | | | 2,887 | | | | 48,731 | | |
Schindler Holding AG, Participating Certificates | | | 167 | | | | 38,408 | | |
| | | | | | 144,376 | | |
TAIWAN — 3.1% | |
Hon Hai Precision Industry Co., Ltd. GDR Reg S | | | 5,545 | | | | 34,826 | | |
Taiwan Semiconductor Manufacturing Co., Ltd. ADR | | | 1,512 | | | | 59,951 | | |
| | | | | | 94,777 | | |
The accompanying notes are an integral part of the financial statements.
105
Annual Report December 31, 2017
December 31, 2017
Baillie Gifford Global Select Equity Fund
| | | Shares | | Value | |
UNITED KINGDOM — 6.6% | |
Hargreaves Lansdown PLC | | | 1,737 | | | $ | 42,184 | | |
Just Group PLC | | | 12,710 | | | | 29,038 | | |
Prudential PLC | | | 1,830 | | | | 46,867 | | |
St James's Place PLC | | | 2,273 | | | | 37,550 | | |
Ted Baker PLC | | | 751 | | | | 27,488 | | |
Ultra Electronics Holdings PLC | | | 1,020 | | | | 18,524 | | |
| | | | | | 201,651 | | |
UNITED STATES — 48.1% | |
ABIOMED, Inc. (a) | | | 208 | | | | 38,981 | | |
Alphabet, Inc., Class A (a) | | | 64 | | | | 67,418 | | |
Amazon.com, Inc. (a) | | | 101 | | | | 118,116 | | |
American Express Co. | | | 368 | | | | 36,546 | | |
C.H. Robinson Worldwide, Inc. | | | 301 | | | | 26,816 | | |
CarMax, Inc. (a) | | | 568 | | | | 36,426 | | |
Celgene Corp. (a) | | | 305 | | | | 31,830 | | |
Chegg, Inc. (a) | | | 1,317 | | | | 21,493 | | |
Ellie Mae, Inc. (a) | | | 248 | | | | 22,171 | | |
EOG Resources, Inc. | | | 267 | | | | 28,812 | | |
Facebook, Inc., Class A (a) | | | 491 | | | | 86,642 | | |
Fastenal Co. | | | 565 | | | | 30,900 | | |
First Republic Bank | | | 739 | | | | 64,027 | | |
Fortive Corp. | | | 414 | | | | 29,953 | | |
GrubHub, Inc. (a) | | | 591 | | | | 42,434 | | |
Illumina, Inc. (a) | | | 244 | | | | 53,312 | | |
Interactive Brokers Group, Inc., Class A | | | 829 | | | | 49,085 | | |
iRobot Corp. (a) | | | 325 | | | | 24,927 | | |
LendingTree, Inc. (a) | | | 208 | | | | 70,814 | | |
Markel Corp. (a) | | | 23 | | | | 26,200 | | |
MarketAxess Holdings, Inc. | | | 419 | | | | 84,533 | | |
Martin Marietta Materials, Inc. | | | 197 | | | | 43,545 | | |
Mastercard, Inc., Class A | | | 180 | | | | 27,245 | | |
Netflix, Inc. (a) | | | 228 | | | | 43,767 | | |
NVIDIA Corp. | | | 180 | | | | 34,830 | | |
Seattle Genetics, Inc. (a) | | | 379 | | | | 20,276 | | |
Sherwin-Williams Co. (The) | | | 83 | | | | 34,033 | | |
Tableau Software, Inc., Class A (a) | | | 491 | | | | 33,977 | | |
TD Ameritrade Holding Corp. | | | 768 | | | | 39,268 | | |
Tesla, Inc. (a) | | | 94 | | | | 29,267 | | |
The accompanying notes are an integral part of the financial statements.
106
Annual Report December 31, 2017
December 31, 2017
Baillie Gifford Global Select Equity Fund
| | | Shares | | Value | |
Tiffany & Co. | | | 275 | | | $ | 28,586 | | |
TJX Cos., Inc. (The) | | | 378 | | | | 28,902 | | |
Under Armour, Inc., Class C (a) | | | 721 | | | | 9,604 | | |
Waters Corp. (a) | | | 142 | | | | 27,433 | | |
Watsco, Inc. | | | 247 | | | | 42,000 | | |
Wayfair, Inc., Class A (a) | | | 380 | | | | 30,503 | | |
| | | | | | 1,464,672 | | |
TOTAL INVESTMENTS — 98.7% | |
(cost $2,957,455) | | | | $ | 3,005,376 | | |
Other assets less liabilities — 1.3% | | | | | 39,827 | | |
NET ASSETS — 100.0% | | | | $ | 3,045,203 | | |
(a) Non-income producing security.
(b) 144A — Securities are exempt from registration under Rule 144A of the Securities Act of 1933, as amended. These securities may be resold in transactions exempt from registration, normally to qualified institutional buyers. Prices are obtained daily from the London International Stock Exchange; therefore, fair valuation is typically not required. At December 31, 2017, the net value of these securities was $30,055 representing 1.0% of net assets.
ADR — American Depositary Receipt.
GDR — Global Depositary Receipt.
Reg S — Regulation S ("Reg S") of the securities Act of 1933, as amended ("1933 Act") is a safe harbor that defines when an offering of securities will be deemed to come to rest abroad and therefore is not subject to the registration obligations imposed under Section 5 of the 1933 Act. The regulation includes two safe harbor provisions: an issuer safe harbor and a resale safe harbor. In each case, the regulation demands that offers and sales of the securities be made outside the United States and that no offering participant (which includes the issuer, the banks assisting with the offer and their respective affiliates) engage in "directed" selling efforts. In the case of issuers for whose securities there is substantial U.S. market interest, the regulation also requires that no offers and sales be made to U.S. persons (including U.S. persons physically located outside the United States).
Fair Value Measurement
The following is a summary of the inputs used as of December 31, 2017 in valuing the Fund's investments carried at fair value:
Investments in Securities | | Level 1 | | Level 2 | | Level 3 | | Total | |
Common Stocks | |
Canada | | $ | 18,584 | | | $ | — | | | $ | — | | | $ | 18,584 | | |
China | | | 171,089 | | | | 67,285 | | | | — | | | | 238,374 | | |
Denmark | | | — | | | | 29,514 | | | | — | | | | 29,514 | | |
France | | | 30,093 | | | | — | | | | — | | | | 30,093 | | |
Germany | | | — | | | | 74,652 | | | | — | | | | 74,652 | | |
Hong Kong | | | — | | | | 68,357 | | | | — | | | | 68,357 | | |
Ireland | | | 50,740 | | | | — | | | | — | | | | 50,740 | | |
Israel | | | — | | | | 41,325 | | | | — | | | | 41,325 | | |
Italy | | | 31,099 | | | | 34,952 | | | | — | | | | 66,051 | | |
Japan | | | — | | | | 384,710 | | | | — | | | | 384,710 | | |
South Korea | | | — | | | | 16,248 | | | | — | | | | 16,248 | | |
Spain | | | — | | | | 16,760 | | | | — | | | | 16,760 | | |
Sweden | | | — | | | | 64,492 | | | | — | | | | 64,492 | | |
The accompanying notes are an integral part of the financial statements.
107
Annual Report December 31, 2017
Investments in Securities | | Level 1 | | Level 2 | | Level 3 | | Total | |
Common Stocks | |
Switzerland | | $ | 25,266 | | | $ | 119,110 | | | $ | — | | | $ | 144,376 | | |
Taiwan | | | 59,951 | | | | 34,826 | | | | — | | | | 94,777 | | |
United Kingdom | | | 27,488 | | | | 174,163 | | | | — | | | | 201,651 | | |
United States | | | 1,464,672 | | | | — | | | | — | | | | 1,464,672 | | |
Total | | $ | 1,878,982 | | | $ | 1,126,394 | | | $ | — | | | $ | 3,005,376 | | |
There were no transfers between levels for the period ended December 31, 2017.
It is the Fund's policy to recognize transfers in and transfers out at the fair value as of the beginning of the period.
The accompanying notes are an integral part of the financial statements.
108
Statement of Assets and Liabilities
Annual Report December 31, 2017
December 31, 2017
Baillie Gifford Global Select Equity Fund
ASSETS | |
Investments, at value (cost $2,957,455) | | $ | 3,005,376 | | |
Cash | | | 40,375 | | |
Due from Investment Advisor | | | 23,393 | | |
Dividends receivable | | | 308 | | |
Tax reclaims receivable | | | 10 | | |
Total Assets | | | 3,069,462 | | |
LIABILITIES | |
Servicing fee payable | | | 226 | | |
Trustee fee payable | | | 35 | | |
Accrued expenses | | | 23,998 | | |
Total Liabilities | | | 24,259 | | |
NET ASSETS | | $ | 3,045,203 | | |
COMPOSITION OF NET ASSETS | |
Paid-in capital | | $ | 3,000,000 | | |
Accumulated net investment loss | | | (2,719 | ) | |
Accumulated net realized loss on foreign currency transactions | | | — | | |
Net unrealized appreciation in value of investments and foreign currencies | | | 47,922 | | |
| | | $ | 3,045,203 | | |
NET ASSET VALUE, PER SHARE | |
| Class K ($1,522,602 / 150,000 shares outstanding), unlimited authorized, no par value | | $ | 10.15 | | |
| Institutional Class ($1,522,601 / 150,000 shares outstanding), unlimited authorized, no par value | | $ | 10.15 | | |
The accompanying notes are an integral part of the financial statements.
109
Annual Report December 31, 2017
For the Period December 14, 2017* through December 31, 2017
Baillie Gifford Global Select Equity Fund
INVESTMENT INCOME | |
Dividends (net of foreign withholding taxes of $21) | | $ | 455 | | |
Total Investment Income | | | 455 | | |
EXPENSES | |
Advisory fee (Note B) | | | 439 | | |
Administration & Supervisory Fee — Class K Shares (Note B) | | | 113 | | |
Administration & Supervisory Fee — Institutional Class Shares (Note B) | | | 113 | | |
Professional fees | | | 20,267 | | |
Custody | | | 1,000 | | |
Fund accounting | | | 10 | | |
Transfer agency | | | 2,386 | | |
Legal | | | 161 | | |
Trustees' fees | | | 35 | | |
Miscellaneous | | | 174 | | |
Total Expenses | | | 24,698 | | |
Fees waived | | | (23,833 | ) | |
Net Expenses | | | 865 | | |
Net Investment Loss | | | (410 | ) | |
REALIZED AND UNREALIZED GAIN (LOSS) ON INVESTMENTS
AND FOREIGN CURRENCY TRANSACTIONS | |
Net realized loss from: | |
Foreign currency transactions | | | (2,309 | ) | |
| | | | (2,309 | ) | |
Net change in unrealized appreciation on: | |
Investments | | | 47,921 | | |
Translation of assets and liabilities denominated in foreign currencies | | | 1 | | |
| | | | 47,922 | | |
Net realized and unrealized gain on investments and foreign currency transactions | | | 45,613 | | |
NET INCREASE IN NET ASSETS FROM OPERATIONS | | $ | 45,203 | | |
* Commencement of investment operations.
The accompanying notes are an integral part of the financial statements.
110
Statements of Changes in Net Assets
Annual Report December 31, 2017
Baillie Gifford Global Select Equity Fund
| | | For the Period
December 14, 2017*
through
December 31, 2017 | |
INCREASE IN NET ASSETS FROM OPERATIONS | |
Net investment loss | | $ | (410 | ) | |
Net realized loss from foreign currency transactions | | | (2,309 | ) | |
Net change in unrealized appreciation on investments and translation of
assets and liabilities in foreign currencies | | | 47,922 | | |
Net increase in net assets from operations | | | 45,203 | | |
TRANSACTIONS IN SHARES OF BENEFICIAL INTEREST | |
Net proceeds from shares subscribed: | |
Class K | | | 1,500,000 | | |
Institutional Class | | | 1,500,000 | | |
Increase in Net Assets from Transactions in Shares of Beneficial Interest | | | 3,000,000 | | |
Total Increase in Net Assets | | | 3,045,203 | | |
NET ASSETS | |
Beginning of period | | | — | | |
End of period (including accumulated net investment loss of $2,719) | | $ | 3,045,203 | | |
* Commencement of investment operations.
The accompanying notes are an integral part of the financial statements.
111
Annual Report December 31, 2017
Baillie Gifford Global Select Equity Fund
Selected data for a Class K Share outstanding throughout the period:
| | | For the Period
December 14, 2017(a)
through
December 31, 2017 | |
Net asset value, beginning of period | | $ | 10.00 | | |
From Investment Operations | |
Net investment loss(b) | | | (0.00 | )(c) | |
Net realized and unrealized gain on investments and foreign currency transactions | | | 0.15 | | |
Net increase in net asset value from investment operations | | | 0.15 | | |
Net asset value, end of period | | $ | 10.15 | | |
Total Return | |
Total return based on net asset value(d) | | | 1.50 | % | |
Ratios/Supplemental Data | |
Net assets, end of period (000's omitted) | | $ | 1,523 | | |
Ratio of net expenses to average net assets, before waiver | | | 18.55 | %* | |
Ratio of net expenses to average net assets, after waiver | | | 0.65 | %* | |
Ratio of net investment loss to average net assets | | | (0.31 | )%* | |
Portfolio turnover rate(e) | | | 0 | % | |
* Annualized.
(a) Commencement of investment operations.
(b) Calculated based upon average shares outstanding during the period.
(c) Amount is less than $0.005 per share.
(d) Total investment return is calculated assuming an initial investment made at the net asset value at the beginning of the period, reinvestment of all dividends and distributions, if any, at net asset value during the period, and redemption on the last day of the period. Total return is not annualized for periods less than one year.
(e) Portfolio turnover rate calculated at fund level.
The accompanying notes are an integral part of the financial statements.
112
Annual Report December 31, 2017
Baillie Gifford Global Select Equity Fund
Selected data for an Institutional Class Share outstanding throughout the period:
| | | For the Period
December 14, 2017(a)
through
December 31, 2017 | |
Net asset value, beginning of period | | $ | 10.00 | | |
From Investment Operations | |
Net investment loss(b) | | | (0.00 | )(c) | |
Net realized and unrealized gain on investments and foreign currency transactions | | | 0.15 | | |
Net increase in net asset value from investment operations | | | 0.15 | | |
Net asset value, end of period | | $ | 10.15 | | |
Total Return | |
Total return based on net asset value(d) | | | 1.50 | % | |
Ratios/Supplemental Data | |
Net assets, end of period (000's omitted) | | $ | 1,523 | | |
Ratio of net expenses to average net assets, before waiver | | | 18.55 | %* | |
Ratio of net expenses to average net assets, after waiver | | | 0.80 | %* | |
Ratio of net investment loss to average net assets | | | (0.31 | )%* | |
Portfolio turnover rate(e) | | | 0 | % | |
* Annualized.
(a) Commencement of investment operations.
(b) Calculated based upon average shares outstanding during the period.
(c) Amount is less than $0.005 per share.
(d) Total investment return is calculated assuming an initial investment made at the net asset value at the beginning of the period, reinvestment of all dividends and distributions, if any, at net asset value during the period, and redemption on the last day of the period. Total return is not annualized for periods less than one year.
(e) Portfolio turnover rate calculated at fund level.
The accompanying notes are an integral part of the financial statements.
113
Industry Diversification Table
Annual Report December 31, 2017
December 31, 2017
Baillie Gifford International Concentrated Growth Fund
| | | Value | | % of Total
Net Assets | |
Apparel Retailers | | $ | 112,736 | | | | 11.2 | % | |
Automobiles & Parts | | | 81,601 | | | | 8.1 | | |
Biotechnology | | | 26,037 | | | | 2.6 | | |
Broadline Retailers | | | 66,372 | | | | 6.6 | | |
Clothing & Accessories | | | 28,889 | | | | 2.9 | | |
General Retailers | | | 76,085 | | | | 7.5 | | |
Hotels Restaurants and Leisure | | | 35,236 | | | | 3.5 | | |
Industrial Machinery | | | 28,017 | | | | 2.8 | | |
Internet, Software & Services | | | 180,331 | | | | 18.0 | | |
Life Insurance | | | 25,517 | | | | 2.5 | | |
Media | | | 31,549 | | | | 3.1 | | |
Personal Products | | | 27,476 | | | | 2.7 | | |
Pharmaceuticals & Biotechnology | | | 35,177 | | | | 3.5 | | |
Speciality Finance | | | 24,971 | | | | 2.5 | | |
Specialized Consumer Services | | | 75,697 | | | | 7.5 | | |
Technology Hardware & Equipment | | | 98,648 | | | | 9.9 | | |
Telecommunication Services | | | 31,668 | | | | 3.2 | | |
Total Value of Investments | | | 986,007 | | | | 98.1 | | |
Other assets less liabilities | | | 18,703 | | | | 1.9 | | |
Net Assets | | $ | 1,004,710 | | | | 100.0 | % | |
114
Annual Report December 31, 2017
December 31, 2017
Baillie Gifford International Concentrated Growth Fund
| | | Shares | | Value | |
COMMON STOCKS — 98.1% | |
ARGENTINA — 3.3% | |
MercadoLibre, Inc. | | | 106 | | | $ | 33,354 | | |
CHINA — 24.2% | |
Alibaba Group Holding Ltd. ADR (a) | | | 439 | | | | 75,697 | | |
Baidu, Inc. ADR (a) | | | 189 | | | | 44,266 | | |
Ctrip.com International Ltd. ADR (a) | | | 799 | | | | 35,236 | | |
Tencent Holdings Ltd. | | | 1,700 | | | | 87,988 | | |
| | | | | | 243,187 | | |
DENMARK — 2.6% | |
Genmab A/S (a) | | | 157 | | | | 26,037 | | |
FRANCE — 12.2% | |
Hermes International | | | 54 | | | | 28,889 | | |
Kering | | | 141 | | | | 66,372 | | |
L'Oreal SA | | | 124 | | | | 27,476 | | |
| | | | | | 122,737 | | |
GERMANY — 9.1% | |
Delivery Hero AG 144A (a)(b) | | | 622 | | | | 24,628 | | |
Rocket Internet SE 144A (a)(b) | | | 584 | | | | 14,723 | | |
Zalando SE 144A (a)(b) | | | 986 | | | | 51,990 | | |
| | | | | | 91,341 | | |
HONG KONG — 2.5% | |
AIA Group Ltd. | | | 3,000 | | | | 25,517 | | |
ITALY — 4.6% | |
Ferrari NV | | | 443 | | | | 46,418 | | |
JAPAN — 6.3% | |
M3, Inc. | | | 900 | | | | 31,549 | | |
SoftBank Group Corp. | | | 400 | | | | 31,668 | | |
| | | | | | 63,217 | | |
NETHERLANDS — 7.9% | |
| ASML Holding NV | | | 455 | | | | 79,105 | | |
The accompanying notes are an integral part of the financial statements.
115
Annual Report December 31, 2017
December 31, 2017
Baillie Gifford International Concentrated Growth Fund
| | | Shares | | Value | |
SPAIN — 6.0% | |
Inditex SA | | | 1,747 | | | $ | 60,746 | | |
SWEDEN — 5.3% | |
Atlas Copco AB, B Shares | | | 731 | | | | 28,017 | | |
Kinnevik AB, B Shares | | | 739 | | | | 24,971 | | |
| | | | | | 52,988 | | |
UNITED STATES — 14.1% | |
Amazon.com, Inc. (a) | | | 44 | | | | 51,457 | | |
Illumina, Inc. (a) | | | 161 | | | | 35,177 | | |
NVIDIA Corp. | | | 101 | | | | 19,543 | | |
Tesla, Inc. (a) | | | 113 | | | | 35,183 | | |
| | | | | | 141,360 | | |
TOTAL INVESTMENTS — 98.1% | |
(cost $979,387) | | | | $ | 986,007 | | |
Other assets less liabilities — 1.9% | | | | | 18,703 | | |
NET ASSETS — 100.0% | | | | $ | 1,004,710 | | |
(a) Non-income producing security.
(b) 144A — Securities are exempt from registration under Rule 144A of the Securities Act of 1933, as amended. These securities may be resold in transactions exempt from registration, normally to qualified institutional buyers. Prices are obtained daily from the London International Stock Exchange; therefore, fair valuation is typically not required. At December 31, 2017, the net value of these securities was $91,341 representing 9.1% of net assets.
ADR — American Depositary Receipt.
The accompanying notes are an integral part of the financial statements.
116
Annual Report December 31, 2017
December 31, 2017
Baillie Gifford International Concentrated Growth Fund
Fair Value Measurement
The following is a summary of the inputs used as of December 31, 2017 in valuing the Fund's investments carried at fair value:
Investments in Securities | | Level 1 | | Level 2 | | Level 3 | | Total | |
Common Stocks | |
Argentina | | $ | 33,354 | | | $ | — | | | $ | — | | | $ | 33,354 | | |
China | | | 155,199 | | | | 87,988 | | | | — | | | | 243,187 | | |
Denmark | | | 26,037 | | | | — | | | | — | | | | 26,037 | | |
France | | | — | | | | 122,737 | | | | — | | | | 122,737 | | |
Germany | | | 24,628 | | | | 66,713 | | | | — | | | | 91,341 | | |
Hong Kong | | | — | | | | 25,517 | | | | — | | | | 25,517 | | |
Italy | | | — | | | | 46,418 | | | | — | | | | 46,418 | | |
Japan | | | — | | | | 63,217 | | | | — | | | | 63,217 | | |
Netherlands | | | — | | | | 79,105 | | | | — | | | | 79,105 | | |
Spain | | | — | | | | 60,746 | | | | — | | | | 60,746 | | |
Sweden | | | — | | | | 52,988 | | | | — | | | | 52,988 | | |
United States | | | 141,360 | | | | — | | | | — | | | | 141,360 | | |
Total | | $ | 380,578 | | | $ | 605,429 | | | $ | — | | | $ | 986,007 | | |
There were no transfers between levels for the period ended December 31, 2017.
It is the Fund's policy to recognize transfers in and transfers out at the fair value as of the beginning of the period.
The accompanying notes are an integral part of the financial statements.
117
Statement of Assets and Liabilities
Annual Report December 31, 2017
December 31, 2017
Baillie Gifford International Concentrated Growth Fund
ASSETS | |
Investments, at value (cost $979,387) | | $ | 986,007 | | |
Cash | | | 19,005 | | |
Due from Investment Advisor | | | 23,037 | | |
Dividends receivable | | | 16 | | |
Total Assets | | | 1,028,065 | | |
LIABILITIES | |
Servicing fee payable | | | 75 | | |
Trustee fee payable | | | 12 | | |
Accrued expenses | | | 23,268 | | |
Total Liabilities | | | 23,355 | | |
NET ASSETS | | $ | 1,004,710 | | |
COMPOSITION OF NET ASSETS | |
Paid-in capital | | $ | 998,090 | | |
Accumulated net investment loss | | | — | | |
Accumulated net realized loss on investments and foreign currency transactions | | | — | | |
Net unrealized appreciation in value of investments and foreign currencies | | | 6,620 | | |
| | | $ | 1,004,710 | | |
NET ASSET VALUE, PER SHARE | |
| Class K ($502,355 / 50,000 shares outstanding), unlimited authorized, no par value | | $ | 10.05 | | |
| Institutional Class ($502,355 / 50,000 shares outstanding), unlimited authorized, no par value | | $ | 10.05 | | |
The accompanying notes are an integral part of the financial statements.
118
Annual Report December 31, 2017
For the Period December 14, 2017(a) through December 31, 2017
Baillie Gifford International Concentrated Growth Fund
INVESTMENT INCOME | |
Dividends | | $ | 16 | | |
Total Investment Income | | | 16 | | |
EXPENSES | |
Advisory fee (Note B) | | | 176 | | |
Administration & Supervisory Fee — Class K Shares (Note B) | | | 38 | | |
Administration & Supervisory Fee — Institutional Class Shares (Note B) | | | 38 | | |
Professional fees | | | 20,267 | | |
Custody | | | 500 | | |
Fund accounting | | | 5 | | |
Transfer agency | | | 2,384 | | |
Legal | | | 54 | | |
Trustees' fees | | | 12 | | |
Miscellaneous | | | 58 | | |
Total Expenses | | | 23,532 | | |
Fees waived | | | (23,214 | ) | |
Net Expenses | | | 318 | | |
Net Investment Loss | | | (302 | ) | |
REALIZED AND UNREALIZED GAIN (LOSS) ON INVESTMENTS
AND FOREIGN CURRENCY TRANSACTIONS | |
Net realized loss from: | |
Foreign currency transactions | | | (1,608 | ) | |
| | | | (1,608 | ) | |
Net change in unrealized appreciation on: | |
Investments | | | 6,620 | | |
| | | | 6,620 | | |
Net realized and unrealized gain on investments and foreign currency transactions | | | 5,012 | | |
NET INCREASE IN NET ASSETS FROM OPERATIONS | | $ | 4,710 | | |
(a) Commencement of investment operations.
The accompanying notes are an integral part of the financial statements.
119
Statements of Changes in Net Assets
Annual Report December 31, 2017
Baillie Gifford International Concentrated Growth Fund
| | | For the Period
December 14, 2017(a)
through
December 31,
2017 | |
INCREASE IN NET ASSETS FROM OPERATIONS | |
Net investment loss | | $ | (302 | ) | |
Net realized loss from foreign currency transactions | | | (1,608 | ) | |
Net change in unrealized appreciation on investments and translation of assets and liabilities in foreign currencies | | | 6,620 | | |
Net increase in net assets from operations | | | 4,710 | | |
TRANSACTIONS IN SHARES OF BENEFICIAL INTEREST | |
Net proceeds from shares subscribed: | |
Class K | | | 500,000 | | |
Institutional Class | | | 500,000 | | |
Increase in Net Assets from Transactions in Shares of Beneficial Interest | | | 1,000,000 | | |
Total Increase in Net Assets | | | 1,004,710 | | |
NET ASSETS | |
Beginning of period | | | — | | |
End of period (including accumulated net investment loss of $—) | | $ | 1,004,710 | | |
(a) Commencement of investment operations.
The accompanying notes are an integral part of the financial statements.
120
Annual Report December 31, 2017
Baillie Gifford International Concentrated Growth Fund
Selected data for a Class K Share outstanding throughout the period:
| | | For the Period
December 14, 2017(a)
through
December 31, 2017 | |
Net asset value, beginning of period | | $ | 10.00 | | |
From Investment Operations | |
Net investment loss(b) | | | (0.00 | )(c) | |
Net realized and unrealized gain on investments and foreign currency transactions | | | 0.05 | | |
Net increase in net asset value from investment operations | | | 0.05 | | |
Net asset value, end of period | | $ | 10.05 | | |
Total Return | |
Total return based on net asset value(d) | | | 0.50 | % | |
Ratios/Supplemental Data | |
Net assets, end of period (000's omitted) | | $ | 502 | | |
Ratio of net expenses to average net assets, before waiver | | | 53.29 | %* | |
Ratio of net expenses to average net assets, after waiver | | | 0.72 | %* | |
Ratio of net investment loss to average net assets | | | (0.68 | )%* | |
Portfolio turnover rate(e) | | | 0 | % | |
* Annualized.
(a) Commencement of investment operations.
(b) Calculated based upon average shares outstanding during the period.
(c) Amount is less than $0.005 per share.
(d) Total investment return is calculated assuming an initial investment made at the net asset value at the beginning of the period, reinvestment of all dividends and distributions, if any, at net asset value during the period, and redemption on the last day of the period. Total return is not annualized for periods less than one year.
(e) Portfolio turnover rate calculated at Fund level.
The accompanying notes are an integral part of the financial statements.
121
Annual Report December 31, 2017
Baillie Gifford International Concentrated Growth Fund
Selected data for an Institutional Class Share outstanding throughout the period:
| | | For the Period
December 14, 2017(a)
through
December 31,
2017 | |
Net asset value, beginning of period | | $ | 10.00 | | |
From Investment Operations | |
Net investment loss(b) | | | (0.00 | )(c) | |
Net realized and unrealized gain on investments and foreign currency transactions | | | 0.05 | | |
Net increase in net asset value from investment operations | | | 0.05 | | |
Net asset value, end of period | | $ | 10.05 | | |
Total Return | |
Total return based on net asset value(d) | | | 0.50 | % | |
Ratios/Supplemental Data | |
Net assets, end of period (000's omitted) | | $ | 502 | | |
Ratio of net expenses to average net assets, before waiver | | | 53.29 | %* | |
Ratio of net expenses to average net assets, after waiver | | | 0.87 | %* | |
Ratio of net investment loss to average net assets | | | (0.68 | )%* | |
Portfolio turnover rate(e) | | | 0 | % | |
* Annualized.
(a) Commencement of investment operations.
(b) Calculated based upon average shares outstanding during the period.
(c) Amount is less than $0.005 per share.
(d) Total investment return is calculated assuming an initial investment made at the net asset value at the beginning of the period, reinvestment of all dividends and distributions, if any, at net asset value during the period, and redemption on the last day of the period. Total return is not annualized for periods less than one year.
(e) Portfolio turnover rate calculated at Fund level.
The accompanying notes are an integral part of the financial statements.
122
Industry Diversification Table
Annual Report December 31, 2017
December 31, 2017
Baillie Gifford International Equity Fund
| | | Value | | % of Total
Net Assets | |
Aerospace & Defense | | $ | 27,919,414 | | | | 1.3 | % | |
Airlines | | | 41,050,756 | | | | 1.9 | | |
Apparel Retailers | | | 46,464,350 | | | | 2.2 | | |
Asset Managers | | | 21,106,805 | | | | 1.0 | | |
Auto Manufacturers | | | 19,043,648 | | | | 0.9 | | |
Auto Parts | | | 26,168,153 | | | | 1.2 | | |
Banks | | | 194,625,754 | | | | 9.1 | | |
Beverages, Food & Tobacco | | | 54,160,852 | | | | 2.6 | | |
Biotechnology | | | 21,676,062 | | | | 1.0 | | |
Business Support Services | | | 31,237,780 | | | | 1.4 | | |
Chemicals | | | 16,028,793 | | | | 0.8 | | |
Clothing & Accessories | | | 55,660,437 | | | | 2.7 | | |
Commercial Services & Supplies | | | 64,499,097 | | | | 3.0 | | |
Construction & Building Materials | | | 57,928,146 | | | | 2.8 | | |
Containers & Packaging | | | 15,258,431 | | | | 0.7 | | |
Distribution/Wholesale | | | 31,037,843 | | | | 1.5 | | |
Diversified Financial Services | | | 31,484,506 | | | | 1.5 | | |
Electronic & Electrical Equipment | | | 156,660,271 | | | | 7.5 | | |
Food & Staples | | | 66,491,078 | | | | 3.2 | | |
Food Producers & Processors | | | 28,276,915 | | | | 1.3 | | |
General Financial | | | 35,869,900 | | | | 1.7 | | |
General Retailers | | | 70,054,964 | | | | 3.2 | | |
Healthcare — Products | | | 17,667,920 | | | | 0.8 | | |
Hotels Restaurants and Leisure | | | 16,398,761 | | | | 0.8 | | |
Industrial Machinery | | | 100,938,039 | | | | 4.8 | | |
Industrial Suppliers | | | 35,069,794 | | | | 1.7 | | |
Information and Communications | | | 19,007,594 | | | | 0.9 | | |
Insurance | | | 66,897,143 | | | | 3.2 | | |
Internet, Software & Services | | | 177,478,498 | | | | 8.3 | | |
Investment Services | | | 39,025,736 | | | | 1.9 | | |
Life Insurance | | | 35,504,444 | | | | 1.7 | | |
Machinery — Diversified | | | 21,782,597 | | | | 1.0 | | |
Media & Photography | | | 87,430,830 | | | | 4.1 | | |
Medical Equipment | | | 22,192,484 | | | | 1.0 | | |
Mining & Metals | | | 37,084,818 | | | | 1.7 | | |
Nonlife Insurance | | | 35,206,113 | | | | 1.7 | | |
Pharmaceuticals & Biotechnology | | | 26,231,050 | | | | 1.2 | | |
Recreational Products | | | 26,073,623 | | | | 1.2 | | |
Restaurant & Bars | | | 19,914,206 | | | | 0.9 | | |
Semiconductors | | | 82,788,296 | | | | 3.9 | | |
123
Industry Diversification Table
Annual Report December 31, 2017
| | | Value | | % of Total
Net Assets | |
Specialized Consumer Services | | $ | 45,310,635 | | | | 2.1 | % | |
Support Services | | | 8,252,299 | | | | 0.4 | | |
Transportation | | | 31,898,213 | | | | 1.5 | | |
Travel & Leisure | | | 25,037,046 | | | | 1.2 | | |
Total Value of Investments | | | 2,089,894,094 | | | | 98.5 | | |
Other assets less liabilities | | | 32,206,660 | | | | 1.5 | | |
Net Assets | | $ | 2,122,100,754 | | | | 100.0 | % | |
124
Annual Report December 31, 2017
December 31, 2017
Baillie Gifford International Equity Fund
| | | Shares | | Value | |
COMMON STOCKS — 97.7% | |
ARGENTINA — 2.8% | |
MercadoLibre, Inc. | | | 191,138 | | | $ | 60,143,483 | | |
AUSTRALIA — 2.1% | |
Brambles Ltd. | | | 1,946,956 | | | | 15,258,431 | | |
Cochlear Ltd. | | | 166,482 | | | | 22,192,484 | | |
SEEK Ltd. | | | 552,258 | | | | 8,166,623 | | |
| | | | | | 45,617,538 | | |
BRAZIL — 1.1% | |
Kroton Educacional SA | | | 4,305,000 | | | | 23,887,821 | | |
CANADA — 4.5% | |
Constellation Software, Inc. | | | 46,955 | | | | 28,465,115 | | |
Fairfax Financial Holdings Ltd. | | | 66,116 | | | | 35,206,113 | | |
Restaurant Brands International, Inc. | | | 323,957 | | | | 19,914,206 | | |
Ritchie Bros. Auctioneers, Inc. | | | 365,837 | | | | 10,949,501 | | |
| | | | | | 94,534,935 | | |
CHINA — 3.2% | |
Alibaba Group Holding Ltd. ADR (a) | | | 163,461 | | | | 28,185,580 | | |
Baidu, Inc. ADR (a) | | | 103,203 | | | | 24,171,175 | | |
Ctrip.com International Ltd. ADR (a) | | | 371,854 | | | | 16,398,761 | | |
| | | | | | 68,755,516 | | |
DENMARK — 4.7% | |
DSV A/S | | | 405,387 | | | | 31,898,213 | | |
Novo Nordisk A/S, B Shares | | | 483,505 | | | | 25,981,379 | | |
Novozymes A/S, B Shares | | | 379,700 | | | | 21,676,062 | | |
Pandora A/S | | | 180,729 | | | | 19,644,978 | | |
| | | | | | 99,200,632 | | |
FINLAND — 1.9% | |
Kone Oyj, B Shares | | | 398,788 | | | | 21,415,945 | | |
Sampo Oyj, A Shares | | | 333,522 | | | | 18,304,356 | | |
| | | | | | 39,720,301 | | |
The accompanying notes are an integral part of the financial statements.
125
Annual Report December 31, 2017
December 31, 2017
Baillie Gifford International Equity Fund
| | | Shares | | Value | |
FRANCE — 3.9% | |
Bureau Veritas SA | | | 713,797 | | | $ | 19,495,685 | | |
Edenred | | | 670,240 | | | | 19,403,310 | | |
Essilor International SA | | | 128,269 | | | | 17,667,920 | | |
Legrand SA | | | 343,936 | | | | 26,441,353 | | |
| | | | | | 83,008,268 | | |
GERMANY — 6.3% | |
Brenntag AG | | | 254,250 | | | | 16,028,793 | | |
Continental AG | | | 70,826 | | | | 19,043,648 | | |
Deutsche Boerse AG | | | 309,904 | | | | 35,869,900 | | |
MTU Aero Engines AG | | | 104,859 | | | | 18,737,711 | | |
SAP SE | | | 387,052 | | | | 43,301,457 | | |
| | | | | | 132,981,509 | | |
HONG KONG — 3.9% | |
AIA Group Ltd. | | | 3,163,800 | | | | 26,910,168 | | |
Hang Seng Bank Ltd. | | | 950,900 | | | | 23,590,813 | | |
Hong Kong Exchanges & Clearing Ltd. | | | 1,029,300 | | | | 31,484,506 | | |
| | | | | | 81,985,487 | | |
IRELAND — 4.7% | |
CRH PLC | | | 596,347 | | | | 21,402,846 | | |
James Hardie Industries PLC SE CDI | | | 901,764 | | | | 15,837,563 | | |
Kingspan Group PLC | | | 472,130 | | | | 20,687,737 | | |
Ryanair Holdings PLC ADR (a) | | | 393,999 | | | | 41,050,756 | | |
| | | | | | 98,978,902 | | |
JAPAN — 12.6% | |
DENSO Corp. | | | 436,800 | | | | 26,168,153 | | |
FANUC Corp. | | | 90,800 | | | | 21,782,597 | | |
Japan Exchange Group, Inc. | | | 2,249,300 | | | | 39,025,736 | | |
Nidec Corp. | | | 205,800 | | | | 28,815,509 | | |
Rakuten, Inc. | | | 1,873,500 | | | | 17,125,055 | | |
Shimano, Inc. | | | 185,500 | | | | 26,073,623 | | |
SMC Corp. | | | 81,300 | | | | 33,364,252 | | |
Square Enix Holdings Co., Ltd. | | | 400,600 | | | | 19,007,594 | | |
Sumitomo Mitsui Trust Holdings, Inc. | | | 608,100 | | | | 24,060,090 | | |
Toyota Tsusho Corp. | | | 772,600 | | | | 31,037,843 | | |
| | | | | | 266,460,452 | | |
The accompanying notes are an integral part of the financial statements.
126
Annual Report December 31, 2017
December 31, 2017
Baillie Gifford International Equity Fund
| | | Shares | | Value | |
NETHERLANDS — 2.8% | |
Heineken Holding NV | | | 313,180 | | | $ | 30,964,107 | | |
Unilever NV CVA | | | 502,229 | | | | 28,276,915 | | |
| | | | | | 59,241,022 | | |
PERU — 1.1% | |
Credicorp Ltd. | | | 110,831 | | | | 22,989,674 | | |
RUSSIA — 0.8% | |
Magnit PJSC GDR Reg S | | | 602,011 | | | | 16,384,541 | | |
SINGAPORE — 1.5% | |
United Overseas Bank Ltd. | | | 1,629,872 | | | | 32,129,695 | | |
SOUTH AFRICA — 4.5% | |
Discovery Ltd. | | | 571,566 | | | | 8,594,276 | | |
Naspers Ltd., N Shares | | | 315,574 | | | | 87,430,830 | | |
| | | | | | 96,025,106 | | |
SOUTH KOREA — 4.7% | |
NAVER Corp. (a) | | | 26,339 | | | | 21,397,268 | | |
Samsung Electronics Co., Ltd. | | | 33,214 | | | | 78,913,518 | | |
| | | | | | 100,310,786 | | |
SPAIN — 2.4% | |
Bankinter SA | | | 2,243,450 | | | | 21,222,320 | | |
Grifols SA | | | 8,539 | | | | 249,671 | | |
Inditex SA | | | 857,852 | | | | 29,828,958 | | |
| | | | | | 51,300,949 | | |
SWEDEN — 3.7% | |
Atlas Copco AB, B Shares | | | 1,204,314 | | | | 46,157,842 | | |
Svenska Handelsbanken AB, A Shares | | | 2,441,301 | | | | 33,362,926 | | |
| | | | | | 79,520,768 | | |
SWITZERLAND — 4.9% | |
Compagnie Financiere Richemont SA | | | 241,984 | | | | 21,915,976 | | |
Credit Suisse Group AG (a) | | | 1,175,963 | | | | 20,974,151 | | |
Nestle SA | | | 582,795 | | | | 50,106,537 | | |
The accompanying notes are an integral part of the financial statements.
127
Annual Report December 31, 2017
December 31, 2017
Baillie Gifford International Equity Fund
| | | Shares | | Value | |
SGS SA | | | 4,504 | | | $ | 11,742,095 | | |
| | | | | | 104,738,759 | | |
TAIWAN — 5.0% | |
Hon Hai Precision Industry Co., Ltd. | | | 2,044,000 | | | | 6,499,081 | | |
Hon Hai Precision Industry Co., Ltd. GDR Reg S | | | 2,546,024 | | | | 15,990,810 | | |
Taiwan Semiconductor Manufacturing Co., Ltd. | | | 10,812,000 | | | | 82,788,296 | | |
| | | | | | 105,278,187 | | |
UNITED KINGDOM — 12.9% | |
| ASOS PLC (a) | | | 184,395 | | | | 16,635,392 | | |
boohoo.com PLC (a) | | | 3,953,908 | | | | 10,062,804 | | |
British American Tobacco PLC | | | 343,154 | | | | 23,196,745 | | |
Burberry Group PLC | | | 584,803 | | | | 14,099,483 | | |
Capita PLC | | | 1,527,327 | | | | 8,252,299 | | |
Experian PLC | | | 1,178,609 | | | | 25,979,663 | | |
Ferguson PLC | | | 313,959 | | | | 22,530,878 | | |
Hargreaves Lansdown PLC | | | 869,103 | | | | 21,106,805 | | |
Howden Joinery Group PLC | | | 1,991,934 | | | | 12,538,916 | | |
Just Eat PLC (a) | | | 2,277,670 | | | | 23,957,007 | | |
Prudential PLC | | | 1,152,333 | | | | 29,511,552 | | |
Rio Tinto PLC | | | 706,950 | | | | 37,084,818 | | |
Rolls-Royce Holdings PLC (a) | | | 800,158 | | | | 9,132,008 | | |
Rolls-Royce Holdings PLC Entitlement (a)(b) | | | 36,807,268 | | | | 49,695 | | |
St James's Place PLC | | | 1,155,031 | | | | 19,081,235 | | |
| | | | | | 273,219,300 | | |
UNITED STATES — 1.7% | |
Copa Holdings SA, Class A | | | 186,760 | | | | 25,037,046 | | |
PriceSmart, Inc. | | | 141,084 | | | | 12,147,332 | | |
| | | | | | 37,184,378 | | |
Total Common Stocks | |
(cost $1,186,906,029) | | | | | 2,073,598,009 | | |
PREFERRED STOCKS — 0.8% | |
BRAZIL — 0.8% | |
Itau Unibanco Holding SA ADR (cost $14,532,097) | | | 1,253,545 | | | | 16,296,085 | | |
The accompanying notes are an integral part of the financial statements.
128
Annual Report December 31, 2017
December 31, 2017
Baillie Gifford International Equity Fund
| | | Value | |
TOTAL INVESTMENTS — 98.5% | |
(cost $1,201,438,126) | | $ | 2,089,894,094 | | |
Other assets less liabilities — 1.5% | | | 32,206,660 | | |
NET ASSETS — 100.0% | | $ | 2,122,100,754 | | |
(a) Non-income producing security.
(b) Investment was valued using significant unobservable inputs.
ADR — American Depositary Receipt.
CDI — CHESS Depositary Interest.
CVA — Certificate Van Aandelen (Bearer).
GDR — Global Depositary Receipt.
Reg S — Regulation S ("Reg S") of the securities Act of 1933, as amended ("1933 Act") is a safe harbor that defines when an offering of securities will be deemed to come to rest abroad and therefore is not subject to the registration obligations imposed under Section 5 of the 1933 Act. The regulation includes two safe harbor provisions: an issuer safe harbor and a resale safe harbor. In each case, the regulation demands that offers and sales of the securities be made outside the United States and that no offering participant (which includes the issuer, the banks assisting with the offer and their respective affiliates) engage in "directed" selling efforts. In the case of issuers for whose securities there is substantial U.S. market interest, the regulation also requires that no offers and sales be made to U.S. persons (including U.S. persons physically located outside the United States).
Fair Value Measurement
The following is a summary of the inputs used as of December 31, 2017 in valuing the Fund's investments carried at fair value:
Investments in Securities | | Level 1 | | Level 2 | | Level 3 | | Total | |
Common Stocks | |
Argentina | | $ | 60,143,483 | | | $ | — | | | $ | — | | | $ | 60,143,483 | | |
Australia | | | — | | | | 45,617,538 | | | | — | | | | 45,617,538 | | |
Brazil | | | — | | | | 23,887,821 | | | | — | | | | 23,887,821 | | |
Canada | | | 94,534,935 | | | | — | | | | — | | | | 94,534,935 | | |
China | | | 68,755,516 | | | | — | | | | — | | | | 68,755,516 | | |
Denmark | | | — | | | | 99,200,632 | | | | — | | | | 99,200,632 | | |
Finland | | | — | | | | 39,720,301 | | | | — | | | | 39,720,301 | | |
France | | | — | | | | 83,008,268 | | | | — | | | | 83,008,268 | | |
Germany | | | — | | | | 132,981,509 | | | | — | | | | 132,981,509 | | |
Hong Kong | | | — | | | | 81,985,487 | | | | — | | | | 81,985,487 | | |
Ireland | | | 41,050,756 | | | | 57,928,146 | | | | — | | | | 98,978,902 | | |
Japan | | | — | | | | 266,460,452 | | | | — | | | | 266,460,452 | | |
Netherlands | | | — | | | | 59,241,022 | | | | — | | | | 59,241,022 | | |
Peru | | | 22,989,674 | | | | — | | | | — | | | | 22,989,674 | | |
Russia | | | — | | | | 16,384,541 | | | | — | | | | 16,384,541 | | |
Singapore | | | — | | | | 32,129,695 | | | | — | | | | 32,129,695 | | |
South Africa | | | — | | | | 96,025,106 | | | | — | | | | 96,025,106 | | |
South Korea | | | — | | | | 100,310,786 | | | | — | | | | 100,310,786 | | |
Spain | | | — | | | | 51,300,949 | | | | — | | | | 51,300,949 | | |
Sweden | | | — | | | | 79,520,768 | | | | — | | | | 79,520,768 | | |
Switzerland | | | — | | | | 104,738,759 | | | | — | | | | 104,738,759 | | |
The accompanying notes are an integral part of the financial statements.
129
Annual Report December 31, 2017
December 31, 2017
Baillie Gifford International Equity Fund
Investments in Securities | | Level 1 | | Level 2 | | Level 3 | | Total | |
Common Stocks | |
Taiwan | | $ | — | | | $ | 105,278,187 | | | $ | — | | | $ | 105,278,187 | | |
United Kingdom | | | 10,062,804 | | | | 263,106,801 | | | | 49,695 | | | | 273,219,300 | | |
United States | | | 37,184,378 | | | | — | | | | — | | | | 37,184,378 | | |
Total Common Stocks | | | 334,721,546 | | | | 1,738,826,768 | | | | 49,695 | | | | 2,073,598,009 | | |
Preferred Stocks | |
Brazil | | | 16,296,085 | | | | — | | | | — | | | | 16,296,085 | | |
Total | | $ | 351,017,631 | | | $ | 1,738,826,768 | | | $ | 49,695 | | | $ | 2,089,894,094 | | |
For the International Equity Fund, fair value of Level 3, Level 2 and Level 1 investments at December 31, 2016 was $52,739, $1,366,689,310 and $295,426,273, respectively. $14,399,961 was transferred out of Level 1 into Level 2 during the year ended December 31, 2017. Transfers into Level 2 and out of Level 1 resulted from foreign securities which were priced using inputs from a third-party vendor modeling tool to reflect any significant market movements between the time at which the Fund valued its securities and the earlier closing of foreign markets.
It is the Fund's policy to recognize transfers in and transfers out at the fair value as of the beginning of the period.
The following is a reconciliation of the Fund's Level 3 investments for which significant unobservable inputs were used in determining value:
Balance at December 31, 2016 | | $ | 52,739 | | |
Purchases | | | 126,596 | | |
Sales | | | (130,214 | ) | |
Realized gain (loss) | | | (31 | ) | |
Change in unrealized gain (loss) | | | 605 | | |
Transfers into Level 3 | | | — | | |
Transfers out of Level 3 | | | — | | |
Balance at December 31, 2017 | | $ | 49,695 | * | |
Change in unrealized gain (loss) related to Investments still held at December 31, 2017 | | $ | 924 | | |
* Value of the security based on the amount it was known that it would be redeemed at, due to halt in active market.
The Trust has made the determination to price these shares at their redemption value. As the fair value is based on management's own assumption, the Trust has determined this to be a level 3 security.
The accompanying notes are an integral part of the financial statements.
130
Statement of Assets and Liabilities
Annual Report December 31, 2017
December 31, 2017
Baillie Gifford International Equity Fund
ASSETS | |
Investments, at value (cost $1,201,438,126) | | $ | 2,089,894,094 | | |
Cash | | | 30,632,627 | | |
Dividends receivable | | | 1,106,505 | | |
Tax reclaims receivable | | | 2,605,603 | | |
Receivable for investments sold | | | 1,060,967 | | |
Prepaid assets | | | 32,442 | | |
Total Assets | | | 2,125,332,238 | | |
LIABILITIES | |
Advisory fee payable | | | 1,815,016 | | |
Due to Custodian | | | 51 | | |
Servicing fee payable | | | 559,105 | | |
Trustee fee payable | | | 23,801 | | |
Accrued expenses | | | 833,511 | | |
Total Liabilities | | | 3,231,484 | | |
NET ASSETS | | $ | 2,122,100,754 | | |
COMPOSITION OF NET ASSETS | |
Paid-in capital | | $ | 1,226,479,543 | | |
Distributions in excess of net investment income | | | (1,379,679 | ) | |
Accumulated net realized gain on investments and foreign currency transactions | | | 8,502,565 | | |
Net unrealized appreciation in value of investments and foreign currencies | | | 888,498,325 | | |
| | | $ | 2,122,100,754 | | |
NET ASSET VALUE, PER SHARE | |
| Class 2 ($478,079,220 / 33,674,872 shares outstanding), unlimited authorized, no par value | | $ | 14.20 | | |
| Class 3 ($1,119,162,461 / 77,865,768 shares outstanding), unlimited authorized, no par value | | $ | 14.37 | | |
| Class 4 ($232,741,034 / 15,948,399 shares outstanding), unlimited authorized, no par value | | $ | 14.59 | | |
| Class 5 ($183,384,095 / 12,371,800 shares outstanding), unlimited authorized, no par value | | $ | 14.82 | | |
| Class K ($108,728,032 / 7,671,676 shares outstanding), unlimited authorized, no par value | | $ | 14.17 | | |
| Institutional Class ($5,912 / 417 shares outstanding), unlimited authorized, no par value | | $ | 14.19 | * | |
* Net assets divided by shares does not recalculate using values rounded to the dollar.
The accompanying notes are an integral part of the financial statements.
131
Annual Report December 31, 2017
For the Year Ended December 31, 2017
Baillie Gifford International Equity Fund
INVESTMENT INCOME | |
Dividends (net of foreign withholding taxes of $4,024,977) | | $ | 36,566,852 | | |
Interest | | | 3,068 | | |
Total Investment Income | | | 36,569,920 | | |
EXPENSES | |
Advisory fee (Note B) | | | 6,751,475 | | |
Shareholder Servicing fees — Class 1 Shares (Note B) | | | 14,486 | | |
Shareholder Servicing fees — Class 2 Shares (Note B) | | | 960,575 | | |
Shareholder Servicing fees — Class 3 Shares (Note B) | | | 1,051,668 | | |
Shareholder Servicing fees — Class 4 Shares (Note B) | | | 73,531 | | |
Shareholder Servicing fees — Class 5 Shares (Note B) | | | 37,426 | | |
Administration & Supervisory Fee — Class K Shares (Note B) | | | 27,493 | | |
Administration & Supervisory Fee — Institutional Class Shares (Note B) | | | 6 | | |
Fund accounting | | | 917,143 | | |
Custody | | | 359,355 | | |
Legal | | | 301,560 | | |
Trustees' fees | | | 85,616 | | |
Transfer agency | | | 88,638 | | |
Professional fees | | | 30,859 | | |
Insurance | | | 14,043 | | |
Miscellaneous | | | 51,550 | | |
Total Expenses | | | 10,765,424 | | |
Net Investment Income | | | 25,804,496 | | |
REALIZED AND UNREALIZED GAIN (LOSS) ON INVESTMENTS
AND FOREIGN CURRENCY TRANSACTIONS | |
Net realized gain (loss) from: | |
Investments | | | 62,956,510 | | |
Foreign currency transactions | | | (119,060 | ) | |
| | | | 62,837,450 | | |
Net change in unrealized appreciation on: | |
Investments | | | 482,709,992 | | |
Translation of assets and liabilities denominated in foreign currencies | | | 227,757 | | |
| | | | 482,937,749 | | |
Net realized and unrealized gain on investments and foreign currency transactions | | | 545,775,199 | | |
NET INCREASE IN NET ASSETS FROM OPERATIONS | | $ | 571,579,695 | | |
The accompanying notes are an integral part of the financial statements.
132
Statements of Changes in Net Assets
Annual Report December 31, 2017
Baillie Gifford International Equity Fund
| | | For the
Year Ended
December 31,
2017 | | For the
Year Ended
December 31,
2016 | |
INCREASE (DECREASE) IN NET ASSETS FROM OPERATIONS | |
Net investment income | | $ | 25,804,496 | | | $ | 25,926,664 | | |
Net realized gain from investments and foreign currency transactions | | | 62,837,450 | | | | 12,881,122 | | |
Net change in unrealized appreciation on investments
and translation of assets and liabilities in foreign currencies | | | 482,937,749 | | | | 49,514,656 | | |
Net increase in net assets from operations | | | 571,579,695 | | | | 88,322,442 | | |
DIVIDENDS AND DISTRIBUTIONS TO SHAREHOLDERS FROM: | |
Net investment income: | |
Class 1 | | | — | | | | (261,202 | ) | |
Class 2 | | | (4,574,939 | ) | | | (7,965,059 | ) | |
Class 3 | | | (11,739,881 | ) | | | (13,740,642 | ) | |
Class 4 | | | (2,546,213 | ) | | | — | | |
Class 5 | | | (1,995,692 | ) | | | (2,749,424 | ) | |
Class K | | | (1,231,283 | ) | | | — | | |
Institutional Class | | | (62 | ) | | | — | | |
Capital gains: | |
Class 1 | | | — | | | | (284,619 | ) | |
Class 2 | | | (11,835,400 | ) | | | (8,835,185 | ) | |
Class 3 | | | (27,349,629 | ) | | | (12,242,254 | ) | |
Class 4 | | | (5,601,265 | ) | | | — | | |
Class 5 | | | (4,347,019 | ) | | | (2,333,843 | ) | |
Class K | | | (2,691,370 | ) | | | — | | |
Institutional Class | | | (146 | ) | | | — | | |
Total Dividends and Distributions | | | (73,912,899 | ) | | | (48,412,228 | ) | |
TRANSACTIONS IN SHARES OF BENEFICIAL INTEREST | |
Net proceeds from shares subscribed: | |
Class 1 | | | 1,497 | | | | 18,721,547 | | |
| Class 2* | | | 21,820,826 | | | | 197,471,010 | | |
Class 3 | | | 215,980,083 | | | | 314,718,178 | | |
Class 4 | | | 206,702,541 | | | | — | | |
Class 5 | | | 2,000,007 | | | | — | | |
Class K | | | 105,992,735 | | | | — | | |
Institutional Class | | | 5,000 | | | | — | | |
Purchase fees: | |
Class 1 | | | 129 | | | | 404 | | |
Class 2 | | | 3,746 | | | | 25,933 | | |
Class 3 | | | 5,862 | | | | 31,311 | | |
Class 5 | | | 1,085 | | | | 6,808 | | |
Redemption fees: | |
Class 1 | | | 206 | | | | 986 | | |
Class 2 | | | 5,976 | | | | 37,355 | | |
Class 3 | | | 9,457 | | | | 45,973 | | |
Class 5 | | | 1,728 | | | | 9,709 | | |
The accompanying notes are an integral part of the financial statements.
133
Statements of Changes in Net Assets
Annual Report December 31, 2017
| | | For the
Year Ended
December 31,
2017 | | For the
Year Ended
December 31,
2016 | |
Dividends reinvested: | |
Class 1 | | $ | — | | | $ | 545,821 | | |
Class 2 | | | 16,410,339 | | | | 16,800,244 | | |
Class 3 | | | 39,089,511 | | | | 25,982,896 | | |
Class 4 | | | 8,147,477 | | | | — | | |
Class 5 | | | 6,342,711 | | | | 5,083,267 | | |
Class K | | | 3,922,653 | | | | — | | |
Institutional Class | | | 208 | | | | — | | |
Cost of shares redeemed: | |
| Class 1* | | | (21,814,876 | ) | | | — | | |
Class 2 | | | (295,922,268 | ) | | | (363,708,396 | ) | |
Class 3 | | | (324,073,123 | ) | | | (216,391,115 | ) | |
Class 5 | | | (41,800,000 | ) | | | (17,199,199 | ) | |
Decrease in Net Assets from Transactions in Shares of Beneficial Interest | | | (57,166,490 | ) | | | (17,817,268 | ) | |
Total Increase in Net Assets | | | 440,500,306 | | | | 22,092,946 | | |
NET ASSETS | |
Beginning of year | | | 1,681,600,448 | | | | 1,659,507,502 | | |
End of year (including distributions in excess of net investment income of
$1,379,679 and $4,817,588, respectively) | | $ | 2,122,100,754 | | | $ | 1,681,600,448 | | |
| | | | | | |
* Class 1 shareholders were converted to Class 2 during the period. Please refer to Notes A and D.
The accompanying notes are an integral part of the financial statements.
134
Annual Report December 31, 2017
Baillie Gifford International Equity Fund
Selected data for a Class 2 Share outstanding throughout each year:
| | | For the
Year Ended
December 31,
2017 | | For the
Year Ended
December 31,
2016 | | For the
Year Ended
December 31,
2015 | | For the
Year Ended
December 31,
2014 | | For the
Year Ended
December 31,
2013 | |
Net asset value, beginning of year | | $ | 10.90 | | | $ | 10.65 | | | $ | 11.20 | | | $ | 11.79 | | | $ | 10.39 | | |
From Investment Operations | |
Net investment income(a) | | | 0.18 | | | | 0.17 | | | | 0.19 | | | | 0.18 | | | | 0.19 | | |
Net realized and unrealized gain (loss) on
investments and foreign currency transactions | | | 3.62 | | | | 0.39 | | | | (0.40 | ) | | | (0.52 | ) | | | 1.40 | | |
Net increase (decrease) in net asset value from
investment operations | | | 3.80 | | | | 0.56 | | | | (0.21 | ) | | | (0.34 | ) | | | 1.59 | | |
Dividends and Distributions to Shareholders | | | | | | | | | | | |
Dividends from net investment income | | | (0.14 | ) | | | (0.15 | ) | | | (0.24 | ) | | | (0.20 | ) | | | (0.19 | ) | |
Distributions from net realized gain on investments | | | (0.36 | ) | | | (0.16 | ) | | | (0.11 | ) | | | (0.05 | ) | | | — | | |
Total Dividends and Distributions | | | (0.50 | ) | | | (0.31 | ) | | | (0.35 | ) | | | (0.25 | ) | | | (0.19 | ) | |
Proceeds from Purchase Fees and
Redemption Fees(a) | | | 0.00 | (b) | | | 0.00 | (b) | | | 0.01 | | | | 0.00 | (b) | | | 0.00 | (b) | |
Net asset value, end of year | | $ | 14.20 | | | $ | 10.90 | | | $ | 10.65 | | | $ | 11.20 | | | $ | 11.79 | | |
Total Return | |
Total return based on net asset value(c) | | | 34.96 | % | | | 5.24 | % | | | (1.89 | )% | | | (2.93 | )% | | | 15.35 | % | |
Ratios/Supplemental Data | |
Net assets, end of year (000's omitted) | | $ | 478,079 | | | $ | 578,606 | | | $ | 708,666 | | | $ | 542,943 | | | $ | 637,144 | | |
Ratio of net expenses to average net assets | | | 0.61 | % | | | 0.61 | % | | | 0.62 | % | | | 0.61 | % | | | 0.61 | % | |
Ratio of net investment income to average net assets | | | 1.41 | % | | | 1.53 | % | | | 1.61 | % | | | 1.57 | % | | | 1.72 | % | |
Portfolio turnover rate(d) | | | 12 | % | | | 12 | % | | | 15 | % | | | 11 | % | | | 16 | % | |
(a) Calculated based upon average shares outstanding during the year.
(b) Amount is less than $0.005 per share.
(c) Total investment return is calculated assuming an initial investment made at the net asset value at the beginning of the period, reinvestment of all dividends and distributions, if any, at net asset value during the period, and redemption on the last day of the period. Total return is not annualized for periods less than one year.
(d) Portfolio turnover rate calculated at Fund level.
The accompanying notes are an integral part of the financial statements.
135
Annual Report December 31, 2017
Baillie Gifford International Equity Fund
Selected data for a Class 3 Share outstanding throughout each year:
| | | For the
Year Ended
December 31,
2017 | | For the
Year Ended
December 31,
2016 | | For the
Year Ended
December 31,
2015 | | For the
Year Ended
December 31,
2014 | | For the
Year Ended
December 31,
2013 | |
Net asset value, beginning of year | | $ | 11.03 | | | $ | 10.79 | | | $ | 11.34 | | | $ | 11.93 | | | $ | 10.52 | | |
From Investment Operations | |
Net investment income(a) | | | 0.18 | | | | 0.17 | | | | 0.20 | | | | 0.21 | | | | 0.19 | | |
Net realized and unrealized gain (loss) on
investments and foreign currency transactions | | | 3.68 | | | | 0.40 | | | | (0.41 | ) | | | (0.54 | ) | | | 1.42 | | |
Net increase (decrease) in net asset value from
investment operations | | | 3.86 | | | | 0.57 | | | | (0.21 | ) | | | (0.33 | ) | | | 1.61 | | |
Dividends and Distributions to Shareholders | | | | | | | | | | | |
Dividends from net investment income | | | (0.16 | ) | | | (0.17 | ) | | | (0.24 | ) | | | (0.21 | ) | | | (0.20 | ) | |
Distributions from net realized gain on investments | | | (0.36 | ) | | | (0.16 | ) | | | (0.11 | ) | | | (0.05 | ) | | | — | | |
Total Dividends and Distributions | | | (0.52 | ) | | | (0.33 | ) | | | (0.35 | ) | | | (0.26 | ) | | | (0.20 | ) | |
Proceeds from Purchase Fees and
Redemption Fees(a) | | | 0.00 | (b) | | | 0.00 | (b) | | | 0.01 | | | | 0.00 | (b) | | | 0.00 | (b) | |
Net asset value, end of year | | $ | 14.37 | | | $ | 11.03 | | | $ | 10.79 | | | $ | 11.34 | | | $ | 11.93 | | |
Total Return | |
Total return based on net asset value(c) | | | 35.05 | % | | | 5.31 | % | | | (1.82 | )% | | | (2.83 | )% | | | 15.34 | % | |
Ratios/Supplemental Data | |
Net assets, end of year (000's omitted) | | $ | 1,119,162 | | | $ | 915,782 | | | $ | 776,265 | | | $ | 1,078,665 | | | $ | 1,268,490 | | |
Ratio of net expenses to average net assets | | | 0.55 | % | | | 0.54 | % | | | 0.54 | % | | | 0.54 | % | | | 0.54 | % | |
Ratio of net investment income to average net assets | | | 1.35 | % | | | 1.54 | % | | | 1.69 | % | | | 1.76 | % | | | 1.75 | % | |
Portfolio turnover rate(d) | | | 12 | % | | | 12 | % | | | 15 | % | | | 11 | % | | | 16 | % | |
(a) Calculated based upon average shares outstanding during the year.
(b) Amount is less than $0.005 per share.
(c) Total investment return is calculated assuming an initial investment made at the net asset value at the beginning of the period, reinvestment of all dividends and distributions, if any, at net asset value during the period, and redemption on the last day of the period. Total return is not annualized for periods less than one year.
(d) Portfolio turnover rate calculated at Fund level.
The accompanying notes are an integral part of the financial statements.
136
Annual Report December 31, 2017
Baillie Gifford International Equity Fund
Selected data for a Class 4 Share outstanding throughout the period:
| | | For the Period
July 10, 2017(a)
through
December 31,
2017 | | For the Period
January 1, 2015(a)
through
December 10,
2015 | | For the
Year Ended
December 31,
2014 | | For the
Year Ended
December 31,
2013 | |
Net asset value, beginning of period | | $ | 13.43 | | | $ | 11.60 | | | $ | 12.20 | | | $ | 10.75 | | |
From Investment Operations | |
Net investment income(b) | | | 0.05 | | | | 0.19 | | | | 0.22 | | | | 0.20 | | |
Net realized and unrealized gain on investments and foreign
currency transactions | | | 1.64 | | | | (0.33 | ) | | | (0.57 | ) | | | 1.45 | | |
Net increase in net asset value from investment operations | | | 1.69 | | | | (0.14 | ) | | | (0.35 | ) | | | 1.65 | | |
Dividends and Distributions to Shareholders | | | | | | | | | |
Dividends from net investment income | | | (0.17 | ) | | | (0.01 | ) | | | (0.21 | ) | | | (0.20 | ) | |
Distributions from net realized gain on investments | | | (0.36 | ) | | | — | | | | (0.05 | ) | | | — | | |
Total Dividends and Distributions | | | (0.53 | ) | | | (0.01 | ) | | | (0.26 | ) | | | (0.20 | ) | |
Proceeds from Purchase Fees and Redemption Fees(b) | | | — | | | | 0.01 | | | | 0.01 | | | | 0.00 | (c) | |
Net asset value, end of period | | $ | 14.59 | | | $ | 11.46 | | | $ | 11.60 | | | $ | 12.20 | | |
Total Return | |
Total return based on net asset value(d) | | | 12.60 | % | | | (1.04 | )% | | | (2.82 | )% | | | 15.42 | % | |
Ratios/Supplemental Data | |
Net assets, end of period (000's omitted) | | $ | 232,741 | | | $ | 59 | | | $ | 352,890 | | | $ | 611,786 | | |
Ratio of net expenses to average net assets | | | 0.53 | %* | | | 0.52 | %* | | | 0.51 | % | | | 0.51 | % | |
Ratio of net investment income to average net assets | | | 0.77 | %* | | | 1.72 | %* | | | 1.82 | % | | | 1.77 | % | |
Portfolio turnover rate(e) | | | 12 | % | | | 15 | % | | | 11 | % | | | 16 | % | |
* Annualized.
(a) Commencement of investment operations.
(b) Calculated based upon average shares outstanding during the period.
(c) Amount is less than $0.005 per share.
(d) Total investment return is calculated assuming an initial investment made at the net asset value at the beginning of the period, reinvestment of all dividends and distributions, if any, at net asset value during the period, and redemption on the last day of the period. Total return is not annualized for periods less than one year.
(e) Portfolio turnover rate calculated at Fund level.
The accompanying notes are an integral part of the financial statements.
137
Annual Report December 31, 2017
Baillie Gifford International Equity Fund
Selected data for a Class 5 Share outstanding throughout each period:
| | | For the
Year Ended
December 31,
2017 | | For the
Year Ended
December 31,
2016 | | For the
Year Ended
December 31,
2015 | | For the Period
April 7, 2014(a)
through
December 31,
2014 | |
Net asset value, beginning of period | | $ | 11.36 | | | $ | 11.11 | | | $ | 11.67 | | | $ | 12.25 | | |
From Investment Operations | |
Net investment income(b) | | | 0.20 | | | | 0.19 | | | | 0.22 | | | | 0.15 | | |
Net realized and unrealized gain (loss) on investments and
foreign currency transactions | | | 3.79 | | | | 0.41 | | | | (0.42 | ) | | | (0.46 | ) | |
Net increase (decrease) in net asset value from
investment operations | | | 3.99 | | | | 0.60 | | | | (0.20 | ) | | | (0.31 | ) | |
Dividends and Distributions to Shareholders | | | | | | | | | |
Dividends from net investment income | | | (0.17 | ) | | | (0.19 | ) | | | (0.25 | ) | | | (0.22 | ) | |
Distributions from net realized gain on investments | | | (0.36 | ) | | | (0.16 | ) | | | (0.11 | ) | | | (0.05 | ) | |
Total Dividends and Distributions | | | (0.53 | ) | | | (0.35 | ) | | | (0.36 | ) | | | (0.27 | ) | |
Proceeds from Purchase Fees and
Redemption Fees(b) | | | 0.00 | (c) | | | 0.00 | (c) | | | 0.00 | (c) | | | 0.00 | (c) | |
Net asset value, end of period | | $ | 14.82 | | | $ | 11.36 | | | $ | 11.11 | | | $ | 11.67 | | |
Total Return | |
Total return based on net asset value(d) | | | 35.16 | % | | | 5.40 | % | | | (1.75 | )% | | | (2.60 | )% | |
Ratios/Supplemental Data | |
Net assets, end of period (000's omitted) | | $ | 183,384 | | | $ | 167,297 | | | $ | 174,577 | | | $ | 296,649 | | |
Ratio of net expenses to average net assets | | | 0.47 | % | | | 0.46 | % | | | 0.47 | % | | | 0.47 | %* | |
Ratio of net investment income to average net assets | | | 1.45 | % | | | 1.66 | % | | | 1.83 | % | | | 1.61 | %* | |
Portfolio turnover rate(e) | | | 12 | % | | | 12 | % | | | 15 | % | | | 11 | % | |
* Annualized.
(a) Commencement of investment operations.
(b) Calculated based upon average shares outstanding during the period.
(c) Amount is less than $0.005 per share.
(d) Total investment return is calculated assuming an initial investment made at the net asset value at the beginning of the period, reinvestment of all dividends and distributions, if any, at net asset value during the period, and redemption on the last day of the period. Total return is not annualized for periods less than one year.
(e) Portfolio turnover rate calculated at Fund level.
The accompanying notes are an integral part of the financial statements.
138
Annual Report December 31, 2017
Baillie Gifford International Equity Fund
Selected data for a Class K Share outstanding throughout the period:
| | | For the Period
April 28, 2017(a)
through
December 31,
2017 | |
Net asset value, beginning of period | | $ | 12.44 | | |
From Investment Operations | |
Net investment income(b) | | | 0.01 | | |
Net realized and unrealized gain on investments and foreign currency transactions | | | 2.25 | | |
Net increase in net asset value from investment operations | | | 2.26 | | |
Dividends and Distributions to Shareholders | |
Dividends from net investment income | | | (0.17 | ) | |
Distributions from net realized gain on investments | | | (0.36 | ) | |
Total Dividends and Distributions | | | (0.53 | ) | |
Net asset value, end of period | | $ | 14.17 | | |
Total Return | |
Total return based on net asset value(c) | | | 18.19 | % | |
Ratios/Supplemental Data | |
Net assets, end of period (000's omitted) | | $ | 108,728 | | |
Ratio of net expenses to average net assets | | | 0.63 | %* | |
Ratio of net investment income to average net assets | | | 0.12 | %* | |
Portfolio turnover rate(d) | | | 12 | % | |
* Annualized.
(a) Commencement of investment operations.
(b) Calculated based upon average shares outstanding during the period.
(c) Total investment return is calculated assuming an initial investment made at the net asset value at the beginning of the period, reinvestment of all dividends and distributions, if any, at net asset value during the period, and redemption on the last day of the period. Total return is not annualized for periods less than one year.
(d) Portfolio turnover rate calculated at Fund level.
The accompanying notes are an integral part of the financial statements.
139
Annual Report December 31, 2017
Baillie Gifford International Equity Fund
Selected data for an Institutional Class Share outstanding throughout the period:
| | | For the Period
April 28, 2017(a)
through
December 31, 2017 | |
Net asset value, beginning of period | | $ | 12.44 | | |
From Investment Operations | |
Net investment income(b) | | | 0.09 | | |
Net realized and unrealized gain on investments and foreign currency transactions | | | 2.17 | | |
Net increase in net asset value from investment operations | | | 2.26 | | |
Dividends and Distributions to Shareholders | |
Dividends from net investment income | | | (0.15 | ) | |
Distributions from net realized gain on investments | | | (0.36 | ) | |
Total Dividends and Distributions | | | (0.51 | ) | |
Net asset value, end of period | | $ | 14.19 | | |
Total Return | |
Total return based on net asset value(c) | | | 18.25 | % | |
Ratios/Supplemental Data | |
Net assets, end of period (000's omitted) | | $ | 6 | | |
Ratio of net expenses to average net assets | | | 0.62 | %* | |
Ratio of net investment income to average net assets | | | 1.01 | %* | |
Portfolio turnover rate(d) | | | 12 | % | |
* Annualized.
(a) Commencement of investment operations.
(b) Calculated based upon average shares outstanding during the period.
(c) Total investment return is calculated assuming an initial investment made at the net asset value at the beginning of the period, reinvestment of all dividends and distributions, if any, at net asset value during the period, and redemption on the last day of the period. Total return is not annualized for periods less than one year.
(d) Portfolio turnover rate calculated at Fund level.
The accompanying notes are an integral part of the financial statements.
140
Industry Diversification Table
Annual Report December 31, 2017
December 31, 2017
Baillie Gifford Long Term Global Growth Equity Fund
| | | Value | | % of Total
Net Assets | |
Apparel Retailers | | $ | 6,221,662 | | | | 3.3 | % | |
Automobiles & Parts | | | 11,200,194 | | | | 5.9 | | |
Biotechnology | | | 4,301,821 | | | | 2.3 | | |
Broadline Retailers | | | 9,014,870 | | | | 4.7 | | |
Clothing & Accessories | | | 4,928,344 | | | | 2.6 | | |
General Retailers | | | 22,132,457 | | | | 11.7 | | |
Health Care Equipment and Supplies | | | 1,745,402 | | | | 0.9 | | |
Hotels Restaurants and Leisure | | | 3,903,159 | | | | 2.1 | | |
Industrial Machinery | | | 2,713,827 | | | | 1.4 | | |
Internet Software & Services | | | 52,007,462 | | | | 27.4 | | |
Life Insurance | | | 3,381,846 | | | | 1.8 | | |
Medical Equipment | | | 6,076,251 | | | | 3.2 | | |
Personal Products | | | 2,216,245 | | | | 1.2 | | |
Pharmaceuticals, Biotechnology & Life Sciences | | | 18,891,054 | | | | 10.0 | | |
Software | | | 10,768,108 | | | | 5.7 | | |
Specialized Consumer Services | | | 12,733,093 | | | | 6.7 | | |
Technology Hardware & Equipment | | | 13,502,981 | | | | 7.2 | | |
Total Value of Investments | | | 185,738,776 | | | | 98.1 | | |
Other assets less liabilities | | | 3,577,577 | | | | 1.9 | | |
Net Assets | | $ | 189,316,353 | | | | 100.0 | % | |
141
Annual Report December 31, 2017
December 31, 2017
Baillie Gifford Long Term Global Growth Equity Fund
| | | Shares | | Value | |
COMMON STOCKS — 98.1% | |
AUSTRALIA — 1.2% | |
Atlassian Corp. PLC, Class A (a) | | | 50,761 | | | $ | 2,310,641 | | |
CHINA — 25.1% | |
Alibaba Group Holding Ltd. ADR (a) | | | 73,845 | | | | 12,733,093 | | |
Baidu, Inc. ADR (a) | | | 39,041 | | | | 9,143,793 | | |
Ctrip.com International Ltd. ADR (a) | | | 88,507 | | | | 3,903,159 | | |
NetEase, Inc. | | | 14,250 | | | | 4,917,247 | | |
Tencent Holdings Ltd. | | | 325,300 | | | | 16,836,863 | | |
| | | | | | 47,534,155 | | |
FRANCE — 7.6% | |
Hermes International | | | 5,989 | | | | 3,203,945 | | |
Kering | | | 19,151 | | | | 9,014,870 | | |
L'Oreal SA | | | 10,002 | | | | 2,216,245 | | |
| | | | | | 14,435,060 | | |
GERMANY — 0.8% | |
Rocket Internet SE 144A (a)(b) | | | 61,819 | | | | 1,558,539 | | |
HONG KONG — 1.8% | |
AIA Group Ltd. | | | 397,600 | | | | 3,381,846 | | |
NETHERLANDS — 3.1% | |
| ASML Holding NV | | | 33,161 | | | | 5,765,303 | | |
SPAIN — 3.3% | |
Inditex SA | | | 178,929 | | | | 6,221,662 | | |
SWEDEN — 1.4% | |
Atlas Copco AB, A Shares | | | 62,884 | | | | 2,713,827 | | |
UNITED STATES — 53.8% | |
Alphabet, Inc., Class C (a) | | | 7,338 | | | | 7,678,483 | | |
Amazon.com, Inc. (a) | | | 14,115 | | | | 16,507,069 | | |
Bluebird Bio, Inc. (a) | | | 23,378 | | | | 4,163,622 | | |
DexCom, Inc. (a) | | | 30,413 | | | | 1,745,402 | | |
Facebook, Inc., Class A (a) | | | 76,114 | | | | 13,431,076 | | |
The accompanying notes are an integral part of the financial statements.
142
Annual Report December 31, 2017
December 31, 2017
Baillie Gifford Long Term Global Growth Equity Fund
| | | Shares | | Value | |
Illumina, Inc. (a) | | | 56,349 | | | $ | 12,311,693 | | |
Intuitive Surgical, Inc. (a) | | | 16,650 | | | | 6,076,251 | | |
Ionis Pharmaceuticals, Inc. (a) | | | 37,167 | | | | 1,869,500 | | |
Juno Therapeutics, Inc. (a) | | | 53,212 | | | | 2,432,321 | | |
Netflix, Inc. (a) | | | 29,305 | | | | 5,625,388 | | |
NVIDIA Corp. | | | 39,988 | | | | 7,737,678 | | |
salesforce.com, Inc. (a) | | | 33,095 | | | | 3,383,302 | | |
Seattle Genetics, Inc. (a) | | | 45,154 | | | | 2,415,739 | | |
Tesla, Inc. (a) | | | 35,973 | | | | 11,200,194 | | |
Under Armour, Inc., Class A (a) | | | 119,501 | | | | 1,724,399 | | |
Workday, Inc., Class A (a) | | | 34,555 | | | | 3,515,626 | | |
| | | | | | 101,817,743 | | |
TOTAL INVESTMENTS — 98.1% | |
(cost $135,450,604) | | | | $ | 185,738,776 | | |
Other assets less liabilities — 1.9% | | | | | 3,577,577 | | |
NET ASSETS — 100.0% | | | | $ | 189,316,353 | | |
(a) Non-income producing security.
(b) 144A — Securities are exempt from registration under Rule 144A of the Securities Act of 1933, as amended. These securities may be resold in transactions exempt from registration, normally to qualified institutional buyers. Prices are obtained daily from the London International Stock Exchange; therefore, fair valuation is typically not required. At December 31, 2017, the net value of these securities was $1,558,539 representing 0.8% of net assets.
ADR — American Depositary Receipt.
The accompanying notes are an integral part of the financial statements.
143
Annual Report December 31, 2017
December 31, 2017
Baillie Gifford Long Term Global Growth Equity Fund
Fair Value Measurement
The following is a summary of the inputs used as of December 31, 2017 in valuing the Fund's investments carried at fair value:
Investments in Securities | | Level 1 | | Level 2 | | Level 3 | | Total | |
Common Stocks | |
Australia | | $ | 2,310,641 | | | $ | — | | | $ | — | | | $ | 2,310,641 | | |
China | | | 30,697,292 | | | | 16,836,863 | | | | — | | | | 47,534,155 | | |
France | | | — | | | | 14,435,060 | | | | — | | | | 14,435,060 | | |
Germany | | | — | | | | 1,558,539 | | | | — | | | | 1,558,539 | | |
Hong Kong | | | — | | | | 3,381,846 | | | | — | | | | 3,381,846 | | |
Netherlands | | | — | | | | 5,765,303 | | | | — | | | | 5,765,303 | | |
Spain | | | — | | | | 6,221,662 | | | | — | | | | 6,221,662 | | |
Sweden | | | — | | | | 2,713,827 | | | | — | | | | 2,713,827 | | |
United States | | | 101,817,743 | | | | — | | | | — | | | | 101,817,743 | | |
Total | | $ | 134,825,676 | | | $ | 50,913,100 | | | $ | — | | | $ | 185,738,776 | | |
There were no transfers between levels for the year ending December 31, 2017.
It is the Fund's policy to recognize transfers in and transfers out at the fair value as of the beginning of the period.
The accompanying notes are an integral part of the financial statements.
144
Statement of Assets and Liabilities
Annual Report December 31, 2017
December 31, 2017
Baillie Gifford Long Term Global Growth Equity Fund
ASSETS | |
Investments, at value (cost $135,450,604) | | $ | 185,738,776 | | |
Cash | | | 3,885,875 | | |
Dividends receivable | | | 1,363 | | |
Tax reclaims receivable | | | 14,855 | | |
Prepaid assets | | | 30,537 | | |
Total Assets | | | 189,671,406 | | |
LIABILITIES | |
Advisory fee payable | | | 160,911 | | |
Servicing fee payable | | | 68,014 | | |
Trustee fee payable | | | 2,250 | | |
Accrued expenses | | | 123,878 | | |
Total Liabilities | | | 355,053 | | |
NET ASSETS | | $ | 189,316,353 | | |
COMPOSITION OF NET ASSETS | |
Paid-in capital | | $ | 135,408,472 | | |
Accumulated net investment loss | | | (125,327 | ) | |
Accumulated net realized gain on investments and foreign currency transactions | | | 3,743,672 | | |
Net unrealized appreciation in value of investments and foreign currencies | | | 50,289,536 | | |
| | | $ | 189,316,353 | | |
NET ASSET VALUE, PER SHARE | |
| Class 2 ($59,869,525 / 3,453,855 shares outstanding), unlimited authorized, no par value | | $ | 17.33 | | |
| Class 4 ($58,802,116 / 2,941,772 shares outstanding), unlimited authorized, no par value | | $ | 19.99 | | |
| Class K ($70,638,501 / 4,073,618 shares outstanding), unlimited authorized, no par value | | $ | 17.34 | | |
| Institutional Class ($6,211 / 358 shares outstanding), unlimited authorized, no par value | | $ | 17.34 | | |
The accompanying notes are an integral part of the financial statements.
145
Annual Report December 31, 2017
For the Year Ended December 31, 2017
Baillie Gifford Long Term Global Growth Equity Fund
INVESTMENT INCOME | |
Dividends (net of foreign withholding taxes of $40,201) | | $ | 308,858 | | |
Interest | | | 191 | | |
Total Investment Income | | | 309,049 | | |
EXPENSES | |
Advisory fee (Note B) | | | 574,302 | | |
Shareholder Servicing fees — Class 1 Shares (Note B) | | | 8,302 | | |
Shareholder Servicing fees — Class 2 Shares (Note B) | | | 91,191 | | |
Shareholder Servicing fees — Class 4 Shares (Note B) | | | 33,477 | | |
Administration & Supervisory Fee — Class K Shares (Note B) | | | 38,814 | | |
Administration & Supervisory Fee — Institutional Class Shares (Note B) | | | 7 | | |
Fund accounting | | | 91,327 | | |
Transfer agency | | | 58,111 | | |
Professional fees | | | 29,981 | | |
Custody | | | 16,340 | | |
Legal | | | 28,813 | | |
Trustees' fees | | | 6,229 | | |
Insurance | | | 736 | | |
Miscellaneous | | | 18,031 | | |
Total Expenses | | | 995,661 | | |
Fees waived | | | (58,131 | ) | |
Net Expenses | | | 937,530 | | |
Net Investment Loss | | | (628,481 | ) | |
REALIZED AND UNREALIZED GAIN (LOSS) ON INVESTMENTS
AND FOREIGN CURRENCY TRANSACTIONS | |
Net realized gain (loss) from: | |
Investments | | | 4,833,627 | | |
Foreign currency transactions | | | (41,518 | ) | |
| | | | 4,792,109 | | |
Net change in unrealized appreciation on: | |
Investments | | | 42,970,362 | | |
Translation of assets and liabilities denominated in foreign currencies | | | 2,695 | | |
| | | | 42,973,057 | | |
Net realized and unrealized gain on investments and foreign currency transactions | | | 47,765,166 | | |
NET INCREASE IN NET ASSETS FROM OPERATIONS | | $ | 47,136,685 | | |
The accompanying notes are an integral part of the financial statements.
146
Statements of Changes in Net Assets
Annual Report December 31, 2017
Baillie Gifford Long Term Global Growth Equity Fund
| | | For the
Year Ended
December 31,
2017 | | For the
Year Ended
December 31,
2016 | |
INCREASE (DECREASE) IN NET ASSETS FROM OPERATIONS | |
Net investment loss | | $ | (628,481 | ) | | $ | (328,739 | ) | |
Net realized gain (loss) on investments and foreign currency transactions | | | 4,792,109 | | | | (1,141,117 | ) | |
Net change in unrealized appreciation (depreciation) on investments
and translation of assets and liabilities in foreign currencies | | | 42,973,057 | | | | (1,321,667 | ) | |
Net increase (decrease) in net assets from operations | | | 47,136,685 | | | | (2,791,523 | ) | |
DIVIDENDS AND DISTRIBUTIONS TO SHAREHOLDERS FROM: | |
Capital gains: | |
Class 1 | | | — | | | | (68,401 | ) | |
Class 2 | | | — | | | | (193,711 | ) | |
Class 4 | | | — | | | | (216,535 | ) | |
Total Dividends and Distributions | | | — | | | | (478,647 | ) | |
TRANSACTIONS IN SHARES OF BENEFICIAL INTEREST | |
Net proceeds from shares subscribed: | |
Class 1 | | | 19,028 | | | | 1,066,932 | | |
| Class 2* | | | 12,925,524 | | | | — | | |
Class 4 | | | 10,989,000 | | | | — | | |
Class K | | | 66,005,000 | | | | — | | |
Institutional Class | | | 5,000 | | | | — | | |
Purchase fees: | |
Class 1 | | | 1,663 | | | | 141 | | |
Class 2 | | | 4,974 | | | | 425 | | |
Class 4 | | | 4,405 | | | | 502 | | |
Redemption fees: | |
Class 1 | | | — | | | | 2,214 | | |
Class 2 | | | — | | | | 6,897 | | |
Class 4 | | | — | | | | 6,965 | | |
Dividends reinvested: | |
Class 1 | | | — | | | | 68,401 | | |
Class 2 | | | — | | | | 193,711 | | |
Class 4 | | | — | | | | 216,535 | | |
Cost of shares redeemed: | |
| Class 1* | | | (12,790,797 | ) | | | — | | |
Class 2 | | | (7,000,025 | ) | | | (2,502,502 | ) | |
Class 4 | | | (22 | ) | | | (13,573,574 | ) | |
Increase (Decrease) in Net Assets from Transactions in Shares of Beneficial Interest | | | 70,163,750 | | | | (14,513,353 | ) | |
Total Increase (Decrease) in Net Assets | | | 117,300,435 | | | | (17,783,523 | ) | |
NET ASSETS | |
Beginning of year | | | 72,015,918 | | | | 89,799,441 | | |
End of year (including accumulated net investment loss of $125,327 and $—, respectively) | | $ | 189,316,353 | | | $ | 72,015,918 | | |
* Class 1 shareholders were converted to Class 2 during the period. Please refer to Notes A and D.
The accompanying notes are an integral part of the financial statements.
147
Annual Report December 31, 2017
Baillie Gifford Long Term Global Growth Equity Fund
Selected data for a Class 2 Share outstanding throughout each period:
| | | For the
Year Ended
December 31,
2017 | | For the
Year Ended
December 31,
2016 | | For the
Year Ended
December 31,
2015 | | For the Period
June 10, 2014(a)
through
December 31,
2014 | |
Net asset value, beginning of period | | $ | 11.25 | | | $ | 11.76 | | | $ | 10.43 | | | $ | 10.00 | | |
From Investment Operations | |
Net investment loss(b) | | | (0.08 | ) | | | (0.05 | ) | | | (0.04 | ) | | | (0.03 | ) | |
Net realized and unrealized gain (loss) on investments and
foreign currency transactions | | | 6.16 | | | | (0.39 | ) | | | 1.47 | | | | 0.47 | | |
Net increase (decrease) in net asset value from
investment operations | | | 6.08 | | | | (0.44 | ) | | | 1.43 | | | | 0.44 | | |
Dividends and Distributions to Shareholders | | | | | | | | | |
Distributions from net realized gain on investments | | | — | | | | (0.07 | ) | | | (0.12 | ) | | | (0.01 | ) | |
Total Dividends and Distributions | | | — | | | | (0.07 | ) | | | (0.12 | ) | | | (0.01 | ) | |
Proceeds from Purchase Fees and
Redemption Fees(b) | | | 0.00 | (c) | | | 0.00 | (c) | | | 0.02 | | | | — | | |
Net asset value, end of period | | $ | 17.33 | | | $ | 11.25 | | | $ | 11.76 | | | $ | 10.43 | | |
Total Return | |
Total return based on net asset value(d) | | | 54.07 | % | | | (3.80 | )% | | | 13.99 | % | | | 4.39 | % | |
Ratios/Supplemental Data | |
Net assets, end of period (000's omitted) | | $ | 59,870 | | | $ | 32,434 | | | $ | 36,177 | | | $ | 26,095 | | |
Ratio of net expenses to average net assets, before waiver | | | 0.82 | % | | | 0.87 | % | | | 0.91 | % | | | 0.88 | %* | |
Ratio of net expenses to average net assets, after waiver | | | 0.77 | % | | | 0.77 | % | | | 0.77 | % | | | 0.80 | %* | |
Ratio of net investment loss to average net assets | | | (0.50 | )% | | | (0.43 | )% | | | (0.34 | )% | | | (0.57 | )%* | |
Portfolio turnover rate(e) | | | 13 | % | | | 15 | % | | | 10 | % | | | 8 | % | |
* Annualized.
(a) Commencement of investment operations.
(b) Calculated based upon average shares outstanding during the period.
(c) Amount is less than $0.005 per share.
(d) Total investment return is calculated assuming an initial investment made at the net asset value at the beginning of the period, reinvestment of all dividends and distributions, if any, at net asset value during the period, and redemption on the last day of the period. Total return is not annualized for periods less than one year.
(e) Portfolio turnover rate calculated at Fund level.
The accompanying notes are an integral part of the financial statements.
148
Annual Report December 31, 2017
Baillie Gifford Long Term Global Growth Equity Fund
Selected data for a Class 4 Share outstanding throughout each period:
| | | For the
Year Ended
December 31,
2017 | | For the
Year Ended
December 31,
2016 | | For the Period
October 7, 2015(a)
through
December 31,
2015 | |
Net asset value, beginning of period | | $ | 12.96 | | | $ | 13.53 | | | $ | 12.22 | | |
From Investment Operations | |
Net investment loss(b) | | | (0.07 | ) | | | (0.04 | ) | | | (0.01 | ) | |
Net realized and unrealized gain (loss) on investments and foreign currency
transactions | | | 7.10 | | | | (0.46 | ) | | | 1.39 | | |
Net increase (decrease) in net asset value from investment operations | | | 7.03 | | | | (0.50 | ) | | | 1.38 | | |
Dividends and Distributions to Shareholders | | | | | | | |
Distributions from net realized gain on investments | | | — | | | | (0.07 | ) | | | (0.08 | ) | |
Total Dividends and Distributions | | | — | | | | (0.07 | ) | | | (0.08 | ) | |
Proceeds from Purchase Fees and Redemption Fees(b) | | | 0.00 | (c) | | | 0.00 | (c) | | | 0.01 | | |
Net asset value, end of period | | $ | 19.99 | | | $ | 12.96 | | | $ | 13.53 | | |
Total Return | |
Total return based on net asset value(d) | | | 54.22 | % | | | (3.71 | )% | | | 11.31 | % | |
Ratios/Supplemental Data | |
Net assets, end of period (000's omitted) | | $ | 58,802 | | | $ | 28,722 | | | $ | 43,344 | | |
Ratio of net expenses to average net assets, before waiver | | | 0.72 | % | | | 0.76 | % | | | 0.75 | %* | |
Ratio of net expenses to average net assets, after waiver | | | 0.67 | % | | | 0.67 | % | | | 0.67 | %* | |
Ratio of net investment loss to average net assets | | | (0.41 | )% | | | (0.33 | )% | | | (0.39 | )%* | |
Portfolio turnover rate(e) | | | 13 | % | | | 15 | % | | | 10 | % | |
* Annualized.
(a) Commencement of investment operations.
(b) Calculated based upon average shares outstanding during the period.
(c) Amount is less than $0.005 per share.
(d) Total investment return is calculated assuming an initial investment made at the net asset value at the beginning of the period, reinvestment of all dividends and distributions, if any, at net asset value during the period, and redemption on the last day of the period. Total return is not annualized for periods less than one year.
(e) Portfolio turnover rate calculated at Fund level.
The accompanying notes are an integral part of the financial statements.
149
Annual Report December 31, 2017
Baillie Gifford Long Term Global Growth Equity Fund
Selected data for a Class K Share outstanding throughout the period:
| | | For the Period
April 28, 2017(a)
through
December 31, 2017 | |
Net asset value, beginning of period | | $ | 13.96 | | |
From Investment Operations | |
Net investment loss(b) | | | (0.07 | ) | |
Net realized and unrealized gain on investments and foreign currency transactions | | | 3.45 | | |
Net increase in net asset value from investment operations | | | 3.38 | | |
Net asset value, end of period | | $ | 17.34 | | |
Total Return | |
Total return based on net asset value(c) | | | 24.21 | % | |
Ratios/Supplemental Data | |
Net assets, end of period (000's omitted) | | $ | 70,639 | | |
Ratio of net expenses to average net assets, before waiver | | | 0.80 | %* | |
Ratio of net expenses to average net assets, after waiver | | | 0.77 | %* | |
Ratio of net investment loss to average net assets | | | (0.61 | )%* | |
Portfolio turnover rate(d) | | | 13 | % | |
* Annualized.
(a) Commencement of investment operations.
(b) Calculated based upon average shares outstanding during the period.
(c) Total investment return is calculated assuming an initial investment made at the net asset value at the beginning of the period, reinvestment of all dividends and distributions, if any, at net asset value during the period, and redemption on the last day of the period. Total return is not annualized for periods less than one year.
(d) Portfolio turnover rate calculated at Fund level.
The accompanying notes are an integral part of the financial statements.
150
Annual Report December 31, 2017
Baillie Gifford Long Term Global Growth Equity Fund
Selected data for an Institutional Class Share outstanding throughout the period:
| | | For the Period
April 28, 2017(a)
through
December 31, 2017 | |
Net asset value, beginning of period | | $ | 13.96 | | |
From Investment Operations | |
Net investment loss(b) | | | (0.06 | ) | |
Net realized and unrealized gain on investments and foreign currency transactions | | | 3.44 | | |
Net increase in net asset value from investment operations | | | 3.38 | | |
Net asset value, end of period | | $ | 17.34 | | |
Total Return | |
Total return based on net asset value(c) | | | 24.21 | % | |
Ratios/Supplemental Data | |
Net assets, end of period (000's omitted) | | $ | 6 | | |
Ratio of net expenses to average net assets, before waiver | | | 0.80 | %* | |
Ratio of net expenses to average net assets, after waiver | | | 0.80 | %* | |
Ratio of net investment loss to average net assets | | | (0.56 | )%* | |
Portfolio turnover rate(d) | | | 13 | % | |
* Annualized.
(a) Commencement of investment operations.
(b) Calculated based upon average shares outstanding during the period.
(c) Total investment return is calculated assuming an initial investment made at the net asset value at the beginning of the period, reinvestment of all dividends and distributions, if any, at net asset value during the period, and redemption on the last day of the period. Total return is not annualized for periods less than one year.
(d) Portfolio turnover rate calculated at Fund level.
The accompanying notes are an integral part of the financial statements.
151
Industry Diversification Table
Annual Report December 31, 2017
December 31, 2017
Baillie Gifford Positive Change Equity Fund
| | | Value | | % of Total
Net Assets | |
Automobiles & Parts | | $ | 51,061 | | | | 5.0 | % | |
Banks | | | 46,521 | | | | 4.6 | | |
Chemicals | | | 75,116 | | | | 7.4 | | |
Construction & Materials | | | 73,345 | | | | 7.2 | | |
Electric Utilities | | | 20,034 | | | | 2.0 | | |
Electrical Equipment | | | 20,172 | | | | 2.0 | | |
Food Producers & Processors | | | 11,211 | | | | 1.1 | | |
Health Care Equipment, Supplies & Services | | | 94,826 | | | | 9.4 | | |
Industrial Engineering — Machinery | | | 39,624 | | | | 3.9 | | |
Internet, Software & Services | | | 88,718 | | | | 8.7 | | |
Life Insurance | | | 36,508 | | | | 3.6 | | |
Media | | | 42,065 | | | | 4.1 | | |
Medical Equipment | | | 39,260 | | | | 3.9 | | |
Mobile Telecommunications | | | 6,120 | | | | 0.6 | | |
Personal Products | | | 22,797 | | | | 2.2 | | |
Pharmaceuticals & Biotechnology | | | 214,477 | | | | 21.1 | | |
Semiconductors | | | 59,317 | | | | 5.8 | | |
Technology Hardware & Equipment | | | 50,071 | | | | 4.9 | | |
Total Value of Investments | | | 991,243 | | | | 97.5 | | |
Other assets less liabilities | | | 25,122 | | | | 2.5 | | |
Net Assets | | $ | 1,016,365 | | | | 100.0 | % | |
152
Annual Report December 31, 2017
December 31, 2016
Baillie Gifford Positive Change Equity Fund
| | | Shares | | Value | |
COMMON STOCKS — 97.5% | |
BELGIUM — 4.8% | |
Umicore SA | | | 1,031 | | | $ | 48,817 | | |
CHINA — 4.6% | |
Tencent Holdings Ltd. | | | 900 | | | | 46,582 | | |
DENMARK — 13.1% | |
Chr. Hansen Holding A/S | | | 606 | | | | 56,843 | | |
Novozymes A/S, B Shares | | | 985 | | | | 56,231 | | |
Orsted A/S 144A (a) | | | 367 | | | | 20,034 | | |
| | | | | | 133,108 | | |
INDONESIA — 4.6% | |
Bank Rakyat Indonesia Persero Tbk PT | | | 173,400 | | | | 46,521 | | |
IRELAND — 4.4% | |
Kingspan Group PLC | | | 1,014 | | | | 44,431 | | |
JAPAN — 11.3% | |
euglena Co., Ltd. (b) | | | 1,200 | | | | 11,211 | | |
M3, Inc. | | | 1,200 | | | | 42,065 | | |
Pigeon Corp. | | | 600 | | | | 22,797 | | |
Sysmex Corp. | | | 500 | | | | 39,260 | | |
| | | | | | 115,333 | | |
KENYA — 0.6% | |
Safaricom, Ltd. | | | 23,600 | | | | 6,120 | | |
NETHERLANDS — 6.9% | |
| ASML Holding NV | | | 288 | | | | 50,071 | | |
Philips Lighting NV 144A (a) | | | 550 | | | | 20,172 | | |
| | | | | | 70,243 | | |
SOUTH AFRICA — 3.6% | |
Discovery Ltd. | | | 2,428 | | | | 36,508 | | |
SWEDEN — 2.8% | |
Nibe Industrier AB B Shares | | | 3,018 | | | | 28,914 | | |
The accompanying notes are an integral part of the financial statements.
153
Annual Report December 31, 2017
December 31, 2017
Baillie Gifford Positive Change Equity Fund
| | | Shares | | Value | |
TAIWAN — 5.8% | |
Taiwan Semiconductor Manufacturing Co., Ltd. ADR | | | 1,496 | | | $ | 59,317 | | |
UNITED STATES — 35.0% | |
ABIOMED, Inc. (b) | | | 266 | | | | 49,851 | | |
Alnylam Pharmaceuticals, Inc. (b) | | | 351 | | | | 44,595 | | |
Alphabet, Inc., Class A (b) | | | 40 | | | | 42,136 | | |
DexCom, Inc. (b) | | | 545 | | | | 31,278 | | |
Ecolab, Inc. | | | 196 | | | | 26,299 | | |
Glaukos Corp. (b) | | | 534 | | | | 13,697 | | |
Illumina, Inc. (b) | | | 260 | | | | 56,808 | | |
Tesla, Inc. (b) | | | 164 | | | | 51,061 | | |
Xylem, Inc. | | | 581 | | | | 39,624 | | |
| | | | | | 355,349 | | |
TOTAL INVESTMENTS — 97.5% | |
(cost $974,533) | | | | $ | 991,243 | | |
Other assets less liabilities — 2.5% | | | | | 25,122 | | |
NET ASSETS — 100.0% | | | | $ | 1,016,365 | | |
(a) 144A — Securities are exempt from registration under Rule 144A of the Securities Act of 1933, as amended. These securities may be resold in transactions exempt from registration, normally to qualified institutional buyers. Prices are obtained daily from the London International Stock Exchange; therefore, fair valuation is typically not required. At December 31, 2017, the net value of these securities was $40,206 representing 4.0% of net assets.
(b) Non-income producing security.
ADR — American Depositary Receipt.
The accompanying notes are an integral part of the financial statements.
154
Annual Report December 31, 2017
December 31, 2017
Baillie Gifford Positive Change Equity Fund
Fair Value Measurement
The following is a summary of the inputs used as of December 31, 2017 in valuing the Fund's investments carried at fair value:
Investments in Securities | | Level 1 | | Level 2 | | Level 3 | | Total | |
Common Stocks | |
Belgium | | $ | — | | | $ | 48,817 | | | $ | — | | | $ | 48,817 | | |
China | | | — | | | | 46,582 | | | | — | | | | 46,582 | | |
Denmark | | | 76,877 | | | | 56,231 | | | | — | | | | 133,108 | | |
Indonesia | | | 46,521 | | | | — | | | | — | | | | 46,521 | | |
Ireland | | | — | | | | 44,431 | | | | — | | | | 44,431 | | |
Japan | | | — | | | | 115,333 | | | | — | | | | 115,333 | | |
Kenya | | | 6,120 | | | | — | | | | — | | | | 6,120 | | |
Netherlands | | | — | | | | 70,243 | | | | — | | | | 70,243 | | |
South Africa | | | — | | | | 36,508 | | | | — | | | | 36,508 | | |
Sweden | | | — | | | | 28,914 | | | | — | | | | 28,914 | | |
Taiwan | | | 59,317 | | | | — | | | | — | | | | 59,317 | | |
United States | | | 355,349 | | | | — | | | | — | | | | 355,349 | | |
Total | | $ | 544,184 | | | $ | 447,059 | | | $ | — | | | $ | 991,243 | | |
There were no transfers between levels for the period ended December 31, 2017.
It is the Fund's policy to recognize transfers in and transfers out at the fair value as of the beginning of the period.
The accompanying notes are an integral part of the financial statements.
155
Statement of Assets and Liabilities
Annual Report December 31, 2017
December 31, 2017
Baillie Gifford Positive Change Equity Fund
ASSETS | |
Investments, at value (cost $974,533) | | $ | 991,243 | | |
Cash | | | 25,330 | | |
Due from Investment Advisor | | | 23,068 | | |
Dividends receivable | | | 80 | | |
Total Assets | | | 1,039,721 | | |
LIABILITIES | |
Servicing fee payable | | | 75 | | |
Trustee fee payable | | | 12 | | |
Accrued expenses | | | 23,269 | | |
Total Liabilities | | | 23,356 | | |
NET ASSETS | | $ | 1,016,365 | | |
COMPOSITION OF NET ASSETS | |
Paid-in capital | | $ | 999,793 | | |
Accumulated net investment loss | | | (138 | ) | |
Accumulated net realized loss on investments and foreign currency transactions | | | — | | |
Net unrealized appreciation in value of investments and foreign currencies | | | 16,710 | | |
| | | $ | 1,016,365 | | |
NET ASSET VALUE, PER SHARE | |
| Class K ($508,183 / 50,000 shares outstanding), unlimited authorized, no par value | | $ | 10.16 | | |
| Institutional Class ($508,182 / 50,000 shares outstanding), unlimited authorized, no par value | | $ | 10.16 | | |
The accompanying notes are an integral part of the financial statements.
156
Annual Report December 31, 2017
For the Period December 14, 2017(a) through December 31, 2017
Baillie Gifford Positive Change Equity Fund
INVESTMENT INCOME | |
Dividends | | $ | 80 | | |
Total Investment Income | | | 80 | | |
EXPENSES | |
Advisory fee (Note B) | | | 146 | | |
Administration & Supervisory Fee — Class K Shares (Note B) | | | 38 | | |
Administration & Supervisory Fee — Institutional Class Shares (Note B) | | | 37 | | |
Professional fees | | | 20,267 | | |
Custody | | | 500 | | |
Fund accounting | | | 5 | | |
Transfer agency | | | 2,384 | | |
Legal | | | 54 | | |
Trustees' fees | | | 12 | | |
Miscellaneous | | | 58 | | |
Total Expenses | | | 23,501 | | |
Fees waived | | | (23,214 | ) | |
Net Expenses | | | 287 | | |
Net Investment Loss | | | (207 | ) | |
REALIZED AND UNREALIZED GAIN (LOSS) ON INVESTMENTS
AND FOREIGN CURRENCY TRANSACTIONS | |
Net realized loss from: | |
Foreign currency transactions | | | (138 | ) | |
| | | | (138 | ) | |
Net change in unrealized appreciation on: | |
Investments | | | 16,710 | | |
| | | | 16,710 | | |
Net realized and unrealized gain on investments and foreign currency transactions | | | 16,572 | | |
NET INCREASE IN NET ASSETS FROM OPERATIONS | | $ | 16,365 | | |
(a) Commencement of investment operations.
The accompanying notes are an integral part of the financial statements.
157
Statements of Changes in Net Assets
Annual Report December 31, 2017
Baillie Gifford Positive Change Equity Fund
| | | For the Period
December 14, 2017(a)
through
December 31, 2017 | |
INCREASE IN NET ASSETS FROM OPERATIONS | |
Net investment loss | | $ | (207 | ) | |
Net realized loss from foreign currency transactions | | | (138 | ) | |
Net change in unrealized appreciation on investments | | | 16,710 | | |
Net increase in net assets from operations | | | 16,365 | | |
TRANSACTIONS IN SHARES OF BENEFICIAL INTEREST | |
Net proceeds from shares subscribed: | |
Class K | | | 500,000 | | |
Institutional Class | | | 500,000 | | |
Increase in Net Assets from Transactions in Shares of Beneficial Interest | | | 1,000,000 | | |
Total Increase in Net Assets | | | 1,016,365 | | |
NET ASSETS | |
Beginning of period | | | — | | |
End of period (including accumulated net investment loss of $138) | | $ | 1,016,365 | | |
(a) Commencement of investment operations.
The accompanying notes are an integral part of the financial statements.
158
Annual Report December 31, 2017
Baillie Gifford Positive Change Equity Fund
Selected data for a Class K Share outstanding throughout the period:
| | | For the Period
December 14, 2017(a)
through
December 31, 2017 | |
Net asset value, beginning of period | | $ | 10.00 | | |
From Investment Operations | |
Net investment loss(b) | | | (0.00 | )(c) | |
Net realized and unrealized gain on investments and foreign currency transactions | | | 0.16 | | |
Net increase in net asset value from investment operations | | | 0.16 | | |
Net asset value, end of period | | $ | 10.16 | | |
Total Return | |
Total return based on net asset value(d) | | | 1.60 | % | |
Ratios/Supplemental Data | |
Net assets, end of period (000's omitted) | | $ | 508 | | |
Ratio of net expenses to average net assets, before waiver | | | 53.13 | %* | |
Ratio of net expenses to average net assets, after waiver | | | 0.65 | %* | |
Ratio of net investment loss to average net assets | | | (0.47 | )%* | |
Portfolio turnover rate(e) | | | 0 | % | |
* Annualized.
(a) Commencement of investment operations.
(b) Calculated based upon average shares outstanding during the period.
(c) Amount is less than $0.005 per share.
(d) Total investment return is calculated assuming an initial investment made at the net asset value at the beginning of the period, reinvestment of all dividends and distributions, if any, at net asset value during the period, and redemption on the last day of the period. Total return is not annualized for periods less than one year.
(e) Portfolio turnover rate calculated at fund level.
The accompanying notes are an integral part of the financial statements.
159
Annual Report December 31, 2017
Baillie Gifford Positive Change Equity Fund
Selected data for an Institutional Class Share outstanding throughout the period:
| | | For the Period
December 14, 2017(a)
through
December 31, 2017 | |
Net asset value, beginning of period | | $ | 10.00 | | |
From Investment Operations | |
Net investment loss(b) | | | (0.00 | )(c) | |
Net realized and unrealized gain on investments and foreign currency transactions | | | 0.16 | | |
Net increase in net asset value from investment operations | | | 0.16 | | |
Net asset value, end of period | | $ | 10.16 | | |
Total Return | |
Total return based on net asset value(d) | | | 1.60 | % | |
Ratios/Supplemental Data | |
Net assets, end of period (000's omitted) | | $ | 508 | | |
Ratio of net expenses to average net assets, before waiver | | | 53.13 | %* | |
Ratio of net expenses to average net assets, after waiver | | | 0.80 | %* | |
Ratio of net investment loss to average net assets | | | (0.47 | )%* | |
Portfolio turnover rate(e) | | | 0 | % | |
* Annualized.
(a) Commencement of investment operations.
(b) Calculated based upon average shares outstanding during the period.
(c) Amount is less than $0.005 per share.
(d) Total investment return is calculated assuming an initial investment made at the net asset value at the beginning of the period, reinvestment of all dividends and distributions, if any, at net asset value during the period, and redemption on the last day of the period. Total return is not annualized for periods less than one year.
(e) Portfolio turnover rate calculated at fund level.
The accompanying notes are an integral part of the financial statements.
160
Industry Diversification Table
Annual Report December 31, 2017
December 31, 2017
Baillie Gifford U.S. Equity Growth Fund
| | | Value | | % of Total
Net Assets | |
Aerospace & Defense | | $ | 14,466 | | | | 1.1 | % | |
Automobiles & Parts | | | 82,819 | | | | 6.1 | | |
Banks | | | 43,580 | | | | 3.2 | | |
Construction & Materials | | | 57,218 | | | | 4.3 | | |
General Financial | | | 172,059 | | | | 12.8 | | |
General Industrials | | | 21,271 | | | | 1.6 | | |
General Retailers | | | 229,597 | | | | 17.0 | | |
Health Care Equipment & Services | | | 72,476 | | | | 5.3 | | |
Household Goods | | | 43,587 | | | | 3.2 | | |
Industrial Engineering | | | 18,973 | | | | 1.4 | | |
Internet, Software & Services | | | 175,998 | | | | 13.0 | | |
Leisure Goods | | | 11,967 | | | | 0.9 | | |
Nonlife Insurance | | | 22,783 | | | | 1.7 | | |
Oil Equipment & Services | | | 7,953 | | | | 0.6 | | |
Personal Goods | | | 22,690 | | | | 1.7 | | |
Pharmaceuticals & Biotechnology | | | 147,856 | | | | 11.0 | | |
Real Estate | | | 11,087 | | | | 0.8 | | |
Support Services | | | 53,488 | | | | 3.9 | | |
Technology Hardware & Equipment | | | 43,709 | | | | 3.3 | | |
Total Value of Investments | | | 1,253,577 | | | | 92.9 | | |
Other assets less liabilities | | | 95,956 | | | | 7.1 | | |
Net Assets | | $ | 1,349,533 | | | | 100.0 | % | |
161
Annual Report December 31, 2017
December 31, 2017
Baillie Gifford U.S. Equity Growth Fund
| | | Shares | | Value | |
COMMON STOCKS — 92.9% | |
CANADA — 1.3% | |
Shopify, Inc., Class A (a) | | | 173 | | | $ | 17,473 | | |
UNITED STATES — 91.6% | |
ABIOMED, Inc. (a) | | | 204 | | | | 38,232 | | |
Activision Blizzard, Inc. | | | 189 | | | | 11,967 | | |
Alnylam Pharmaceuticals, Inc. (a) | | | 205 | | | | 26,045 | | |
Alphabet, Inc., Class C (a) | | | 69 | | | | 72,202 | | |
Amazon.com, Inc. (a) | | | 103 | | | | 120,455 | | |
American Express Co. | | | 199 | | | | 19,763 | | |
Celgene Corp. (a) | | | 178 | | | | 18,576 | | |
CoStar Group, Inc. (a) | | | 66 | | | | 19,599 | | |
Denali Therapeutics, Inc. (a) | | | 763 | | | | 11,933 | | |
Ellie Mae, Inc. (a) | | | 253 | | | | 22,618 | | |
Facebook, Inc., Class A (a) | | �� | 413 | | | | 72,878 | | |
First Republic Bank | | | 503 | | | | 43,580 | | |
Fortive Corp. | | | 294 | | | | 21,271 | | |
Glaukos Corp. (a) | | | 371 | | | | 9,516 | | |
GrubHub, Inc. (a) | | | 841 | | | | 60,384 | | |
HEICO Corp., Class A | | | 183 | | | | 14,466 | | |
Illumina, Inc. (a) | | | 230 | | | | 50,253 | | |
Interactive Brokers Group, Inc., Class A | | | 432 | | | | 25,579 | | |
Juno Therapeutics, Inc. (a) | | | 311 | | | | 14,216 | | |
Markel Corp. (a) | | | 20 | | | | 22,783 | | |
MarketAxess Holdings, Inc. | | | 322 | | | | 64,963 | | |
Martin Marietta Materials, Inc. | | | 95 | | | | 20,999 | | |
Mastercard, Inc., Class A | | | 257 | | | | 38,899 | | |
Netflix, Inc. (a) | | | 254 | | | | 48,758 | | |
New Relic, Inc. (a) | | | 189 | | | | 10,919 | | |
NOW, Inc. (a) | | | 721 | | | | 7,953 | | |
NVIDIA Corp. | | | 109 | | | | 21,091 | | |
Redfin Corp. (a) | | | 354 | | | | 11,087 | | |
Seattle Genetics, Inc. (a) | | | 101 | | | | 5,403 | | |
Stitch Fix, Inc., Class A (a) | | | 469 | | | | 12,114 | | |
Tableau Software, Inc., Class A (a) | | | 289 | | | | 19,999 | | |
TD Ameritrade Holding Corp. | | | 447 | | | | 22,855 | | |
Tesla, Inc. (a) | | | 266 | | | | 82,819 | | |
Under Armour, Inc., Class C (a) | | | 794 | | | | 10,576 | | |
The accompanying notes are an integral part of the financial statements.
162
Annual Report December 31, 2017
December 31, 2017
Baillie Gifford U.S. Equity Growth Fund
| | | Shares | | Value | |
Verisk Analytics, Inc. (a) | | | 171 | | | $ | 16,416 | | |
Vertex Pharmaceuticals, Inc. (a) | | | 143 | | | | 21,430 | | |
Wabtec Corp. | | | 233 | | | | 18,973 | | |
Waters Corp. (a) | | | 128 | | | | 24,728 | | |
Watsco, Inc. | | | 213 | | | | 36,219 | | |
Wayfair, Inc., Class A (a) | | | 543 | | | | 43,587 | | |
| | | | | | 1,236,104 | | |
TOTAL INVESTMENTS — 92.9% | |
(cost $923,808) | | | | $ | 1,253,577 | | |
Other assets less liabilities — 7.1% | | | | | 95,956 | | |
NET ASSETS — 100.0% | | | | $ | 1,349,533 | | |
(a) Non-income producing security.
Fair Value Measurement
The following is a summary of the inputs used as of December 31, 2017 in valuing the Fund's investments carried at fair value:
Investments in Securities | | Level 1 | | Level 2 | | Level 3 | | Total | |
Common Stocks | |
Canada | | $ | 17,473 | | | $ | — | | | $ | — | | | $ | 17,473 | | |
United States | | | 1,236,104 | | | | — | | | | — | | | | 1,236,104 | | |
Total | | $ | 1,253,577 | | | $ | — | | | $ | — | | | $ | 1,253,577 | | |
There were no transfers between levels for the year ending December 31, 2017.
It is the Fund's policy to recognize transfers in and transfers out at the fair value as of the beginning of the period.
The accompanying notes are an integral part of the financial statements.
163
Statement of Assets and Liabilities
Annual Report December 31, 2017
December 31, 2017
Baillie Gifford U.S. Equity Growth Fund
ASSETS | |
Investments, at value (cost $923,808) | | $ | 1,253,577 | | |
Cash | | | 6,642 | | |
Due from Investment Advisor | | | 129,419 | | |
Prepaid assets | | | 30,378 | | |
Total Assets | | | 1,420,016 | | |
LIABILITIES | |
Servicing fee payable | | | 566 | | |
Trustee fee payable | | | 15 | | |
Accrued expenses | | | 69,902 | | |
Total Liabilities | | | 70,483 | | |
NET ASSETS | | $ | 1,349,533 | | |
COMPOSITION OF NET ASSETS | |
Paid-in capital | | $ | 1,010,513 | | |
Accumulated net investment loss | | | — | | |
Accumulated net realized gain on investments | | | 9,251 | | |
Net unrealized appreciation in value of investments | | | 329,769 | | |
| | | $ | 1,349,533 | | |
NET ASSET VALUE, PER SHARE | |
| Class K ($1,343,683 / 100,379 shares outstanding), unlimited authorized, no par value | | $ | 13.39 | | |
| Institutional Class ($5,850 / 437 shares outstanding), unlimited authorized, no par value | | $ | 13.39 | | |
The accompanying notes are an integral part of the financial statements.
164
Annual Report December 31, 2017
For the Year Ended December 31, 2017
Baillie Gifford U.S. Equity Growth Fund
INVESTMENT INCOME | |
Dividends | | $ | 3,908 | | |
Total Investment Income | | | 3,908 | | |
EXPENSES | |
Advisory fee (Note B) | | | 3,686 | | |
Shareholder Servicing fees — Class 1 Shares (Note B) | | | 894 | | |
Administration & Supervisory Fee — Class K Shares (Note B) | | | 1,436 | | |
Administration & Supervisory Fee — Institutional Class Shares (Note B) | | | 6 | | |
Professional fees | | | 28,001 | | |
Custody | | | 3,117 | | |
Fund accounting | | | 34,535 | | |
Transfer agency | | | 28,205 | | |
Legal | | | 21,562 | | |
Trustees' fees | | | 65 | | |
Insurance | | | 8 | | |
Miscellaneous | | | 16,146 | | |
Total Expenses | | | 137,661 | | |
Fees waived | | | (130,517 | ) | |
Net Expenses | | | 7,144 | | |
Net Investment Loss | | | (3,236 | ) | |
REALIZED AND UNREALIZED GAIN (LOSS) ON INVESTMENTS | |
Net realized gain from: | |
Investments | | | 17,349 | | |
| | | | 17,349 | | |
Net change in unrealized appreciation on: | |
Investments | | | 333,045 | | |
| | | | 333,045 | | |
Net realized and unrealized gain on investments | | | 350,394 | | |
NET INCREASE IN NET ASSETS FROM OPERATIONS | | $ | 347,158 | | |
The accompanying notes are an integral part of the financial statements.
165
Statements of Changes in Net Assets
Annual Report December 31, 2017
Baillie Gifford U.S. Equity Growth Fund
| | | For the
Year Ended
December 31,
2017 | | For the Period
December 6, 2016(a)
through
December 31,
2016 | |
INCREASE (DECREASE) IN NET ASSETS FROM OPERATIONS | |
Net investment loss | | $ | (3,236 | ) | | $ | (361 | ) | |
Net realized gain from investments | | | 17,349 | | | | 1,012 | | |
Net change in unrealized appreciation (depreciation) on investments | | | 333,045 | | | | (3,276 | ) | |
Net increase (decrease) in net assets from operations | | | 347,158 | | | | (2,625 | ) | |
DIVIIDENDS AND DISTRIBUTIONS TO SHAREHOLDERS FROM | |
Capital gains: | |
Class K | | | (5,489 | ) | | | — | | |
Institutional Class | | | (24 | ) | | | — | | |
Total Dividends and Distributions | | | (5,513 | ) | | | | | |
TRANSACTIONS IN SHARES OF BENEFICIAL INTEREST | |
Net proceeds from shares subscribed: | |
Class 1 | | | — | | | | 1,000,000 | | |
| Class K* | | | 1,148,640 | | | | — | | |
Institutional Class | | | 5,000 | | | | — | | |
Dividends reinvested: | |
Class K | | | 5,489 | | | | — | | |
Institutional Class | | | 24 | | | | — | | |
Cost of shares redeemed: | |
| Class 1* | | | (1,148,640 | ) | | | — | | |
Increase in Net Assets from Transactions in Shares of Beneficial Interest | | | 10,513 | | | | 1,000,000 | | |
Total Increase in Net Assets | | | 352,158 | | | | 997,375 | | |
NET ASSETS | |
Beginning of period | | | 997,375 | | | | — | | |
End of period (including accumulated net investment loss of
$— and $—, respectively) | | $ | 1,349,533 | | | $ | 997,375 | | |
| | | | | | |
(a) Commencement of investment operations.
* Class 1 shareholders were converted to Class K during the period. Please refer to Notes A and D.
The accompanying notes are an integral part of the financial statements.
166
Annual Report December 31, 2017
Baillie Gifford U.S. Equity Growth Fund
Selected data for a Class K Share outstanding throughout the period:
| | | For the Period
April 28, 2017(a)
through
December 31,
2017 | |
Net asset value, beginning of period | | $ | 11.49 | | |
From Investment Operations | |
Net investment loss(b) | | | (0.03 | ) | |
Net realized and unrealized gain on investments | | | 1.98 | | |
Net increase in net asset value from investment operations | | | 1.95 | | |
Dividends and Distributions to Shareholders | |
Distributions from net realized gain on investments | | | (0.05 | ) | |
Total Dividends and Distributions | | | (0.05 | ) | |
Net asset value, end of period | | $ | 13.39 | | |
Total Return | |
Total return based on net asset value(c) | | | 17.01 | % | |
Ratios/Supplemental Data | |
Net assets, end of period (000's omitted) | | $ | 1,344 | | |
Ratio of net expenses to average net assets, before waiver | | | 13.11 | %* | |
Ratio of net expenses to average net assets, after waiver | | | 0.57 | %* | |
Ratio of net investment loss to average net assets | | | (0.31 | )%* | |
Portfolio turnover rate(d) | | | 15 | % | |
* Annualized.
(a) Commencement of investment operations.
(b) Calculated based upon average shares outstanding during the period.
(c) Total investment return is calculated assuming an initial investment made at the net asset value at the beginning of the period, reinvestment of all dividends and distributions, if any, at net asset value during the period, and redemption on the last day of the period. Total return is not annualized for periods less than one year.
(d) Portfolio turnover rate calculated at Fund level.
The accompanying notes are an integral part of the financial statements.
167
Annual Report December 31, 2017
Baillie Gifford U.S. Equity Growth Fund
Selected data for an Institutional Class Share outstanding throughout the period:
| | | For the Period
April 28, 2017(a)
through
December 31,
2017 | |
Net asset value, beginning of period | | $ | 11.49 | | |
From Investment Operations | |
Net investment loss(b) | | | (0.03 | ) | |
Net realized and unrealized gain on investments | | | 1.98 | | |
Net increase in net asset value from investment operations | | | 1.95 | | |
Dividends and Distributions to Shareholders | | | |
Distributions from net realized gain on investments | | | (0.05 | ) | |
Total Dividends and Distributions | | | (0.05 | ) | |
Net asset value, end of period | | $ | 13.39 | | |
Total Return | |
Total return based on net asset value(c) | | | 17.01 | % | |
Ratios/Supplemental Data | |
Net assets, end of period (000's omitted) | | $ | 6 | | |
Ratio of net expenses to average net assets, before waiver | | | 13.11 | %* | |
Ratio of net expenses to average net assets, after waiver | | | 0.72 | %* | |
Ratio of net investment loss to average net assets | | | (0.31 | )%* | |
Portfolio turnover rate(d) | | | 15 | % | |
* Annualized.
(a) Commencement of investment operations.
(b) Calculated based upon average shares outstanding during the period.
(c) Total investment return is calculated assuming an initial investment made at the net asset value at the beginning of the period, reinvestment of all dividends and distributions, if any, at net asset value during the period, and redemption on the last day of the period. Total return is not annualized for periods less than one year.
(d) Portfolio turnover rate calculated at Fund level.
The accompanying notes are an integral part of the financial statements.
168
Industry Diversification Table
Annual Report December 31, 2017
December 31, 2017
Baillie Gifford International Choice Fund
| | | Value | | % of Total
Net Assets | |
Apparel Retailers | | $ | 28,746,383 | | | | 5.7 | % | |
Asset Managers | | | 18,574,880 | | | | 3.7 | | |
Auto Parts | | | 4,948,465 | | | | 1.0 | | |
Banks | | | 25,942,298 | | | | 5.1 | | |
Beverages, Food & Tobacco | | | 7,118,567 | | | | 1.4 | | |
Brewers | | | 11,590,738 | | | | 2.3 | | |
Broadline Retailers | | | 8,090,138 | | | | 1.6 | | |
Business Support Services | | | 6,596,684 | | | | 1.3 | | |
Chemicals | | | 6,082,104 | | | | 1.2 | | |
Clothing & Accessories | | | 10,933,540 | | | | 2.2 | | |
Commercial Services & Supplies | | | 5,717,337 | | | | 1.1 | | |
Construction & Materials | | | 4,804,516 | | | | 1.0 | | |
Containers & Packaging | | | 5,227,342 | | | | 1.0 | | |
Distillers & Vintners | | | 6,109,531 | | | | 1.2 | | |
Electronic & Electrical Equipment | | | 28,915,248 | | | | 5.7 | | |
Food & Drug Retailers/Wholesalers | | | 19,525,689 | | | | 3.9 | | |
Food & Staples | | | 9,036,512 | | | | 1.8 | | |
Footwear | | | 7,932,971 | | | | 1.6 | | |
General Industries | | | 7,178,886 | | | | 1.4 | | |
Hotels Restaurants and Leisure | | | 5,544,517 | | | | 1.1 | | |
Industrial Engineering | | | 8,439,650 | | | | 1.6 | | |
Industrial Machinery | | | 36,333,737 | | | | 7.1 | | |
Internet | | | 12,496,628 | | | | 2.5 | | |
Investment Services | | | 3,928,078 | | | | 0.8 | | |
Leisure Goods | | | 5,356,157 | | | | 1.0 | | |
Life Insurance | | | 7,656,784 | | | | 1.5 | | |
Media & Photography | | | 15,077,797 | | | | 3.0 | | |
Media Agencies | | | 8,891,589 | | | | 1.7 | | |
Medical Equipment | | | 16,116,986 | | | | 3.2 | | |
Mortgage Finance | | | 4,035,971 | | | | 0.8 | | |
Nondurable Household Products | | | 10,520,588 | | | | 2.1 | | |
Nonlife Insurance | | | 11,885,601 | | | | 2.4 | | |
Oil Equipment & Services | | | 2,723,998 | | | | 0.5 | | |
Personal Products | | | 15,322,834 | | | | 3.0 | | |
Pharmaceuticals & Biotechnology | | | 19,754,021 | | | | 3.9 | | |
Property & Casualty Insurance | | | 9,768,340 | | | | 1.9 | | |
Recreational Products | | | 5,664,512 | | | | 1.1 | | |
Retailers — General | | | 11,067,469 | | | | 2.2 | | |
Semiconductors | | | 13,160,152 | | | | 2.6 | | |
Speciality Finance | | | 6,900,441 | | | | 1.3 | | |
169
Industry Diversification Table
Annual Report December 31, 2017
| | | Value | | % of Total
Net Assets | |
Specialized Consumer Services | | $ | 24,711,556 | | | | 4.7 | % | |
Support Services | | | 5,905,548 | | | | 1.2 | | |
Technology Hardware & Equipment | | | 11,773,513 | | | | 2.2 | | |
Telecommunication Services | | | 4,449,387 | | | | 0.9 | | |
Travel & Leisure | | | 2,102,395 | | | | 0.4 | | |
Total Value of Investments | | | 502,660,078 | | | | 98.9 | | |
Other assets less liabilities | | | 5,693,769 | | | | 1.1 | | |
Net Assets | | $ | 508,353,847 | | | | 100.0 | % | |
170
Annual Report December 31, 2017
December 31, 2017
Baillie Gifford International Choice Fund
| | | Shares | | Value | |
COMMON STOCKS—98.5% | |
AUSTRALIA—5.5% | |
Brambles Ltd. | | | 667,002 | | | $ | 5,227,342 | | |
Cochlear Ltd. | | | 78,662 | | | | 10,485,849 | | |
Mesoblast Ltd. (a) | | | 388,292 | | | | 442,329 | | |
SEEK Ltd. | | | 386,628 | | | | 5,717,337 | | |
Treasury Wine Estates Ltd. | | | 492,348 | | | | 6,109,531 | | |
| | | | | | 27,982,388 | | |
BRAZIL—1.2% | |
Raia Drogasil SA | | | 216,700 | | | | 5,994,820 | | |
CANADA—1.6% | |
Fairfax Financial Holdings Ltd. | | | 10,022 | | | | 5,336,615 | | |
Shopify, Inc., Class A (a) | | | 25,370 | | | | 2,562,370 | | |
| | | | | | 7,898,985 | | |
CHINA—7.1% | |
Alibaba Group Holding Ltd. ADR (a) | | | 54,528 | | | | 9,402,263 | | |
Baidu, Inc. ADR (a) | | | 38,171 | | | | 8,940,030 | | |
Ctrip.com International Ltd. ADR (a) | | | 125,726 | | | | 5,544,517 | | |
JD.com, Inc. ADR (a) | | | 126,088 | | | | 5,222,565 | | |
Tsingtao Brewery Co., Ltd., Class H | | | 1,380,057 | | | | 7,118,567 | | |
| | | | | | 36,227,942 | | |
DENMARK—5.4% | |
Carlsberg A/S, B Shares | | | 69,110 | | | | 8,288,932 | | |
Novo Nordisk A/S, B Shares | | | 202,041 | | | | 10,856,772 | | |
Novozymes A/S, B Shares | | | 148,105 | | | | 8,454,920 | | |
| | | | | | 27,600,624 | | |
FINLAND—1.2% | |
Kone Oyj, B Shares | | | 111,378 | | | | 5,981,286 | | |
FRANCE—1.5% | |
Legrand SA | | | 100,418 | | | | 7,720,005 | | |
The accompanying notes are an integral part of the financial statements.
171
Annual Report December 31, 2017
December 31, 2017
Baillie Gifford International Choice Fund
| | | Shares | | Value | |
GERMANY—4.7% | |
adidas AG | | | 39,667 | | | $ | 7,932,971 | | |
Infineon Technologies AG | | | 216,070 | | | | 5,884,479 | | |
Zalando SE 144A (a)(b) | | | 189,112 | | | | 9,971,437 | | |
| | | | | | 23,788,887 | | |
HONG KONG—1.8% | |
AIA Group Ltd. | | | 900,200 | | | | 7,656,784 | | |
Cafe de Coral Holdings Ltd. | | | 512,298 | | | | 1,406,502 | | |
| | | | | | 9,063,286 | | |
INDIA—3.4% | |
Asian Paints Ltd. | | | 265,065 | | | | 4,804,516 | | |
Housing Development Finance Corp., Ltd. | | | 150,716 | | | | 4,035,971 | | |
Mahindra & Mahindra Ltd. GDR | | | 266,711 | | | | 6,214,366 | | |
MakeMytrip Ltd. (a) | | | 70,432 | | | | 2,102,395 | | |
| | | | | | 17,157,248 | | |
JAPAN—17.6% | |
Advantest Corp. | | | 209,800 | | | | 3,870,670 | | |
DENSO Corp. | | | 82,600 | | | | 4,948,465 | | |
Japan Exchange Group, Inc. | | | 226,400 | | | | 3,928,078 | | |
Kakaku.com, Inc. | | | 341,600 | | | | 5,766,438 | | |
Kao Corp. | | | 155,700 | | | | 10,520,588 | | |
MS&AD Insurance Group Holdings, Inc. | | | 289,600 | | | | 9,768,340 | | |
Olympus Corp. | | | 147,200 | | | | 5,631,137 | | |
Pigeon Corp. | | | 172,600 | | | | 6,557,961 | | |
Rakuten, Inc. | | | 404,200 | | | | 3,694,661 | | |
Shimano, Inc. | | | 40,300 | | | | 5,664,512 | | |
Shiseido Co., Ltd. | | | 181,900 | | | | 8,764,873 | | |
SMC Corp. | | | 21,400 | | | | 8,782,226 | | |
SoftBank Group Corp. | | | 56,200 | | | | 4,449,387 | | |
Sugi Holdings Co., Ltd. | | | 51,000 | | | | 2,598,086 | | |
Suruga Bank Ltd. | | | 203,500 | | | | 4,351,314 | | |
| | | | | | 89,296,736 | | |
MALAYSIA—0.9% | |
Public Bank Bhd | | | 901,900 | | | | 4,630,957 | | |
MEXICO—0.6% | |
Wal-Mart de Mexico SAB de CV | | | 1,169,300 | | | | 2,867,573 | | |
The accompanying notes are an integral part of the financial statements.
172
Annual Report December 31, 2017
December 31, 2017
Baillie Gifford International Choice Fund
| | | Shares | | Value | |
NETHERLANDS—0.9% | |
| ASML Holding NV | | | 26,515 | | | $ | 4,609,843 | | |
PHILIPPINES—0.5% | |
Puregold Price Club, Inc. | | | 2,299,400 | | | | 2,303,085 | | |
PORTUGAL—1.5% | |
Jeronimo Martins SGPS SA | | | 396,006 | | | | 7,694,996 | | |
RUSSIA—0.4% | |
Magnit PJSC GDR Reg S | | | 70,669 | | | | 1,923,352 | | |
SINGAPORE—3.2% | |
Jardine Matheson Holdings Ltd. | | | 70,700 | | | | 4,289,546 | | |
Jardine Strategic Holdings Ltd. | | | 73,000 | | | | 2,889,340 | | |
United Overseas Bank Ltd. | | | 473,299 | | | | 9,330,152 | | |
| | | | | | 16,509,038 | | |
SOUTH AFRICA—4.4% | |
Clicks Group Ltd. | | | 502,597 | | | | 7,357,882 | | |
Naspers Ltd., N Shares | | | 54,422 | | | | 15,077,797 | | |
| | | | | | 22,435,679 | | |
SOUTH KOREA—3.0% | |
NAVER Corp. (a) | | | 4,378 | | | | 3,556,598 | | |
Samsung Electronics Co., Ltd. GDR 144A (b) | | | 4,523 | | | | 5,356,157 | | |
Samsung Fire & Marine Insurance Co., Ltd. (a) | | | 26,265 | | | | 6,548,986 | | |
| | | | | | 15,461,741 | | |
SPAIN—2.8% | |
Distribuidora Internacional de Alimentacion SA | | | 627,766 | | | | 3,237,787 | | |
Inditex SA | | | 308,668 | | | | 10,732,905 | | |
| | | | | | 13,970,692 | | |
SWEDEN—5.0% | |
Atlas Copco AB, A Shares | | | 23,278 | | | | 1,004,587 | | |
Atlas Copco AB, B Shares | | | 261,210 | | | | 10,011,418 | | |
Investor AB, B Shares | | | 151,300 | | | | 6,900,441 | | |
Svenska Handelsbanken AB, A Shares | | | 558,309 | | | | 7,629,875 | | |
| | | | | | 25,546,321 | | |
The accompanying notes are an integral part of the financial statements.
173
Annual Report December 31, 2017
December 31, 2017
Baillie Gifford International Choice Fund
| | | Shares | | Value | |
SWITZERLAND—6.0% | |
Compagnie Financiere Richemont SA | | | 66,788 | | | $ | 6,048,847 | | |
Mettler-Toledo International, Inc. (a) | | | 13,690 | | | | 8,481,229 | | |
Nestle SA | | | 82,734 | | | | 7,113,160 | | |
Schindler Holding AG, Participating Certificates | | | 33,793 | | | | 7,772,071 | | |
u-blox Holding AG (a) | | | 6,499 | | | | 1,279,191 | | |
| | | | | | 30,694,498 | | |
TAIWAN—4.3% | |
Delta Electronics, Inc. | | | 855,000 | | | | 4,107,734 | | |
Hon Hai Precision Industry Co., Ltd. GDR Reg S | | | 753,994 | | | | 4,735,610 | | |
Taiwan Semiconductor Manufacturing Co., Ltd. ADR | | | 331,908 | | | | 13,160,152 | | |
| | | | | | 22,003,496 | | |
THAILAND—0.7% | |
Thai Beverage PCL | | | 4,800,000 | | | | 3,301,806 | | |
UNITED KINGDOM—13.3% | |
| ASOS PLC (a) | | | 89,142 | | | | 8,042,041 | | |
Auto Trader Group PLC 144A (b) | | | 1,227,756 | | | | 5,848,194 | | |
Burberry Group PLC | | | 202,602 | | | | 4,884,693 | | |
Capita PLC | | | 618,752 | | | | 3,343,178 | | |
Hargreaves Lansdown PLC | | | 521,894 | | | | 12,674,579 | | |
Intertek Group PLC | | | 94,328 | | | | 6,596,684 | | |
John Wood Group PLC | | | 311,328 | | | | 2,723,998 | | |
Johnson Matthey PLC | | | 146,775 | | | | 6,082,104 | | |
Jupiter Fund Management PLC | | | 697,314 | | | | 5,900,301 | | |
Rightmove PLC | | | 146,519 | | | | 8,891,589 | | |
Weir Group PLC (The) | | | 97,062 | | | | 2,782,149 | | |
| | | | | | 67,769,510 | | |
Total Common Stocks | |
(cost $378,801,360) | | | | | 500,434,794 | | |
PREFERRED STOCKS—0.4% | |
GERMANY—0.4% | |
Sartorius AG (cost $2,413,567) | | | 23,426 | | | | 2,225,284 | | |
TOTAL INVESTMENTS—98.9% | |
(cost $381,214,927) | | | | $ | 502,660,078 | | |
Other assets less liabilities—1.1% | | | | | 5,693,769 | | |
NET ASSETS — 100.0% | | | | $ | 508,353,847 | | |
The accompanying notes are an integral part of the financial statements.
174
Annual Report December 31, 2017
(a) Non-income producing security.
(b) 144A — Securities are exempt from registration under Rule 144A of the Securities Act of 1933, as amended. These securities may be resold in transactions exempt from registration, normally to qualified institutional buyers. Prices are obtained daily from the London International Stock Exchange; therefore, fair valuation is typically not required. At December 31, 2017, the net value of these securities was $21,175,788 representing 4.2% of net assets.
ADR — American Depositary Receipt.
GDR — Global Depositary Receipt.
Reg S — Regulation S ("Reg S") of the securities Act of 1933, as amended ("1933 Act") is a safe harbor that defines when an offering of securities will be deemed to come to rest abroad and therefore is not subject to the registration obligations imposed under Section 5 of the 1933 Act. The regulation includes two safe harbor provisions: an issuer safe harbor and a resale safe harbor. In each case, the regulation demands that offers and sales of the securities be made outside the United States and that no offering participant (which includes the issuer, the banks assisting with the offer and their respective affiliates) engage in "directed" selling efforts. In the case of issuers for whose securities there is substantial U.S. market interest, the regulation also requires that no offers and sales be made to U.S. persons (including U.S. persons physically located outside the United States).
Fair Value Measurement
The following is a summary of the inputs used as of December 31, 2017 in valuing the Fund's investments carried at fair value:
Investments in Securities | | Level 1 | | Level 2 | | Level 3 | | Total | |
Common Stocks | |
Australia | | $ | 442,329 | | | $ | 27,540,059 | | | $ | — | | | $ | 27,982,388 | | |
Brazil | | | — | | | | 5,994,820 | | | | — | | | | 5,994,820 | | |
Canada | | | 7,898,985 | | | | — | | | | — | | | | 7,898,985 | | |
China | | | 36,227,942 | | | | — | | | | — | | | | 36,227,942 | | |
Denmark | | | — | | | | 27,600,624 | | | | — | | | | 27,600,624 | | |
Finland | | | — | | | | 5,981,286 | | | | — | | | | 5,981,286 | | |
France | | | — | | | | 7,720,005 | | | | — | | | | 7,720,005 | | |
Germany | | | — | | | | 23,788,887 | | | | — | | | | 23,788,887 | | |
Hong Kong | | | — | | | | 9,063,286 | | | | — | | | | 9,063,286 | | |
India | | | 8,316,761 | | | | 8,840,487 | | | | — | | | | 17,157,248 | | |
Japan | | | — | | | | 89,296,736 | | | | — | | | | 89,296,736 | | |
Malaysia | | | 4,630,957 | | | | — | | | | — | | | | 4,630,957 | | |
Mexico | | | 2,867,573 | | | | — | | | | — | | | | 2,867,573 | | |
Netherlands | | | — | | | | 4,609,843 | | | | — | | | | 4,609,843 | | |
Philippines | | | 2,303,085 | | | | — | | | | — | | | | 2,303,085 | | |
Portugal | | | 7,694,996 | | | | — | | | | — | | | | 7,694,996 | | |
Russia | | | — | | | | 1,923,352 | | | | — | | | | 1,923,352 | | |
Singapore | | | 2,889,340 | | | | 13,619,698 | | | | — | | | | 16,509,038 | | |
South Africa | | | 7,357,882 | | | | 15,077,797 | | | | — | | | | 22,435,679 | | |
South Korea | | | — | | | | 15,461,741 | | | | — | | | | 15,461,741 | | |
Spain | | | — | | | | 13,970,692 | | | | — | | | | 13,970,692 | | |
Sweden | | | — | | | | 25,546,321 | | | | — | | | | 25,546,321 | | |
Switzerland | | | 9,760,420 | | | | 20,934,078 | | | | — | | | | 30,694,498 | | |
Taiwan | | | 13,160,152 | | | | 8,843,344 | | | | — | | | | 22,003,496 | | |
Thailand | | | — | | | | 3,301,806 | | | | — | | | | 3,301,806 | | |
United Kingdom | | | 8,630,343 | | | | 59,139,167 | | | | — | | | | 67,769,510 | | |
Total Common Stocks | | | 112,180,765 | | | | 388,254,029 | | | | — | | | | 500,434,794 | | |
Preferred Stocks | |
Germany | | | — | | | | 2,225,284 | | | | — | | | | 2,225,284 | | |
Total | | $ | 112,180,765 | | | $ | 390,479,313 | | | $ | — | | | $ | 502,660,078 | | |
For the International Choice Fund, fair value of Level 2 and Level 1 investments at December 31, 2016 was $291,728,776 and $48,702,277, respectively. $16,370,608 was transferred out of Level 2 into Level 1 during the year ended December 31, 2017. Transfers into Level 1 and out of Level 2 resulted when pricing was based on quoted market prices.
It is the Fund's policy to recognize transfers in and transfers out at the fair value as of the beginning of the period.
The accompanying notes are an integral part of the financial statements.
175
Statement of Assets and Liabilities
Annual Report December 31, 2017
December 31, 2017
Baillie Gifford International Choice Fund
ASSETS | |
Investments, at value (cost $381,214,927) | | $ | 502,660,078 | | |
Cash | | | 5,566,783 | | |
Dividends receivable | | | 368,958 | | |
Tax reclaims receivable | | | 724,607 | | |
Prepaid assets | | | 425 | | |
Total Assets | | | 509,320,851 | | |
LIABILITIES | |
Advisory fee payable | | | 439,166 | | |
Servicing fee payable | | | 178,574 | | |
Payable for deferred Indian capital gains tax | | | 76,371 | | |
Trustee fee payable | | | 5,652 | | |
Accrued expenses | | | 267,241 | | |
Total Liabilities | | | 967,004 | | |
NET ASSETS | | $ | 508,353,847 | | |
COMPOSITION OF NET ASSETS | |
Paid-in capital | | $ | 396,216,845 | | |
Distributions in excess of net investment income | | | (2,544,396 | ) | |
Accumulated net realized loss on investments and foreign currency transactions | | | (6,707,271 | ) | |
Net unrealized appreciation in value of investments and foreign currencies
(net of deferred Indian capital gains tax) | | | 121,388,669 | | |
| | | $ | 508,353,847 | | |
NET ASSET VALUE, PER SHARE | |
| Class 2 ($324,763,793 / 21,865,241 shares outstanding), unlimited authorized, no par value | | $ | 14.85 | | |
| Class 3 ($142,843,556 / 9,514,232 shares outstanding), unlimited authorized, no par value | | $ | 15.01 | | |
| Class 4 ($40,746,498 / 2,686,098 shares outstanding), unlimited authorized, no par value | | $ | 15.17 | | |
The accompanying notes are an integral part of the financial statements.
176
Annual Report December 31, 2017
For the Year Ended December 31, 2017
Baillie Gifford International Choice Fund
INVESTMENT INCOME | |
Dividends (net of foreign withholding taxes of $798,347) | | $ | 7,469,397 | | |
Interest | | | 868 | | |
Total Investment Income | | | 7,470,265 | | |
EXPENSES | |
Advisory fee (Note B) | | | 1,552,996 | | |
Shareholder Servicing fees—Class 1 Shares (Note B) | | | 11,844 | | |
Shareholder Servicing fees—Class 2 Shares (Note B) | | | 478,793 | | |
Shareholder Servicing fees—Class 3 Shares (Note B) | | | 129,011 | | |
Shareholder Servicing fees—Class 4 Shares (Note B) | | | 19,825 | | |
Fund accounting | | | 259,708 | | |
Custody | | | 86,922 | | |
Legal | | | 94,702 | | |
Transfer agency | | | 48,721 | | |
Professional fees | | | 34,546 | | |
Trustees' fees | | | 19,771 | | |
Insurance | | | 3,148 | | |
Miscellaneous | | | 9,059 | | |
Total Expenses | | | 2,749,046 | | |
Net Investment Income | | | 4,721,219 | | |
REALIZED AND UNREALIZED GAIN (LOSS) ON INVESTMENTS
AND FOREIGN CURRENCY TRANSACTIONS | |
Net realized gain (loss) from: | |
Investments | | | 9,800,940 | | |
Foreign currency transactions | | | (43,090 | ) | |
| | | | 9,757,850 | | |
Net change in unrealized appreciation (depreciation) on: | |
Investments (net of deferred Indian capital gains tax $76,371) | | | 101,710,950 | | |
Translation of assets and liabilities denominated in foreign currencies | | | (27,530 | ) | |
| | | | 101,683,420 | | |
Net realized and unrealized gain on investments and foreign currency transactions | | | 111,441,270 | | |
NET INCREASE IN NET ASSETS FROM OPERATIONS | | $ | 116,162,489 | | |
The accompanying notes are an integral part of the financial statements.
177
Statements of Changes in Net Assets
Annual Report December 31, 2017
Baillie Gifford International Choice Fund
| | | For the
Year Ended
December 31,
2017 | | For the
Year Ended
December 31,
2016 | |
INCREASE IN NET ASSETS FROM OPERATIONS | |
Net investment income | | $ | 4,721,219 | | | $ | 5,199,512 | | |
Net realized gain (loss) from investments and foreign currency transactions | | | 9,757,850 | | | | (5,129,405 | ) | |
Net change in unrealized appreciation on investments and translation of
assets and liabilities in foreign currencies | | | 101,683,420 | | | | 1,842,721 | | |
Net increase in net assets from operations | | | 116,162,489 | | | | 1,912,828 | | |
DIVIDENDS AND DISTRIBUTIONS TO SHAREHOLDERS FROM: | |
Net investment income: | |
Class 1 | | | — | | | | (194,799 | ) | |
Class 2 | | | (4,034,314 | ) | | | (2,772,340 | ) | |
Class 3 | | | (1,833,941 | ) | | | (1,432,137 | ) | |
Class 4 | | | (534,209 | ) | | | — | | |
Total Dividends and Distributions | | | (6,402,464 | ) | | | (4,399,276 | ) | |
TRANSACTIONS IN SHARES OF BENEFICIAL INTEREST | |
Net proceeds from shares subscribed: | |
| Class 2* | | | 33,249,954 | | | | 399,160 | | |
Class 4 | | | 34,081,343 | | | | — | | |
Purchase fees: | |
Class 1 | | | 3,420 | | | | 40 | | |
Class 2 | | | 46,266 | | | | 535 | | |
Class 3 | | | 22,875 | | | | 265 | | |
Dividends reinvested: | |
Class 1 | | | — | | | | 194,799 | | |
Class 2 | | | 4,034,314 | | | | 2,772,340 | | |
Class 3 | | | 1,833,960 | | | | 1,432,137 | | |
Class 4 | | | 534,209 | | | | — | | |
Cost of shares redeemed: | |
| Class 1* | | | (17,850,819 | ) | | | — | | |
Class 2 | | | (1,500,000 | ) | | | — | | |
Increase in Net Assets from Transactions in Shares of Beneficial Interest | | | 54,455,522 | | | | 4,799,276 | | |
Total Increase in Net Assets | | | 164,215,547 | | | | 2,312,828 | | |
NET ASSETS | |
Beginning of year | | | 344,138,300 | | | | 341,825,472 | | |
End of year (including distributions in excess of net investment income of
$2,544,396 and $820,062, respectively) | | $ | 508,353,847 | | | $ | 344,138,300 | | |
* Class 1 shareholders were converted to Class 2 during the period. Please refer to Notes A and D.
The accompanying notes are an integral part of the financial statements.
178
Annual Report December 31, 2017
Baillie Gifford International Choice Fund
Selected data for a Class 2 Share outstanding throughout each period:
| | | For the
Year Ended
December 31,
2017 | | For the
Year Ended
December 31,
2016 | | For the
Year Ended
December 31,
2015 | | For the
Year Ended
December 31,
2014 | | For the Period
April 9, 2013(a)
through
December 31,
2013 | |
Net asset value, beginning of period | | $ | 11.44 | | | $ | 11.53 | | | $ | 11.51 | | | $ | 12.20 | | | $ | 11.00 | | |
From Investment Operations | |
Net investment income(b) | | | 0.14 | | | | 0.17 | | | | 0.16 | | | | 0.17 | | | | 0.08 | | |
Net realized and unrealized gain (loss)
on investments and foreign currency
transactions | | | 3.46 | | | | (0.11 | ) | | | 0.03 | | | | (0.58 | ) | | | 1.19 | | |
Net increase (decrease) in net asset value
from investment operations | | | 3.60 | | | | 0.06 | | | | 0.19 | | | | (0.41 | ) | | | 1.27 | | |
Dividends and Distributions to
Shareholders | | | | | | | | | | | |
Dividends from net investment income | | | (0.19 | ) | | | (0.15 | ) | | | (0.17 | ) | | | (0.17 | ) | | | (0.09 | ) | |
Distributions from net realized gain
on investments | | | — | | | | — | | | | — | | | | (0.12 | ) | | | — | | |
Total Dividends and Distributions | | | (0.19 | ) | | | (0.15 | ) | | | (0.17 | ) | | | (0.29 | ) | | | (0.09 | ) | |
Proceeds from Purchase Fees and
Redemption Fees(b) | | | 0.00 | (c) | | | 0.00 | (c) | | | 0.00 | (c) | | | 0.01 | | | | 0.02 | | |
Net asset value, end of period | | $ | 14.85 | | | $ | 11.44 | | | $ | 11.53 | | | $ | 11.51 | | | $ | 12.20 | | |
Total Return | |
Total return based on net asset value(d) | | | 31.45 | % | | | 0.54 | % | | | 1.56 | % | | | (3.29 | )% | | | 11.76 | % | |
Ratios/Supplemental Data | |
Net assets, end of period (000's omitted) | | $ | 324,764 | | | $ | 219,300 | | | $ | 217,720 | | | $ | 245,206 | | | $ | 169,778 | | |
Ratio of net expenses to average net
assets, before waiver | | | 0.65 | % | | | 0.65 | % | | | 0.63 | % | | | 0.63 | % | | | 0.67 | %* | |
Ratio of net expenses to average net
assets, after waiver | | | 0.65 | % | | | 0.65 | % | | | 0.63 | % | | | 0.63 | % | | | 0.66 | %* | |
Ratio of net investment income to
average net assets | | | 1.03 | % | | | 1.48 | % | | | 1.38 | % | | | 1.35 | % | | | 0.98 | %* | |
Portfolio turnover rate(e) | | | 12 | % | | | 14 | % | | | 15 | % | | | 9 | % | | | 11 | % | |
* Annualized.
(a) Commencement of investment operations.
(b) Calculated based upon average shares outstanding during the period.
(c) Amount is less than $0.005 per share.
(d) Total investment return is calculated assuming an initial investment made at the net asset value at the beginning of the period, reinvestment of all dividends and distributions, if any, at net asset value during the period, and redemption on the last day of the period. Total return is not annualized for periods less than one year.
(e) Portfolio turnover rate calculated at Fund level.
The accompanying notes are an integral part of the financial statements.
179
Annual Report December 31, 2017
Baillie Gifford International Choice Fund
Selected data for a Class 3 Share outstanding throughout each period:
| | | For the
Year Ended
December 31,
2017 | | For the
Year Ended
December 31,
2016 | | For the
Year Ended
December 31,
2015 | | For the
Year Ended
December 31,
2014 | | For the Period
April 30, 2013(a)
through
December 31,
2013 | |
Net asset value, beginning of period | | $ | 11.56 | | | $ | 11.65 | | | $ | 11.63 | | | $ | 12.33 | | | $ | 11.50 | | |
From Investment Operations | |
Net investment income(b) | | | 0.15 | | | | 0.18 | | | | 0.18 | | | | 0.17 | | | | 0.09 | | |
Net realized and unrealized gain (loss)
on investments and foreign currency
transactions | | | 3.50 | | | | (0.12 | ) | | | 0.02 | | | | (0.58 | ) | | | 0.82 | | |
Net increase (decrease) in net asset
value from investment operations | | | 3.65 | | | | 0.06 | | | | 0.20 | | | | (0.41 | ) | | | 0.91 | | |
Dividends and Distributions to
Shareholders | | | | | | | | | | | |
Dividends from net investment income | | | (0.20 | ) | | | (0.15 | ) | | | (0.18 | ) | | | (0.18 | ) | | | (0.10 | ) | |
Distributions from net realized gain
on investments | | | — | | | | — | | | | — | | | | (0.12 | ) | | | — | | |
Total Dividends and Distributions | | | (0.20 | ) | | | (0.15 | ) | | | (0.18 | ) | | | (0.30 | ) | | | (0.10 | ) | |
Proceeds from Purchase Fees and
Redemption Fees(b) | | | 0.00 | (c) | | | 0.00 | (c) | | | 0.00 | (c) | | | 0.01 | | | | 0.02 | | |
Net asset value, end of period | | $ | 15.01 | | | $ | 11.56 | | | $ | 11.65 | | | $ | 11.63 | | | $ | 12.33 | | |
Total Return | |
Total return based on net asset value(d) | | | 31.54 | % | | | 0.61 | % | | | 1.63 | % | | | (3.26 | )% | | | 8.11 | % | |
Ratios/Supplemental Data | |
Net assets, end of period (000's omitted) | | $ | 142,844 | | | $ | 108,594 | | | $ | 107,936 | | | $ | 106,203 | | | $ | 109,740 | | |
Ratio of net expenses to average net assets | | | 0.58 | % | | | 0.58 | % | | | 0.56 | % | | | 0.56 | % | | | 0.58 | %* | |
Ratio of net investment income to average
net assets | | | 1.13 | % | | | 1.55 | % | | | 1.45 | % | | | 1.38 | % | | | 1.10 | %* | |
Portfolio turnover rate(e) | | | 12 | % | | | 14 | % | | | 15 | % | | | 9 | % | | | 11 | % | |
* Annualized.
(a) Commencement of investment operations.
(b) Calculated based upon average shares outstanding during the period.
(c) Amount is less than $0.005 per share.
(d) Total investment return is calculated assuming an initial investment made at the net asset value at the beginning of the period, reinvestment of all dividends and distributions, if any, at net asset value during the period, and redemption on the last day of the period. Total return is not annualized for periods less than one year.
(e) Portfolio turnover rate calculated at Fund level.
The accompanying notes are an integral part of the financial statements.
180
Annual Report December 31, 2017
Baillie Gifford International Choice Fund
Selected data for a Class 4 Share outstanding throughout the period:
| | | For the Period
April 03, 2017(a)
through
December 31, 2017 | |
Net asset value, beginning of period | | $ | 12.86 | | |
From Investment Operations | |
Net investment income(b) | | | 0.11 | | |
Net realized and unrealized gain on investments and foreign currency transactions | | | 2.40 | | |
Net increase in net asset value from investment operations | | | 2.51 | | |
Dividends and Distributions to Shareholders | | | |
Dividends from net investment income | | | (0.20 | ) | |
Total Dividends and Distributions | | | (0.20 | ) | |
Net asset value, end of period | | $ | 15.17 | | |
Total Return | |
Total return based on net asset value(c) | | | 19.56 | % | |
Ratios/Supplemental Data | |
Net assets, end of period (000's omitted) | | $ | 40,746 | | |
Ratio of net expenses to average net assets | | | 0.54 | %* | |
Ratio of net investment income to average net assets | | | 0.99 | %* | |
Portfolio turnover rate(d) | | | 12 | % | |
* Annualized.
(a) Commencement of investment operations.
(b) Calculated based upon average shares outstanding during the period.
(c) Total investment return is calculated assuming an initial investment made at the net asset value at the beginning of the period, reinvestment of all dividends and distributions, if any, at net asset value during the period, and redemption on the last day of the period. Total return is not annualized for periods less than one year.
(d) Portfolio turnover rate calculated at Fund level.
The accompanying notes are an integral part of the financial statements.
181
Notes to Financial Statements
Annual Report December 31, 2017
Note A — Organization and Accounting Policies
Each of Baillie Gifford EAFE Fund ("EAFE Fund"), Baillie Gifford EAFE Choice Fund ("EAFE Choice Fund"), Baillie Gifford EAFE Pure Fund ("EAFE Pure Fund"), Baillie Gifford Emerging Markets Fund ("Emerging Markets Fund"), Baillie Gifford Global Alpha Equity Fund ("Global Alpha Equity Fund"), Baillie Gifford Global Select Equity Fund ("Global Select Equity Fund"), Baillie Gifford International Concentrated Growth Fund ("International Concentrated Growth Fund"), Baillie Gifford International Equity Fund ("International Equity Fund"), Baillie Gifford Long Term Global Growth Equity Fund ("Long Term Global Growth Equity Fund"), Baillie Gifford Positive Change Equity Fund ("Positive Change Equity Fund"), Baillie Gifford U.S. Equity Growth Fund ("U.S. Equity Growth Fund") and Baillie Gifford International Choice Fund ("International Choice Fund"), (each, a "Fund", and collectively, the "Funds") is a series of Baillie Gifford Funds (the "Trust"). The investment objective of the the Funds is to achieve capital appreciation, for more detail
on specific objectives of each fund please refer to the Prospectus. The Trust is an open-end management investment company registered under the Investment Company Act of 1940, as amended. The Trust is organized as a Massachusetts business trust under the laws of Massachusetts pursuant to the Second Amended and Restated Agreement and Declaration of Trust dated February 27, 2017 as amended from time to time.
On April 10, 2017, all outstanding Class 1 shares of each Fund were converted to Class 2 shares of the same Fund with the exception of U.S. Equity Growth Fund, where the sole shareholder ceased to hold Class 1 shares and became the sole shareholder of Class K on April 28, 2017.
Effective April 28, 2017, all Funds with the exception of International Choice Fund had two new share classes added, Class K and Institutional Class. The Global Select Equity Fund, International Concentrated Growth Fund and Positive Change Equity Fund had an inception date of December 14, 2017.
Effective beginning May 1, 2017, the Funds ceased to charge the purchase and redemption fees.
The following table is a summary of classes with shares outstanding as of December 31, 2017:
| | | EAFE | | EAFE
Choice | | EAFE
Pure | | Emerging
Markets | | Global
Alpha
Equity | | Global
Select
Equity | | International
Concentrated
Growth | | International
Equity | | Long
Term
Global
Growth
Equity | | Positive
Change
Equity | |
U.S.
Equity
Growth | | International
Choice | |
Class 2 | | | X | | | | X | | | | X | | | | X | | | | X | | | | N/A | | | | N/A | | | | X | | | | X | | | | N/A | | | | N/A | | | | X | | |
Class 3 | | | X | | | | X | | | | X | | | | X | | | | X | | | | N/A | | | | N/A | | | | X | | | | N/A | | | | N/A | | | | N/A | | | | X | | |
Class 4 | | | X | | | | N/A | | | | N/A | | | | N/A | | | | X | | | | N/A | | | | N/A | | | | X | | | | X | | | | N/A | | | | N/A | | | | X | | |
Class 5 | | | X | | | | N/A | | | | N/A | | | | X | | | | N/A | | | | N/A | | | | N/A | | | | X | | | | N/A | | | | N/A | | | | N/A | | | | N/A | | |
Class K | | | X | | | | X | | | | X | | | | X | | | | X | | | | X | | | | X | | | | X | | | | X | | | | X | | | | X | | | | N/A | | |
Institutional
Class | | | X | | | | X | | | | X | | | | X | | | | X | | | | X | | | | X | | | | X | | | | X | | | | X | | | | X | | | | N/A | | |
The Funds are investment companies that apply the accounting and reporting guidance issued in Topic 946 by the U.S. Financial Accounting Standards Board. The financial statements of the Funds have been prepared in conformity with accounting principles generally accepted in the United States of America ("GAAP"). Management is required to make certain estimates and assumptions that affect the reported amounts of assets and liabilities for the Funds and disclosure of contingent assets and liabilities for the Funds at the date of the financial statements and the reported amounts of increases and decreases in net assets from operations for the Funds
during the reporting period. Actual results could differ from those estimates.
The following is a summary of significant accounting policies followed by the Funds:
Valuation of Investments
Equity securities listed on an established securities exchange are normally valued at their last sale price on the exchange where primarily traded. Equity securities
182
Notes to Financial Statements
Annual Report December 31, 2017
listed on the NASDAQ National Market System are valued at the NASDAQ Official Closing Price. Equity securities listed on an established securities exchange or on the NASDAQ National Market System for which there is no reported sale during the day, and in the case of over-the-counter securities not so listed, are valued at the mean between the last available bid and asked prices. Other securities for which current market quotations are not readily available (or for which quotations are not believed to be reliable due to market changes that occur after the most recent available quotations are obtained or any other reason), and all other assets, are taken at fair value as determined in good faith by Baillie Gifford Overseas Limited (the "Manager"), pursuant to procedures approved by the trustees of the Trust (the "Trustees"). The actual calculations may be made by persons acting pursuant to the direction of the Trustees or by pricing services.
Generally, trading in foreign securities markets is substantially completed each day at various times prior to close of regular trading on the New York Stock Exchange. Occasionally, events affecting the value of equity securities of non-U.S. issuers not traded on a U.S. exchange may occur between the completion of substantial trading of such securities for the day and the close of regular trading on the New York Stock Exchange, which events may not be reflected in the computation of a Funds' net asset values. If events materially affecting the value of the Funds' portfolio securities occur during such period, then these securities will be valued at their fair value as determined in good faith by the Manager, pursuant to procedures approved by the Board. The Funds utilize a third party pricing service which for all equity securities, except those traded on a Canadian, Latin American or U.S. exchange, subject to certain minimum confidence levels, applies a fair value adjustment that seeks to reflect changes in such securities' market prices since the close of the market on which they are traded. To the extent that securities are valued using this service, they will be classified as Level 2 securities in the fair value measurement framework described below.
The Funds invest in obligations of foreign entities and securities denominated in foreign currencies. Such investments involve risk not typically involved with domestic investments. Such risks include fluctuations in foreign exchange rates, inability to convert proceeds into U.S. dollars, application of foreign tax laws, foreign investment restrictions, less publicly available information about foreign financial instruments, less
liquidity resulting from substantially less trading volume, more volatile prices, and generally less government supervision of foreign securities markets and issuers.
Fair Value Measurement
GAAP provides guidance on fair value measurements and defines fair value as the price that a Fund would receive to sell an investment or pay to transfer a liability in a timely transaction with an independent buyer in the principal market, or in the absence of a principal market the most advantageous market for the investment or liability. It establishes a single definition of fair value, creates a three-tier hierarchy as a framework for measuring fair value based on inputs used to value the Fund's investments, and requires additional disclosure about fair value. The hierarchy of inputs is summarized below:
Level 1 — unadjusted quoted prices in active markets for identical investments
Level 2 — other significant observable inputs (including quoted prices for similar investments, interest rates, prepayment speeds, credit risk, etc.)
Level 3 — significant unobservable inputs (including the Trust's own assumptions in determining the fair value of investments)
For Level 1 inputs, the Fund's use unadjusted quoted prices in active markets for assets or liabilities with sufficient frequency and volume to provide pricing information as the most reliable evidence of fair value.
The Funds' Level 2 valuation techniques include inputs other than quoted prices within Level 1 that are observable for an asset or liability, either directly or indirectly. Level 2 observable inputs may include quoted prices for similar assets and liabilities in active markets or quoted prices for identical or similar assets or liabilities in markets that are not active in which there are few transactions, the prices are not current, or price quotations vary substantially over time or among market participants. Inputs that are observable for the asset or liability in Level 2 include such factors as interest rates, yield curves, prepayment speeds, credit risk, and default rates for similar liabilities.
For Level 3 valuation techniques, the Funds use unobservable inputs that reflect assumptions market participants would be expected to use in pricing the asset or liability. Unobservable inputs are used to measure fair
183
Notes to Financial Statements
Annual Report December 31, 2017
value to the extent that observable inputs are not available and are developed based on the best information available under the circumstances. In developing unobservable inputs, market participant assumptions are used if they are reasonably available without undue cost and effort.
It is each Fund's policy to recognize transfers in and transfers out at the fair value as of the beginning of the period. The portfolio may hold securities which are periodically fair valued in accordance with the Funds' Pricing and Valuation Procedures. This may result in movements between Levels 1, 2, and 3 throughout the period.
These transfers may result from using third-party vendor modeling tools to reflect any significant market movements between the time at which the Funds valued their securities and the earlier closing of foreign markets. With regard to the transfers from Level 1 into Level 2, quotations were still obtained from the Funds' third party pricing vendor. Pursuant to the Funds' fair value procedures noted previously, equity securities (including exchange traded securities) are generally categorized as Level 1 securities in the fair value hierarchy. Investments for which there are no such quotations, or for which quotations do not appear reliable, are valued at fair value as determined in accordance with procedures established by and under the supervision of the Trustees. These valuations are typically categorized as Level 2 or Level 3 securities in the fair value hierarchy.
The inputs or methodology used for valuing securities are not necessarily an indication of the risk associated with investing in those securities. The hierarchy classification of inputs used to value each Fund's investments at December 31, 2017 is disclosed at the end of each Fund's Portfolio of Investments.
Foreign Currency Translation
The accounting records of the Funds are maintained in U.S. dollars. Foreign currency amounts are translated into U.S. dollars at the applicable rate of exchange to determine the value of investments, assets and liabilities. For the Funds, purchases and sales of securities, and income and expenses are translated at the prevailing rate of exchange on the respective dates of such transactions. The Funds do not isolate that portion of net realized and unrealized gains and losses on investments resulting from changes in foreign exchange rates from the impact arising from changes in market prices. Such fluctuations
are included with net realized and unrealized gain or loss from investments.
Net realized foreign exchange gains and losses arise from sales of foreign currencies, currency gains or losses realized between the trade and settlement dates on securities transactions, and the differences between the amounts of dividends, interest, and foreign withholding taxes recorded on the Funds' books and the U.S. dollar equivalent of the amounts actually received or paid. Net unrealized foreign exchange gains and losses arise from changes in the value of assets and liabilities, other than investments in securities, resulting from changes in the exchange rates.
Securities Transactions and Investment Income
The Funds' securities transactions are recorded on the trade date. Realized gains or losses on sales of investments are determined on the basis of identified cost. Dividend income is recorded on the ex-dividend date.
Investment income, expenses (other than those specific to a particular class of shares), and realized and unrealized gains and losses on investments are allocated to the separate classes of shares based upon their relative net asset value on the date income is earned or expensed and realized and unrealized gains and losses are incurred.
Federal Taxes
Each Fund intends to continue to qualify to be taxed as a "regulated investment company" under the provisions of the U.S. Internal Revenue Code of 1986, as amended (the "Code"), and as such will not be subject to U.S. federal income tax on income (including any net realized capital gains) which is distributed in accordance with the provisions of the Code to the Funds' shareholders. Therefore, no U.S. federal income tax provision is required.
Investment income received from investments in foreign jurisdictions may be subject to foreign withholding tax. Whenever possible, the Funds will attempt to operate so as to qualify for reduced tax rates or tax exemptions in those countries with which the United States has a tax treaty. Foreign taxes, if any, net of any reclaims, are recorded based on the tax regulations and rates that exist in the foreign markets in which the Funds invest.
184
Notes to Financial Statements
Annual Report December 31, 2017
In addition to the requirements of the Code, the Funds may also be subject to capital gains tax in India and potentially other foreign jurisdictions on gains realized upon sale of Indian securities, payable upon repatriation of sales proceeds. Any realized losses in excess of gains may be carried forward to offset future gains. Funds with exposure to Indian securities and potentially other foreign jurisdictions accrue a deferred liability for unrealized gains in excess of available loss carryforwards on Indian securities based on existing tax rates and holding periods of the securities. As of December 31, 2017, the Emerging Markets Fund recorded a deferred liability for potential future Indian capital gains taxes of $8,631,321. As of December 31, 2017 Global Alpha Fund recorded a deferred liability for potential future India capital gains taxes of $247,657. As of December 31, 2017 International Choice recorded a deferred liability for potential future India capital gains taxes of $76,371.
The Funds are subject to tax accounting standards that provide guidance for how certain and uncertain tax positions should be recognized, measured, presented and disclosed in the financial statements. These standards require the evaluation of tax positions taken or expected to be taken in the course of preparing the Funds' tax
returns to determine whether the tax positions are "more-likely-than-not" of being sustained by the applicable tax authority. Tax positions not deemed to meet the "more-likely-than-not" threshold would be recorded as a reduction in a tax benefit or expense in the current year. Management has evaluated the application of these standards and has determined no liabilities for income tax related expenses are required in the financial statements of the Funds. For the International Equity Fund, EAFE Fund, EAFE Choice Fund, Emerging Markets Fund, Global Alpha Equity Fund, International Choice Fund, EAFE Pure Fund and Long Term Global Growth Equity Fund, the tax periods 2015 through present remain subject to examination. For the U.S. Equity Growth Fund, the tax period ended 2016 through present remain subject to examination. For the Global Select Equity Fund, International Concentrated Growth Fund and Positive Change Equity Fund, the tax period ended 2017 is subject to examination.
At December 31, 2017 for Federal income tax purposes, the following Fund has capital loss carryforwards available to offset future capital gains indefinitely. To the extent that these loss carryforwards are utilized, capital gains so offset will not be distributed to shareholders.
Fund | | Short Term
Capital Loss
No Expiration | | Long Term
Capital Loss
No Expiration | | Capital
Loss
Available
Total | |
International Choice | | | — | | | $ | 6,374,949 | | | $ | 6,374,949 | | |
During the year ended December 31, 2017, the following Funds utilized capital loss carryforwards:
Fund | | Utilized | |
EAFE Choice | | $ | 7,507,574 | | |
EAFE Pure | | | 3,684,286 | | |
Emerging Markets | | | 27,705,851 | | |
Global Alpha Equity | | | 18,762,547 | | |
International Choice | | | 8,852,010 | | |
Realized capital losses, currency losses and passive foreign investment company ("PFIC") losses incurred after October 31 ("post-October losses/Late-Year Specified") within the taxable year are deemed to arise
on the first business day of each Fund's next taxable year. During the year or period ended December 31, 2017, the Funds shown below incurred and will elect to defer net post-October or late-year losses as indicated.
185
Notes to Financial Statements
Annual Report December 31, 2017
At December 31, 2017, the components of accumulated earnings on tax basis were as follows:
Fund | | Undistributed
Net Ordinary
Income | | Long Term
Capital
Gains | | Capital
Loss
Carryforwards | | Post October
Capital/Currency
Losses/Late year
ordinary losses | | Net Unrealized
Appreciation/
Depreciation on
Investments
and Foreign
Currencies | | Total
Accumulated
Earnings/
Deficit | |
EAFE | | $ | 44,387 | | | $ | 42,600,167 | | | $ | — | | | $ | — | | | $ | 1,260,846,798 | | | $ | 1,303,491,352 | | |
EAFE Choice | | | — | | | | 1,902,080 | | | | — | | | | (469,763 | ) | | | 84,192,674 | | | | 85,624,991 | | |
EAFE Pure | | | — | | | | 2,237,108 | | | | — | | | | (731,523 | ) | | | 48,400,389 | | | | 49,905,974 | | |
Emerging Markets | | | — | | | | 93,545,579 | | | | — | | | | (479,011 | ) | | | 598,630,696 | | | | 691,697,264 | | |
Global Alpha Equity | | | 1,559,743 | | | | 14,653,534 | | | | — | | | | — | | | | 349,813,029 | | | | 366,026,306 | | |
Global Select Equity | | | 766 | | | | — | | | | — | | | | — | | | | 44,437 | | | | 45,203 | | |
International
Concentrated
Growth | | | — | | | | — | | | | — | | | | — | | | | 6,620 | | | | 6,620 | | |
International Equity | | | 3,304,560 | | | | 14,328,681 | | | | — | | | | — | | | | 877,987,970 | | | | 895,621,211 | | |
Long Term Global
Growth Equity | | | — | | | | 3,906,506 | | | | — | | | | (22,229 | ) | | | 50,023,604 | | | | 53,907,881 | | |
Positive Change Equity | | | — | | | | — | | | | — | | | | (138 | ) | | | 16,710 | | | | 16,572 | | |
U.S. Equity Growth | | | 9,266 | | | | — | | | | — | | | | — | | | | 329,754 | | | | 339,020 | | |
International Choice | | | — | | | | — | | | | (6,374,949 | ) | | | (532,464 | ) | | | 119,044,415 | | | | 112,137,002 | | |
The differences between the components of distributable earnings on a tax basis and the amounts reflected in the Statements of Assets and Liabilities are primarily due to the differing book/tax treatment of realized losses on wash sales and mark to market income on securities categorized as PFICs.
For the year ended December 31, 2017, the following reclassifications have been made on the Statements of Assets and Liabilities as a result of certain differences in the computation of net investment income and net realized capital gains under U.S. federal income tax rules and regulations versus GAAP, such as the treatment of foreign currency gains and losses and the redesignation of dividends.
Fund | | Undistributed
(Distributions in
Excess of) Net
Investment Income | | Accumulated Net
Realized Gains
(Losses) on
Investments and
Foreign Currency
Transactions | | Paid-in
Capital | |
EAFE | | $ | 1,784,910 | | | $ | (1,784,910 | ) | | $ | — | | |
EAFE Choice | | | (7,649 | ) | | | 7,649 | | | | — | | |
EAFE Pure | | | 74,108 | | | | (74,108 | ) | | | — | | |
Emerging Markets | | | 2,270,133 | | | | (2,270,133 | ) | | | — | | |
Global Alpha Equity | | | 139,122 | | | | (139,122 | ) | | | — | | |
Global Select Equity | | | (2,309 | ) | | | 2,309 | | | | — | | |
International Concentrated Growth | | | 302 | | | | 1,608 | | | | (1,910 | ) | |
International Equity | | | (278,517 | ) | | | 278,517 | | | | — | | |
Long Term Global Growth Equity | | | 503,154 | | | | 41,518 | | | | (544,672 | ) | |
Positive Change Equity | | | 69 | | | | 138 | | | | (207 | ) | |
U.S. Equity Growth | | | 3,236 | | | | (3,236 | ) | | | — | | |
International Choice | | | (43,089 | ) | | | 43,090 | | | | (1 | ) | |
186
Notes to Financial Statements
Annual Report December 31, 2017
Dividends and Distributions to Shareholders
The Funds intend to distribute each year, as dividends, substantially all net investment income and net capital gains realized. All such dividends or distributions are credited in the form of additional shares of the Funds at net asset value on the ex-dividend date unless the
shareholder elects to receive dividends and distributions in cash. Currently, the Funds' policies are to distribute net investment income and net capital gains on an annual basis. Such distributions are determined in conformity with U.S. federal income tax regulations, which may differ from GAAP.
For the years or periods ended December 31, 2017 and December 31, 2016, the tax characters of the dividends paid were:
Fund | | Ordinary
Income
2017 | | Long Term
Capital Gains
2017 | | Return of
Capital
2017 | | Ordinary
Income
2016 | | Long Term
Capital Gains
2016 | | Return of
Capital
2016 | |
EAFE | | $ | 19,751,226 | | | $ | 48,725,790 | | | $ | — | | | $ | 15,659,306 | | | $ | 101,073,397 | | | $ | — | | |
EAFE Choice | | | 4,719,038 | | | | — | | | | — | | | | 3,673,930 | | | | — | | | | — | | |
EAFE Pure | | | 5,473,971 | | | | — | | | | — | | | | 2,430,664 | | | | — | | | | — | | |
Emerging Markets | | | 19,863,377 | | | | 13,157,890 | | | | — | | | | 12,494,261 | | | | — | | | | 207,935 | | |
Global Alpha Equity | | | 8,003,422 | | | | 32,552,970 | | | | — | | | | 5,050,014 | | | | 2,554,846 | | | | — | | |
Global Select Equity | | | — | | | | — | | | | — | | | | — | | | | — | | | | — | | |
International Concentrated
Growth | | | — | | | | — | | | | — | | | | — | | | | — | | | | — | | |
International Equity | | | 22,247,527 | | | | 51,665,372 | | | | — | | | | 24,716,327 | | | | 23,695,901 | | | | — | | |
Long Term Global Growth Equity | | | — | | | | — | | | | — | | | | — | | | | 478,647 | | | | — | | |
Positive Change Equity | | | — | | | | — | | | | — | | | | — | | | | — | | | | — | | |
U.S. Equity Growth | | | 5,513 | | | | — | | | | — | | | | — | | | | — | | | | — | | |
International Choice | | | 6,402,464 | | | | — | | | | — | | | | 4,399,276 | | | | — | | | | — | | |
For tax purposes, short-term capital gain distributions, if any, are considered ordinary income distributions.
Note B — Investment Management and Other Services
The Funds are advised and managed by the Manager. The Manager, an investment adviser registered with the Securities and Exchange Commission (the "SEC"), is a wholly owned subsidiary of Baillie Gifford & Co.
Under an investment advisory agreement between the Manager and the Trust on behalf of the Funds (the "Advisory Agreeement"), each Fund paid the Manager an investment advisory fee, in arrears, for the year or period ended December 31, 2017.
Effective May 1, 2017, the fee paid by each Fund under the Advisory Agreement is subject to the breakpoints reflected in the table below. The fee is calculated and acrrued daily as percentage of the average daily net assets of each Fund and is paid quarterly.
| Fund | | Average Daily Net Assets
of the Fund (millions) | | Annual Rate at
Each Asset Level | |
EAFE
| | $0 - $2,000
> $2,000 - $5,000
Above $5,000 | | | 0.35%
0.31%
0.29% | | |
EAFE Choice
| | $0 - $2,000
> $2,000 - $5,000
Above $5,000 | | | 0.35%
0.31%
0.29% | | |
187
Notes to Financial Statements
Annual Report December 31, 2017
| Fund | | Average Daily Net Assets
of the Fund (millions) | | Annual Rate at
Each Asset Level | |
EAFE Pure
| | $0 - $2,000
> $2,000 - $5,000
Above $5,000 | | | 0.35%
0.31%
0.29% | | |
Emerging Markets
| | $0 - $2,000
> $2,000 - $5,000
Above $5,000 | | | 0.55%
0.51%
0.49% | | |
Global Alpha Equity
| | $0 - $2,000
> $2,000 - $5,000
Above $5,000 | | | 0.40%
0.36%
0.34% | | |
Global Select Equity
| | $0 - $2,000
> $2,000 - $5,000
Above $5,000 | | | 0.33%
0.29%
0.27% | | |
International Concentrated Growth
| | $0 - $2,000
> $2,000 - $5,000
Above $5,000 | | | 0.40%
0.36%
0.34% | | |
International Equity
| | $0 - $2,000
> $2,000 - $5,000
Above $5,000 | | | 0.35%
0.31%
0.29% | | |
Long Term Global Growth Equity
| | $0 - $2,000
> $2,000 - $5,000
Above $5,000 | | | 0.45%
0.41%
0.39% | | |
Positive Change Equity
| | $0 - $2,000
> $2,000 - $5,000
Above $5,000 | | | 0.33%
0.29%
0.27% | | |
U.S. Equity Growth
| | $0 - $2,000
> $2,000 - $5,000
Above $5,000 | | | 0.33%
0.29%
0.27% | | |
International Choice
| | $0 - $2,000
> $2,000 - $5,000
Above $5,000 | | | 0.35%
0.31%
0.29% | | |
Prior to April 30, 2017, the advisory fees paid by the Funds were as follows:
Fund | | Annual Rate | |
EAFE | | | 0.35 | % | |
EAFE Choice | | | 0.35 | % | |
EAFE Pure | | | 0.35 | % | |
Emerging Markets | | | 0.55 | % | |
Global Alpha Equity | | | 0.40 | % | |
International Equity | | | 0.35 | % | |
Long Term Global Growth Equity | | | 0.45 | % | |
U.S. Equity Growth | | | 0.25 | % | |
International Choice | | | 0.35 | % | |
188
Notes to Financial Statements
Annual Report December 31, 2017
Effective May 1, 2017, advisory fees for all classes paid by each Fund under the Advisory Agreement are subjected to breakpoints for Fund assets above $2 billion and $5 billion.
The Manager has contractually agreed to waive its fees and/or bear expenses of the Long Term Global Growth Equity Fund through April 30, 2018 to the extent that such Fund's Total Annual Fund Operating Expenses (excluding interest, taxes and extraordinary expenses) exceed 0.77% for Class 2 shares, 0.70% for Class 3 shares, 0.67% for Class 4 shares, 0.62% for Class 5 shares, 0.77% for Class K shares, and 0.92% for Institutional Class shares.
The Manager has also contractually agreed to waive its fees and/or bear expenses of the U.S. Equity Growth Fund through April 30, 2018 to the extent that the Fund's Total Annual Operating Expenses (excluding interest, taxes and extraordinary expenses) exceed 0.57% for Class K shares, and 0.72% for Institutional Class shares.
The Manager has also contractually agreed to waive its fees and/or bear expenses of the Global Select Equity Fund & Positive Change Equity Fund through April 30, 2019 to the extent that the Funds' Total Annual Operating Expenses (excluding interest, taxes and extraordinary expenses) exceed 0.65% for Class K shares, and 0.80% for Institutional Class shares.
The Manager has contractually agreed to waive its fees and/or bear expenses of the International Concentrated Growth Fund through April 30, 2019 to the extent that such Fund's Total Annual Fund Operating Expenses (excluding interest, taxes and extraordinary expenses) exceed 0.72% for Class K shares, and 0.87% for Institutional Class shares.
Waived fees for all Funds are not subject to recoupment.
Baillie Gifford Funds Services LLC ("BGFS"), a wholly-owned subsidiary of the Manager, serves as the sole distributor and principal underwriter of the shares of the Funds.
Each Fund (other than the Global Select Equity Fund, the International Concentrated Growth Fund, the Positive Change Equity and the U.S. Equity Growth Fund) has adopted a Shareholder Servicing Plan providing that the Fund may pay the Manager, or any other entity that acts from time to time as the shareholder servicing agent with respect to a class of Fund shares, for services rendered and expenses borne in connection with the provision of services provided to Fund investors and/or the maintenance of shareholder accounts. For these services, the Funds pay the Manager a fee at the annualized rate of the Funds' average daily net assets attributed to each class of share as follows:
| | | EAFE | | EAFE
Choice | | EAFE
Pure | | Emerging
Markets | | Global Alpha
Equity | | International
Equity | | Long Term
Global
Growth
Equity | | International
Choice | |
Class 2 | | | 0.17 | % | | | 0.17 | % | | | 0.17 | % | | | 0.17 | % | | | 0.17 | % | | | 0.17 | % | | | 0.17 | % | | | 0.17 | % | |
Class 3 | | | 0.10 | % | | | 0.10 | % | | | 0.10 | % | | | 0.10 | % | | | 0.10 | % | | | 0.10 | % | | | 0.10 | % | | | 0.10 | % | |
Class 4 | | | 0.07 | % | | | 0.07 | % | | | 0.07 | % | | | 0.07 | % | | | 0.07 | % | | | 0.07 | % | | | 0.07 | % | | | 0.07 | % | |
Class 5 | | | 0.02 | % | | | 0.02 | % | | | 0.02 | % | | | 0.02 | % | | | 0.02 | % | | | 0.02 | % | | | 0.02 | % | | | 0.02 | % | |
With respect to Class K and Institutional Class shares, the Manager is responsible for providing certain administrative services to Fund shareholders as well as coordinating, overseeing and supporting services provided to Fund shareholders by third parties, including financial intermediaries that hold accounts with the Funds, pursuant to an Administration and Supervisory Agreement between the Manager and the Trust on behalf of each Fund. Each Fund other than the International Choice Fund has adopted an Administration, Supervisory and Sub-Accounting Services Plan with respect to Class K and Institutional Class shares of each Fund, which authorizes each Fund to pay the Manager an Administration and Supervisory Fee quarterly, in arrears, with respect to Class K and Institutional Class shares at an annual rate of 0.17% of such Fund's average net assets.
The Bank of New York Mellon serves as the Funds' administrator and custodian. BNY Mellon Investment Servicing (U.S.) Inc. serves as the Trust's transfer agent, registrar and dividend disbursing agent.
189
Notes to Financial Statements
Annual Report December 31, 2017
Note C — Investment Transactions
Purchases and proceeds from sales of securities (excluding in-kind purchases and redemptions and short-term securities) for the year or period ended December 31, 2017 were as follows:
Fund | | Purchases | | Sales | |
EAFE | | $ | 240,331,073 | | | $ | 596,129,839 | | |
EAFE Choice | | | 37,788,111 | | | | 107,251,471 | | |
EAFE Pure | | | 124,248,381 | | | | 55,752,796 | | |
Emerging Markets | | | 564,943,207 | | | | 898,434,990 | | |
Global Alpha Equity | | | 278,321,058 | | | | 264,683,757 | | |
Global Select Equity | | | 2,957,454 | | | | — | | |
International Concentrated Growth | | | 979,387 | | | | — | | |
International Equity | | | 225,013,606 | | | | 342,954,331 | | |
Long Term Global Growth Equity | | | 82,928,206 | | | | 15,977,768 | | |
Positive Change Equity | | | 974,533 | | | | — | | |
U.S. Equity Growth | | | 177,029 | | | | 261,905 | | |
International Choice | | | 102,925,386 | | | | 52,208,251 | | |
The Funds' cost of investments and gross unrealized appreciation (depreciation) at December 31, 2017 for U.S. federal income tax purposes were as follows:
Fund | | Cost of
Investments | | Gross
Appreciation | | Gross
Depreciation | | Net
Appreciation | |
EAFE | | $ | 1,501,421,391 | | | $ | 1,393,498,788 | | | $ | (132,726,375 | ) | | $ | 1,260,772,413 | | |
EAFE Choice | | | 220,589,746 | | | | 101,156,822 | | | | (16,980,534 | ) | | | 84,176,288 | | |
EAFE Pure | | | 252,427,580 | | | | 61,901,344 | | | | (13,515,597 | ) | | | 48,385,747 | | |
Emerging Markets | | | 1,089,634,793 | | | | 643,487,889 | | | | (36,241,028 | ) | | | 607,246,861 | | |
Global Alpha Equity | | | 785,107,091 | | | | 389,449,517 | | | | (39,403,242 | ) | | | 350,046,275 | | |
Global Select Equity | | | 2,960,940 | | | | 74,543 | | | | (30,107 | ) | | | 44,436 | | |
International Concentrated Growth | | | 979,387 | | | | 19,896 | | | | (13,276 | ) | | | 6,620 | | |
International Equity | | | 1,211,949,065 | | | | 979,587,725 | | | | (101,642,696 | ) | | | 877,945,029 | | |
Long Term Global Growth Equity | | | 135,716,536 | | | | 52,797,651 | | | | (2,775,411 | ) | | | 50,022,240 | | |
Positive Change Equity | | | 974,533 | | | | 28,032 | | | | (11,322 | ) | | | 16,710 | | |
U.S. Equity Growth | | | 923,823 | | | | 359,179 | | | | (29,425 | ) | | | 329,754 | | |
International Choice | | | 383,559,181 | | | | 153,719,841 | | | | (34,618,944 | ) | | | 119,100,897 | | |
190
Notes to Financial Statements
Annual Report December 31, 2017
Note D — Transactions in Shares of Beneficial Interest
| | | EAFE Fund | |
| | | Class 1 Shares
For the
Period Ended
December 31, 2017 | | Class 2 Shares
For the
Year Ended
December 31, 2017 | |
| | | Shares | | Amount | | Shares | | Amount | |
Shares sold | | | 142 | | | $ | 1,508 | | | | 9,465,027 | ** | | $ | 109,733,985 | ** | |
Purchase fees | | | — | | | | 279 | | | | — | | | | 11,880 | | |
Redemption fees | | | — | | | | 100 | | | | — | | | | 16,484 | | |
Shares issued in reinvestment of dividends and distributions | | | — | | | | — | | | | 1,211,109 | | | | 17,464,610 | | |
Shares redeemed | | | (1,838,303 | )* | | | (20,817,261 | )* | | | (31,363,941 | ) | | | (437,863,539 | ) | |
Net increase (decrease) | | | (1,838,161 | ) | | $ | (20,815,374 | ) | | | (20,687,805 | ) | | $ | (310,636,580 | ) | |
| | | EAFE Fund | |
| | | Class 3 Shares
For the
Year Ended
December 31, 2017 | | Class 4 Shares
For the
Year Ended
December 31, 2017 | |
| | | Shares | | Amount | | Shares | | Amount | |
Shares sold | | | 7,588,420 | | | $ | 110,142,876 | | | | 1,895,088 | | | $ | 25,000,000 | | |
Purchase fees | | | — | | | | 6,994 | | | | — | | | | 3,256 | | |
Redemption fees | | | — | | | | 8,105 | | | | — | | | | 4,201 | | |
Shares issued in reinvestment of dividends and distributions | | | 1,024,175 | | | | 14,798,611 | | | | 518,970 | | | | 7,503,626 | | |
Shares redeemed | | | (9,802,341 | ) | | | (122,361,558 | ) | | | (1,409,453 | ) | | | (20,000,000 | ) | |
Net increase (decrease) | | | (1,189,746 | ) | | $ | 2,595,028 | | | | 1,004,605 | | | $ | 12,511,083 | | |
| | | EAFE Fund | |
| | | Class 5 Shares
For the
Year Ended
December 31, 2017 | | Class K Shares
For the
Period Ended
December 31, 2017 | |
| | | Shares | | Amount | | Shares | | Amount | |
Shares sold | | | — | | | $ | — | | | | 416 | | | $ | 5,000 | | |
Purchase fees | | | — | | | | 12,563 | | | | — | | | | — | | |
Redemption fees | | | — | | | | 16,205 | | | | — | | | | — | | |
Shares issued in reinvestment of dividends and distributions | | | 1,981,299 | | | | 28,702,684 | | | | 10 | | | | 150 | | |
Shares redeemed | | | — | | | | — | | | | — | | | | — | | |
Net increase | | | 1,981,299 | | | $ | 28,731,452 | | | | 426 | | | $ | 5,150 | | |
* 1,580,441 shares and $17,964,404 converted from Class 1 into Class 2.
** 1,573,520 shares and $17,964,404 converted into Class 2 from Class 1.
191
Notes to Financial Statements
Annual Report December 31, 2017
| | | EAFE Fund | |
| | | Institutional Class Shares
For the
Period Ended
December 31, 2017 | |
| | | Shares | | Amount | |
Shares sold | | | 416 | | | $ | 5,000 | | |
Purchase fees | | | — | | | | — | | |
Redemption fees | | | — | | | | — | | |
Shares issued in reinvestment of dividends and distributions | | | 10 | | | | 150 | | |
Shares redeemed | | | — | | | | — | | |
Net increase | | | 426 | | | $ | 5,150 | | |
| | | EAFE Fund | |
| | | Class 1 Shares
For the
Period Ended
December 31, 2016 | | Class 2 Shares
For the
Year Ended
December 31, 2016 | |
| | | Shares | | Amount | | Shares | | Amount | |
Shares sold | | | 4,698,114 | | | $ | 47,348,253 | | | | 6,086,887 | | | $ | 63,886,179 | | |
Purchase fees | | | — | | | | 1,029 | | | | — | | | | 34,321 | | |
Redemption fees | | | — | | | | 1,595 | | | | — | | | | 32,039 | | |
Shares issued in reinvestment of dividends and distributions | | | 96,772 | | | | 969,616 | | | | 3,840,670 | | | | 38,642,083 | | |
Shares redeemed | | | (2,956,724 | ) | | | (30,384,500 | ) | | | (6,964,934 | ) | | | (72,383,976 | ) | |
Net increase | | | 1,838,162 | | | $ | 17,935,993 | | | | 2,962,623 | | | $ | 30,210,646 | | |
| | | EAFE Fund | |
| | | Class 3 Shares
For the
Year Ended
December 31, 2016 | | Class 4 Shares
For the
Period Ended
December 31, 2016 | |
| | | Shares | | Amount | | Shares | | Amount | |
Shares sold | | | 19,421,551 | | | $ | 197,212,132 | | | | 18,892,940 | | | $ | 217,043,346 | | |
Purchase fees | | | — | | | | 28,671 | | | | — | | | | 2,941 | | |
Redemption fees | | | — | | | | 27,583 | | | | — | | | | 2,280 | | |
Shares issued in reinvestment of dividends and distributions | | | 2,333,635 | | | | 23,564,955 | | | | 1,063,818 | | | | 10,705,515 | | |
Shares redeemed | | | (25,372,008 | ) | | | (284,259,708 | ) | | | (18,867,216 | ) | | | (191,724,888 | ) | |
Net increase (decrease) | | | (3,616,822 | ) | | $ | (63,426,367 | ) | | | 1,089,542 | | | $ | 36,029,194 | | |
192
Notes to Financial Statements
Annual Report December 31, 2017
| | | EAFE Fund | |
| | | Class 5 Shares
For the
Year Ended
December 31, 2016 | |
| | | Shares | | Amount | |
Shares sold | | | — | | | $ | — | | |
Purchase fees | | | — | | | | 36,592 | | |
Redemption fees | | | — | | | | 34,541 | | |
Shares issued in reinvestment of dividends and distributions | | | 4,195,386 | | | | 42,410,685 | | |
Shares redeemed | | | — | | | | — | | |
Net increase | | | 4,195,386 | | | $ | 42,481,818 | | |
| | | EAFE Choice Fund | |
| | | Class 1 Shares
For the
Period Ended
December 31, 2017 | | Class 2 Shares
For the
Year Ended
December 31, 2017 | |
| | | Shares | | Amount | | Shares | | Amount | |
Shares sold | | | 117 | | | $ | 1,497 | | | | 139,266 | ** | | $ | 2,010,737 | ** | |
Purchase fees | | | — | | | | — | | | | — | | | | 1,361 | | |
Redemption fees | | | — | | | | — | | | | — | | | | 4,257 | | |
Shares issued in reinvestment of dividends and distributions | | | — | | | | — | | | | 265,970 | | | | 4,282,725 | | |
Shares redeemed | | | (352 | )* | | | (4,741 | )* | | | (4,847,568 | ) | | | (76,008,120 | ) | |
Net decrease | | | (235 | ) | | $ | (3,244 | ) | | | (4,442,332 | ) | | $ | (69,709,040 | ) | |
| | | EAFE Choice Fund | |
| | | Class 3 Shares
For the
Year Ended
December 31, 2017 | | Class K Shares
For the
Period Ended
December 31, 2017 | |
| | | Shares | | Amount | | Shares | | Amount | |
Shares sold | | | 176,660 | | | $ | 2,591,699 | | | | 353 | | | $ | 5,000 | | |
Purchase fees | | | — | | | | 100 | | | | — | | | | — | | |
Redemption fees | | | — | | | | 317 | | | | — | | | | — | | |
Shares issued in reinvestment of dividends and distributions | | | 26,628 | | | | 432,754 | | | | 6 | | | | 92 | | |
Shares redeemed | | | (128,175 | ) | | | (1,910,571 | ) | | | — | | | | — | | |
Net increase (decrease) | | | 75,113 | | | $ | 1,114,299 | | | | 359 | | | $ | 5,092 | | |
* 352 shares and $4,741 converted from Class 1 into Class 2.
** 348 shares and $4,741 converted into Class 2 from Class 1.
193
Notes to Financial Statements
Annual Report December 31, 2017
| | | EAFE Choice Fund | |
| | | Institutional Class Shares
For the
Period Ended
December 31, 2017 | |
| | | Shares | | Amount | |
Shares sold | | | 12,471 | | | $ | 199,000 | | |
Purchase fees | | | — | | | | — | | |
Redemption fees | | | — | | | | — | | |
Shares issued in reinvestment of dividends and distributions | | | 6 | | | | 98 | | |
Shares redeemed | | | — | | | | — | | |
Net increase (decrease) | | | 12,477 | | | $ | 199,098 | | |
| | | EAFE Choice Fund | |
| | | Class 1 Shares
For the
Period Ended
December 31, 2016 | | Class 2 Shares
For the
Year Ended
December 31, 2016 | |
| | | Shares | | Amount | | Shares | | Amount | |
Shares sold | | | 870,137 | | | $ | 10,978,072 | | | | 5,205,400 | | | $ | 64,883,358 | | |
Purchase fees | | | — | | | | 7,278 | | | | — | | | | 100,782 | | |
Redemption fees | | | — | | | | 781 | | | | — | | | | 24,442 | | |
Shares issued in reinvestment of dividends and distributions | | | 3 | | | | 39 | | | | 275,500 | | | | 3,413,749 | | |
Shares redeemed | | | (2,438,388 | ) | | | (30,703,470 | ) | | | (1,882,174 | ) | | | (24,097,363 | ) | |
Net increase (decrease) | | | (1,568,248 | ) | | $ | (19,717,300 | ) | | | 3,598,726 | | | $ | 44,324,968 | | |
| | | EAFE Choice Fund | |
| | | Class 3 Shares
For the
Year Ended
December 31, 2016 | |
| | | Shares | | Amount | |
Shares sold | | | 214,939 | | | $ | 2,715,447 | | |
Purchase fees | | | — | | | | 8,214 | | |
Redemption fees | | | — | | | | 1,724 | | |
Shares issued in reinvestment of dividends and distributions | | | 20,799 | | | | 260,142 | | |
Shares redeemed | | | (210,489 | ) | | | (2,710,863 | ) | |
Net increase | | | 25,249 | | | $ | 274,664 | | |
194
Notes to Financial Statements
Annual Report December 31, 2017
| | | EAFE PURE Fund | |
| | | Class 1 Shares
For the
Period Ended
December 31, 2017 | | Class 2 Shares
For the
Year Ended
December 31, 2017 | |
| | | Shares | | Amount | | Shares | | Amount | |
Shares sold | | | 154 | | | $ | 1,497 | | | | 1,993,899 | ** | | $ | 19,968,711 | ** | |
Purchase fees | | | — | | | | 5 | | | | — | | | | 198,413 | | |
Redemption fees | | | — | | | | — | | | | — | | | | 3,003 | | |
Shares issued in reinvestment of dividends and distributions | | | — | | | | — | | | | 327,488 | | | | 3,944,235 | | |
Shares redeemed | | | (461 | )* | | | (4,715 | )* | | | (2,015,092 | ) | | | (23,503,003 | ) | |
Net increase (decrease) | | | (307 | ) | | $ | (3,213 | ) | | | 306,295 | | | $ | 611,359 | | |
| | | EAFE PURE Fund | |
| | | Class 3 Shares
For the
Year Ended
December 31, 2017 | | Class K Shares
For the
Period Ended
December 31, 2017 | |
| | | Shares | | Amount | | Shares | | Amount | |
Shares sold | | | 7,086,028 | | | $ | 74,325,352 | | | | 466 | | | $ | 5,000 | | |
Purchase fees | | | — | | | | 1 | | | | — | | | | — | | |
Redemption fees | | | — | | | | — | | | | — | | | | — | | |
Shares issued in reinvestment of dividends and distributions | | | 125,774 | | | | 1,529,525 | | | | 9 | | | | 105 | | |
Shares redeemed | | | (432,822 | ) | | | (5,000,000 | ) | | | — | | | | — | | |
Net increase | | | 6,778,980 | | | $ | 70,854,878 | | | | 475 | | | $ | 5,105 | | |
| | | EAFE PURE Fund | |
| | | Institutional Class Shares
For the
Period Ended
December 31, 2017 | |
| | | Shares | | Amount | |
Shares sold | | | 466 | | | $ | 5,000 | | |
Purchase fees | | | — | | | | — | | |
Redemption fees | | | — | | | | — | | |
Shares issued in reinvestment of dividends and distributions | | | 9 | | | | 105 | | |
Shares redeemed | | | — | | | | — | | |
Net increase | | | 475 | | | $ | 5,105 | | |
* 461 shares and $4,715 converted from Class 1 into Class 2.
** 457 shares and $4,715 converted into Class 2 from Class 1.
195
Notes to Financial Statements
Annual Report December 31, 2017
| | | EAFE PURE Fund | |
| | | Class 1 Shares
For the
Period Ended
December 31, 2016 | | Class 2 Shares
For the
Year Ended
December 31, 2016 | |
| | | Shares | | Amount | | Shares | | Amount | |
Shares sold | | | 303 | | | $ | 2,994 | | | | — | | | $ | — | | |
Purchase fees | | | — | | | | — | | | | — | | | | 6 | | |
Redemption fees | | | — | | | | — | | | | — | | | | — | | |
Shares issued in reinvestment of dividends and distributions | | | 5 | | | | 44 | | | | 256,259 | | | | 2,430,621 | | |
Shares redeemed | | | — | | | | — | | | | — | | | | — | | |
Net increase | | | 308 | | | $ | 3,038 | | | | 256,259 | | | $ | 2,430,627 | | |
| | | Emerging Markets Fund | |
| | | Class 1 Shares
For the
Period Ended
December 31, 2017 | | Class 2 Shares
For the
Year Ended
December 31, 2017 | |
| | | Shares | | Amount | | Shares | | Amount | |
Shares sold | | | 96 | | | $ | 1,497 | | | | 2,787,599 | ** | | $ | 49,650,731 | ** | |
Purchase fees | | | — | | | | 281 | | | | — | | | | 4,567 | | |
Redemption fees | | | — | | | | — | | | | — | | | | 4,199 | | |
Shares issued in reinvestment of dividends and distributions | | | — | | | | — | | | | 167,120 | | | | 3,767,062 | | |
Shares redeemed | | | (500,747 | )* | | | (8,699,086 | )* | | | (2,033,116 | ) | | | (45,405,788 | ) | |
Net increase (decrease) | | | (500,651 | ) | | $ | (8,697,308 | ) | | | 921,603 | | | $ | 8,020,771 | | |
| | | Emerging Markets Fund | |
| | | Class 3 Shares
For the
Year Ended
December 31, 2017 | | Class 5 Shares
For the
Year Ended
December 31, 2017 | |
| | | Shares | | Amount | | Shares | | Amount | |
Shares sold | | | — | | | $ | — | | | | — | | | $ | — | | |
Purchase fees | | | — | | | | 4,814 | | | | — | | | | 40,345 | | |
Redemption fees | | | — | | | | 3,560 | | | | — | | | | 29,835 | | |
Shares issued in reinvestment of dividends and distributions | | | 165,344 | | | | 3,756,892 | | | | 1,034,998 | | | | 24,116,683 | | |
Shares redeemed | | | — | | | | — | | | | (17,316,669 | ) | | | (396,049,578 | ) | |
Net increase (decrease) | | | 165,344 | | | $ | 3,765,266 | | | | (16,281,671 | ) | | $ | (371,862,715 | ) | |
* 500,747 shares and $8,699,086 converted from Class 1 into Class 2.
** 492,613 shares and $8,699,086 converted into Class 2 from Class 1.
196
Notes to Financial Statements
Annual Report December 31, 2017
| | | Emerging Markets Fund | |
| | | Class K Shares
For the
Period Ended
December 31, 2017 | | Institutional
Class Shares
For the
Period Ended
December 31, 2017 | |
| | | Shares | | Amount | | Shares | | Amount | |
Shares sold | | | 4,741,936 | | | $ | 98,891,235 | | | | 274 | | | $ | 5,000 | | |
Purchase fees | | | — | | | | — | | | | — | | | | — | | |
Redemption fees | | | — | | | | — | | | | — | | | | — | | |
Shares issued in reinvestment of dividends and distributions | | | 59,488 | | | | 1,339,105 | | | | 5 | | | | 121 | | |
Shares redeemed | | | (1,583,086 | ) | | | (35,000,000 | ) | | | — | | | | — | | |
Net increase | | | 3,218,338 | | | $ | 65,230,340 | | | | 279 | | | $ | 5,121 | | |
| | | Emerging Markets Fund | |
| | | Class 1 Shares
For the
Period Ended
December 31, 2016 | | Class 2 Shares
For the
Year Ended
December 31, 2016 | |
| | | Shares | | Amount | | Shares | | Amount | |
Shares sold | | | 496,351 | | | $ | 7,035,259 | | | | 4,229,576 | | | $ | 69,655,261 | | |
Purchase fees | | | — | | | | 809 | | | | — | | | | 35,040 | | |
Redemption fees | | | — | | | | 14 | | | | — | | | | 1,637 | | |
Shares issued in reinvestment of dividends and distributions | | | 4,300 | | | | 63,550 | | | | 73,367 | | | | 1,102,014 | | |
Shares redeemed | | | — | | | | — | | | | (935,781 | ) | | | (13,454,743 | ) | |
Net increase | | | 500,651 | | | $ | 7,099,632 | | | | 3,367,162 | | | $ | 57,339,209 | | |
| | | Emerging Markets Fund | |
| | | Class 3 Shares
For the
Period Ended
December 31, 2016 | | Class 4 Shares
For the
Year Ended
December 31, 2016 | |
| | | Shares | | Amount | | Shares | | Amount | |
Shares sold | | | 8,297,326 | | | $ | 122,132,513 | | | | — | | | $ | — | | |
Purchase fees | | | — | | | | 13,857 | | | | — | | | | 46,053 | | |
Redemption fees | | | — | | | | 241 | | | | — | | | | 2,003 | | |
Shares issued in reinvestment of dividends and distributions | | | 78,731 | | | | 1,191,919 | | | | — | | | | — | | |
Shares redeemed | | | — | | | | — | | | | (6,500,627 | ) | | | (110,086,301 | ) | |
Net increase (decrease) | | | 8,376,057 | | | $ | 123,338,530 | | | | (6,500,627 | ) | | $ | (110,038,245 | ) | |
197
Notes to Financial Statements
Annual Report December 31, 2017
| | | Emerging Markets Fund | |
| | | Class 5 Shares
For the
Year Ended
December 31, 2016 | |
| | | Shares | | Amount | |
Shares sold | | | 7,003,622 | | | $ | 119,060,276 | | |
Purchase fees | | | — | | | | 439,341 | | |
Redemption fees | | | — | | | | 21,089 | | |
Shares issued in reinvestment of dividends and distributions | | | 667,883 | | | | 10,344,713 | | |
Shares redeemed | | | (59,981 | ) | | | (1,002,506 | ) | |
Net increase | | | 7,611,524 | | | $ | 128,862,913 | | |
| | | Global Alpha Equity Fund | |
| | | Class 1 Shares
For the
Period Ended
December 31, 2017 | | Class 2 Shares
For the
Year Ended
December 31, 2017 | |
| | | Shares | | Amount | | Shares | | Amount | |
Shares sold | | | 102 | | | $ | 1,498 | | | | 1,214,499 | ** | | $ | 20,191,462 | ** | |
Purchase fees | | | — | | | | — | | | | — | | | | 5,472 | | |
Redemption fees | | | — | | | | — | | | | — | | | | 6,754 | | |
Shares issued in reinvestment of dividends and distributions | | | — | | | | — | | | | 286,122 | | | | 5,398,523 | | |
Shares redeemed | | | (319 | )* | | | (4,965 | )* | | | (8,809,058 | ) | | | (154,903,521 | ) | |
Net increase (decrease) | | | (217 | ) | | $ | (3,467 | ) | | | (7,308,437 | ) | | $ | (129,301,310 | ) | |
| | | Global Alpha Equity Fund | |
| | | Class 3 Shares
For the
Year Ended
December 31, 2017 | | Class 4 Shares
For the
Period Ended
December 31, 2017 | |
| | | Shares | | Amount | | Shares | | Amount | |
Shares sold | | | 9,384,358 | | | $ | 167,078,422 | | | | 18,644,881 | | | $ | 352,706,903 | | |
Purchase fees | | | — | | | | 14,033 | | | | — | | | | — | | |
Redemption fees | | | — | | | | 17,770 | | | | — | | | | — | | |
Shares issued in reinvestment of dividends and distributions | | | 1,039,321 | | | | 19,986,144 | | | | 669,263 | | | | 13,112,596 | | |
Shares redeemed | | | (21,154,751 | ) | | | (388,729,425 | ) | | | (522,422 | ) | | | (10,500,000 | ) | |
Net increase (decrease) | | | (10,731,072 | ) | | $ | (201,633,056 | ) | | | 18,791,722 | | | $ | 355,319,499 | | |
* 319 shares and $4,965 converted from Class 1 into Class 2.
** 312 shares and $4,965 converted into Class 2 from Class 1.
198
Notes to Financial Statements
Annual Report December 31, 2017
| | | Global Alpha Equity Fund | |
| | | Class K Shares
For the
Period Ended
December 31, 2017 | | Institutional
Class Shares
For the
Period Ended
December 31, 2017 | |
| | | Shares | | Amount | | Shares | | Amount | |
Shares sold | | | 4,132,888 | * | | $ | 75,400,530 | * | | | 302 | | | $ | 5,000 | | |
Purchase fees | | | — | | | | — | | | | — | | | | — | | |
Redemption fees | | | — | | | | — | | | | — | | | | — | | |
Shares issued in reinvestment of dividends and distributions | | | 109,284 | | | | 2,058,917 | | | | 11 | | | | 213 | | |
Shares redeemed | | | (1,258,732 | ) | | | (23,575,015 | ) | | | — | | | | — | | |
Net increase | | | 2,983,440 | | | $ | 53,884,432 | | | | 313 | | | $ | 5,213 | | |
| | | Global Alpha Equity Fund | |
| | | Class 1 Shares
For the
Period Ended
December 31, 2016 | | Class 2 Shares
For the
Year Ended
December 31, 2016 | |
| | | Shares | | Amount | | Shares | | Amount | |
Shares sold | | | 216 | | | $ | 2,996 | | | | 7,593,796 | | | $ | 102,389,191 | | |
Purchase fees | | | — | | | | 1 | | | | — | | | | 50,495 | | |
Redemption fees | | | — | | | | — | | | | — | | | | 12,291 | | |
Shares issued in reinvestment of dividends and distributions | | | 2 | | | | 26 | | | | 164,823 | | | | 2,377,207 | | |
Shares redeemed | | | — | | | | — | | | | (7,363,426 | ) | | | (108,680,958 | ) | |
Net increase (decrease) | | | 218 | | | $ | 3,023 | | | | 395,193 | | | $ | (3,851,774 | ) | |
| | | Global Alpha Equity Fund | |
| | | Class 3 Shares
For the
Year Ended
December 31, 2016 | |
| | | Shares | | Amount | |
Shares sold | | | 13,816,078 | | | $ | 206,629,056 | | |
Purchase fees | | | — | | | | 107,459 | | |
Redemption fees | | | — | | | | 21,142 | | |
Shares issued in reinvestment of dividends and distributions | | | 354,436 | | | | 5,227,626 | | |
Shares redeemed | | | (9,262,478 | ) | | | (128,628,662 | ) | |
Net increase | | | 4,908,036 | | | $ | 83,356,621 | | |
* Includes in-kind subscription for 1,607,239 shares and $28,817,791.
199
Notes to Financial Statements
Annual Report December 31, 2017
| | | Global Select Equity Fund | |
| | | Class K Shares
For the
Period Ended
December 31, 2017 | | Institutional Class Shares
For the
Period Ended
December 31, 2017 | |
| | | Shares | | Amount | | Shares | | Amount | |
Shares sold | | | 150,000 | | | $ | 1,500,000 | | | | 150,000 | | | $ | 1,500,000 | | |
Purchase fees | | | — | | | | — | | | | — | | | | — | | |
Redemption fees | | | — | | | | — | | | | — | | | | — | | |
Shares issued in reinvestment of dividends and distributions | | | — | | | | — | | | | — | | | | — | | |
Shares redeemed | | | — | | | | — | | | | — | | | | — | | |
Net increase | | | 150,000 | | | $ | 1,500,000 | | | | 150,000 | | | $ | 1,500,000 | | |
| | | International Concentrated Growth Fund | |
| | | Class K Shares
For the
Period Ended
December 31, 2017 | | Institutional
Class Shares
For the
Period Ended
December 31, 2017 | |
| | | Shares | | Amount | | Shares | | Amount | |
Shares sold | | | 50,000 | | | $ | 500,000 | | | | 50,000 | | | $ | 500,000 | | |
Purchase fees | | | — | | | | — | | | | — | | | | — | | |
Redemption fees | | | — | | | | — | | | | — | | | | — | | |
Shares issued in reinvestment of dividends and distributions | | | — | | | | — | | | | — | | | | — | | |
Shares redeemed | | | — | | | | — | | | | — | | | | — | | |
Net increase | | | 50,000 | | | $ | 500,000 | | | | 50,000 | | | $ | 500,000 | | |
| | | International Equity Fund | |
| | | Class 1 Shares
For the
Period Ended
December 31, 2017 | | Class 2 Shares
For the
Year Ended
December 31, 2017 | |
| | | Shares | | Amount | | Shares | | Amount | |
Shares sold | | | 135 | | | $ | 1,497 | | | | 1,828,103 | ** | | $ | 21,820,826 | ** | |
Purchase fees | | | — | | | | 129 | | | | — | | | | 3,746 | | |
Redemption fees | | | — | | | | 206 | | | | — | | | | 5,976 | | |
Shares issued in reinvestment of dividends and distributions | | | — | | | | — | | | | 1,160,931 | | | | 16,410,339 | | |
Shares redeemed | | | (1,855,127 | )* | | | (21,814,876 | )* | | | (22,421,627 | ) | | | (295,922,268 | ) | |
Net increase (decrease) | | | (1,854,992 | ) | | $ | (21,813,044 | ) | | | (19,432,593 | ) | | $ | (257,681,381 | ) | |
* 1,855,127 shares and $21,814,876 converted from Class 1 into Class 2.
** 1,827,648 shares and $21,814,876 converted into Class 2 from Class 1.
200
Notes to Financial Statements
Annual Report December 31, 2017
| | | International Equity Fund | |
| | | Class 3 Shares
For the
Year Ended
December 31, 2017 | | Class 4 Shares
For the
Period Ended
December 31, 2017 | |
| | | Shares | | Amount | | Shares | | Amount | |
Shares sold | | | 16,354,903 | | | $ | 215,980,083 | | | | 15,387,668 | | | $ | 206,702,541 | | |
Purchase fees | | | — | | | | 5,862 | | | | — | | | | — | | |
Redemption fees | | | — | | | | 9,457 | | | | — | | | | — | | |
Shares issued in reinvestment of dividends and distributions | | | 2,731,488 | | | | 39,089,511 | | | | 560,731 | | | | 8,147,477 | | |
Shares redeemed | | | (24,252,519 | ) | | | (324,073,123 | ) | | | — | | | | — | | |
Net increase (decrease) | | | (5,166,128 | ) | | $ | (68,988,210 | ) | | | 15,948,399 | | | $ | 214,850,018 | | |
| | | International Equity Fund | |
| | | Class 5 Shares
For the
Year Ended
December 31, 2017 | | Class K Shares
For the
Period Ended
December 31, 2017 | |
| | | Shares | | Amount | | Shares | | Amount | |
Shares sold | | | 147,805 | | | $ | 2,000,007 | | | | 7,393,671 | | | $ | 105,992,735 | | |
Purchase fees | | | — | | | | 1,085 | | | | — | | | | — | | |
Redemption fees | | | — | | | | 1,728 | | | | — | | | | — | | |
Shares issued in reinvestment of dividends and distributions | | | 429,770 | | | �� | 6,342,711 | | | | 278,005 | | | | 3,922,653 | | |
Shares redeemed | | | (2,930,950 | ) | | | (41,800,000 | ) | | | — | | | | — | | |
Net increase | | | (2,353,375 | ) | | $ | (33,454,469 | ) | | | 7,671,676 | | | $ | 109,915,388 | | |
| | International Equity Fund | |
| | | Institutional Class Shares
For the
Period Ended
December 31, 2017 | |
| | | Shares | | Amount | |
Shares sold | | | 402 | | | $ | 5,000 | | |
Purchase fees | | | — | | | | — | | |
Redemption fees | | | — | | | | — | | |
Shares issued in reinvestment of dividends and distributions | | | 15 | | | | 208 | | |
Shares redeemed | | | — | | | | — | | |
Net increase | | | 417 | | | $ | 5,208 | | |
201
Notes to Financial Statements
Annual Report December 31, 2017
| | | International Equity Fund | |
| | | Class 1 Shares
For the
Period Ended
December 31, 2016 | | Class 2 Shares
For the
Year Ended
December 31, 2016 | |
| | | Shares | | Amount | | Shares | | Amount | |
Shares sold | | | 1,804,363 | | | $ | 18,721,547 | | | | 18,649,438 | | | $ | 197,471,010 | | |
Purchase fees | | | — | | | | 404 | | | | — | | | | 25,933 | | |
Redemption fees | | | — | | | | 986 | | | | — | | | | 37,355 | | |
Shares issued in reinvestment of dividends and distributions | | | 50,629 | | | | 545,821 | | | | 1,530,262 | | | | 16,800,244 | | |
Shares redeemed | | | — | | | | — | | | | (33,640,173 | ) | | | (363,708,396 | ) | |
Net increase (decrease) | | | 1,854,992 | | | $ | 19,268,758 | | | | (13,460,473 | ) | | $ | (149,373,854 | ) | |
| | | International Equity Fund | |
| | | Class 3 Shares
For the
Year Ended
December 31, 2016 | | Class 5 Shares
For the
Year Ended
December 31, 2016 | |
| | | Shares | | Amount | | Shares | | Amount | |
Shares sold | | | 28,870,850 | | | $ | 314,718,178 | | | | — | | | $ | — | | |
Purchase fees | | | — | | | | 31,311 | | | | — | | | | 6,808 | | |
Redemption fees | | | — | | | | 45,973 | | | | — | | | | 9,709 | | |
Shares issued in reinvestment of dividends and distributions | | | 2,343,575 | | | | 25,982,896 | | | | 443,774 | | | | 5,083,267 | | |
Shares redeemed | | | (20,158,056 | ) | | | (216,391,115 | ) | | | (1,435,575 | ) | | | (17,199,199 | ) | |
Net increase (decrease) | | | 11,056,369 | | | $ | 124,387,243 | | | | (991,801 | ) | | $ | (12,099,415 | ) | |
| | | Long Term Global Growth Equity Fund | |
| | | Class 1 Shares
For the
Year Ended
December 31, 2017 | | Class 2 Shares
For the
Year Ended
December 31, 2017 | |
| | | Shares | | Amount | | Shares | | Amount | |
Shares sold | | | 1,805 | | | $ | 19,028 | | | | 975,426 | ** | | $ | 12,925,524 | ** | |
Purchase fees | | | — | | | | 1,663 | | | | — | | | | 4,974 | | |
Redemption fees | | | — | | | | — | | | | — | | | | — | | |
Shares issued in reinvestment of dividends and distributions | | | — | | | | — | | | | — | | | | — | | |
Shares redeemed | | | (1,118,879 | )* | | | (12,790,798 | )* | | | (404,454 | ) | | | (7,000,025 | ) | |
Net increase (decrease) | | | (1,117,074 | ) | | $ | (12,770,107 | ) | | | 570,972 | | | $ | 5,930,473 | | |
* 1,118,879 shares and $12,790,798 converted from Class 1 into Class 2.
** 966,613 shares and $12,790,798 converted into Class 2 from Class 1.
202
Notes to Financial Statements
Annual Report December 31, 2017
| | | Long Term Global Growth Equity Fund | |
| | | Class 4 Shares
For the
Year Ended
December 31, 2017 | | Class K Shares
For the
Period Ended
December 31, 2017 | |
| | | Shares | | Amount | | Shares | | Amount | |
Shares sold | | | 725,715 | | | $ | 10,989,000 | | | | 4,073,618 | | | $ | 66,005,000 | | |
Purchase fees | | | — | | | | 4,405 | | | | — | | | | — | | |
Redemption fees | | | — | | | | — | | | | — | | | | — | | |
Shares issued in reinvestment of dividends and distributions | | | — | | | | — | | | | — | | | | — | | |
Shares redeemed | | | — | | | | (22 | ) | | | — | | | | — | | |
Net increase | | | 725,715 | | | $ | 10,993,383 | | | | 4,073,618 | | | $ | 66,005,000 | | |
| | | Long Term Global
Growth Equity Fund | |
| | | Institutional Class Shares
For the
Period Ended
December 31, 2017 | |
| | | Shares | | Amount | |
Shares sold | | | 358 | | | $ | 5,000 | | |
Purchase fees | | | — | | | | — | | |
Redemption fees | | | — | | | | — | | |
Shares issued in reinvestment of dividends and distributions | | | — | | | | — | | |
Shares redeemed | | | — | | | | — | | |
Net increase | | | 358 | | | $ | 5,000 | | |
| | | Long Term Global Growth Equity Fund | |
| | | Class 1 Shares
For the
Year Ended
December 31, 2016 | | Class 2 Shares
For the
Year Ended
December 31, 2016 | |
| | | Shares | | Amount | | Shares | | Amount | |
Shares sold | | | 100,133 | | | $ | 1,066,932 | | | | — | | | $ | — | | |
Purchase fees | | | — | | | | 141 | | | | — | | | | 425 | | |
Redemption fees | | | — | | | | 2,214 | | | | — | | | | 6,897 | | |
Shares issued in reinvestment of dividends and distributions | | | 6,652 | | | | 68,401 | | | | 16,271 | | | | 193,711 | | |
Shares redeemed | | | — | | | | — | | | | (209,222 | ) | | | (2,502,502 | ) | |
Net increase (decrease) | | | 106,785 | | | $ | 1,137,688 | | | | (192,951 | ) | | $ | (2,301,469 | ) | |
203
Notes to Financial Statements
Annual Report December 31, 2017
| | | Long Term Global Growth
Equity Fund | |
| | | Class 4 Shares
For the
Year Ended
December 31, 2016 | |
| | | Shares | | Amount | |
Shares sold | | | — | | | $ | — | | |
Purchase fees | | | — | | | | 502 | | |
Redemption fees | | | — | | | | 6,965 | | |
Shares issued in reinvestment of dividends and distributions | | | 15,793 | | | | 216,535 | | |
Shares redeemed | | | (1,004,102 | ) | | | (13,573,574 | ) | |
Net decrease | | | (988,309 | ) | | $ | (13,349,572 | ) | |
| | | Positive Change Equity Fund | |
| | | Class K Shares
For the
Period Ended
December 31, 2017 | | Institutional Class Shares
For the
Period Ended
December 31, 2017 | |
| | | Shares | | Amount | | Shares | | Amount | |
Shares sold | | | 50,000 | | | $ | 500,000 | | | | 50,000 | | | $ | 500,000 | | |
Purchase fees | | | — | | | | — | | | | — | | | | — | | |
Redemption fees | | | — | | | | — | | | | — | | | | — | | |
Shares issued in reinvestment of dividends and distributions | | | — | | | | — | | | | — | | | | — | | |
Shares redeemed | | | — | | | | — | | | | — | | | | — | | |
Net increase | | | 50,000 | | | $ | 500,000 | | | | 50,000 | | | $ | 500,000 | | |
| | | U.S. Equity Growth Fund | |
| | | Class 1 Shares
For the
Year Ended
December 31, 2017 | | Class K Shares
For the
Period Ended
December 31, 2017 | |
| | | Shares | | Amount | | Shares | | Amount | |
Shares sold | | | — | | | $ | — | | | | 99,970 | ** | | $ | 1,148,640 | ** | |
Purchase fees | | | — | | | | — | | | | — | | | | — | | |
Redemption fees | | | — | | | | — | | | | — | | | | — | | |
Shares issued in reinvestment of dividends and distributions | | | — | | | | — | | | | 409 | | | | 5,489 | | |
Shares redeemed | | | (100,000 | )* | | | (1,148,640 | )* | | | — | | | | — | | |
Net increase (decrease) | | | (100,000 | ) | | $ | (1,148,640 | ) | | | 100,379 | | | $ | 1,154,129 | | |
* 100,000 shares and $1,148,640 converted from Class 1 into Class K.
** 99,970 shares and $1,148,640 converted into Class K from Class 1.
204
Notes to Financial Statements
Annual Report December 31, 2017
| | | U.S. Equity Growth Fund | |
| | | Institutional Class Shares
For the
Period Ended
December 31, 2017 | |
| | | Shares | | Amount | |
Shares sold | | | 435 | | | $ | 5,000 | | |
Purchase fees | | | — | | | | — | | |
Redemption fees | | | — | | | | — | | |
Shares issued in reinvestment of dividends and distributions | | | 2 | | | | 24 | | |
Shares redeemed | | | — | | | | — | | |
Net increase | | | 437 | | | $ | 5,024 | | |
| | | U.S. Equity Growth Fund | |
| | | Class 1 Shares
For the
Period Ended
December 31, 2016 | |
| | | Shares | | Amount | |
Shares sold | | | 100,000 | | | $ | 1,000,000 | | |
Purchase fees | | | — | | | | — | | |
Redemption fees | | | — | | | | — | | |
Shares issued in reinvestment of dividends and distributions | | | — | | | | — | | |
Shares redeemed | | | — | | | | — | | |
Net increase | | | 100,000 | | | $ | 1,000,000 | | |
| | | International Choice Fund | |
| | | Class 1 Shares
For the
Year Ended
December 31, 2017 | | Class 2 Shares
For the
Year Ended
December 31, 2017 | |
| | | Shares | | Amount | | Shares | | Amount | |
Shares sold | | | — | | | $ | — | | | | 2,534,688 | ** | | $ | 33,249,954 | ** | |
Purchase fees | | | — | | | | 3,420 | | | | — | | | | 46,266 | | |
Redemption fees | | | — | | | | — | | | | — | | | | — | | |
Shares issued in reinvestment of dividends and distributions | | | — | | | | — | | | | 272,087 | | | | 4,034,314 | | |
Shares redeemed | | | (1,434,417 | )* | | | (17,850,819 | )* | | | (107,813 | ) | | | (1,500,000 | ) | |
Net increase (decrease) | | | (1,434,417 | ) | | $ | (17,847,399 | ) | | | 2,698,962 | | | $ | 35,830,534 | | |
* 1,434,417 shares and $17,850,819 converted from Class 1 into Class 2.
** 1,419,374 shares and $17,850,819 converted into Class 2 from Class 1.
205
Notes to Financial Statements
Annual Report December 31, 2017
| | | International Choice Fund | |
| | | Class 3 Shares
For the
Year Ended
December 31, 2017 | | Class 4 Shares
For the
Year Ended
December 31, 2017 | |
| | | Shares | | Amount | | Shares | | Amount | |
Shares sold | | | — | | | $ | — | | | | 2,650,821 | | | $ | 34,081,343 | | |
Purchase fees | | | — | | | | 22,875 | | | | — | | | | — | | |
Redemption fees | | | — | | | | — | | | | — | | | | — | | |
Shares issued in reinvestment of dividends and distributions | | | 122,364 | | | | 1,833,960 | | | | 35,278 | | | | 534,209 | | |
Shares redeemed | | | — | | | | — | | | | — | | | | — | | |
Net increase | | | 122,364 | | | $ | 1,856,835 | | | | 2,686,099 | | | $ | 34,615,552 | | |
| | | International Choice Fund | |
| | | Class 1 Shares
For the
Year Ended
December 31, 2016 | | Class 2 Shares
For the
Year Ended
December 31, 2016 | |
| | | Shares | | Amount | | Shares | | Amount | |
Shares sold | | | — | | | $ | — | | | | 34,587 | | | $ | 399,160 | | |
Purchase fees | | | — | | | | 40 | | | | | | 535 | | |
Redemption fees | | | — | | | | — | | | | — | | | | — | | |
Shares issued in reinvestment of dividends and distributions | | | 17,296 | | | | 194,799 | | | | 243,617 | | | | 2,772,340 | | |
Shares redeemed | | | — | | | | — | | | | — | | | | — | | |
Net increase | | | 17,296 | | | $ | 194,839 | | | | 278,204 | | | $ | 3,172,035 | | |
| | | International Choice Fund | |
| | | Class 3 Shares
For the
Year Ended
December 31, 2016 | |
| | | Shares | | Amount | |
Shares sold | | | — | | | $ | — | | |
Purchase fees | | | — | | | | 265 | | |
Redemption fees | | | — | | | | — | | |
Shares issued in reinvestment of dividends and distributions | | | 124,536 | | | | 1,432,137 | | |
Shares redeemed | | | — | | | | — | | |
Net increase | | | 124,536 | | | $ | 1,432,402 | | |
206
Notes to Financial Statements
Annual Report December 31, 2017
The Funds charged the following purchase fees and redemption fees for the period January 1, 2017 to April 30, 2017:
Fund | | Purchase Fees | | Redemption Fees | |
EAFE | | | 0.21 | % | | | 0.10 | % | |
EAFE Choice | | | 0.21 | % | | | 0.10 | % | |
EAFE Pure | | | 0.21 | % | | | 0.10 | % | |
Emerging Markets | | | 0.20 | % | | | 0.25 | % | |
Global Alpha Equity | | | 0.15 | % | | | 0.10 | % | |
International Equity | | | 0.21 | % | | | 0.10 | % | |
Long Term Global Growth Equity | | | 0.10 | % | | | 0.10 | % | |
U.S. Equity Growth | | | 0.06 | % | | | 0.06 | % | |
International Choice | | | 0.21 | % | | | 0.10 | % | |
Effective beginning May 1, 2017 the Funds ceased to charge purchase and redemption fees
Note E — Beneficial Ownership
The beneficial ownership, either directly or indirectly, of more than 25% of the voting securities of a Fund creates a presumption of control under Section 2(a)(9) of the 1940 Act. As of December 31, 2017, the following shareholders beneficially owned 25% or more of a Fund's voting securities:
Fund | | Investor | | Percentage | |
the EAFE Fund | | Kentucky Teachers Retirement System | | | 40.81 | % | |
the EAFE Choice Fund | | Norhtern Trust as Trustee FBO | | | 27.89 | % | |
the EAFE Pure Fund | | El Paso Firemen & Policemen's Pension Fund | | | 27.16 | % | |
the Emerging Markets Fund | | Board of Trustees for the Maryland State Retirement and Pension System | | | 45.02 | % | |
the Global Select Equity Fund | | Baillie Gifford Overseas Ltd | | | 100.00 | % | |
the International Concentrated
Growth Fund | | Baillie Gifford Overseas Ltd | | | 100.00 | % | |
the Long Term Global Growth Equity Fund | | Nissan Employee Retirement Plan | | | 31.06 | % | |
the Long Term Global Growth Equity Fund | | The Salvation Army A Georgia Corporation | | | 31.62 | % | |
the Positive Change Equity Fund | | Baillie Gifford Overseas Ltd | | | 100.00 | % | |
the U.S. Equity Growth Fund | | Baillie Gifford International LLC | | | 100.00 | % | |
the International Choice Fund | | the Municipal Fire & Police Retirement System of Iowa | | | 28.10 | % | |
Purchase and Redemption activity of these accounts may have a significant effect on the operation of each Fund.
At December 31, 2017, Baillie Gifford Overseas Ltd ('the Advisor'), who is affiliated with the Funds, owned 100% of the Global Select Equity Fund, the International Concentrated Growth Fund and the Positive Change Equity Fund. As a result, the Adviser may be deemed to control the Fund.
At December 31, 2017, Baillie Gifford International LLC, a wholly owned subsidiary of Baillie Gifford Overseas Limited, the Advisor, owned 100% of the U.S. Equity Growth Fund and as a result may be deemed to control the Fund.
207
Notes to Financial Statements
Annual Report December 31, 2017
Note F — Commitments and Contingencies
Each of the Funds indemnifies the Trust's officers and Trustees for certain liabilities that might arise from the performance of their duties to the Fund. Additionally, in the normal course of business, each Fund enters into contracts that contain a variety of representations and warranties and which provide general indemnifications.
The Funds' maximum exposure under these arrangements is unknown, as this would involve future claims that may be made against the Funds that have not yet occurred. However, based on experience, the Funds expect the risk of loss to be remote.
Note G — New Accounting Pronouncement
In October 2016, the Securities and Exchange Commission (SEC) issued a new rule, Investment Company Reporting Modernization, which, among other provisions, amends Regulation S-X to require standardized, enhanced disclosures, particularly related to derivatives, in investment company financial statements. The amendment of Regulation S-X was applied to the Funds' financial statements for the period ending December 31, 2017; adoption is expected to have no effect on the fund's net assets or results of operations.
Note H — Line of Credit
The Trust has entered into a committed facility with Bank of New York Mellon which allows the Funds managed by the Advisor to borrow up to $50 million in total which matures on April 28, 2018, subject to minimum asset coverage requirements set out in the credit agreement. Each Fund may borrow money under this credit facility for the temporary funding of shareholder redemptions with respect to Class K and Institutional Class shares or for other temporary or emergency purposes.
Borrowings are charged an interest rate of 1.25% per annum plus the greater of the Federal Funds Effective Rate or the one-month LIBOR Rate. Pursuant to allocation procedures adopted by the Board, the Classes borrowing pursuant to the Credit Agreement shall bear
any expenses associated with the credit facility or borrowings thereunder. Each Fund also pays a commitment fee equal to its pro rata share of the amount of the credit facility based on such Fund's average net asset value attributable to the share classes for which the facility is maintained. The Baillie Gifford Funds had no outstanding loans at December 31, 2017. For the period ended December 31, 2017, the commitment fee for the line of credit was paid by the advisor, Baillie Gifford Overseas Limited.
On October 2, 2017 the Emerging Markets Fund borrowed a maximum of $8.6 million with an average loan balance of approximately $6.1 million under the Credit Facility lasting for two days during the year ended December 31, 2017. The interest associated with the Credit Facility was reimbursed by the Advisor.
Note I — Principal Risks
Cash
Cash held by the Funds may be in excess of Federal Deposit Insurance Corporation (FDIC) limitations. The Manager does not expect any loses as a result of cash being in excess of FDIC limits.
Currency and Currency Hedging Risk
The Fund could lose value if it invests in foreign currencies or securities denominated in foreign currencies which decline in value relative to the U.S. Dollar, or if it invests in products to reduce this exposure, and those products lose value. A Fund may realize a loss if it has exposure to a non-U.S. currency, and this non-U.S. currency declines in value, relative to the U.S. dollar. Similarly, a Fund may realize a loss if the Fund hedges exposure to a non-U.S. currency, and this non-U.S. currency increases in value, relative to the U.S. dollar. While hedging can reduce or eliminate losses, it can also reduce or eliminate gains.
Non U.S. Investment Risk
Non-U.S. securities are subject to additional risks, including less liquidity, increased volatility, less transparency, withholding or other taxes, increased
208
Notes to Financial Statements
Annual Report December 31, 2017
vulnerability to adverse changes in local and global economic conditions, less regulation, and possible fluctuation in value due to adverse political conditions. Foreign portfolio transactions generally involve higher commission rates, transfer taxes, and custodial costs than similar transactions in the U.S.
For further information on risk please refer to the Prospectus.
Note J — Change in Independent Registered Public Accounting Firm
Effective September 18, 2017, Cohen & Company, Ltd ("Cohen") was appointed as the Funds' independent registered public accounting firm for the fiscal year ending December 31, 2017. The selection of Cohen was recommended by the Trust's Audit Oversight Committee, comprised of all non-interested Trustees, and was approved by the Board.
Note K — Legal Notice
MSCI. The MSCI information may only be used for your internal use, may not be reproduced or redisseminated in any form and may not be used as a basis for or a component of any financial instruments or products or indices. None of the MSCI information is intended to constitute investment advice or a recommendation to make (or refrain from making) any kind of investment decision and may not be relied on as such. Historical data and analysis should not be taken as an indication or guarantee of any future performance analysis, forecast or prediction. The MSCI information is provided on an "as is" basis and the user of this information assumes the entire risk of any use made of this information. MSCI, each of its affiliates and each other person involved in or related to compiling, computing or creating any MSCI information (collectively, the "MSCI Parties") expressly disclaims all warranties (including, without limitation, any warranties of originality, accuracy, completeness, timeliness, non-infringement, merchantability and fitness for a particular purpose) with respect to this information.
Without limiting any of the foregoing, in no event shall any MSCI Party have any liability for any direct, indirect, special, incidental, punitive, consequential (including, without limitation, lost profits) or any other damages. (www.msci.com)
S&P (US Equity Growth)
The S&P 500 and S&P Global Small Cap ("Index") is a product of S&P Dow Jones Indices LLC, a division of S&P Global, or its affiliates ("SPDJI"). Standard & Poor's® and S&P® are registered trademarks of Standard & Poor's Financial Services LLC, a division of S&P Global ("S&P"); Dow Jones® is a registered trademark of Dow Jones Trademark Holdings LLC ("Dow Jones"). Neither S&P Dow Jones Indices LLC, Dow Jones Trademark Holdings LLC, their affiliates nor their third party licensors make any representation or warranty, express or implied, as to the ability of any index to accurately represent the asset class or market sector that it purports to represent and neither S&P Dow Jones Indices LLC, Dow Jones Trademark Holdings LLC, their affiliates nor their third party licensors shall have any liability for any errors, omissions, or interruptions of any index or the data included therein.
Note L — Subsequent Events
Events or transactions that occur after the financial statement date but before the financial statements are issued are categorized as recognized or non-recognized for financial statement purposes.
There were no subsequent events identified between December 31, 2017 and the issuance of the Financial Statements.
209
Report of Independent Registered Public Accounting Firm
Annual Report December 31, 2017
To the Shareholders of Baillie Gifford EAFE Fund,
Baillie Gifford EAFE Choice Fund, Baillie Gifford EAFE Pure Fund,
Baillie Gifford Emerging Markets Fund, Baillie Gifford Global Alpha Equity Fund,
Baillie Gifford Global Select Equity Fund, Baillie Gifford International Concentrated Growth Fund,
Baillie Gifford International Equity Fund, Baillie Gifford Long Term Global Growth Equity Fund,
Baillie Gifford Positive Change Equity Fund, Baillie Gifford U.S. Equity Growth Fund,
and Baillie Gifford International Choice Fund, and Board of Trustees of Baillie Gifford Funds
Opinion on the Financial Statements
We have audited the accompanying statements of assets and liabilities, including the portfolios of investments, of Baillie Gifford EAFE Fund, Baillie Gifford EAFE Choice Fund, Baillie Gifford EAFE Pure Fund, Baillie Gifford Emerging Markets Fund, Baillie Gifford Global Alpha Equity Fund, Baillie Gifford Global Select Equity Fund, Baillie Gifford International Concentrated Growth Fund, Baillie Gifford International Equity Fund, Baillie Gifford Long Term Global Growth Equity Fund, Baillie Gifford Positive Change Equity Fund, Baillie Gifford U.S. Equity Growth Fund, and Baillie Gifford International Choice Fund (the "Funds"), each a series of Baillie Gifford Funds, as of December 31, 2017, and the related statements of operations, the statements of changes in net assets, including the related notes, and the financial highlights for the year or period then ended (collectively referred to as the "financial statements"). In our opinion, the financial statements present fairly, in all material respects, the financial position of the Funds, as of December 31, 2017, the results of their operations, the changes in their net assets, and the financial highlights for the year or period then ended, in conformity with accounting principles generally accepted in the United States of America.
The Funds' financial statements and financial highlights for the years or periods ended December 31, 2016 and prior were audited by other auditors, whose report dated February 28, 2017, expressed an unqualified opinion on those financial statements and financial highlights.
Basis for Opinion
These financial statements are the responsibility of the Funds' management. Our responsibility is to express an opinion on the Funds' financial statements based on our audit. We are a public accounting firm registered with the Public Company Accounting Oversight Board (United States) ("PCAOB") and are required to be independent with respect to the Funds in accordance with the U.S. federal securities laws and the applicable rules and regulations of the Securities and Exchange Commission and the PCAOB.
We conducted our audit in accordance with the standards of the PCAOB. Those standards require that we plan and perform the audit to obtain reasonable assurance about whether the financial statements are free of material misstatement, whether due to error or fraud.
Our audit includes performing procedures to assess the risks of material misstatement of the financial statements, whether due to error or fraud, and performing procedures that respond to those risks. Such procedures include examining, on a test basis, evidence regarding the amounts and disclosures in the financial statements and confirmation of securities owned as of December 31, 2017, by correspondence with the custodian and brokers, or by other appropriate auditing procedures where replies from brokers were not received. Our audit also included evaluating the accounting principles used and significant estimates made by management, as well as evaluating the overall presentation of the financial statements. We believe that our audit provides a reasonable basis for our opinion.
We have served as the Funds' auditor since 2017.
COHEN & COMPANY, LTD.
Cleveland, Ohio
February 28, 2018
210
Supplemental Information (unaudited)
Annual Report December 31, 2017
Federal Income Tax Information
Qualified dividend income was taxable to the Funds listed in the table below through December 31, 2017. The Funds intend to designate the maximum amount of dividends that qualify for the reduced tax rate pursuant to the Jobs and Growth Tax Relief Reconciliation Act of 2003.
Fund | | Qualified
Dividend Income | |
EAFE | | | 100.00 | % | |
EAFE Choice | | | 100.00 | % | |
EAFE Pure | | | 89.24 | % | |
Emerging Markets | | | 80.87 | % | |
Global Alpha Equity | | | 100.00 | % | |
Global Select Equity | | | 0.00 | % | |
International Concentrated | | | 0.00 | % | |
International Equity | | | 100.00 | % | |
Long Term Global Growth Equity | | | 0.00 | % | |
Positive Change Equity | | | 0.00 | % | |
U.S. Equity Growth | | | 70.83 | % | |
International Choice | | | 100.00 | % | |
For corporate shareholders, the percentage of ordinary income distributions for the year/period ended December 31, 2017 for the corporate dividends-received deducation for each Fund is:
Fund | | Dividends-received
Deductions | |
EAFE | | | 0.00 | % | |
EAFE Choice | | | 0.00 | % | |
EAFE Pure | | | 0.00 | % | |
Emerging Markets | | | 0.00 | % | |
Global Alpha Equity | | | 39.62 | % | |
Global Select Equity | | | 0.00 | % | |
International Concentrated | | | 0.00 | % | |
International Equity | | | 0.00 | % | |
Long Term Global Growth Equity | | | 0.00 | % | |
Positive Change Equity | | | 0.00 | % | |
U.S. Equity Growth | | | 70.83 | % | |
International Choice | | | 0.00 | % | |
In February 2018, certain US shareholders will be advised on IRS Form 1099 DIV or substitute 1099 DIV as to the U.S. federal tax status of the distributions received by certain US shareholders in the calendar year 2017.
211
Supplemental Information (unaudited)
Annual Report December 31, 2017
Foreign Taxes Paid — The following Funds elect under the Internal Revenue Code Section 853 to pass through foreign taxes paid to its shareholders. The total amount of foreign taxes passed through to shareholders on a per share basis for the year ended December 31, 2017, are as follows:
Fund | | Foreign Taxes
Per Share | | Foreign Income
Per Share | |
EAFE | | | 0.0148 | | | | 0.1553 | | |
EAFE Choice | | | 0.0277 | | | | 0.3331 | | |
EAFE Pure | | | 0.0185 | | | | 0.2302 | | |
Emerging Markets | | | 0.0453 | | | | 0.4381 | | |
Global Alpha Equity | | | 0.0145 | | | | 0.1546 | | |
Global Select Equity | | | — | | | | — | | |
International Concentrated | | | — | | | | — | | |
International Equity | | | 0.0258 | | | | 0.2829 | | |
Long Term Global Growth Equity | | | — | | | | — | | |
Positive Change Equity | | | — | | | | — | | |
U.S. Equity Growth | | | — | | | | — | | |
International Choice | | | 0.0232 | | | | 0.2462 | | |
212
Supplemental Information (unaudited)
Annual Report December 31, 2017
Management of The Trust
The following tables set forth the Trustees and Officers of the Trust, their principal occupations during the past five years, and certain other information as of December 31, 2017.
Name and Year of Birth(1) | | Position(s)
Held with
Trust | | Length of
Time
Served(2) | | Principal Occupation and Other
Directorships Held During Past 5 Years(3) | | Number of Funds in
Fund complex
overseen by
Trustee(4)(5) | |
Disinterested Trustees | | | | | | | | | |
George W. Browning*
1941 | | Trustee | | Since 2007 | | Retired December 31, 2017, Formerly: Managing Director, Client Service, Babson Capital Management, LLC (investment adviser). | | | 13 | | |
Howard W. Chin
1952 | | Trustee | | Since 2015 | | Retired. Formerly: Managing Director, Investments, Guardian Life Insurance (financial services). | | | 13 | | |
Bruce C. Long
1945 | | Trustee | | Since 2009 | | Global Financial Consultant. CEO, K-Stream LLC (financial services); Consultant, DALBAR, Inc. (financial measurements); Consultant, Carpenter Group (financial services). | | | 13 | | |
Robert E. Rigsby
1949 | | Trustee | | Since 2014 | | Retired. Formerly: President & COO, Delivery Business at Dominion Energy, Inc. (electric and gas energy company). | | | 13 | | |
Pamela M.J. Cox
1952 | | Trustee | | Since 2017 | | Senior Associate (non-resident), CSIS (think tank). Formerly: Senior Vice President; Vice President East Asia, World Bank Group (international bank & financial services). | | | 13 | | |
Interested Trustee | | | | | | | | | |
David Salter
1975 | | Trustee, Chairman of the Board, and President | | Since 2014 | | Partner, Baillie Gifford & Co. (investment adviser); Manager, Baillie Gifford International LLC with oversight of products offered to the North American market. | | | 13 | | |
Name and Age(1) | | Position(s)
Held with
Trust | | Length of
Time
Served(2) | | Principal Occupation During Past 5 Years(3) | |
Officers (other than Officers who are also Trustees) | |
Andrew Telfer
1967 | | Vice President | | Since 2008 | | Managing Partner, Baillie Gifford & Co. (investment adviser); Director, Baillie Gifford Overseas Limited (investment adviser). | |
Michael Stirling-Aird
1977 | | Vice President | | Since 2012 | | Client Service Director, Baillie Gifford Overseas Limited (investment adviser). | |
Julie Paul
1975 | | Vice President | | Since 2012 | | Manager, North American Funds Operations Department, Baillie Gifford & Co. (investment adviser). | |
Tim Campbell
1975 | | Vice President | | Since 2014 | | Partner, Baillie Gifford & Co. (investment adviser); Manager, Baillie Gifford International LLC with oversight of marketing performed in North America. | |
Lindsay Cockburn
1978 | | Treasurer | | Since 2015 | | Manager, North American Funds Operations Department, Baillie Gifford & Co. (investment adviser). | |
Gareth Griffiths
1973 | | Chief Legal Officer and Secretary | | Since 2015 | | Senior Legal Advisor for the Baillie Gifford Group (investment adviser). | |
213
Supplemental Information (unaudited)
Annual Report December 31, 2017
Name and Year of Birth(1) | | Position(s)
Held with
Trust | | Length of
Time
Served(2) | | Principal Occupation During Past 5 Years(3) | |
Officers (other than Officers who are also Trustees) | |
Graham Laybourn
1966 | | Chief Compliance Officer | | Since 2005 | | Partner, Baillie Gifford & Co. (investment adviser); Group Compliance Officer, Director of Regulatory Risk and Legal, Baillie Gifford Group (investment adviser). | |
Evan Delaney
1969 | | Chief Risk Officer | | Since 2013 | | Group Chief Risk Officer, Director of Business Risk and Internal Audit, Baillie Gifford Group (investment adviser). | |
Lesley-Anne Archibald
1988 | | Vice President | | Since 2017 | | Assistant Manager, North American Funds Operations Department, Baillie Gifford & Co. (investment advisor). | |
The address of each Trustee and Officer of the Trust is c/o Baillie Gifford Funds, Calton Square, 1 Greenside Row, Edinburgh, Scotland EH1 3AN.
* Retired December 31, 2017.
(1) There is no stated term of office for the Trustees and a Trustee may serve until such Trustee reaches the age of 75 years. Thereafter, such Trustee offers to tender his or her resignation from the Board, and the Nominating and Governance Committee, at its discretion, makes a recommendation to the Board whether to accept or reject such resignation annually. The Chairman of the Board and President of the Trust are elected annually by the Board of Trustees. Other officers may be elected or appointed by the Trustees at any time.
(2) Previous positions during the past five years with Baillie Gifford & Co., the Manager and Baillie Gifford Group are omitted if not materially different from the positions listed.
(3) The number of Funds in the Fund complex overseen by the Trustee includes the Asia ex Japan Fund, a series of the Trust which has not yet commenced operations.
(4) David Salter is an "interested person" (as defined in the 1940 Act) of the Trust or the Manager due to his positions with the Manager (Baillie Gifford Overseas Ltd.) and his role as an officer of the Trust.
Additional information regarding the Trustees is in the Funds' Statement of Additional Information and is available upon request, without charge, by calling Baillie Gifford Overseas Limited at 011-44-131-275-2000.
A description of the Funds' proxy voting policies and procedures related to portfolio securities is available without charge, upon request, by calling Baillie Gifford Overseas Limited at 011-44-131-275-2000 or on the SEC's website at http://www.sec.gov. Shareholders may submit to the Trust claims for reimbursement of telephone charges incurred in placing such calls.
Information regarding how the Funds voted proxies relating to portfolio securities during the most recent 12-month period ended June 30 is also available without charge upon request by calling Baillie Gifford Overseas Limited at 011-44-131-275-2000 or by accessing the
Fund's Form N-PX on the SEC's website at http://www.sec.gov. Shareholders may submit to the Trust claims for reimbursement of telephone charges incurred in placing such calls.
Each of the Funds files its complete schedule of portfolio holdings with the SEC for the first and third quarters of each fiscal year on Form N-Q. The Funds' Form N-Q is available on the SEC's website at http://www.sec.gov. The Funds' Form N-Q may also be viewed and copied at the SEC's Public Reference Room in Washington, DC; information on the operation of the Public Reference Room may be obtained by calling (800) SEC-0330. The Funds' holdings can also be found at Baillie Gifford Funds website: http://USmutualfund.bailliegifford.com
214
BOARD CONSIDERATIONS REGARDING
NEW FUNDS' ADVISORY AGREEMENT APPROVAL
Annual Report December 31, 2017
On September 18-19, 2017, the Board of Trustees (the "Board") of the Baillie Gifford Funds (the "Trust"), including those trustees who are not "interested persons" as defined by the Investment Company Act of 1940, as amended (the "Independent Trustees"), approved the investment advisory agreement (the "Advisory Agreement") between the Trust, on behalf of The Positive Change Equity Fund, The Global Select Equity Fund and The International Concentrated Growth Fund, respectively, (each a "Fund" and collectively, the "Funds") and Baillie Gifford Overseas Limited (the "Manager"). As part of the review process, the Independent Trustees met independently of Trust management and of the interested trustee of the Board to consider the approval of the Advisory Agreement. During the review process, the Independent Trustees were represented by independent legal counsel. The Independent Trustees reviewed materials received from the Manager, Broadridge (an independent provider of mutual fund data, "Broadridge") and independent legal counsel. The Board determined that, given the totality of the information provided with respect to the Advisory Agreement, the Board had received sufficient information to approve the Advisory Agreement. The Independent Trustees then presented their findings to the Board.
The Board concluded that it was in the best interests of each Fund to approve the Advisory Agreement. In reaching this conclusion for the Funds, the Board did not identify any single factor as determinative in its analysis, but rather the Board considered a variety of factors, including those discussed below. The Board did not allot a particular weight to any one factor or group of factors.
The Board considered the nature, extent and quality of the services expected to be provided by the Manager to The Positive Change Equity Fund, The Global Select Equity Fund and The International Concentrated Growth Fund. The Board noted that pursuant to the Funds' Advisory Agreement, the Manager will provide portfolio management services to the Funds and will receive a management fee and pursuant to a separate Administration, Supervisory and Sub-Accounting Services Plan and Administration and Supervisory Agreement the Manager will receive an administration and supervisory fee. The Board considered the background and qualifications of the investment and compliance personnel who would be involved in the management and oversight of the Funds and reviewed information regarding each Fund's management fee, administration and supervisory fee and estimated expense ratio compared to similar funds. The Board considered the proposed investment objective and policies for the Funds and reviewed composite performance information for similar strategies from the Manager. The Board noted that the Manager provides advisory services to other funds in the Trust and that the Board had also reviewed extensive information regarding the Manager and the nature and quality of services provided during the annual contract renewal process that was completed in June 2017. In evaluating the management fee to be paid by each Fund, and in particular when assessing comparative data, the Board considered not only the management fee, but also the combination of the Fund's management fee and administration and supervisory fee. The Board concluded that the nature, extent and quality of the services provided by the Manager to the Funds, pursuant to the Advisory Agreement, were expected to be satisfactory.
With respect to profitability, the Board considered that because the Funds were not operational that the Manager did not provide estimated profitability. The Board considered other benefits to be derived by the Manager from its relationship to the Funds, including receipt of the administration and supervisory fee. The Board considered whether there were economies of scale with respect to management of the Funds and whether the Funds would benefit from any economies of scale. The Board considered the relatively low level of the management fees of the Funds compared to peer funds and that the Funds were not yet operational and had no assets.
The Board noted the following items specific to the referenced Funds.
The Positive Change Equity Fund
The Board reviewed the Fund's management fee (plus the administration and supervisory fee) and total expense ratio and compared them to the average management fees and expense ratios of an expense peer group and expense universe of funds based on data provided by Broadridge. The comparable fund information showed that the Fund's management fee (plus the administration and supervisory fee) was below the average management fee of both the expense peer group and the expense universe. The Board also reviewed the fee schedules for separately managed accounts of the Manager with a similar investment mandate. The Board considered that the Manager has contractually
215
BOARD CONSIDERATIONS REGARDING
NEW FUNDS' ADVISORY AGREEMENT APPROVAL
Annual Report December 31, 2017
agreed to waive its fees and/or bear other expenses of the Class K and Institutional Class Shares of the Fund through April 30, 2019 and that the contractual agreement may only be terminated by the Board. The Board considered that the management fee was on the low end of the spectrum of the expense peer group. On the basis of the information provided, the Board concluded that the management fee was reasonable.
The Global Select Equity Fund
The Board reviewed the Fund's management fee (plus the administration and supervisory fee) and total expense ratio and compared them to the average management fees and expense ratios of an expense peer group and expense universe of funds based on data provided by Broadridge. The comparable fund information showed that the Fund's management fee (plus the administration and supervisory fee) was below the average management fee of both the expense peer group and the expense universe. The Board also reviewed the fee schedules for separately managed accounts of the Manager with a similar investment mandate. The Board considered that the Manager has contractually agreed to waive its fees and/or bear other expenses of the Class K and Institutional Class Shares of the Fund through April 30, 2019 and that the contractual agreement may only be terminated by the Board. The Board considered that the management fee was on the low end of the spectrum of the expense peer group. On the basis of the information provided, the Board concluded that the management fee was reasonable.
The International Concentrated Growth Fund
The Board reviewed the Fund's management fee (plus the administration and supervisory fee) and total expense ratio and compared them to the average management fees and expense ratios of an expense peer group and expense universe of funds based on data provided by Broadridge. The comparable fund information showed that the Fund's management fee (plus the administration and supervisory fee) was above the average management fee of the expense peer group and below the average management fee of the expense universe. The Board also reviewed the fee schedules for separately managed accounts of the Manager with a similar investment mandate. The Board considered that the Manager has contractually agreed to waive its fees and/or bear other expenses of the Class K and Institutional Class Shares of the Fund through April 30, 2019 and that the contractual agreement may only be terminated by the Board. On the basis of the information provided, the Board concluded that the management fee was reasonable.
Conclusion
Based upon all the information considered and the conclusions reached, the Board determined that the terms of the Advisory Agreement for the Funds were reasonable and fair and that the approval of the Advisory Agreement was in the best interests of each Fund.
216
Item 2. Code of Ethics.
(a) The registrant, as of the end of the period covered by this report, has adopted a code of ethics that applies to the registrant’s principal executive officer, principal financial officer, principal accounting officer or controller, or persons performing similar functions, regardless of whether these individuals are employed by the registrant or a third party.
(b) Not applicable.
(c) There have been no amendments, during the period covered by this report, to a provision of the code of ethics that applies to the registrant’s principal executive officer, principal financial officer, principal accounting officer or controller, or persons performing similar functions, regardless of whether these individuals are employed by the registrant or a third party, and that relate to any element of the code of ethics definition enumerated in paragraph (b) of this item’s instructions.
(d) The registrant has not granted any waivers, including an implicit waiver, from a provision of the code of ethics that applies to the registrant’s principal executive officer, principal financial officer, principal accounting officer or controller, or persons performing similar functions, regardless of whether these individuals are employed by the registrant or a third party, that relates to one or more of the items set forth in paragraph (b) of this item’s instructions.
(e) Not applicable.
(f) The registrant’s Code of Ethics is attached hereto as an exhibit.
Item 3. Audit Committee Financial Expert.
As of the end of the period covered by the report, the registrant’s Board of Trustees has determined that Mr. Robert E. Rigsby, is qualified to serve as an audit committee financial expert serving on its audit oversight committee and that he is “independent,” as defined by Item 3 of Form N-CSR.
Item 4. Principal Accountant Fees and Services.
Audit Fees
(a) The aggregate fees billed for each of the last two fiscal years for professional services rendered by the principal accountant for the audit of the registrant’s annual financial statements or services
that are normally provided by the accountant in connection with statutory and regulatory filings or engagements for those fiscal years are $164,000 for 2016 and $240,800 for 2017.
Audit fees include amounts for auditing and reporting on the financial statements and the financial highlights included in the Funds annual report to the shareholders, issuance of the auditor’s consent to be included in the Funds’ annual amendment to the registration statement on Form N-1A, issuance of the auditor’s report on internal controls for inclusion in Form N-SAR and provision of comments on the Funds’ interim financial statements (as requested). The audit fees above represent the amounts billed for services provided for the fiscal year indicated, not the amounts billed during such year.
Audit-Related Fees
(b) The aggregate fees billed in each of the last two fiscal years for assurance and related services by the principal accountant that are reasonably related to the performance of the audit of the registrant’s financial statements and are not reported under paragraph (a) of this Item are $0 for 2016 and $0 for 2017.
Audit-related fees include amounts billed for assurance and related services rendered to the registrant, including consultations related to financial accounting and reporting standards. The audit-related fees above represent the amounts billed during the fiscal year indicated.
Tax Fees
(c) The aggregate fees billed in each of the last two fiscal years for professional services rendered by the principal accountant for tax compliance, tax advice, and tax planning are $34,000 for 2016 and $72,000 for 2017.
Tax fees include amounts for services rendered to the registrant for tax compliance, tax planning and tax advice, including tax return preparation and review of and participation in determining required income and capital gains distributions. The tax fees above represent the amounts billed during the fiscal year indicated.
All Other Fees
(d) The aggregate fees billed in each of the last two fiscal years for products and services provided by the principal accountant, other than the services reported in paragraphs (a) through (c) of this Item are $0 for 2016 and $0 for 2017.
(e)(1) Engagements that are required to be pre-approved by the registrant’s Audit Oversight Committee, “the Committee”, may be pre-approved (i) at any regular or special meeting of the Committee or (ii) by the Committee Chair (or any other Committee member who is a disinterested trustee under the 1940 Act to whom this responsibility has been delegated), as long as the estimated fee for the particular services for which pre-approval is sought does not exceed $75,000 (for audit services) or $100,000 (for audit-related services) and provided that such committee member must report, for informational purposes only, any pre-approval decisions to the Board at its next regularly scheduled meeting.
(e)(2) The percentage of services described in each of paragraphs (b) through (d) of this Item that were approved by the audit committee pursuant to paragraph (c)(7)(i)(C) of Rule 2-01 of Regulation S-X are as follows:
(b) Audit Related Fees — Not Applicable
(c) Tax Fees — 100%
(d) All Other Fees — Not Applicable
(f) Not applicable.
(g) The aggregate non-audit fees billed by the registrant’s accountant for services rendered to the registrant, and rendered to the registrant’s investment adviser (not including any sub-adviser whose role is primarily portfolio management and is subcontracted with or overseen by another investment adviser), and any entity controlling, controlled by, or under common control with the adviser that provides ongoing services to the registrant for each of the last two fiscal years of the registrant was $0 for 2016 and $0 for 2017.
(h) Not applicable.
Item 5. Audit Committee of Listed Registrants.
Not applicable.
Item 6. Investments.
(a) Schedule of Investments in securities of unaffiliated issuers as of the close of the reporting period is included as part of the report to shareholders filed under Item 1 of this form.
(b) In accordance with Section 13(c) of the Investment Company Act of 1940, the registrant has divested itself of the following securities since the filing of its last report on Form N-CSR:
The International Equity Fund
Name of
Issuer | | Exchange
Ticker
Symbol | | Security
Identifier
(CUSIP
number/ISIN) | | Total
Number
of Shares
Divested | | Date
Securities
were
Divested | | Amount
Held on
Filing Date | | Statute |
Atlas Copco B | | ATCO B | | SE0006886768 | | 18,995 | | 03/03/2017 | | 1,204,314 | | Sudan Accountability and Divestment Act of 2007; |
| | | | | | 51,805 | | 07/19/2017 | | | |
| | | | | | 19,648 | | 10/24/2017 | | | |
| | | | | | 27,348 | | 11/27/2017 | | | |
| | | | | | 18,884 | | 12/18/2017 | | | |
The EAFE Fund
Name of
Issuer | | Exchange
Ticker
Symbol | | Security
Identifier
(CUSIP
number/ISIN) | | Total
Number
of Shares
Divested | | Date
Securities
were
Divested | | Amount
Held on
Filing Date | | Statute |
Atlas Copco A | | ATCO A | | SE0006886750 | | 39,167 | | 04/21/2017 | | 2,200,696 | | Sudan Accountability and Divestment Act of 2007; |
| | | | | | 49,424 | | 06/22/2017 | | | |
| | | | | | 41,769 | | 09/21/2017 | | | |
| | | | | | 38,216 | | 09/26/2017 | | | |
| | | | | | 22,457 | | 10/16/2017 | | | |
| | | | | | 20,941 | | 10/31/2017 | | | |
| | | | | | 63,343 | | 11/28/2017 | | | |
| | | | | | 25,432 | | 12/18/2017 | | | |
| | | | | | 26,160 | | 12/27/2017 | | | |
The EAFE Choice Fund
Name of
Issuer | | Exchange
Ticker
Symbol | | Security
Identifier
(CUSIP
number/ISIN) | | Total
Number
of Shares
Divested | | Date
Securities
were
Divested | | Amount
Held on
Filing Date | | Statute |
Atlas Copco A | | ATCO A | | SE0006886750 | | 3,109 | | 03/17/2017 | | 0 | | Sudan Accountability and Divestment Act of 2007; |
| | | | | | 6,606 | | 08/30/2017 | | | |
| | | | | | 4,025 | | 10/04/2017 | | | |
| | | | | | 3,830 | | 11/15/2017 | | | |
| | | | | | | | | | | | |
Atlas Copco B | | ATCO B | | SE0006886768 | | 7,783 17,637 | | 11/20/2017 12/05/2017 | | 180,311 | | Sudan Accountability and Divestment Act of 2007; |
| | | | | | | | | |
The EAFE Pure Fund
Name of
Issuer | | Exchange
Ticker
Symbol | | Security
Identifier
(CUSIP
number/ISIN) | | Total
Number
of Shares
Divested | | Date
Securities
were
Divested | | Amount
Held on
Filing Date | | Statute |
Atlas Copco A | | ATCO A | | SE0006886750 | | 3,341 11,451 | | 08/11/2017 12/19/2017 | | 138,119 | | Sudan Accountability and Divestment Act of 2007; |
| | | | | | | | | |
The Global Alpha Equity Fund
Name of
Issuer | | Exchange
Ticker
Symbol | | Security
Identifier
(CUSIP
number/ISIN) | | Total
Number
of Shares
Divested | | Date
Securities
were
Divested | | Amount
Held on
Filing Date | | Statute |
Atlas Copco A | | ATCO A | | SE0006886750 | | 9,975 | | 02/28/2017 | | 0 | | Sudan Accountability and Divestment Act of 2007; |
| | | | | | | | | | | | |
Atlas Copco B | | ATCO B | | SE0006886768 | | 2,793 14,081 7,911 | | 02/28/2017 09/15/2017 11/27/2017 | | 353,827 | | Sudan Accountability and Divestment Act of 2007; |
| | | | | | | | | |
| | | | | | | | | |
The Long Term Global Growth Equity Fund
Name of
Issuer | | Exchange
Ticker
Symbol | | Security
Identifier
(CUSIP
number/ISIN) | | Total
Number
of Shares
Divested | | Date
Securities
were
Divested | | Amount
Held on
Filing Date | | Statute |
Atlas Copco A | | ATCO A | | SE0006886750 | | 2,574 | | 03/22/2017 | | 62,884 | | Sudan Accountability and Divestment Act of 2007; |
| | | | | | 3,331 | | 03/23/2017 | | | |
| | | | | | 1,337 | | 03/30/2017 | | | |
| | | | | | 557 | | 03/31/2017 | | | |
| | | | | | 1,061 | | 04/04/2017 | | | |
| | | | | | 197 | | 04/04/2017 | | | |
| | | | | | 906 | | 04/05/2017 | | | |
Item 7. Disclosure of Proxy Voting Policies and Procedures for Closed-End Management Investment Companies.
Not applicable.
Item 8. Portfolio Managers of Closed-End Management Investment Companies.
Not applicable.
Item 9. Purchases of Equity Securities by Closed-End Management Investment Company and Affiliated Purchasers.
Not applicable.
Item 10. Submission of Matters to a Vote of Security Holders.
Not applicable.
Item 11. Controls and Procedures.
(a) The registrant’s principal executive and principal financial officers, or persons performing similar functions, have concluded that the registrant’s disclosure controls and procedures (as defined in Rule 30a-3(c) under the Investment Company Act of 1940, as amended (the “1940 Act”) (17 CFR 270.30a-3(c))) are effective, as of a date within 90 days of the filing date of the report that includes the disclosure required by this paragraph, based on their evaluation of these controls and procedures required by Rule 30a-3(b) under the 1940 Act (17 CFR 270.30a-3(b)) and Rules 13a-15(b) or 15d-15(b) under the Securities Exchange Act of 1934, as amended (17 CFR 240.13a-15(b) or 240.15d-15(b)).
(b) There were no changes in the registrant’s internal control over financial reporting (as defined in Rule 30a-3(d) under the 1940 Act (17 CFR 270.30a-3(d))) that occurred during the registrant’s last fiscal quarter that has materially affected, or is reasonably likely to materially affect, the registrant’s internal control over financial reporting.
Item 12. Disclosure of Securities Lending Activities for Closed-End Management Investment Companies.
Not applicable.
Item 13. Exhibits.
(a)(1) Code of ethics, or any amendment thereto, that is the subject of disclosure required by Item 2 is attached hereto.
(a)(2) Certifications pursuant to Rule 30a-2(a) under the 1940 Act and Section 302 of the Sarbanes-Oxley Act of 2002 are attached hereto.
(a)(3) Not applicable.
(a)(4) Not applicable.
(b) Certifications pursuant to Rule 30a-2(b) under the 1940 Act and Section 906 of the Sarbanes-Oxley Act of 2002 are attached hereto.
SIGNATURES
Pursuant to the requirements of the Securities Exchange Act of 1934 and the Investment Company Act of 1940, the registrant has duly caused this report to be signed on its behalf by the undersigned, thereunto duly authorized.
(Registrant) | | Baillie Gifford Funds | |
| | |
| | |
By (Signature and Title)* | /s/ David Salter | |
| David Salter, President | |
| (principal executive officer) | |
| | |
| | |
Date | March 1, 2018 | | |
| | | | |
Pursuant to the requirements of the Securities Exchange Act of 1934 and the Investment Company Act of 1940, this report has been signed below by the following persons on behalf of the registrant and in the capacities and on the dates indicated.
By (Signature and Title)* | /s/ David Salter | |
| David Salter, President | |
| (principal executive officer) | |
| | |
| | |
Date | March 1, 2018 | | |
| | |
| | |
By (Signature and Title)* | /s/ Lindsay Cockburn | |
| Lindsay Cockburn, Treasurer | |
| (principal financial officer) | |
| | |
Date | March 1, 2018 | | |
* Print the name and title of each signing officer under his or her signature.