UNITED STATES
SECURITIES AND EXCHANGE COMMISSION
Washington, D.C. 20549
FORM N-CSR
CERTIFIED SHAREHOLDER REPORT OF REGISTERED
MANAGEMENT INVESTMENT COMPANIES
Investment Company Act file number | 811-10145 |
|
Baillie Gifford Funds |
(Exact name of registrant as specified in charter) |
|
1 Greenside Row
Edinburgh, Scotland, UK, | |
EH1 3AN
|
(Address of principal executive offices) | | (Zip code) |
|
Gareth Griffiths
1 Greenside Row
Edinburgh, Scotland, UK, EH1 3AN |
(Name and address of agent for service) |
|
Registrant’s telephone number, including area code: | 011-44-131-275-2000 | |
|
Date of fiscal year end: | December 31 | |
|
Date of reporting period: | December 31, 2015 | |
| | | | | | | | |
Form N-CSR is to be used by management investment companies to file reports with the Commission not later than 10 days after the transmission to stockholders of any report that is required to be transmitted to stockholders under Rule 30e-1 under the Investment Company Act of 1940 (17 CFR 270.30e-1). The Commission may use the information provided on Form N-CSR in its regulatory, disclosure review, inspection, and policymaking roles.
A registrant is required to disclose the information specified by Form N-CSR, and the Commission will make this information public. A registrant is not required to respond to the collection of information contained in Form N-CSR unless the Form displays a currently valid Office of Management and Budget (“OMB”) control number. Please direct comments concerning the accuracy of the information collection burden estimate and any suggestions for reducing the burden to Secretary, Securities and Exchange Commission, 100 F Street, NE, Washington, DC 20549. The OMB has reviewed this collection of information under the clearance requirements of 44 U.S.C. § 3507.
Item 1. Reports to Stockholders.
The Report to Shareholders is attached herewith.
BAILLIE GIFFORD FUNDS
International Equity Fund
EAFE Fund
EAFE Choice Fund
EAFE Pure Fund
Emerging Markets Fund
Global Alpha Equity Fund
Long Term Global Growth Equity Fund
International Choice Fund
Annual Report
December 31, 2015


Index
Page Number | | | |
| | 01 | | | Management Discussion | |
| | 17 | | | Fund Expenses | |
| | | International Equity Fund | |
| | 21 | | | Industry Diversification Table | |
| | 23 | | | Portfolio of Investments | |
| | 28 | | | Statement of Assets and Liabilities | |
| | 29 | | | Statement of Operations | |
| | 30 | | | Statements of Changes in Net Assets | |
| | | Financial Highlights | |
| | 32 | | | Selected Data for Class 2 | |
| | 33 | | | Selected Data for Class 3 | |
| | 34 | | | Selected Data for Class 5 | |
| | | EAFE Fund | |
| | 35 | | | Industry Diversification Table | |
| | 36 | | | Portfolio of Investments | |
| | 40 | | | Statement of Assets and Liabilities | |
| | 41 | | | Statement of Operations | |
| | 42 | | | Statements of Changes in Net Assets | |
| | | Financial Highlights | |
| | 44 | | | Selected Data for Class 2 | |
| | 45 | | | Selected Data for Class 3 | |
| | 46 | | | Selected Data for Class 4 | |
| | 47 | | | Selected Data for Class 5 | |
| | | EAFE Choice Fund | |
| | 48 | | | Industry Diversification Table | |
| | 50 | | | Portfolio of Investments | |
| | 54 | | | Statement of Assets and Liabilities | |
| | 55 | | | Statement of Operations | |
| | 56 | | | Statements of Changes in Net Assets | |
| | | Financial Highlights | |
| | 57 | | | Selected Data for Class 1 | |
| | 58 | | | Selected Data for Class 2 | |
| | 59 | | | Selected Data for Class 3 | |
| | | EAFE Pure Fund | |
| | 60 | | | Industry Diversification Table | |
| | 61 | | | Portfolio of Investments | |
| | 64 | | | Statement of Assets and Liabilities | |
| | 65 | | | Statement of Operations | |
| | 66 | | | Statements of Changes in Net Assets | |
| | | Financial Highlights | |
| | 67 | | | Selected Data for Class 2 | |
| | | Emerging Markets Fund | |
| | 68 | | | Industry Diversification Table | |
| | 70 | | | Portfolio of Investments | |
| | 74 | | | Statement of Assets and Liabilities | |
| | 75 | | | Statement of Operations | |
| | 76 | | | Statements of Changes in Net Assets | |
Page Number | | | |
| | | Financial Highlights | |
| | 77 | | | Selected Data for Class 2 | |
| | 78 | | | Selected Data for Class 4 | |
| | 79 | | | Selected Data for Class 5 | |
| | | Global Alpha Equity Fund | |
| | 80 | | | Industry Diversification Table | |
| | 82 | | | Portfolio of Investments | |
| | 87 | | | Statement of Assets and Liabilities | |
| | 88 | | | Statement of Operations | |
| | 89 | | | Statements of Changes in Net Assets | |
| | | Financial Highlights | |
| | 90 | | | Selected Data for Class 2 | |
| | 91 | | | Selected Data for Class 3 | |
| | | Long Term Global Growth Equity Fund | |
| | 92 | | | Industry Diversification Table | |
| | 93 | | | Portfolio of Investments | |
| | 95 | | | Statement of Assets and Liabilities | |
| | 96 | | | Statement of Operations | |
| | 97 | | | Statements of Changes in Net Assets | |
| | | Financial Highlights | |
| | 98 | | | Selected Data for Class 1 | |
| | 99 | | | Selected Data for Class 2 | |
| | 100 | | | Selected Data for Class 4 | |
| | | International Choice Fund | |
| | 101 | | | Industry Diversification Table | |
| | 103 | | | Portfolio of Investments | |
| | 107 | | | Statement of Assets and Liabilities | |
| | 108 | | | Statement of Operations | |
| | 109 | | | Statements of Changes in Net Assets | |
| | | Financial Highlights | |
| | 110 | | | Selected Data for Class 1 | |
| | 111 | | | Selected Data for Class 2 | |
| | 112 | | | Selected Data for Class 3 | |
| | 113 | | | Notes to Financial Statements | |
| | 139 | | | Report of Independent Registered Public Accounting Firm | |
| | | Supplemental Information | |
| | 140 | | | Federal Income Tax Information | |
| | 141 | | | Management of the Trust | |
| | 143 | | | Board Considerations Regarding 2015 Contract Renewal | |

Management Discussion (unaudited)
Annual Report December 31, 2015
International Equity Fund
Market Conditions and Review of Performance during 2015
During 2015, markets were fairly volatile, and the MSCI ACWI ex U.S. Index fell 5.25%. Much of the headlines were dominated by newsflow surrounding growth prospects for the Chinese economy and those emerging markets that depend on it, falling oil and commodity prices and rate rises in the U.S. While markets inevitably move on such news, our mentality during turbulent periods is to remember that the long-term value of equities is rarely altered by single events, and that the markets tend to overreact to headlines. We focus instead on company fundamentals, and often view market volatility as an inefficiency to exploit by adding to companies that may have been unfairly punished in share price terms.
The International Equity Fund Class 2 returned -1.89% during 2015, outperforming the MSCI ACWI ex U.S. Index which returned -5.25% for the year.
A number of diversified financial holdings contributed to this relative outperformance, including the exchanges Japan Exchange Group, Hong Kong Exchanges and Clearing and Deutsche Boerse (European exchange operator) who benefitted from increased trading volumes as a result of market volatility. Amlin (UK insurer) and Hargreaves Lansdown (UK on-line retail investing platform) were also among the top performers. Elsewhere, Ryanair (European low cost airline), which now offers passengers flights between a greater number of primary airports and a friendlier approach, has been a fairly consistent contributor throughout the year.
The low oil price had an effect on relative performance with Tullow Oil (oil exploration and production company) and Seadrill (offshore drilling company) among the significant detractors for the year. Rio Tinto (low cost iron-ore producer) also detracted, seeing weakness in their shares due to falling commodity prices. In this tough environment, success in the sector comes down to balance sheet strength, cost flexibility and embedding lifting costs. We continue to believe that Rio Tinto is well positioned in this regard. Bitauto (Chinese online car distributor) was also among the top detractors. This was held for an unusually short period of less than a year. It has shifted its business model from
purely online to a mixture of online and offline (leasing vehicles, car insurance and financing). This is more capital intensive than pure online advertising and has seen cash flow and our expectations for future profitability deteriorate quite rapidly.
We continue to find exciting investment opportunities for the portfolio. For example, we have taken holdings in Alibaba (Chinese e-commerce giant), Constellation Software (holding company of niche software businesses), Sumitomo Mitsui Trust Holdings (Japanese independent trust bank) and Nidec (Japanese manufacturer of specialist small motors). The Fund comprises a diverse range of companies, but we remain focussed on those that have durable competitive advantages, good management, and strong financial characteristics.
Investment Strategies used to manage the Fund
Baillie Gifford is a growth manager with a bottom-up approach to stock picking. We aim to invest in companies that will generate sustainable earnings growth above that of the market over the long term. In determining the potential of a company, we analyse industry background, competitive advantage, management attitudes and financial strength, and finally we consider valuation. We meet the management of companies within our investment universe and revisit the investment case for the Fund's holdings on a regular basis to ensure that our expectations are being met.
The ACWI ex U.S. Alpha Portfolio Construction Group is responsible for the overall strategy and stock selection process. They meet regularly to discuss both buy and sell ideas and the level of conviction for existing holdings and will continue to monitor the long-term prospects for the Fund's holdings and make changes where appropriate.
Outlook
As stock pickers, our focus, as always, remains on company fundamentals. The Portfolio Construction Group will continue to work hard on monitoring the investment case for existing holdings, and look out for new long-term growth opportunities for the Fund.
01
Management Discussion (unaudited)
Annual Report December 31, 2015
Fund Performance for periods ended 12/31/15 (Average Annual Total Returns)
| | One Year | | % p.a.
Five Year | | Since Inception
% p.a.
(February 7, 2008) | |
The International Equity Fund Class 2* | | | -1.89 | % | | | 3.42 | % | | | 2.68 | % | |
MSCI ACWI Ex U.S. Index | | | -5.25 | % | | | 1.51 | % | | | 0.83 | % | |
* The returns for Class 2 shares have been provided. One-year return figures for the other share classes are as follows: -1.82% for Class 3 and -1.75% for Class 5. Additional year-over-year returns for each class are available in the Financial Highlights section.
Comparison of the change in value of $1,000,000 investment in the Fund's Class 2 shares and the Index
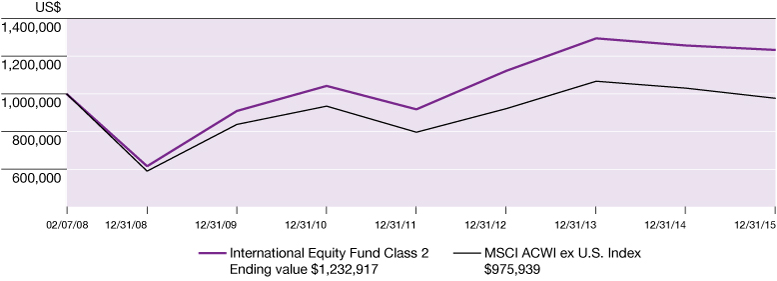
Past performance does not predict future performance. The graph and the table above do not reflect the deduction of taxes that a shareholder would pay on Fund distributions or redemptions of Fund shares.
02
Management Discussion (unaudited)
Annual Report December 31, 2015
The EAFE Fund
Market Conditions and Review of performance during 2015
2015 was a volatile year for international equities. Early enthusiasm, following additional stimulus from the European Central Bank, turned to fear as Greece's stand-off with its creditors led to an unsatisfactory last ditch solution. Market sentiment was then further shaken following the release of weak Chinese growth data (in spite of the fact that this had been widely forecast), and a rout set in when the Chinese government introduced a series of well intended, but poorly conceived, policy measures. That international markets largely recovered from these falls has been less newsworthy, but it reminds us of the importance of patience when investing over the long term.
The EAFE Fund Class 2 produced a return of -3.07% during 2015, underperforming the MSCI EAFE Index which returned -0.39%.
The Fund's exposure to bank stocks hurt performance. In Europe, Banco Popular, Banco Santander, and Svenska Handelsbanken suffered under the weight of increased regulatory oversight, higher capital requirements and muted loan growth. Likewise Standard Chartered and Credicorp, the emerging markets focussed banks, were weak as the macro backdrop in their geographies deteriorated. Industrial holdings also detracted as falling commodity prices and lower investment impacted broader industry trends. For example, Rolls Royce, the UK engineering company, was impacted by lower offshore oil and gas activity and reduced defence spending; however, we remain optimistic about the long-term growth potential of its civil aerospace division where Rolls Royce enjoys a duopoly position in a structural growth market. For Volkswagen (the German car manufacturer) the challenge was more company specific, and we sold the Fund's holding following the emissions scandal.
Moving to the contributors, companies such as Tencent (Chinese internet company), Zalando (online fashion retailer), and, within its niche, New Oriental Education & Technology (Chinese education provider) are driving the transition towards internet based commerce. Zalando was only founded in 2008 but has already achieved annual sales of €3bn. Healthcare holdings, such as Celltrion (Korean biopharmaceutical company), Christian Hansen (Danish enzyme specialist),
M3 (Japanese online medical portal), and Genmab, also appreciated strongly. Genmab, which is focused on developing humanised antibodies to treat cancer, was strong following FDA approval for one of its new drugs.
Two of the most prominent investment themes within the Fund are the vital force of technological change and the growing importance of emerging market consumers, the new holding in Ctrip embodies both of these themes. Ctrip, China's largest online travel company, has a highly scalable business model and a huge market opportunity, furthermore we believe that recent consolidation in the sector should lead to improved margins. Staying with technology, the demand for ever more powerful (and mobile) computers is a tailwind for companies with specialist skills within the semiconductor industry, and the Fund took new positions in AMS and Dialogue Semiconductor. AMS makes analogue semiconductors which act as the interface between the digital and the real world, enabling digital devices to sense and regulate the real world in a growing range of devices. Separately we anticipated that Dialog Semiconductor will benefit from increasing demand for its power management chips, which help to extend the battery life in ever more powerful mobile devices. New holdings were funded by sales in a range of companies where we felt that the future growth prospects were not similarly impressive, examples being Heidelberg Cement, Meggitt, Porsche, and Mail.ru.
Investment Strategies used to manage the Fund
The investment strategy remains unchanged. The investment managers follow a growth strategy with a bottom-up approach to stock picking. We aim to invest in companies that will generate sustainable earnings growth above the market over the long term. In determining the potential of a company, we analyse industry background, competitive advantage, management attitudes and financial strength, and finally we consider valuation. We meet the management of the companies within our investment universe and revisit the investment case for the Fund's holdings on a regular basis to ensure that our expectations are being met.
The EAFE Alpha Portfolio Construction Group is responsible for the overall strategy and stock selection process. They meet regularly to discuss both buy and sell ideas and the level of conviction in their continuing holdings.
03
Management Discussion (unaudited)
Annual Report December 31, 2015
Outlook
The New Year will no doubt herald many new events about which the media, and investors generally, will obsess. As we saw in 2015, noisy headlines are generally a distraction in the search for long duration growth trends. On a recent investment visit to China, amidst the blaring western headlines of Chinese weakness undermining global growth, we found management teams talking of growth and the myriad of opportunities driven by the scale of the market, immature infrastructure and the pace of mobile development. Offline goods and
services are being cannibalised by the move online in both developing and developed economies. This research has reinforced our positive views on the social networks and e-commerce innovators the Fund's invest in on your behalf such as Baidu, Alibaba, Tencent, Zalando and Kinnevik, and we remain as excited as ever by the potential rate and duration of growth for these businesses, despite inevitable short-term fears. Similarly, there is little doubt that healthcare will look very different in five to ten years' time, such is the acceleration of our understanding of human biology. It is hard to overstate the potential benefits to society should new medical technologies deliver on their potential.
Fund Performance for periods ended 12/31/15 (Average Annual Total Returns)
| | One Year | | Five Year | | Since Inception
% p.a.% p.a.
(March 6, 2008) | |
The EAFE Fund Class 2* | | | -3.07 | % | | | 4.00 | % | | | 2.63 | % | |
MSCI EAFE Index | | | -0.39 | % | | | 4.07 | % | | | 1.19 | % | |
* The returns for Class 2 shares have been provided. One-year return figures for the other share classes are as follows: -3.02% for Class 3, -2.99% for Class 4 and -2.94% for Class 5. Additional year-over-year returns for each class are available in the Financial Highlights section.
Comparison of the change in value of $1,000,000 investment in the Fund's Class 2 shares and the Index
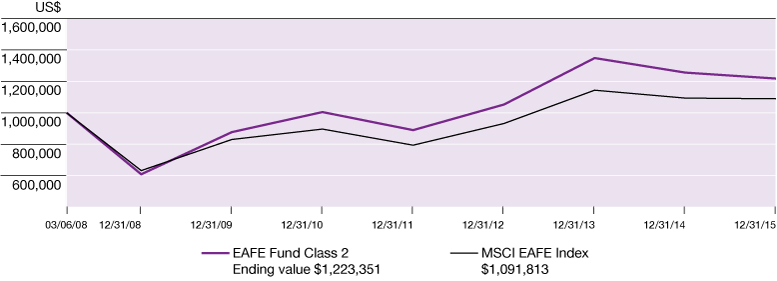
Past performance does not predict future performance. The graph and the table above do not reflect the deduction of taxes that a shareholder would pay on Fund distributions or redemptions of Fund shares.
04
Management Discussion (unaudited)
Annual Report December 31, 2015
The EAFE Choice Fund
Market Conditions and Review of performance during 2015
On the face of it, 2015 was a lacklustre year for international markets. The oil price continued its decline, but it was not alone; during December, most major commodities reached their lowest price levels since the Global Financial Crisis. Other significant events which punctuated the year included the Greek debt crisis, volatility in Chinese stock markets, escalating tensions in the Middle East and the devastating terrorist attack in Paris. It was pleasing, therefore, to end the year on a more positive note. By initiating the first interest rate rise for almost a decade, the Federal Reserve exhibited some confidence that there may be more stable economic times ahead. However, whilst individual macro events can, undoubtedly, have an impact on short term investment performance, predicting such events is a fruitless endeavour. Rather than attempting to do so, the International Focus Team is dedicated to identifying high quality growth businesses, run by trustworthy management, trading at attractive valuations. Twelve months is far too short a time period to assess the merits of this approach, but maintaining faith in this established investment philosophy will, we believe, offer the best opportunity for attractive long-term returns.
The EAFE Choice Fund Class 2 produced a return of 2.16% during 2015, outperforming the benchmark which returned -0.39% for the year.
The UK market finished the year in negative territory (weighed down by the troubles of the energy sector) but that did not stop two domestically focussed, UK-listed names being the Fund's top performers during the period. Buoyed by rising house prices, particularly in London, Rightmove, the online real estate portal enjoyed a stellar year. Despite the best efforts of its competitors, the company maintains a dominant position, enjoying an 80% market share. The management team, led by CEO and co-founder Nick McKittrick, has demonstrated a sensible long-term approach, implementing gradual price increases and broadening the company's range of services. Whilst retaining sufficient capital to enable continued R&D investment, the company has a good record of returning excess cash to shareholders. Having started in 2007, Rightmove has bought back over one third of its shares in issuance.
The other UK-listed business amongst the top performers was Hargreaves Lansdown. The leading domestic online financial services platform saw strong inflows during the year, partly as a result of government
initiatives announced in 2014 and 2015. The reforms enable greater tax free savings and increased flexibility regarding pension assets. With the baby boomer generation reaching retirement age, Hargreaves Lansdown is well placed to continue to benefit from favourable structural demographics. At more than three times the size of its nearest competitor, the company's scale should help to ensure that it can continue to generate strong revenues despite the sector facing increasing pressure over fees.
Another strong contributor to performance during the year was Danish pharmaceutical business, Novo Nordisk. The world leader in the treatment of diabetes, the company employs over 40,000 people throughout 75 countries. Novo Nordisk has a long history of heavy investment in R&D and it received positive news flow around its new insulin drug, Tresiba. Having been approved by the FDA, the product is expected to be launched during the first quarter of 2016. The longer-term opportunity also looks bright for Novo Nordisk, with only about 6% of the diabetic population currently receiving effective care.
Emerging markets endured a challenging year and, within the fund, this was most clearly manifested in the weakness of banking stocks Standard Chartered, United Overseas Bank (UOB) and Garanti Bankasi. The former has a strong presence in commercial and trade related finance throughout Asia and Africa which may present long-term growth opportunities. However, a series of challenging events including regulatory fines, management change and capital raising prompted us to reconsider the holding. Whilst the new management team have established what appears to be a credible restructuring process, we fear that there will be more pain before the benefits are reaped. We also sold Garanti Bankasi as the political and economic situation in Turkey has rather engulfed the original investment case. We remain more positive about the growth prospects for Singaporean bank, UOB and see the expanding wealth management business as an important driver of future returns.
Johnson Matthey is one of the largest suppliers of environmental catalysts used in the manufacturing of automobiles. Supported by significant changes in environmental legislation, the long term investment case for Johnson Matthey looks attractive. However, during 2015 the share price was weak due to the uncertainty surrounding the Volkswagen emissions scandal. Around half of the cars in Europe are diesel and this is an important market for Johnson Matthey. The ramifications of the emissions fraud are yet to become clear; the bull case for Johnson Matthey is that tighter controls create an increased demand for more sophisticated products.
05
Management Discussion (unaudited)
Annual Report December 31, 2015
Investment Strategies used to manage the Fund
Baillie Gifford is a growth manager with a bottom-up approach to stock picking. We aim to invest in companies that will generate sustainable earnings growth above the market over the long-term. In determining the potential of a company, we analyse industry background, competitive advantage, management capabilities, financial strength and valuation. From the outset, we also consider aspects which may derail the investment case and revisit the thesis for the Fund's holdings on a regular basis to ensure that our expectations are being met.
The International Focus Portfolio Construction Group is responsible for the overall strategy and stock selection process. It meets regularly to discuss both buy and sell ideas and the level of conviction for existing holdings. Ongoing monitoring of the long-term prospects for the Fund's holdings enables appropriate changes to be made, where applicable.
Outlook
There are a number of uncertainties on the horizon as we enter 2016: fluctuating oil prices, the transitioning Chinese economy, instability in the Middle East and rising interest rates. However, while the individual nature of these opportunities and threats may be slightly different from previous years, our approach to managing the Fund remains unchanged. Our focus continues to be the discovery of exciting growth companies, based on a consistent investment process and fundamental analysis. The fortunes of companies can change markedly in the short term, often based on the irrational behaviour of the market. However, identifying companies with growing franchise business run by sensible, aligned management teams will give us every chance of generating outperformance over the long-term. The Fund represents an eclectic mix of business and we already have an exciting list of potential new ideas for the year ahead. Indeed, this is an excellent time for long-term stock pickers.
Fund Performance for periods ended 12/31/15 (Average Annual Total Returns)
| | One Year | | % p.a.
Five Year | | Since Inception
% p.a.
(December 17, 2009) | |
The EAFE Choice Fund Class 2* | | | 2.16 | % | | | 4.78 | % | | | 7.03 | % | |
MSCI EAFE Index | | | -0.39 | % | | | 4.07 | % | | | 5.08 | % | |
* The returns for Class 2 shares have been provided. One-year return figures for the other share classes are as follows: 2.10% for Class 1 and 2.25% for Class 3. Additional year-over-year returns for each class are available in the Financial Highlights section.
Comparison of the change in value of $1,000,000 investment in the Fund's Class 2 shares and the Index

Past performance does not predict future performance. The graph and the table above do not reflect the deduction of taxes that a shareholder would pay on Fund distributions or redemptions of Fund shares.
06
Management Discussion (unaudited)
Annual Report December 31, 2015
The EAFE Pure Fund
Market Conditions and Review of performance during 2015
On the face of it, 2015 was a lacklustre year for international markets. The oil price continued its decline, but it was not alone; during December, most major commodities reached their lowest price levels since the Global Financial Crisis. Other significant events which punctuated the year included the Greek debt crisis, volatility in Chinese stock markets, escalating tensions in the Middle East and the devastating terrorist attack in Paris. It was pleasing, therefore, to end the year on a more positive note. By initiating the first interest rate rise for almost a decade, the Federal Reserve exhibited some confidence that there may be more stable economic times ahead. However, whilst individual macro events can, undoubtedly, have an impact on short term investment performance, predicting such events is a fruitless endeavour. Rather than attempting to do so, the International Focus Team is dedicated to identifying high quality growth businesses, run by trustworthy management, trading at attractive valuations. Twelve months is far too short a time period to assess the merits of this approach, but maintaining faith in this established investment philosophy will, we believe, offer the best opportunity for attractive long-term returns.
The EAFE Pure Fund Class 2 produced a return of 4.61% during 2015, outperforming the benchmark which returned -0.39% for the year.
The UK market finished the year in negative territory (weighed down by the troubles of the energy sector) but that did not stop two domestically focussed, UK-listed names being the Fund's top performers during the period. Buoyed by rising house prices, particularly in London, Rightmove, the online real estate portal enjoyed a stellar year. Despite the best efforts of its competitors, the company maintains a dominant position, enjoying an 80% market share. The management team, led by CEO and co-founder Nick McKittrick, has demonstrated a sensible long-term approach, implementing gradual price increases and broadening the company's range of services. Whilst retaining sufficient capital to enable continued R&D investment, the company has a good record of returning excess cash to shareholders. Having started in 2007, Rightmove has bought back over one third of its shares in issuance.
The other UK-listed business amongst the top performers was Hargreaves Lansdown. The leading domestic online financial services platform saw strong
inflows during the year, partly as a result of government initiatives announced in 2014 and 2015. The reforms enable greater tax free savings and increased flexibility regarding pension assets. With the baby boomer generation reaching retirement age, Hargreaves Lansdown is well placed to continue to benefit from favourable structural demographics. At more than three times the size of its nearest competitor, the company's scale should help to ensure that it can continue to generate strong revenues despite the sector facing increasing pressure over fees.
Another strong contributor to performance during the year was Danish pharmaceutical business, Novo Nordisk. The world leader in the treatment of diabetes, the company employs over 40,000 people throughout 75 countries. Novo Nordisk has a long history of heavy investment in R&D and it received positive news flow around its new insulin drug, Tresiba. Having been approved by the FDA, the product is expected to be launched during the first quarter of 2016. The longer term opportunity also looks bright for Novo Nordisk, with only about 6% of the diabetic population currently receiving effective care.
Although not held directly, emerging markets endured a challenging year and, within the Fund, this was most clearly manifested in the weakness of banking stocks Standard Chartered and United Overseas Bank. The former has a strong presence in commercial and trade related finance throughout Asia and Africa which may present long-term growth opportunities. However, a series of challenging events including regulatory fines, management change and capital raising prompted us to reconsider the holding. Whilst the new management team have established what appears to be a credible restructuring process, we fear that there will be more pain before the benefits are reaped. We remain more positive about the growth prospects for Singaporean bank, UOB and see the expanding wealth management business as an important driver of future returns.
Johnson Matthey is one of the largest suppliers of environmental catalysts used in the manufacturing of automobiles. Supported by significant changes in environmental legislation, the long term investment case for Johnson Matthey looks attractive. However, during 2015 the share price was weak due to the uncertainty surrounding the Volkswagen emissions scandal. Around about half of the cars in Europe are diesel and this is an important market for Johnson Matthey. The ramifications of the emissions fraud are yet to become clear; the bull case for Johnson Matthey is that tighter controls create an increased demand for more sophisticated products.
07
Management Discussion (unaudited)
Annual Report December 31, 2015
Investment Strategies used to manage the Fund
Baillie Gifford is a growth manager with a bottom-up approach to stock picking. We aim to invest in companies that will generate sustainable earnings growth above the market over the long-term. In determining the potential of a company, we analyse industry background, competitive advantage, management capabilities, financial strength and valuation. From the outset, we also consider aspects which may derail the investment case and revisit the thesis for the Fund's holdings on a regular basis to ensure that our expectations are being met.
The International Focus Portfolio Construction Group is responsible for the overall strategy and stock selection process. It meets regularly to discuss both buy and sell ideas and the level of conviction for existing holdings. Ongoing monitoring of the long-term prospects for the Fund's holdings enables appropriate changes to be made, where applicable.
Outlook
There are a number of uncertainties as we enter 2016: fluctuating oil prices, the transitioning Chinese economy, instability in the Middle East and rising interest rates. However, while the individual nature of these opportunities and threats may be slightly different from previous years, our approach to managing the Fund remains unchanged. Our focus continues to be the discovery of exciting growth companies, based on a consistent investment process and fundamental analysis. The fortunes of companies can change markedly in the short term, often based on the irrational behaviour of the market. However, identifying companies with growing franchise business run by sensible, aligned management teams will give us every chance of generating outperformance over the long term. The Fund represents an eclectic mix of business and we already have an exciting list of potential new ideas for the year ahead. Indeed, this is an excellent time for long-term stock pickers.
Fund Performance for periods ended 12/31/15 (Average Annual Total Returns)
| | One Year | | Since Inception
% p.a.
(April 15, 2015) | |
The EAFE Pure Fund Class 2* | | | 4.61 | % | | | -0.82 | % | |
MSCI EAFE Index | | | -0.39 | % | | | -2.42 | % | |
* The returns for Class 2 shares have been provided.
Comparison of the change in value of $1,000,000 investment in the Fund's Class 2 shares and the Index
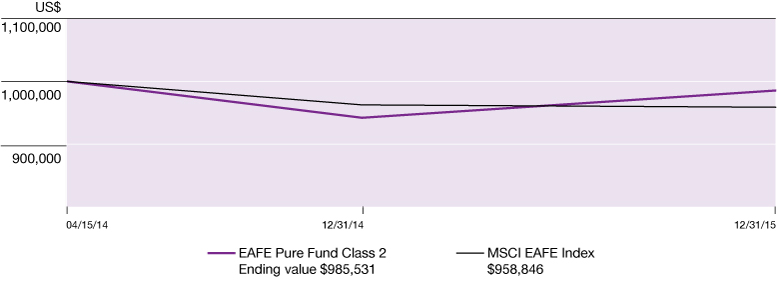
Past performance does not predict future performance. The graph and the table above do not reflect the deduction of taxes that a shareholder would pay on Fund distributions or redemptions of Fund shares.
08
Management Discussion (unaudited)
Annual Report December 31, 2015
The Emerging Markets Fund
Market Conditions and Review of Performance during 2015
It has been a forgettable year for emerging markets (EM) with the MSCI EM Index down over 14% in U.S. dollar terms. It would be easy in a year dominated by substantial swings in markets and sensationalist headlines to believe that much has changed within the emerging markets universe: evaporating growth, rampant China fears, collapsing commodity prices and currency sell-offs, have all dominated the scaremongering. However, there is little here that is really new.
The problems associated with falling commodity prices and U.S. dollar debt in a number of the larger EM economies, chief amongst them Brazil, Russia and South Africa, are well known. Economic growth has been scarce therefore, and the currencies of these countries have been extremely weak against the U.S. dollar over the last 12 months.
India's economic outlook has undoubtedly been given a helping hand by the collapse in oil prices, on account of the country being a large net importer. The narrowing of the current account deficit and the decline in inflation has allowed the Reserve Bank of India to cut interest rates, but the scope for further policy stimulus remains substantial. Whilst many political reforms have stalled during the year, there has been incremental progress, especially in the financial sector.
In China, the macroeconomic picture is unfolding much as we had expected. The industrial north is in recession while the consumption and services sectors continue to enjoy decent growth. The scope for policy stimulus is still substantial, with cuts to benchmark lending rates being made during the year, as well as to the banks' reserve requirement ratios. Over the past 12 months, there has been plenty of coverage of volatility in the A-share market, the so-called 'devaluation' of the renminbi and the slowdown in headline GDP. What matters far more than the size of China's GDP, is its shape. Beijing's efforts to rebalance the economy away from the investment-led model of recent decades, towards a more consumption-oriented approach, appears to be on track.
The Emerging Markets Fund Class 5 shares fell by 8.24% during 2015, outperforming the MSCI Emerging Markets Index which fell by 14.60%.
Dragon Oil, the Turkmenistan oil exploration and production business, was the top performance contributor over 2015. The company had been subject to a number of
failed takeover bids, but was eventually bought by the Emirates National Oil Company in August. The final bid of 800p per share followed pressure from Baillie Gifford and another investor on ENOC to raise its offer. The cash that was received by the fund as a result of the takeover was redeployed into a number of new holdings.
China was the top country contributor and a range of holdings displayed strong share price performance, including the internet businesses, Tencent and JD.com, property developer, China Vanke and telecoms equipment maker, ZTE Corp. Though the Chinese market has been volatile, we are encouraged by the operational performance at a number of companies, particularly the internet businesses. Tencent for example, is displaying rapid growth in revenues (3Q15, 34%) and operating profits (3Q15, 37%), and is reinvesting meaningfully in its future growth as it builds out its robust ecosystem further.
The markets in Brazil, Greece and South Africa were weak during the year and the underweight positions in each of these countries has helped performance. Brazil has had a particularly troubled time, mired by political scandal and the economy is shrinking in U.S. dollar terms, whilst unemployment is rising and debt levels are spiralling.
The Fund's underweight position in Russia detracted from performance as the stock market did better in 2015 than many of its EM counterparts. From our perspective, we still believe that the macro environment looks troubled. Inflation is running at 15.5% and nominal wage growth fell to a historic low of just 4.5% in October; Russia's recession rumbles on.
Also amongst the detractors was Mexico as Cemex detracted from performance. A strong U.S. market failed to offset weakness in Latin America. Nonetheless, the company continues to restructure, disposing of non-core assets and paying down debt; patience will be required for the benefits of this streamlining to take effect and for stabilisation in markets such as Colombia.
Investment Strategies used to manage the Fund
Baillie Gifford is a growth manager with a bottom-up approach to stock picking. We aim to invest in companies that will generate sustainable earnings growth above the market over the long term. In determining the potential of a company, we analyse the industry background, competitive advantage, management attitudes and financial strength, and finally we consider valuation. We meet the management of the companies within our investment universe and revisit the investment case for
09
Management Discussion (unaudited)
Annual Report December 31, 2015
the Fund's holdings on a regular basis to ensure that our expectations are being met.
The emerging markets investment team is responsible for the overall strategy and stock selection process, led by the most senior investment managers. The team meets regularly to discuss both buy and sell ideas and to determine the level of conviction in the Fund's holdings.
Outlook
The investment environment is clearly dynamic, but our long term investment approach has not changed. As ever, for Baillie Gifford it's about company fundamentals first and foremost. We look forward to the years ahead in the knowledge that for stock pickers, the divergence in fortunes across emerging markets makes this a fascinating time. For some individual stock-specific
winners, we think it is quite possible that the growth opportunity may be far larger than anything EM investors have seen before, with the gap between the winners and the losers likely to be far more profound.
Commodity producing countries and companies continue to be hamstrung by weak demand and over-supply, yet have still to reach the crisis levels that may make renewed long term investment attractive. Even if companies are managing to grow in local currency terms, hard currency returns remain elusive.
This is a time of great disruption in emerging markets as the mobile internet blows away the inefficient and underdeveloped 'bricks and mortar' infrastructure in retail, media, gaming, travel, finance and a host of other areas. Never has it been more important to have active management in these stock markets to pick the 'new' winners and discard the 'old' losers: the index is not a safe place to hide.
Fund Performance for periods ended 12/31/15 (Average Annual Total Returns)
| | One Year | | % p.a.
Five Year | | % p.a.
Ten Year | | Since Inception
% p.a.
(April 4, 2003) | |
The Emerging Markets
Fund Class 5 | | | -8.24 | % | | | -2.75 | % | | | 6.19 | % | | | 13.61 | % | |
MSCI Emerging Markets Index | | | -14.60 | % | | | -4.47 | % | | | 3.94 | % | | | 11.51 | % | |
* Returns for Class 5 shares have been provided. Class III shares were converted into Class 5 shares effective January 1, 2015. Additional year-over-year returns for each class are available in the Financial Highlights section.
Comparison of the change in value of $1,000,000 investment in the Fund's Class 5 shares and the Index

Past performance does not predict future performance. The graph and the table above do not reflect the deduction of taxes that a shareholder would pay on Fund distributions or redemptions of Fund shares
10
Management Discussion (unaudited)
Annual Report December 31, 2015
The Global Alpha Equity Fund
Market Conditions and Review of Performance during 2015
Global Markets were once again volatile over the year, with the MSCI All Country World Index falling 1.84% over the period. However, the Global Alpha Equity Fund Class 3 outperformed the index over the twelve months, returning 1.84%.
As we review the financial headlines, it's clear that three events have dominated the animal spirits of the markets. The first was the widely anticipated and much discussed rise in U.S. interest rates. The 0.25% increase in December marks the end of an extraordinary period of government intervention in financial markets. For us, such 'normalisation' of monetary policy is a positive sign that the patient is coming off life support.
The second event driving sentiment has been weakness in oil and other commodity markets which saw Brent crude fall to approximately $40/barrel. This has had a particularly egregious effect on those emerging market countries whose economies are largely centred on commodity exports.
Finally, slowing GDP growth and a depreciating currency in China affected markets around the world. We strongly believe that the reorientation of the economy away from fixed asset investment to consumption and services is a sensible strategy, a view somewhat validated by the IMF's decision in November to include the renminbi in its benchmark 'Special Drawing Rights' currency basket.
In contrast to a tightening of monetary policy in the U.S., the European Central Bank decided to extend its quantitative easing programme by an extra six months. This policy divergence with the U.S. is driven by a fear of the eurozone slipping into a spiral of deflation that would threaten a recovery in household spending and, perhaps more importantly, push back business investment.
As we would expect, the majority of performance of the Fund was driven by stock selection. Amongst the top performers were Amazon, Royal Caribbean Cruises, Alphabet (Google) and Ryanair. Amazon (ecommerce) was the top performing stock as it saw rapid growth in Prime membership and in its cloud computing business, Amazon Web Services (AWS). AWS has 20% market share of the cloud computing industry, and with 25% operating margins now accounts for over 50% of group operating profits. Alphabet, which is the new name for Google Inc, also had a good year, with strong growth in
mobile search being particularly pleasing. Six of Googles products (Search, Android, Play, Maps, Chrome and YouTube) now have over 1bn users each. We continue to strongly believe in the growth opportunities that these internet platforms present. Their ability to invest heavily in auxiliary services and revenues helps to cement their competitive positions and we think that there is increasing evidence that many parts of the internet will prove to be 'winner takes all' markets. Another strong contributor was Royal Caribbean Cruises (cruise ship operator). The company is benefitting from resurgent demand, disciplined capacity growth and lower unit costs supported by a softening fuel price. Ryanair, the budget airline, is another positive beneficiary of a low oil price. However, a revamped website, increased routes and greater use of hub airports have had a much more significant impact by boosting the growth in passenger numbers.
The two largest stock detractors were Ultra Petroleum (oil and gas exploration & production) and Harley-Davidson (heavy motorbikes). Continuing weakness in energy markets has inevitably weighed on the Ultra Petroleum share price. Although production levels have been higher and costs lower than expected, the company's total net debt levels remain high. Harley-Davidson announced disappointing numbers with a decline in total sales and a drop in its share of the U.S. motorbike market to about 50%. The company is struggling to compete against European and Japanese motorbike producers which have used currency weakness to aggressively price their bikes in the US market. Harley also announced a number of product recalls, costing the company around $30m.
Being long-term investors, portfolio turnover remains low and so changes from one year to the next tend not to be dramatic.
Over the past year we have continued to sell companies where we think the outlook is uninspiring — these have included Arcos Dorados (McDonald's franchisee in Latin America), Tokyo Electron (semiconductor equipment manufacturer) and Jyske Bank (Danish retail bank). We have also sold holdings where valuations now look stretched. For example Roche (pharmaceuticals) and Bunzl (UK based supplier of consumables).
We have tended to re-invest the proceeds in young companies that demonstrate disruptive innovation and that pose a threat to mature incumbents. In this regard, we took a holding in Zillow (online real estate portal), Grubhub (the leading U.S. online food takeaway platform), Alnylam Pharmaceuticals (early stage biotech company) and Autohome, (a Chinese auto website that is feeding off a rapidly growing primary market for cars). As stated above, we believe that the U.S. economy is on
11
Management Discussion (unaudited)
Annual Report December 31, 2015
the road to recovery and we're trying to get more exposure to domestic beneficiaries of this rebound. This led to the purchase of CH Robinson, a third party logistics provider that should benefit both from a cyclical recovery in volumes but also secular growth in the shipping broker market.
Investment Strategies used to manage the Fund
Baillie Gifford is a growth manager with a bottom-up approach to stock picking. We aim to invest in companies that will generate sustainable earnings growth above the market over the long term. In determining the potential of a company, we analyse industry background, competitive advantage, management attitudes and financial strength, and finally we consider valuation. We meet the management of the companies within our investment universe and revisit the investment case for the Fund's holdings on a regular basis to ensure that our expectations are being met.
The Global Alpha investment team is responsible for the overall strategy and stock selection process. They meet regularly as part of a Portfolio Review Group, along with representatives from each of Baillie Gifford's regional investment teams, to discuss both buy and sell ideas and the level of conviction in their continuing holdings.
Outlook
As we enter 2016, we are encouraged by the number of possible investment opportunities competing for entry into the Fund. Markets inevitably will remain volatile but our job is to look through such short-term noise and identify those businesses that can sustainably grow their cash flows and earnings at above market rates. This focus on long-term fundamentals and an ever-expanding opportunity set leaves us confident that we can continue to deliver strong performance for our clients going forward.
Fund Performance for periods ended 12/31/15 (Average Annual Total Returns)
| | One Year | | Since Inception
% p.a.
(November 15, 2011) | |
The Global Alpha Fund Class 3* | | | 1.84 | % | | | 12.15 | % | |
MSCI AC World Index | | | -1.84 | % | | | 9.71 | % | |
* The returns for Class 3 shares have been provided. One-year return figures for the other share classes are as follows: 1.75% for Class 2. Additional year-over-year returns for each class are available in the Financial Highlights section.
Comparison of the change in value of $1,000,000 investment in the Fund's Class 3 shares and the Index
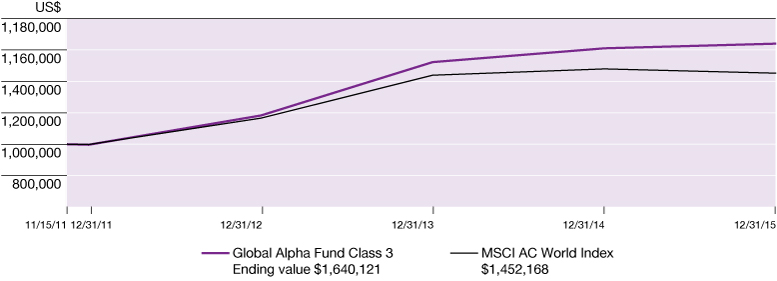
Past performance does not predict future performance. The graph and the table above do not reflect the deduction of taxes that a shareholder would pay on Fund distributions or redemptions of Fund shares.
12
Management Discussion (unaudited)
Annual Report December 31, 2015
The Long Term Global Growth Equity Fund
Market Conditions and Review of Performance during 2015
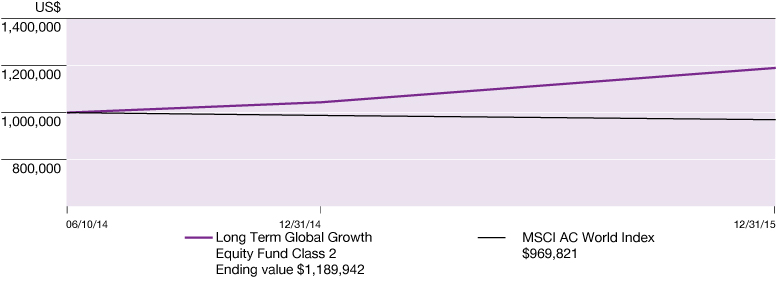
As long-term investors, we focus on companies and their prospects over five to ten years so we typically place more emphasis on performance attribution over much longer periods than the inception date of this fund currently allows. Nevertheless, the Long Term Global Growth Equity Fund Class 2 returned 11.79% p.a. since the Fund's inception on 10th June 2014, whereas the MSCI All Country World Index returned -1.95% p.a. over the period.
Amazon was a strong contributor to performance, driven not only by the impressive growth of their e-commerce platform, but also by the size of the Fund's position which reflects our high level of conviction in both the management team and the scope for substantial further growth. Amazon's addressable market is expanding into media content and new categories within its physical ecommerce offering. Meanwhile, the technology powering Amazon's business gets better and cheaper every year and AWS, Amazon's hosted computing platform, offers another very large long-term opportunity for the company.
The shares of Chinese online travel agency Ctrip also performed strongly on the news that the company is teaming up with Qunar, its closest competitor. This has left Ctrip with a near-monopoly in China's online travel market. The company grew its top line at 45% during the 2015. With only 5% of the Chinese population holding a passport, we anticipate very strong long term growth.
Tencent's strong share price reflected strong operational progress. The company's WeChat messaging platform is underpinning an increasingly wide range of applications and the growing use of the platform for online payments is particularly striking.
Meanwhile, Baidu, the Chinese search engine, detracted from performance. The stock market seems concerned about the company's continued determination to invest for the future but we are very supportive of this strategy. Baidu has successfully managed the transition from desktop to mobile and the long term opportunity is broadening out as a result of the company's investments in online mapping and a range of local services. We are also monitoring the company's longer term aspirations in artificial intelligence and driverless cars and this remains a large position in the portfolio.
The Fund's holding in Stratasys, the 3D printing company was very weak over the period. The opportunity for the company's technology to transform a range of industries such as health care and high end manufacturing remains very large but the market is increasingly concerned about weak sales and the company's competitive advantage. We share many of these concerns and we are also looking at the company's corporate culture carefully following a merger with an Israeli competitor.
Although we expect stock market performance to remain volatile in the coming months, we remain confident in the prospects for substantial growth in our holdings over the longer term.
Investment Strategies used to manage the Fund
Baillie Gifford is a growth manager with a bottom-up approach to stock picking. We aim to invest in companies that will generate sustainable earnings growth above the market over the long term. In determining the potential of a company, we analyse industry background, competitive advantage, management attitudes and financial strength, and finally we consider valuation. We meet the management of the companies within our investment universe and revisit the investment case for the Fund's holdings on a regular basis to ensure that our expectations are being met.
The Long Term Global Growth team is responsible for the overall strategy and stock selection process. They meet regularly to discuss both buy and sell ideas and the level of conviction for existing holdings and will continue to monitor the long-term prospects for the Fund's holdings and make changes where appropriate.
Outlook
For some time now, we have believed that rapid technological progress will underpin substantial long-term change in a range of industries. The Fund now has several holdings that reflect this view. For example, at the very end of 2014 we made an initial investment in Lending Club which is using the internet to transform financial services. The company disintermediates consumer lending, which is a $3 trillion market in the US alone. The central premise behind Lending Club's business model is that it is possible to separate the two core elements of a traditional bank (operations and capital) and provide both more efficiently, allowing it to
13
Management Discussion (unaudited)
Annual Report December 31, 2015
run a profitable business on narrower spreads and provide better terms for savers and lenders.
Similarly we believe the incumbents within healthcare are at risk, with the traditional 'big pharma' business model depending on finding, protecting and marketing effective formulations on a mass, rather than a personalised basis. As we now have a greater knowledge of the genetic basis of diseases, thanks to genome sequencing, treatment regimes have evolved and their effectiveness is now based on fact rather than serendipity. The advances made in sequencing and understanding the genome have enabled companies such as Ionis Pharmaceuticals and Bluebird Bio, Inc both added to your Fund this year, to develop cures for previously untreatable rare diseases.
In general, share prices were strong for much of the period. We are looking again at prospects for some of the companies and their potential to grow to many multiples of their current size over the next five to ten years. We continue to see substantial upside from here as most of the holdings in the Fund are still in the early stages of driving change in large addressable markets. Encouragingly, the management teams of these companies remain committed to investing for the long term, even if this depresses short-term earnings. We believe that this is the right approach and is in sharp contrast to many benchmark incumbents who are focused on maximising near-term earnings, even though many of them look vulnerable on a ten year view.
Fund Performance for periods ended 12/31/15 (Average Annual Total Returns)
| | One Year | | Since Inception
% p.a.
June 10, 2014 | |
The LTGG Equity Fund Class 2* | | | 13.99 | % | | | 11.79 | % | |
MSCI AC World Index | | | -1.84 | % | | | -1.95 | % | |
* The returns for Class 2 shares have been provided. Additional year-over-year returns for each class are available in the Financial Highlights section.
Comparison of the change in value of $1,000,000 investment in the Fund's Class 2 shares and the Index
Past performance does not predict future performance. The graph and the table above do not reflect the deduction of taxes that a shareholder would pay on Fund distributions or redemptions of Fund shares.
14
Management Discussion (unaudited)
Annual Report December 31, 2015
The International Choice Fund
Market Conditions and Review of Performance during 2015
On the face of it, 2015 was a lacklustre year for international markets. The oil price continued its decline, but it was not alone; during December, most major commodities reached their lowest price levels since the Global Financial Crisis. Other significant events which punctuated the year included the Greek debt crisis, volatility in Chinese stock markets, escalating tensions in the Middle East and the devastating terrorist attack in Paris. It was pleasing, therefore, to end the year on a more positive note. By initiating the first interest rate rise for almost a decade, the Federal Reserve exhibited some confidence that there may be more stable economic times ahead. However, whilst individual macro events can, undoubtedly, have an impact on short-term investment performance, predicting such events is a fruitless endeavour. Rather than attempting to do so, the International Focus Team is dedicated to identifying high quality growth businesses, run by trustworthy management, trading at attractive valuations. Twelve months is far too short a time period to assess the merits of this approach, but maintaining faith in this established investment philosophy will, we believe, offer the best opportunity for attractive long-term returns.
The International Choice Fund Class 2 produced a return of 1.56% during 2015, outperforming the benchmark which returned -5.25% for the year.
The UK market finished the year in negative territory (weighed down by the troubles of the energy sector) but that did not stop two domestically focussed, UK-listed names being the Fund's top performers during the period. Buoyed by rising house prices, particularly in London, Rightmove, the online real estate portal enjoyed a stellar year. Despite the best efforts of its competitors, the company maintains a dominant position, enjoying an 80% market share. The management team, led by CEO and co-founder Nick McKittrick, has demonstrated a sensible long-term approach, implementing gradual price increases and broadening the company's range of services. Whilst retaining sufficient capital to enable continued R&D investment, the company has a good record of returning excess cash to shareholders. Having started in 2007, Rightmove has bought back over one third of its shares in issuance.
The other UK-listed business amongst the top performers was Hargreaves Lansdown. The leading domestic online financial services platform saw strong
inflows during the year, partly as a result of government initiatives announced in 2014 and 2015. The reforms enable greater tax free savings and increased flexibility regarding pension assets. With the baby boomer generation reaching retirement age, Hargreaves Lansdown is well placed to continue to benefit from favourable structural demographics. At more than three times the size of its nearest competitor, the company's scale should help to ensure that it can continue to generate strong revenues despite the sector facing increasing pressure over fees.
Another strong contributor to performance during the year was Danish pharmaceutical business, Novo Nordisk. The world leader in the treatment of diabetes, the company employs over 40,000 people throughout 75 countries. Novo Nordisk has a long history of heavy investment in R&D and it received positive news flow around its new insulin drug, Tresiba. Having been approved by the FDA, the product is expected to be launched during the first quarter of 2016. The longer-term opportunity also looks bright for Novo Nordisk, with only about 6% of the diabetic population currently receiving effective care.
Emerging markets endured a challenging year and, within the fund, this was most clearly manifested in the weakness of banking stocks, Standard Chartered, United Overseas Bank (UOB) and Garanti Bankasi. The former has a strong presence in commercial and trade related finance throughout Asia and Africa which may present long-term growth opportunities. However, a series of challenging events including regulatory fines, management change and capital raising prompted us to reconsider the holding. Whilst the new management team have established what appears to be a credible restructuring process, we fear that there will be more pain before the benefits are reaped. We also sold Garanti Bankasi as the political and economic situation in Turkey has rather engulfed the original investment case. We remain more positive about the growth prospects for Singaporean bank, UOB and see the expanding wealth management business as an important driver of future returns.
Johnson Matthey is one of the largest suppliers of environmental catalysts used in the manufacturing of automobiles. Supported by significant changes in environmental legislation, the long-term investment case for Johnson Matthey looks attractive. However, during 2015 the share price was weak due to the uncertainty surrounding the Volkswagen emissions scandal. Around half of the cars in Europe are diesel and this is an important market for Johnson Matthey. The ramifications of the emissions fraud are yet to become clear; the bull case for Johnson Matthey is that tighter controls create an increased demand for more sophisticated products.
15
Management Discussion (unaudited)
Annual Report December 31, 2015
Investment Strategies used to manage the Fund
Baillie Gifford is a growth manager with a bottom-up approach to stock picking. We aim to invest in companies that will generate sustainable earnings growth above the market over the long-term. In determining the potential of a company, we analyse industry background, competitive advantage, management capabilities, financial strength and valuation. From the outset, we also consider aspects which may derail the investment case and revisit the thesis for the Fund's holdings on a regular basis to ensure that our expectations are being met.
The International Focus Portfolio Construction Group is responsible for the overall strategy and stock selection process. It meets regularly to discuss both buy and sell ideas and the level of conviction for existing holdings. Ongoing monitoring of the long-term prospects for the Fund's holdings enables appropriate changes to be made, where applicable.
Outlook
There are a number of uncertainties on the horizon as we enter 2016: fluctuating oil prices, the transitioning Chinese economy, instability in the Middle East and rising interest rates. However, while the individual nature of these opportunities and threats may be slightly different from previous years, our approach to managing the Fund remains unchanged. Our focus continues to be the discovery of exciting growth companies, based on a consistent investment process and fundamental analysis. The fortunes of companies can change markedly in the short term, often based on the irrational behaviour of the market. However, identifying companies with growing franchise business run by sensible, aligned management teams will give us every chance of generating outperformance over the long term. The Fund represents an eclectic mix of business and we already have an exciting list of potential new ideas for the year ahead. Indeed, this is an excellent time for long term stock pickers.
Fund Performance for periods ended 12/31/15 (Average Annual Total Returns)
| | One Year | | Since Inception
% p.a.
April 9, 2013 | |
The International Choice Fund Class 2* | | | 1.56 | % | | | 3.49 | % | |
MSCI ACWI ex U.S. Index | | | -5.25 | % | | | 1.10 | % | |
* The returns for Class 2 shares have been provided. One-year return figures for other share classes are as follows: 1.48% for Class 1 and 1.63% for Class 3. Additional year-over-year returns for each class are available in the Financial Highlights section.
Comparison of the change in value of $1,000,000 investment in the Fund's Class 2 shares and the Index

Past performance does not predict future performance. The graph and the table above do not reflect the deduction of taxes that a shareholder would pay on Fund distributions or redemptions of Fund shares..
16
Fund Expenses (unaudited)
Annual Report December 31, 2015
As a shareholder of the Baillie Gifford International Equity Fund, the Baillie Gifford EAFE Fund, the Baillie Gifford EAFE Choice Fund, the Baillie Gifford EAFE Pure Fund, the Baillie Gifford Emerging Markets Fund, the Baillie Gifford Global Alpha Equity Fund, the Baillie Gifford Long Term Global Growth Equity Fund and the Baillie Gifford International Choice Fund (together, the "Funds") you incur two types of costs: (1) transaction costs, which may include purchase fees and redemption fees and (2) ongoing costs, including management fees, shareholder service fees and other Fund expenses. This example is intended to help you understand your ongoing costs (in dollars) of investing in the Funds and to compare these costs with the ongoing costs of investing in the other mutual funds.
The example is based on an investment of $1,000 invested at the beginning of the period and held for the entire period from July 1, 2015 to December 31, 2015.
Actual Expenses
The first line of each table provides information about actual account values and actual expenses. You may use the information in this line, together with the amount you invested, to estimate the expenses that you paid over the period. Simply divide the account value by $1,000 (for example, an $8,600 account value divided by $1,000 = 8.6), then multiply the result by the number in the first line under the heading entitled "Expenses Paid During the Period" to estimate the expenses you paid on your account during this period.
Hypothetical Example for Comparison Purposes
The second line of each table on the following page provides information about hypothetical account values and hypothetical expenses based on the Fund's actual expense ratio and an assumed annual rate of return of 5% before expenses, which is not the Fund's actual return. The hypothetical account values and expenses may not be used to estimate the actual ending account balance or expenses you paid for the period. You may use this information to compare the ongoing costs of investing in the Fund and other funds by comparing this 5% hypothetical example with the 5% hypothetical examples that appear in the shareholder reports of other funds.
Please note that the expenses shown in the table are meant to highlight your ongoing costs only and do not reflect any transactional costs, such as purchase fees and redemption fees. Therefore, the second line of the table is useful in comparing ongoing costs only, and will not help you determine the relative total costs of owning different funds. In addition, if these transactional costs were included, your costs would have been higher.
17
Fund Expenses (unaudited)
Annual Report December 31, 2015
| | | Beginning
Account Value
7/01/15 | | Ending
Account
Value
12/31/15 | | Annualized
Expense Ratios
Based on the Period
7/01/15 to 12/31/15 | | Expenses Paid
During Period | |
Baillie Gifford International Equity Fund — Class 2 | |
Actual | | $ | 1,000 | | | $ | 924.20 | | | | 0.61 | % | | $ | 2.96 | | |
Hypothetical (5% return before expenses) | | $ | 1,000 | | | $ | 1,022.13 | | | | 0.61 | % | | $ | 3.11 | | |
Baillie Gifford International Equity Fund — Class 3 | |
Actual | | $ | 1,000 | | | $ | 924.50 | | | | 0.54 | % | | $ | 2.62 | | |
Hypothetical (5% return before expenses) | | $ | 1,000 | | | $ | 1,022.48 | | | | 0.54 | % | | $ | 2.75 | | |
Baillie Gifford International Equity Fund — Class 5 | |
Actual | | $ | 1,000 | | | $ | 924.90 | | | | 0.47 | % | | $ | 2.28 | | |
Hypothetical (5% return before expenses) | | $ | 1,000 | | | $ | 1,022.84 | | | | 0.47 | % | | $ | 2.40 | | |
Baillie Gifford EAFE Fund — Class 2 | |
Actual | | $ | 1,000 | | | $ | 902.40 | | | | 0.62 | % | | $ | 2.97 | | |
Hypothetical (5% return before expenses) | | $ | 1,000 | | | $ | 1,022.08 | | | | 0.62 | % | | $ | 3.16 | | |
Baillie Gifford EAFE Fund — Class 3 | |
Actual | | $ | 1,000 | | | $ | 902.60 | | | | 0.55 | % | | $ | 2.64 | | |
Hypothetical (5% return before expenses) | | $ | 1,000 | | | $ | 1,022.43 | | | | 0.55 | % | | $ | 2.80 | | |
Baillie Gifford EAFE Fund — Class 4 | |
Actual | | $ | 1,000 | | | $ | 902.70 | | | | 0.52 | % | | $ | 2.49 | | |
Hypothetical (5% return before expenses) | | $ | 1,000 | | | $ | 1,022.58 | | | | 0.52 | % | | $ | 2.65 | | |
Baillie Gifford EAFE Fund — Class 5 | |
Actual | | $ | 1,000 | | | $ | 902.90 | | | | 0.47 | % | | $ | 2.25 | | |
Hypothetical (5% return before expenses) | | $ | 1,000 | | | $ | 1,022.84 | | | | 0.47 | % | | $ | 2.40 | | |
Baillie Gifford EAFE Choice Fund — Class 1 | |
Actual | | $ | 1,000 | | | $ | 946.80 | | | | 0.76 | % | | $ | 3.73 | | |
Hypothetical (5% return before expenses) | | $ | 1,000 | | | $ | 1,021.37 | | | | 0.76 | % | | $ | 3.87 | | |
Baillie Gifford EAFE Choice Fund — Class 2 | |
Actual | | $ | 1,000 | | | $ | 947.10 | | | | 0.68 | % | | $ | 3.34 | | |
Hypothetical (5% return before expenses) | | $ | 1,000 | | | $ | 1,021.78 | | | | 0.68 | % | | $ | 3.47 | | |
18
Fund Expenses (unaudited)
Annual Report December 31, 2015
| | | Beginning
Account Value
7/01/15 | | Ending
Account
Value
12/31/15 | | Annualized
Expense Ratios
Based on the Period
7/01/15 to 12/31/15 | | Expenses Paid
During Period | |
Baillie Gifford EAFE Choice Fund — Class 3 | |
Actual | | $ | 1,000 | | | $ | 947.50 | | | | 0.61 | % | | $ | 2.99 | | |
Hypothetical (5% return before expenses) | | $ | 1,000 | | | $ | 1,022.13 | | | | 0.61 | % | | $ | 3.11 | | |
Baillie Gifford EAFE Pure Fund — Class 2 | |
Actual | | $ | 1,000 | | | $ | 964.70 | | | | 0.66 | % | | $ | 3.27 | | |
Hypothetical (5% return before expenses) | | $ | 1,000 | | | $ | 1,021.88 | | | | 0.66 | % | | $ | 3.36 | | |
Baillie Gifford Emerging Markets Fund — Class 2 | |
Actual | | $ | 1,000 | | | $ | 889.90 | | | | 0.88 | % | | $ | 4.19 | | |
Hypothetical (5% return before expenses) | | $ | 1,000 | | | $ | 1,020.77 | | | | 0.88 | % | | $ | 4.48 | | |
Baillie Gifford Emerging Markets Fund — Class 4 | |
Actual* | | $ | 1,000 | | | $ | 985.50 | | | | 0.76 | % | | $ | 1.22 | | |
Hypothetical (5% return before expenses) | | $ | 1,000 | | | $ | 1,021.37 | | | | 0.76 | % | | $ | 3.87 | | |
Baillie Gifford Emerging Markets Fund — Class 5 | |
Actual | | $ | 1,000 | | | $ | 890.00 | | | | 0.72 | % | | $ | 3.43 | | |
Hypothetical (5% return before expenses) | | $ | 1,000 | | | $ | 1,021.58 | | | | 0.72 | % | | $ | 3.67 | | |
Baillie Gifford Global Alpha Equity Fund — Class 2 | |
Actual | | $ | 1,000 | | | $ | 971.90 | | | | 0.68 | % | | $ | 3.38 | | |
Hypothetical (5% return before expenses) | | $ | 1,000 | | | $ | 1,021.78 | | | | 0.68 | % | | $ | 3.47 | | |
Baillie Gifford Global Alpha Equity Fund — Class 3 | |
Actual | | $ | 1,000 | | | $ | 972.10 | | | | 0.61 | % | | $ | 3.03 | | |
Hypothetical (5% return before expenses) | | $ | 1,000 | | | $ | 1,022.13 | | | | 0.61 | % | | $ | 3.11 | | |
Baillie Gifford Long Term Global Growth Equity Fund — Class 1 | |
Actual** | | $ | 1,000 | | | $ | 1,029.80 | | | | 0.85 | % | | $ | 4.21 | | |
Hypothetical (5% return before expenses) | | $ | 1,000 | | | $ | 1,020.92 | | | | 0.85 | % | | $ | 4.33 | | |
Baillie Gifford Long Term Global Growth Equity Fund — Class 2 | |
Actual | | $ | 1,000 | | | $ | 1,033.00 | | | | 0.77 | % | | $ | 3.95 | | |
Hypothetical (5% return before expenses) | | $ | 1,000 | | | $ | 1,021.32 | | | | 0.77 | % | | $ | 3.92 | | |
19
Fund Expenses (unaudited)
Annual Report December 31, 2015
| | | Beginning
Account Value
7/01/15 | | Ending
Account
Value
12/31/15 | | Annualized
Expense Ratios
Based on the Period
7/01/15 to 12/31/15 | | Expenses Paid
During Period | |
Baillie Gifford Long Term Global Growth Equity Fund — Class 4 | |
Actual*** | | $ | 1,000 | | | $ | 1,113.10 | | | | 0.67 | % | | $ | 1.65 | | |
Hypothetical (5% return before expenses) | | $ | 1,000 | | | $ | 1,021.83 | | | | 0.67 | % | | $ | 3.41 | | |
Baillie Gifford International Choice Fund — Class 1 | |
Actual | | $ | 1,000 | | | $ | 944.50 | | | | 0.72 | % | | $ | 3.53 | | |
Hypothetical (5% return before expenses) | | $ | 1,000 | | | $ | 1,021.58 | | | | 0.72 | % | | $ | 3.67 | | |
Baillie Gifford International Choice Fund — Class 2 | |
Actual | | $ | 1,000 | | | $ | 944.90 | | | | 0.64 | % | | $ | 3.14 | | |
Hypothetical (5% return before expenses) | | $ | 1,000 | | | $ | 1,021.98 | | | | 0.64 | % | | $ | 3.26 | | |
Baillie Gifford International Choice Fund — Class 3 | |
Actual | | $ | 1,000 | | | $ | 945.20 | | | | 0.57 | % | | $ | 2.79 | | |
Hypothetical (5% return before expenses) | | $ | 1,000 | | | $ | 1,022.33 | | | | 0.57 | % | | $ | 2.91 | | |
* Commencement of operations on November 2, 2015.
** Commencement of operations on July 6, 2015.
*** Commencement of operations on October 7, 2015.
Expenses are calculated using the annualized expense ratio for the Funds, which represents the ongoing expenses as a percentage of net assets for the year or period ended December 31, 2015. Expenses are calculated by multiplying the annualized expense ratio by the average account value for the period; then
multiplying the result by the number of days in the most recent fiscal half-year; and then dividing that result by the number of days in the calendar year. Expense ratios for the most recent fiscal year may differ from expense ratios based on the one-year data in the financial highlights.
20
Industry Diversification Table
Annual Report December 31, 2015
December 31, 2015 (unaudited)
Baillie Gifford International Equity Fund
| | | Value | | % of Total
Net Assets | |
Aerospace | | $ | 8,037,135 | | | | 0.5 | % | |
Aerospace/Defense | | | 29,108,412 | | | | 1.8 | | |
Airlines | | | 51,247,069 | | | | 3.1 | | |
Apparel | | | 20,533,933 | | | | 1.2 | | |
Apparel Retailers | | | 41,053,411 | | | | 2.4 | | |
Asset Managers | | | 22,225,574 | | | | 1.3 | | |
Auto Manufacturers | | | 18,899,558 | | | | 1.1 | | |
Auto Parts | | | 23,429,230 | | | | 1.4 | | |
Banks | | | 144,075,709 | | | | 8.6 | | |
Beverages, Food & Tobacco | | | 47,343,870 | | | | 2.9 | | |
Biotechnology | | | 19,692,060 | | | | 1.2 | | |
Building Materials & Fixtures | | | 14,969,527 | | | | 0.9 | | |
Business Support Services | | | 24,530,608 | | | | 1.5 | | |
Chemicals | | | 14,414,907 | | | | 0.9 | | |
Clothing & Accessories | | | 27,088,282 | | | | 1.7 | | |
Commercial Services | | | 41,661,103 | | | | 2.4 | | |
Construction & Building Materials | | | 44,216,137 | | | | 2.7 | | |
Containers & Packaging | | | 18,370,430 | | | | 1.1 | | |
Distillers & Vintners | | | 13,751,144 | | | | 0.9 | | |
Distribution/Wholesale | | | 20,871,060 | | | | 1.3 | | |
Diversified Financial Services | | | 58,327,037 | | | | 3.6 | | |
Electrical Components & Equipment | | | 16,598,910 | | | | 1.0 | | |
Electronic & Electrical Equipment | | | 51,708,237 | | | | 3.1 | | |
Exploration & Production | | | 5,971,316 | | | | 0.4 | | |
Food Producers & Processors | | | 36,253,541 | | | | 2.1 | | |
Food Products | | | 46,875,331 | | | | 2.8 | | |
Food Retailers & Wholesalers | | | 14,881,066 | | | | 0.9 | | |
Healthcare — Products | | | 17,826,778 | | | | 1.1 | | |
Industrial Engineering | | | 9,925,830 | | | | 0.6 | | |
Industrial Machinery | | | 77,502,300 | | | | 4.7 | | |
Industrial Suppliers | | | 23,371,844 | | | | 1.4 | | |
Insurance | | | 94,111,590 | | | | 5.6 | | |
Integrated Oil & Gas | | | 15,911,307 | | | | 1.0 | | |
Internet | | | 80,956,435 | | | | 4.8 | | |
Investment Companies | | | 2,851,517 | | | | 0.2 | | |
Investment Services | | | 32,984,606 | | | | 2.0 | | |
Machinery — Diversified | | | 16,970,552 | | | | 1.0 | | |
Media & Photography | | | 47,622,734 | | | | 2.9 | | |
Medical Equipment | | | 15,399,168 | | | | 0.9 | | |
Mining & Metals | | | 22,392,688 | | | | 1.3 | | |
21
Industry Diversification Table
Annual Report December 31, 2015
| | | Value | | % of Total
Net Assets | |
Mobile Telecommunications | | $ | 14,650,066 | | | | 0.9 | % | |
Oil & Gas | | | 12,454,594 | | | | 0.8 | | |
Pharmaceuticals | | | 22,765,518 | | | | 1.4 | | |
Property & Casualty Insurance | | | 18,204,758 | | | | 1.1 | | |
Recreational Products | | | 22,864,870 | | | | 1.4 | | |
Restaurant & Bars | | | 13,501,488 | | | | 0.8 | | |
Retailers — General | | | 13,433,592 | | | | 0.8 | | |
Semiconductors | | | 87,842,242 | | | | 5.3 | | |
Software | | | 16,959,113 | | | | 1.0 | | |
Software & Computer Services | | | 25,460,922 | | | | 1.5 | | |
Specialized Consumer Services | | | 35,840,246 | | | | 2.2 | | |
Transportation | | | 25,350,006 | | | | 1.5 | | |
Total Value of Investments | | | 1,643,289,361 | | | | 99.0 | | |
Other assets less liabilities | | | 16,218,141 | | | | 1.0 | | |
Net Assets | | $ | 1,659,507,502 | | | | 100.0 | % | |
22
Annual Report December 31, 2015
December 31, 2015
Baillie Gifford International Equity Fund
| | | Shares | | Value | |
COMMON STOCKS — 98.5% | |
ARGENTINA — 1.5% | |
MercadoLibre, Inc. | | | 221,823 | | | $ | 25,363,242 | | |
AUSTRALIA — 2.9% | |
Brambles Ltd. | | | 2,193,515 | | | | 18,370,430 | | |
Cochlear Ltd. | | | 222,527 | | | | 15,399,168 | | |
Treasury Wine Estates Ltd. | | | 2,290,281 | | | | 13,751,144 | | |
| | | | | | 47,520,742 | | |
BERMUDA — 0.2% | |
Seadrill Ltd. (a) | | | 834,467 | | | | 2,881,756 | | |
BRAZIL — 1.1% | |
Embraer SA ADR | | | 598,464 | | | | 17,678,627 | | |
CANADA — 4.1% | |
Constellation Software, Inc. | | | 40,678 | | | | 16,959,113 | | |
Fairfax Financial Holdings Ltd. | | | 59,489 | | | | 28,242,335 | | |
Restaurant Brands International, Inc. | | | 361,005 | | | | 13,501,488 | | |
Ritchie Bros. Auctioneers, Inc. | | | 409,365 | | | | 9,869,790 | | |
| | | | | | 68,572,726 | | |
CHINA — 3.2% | |
Alibaba Group Holding Ltd. ADR (a) | | | 176,818 | | | | 14,369,999 | | |
Baidu, Inc. ADR (a) | | | 146,215 | | | | 27,640,483 | | |
Want Want China Holdings Ltd. | | | 14,366,000 | | | | 10,662,256 | | |
| | | | | | 52,672,738 | | |
DENMARK — 4.1% | |
DSV A/S | | | 643,995 | | | | 25,350,006 | | |
Novo Nordisk A/S, B Shares | | | 393,199 | | | | 22,765,518 | | |
Novozymes A/S, B Shares | | | 411,289 | | | | 19,692,060 | | |
| | | | | | 67,807,584 | | |
FINLAND — 2.5% | |
Kone Oyj, B Shares | | | 538,080 | | | | 22,783,001 | | |
Sampo Oyj, A Shares | | | 374,225 | | | | 19,004,087 | | |
| | | | | | 41,787,088 | | |
The accompanying notes are an integral part of the financial statements.
23
Annual Report December 31, 2015
December 31, 2015
Baillie Gifford International Equity Fund
| | | Shares | | Value | |
FRANCE — 1.6% | |
Edenred | | | 490,231 | | | $ | 9,266,913 | | |
Essilor International SA | | | 143,030 | | | | 17,826,778 | | |
| | | | | | 27,093,691 | | |
GERMANY — 6.1% | |
Brenntag AG | | | 276,635 | | | | 14,414,907 | | |
Continental AG | | | 78,126 | | | | 18,899,558 | | |
Deutsche Boerse AG | | | 347,250 | | | | 30,523,851 | | |
MTU Aero Engines AG | | | 117,270 | | | | 11,429,785 | | |
SAP SE | | | 320,854 | | | | 25,460,922 | | |
| | | | | | 100,729,023 | | |
HONG KONG — 2.9% | |
Hang Seng Bank Ltd. | | | 1,092,500 | | | | 20,706,541 | | |
Hong Kong Exchanges and Clearing Ltd. | | | 1,091,400 | | | | 27,803,186 | | |
| | | | | | 48,509,727 | | |
INDIA — 0.5% | |
IDFC Bank Ltd. (a) | | | 5,404,569 | | | | 4,971,080 | | |
IDFC Ltd. | | | 3,924,806 | | | | 2,851,517 | | |
| | | | | | 7,822,597 | | |
IRELAND — 5.2% | |
CRH Plc. | | | 846,300 | | | | 24,501,980 | | |
James Hardie Industries Plc. SE CDI | | | 1,563,634 | | | | 19,714,157 | | |
Ryanair Holdings Plc. ADR | | | 478,655 | | | | 41,384,511 | | |
| | | | | | 85,600,648 | | |
JAPAN — 14.7% | |
DENSO Corp. | | | 490,300 | | | | 23,429,230 | | |
FANUC Corp. | | | 98,500 | | | | 16,970,552 | | |
Fast Retailing Co., Ltd. | | | 58,700 | | | | 20,533,933 | | |
Japan Exchange Group, Inc. | | | 2,110,100 | | | | 32,984,606 | | |
MS&AD Insurance Group Holdings, Inc. | | | 620,800 | | | | 18,204,758 | | |
Nidec Corp. | | | 228,900 | | | | 16,598,910 | | |
Rakuten, Inc. | | | 1,864,100 | | | | 21,470,247 | | |
Shimano, Inc. | | | 148,900 | | | | 22,864,870 | | |
SMC Corp. | | | 94,400 | | | | 24,518,881 | | |
The accompanying notes are an integral part of the financial statements.
24
Annual Report December 31, 2015
December 31, 2015
Baillie Gifford International Equity Fund
| | | Shares | | Value | |
Sumitomo Mitsui Trust Holdings, Inc. | | | 6,667,000 | | | $ | 25,250,140 | | |
Toyota Tsusho Corp. | | | 892,200 | | | | 20,871,060 | | |
| | | | | | 243,697,187 | | |
NETHERLANDS — 3.8% | |
Heineken Holding NV | | | 341,633 | | | | 26,301,345 | | |
Unilever NV CVA | | | 587,167 | | | | 25,591,285 | | |
Yandex NV, Class A (a) | | | 768,239 | | | | 12,076,717 | | |
| | | | | | 63,969,347 | | |
PERU — 0.5% | |
Credicorp Ltd. | | | 90,021 | | | | 8,760,844 | | |
RUSSIA — 0.9% | |
Magnit PJSC GDR Reg S | | | 370,066 | | | | 14,881,066 | | |
SINGAPORE — 1.5% | |
United Overseas Bank Ltd. | | | 1,796,104 | | | | 24,762,554 | | |
SOUTH AFRICA — 2.9% | |
Naspers Ltd., N Shares | | | 348,414 | | | | 47,622,734 | | |
SOUTH KOREA — 4.1% | |
NAVER Corp. | | | 28,470 | | | | 15,875,993 | | |
Samsung Electronics Co., Ltd. | | | 35,669 | | | | 38,043,924 | | |
SK Telecom Co., Ltd. | | | 80,047 | | | | 14,650,066 | | |
| | | | | | 68,569,983 | | |
SPAIN — 2.8% | |
Bankinter SA | | | 2,306,064 | | | | 16,353,121 | | |
Inditex SA | | | 900,101 | | | | 30,922,351 | | |
| | | | | | 47,275,472 | | |
SWEDEN — 4.5% | |
Atlas Copco AB, B Shares | | | 1,313,610 | | | | 30,200,418 | | |
Svenska Handelsbanken AB, A Shares | | | 2,643,741 | | | | 35,112,804 | | |
Volvo AB, B Shares | | | 1,070,452 | | | | 9,925,830 | | |
| | | | | | 75,239,052 | | |
The accompanying notes are an integral part of the financial statements.
25
Annual Report December 31, 2015
December 31, 2015
Baillie Gifford International Equity Fund
| | | Shares | | Value | |
SWITZERLAND — 4.7% | |
Compagnie Financiere Richemont SA | | | 222,326 | | | $ | 15,912,526 | | |
LafargeHolcim Ltd. (a) | | | 295,927 | | | | 14,969,527 | | |
Nestle SA | | | 631,443 | | | | 46,875,331 | | |
| | | | | | 77,757,384 | | |
TAIWAN — 4.2% | |
Hon Hai Precision Industry Co., Ltd. GDR Reg S | | | 2,694,604 | | | | 13,664,313 | | |
Taiwan Semiconductor Manufacturing Co., Ltd. | | | 13,085,000 | | | | 56,451,847 | | |
| | | | | | 70,116,160 | | |
UNITED KINGDOM — 16.6% | |
ARM Holdings Plc. | | | 2,059,451 | | | | 31,390,395 | | |
ASOS Plc. (a) | | | 199,391 | | | | 10,131,060 | | |
BG Group Plc. | | | 1,097,640 | | | | 15,911,307 | | |
British American Tobacco Plc. | | | 378,910 | | | | 21,042,525 | | |
Burberry Group Plc. | | | 635,198 | | | | 11,175,756 | | |
Capita Plc. | | | 1,378,696 | | | | 24,530,608 | | |
Experian Plc. | | | 1,274,400 | | | | 22,524,400 | | |
Hargreaves Lansdown Plc. | | | 1,001,118 | | | | 22,225,574 | | |
Petrofac Ltd. | | | 816,115 | | | | 9,572,838 | | |
Prudential Plc. | | | 1,246,545 | | | | 28,084,189 | | |
Rio Tinto Plc. | | | 769,100 | | | | 22,392,688 | | |
Rolls-Royce Holdings Plc. (a) | | | 930,290 | | | | 7,879,995 | | |
Rolls-Royce Holdings Plc. Preference Shares (a) | | | 106,592,670 | | | | 157,140 | | |
St James's Place PLC | | | 1,267,122 | | | | 18,780,979 | | |
Tullow Oil Plc. (a) | | | 2,437,802 | | | | 5,971,316 | | |
Wolseley Plc. | | | 430,316 | | | | 23,371,844 | | |
| | | | | | 275,142,614 | | |
UNITED STATES — 1.4% | |
Copa Holdings SA, Class A | | | 204,363 | | | | 9,862,558 | | |
PriceSmart, Inc. | | | 161,870 | | | | 13,433,592 | | |
| | | | | | 23,296,150 | | |
Total Common Stocks | |
(cost $1,270,616,976) | | | | | 1,635,130,736 | | |
The accompanying notes are an integral part of the financial statements.
26
Annual Report December 31, 2015
December 31, 2015
Baillie Gifford International Equity Fund
| | | Shares | | Value | |
PREFERRED STOCKS — 0.5% | |
BRAZIL — 0.5% | |
Itau Unibanco Holding SA ADR (cost $16,404,432) | | | 1,253,245 | | | $ | 8,158,625 | | |
TOTAL INVESTMENTS — 99.0% | |
(cost $1,287,021,408) | | | | $ | 1,643,289,361 | | |
Other assets less liabilities — 1.0% | | | | | 16,218,141 | | |
NET ASSETS — 100.0% | | | | $ | 1,659,507,502 | | |
(a) Non-income producing security.
ADR — American Depositary Receipt.
CDI — Chess Depositary Interest.
CVA — Certificate Van Aandelen (Bearer).
GDR — Global Depositary Receipt.
Reg S — Regulation S ("Reg S") of the Securities Act of 1933, as amended ("1933 Act") is a safe harbor that defines when an offering of securities will be deemed to come to rest abroad and therefore is not subject to the registration obligations imposed under Section 5 of the 1933 Act. The regulation includes two safe harbor provisions: an issuer safe harbor and a resale safe harbor. In each case, the regulation demands that offers and sales of the securities be made outside the United States and that no offering participant (which includes the issuer, the banks assisting with the offer and their respective affiliates) engage in "directed" selling efforts. In the case of issuers for whose securities there is substantial U.S. market interest, the regulation also requires that no offers and sales be made to U.S. persons (including U.S. persons physically located outside the United States).
The accompanying notes are an integral part of the financial statements.
27
Statement of Assets and Liabilities
Annual Report December 31, 2015
December 31, 2015
Baillie Gifford International Equity Fund
ASSETS | |
Investments, at value (cost $1,287,021,408) | | $ | 1,643,289,361 | | |
Cash | | | 14,933,251 | | |
Foreign cash, at value (cost $43,886) | | | 43,768 | | |
Tax reclaims receivable | | | 2,099,416 | | |
Dividends receivable | | | 2,028,200 | | |
Total Assets | | | 1,662,393,996 | | |
LIABILITIES | |
Management fee payable | | | 1,801,658 | | |
Servicing fee payable | | | 580,741 | | |
Trustee fee payable | | | 28,622 | | |
Accrued expenses | | | 475,473 | | |
Total Liabilities | | | 2,886,494 | | |
NET ASSETS | | $ | 1,659,507,502 | | |
COMPOSITION OF NET ASSETS | |
Paid-in capital | | $ | 1,301,463,301 | | |
Distributions in excess of net investment income | | | (2,342,650 | ) | |
Accumulated net realized gain on investments and foreign currency transactions | | | 4,340,931 | | |
Net unrealized appreciation in value of investments and foreign currencies | | | 356,045,920 | | |
| | | $ | 1,659,507,502 | | |
NET ASSET VALUE, PER SHARE | |
| Class 2 ($708,665,578 / 66,567,938 shares outstanding), unlimited authorized, no par value | | $ | 10.65 | | |
Maximum Purchase Price Per Share (Note D) | | $ | 10.68 | | |
Minimum Redemption Price Per Share (Note D) | | $ | 10.64 | | |
| Class 3 ($776,265,175 / 71,975,527 shares outstanding), unlimited authorized, no par value | | $ | 10.79 | | |
Maximum Purchase Price Per Share (Note D) | | $ | 10.82 | | |
Minimum Redemption Price Per Share (Note D) | | $ | 10.78 | | |
| Class 5 ($174,576,749 / 15,716,976 shares outstanding), unlimited authorized, no par value | | $ | 11.11 | | |
Maximum Purchase Price Per Share (Note D) | | $ | 11.14 | | |
Minimum Redemption Price Per Share (Note D) | | $ | 11.10 | | |
The accompanying notes are an integral part of the financial statements.
28
Annual Report December 31, 2015
For the Year Ended December 31, 2015
Baillie Gifford International Equity Fund
INVESTMENT INCOME | |
Dividends (net of foreign withholding taxes of $4,839,351) | | $ | 51,008,151 | | |
Interest | | | 5,301 | | |
Total Investment Income | | | 51,013,452 | | |
EXPENSES | |
Management fee (Note B) | | | 7,966,412 | | |
Shareholder Servicing fees — Class 1 Shares (Note B) | | | 15,214 | | |
Shareholder Servicing fees — Class 2 Shares (Note B) | | | 1,217,517 | | |
Shareholder Servicing fees — Class 3 Shares (Note B) | | | 923,212 | | |
Shareholder Servicing fees — Class 4 Shares (Note B) | | | 239,441 | | |
Shareholder Servicing fees — Class 5 Shares (Note B) | | | 57,714 | | |
Fund accounting | | | 1,065,502 | | |
Custody | | | 429,771 | | |
Professional fees | | | 239,742 | | |
Legal | | | 215,010 | | |
Trustees' fees | | | 122,845 | | |
Transfer agency | | | 69,557 | | |
Insurance | | | 24,825 | | |
Miscellaneous | | | 18,926 | | |
Total Expenses | | | 12,605,688 | | |
Net Investment Income | | | 38,407,764 | | |
REALIZED AND UNREALIZED GAIN (LOSS) ON INVESTMENTS
AND FOREIGN CURRENCY TRANSACTIONS | |
Net realized gain (loss) from: | |
Investments | | | 32,482,328 | | |
Foreign currency transactions | | | (1,984,331 | ) | |
| | | | 30,497,997 | | |
Net change in unrealized appreciation (depreciation) on: | |
Investments | | | (95,888,461 | ) | |
Translation of assets and liabilities denominated in foreign currencies | | | (28,105 | ) | |
| | | | (95,916,566 | ) | |
Net realized and unrealized loss on investments and foreign currency transactions | | | (65,418,569 | ) | |
NET DECREASE IN NET ASSETS FROM OPERATIONS | | $ | (27,010,805 | ) | |
The accompanying notes are an integral part of the financial statements.
29
Statements of Changes in Net Assets
Annual Report December 31, 2015
Baillie Gifford International Equity Fund
| | | For the
Year Ended
December 31,
2015 | | For the
Year Ended
December 31,
2014 | |
INCREASE (DECREASE) IN NET ASSETS FROM OPERATIONS | |
Net investment income | | $ | 38,407,764 | | | $ | 41,899,388 | | |
Net realized gain from investments and foreign currency transactions | | | 30,497,997 | | | | 28,009,956 | | |
Net change in unrealized appreciation (depreciation) on investments
and translation of assets and liabilities in foreign currencies | | | (95,916,566 | ) | | | (138,555,427 | ) | |
Net decrease in net assets from operations | | | (27,010,805 | ) | | | (68,646,083 | ) | |
DIVIDENDS AND DISTRIBUTIONS TO SHAREHOLDERS FROM: | |
Net investment income: | |
Class 1 | | | — | | | | (283,889 | ) | |
Class 2 | | | (15,325,212 | ) | | | (9,390,129 | ) | |
Class 3 | | | (17,070,973 | ) | | | (19,194,094 | ) | |
Class 4 | | | (439,047 | ) | | | (6,244,218 | ) | |
Class 5 | | | (4,013,556 | ) | | | (5,362,838 | ) | |
Capital gains: | |
Class 1 | | | — | * | | | (79,843 | ) | |
Class 2 | | | (6,953,265 | ) | | | (2,356,308 | ) | |
Class 3 | | | (7,515,781 | ) | | | (4,620,754 | ) | |
Class 4 | | | — | * | | | (1,478,334 | ) | |
Class 5 | | | (1,641,353 | ) | | | (1,234,770 | ) | |
Total Dividends and Distributions | | | (52,959,187 | ) | | | (50,245,177 | ) | |
TRANSACTIONS IN SHARES OF BENEFICIAL INTEREST | |
Net proceeds from shares subscribed: | |
Class 1 | | | — | | | | 255,949 | | |
Class 2 | | | 247,218,214 | | | | 136,831,273 | | |
Class 3 | | | 25,126,900 | | | | 220,966,910 | | |
Class 4 | | | — | | | | 54,835,000 | | |
Class 5 | | | — | | | | 304,629,645 | | |
Purchase fees: | |
Class 1 | | | 641 | | | | 3,626 | | |
Class 2 | | | 65,938 | | | | 67,788 | | |
Class 3 | | | 87,703 | | | | 179,891 | | |
Class 4 | | | 34,324 | | | | 72,418 | | |
Class 5 | | | 28,860 | | | | 18,147 | | |
Redemption fees: | |
Class 1 | | | 405 | | | | 5,368 | | |
Class 2 | | | 296,120 | | | | 122,868 | | |
Class 3 | | | 329,043 | | | | 306,728 | | |
Class 4 | | | 131,738 | | | | 106,695 | | |
Class 5 | | | 87,989 | | | | 47,408 | | |
Dividends reinvested: | |
Class 2 | | | 22,278,477 | | | | 11,746,437 | | |
Class 3 | | | 24,586,754 | | | | 23,814,848 | | |
Class 4 | | | 439,047 | | | | 7,722,552 | | |
Class 5 | | | 5,654,909 | | | | 6,597,607 | | |
* Capital gains distributions were not made due to classes being dormant.
The accompanying notes are an integral part of the financial statements.
30
Statements of Changes in Net Assets
Annual Report December 31, 2015
Baillie Gifford International Equity Fund
| | | For the
Year Ended
December 31,
2015 | | For the
Year Ended
December 31,
2014 | |
Cost of shares redeemed: | |
Class 1 | | $ | (19,688,877 | ) | | $ | (8,566,950 | ) | |
Class 2 | | | (51,362,173 | ) | | | (211,341,046 | ) | |
Class 3 | | | (335,706,903 | ) | | | (380,295,118 | ) | |
Class 4 | | | (349,226,277 | ) | | | (304,629,645 | ) | |
Class 5 | | | (120,120,122 | ) | | | — | | |
Decrease in Net Assets from Transactions in Shares of Beneficial Interest | | | (549,737,290 | ) | | | (136,501,601 | ) | |
Total Decrease in Net Assets | | | (629,707,282 | ) | | | (255,392,861 | ) | |
NET ASSETS | |
Beginning of year | | | 2,289,214,784 | | | | 2,544,607,645 | | |
End of year (including distributions in excess of net investment income of
$2,342,650 and $1,917,295, respectively) | | $ | 1,659,507,502 | | | $ | 2,289,214,784 | | |
| | | | | | |
The accompanying notes are an integral part of the financial statements.
31
Annual Report December 31, 2015
Baillie Gifford International Equity Fund
Selected data for a Class 2 Share outstanding throughout each year:
| | | For the
Year Ended
December 31,
2015 | | For the
Year Ended
December 31,
2014 | | For the
Year Ended
December 31,
2013 | | For the
Year Ended
December 31,
2012 | | For the
Year Ended
December 31,
2011 | |
Net asset value, beginning of year | | $ | 11.20 | | | $ | 11.79 | | | $ | 10.39 | | | $ | 8.63 | | | $ | 9.95 | | |
From Investment Operations | |
Net investment income(a) | | | 0.19 | | | | 0.18 | | | | 0.19 | | | | 0.22 | | | | 0.16 | | |
Net realized and unrealized gain (loss) on
investments and foreign currency transactions | | | (0.40 | ) | | | (0.52 | ) | | | 1.40 | | | | 1.69 | | | | (1.36 | ) | |
Net increase (decrease) in net asset value from
investment operations | | | (0.21 | ) | | | (0.34 | ) | | | 1.59 | | | | 1.91 | | | | (1.20 | ) | |
Dividends and Distributions to Shareholders | | | | | | | | | | | | | | | | | | | | | |
Dividends from net investment income | | | (0.24 | ) | | | (0.20 | ) | | | (0.19 | ) | | | (0.16 | ) | | | (0.12 | ) | |
Distributions from net realized gain on investments | | | (0.11 | ) | | | (0.05 | ) | | | — | | | | — | | | | (0.01 | ) | |
Total Dividends and Distributions | | | (0.35 | ) | | | (0.25 | ) | | | (0.19 | ) | | | (0.16 | ) | | | (0.13 | ) | |
Proceeds from Purchase Fees and
Redemption Fees(a) | | | 0.01 | | | | 0.00 | (b) | | | 0.00 | (b) | | | 0.01 | | | | 0.01 | | |
Net asset value, end of year | | $ | 10.65 | | | $ | 11.20 | | | $ | 11.79 | | | $ | 10.39 | | | $ | 8.63 | | |
Total Return | |
Total return based on net asset value(c) | | | (1.89 | )% | | | (2.93 | )% | | | 15.35 | % | | | 22.33 | % | | | (11.94 | )% | |
Ratios/Supplemental Data | |
Net assets, end of year (000's omitted) | | $ | 708,666 | | | $ | 542,943 | | | $ | 637,144 | | | $ | 682,452 | | | $ | 831,065 | | |
Ratio of net expenses to average net assets,
before waiver | | | 0.62 | % | | | 0.61 | % | | | 0.61 | % | | | 0.64 | %(d) | | | 0.67 | % | |
Ratio of net expenses to average net assets,
after waiver | | | 0.62 | % | | | 0.61 | % | | | 0.61 | % | | | 0.62 | %(d) | | | 0.67 | % | |
Ratio of net investment income to average
net assets | | | 1.61 | % | | | 1.57 | % | | | 1.72 | % | | | 2.27 | % | | | 1.74 | % | |
Portfolio turnover rate(e) | | | 15 | % | | | 11 | % | | | 16 | % | | | 13 | % | | | 11 | % | |
(a) Calculated based upon average shares outstanding during the year.
(b) Amount is less than $0.005 per share.
(c) Total return is calculated assuming an initial investment made at the net asset value at the beginning of the period, reinvestment of all dividends and distributions, if any, at net asset value during the period, and redemption on the last day of the period.
(d) Effective January 1, 2012, Baillie Gifford Overseas Limited had voluntarily agreed to waive a portion of the Fund's management fee through June 30, 2012, during which time Baillie Gifford Overseas Limited received annual management fee equal to 0.25% of the Fund's average net assets.
(e) Portfolio turnover rate calculated at Fund level.
The accompanying notes are an integral part of the financial statements.
32
Annual Report December 31, 2015
Baillie Gifford International Equity Fund
Selected data for a Class 3 Share outstanding throughout each year:
| | | For the
Year Ended
December 31,
2015 | | For the
Year Ended
December 31,
2014 | | For the
Year Ended
December 31,
2013 | | For the
Year Ended
December 31,
2012 | | For the
Year Ended
December 31,
2011 | |
Net asset value, beginning of year | | $ | 11.34 | | | $ | 11.93 | | | $ | 10.52 | | | $ | 8.73 | | | $ | 10.06 | | |
From Investment Operations | |
Net investment income(a) | | | 0.20 | | | | 0.21 | | | | 0.19 | | | | 0.17 | | | | 0.17 | | |
Net realized and unrealized gain (loss) on
investments and foreign currency transactions | | | (0.41 | ) | | | (0.54 | ) | | | 1.42 | | | | 1.78 | | | | (1.37 | ) | |
Net increase (decrease) in net asset value from
investment operations | | | (0.21 | ) | | | (0.33 | ) | | | 1.61 | | | | 1.95 | | | | (1.20 | ) | |
Dividends and Distributions to Shareholders | | | | | | | | | | | | | | | | | | | | | |
Dividends from net investment income | | | (0.24 | ) | | | (0.21 | ) | | | (0.20 | ) | | | (0.17 | ) | | | (0.13 | ) | |
Distributions from net realized gain on investments | | | (0.11 | ) | | | (0.05 | ) | | | — | | | | — | | | | (0.01 | ) | |
Total Dividends and Distributions | | | (0.35 | ) | | | (0.26 | ) | | | (0.20 | ) | | | (0.17 | ) | | | (0.14 | ) | |
Proceeds from Purchase Fees and
Redemption Fees(a) | | | 0.01 | | | | 0.00 | (b) | | | 0.00 | (b) | | | 0.01 | | | | 0.01 | | |
Net asset value, end of year | | $ | 10.79 | | | $ | 11.34 | | | $ | 11.93 | | | $ | 10.52 | | | $ | 8.73 | | |
Total Return | |
Total return based on net asset value(c) | | | (1.82 | )% | | | (2.83 | )% | | | 15.34 | % | | | 22.50 | % | | | (11.85 | )% | |
Ratios/Supplemental Data | |
Net assets, end of year (000's omitted) | | $ | 776,265 | | | $ | 1,078,665 | | | $ | 1,268,490 | | | $ | 862,591 | | | $ | 367,327 | | |
Ratio of net expenses to average net assets,
before waiver | | | 0.54 | % | | | 0.54 | % | | | 0.54 | % | | | 0.58 | %(d) | | | 0.60 | % | |
Ratio of net expenses to average net assets,
after waiver | | | 0.54 | % | | | 0.54 | % | | | 0.54 | % | | | 0.56 | %(d) | | | 0.60 | % | |
Ratio of net investment income to average
net assets | | | 1.69 | % | | | 1.76 | % | | | 1.75 | % | | | 1.71 | % | | | 1.75 | % | |
Portfolio turnover rate(e) | | | 15 | % | | | 11 | % | | | 16 | % | | | 13 | % | | | 11 | % | |
(a) Calculated based upon average shares outstanding during the year.
(b) Amount is less than $0.005 per share.
(c) Total return is calculated assuming an initial investment made at the net asset value at the beginning of the period, reinvestment of all dividends and distributions, if any, at net asset value during the period, and redemption on the last day of the period. Total return is not annualized for periods less than one year.
(d) Effective January 1, 2012, Baillie Gifford Overseas Limited had voluntarily agreed to waive a portion of the Fund's management fee through June 30, 2012, during which time Baillie Gifford Overseas Limited received annual management fee equal to 0.25% of the Fund's average net assets.
(e) Portfolio turnover rate calculated at Fund level.
The accompanying notes are an integral part of the financial statements.
33
Annual Report December 31, 2015
Baillie Gifford International Equity Fund
Selected data for a Class 5 Share outstanding throughout each period:
| | | For the
Year Ended
December 31,
2015 | | For the Period
April 7, 2014(a)
through
December 31,
2014 | |
Net asset value, beginning of period | | $ | 11.67 | | | $ | 12.25 | | |
From Investment Operations | |
Net investment income(b) | | | 0.22 | | | | 0.15 | | |
Net realized and unrealized loss on investments and foreign currency transactions | | | (0.42 | ) | | | (0.46 | ) | |
Net decrease in net asset value from investment operations | | | (0.20 | ) | | | (0.31 | ) | |
Dividends and Distributions to Shareholders | | | | | | | | | |
Dividends from net investment income | | | (0.25 | ) | | | (0.22 | ) | |
Distributions from net realized gain on investments | | | (0.11 | ) | | | (0.05 | ) | |
Total Dividends and Distributions | | | (0.36 | ) | | | (0.27 | ) | |
Proceeds from Purchase Fees and Redemption Fees(b) | | | 0.00 | (c) | | | 0.00 | (c) | |
Net asset value, end of period | | $ | 11.11 | | | $ | 11.67 | | |
Total Return | |
Total return based on net asset value(d) | | | (1.75 | )% | | | (2.60 | )% | |
Ratios/Supplemental Data | |
Net assets, end of period (000's omitted) | | $ | 174,577 | | | $ | 296,649 | | |
Ratio of net expenses to average net assets | | | 0.47 | % | | | 0.47 | %* | |
Ratio of net investment income to average net assets | | | 1.83 | % | | | 1.61 | %* | |
Portfolio turnover rate(e) | | | 15 | % | | | 11 | % | |
* Annualized.
(a) Commencement of investment operations.
(b) Calculated based upon average shares outstanding during the year.
(c) Amount is less than $0.005 per share.
(d) Total return is calculated assuming an initial investment made at the net asset value at the beginning of the period, reinvestment of all dividends and distributions, if any, at net asset value during the period, and redemption on the last day of the period. Total return is not annualized for periods less than one year.
(e) Portfolio turnover rate calculated at Fund level.
The accompanying notes are an integral part of the financial statements.
34
Industry Diversification Table
Annual Report December 31, 2015
December 31, 2015 (unaudited)
Baillie Gifford EAFE Fund
| | | Value | | % of Total
Net Assets | |
Aerospace | | $ | 53,243,108 | | | | 2.5 | % | |
Apparel Retailers | | | 170,578,877 | | | | 7.7 | | |
Automobiles | | | 106,100,553 | | | | 4.9 | | |
Banks | | | 188,624,850 | | | | 8.6 | | |
Biotechnology | | | 93,673,826 | | | | 4.3 | | |
Broadline Retailers | | | 47,611,837 | | | | 2.2 | | |
Business Support Services | | | 19,117,963 | | | | 0.9 | | |
Chemicals | | | 50,229,935 | | | | 2.3 | | |
Clothing & Accessories | | | 40,453,814 | | | | 1.8 | | |
Commodity Chemicals | | | 27,473,612 | | | | 1.3 | | |
Computers | | | 11,157,799 | | | | 0.5 | | |
Construction & Building Materials | | | 15,095,249 | | | | 0.7 | | |
Diversified Financial Services | | | 42,132,195 | | | | 1.9 | | |
Diversified Industrials | | | 22,714,667 | | | | 1.0 | | |
Energy — Alternate Sources | | | 10,335,655 | | | | 0.5 | | |
Food & Drug Retailers | | | 11,692,435 | | | | 0.5 | | |
Food Producers & Processors | | | 10,855,978 | | | | 0.5 | | |
Food Retailers & Wholesalers | | | 34,567,651 | | | | 1.6 | | |
General Financial | | | 11,492,308 | | | | 0.5 | | |
General Retailers | | | 13,520,715 | | | | 0.6 | | |
Healthcare — Products | | | 38,047,578 | | | | 1.8 | | |
Industrial Machinery | | | 105,877,547 | | | | 4.8 | | |
Insurance | | | 61,930,441 | | | | 2.8 | | |
Internet | | | 271,422,665 | | | | 12.4 | | |
Life Insurance | | | 92,295,916 | | | | 4.2 | | |
Media | | | 44,910,244 | | | | 2.1 | | |
Media & Photography | | | 13,302,448 | | | | 0.6 | | |
Personal products | | | 59,508,501 | | | | 2.7 | | |
Pharmaceuticals | | | 44,310,367 | | | | 2.0 | | |
Publishing | | | 12,895,049 | | | | 0.6 | | |
Semiconductors | | | 126,310,553 | | | | 5.8 | | |
Software | | | 15,724,586 | | | | 0.7 | | |
Speciality Finance | | | 79,719,769 | | | | 3.6 | | |
Specialized Consumer Services | | | 148,368,048 | | | | 6.8 | | |
Telecommunication Services | | | 76,614,074 | | | | 3.5 | | |
Travel & Tourism | | | 1,542,511 | | | | 0.1 | | |
Total Value of Investments | | | 2,173,453,324 | | | | 99.3 | | |
Other assets less liabilities | | | 15,399,492 | | | | 0.7 | | |
Net Assets | | $ | 2,188,852,816 | | | | 100.0 | % | |
35
Annual Report December 31, 2015
December 31, 2015
Baillie Gifford EAFE Fund
| | | Shares | | Value | |
COMMON STOCKS — 99.3% | |
ARGENTINA — 1.0% | |
MercadoLibre, Inc. | | | 197,725 | | | $ | 22,607,877 | | |
AUSTRIA — 0.6% | |
ams AG | | | 361,823 | | | | 12,095,238 | | |
CHINA — 15.5% | |
Alibaba Group Holding Ltd. ADR (a) | | | 962,044 | | | | 78,185,316 | | |
Baidu, Inc. ADR (a) | | | 649,046 | | | | 122,695,656 | | |
Ctrip.com International Ltd. ADR (a) | | | 33,294 | | | | 1,542,511 | | |
JD.com, Inc. ADR (a) | | | 387,800 | | | | 12,512,367 | | |
New Oriental Education & Technology Group, Inc. ADR | | | 514,513 | | | | 16,140,273 | | |
Tencent Holdings Ltd. | | | 5,492,100 | | | | 107,535,242 | | |
| | | | | | 338,611,365 | | |
DENMARK — 5.0% | |
Chr. Hansen Holding A/S | | | 320,316 | | | | 20,035,893 | | |
Genmab A/S (a) | | | 119,943 | | | | 15,948,105 | | |
Novo Nordisk A/S, B Shares | | | 765,315 | | | | 44,310,367 | | |
Novozymes A/S, B Shares | | | 626,425 | | | | 29,992,532 | | |
| | | | | | 110,286,897 | | |
FRANCE — 5.4% | |
Compagnie Generale d'Optique Essillor International SA | | | 189,710 | | | | 23,644,816 | | |
Kering | | | 205,289 | | | | 35,099,470 | | |
L'Oreal SA | | | 353,784 | | | | 59,508,501 | | |
| | | | | | 118,252,787 | | |
GERMANY — 5.8% | |
Aixtron SE (a) | | | 1,193,844 | | | | 5,296,116 | | |
BASF SE | | | 360,648 | | | | 27,473,612 | | |
Dialog Semiconductor Plc. (a) | | | 81,808 | | | | 2,729,836 | | |
MorphoSys AG (a) | | | 196,721 | | | | 12,240,960 | | |
Rocket Internet SE 144A (a)(b) | | | 516,174 | | | | 15,724,586 | | |
SMA Solar Technology AG (a) | | | 186,895 | | | | 10,335,655 | | |
Zalando SE 144A (a)(b) | | | 1,355,825 | | | | 53,633,601 | | |
| | | | | | 127,434,366 | | |
The accompanying notes are an integral part of the financial statements.
36
Annual Report December 31, 2015
December 31, 2015
Baillie Gifford EAFE Fund
| | | Shares | | Value | |
HONG KONG — 5.5% | |
AIA Group Ltd. | | | 15,446,800 | | | $ | 92,295,916 | | |
Hong Kong Exchanges and Clearing Ltd. | | | 1,136,101 | | | | 28,941,935 | | |
| | | | | | 121,237,851 | | |
INDIA — 0.6% | |
Housing Development Finance Corp., Ltd. | | | 693,500 | | | | 13,190,260 | | |
IRELAND — 1.7% | |
Bank of Ireland (a) | | | 62,171,637 | | | | 22,949,730 | | |
James Hardie Industries Plc. SE CDI | | | 1,197,284 | | | | 15,095,249 | | |
| | | | | | 38,044,979 | | |
ITALY — 7.8% | |
EXOR SpA | | | 587,587 | | | | 26,668,779 | | |
Fiat Chrysler Automobiles NV (a) | | | 7,639,767 | | | | 106,100,553 | | |
UniCredit SpA | | | 7,026,375 | | | | 38,846,866 | | |
| | | | | | 171,616,198 | | |
JAPAN — 11.2% | |
Don Quijote Holdings Co., Ltd. | | | 385,000 | | | | 13,520,715 | | |
M3, Inc. | | | 2,166,000 | | | | 44,910,244 | | |
Rakuten, Inc. | | | 4,692,100 | | | | 54,042,459 | | |
SBI Holdings, Inc. | | | 1,065,000 | | | | 11,492,308 | | |
SMC Corp. | | | 167,200 | | | | 43,427,510 | | |
SoftBank Group Corp. | | | 1,518,000 | | | | 76,614,074 | | |
| | | | | | 244,007,310 | | |
NETHERLANDS — 2.6% | |
| ASML Holding NV | | | 511,149 | | | | 45,416,599 | | |
Gemalto NV | | | 185,956 | | | | 11,157,799 | | |
| | | | | | 56,574,398 | | |
NORWAY — 1.2% | |
Schibsted ASA, Class A | | | 404,617 | | | | 13,302,448 | | |
Schibsted ASA, Class B (a) | | | 404,617 | | | | 12,895,049 | | |
| | | | | | 26,197,497 | | |
PORTUGAL — 0.6% | |
Jeronimo Martins SGPS SA | | | 924,037 | | | | 12,023,988 | | |
The accompanying notes are an integral part of the financial statements.
37
Annual Report December 31, 2015
December 31, 2015
Baillie Gifford EAFE Fund
| | | Shares | | Value | |
RUSSIA — 0.4% | |
Magnit PJSC GDR Reg S | | | 241,563 | | | $ | 9,713,713 | | |
SOUTH KOREA — 1.6% | |
Celltrion, Inc. (a) | | | 216,644 | | | | 15,456,336 | | |
NAVER Corp. | | | 33,326 | | | | 18,583,890 | | |
| | | | | | 34,040,226 | | |
SPAIN — 8.8% | |
Banco Popular Espanol SA | | | 12,927,045 | | | | 42,593,361 | | |
Banco Santander SA | | | 4,103,388 | | | | 20,186,196 | | |
Distribuidora Internacional de Alimentacion SA (a) | | | 2,175,259 | | | | 12,829,950 | | |
Inditex SA | | | 3,404,093 | | | | 116,945,276 | | |
| | | | | | 192,554,783 | | |
SWEDEN — 9.2% | |
Alfa Laval AB | | | 1,244,226 | | | | 22,714,667 | | |
Atlas Copco AB, A Shares | | | 2,546,403 | | | | 62,450,037 | | |
Elekta AB, B Shares | | | 1,695,069 | | | | 14,402,762 | | |
Investment AB Kinnevik, B Shares | | | 1,722,363 | | | | 53,050,990 | | |
Svenska Handelsbanken AB, A Shares | | | 3,635,227 | | | | 48,281,209 | | |
| | | | | | 200,899,665 | | |
SWITZERLAND — 4.1% | |
Compagnie Financiere Richemont SA | | | 565,211 | | | | 40,453,814 | | |
Syngenta AG | | | 128,333 | | | | 50,229,935 | | |
| | | | | | 90,683,749 | | |
TURKEY — 0.5% | |
BIM Birlesik Magazalar A/S | | | 616,742 | | | | 10,855,978 | | |
UNITED KINGDOM — 10.2% | |
Aggreko Plc. | | | 1,420,165 | | | | 19,117,963 | | |
ARM Holdings Plc. | | | 3,987,160 | | | | 60,772,764 | | |
Ocado Group Plc. (a) | | | 2,617,071 | | | | 11,692,435 | | |
Prudential Plc. | | | 2,748,845 | | | | 61,930,441 | | |
Rolls-Royce Holdings Plc. (a) | | | 6,185,930 | | | | 52,397,744 | | |
The accompanying notes are an integral part of the financial statements.
38
Annual Report December 31, 2015
December 31, 2015
Baillie Gifford EAFE Fund
| | | Shares | | Value | |
Rolls-Royce Holdings Plc. Preference Shares (a) | | | 573,435,711 | | | $ | 845,364 | | |
Standard Chartered Plc. | | | 1,900,338 | | | | 15,767,488 | | |
| | | | | | 222,524,199 | | |
TOTAL INVESTMENTS — 99.3% | |
(cost $1,680,350,450) | | | | $ | 2,173,453,324 | | |
Other assets less liabilities — 0.7% | | | | | 15,399,492 | | |
NET ASSETS — 100.0% | | | | $ | 2,188,852,816 | | |
(a) Non-income producing security.
(b) 144A — Securities are exempt from registration under Rule 144A of the Securities Act of 1933, as amended. These securities may be resold in transactions exempt from registration, normally to qualified institutional buyers. Prices are obtained daily from the London International Stock Exchange; therefore, Fair valuation is typically not required. At December 31, 2015, the net value of these securities was $69,358,187 representing 3.2% of net assets.
ADR — American Depositary Receipt.
CDI — Chess Depositary Interest.
GDR — Global Depositary Receipt.
Reg S — Regulation S ("Reg S") of the Securities Act of 1933, as amended ("1933 Act") is a safe harbor that defines when an offering of securities will be deemed to come to rest abroad and therefore is not subject to the registration obligations imposed under Section 5 of the 1933 Act. The regulation includes two safe harbor provisions: an issuer safe harbor and a resale safe harbor. In each case, the regulation demands that offers and sales of the securities be made outside the United States and that no offering participant (which includes the issuer, the banks assisting with the offer and their respective affiliates) engage in "directed" selling efforts. In the case of issuers for whose securities there is substantial U.S. market interest, the regulation also requires that no offers and sales be made to U.S. persons (including U.S. persons physically located outside the United States).
The accompanying notes are an integral part of the financial statements.
39
Statement of Assets and Liabilities
Annual Report December 31, 2015
December 31, 2015
Baillie Gifford EAFE Fund
ASSETS | |
Investments, at value (cost $1,680,350,450) | | $ | 2,173,453,324 | | |
Cash | | | 16,005,605 | | |
Foreign cash, at value (cost $28,424) | | | 28,305 | | |
Tax reclaims receivable | | | 1,840,832 | | |
Dividends receivable | | | 326,226 | | |
Capital shares sold receivable | | | 250,000 | | |
Total Assets | | | 2,191,904,292 | | |
LIABILITIES | |
Management fee payable | | | 1,966,870 | | |
Servicing fee payable | | | 521,077 | | |
Trustee fee payable | | | 30,012 | | |
Accrued expenses | | | 533,517 | | |
Total Liabilities | | | 3,051,476 | | |
NET ASSETS | | $ | 2,188,852,816 | | |
COMPOSITION OF NET ASSETS | |
Paid-in capital | | $ | 1,711,286,724 | | |
Distributions in excess of net investment income | | | (18,242,099 | ) | |
Accumulated net realized gain on investments and foreign currency transactions | | | 2,860,807 | | |
Net unrealized appreciation in value of investments and foreign currencies | | | 492,947,384 | | |
| | | $ | 2,188,852,816 | | |
NET ASSET VALUE, PER SHARE | |
| Class 2 ($732,134,704 / 69,615,824 shares outstanding), unlimited authorized, no par value | | $ | 10.52 | | |
Maximum Purchase Price Per Share (Note D) | | $ | 10.55 | | |
Minimum Redemption Price Per Share (Note D) | | $ | 10.51 | | |
| Class 3 ($490,217,613 / 46,521,035 shares outstanding), unlimited authorized, no par value | | $ | 10.54 | | |
Maximum Purchase Price Per Share (Note D) | | $ | 10.57 | | |
Minimum Redemption Price Per Share (Note D) | | $ | 10.53 | | |
| Class 4 ($199,085,521 / 18,867,216 shares outstanding), unlimited authorized, no par value | | $ | 10.55 | | |
Maximum Purchase Price Per Share (Note D) | | $ | 10.58 | | |
Minimum Redemption Price Per Share (Note D) | | $ | 10.54 | | |
| Class 5 ($767,414,978 / 72,640,369 shares outstanding), unlimited authorized, no par value | | $ | 10.56 | | |
Maximum Purchase Price Per Share (Note D) | | $ | 10.59 | | |
Minimum Redemption Price Per Share (Note D) | | $ | 10.55 | | |
The accompanying notes are an integral part of the financial statements.
40
Annual Report December 31, 2015
For the Year Ended December 31, 2015
Baillie Gifford EAFE Fund
INVESTMENT INCOME | |
Dividends (net of foreign withholding taxes of $2,906,741) | | $ | 32,385,581 | | |
Interest | | | 442 | | |
Total Investment Income | | | 32,386,023 | | |
EXPENSES | |
Management fee (Note B) | | | 8,071,112 | | |
Shareholder Servicing fees — Class 2 Shares (Note B) | | | 1,308,655 | | |
Shareholder Servicing fees — Class 3 Shares (Note B) | | | 508,554 | | |
Shareholder Servicing fees — Class 4 Shares (Note B) | | | 148,212 | | |
Shareholder Servicing fees — Class 5 Shares (Note B) | | | 163,189 | | |
Fund accounting | | | 1,100,758 | | |
Custody | | | 491,846 | | |
Professional fees | | | 301,722 | | |
Legal | | | 241,269 | | |
Trustees' fees | | | 123,203 | | |
Transfer agency | | | 63,700 | | |
Insurance | | | 24,422 | | |
Miscellaneous | | | 19,177 | | |
Total Expenses | | | 12,565,819 | | |
Net Investment Income | | | 19,820,204 | | |
REALIZED AND UNREALIZED GAIN (LOSS) ON INVESTMENTS
AND FOREIGN CURRENCY TRANSACTIONS | |
Net realized gain (loss) from: | |
Investments | | | 23,855,926 | | |
Foreign currency transactions | | | (617,039 | ) | |
| | | | 23,238,887 | | |
Net change in unrealized appreciation (depreciation) on: | |
Investments | | | (109,511,221 | ) | |
Translation of assets and liabilities denominated in foreign currencies | | | (2,150 | ) | |
| | | | (109,513,371 | ) | |
Net realized and unrealized loss on investments and foreign currency transactions | | | (86,274,484 | ) | |
NET DECREASE IN NET ASSETS FROM OPERATIONS | | $ | (66,454,280 | ) | |
The accompanying notes are an integral part of the financial statements.
41
Statements of Changes in Net Assets
Annual Report December 31, 2015
Baillie Gifford EAFE Fund
| | | For the
Year Ended
December 31,
2015 | | For the
Year Ended
December 31,
2014 | |
INCREASE (DECREASE) IN NET ASSETS FROM OPERATIONS | |
Net investment income | | $ | 19,820,204 | | | $ | 29,403,379 | | |
Net realized gain from investments and foreign currency transactions | | | 23,238,887 | | | | 121,660,874 | | |
Net change in unrealized appreciation (depreciation) on investments
and translation of assets and liabilities in foreign currencies | | | (109,513,371 | ) | | | (316,322,952 | ) | |
Net decrease in net assets from operations | | | (66,454,280 | ) | | | (165,258,699 | ) | |
DIVIDENDS AND DISTRIBUTIONS TO SHAREHOLDERS FROM: | |
Net investment income: | |
Class 2 | | | (5,966,269 | ) | | | (9,320,741 | ) | |
Class 3 | | | (4,330,966 | ) | | | (6,352,405 | ) | |
Class 4 | | | (1,816,851 | ) | | | (2,730,027 | ) | |
Class 5 | | | (7,380,450 | ) | | | (10,901,354 | ) | |
Capital gains: | |
Class 2 | | | (11,267,799 | ) | | | (29,768,962 | ) | |
Class 3 | | | (7,479,657 | ) | | | (19,181,263 | ) | |
Class 4 | | | (3,059,883 | ) | | | (8,054,995 | ) | |
Class 5 | | | (11,775,272 | ) | | | (30,984,381 | ) | |
Total Dividends and Distributions | | | (53,077,147 | ) | | | (117,294,128 | ) | |
TRANSACTIONS IN SHARES OF BENEFICIAL INTEREST | |
Net proceeds from shares subscribed: | |
Class 2 | | | 35,137,479 | | | | 45,528,771 | | |
Class 3 | | | 22,937,350 | | | | 2,346,938 | | |
Class 4 | | | — | | | | — | | |
Class 5 | | | — | | | | — | | |
Purchase fees: | |
Class 2 | | | 42,401 | | | | 21,985 | | |
Class 3 | | | 29,574 | | | | 14,081 | | |
Class 4 | | | 11,350 | | | | 5,903 | | |
Class 5 | | | 43,743 | | | | 22,738 | | |
Redemption fees: | |
Class 2 | | | 24,000 | | | | 47,221 | | |
Class 3 | | | 15,751 | | | | 30,074 | | |
Class 4 | | | 6,611 | | | | 12,616 | | |
Class 5 | | | 25,474 | | | | 48,592 | | |
Dividends reinvested: | |
Class 2 | | | 16,614,298 | | | | 38,035,551 | | |
Class 3 | | | 11,810,623 | | | | 25,533,668 | | |
Class 4 | | | 4,876,734 | | | | 10,785,022 | | |
Class 5 | | | 19,155,722 | | | | 41,885,735 | | |
The accompanying notes are an integral part of the financial statements.
42
Statements of Changes in Net Assets
Annual Report December 31, 2015
Baillie Gifford EAFE Fund
| | | For the
Year Ended
December 31,
2015 | | For the
Year Ended
December 31,
2014 | |
Cost of shares redeemed: | |
Class 1 | | $ | — | | | $ | (26,371,394 | ) | |
Class 2 | | | (34,409,812 | ) | | | (62,864,979 | ) | |
Class 3 | | | (6,012,024 | ) | | | (8,013,523 | ) | |
Increase in Net Assets from Transactions in Shares of Beneficial Interest | | | 70,309,274 | | | | 67,068,999 | | |
Total Decrease in Net Assets | | | (49,222,153 | ) | | | (215,483,828 | ) | |
NET ASSETS | |
Beginning of year | | | 2,238,074,969 | | | | 2,453,558,797 | | |
End of year (including distributions in excess of net investment income of
$18,242,099 and $17,950,728, respectively) | | $ | 2,188,852,816 | | | $ | 2,238,074,969 | | |
| | | | | | |
The accompanying notes are an integral part of the financial statements.
43
Annual Report December 31, 2015
Baillie Gifford EAFE Fund
Selected data for a Class 2 Share outstanding throughout each year:
| | | For the
Year Ended
December 31,
2015 | | For the
Year Ended
December 31,
2014 | | For the
Year Ended
December 31,
2013 | | For the
Year Ended
December 31,
2012 | | For the
Year Ended
December 31,
2011 | |
Net asset value, beginning of year | | $ | 11.11 | | | $ | 12.58 | | | $ | 9.88 | | | $ | 8.40 | | | $ | 9.70 | | |
From Investment Operations | |
Net investment income(a) | | | 0.09 | | | | 0.14 | | | | 0.13 | | | | 0.11 | | | | 0.13 | | |
Net realized and unrealized gain (loss) on
investments and foreign currency transactions | | | (0.42 | ) | | | (1.01 | ) | | | 2.70 | | | | 1.47 | | | | (1.27 | ) | |
Net increase (decrease) in net asset value from
investment operations | | | (0.33 | ) | | | (0.87 | ) | | | 2.83 | | | | 1.58 | | | | (1.14 | ) | |
Dividends and Distributions to Shareholders | | | | | | | | | | | | | | | | | | | | | |
Dividends from net investment income | | | (0.09 | ) | | | (0.14 | ) | | | (0.13 | ) | | | (0.10 | ) | | | (0.16 | ) | |
Distributions from net realized gain on investments | | | (0.17 | ) | | | (0.46 | ) | | | — | | | | — | | | | — | | |
Total Dividends and Distributions | | | (0.26 | ) | | | (0.60 | ) | | | (0.13 | ) | | | (0.10 | ) | | | (0.16 | ) | |
Proceeds from Purchase Fees and
Redemption Fees(a) | | | 0.00 | (b) | | | 0.00 | (b) | | | 0.00 | (b) | | | 0.00 | (b) | | | 0.00 | (b) | |
Net asset value, end of year | | $ | 10.52 | | | $ | 11.11 | | | $ | 12.58 | | | $ | 9.88 | | | $ | 8.40 | | |
Total Return | |
Total return based on net asset value(c) | | | (3.07 | )% | | | (6.98 | )% | | | 28.69 | % | | | 18.78 | % | | | (11.70 | )% | |
Ratios/Supplemental Data | |
Net assets, end of year (000's omitted) | | $ | 732,135 | | | $ | 754,210 | | | $ | 828,208 | | | $ | 936,352 | | | $ | 682,295 | | |
Ratio of net expenses to average net assets | | | 0.62 | % | | | 0.61 | % | | | 0.61 | % | | | 0.61 | % | | | 0.60 | % | |
Ratio of net investment income to average
net assets | | | 0.78 | % | | | 1.18 | % | | | 1.21 | % | | | 1.20 | % | | | 1.33 | % | |
Portfolio turnover rate(d) | | | 17 | % | | | 18 | % | | | 15 | % | | | 18 | % | | | 11 | % | |
(a) Calculated based upon average shares outstanding during the year.
(b) Amount is less than $0.005 per share.
(c) Total return is calculated assuming an initial investment made at the net asset value at the beginning of the period, reinvestment of all dividends and distributions, if any, at net asset value during the period, and redemption on the last day of the period. Total return is not annualized for periods less than one year.
(d) Portfolio turnover rate calculated at Fund level.
The accompanying notes are an integral part of the financial statements.
44
Annual Report December 31, 2015
Baillie Gifford EAFE Fund
Selected data for a Class 3 Share outstanding throughout each year:
| | | For the
Year Ended
December 31,
2015 | | For the
Year Ended
December 31,
2014 | | For the
Year Ended
December 31,
2013 | | For the
Year Ended
December 31,
2012 | | For the
Year Ended
December 31,
2011 | |
Net asset value, beginning of year | | $ | 11.13 | | | $ | 12.61 | | | $ | 9.90 | | | $ | 8.42 | | | $ | 9.72 | | |
From Investment Operations | |
Net investment income(a) | | | 0.10 | | | | 0.15 | | | | 0.14 | | | | 0.12 | | | | 0.13 | | |
Net realized and unrealized gain (loss) on
investments and foreign currency transactions | | | (0.43 | ) | | | (1.02 | ) | | | 2.71 | | | | 1.46 | | | | (1.26 | ) | |
Net increase (decrease) in net asset value from
investment operations | | | (0.33 | ) | | | (0.87 | ) | | | 2.85 | | | | 1.58 | | | | (1.13 | ) | |
Dividends and Distributions to Shareholders | | | | | | | | | | | | | | | | | | | | | |
Dividends from net investment income | | | (0.09 | ) | | | (0.15 | ) | | | (0.14 | ) | | | (0.10 | ) | | | (0.17 | ) | |
Distributions from net realized gain on investments | | | (0.17 | ) | | | (0.46 | ) | | | — | | | | — | | | | — | | |
Total Dividends and Distributions | | | (0.26 | ) | | | (0.61 | ) | | | (0.14 | ) | | | (0.10 | ) | | | (0.17 | ) | |
Proceeds from Purchase Fees and
Redemption Fees(a) | | | 0.00 | (b) | | | 0.00 | (b) | | | 0.00 | (b) | | | 0.00 | (b) | | | 0.00 | (b) | |
Net asset value, end of year | | $ | 10.54 | | | $ | 11.13 | | | $ | 12.61 | | | $ | 9.90 | | | $ | 8.42 | | |
Total Return | |
Total return based on net asset value(c) | | | (3.02 | )% | | | (6.91 | )% | | | 28.83 | % | | | 18.82 | % | | | (11.61 | )% | |
Ratios/Supplemental Data | |
Net assets, end of year (000's omitted) | | $ | 490,218 | | | $ | 487,943 | | | $ | 530,001 | | | $ | 490,822 | | | $ | 502,187 | | |
Ratio of net expenses to average net assets | | | 0.55 | % | | | 0.54 | % | | | 0.54 | % | | | 0.54 | % | | | 0.54 | % | |
Ratio of net investment income to average
net assets | | | 0.85 | % | | | 1.23 | % | | | 1.30 | % | | | 1.26 | % | | | 1.35 | % | |
Portfolio turnover rate(d) | | | 17 | % | | | 18 | % | | | 15 | % | | | 18 | % | | | 11 | % | |
(a) Calculated based upon average shares outstanding during the year.
(b) Amount is less than $0.005 per share.
(c) Total return is calculated assuming an initial investment made at the net asset value at the beginning of the period, reinvestment of all dividends and distributions, if any, at net asset value during the period, and redemption on the last day of the period. Total return is not annualized for periods less than one year.
(d) Portfolio turnover rate calculated at Fund level.
The accompanying notes are an integral part of the financial statements.
45
Annual Report December 31, 2015
Baillie Gifford EAFE Fund
Selected data for a Class 4 Share outstanding throughout each period:
| | | For the
Year Ended
December 31,
2015 | | For the
Year Ended
December 31,
2014 | | For the Period
October 10, 2013(a)
through
December 31,
2013 | |
Net asset value, beginning of period | | $ | 11.15 | | | $ | 12.62 | | | $ | 11.68 | | |
From Investment Operations | |
Net investment income(b) | | | 0.10 | | | | 0.16 | | | | 0.00 | (c) | |
Net realized and unrealized gain (loss) on investments and foreign currency
transactions | | | (0.43 | ) | | | (1.01 | ) | | | 1.08 | | |
Net increase (decrease) in net asset value from investment operations | | | (0.33 | ) | | | (0.85 | ) | | | 1.08 | | |
Dividends and Distributions to Shareholders | | | | | | | | | | | | | |
Dividends from net investment income | | | (0.10 | ) | | | (0.16 | ) | | | (0.14 | ) | |
Distributions from net realized gain on investments | | | (0.17 | ) | | | (0.46 | ) | | | — | | |
Total Dividends and Distributions | | | (0.27 | ) | | | (0.62 | ) | | | (0.14 | ) | |
Proceeds from Purchase Fees and Redemption Fees(b) | | | 0.00 | (c) | | | 0.00 | (c) | | | 0.00 | (c) | |
Net asset value, end of period | | $ | 10.55 | | | $ | 11.15 | | | $ | 12.62 | | |
Total Return | |
Total return based on net asset value(d) | | | (2.99 | )% | | | (6.88 | )% | | | 9.29 | % | |
Ratios/Supplemental Data | |
Net assets, end of period (000's omitted) | | $ | 199,086 | | | $ | 205,228 | | | $ | 220,388 | | |
Ratio of net expenses to average net assets | | | 0.52 | % | | | 0.51 | % | | | 0.52 | %* | |
Ratio of net investment income to average net assets | | | 0.89 | % | | | 1.26 | % | | | 0.03 | %* | |
Portfolio turnover rate(e) | | | 17 | % | | | 18 | % | | | 15 | % | |
* Annualized.
(a) Commencement of investment operations.
(b) Calculated based upon average shares outstanding during the year.
(c) Amount is less than $0.005 per share.
(d) Total return is calculated assuming an initial investment made at the net asset value at the beginning of the period, reinvestment of all dividends and distributions, if any, at net asset value during the period, and redemption on the last day of the period. Total return is not annualized for periods less than one year.
(e) Portfolio turnover rate calculated at Fund level.
The accompanying notes are an integral part of the financial statements.
46
Annual Report December 31, 2015
Baillie Gifford EAFE Fund
Selected data for a Class 5 Share outstanding throughout each period:
| | | For the
Year Ended
December 31,
2015 | | For the
Year Ended
December 31,
2014 | | For the
Year Ended
December 31,
2013 | | For the Period
July 18, 2012(a)
through
December 31,
2012 | |
Net asset value, beginning of period | | $ | 11.16 | | | $ | 12.64 | | | $ | 9.92 | | | $ | 8.67 | | |
From Investment Operations | |
Net investment income(b) | | | 0.11 | | | | 0.16 | | | | 0.14 | | | | 0.03 | | |
Net realized and unrealized gain (loss) on investments and
foreign currency transactions | | | (0.44 | ) | | | (1.02 | ) | | | 2.73 | | | | 1.33 | | |
Net increase (decrease) in net asset value from
investment operations | | | (0.33 | ) | | | (0.86 | ) | | | 2.87 | | | | 1.36 | | |
Dividends and Distributions to Shareholders | | | | | | | | | | | | | | | | | |
Dividends from net investment income | | | (0.10 | ) | | | (0.16 | ) | | | (0.15 | ) | | | (0.11 | ) | |
Distributions from net realized gain on investments | | | (0.17 | ) | | | (0.46 | ) | | | — | | | | — | | |
Total Dividends and Distributions | | | (0.27 | ) | | | (0.62 | ) | | | (0.15 | ) | | | (0.11 | ) | |
Proceeds from Purchase Fees and
Redemption Fees(b) | | | 0.00 | (c) | | | 0.00 | (c) | | | 0.00 | (c) | | | 0.00 | (c) | |
Net asset value, end of period | | $ | 10.56 | | | $ | 11.16 | | | $ | 12.64 | | | $ | 9.92 | | |
Total Return | |
Total return based on net asset value(d) | | | (2.94 | )% | | | (6.83 | )% | | | 28.97 | % | | | 15.72 | % | |
Ratios/Supplemental Data | |
Net assets, end of period (000's omitted) | | $ | 767,415 | | | $ | 790,695 | | | $ | 848,681 | | | $ | 616,590 | | |
Ratio of net expenses to average net assets | | | 0.47 | % | | | 0.46 | % | | | 0.46 | % | | | 0.46 | %* | |
Ratio of net investment income to average net assets | | | 0.94 | % | | | 1.30 | % | | | 1.28 | % | | | 0.70 | %* | |
Portfolio turnover rate(e) | | | 17 | % | | | 18 | % | | | 15 | % | | | 18 | % | |
* Annualized.
(a) Commencement of investment operations.
(b) Calculated based upon average shares outstanding during the year.
(c) Amount is less than $0.005 per share.
(d) Total return is calculated assuming an initial investment made at the net asset value at the beginning of the period, reinvestment of all dividends and distributions, if any, at net asset value during the period, and redemption on the last day of the period. Total return is not annualized for periods less than one year.
(e) Portfolio turnover rate calculated at Fund level.
The accompanying notes are an integral part of the financial statements.
47
Industry Diversification Table
Annual Report December 31, 2015
December 31, 2015 (unaudited)
Baillie Gifford EAFE Choice Fund
| | | Value | | % of Total
Net Assets | |
Apparel Retailers | | $ | 12,560,579 | | | | 4.6 | % | |
Asset Managers | | | 9,734,551 | | | | 3.6 | | |
Auto Manufacturers | | | 3,915,077 | | | | 1.5 | | |
Auto Parts | | | 3,464,448 | | | | 1.3 | | |
Banks | | | 14,180,548 | | | | 5.3 | | |
Beverages, Food & Tobacco | | | 2,585,463 | | | | 1.0 | | |
Biotechnology | | | 3,746,432 | | | | 1.3 | | |
Brewers | | | 9,294,622 | | | | 3.5 | | |
Broadline Retailers | | | 1,622,929 | | | | 0.6 | | |
Bus, Train & Employment | | | 3,173,881 | | | | 1.2 | | |
Business Support Services | | | 6,987,566 | | | | 2.7 | | |
Clothing & Accessories | | | 4,901,715 | | | | 1.9 | | |
Containers & Packaging | | | 2,716,795 | | | | 1.0 | | |
Distillers & Vintners | | | 2,657,704 | | | | 1.0 | | |
Diversified Industrials | | | 3,438,355 | | | | 1.3 | | |
Electrical Components & Equipment | | | 3,258,686 | | | | 1.2 | | |
Electronic & Electrical Equipment | | | 2,922,742 | | | | 1.1 | | |
Electronic Equipment | | | 4,952,994 | | | | 1.9 | | |
Food & Drug Retailers | | | 2,146,219 | | | | 0.8 | | |
Food Products | | | 11,091,330 | | | | 4.1 | | |
Food Retailers & Wholesalers | | | 5,858,294 | | | | 2.2 | | |
Footwear | | | 4,245,775 | | | | 1.6 | | |
General Mining | | | 1,365,872 | | | | 0.5 | | |
Holding Companies — Diversified | | | 1,087,574 | | | | 0.4 | | |
Industrial Machinery | | | 19,693,390 | | | | 7.3 | | |
Integrated Oil & Gas | | | 3,119,639 | | | | 1.2 | | |
Internet | | | 3,516,144 | | | | 1.3 | | |
Investment Companies | | | 1,578,289 | | | | 0.6 | | |
Investment Services | | | 3,298,304 | | | | 1.2 | | |
Media & Photography | | | 3,947,307 | | | | 1.5 | | |
Media Agencies | | | 5,447,760 | | | | 2.0 | | |
Medical Equipment | | | 10,672,592 | | | | 4.0 | | |
Nondurable Household Products | | | 5,832,623 | | | | 2.2 | | |
Nonlife Insurance | | | 4,060,685 | | | | 1.5 | | |
Oil Equipment & Services | | | 2,999,405 | | | | 1.1 | | |
Personal Products | | | 4,095,281 | | | | 1.5 | | |
Pharmaceuticals | | | 4,834,345 | | | | 1.8 | | |
Pharmaceuticals & Biotechnology | | | 8,363,454 | | | | 3.1 | | |
Property & Casualty Insurance | | | 7,281,317 | | | | 2.7 | | |
Recreational Products | | | 6,111,631 | | | | 2.3 | | |
48
Industry Diversification Table
Annual Report December 31, 2015
| | | Value | | % of Total
Net Assets | |
Restaurants & Bars | | $ | 1,582,943 | | | | 0.6 | % | |
Retailers — General | | | 3,727,961 | | | | 1.4 | | |
Semiconductors | | | 14,246,856 | | | | 5.3 | | |
Specialised Consumer Services | | | 3,329,229 | | | | 1.2 | | |
Speciality Chemicals | | | 4,683,846 | | | | 1.7 | | |
Speciality Finance | | | 9,426,159 | | | | 3.5 | | |
Specialized Consumer Services | | | 8,898,362 | | | | 3.3 | | |
Total Value of Investments | | | 262,657,673 | | | | 97.9 | | |
Other assets less liabilities | | | 5,593,528 | | | | 2.1 | | |
Net Assets | | $ | 268,251,201 | | | | 100.0 | % | |
49
Annual Report December 31, 2015
December 31, 2015
Baillie Gifford EAFE Choice Fund
| | | Shares | | Value | |
COMMON STOCKS — 97.5% | |
AUSTRALIA — 5.6% | |
Brambles Ltd. | | | 324,398 | | | $ | 2,716,795 | | |
Cochlear Ltd. | | | 88,631 | | | | 6,133,384 | | |
Mesoblast Ltd. (a) | | | 270,908 | | | | 362,186 | | |
Mesoblast Ltd. ADR (a) | | | 4,400 | | | | 27,984 | | |
Seek Ltd. | | | 285,161 | | | | 3,173,881 | | |
Treasury Wine Estates Ltd. | | | 442,646 | | | | 2,657,704 | | |
| | | | | | 15,071,934 | | |
CHINA — 4.0% | |
Alibaba Group Holding Ltd. ADR (a) | | | 38,079 | | | | 3,094,680 | | |
Baidu, Inc. ADR (a) | | | 18,600 | | | | 3,516,144 | | |
JD.com, Inc. ADR (a) | | | 50,300 | | | | 1,622,929 | | |
Tsingtao Brewery Co., Ltd., Class H | | | 573,943 | | | | 2,585,463 | | |
| | | | | | 10,819,216 | | |
DENMARK — 6.3% | |
Carlsberg A/S, B Shares | | | 59,191 | | | | 5,243,831 | | |
Novo Nordisk A/S, B Shares | | | 144,451 | | | | 8,363,454 | | |
Novozymes A/S, B Shares | | | 70,099 | | | | 3,356,262 | | |
| | | | | | 16,963,547 | | |
FINLAND — 1.4% | |
Kone Oyj, B Shares | | | 90,595 | | | | 3,835,909 | | |
FRANCE — 1.2% | |
Legrand SA | | | 57,609 | | | | 3,258,686 | | |
GERMANY — 2.8% | |
adidas AG | | | 43,744 | | | | 4,245,775 | | |
Zalando SE 144A (a)(b) | | | 83,939 | | | | 3,320,451 | | |
| | | | | | 7,566,226 | | |
The accompanying notes are an integral part of the financial statements.
50
Annual Report December 31, 2015
December 31, 2015
Baillie Gifford EAFE Choice Fund
| | | Shares | | Value | |
HONG KONG — 3.2% | |
BOC Hong Kong Holdings Ltd. | | | 646,960 | | | $ | 1,968,714 | | |
Cafe de Coral Holdings Ltd. | | | 563,702 | | | | 1,651,953 | | |
Jardine Matheson Holdings Ltd. | | | 71,000 | | | | 3,438,355 | | |
Jardine Strategic Holdings Ltd. | | | 39,900 | | | | 1,087,574 | | |
Li & Fung Ltd. | | | 428,782 | | | | 289,980 | | |
| | | | | | 8,436,576 | | |
INDIA — 1.5% | |
Mahindra & Mahindra Ltd. GDR | | | 204,872 | | | | 3,915,077 | | |
ISRAEL — 0.1% | |
Protalix BioTherapeutics, Inc. (a) | | | 212,364 | | | | 216,611 | | |
JAPAN — 19.8% | |
Asahi Group Holdings Ltd. | | | 129,400 | | | | 4,050,791 | | |
DENSO Corp. | | | 72,500 | | | | 3,464,448 | | |
Japan Exchange Group, Inc. | | | 211,000 | | | | 3,298,304 | | |
Kakaku.com, Inc. | | | 97,900 | | | | 1,925,654 | | |
Kao Corp. | | | 113,500 | | | | 5,832,623 | | |
MS&AD Insurance Group Holdings, Inc. | | | 248,300 | | | | 7,281,317 | | |
Olympus Corp. | | | 115,300 | | | | 4,539,208 | | |
Rakuten, Inc. | | | 336,700 | | | | 3,878,028 | | |
Shimano, Inc. | | | 39,800 | | | | 6,111,631 | | |
Shiseido Co., Ltd. | | | 183,400 | | | | 3,805,301 | | |
SMC Corp. | | | 12,300 | | | | 3,194,727 | | |
SUGI Holdings Co., Ltd. | | | 38,900 | | | | 2,146,219 | | |
THK Co., Ltd. | | | 186,500 | | | | 3,456,607 | | |
| | | | | | 52,984,858 | | |
PORTUGAL — 1.1% | |
Jeronimo Martins SGPS SA | | | 230,715 | | | | 3,002,168 | | |
SINGAPORE — 1.6% | |
United Overseas Bank Ltd. | | | 315,006 | | | | 4,342,930 | | |
SOUTH AFRICA — 2.3% | |
Clicks Group Ltd. | | | 360,599 | | | | 2,076,008 | | |
Naspers Ltd., N Shares | | | 28,879 | | | | 3,947,307 | | |
| | | | | | 6,023,315 | | |
The accompanying notes are an integral part of the financial statements.
51
Annual Report December 31, 2015
December 31, 2015
Baillie Gifford EAFE Choice Fund
| | | Shares | | Value | |
SOUTH KOREA — 2.4% | |
Samsung Electronics Co., Ltd. GDR (b) | | | 4,449 | | | $ | 2,358,793 | | |
Samsung Fire & Marine Insurance Co., Ltd. | | | 15,534 | | | | 4,060,685 | | |
| | | | | | 6,419,478 | | |
SPAIN — 3.0% | |
Corporacion Financiera Alba SA | | | 36,571 | | | | 1,578,289 | | |
Distribuidora Internacional de Alimentacion SA (a) | | | 484,243 | | | | 2,856,126 | | |
Inditex SA | | | 104,066 | | | | 3,575,116 | | |
| | | | | | 8,009,531 | | |
SWEDEN — 7.7% | |
Atlas Copco AB, B Shares | | | 197,695 | | | | 4,545,087 | | |
Investment AB Kinnevik, B Shares | | | 217,800 | | | | 6,708,520 | | |
Investor AB, B Shares | | | 73,949 | | | | 2,717,639 | | |
Svenska Handelsbanken AB, A Shares | | | 500,444 | | | | 6,646,639 | | |
| | | | | | 20,617,885 | | |
SWITZERLAND — 8.3% | |
Compagnie Financiere Richemont SA | | | 32,742 | | | | 2,343,441 | | |
Mettler-Toledo International, Inc. (a) | | | 14,605 | | | | 4,952,994 | | |
Nestle SA | | | 91,619 | | | | 6,801,360 | | |
Roche Holding AG — Genusschein | | | 16,664 | | | | 4,617,734 | | |
Schindler Holding AG, Participating Certificates | | | 21,407 | | | | 3,581,368 | | |
| | | | | | 22,296,897 | | |
TAIWAN — 2.9% | |
Hon Hai Precision Industry Co., Ltd. GDR Reg S | | | 576,365 | | | | 2,922,742 | | |
Taiwan Semiconductor Manufacturing Co., Ltd. ADR | | | 213,303 | | | | 4,852,643 | | |
| | | | | | 7,775,385 | | |
UNITED KINGDOM — 22.3% | |
ARM Holdings Plc. | | | 393,328 | | | | 5,995,152 | | |
ASOS Plc. (a) | | | 111,494 | | | | 5,665,012 | | |
Auto Trader Group Plc. 144A (a)(b) | | | 510,626 | | | | 3,329,229 | | |
BG Group Plc. | | | 215,208 | | | | 3,119,639 | | |
BHP Billiton Plc. | | | 122,479 | | | | 1,365,872 | | |
Burberry Group Plc. | | | 145,405 | | | | 2,558,274 | | |
Capita Plc. | | | 219,314 | | | | 3,902,170 | | |
Hargreaves Lansdown Plc. | | | 315,267 | | | | 6,999,165 | | |
The accompanying notes are an integral part of the financial statements.
52
Annual Report December 31, 2015
December 31, 2015
Baillie Gifford EAFE Choice Fund
| | | Shares | | Value | |
Imagination Technologies Group Plc. (a) | | | 528,839 | | | $ | 1,040,268 | | |
Intertek Group Plc. | | | 75,425 | | | | 3,085,396 | | |
John Wood Group Plc. | | | 333,035 | | | | 2,999,405 | | |
Johnson Matthey Plc. | | | 119,736 | | | | 4,683,846 | | |
Jupiter Fund Management Plc. | | | 411,592 | | | | 2,735,386 | | |
Mitchells & Butlers Plc. | | | 313,150 | | | | 1,582,943 | | |
Rightmove Plc. | | | 89,645 | | | | 5,447,760 | | |
Unilever Plc. | | | 100,017 | | | | 4,289,970 | | |
Weir Group Plc. (The) | | | 73,504 | | | | 1,079,692 | | |
| | | | | | 59,879,179 | | |
Total Common Stocks | |
(cost $249,428,651) | | | | | 261,435,408 | | |
PREFERRED STOCKS — 0.4% | |
BRAZIL — 0.4% | |
Itau Unibanco Holding SA ADR (cost $2,132,492) | | | 187,752 | | | | 1,222,265 | | |
TOTAL INVESTMENTS — 97.9% | |
(cost $251,561,143) | | | | $ | 262,657,673 | | |
Other assets less liabilities — 2.1% | | | | | 5,593,528 | | |
NET ASSETS — 100.0% | | | | $ | 268,251,201 | | |
(a) Non-income producing security.
(b) 144A — Securities are exempt from registration under Rule 144A of the Securities Act of 1933, as amended. These securities may be resold in transactions exempt from registration, normally to qualified institutional buyers. Prices are obtained daily from the London International Stock Exchange; therefore, Fair valuation is typically not required. At December 31, 2015, the net value of these securities was $9,008,473 representing 3.4% of net assets.
ADR — American Depositary Receipt.
GDR — Global Depositary Receipt.
Reg S — Regulation S ("Reg S") of the Securities Act of 1933, as amended ("1933 Act") is a safe harbor that defines when an offering of securities will be deemed to come to rest abroad and therefore is not subject to the registration obligations imposed under Section 5 of the 1933 Act. The regulation includes two safe harbor provisions: an issuer safe harbor and a resale safe harbor. In each case, the regulation demands that offers and sales of the securities be made outside the United States and that no offering participant (which includes the issuer, the banks assisting with the offer and their respective affiliates) engage in "directed" selling efforts. In the case of issuers for whose securities there is substantial U.S. market interest, the regulation also requires that no offers and sales be made to U.S. persons (including U.S. persons physically located outside the United States).
The accompanying notes are an integral part of the financial statements.
53
Statement of Assets and Liabilities
Annual Report December 31, 2015
December 31, 2015
Baillie Gifford EAFE Choice Fund
ASSETS | |
Investments, at value (cost $251,561,143) | | $ | 262,657,673 | | |
Cash | | | 3,088,727 | | |
Foreign cash, at value (cost $2,394,686) | | | 2,373,800 | | |
Dividends receivable | | | 260,075 | | |
Tax reclaims receivable | | | 241,610 | | |
Receivable for investments sold | | | 49,667 | | |
Total Assets | | | 268,671,552 | | |
LIABILITIES | |
Management fee payable | | | 237,744 | | |
Servicing fee payable | | | 115,904 | | |
Trustee fee payable | | | 3,620 | | |
Payable for investments purchased | | | 57 | | |
Accrued expenses | | | 63,026 | | |
Total Liabilities | | | 420,351 | | |
NET ASSETS | | $ | 268,251,201 | | |
COMPOSITION OF NET ASSETS | |
Paid-in capital | | $ | 265,512,932 | | |
Distributions in excess of net investment income | | | (616,313 | ) | |
Accumulated net realized loss on investments and foreign currency transactions | | | (7,717,337 | ) | |
Net unrealized appreciation in value of investments and foreign currencies | | | 11,071,919 | | |
| | | $ | 268,251,201 | | |
NET ASSET VALUE, PER SHARE | |
| Class 1 ($19,516,102 / 1,568,483 shares outstanding), unlimited authorized, no par value | | $ | 12.44 | | |
Maximum Purchase Price Per Share (Note D) | | $ | 12.47 | | |
Minimum Redemption Price Per Share (Note D) | | $ | 12.43 | | |
| Class 2 ($229,032,176 / 18,251,102 shares outstanding), unlimited authorized, no par value | | $ | 12.55 | | |
Maximum Purchase Price Per Share (Note D) | | $ | 12.58 | | |
Minimum Redemption Price Per Share (Note D) | | $ | 12.54 | | |
| Class 3 ($19,702,923 / 1,555,678 shares outstanding), unlimited authorized, no par value | | $ | 12.67 | | |
Maximum Purchase Price Per Share (Note D) | | $ | 12.70 | | |
Minimum Redemption Price Per Share (Note D) | | $ | 12.66 | | |
The accompanying notes are an integral part of the financial statements.
54
Annual Report December 31, 2015
For the Year Ended December 31, 2015
Baillie Gifford EAFE Choice Fund
INVESTMENT INCOME | |
Dividends (net of foreign withholding taxes of $501,143) | | $ | 4,733,226 | | |
Interest | | | 63 | | |
Total Investment Income | | | 4,733,289 | | |
EXPENSES | |
Management fee (Note B) | | | 843,070 | | |
Shareholder Servicing fees — Class 1 Shares (Note B) | | | 50,143 | | |
Shareholder Servicing fees — Class 2 Shares (Note B) | | | 340,442 | | |
Shareholder Servicing fees — Class 3 Shares (Note B) | | | 20,560 | | |
Fund accounting | | | 153,776 | | |
Custody | | | 55,760 | | |
Transfer agency | | | 44,114 | | |
Legal | | | 36,166 | | |
Trustees' fees | | | 13,777 | | |
Professional fees | | | 11,341 | | |
Insurance | | | 2,083 | | |
Miscellaneous | | | 6,238 | | |
Total Expenses | | | 1,577,470 | | |
Net Investment Income | | | 3,155,819 | | |
REALIZED AND UNREALIZED GAIN (LOSS) ON INVESTMENTS
AND FOREIGN CURRENCY TRANSACTIONS | |
Net realized gain (loss) from: | |
Investments | | | (4,774,724 | ) | |
Foreign currency transactions | | | 35,174 | | |
| | | | (4,739,550 | ) | |
Net change in unrealized appreciation (depreciation) on: | |
Investments | | | (416,473 | ) | |
Translation of assets and liabilities denominated in foreign currencies | | | 2,542 | | |
| | | | (413,931 | ) | |
Net realized and unrealized loss on investments and foreign currency transactions | | | (5,153,481 | ) | |
NET DECREASE IN NET ASSETS FROM OPERATIONS | | $ | (1,997,662 | ) | |
The accompanying notes are an integral part of the financial statements.
55
Statements of Changes in Net Assets
Annual Report December 31, 2015
Baillie Gifford EAFE Choice Fund
| | | For the
Year Ended
December 31,
2015 | | For the
Year Ended
December 31,
2014 | |
INCREASE (DECREASE) IN NET ASSETS FROM OPERATIONS | |
Net investment income | | $ | 3,155,819 | | | $ | 1,597,333 | | |
Net realized gain (loss) from investments and foreign currency transactions | | | (4,739,550 | ) | | | 6,387,838 | | |
Net change in unrealized appreciation (depreciation) on investments
and translation of assets and liabilities in foreign currencies | | | (413,931 | ) | | | (16,200,724 | ) | |
Net decrease in net assets from operations | | | (1,997,662 | ) | | | (8,215,553 | ) | |
DIVIDENDS AND DISTRIBUTIONS TO SHAREHOLDERS FROM: | |
Net investment income: | |
Class 1 | | | (219,253 | ) | | | (186,113 | ) | |
Class 2 | | | (2,733,303 | ) | | | (1,264,099 | ) | |
Class 3 | | | (246,548 | ) | | | (224,951 | ) | |
Total Dividends and Distributions | | | (3,199,104 | ) | | | (1,675,163 | ) | |
TRANSACTIONS IN SHARES OF BENEFICIAL INTEREST | |
Net proceeds from shares subscribed: | |
Class 2 | | | 215,409,582 | | | | 61,146,066 | | |
Class 3 | | | 1,931,937 | | | | 20,531,631 | | |
Purchase fees: | |
Class 1 | | | 25,569 | | | | 26,546 | | |
Class 2 | | | 211,071 | | | | 165,327 | | |
Class 3 | | | 25,857 | | | | 1,586 | | |
Redemption fees: | |
Class 1 | | | 877 | | | | 9,582 | | |
Class 2 | | | 10,062 | | | | 36,836 | | |
Class 3 | | | 901 | | | | 10 | | |
Dividends reinvested: | |
Class 1 | | | 219,253 | | | | 186,113 | | |
Class 2 | | | 2,733,303 | | | | 1,264,099 | | |
Class 3 | | | 246,548 | | | | 224,951 | | |
Cost of shares redeemed: | |
Class 2 | | | (93,972,196 | ) | | | (40,487,027 | ) | |
Class 3 | | | (1,502,224 | ) | | | (45,090 | ) | |
Increase in Net Assets from Transactions in Shares of Beneficial Interest | | | 125,340,540 | | | | 43,060,630 | | |
Total Increase in Net Assets | | | 120,143,774 | | | | 33,169,914 | | |
NET ASSETS | |
Beginning of year | | | 148,107,427 | | | | 114,937,513 | | |
End of year (including distributions in excess of net investment income of
$616,313 and $789,502 respectively) | | $ | 268,251,201 | | | $ | 148,107,427 | | |
| | | | | | |
The accompanying notes are an integral part of the financial statements.
56
Annual Report December 31, 2015
Baillie Gifford EAFE Choice Fund
Selected data for a Class 1 Shares outstanding throughout each period:
| | | For the
Year Ended
December 31,
2015 | | For the
Year Ended
December 31,
2014 | | For the Period
December 17, 2013(a)
through
December 31,
2013 | |
Net asset value, beginning of period | | $ | 12.32 | | | $ | 13.02 | | | $ | 12.80 | | |
From Investment Operations | |
Net investment income(b) | | | 0.17 | | | | 0.15 | | | | 0.00 | (c) | |
Net realized and unrealized gain (loss) on investments and foreign
currency transactions | | | 0.07 | (f) | | | (0.75 | ) | | | 0.56 | | |
Net increase (decrease) in net asset value from investment operations | | | 0.24 | | | | (0.60 | ) | | | 0.56 | | |
Dividends and Distributions to Shareholders | | | | | | | |
Dividends from net investment income | | | (0.14 | ) | | | (0.12 | ) | | | (0.34 | ) | |
Proceeds from Purchase Fees and Redemption Fees(b) | | | 0.02 | | | | 0.02 | | | | 0.00 | (c) | |
Net asset value, end of period | | $ | 12.44 | | | $ | 12.32 | | | $ | 13.02 | | |
Total Return | |
Total return based on net asset value(d) | | | 2.10 | % | | | (4.46 | )% | | | 4.39 | % | |
Ratios/Supplemental Data | |
Net assets, end of period (000's omitted) | | $ | 19,516 | | | $ | 19,115 | | | $ | 19,995 | | |
Ratio of net expenses to average net assets | | | 0.73 | % | | | 0.84 | % | | | 0.27 | %* | |
Ratio of net investment income to average net assets | | | 1.34 | % | | | 1.12 | % | | | 0.61 | %* | |
Portfolio turnover rate(e) | | | 16 | % | | | 23 | % | | | 25 | % | |
* Annualized.
(a) Commencement of operations.
(b) Calculated based upon average shares outstanding during the period.
(c) Amount is less than $0.005 per share.
(d) Total return is calculated assuming an initial investment made at the net asset value at the beginning of the period, reinvestment of all dividends and distributions, if any, at net asset value during the period, and redemption on the last day of the period. Total return is not annualized for periods less than one year.
(e) Portfolio turnover rate calculated at Fund level.
(f) Calculation of the net gain per share (both realized and unrealized) does not correlate to the aggregate realized and unrealized losses presented in the Statement of Operations due to the timing of sales and repurchases of Class shares in relation to fluctuating market values of the investments of the Fund.
The accompanying notes are an integral part of the financial statements.
57
Annual Report December 31, 2015
Baillie Gifford EAFE Choice Fund
Selected data for a Class 2 Shares outstanding throughout each year:
| | | For the
Year Ended
December 31,
2015 | | For the
Year Ended
December 31,
2014 | | For the
Year Ended
December 31,
2013 | | For the
Year Ended
December 31,
2012 | | For the
Year Ended
December 31,
2011 | |
Net asset value, beginning of year | | $ | 12.43 | | | $ | 13.13 | | | $ | 11.19 | | | $ | 9.45 | | | $ | 11.24 | | |
From Investment Operations | |
Net investment income(a) | | | 0.17 | | | | 0.16 | | | | 0.17 | | | | 0.23 | | | | 0.21 | | |
Net realized and unrealized gain (loss) on
investments and foreign currency transactions | | | 0.09 | (e) | | | (0.75 | ) | | | 2.19 | | | | 1.83 | | | | (1.64 | ) | |
Net increase (decrease) in net asset value from
investment operations | | | 0.26 | | | | (0.59 | ) | | | 2.36 | | | | 2.06 | | | | (1.43 | ) | |
Dividends and Distributions to Shareholders | | | | | | | | | | | | | | | | | | | | | |
Dividends from net investment income | | | (0.15 | ) | | | (0.14 | ) | | | (0.43 | ) | | | (0.32 | ) | | | (0.21 | ) | |
Distributions from net realized gain on investments | | | — | | | | — | | | | — | | | | — | | | | (0.17 | ) | |
Total Dividends and Distributions | | | (0.15 | ) | | | (0.14 | ) | | | (0.43 | ) | | | (0.32 | ) | | | (0.38 | ) | |
Proceeds from Purchase Fees and
Redemption Fees(a) | | | 0.01 | | | | 0.03 | | | | 0.01 | | | | 0.00 | (c) | | | 0.02 | | |
Net asset value, end of year | | $ | 12.55 | | | $ | 12.43 | | | $ | 13.13 | | | $ | 11.19 | | | $ | 9.45 | | |
Total Return | |
Total return based on net asset value(b) | | | 2.16 | % | | | (4.25 | )% | | | 21.20 | % | | | 21.81 | % | | | (12.54 | )% | |
Ratios/Supplemental Data | |
Net assets, end of year (000's omitted) | | $ | 229,032 | | | $ | 110,234 | | | $ | 94,942 | | | $ | 156,038 | | | $ | 115,242 | | |
Ratio of net expenses to average net assets | | | 0.65 | % | | | 0.66 | % | | | 0.67 | % | | | 0.64 | % | | | 0.65 | % | |
Ratio of net investment income to average net assets | | | 1.29 | % | | | 1.23 | % | | | 1.41 | % | | | 2.23 | % | | | 1.97 | % | |
Portfolio turnover rate(d) | | | 16 | % | | | 23 | % | | | 25 | % | | | 21 | % | | | 46 | % | |
(a) Calculated based upon average shares outstanding during the period.
(b) Total return is calculated assuming an initial investment made at the net asset value at the beginning of the period, reinvestment of all dividends and distributions, if any, at net asset value during the period, and redemption on the last day of the period. Total return is not annualized for periods less than one year.
(c) Amount is less than $0.005 per share.
(d) Portfolio turnover rate calculated at Fund level.
(e) Calculation of the net gain per share (both realized and unrealized) does not correlate to the aggregate realized and unrealized losses presented in the Statement of Operations due to the timing of sales and repurchases of Class shares in relation to fluctuating market values of the investments of the Fund.
The accompanying notes are an integral part of the financial statements.
58
Annual Report December 31, 2015
Baillie Gifford EAFE Choice Fund
Selected data for a Class 3 Shares outstanding throughout each period:
| | | For the
Year Ended
December 31,
2015 | | For the Period
July 7,
2014(e)
through
December 31,
2014 | | For the Period
January 1,
2013
through
April 16,
2013(d) | | For the Period
January 23,
2012(e)
through
December 31,
2012 | | For the Period
January 1,
2011
through
April 18,
2011(d) | |
Net asset value, beginning of period | | $ | 12.54 | | | $ | 14.08 | | | $ | 11.22 | | | $ | 10.15 | | | $ | 11.42 | | |
From Investment Operations | |
Net investment income(b) | | | 0.20 | | | | 0.05 | | | | 0.07 | | | | 0.28 | | | | 0.09 | | |
Net realized and unrealized gain (loss) on
investments and foreign currency transactions | | | 0.07 | (h) | | | (1.44 | ) | | | 0.79 | | | | 1.12 | | | | 0.15 | | |
Net increase (decrease) in net asset value from
investment operations | | | 0.27 | | | | (1.39) | | | | 0.86 | | | | 1.40 | | | | 0.24 | | |
Dividends and Distributions to Shareholders | | | | | | | | | | | | | | | | | | | | | |
Dividends from net investment income | | | (0.16 | ) | | | (0.15 | ) | | | — | | | | (0.33 | ) | | | — | | |
Proceeds from Purchase Fees and
Redemption Fees(b) | | | 0.02 | | | | 0.00 | (f) | | | 0.00 | (f) | | | 0.00 | (f) | | | 0.00 | (f) | |
Net asset value, end of period | | $ | 12.67 | | | $ | 12.54 | | | $ | 12.08 | | | $ | 11.22 | | | $ | 11.66 | | |
Total Return | |
Total return based on net asset value(c) | | | 2.25 | % | | | (9.86 | )%** | | | 7.66 | %** | | | 13.79 | %** | | | 2.10 | %** | |
Ratios/Supplemental Data | |
Net assets, end of period (000's omitted) | | $ | 19,703 | | | $ | 18,758 | | | $ | — | (d) | | $ | 27,557 | | | $ | — | (d) | |
Ratio of net expenses to average net assets | | | 0.58 | % | | | 0.58 | %* | | | 0.55 | %* | | | 0.57 | %* | | | 0.57 | %* | |
Ratio of net investment income to
average net assets | | | 1.51 | % | | | 0.71 | %* | | | 2.29 | %* | | | 2.86 | %* | | | 2.50 | %* | |
Portfolio turnover rate(g) | | | 16 | % | | | 23 | % | | | 5 | % | | | 21 | % | | | 46 | % | |
* Annualized.
** Not annualized.
(a) Commencement of investment operations.
(b) Calculated based upon average shares outstanding during the period.
(c) Total return is calculated assuming an initial investment made at the net asset value at the beginning of the period, reinvestment of all dividends and distributions, if any, at net asset value during the period, and redemption on the last day of the period. Total return is not annualized for periods less than one year.
(d) Class had no shareholders from April 19, 2011 to January 22, 2012 and from April 17, 2013 to July 6, 2014. All shares of this class were redeemed at $11.66 on April 18, 2011. New shares were issued at $10.15 on January 23, 2012. All shares of this class were redeemed at $12.08 on April 16, 2013. New shares were issued at $14.08 on July 7, 2014.
(e) Recommencement of investment operations
(f) Amount is less than $0.005 per share.
(g) Portfolio turnover rate calculated at Fund level.
(h) Calculation of the net gain per share (both realized and unrealized) does not correlate to the aggregate realized and unrealized losses presented in the Statement of Operations due to the timing of sales and repurchases of Class shares in relation to fluctuating market values of the investments of the Fund.
The accompanying notes are an integral part of the financial statements.
59
Industry Diversification Table
Annual Report December 31, 2015
December 31, 2015 (unaudited)
Baillie Gifford EAFE Pure Fund
| | | Value | | % of Total
Net Assets | |
Apparel Retailers | | $ | 10,299,857 | | | | 5.9 | % | |
Asset Managers | | | 7,177,372 | | | | 4.2 | | |
Auto Parts | | | 2,265,033 | | | | 1.3 | | |
Banks | | | 10,799,500 | | | | 6.3 | | |
Biotechnology | | | 2,701,096 | | | | 1.5 | | |
Brewers | | | 6,785,660 | | | | 3.9 | | |
Bus, Train & Employment | | | 2,370,597 | | | | 1.4 | | |
Business Support Services | | | 5,748,900 | | | | 3.3 | | |
Clothing & Accessories | | | 4,603,654 | | | | 2.7 | | |
Containers & Packaging | | | 2,220,315 | | | | 1.3 | | |
Distillers & Vintners | | | 1,870,539 | | | | 1.1 | | |
Diversified Industrials | | | 3,351,186 | | | | 1.9 | | |
Drug Retailers | | | 1,395,870 | | | | 0.8 | | |
Electrical Components & Equipment | | | 2,071,827 | | | | 1.2 | | |
Electronic Equipment | | | 3,387,909 | | | | 2.0 | | |
Food Products | | | 9,470,820 | | | | 5.5 | | |
Food Retailers & Wholesalers | | | 4,001,504 | | | | 2.4 | | |
Footwear | | | 2,940,226 | | | | 1.7 | | |
General Mining | | | 1,141,685 | | | | 0.6 | | |
Industrial Machinery | | | 14,508,232 | | | | 8.5 | | |
Integrated Oil & Gas | | | 2,366,242 | | | | 1.4 | | |
Investment Services | | | 2,208,770 | | | | 1.3 | | |
Media Agencies | | | 4,497,008 | | | | 2.6 | | |
Medical Equipment | | | 7,832,811 | | | | 4.5 | | |
Nondurable Household Products | | | 4,609,571 | | | | 2.7 | | |
Oil Equipment & Services | | | 2,010,696 | | | | 1.2 | | |
Personal Products | | | 2,636,098 | | | | 1.5 | | |
Pharmaceuticals | | | 8,921,324 | | | | 5.1 | | |
Property & Casualty Insurance | | | 4,885,491 | | | | 2.8 | | |
Recreational Products | | | 5,128,856 | | | | 3.0 | | |
Restaurants & Bars | | | 873,675 | | | | 0.5 | | |
Semiconductors | | | 4,522,763 | | | | 2.6 | | |
Speciality Chemicals | | | 4,101,260 | | | | 2.4 | | |
Speciality Finance | | | 9,939,742 | | | | 5.7 | | |
Specialized Consumer Services | | | 7,104,500 | | | | 4.1 | | |
Total Value of Investments | | | 170,750,589 | | | | 98.9 | | |
Other assets less liabilities | | | 1,908,191 | | | | 1.1 | | |
Net Assets | | $ | 172,658,780 | | | | 100.0 | % | |
60
Annual Report December 31, 2015
December 31, 2015
Baillie Gifford EAFE Pure Fund
| | | Shares | | Value | |
COMMON STOCKS — 98.9% | |
AUSTRALIA — 6.3% | |
Brambles Ltd. | | | 265,116 | | | $ | 2,220,315 | | |
Cochlear Ltd. | | | 60,793 | | | | 4,206,957 | | |
Mesoblast Ltd. (a) | | | 171,023 | | | | 228,646 | | |
Mesoblast Ltd. ADR (a) | | | 2,000 | | | | 12,720 | | |
Seek Ltd. | | | 212,989 | | | | 2,370,597 | | |
Treasury Wine Estates Ltd. | | | 311,542 | | | | 1,870,539 | | |
| | | | | | 10,909,774 | | |
DENMARK — 6.7% | |
Carlsberg A/S, B Shares | | | 38,821 | | | | 3,439,218 | | |
Novo Nordisk A/S, B Shares | | | 98,605 | | | | 5,709,053 | | |
Novozymes A/S, B Shares | | | 51,374 | | | | 2,459,730 | | |
| | | | | | 11,608,001 | | |
FINLAND — 1.6% | |
Kone Oyj, B Shares | | | 64,353 | | | | 2,724,789 | | |
FRANCE — 1.2% | |
Legrand SA | | | 36,627 | | | | 2,071,827 | | |
GERMANY — 3.3% | |
adidas AG | | | 30,293 | | | | 2,940,226 | | |
Zalando SE 144A (a)(b) | | | 69,281 | | | | 2,740,612 | | |
| | | | | | 5,680,838 | | |
HONG KONG — 3.2% | |
BOC Hong Kong Holdings Ltd. | | | 650,500 | | | | 1,979,486 | | |
Jardine Matheson Holdings Ltd. | | | 69,200 | | | | 3,351,186 | | |
Li & Fung Ltd. | | | 204,000 | | | | 137,962 | | |
| | | | | | 5,468,634 | | |
ISRAEL — 0.0% | |
Protalix BioTherapeutics, Inc. (a) | | | 45,400 | | | | 46,308 | | |
JAPAN — 22.7% | |
Asahi Group Holdings Ltd. | | | 106,900 | | | | 3,346,442 | | |
DENSO Corp. | | | 47,400 | | | | 2,265,033 | | |
The accompanying notes are an integral part of the financial statements.
61
Annual Report December 31, 2015
December 31, 2015
Baillie Gifford EAFE Pure Fund
| | | Shares | | Value | |
Japan Exchange Group, Inc. | | | 141,300 | | | $ | 2,208,770 | | |
Kakaku.com, Inc. | | | 73,700 | | | | 1,449,650 | | |
Kao Corp. | | | 89,700 | | | | 4,609,571 | | |
MS&AD Insurance Group Holdings, Inc. | | | 166,600 | | | | 4,885,491 | | |
Olympus Corp. | | | 92,100 | | | | 3,625,854 | | |
Rakuten, Inc. | | | 267,600 | | | | 3,082,151 | | |
Shimano, Inc. | | | 33,400 | | | | 5,128,856 | | |
Shiseido Co., Ltd. | | | 120,400 | | | | 2,498,136 | | |
SMC Corp. | | | 8,300 | | | | 2,155,791 | | |
SUGI Holdings Co., Ltd. | | | 25,300 | | | | 1,395,870 | | |
THK Co., Ltd. | | | 138,400 | | | | 2,565,117 | | |
| | | | | | 39,216,732 | | |
PORTUGAL — 1.2% | |
Jeronimo Martins SGPS SA | | | 154,294 | | | | 2,007,743 | | |
SINGAPORE — 2.1% | |
United Overseas Bank Ltd. | | | 267,333 | | | | 3,685,671 | | |
SPAIN — 3.4% | |
Distribuidora Internacional de Alimentacion SA (a) | | | 338,033 | | | | 1,993,761 | | |
Inditex SA | | | 112,828 | | | | 3,876,128 | | |
| | | | | | 5,869,889 | | |
SWEDEN — 10.6% | |
Atlas Copco AB, A Shares | | | 95,123 | | | | 2,332,873 | | |
Atlas Copco AB, B Shares | | | 35,100 | | | | 806,963 | | |
Investment AB Kinnevik, B Shares | | | 159,551 | | | | 4,914,375 | | |
Investor AB, B Shares | | | 136,744 | | | | 5,025,367 | | |
Svenska Handelsbanken AB, A Shares | | | 386,579 | | | | 5,134,343 | | |
| | | | | | 18,213,921 | | |
SWITZERLAND — 10.3% | |
Compagnie Financiere Richemont SA | | | 35,419 | | | | 2,535,042 | | |
Mettler-Toledo International, Inc. (a) | | | 9,990 | | | | 3,387,909 | | |
Nestle SA | | | 73,796 | | | | 5,478,265 | | |
Roche Holding AG — Genusschein | | | 11,425 | | | | 3,165,963 | | |
Schindler Holding AG, Participating Certificates | | | 19,051 | | | | 3,187,212 | | |
| | | | | | 17,754,391 | | |
The accompanying notes are an integral part of the financial statements.
62
Annual Report December 31, 2015
December 31, 2015
Baillie Gifford EAFE Pure Fund
| | | Shares | | Value | |
UNITED KINGDOM — 26.3% | |
ARM Holdings Plc. | | | 257,523 | | | $ | 3,925,196 | | |
ASOS Plc. (a) | | | 72,488 | | | | 3,683,117 | | |
Auto Trader Group Plc. 144A (a)(b) | | | 394,592 | | | | 2,572,699 | | |
BG Group Plc. | | | 163,235 | | | | 2,366,242 | | |
BHP Billiton Plc. | | | 102,376 | | | | 1,141,685 | | |
Burberry Group Plc. | | | 117,574 | | | | 2,068,612 | | |
Capita Plc. | | | 172,019 | | | | 3,060,668 | | |
Hargreaves Lansdown Plc. | | | 232,150 | | | | 5,153,905 | | |
Imagination Technologies Group Plc. (a) | | | 303,784 | | | | 597,567 | | |
Intertek Group Plc. | | | 65,716 | | | | 2,688,232 | | |
John Wood Group Plc. | | | 223,255 | | | | 2,010,696 | | |
Johnson Matthey Plc. | | | 104,843 | | | | 4,101,260 | | |
Jupiter Fund Management Plc. | | | 304,470 | | | | 2,023,467 | | |
Mitchells & Butlers Plc. | | | 172,837 | | | | 873,675 | | |
Rightmove Plc. | | | 74,000 | | | | 4,497,008 | | |
Unilever Plc. | | | 93,083 | | | | 3,992,555 | | |
Weir Group Plc. (The) | | | 50,071 | | | | 735,487 | | |
| | | | | | 45,492,071 | | |
TOTAL INVESTMENTS — 98.9% | |
(cost $175,949,798) | | | | $ | 170,750,589 | | |
Other assets less liabilities — 1.1% | | | | | 1,908,191 | | |
NET ASSETS — 100.0% | | | | $ | 172,658,780 | | |
(a) Non-income producing security.
(b) 144A — Securities are exempt from registration under Rule 144A of the Securities Act of 1933, as amended. These securities may be resold in transactions exempt from registration, normally to qualified institutional buyers. Prices are obtained daily from the London International Stock Exchange; therefore, Fair valuation is typically not required. At December 31, 2015, the net value of these securities was $5,313,311 representing 3.1% of net assets.
ADR — American Depositary Receipt.
The accompanying notes are an integral part of the financial statements.
63
Statement of Assets and Liabilities
Annual Report December 31, 2015
December 31, 2015
Baillie Gifford EAFE Pure Fund
ASSETS | |
Investments, at value (cost $175,949,798) | | $ | 170,750,589 | | |
Cash | | | 1,391,940 | | |
Foreign cash, at value (cost $453,006) | | | 451,090 | | |
Receivable for investments sold | | | 18,909 | | |
Dividends receivable | | | 148,702 | | |
Tax reclaims receivable | | | 120,740 | | |
Total Assets | | | 172,881,970 | | |
LIABILITIES | |
Management fee payable | | | 128,414 | | |
Servicing fee payable | | | 62,373 | | |
Trustee fee payable | | | 1,887 | | |
Accrued expenses | | | 30,516 | | |
Total Liabilities | | | 223,190 | | |
NET ASSETS | | $ | 172,658,780 | | |
COMPOSITION OF NET ASSETS | |
Paid-in capital | | $ | 180,037,608 | | |
Distributions in excess of net investment income | | | (109,385 | ) | |
Accumulated net realized loss on investments and foreign currency transactions | | | (2,062,931 | ) | |
Net unrealized depreciation in value of investments and foreign currencies | | | (5,206,512 | ) | |
| | | $ | 172,658,780 | | |
NET ASSET VALUE, PER SHARE | |
| Class 2 ($172,658,780 / 17,794,489 shares outstanding), unlimited authorized, no par value | | $ | 9.70 | | |
Maximum Purchase Price Per Share (Note D) | | $ | 9.72 | | |
Minimum Redemption Price Per Share (Note D) | | $ | 9.69 | | |
The accompanying notes are an integral part of the financial statements.
64
Annual Report December 31, 2015
For the Year Ended December 31, 2015
Baillie Gifford EAFE Pure Fund
INVESTMENT INCOME | |
Dividends (net of foreign withholding taxes of $177,318) | | $ | 2,256,376 | | |
Total Investment Income | | | 2,256,376 | | |
EXPENSES | |
Management fee (Note B) | | | 390,754 | | |
Shareholder Servicing fees — Class 2 Shares (Note B) | | | 189,795 | | |
Fund accounting | | | 86,959 | | |
Custody | | | 25,722 | | |
Transfer agency | | | 14,617 | | |
Legal | | | 12,607 | | |
Trustees' fees | | | 6,660 | | |
Professional fees | | | 3,867 | | |
Insurance | | | 796 | | |
Miscellaneous | | | 5,261 | | |
Total Expenses | | | 737,038 | | |
Net Investment Income | | | 1,519,338 | | |
REALIZED AND UNREALIZED GAIN (LOSS) ON INVESTMENTS
AND FOREIGN CURRENCY TRANSACTIONS | |
Net realized gain (loss) from: | |
Investments | | | (1,982,138 | ) | |
Foreign currency transactions | | | 50,820 | | |
| | | | (1,931,318 | ) | |
Net change in unrealized appreciation (depreciation) on: | |
Investments | | | (2,243,601 | ) | |
Translation of assets and liabilities denominated in foreign currencies | | | (6,002 | ) | |
| | | | (2,249,603 | ) | |
Net realized and unrealized loss on investments and foreign currency transactions | | | (4,180,921 | ) | |
NET DECREASE IN NET ASSETS FROM OPERATIONS | | $ | (2,661,583 | ) | |
The accompanying notes are an integral part of the financial statements.
65
Statements of Changes in Net Assets
Annual Report December 31, 2015
Baillie Gifford EAFE Pure Fund
| | | For the
Year Ended
December 31,
2015 | | For the Period
April 15, 2014(a)
through
December 31,
2014 | |
INCREASE (DECREASE) IN NET ASSETS FROM OPERATIONS | |
Net investment income | | $ | 1,519,338 | | | $ | 381,181 | | |
Net realized loss from investments and foreign currency transactions | | | (1,931,318 | ) | | | (201,488 | ) | |
Net change in unrealized appreciation (depreciation) on investments
and translation of assets and liabilities in foreign currencies | | | (2,249,603 | ) | | | (2,956,909 | ) | |
Net decrease in net assets from operations | | | (2,661,583 | ) | | | (2,777,216 | ) | |
DIVIDENDS AND DISTRIBUTIONS TO SHAREHOLDERS FROM: | |
Net investment income: | |
Class 2 | | | (1,657,148 | ) | | | (263,706 | ) | |
Capital gains: | |
Class 2 | | | — | | | | (19,175 | ) | |
Total Dividends and Distributions | | | (1,657,148 | ) | | | (282,881 | ) | |
TRANSACTIONS IN SHARES OF BENEFICIAL INTEREST | |
Net proceeds from shares subscribed: | |
Class 2 | | | 131,717,335 | | | | 45,862,000 | | |
Purchase fees: | |
Class 2 | | | 380,244 | | | | 138,000 | | |
Dividends reinvested: | |
Class 2 | | | 1,657,148 | | | | 282,881 | | |
Increase in Net Assets from Transactions in Shares of Beneficial Interest | | | 133,754,727 | | | | 46,282,881 | | |
Total Increase in Net Assets | | | 129,435,996 | | | | 43,222,784 | | |
NET ASSETS | |
Beginning of period | | | 43,222,784 | | | | — | | |
End of period (including distributions in excess of net investment income
of $109,385 and $22,395, respectively) | | $ | 172,658,780 | | | $ | 43,222,784 | | |
(a) Commencement of investment operations
The accompanying notes are an integral part of the financial statements.
66
Annual Report December 31, 2015
Baillie Gifford EAFE Pure Fund
Selected data for a Class 2 Share outstanding throughout each period:
| | | For the
Year Ended
December 31,
2015 | | For the Period
April 15, 2014(a)
through
December 31,
2014 | |
Net asset value, beginning of period | | $ | 9.36 | | | $ | 10.00 | | |
From Investment Operations | |
Net investment income(b) | | | 0.13 | | | | 0.08 | | |
Net realized and unrealized gain (loss) on investments and foreign currency transactions | | | 0.27 | (f) | | | (0.69 | ) | |
Net increase (decrease) in net asset value from investment operations | | | 0.40 | | | | (0.61 | ) | |
Dividends and Distributions to Shareholders | | | | | |
Dividends from net investment income | | | (0.09 | ) | | | (0.06 | ) | |
Distributions from net realized gain on investments | | | — | | | | (0.00 | )(c) | |
Total Dividends and Distributions | | | (0.09 | ) | | | (0.06 | ) | |
Proceeds from Purchase Fees and Redemption Fees(b) | | | 0.03 | | | | 0.03 | | |
Net asset value, end of period | | $ | 9.70 | | | $ | 9.36 | | |
Total Return | |
Total return based on net asset value(d) | | | 4.61 | % | | | (5.79 | )% | |
Ratios/Supplemental Data | |
Net assets, end of period (000's omitted) | | $ | 172,659 | | | $ | 43,223 | | |
Ratio of net expenses to average net assets, before waiver | | | 0.66 | % | | | 0.70 | %* | |
Ratio of net expenses to average net assets, after waiver | | | 0.66 | % | | | 0.67 | %* | |
Ratio of net investment income to average net assets | | | 1.36 | % | | | 1.17 | %* | |
Portfolio turnover rate(e) | | | 18 | % | | | 5 | % | |
* Annualized.
(a) Commencement of investment operations.
(b) Calculated based upon average shares outstanding during the period.
(c) Amount is less than $0.005 per share.
(d) Total return is calculated assuming an initial investment made at the net asset value at the beginning of the period, reinvestment of all dividends and distributions, if any, at net asset value during the period, and redemption on the last day of the period. Total return is not annualized for periods less than one year.
(e) Portfolio turnover rate calculated at Fund level.
(f) Calculation of the net gain per share (both realized and unrealized) does not correlate to the aggregate realized and unrealized losses presented in the Statement of Operations due to the timing of sales and repurchases of Class shares in relation to fluctuating market values of the investments of the Fund.
The accompanying notes are an integral part of the financial statements.
67
Industry Diversification Table
Annual Report December 31, 2015
December 31, 2015 (unaudited)
Baillie Gifford Emerging Markets Fund
| | | Value | | % of Total
Net Assets | |
Aerospace/Defense | | $ | 13,037,420 | | | | 1.2 | % | |
Auto Manufacturers | | | 17,573,785 | | | | 1.6 | | |
Automobiles | | | 8,970,362 | | | | 0.8 | | |
Automobiles & Parts | | | 16,747,878 | | | | 1.5 | | |
Banks | | | 58,433,801 | | | | 5.2 | | |
Biotechnology | | | 5,361,285 | | | | 0.5 | | |
Broadcasting & Entertainment | | | 9,850,047 | | | | 0.9 | | |
Broadline Retailers | | | 52,496,483 | | | | 4.8 | | |
Building Materials & Fixtures | | | 23,025,043 | | | | 2.1 | | |
Commodity Chemicals | | | 25,364,988 | | | | 2.3 | | |
Computer Hardware | | | 7,251,504 | | | | 0.7 | | |
Computer Services | | | 29,910,278 | | | | 2.7 | | |
Computers | | | 14,758,446 | | | | 1.3 | | |
Construction & Building Materials | | | 8,357,267 | | | | 0.7 | | |
Diversified Financial Services | | | 32,536,609 | | | | 3.0 | | |
Electrical Components & Equipment | | | 10,837,918 | | | | 1.0 | | |
Electronic & Electrical Equipment | | | 76,827,605 | | | | 6.9 | | |
Electronic Equipment | | | 24,727,585 | | | | 2.2 | | |
Food Products | | | 6,892,606 | | | | 0.6 | | |
Household Goods | | | 12,713,187 | | | | 1.2 | | |
Industrial Engineering | | | 5,901,583 | | | | 0.6 | | |
Insurance | | | 49,193,190 | | | | 4.5 | | |
Internet | | | 121,791,926 | | | | 11.0 | | |
Leisure Goods | | | 12,521,736 | | | | 1.1 | | |
Life Insurance | | | 53,784,468 | | | | 4.9 | | |
Media & Photography | | | 34,312,004 | | | | 3.1 | | |
Nonlife Insurance | | | 27,488,473 | | | | 2.5 | | |
Oil & Gas | | | 30,505,698 | | | | 2.8 | | |
Pharmaceuticals | | | 29,880,529 | | | | 2.7 | | |
Property & Casualty Insurance | | | 8,880,795 | | | | 0.8 | | |
Real Estate Holding & Development | | | 39,892,119 | | | | 3.6 | | |
Renewable Energy Equipment | | | 4,300,882 | | | | 0.4 | | |
Semiconductors | | | 63,497,335 | | | | 5.8 | | |
Software | | | 20,595,651 | | | | 1.9 | | |
Software & Computer Services | | | 4,758,078 | | | | 0.4 | | |
Specialized Consumer Services | | | 47,850,394 | | | | 4.4 | | |
Technology Hardware & Equipment | | | 28,994,813 | | | | 2.6 | | |
68
Industry Diversification Table
Annual Report December 31, 2015
| | | Value | | % of Total
Net Assets | |
Telecommunications | | $ | 15,115,773 | | | | 1.4 | % | |
Toys | | | 8,953,250 | | | | 0.8 | | |
Transportation Services | | | 6,886,537 | | | | 0.6 | | |
Travel & Tourism | | | 14,207,743 | | | | 1.3 | | |
Total Value of Investments | | | 1,084,987,074 | | | | 98.4 | | |
Other assets less liabilities | | | 17,554,938 | | | | 1.6 | | |
Net Assets | | $ | 1,102,542,012 | | | | 100.0 | % | |
69
Annual Report December 31, 2015
December 31, 2015
Baillie Gifford Emerging Markets Fund
| | | Shares | | Value | |
COMMON STOCKS — 95.3% | |
ARGENTINA — 1.1% | |
MercadoLibre, Inc. | | | 105,134 | | | $ | 12,021,022 | | |
BRAZIL — 1.2% | |
Embraer SA ADR | | | 441,348 | | | | 13,037,420 | | |
CHINA — 27.9% | |
Alibaba Group Holding Ltd. ADR (a) | | | 588,783 | | | | 47,850,394 | | |
Baidu, Inc. ADR (a) | | | 188,846 | | | | 35,699,448 | | |
China Pacific Insurance Group Co. Ltd., Class H | | | 2,584,800 | | | | 10,577,964 | | |
China Vanke Co. Ltd., Class H | | | 7,534,300 | | | | 22,262,498 | | |
Ctrip.com International Ltd. ADR (a) | | | 306,664 | | | | 14,207,743 | | |
Geely Automobile Holdings Ltd. | | | 31,695,000 | | | | 16,747,878 | | |
JD.com, Inc. ADR (a) | | | 1,219,933 | | | | 39,361,138 | | |
Legend Holdings Corp. 144A, Class H (a)(b) | | | 2,049,100 | | | | 7,251,504 | | |
Ping An Insurance Group Co. of China Ltd., Class H | | | 7,007,500 | | | | 38,644,295 | | |
Tencent Holdings Ltd. | | | 2,725,000 | | | | 53,355,462 | | |
ZTE Corp., Class H | | | 9,372,000 | | | | 21,275,278 | | |
| | | | | | 307,233,602 | | |
EGYPT — 0.6% | |
Egyptian Financial Group — Hermes Holding SAE (a) | | | 5,660,464 | | | | 6,349,978 | | |
HONG KONG — 10.1% | |
AAC Technologies Holdings, Inc. | | | 1,666,000 | | | | 10,837,918 | | |
Brilliance China Automotive Holdings Ltd. | | | 7,172,000 | | | | 8,970,362 | | |
China Overseas Land & Investment Ltd. | | | 5,064,000 | | | | 17,629,621 | | |
China Taiping Insurance Holdings Co., Ltd. (a) | | | 4,152,010 | | | | 12,744,641 | | |
CSPC Pharmaceutical Group Ltd. | | | 6,302,000 | | | | 6,424,940 | | |
GCL-Poly Energy Holdings Ltd. | | | 28,727,000 | | | | 4,271,229 | | |
Haier Electronics Group Co., Ltd. | | | 6,298,300 | | | | 12,713,187 | | |
Kingsoft Corp. Ltd. | | | 3,687,000 | | | | 8,953,250 | | |
Lenovo Group Ltd. | | | 14,624,000 | | | | 14,758,446 | | |
Sino Biopharmaceutical Ltd. | | | 7,676,000 | | | | 6,940,000 | | |
Sunny Optical Technology Group Co. Ltd. | | | 3,034,000 | | | | 6,919,821 | | |
| | | | | | 111,163,415 | | |
The accompanying notes are an integral part of the financial statements.
70
Annual Report December 31, 2015
December 31, 2015
Baillie Gifford Emerging Markets Fund
| | | Shares | | Value | |
INDIA — 17.8% | |
Ambuja Cements Ltd. | | | 1,877,024 | | | $ | 5,740,095 | | |
Asian Paints Ltd. | | | 842,582 | | | | 11,224,634 | | |
Axis Bank Ltd. | | | 2,020,399 | | | | 13,628,113 | | |
Cipla Ltd. | | | 517,074 | | | | 5,068,802 | | |
HCL Technologies Ltd. | | | 1,219,106 | | | | 15,722,741 | | |
Housing Development Finance Corp., Ltd. | | | 1,376,806 | | | | 26,186,631 | | |
ICICI Bank Ltd. | | | 4,488,482 | | | | 17,728,315 | | |
Lupin Ltd. | | | 413,721 | | | | 11,446,787 | | |
Mahindra & Mahindra Ltd. | | | 915,483 | | | | 17,573,785 | | |
Oracle Financial Services Software Ltd. | | | 86,367 | | | | 4,872,910 | | |
Reliance Industries Ltd. | | | 1,992,352 | | | | 30,505,698 | | |
Tata Consultancy Services Ltd. | | | 430,770 | | | | 15,836,645 | | |
Tech Mahindra Ltd. | | | 1,792,506 | | | | 14,073,633 | | |
UltraTech Cement Ltd. | | | 144,560 | | | | 6,060,314 | | |
| | | | | | 195,669,103 | | |
MALAYSIA — 1.2% | |
Public Bank Bhd | | | 3,166,040 | | | | 13,641,886 | | |
MEXICO — 2.8% | |
Cemex SAB de CV ADR, Participating Certificates (a) | | | 1,500,407 | | | | 8,357,267 | | |
Grupo Televisa SAB ADR | | | 362,001 | | | | 9,850,047 | | |
Wal-Mart de Mexico SAB de CV | | | 5,205,360 | | | | 13,135,345 | | |
| | | | | | 31,342,659 | | |
POLAND — 0.8% | |
Powszechny Zaklad Ubezpieczen SA | | | 1,029,420 | | | | 8,880,795 | | |
SOUTH AFRICA — 3.1% | |
Naspers Ltd., N Shares | | | 251,031 | | | | 34,312,004 | | |
SOUTH KOREA — 12.8% | |
Dongbu Insurance Co., Ltd. | | | 232,106 | | | | 13,887,245 | | |
Hyundai Marine & Fire Insurance Co., Ltd. | | | 287,225 | | | | 8,800,588 | | |
Interpark Holdings Corp. (a) | | | 510,412 | | | | 4,758,078 | | |
LG Chem Ltd. | | | 72,412 | | | | 19,991,734 | | |
Medy-Tox, Inc. | | | 12,407 | | | | 5,361,285 | | |
NAVER Corp. | | | 22,538 | | | | 12,568,077 | | |
NCSoft Corp. | | | 45,197 | | | | 8,147,917 | | |
The accompanying notes are an integral part of the financial statements.
71
Annual Report December 31, 2015
December 31, 2015
Baillie Gifford Emerging Markets Fund
| | | Shares | | Value | |
Orion Corp. | | | 6,978 | | | $ | 6,892,606 | | |
Samsung Electronics Co., Ltd. | | | 29,980 | | | | 31,976,137 | | |
Samsung Fire & Marine Insurance Co., Ltd. | | | 52,031 | | | | 13,601,228 | | |
Samsung SDI Co., Ltd. | | | 157,235 | | | | 15,115,773 | | |
| | | | | | 141,100,668 | | |
TAIWAN — 15.3% | |
Advantech Co., Ltd. | | | 1,205,463 | | | | 7,719,535 | | |
Airtac International Group | | | 681,300 | | | | 3,135,327 | | |
China Life Insurance Co., Ltd. | | | 36,206,010 | | | | 27,647,961 | | |
CTBC Financial Holding Co. Ltd. | | | 9,536,000 | | | | 4,882,445 | | |
Delta Electronics, Inc. | | | 3,786,000 | | | | 17,807,764 | | |
Fubon Financial Holding Co. Ltd. | | | 3,354,000 | | | | 4,562,209 | | |
Himax Technologies, Inc. ADR | | | 1,006,295 | | | | 8,251,619 | | |
Hiwin Technologies Corp. | | | 706,516 | | | | 2,766,256 | | |
Hon Hai Precision Industry Co., Ltd. | | | 9,987,680 | | | | 24,442,828 | | |
Largan Precision Co., Ltd. | | | 183,000 | | | | 12,521,736 | | |
MediaTek, Inc. | | | 1,786,000 | | | | 13,508,409 | | |
Taiwan Semiconductor Manufacturing Co., Ltd. | | | 9,674,310 | | | | 41,737,307 | | |
| | | | | | 168,983,396 | | |
THAILAND — 0.6% | |
Airports of Thailand PCL NVDR | | | 720,300 | | | | 6,886,537 | | |
Total Common Stocks | |
(cost $1,031,299,091) | | | | | 1,050,622,485 | | |
PREFERRED STOCKS — 3.1% | |
BRAZIL — 0.8% | |
Banco Bradesco SA | | | 1,760,277 | | | | 8,517,479 | | |
SOUTH KOREA — 2.3% | |
LG Chem Ltd. | | | 25,719 | | | | 5,373,254 | | |
Samsung Electronics Co., Ltd. | | | 22,078 | | | | 20,408,640 | | |
| | | | | | 25,781,894 | | |
Total Preferred Stocks | |
(cost $35,902,696) | | | | | 34,299,373 | | |
The accompanying notes are an integral part of the financial statements.
72
Annual Report December 31, 2015
December 31, 2015
Baillie Gifford Emerging Markets Fund
| | | Shares | | Value | |
RIGHTS — 0.0% | |
BRAZIL — 0.0% | |
Banco Bradesco SA(a), expiring on 2/28/16 | | | 57,662 | | | $ | 35,563 | | |
HONG KONG — 0.0% | |
GCL-Poly Energy Holdings, Ltd. (a), expiring on 1/20/16 | | | 5,745,400 | | | | 29,653 | | |
Total Rights | |
(cost $0) | | | | | 65,216 | | |
TOTAL INVESTMENTS — 98.4% | |
(cost $1,067,201,787) | | | | $ | 1,084,987,074 | | |
Other assets less liabilities — 1.6% | | | | | 17,554,938 | | |
NET ASSETS — 100.0% | | | | $ | 1,102,542,012 | | |
(a) Non-income producing security.
(b) 144A — Securities are exempt from registration under Rule 144A of the Securities Act of 1933, as amended. These securities may be resold in transactions exempt from registration, normally to qualified institutional buyers. Prices are obtained daily from the London International Stock Exchange; therefore, Fair valuation is typically not required. At December 31, 2015, the net value of these securities was $7,251,504 representing 0.7% of net assets.
ADR — American Depositary Receipt.
NVDR — Non-Voting Depositary Receipt.
The accompanying notes are an integral part of the financial statements.
73
Statement of Assets and Liabilities
Annual Report December 31, 2015
December 31, 2015
Baillie Gifford Emerging Markets Fund
ASSETS | |
Investments, at value (cost $1,067,201,787) | | $ | 1,084,987,074 | | |
Cash | | | 17,260,273 | | |
Foreign cash, at value (cost $351,739) | | | 352,562 | | |
Dividends receivable | | | 2,270,631 | | |
Tax reclaims receivable | | | 983 | | |
Receivable for Indian capital gains tax | | | 219,742 | | |
Total Assets | | | 1,105,091,265 | | |
LIABILITIES | |
Payable for deferred Indian capital gains tax | | | 1,129,684 | | |
Management fee payable | | | 1,102,531 | | |
Servicing fee payable | | | 72,518 | | |
Trustee fee payable | | | 10,333 | | |
Accrued expenses | | | 234,187 | | |
Total Liabilities | | | 2,549,253 | | |
NET ASSETS | | $ | 1,102,542,012 | | |
COMPOSITION OF NET ASSETS | |
Paid-in capital | | $ | 1,111,277,962 | | |
Distributions in excess of net investment income | | | (291,836 | ) | |
Accumulated net realized loss on investments and foreign currency transactions | | | (25,039,837 | ) | |
Net unrealized appreciation in value of investments and foreign currencies
(including deferred Indian capital gains tax) | | | 16,595,723 | | |
| | $ | 1,102,542,012 | | |
NET ASSET VALUE, PER SHARE | |
| Class 2 ($69,091,603 / 4,643,157 shares outstanding), unlimited authorized, no par value | | $ | 14.88 | | |
Maximum Purchase Price Per Share (Note D) | | $ | 14.92 | | |
Minimum Redemption Price Per Share (Note D) | | $ | 14.83 | | |
| Class 4 ($98,273,204 / 6,500,627 shares outstanding), unlimited authorized, no par value | | $ | 15.12 | | |
Maximum Purchase Price Per Share (Note D) | | $ | 15.17 | | |
Minimum Redemption Price Per Share (Note D) | | $ | 15.07 | | |
| Class 5 ($935,177,205 / 60,994,792 shares outstanding), unlimited authorized, no par value | | $ | 15.33 | | |
Maximum Purchase Price Per Share (Note D) | | $ | 15.38 | | |
Minimum Redemption Price Per Share (Note D) | | $ | 15.28 | | |
The accompanying notes are an integral part of the financial statements.
74
Annual Report December 31, 2015
For the Year Ended December 31, 2015
Baillie Gifford Emerging Markets Fund
INVESTMENT INCOME | |
Dividends (net of foreign withholding taxes of $1,231,172) | | $ | 9,683,264 | | |
Total Investment Income | | | 9,683,264 | | |
EXPENSES | |
Management fee (Note B) | | | 3,276,856 | | |
Shareholder Servicing fees — Class 2 Shares (Note B)(a) | | | 82,252 | | |
Shareholder Servicing fees — Class 4 Shares (Note B) | | | 11,275 | | |
Shareholder Servicing fees — Class 5 Shares (Note B)(b) | | | 106,259 | | |
Custody | | | 367,115 | | |
Fund accounting | | | 311,445 | | |
Legal | | | 52,983 | | |
Professional fees | | | 38,574 | | |
Trustees' fees | | | 31,770 | | |
Transfer agency | | | 30,183 | | |
Insurance | | | 5,656 | | |
Miscellaneous | | | 8,328 | | |
Total Expenses | | | 4,322,696 | | |
Net Investment Income | | | 5,360,568 | | |
REALIZED AND UNREALIZED GAIN (LOSS) ON INVESTMENTS
AND FOREIGN CURRENCY TRANSACTIONS | |
Net realized loss from: | |
Investments (net of deferred Indian capital gains tax $209,442) | | | (1,646,159 | ) | |
Foreign currency transactions | | | (556,899 | ) | |
| | | (2,203,058 | ) | |
Net change in unrealized appreciation (depreciation) on: | |
Investments (net of deferred Indian capital gains tax $757,042) | | | (65,938,141 | ) | |
Translation of assets and liabilities denominated in foreign currencies | | | (20,187 | ) | |
| | | (65,958,328 | ) | |
Net realized and unrealized loss on investments and foreign currency transactions | | | (68,161,386 | ) | |
NET DECREASE IN NET ASSETS FROM OPERATIONS | | $ | (62,800,818 | ) | |
(a) Class II shares were converted into Class 2 shares.
(b) Class III shares were converted into Class 5 shares.
The accompanying notes are an integral part of the financial statements.
75
Statements of Changes in Net Assets
Annual Report December 31, 2015
Baillie Gifford Emerging Markets Fund
| | | For the
Year Ended
December 31,
2015 | | For the
Year Ended
December 31,
2014 | |
INCREASE (DECREASE) IN NET ASSETS FROM OPERATIONS | |
Net investment income | | $ | 5,360,568 | | | $ | 4,498,967 | | |
Net realized loss from investments and foreign currency transactions | | | (2,203,058 | ) | | | (8,931,554 | ) | |
Net change in unrealized appreciation (depreciation) on investments
and translation of assets and liabilities in foreign currencies | | | (65,958,328 | ) | | | 892,139 | | |
Net decrease in net assets from operations | | | (62,800,818 | ) | | | (3,540,448 | ) | |
DIVIDENDS AND DISTRIBUTIONS TO SHAREHOLDERS FROM: | |
Net investment income: | |
Class 2(a) | | | (773,521 | ) | | | — | | |
Class 4 | | | (399,288 | ) | | | — | | |
Class 5(b) | | | (7,666,337 | ) | | | (719,470 | ) | |
Capital gains: | |
Class 2(a) | | | (18,566 | ) | | | — | | |
Class 4 | | | (25,969 | ) | | | — | | |
Class 5(b) | | | (243,558 | ) | | | — | | |
Total Dividends and Distributions | | | (9,127,239 | ) | | | (719,470 | ) | |
TRANSACTIONS IN SHARES OF BENEFICIAL INTEREST | |
Net proceeds from shares subscribed: | |
Class 2(a) | | | 105,642,000 | | | | 9,232,291 | | |
Class 4 | | | 99,700,000 | | | | — | | |
Class 5(b) | | | 983,566,063 | | | | 186,487,716 | | |
Purchase fees: | |
Class 2(a) | | | 216,847 | | | | 9,767 | | |
Class 4 | | | 266,494 | | | | — | | |
Class 5(b) | | | 1,674,659 | | | | 470,589 | | |
Redemption fees: | |
Class 2(a) | | | 8,107 | | | | 643 | | |
Class 4 | | | — | | | | — | | |
Class 5(b) | | | 82,240 | | | | 59,170 | | |
Dividends reinvested: | |
Class 2(a) | | | 792,088 | | | | — | | |
Class 4 | | | 425,257 | | | | — | | |
Class 5(b) | | | 7,909,895 | | | | 719,470 | | |
Cost of shares redeemed: | |
Class 2(a) | | | (25,813,476 | ) | | | (59,760,469 | ) | |
Class III | | | (485,066,064 | ) | | | (16,328,088 | ) | |
Increase in Net Assets from Transactions in Shares of Beneficial Interest | | | 689,404,110 | | | | 120,891,089 | | |
Total Increase (Decrease) in Net Assets | | | 617,476,053 | | | | 116,631,171 | | |
NET ASSETS | |
Beginning of year | | | 485,065,959 | | | | 368,434,788 | | |
End of year (including undistributed (distributions in excess of)
net investment income of ($291,836) and $3,953,078, respectively) | | $ | 1,102,542,012 | | | $ | 485,065,959 | | |
(a) Class II shares were converted into Class 2 shares on January 1, 2015.
(b) Class III shares were converted into Class 5 shares on January 1, 2015.
The accompanying notes are an integral part of the financial statements.
76
Annual Report December 31, 2015
Baillie Gifford Emerging Markets Fund
Selected data for a Class 2 Shares outstanding throughout each period:^
| | | For the Period
March 3, 2015(a)
through
December 31,
2015 | | For the Period
April 8, 2014(a)
through
June 9,
2014 | | For the Period
January 1, 2014(a)
through
January 12,
2014 | | For the Period
April 9, 2013(b)
through
December 31,
2013 | |
Net asset value, beginning of period | | $ | 17.24 | | | $ | 16.64 | | | $ | 16.52 | | | $ | 15.60 | | |
From Investment Operations | |
Net investment income (loss)(c) | | | 0.13 | | | | 0.01 | | | | (0.00 | )(d) | | | 0.10 | | |
Net realized and unrealized gain (loss) on investments
and foreign currency transactions | | | (2.38 | ) | | | 1.18 | | | | (0.41 | ) | | | 1.10 | | |
Net increase (decrease) in net asset value from
investment operations | | | (2.25) | | | | 1.19 | | | | (0.41) | | | | 1.20 | | |
Dividends and Distributions to Shareholders | | | | | | | | | | | | | | | | | |
Dividends from net investment income | | | (0.17 | ) | | | — | | | | — | | | | (0.29 | ) | |
Distributions from net realized gain on investments | | | (0.00 | )(d) | | | — | | | | — | | | | — | | |
Total Dividends and Distributions | | | (0.17 | ) | | | — | | | | — | | | | (0.29 | ) | |
Proceeds from Purchase Fees and
Redemption Fees(c) | | | 0.06 | | | | 0.02 | | | | — | | | | 0.01 | | |
Net asset value, end of period | | $ | 14.88 | | | $ | 17.85 | | | $ | 16.11 | | | $ | 16.52 | | |
Total Return | |
Total return based on net asset value(e) | | | (12.68 | )% | | | 7.27 | % | | | (2.48 | )% | | | 7.90 | % | |
Ratios/Supplemental Data | |
Net assets, end of period (000's omitted) | | $ | 69,091 | | | $ | 9,994 | | | $ | 49,767 | | | $ | 51,029 | | |
Ratio of net expenses to average net assets | | | 0.87 | %* | | | 0.90 | % | | | 0.92 | % | | | 0.89 | %* | |
Ratio of net investment income to average net assets | | | 0.95 | %* | | | 0.46 | % | | | (0.90 | )% | | | 0.90 | %* | |
Portfolio turnover rate(f) | | | 46 | % | | | 26 | % | | | 26 | % | | | 33 | % | |
* Annualized.
^ Formerly Class II shares.
(a) Recommencement of investment operations. Class had no shareholders from January 13, 2014 to April 7, 2014 and from June 10, 2014 to March 2, 2015. All shares of this class were redeemed at $16.11 on January 12, 2014. New shares were issued at $16.64 on April 8, 2014. All shares of this class were redeemed at $17.85 on June 9, 2014. New shares were issued at $17.24 on March 3, 2015.
(b) Commencement of investment operations.
(c) Calculated based upon average shares outstanding during the period.
(d) Amount is less than 0.005 per share.
(e) Total return is calculated assuming an initial investment made at the net asset value at the beginning of the period, reinvestment of all dividends and distributions, if any, at net asset value during the period, and redemption on the last day of the period. Total return is not annualized for periods less than one year.
(f) Portfolio turnover rate calculated at Fund level.
The accompanying notes are an integral part of the financial statements.
77
Annual Report December 31, 2015
Baillie Gifford Emerging Markets Fund
Selected data for a Class 4 Shares outstanding throughout the period:
| | For the Period
November 2, 2015(a)
through
December 31,
2015 | |
Net asset value, beginning of period | | $ | 15.40 | | |
From Investment Operations | |
Net investment income(b) | | | 0.02 | | |
Net realized and unrealized loss on investments and foreign currency transactions | | | (0.28 | ) | |
Net decrease in net asset value from investment operations | | | (0.26 | ) | |
Dividends and Distributions to Shareholders | |
Dividends from net investment income | | | (0.06 | ) | |
Distributions from net realized gain on investments | | | (0.00 | )(c) | |
Total Dividends and Distributions | | | (0.06 | ) | |
Proceeds from Purchase Fees and Redemption Fees(b) | | | 0.04 | | |
Net asset value, end of period | | $ | 15.12 | | |
Total Return | |
Total return based on net asset value(d) | | | (1.40 | )% | |
Ratios/Supplemental Data | |
Net assets, end of period (000's omitted) | | $ | 98,273 | | |
Ratio of net expenses to average net assets | | | 0.76 | %* | |
Ratio of net investment income to average net assets | | | 0.88 | %* | |
Portfolio turnover rate(e) | | | 46 | % | |
* Annualized.
(a) Commencement of investment operations.
(b) Calculated based upon average shares outstanding during the period.
(c) Amount is less than 0.005 per share.
(d) Total return is calculated assuming an initial investment made at the net asset value at the beginning of the period, reinvestment of all dividends and distributions, if any, at net asset value during the period, and redemption on the last day of the period. Total return is not annualized for periods less than one year.
(e) Portfolio turnover rate calculated at Fund level.
The accompanying notes are an integral part of the financial statements.
78
Annual Report December 31, 2015
Baillie Gifford Emerging Markets Fund
Selected data for a Class 5 Shares outstanding throughout each year:
| | | For the
Year Ended
December 31,
2015 | |
Net asset value, beginning of year | | $ | 16.93 | | |
From Investment Operations | |
Net investment income(a) | | | 0.14 | | |
Net realized and unrealized loss on investments and foreign currency transactions | | | (1.60 | ) | |
Net decrease in net asset value from investment operations | | | (1.46 | ) | |
Dividends and Distributions to Shareholders | |
Dividends from net investment income | | | (0.19 | ) | |
Distributions from net realized gain on investments | | | (0.00 | )(b) | |
Total Dividends and Distributions | | | (0.19 | ) | |
Proceeds from Purchase Fees and Redemption Fees(a) | | | 0.05 | | |
Net asset value, end of year | | $ | 15.33 | | |
Total Return | |
Total return based on net asset value(c) | | | (8.24 | )% | |
Ratios/Supplemental Data | |
Net assets, end of period (000's omitted) | | $ | 935,177 | | |
Ratio of net expenses to average net assets | | | 0.71 | % | |
Ratio of net investment income to average net assets | | | 0.89 | % | |
Portfolio turnover rate(d) | | | 46 | % | |
(a) Calculated based upon average shares outstanding during the year.
(b) Amount is less than 0.005 per share.
(c) Total return is calculated assuming an initial investment made at the net asset value at the beginning of the period, reinvestment of all dividends and distributions, if any, at net asset value during the period, and redemption on the last day of the period. Total return is not annualized for periods less than one year.
(d) Portfolio turnover rate calculated at Fund level.
The accompanying notes are an integral part of the financial statements.
79
Industry Diversification Table
Annual Report December 31, 2015
December 31, 2015 (unaudited)
Baillie Gifford Global Alpha Equity Fund
| | | Value | | % of Total
Net Assets | |
Aerospace | | $ | 4,311,484 | | | | 0.6 | % | |
Airlines | | | 15,385,384 | | | | 2.2 | | |
Asset Managers | | | 3,717,471 | | | | 0.5 | | |
Automobiles | | | 11,701,605 | | | | 1.6 | | |
Banks | | | 52,448,814 | | | | 7.5 | | |
Beverages | | | 3,439,120 | | | | 0.5 | | |
Beverages, Food & Tobacco | | | 2,162,274 | | | | 0.3 | | |
Biotechnology | | | 10,563,999 | | | | 1.5 | | |
Brewers | | | 5,903,839 | | | | 0.8 | | |
Broadline Retailers | | | 28,972,701 | | | | 4.1 | | |
Business Support Services | | | 1,223,340 | | | | 0.2 | | |
Chemicals | | | 4,349,133 | | | | 0.6 | | |
Clothing & Accessories | | | 4,183,939 | | | | 0.6 | | |
Commercial Services | | | 28,661,948 | | | | 4.0 | | |
Construction & Building Materials | | | 18,845,477 | | | | 2.6 | | |
Construction & Materials | | | 7,506,300 | | | | 1.0 | | |
Containers & Packaging | | | 6,225,218 | | | | 0.9 | | |
Diversified Financial Services | | | 32,425,888 | | | | 4.5 | | |
Diversified Industrials | | | 4,145,397 | | | | 0.6 | | |
Electronic & Electrical Equipment | | | 12,600,948 | | | | 1.8 | | |
Engineering & Machinery | | | 5,566,240 | | | | 0.8 | | |
Farming & Fishing | | | 5,572,981 | | | | 0.8 | | |
Financial Administration | | | 5,364,442 | | | | 0.7 | | |
Financial Services | | | 5,376,702 | | | | 0.8 | | |
Fixed Line Telecommunications | | | 2,653,714 | | | | 0.4 | | |
Food Products | | | 12,445,021 | | | | 1.7 | | |
Food Retailers & Wholesalers | | | 4,319,745 | | | | 0.6 | | |
Gambling | | | 2,755,550 | | | | 0.4 | | |
Healthcare — Products | | | 6,552,309 | | | | 0.9 | | |
Healthcare Providers | | | 15,243,441 | | | | 2.1 | | |
Household Goods & Home Construction | | | 6,592,848 | | | | 0.9 | | |
Industrial Engineering | | | 3,309,469 | | | | 0.5 | | |
Industrial Machinery | | | 27,250,880 | | | | 3.8 | | |
Industrial Suppliers | | | 9,179,639 | | | | 1.3 | | |
Insurance | | | 47,781,228 | | | | 6.7 | | |
Internet | | | 48,911,279 | | | | 6.8 | | |
Investment Services | | | 4,126,788 | | | | 0.6 | | |
Life Insurance | | | 12,364,837 | | | | 1.7 | | |
Media & Photography | | | 25,004,388 | | | | 3.5 | | |
80
Industry Diversification Table
Annual Report December 31, 2015
| | | Value | | % of Total
Net Assets | |
Medical Equipment | | $ | 8,649,343 | | | | 1.3 | % | |
Mobile Telecommunications | | | 1,644,687 | | | | 0.2 | | |
Motorcycles | | | 7,826,961 | | | | 1.1 | | |
Oil & Gas | | | 14,263,197 | | | | 1.9 | | |
Oil Equipment & Services | | | 3,397,013 | | | | 0.5 | | |
Pharmaceuticals, Biotechnology & Life Sciences | | | 9,173,917 | | | | 1.3 | | |
Property & Casualty Insurance | | | 13,196,104 | | | | 1.9 | | |
Publishing | | | 4,315,771 | | | | 0.6 | | |
Real Estate | | | 2,647,944 | | | | 0.4 | | |
Real Estate Holding & Development | | | 2,386,443 | | | | 0.3 | | |
Retailers — General | | | 9,099,396 | | | | 1.3 | | |
Semiconductors | | | 43,338,354 | | | | 6.2 | | |
Software | | | 5,534,600 | | | | 0.8 | | |
Software & Computer Services | | | 14,372,287 | | | | 2.0 | | |
Specialized Consumer Services | | | 18,486,196 | | | | 2.6 | | |
Technology Hardware & Equipment | | | 6,512,389 | | | | 0.9 | | |
Travel & Leisure | | | 29,240,581 | | | | 4.1 | | |
Trucking | | | 6,166,649 | | | | 0.9 | | |
Total Value of Investments | | | 709,397,612 | | | | 99.7 | | |
Other assets less liabilities | | | 2,475,490 | | | | 0.3 | | |
Net Assets | | $ | 711,873,102 | | | | 100.0 | % | |
81
Annual Report December 31, 2015
December 31, 2015
Baillie Gifford Global Alpha Equity Fund
| | | Shares | | Value | |
COMMON STOCKS — 99.7% | |
AUSTRALIA — 0.9% | |
Brambles Ltd. | | | 743,320 | | | $ | 6,225,218 | | |
BRAZIL — 0.3% | |
BM&FBovespa SA | | | 860,100 | | | | 2,351,751 | | |
CANADA — 1.6% | |
Fairfax Financial Holdings Ltd. | | | 14,538 | | | | 6,901,899 | | |
Ritchie Bros. Auctioneers, Inc. | | | 161,080 | | | | 3,883,639 | | |
Ultra Petroleum Corp. (a) | | | 356,132 | | | | 890,330 | | |
| | | | | | 11,675,868 | | |
CHINA — 3.6% | |
Alibaba Group Holding Ltd. ADR (a) | | | 139,152 | | | | 11,308,883 | | |
Baidu, Inc. ADR (a) | | | 52,113 | | | | 9,851,442 | | |
Mindray Medical International Ltd. ADR | | | 88,469 | | | | 2,399,279 | | |
Tsingtao Brewery Co., Ltd., Class H | | | 480,000 | | | | 2,162,274 | | |
| | | | | | 25,721,878 | | |
DENMARK — 0.8% | |
Carlsberg A/S, B Shares | | | 66,641 | | | | 5,903,839 | | |
GERMANY — 2.8% | |
Deutsche Boerse AG | | | 64,125 | | | | 5,636,694 | | |
SAP SE | | | 181,117 | | | | 14,372,287 | | |
| | | | | | 20,008,981 | | |
HONG KONG — 2.7% | |
AIA Group Ltd. | | | 2,069,400 | | | | 12,364,837 | | |
Jardine Matheson Holdings Ltd. | | | 85,600 | | | | 4,145,397 | | |
Sands China Ltd. | | | 812,800 | | | | 2,755,550 | | |
| | | | | | 19,265,784 | | |
INDIA — 1.2% | |
HDFC Bank Ltd. ADR | | | 51,400 | | | | 3,166,240 | | |
ICICI Bank Ltd. ADR | | | 647,800 | | | | 5,072,274 | | |
| | | | | | 8,238,514 | | |
The accompanying notes are an integral part of the financial statements.
82
Annual Report December 31, 2015
December 31, 2015
Baillie Gifford Global Alpha Equity Fund
| | | Shares | | Value | |
IRELAND — 5.8% | |
Bank of Ireland (a) | | | 19,031,593 | | | $ | 7,025,228 | | |
CRH Plc. | | | 650,924 | | | | 18,845,477 | | |
Ryanair Holdings PLC ADR | | | 177,948 | | | | 15,385,384 | | |
| | | | | | 41,256,089 | | |
ITALY — 0.7% | |
Fiat Chrysler Automobiles NV (a) | | | 374,735 | | | | 5,204,294 | | |
JAPAN — 6.7% | |
CyberAgent, Inc. | | | 91,400 | | | | 3,765,912 | | |
Inpex Corp. | | | 611,200 | | | | 5,958,535 | | |
Japan Exchange Group, Inc. | | | 264,000 | | | | 4,126,788 | | |
MS&AD Insurance Group Holdings, Inc. | | | 450,000 | | | | 13,196,104 | | |
Olympus Corp. | | | 155,400 | | | | 6,117,891 | | |
Rohm Co., Ltd. | | | 71,200 | | | | 3,606,342 | | |
SMC Corp. | | | 25,600 | | | | 6,649,188 | | |
THK Co., Ltd. | | | 237,900 | | | | 4,409,259 | | |
| | | | | | 47,830,019 | | |
NETHERLANDS — 1.3% | |
QIAGEN NV (a) | | | 150,200 | | | | 4,153,030 | | |
Yandex NV, Class A (a) | | | 309,700 | | | | 4,868,484 | | |
| | | | | | 9,021,514 | | |
NORWAY — 1.2% | |
Schibsted ASA, Class A | | | 135,419 | | | | 4,452,122 | | |
Schibsted ASA, Class B (a) | | | 135,419 | | | | 4,315,771 | | |
| | | | | | 8,767,893 | | |
RUSSIA — 0.4% | |
Sberbank of Russia ADR | | | 446,162 | | | | 2,617,364 | | |
SOUTH AFRICA — 3.1% | |
MTN Group Ltd. | | | 190,924 | | | | 1,644,687 | | |
Naspers Ltd., N Shares | | | 150,363 | | | | 20,552,266 | | |
| | | | | | 22,196,953 | | |
SOUTH KOREA — 1.6% | |
Samsung Electronics Co., Ltd. GDR (b) | | | 17,045 | | | | 9,037,005 | | |
SK Hynix, Inc. | | | 87,240 | | | | 2,253,667 | | |
| | | | | | 11,290,672 | | |
The accompanying notes are an integral part of the financial statements.
83
Annual Report December 31, 2015
December 31, 2015
Baillie Gifford Global Alpha Equity Fund
| | | Shares | | Value | |
SPAIN — 0.9% | |
Banco Popular Espanol SA | | | 663,122 | | | $ | 2,184,923 | | |
Distribuidora Internacional de Alimentacion SA (a) | | | 732,393 | | | | 4,319,745 | | |
| | | | | | 6,504,668 | | |
SWEDEN — 2.6% | |
Atlas Copco AB, A Shares | | | 24,477 | | | | 600,293 | | |
Atlas Copco AB, B Shares | | | 290,416 | | | | 6,676,780 | | |
Svenska Handelsbanken AB, A Shares | | | 587,595 | | | | 7,804,134 | | |
Volvo AB, B Shares | | | 356,910 | | | | 3,309,469 | | |
| | | | | | 18,390,676 | | |
SWITZERLAND — 4.1% | |
Coca-Cola HBC AG (a) | | | 161,493 | | | | 3,439,120 | | |
Compagnie Financiere Richemont SA | | | 58,457 | | | | 4,183,939 | | |
Nestle SA | | | 167,643 | | | | 12,445,021 | | |
Schindler Holding AG, Participating Certificates | | | 53,290 | | | | 8,915,360 | | |
| | | | | | 28,983,440 | | |
TAIWAN — 2.4% | |
Taiwan Semiconductor Manufacturing Co., Ltd. ADR | | | 737,038 | | | | 16,767,614 | | |
UNITED KINGDOM — 6.3% | |
Aggreko Plc. | | | 90,875 | | | | 1,223,340 | | |
Hays Plc. | | | 1,880,283 | | | | 4,038,219 | | |
Prudential Plc. | | | 1,156,632 | | | | 26,058,483 | | |
Rolls-Royce Holdings Plc. (a) | | | 500,920 | | | | 4,243,029 | | |
Rolls-Royce Holdings Plc. Preference Shares (a) | | | 46,435,284 | | | | 68,455 | | |
Wolseley Plc. | | | 169,013 | | | | 9,179,639 | | |
| | | | | | 44,811,165 | | |
UNITED STATES — 48.7% | |
Alnylam Pharmaceuticals, Inc. (a) | | | 42,085 | | | | 3,961,882 | | |
Alphabet, Inc., Class C (a) | | | 23,848 | | | | 18,097,770 | | |
Amazon.com, Inc. (a) | | | 42,866 | | | | 28,972,701 | | |
American Express Co. | | | 77,307 | | | | 5,376,702 | | |
Anthem, Inc. | | | 109,319 | | | | 15,243,441 | | |
Autohome, Inc. ADR (a) | | | 77,871 | | | | 2,719,255 | | |
C.H. Robinson Worldwide, Inc. | | | 99,430 | | | | 6,166,649 | | |
CarMax, Inc. (a) | | | 168,601 | | | | 9,099,396 | | |
Colgate-Palmolive Co. | | | 98,962 | | | | 6,592,848 | | |
The accompanying notes are an integral part of the financial statements.
84
Annual Report December 31, 2015
December 31, 2015
Baillie Gifford Global Alpha Equity Fund
| | | Shares | | Value | |
Dolby Laboratories, Inc., Class A | | | 104,967 | | | $ | 3,532,140 | | |
eBay, Inc. (a) | | | 157,589 | | | | 4,330,546 | | |
EOG Resources, Inc. | | | 104,737 | | | | 7,414,332 | | |
Facebook, Inc., Class A (a) | | | 81,481 | | | | 8,527,801 | | |
Financial Engines, Inc. | | | 110,409 | | | | 3,717,471 | | |
First Republic Bank | | | 212,101 | | | | 14,011,392 | | |
Grubhub, Inc. (a) | | | 117,635 | | | | 2,846,767 | | |
Harley-Davidson, Inc. | | | 172,438 | | | | 7,826,961 | | |
Howard Hughes Corp. (The) (a) | | | 23,400 | | | | 2,647,944 | | |
Intuitive Surgical, Inc. (a) | | | 4,635 | | | | 2,531,452 | | |
Leucadia National Corp. | | | 152,600 | | | | 2,653,714 | | |
Lincoln Electric Holdings, Inc. | | | 107,270 | | | | 5,566,240 | | |
M&T Bank Corp. | | | 87,203 | | | | 10,567,259 | | |
Markel Corp. (a) | | | 16,778 | | | | 14,820,846 | | |
Martin Marietta Materials, Inc. | | | 54,959 | | | | 7,506,300 | | |
MasterCard, Inc., Class A | | | 102,861 | | | | 10,014,547 | | |
Monsanto Co. | | | 56,567 | | | | 5,572,981 | | |
Moody's Corp. | | | 106,892 | | | | 10,725,543 | | |
Myriad Genetics, Inc. (a) | | | 212,556 | | | | 9,173,917 | | |
NOW, Inc. (a) | | | 214,729 | | | | 3,397,013 | | |
PayPal Holdings, Inc. (a) | | | 148,189 | | | | 5,364,442 | | |
Praxair, Inc. | | | 42,472 | | | | 4,349,133 | | |
QUALCOMM, Inc. | | | 85,200 | | | | 4,258,722 | | |
Royal Caribbean Cruises Ltd. | | | 288,910 | | | | 29,240,581 | | |
Seattle Genetics, Inc. (a) | | | 147,106 | | | | 6,602,117 | | |
TD Ameritrade Holding Corp. | | | 396,277 | | | | 13,754,775 | | |
Teradyne, Inc. | | | 343,619 | | | | 7,102,605 | | |
Tesla Motors, Inc. (a) | | | 27,071 | | | | 6,497,311 | | |
TripAdvisor, Inc. (a) | | | 64,922 | | | | 5,534,600 | | |
Twitter, Inc. (a) | | | 46,699 | | | | 1,080,615 | | |
Visa, Inc., Class A | | | 137,752 | | | | 10,682,668 | | |
Waters Corp. (a) | | | 67,386 | | | | 9,068,808 | | |
Xilinx, Inc. | | | 145,301 | | | | 6,824,788 | | |
Zillow Group, Inc., Class A (a) | | | 32,691 | | | | 851,274 | | |
Zillow Group, Inc., Class C (a) | | | 65,382 | | | | 1,535,169 | | |
| | | | | | 346,363,418 | | |
TOTAL INVESTMENTS — 99.7% | |
(cost $618,378,162) | | | | $ | 709,397,612 | | |
Other assets less liabilities — 0.3% | | | | | 2,475,490 | | |
NET ASSETS — 100.0% | | | | $ | 711,873,102 | | |
The accompanying notes are an integral part of the financial statements.
85
Annual Report December 31, 2015
December 31, 2015
Baillie Gifford Global Alpha Equity Fund
(a) Non-income producing security.
(b) 144A — Securities are exempt from registration under Rule 144A of the Securities Act of 1933, as amended. These securities may be resold in transactions exempt from registration, normally to qualified institutional buyers. Prices are obtained daily from the London International Stock Exchange; therefore, Fair valuation is typically not required. At December 31, 2015, the net value of these securities was $9,037,005 representing 1.3% of net assets.
ADR — American Depositary Receipt.
GDR — Global Depositary Receipt.
The accompanying notes are an integral part of the financial statements.
86
Statement of Assets and Liabilities
Annual Report December 31, 2015
December 31, 2015
Baillie Gifford Global Alpha Equity Fund
ASSETS | |
Investments, at value (cost $618,378,162) | | $ | 709,397,612 | | |
Cash | | | 2,954,422 | | |
Foreign cash, at value (cost $47,751) | | | 46,662 | | |
Tax reclaims receivable | | | 303,017 | | |
Dividends receivable | | | 169,905 | | |
Receivable for investments sold | | | 89,238 | | |
Total Assets | | | 712,960,856 | | |
LIABILITIES | |
Management fee payable | | | 719,225 | | |
Servicing fee payable | | | 217,053 | | |
Trustee fee payable | | | 9,685 | | |
Accrued expenses | | | 141,791 | | |
Total Liabilities | | | 1,087,754 | | |
NET ASSETS | | $ | 711,873,102 | | |
COMPOSITION OF NET ASSETS | |
Paid-in capital | | $ | 619,507,345 | | |
Distributions in excess of net investment income | | | (956,877 | ) | |
Accumulated net realized gain on investments and foreign currency transactions | | | 2,327,908 | | |
Net unrealized appreciation in value of investments and foreign currencies | | | 90,994,726 | | |
| | | $ | 711,873,102 | | |
NET ASSET VALUE, PER SHARE | |
| Class 2 ($210,889,915 / 15,109,093 shares outstanding), unlimited authorized, no par value | | $ | 13.96 | | |
Maximum Purchase Price Per Share (Note D) | | $ | 13.98 | | |
Minimum Redemption Price Per Share (Note D) | | $ | 13.95 | | |
| Class 3 ($500,983,187 / 35,211,055 shares outstanding), unlimited authorized, no par value | | $ | 14.23 | | |
Maximum Purchase Price Per Share (Note D) | | $ | 14.25 | | |
Minimum Redemption Price Per Share (Note D) | | $ | 14.22 | | |
The accompanying notes are an integral part of the financial statements.
87
Annual Report December 31, 2015
For the Year Ended December 31, 2015
Baillie Gifford Global Alpha Equity Fund
INVESTMENT INCOME | |
Dividends (net of foreign withholding taxes of $553,432) | | $ | 10,383,056 | | |
Interest | | | 2,355 | | |
Total Investment Income | | | 10,385,411 | | |
EXPENSES | |
Management fee (Note B) | | | 2,844,676 | | |
Shareholder Servicing fees — Class 2 Shares (Note B) | | | 379,539 | | |
Shareholder Servicing fees — Class 3 Shares (Note B) | | | 487,910 | | |
Fund accounting | | | 371,933 | | |
Custody | | | 112,921 | | |
Legal | | | 68,554 | | |
Trustees' fees | | | 39,972 | | |
Transfer agency | | | 30,956 | | |
Professional fees | | | 23,547 | | |
Insurance | | | 7,305 | | |
Miscellaneous | | | 9,802 | | |
Total Expenses | | | 4,377,115 | | |
Net Investment Income | | | 6,008,296 | | |
REALIZED AND UNREALIZED GAIN (LOSS) ON INVESTMENTS
AND FOREIGN CURRENCY TRANSACTIONS | |
Net realized gain (loss) from: | |
Investments | | | 6,735,984 | | |
Foreign currency transactions | | | (216,097 | ) | |
| | | | 6,519,887 | | |
Net change in unrealized appreciation (depreciation) on: | |
Investments | | | (3,298,496 | ) | |
Translation of assets and liabilities denominated in foreign currencies | | | (995 | ) | |
| | | | (3,299,491 | ) | |
Net realized and unrealized gain on investments and foreign currency transactions | | | 3,220,396 | | |
NET INCREASE IN NET ASSETS FROM OPERATIONS | | $ | 9,228,692 | | |
The accompanying notes are an integral part of the financial statements.
88
Statements of Changes in Net Assets
Annual Report December 31, 2015
Baillie Gifford Global Alpha Equity Fund
| | | For the
Year Ended
December 31,
2015 | | For the
Year Ended
December 31,
2014 | |
INCREASE (DECREASE) IN NET ASSETS FROM OPERATIONS | |
Net investment income | | $ | 6,008,296 | | | $ | 4,911,650 | | |
Net realized gain from investments and foreign currency transactions | | | 6,519,887 | | | | 28,022,248 | | |
Net change in unrealized (depreciation) on investments
and translation of assets and liabilities in foreign currencies | | | (3,299,491 | ) | | | (8,282,983 | ) | |
Net increase in net assets from operations | | | 9,228,692 | | | | 24,650,915 | | |
DIVIDENDS AND DISTRIBUTIONS TO SHAREHOLDERS FROM: | | | | | |
Net investment income: | |
Class 2 | | | (1,663,175 | ) | | | (1,935,270 | ) | |
Class 3 | | | (4,225,198 | ) | | | (4,118,562 | ) | |
Capital gains: | |
Class 2 | | | (2,554,643 | ) | | | (8,447,239 | ) | |
Class 3 | | | (6,010,186 | ) | | | (17,020,345 | ) | |
Total Dividends and Distributions | | | (14,453,202 | ) | | | (31,521,416 | ) | |
TRANSACTIONS IN SHARES OF BENEFICIAL INTEREST | |
Net proceeds from shares subscribed: | |
Class 2 | | | 121,571,150 | | | | 88,622,400 | | |
Class 3 | | | 109,854,707 | | | | 139,720,000 | | |
Purchase fees: | |
Class 2 | | | 76,958 | | | | 114,452 | | |
Class 3 | | | 151,892 | | | | 343,148 | | |
Redemption fees: | |
Class 2 | | | 16,421 | | | | 17,680 | | |
Class 3 | | | 39,023 | | | | 54,051 | | |
Dividends reinvested: | |
Class 2 | | | 4,217,818 | | | | 10,382,509 | | |
Class 3 | | | 10,235,384 | | | | 21,138,906 | | |
Cost of shares redeemed: | |
Class 2 | | | (129,449,097 | ) | | | — | | |
Class 3 | | | (24,036,054 | ) | | | (47,820,230 | ) | |
Increase in Net Assets from Transactions in Shares of Beneficial Interest | | | 92,678,202 | | | | 212,572,916 | | |
Total Increase in Net Assets | | | 87,453,692 | | | | 205,702,415 | | |
NET ASSETS | |
Beginning of year | | | 624,419,410 | | | | 418,716,995 | | |
End of year (including distributions in excess of net investment income
of $956,877 and $1,074,984, respectively) | | $ | 711,873,102 | | | $ | 624,419,410 | | |
The accompanying notes are an integral part of the financial statements.
89
Annual Report December 31, 2015
Baillie Gifford Global Alpha Equity Fund
Selected data for a Class 2 Share outstanding throughout each period:
| | | For the
Year Ended
December 31,
2015 | | For the
Year Ended
December 31,
2014 | | For the Period
January 6, 2013(a)
through
December 31,
2013 | |
Net asset value, beginning of period | | $ | 14.00 | | | $ | 14.10 | | | $ | 11.55 | | |
From Investment Operations | |
Net investment income(b) | | | 0.12 | | | | 0.11 | | | | 0.12 | | |
Net realized and unrealized gain on investments and foreign currency
transactions | | | 0.11 | (f) | | | 0.53 | | | | 2.94 | | |
Net increase in net asset value from investment operations | | | 0.23 | | | | 0.64 | | | | 3.06 | | |
Dividends and Distributions to Shareholders | | | | | | | |
Dividends from net investment income | | | (0.11 | ) | | | (0.14 | ) | | | (0.17 | ) | |
Distributions from net realized gain on investments | | | (0.17 | ) | | | (0.61 | ) | | | (0.34 | ) | |
Total Dividends and Distributions | | | (0.28 | ) | | | (0.75 | ) | | | (0.51 | ) | |
Proceeds from Purchase Fees and Redemption Fees(b) | | | 0.01 | | | | 0.01 | | | | 0.00 | (c) | |
Net asset value, end of period | | $ | 13.96 | | | $ | 14.00 | | | $ | 14.10 | | |
Total Return | |
Total return based on net asset value(d) | | | 1.75 | % | | | 4.49 | % | | | 26.48 | % | |
Ratios/Supplemental Data | |
Net assets, end of period (000's omitted) | | $ | 210,890 | | | $ | 213,426 | | | $ | 119,535 | | |
Ratio of net expenses to average net assets | | | 0.66 | % | | | 0.67 | % | | | 0.68 | %* | |
Ratio of net investment income to average net assets | | | 0.83 | % | | | 0.74 | % | | | 1.00 | %* | |
Portfolio turnover rate(e) | | | 16 | % | | | 26 | % | | | 20 | % | |
* Annualized.
(a) Commencement of investment operations.
(b) Calculated based upon average shares outstanding during the period.
(c) Amount is less than $0.005 per share.
(d) Total return is calculated assuming an initial investment made at the net asset value at the beginning of the period, reinvestment of all dividends and distributions, if any, at net asset value during the period, and redemption on the last day of the period. Total return is not annualized for periods less than one year.
(e) Portfolio turnover rate calculated at Fund level.
(f) Calculation of the net gain per share (both realized and unrealized) does not correlate to the aggregate realized and unrealized gain presented in the Statement of Operations due to the timing of sales and repurchases of Class shares in relation to fluctuating market values of the investments of the Fund.
The accompanying notes are an integral part of the financial statements.
90
Annual Report December 31, 2015
Baillie Gifford Global Alpha Equity Fund
Selected data for a Class 3 Share outstanding throughout each period:
| | | For the
Year Ended
December 31,
2015 | | For the
Year Ended
December 31,
2014 | | For the
Year Ended
December 31,
2013 | | For the
Year Ended
December 31,
2012 | | For the Period
November 15, 2011(a)
through
December 31,
2011 | |
Net asset value, beginning of period | | $ | 14.26 | | | $ | 14.36 | | | $ | 11.56 | | | $ | 9.86 | | | $ | 10.00 | | |
From Investment Operations | |
Net investment income(b) | | | 0.13 | | | | 0.13 | | | | 0.14 | | | | 0.19 | | | | 0.01 | | |
Net realized and unrealized gain (loss) on
investments and foreign currency transactions | | | 0.12 | (f) | | | 0.52 | | | | 3.17 | | | | 1.65 | | | | (0.14 | ) | |
Net increase (decrease) in net asset value from
investment operations | | | 0.25 | | | | 0.65 | | | | 3.31 | | | | 1.84 | | | | (0.13 | ) | |
Dividends and Distributions to
Shareholders | | | | | | | | | | | |
Dividends from net investment income | | | (0.12 | ) | | | (0.15 | ) | | | (0.18 | ) | | | (0.14 | ) | | | (0.01 | ) | |
Distributions from net realized gain on
investments | | | (0.17 | ) | | | (0.61 | ) | | | (0.34 | ) | | | — | | | | — | | |
Total Dividends and Distributions | | | (0.29 | ) | | | (0.76 | ) | | | (0.52 | ) | | | (0.14 | ) | | | (0.01 | ) | |
Proceeds from Purchase Fees and
Redemption Fees(b) | | | 0.01 | | | | 0.01 | | | | 0.01 | | | | 0.00 | (c) | | | — | | |
Net asset value, end of period | | $ | 14.23 | | | $ | 14.26 | | | $ | 14.36 | | | $ | 11.56 | | | $ | 9.86 | | |
Total Return | | | | | | | | | | | |
Total return based on net asset
value(d) | | | 1.84 | % | | | 4.48 | % | | | 28.71 | % | | | 18.69 | % | | | (1.25 | )% | |
Ratios/Supplemental Data | |
Net assets, end of period (000's omitted) | | $ | 500,983 | | | $ | 410,993 | | | $ | 299,182 | | | $ | 231,157 | | | $ | 104,721 | | |
Ratio of net expenses to average net assets | | | 0.59 | % | | | 0.59 | % | | | 0.61 | % | | | 0.63 | % | | | 0.64 | %* | |
Ratio of net investment income to
average net assets | | | 0.85 | % | | | 0.91 | % | | | 1.05 | % | | | 1.76 | % | | | 1.12 | %* | |
Portfolio turnover rate(e) | | | 16 | % | | | 26 | % | | | 20 | % | | | 15 | % | | | 3 | % | |
* Annualized.
(a) Commencement of investment operations.
(b) Calculated based upon average shares outstanding during the period.
(c) Amount is less than $0.005 per share.
(d) Total return is calculated assuming an initial investment made at the net asset value at the beginning of the period, reinvestment of all dividends and distributions, if any, at net asset value during the period, and redemption on the last day of the period. Total return is not annualized for periods less than one year.
(e) Portfolio turnover rate calculated at Fund level.
(f) Calculation of the net gain per share (both realized and unrealized) does not correlate to the aggregate realized and unrealized losses presented in the Statement of Operations due to the timing of sales and repurchases of Class shares in relation to fluctuating market values of the investments of the Fund
The accompanying notes are an integral part of the financial statements.
91
Industry Diversification Table
Annual Report December 31, 2015
December 31, 2015 (unaudited)
Baillie Gifford Long Term Global Growth Equity Fund
| | | Value | | % of Total
Net Assets | |
Apparel Retailers | | $ | 4,164,052 | | | | 4.7 | % | |
Automobiles | | | 4,947,326 | | | | 5.5 | | |
Biotechnology | | | 13,007,401 | | | | 14.5 | | |
Broadline Retailers | | | 10,740,416 | | | | 12.0 | | |
Bus, Train & Employment | | | 2,050,704 | | | | 2.3 | | |
Clothing & Accessories | | | 2,652,942 | | | | 2.9 | | |
Computer Hardware | | | 335,764 | | | | 0.4 | | |
Consumer Finance | | | 1,136,846 | | | | 1.3 | | |
Food Retailers & Wholesalers | | | 1,279,700 | | | | 1.4 | | |
Industrial Machinery | | | 1,377,166 | | | | 1.5 | | |
Internet | | | 21,465,300 | | | | 23.8 | | |
Life Insurance | | | 1,762,650 | | | | 2.0 | | |
Medical Equipment | | | 3,295,529 | | | | 3.7 | | |
Personal products | | | 1,335,049 | | | | 1.5 | | |
Pharmaceuticals, Biotechnology & Life Sciences | | | 924,254 | | | | 1.0 | | |
Retailing | | | 1,669,948 | | | | 1.9 | | |
Semiconductors | | | 1,695,122 | | | | 1.9 | | |
Software | | | 7,936,131 | | | | 8.8 | | |
Specialized Consumer Services | | | 2,842,012 | | | | 3.2 | | |
Travel & Tourism | | | 3,441,670 | | | | 3.8 | | |
Total Value of Investments | | | 88,059,982 | | | | 98.1 | | |
Other assets less liabilities | | | 1,739,459 | | | | 1.9 | | |
Net Assets | | $ | 89,799,441 | | | | 100.0 | % | |
92
Annual Report December 31, 2015
December 31, 2015
Baillie Gifford Long Term Global Growth Equity Fund
| | | Shares | | Value | |
COMMON STOCKS — 98.1% | |
CHINA — 19.4% | |
Alibaba Group Holding Ltd. ADR (a) | | | 34,970 | | | $ | 2,842,012 | | |
Baidu, Inc. ADR (a) | | | 29,866 | | | | 5,645,869 | | |
Ctrip.com International Ltd. ADR (a) | | | 74,286 | | | | 3,441,670 | | |
Tencent Holdings Ltd. | | | 281,800 | | | | 5,517,640 | | |
| | | | | | 17,447,191 | | |
DENMARK — 2.0% | |
Novozymes A/S, B Shares | | | 36,970 | | | | 1,770,082 | | |
FRANCE — 5.6% | |
Hermes International | | | 4,380 | | | | 1,480,557 | | |
Kering | | | 12,997 | | | | 2,222,174 | | |
L'Oreal SA | | | 7,937 | | | | 1,335,049 | | |
| | | | | | 5,037,780 | | |
GERMANY — 1.2% | |
Rocket Internet SE 144A (a)(b) | | | 35,090 | | | | 1,068,972 | | |
HONG KONG — 2.0% | |
AIA Group Ltd. | | | 295,000 | | | | 1,762,650 | | |
SPAIN — 4.7% | |
Inditex SA | | | 121,209 | | | | 4,164,052 | | |
SWEDEN — 1.5% | |
Atlas Copco AB, A Shares | | | 56,154 | | | | 1,377,166 | | |
UNITED KINGDOM — 3.2% | |
ARM Holdings Plc. | | | 111,213 | | | | 1,695,122 | | |
Burberry Group Plc. | | | 66,635 | | | | 1,172,385 | | |
| | | | | | 2,867,507 | | |
The accompanying notes are an integral part of the financial statements.
93
Annual Report December 31, 2015
December 31, 2015
Baillie Gifford Long Term Global Growth Equity Fund
| | | Shares | | Value | |
UNITED STATES — 58.5% | |
Alphabet, Inc., Class C (a) | | | 5,159 | | | $ | 3,915,062 | | |
Amazon.com, Inc. (a) | | | 12,603 | | | | 8,518,242 | | |
Bluebird Bio, Inc. (a) | | | 14,392 | | | | 924,254 | | |
Facebook, Inc., Class A (a) | | | 56,228 | | | | 5,884,822 | | |
Illumina, Inc. (a) | | | 41,758 | | | | 8,015,239 | | |
Intuitive Surgical, Inc. (a) | | | 6,034 | | | | 3,295,529 | | |
Ionis Pharmaceuticals, Inc. (a) | | | 29,345 | | | | 1,817,336 | | |
LendingClub Corp. (a) | | | 102,882 | | | | 1,136,846 | | |
LinkedIn Corp., Class A (a) | | | 9,111 | | | | 2,050,704 | | |
Netflix, Inc. (a) | | | 14,600 | | | | 1,669,948 | | |
salesforce.com, Inc. (a) | | | 27,098 | | | | 2,124,483 | | |
Seattle Genetics, Inc. (a) | | | 31,300 | | | | 1,404,744 | | |
Splunk, Inc. (a) | | | 21,975 | | | | 1,292,350 | | |
Stratasys Ltd. (a) | | | 14,300 | | | | 335,764 | | |
Tesla Motors, Inc. (a) | | | 20,613 | | | | 4,947,326 | | |
TripAdvisor, Inc. (a) | | | 18,143 | | | | 1,546,691 | | |
Twitter, Inc. (a) | | | 21,690 | | | | 501,907 | | |
Whole Foods Market, Inc. | | | 38,200 | | | | 1,279,700 | | |
Workday, Inc., Class A (a) | | | 23,891 | | | | 1,903,635 | | |
| | | | | | 52,564,582 | | |
TOTAL INVESTMENTS — 98.1% | |
(cost $79,421,418) | | | | $ | 88,059,982 | | |
Other assets less liabilities — 1.9% | | | | | 1,739,459 | | |
NET ASSETS — 100.0% | | | | $ | 89,799,441 | | |
(a) Non-income producing security.
(b) 144A — Securities are exempt from registration under Rule 144A of the Securities Act of 1933, as amended. These securities may be resold in transactions exempt from registration, normally to qualified institutional buyers. Prices are obtained daily from the London International Stock Exchange; therefore, Fair valuation is typically not required. At December 31, 2015, the net value of these securities was $1,068,972 representing 1.2% of net assets.
ADR — American Depositary Receipt.
The accompanying notes are an integral part of the financial statements.
94
Statement of Assets and Liabilities
Annual Report December 31, 2015
December 31, 2015
Baillie Gifford Long Term Global Growth Equity Fund
ASSETS | |
Investments, at value (cost $79,421,418) | | $ | 88,059,982 | | |
Cash | | | 1,813,472 | | |
Tax reclaims receivable | | | 11,420 | | |
Dividends receivable | | | 10,020 | | |
Other Assets | | | 459 | | |
Total Assets | | | 89,895,353 | | |
LIABILITIES | |
Management fee payable | | | 37,424 | | |
Servicing fee payable | | | 28,301 | | |
Trustee fee payable | | | 1,194 | | |
Accrued expenses | | | 28,993 | | |
Total Liabilities | | | 95,912 | | |
NET ASSETS | | $ | 89,799,441 | | |
COMPOSITION OF NET ASSETS | |
Paid-in capital | | $ | 80,683,659 | | |
Accumulated net investment loss | | | (294 | ) | |
Accumulated net realized gain on investments and foreign currency transactions | | | 477,930 | | |
Net unrealized appreciation in value of investments and foreign currencies | | | 8,638,146 | | |
| | | $ | 89,799,441 | | |
NET ASSET VALUE, PER SHARE | |
| Class 1 ($10,277,877 / 1,010,289 shares outstanding), unlimited authorized, no par value | | $ | 10.17 | | |
Maximum Purchase Price Per Share (Note D) | | $ | 10.19 | | |
Minimum Redemption Price Per Share (Note D) | | $ | 10.16 | | |
| Class 2 ($36,177,481 / 3,075,833 shares outstanding), unlimited authorized, no par value | | $ | 11.76 | | |
Maximum Purchase Price Per Share (Note D) | | $ | 11.78 | | |
Minimum Redemption Price Per Share (Note D) | | $ | 11.75 | | |
| Class 4 ($43,344,083 / 3,204,365 shares outstanding), unlimited authorized, no par value | | $ | 13.53 | | |
Maximum Purchase Price Per Share (Note D) | | $ | 13.55 | | |
Minimum Redemption Price Per Share (Note D) | | $ | 13.52 | | |
The accompanying notes are an integral part of the financial statements.
95
Annual Report December 31, 2015
For the Year Ended December 31, 2015
Baillie Gifford Long Term Global Growth Equity Fund
INVESTMENT INCOME | |
Dividends (net of foreign withholding taxes of $19,467) | | $ | 176,420 | | |
Interest | | | 1 | | |
Total Investment Income | | | 176,421 | | |
EXPENSES | |
Management fee (Note B) | | | 215,043 | | |
Shareholder Servicing fees — Class 1 Shares (Note B) | | | 12,038 | | |
Shareholder Servicing fees — Class 2 Shares (Note B) | | | 56,238 | | |
Shareholder Servicing fees — Class 4 Shares (Note B) | | | 6,924 | | |
Fund accounting | | | 77,065 | | |
Transfer agency | | | 24,726 | | |
Custody | | | 11,467 | | |
Legal | | | 6,016 | | |
Professional fees | | | 3,739 | | |
Trustees' fees | | | 2,714 | | |
Insurance | | | 342 | | |
Miscellaneous | | | 3,948 | | |
Total Expenses | | | 420,260 | | |
Fees waived | | | (58,336 | ) | |
Net Expenses | | | 361,924 | | |
Net Investment Loss | | | (185,503 | ) | |
REALIZED AND UNREALIZED GAIN (LOSS) ON INVESTMENTS
AND FOREIGN CURRENCY TRANSACTIONS | |
Net realized gain from: | |
Investments | | | 1,135,755 | | |
Foreign currency transactions | | | 21,167 | | |
| | | | 1,156,922 | | |
Net change in unrealized appreciation (depreciation) on: | |
Investments | | | 7,733,576 | | |
Translation of assets and liabilities denominated in foreign currencies | | | (408 | ) | |
| | | | 7,733,168 | | |
Net realized and unrealized gain on investments and foreign currency transactions | | | 8,890,090 | | |
NET INCREASE IN NET ASSETS FROM OPERATIONS | | $ | 8,704,587 | | |
The accompanying notes are an integral part of the financial statements.
96
Statements of Changes in Net Assets
Annual Report December 31, 2015
Baillie Gifford Long Term Global Growth Equity Fund
| | | For the
Year Ended
December 31,
2015 | | For the Period
June 10, 2014(a)
through
December 31,
2014 | |
INCREASE (DECREASE) IN NET ASSETS FROM OPERATIONS | |
Net investment loss | | $ | (185,503 | ) | | $ | (83,723 | ) | |
Net realized gain from investments and foreign currency transactions | | | 1,156,922 | | | | 273,598 | | |
Net change in unrealized appreciation (depreciation) on investments
and translation of assets and liabilities in foreign currencies | | | 7,733,168 | | | | 904,978 | | |
Net increase in net assets from operations | | | 8,704,587 | | | | 1,094,853 | | |
DIVIDENDS AND DISTRIBUTIONS TO SHAREHOLDERS FROM: | |
Capital gains: | |
Class 1 | | | (122,755 | ) | | | — | | |
Class 2 | | | (374,196 | ) | | | (23,988 | ) | |
Class 4 | | | (259,919 | ) | | | — | | |
Total Dividends and Distributions | | | (756,870 | ) | | | (23,988 | ) | |
TRANSACTIONS IN SHARES OF BENEFICIAL INTEREST | |
Net proceeds from shares subscribed: | |
Class 1 | | | 9,980,000 | | | | — | | |
Class 2 | | | 5,988,000 | | | | 25,000,000 | | |
Class 4 | | | 38,941,500 | | | | — | | |
Purchase fees: | |
Class 1 | | | 11,124 | | | | — | | |
Class 2 | | | 51,144 | | | | — | | |
Class 4 | | | 28,233 | | | | — | | |
Dividends reinvested: | |
Class 1 | | | 122,755 | | | | — | | |
Class 2 | | | 374,196 | | | | 23,988 | | |
Class 4 | | | 259,919 | | | | — | | |
Increase in Net Assets from Transactions in Shares of Beneficial Interest | | | 55,756,871 | | | | 25,023,988 | | |
Total Increase in Net Assets | | | 63,704,588 | | | | 26,094,853 | | |
NET ASSETS | |
Beginning of year | | | 26,094,853 | | | | — | | |
End of year (including accumulated net investment loss of
$294 and $0, respectively) | | $ | 89,799,441 | | | $ | 26,094,853 | | |
(a) Commencement of investment operations.
The accompanying notes are an integral part of the financial statements.
97
Annual Report December 31, 2015
Baillie Gifford Long Term Global Growth Equity Fund
Selected data for a Class 1 Share outstanding throughout the period:
| | | For the Period
July 6, 2015(a)
through
December 31,
2015 | |
Net asset value, beginning of period | | $ | 10.00 | | |
From Investment Operations | |
Net investment loss(b) | | | (0.03 | ) | |
Net realized and unrealized gain on investments and foreign currency transactions | | | 0.31 | | |
Net increase in net asset value from investment operations | | | 0.28 | | |
Dividends and Distributions to Shareholders | | | |
Distributions from net realized gain on investments | | | (0.12 | ) | |
Total Dividends and Distributions | | | (0.12 | ) | |
Proceeds from Purchase Fees and Redemption Fees(b) | | | 0.01 | | |
Net asset value, end of period | | $ | 10.17 | | |
Total Return | |
Total return based on net asset value(c) | | | 2.98 | % | |
Ratios/Supplemental Data | |
Net assets, end of period (000's omitted) | | $ | 10,278 | | |
Ratio of net expenses to average net assets, before waiver | | | 0.96 | %* | |
Ratio of net expenses to average net assets, after waiver | | | 0.85 | %* | |
Ratio of net investment loss to average net assets | | | (0.66 | )%* | |
Portfolio turnover rate(d) | | | 10 | % | |
* Annualized.
(a) Commencement of investment operations.
(b) Calculated based upon average shares outstanding during the period.
(c) Total return is calculated assuming an initial investment made at the net asset value at the beginning of the period, reinvestment of all dividends and distributions, if any, at net asset value during the period, and redemption on the last day of the period. Total return is not annualized for periods less than one year.
(d) Portfolio turnover rate calculated at Fund level.
The accompanying notes are an integral part of the financial statements.
98
Annual Report December 31, 2015
Baillie Gifford Long Term Global Growth Equity Fund
Selected data for a Class 2 Share outstanding throughout each period:
| | | For the
Year Ended
December 31,
2015 | | For the Period
June 10, 2014(a)
through
December 31,
2014 | |
Net asset value, beginning of period | | $ | 10.43 | | | $ | 10.00 | | |
From Investment Operations | |
Net investment loss(b) | | | (0.04 | ) | | | (0.03 | ) | |
Net realized and unrealized gain on investments
and foreign currency transactions | | | 1.47 | | | | 0.47 | | |
Net increase in net asset value from investment operations | | | 1.43 | | | | 0.44 | | |
Dividends and Distributions to Shareholders | | | | | |
Distributions from net realized gain on investments | | | (0.12 | ) | | | (0.01 | ) | |
Total Dividends and Distributions | | | (0.12 | ) | | | (0.01 | ) | |
Proceeds from Purchase Fees and Redemption Fees(b) | | | 0.02 | | | | — | | |
Net asset value, end of period | | $ | 11.76 | | | $ | 10.43 | | |
Total Return | |
Total return based on net asset value(c) | | | 13.99 | % | | | 4.39 | % | |
Ratios/Supplemental Data | |
Net assets, end of period (000's omitted) | | $ | 36,177 | | | $ | 26,095 | | |
Ratio of net expenses to average net assets, before waiver | | | 0.91 | % | | | 0.88 | %* | |
Ratio of net expenses to average net assets, after waiver | | | 0.77 | % | | | 0.80 | %* | |
Ratio of net investment loss to average net assets | | | (0.34 | )% | | | (0.57 | )%* | |
Portfolio turnover rate(d) | | | 10 | % | | | 8 | % | |
* Annualized.
(a) Commencement of investment operations.
(b) Calculated based upon average shares outstanding during the period.
(c) Total return is calculated assuming an initial investment made at the net asset value at the beginning of the period, reinvestment of all dividends and distributions, if any, at net asset value during the period, and redemption on the last day of the period. Total return is not annualized for periods less than one year.
(d) Portfolio turnover rate calculated at Fund level.
The accompanying notes are an integral part of the financial statements.
99
Annual Report December 31, 2015
Baillie Gifford Long Term Global Growth Equity Fund
Selected data for a Class 4 Share outstanding throughout the period:
| | | For the Period
October 7, 2015(a)
through
December 31,
2015 | |
Net asset value, beginning of period | | $ | 12.22 | | |
From Investment Operations | |
Net investment loss(b) | | | (0.01 | ) | |
Net realized and unrealized gain on investments and foreign currency transactions | | | 1.39 | | |
Net increase in net asset value from investment operations | | | 1.38 | | |
Dividends and Distributions to Shareholders | | | |
Distributions from net realized gain on investments | | | (0.08 | ) | |
Total Dividends and Distributions | | | (0.08 | ) | |
Proceeds from Purchase Fees and Redemption Fees(b) | | | 0.01 | | |
Net asset value, end of period | | $ | 13.53 | | |
Total Return | |
Total return based on net asset value(c) | | | 11.31 | % | |
Ratios/Supplemental Data | |
Net assets, end of period (000's omitted) | | $ | 43,344 | | |
Ratio of net expenses to average net assets, before waiver | | | 0.75 | %* | |
Ratio of net expenses to average net assets, after waiver | | | 0.67 | %* | |
Ratio of net investment loss to average net assets | | | (0.39 | )%* | |
Portfolio turnover rate(d) | | | 10 | % | |
* Annualized.
(a) Commencement of investment operations.
(b) Calculated based upon average shares outstanding during the period.
(c) Total return is calculated assuming an initial investment made at the net asset value at the beginning of the period, reinvestment of all dividends and distributions, if any, at net asset value during the period, and redemption on the last day of the period. Total return is not annualized for periods less than one year.
(d) Portfolio turnover rate calculated at Fund level.
The accompanying notes are an integral part of the financial statements.
100
Industry Diversification Table
Annual Report December 31, 2015
December 31, 2015 (unaudited)
Baillie Gifford International Choice Fund
| | | Value | | % of Total
Net Assets | |
Apparel Retailers | | $ | 16,136,060 | | | | 4.7 | % | |
Asset Managers | | | 11,872,845 | | | | 3.5 | | |
Auto Manufacturers | | | 5,096,812 | | | | 1.5 | | |
Auto Parts | | | 3,555,241 | | | | 1.0 | | |
Banks | | | 15,077,309 | | | | 4.4 | | |
Beverages, Food & Tobacco | | | 3,252,677 | | | | 1.0 | | |
Biotechnology | | | 3,219,091 | | | | 0.9 | | |
Brewers | | | 12,978,176 | | | | 3.8 | | |
Broadline Retailers | | | 6,367,016 | | | | 1.9 | | |
Bus, Train & Employment | | | 3,791,370 | | | | 1.1 | | |
Business Support Services | | | 8,570,004 | | | | 2.5 | | |
Clothing & Accessories | | | 5,557,446 | | | | 1.6 | | |
Containers & Packaging | | | 3,363,286 | | | | 1.0 | | |
Distillers & Vintners | | | 2,514,061 | | | | 0.7 | | |
Diversified Industrials | | | 3,777,348 | | | | 1.1 | | |
Drug Retailers | | | 2,753,119 | | | | 0.8 | | |
Electrical Components & Equipment | | | 2,739,810 | | | | 0.8 | | |
Electronic & Electrical Equipment | | | 4,376,123 | | | | 1.3 | | |
Electronic Equipment | | | 7,172,496 | | | | 2.1 | | |
Food Products | | | 13,006,564 | | | | 3.8 | | |
Food Retailers & Wholesalers | | | 7,677,572 | | | | 2.2 | | |
Footwear | | | 5,168,423 | | | | 1.5 | | |
General Mining | | | 1,386,414 | | | | 0.4 | | |
Holding Companies — Diversified | | | 1,989,798 | | | | 0.6 | | |
Industrial Machinery | | | 22,944,099 | | | | 6.7 | | |
Integrated Oil & Gas | | | 3,620,720 | | | | 1.1 | | |
Internet | | | 6,975,576 | | | | 2.0 | | |
Investment Companies | | | 1,447,913 | | | | 0.4 | | |
Investment Services | | | 4,206,510 | | | | 1.2 | | |
Media & Photography | | | 7,357,308 | | | | 2.2 | | |
Media Agencies | | | 6,337,439 | | | | 1.9 | | |
Medical Equipment | | | 13,364,728 | | | | 3.9 | | |
Nondurable Household Products | | | 8,474,004 | | | | 2.5 | | |
Nonlife Insurance | | | 6,235,846 | | | | 1.8 | | |
Oil Equipment & Services | | | 2,576,506 | | | | 0.8 | | |
Personal Products | | | 5,005,980 | | | | 1.5 | | |
Pharmaceuticals | | | 16,229,959 | | | | 4.8 | | |
Property & Casualty Insurance | | | 8,011,501 | | | | 2.3 | | |
Recreational Products | | | 7,938,978 | | | | 2.3 | | |
Restaurants & Bars | | | 1,729,323 | | | | 0.5 | | |
101
Industry Diversification Table
Annual Report December 31, 2015
| | | Value | | % of Total
Net Assets | |
Retailers — General | | $ | 6,133,810 | | | | 1.8 | % | |
Semiconductors | | | 20,114,231 | | | | 5.9 | | |
Specialised Consumer Services | | | 4,375,379 | | | | 1.3 | | |
Speciality Chemicals | | | 4,513,799 | | | | 1.3 | | |
Speciality Finance | | | 13,084,657 | | | | 3.8 | | |
Specialized Consumer Services | | | 11,537,138 | | | | 3.4 | | |
Travel & Tourism | | | 1,660,282 | | | | 0.5 | | |
Total Value of Investments | | | 335,274,747 | | | | 98.1 | | |
Other assets less liabilities | | | 6,550,725 | | | | 1.9 | | |
Net Assets | | $ | 341,825,472 | | | | 100.0 | % | |
102
Annual Report December 31, 2015
December 31, 2015
Baillie Gifford International Choice Fund
| | | Shares | | Value | |
COMMON STOCKS — 97.7% | |
AUSTRALIA — 5.3% | |
Brambles Ltd. | | | 401,592 | | | $ | 3,363,286 | | |
Cochlear Ltd. | | | 114,051 | | | | 7,892,483 | | |
Mesoblast Ltd. (a) | | | 359,292 | | | | 480,349 | | |
Mesoblast Ltd. ADR (a) | | | 5,800 | | | | 36,888 | | |
Seek Ltd. | | | 340,640 | | | | 3,791,370 | | |
Treasury Wine Estates Ltd. | | | 418,722 | | | | 2,514,061 | | |
| | | | | | 18,078,437 | | |
CHINA — 5.7% | |
Alibaba Group Holding Ltd. ADR (a) | | | 48,300 | | | | 3,925,341 | | |
Baidu, Inc. ADR (a) | | | 36,900 | | | | 6,975,576 | | |
Ctrip.com International Ltd. ADR (a) | | | 35,836 | | | | 1,660,282 | | |
JD.com, Inc. ADR (a) | | | 117,100 | | | | 3,778,232 | | |
Tsingtao Brewery Co., Ltd., Class H | | | 722,057 | | | | 3,252,677 | | |
| | | | | | 19,592,108 | | |
DENMARK — 5.6% | |
Carlsberg A/S, B Shares | | | 73,998 | | | | 6,555,608 | | |
Novo Nordisk A/S, B Shares | | | 171,199 | | | | 9,912,115 | | |
Novozymes A/S, B Shares | | | 56,431 | | | | 2,701,854 | | |
| | | | | | 19,169,577 | | |
FINLAND — 1.3% | |
Kone Oyj, B Shares | | | 103,362 | | | | 4,376,480 | | |
FRANCE — 0.8% | |
Legrand SA | | | 48,436 | | | | 2,739,810 | | |
GERMANY — 2.7% | |
adidas AG | | | 53,250 | | | | 5,168,423 | | |
Zalando SE 144A (a)(b) | | | 107,038 | | | | 4,234,200 | | |
| | | | | | 9,402,623 | | |
HONG KONG — 3.0% | |
BOC Hong Kong Holdings Ltd. | | | 667,040 | | | | 2,029,817 | | |
Cafe de Coral Holdings Ltd. | | | 680,298 | | | | 1,993,643 | | |
Jardine Matheson Holdings Ltd. | | | 78,000 | | | | 3,777,348 | | |
The accompanying notes are an integral part of the financial statements.
103
Annual Report December 31, 2015
December 31, 2015
Baillie Gifford International Choice Fund
| | | Shares | | Value | |
Jardine Strategic Holdings Ltd. | | | 73,000 | | | $ | 1,989,798 | | |
Li & Fung Ltd. | | | 459,218 | | | | 310,563 | | |
| | | | | | 10,101,169 | | |
INDIA — 1.5% | |
Mahindra & Mahindra Ltd. GDR | | | 266,711 | | | | 5,096,812 | | |
ISRAEL — 0.1% | |
Protalix BioTherapeutics, Inc. (a) | | | 329,319 | | | | 335,905 | | |
JAPAN — 18.9% | |
Asahi Group Holdings Ltd. | | | 153,000 | | | | 4,789,575 | | |
DENSO Corp. | | | 74,400 | | | | 3,555,241 | | |
Japan Exchange Group, Inc. | | | 269,100 | | | | 4,206,510 | | |
Kakaku.com, Inc. | | | 124,300 | | | | 2,444,932 | | |
Kao Corp. | | | 164,900 | | | | 8,474,004 | | |
MS&AD Insurance Group Holdings, Inc. | | | 273,200 | | | | 8,011,501 | | |
Olympus Corp. | | | 139,000 | | | | 5,472,245 | | |
Rakuten, Inc. | | | 448,600 | | | | 5,166,865 | | |
Shimano, Inc. | | | 51,700 | | | | 7,938,978 | �� | |
Shiseido Co., Ltd. | | | 226,300 | | | | 4,695,417 | | |
SMC Corp. | | | 12,300 | | | | 3,194,727 | | |
SUGI Holdings Co., Ltd. | | | 49,900 | | | | 2,753,119 | | |
THK Co., Ltd. | | | 218,500 | | | | 4,049,698 | | |
| | | | | | 64,752,812 | | |
MEXICO — 0.8% | |
Wal-Mart de Mexico SAB de CV | | | 1,025,900 | | | | 2,588,784 | | |
PHILIPPINES — 0.4% | |
Puregold Price Club, Inc. | | | 1,995,000 | | | | 1,471,183 | | |
PORTUGAL — 1.0% | |
Jeronimo Martins SGPS SA | | | 252,574 | | | | 3,286,607 | | |
SINGAPORE — 1.4% | |
United Overseas Bank Ltd. | | | 341,011 | | | | 4,701,456 | | |
The accompanying notes are an integral part of the financial statements.
104
Annual Report December 31, 2015
December 31, 2015
Baillie Gifford International Choice Fund
| | | Shares | | Value | |
SOUTH AFRICA — 2.9% | |
Clicks Group Ltd. | | | 463,598 | | | $ | 2,668,984 | | |
Naspers Ltd., N Shares | | | 53,827 | | | | 7,357,308 | | |
| | | | | | 10,026,292 | | |
SOUTH KOREA — 3.5% | |
Samsung Electronics Co., Ltd. GDR (b) | | | 10,513 | | | | 5,573,835 | | |
Samsung Fire & Marine Insurance Co., Ltd. | | | 23,855 | | | | 6,235,846 | | |
| | | | | | 11,809,681 | | |
SPAIN — 3.4% | |
Corporacion Financiera Alba SA | | | 33,550 | | | | 1,447,913 | | |
Distribuidora Internacional de Alimentacion SA (a) | | | 744,468 | | | | 4,390,965 | | |
Inditex SA | | | 165,758 | | | | 5,694,502 | | |
| | | | | | 11,533,380 | | |
SWEDEN — 7.6% | |
Atlas Copco AB, B Shares | | | 261,210 | | | | 6,005,322 | | |
Investment AB Kinnevik, B Shares | | | 275,521 | | | | 8,486,400 | | |
Investor AB, B Shares | | | 125,122 | | | | 4,598,257 | | |
Svenska Handelsbanken AB, A Shares | | | 526,539 | | | | 6,993,219 | | |
| | | | | | 26,083,198 | | |
SWITZERLAND — 7.3% | |
Compagnie Financiere Richemont SA | | | 42,387 | | | | 3,033,762 | | |
Mettler-Toledo International, Inc. (a) | | | 16,226 | | | | 5,502,724 | | |
Nestle SA | | | 84,299 | | | | 6,257,958 | | |
Roche Holding AG — Genusschein | | | 21,587 | | | | 5,981,939 | | |
Schindler Holding AG, Participating Certificates | | | 24,842 | | | | 4,156,040 | | |
| | | | | | 24,932,423 | | |
TAIWAN — 3.8% | |
Delta Electronics, Inc. | | | 355,000 | | | | 1,669,772 | | |
Hon Hai Precision Industry Co., Ltd. GDR Reg S | | | 862,972 | | | | 4,376,123 | | |
Taiwan Semiconductor Manufacturing Co., Ltd. ADR | | | 304,741 | | | | 6,932,858 | | |
| | | | | | 12,978,753 | | |
THAILAND — 0.5% | |
Thai Beverage PCL | | | 3,363,800 | | | | 1,632,993 | | |
The accompanying notes are an integral part of the financial statements.
105
Annual Report December 31, 2015
December 31, 2015
Baillie Gifford International Choice Fund
| | | Shares | | Value | |
UNITED KINGDOM — 20.2% | |
ARM Holdings Plc. | | | 408,920 | | | $ | 6,232,807 | | |
ASOS Plc. (a) | | | 122,168 | | | | 6,207,358 | | |
Auto Trader Group Plc. 144A (a)(b) | | | 671,081 | | | | 4,375,379 | | |
BG Group Plc. | | | 249,775 | | | | 3,620,720 | | |
BHP Billiton Plc. | | | 124,321 | | | | 1,386,414 | | |
Burberry Group Plc. | | | 143,439 | | | | 2,523,684 | | |
Capita Plc. | | | 277,789 | | | | 4,942,593 | | |
Hargreaves Lansdown Plc. | | | 404,033 | | | | 8,969,837 | | |
Imagination Technologies Group Plc. (a) | | | 698,869 | | | | 1,374,731 | | |
Intertek Group Plc. | | | 88,675 | | | | 3,627,411 | | |
John Wood Group Plc. | | | 286,079 | | | | 2,576,506 | | |
Johnson Matthey Plc. | | | 115,389 | | | | 4,513,799 | | |
Jupiter Fund Management Plc. | | | 436,814 | | | | 2,903,008 | | |
Mitchells & Butlers Plc. | | | 342,108 | | | | 1,729,323 | | |
Rightmove Plc. | | | 104,285 | | | | 6,337,439 | | |
Unilever Plc. | | | 157,338 | | | | 6,748,606 | | |
Weir Group Plc. (The) | | | 79,096 | | | | 1,161,832 | | |
| | | | | | 69,231,447 | | |
Total Common Stocks | |
(cost $314,988,573) | | | | | 333,921,930 | | |
PREFERRED STOCKS — 0.4% | |
BRAZIL — 0.4% | |
Itau Unibanco Holding SA ADR (cost $2,393,834) | | | 207,806 | | | | 1,352,817 | | |
TOTAL INVESTMENTS — 98.1% | |
(cost $317,382,407) | | | | $ | 335,274,747 | | |
Other assets less liabilities — 1.9% | | | | | 6,550,725 | | |
NET ASSETS — 100.0% | | | | $ | 341,825,472 | | |
(a) Non-income producing security.
(b) 144A — Securities are exempt from registration under Rule 144A of the Securities Act of 1933, as amended. These securities may be resold in transactions exempt from registration, normally to qualified institutional buyers. Prices are obtained daily from the London International Stock Exchange; therefore, Fair valuation is typically not required. At December 31, 2015, the net value of these securities was $14,183,414 representing 4.1% of net assets.
ADR — American Depositary Receipt.
GDR — Global Depositary Receipt.
Reg S — Regulation S ("Reg S") of the Securities Act of 1933, as amended ("1933 Act") is a safe harbor that defines when an offering of securities will be deemed to come to rest abroad and therefore is not subject to the registration obligations imposed under Section 5 of the 1933 Act. The regulation includes two safe harbor provisions: an issuer safe harbor and a resale safe harbor. In each case, the regulation demands that offers and sales of the securities be made outside the United States and that no offering participant (which includes the issuer, the banks assisting with the offer and their respective affiliates) engage in "directed" selling efforts. In the case of issuers for whose securities there is substantial U.S. market interest, the regulation also requires that no offers and sales be made to U.S. persons (including U.S. persons physically located outside the United States).
The accompanying notes are an integral part of the financial statements.
106
Statement of Assets and Liabilities
Annual Report December 31, 2015
December 31, 2015
Baillie Gifford International Choice Fund
ASSETS | |
Investments, at value (cost $317,382,407) | | $ | 335,274,747 | | |
Cash | | | 2,923,999 | | |
Foreign cash, at value (cost $3,500,818) | | | 3,468,379 | | |
Dividends receivable | | | 325,644 | | |
Tax reclaims receivable | | | 291,361 | | |
Receivable for investments sold | | | 58,295 | | |
Total Assets | | | 342,342,425 | | |
LIABILITIES | |
Management fee payable | | | 304,031 | | |
Servicing fee payable | | | 131,831 | | |
Trustee fee payable | | | 4,647 | | |
Accrued expenses | | | 76,444 | | |
Total Liabilities | | | 516,953 | | |
NET ASSETS | | $ | 341,825,472 | | |
COMPOSITION OF NET ASSETS | |
Paid-in capital | | $ | 336,962,048 | | |
Distributions in excess of net investment income | | | (920,335 | ) | |
Accumulated net realized loss on investments and foreign currency transactions | | | (12,078,769 | ) | |
Net unrealized appreciation in value of investments and foreign currencies | | | 17,862,528 | | |
| | | $ | 341,825,472 | | |
NET ASSET VALUE, PER SHARE | |
| Class 1 ($16,169,820 / 1,417,122 shares outstanding), unlimited authorized, no par value | | $ | 11.41 | | |
Maximum Purchase Price Per Share (Note D) | | $ | 11.44 | | |
Minimum Redemption Price Per Share (Note D) | | $ | 11.40 | | |
| Class 2 ($217,719,781 / 18,888,075 shares outstanding), unlimited authorized, no par value | | $ | 11.53 | | |
Maximum Purchase Price Per Share (Note D) | | $ | 11.56 | | |
Minimum Redemption Price Per Share (Note D) | | $ | 11.52 | | |
| Class 3 ($107,935,871 / 9,267,332 shares outstanding), unlimited authorized, no par value | | $ | 11.65 | | |
Maximum Purchase Price Per Share (Note D) | | $ | 11.68 | | |
Minimum Redemption Price Per Share (Note D) | | $ | 11.64 | | |
The accompanying notes are an integral part of the financial statements.
107
Annual Report December 31, 2015
For the Year Ended December 31, 2015
Baillie Gifford International Choice Fund
INVESTMENT INCOME | |
Dividends (net of foreign withholding taxes of $682,973) | | $ | 7,203,176 | | |
Interest | | | 140 | | |
Total Investment Income | | | 7,203,316 | | |
EXPENSES | |
Management fee (Note B) | | | 1,252,986 | | |
Shareholder Servicing fees — Class 1 Shares (Note B) | | | 41,606 | | |
Shareholder Servicing fees — Class 2 Shares (Note B) | | | 391,628 | | |
Shareholder Servicing fees — Class 3 Shares (Note B) | | | 111,010 | | |
Fund accounting | | | 215,316 | | |
Custody | | | 70,034 | | |
Transfer agency | | | 44,594 | | |
Legal | | | 32,564 | | |
Trustees' fees | | | 19,060 | | |
Professional fees | | | 13,396 | | |
Insurance | | | 3,770 | | |
Miscellaneous | | | 4,457 | | |
Total Expenses | | | 2,200,421 | | |
Net Investment Income | | | 5,002,895 | | |
REALIZED AND UNREALIZED GAIN (LOSS) ON INVESTMENTS
AND FOREIGN CURRENCY TRANSACTIONS | |
Net realized gain (loss) from: | |
Investments | | | (11,851,586 | ) | |
Foreign currency transactions | | | 37,478 | | |
| | | | (11,814,108 | ) | |
Net change in unrealized appreciation (depreciation) on: | |
Investments | | | 13,299,063 | | |
Translation of assets and liabilities denominated in foreign currencies | | | (5,072 | ) | |
| | | | 13,293,991 | | |
Net realized and unrealized gain on investments and foreign currency transactions | | | 1,479,883 | | |
NET INCREASE IN NET ASSETS FROM OPERATIONS | | $ | 6,482,778 | | |
The accompanying notes are an integral part of the financial statements.
108
Statements of Changes in Net Assets
Annual Report December 31, 2015
Baillie Gifford International Choice Fund
| | | For the
Year Ended
December 31,
2015 | | For the
Year Ended
December 31,
2014 | |
INCREASE (DECREASE) IN NET ASSETS FROM OPERATIONS | |
Net investment income | | $ | 5,002,895 | | | $ | 5,006,754 | | |
Net realized gain (loss) from investments and foreign currency transactions | | | (11,814,108 | ) | | | 3,599,633 | | |
Net change in unrealized appreciation (depreciation) on investments
and translation of assets and liabilities in foreign currencies | | | 13,293,991 | | | | (18,069,373 | ) | |
Net increase (decrease) in net assets from operations | | | 6,482,778 | | | | (9,462,986 | ) | |
DIVIDENDS AND DISTRIBUTIONS TO SHAREHOLDERS FROM: | |
Net investment income: | |
Class 1 | | | (223,516 | ) | | | (204,051 | ) | |
Class 2 | | | (3,152,571 | ) | | | (3,555,055 | ) | |
Class 3 | | | (1,621,215 | ) | | | (1,598,567 | ) | |
Capital gains: | |
Class 1 | | | — | | | | (166,643 | ) | |
Class 2 | | | — | | | | (2,534,923 | ) | |
Class 3 | | | — | | | | (1,086,259 | ) | |
Total Dividends and Distributions | | | (4,997,302 | ) | | | (9,145,498 | ) | |
TRANSACTIONS IN SHARES OF BENEFICIAL INTEREST | |
Net proceeds from shares subscribed: | |
Class 1 | | | — | | | | 16,949,000 | | |
Class 2 | | | — | | | | 83,102,298 | | |
Purchase fees: | |
Class 1 | | | — | | | | 2,204 | | |
Class 2 | | | — | | | | 158,176 | | |
Class 3 | | | — | | | | 72,187 | | |
Redemption fees: | |
Class 1 | | | 2,806 | | | | 174 | | |
Class 2 | | | 41,610 | | | | 3,597 | | |
Class 3 | | | 18,709 | | | | 1,732 | | |
Dividends reinvested: | |
Class 1 | | | 223,516 | | | | 370,694 | | |
Class 2 | | | 3,152,571 | | | | 6,089,979 | | |
Class 3 | | | 1,621,215 | | | | 2,684,825 | | |
Cost of shares redeemed: | |
Class 2 | | | (32,063,125 | ) | | | (3,001,502 | ) | |
Increase (Decrease) in Net Assets from Transactions in Shares of Beneficial Interest | | | (27,002,698 | ) | | | 106,433,364 | | |
Total Increase (Decrease) in Net Assets | | | (25,517,222 | ) | | | 87,824,880 | | |
NET ASSETS | |
Beginning of year | | | 367,342,694 | | | | 279,517,814 | | |
End of year (including distributions in excess of net investment income of
$920,335 and $1,089,282, respectively) | | $ | 341,825,472 | | | $ | 367,342,694 | | |
| | | | | | |
The accompanying notes are an integral part of the financial statements.
109
Annual Report December 31, 2015
Baillie Gifford International Choice Fund
Selected data for a Class 1 Share outstanding throughout each period:
| | | For the
Year Ended
December 31,
2015 | | For the Period
April 9, 2014(a)
through
December 31,
2014 | |
Net asset value, beginning of period | | $ | 11.40 | | | $ | 12.41 | | |
From Investment Operations | |
Net investment income(b) | | | 0.16 | | | | 0.08 | | |
Net realized and unrealized gain (loss) on investments and foreign currency transactions | | | 0.01 | | | | (0.82 | ) | |
Net increase (decrease) in net asset value from investment operations | | | 0.17 | | | | (0.74 | ) | |
Dividends and Distributions to Shareholders | | | | | | | | | |
Dividends from net investment income | | | (0.16 | ) | | | (0.15 | ) | |
Distributions from net realized gain on investments | | | — | | | | (0.12 | ) | |
Total Dividends and Distributions | | | (0.16 | ) | | | (0.27 | ) | |
Proceeds from Purchase Fees and Redemption Fees(b) | | | 0.00 | (c) | | | 0.00 | | |
Net asset value, end of period | | $ | 11.41 | | | $ | 11.40 | | |
Total Return | |
Total return based on net asset value(d) | | | 1.48 | % | | | (5.98 | )% | |
Ratios/Supplemental Data | |
Net assets, end of period (000's omitted) | | $ | 16,170 | | | $ | 15,934 | | |
Ratio of net expenses to average net assets | | | 0.71 | % | | | 0.83 | %* | |
Ratio of net investment income to average net assets | | | 1.30 | % | | | 0.91 | %* | |
Portfolio turnover rate(e) | | | 15 | % | | | 9 | % | |
* Annualized.
(a) Commencement of investment operations.
(b) Calculated based upon average shares outstanding during the period.
(c) Amount is less than $0.005 per share.
(d) Total return is calculated assuming an initial investment made at the net asset value at the beginning of the period, reinvestment of all dividends and distributions, if any, at net asset value during the period, and redemption on the last day of the period. Total return is not annualized for periods less than one year.
(e) Portfolio turnover rate calculated at Fund level.
The accompanying notes are an integral part of the financial statements.
110
Annual Report December 31, 2015
Baillie Gifford International Choice Fund
Selected data for a Class 2 Share outstanding throughout each period:
| | | For the
Year Ended
December 31,
2015 | | For the
Year Ended
December 31,
2014 | | For the Period
April 9, 2013(a)
through
December 31,
2013 | |
Net asset value, beginning of period | | $ | 11.51 | | | $ | 12.20 | | | $ | 11.00 | | |
From Investment Operations | |
Net investment income(b) | | | 0.16 | | | | 0.17 | | | | 0.08 | | |
Net realized and unrealized gain (loss) on investments and
foreign currency transactions | | | 0.03 | | | | (0.58 | ) | | | 1.19 | | |
Net increase (decrease) in net asset value from
investment operations | | | 0.19 | | | | (0.41 | ) | | | 1.27 | | |
Dividends and Distributions to Shareholders | | | | | | | | | | | | | |
Dividends from net investment income | | | (0.17 | ) | | | (0.17 | ) | | | (0.09 | ) | |
Distributions from net realized gain on investments | | | — | | | | (0.12 | ) | | | — | | |
Total Dividends and Distributions | | | (0.17 | ) | | | (0.29 | ) | | | (0.09 | ) | |
Proceeds from Purchase Fees and
Redemption Fees(b) | | | 0.00 | (c) | | | 0.01 | | | | 0.02 | | |
Net asset value, end of period | | $ | 11.53 | | | $ | 11.51 | | | $ | 12.20 | | |
Total Return | |
Total return based on net asset value(d) | | | 1.56 | % | | | (3.29 | )% | | | 11.76 | % | |
Ratios/Supplemental Data | |
Net assets, end of period (000's omitted) | | $ | 217,720 | | | $ | 245,206 | | | $ | 169,778 | | |
Ratio of net expenses to average net assets, before waiver | | | 0.63 | % | | | 0.63 | % | | | 0.67 | %* | |
Ratio of net expenses to average net assets, after waiver | | | 0.63 | % | | | 0.63 | % | | | 0.66 | %* | |
Ratio of net investment income to average net assets | | | 1.38 | % | | | 1.35 | % | | | 0.98 | %* | |
Portfolio turnover rate(e) | | | 15 | % | | | 9 | % | | | 11 | % | |
* Annualized.
(a) Commencement of investment operations.
(b) Calculated based upon average shares outstanding during the period.
(c) Amount is less than $0.005 per share.
(d) Total return is calculated assuming an initial investment made at the net asset value at the beginning of the period, reinvestment of all dividends and distributions, if any, at net asset value during the period, and redemption on the last day of the period. Total return is not annualized for periods less than one year.
(e) Portfolio turnover rate calculated at Fund level.
The accompanying notes are an integral part of the financial statements.
111
Annual Report December 31, 2015
Baillie Gifford International Choice Fund
Selected data for a Class 3 Share outstanding throughout each period:
| | | For the
Year Ended
December 31,
2015 | | For the
Year Ended
December 31,
2014 | | For the Period
April 30, 2013(a)
through
December 31,
2013 | |
Net asset value, beginning of period | | $ | 11.63 | | | $ | 12.33 | | | $ | 11.50 | | |
From Investment Operations | |
Net investment income(b) | | | 0.18 | | | | 0.17 | | | | 0.09 | | |
Net realized and unrealized gain (loss) on investments and
foreign currency transactions | | | 0.02 | | | | (0.58 | ) | | | 0.82 | | |
Net increase (decrease) in net asset value from
investment operations | | | 0.20 | | | | (0.41 | ) | | | 0.91 | | |
Dividends and Distributions to Shareholders | | | | | | | |
Dividends from net investment income | | | (0.18 | ) | | | (0.18 | ) | | | (0.10 | ) | |
Distributions from net realized gain on investments | | | — | | | | (0.12 | ) | | | — | | |
Total Dividends and Distributions | | | (0.18 | ) | | | (0.30 | ) | | | (0.10 | ) | |
Proceeds from Purchase Fees and
Redemption Fees(b) | | | 0.00 | (c) | | | 0.01 | | | | 0.02 | | |
Net asset value, end of period | | $ | 11.65 | | | $ | 11.63 | | | $ | 12.33 | | |
Total Return | |
Total return based on net asset value(d) | | | 1.63 | % | | | (3.26 | )% | | | 8.11 | % | |
Ratios/Supplemental Data | |
Net assets, end of period (000's omitted) | | $ | 107,936 | | | $ | 106,203 | | | $ | 109,740 | | |
Ratio of net expenses to average net assets, before waiver | | | 0.56 | % | | | 0.56 | % | | | 0.58 | %* | |
Ratio of net expenses to average net assets, after waiver | | | 0.56 | % | | | 0.56 | % | | | 0.58 | %* | |
Ratio of net investment income to average net assets | | | 1.45 | % | | | 1.38 | % | | | 1.10 | %* | |
Portfolio turnover rate(e) | | | 15 | % | | | 9 | % | | | 11 | % | |
* Annualized.
(a) Commencement of investment operations.
(b) Calculated based upon average shares outstanding during the period.
(c) Amount is less than $0.005 per share.
(d) Total return is calculated assuming an initial investment made at the net asset value at the beginning of the period, reinvestment of all dividends and distributions, if any, at net asset value during the period, and redemption on the last day of the period. Total return is not annualized for periods less than one year.
(e) Portfolio turnover rate calculated at Fund level.
The accompanying notes are an integral part of the financial statements.
112
Notes to Financial Statements
Annual Report December 31, 2015
Note A — Organization and Accounting Policies
Each of Baillie Gifford International Equity Fund ("International Equity Fund"), Baillie Gifford EAFE Fund ("EAFE Fund"), Baillie Gifford EAFE Choice Fund ("EAFE Choice Fund"), Baillie Gifford EAFE Pure Fund ("EAFE Pure Fund"), Baillie Gifford Emerging Markets Fund ("Emerging Markets Fund"), Baillie Gifford Global Alpha Equity Fund ("Global Alpha Equity Fund"), Baillie Gifford Long Term Global Growth Equity Fund ("Long Term Global Growth Equity Fund") and Baillie Gifford International Choice Fund ("International Choice Fund"), (each, a "Fund", and collectively, the "Funds") is a series of Baillie Gifford Funds (the "Trust"). The Trust is a diversified open-end management investment company registered under the
Investment Company Act of 1940, as amended. Effective April 2, 2015, the shares of all Funds except for the International Choice Fund have been registered for public offer and sale under the Securities Act of 1933, as amended. The Trust is organized as a Massachusetts business trust under the laws of Massachusetts pursuant to an Amended and Restated Agreement and Declaration of Trust dated December 31, 2014.
Effective January 1, 2015, the share class structure of the Emerging Markets Fund was changed as follows: Class I shares were converted into Class 1 shares; Class II shares were converted into Class 2 shares; and Class III shares were converted into Class 5 shares. The Fund also added Class 3 and Class 4 shares. The purpose of these changes was to standardize the Fund's share classes such that all Funds offer the same Class 1, Class 2, Class 3, Class 4 and Class 5 shares.
The following table is a summary of classes issued and offered as of December 31, 2015:
| | | International
Equity | | EAFE | | EAFE
Choice | | EAFE
Pure | | Emerging
Markets | | Global Alpha
Equity | | Long Term
Global
Growth
Equity | | International
Choice | |
Class 1 | | | N/A | | | | N/A | | | | X | | | | N/A | | | | N/A | | | | N/A | | | | X | | | | X | | |
Class 2 | | | X | | | | X | | | | X | | | | X | | | | X | | | | X | | | | X | | | | X | | |
Class 3 | | | X | | | | X | | | | X | | | | N/A | | | | N/A | | | | X | | | | N/A | | | | X | | |
Class 4 | | | N/A | | | | X | | | | N/A | | | | N/A | | | | X | | | | N/A | | | | X | | | | N/A | | |
Class 5 | | | X | | | | X | | | | N/A | | | | N/A | | | | X | | | | N/A | | | | N/A | | | | N/A | | |
The financial statements of the Funds have been prepared in conformity with accounting principles generally accepted in the United States of America ("GAAP"). Management is required to make certain estimates and assumptions that affect the reported amounts of assets and liabilities for the Funds and disclosure of contingent assets and liabilities for the Funds at the date of the financial statements and the reported amounts of increases and decreases in net assets from operations for the Funds during the reporting period. Actual results could differ from those estimates.
The following is a summary of significant accounting policies followed by the Funds:
Valuation of Investments
Equity securities listed on an established securities exchange are normally valued at their last sale price on the exchange where primarily traded. Equity securities listed on the NASDAQ National Market System are valued at the NASDAQ Official Closing Price. Equity securities listed on an established securities exchange or on the NASDAQ National Market System for which there is no reported sale during the day are valued at the mean between the last available bid and asked prices. Other securities for which current market quotations are not readily available (or for which quotations are not believed to be reliable due to market changes that occur after the most recent available quotations are obtained or any other reason), and all other assets, are taken at fair value as determined in good faith by Baillie Gifford Overseas Limited (the "Manager"), pursuant to procedures approved by the board of trustees of the Trust
113
Notes to Financial Statements
Annual Report December 31, 2015
(the "Board"). The actual calculations may be made by persons acting pursuant to the direction of the Board or by pricing services.
Generally, trading in foreign securities markets is substantially completed each day at various times prior to close of regular trading on the New York Stock Exchange. Occasionally, events affecting the value of foreign fixed income securities and of equity securities of non-U.S. issuers not traded on a U.S. exchange may occur between the completion of substantial trading of such securities for the day and the close of regular trading on the New York Stock Exchange, which events may not be reflected in the computation of a Fund's net asset values. If events materially affecting the value of the Funds' portfolio securities occur during such period, then these securities will be valued at their fair value as determined in good faith by the Manager, pursuant to procedures approved by the Board. The Funds utilize a third party pricing service which for all equity securities, except those traded on a Canadian, Latin American or U.S. exchange, subject to certain minimum confidence levels applies a fair value adjustment that seeks to reflect changes in such securities' market prices since the close of the market on which they are traded. To the extent that securities are valued using this service, they will be classified as Level 2 securities in the fair value measurement framework described below.
The Funds invest in obligations of foreign entities and securities denominated in foreign currencies. Such investments involve risk not typically involved with domestic investments. Such risks include fluctuations in foreign exchange rates, inability to convert proceeds into U.S. dollars, application of foreign tax laws, foreign investment restrictions, less publicly available information about foreign financial instruments, less liquidity resulting from substantially less trading volume, more volatile prices, and generally less government supervision of foreign securities markets and issuers.
Fair Value Measurement
GAAP provides guidance on fair value measurements and defines fair value as the price that a Fund would receive to sell an investment or pay to transfer a liability
in a timely transaction with an independent buyer in the principal market, or in the absence of a principal market the most advantageous market for the investment or liability. It establishes a single definition of fair value, creates a three-tier hierarchy as a framework for measuring fair value based on inputs used to value the Fund's investments, and requires additional disclosure about fair value. The hierarchy of inputs is summarized below:
Level 1 — unadjusted quoted prices in active markets for identical investments
Level 2 — other significant observable inputs (including quoted prices for similar investments, interest rates, prepayment speeds, credit risk, etc.)
Level 3 — significant unobservable inputs (including the Trust's own assumptions in determining the fair value of investments)
For Level 1 inputs, the Funds use unadjusted quoted prices in active markets for assets or liabilities with sufficient frequency and volume to provide pricing information as the most reliable evidence of fair value.
The Funds' Level 2 valuation techniques include inputs other than quoted prices within Level 1 that are observable for an asset or liability, either directly or indirectly. Level 2 observable inputs may include quoted prices for similar assets and liabilities in active markets or quoted prices for identical or similar assets or liabilities in markets that are not active in which there are few transactions, the prices are not current, or price quotations vary substantially over time or among market participants. Inputs that are observable for the asset or liability in Level 2 include such factors as interest rates, yield curves, prepayment speeds, credit risk, and default rates for similar liabilities.
For Level 3 valuation techniques, the Funds use unobservable inputs that reflect assumptions market participants would be expected to use in pricing the asset or liability. Unobservable inputs are used to measure fair value to the extent that observable inputs are not available and are developed based on the best information available under the circumstances. In developing unobservable inputs, market participant assumptions are used if they are reasonably available without undue cost and effort.
114
Notes to Financial Statements
Annual Report December 31, 2015
The inputs or methodology used for valuing securities are not necessarily an indication of the risk associated with investing in those securities. The following is a summary of the inputs used as of December 31, 2015 in valuing the Funds' investments carried at fair value:
International Equity Fund
Investments in Securities | | Level 1 | | Level 2 | | Level 3 | | Total | |
Common Stocks | |
Argentina | | $ | 25,363,242 | | | $ | — | | | $ | — | | | $ | 25,363,242 | | |
Australia | | | — | | | | 47,520,742 | | | | — | | | | 47,520,742 | | |
Bermuda | | | — | | | | 2,881,756 | | | | — | | | | 2,881,756 | | |
Brazil | | | 17,678,627 | | | | — | | | | — | | | | 17,678,627 | | |
Canada | | | 68,572,726 | | | | — | | | | — | | | | 68,572,726 | | |
China | | | 42,010,482 | | | | 10,662,256 | | | | — | | | | 52,672,738 | | |
Denmark | | | — | | | | 67,807,584 | | | | — | | | | 67,807,584 | | |
Finland | | | — | | | | 41,787,088 | | | | — | | | | 41,787,088 | | |
France | | | — | | | | 27,093,691 | | | | — | | | | 27,093,691 | | |
Germany | | | — | | | | 100,729,023 | | | | — | | | | 100,729,023 | | |
Hong Kong | | | — | | | | 48,509,727 | | | | — | | | | 48,509,727 | | |
India | | | 4,971,080 | | | | 2,851,517 | | | | — | | | | 7,822,597 | | |
Ireland | | | 41,384,511 | | | | 44,216,137 | | | | — | | | | 85,600,648 | | |
Japan | | | — | | | | 243,697,187 | | | | — | | | | 243,697,187 | | |
Netherlands | | | 37,668,002 | | | | 26,301,345 | | | | — | | | | 63,969,347 | | |
Peru | | | 8,760,844 | | | | — | | | | — | | | | 8,760,844 | | |
Russia | | | — | | | | 14,881,066 | | | | — | | | | 14,881,066 | | |
Singapore | | | — | | | | 24,762,554 | | | | — | | | | 24,762,554 | | |
South Africa | | | — | | | | 47,622,734 | | | | — | | | | 47,622,734 | | |
South Korea | | | — | | | | 68,569,983 | | | | — | | | | 68,569,983 | | |
Spain | | | — | | | | 47,275,472 | | | | — | | | | 47,275,472 | | |
Sweden | | | — | | | | 75,239,052 | | | | — | | | | 75,239,052 | | |
Switzerland | | | — | | | | 77,757,384 | | | | — | | | | 77,757,384 | | |
Taiwan | | | — | | | | 70,116,160 | | | | — | | | | 70,116,160 | | |
United Kingdom | | | — | | | | 274,985,474 | | | | 157,140 | | | | 275,142,614 | | |
United States | | | 23,296,150 | | | | — | | | | — | | | | 23,296,150 | | |
| | | 269,705,664 | | | | 1,365,267,932 | | | | 157,140 | | | | 1,635,130,736 | | |
Preferred Stocks | |
Brazil | | | 8,158,625 | | | | — | | | | — | | | | 8,158,625 | | |
| | $ | 277,864,289 | | | $ | 1,365,267,932 | | | $ | 157,140 | | | $ | 1,643,289,361 | | |
For the International Equity Fund fair value of Level 2 and Level 1 investments at December 31, 2014 was $1,917,090,343 and $335,946,812,respectively. $31,165,728 was transferred out of Level 2 into Level 1 and $19,480,276 was transferred out of Level 1 to Level 2 during the year ended December 31, 2015.
115
Notes to Financial Statements
Annual Report December 31, 2015
EAFE Fund
Investments in Securities | | Level 1 | | Level 2 | | Level 3 | | Total | |
Common Stocks | |
Argentina | | $ | 22,607,877 | | | $ | — | | | $ | — | | | $ | 22,607,877 | | |
Austria | | | — | | | | 12,095,238 | | | | — | | | | 12,095,238 | | |
China | | | 231,076,123 | | | | 107,535,242 | | | | — | | | | 338,611,365 | | |
Denmark | | | — | | | | 110,286,897 | | | | — | | | | 110,286,897 | | |
France | | | — | | | | 118,252,787 | | | | — | | | | 118,252,787 | | |
Germany | | | 53,633,601 | | | | 73,800,765 | | | | — | | | | 127,434,366 | | |
Hong Kong | | | — | | | | 121,237,851 | | | | — | | | | 121,237,851 | | |
India | | | — | | | | 13,190,260 | | | | — | | | | 13,190,260 | | |
Ireland | | | — | | | | 38,044,979 | | | | — | | | | 38,044,979 | | |
Italy | | | — | | | | 171,616,198 | | | | — | | | | 171,616,198 | | |
Japan | | | — | | | | 244,007,310 | | | | — | | | | 244,007,310 | | |
Netherlands | | | — | | | | 56,574,398 | | | | — | | | | 56,574,398 | | |
Norway | | | 12,895,049 | | | | 13,302,448 | | | | — | | | | 26,197,497 | | |
Portugal | | | — | | | | 12,023,988 | | | | — | | | | 12,023,988 | | |
Russia | | | — | | | | 9,713,713 | | | | — | | | | 9,713,713 | | |
South Korea | | | — | | | | 34,040,226 | | | | — | | | | 34,040,226 | | |
Spain | | | — | | | | 192,554,783 | | | | — | | | | 192,554,783 | | |
Sweden | | | — | | | | 200,899,665 | | | | — | | | | 200,899,665 | | |
Switzerland | | | — | | | | 90,683,749 | | | | — | | | | 90,683,749 | | |
Turkey | | | — | | | | 10,855,978 | | | | — | | | | 10,855,978 | | |
United Kingdom | | | — | | | | 221,678,835 | | | | 845,364 | | | | 222,524,199 | | |
Total | | $ | 320,212,650 | | | $ | 1,852,395,310 | | | $ | 845,364 | | | $ | 2,173,453,324 | | |
For the EAFE Fund fair value of Level 2 and Level 1 investments at December 31, 2014 was $1,931,274,774 and $288,590,123, respectively. $31,266,201 was transferred out of Level 1 into Level 2 during the year ended December 31, 2015.
EAFE Choice Fund
Investments in Securities | | Level 1 | | Level 2 | | Level 3 | | Total | |
Common Stocks | |
Australia | | $ | 27,984 | | | $ | 15,043,950 | | | $ | — | | | $ | 15,071,934 | | |
China | | | 8,233,753 | | | | 2,585,463 | | | | — | | | | 10,819,216 | | |
Denmark | | | — | | | | 16,963,547 | | | | — | | | | 16,963,547 | | |
Finland | | | — | | | | 3,835,909 | | | | — | | | | 3,835,909 | | |
France | | | — | | | | 3,258,686 | | | | — | | | | 3,258,686 | | |
Germany | | | 3,320,451 | | | | 4,245,775 | | | | — | | | | 7,566,226 | | |
Hong Kong | | | — | | | | 8,436,576 | | | | — | | | | 8,436,576 | | |
India | | | — | | | | 3,915,077 | | | | — | | | | 3,915,077 | | |
Israel | | | 216,611 | | | | — | | | | — | | | | 216,611 | | |
116
Notes to Financial Statements
Annual Report December 31, 2015
Investments in Securities | | Level 1 | | Level 2 | | Level 3 | | Total | |
Common Stocks | |
Japan | | $ | — | | | $ | 52,984,858 | | | $ | — | | | $ | 52,984,858 | | |
Portugal | | | — | | | | 3,002,168 | | | | — | | | | 3,002,168 | | |
Singapore | | | — | | | | 4,342,930 | | | | — | | | | 4,342,930 | | |
South Africa | | | — | | | | 6,023,315 | | | | — | | | | 6,023,315 | | |
South Korea | | | — | | | | 6,419,478 | | | | — | | | | 6,419,478 | | |
Spain | | | — | | | | 8,009,531 | | | | — | | | | 8,009,531 | | |
Sweden | | | — | | | | 20,617,885 | | | | — | | | | 20,617,885 | | |
Switzerland | | | 4,952,994 | | | | 17,343,903 | | | | — | | | | 22,296,897 | | |
Taiwan | | | 4,852,643 | | | | 2,922,742 | | | | — | | | | 7,775,385 | | |
United Kingdom | | | — | | | | 59,879,179 | | | | — | | | | 59,879,179 | | |
Total Common Stocks | | | 21,604,436 | | | | 239,830,972 | | | | — | | | | 261,435,408 | | |
Preferred Stocks | |
Brazil | | | 1,222,265 | | | | — | | | | — | | | | 1,222,265 | | |
Total | | $ | 22,826,701 | | | $ | 239,830,972 | | | $ | — | | | $ | 262,657,673 | | |
For the EAFE Choice Fund fair value of Level 2 and Level 1 investments at December 31, 2014 was $123,889,450 and $20,906,287, respectively. $6,956,036 was transferred out of Level 1 into Level 2 during the year ended December 31, 2015.
EAFE Pure Fund
Investments in Securities | | Level 1 | | Level 2 | | Level 3 | | Total | |
Common Stocks | |
Australia | | $ | 12,720 | | | $ | 10,897,054 | | | $ | — | | | $ | 10,909,774 | | |
Denmark | | | — | | | | 11,608,001 | | | | — | | | | 11,608,001 | | |
Finland | | | — | | | | 2,724,789 | | | | — | | | | 2,724,789 | | |
France | | | — | | | | 2,071,827 | | | | — | | | | 2,071,827 | | |
Germany | | | 2,740,612 | | | | 2,940,226 | | | | — | | | | 5,680,838 | | |
Hong Kong | | | — | | | | 5,468,634 | | | | — | | | | 5,468,634 | | |
Israel | | | 46,308 | | | | — | | | | — | | | | 46,308 | | |
Japan | | | — | | | | 39,216,732 | | | | — | | | | 39,216,732 | | |
Portugal | | | — | | | | 2,007,743 | | | | — | | | | 2,007,743 | | |
Singapore | | | — | | | | 3,685,671 | | | | — | | | | 3,685,671 | | |
Spain | | | — | | | | 5,869,889 | | | | — | | | | 5,869,889 | | |
Sweden | | | — | | | | 18,213,921 | | | | — | | | | 18,213,921 | | |
Switzerland | | | 3,387,909 | | | | 14,366,482 | | | | — | | | | 17,754,391 | | |
United Kingdom | | | — | | | | 45,492,071 | | | | — | | | | 45,492,071 | | |
Total | | $ | 6,187,549 | | | $ | 164,563,040 | | | $ | — | | | $ | 170,750,589 | | |
For the EAFE Pure Fund fair value of Level 2 and Level 1 investments at December 31, 2014 was $40,080,938 and $2,777,673, respectively. $284,609 was transferred out of Level 1 into Level 2 during the year ended December 31, 2015.
117
Notes to Financial Statements
Annual Report December 31, 2015
Emerging Markets Fund
Investments in Securities | | Level 1 | | Level 2 | | Level 3 | | Total | |
Common Stocks | |
Argentina | | $ | 12,021,022 | | | $ | — | | | $ | — | | | $ | 12,021,022 | | |
Brazil | | | 13,037,420 | | | | — | | | | — | | | | 13,037,420 | | |
China | | | 137,118,723 | | | | 147,852,381 | | | | 22,262,498 | | | | 307,233,602 | | |
Egypt | | | — | | | | 6,349,978 | | | | — | | | | 6,349,978 | | |
Hong Kong | | | — | | | | 111,163,415 | | | | — | | | | 111,163,415 | | |
India | | | 4,872,910 | | | | 190,796,193 | | | | — | | | | 195,669,103 | | |
Malaysia | | | — | | | | 13,641,886 | | | | — | | | | 13,641,886 | | |
Mexico | | | 31,342,659 | | | | — | | | | — | | | | 31,342,659 | | |
Poland | | | — | | | | 8,880,795 | | | | — | | | | 8,880,795 | | |
South Africa | | | — | | | | 34,312,004 | | | | — | | | | 34,312,004 | | |
South Korea | | | — | | | | 141,100,668 | | | | — | | | | 141,100,668 | | |
Taiwan | | | 8,251,619 | | | | 160,731,777 | | | | — | | | | 168,983,396 | | |
Thailand | | | — | | | | 6,886,537 | | | | — | | | | 6,886,537 | | |
Total Common Stocks | | | 206,644,353 | | | | 821,715,634 | | | | 22,262,498 | | | | 1,050,622,485 | | |
Preferred Stocks | |
Brazil | | | — | | | | 8,517,479 | | | | — | | | | 8,517,479 | | |
South Korea | | | — | | | | 25,781,894 | | | | — | | | | 25,781,894 | | |
Total Preferred Stocks | | | — | | | | 34,299,373 | | | | — | | | | 34,299,373 | | |
Rights | |
Brazil | | | 35,563 | | | | — | | | | — | | | | 35,563 | | |
Hong Kong | | | — | | | | 29,653 | | | | — | | | | 29,653 | | |
Total Rights | | | 35,563 | | | | 29,653 | | | | — | | | | 65,216 | | |
Total | | $ | 206,679,916 | | | $ | 856,044,660 | | | $ | 22,262,498 | | | $ | 1,084,987,074 | | |
For the Emerging Markets Fund fair value of Level 2 and Level 1 investments at December 31, 2014 was $355,943,360 and $120,691,854, respectively. $13,319,154 was transferred out of Level 1 into Level 2 and $1,741,543 was transferred out of Level 2 into Level 1 during the year ended December 31, 2015.
The following is a reconciliation of the Fund's Level 3 investments for which significant unobservable inputs were used in determining value:
Balance at December 31, 2014 | | $ | 0 | | |
Purchases | | | 19,132,173 | | |
Sales | | | (533,502 | ) | |
Realized gain (loss) | | | (90,160 | ) | |
Change in unrealized gain (loss) | | | 3,753,987 | | |
Transfers into Level 3 (a) | | | 0 | | |
Transfers out of Level 3 (a) | | | 0 | | |
Balance at December 31, 2015 | | | 22,262,498 | * | |
Change in unrealized gain (loss) related to Investments still held at December 31, 2015 . | | | 3,753,987 | | |
* Value of the security based on last trade prior to trade halt
118
Notes to Financial Statements
Annual Report December 31, 2015
Global Alpha Equity Fund
Investments in Securities | | Level 1 | | Level 2 | | Level 3 | | Total | |
Common Stocks | |
Australia | | $ | — | | | $ | 6,225,218 | | | $ | — | | | $ | 6,225,218 | | |
Brazil | | | — | | | | 2,351,751 | | | | — | | | | 2,351,751 | | |
Canada | | | 11,675,868 | | | | — | | | | — | | | | 11,675,868 | | |
China | | | 23,559,604 | | | | 2,162,274 | | | | — | | | | 25,721,878 | | |
Denmark | | | — | | | | 5,903,839 | | | | — | | | | 5,903,839 | | |
Germany | | | — | | | | 20,008,981 | | | | — | | | | 20,008,981 | | |
Hong Kong | | | — | | | | 19,265,784 | | | | — | | | | 19,265,784 | | |
IIndia | | | 8,238,514 | | | | — | | | | — | | | | 8,238,514 | | |
Ireland | | | 15,385,384 | | | | 25,870,705 | | | | — | | | | 41,256,089 | | |
Italy | | | — | | | | 5,204,294 | | | | — | | | | 5,204,294 | | |
Japan | | | — | | | | 47,830,019 | | | | — | | | | 47,830,019 | | |
Netherlands | | | 9,021,514 | | | | — | | | | — | | | | 9,021,514 | | |
Norway | | | 4,315,771 | | | | 4,452,122 | | | | — | | | | 8,767,893 | | |
Russia | | | — | | | | 2,617,364 | | | | — | | | | 2,617,364 | | |
South Africa | | | — | | | | 22,196,953 | | | | — | | | | 22,196,953 | | |
South Korea | | | — | | | | 11,290,672 | | | | — | | | | 11,290,672 | | |
Spain | | | — | | | | 6,504,668 | | | | — | | | | 6,504,668 | | |
Sweden | | | — | | | | 18,390,676 | | | | — | | | | 18,390,676 | | |
Switzerland | | | — | | | | 28,983,440 | | | | — | | | | 28,983,440 | | |
Taiwan | | | 16,767,614 | | | | — | | | | — | | | | 16,767,614 | | |
United Kingdom | | | — | | | | 44,742,710 | | | | 68,455 | | | | 44,811,165 | | |
United States | | | 346,363,418 | | | | — | | | | — | | | | 346,363,418 | | |
Total | | $ | 435,327,687 | | | $ | 274,001,470 | | | $ | 68,455 | | | $ | 709,397,612 | | |
For the Global Alpha Equity Fund, fair value of Level 2 and Level 1 investments at December 31, 2015 was $255,484,691 and $358,386,925, respectively. $2,592,378 was transferred out of Level 1 into Level 2 during the year ended December 31, 2015.
Long Term Global Growth Equity Fund
Investments in Securities | | | | | | | | | |
Common Stocks | |
China | | $ | 11,929,551 | | | $ | 5,517,640 | | | $ | — | | | $ | 17,447,191 | | |
Denmark | | | — | | | | 1,770,082 | | | | — | | | | 1,770,082 | | |
France | | | — | | | | 5,037,780 | | | | — | | | | 5,037,780 | | |
Germany | | | — | | | | 1,068,972 | | | | — | | | | 1,068,972 | | |
Hong Kong | | | — | | | | 1,762,650 | | | | — | | | | 1,762,650 | | |
Spain | | | — | | | | 4,164,052 | | | | — | | | | 4,164,052 | | |
Sweden | | | — | | | | 1,377,166 | | | | — | | | | 1,377,166 | | |
United Kingdom | | | — | | | | 2,867,507 | | | | — | | | | 2,867,507 | | |
United States | | | 52,564,582 | | | | — | | | | — | | | | 52,564,582 | | |
Total | | $ | 64,494,133 | | | $ | 23,565,849 | | | $ | — | | | $ | 88,059,982 | | |
119
Notes to Financial Statements
Annual Report December 31, 2015
For the Long Term Global Growth Equity Fund fair value of Level 2 and Level 1 investments at December 31, 2014 was $7,839,476 and $17,789,733, respectively. $372,486 was transferred out of Level 1 into Level 2 during the year ended December 31, 2015.
International Choice Fund
Investments in Securities | | Level 1 | | Level 2 | | Level 3 | | Total | |
Common Stocks | |
Australia | | $ | 36,888 | | | $ | 18,041,549 | | | $ | — | | | $ | 18,078,437 | | |
China | | | 16,339,431 | | | | 3,252,677 | | | | — | | | | 19,592,108 | | |
Denmark | | | — | | | | 19,169,577 | | | | — | | | | 19,169,577 | | |
Finland | | | — | | | | 4,376,480 | | | | — | | | | 4,376,480 | | |
France | | | — | | | | 2,739,810 | | | | — | | | | 2,739,810 | | |
Germany | | | 4,234,200 | | | | 5,168,423 | | | | — | | | | 9,402,623 | | |
Hong Kong | | | — | | | | 10,101,169 | | | | — | | | | 10,101,169 | | |
India | | | — | | | | 5,096,812 | | | | — | | | | 5,096,812 | | |
Israel | | | 335,905 | | | | — | | | | — | | | | 335,905 | | |
Japan | | | — | | | | 64,752,812 | | | | — | | | | 64,752,812 | | |
Mexico | | | 2,588,784 | | | | — | | | | — | | | | 2,588,784 | | |
Philippines | | | 1,471,183 | | | | — | | | | — | | | | 1,471,183 | | |
Portugal | | | — | | | | 3,286,607 | | | | — | | | | 3,286,607 | | |
Singapore | | | — | | | | 4,701,456 | | | | — | | | | 4,701,456 | | |
South Africa | | | — | | | | 10,026,292 | | | | — | | | | 10,026,292 | | |
South Korea | | | — | | | | 11,809,681 | | | | — | | | | 11,809,681 | | |
Spain | | | — | | | | 11,533,380 | | | | — | | | | 11,533,380 | | |
Sweden | | | — | | | | 26,083,198 | | | | — | | | | 26,083,198 | | |
Switzerland | | | 5,502,724 | | | | 19,429,699 | | | | — | | | | 24,932,423 | | |
Taiwan | | | 6,932,858 | | | | 6,045,895 | | | | — | | | | 12,978,753 | | |
Thailand | | | — | | | | 1,632,993 | | | | — | | | | 1,632,993 | | |
United Kingdom | | | — | | | | 69,231,447 | | | | — | | | | 69,231,447 | | |
Total Common Stocks | | | 37,441,973 | | | | 296,479,957 | | | | — | | | | 333,921,930 | | |
Preferred Stocks | |
Brazil | | | 1,352,817 | | | | — | | | | — | | | | 1,352,817 | | |
Total | | $ | 38,794,790 | | | $ | 296,479,957 | | | $ | — | | | $ | 335,274,747 | | |
For the International Choice Fund fair value of Level 2 and Level 1 investments at December 31, 2014 was $302,184,212 and $62,081,366, respectively. $20,169,954 was transferred out of Level 1 into Level 2 during the year ended December 31, 2015. $2,201,070 was transferred out of Level 2 into Level 1 during the year ended December 31, 2015.
It is each Fund's policy to recognize transfers in and transfers out at the fair value as of the beginning of the period. The portfolio may hold securities which are periodically fair valued in accordance with the Funds' Pricing and Valuation Procedures. This may result in movements between Levels 1, 2, and 3 throughout the period which are given below each Fund's table.
These transfers were all as a result of using third-party vendor modeling tools to reflect any (lack of) significant market movements between the time at which the Funds valued their securities and the earlier closing of foreign markets. With regard to the transfers from Level 1 into Level 2, quotations were still obtained from the Funds' third party pricing vendor. Pursuant to the Funds' Pricing
120
Notes to Financial Statements
Annual Report December 31, 2015
and Valuation Procedures noted previously, equity securities (including exchange traded securities and open-end regulated investment companies) and exchange traded derivatives (i.e. futures contracts and options) are generally categorized as Level 1 securities in the fair value hierarchy. Fixed income securities, non-exchange traded derivatives and money market instruments are generally categorized as Level 2 securities in the fair value hierarchy. Investments for which there are no such quotations, or for which quotations do not appear reliable, are valued at fair value as determined in accordance with procedures established by and under the supervision of the Board. These valuations are typically categorized as Level 2 or Level 3 securities in the fair value hierarchy.
Derivative and Hedging Disclosure
GAAP requires qualitative disclosures about objectives and strategies for using derivatives, quantitative disclosures about fair value amounts of gains and losses on derivative instruments, and disclosures about credit-risk-related contingent features in derivative agreements. The Funds did not utilize derivatives for the year ended December 31, 2015.
Foreign Currency Translation
The accounting records of the Funds are maintained in U.S. dollars. Foreign currency amounts are translated into U.S. dollars at the applicable rate of exchange to determine the value of investments, assets and liabilities. For the Funds, purchases and sales of securities, and income and expenses are translated at the prevailing rate of exchange on the respective dates of such transactions. The Funds do not isolate that portion of net realized and unrealized gains and losses on investments resulting from changes in foreign exchange rates from the impact arising from changes in market prices. Such fluctuations are included with net realized and unrealized gain or loss from investments.
Net realized foreign exchange gains and losses arise from sales of foreign currencies, currency gains or losses realized between the trade and settlement dates on securities transactions, and the differences between the amounts of dividends, interest, and foreign withholding taxes recorded on the Funds' books and the U.S. dollar equivalent of the amounts actually received or paid. Net unrealized foreign exchange gains and losses arise from changes in the value of assets and liabilities, other than investments in securities, resulting from changes in the exchange rates.
Forward Foreign Currency Contracts
The Funds may enter into forward foreign currency contracts in connection with planned purchases or sales of securities, or to hedge against changes in currency exchange rates affecting the values of securities denominated in a particular currency. A forward exchange currency contract is a commitment to purchase or sell a foreign currency at a future date at a negotiated forward rate. Fluctuations in the value of forward foreign currency exchange contracts are recorded for book purposes as unrealized gains or losses on foreign currency related transactions by a Fund. When forward contracts are closed, the Funds record realized gains or losses equal to the differences between the values of such forward contracts at the time each was opened and the value at the time each was closed. Such amounts are recorded in net realized gain or loss on foreign currency related transactions.
The Funds' maximum risk of loss from counterparty credit risk is the net value of the cash flows to be received from the counterparty at the end of the contract's life. This risk may be mitigated by having a master netting arrangement between the Funds and the counterparty which may permit the Funds to offset amounts payable by the Funds to the same counterparty against amounts to be received; and by the receipt of collateral from the counterparty by the Funds to cover the Funds' exposure to the counterparty. However, there is no assurance that such mitigating factors are easily enforceable.
The Funds may be party to financial instruments with off-balance-sheet risk, primarily forward contracts, in order to minimize the impact of adverse changes in the relationship between the U.S. dollar and various foreign currencies. These instruments involve market risk in excess of the amount recognized in the Statement of Assets and Liabilities. Risks arise from the possible inability of counter parties to meet the terms of their contracts, future adverse movement in currency values and contract positions that are not exact offsets. The contract amount indicates the extent of the Funds' involvement in such currencies. At December 31, 2015, the Funds did not have any forward foreign currency contracts.
Securities Transactions and Investment Income
The Funds' securities transactions are recorded on the trade date. Realized gains or losses on sales of investments are determined on the basis of identified cost. Dividend income is recorded on the ex-dividend date and interest income is recorded on an accrual basis.
121
Notes to Financial Statements
Annual Report December 31, 2015
Investment income, expenses (other than those specific to a particular class of shares), and realized and unrealized gains and losses on investments are allocated to the separate classes of shares based upon their relative net asset value on the date income is earned or expensed and realized and unrealized gains and losses are incurred.
Federal Taxes
Each Fund intends to continue to qualify to be taxed as a "regulated investment company" under the provisions of the U.S. Internal Revenue Code of 1986, as amended (the "Code"), and as such will not be subject to U.S. federal income tax on income (including any net realized capital gains) which is distributed in accordance with the provisions of the Code to the Funds' shareholders. Therefore, no U.S. federal income tax provision is required.
Investment income received from investments in foreign currencies may be subject to foreign withholding tax. Whenever possible, the Funds will attempt to operate so as to qualify for reduced tax rates or tax exemptions in those countries with which the United States has a tax treaty.
In addition to the requirements of the Code, the Funds may also be subject to capital gains tax in India on gains realized upon sale of Indian securities, payable upon repatriation of sales proceeds. Any realized losses in excess of gains may be carried forward to offset future gains. Funds with exposure to Indian securities accrue a deferred liability for unrealized gains in excess of available carryforwards on Indian securities based on
existing tax rates and holding periods of the securities. As of December 31, 2015, the Emerging Markets Fund recorded a deferred liability for potential future Indian capital gains taxes of $1,129,684.
The Funds are subject to tax accounting standards that provide guidance for how certain and uncertain tax positions should be recognized, measured, presented and disclosed in the financial statements. These standards require the evaluation of tax positions taken or expected to be taken in the course of preparing the Funds' tax returns to determine whether the tax positions are "more-likely-than-not" of being sustained by the applicable tax authority. Tax positions not deemed to meet the "more-likely-than-not" threshold would be recorded as a reduction in a tax benefit or expense in the current year. Management has evaluated the application of these standards and has determined no liabilities for income tax related expenses are required in the financial statements of the Funds. For the International Equity Fund, EAFE Fund, EAFE Choice Fund, Emerging Markets Fund, Global Alpha Equity Fund and International Choice Fund the tax periods 2012 through present remain subject to examination by the Internal Revenue Service. For the EAFE Pure Fund and Long Term Global Growth Equity Fund, the tax periods 2014 through present remain subject to examination.
At December 31, 2015 for federal income tax purposes, the following Funds had capital loss carryforwards available to offset future capital gains through the years indicated. To the extent that these loss carryforwards are utilized, capital gains so offset will not be distributed to shareholders.
Fund | | Capital Loss
No Expiration | | Capital
Loss
Available
Total | |
International Equity | | $ | — | | | $ | — | | |
EAFE | | | — | | | | — | | |
EAFE Choice | | | 1,756,241 | | | | 1,756,241 | | |
EAFE Pure | | | 185,980 | | | | 185,980 | | |
Emerging Markets | | | — | | | | — | | |
Global Alpha Equity | | | — | | | | — | | |
Long Term Global Growth Equity | | | — | | | | — | | |
International Choice | | | 4,974,320 | | | | 4,974,320 | | |
The Regulated Investment Company Modernization Act of 2010 eliminated the eight-year carryover period for capital losses that arise in taxable years beginning after its enactment date of December 22, 2010. Consequently,
these capital losses can be carried forward for an unlimited period. However, capital losses with an expiration period may not be used to offset capital gains until all net capital losses without an expiration date have
122
Notes to Financial Statements
Annual Report December 31, 2015
been utilized. Additionally, post-enactment capital loss carryovers will retain their character as either short-term or long-term capital losses instead of as short-term
capital losses as under prior law. The amounts in the table below are characterized as short-term and long-term capital losses and have no expiration.
Fund | | Short-Term
Capital Losses | | Long-Term
Capital Losses | |
International Equity | | $ | — | | | $ | — | | |
EAFE | | | — | | | | — | | |
EAFE Choice | | | 1,756,241 | | | | — | | |
EAFE Pure | | | 185,980 | | | | — | | |
Emerging Markets | | | — | | | | — | | |
Global Alpha Equity | | | — | | | | — | | |
Long Term Global Growth Equity | | | — | | | | — | | |
International Choice | | | — | | | | 4,974,320 | | |
Realized capital losses, currency losses and passive foreign investment company ("PFIC") losses incurred after October 31 ("post-October losses/Late-Year Specified") within the taxable year are deemed to arise
on the first business day of each Fund's next taxable year. During the year ended December 31, 2015, the Funds shown below incurred and will elect to defer net post- October losses as indicated.
At December 31, 2015, the components of accumulated earnings on tax basis were as follows:
Fund | | Undistributed
Net Ordinary
Income | | Accumulated
Long Term
Capital
Gains | | Capital
Loss
Carryforwards | | Post October
Capital/Currency
Losses | | Net Unrealized
Appreciation
(Depreciation) on
Investments
and Foreign
Currencies | | Total
Accumulated
Earnings
(Deficit) | |
International Equity | | $ | 2,342,173 | | | $ | 8,235,367 | | | $ | — | | | $ | — | | | $ | 347,466,661 | | | $ | 358,044,201 | | |
EAFE | | | — | | | | 3,405,962 | | | | — | | | | (190,277 | ) | | | 474,350,407 | | | | 477,566,092 | | |
EAFE Choice | | | — | | | | — | | | | (1,756,241 | ) | | | (4,773,172 | ) | | | 9,267,682 | | | | 2,738,269 | | |
EAFE Pure | | | — | | | | — | | | | (185,980 | ) | | | (1,863,567 | ) | | | (5,329,281 | ) | | | (7,378,828 | ) | |
Emerging Markets | | | — | | | | — | | | | — | | | | (10,486,183 | ) | | | 1,750,233 | | | | (8,735,950 | ) | |
Global Alpha Equity | | | — | | | | 2,554,846 | | | | — | | | | (1,831 | ) | | | 89,812,742 | | | | 92,365,757 | | |
Long Term Global
Growth Equity | | | — | | | | 478,641 | | | | — | | | | (294 | ) | | | 8,637,435 | | | | 9,115,782 | | |
International Choice | | | — | | | | — | | | | (4,974,320 | ) | | | (7,141,623 | ) | | | 16,979,367 | | | | 4,863,424 | | |
The differences between the components of distributable earnings on a tax basis and the amounts reflected in the Statements of Assets and Liabilities are primarily due to the differing book/tax treatment of realized losses on wash sales and mark to market income on securities categorized as PFICs.
For the year ended December 31, 2015, the following reclassifications have been made on the Statements of
Assets and Liabilities as a result of certain differences in the computation of net investment income and net realized capital gains under U.S. federal income tax rules and regulations versus GAAP, such as the treatment of foreign currency gains and losses and the redesignation of dividends.
123
Notes to Financial Statements
Annual Report December 31, 2015
Fund | | Undistributed
(Distributions in
Excess of) Net
Investment Income | | Accumulated Net
Realized Gains
(Losses) on
Investments and
Foreign Currency
Transactions | | Paid-in
Capital | |
International Equity | | $ | (1,984,331 | ) | | $ | 1,984,331 | | | $ | — | | |
EAFE | | | (617,039 | ) | | | 617,039 | | | | — | | |
EAFE Choice | | | 216,474 | | | | (153,769 | ) | | | (62,705 | ) | |
EAFE Pure | | | 50,820 | | | | (50,820 | ) | | | — | | |
Emerging Markets | | | (766,336 | ) | | | 766,336 | | | | — | | |
Global Alpha Equity | | | (1,816 | ) | | | 1,816 | | | | — | | |
Long Term Global Growth Equity | | | 185,209 | | | | (88,009 | ) | | | (97,200 | ) | |
International Choice | | | 163,354 | | | | (37,478 | ) | | | (125,876 | ) | |
Dividends and Distributions to Shareholders
The Funds intend to distribute each year, as dividends, substantially all net investment income and net capital gains realized. All such dividends or distributions are credited in the form of additional shares of the Funds at net asset value on the ex-dividend date unless the
shareholder elects to receive dividends and distributions in cash. Currently, the Funds' policies are to distribute net investment income and net capital gains on an annual basis. Such distributions are determined in conformity with U.S. federal income tax regulations, which may differ from GAAP.
For the years ended December 31, 2015 and December 31, 2014, the tax characters of the dividends paid were:
Fund | | Ordinary
Income
2015 | | Return of
Capital
2015 | | Ordinary
Income
2014 | | Return of
Capital
2014 | | Long Term
Capital Gains
2015 | | Long Term
Capital Gains
2014 | |
International Equity | | $ | 36,848,788 | | | | — | | | $ | 40,475,196 | | | | — | | | $ | 16,110,399 | | | $ | 9,769,981 | | |
EAFE | | | 19,494,536 | | | | — | | | | 29,304,527 | | | | — | | | | 33,582,611 | | | | 87,989,601 | | |
EAFE Choice | | | 3,136,399 | | | | 62,705 | | | | 1,637,245 | | | | 37,918 | | | | — | | | | — | | |
EAFE Pure | | | 1,657,148 | | | | — | | | | 282,881 | | | | — | | | | — | | | | — | | |
Emerging Markets | | | 8,839,141 | | | | — | | | | 719,470 | | | | — | | | | 288,098 | | | | — | | |
Global Alpha Equity | | | 5,735,283 | | | | — | | | | 7,018,819 | | | | — | | | | 8,717,919 | | | | 24,502,597 | | |
Long Term Global
Growth Equity | | | 165,887 | | | | — | | | | 23,988 | | | | — | | | | 590,983 | | | | — | | |
International Choice | | | 4,871,426 | | | | 125,876 | | | | 8,177,435 | | | | 89,668 | | | | — | | | | 878,395 | | |
For tax purposes, short-term capital gain distributions, if any, are considered ordinary income distributions.
Note B — Investment Management and Other Services
The Funds are advised and managed by Baillie Gifford Overseas Limited (the "Manager"). The Manager, an investment adviser registered with the Securities and Exchange Commission (the "SEC), is a wholly owned subsidiary of Baillie Gifford & Co.
Under an investment advisory agreement between the Manager and the Trust on behalf of the Funds, each Fund paid the Manager a quarterly management fee, in arrears, at the following annual rate of the respective Fund's average net assets as of December 31, 2015.
124
Notes to Financial Statements
Annual Report December 31, 2015
Fund | | Management Fee | |
International Equity | | | 0.35 | % | |
EAFE | | | 0.35 | % | |
EAFE Choice | | | 0.35 | % | |
EAFE Pure | | | 0.35 | % | |
Emerging Markets | | | 0.55 | % | |
Global Alpha Equity | | | 0.40 | % | |
Long Term Global Growth Equity | | | 0.45 | % | |
International Choice | | | 0.35 | % | |
For the year ended December 31, 2015, the Funds incurred management fees as follows:
Fund | | Management Fee | | Management Fee
Waiver/Expenses
Reimbursed | |
International Equity | | $ | 7,966,412 | | | $ | — | | |
EAFE | | | 8,071,112 | | | | — | | |
EAFE Choice | | | 843,070 | | | | — | | |
EAFE Pure | | | 390,754 | | | | — | | |
Emerging Markets | | | 3,276,856 | | | | — | | |
Global Alpha Equity | | | 2,844,676 | | | | — | | |
Long Term Global Growth Equity | | | 215,043 | | | | 58,336 | | |
International Choice | | | 1,252,986 | | | | — | | |
Baillie Gifford Funds Services LLC ("BGFS"), a wholly- owned subsidiary of the Manager, serves as the sole distributor and principal underwriter of the shares of the Funds.
Each Fund has adopted a Shareholder Servicing Plan providing that the Fund may pay the Manager, or any other entity that acts from time to time as the shareholder servicing agent with respect to a class of Fund's shares,
for services rendered and expenses borne in connection with the provision of services provided to Fund investors and/or the maintenance of shareholder accounts. The Trust, on behalf of each Fund, has entered into a Shareholder Service Agreement with the Manager. For these services, the Funds pay the Manager a fee at the annualized rate of each Fund's average daily net assets attributed to each class of share as follows:
| | | International
Equity | | EAFE | | EAFE
Choice | | EAFE
Pure | | Emerging
Markets | | Global Alpha
Equity | | Long Term
Global
Growth
Equity | | International
Choice | |
Class 1 | | | 0.25 | % | | | 0.25 | % | | | 0.25 | % | | | 0.25 | % | | | 0.25 | % | | | 0.25 | % | | | 0.25 | % | | | 0.25 | % | |
Class 2 | | | 0.17 | % | | | 0.17 | % | | | 0.17 | % | | | 0.17 | % | | | 0.17 | % | | | 0.17 | % | | | 0.17 | % | | | 0.17 | % | |
Class 3 | | | 0.10 | % | | | 0.10 | % | | | 0.10 | % | | | 0.10 | % | | | 0.10 | % | | | 0.10 | % | | | 0.10 | % | | | 0.10 | % | |
Class 4 | | | 0.07 | % | | | 0.07 | % | | | 0.07 | % | | | 0.07 | % | | | 0.07 | % | | | 0.07 | % | | | 0.07 | % | | | 0.07 | % | |
Class 5 | | | 0.02 | % | | | 0.02 | % | | | 0.02 | % | | | 0.02 | % | | | 0.02 | % | | | 0.02 | % | | | 0.02 | % | | | 0.02 | % | |
125
Notes to Financial Statements
Annual Report December 31, 2015
For the year ended December 31, 2015, the Funds incurred shareholder servicing fees for each class of share as follows:
| | | International
Equity | | EAFE | | EAFE
Choice | | EAFE
Pure | | Emerging
Markets | | Global Alpha
Equity | | Long Term
Global
Growth
Equity | | International
Choice | |
Class 1 | | $ | 15,214 | | | | N/A | | | $ | 50,143 | | | | N/A | | | | N/A | | | | N/A | | | $ | 12,038 | | | $ | 41,606 | | |
Class 2 | | | 1,217,517 | | | $ | 1,308,655 | | | | 340,442 | | | $ | 189,795 | | | $ | 82,252 | | | $ | 379,539 | | | | 56,238 | | | | 391,628 | | |
Class 3 | | | 923,212 | | | | 508,554 | | | | 20,560 | | | | N/A | | | | N/A | | | | 487,910 | | | | N/A | | | | 111,010 | | |
Class 4 | | | 239,441 | | | | 148,212 | | | | N/A | | | | N/A | | | | 11,275 | | | | N/A | | | | 6,924 | | | | N/A | | |
Class 5 | | | 57,714 | | | | 163,189 | | | | N/A | | | | N/A | | | | 106,259 | | | | N/A | | | | N/A | | | | N/A | | |
Note C — Investment Transactions
Purchases and proceeds from sales of securities (excluding in-kind purchases and redemptions and short-term securities) for the year ended December 31, 2015 were as follows:
Fund | | Purchases | | Sales | |
International Equity | | $ | 339,537,602 | | | $ | 885,457,011 | | |
EAFE | | | 406,605,013 | | | | 382,872,348 | | |
EAFE Choice | | | 83,150,609 | | | | 39,097,379 | | |
EAFE Pure | | | 152,340,077 | | | | 20,157,069 | | |
Emerging Markets | | | 954,131,422 | | | | 279,161,746 | | |
Global Alpha Equity | | | 204,141,621 | | | | 112,054,514 | | |
Long Term Global Growth Equity | | | 58,024,392 | | | | 4,462,949 | | |
International Choice | | | 51,585,866 | | | | 81,873,061 | | |
For the year ended December 31, 2015, the cost of in-kind purchases and the proceeds from in-kind redemptions were as follows:
Fund | | Purchases | | Sales | |
EAFE | | $ | 15,894,838 | | | $ | — | | |
EAFE Choice | | | 79,123,524 | | | | — | | |
The Funds' cost of investments and gross unrealized appreciation (depreciation) at December 31, 2015 for U.S. federal income tax purposes were as follows:
Fund | | Cost of
Investments | | Gross
Appreciation | | Gross
Depreciation | | Net
Appreciation
(Depreciation) | |
International Equity | | $ | 1,295,600,667 | | | $ | 490,082,123 | | | $ | (142,393,429 | ) | | $ | 347,688,694 | | |
EAFE | | | 1,698,947,427 | | | | 707,997,342 | | | | (233,491,445 | ) | | | 474,505,897 | | |
EAFE Choice | | | 253,365,380 | | | | 33,578,698 | | | | (24,286,405 | ) | | | 9,292,293 | | |
EAFE Pure | | | 176,072,567 | | | | 8,897,916 | | | | (14,219,894 | ) | | | (5,321,978 | ) | |
Emerging Markets | | | 1,082,047,277 | | | | 93,137,528 | | | | (90,197,731 | ) | | | 2,939,797 | | |
Global Alpha Equity | | | 619,560,146 | | | | 146,944,333 | | | | (57,106,867 | ) | | | 89,837,466 | | |
Long Term Global Growth Equity | | | 79,422,129 | | | | 12,632,465 | | | | (3,994,612 | ) | | | 8,637,853 | | |
International Choice | | | 318,265,568 | | | | 46,572,893 | | | | (29,563,714 | ) | | | 17,009,179 | | |
126
Notes to Financial Statements
Annual Report December 31, 2015
Note D — Transactions in Shares of Beneficial Interest
| | International Equity Fund | |
| | Class 1 Shares
For the
Year Ended
December 31, 2015 | | Class 2 Shares
For the
Year Ended
December 31, 2015 | |
| | Shares | | Amount | | Shares | | Amount | |
Shares sold | | | — | | | $ | — | | | | 20,629,795 | | | $ | 247,218,214 | | |
Purchase fees | | | — | | | | 641 | | | | — | | | | 65,938 | | |
Redemption fees | | | — | | | | 405 | | | | — | | | | 296,120 | | |
Shares issued in reinvestment of dividends and distributions | | | — | | | | — | | | | 2,061,481 | | | | 22,278,477 | | |
Shares redeemed | | | (1,609,379 | ) | | | (19,688,877 | ) | | | (4,612,722 | ) | | | (51,362,173 | ) | |
Net increase (decrease) | | | (1,609,379 | ) | | $ | (19,687,831 | ) | | | 18,078,554 | | | $ | 218,496,576 | | |
| | International Equity Fund | |
| | Class 3 Shares
For the
Year Ended
December 31, 2015 | | Class 4 Shares
For the
Year Ended
December 31, 2015 | |
| | Shares | | Amount | | Shares | | Amount | |
Shares sold | | | 2,231,988 | | | $ | 25,126,900 | | | | — | | | | — | | |
Purchase fees | | | — | | | | 87,703 | | | | — | | | | 34,324 | | |
Redemption fees | | | — | | | | 329,043 | | | | — | | | | 131,738 | | |
Shares issued in reinvestment of dividends and distributions | | | 2,245,617 | | | | 24,586,754 | | | | 39,549 | | | | 439,047 | | |
Shares redeemed | | | (27,632,696 | ) | | | (335,706,903 | ) | | | (30,469,775 | ) | | | (349,226,277 | ) | |
Net decrease | | | (23,155,091 | ) | | $ | (285,576,503 | ) | | | (30,430,226 | ) | | $ | (348,621,168 | ) | |
| | International Equity Fund | |
| | Class 5 Shares
For the
Year Ended
December 31, 2015 | |
| | Shares | | Amount | |
Shares sold | | | — | | | $ | — | | |
Purchase premium | | | — | | | | 28,860 | | |
Redemption fees | | | — | | | | 87,989 | | |
Shares issued in reinvestment of dividends and distributions | | | 501,623 | | | | 5,654,909 | | |
Shares redeemed | | | (10,210,476 | ) | | | (120,120,122 | ) | |
Net decrease | | | (9,708,853 | ) | | $ | (114,348,364 | ) | |
127
Notes to Financial Statements
Annual Report December 31, 2015
| | | International Equity Fund | |
| | Class 1 Shares
For the
Year Ended
December 31, 2014 | | Class 2 Shares
For the
Year Ended
December 31, 2014 | |
| | Shares | | Amount | | Shares | | Amount | |
Shares sold | | | 22,544 | | | $ | 255,949 | | | | 11,613,043 | | | $ | 136,831,273 | | |
Purchase premium | | | — | | | | 3,626 | | | | — | | | | 67,788 | | |
Redemption fees | | | — | | | | 5,368 | | | | — | | | | 122,868 | | |
Shares issued in reinvestment of dividends and distributions | | | — | | | | — | | | | 1,035,276 | | | | 11,746,437 | | |
Shares redeemed | | | (713,734 | ) | | | (8,566,950 | ) | | | (18,208,701 | ) | | | (211,341,046 | ) | |
Net decrease | | | (691,190 | ) | | $ | (8,302,007 | ) | | | (5,560,382 | ) | | $ | (62,572,680 | ) | |
| | International Equity Fund | |
| | Class 3 Shares
For the
Year Ended
December 31, 2014 | | Class 4 Shares
For the
Year Ended
December 31, 2014 | |
| | Shares | | Amount | | Shares | | Amount | |
Shares sold | | | 18,794,822 | | | $ | 220,966,910 | | | | 4,642,038 | | | $ | 54,835,000 | | |
Purchase premium | | | — | | | | 179,891 | | | | — | | | | 72,418 | | |
Redemption fees | | | — | | | | 306,728 | | | | — | | | | 106,695 | | |
Shares issued in reinvestment of dividends and distributions | | | 2,072,763 | | | | 23,814,848 | | | | 657,222 | | | | 7,722,552 | | |
Shares redeemed | | | (32,031,621 | ) | | | (380,295,118 | ) | | | (25,018,860 | ) | | | (304,629,645 | ) | |
Net decrease | | | (11,164,036 | ) | | $ | (135,026,741 | ) | | | (19,719,600 | ) | | $ | (241,892,980 | ) | |
| | International Equity Fund | |
| | Class 5 Shares
For the Period
April 7, 2014
through
December 31, 2014* | |
| | Shares | | Amount | |
Shares sold | | | 24,867,726 | | | $ | 304,629,645 | | |
Purchase premium | | | — | | | | 18,147 | | |
Redemption fees | | | — | | | | 47,408 | | |
Shares issued in reinvestment of dividends and distributions | | | 558,103 | | | | 6,597,607 | | |
Shares redeemed | | | — | | | | — | | |
Net increase | | | 25,425,829 | | | $ | 311,292,807 | | |
* Commencement of investment operations.
128
Notes to Financial Statements
Annual Report December 31, 2015
| | EAFE Fund | |
| | Class 2 Shares
For the
Year Ended
December 31, 2015 | | Class 3 Shares
For the
Year Ended
December 31, 2015 | |
| | Shares | | Amount | | Shares | | Amount | |
Shares sold | | | 3,149,778 | | | $ | 35,137,479 | | | | 2,059,371 | | | $ | 22,937,350 | | |
Purchase fees | | | — | | | | 42,401 | | | | — | | | | 29,574 | | |
Redemption fees | | | — | | | | 24,000 | | | | — | | | | 15,751 | | |
Shares issued in reinvestment of dividends and distributions | | | 1,562,542 | | | | 16,614,298 | | | | 1,107,678 | | | | 11,810,623 | | |
Shares redeemed | | | (2,986,754 | ) | | | (34,409,812 | ) | | | (476,535 | ) | | | (6,012,024 | ) | |
Net increase | | | 1,725,566 | | | $ | 17,408,366 | | | | 2,690,514 | | | $ | 28,781,274 | | |
| | EAFE Fund | |
| | Class 4 Shares
For the
Year Ended
December 31, 2015 | | Class 5 Shares
For the
Year Ended
December 31, 2015 | |
| | Shares | | Amount | | Shares | | Amount | |
Shares sold | | | — | | | $ | — | | | | — | | | $ | — | | |
Purchase fees | | | — | | | | 11,350 | | | | — | | | | 43,743 | | |
Redemption fees | | | — | | | | 6,611 | | | | — | | | | 25,474 | | |
Shares issued in reinvestment of dividends
and distributions | | | 456,744 | | | | 4,876,734 | | | | 1,791,491 | | | | 19,155,722 | | |
Shares redeemed | | | — | | | | — | | | | — | | | | — | | |
Net increase | | | 456,744 | | | $ | 4,894,695 | | | | 1,791,491 | | | $ | 19,224,939 | | |
129
Notes to Financial Statements
Annual Report December 31, 2015
| | | EAFE Fund | |
| | Class 1 Shares
For the
Year Ended
December 31, 2014 | | Class 2 Shares
For the
Year Ended
December 31, 2014 | |
| | Shares | | Amount | | Shares | | Amount | |
Shares sold | | | — | | | $ | — | | | | 3,704,676 | | | $ | 45,528,771 | | |
Purchase premium | | | — | | | | — | | | | — | | | | 21,985 | | |
Redemption fees | | | — | | | | — | | | | — | | | | 47,221 | | |
Shares issued in reinvestment of dividends and distributions | | | — | | | | — | | | | 3,373,022 | | | | 38,035,551 | | |
Shares redeemed | | | (2,081,948 | ) | | | (26,371,394 | ) | | | (5,002,148 | ) | | | (62,864,979 | ) | |
Net increase (decrease) | | | (2,081,948 | ) | | $ | (26,371,394 | ) | | | 2,075,550 | | | $ | 20,768,549 | | |
| | EAFE Fund | |
| | Class 3 Shares
For the
Year Ended
December 31, 2014 | | Class 4 Shares
For the
Year Ended
December 31, 2014 | | Class 5 Shares
For the
Year Ended
December 31, 2014 | |
| | Shares | | Amount | | Shares | | Amount | | Shares | | Amount | |
Shares sold | | | 190,672 | | | $ | 2,346,938 | | | | — | | | $ | — | | | | — | | | $ | — | | |
Purchase premium | | | — | | | | 14,081 | | | | — | | | | 5,903 | | | | — | | | | 22,738 | | |
Redemption fees | | | — | | | | 30,074 | | | | — | | | | 12,616 | | | | — | | | | 48,592 | | |
Shares issued in reinvestment of
dividends and distributions | | | 2,259,637 | | | | 25,533,668 | | | | 953,161 | | | | 10,785,022 | | | | 3,697,507 | | | | 41,885,735 | | |
Shares redeemed | | | (655,116 | ) | | | (8,013,523 | ) | | | — | | | | — | | | | — | | | | — | | |
Net increase | | | 1,795,193 | | | $ | 19,911,238 | | | | 953,161 | | | $ | 10,803,541 | | | | 3,697,507 | | | $ | 41,957,065 | | |
130
Notes to Financial Statements
Annual Report December 31, 2015
| | EAFE Choice Fund | |
| | Class 1 Shares
For the
Year Ended
December 31, 2015 | | Class 2 Shares
For the
Year Ended
December 31, 2015 | |
| | Shares | | Amount | | Shares | | Amount | |
Shares sold | | | — | | | $ | — | | | | 16,244,817 | | | $ | 215,409,582 | | |
Purchase fees | | | — | | | | 25,569 | | | | — | | | | 211,071 | | |
Redemption fees | | | — | | | | 877 | | | | — | | | | 10,062 | | |
Shares issued in reinvestment of dividends and distributions | | | 17,372 | | | | 219,253 | | | | 214,735 | | | | 2,733,303 | | |
Shares redeemed | | | — | | | | — | | | | (7,076,604 | ) | | | (93,972,196 | ) | |
Net increase | | | 17,372 | | | $ | 245,699 | | | | 9,382,948 | | | $ | 124,391,822 | | |
| | EAFE Choice Fund | |
| | Class 3 Shares
For the
Year Ended
December 31, 2015 | |
| | Shares | | Amount | |
Shares sold | | | 151,073 | | | $ | 1,931,937 | | |
Purchase fees | | | — | | | | 25,857 | | |
Redemption fees | | | — | | | | 901 | | |
Shares issued in reinvestment of dividends and distributions | | | 19,192 | | | | 246,548 | | |
Shares redeemed | | | (110,288 | ) | | | (1,502,224 | ) | |
Net increase | | | 59,977 | | | $ | 703,019 | | |
131
Notes to Financial Statements
Annual Report December 31, 2015
| | | EAFE Choice Fund | |
| | Class 1 Shares
For the
Year Ended
December 31, 2014 | | Class 2 Shares
For the
Year Ended
December 31, 2014 | |
| | Shares | | Amount | | Shares | | Amount | |
Shares sold | | | — | | | $ | — | | | | 4,465,602 | | | $ | 61,146,066 | | |
Purchase premium | | | — | | | | 26,546 | | | | | | 165,327 | | |
Redemption fees | | | — | | | | 9,582 | | | | — | | | | 36,836 | | |
Shares issued in reinvestment of dividends and distributions | | | 14,886 | | | | 186,113 | | | | 100,267 | | | | 1,264,099 | | |
Shares redeemed | | | — | | | | — | | | | (2,930,025 | ) | | | (40,487,027 | ) | |
Net increase | | | 14,886 | | | $ | 222,241 | | | | 1,635,844 | | | $ | 22,125,301 | | |
| | EAFE Choice Fund | |
| | Class 3 Shares
For the period
July 7, 2014 through
December 31, 2014* | |
| | Shares | | Amount | |
Shares sold | | | 1,481,333 | | | $ | 20,531,631 | | |
Purchase premium | | | — | | | | 1,586 | | |
Redemption fees | | | — | | | | 10 | | |
Shares issued in reinvestment of dividends and distributions | | | 17,692 | | | | 224,951 | | |
Shares redeemed | | | (3,324 | ) | | | (45,090 | ) | |
Net increase | | | 1,495,701 | | | $ | 20,713,088 | | |
* There were no shareholders for the period January 1, 2014 through July 6, 2014.
132
Notes to Financial Statements
Annual Report December 31, 2015
| | EAFE Pure Fund | |
| | Class 2 Shares
For the
Year Ended
December 31, 2015 | |
| | Shares | | Amount | |
Shares sold | | | 13,009,985 | | | $ | 131,717,335 | | |
Purchase fees | | | — | | | | 380,244 | | |
Redemption fees | | | — | | | | — | | |
Shares issued in reinvestment of dividends and distributions | | | 168,510 | | | | 1,657,148 | | |
Shares redeemed | | | — | | | | — | | |
Net increase | | | 13,178,495 | | | $ | 133,754,727 | | |
| | | EAFE Pure Fund | |
| | Class 2 Shares
For the Period
April 15, 2014*
through
December 31, 2014 | |
| | Shares | | Amount | |
Shares sold | | | 4,586,200 | | | $ | 45,862,000 | | |
Purchase premium | | | — | | | | 138,000 | | |
Redemption fees | | | — | | | | — | | |
Shares issued in reinvestment of dividends and distributions | | | 29,794 | | | | 282,881 | | |
Shares redeemed | | | — | | | | — | | |
Net increase | | | 4,615,994 | | | $ | 46,282,881 | | |
* Commencement of investments operations.
| | Emerging Markets Fund | |
| | Class 2 Shares
For the
Year Ended
December 31, 2015 | | Class 4 Shares
For the
Year Ended
December 31, 2015 | |
| | Shares | | Amount | | Shares | | Amount | |
Shares sold | | | 6,336,060 | | | $ | 105,642,000 | | | | 6,472,807 | | | $ | 99,700,000 | | |
Purchase fees | | | — | | | | 216,847 | | | | — | | | | 266,494 | | |
Redemption fees | | | — | | | | 8,107 | | | | — | | | | — | | |
Shares issued in reinvestment of dividends and distributions | | | 55,847 | | | | 792,088 | | | | 27,820 | | | | 425,257 | | |
Shares redeemed | | | (1,748,750 | ) | | | (25,813,476 | ) | | | — | | | | — | | |
Net increase | | | 4,643,157 | | | $ | 80,845,566 | | | | 6,500,627 | | | $ | 100,391,751 | | |
133
Notes to Financial Statements
Annual Report December 31, 2015
| | Emerging Markets Fund | |
| | Class III Shares
For the
Year Ended
December 31, 2015 | |
| | Shares | | Amount | |
Shares redeemed | | | (28,944,005 | ) | | $ | (485,066,064 | ) | |
Net decrease | | | (28,944,005 | ) | | $ | (485,066,064 | ) | |
| | Emerging Markets Fund | |
| | Class 5 Shares
For the
Year Ended
December 31, 2015 | |
| | Shares | | Amount | |
Shares sold | | | 60,465,768 | | | $ | 983,566,063 | | |
Purchase fees | | | — | | | | 1,674,659 | | |
Redemption fees | | | — | | | | 82,240 | | |
Shares issued in reinvestment of dividends and distributions | | | 529,024 | | | | 7,909,895 | | |
Shares redeemed | | | — | | | | — | | |
Net increase | | | 60,994,792 | | | $ | 993,232,857 | | |
| | | Emerging Markets Fund | |
| | Class II Shares
For the Period
January 1, 2014
through
June 9, 2014 | | Class III Shares
For the
Year Ended
December 31, 2014 | |
| | Shares | | Amount | | Shares | | Amount | |
Shares sold | | | 559,872 | | | $ | 9,232,291 | | | | 10,924,314 | | | $ | 186,487,716 | | |
Purchase premium | | | — | | | | 9,767 | | | | — | | | | 470,589 | | |
Redemption fees | | | — | | | | 643 | | | | — | | | | 59,170 | | |
Shares issued in reinvestment of dividends and distributions | | | — | | | | — | | | | 39,176 | | | | 719,470 | | |
Shares redeemed | | | (3,648,913 | ) | | | (59,760,469 | ) | | | (981,162 | ) | | | (16,328,088 | ) | |
Net increase (decrease) | | | (3,089,041 | ) | | $ | (50,517,768 | ) | | | 9,982,328 | | | $ | 171,408,857 | | |
* Emerging Market Fund Class II shares were redeemed on June 9, 2014.
134
Notes to Financial Statements
Annual Report December 31, 2015
| | Global Alpha Equity Fund | |
| | Class 2 Shares
For the
Year Ended
December 31, 2015 | | Class 3 Shares
For the
Year Ended
December 31, 2015 | |
| | Shares | | Amount | | Shares | | Amount | |
Shares sold | | | 8,298,615 | | | $ | 121,571,150 | | | | 7,252,859 | | | $ | 109,854,707 | | |
Purchase fees | | | — | | | | 76,958 | | | | — | | | | 151,892 | | |
Redemption fees | | | — | | | | 16,421 | | | | — | | | | 39,023 | | |
Shares issued in reinvestment of dividends and distributions | | | 300,866 | | | | 4,217,818 | | | | 715,955 | | | | 10,235,384 | | |
Shares redeemed | | | (8,736,418 | ) | | | (129,449,097 | ) | | | (1,576,496 | ) | | | (24,036,054 | ) | |
Net increase (decrease) | | | (136,937 | ) | | $ | (3,566,750 | ) | | | 6,392,318 | | | $ | 96,244,952 | | |
| | | Global Alpha Equity Fund | |
| | Class 2 Shares
For the
Year Ended
December 31, 2014 | | Class 3 Shares
For the
Year Ended
December 31, 2014 | |
| | Shares | | Amount | | Shares | | Amount | |
Shares sold | | | 6,042,155 | | | $ | 88,622,400 | | | | 9,808,974 | | | $ | 139,720,000 | | |
Purchase premium | | | — | | | | 114,452 | | | | — | | | | 343,148 | | |
Redemption fees | | | — | | | | 17,680 | | | | — | | | | 54,051 | | |
Shares issued in reinvestment of dividends and distributions | | | 729,080 | | | | 10,382,509 | | | | 1,455,220 | | | | 21,138,906 | | |
Shares redeemed | | | — | | | | — | | | | (3,285,458 | ) | | | (47,820,230 | ) | |
Net increase | | | 6,771,235 | | | $ | 99,137,041 | | | | 7,978,736 | | | $ | 113,435,875 | | |
| | Long Term Global Growth Equity | |
| | Class 1 Shares
For the
Year Ended
December 31, 2015 | | Class 2 Shares
For the
Year Ended
December 31, 2015 | | Class 4 Shares
For the
Year Ended
December 31, 2015 | |
| | Shares | | Amount | | Shares | | Amount | | Shares | | Amount | |
Shares sold | | | 998,000 | | | $ | 9,980,000 | | | | 541,142 | | | $ | 5,988,000 | | | | 3,185,477 | | | $ | 38,941,500 | | |
Purchase fees | | | — | | | | 11,124 | | | | — | | | | 51,144 | | | | — | | | | 28,233 | | |
Redemption fees | | | — | | | | — | | | | — | | | | — | | | | — | | | | — | | |
Shares issued in reinvestment of
dividends and distributions | | | 12,289 | | | | 122,755 | | | | 32,416 | | | | 374,196 | | | | 18,888 | | | | 259,919 | | |
Shares redeemed | | | — | | | | — | | | | — | | | | — | | | | — | | | | — | | |
Net increase | | | 1,010,289 | | | $ | 10,113,879 | | | | 573,558 | | | $ | 6,413,340 | | | | 3,204,365 | | | $ | 39,229,652 | | |
135
Notes to Financial Statements
Annual Report December 31, 2015
| | | Long Term
Global Growth Equity | |
| | | Class 2 Shares
For the Period
June 10, 2014
through
December 31, 2014 | |
| | Shares | | Amount | |
Shares sold | | | 2,500,000 | | | $ | 25,000,000 | | |
Purchase premium | | | — | | | | — | | |
Redemption fees | | | — | | | | — | | |
Shares issued in reinvestment of dividends and distributions | | | 2,275 | | | | 23,988 | | |
Shares redeemed | | | — | | | | — | | |
Net increase | | | 2,502,275 | | | $ | 25,023,988 | | |
* Commencement of investments operations.
| | International Choice Fund | |
| | Class 1 Shares
For the
Year Ended
December 31, 2015 | | Class 2 Shares
For the
Year Ended
December 31, 2015 | |
| | Shares | | Amount | | Shares | | Amount | |
Shares sold | | | — | | | $ | — | | | | — | | | $ | — | | |
Purchase fees | | | — | | | | — | | | | — | | | | — | | |
Redemption fees | | | — | | | | 2,806 | | | | — | | | | 41,610 | | |
Shares issued in reinvestment of dividends and distributions | | | 19,311 | | | | 223,516 | | | | 269,614 | | | | 3,152,571 | | |
Shares redeemed | | | — | | | | — | | | | (2,678,234 | ) | | | (32,063,125 | ) | |
Net increase (decrease) | | | 19,311 | | | $ | 226,322 | | | | (2,408,620 | ) | | $ | (28,868,944 | ) | |
| | International Choice Fund | |
| | Class 3 Shares
For the
Year Ended
December 31, 2015 | |
| | Shares | | Amount | |
Shares sold | | | — | | | $ | — | | |
Purchase fees | | | — | | | | — | | |
Redemption fees | | | — | | | | 18,709 | | |
Shares issued in reinvestment of dividends and distributions | | | 137,221 | | | | 1,621,215 | | |
Shares redeemed | | | — | | | | — | | |
Net increase | | | 137,221 | | | $ | 1,639,924 | | |
136
Notes to Financial Statements
Annual Report December 31, 2015
| | | International Choice Fund | |
| | Class 1 Shares
For the Period
April 9, 2014*
through
December 31, 2014 | | Class 2 Shares
For the
Year Ended
December 31, 2014 | |
| | Shares | | Amount | | Shares | | Amount | |
Shares sold | | | 1,365,731 | | | $ | 16,949,000 | | | | 7,104,551 | | | $ | 83,102,298 | | |
Purchase premium | | | — | | | | 2,204 | | | | — | | | | 158,176 | | |
Redemption fees | | | — | | | | 174 | | | | — | | | | 3,597 | | |
Shares issued in reinvestment of dividends and distributions | | | 32,080 | | | | 370,694 | | | | 521,832 | | | | 6,089,979 | | |
Shares redeemed | | | — | | | | — | | | | (250,607 | ) | | | (3,001,502 | ) | |
Net increase | | | 1,397,811 | | | $ | 17,322,072 | | | | 7,375,776 | | | $ | 86,352,548 | | |
* Commencement of investments operations.
| | International Choice Fund | |
| | Class 3 Shares
For the
Year Ended
December 31, 2014 | |
| | Shares | | Amount | |
Shares sold | | | — | | | $ | — | | |
Purchase premium | | | — | | | | 72,187 | | |
Redemption fees | | | — | | | | 1,732 | | |
Shares issued in reinvestment of dividends and distributions | | | 227,721 | | | | 2,684,825 | | |
Net increase | | | 227,721 | | | $ | 2,758,744 | | |
The funds charged the following purchases and redemption fees effective September 23, 2015*:
Fund | | Purchase Fees | | Redemption Fees | |
International Equity | | | 0.25 | % | | | 0.10 | % | |
EAFE | | | 0.25 | % | | | 0.10 | % | |
EAFE Choice | | | 0.25 | % | | | 0.10 | % | |
EAFE Pure | | | 0.25 | % | | | 0.10 | % | |
Emerging Markets | | | 0.30 | % | | | 0.35 | % | |
Global Alpha Equity | | | 0.15 | % | | | 0.10 | % | |
Long Term Global Growth Equity | | | 0.15 | % | | | 0.10 | % | |
International Choice | | | 0.25 | % | | | 0.10 | % | |
137
Notes to Financial Statements
Annual Report December 31, 2015
Prior to September 23, 2015 the Funds charged the following purchases and redemption fees:
Fund | | Purchase Fees | | Redemption Fees | |
International Equity | | | 0.30 | % | | | 0.20 | % | |
EAFE | | | 0.30 | % | | | 0.20 | % | |
EAFE Choice | | | 0.30 | % | | | 0.20 | % | |
EAFE Pure | | | 0.30 | % | | | 0.20 | % | |
Emerging Markets | | | 0.35 | % | | | 0.35 | % | |
Global Alpha Equity | | | 0.20 | % | | | 0.15 | % | |
Long Term Global Growth Equity | | | 0.20 | % | | | 0.15 | % | |
International Choice | | | 0.30 | % | | | 0.20 | % | |
* Current purchase and redemption fees were approved by the Board and became effective on the 23rd September 2015.
The purchase and redemption fees may be waived or reduced by the Manager if the brokerage and transaction costs in connection with the purchase or redemption are minimal or in other circumstances in the Manager's discretion.
Note E — Beneficial Ownership
The beneficial ownership, either directly or indirectly, of more than 25% of the voting securities of a Fund creates a presumption of control under Section 2(a)(9) of the 1940 Act. As of December 31, 2015, Kentucky Teachers Retirement System owned 35.06% of the EAFE Fund; US Army Non Appropriated Fund owned 32.13% of the EAFE Pure Fund; McAuley Portfolio Management Company owned 31.94% of the EAFE Pure Fund; the Municipal Fire & Police Retirement System of Iowa owned 31.58% of the International Choice Fund; Board of Trustees for the Maryland State Retirement and Pension System owned 44.44% of the Emerging Markets Fund; Longwood Foundation, Inc. owned 40.29% of the Long Term Global Growth Equity Fund; and Nissan Employee Retirement Plan owned 48.27% of the Long Term Global Growth Equity Fund.
Purchase and Redemption activity of these accounts may have a significant effect on the operation of each Fund.
Note F — Commitments and Contingencies
Each of the Funds indemnifies the Trust's officers and Trustees for certain liabilities that might arise from the performance of their duties to the Fund. Additionally, in the normal course of business, each Fund enters into contracts that contain a variety of representations and warranties and which provide general indemnifications. The Funds' maximum exposure under these arrangements is unknown, as this would involve future claims that may be made against the Funds that have not yet occurred. However, based on experience, the Funds expect the risk of loss to be remote.
Note G — Subsequent Events
Events or transactions that occur after the financial statement date but before the financial statements are issued are categorized as recognized or non-recognized for financial statement purposes.
John G. Barrie Jr. retired from the Board on January 1, 2016. David Salter was appointed as an Interested Trustee effective January 1, 2016.
There were no other subsequent events identified between December 31, 2015 and the issuance of the Financial Statements.
138
Report of Independent Registered Public Accounting Firm
Annual Report December 31, 2015
To the Board of Trustees of Baillie Gifford Funds
and the Shareholders of Baillie Gifford International Equity Fund,
Baillie Gifford EAFE Fund, Baillie Gifford EAFE Choice Fund,
Baillie Gifford EAFE Pure Fund, Baillie Gifford Emerging Markets Fund,
Baillie Gifford Global Alpha Equity Fund, Baillie Gifford Long Term Global Growth Equity Fund and Baillie Gifford International Choice Fund
We have audited the accompanying statements of assets and liabilities of the Baillie Gifford International Equity Fund, Baillie Gifford EAFE Fund, Baillie Gifford EAFE Choice Fund, Baillie Gifford EAFE Pure Fund, Baillie Gifford Emerging Markets Fund, Baillie Gifford Global Alpha Equity Fund, Baillie Gifford Long Term Global Growth Equity Fund and Baillie Gifford International Choice Fund (the "Funds"), each a series of shares of beneficial interest in the Baillie Gifford Funds, including the portfolios of investments, as of December 31, 2015, and the related statements of operations for the year then ended, the statements of changes in net assets for each of the years or periods presented in the two-year period then ended and the financial highlights for each of the years or periods presented in the five-year period then ended. These financial statements and financial highlights are the responsibility of the Funds' management. Our responsibility is to express an opinion on these financial statements and financial highlights based on our audits.
We conducted our audits in accordance with the standards of the Public Company Accounting Oversight Board (United States). Those standards require that we plan and perform the audits to obtain reasonable assurance about whether the financial statements and financial highlights are free of material misstatement. An audit includes examining, on a test basis, evidence supporting the amounts and disclosures in the financial statements. Our procedures included confirmation of securities owned as of December 31, 2015 by correspondence with the custodian and brokers. An audit also includes assessing the accounting principles used and significant estimates made by management, as well as evaluating the overall financial statement presentation. We believe that our audits provide a reasonable basis for our opinion.
In our opinion, the financial statements and financial highlights referred to above present fairly, in all material respects, the financial position of the Baillie Gifford International Equity Fund, Baillie Gifford EAFE Fund, Baillie Gifford EAFE Choice Fund, Baillie Gifford EAFE Pure Fund, Baillie Gifford Emerging Markets Fund, Baillie Gifford Global Alpha Equity Fund, Baillie Gifford Long Term Global Growth Equity Fund and Baillie Gifford International Choice Fund as of December 31, 2015, and the results of their operations for the year then ended, the changes in their net assets for each of the years or periods presented in the two-year period then ended and their financial highlights for each of the years or periods presented in the five-year period then ended in conformity with accounting principles generally accepted in the United States of America.

BBD, LLP
Philadelphia, Pennsylvania
February 26, 2016
139
Supplemental Information (unaudited)
Annual Report December 31, 2015
Federal Income Tax Information
Qualified dividend income was taxable to the Funds listed in the table below through December 31, 2015. The Funds intend to designate the maximum amount of dividends that qualify for the reduced tax rate pursuant to the Jobs and Growth Tax Relief Reconciliation Act of 2003.
Fund | | Qualified
Dividend Income | |
International Equity | | $ | 45,783,067 | | |
EAFE | | | 33,526,372 | | |
EAFE Choice | | | 4,586,514 | | |
EAFE Pure | | | 2,152,817 | | |
Emerging Markets | | | 5,844,287 | | |
Global Alpha Equity | | | 9,958,630 | | |
Long Term Global Growth Equity | | | 192,399 | | |
International Choice | | | 7,005,979 | | |
For corporate shareholders, the percentage of ordinary income distributions for the year ended December 31, 2015 qualified for the corporate dividends-received deduction for each Fund is:
Fund | | Dividends-received
Deductions | |
International Equity | | | 0.39 | % | |
EAFE | | | 0.00 | % | |
EAFE Choice | | | 2.21 | % | |
EAFE Pure | | | 4.33 | % | |
Emerging Markets | | | 0.00 | % | |
Global Alpha Equity | | | 57.09 | % | |
Long Term Global Growth Equity | | | 9.06 | % | |
International Choice | | | 1.97 | % | |
In January 2016, certain U.S. shareholders will be advised on IRS Form 1099 DIV or substitute 1099 DIV as to the U.S. federal tax status of distributions received in the calendar year 2015.
140
Supplemental Information (unaudited)
Annual Report December 31, 2015
Management of The Trust
The following tables set forth the Trustees and Officers of the Trust, their principal occupations during the past five years, and certain other information.
Name and Age(1) | | Position(s)
Held with
Trust | | Length of
Time
Served(2) | | Principal Occupation and Other
Directorships Held During Past 5 Years(3) | | Number of Funds in
Fund complex
overseen by
Trustees(4)(5) | |
Disinterested Trustees | |
John G. Barrie, Jr.
Age 75 | | Trustee | | Since 2000 | | Retired. Formerly: Assistant Treasurer, Dominion Resources, Inc. (electric and gas utility). | | | 10 | | |
George W. Browning
Age 74 | | Trustee | | Since 2007 | | Retired. Formerly: Managing Director, Client Service, Babson Capital Management, LLC (investment adviser). | | | 10 | | |
Howard W. Chin
Age 63 | | Trustee | | Since 2015 | | Retired. Formerly: Managing Director, Investments, Guardian Life Insurance (financial services). | | | 10 | | |
Bruce C. Long
Age 70 | | Trustee | | Since 2009 | | Global Financial Consultant. Formerly: Executive Vice President and director of various entities, Guardian Life Insurance (financial services). | | | 10 | | |
Robert E. Rigsby
Age 66 | | Trustee | | Since 2014 | | Retired. Formerly: President & COO, Delivery Business at Dominion Resources, Inc. (electric and gas utility). | | | 10 | | |
Interested Trustee | |
Peter Hadden
Age 58 | | Trustee, Chairman of the Board, and President | | Since 2009 | | Partner, Baillie Gifford & Co. (investment adviser); Director, Baillie Gifford Overseas Ltd. (investment adviser); Formerly, Vice President of the Trust (2008 to 2009). | | | 10 | | |
David Salter
Age 40 | | Trustee, Vice President | | Since 2014 | | Partner, Baillie Gifford & Co. (investment adviser); Manager, Baillie Gifford International LLC with oversight of products offered to the North American market. | | | 10 | | |
Name and Age(1) | | Position(s)
Held with
Trust | | Length of
Time
Served(2) | | Principal Occupation During Past 5 Years(3) | |
Officers (other than Officers who are also Trustees) | |
Andrew Telfer
Age 48 | | Vice President | | Since 2008 | | Managing Partner, Baillie Gifford & Co. (investment adviser); Director, Baillie Gifford Overseas Limited (investment adviser). | |
Michael Stirling-Aird
Age 38 | | Vice President | | Since 2012 | | Client Service Director, Baillie Gifford Overseas Limited (investment adviser). | |
Julie Paul
Age 40 | | Vice President | | Since 2012 | | Assistant Manager, Overseas Institutional Clients Accounting Department, Baillie Gifford & Co. (investment adviser). | |
Tim Campbell
Age 40 | | Vice President | | Since 2014 | | Partner, Baillie Gifford & Co. (investment adviser); Manager, Baillie Gifford International LLC with oversight of marketing performed in North America. | |
141
Supplemental Information (unaudited)
Annual Report December 31, 2015
Name and Age(1) | | Position(s)
Held with
Trust | | Length of
Time
Served(2) | | Principal Occupation During Past 5 Years(3) | |
Officers (other than Officers who are also Trustees) | |
Lindsay Cockburn
Age 37 | | Treasurer | | Since 2015 | | Manager, Institutional Accounting Department, Baillie Gifford & Co. (investment adviser). | |
Gareth Griffiths
Age 42 | | Secretary | | Since 2015 | | Senior Legal Advisor for the Baillie Gifford Group (investment adviser). | |
Graham Laybourn
Age 49 | | Chief Compliance Officer | | Since 2005 | | Partner, Baillie Gifford & Co. (investment adviser); Group Compliance Officer, Director of Regulatory Risk and Legal, Baillie Gifford Group (investment adviser). | |
Evan Delaney
Age 46 | | Chief Risk Officer | | Since 2013 | | Group Chief Risk Officer, Director of Business Risk and Internal Audit, Baillie Gifford Group (investment adviser). | |
(1) The address of each trustee and officer of the Trust is c/o Baillie Gifford Funds, Calton Square, 1 Greenside Row, Edinburgh, Scotland EH1 3AN.
(2) There is no stated term of office for the trustees and a trustee may serve until such trustee reaches the age of 75 years. Thereafter, such trustee offers to tender his or her resignation from the Board, and the Nominating and Governance Committee, at its discretion, makes a recommendation to the Board whether to accept or reject such resignation annually. The Chairman of the Board and President of the Trust are elected annually by the Board of Trustees. Other officers may be elected or appointed by the trustees at any time.
(3) Previous positions during the past five years with Baillie Gifford & Co., the Manager and Baillie Gifford Group are omitted if not materially different from the positions listed.
(4) The number of Funds in the Fund complex overseen by the Trustee includes the North American Equity Fund and the Emerging Markets Bond Fund, two series of the Trust which have not yet commenced operations.
(5) Mr. Hadden and Mr. Salter are "interested persons" (as defined in the 1940 Act) of the Trust or the Manager due to their positions with the Manager (Baillie Gifford Overseas Ltd.) and roles as officers of the Trust.
Additional information regarding the Trustees is in the Funds' Statement of Additional Information and is available upon request, without charge, by calling Baillie Gifford Overseas Limited at 011-44-131-275-2000.
A description of the Funds' proxy voting policies and procedures related to portfolio securities is available without charge, upon request, by calling Baillie Gifford Overseas Limited at 011-44-131-275-2000 or on the SEC's website at http://www.sec.gov. Shareholders may submit to the Trust claims for reimbursement of telephone charges incurred in placing such calls.
Information regarding how the Funds voted proxies relating to portfolio securities during the most recent 12-month period ended June 30 is also available without charge upon request by calling Baillie Gifford Overseas
Limited at 011-44-131-275-2000 or by accessing the Fund's Form N-PX on the SEC's website at http://www.sec.gov. Shareholders may submit to the Trust claims for reimbursement of telephone charges incurred in placing such calls.
Each of the Funds files its complete schedule of portfolio holdings with the SEC for the first and third quarters of each fiscal year on Form N-Q. The Funds' Form N-Q is available on the SEC's website at http://www.sec.gov. The Funds' Form N-Q may also be viewed and copied at the SEC's Public Reference Room in Washington, DC; information on the operation of the Public Reference Room may be obtained by calling (800) SEC-0330.
142
BOARD CONSIDERATION REGARDING
2015 CONTRACT RENEWAL
FOR SHAREHOLDER REPORT DISCLOSURE
(unaudited)
Annual Report December 31, 2015
BAILLIE GIFFORD FUNDS
On June 19, 2015, the Board of the Trust, including those trustees who are not "interested persons" as defined by the Investment Company Act of 1940, as amended (the "Independent Trustees"), approved the renewal of the investment advisory agreement (the "Advisory Agreement") between the Trust, on behalf of the Funds and the Manager. As part of the review process, the Independent Trustees met independently of Trust management and of the interested trustee of the Board to consider the renewal of the Advisory Agreement. During the review process, the Independent Trustees were represented by independent legal counsel. The Independent Trustees reviewed materials received from the Manager, Lipper Inc. (an independent provider of mutual fund data, "Lipper") and independent legal counsel. After reviewing the information received, the Independent Trustees requested supplemental information that was provided by the Manager. The Independent Trustees then presented their findings to the Board.
The Board concluded that it was in the best interests of each Fund to renew the Advisory Agreement. In reaching this conclusion for the Funds, the Board did not identify any single factor as determinative in its analysis, but rather the Board considered a variety of factors, including those discussed below. The Board did not allot a particular weight to any one factor or group of factors.
International Equity Fund, International Choice Fund, EAFE Fund, EAFE Choice Fund, EAFE Pure Fund, Emerging Markets Fund, Global Alpha Equity Fund and Long Term Global Growth Equity Fund
The Board considered the nature, extent and quality of the services provided by the Manager to the International Equity Fund, the International Choice Fund, the EAFE Fund, the EAFE Choice Fund, the EAFE Pure Fund, the Emerging Markets Fund, the Global Alpha Equity Fund and the Long Term Global Growth Equity Fund. The Board noted that, pursuant to the Funds' Advisory Agreement, the Manager provides portfolio management services to the Funds and receives a management fee and that, pursuant to a separate Shareholder Service Plan and Shareholder Servicing Agreement, the Manager receives a shareholder service fee. The Board considered the background and qualifications of the investment and compliance personnel involved in the management and oversight of the Trust, reviewed information regarding each Fund's performance, management fee, shareholder service fee and expense ratio compared to similar funds and considered the experience of the Manager in providing services to each Fund. In evaluating the management fee paid by each Fund, and in particular when assessing comparative data, the Board considered not only the management fee, but also the combination of the Fund's management fee and shareholder service fee. The Board also reviewed the Manager's financial statements. The Board considered other benefits derived by the Manager from its relationship to the Funds, including receipt of the shareholder service fee (which varies among the share classes) and the use of soft dollars to pay for research services for the Funds or other clients of the Manager. The Board concluded that the nature, extent and quality of the services provided by the Manager to the Funds were satisfactory.
The Board reviewed the Manager's revenues received with respect to the Funds and the nature of the Manager's resources expended in providing advisory services to the Funds. The Board considered the Manager's estimated profitability with respect to the Funds and concluded that it was not unreasonable.
Based upon all the information considered and the conclusions reached, the Board determined that the terms of the Advisory Agreement for the Funds were reasonable and fair and that the continuation of the Advisory Agreement was in the best interests of each Fund. The Board noted the following items specific to the referenced Funds.
International Equity Fund
The Board reviewed total return information for the one-, three- and five-year and since inception (February 29, 2008) periods ended March 31, 2015 for the Fund compared to a benchmark index (MSCI ACWI ex USA Index) and an average of the total return of a performance universe of funds provided by Lipper and calendar year returns
143
BOARD CONSIDERATION REGARDING
2015 CONTRACT RENEWAL
FOR SHAREHOLDER REPORT DISCLOSURE
(unaudited)
Annual Report December 31, 2015
from 2008 through 2014. The Board noted that the Fund's total return was above the benchmark index and the average of the performance universe for the one-, three- and five-year and since inception periods. The Board concluded that the Fund's performance was satisfactory.
The Board reviewed the Fund's management fee (plus the Class 1 shareholder service fee) and total expense ratio and compared them to the average management fees and expense ratios of an expense peer group and expense universe of funds based on data provided by Lipper. The comparable fund information showed that the Fund's management fee (plus the Class 1 shareholder service fee) was below the average management fee of both the expense peer group and the expense universe. The Board also reviewed the fee schedules for separately managed accounts of the Manager with a similar investment mandate, noting that the Fund's management fee plus shareholder service fees were within range of the separately managed account fee schedules. The Board considered whether there were economies of scale with respect to management of the Fund and whether the Fund benefits from economies of scale. The Board considered that the management fee was on the low end of the spectrum of the expense peer group. On the basis of the information provided, the Board concluded that the management fee was reasonable.
International Choice Fund
The Board reviewed total return information for the one-year and since inception (September 24, 2012) periods ended March 31, 2015 for the Fund compared to a benchmark index (MSCI ACWI ex USA Index) and an average of the total return of a performance universe of funds provided by Lipper and calendar year returns from 2012 through 2014. The Board noted that the Fund's total return was above the benchmark index and the average of the performance universe for the one-year and since inception periods. The Board concluded that the Fund's performance was satisfactory.
The Board reviewed the Fund's management fee (plus the Class 1 shareholder service fee) and total expense ratio and compared them to the average management fees and expense ratios of an expense peer group and expense universe of funds based on data provided by Lipper. The comparable fund information showed that the Fund's management fee (plus the Class 1 shareholder service fee) was below the average management fee of both the expense peer group and the expense universe. The Board also reviewed the fee schedules for separately managed accounts of the Manager with a similar investment mandate, noting that the Fund's management fee plus shareholder service fees were within range of the separately managed account fee schedules. The Board considered whether there were economies of scale with respect to management of the Fund and whether the Fund benefits from economies of scale. The Board considered that the management fee was on the low end of the spectrum of the expense peer group. On the basis of the information provided, the Board concluded that the management fee was reasonable.
EAFE Fund
The Board reviewed total return information for the one-, three- and five-year and since inception (March 31, 2008) periods ended March 31, 2015 for the Fund compared to a benchmark index (MSCI EAFE Index) and an average of the total return of a performance universe of funds provided by Lipper and calendar year returns from 2008 through 2014. The Board noted that the Fund's total return was above the benchmark index and the average of the performance universe for the one-, three- and five-year and since inception periods. The Board concluded that the Fund's performance was satisfactory.
The Board reviewed the Fund's management fee (plus the Class 1 shareholder service fee) and total expense ratio and compared them to the average management fees and expense ratios of an expense peer group and expense universe of funds based on data provided by Lipper. The comparable fund information showed that the Fund's management fee (plus the Class 1 shareholder service fee) was below the average management fee of both the expense peer group and the expense universe. The Board also reviewed the fee schedules for separately managed accounts of the Manager with a similar investment mandate, noting that the Fund's management fee plus shareholder
144
BOARD CONSIDERATION REGARDING
2015 CONTRACT RENEWAL
FOR SHAREHOLDER REPORT DISCLOSURE
(unaudited)
Annual Report December 31, 2015
service fees were within range of the separately managed account fee schedules. The Board considered whether there were economies of scale with respect to management of the Fund and whether the Fund benefits from economies of scale. The Board considered that the management fee was on the low end of the spectrum of the expense peer group. On the basis of the information provided, the Board concluded that the management fee was reasonable.
EAFE Choice Fund
The Board reviewed total return information for the one-, three- and five-year and since inception (December 31, 2009) periods ended March 31, 2015 for the Fund compared to a benchmark index (MSCI EAFE Index) and an average of the total return of a performance universe of funds provided by Lipper and calendar year returns from 2010 through 2014. The Board noted that the Fund's total return was above the benchmark index and below the average of the performance universe for the one-year period and above the benchmark index and the average of the performance universe for the three- and five-year and since inception periods. The Board concluded that the Fund's performance was satisfactory.
The Board reviewed the Fund's management fee (plus the Class 1 shareholder service fee) and total expense ratio and compared them to the average management fees and expense ratios of an expense peer group and expense universe of funds based on data provided by Lipper. The comparable fund information showed that the Fund's management fee (plus the Class 1 shareholder service fee) was below the average management fee of both the expense peer group and the expense universe. The Board also reviewed the fee schedules for separately managed accounts of the Manager with a similar investment mandate, noting that the Fund's management fee plus shareholder service fees were within range of the separately managed account fee schedules. The Board considered whether there were economies of scale with respect to management of the Fund and whether the Fund benefits from economies of scale. The Board considered that the management fee was on the low end of the spectrum in the expense peer group. On the basis of the information provided, the Board concluded that the management fee was reasonable.
EAFE Pure Fund
The Board reviewed total return information for the period from inception on April 15, 2014 to March 31, 2015 for the Fund compared to a benchmark index (MSCI EAFE Index) and an average of the total return of a performance universe of funds provided by Lipper and calendar year returns for 2014. The Board noted that the Fund's total return was above the benchmark index and below the average of the performance universe for the since inception period. The Board concluded that the Fund's performance was satisfactory.
The Board reviewed the Fund's management fee (plus the Class 1 shareholder service fee) and total expense ratio and compared them to the average management fees and expense ratios of an expense peer group and expense universe of funds based on data provided by Lipper. The comparable fund information showed that the Fund's management fee (plus the Class 1 shareholder service fee) was below the average management fee of both the expense peer group and the expense universe. The Board also reviewed the fee schedules for separately managed accounts of the Manager with a similar investment mandate, noting that the Fund's management fee plus shareholder service fees were within range of the separately managed account fee schedules. The Board considered whether there were economies of scale with respect to management of the Fund and whether the Fund benefits from economies of scale. The Board considered that the management fee was on the low end of the spectrum in the expense peer group and considered the expense limitation in place through April 30, 2016. On the basis of the information provided, the Board concluded that the management fee was reasonable.
145
BOARD CONSIDERATION REGARDING
2015 CONTRACT RENEWAL
FOR SHAREHOLDER REPORT DISCLOSURE
(unaudited)
Annual Report December 31, 2015
Emerging Markets Fund
The Board reviewed total return information for the one-, three-, five- and ten-year and since inception (April 30, 2003) periods ended March 31, 2015 for the Fund compared to a benchmark index (MSCI Emerging Markets Index) and to an average of the total return of a performance universe of funds provided by Lipper and calendar year returns from 2005 through 2014. The Board noted that the Fund's total return was above the benchmark index and the average of the performance universe for the one-, three-, five- and ten-year and since inception periods. The Board concluded that the Fund's performance was satisfactory.
The Board reviewed the Fund's management fee (plus the Class 1 shareholder service fee) and total expense ratio and compared them to the average management fees and expense ratios of an expense peer group and expense universe of funds based on data provided by Lipper. The comparable fund information showed that the Fund's management fee (plus the Class 1 shareholder service fee) was below the average management fee of both the expense peer group and the expense universe. The Board also reviewed the fee schedules for separately managed accounts of the Manager with a similar investment mandate, noting that the Fund's management fee plus shareholder service fees were within range of the separately managed account fee schedules. The Board considered whether there were economies of scale with respect to management of the Fund and whether the Fund benefits from economies of scale. The Board considered that the management fee was on the low end of the spectrum in the expense peer group. On the basis of the information provided, the Board concluded that the management fee was reasonable.
Global Alpha Equity Fund
The Board reviewed total return information for the one- and three-year and since inception (November 30, 2011) periods ended March 31, 2015 for the Fund compared to a benchmark index (MSCI ACWI Index) and an average of the total return of a performance universe of funds provided by Lipper and calendar year returns for 2011 through 2014. The Board noted that the Fund's total return was above the benchmark index and the average of the performance universe for the one- and three-year and since inception periods. The Board concluded that the Fund's performance was satisfactory.
The Board reviewed the Fund's management fee (plus the Class 1 shareholder service fee) and total expense ratio and compared them to the average management fees and expense ratios of an expense peer group and expense universe of funds based on data provided by Lipper. The comparable fund information showed that the Fund's management fee (plus the Class 1 shareholder service fee) was below the average management fee of both the expense peer group and the expense universe. The Board also reviewed the fee schedules for separately managed accounts of the Manager with a similar investment mandate, noting that the Fund's management fee plus shareholder service fees were within range of the separately managed account fee schedules. The Board considered whether there were economies of scale with respect to management of the Fund and whether the Fund benefits from economies of scale. The Board considered that the management fee rate was on the low end of the spectrum in the expense peer group. On the basis of the information provided, the Board concluded that the management fee was reasonable.
Long Term Global Growth Equity Fund
The Board reviewed total return information for the period from inception on June 10, 2014 to March 31, 2015 for the Fund compared to a benchmark index (MSCI AC World Index) and an average of the total return of a performance universe of funds provided by Lipper and calendar year returns for 2014. The Board noted that the Fund's total return was above the benchmark index and the average of the performance universe for the since inception period. The Board concluded that the Fund's performance was satisfactory.
The Board reviewed the Fund's management fee (plus the Class 1 shareholder service fee) and total expense ratio and compared them to the average management fees and expense ratios of an expense peer group and expense
146
BOARD CONSIDERATION REGARDING
2015 CONTRACT RENEWAL
FOR SHAREHOLDER REPORT DISCLOSURE
(unaudited)
Annual Report December 31, 2015
universe of funds based on data provided by Lipper. The comparable fund information showed that the Fund's management fee (plus the Class 1 shareholder service fee) was above the average management fee of the expense peer group and below the average management fee of the expense universe. The Board also considered that the Fund's management fee (plus the average share class shareholder service fee) was below the average management fee of the expense peer group and the expense universe. The Board also reviewed the fee schedules for separately managed accounts of the Manager with a similar investment mandate, noting that the Fund's management fee plus shareholder service fees were within range of the separately managed account fee schedules. The Board considered whether there were economies of scale with respect to management of the Fund and whether the Fund benefits from economies of scale. The Board considered that the management fee was on the low end of the spectrum in the expense peer group and also considered the expense limitation in place through April 30, 2016. On the basis of the information provided, the Board concluded that the management fee was reasonable.
Conclusion
Based upon all the information considered and the conclusions reached, the Board determined that the terms of the Advisory Agreement for the Funds were reasonable and fair and that the continuation of the Advisory Agreement was in the best interests of each Fund.
147
Item 2. Code of Ethics.
(a) The registrant, as of the end of the period covered by this report, has adopted a code of ethics that applies to the registrant’s principal executive officer, principal financial officer, principal accounting officer or controller, or persons performing similar functions, regardless of whether these individuals are employed by the registrant or a third party.
(b) Not applicable.
(c) There have been no amendments, during the period covered by this report, to a provision of the code of ethics that applies to the registrant’s principal executive officer, principal financial officer, principal accounting officer or controller, or persons performing similar functions, regardless of whether these individuals are employed by the registrant or a third party, and that relate to any element of the code of ethics definition enumerated in paragraph (b) of this item’s instructions.
(d) The registrant has not granted any waivers, including an implicit waiver, from a provision of the code of ethics that applies to the registrant’s principal executive officer, principal financial officer, principal accounting officer or controller, or persons performing similar functions, regardless of whether these individuals are employed by the registrant or a third party, that relates to one or more of the items set forth in paragraph (b) of this item’s instructions.
(e) Not applicable.
(f) The registrant’s Code of Ethics is attached hereto as an exhibit.
Item 3. Audit Committee Financial Expert.
As of the end of the period covered by the report, the registrant’s Board of Trustees has determined that Mr. Robert E. Rigsby, is qualified to serve as an audit committee financial expert serving on its audit committee and that he is “independent,” as defined by Item 3 of Form N-CSR.
Item 4. Principal Accountant Fees and Services.
Audit Fees
(a) The aggregate fees billed for each of the last two fiscal years for professional services rendered by the principal accountant for the audit of the registrant’s annual financial statements or services
that are normally provided by the accountant in connection with statutory and regulatory filings or engagements for those fiscal years are $144,000 for 2014 and $152,000 for 2015.
Audit fees include amounts for auditing and reporting on the financial statements and the financial highlights included in the Funds’ annual report to the shareholders, issuance of the auditor’s consent to be included in the Funds’ annual amendment to the registration statement on Form N-1A, issuance of the auditor’s report on internal controls for inclusion in Form N-SAR and provision of comments on the Funds’ interim financial statements (as requested). The audit fees above represent the amounts billed for services provided for the fiscal year indicated, not the amounts billed during such year.
Audit-Related Fees
(b) The aggregate fees billed in each of the last two fiscal years for assurance and related services by the principal accountant that are reasonably related to the performance of the audit of the registrant’s financial statements and are not reported under paragraph (a) of this Item are $0 for 2014 and $0 for 2015.
Audit-related fees include amounts billed for assurance and related services rendered to the registrant, including consultations related to financial accounting and reporting standards. The audit-related fees above represent the amounts billed during the fiscal year indicated.
Tax Fees
(c) The aggregate fees billed in each of the last two fiscal years for professional services rendered by the principal accountant for tax compliance, tax advice, and tax planning are $32,000 for 2014 and $32,000 for 2015.
Tax fees include amounts for services rendered to the registrant for tax compliance, tax planning and tax advice, including tax return preparation and review of and participation in determining required income and capital gains distributions. The tax fees above represent the amounts billed during the fiscal year indicated.
All Other Fees
(d) The aggregate fees billed in each of the last two fiscal years for products and services provided by the principal accountant, other than the services reported in paragraphs (a) through (c) of this Item are $0 for 2014 and $0 for 2015.
(e)(1) Engagements that are required to be pre-approved by the registrant’s Audit Oversight Committee, the “Committee”, may be pre-approved (i) at any regular or special meeting of the Committee or (ii) by the Committee Chair (or any other Committee member who is a disinterested trustee under the 1940 Act to whom this responsibility has been delegated), as long as the estimated fee for the particular services for which pre-approval is sought does not exceed $75,000 (for audit services) or $100,000 (for audit-related services) and provided that such committee member must report, for informational purposes only, any pre-approval decisions to the Board at its next regularly scheduled meeting.
(e)(2) The percentage of services described in each of paragraphs (b) through (d) of this Item that were approved by the audit committee pursuant to paragraph (c)(7)(i)(C) of Rule 2-01 of Regulation S-X are as follows:
(b) Audit Related Fees – Not Applicable
(c) Tax Fees – 100%
(d) All Other Fees – Not Applicable
(f) Not applicable.
(g) The aggregate non-audit fees billed by the registrant’s accountant for services rendered to the registrant, and rendered to the registrant’s investment adviser (not including any sub-adviser whose role is primarily portfolio management and is subcontracted with or overseen by another investment adviser), and any entity controlling, controlled by, or under common control with the adviser that provides ongoing services to the registrant for each of the last two fiscal years of the registrant was $0 for 2014 and $0 for 2015.
(h) Not applicable.
Item 5. Audit Committee of Listed Registrants.
Not applicable.
Item 6. Investments.
(a) Schedule of Investments in securities of unaffiliated issuers as of the close of the reporting period is included as part of the report to shareholders filed under Item 1 of this form.
(b) In accordance with Section 13(c) of the Investment Company Act of 1940, the registrant has divested itself of the following securities since the filing of its last report on Form N-CSR:
The EAFE Fund
Name
of Issuer | | Exchange
Ticker
Symbol | | Security
Identifier
(CUSIP
number) | | Total
number of
shares
divested | | Date
securities
were
divested | | Amount
Held on
Filing Date | | Statute | |
Volkswagen | | VOW GY | | 5497102 | | 76,096 11,325 | | 09/22/2015 09/23/2015 | | 0 | | Sudan Accountability and Divestment Act of 2007; Comprehensive Iran Sanctions, Accountability, and Divestment Act of 2010 | |
The Emerging Markets Fund
Name
of Issuer | | Exchange
Ticker
Symbol | | Security
Identifier
(CUSIP
number) | | Total
number of
shares
divested | | Date
securities
were
divested | | Amount
Held on
Filing Date | | Statute | |
Reliance Industries | | RIL IN | | 6099626 | | 51,272 | | 10/15/2015 | | 1,992,352 | | Sudan Accountability and Divestment Act of 2007; Comprehensive Iran Sanctions, Accountability, and Divestment Act of 2010 | |
Item 7. Disclosure of Proxy Voting Policies and Procedures for Closed-End Management Investment Companies.
Not applicable.
Item 8. Portfolio Managers of Closed-End Management Investment Companies.
Not applicable.
Item 9. Purchases of Equity Securities by Closed-End Management Investment Company and Affiliated Purchasers.
Not applicable.
Item 10. Submission of Matters to a Vote of Security Holders.
Not applicable.
Item 11. Controls and Procedures.
(a) The registrant’s principal executive and principal financial officers, or persons performing similar functions, have concluded that the registrant’s disclosure controls and procedures (as defined in Rule 30a-3(c) under the Investment Company Act of 1940, as amended (the “1940 Act”) (17 CFR 270.30a-3(c))) are effective, as of a date within 90 days of the filing date of the report that includes the disclosure required by this paragraph, based on their evaluation of these controls and procedures required by Rule 30a-3(b) under the 1940 Act (17 CFR 270.30a-3(b)) and Rules 13a-15(b) or 15d-15(b) under the Securities Exchange Act of 1934, as amended (17 CFR 240.13a-15(b) or 240.15d-15(b)).
(b) There were no changes in the registrant’s internal control over financial reporting (as defined in Rule 30a-3(d) under the 1940 Act (17 CFR 270.30a-3(d)) that occurred during the registrant’s second fiscal quarter of the period covered by this report that has materially affected, or is reasonably likely to materially affect, the registrant’s internal control over financial reporting.
Item 12. Exhibits.
(a)(1) Code of ethics, or any amendment thereto, that is the subject of disclosure required by Item 2 is attached hereto.
(a)(2) Certifications pursuant to Rule 30a-2(a) under the 1940 Act and Section 302 of the Sarbanes-Oxley Act of 2002 are attached hereto.
(a)(3) Not applicable.
(b) Certifications pursuant to Rule 30a-2(b) under the 1940 Act and Section 906 of the Sarbanes-Oxley Act of 2002 are attached hereto.
SIGNATURES
Pursuant to the requirements of the Securities Exchange Act of 1934 and the Investment Company Act of 1940, the registrant has duly caused this report to be signed on its behalf by the undersigned, thereunto duly authorized.
(Registrant) | | | Baillie Gifford Funds | |
| | | |
| | | |
By (Signature and Title)* | | /s/ Peter Hadden | |
| | Peter Hadden, President | |
| | (principal executive officer) | |
| | | |
Date | 3/8/2016 | | | |
| | | | | |
Pursuant to the requirements of the Securities Exchange Act of 1934 and the Investment Company Act of 1940, this report has been signed below by the following persons on behalf of the registrant and in the capacities and on the dates indicated.
By (Signature and Title)* | | /s/ Peter Hadden | |
| | Peter Hadden, President | |
| | (principal executive officer) | |
| | | |
Date | 3/8/2016 | | | |
| | | |
| | | |
By (Signature and Title)* | | /s/ Lindsay Cockburn | |
| | Lindsay Cockburn, Treasurer | |
| | (principal financial officer) | |
| | | |
Date | 3/8/2016 | | | |
* Print the name and title of each signing officer under his or her signature.