UNITED STATES
SECURITIES AND EXCHANGE COMMISSION
Washington, D.C. 20549
FORM N-CSR
CERTIFIED SHAREHOLDER REPORT OF REGISTERED MANAGEMENT
INVESTMENT COMPANIES
Investment Company Act file number 811-10145
Baillie Gifford Funds
(Exact name of registrant as specified in charter)
1 Greenside Row
Edinburgh, Scotland, UK, EH1 3AN
(Address of principal executive offices) (Zip code)
Angus NG Macdonald
1 Greenside Row
Edinburgh, Scotland, UK, EH1 3AN
(Name and address of agent for service)
Registrant’s telephone number, including area code: 011-44-131-275-2000
Date of fiscal year end: December 31
Date of reporting period: December 31, 2013
The registrant, an open-end investment company registered pursuant to Section 8(b) of the Investment Company Act of 1940 (the “Act”), has not filed a registrant statement that has gone effective under the Securities Act of 1933 (the “1933 Act”) because beneficial interests in the registrant are issued and sold solely in private transactions that do not involve any public offering within the meaning of Section 4(2) of the 1933 Act. Accordingly, this report is not filed under Section 13(a) or Section 15(d) of the Securities Exchange Act of 1934.
Item 1. Reports to Stockholders.
The Report to Shareholders is attached herewith.
Baillie Gifford Funds
International Equity Fund
International Choice Fund
EAFE Fund
EAFE Choice Fund
Emerging Markets Fund
Global Alpha Equity Fund
Annual Report
December 31, 2013
INDEX
INDEX (continued)
INDEX (concluded)
Management Discussion
The International Equity Fund
Market Conditions and Review of Performance during 2013
2013 has been a good year for international equity markets. Investors who have kept faith in this asset class have, on the whole, been rewarded. Nearly five years into a recovery from the lows reached in early 2009, equity markets have finally rediscovered some genuine optimism, with a notable shift in preference in the second half of 2013 from defensive stocks towards those with more substantial but less predictable growth prospects.
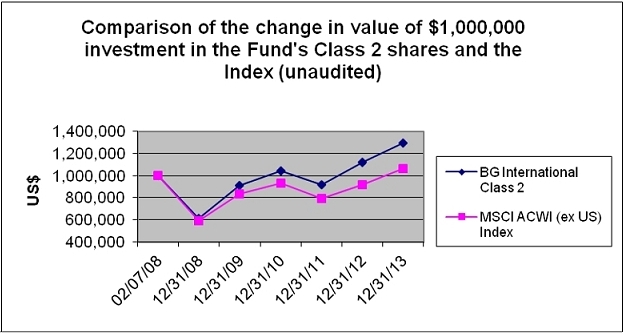
The International Equity Fund Class 2 returned 15.35% during 2013, underperforming the MSCI ACWI ex U.S. Index which returned 15.78% for the year.
During the first three months of 2013, markets were in positive territory overall, jollied along by the continued support of central banks and increasingly clear signs that the US economy had not only managed to make significant steps towards cleaning up its banking sector, but was also beginning to reap the growth benefits of an improving employment, housing and manufacturing backdrop. In Japan, Shinzo Abe’s government gave a strong policy steer to determinedly tackle deflation with the Bank of Japan undertaking quantitative easing, weakening the Yen against the dollar. Japan was the strongest of the large markets during the first quarter of 2013 as Japanese companies surged across the board. As we moved into the second quarter of 2013, markets reacted negatively to suggestions that the Federal Reserve’s ultra loose quantitative easing programme may begin to wind down. As we moved into the third quarter of 2013, it was a sobering summer for financial markets as the pre-announced September taper of the Federal Reserve’s quantitative easing programme loomed on the horizon. An air of resignation that the party was ending settled in. Liquidity began to drain from the Emerging Markets, particularly those with larger current account deficits, and gradual policy normalisation became the accepted wisdom. However, in mid-September the Federal Reserve eased back on their language with respect to the immediacy of tapering and equity markets were strong overall, particularly the developed markets, although Emerging Markets with large current account deficits continued to be the focus of liquidity withdrawals. This is a trend which continued into the final quarter of the year. After a long period of exceptional support from monetary authorities we do now appear to be entering a period of normalisation. However, interest rates are likely to remain low for the time being.
The portfolio slightly underperformed its benchmark over the year. Among the more significant detractors were the stocks that the portfolio holds in the Energy and Materials sectors. To a large extent, we would attribute this underperformance to the general sentiment towards these sectors, particularly fears over growth in China and the Emerging Markets. Tullow Oil (UK listed oil exploration and production company with African assets), Kunlun Energy (Chinese oil and gas exploration and production company) and China Shenhua Energy (China’s largest coal producer) all detracted from relative performance over the year. We took the decision to sell China Shenhua Energy as coal demand slowed and the advantage of its dedicated rail network appeared to be under threat. We also sold Kunlun Energy after corruption charges were brought against its Chairman (relating to the parent company, Petrochina). In addition, Antofagasta (Chilean low cost copper mines) and Rio Tinto (UK listed diversified miner) detracted from relative performance. In terms of what helped relative performance during 2013, stock selection in Emerging Markets was a big driver. Naspers (South African internet and media conglomerate), Baidu (Chinese search engine), Naver Corp (Korean search and messaging portal) and MercadoLibre (South American e-commerce platform) were all among the positive contributors over 2013. These contributions come against a backdrop of strong returns across internet companies. We suspect that a degree of excitement over several high profile IPOs (and rumoured IPOs) helped fuel this strong performance, but the most significant factor is that it is becoming increasingly clear that these companies are indeed able to monetise the large user bases that they rapidly acquire.
We continue to find exciting investment opportunities for the portfolio. For example, we have taken holdings in St James’ Place (UK wealth management business), SAP (a German company which is a global leader in enterprise software), Toyota Tsusho (Japanese listed distributor of cars with a strong position in developing markets) and Fanuc (Japanese manufacturer of factory automation equipment). The portfolio is dominated by well-financed businesses with attractive long-term growth prospects, and retains a bias towards companies that are well placed to benefit from rising domestic consumption in Emerging Markets. The portfolio has limited direct exposure to European banks, with Svenska Handelsbanken, a traditional well capitalised Swedish bank, the only such holding. A sharp recovery in lower quality financials therefore remains a risk to the portfolio, but we remain committed to our style of investing in well managed growth businesses. The portfolio comprises a diverse range of companies, but on the whole the attributes of a strong industry background, durable competitive advantage, good management and strong financial characteristics are important aspects of the holdings, and these should stand the portfolio in good stead over the longer term.
Investment Strategies used to manage the Fund
Baillie Gifford is a growth manager with a bottom-up approach to stock picking. We aim to invest in companies that will generate sustainable earnings growth above that of the market over the long term. In determining the potential of a company, we analyse industry background, competitive advantage, management attitudes and financial strength, and finally we consider valuation. We meet the management of the companies within our investment universe and revisit the investment case for the portfolio’s holdings on a regular basis to ensure that our expectations are being met.
The ACWI ex US Alpha Portfolio Construction Group is responsible for the overall strategy and stock selection process. They meet regularly to discuss both buy and sell ideas and the level of conviction for existing holdings and will continue to monitor the long term prospects for the Fund’s holdings and make changes where appropriate.
Outlook
The operational performance of companies has generally been in line with our expectations and is a key barometer for our outlook. More broadly, we may be at a transitional point in the economic cycle; there is a risk that after a prolonged period of ultra low rates, the transition to a more normal rate regime may prove difficult. However, the potential for a US recovery and a return to growth in Southern Europe, the ambitious reform proposals emerging from China’s Third Plenum and the possibility that Abenomics in Japan will succeed, are all encouraging signs for sustainable global growth.
As stock pickers, our focus is on company fundamentals. Companies are not excessively leveraged, returns are high and demand in developed markets is improving. The long-term forces driving increased consumption and investment in the Emerging Markets remain in place, if currently subdued. Looking ahead to 2014 (and beyond), we are excited about the prospects for the companies held in The International Equity Fund. The team of investors in the Portfolio Construction Group will continue to work hard on monitoring the investment case for existing holdings, and looking out for new long-term growth opportunities.
| Fund Performance for periods ended 12/31/13 (Average Annual Total Returns) | |
| | | | | | | Since Inception | |
| | | | | | | % p.a. | |
| | | One Year | | Five Year | | (February 7, 2008) | |
| | | | | | | | |
| The International Equity Fund Class 2* | | 15.35% | | 16.05% | | 4.47% | |
| | | | | | | | |
| MSCI ACWI ex U.S. Index | | 15.78% | | 13.31% | | 1.66% | |
| | | | | | | | |
*The returns for Class 2 shares have been provided. One-year return figures for other share classes are as follows: 15.10% for Class 1, 15.34% for Class 3, and 15.42% for Class 4.
Additional year-over-year returns for each class are available in the Financial Highlights section.
The International Choice Fund
Market Conditions and Review of Performance during 2013
During 2013, the MSCI ACWI ex U.S. benchmark delivered a return of 15.8% when measured in dollar terms. Stepping back from all the intraday breaking news updates from countless Federal Reserve watchers and the nervous procrastination of central banks on the precise timing of monetary policy adjustments, the broader picture remains an encouraging one: five years on from the financial crisis the world is steadily and finally moving on. The American economy at last seems to be building clear momentum going into 2014, no doubt taking many others on its coattails. As equity investors in growing international businesses, we welcome the suggestion that emergency injections of liquidity will not be required forever and even the radical suggestion that interest rates may not have to stay at zero indefinitely. The fundamental improvements allowing for this normalisation of policy conditions are heartening when thinking about the demand drivers and the business opportunities open to the corporate sector over the next few years. We are optimistic that a positive environment of steady improvement in the global economy will present interesting opportunities to own growing international companies at still very attractive prices.
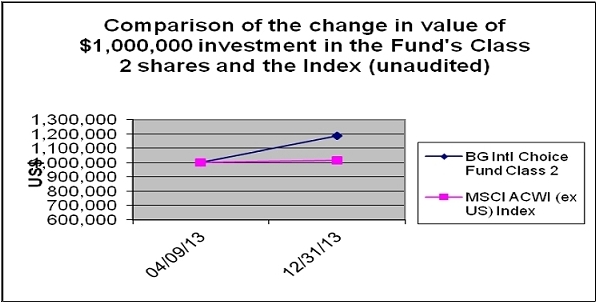
The International Choice Fund Class 2 produced a return of 19.19%* during 2013, outperforming the benchmark which returned 15.78% for the year.
A number of the portfolio’s e-commerce related holdings performed well over the year, with ASOS (UK listed online fashion retailer) and Kinnevik (a Swedish holding company with global exposure in telecoms, media and e-commerce) enjoying rising share prices. We believe there are some quite dramatic changes afoot in e-commerce and some brands are already showing that they could be significant global players. We continue to weigh up some rather off-putting short term valuation figures against the prospect of these businesses being many times their current size in five or ten years.
Hargreaves Lansdown, the UK saving platform, also performed well over the period. The impressive scale of new business inflows and high levels of customer loyalty are hopefully testament to the strength of Hargreaves Lansdown’s customer proposition. We believe that Hargreaves is providing a simple, efficient and valued service at an acceptable fee to the vast majority of its customer base. So long as customers continue to like what it does, it has the potential to grow for many years.
A significant detractor from performance over the period has been UK based graphics chip design business, Imagination Technologies. Although there is every reason to believe that end markets of smartphones, tablets and other consumer electronic gadgets will continue to grow for many years, Imagination appears to have hit something of an air pocket with a few of its end customers as they transition from older consumer devices to newer products. We hope that in five years time the long term growth trajectory of the business will have been re-established. Other significant detractors from performance included Cochlear, the Australian hearing implant manufacturer, and Garanti Bank, the Turkish retail bank.
Investment Strategies used to manage the Fund
Baillie Gifford is a growth manager with a bottom-up approach to stock picking. We aim to invest in companies that will generate sustainable earnings growth above the market over the long term. In determining the potential of a company, we analyse industry background, competitive advantage, management attitudes and financial strength, and finally we consider valuation. We meet the management of the companies within our investment universe and revisit the investment case for the portfolio’s holdings on a regular basis to ensure that our expectations are being met.
The International Focus Portfolio Construction Group is responsible for the overall strategy and stock selection process. They meet regularly to discuss both buy and sell ideas and the level of conviction for existing holdings and will continue to monitor the long term prospects for the Fund’s holdings and make changes where appropriate.
Outlook
We do not and cannot know what will happen to the stock market over the next six or twelve months, however we remain optimistic that we are selecting stocks in a positive and helpful global environment for long term growth investors. We are confident the portfolio holds some excellent growth businesses. We have also been busy considering and debating a number of competing new ideas for the portfolio. Trading infrequently, the result of our long term approach to investing, allows existing holdings to grow, keeps down costs and reduces the occurrence of our tactical mistakes, so we still have an unashamed bias towards a low turnover approach to managing the portfolio.
The last six or seven years may at times have been a bumpy ride for international investment, but we enter 2014 feeling optimistic and excited, particularly on the basis of the attractive opportunities available to us as international growth managers.
| Fund Performance for periods ended 12/31/13 (Average Annual Total Returns) |
| | | | | Since Inception % p.a. | |
| | | One Year | | (April 9, 2013) | |
| | | | | | |
| The International Choice Fund Class 2 | | 19.19%* | | 19.19%* | |
| | | | | | |
| MSCI ACWI ex U.S. Index | | 15.78% | | 15.78% | |
| | | | | | |
*The International Choice Fund Class 2 commenced on April 9, 2013, the return shown is therefore a synthetic return based on the performance of Class 2 since inception plus Class 1 performance from January 1, 2013 to April 8, 2013.
The EAFE Fund
Market Conditions and Review of performance during 2013
Nearly five years into a recovery from the lows reached in early 2009, equity markets have finally rediscovered some genuine optimism, with a notable shift in preference in the second half of 2013 from defensive stocks towards those with more substantial but less predictable growth prospects. We view this sea change in sentiment as a delayed response to the considerable progress made since the global financial crisis, both at a macro and company level. The broadening out of the US recovery, a return to growth in Southern Europe, and the ambitious reform proposals emerging from China’s Third Plenum and ‘Abenomics’ in Japan are all encouraging signs for sustainable global growth.
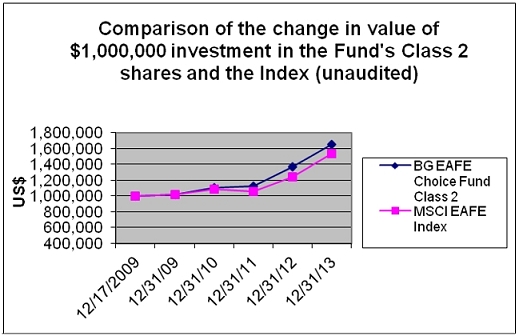
The EAFE Fund Class 2 produced a return of 28.69% during 2013, outperforming the MSCI EAFE Index which returned 23.29% for the year.
The vigour of the rise of some of the Fund’s technology holdings, such as Baidu (Chinese search engine), Tencent (Chinese social networking platform), Naver (South Korean search and messaging portal) and ARM (UK semiconductor chip designer), was evident over the past year. Although this can partly be attributed to the change in market sentiment referred to above, we have been encouraged by the substantial progress made by the internet companies in particular. While the market has been preoccupied by the uncertainty created by the transition from desktop computers to mobile devices, resulting in a pronounced de-rating of the sector over the past couple of years, these companies have been investing heavily for future growth. That investment is now bearing fruit, with considerable progress being made on the monetisation of mobile users.
E-commerce is another fast-growing sub-sector of mobile internet where we are enthusiastic about the long-term growth prospects. Softbank, the Japanese telecoms company with a large stake in the Chinese online marketplace Alibaba, is now one of the Fund’s largest holdings, reflecting strong performance and our growing level of conviction in the company. Other positive contributors in this area have been Swedish investment firm, Kinnevik, which is increasingly focussed on growing its online businesses (32% of its portfolio), ASOS, the UK-based online clothing retailer, and Schibsted, which is successfully shifting from its past as a Norwegian newspaper business to a structurally more profitable internet company.
These gains more than offset weakness in some holdings which are more exposed to concerns about the effect of US tapering on Emerging Markets, such as the Turkish bank, Garanti Bankasi, and the Brazilian stock exchange, BM&F Bovespa. Commodity and traditional energy-related areas have also been weak and, while we have sold several holdings in this area over the past 12 months, the Fund’s holding in SQM, a Chilean potash and lithium mining company, was weak following the collapse of the potash cartel. We think the reaction has been overly pessimistic and are excited by the growth prospects of the lithium business.
Investment Strategies used to manage the Fund
Baillie Gifford is a growth manager with a bottom-up approach to stock picking. We aim to invest in companies that will generate sustainable earnings growth above the market over the long term. In determining the potential of a company, we analyse industry background, competitive advantage, management attitudes and financial strength, and finally we consider valuation. We meet the management of the companies within our investment universe and revisit the investment case for the portfolio’s holdings on a regular basis to ensure that our expectations are being met.
The EAFE Alpha Portfolio Construction Group is responsible for the overall strategy and stock selection process. They meet regularly to discuss both buy and sell ideas and the level of conviction in their continuing holdings.
Outlook
We look into 2014 with a sense of optimism and with a rich seam of exciting companies, themes and countries that we want to learn more about. We are enthusiastic about the significant political and economic progress made over the past few years in Europe and are working to potentially unearth further growth franchises. We are similarly fascinated by the extent of the commitment to reform by the Chinese government which could open up our investment possibilities there. We plan to better our understanding of the scale of these opportunities and to continue to search for companies that might benefit the Fund.
| Fund Performance for periods ended 12/31/13 (Average Annual Total Returns) | |
| | | | | | | Since Inception
% p.a. | |
| | | One Year | | Five Year | | (March 6, 2008) | |
| | | | | | | | |
| The EAFE Fund Class 2* | | 28.69% | | 18.06% | | 5.40% | |
| | | | | | | | |
| MSCI EAFE Index | | 23.29% | | 12.95% | | 2.44% | |
| | | | | | | | |
*Returns for Class 2 shares have been provided. One-year return figures for other share classes are as follows: 28.48% for Class 1, 28.83% for Class 3, and 28.97% for Class 5. Additional year-over-year returns for each class are available in the Financial Highlights section.

The EAFE Choice Fund
Market Conditions and Review of performance during 2013
During 2013, the MSCI EAFE Index delivered a return of 23.29%. Stepping back from all the intraday breaking news updates from countless Federal Reserve watchers and the nervous procrastination of central banks on the precise timing of monetary policy adjustments, the broader picture remains an encouraging one: five years on from the financial crisis, the world is steadily and finally moving on. The American economy at last seems to be building clear momentum going into 2014, no doubt taking many others on its coattails. As equity investors in growing international businesses, we welcome the suggestion that emergency injections of liquidity will not be required forever and even the radical suggestion that interest rates may not have to stay at zero indefinitely. The fundamental improvements allowing for this normalisation of policy conditions are heartening when thinking about the demand drivers and the business opportunities open to the corporate sector over the next few years. We are optimistic that a positive environment of steady improvement in the global economy will present interesting opportunities to own growing international companies at still very attractive prices.
The EAFE Choice Fund Class 2 produced a return of 21.20% during 2013, underperforming the benchmark which returned 23.29% for the year.
A significant detractor from performance over the period has been UK-based graphics chip design business, Imagination Technologies. Although there is every reason to believe that end markets of smartphones, tablets and other consumer electronic gadgets will continue to grow for many years, Imagination appears to have hit something of an air pocket with a few of its end customers as they transition from older consumer devices to newer products. We hope that in five years time the long term growth trajectory of the business will have been re-established. Other significant detractors from performance included Cochlear, an Australian hearing implant manufacturer, and Garanti Bank, a Turkish retail bank.
A number of the portfolio’s e-commerce related holdings performed well over the year, with ASOS (UK-listed online fashion retailer) and Kinnevik (a Swedish holding company with global exposure in telecoms, media and e-commerce) enjoying rising share prices. We believe there are some quite dramatic changes afoot in e-commerce and some brands are already showing that they could be significant global players. We continue to weigh up some rather off-putting short term valuation figures against the prospect of these businesses being many times their current size in five or ten years.
Hargreaves Lansdown, the UK saving platform, also performed well over the period. The impressive scale of new business inflows and high levels of customer loyalty are hopefully a testament to the strength of Hargreaves Lansdown’s customer proposition. We believe that Hargreaves is providing a simple, efficient and valued service at an acceptable fee to the vast majority of its customer base. So long as customers continue to like what it does, it has the potential to grow for many years.
Investment Strategies used to manage the Fund
Baillie Gifford is a growth manager with a bottom-up approach to stock picking. We aim to invest in companies that will generate sustainable earnings growth above the market over the long term. In determining the potential of a company, we analyse industry background, competitive advantage, management attitudes and financial strength, and finally we consider valuation. We meet the management of the companies within our investment universe and revisit the investment case for the portfolio’s holdings on a regular basis to ensure that our expectations are being met.
The International Focus Portfolio Construction Group is responsible for the overall strategy and stock selection process. They meet regularly to discuss both buy and sell ideas and the level of conviction for existing holdings and will continue to monitor the long term prospects for the Fund’s holdings and make changes where appropriate.
Outlook
We do not and cannot know what will happen to the stock market over the next six or twelve months, however we remain optimistic that we are selecting stocks in a positive and helpful global environment for long term growth investors. We are confident the portfolio holds some excellent growth businesses. We have also been busy considering and debating a number of competing new ideas for the portfolio. Trading infrequently, the result of our long term approach to investing, allows existing holdings to grow, keeps down costs and reduces the occurrence of our tactical mistakes, so we still have an unashamed bias towards a low turnover approach to managing the portfolio.
The last six or seven years may at times have been a bumpy ride for international investment, but we enter 2014 feeling optimistic and excited, particularly on the basis of the attractive opportunities available to us as international growth managers.
| Fund Performance for periods ended 12/31/13 (Average Annual Total Returns) | |
| | | | | Since Inception % | |
| | | | | p.a. | |
| | | One Year | | (December 17, 2009)* | |
| | | | | | |
| The EAFE Choice Fund Class 2* | | 21.20% | | 11.30% | |
| | | | | | |
| MSCI EAFE Index | | 23.29% | | 8.54% | |
| | | | | | |
*Returns for Class 2 shares have been provided. Additional year-over-year returns for each class are available in the Financial Highlights section.
The Emerging Markets Fund
Market Conditions and Review of Performance during 2013
Over the course of 2013, the MSCI Emerging Markets Index posted negative returns, underperforming developed equity markets, as speculation surrounding tapering of the US Federal Reserve’s quantitative easing programme heightened investors’ fear. Concerns over a liquidity crunch in Chinese banks raised worries over possible bank failures, and civil unrest in a number of Emerging Market countries also weighed.
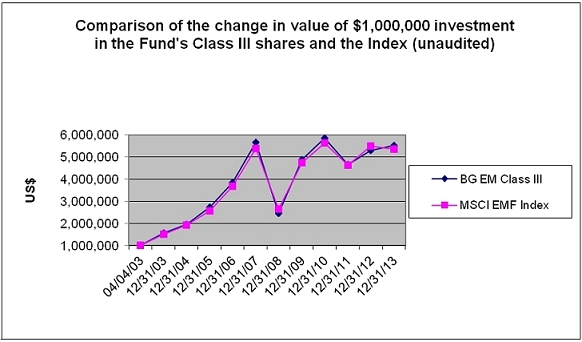
The Emerging Markets Fund Class III returned 3.98% during 2013, outperforming the MSCI Emerging Markets Index which returned -2.27% for the year.
The Taiwanese market was the best performing market in the MSCI Emerging Markets Index over the year as firmer global growth provided a favourable backdrop for Taiwanese exports, particularly technological and non-commodity goods. Ongoing expansion in global trade also buoyed the Korean market, the second largest index constituent. Elsewhere, further signs of economic stabilization and a steady pace of structural reform progress, most recently invigorated by the proposals unveiled by President Xi Jinping after the Third Plenum of the 18th Congress of the Communist Party, helped to sustain investor confidence in China, which also performed well. On the other hand, in a stark reversal of fortunes to its 2012 performance, Turkey was one of the hardest hit markets. Macroeconomic concerns about a slowdown in growth, depreciating currency and burgeoning current account deficit, coupled with widespread anti-governmental demonstrations, provided investors with numerous reasons for concern. The smaller ASEAN economies of Indonesia and Thailand fared no better. In Indonesia, with economic growth slowing due to falling demand for its commodities from China, a high current account deficit exposing its vulnerability to the tightening of US monetary policy, and ongoing inflationary pressures, investor sentiment towards Indonesia was weak. In a similar vein, and for almost identical reasons and in contrast to a very strong 2012 performance, the Thai market struggled. The portfolio ended 2013 with no holdings in Turkey, Indonesia or Thailand. Elsewhere, in Latin America, whilst the Mexican stock market benefitted over the year from the US recovery and ongoing structural reform, Brazil was notably weak. Investor concerns appeared centered on higher interest rates, government interference and a deteriorating fiscal outlook.
The stand-out sector performer over the year was Information Technology, where both the overweight position and stock selection contributed strongly towards performance. The Information Technology companies which performed best over the year were underpinned by varied and often uncorrelated growth drivers. Amongst the top positive contributors were Tech Mahindra (Indian Information Technology Outsourcer), Naver (South Korean search engine) and GCL-Poly Energy Holdings (Chinese polysilicon manufacturer). Whilst all three are examples of companies that MSCI designates as ‘Information Technology’, the businesses depend respectively upon global corporate Information Technology capital expenditure, internet penetration and online spending in South Korea, and an increase in global demand for cheaper and greener energy.
The Fund’s underweight position to the Materials sector also contributed towards relative performance. We remain extremely cautious on those broader areas of the market which have spent the past decade coat-tailing on Chinese commodity demand.
On the other hand, stock selection in the Energy sector was the largest drag on relative performance. These stocks are overwhelmingly newsflow driven and stock prices can be very volatile from one quarter to the next, often on little specific news. African Petroleum Corp (West Africa), Tullow Oil (Ghana) and Niko Resources Limited (India and Indonesia) all appear amongst the biggest detractors of the year. Whilst in 2012 Africa Petroleum was the Fund’s top performer, in the early part of 2013 the announcement that an oil discovery off the coast of Liberia was not commercial resulted a sharp decline in the share price from which it has yet to recover. Tullow Oil drilled a number of dry wells
and its success rate ran at approximately 30% over the year compared to around 50% historically. Niko failed to have any success with its Indonesian oil exploration and whilst it still has huge acreage, its stressed balance sheet means it will be very difficult to unlock the value of any of its assets and therefore we sold the holding. Conversely, Dragon Oil (Turkmenistan) appears amongst the top contributors over the year. Strong growth in production volumes from its operations and a trading update reiterating 10-15% production growth for 2014 were taken well by investors.
Investment Strategies used to manage the Fund.
Baillie Gifford is a growth manager with a bottom-up approach to stock picking. We aim to invest in companies that will generate sustainable earnings growth above the market over the long term. In determining the potential of a company, we analyse the industry background, competitive advantage, management attitudes and financial strength, and finally we consider valuation. We meet the management of the companies within our investment universe and revisit the investment case for the portfolio’s holdings on a regular basis to ensure that our expectations are being met.
The Emerging Markets investment team is responsible for the overall strategy and stock selection process, led by the most senior investment managers. The team meets regularly to discuss both buy and sell ideas and to determine the level of conviction in the Fund’s holdings.
Outlook
The soothsayers are hard at work, divining whether 2014 will be a breakout or breakdown year for Emerging Markets. As stock pickers, we have no strong views on the relative emerging vs. developed trade, and observe that we rarely find headline market multiples to be particularly informative. Of more interest to us is the relatively polarised nature of valuations: for example, analysis from UBS suggests that the spread between the cheapest and most expensive quintiles of the MSCI EM Index is the highest it has been for more than 20 years. We continue to have little interest in those ‘bond-like’ equities that now find themselves among the most richly-valued segments of the market. We are also not particularly drawn to many of the stocks at the cheapest end either, especially since many of these are state-owned entities (notably financial and commodity companies) that may be called upon to support the national interest at a time of slowing economic growth. The case for a re-rating of these optically cheap headline multiples is not, in our view, persuasive.
Rather, it is in the middle-ground that we continue to find the richest seam of ideas: particularly those stocks with very substantial but less predictable growth streams that we believe have been left trading on anomalously low valuations given the fashion for safety in recent years. Indeed, we have been encouraged by tentative hints that this trend may finally be coming to an end. This has perhaps been most evident in the strong performance of a number of our favourite internet stocks in recent months. Have these stocks simply been hyped ahead of the Alibaba IPO, with valuations now looking stretched? We would suggest there is far more to it than this. The pace of technological change remains breathtaking and exploitable by entrepreneurial management teams. The operational performance of companies is the proof we require, and we hope the market continues to reward this, by becoming increasingly willing to join us in looking through the odd, inevitable quarterly blip.
| | | One Year | | Five Year | | 10 Year | | Since inception % | |
| | | | | | | | | p.a. (April 4, 2003) | |
| The Emerging Markets Fund Class III* | | 3.98% | | 17.53% | | 13.24% | | 17.24% | |
| | | | | | | | | | |
| MSCI Emerging Markets Index | | -2.27% | | 15.14% | | 13.83% | | 15.21% | |
| | | | | | | | | | |
*Returns for Class III shares have been provided. Additional year-over-year returns for each class are available in the Financial Highlights section.
The Global Alpha Equity Fund
Market Conditions and Review of Performance during 2013
It has been a strong year for equity markets and the most noticeable feature of the past twelve months has been the recovery in developed markets, with Emerging Market returns lagging significantly. Whilst fears over the sustainability of China’s strong growth and the gradual withdrawal of quantitative easing continue to weigh on sentiment, talk of tapering was better received during the fourth quarter than previously and we continue to see it as a positive. Signs of a move towards a more “normal” monetary policy surely mean that the US economy continues to strengthen.
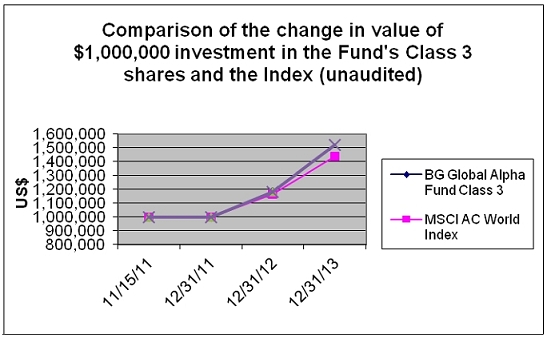
The Global Alpha Equity Fund Class 3 produced a return of 28.71% during 2013, outperforming the MSCI All Country World Index which returned 23.44% for the year.
As we would expect, stock selection drove performance. Amongst the top performers were Tesla Motors (electric car manufacturer) and Prudential (life insurer). Tesla, a new purchase for the portfolio during the first quarter, is seeking to create a new market for Electric Vehicles by pushing the boundaries of styling, battery life and range. Shortly after purchase the company reported its first quarterly profit, announced that it planned to pay back a $450m Department of Energy loan and that its Model S had received the highest ever rating (99/100) in a well regarded Consumer Reports survey. All of these factors conspired to lift Tesla’s shares very significantly and we felt it prudent to take some profits. Whilst we remain aware of the risks associated with the continued expansion of what is still a relatively early stage business, we also remain excited by its prospects as it moves from high end cars towards more mass market models.
Prudential, the life insurer, was also a strong contributor to the portfolio during 2013, despite an impressive three year run. Whilst Prudential is UK listed, we hold the company because of its strong Asian business. Prudential recently announced an expansion of its operations in Cambodia, Myanmar, Poland and Ghana in addition to strong existing business in Indonesia, Singapore, Vietnam, Thailand, the Philippines and Hong Kong. These markets have attractive characteristics: fast-growing GDP, young populations and low insurance penetration. In December, management set new objectives including increased free surplus generation targets and growth of pre tax operating profits in Asia, which again prompted the share price to react positively.
The most significant negative contributor to performance was Clicks. The South African pharmacy chain indicated that it wanted to curb increases in drug costs for customers despite rising pharmacist wages, leading to concerns that profitability would deteriorate. The company is also operating against a more challenging demand backdrop, with growth prospects looking weaker than we had hoped. We sold out of the stock during the third quarter in search of more exciting opportunities elsewhere.
Another detractor from performance was BM&F Bovespa. The Brazilian stock exchange operator’s share price was affected over the year by macroeconomic concerns including the reversal of the cheap dollar, a slow down in the end markets for the country’s commodities exports and some recent social tension. Coupled with this, company specific factors including soft trading volumes and a dispute with the Brazilian tax authority also contributed to the stock’s performance. Clearly, shareholders have had much to worry about this year. However, we think the long-term growth drivers remain in place for this company: they are geared into the development of a still immature stock market in a country with attractive demographics and a very low base of equity ownership. The company holds a dominant position in trading and clearing in Brazil and as such is able to earn attractive returns. We are confident that trading volumes and prospects will grow significantly over the longer term.
Investment Strategies used to manage the Fund
Baillie Gifford is a growth manager with a bottom-up approach to stock picking. We aim to invest in companies that will generate sustainable earnings growth above the market over the long-term. In determining the potential of a company, we analyse industry background, competitive advantage, management attitudes and financial strength, and finally we consider valuation. We meet the management of the companies within our investment universe and revisit the investment case for the portfolio’s holdings on a regular basis to ensure that our expectations are being met.
The Global Alpha investment team is responsible for the overall strategy and stock selection process. They meet regularly as part of a Portfolio Review Group, along with representatives from each of Baillie Gifford’s regional investment teams, to discuss both buy and sell ideas and the level of conviction in their continuing holdings.
Outlook
We appear to have moved into a new phase in the process of healing the global economy. Central banks and governments (notably in the US) are now seeking to reduce stimulus and rid their balance sheets of assets they acquired during the financial crisis. Inevitably this will continue to cause some unease amongst markets and so we would expect periods of volatility to continue.
Whilst other risks exist – notably the challenges of re-orientating the Chinese economy towards domestic consumption and stimulating growth in Europe, we think that the broad progress being made bodes well for corporate confidence. Indeed, we remain upbeat about the growth prospects for the types of high quality companies in which we invest for the fund.
| Fund Performance for periods ended 12/31/13 (Average Annual Total Returns) | |
| | | | | Since Inception % | |
| | | | | p.a. | |
| | | One Year | | (November 15, 2011) | |
| | | | | | |
| The Global Alpha Fund Class 3* | | 28.71% | | 21.34% | |
| | | | | | |
| MSCI AC World Index | | 23.44% | | 19.06% | |
*Returns for Class 2 shares have been provided. Additional year-over-year returns for each class are available in the Financial Highlights section.
Fund Expenses (unaudited)
As a shareholder of the Baillie Gifford International Equity Fund, the Baillie Gifford International Choice Fund, the Baillie Gifford EAFE Fund, the Baillie Gifford EAFE Choice Fund, the Baillie Gifford Emerging Markets Fund and/or the Baillie Gifford Global Alpha Equity Fund (together, the “Funds”), you incur two types of costs: (1) transaction costs, which may include purchase premiums and redemption fees and (2) ongoing costs, including management fees, shareholder service fees and other Fund expenses. This example is intended to help you understand your ongoing costs (in dollars) of investing in the Funds and to compare these costs with the ongoing costs of investing in the other mutual funds.
The example is based on an investment of $1,000 invested at the beginning of the period and held for the entire period from July 1, 2013 to December 31, 2013.
Actual Expenses
The first line of each table provides information about actual account values and actual expenses. You may use the information in this line, together with the amount you invested, to estimate the expenses that you paid over the period. Simply divide the account value by $1,000 (for example, an $8,600 account value divided by $1,000 = 8.6), then multiply the result by the number in the first line under the heading entitled “Expenses Paid During the Period” to estimate the expenses you paid on your account during this period.
Hypothetical Example for Comparison Purposes
The second line of each table on the following page provides information about hypothetical account values and hypothetical expenses based on the Fund’s actual expense ratio and an assumed annual rate of return of 5% before expenses, which is not the Fund’s actual return. The hypothetical account values and expenses may not be used to estimate the actual ending account balance or expenses you paid for the period. You may use this information to compare the ongoing costs of investing in the Fund and other funds by comparing this 5% hypothetical example with the 5% hypothetical examples that appear in the shareholder reports of other funds.
Please note that the expenses shown in the table are meant to highlight your ongoing costs only and do not reflect any transactional costs, such as purchase premiums and redemption fees. Therefore, the second line of the table is useful in comparing ongoing costs only, and will not help you determine the relative total costs of owning different funds. In addition, if these transactional costs were included, your costs would have been higher.
Fund Expenses (unaudited)(continued)
| | | | | | | | | | |
| | | Beginning
Account Value
7/01/2013 | | Ending
Account
Value
12/31/13 | | Annualized Expense
Ratios Based on the
Period 7/01/13 to
12/31/13 | | Expenses Paid
During the Period
7/01/13 to 12/31/13 | |
| | | | | | | | | | |
| Baillie Gifford International Equity - Class 1 | | | | | | | | | |
| Actual | | $1,000.00 | | $1,165.56 | | 0.78% | | $4.26 | |
| Hypothetical (5% return before expenses) | | $1,000.00 | | $1,021.27 | | 0.78% | | $3.97 | |
| | | | | | | | | | |
| Baillie Gifford International Equity - Class 2 | | | | | | | | | |
| Actual | | $1,000.00 | | $1,165.89 | | 0.61% | | $3.33 | |
| Hypothetical (5% return before expenses) | | $1,000.00 | | $1,022.13 | | 0.61% | | $3.11 | |
| | | | | | | | | | |
| Baillie Gifford International Equity - Class 3 | | | | | | | | | |
| Actual | | $1,000.00 | | $1,165.59 | | 0.54% | | $2.95 | |
| Hypothetical (5% return before expenses) | | $1,000.00 | | $1,022.48 | | 0.54% | | $2.75 | |
| | | | | | | | | | |
| Baillie Gifford International Equity - Class 4 | | | | | | | | | |
| Actual | | $1,000.00 | | $1,167.20 | | 0.51% | | $2.79 | |
| Hypothetical (5% return before expenses) | | $1,000.00 | | $1,022.63 | | 0.51% | | $2.60 | |
| | | | | | | | | | |
| Baillie Gifford International Choice - Class 2 | | | | | | | | | |
| Actual | | $1,000.00 | | $1,144.68 | | 0.65% | | $3.51 | |
| Hypothetical (5% return before expenses) | | $1,000.00 | | $1,021.93 | | 0.65% | | $3.31 | |
| | | | | | | | | | |
| Baillie Gifford International Choice - Class 3 | | | | | | | | | |
| Actual | | $1,000.00 | | $1,145.85 | | 0.56% | | $3.03 | |
| Hypothetical (5% return before expenses) | | $1,000.00 | | $1,022.38 | | 0.56% | | $2.85 | |
| | | | | | | | | | |
| Baillie Gifford EAFE - Class 1 | | | | | | | | | |
| Actual | | $1,000.00 | | $1,264.37 | | 0.78% | | $4.45 | |
| Hypothetical (5% return before expenses) | | $1,000.00 | | $1,021.27 | | 0.78% | | $3.97 | |
| | | | | | | | | | |
| Baillie Gifford EAFE - Class 2 | | | | | | | | | |
| Actual | | $1,000.00 | | $1,265.17 | | 0.61% | | $3.48 | |
| Hypothetical (5% return before expenses) | | $1,000.00 | | $1,022.13 | | 0.61% | | $3.11 | |
| | | | | | | | | | |
| Baillie Gifford EAFE - Class 3 | | | | | | | | | |
| Actual | | $1,000.00 | | $1,266.53 | | 0.54% | | $3.08 | |
| Hypothetical (5% return before expenses) | | $1,000.00 | | $1,022.48 | | 0.54% | | $2.75 | |
| | | | | | | | | | |
| Baillie Gifford EAFE - Class 4* | | | | | | | | | |
| Actual | | $1,000.00 | | $1,092.92 | | 0.52% | | $1.24 | |
| Hypothetical (5% return before expenses) | | $1,000.00 | | $1,022.58 | | 0.52% | | $2.65 | |
| | | | | | | | | | |
| Baillie Gifford EAFE - Class 5 | | | | | | | | | |
| Actual | | $1,000.00 | | $1,266.73 | | 0.46% | | $2.63 | |
| Hypothetical (5% return before expenses) | | $1,000.00 | | $1,022.89 | | 0.46% | | $2.35 | |
| | | | | | | | | | |
| Baillie Gifford EAFE Choice - Class 1** | | | | | | | | | |
| Actual | | $1,000.00 | | $1,043.92 | | 0.27% | | $0.11 | |
| Hypothetical (5% return before expenses) | | $1,000.00 | | $1,023.84 | | 0.27% | | $1.38 | |
Fund Expenses (unaudited)(concluded)
| Baillie Gifford EAFE Choice - Class 2 | | | | | | | | | |
| Actual | | $1,000.00 | | $1,153.23 | | 0.65% | | $3.53 | |
| Hypothetical (5% return before expenses) | | $1,000.00 | | $1,021.93 | | 0.65% | | $3.31 | |
| | | | | | | | | | |
| Baillie Gifford Emerging Markets - Class II | | | | | | | | | |
| Actual | | $1,000.00 | | $1,128.19 | | 0.90% | | $4.83 | |
| Hypothetical (5% return before expenses) | | $1,000.00 | | $1,020.67 | | 0.90% | | $4.58 | |
| | | | | | | | | | |
| Baillie Gifford Emerging Markets - Class III | | | | | | | | | |
| Actual | | $1,000.00 | | $1,128.58 | | 0.75% | | $4.02 | |
| Hypothetical (5% return before expenses) | | $1,000.00 | | $1,021.42 | | 0.75% | | $3.82 | |
| | | | | | | | | | |
| Baillie Gifford Global Alpha Equity - Class 2 | | | | | | | | | |
| Actual | | $1,000.00 | | $1,149.94 | | 0.68% | | $3.68 | |
| Hypothetical (5% return before expenses) | | $1,000.00 | | $1,021.78 | | 0.68% | | $3.47 | |
| | | | | | | | | | |
| Baillie Gifford Global Alpha Equity - Class 3 | | | | | | | | | |
| Actual | | $1,000.00 | | $1,151.33 | | 0.61% | | $3.31 | |
| Hypothetical (5% return before expenses) | | $1,000.00 | | $1,022.13 | | 0.61% | | $3.11 | |
| * | | Commencement of investment operations October 10, 2013. |
| ** | | Commencement of investment operations December 17, 2013. |
Expenses are calculated using the annualized expense ratio for the Funds, which represents the ongoing expenses as a percentage of net assets for the six-months ended December 31, 2013. Expenses are calculated by multiplying the annualized expense ratio by the average account value for the period; then multiplying the result by the number of days in the most recent fiscal half-year; and then dividing that result by the number of days in the calendar year. Expense ratios for the most recent fiscal half-year may differ from expense ratios based on the one-year data in the financial highlights.
| INDUSTRY DIVERSIFICATION TABLE | |
| December 31, 2013 (unaudited) | Baillie Gifford International Equity Fund |
| | | Value | | | % of Total
Net Assets | |
| | | | | | | | | |
| Aerospace | | $ | 28,415,819 | | | | 1.1 | % |
| Aerospace/Defense | | | 21,315,742 | | | | 0.8 | |
| Airlines | | | 32,655,490 | | | | 1.3 | |
| Apparel | | | 47,392,790 | | | | 1.9 | |
| Apparel retailers | | | 44,650,026 | | | | 1.8 | |
| Auto Manufacturers | | | 79,636,106 | | | | 3.1 | |
| Banks | | | 207,984,810 | | | | 8.2 | |
| Beverages, Food & Tobacco | | | 93,522,525 | | | | 3.7 | |
| Biotechnology | | | 24,807,397 | | | | 1.0 | |
| Chemicals | | | 24,176,000 | | | | 1.0 | |
| Commercial Services | | | 132,324,135 | | | | 5.2 | |
| Construction & Building Materials | | | 74,212,139 | | | | 2.9 | |
| Distribution/Wholesale | | | 24,159,084 | | | | 0.9 | |
| Diversified Financial Services | | | 102,997,607 | | | | 4.0 | |
| Diversified Industrials | | | 20,145,122 | | | | 0.8 | |
| Electronic & Electrical Equipment | | | 106,269,529 | | | | 4.2 | |
| Engineering & Construction | | | 19,487,203 | | | | 0.8 | |
| Engineering & Machinery | | | 136,103,729 | | | | 5.3 | |
| Exploration & Production | | | 28,154,201 | | | | 1.1 | |
| Food Producers & Processors | | | 144,330,305 | | | | 5.7 | |
| Food Retailers & Wholesalers | | | 37,754,746 | | | | 1.5 | |
| General Retailers | | | 9,768,021 | | | | 0.4 | |
| Healthcare - Products | | | 47,115,221 | | | | 1.9 | |
| Industrial Suppliers | | | 35,578,392 | | | | 1.4 | |
| Insurance | | | 164,047,902 | | | | 6.4 | |
| Internet | | | 135,762,468 | | | | 5.3 | |
| Investment Companies | | | 11,418,138 | | | | 0.4 | |
| Investment Services | | | 27,619,493 | | | | 1.1 | |
| Machinery - Diversified | | | 25,635,368 | | | | 1.0 | |
| Media & Photography | | | 105,601,568 | | | | 4.1 | |
| Mining & Metals | | | 95,251,742 | | | | 3.7 | |
| Mobile Telecommunications | | | 19,626,380 | | | | 0.8 | |
| Oil & Gas | | | 77,281,601 | | | | 3.0 | |
| Pharmaceuticals | | | 25,141,312 | | | | 1.0 | |
| Retailers - General | | | 27,142,296 | | | | 1.1 | |
| Semiconductors | | | 138,937,356 | | | | 5.5 | |
| Software | | | 47,826,100 | | | | 1.9 | |
| Telecommunication Services | | | 20,072,261 | | | | 0.8 | |
| Transportation | | | 33,464,718 | | | | 1.3 | |
| Travel & Leisure | | | 18,380,312 | | | | 0.7 | |
| | | | | | | | | |
| Total Value of Investments | | | 2,496,165,154 | | | | 98.1 | |
| Other assets less liabilities | | | 48,442,491 | | | | 1.9 | |
| Net Assets | | $ | 2,544,607,645 | | | | 100.0 | % |
| PORTFOLIO OF INVESTMENTS | |
| December 31, 2013 | Baillie Gifford International Equity Fund |
| | | Shares | | | Value |
| | | | | | | |
| COMMON STOCKS - 97.6% | | | | | | |
| ARGENTINA - 1.2% | | | | | | |
| MercadoLibre, Inc. | | | 291,009 | | | $ | 31,367,860 | |
| | | | | | | | | |
| AUSTRALIA - 3.0% | | | | | | | | |
| Brambles Ltd. | | | 3,046,989 | | | | 24,963,740 | |
| Cochlear Ltd. | | | 328,468 | | | | 17,306,028 | |
| Treasury Wine Estates Ltd. | | | 3,172,796 | | | | 13,684,243 | |
| Woolworths Ltd. | | | 665,267 | | | | 20,145,122 | |
| | | | | | | | 76,099,133 | |
| BERMUDA - 0.7% | | | | | | | | |
| Seadrill Ltd. | | | 417,902 | | | | 17,127,495 | |
| | | | | | | | | |
| BRAZIL - 0.8% | | | | | | | | |
| Embraer SA ADR | | | 662,391 | | | | 21,315,742 | |
| | | | | | | | | |
| CANADA - 2.7% | | | | | | | | |
| Cenovus Energy, Inc. | | | 427,789 | | | | 12,242,679 | |
| Fairfax Financial Holdings Ltd. | | | 90,368 | | | | 36,079,993 | |
| Ritchie Bros. Auctioneers, Inc. | | | 583,250 | | | | 13,373,922 | |
| Westport Innovations, Inc. (a) | | | 324,929 | | | | 6,359,401 | |
| | | | | | | | 68,055,995 | |
| CHINA - 5.7% | | | | | | | | |
| Baidu, Inc. ADR (a) | | | 201,964 | | | | 35,925,356 | |
| China Mobile Ltd. | | | 1,927,000 | | | | 20,072,261 | |
| Hang Seng Bank Ltd. | | | 1,310,700 | | | | 21,287,812 | |
| Hong Kong Exchanges and Clearing Ltd. | | | 2,122,400 | | | | 35,476,628 | |
| Sun Art Retail Group Ltd. | | | 6,916,500 | | | | 9,768,021 | |
| Want Want China Holdings Ltd. | | | 16,150,000 | | | | 23,374,627 | |
| | | | | | | | 145,904,705 | |
| DENMARK - 3.3% | | | | | | | | |
| DSV A/S | | | 1,019,255 | | | | 33,464,718 | |
| Novo Nordisk A/S, B Shares | | | 137,158 | | | | 25,141,312 | |
| Novozymes A/S, B Shares | | | 587,293 | | | | 24,807,397 | |
| | | | | | | | 83,413,427 | |
| FINLAND - 3.7% | | | | | | | | |
| Kone Oyj, B Shares | | | 1,198,168 | | | | 54,035,916 | |
| Sampo Oyj, A Shares | | | 794,875 | | | | 39,070,355 | |
| | | | | | | | 93,106,271 | |
| FRANCE - 3.1% | | | | | | | | |
| Compagnie Generale d’Optique Essillor International SA | | | 280,141 | | | | 29,809,193 | |
| Edenred | | | 709,497 | | | | 23,755,780 | |
| Lafarge SA | | | 322,538 | | | | 24,209,769 | |
| | | | | | | | 77,774,742 | |
The accompanying notes are an integral part of the financial statements.
| PORTFOLIO OF INVESTMENTS (continued) | |
| December 31, 2013 | Baillie Gifford International Equity Fund |
| | | Shares | | | Value |
| | | | | | | | | |
| GERMANY - 6.6% | | | | | | | | |
| Brenntag AG | | | 130,261 | | | $ | 24,176,000 | |
| Continental AG | | | 166,609 | | | | 36,602,378 | |
| Deutsche Boerse AG | | | 515,741 | | | | 42,741,677 | |
| SAP AG | | | 298,732 | | | | 25,906,629 | |
| Sky Deutschland AG (a) | | | 3,482,205 | | | | 38,489,105 | |
| | | | | | | | 167,915,789 | |
| INDIA - 0.4% | | | | | | | | |
| IDFC, Ltd. | | | 6,421,969 | | | | 11,418,138 | |
| | | | | | | | | |
| IRELAND - 3.2% | | | | | | | | |
| CRH Plc. | | | 826,064 | | | | 20,976,159 | |
| James Hardie Industries Plc. SE CDI | | | 2,501,025 | | | | 29,026,211 | |
| Ryanair Holdings Plc. ADR (a) | | | 695,834 | | | | 32,655,490 | |
| | | | | | | | 82,657,860 | |
| JAPAN - 9.3% | | | | | | | | |
| FANUC Corp. | | | 139,900 | | | | 25,635,368 | |
| Fast Retailing Co., Ltd. | | | 79,200 | | | | 32,711,413 | |
| Japan Exchange Group, Inc. | | | 971,700 | | | | 27,619,493 | |
| Rakuten, Inc. | | | 2,614,500 | | | | 39,017,314 | |
| Shimano, Inc. | | | 214,100 | | | | 18,380,312 | |
| SMC Corp. | | | 129,800 | | | | 32,760,032 | |
| Tokyo Electron Ltd. | | | 283,400 | | | | 15,616,112 | |
| Toyota Tsusho Corp. | | | 974,200 | | | | 24,159,084 | |
| Trend Micro, Inc. | | | 625,500 | | | | 21,919,471 | |
| | | | | | | | 237,818,599 | |
| NETHERLANDS - 2.7% | | | | | | | | |
| Heineken Holding NV | | | 535,772 | | | | 33,914,375 | |
| Unilever NV CVA | | | 840,789 | | | | 33,804,303 | |
| | | | | | | | 67,718,678 | |
| NORWAY - 0.8% | | | | | | | | |
| Aker Solutions ASA | | | 1,088,449 | | | | 19,487,203 | |
| | | | | | | | | |
| PERU - 1.0% | | | | | | | | |
| Credicorp Ltd. | | | 185,577 | | | | 24,631,635 | |
| | | | | | | | | |
| PORTUGAL - 0.3% | | | | | | | | |
| Galp Energia, SGPS, SA | | | 477,745 | | | | 7,829,923 | |
| | | | | | | | | |
| RUSSIA - 2.2% | | | | | | | | |
| Magnit OJSC GDR Reg S | | | 568,441 | | | | 37,754,746 | |
| Sberbank of Russia ADR | | | 1,488,930 | | | | 18,785,102 | |
| | | | | | | | 56,539,848 | |
| SINGAPORE - 1.4% | | | | | | | | |
| United Overseas Bank Ltd. | | | 2,149,175 | | | | 36,293,230 | |
| | | | | | | | | |
| SOUTH AFRICA - 3.1% | | | | | | | | |
| Massmart Holdings Ltd. | | | 983,469 | | | | 12,195,810 | |
| Naspers Ltd., N Shares | | | 641,154 | | | | 67,112,463 | |
| | | | | | | | 79,308,273 | |
The accompanying notes are an integral part of the financial statements.
| PORTFOLIO OF INVESTMENTS (continued) | |
| December 31, 2013 | Baillie Gifford International Equity Fund |
| | | Shares | | | Value |
| | | | | | | | | |
| SOUTH KOREA - 5.4% | | | | | | | | |
| Hyundai Mobis (a) | | | 59,368 | | | $ | 16,528,286 | |
| NAVER Corp. | | | 42,738 | | | | 29,451,938 | |
| Samsung Electronics Co., Ltd. | | | 55,930 | | | | 72,879,435 | |
| SK Telecom Co., Ltd. | | | 89,684 | | | | 19,626,380 | |
| | | | | | | | 138,486,039 | |
| SPAIN - 1.8% | | | | | | | | |
| Inditex SA | | | 270,423 | | | | 44,650,026 | |
| | | | | | | | | |
| SWEDEN - 5.1% | | | | | | | | |
| Atlas Copco AB, B Shares | | | 1,939,623 | | | | 49,307,781 | |
| Svenska Handelsbanken AB, A Shares | | | 1,250,324 | | | | 61,474,457 | |
| Volvo AB, B Shares | | | 1,531,041 | | | | 20,146,041 | |
| | | | | | | | 130,928,279 | |
| SWITZERLAND - 2.8% | | | | | | | | |
| Nestle SA | | | 959,289 | | | | 70,306,350 | |
| TAIWAN - 3.3% | | | | | | | | |
| Hon Hai Precision Industry Co., Ltd. GDR Reg S | | | 3,520,025 | | | | 18,726,533 | |
| Taiwan Semiconductor Manufacturing Co., Ltd. | | | 18,418,000 | | | | 65,033,219 | |
| | | | | | | | 83,759,752 | |
| TURKEY - 1.1% | | | | | | | | |
| BIM Birlesik Magazalar A/S | | | 834,084 | | | | 16,845,025 | |
| Turkiye Garanti Bankasi A/S | | | 3,727,967 | | | | 12,084,336 | |
| | | | | | | | 28,929,361 | |
| UNITED KINGDOM - 22.3% | | | | | | | | |
| Amlin Plc. | | | 3,687,822 | | | | 28,073,969 | |
| Antofagasta Plc. | | | 1,172,755 | | | | 16,077,951 | |
| ARM Holdings Plc. | | | 3,205,638 | | | | 58,288,025 | |
| BG Group Plc. | | | 1,065,648 | | | | 22,931,113 | |
| BHP Billiton Plc. | | | 662,699 | | | | 20,563,599 | |
| British American Tobacco Plc. | | | 855,602 | | | | 45,923,907 | |
| Burberry Group Plc. | | | 582,700 | | | | 14,681,377 | |
| Capita Plc. | | | 2,081,258 | | | | 35,825,327 | |
| Experian Plc. | | | 1,862,523 | | | | 34,405,366 | |
| Hargreaves Lansdown Plc. | | | 1,103,172 | | | | 24,779,302 | |
| Petrofac Ltd. | | | 846,142 | | | | 17,150,391 | |
| Premier Farnell Plc. | | | 3,987,052 | | | | 14,663,561 | |
| Prudential Plc. | | | 1,934,385 | | | | 43,222,136 | |
| Rio Tinto Plc. | | | 1,037,166 | | | | 58,610,192 | |
| Rolls-Royce Holdings Plc. (a) | | | 1,343,443 | | | | 28,415,819 | |
| St James’s Place Plc. | | | 1,456,237 | | | | 17,601,449 | |
| Standard Chartered Plc. | | | 953,077 | | | | 21,527,212 | |
| Tullow Oil Plc. | | | 1,983,715 | | | | 28,154,201 | |
| Wolseley Plc. | | | 625,791 | | | | 35,578,392 | |
| | | | | | | | 566,473,289 | |
| UNITED STATES - 0.6% | | | | | | | | |
| PriceSmart, Inc. | | | 129,362 | | | | 14,946,486 | |
The accompanying notes are an integral part of the financial statements.
| PORTFOLIO OF INVESTMENTS (concluded) | |
| December 31, 2013 | Baillie Gifford International Equity Fund |
| | | Shares | | | Value |
| | | | | | | |
Total Common Stocks
(cost $1,891,512,932) | | | | | | $ | 2,484,264,128 | |
| | | | | | | | | |
| PREFERRED STOCKS - 0.5% | | | | | | | | |
| BRAZIL - 0.5% | | | | | | | | |
Itau Unibanco Holding SA ADR
(cost $14,189,621) | | | 877,010 | | | | 11,901,026 | |
| | | | | | | | | |
TOTAL INVESTMENTS - 98.1%
(cost $1,905,702,553) | | | | | | | 2,496,165,154 | |
| Other assets less liabilities - 1.9% | | | | | | | 48,442,491 | |
| NET ASSETS - 100.0% | | | | | | $ | 2,544,607,645 | |
| (a) Non-income producing security. |
| ADR | - | American Depositary Receipt. |
| CDI | - | Chess Depositary Interest. |
| CVA | - | Certificate Van Aandelen (Bearer). |
| GDR | - | Global Depositary Receipt. |
Reg S - is a safe harbor that defines when an offering of securities will be deemed to come to rest abroad and therefore is not subject to the registration obligations imposed under Section 5 of the 1933 Act. The regulation includes two safe harbor provisions: an issuer safe harbor and a resale safe harbor. In each case, the regulation demands that offers and sales of the securities be made outside the United States and that no offering participant (which includes the issuer, the banks assisting with the offer and their respective affiliates) engage in “directed” selling efforts. In the case of issuers for whose securities there is substantial U.S. market interest, the regulation also requires that no offers and sales be made to U.S. persons (including U.S. persons physically located outside the United States).
The accompanying notes are an integral part of the financial statements.
| STATEMENT OF ASSETS AND LIABILITIES | |
| December 31, 2013 | Baillie Gifford International Equity Fund |
| ASSETS | | | | |
| Investments, at value (cost $1,905,702,553) | | $ | 2,496,165,154 | |
| Cash | | | 49,299,032 | |
| Foreign cash, at value (cost $16) | | | 16 | |
| Dividends receivable | | | 1,324,521 | |
| Tax reclaims receivable | | | 1,580,211 | |
| Total Assets | | | 2,548,368,934 | |
| | | | | |
| LIABILITIES | | | | |
| Management fee payable | | | 1,546,716 | |
| Servicing fee payable | | | 1,325,673 | |
| Distribution payable | | | 248,607 | |
| Trustee fee payable | | | 17,488 | |
| Accrued expenses | | | 622,805 | |
| Total Liabilities | | | 3,761,289 | |
| | | | | |
| NET ASSETS | | $ | 2,544,607,645 | |
| | | | | |
| COMPOSITION OF NET ASSETS | | | | |
| Paid-in capital | | $ | 1,987,702,192 | |
| Distributions in excess of net investment income | | | (2,620,701 | ) |
| Accumulated net realized loss on investments and foreign currency transactions | | | (30,991,759 | ) |
| Net unrealized appreciation in value of investments and foreign currencies | | | 590,517,913 | |
| | | $ | 2,544,607,645 | |
| | | | | |
| NET ASSET VALUE, PER SHARE | | | |
| | | | |
Class 1 ($27,187,071 / 2,300,569 shares outstanding),
unlimited authorized, no par value | | $ | 11.82 | |
| Maximum Purchase Price Per Share (Note D) | | $ | 11.84 | |
| Minimum Redemption Price Per Share (Note D) | | $ | 11.80 | |
| | | | | |
Class 2 ($637,144,206 / 54,049,766 shares outstanding),
unlimited authorized, no par value | | $ | 11.79 | |
| Maximum Purchase Price Per Share (Note D) | | $ | 11.81 | |
| Minimum Redemption Price Per Share (Note D) | | $ | 11.77 | |
| | | | | |
Class 3 ($1,268,490,034 / 106,294,654 shares outstanding),
unlimited authorized, no par value | | $ | 11.93 | |
| Maximum Purchase Price Per Share (Note D) | | $ | 11.95 | |
| Minimum Redemption Price Per Share (Note D) | | $ | 11.91 | |
| | | | | |
Class 4 ($611,786,334 / 50,149,826 shares outstanding),
unlimited authorized, no par value | | $ | 12.20 | |
| Maximum Purchase Price Per Share (Note D) | | $ | 12.22 | |
| Minimum Redemption Price Per Share (Note D) | | $ | 12.18 | |
The accompanying notes are an integral part of the financial statements.
| STATEMENT OF OPERATIONS | |
| For the Year Ended December 31, 2013 | Baillie Gifford International Equity Fund |
| INVESTMENT INCOME | | | | |
| Dividends (net of foreign withholding taxes of $5,748,801) | | $ | 51,924,539 | |
| Interest | | | 11,267 | |
| Total Investment Income | | | 51,935,806 | |
| | | | | |
| EXPENSES | | | | |
| Management fee (Note B) | | | 5,642,205 | |
| Shareholder Servicing fees - Class 1 Shares (Note B) | | | 255,253 | |
| Shareholder Servicing fees - Class 2 Shares (Note B) | | | 1,745,139 | |
| Shareholder Servicing fees - Class 3 Shares (Note B) | | | 2,050,734 | |
| Shareholder Servicing fees - Class 4 Shares (Note B) | | | 898,426 | |
| Fund Accounting | | | 1,115,048 | |
| Custody | | | 421,355 | |
| Legal | | | 237,493 | |
| Trustees’ fees | | | 59,636 | |
| Professional fees | | | 59,606 | |
| Transfer Agency | | | 40,131 | |
| Insurance | | | 34,713 | |
| Miscellaneous | | | 25,967 | |
| Total Expenses | | | 12,585,706 | |
| | | | | |
| Net Investment Income | | | 39,350,100 | |
| | | | | |
| | | | | |
| | | | |
| REALIZED AND UNREALIZED GAIN (LOSS) ON INVESTMENTS, IN-KIND AND FOREIGN CURRENCY TRANSACTIONS | | | | |
| Net realized gain (loss) from: | | | | |
| Investments | | | (9,742,523 | ) |
| In-kind transactions | | | 490,670 | |
| Foreign currency transactions | | | 208,500 | |
| | | | (9,043,353 | ) |
| | | | | |
| Net change in unrealized appreciation (depreciation) on: | | | | |
| Investments | | | 298,983,807 | |
| Translation of assets and liabilities in foreign currencies | | | (280,975 | ) |
| | | | 298,702,832 | |
| | | | | |
| Net realized and unrealized gain on investments and foreign currency transactions | | | 289,659,479 | |
| NET INCREASE IN NET ASSETS FROM OPERATIONS | | $ | 329,009,579 | |
The accompanying notes are an integral part of the financial statements.
| STATEMENTS OF CHANGES IN NET ASSETS | Baillie Gifford International Equity Fund |
| | | For the
Year Ended
December 31,
2013 | | | For the
Year Ended
December 31,
2012 | |
| | | | | | | | | |
| INCREASE IN NET ASSETS FROM OPERATIONS | | | | | | | | |
| Net investment income | | $ | 39,350,100 | | | $ | 36,978,146 | |
| | | | | | | | | |
| Net realized loss from investments, in-kind and foreign currency transactions | | | (9,043,353 | ) | | | (27,992,641 | ) |
| Net change in unrealized appreciation (depreciation) on investments and translation of assets and liabilities in foreign currencies | | | 298,702,832 | | | | 319,771,176 | |
| Net increase in net assets from operations | | | 329,009,579 | | | | 328,756,681 | |
| | | | | | | | | |
| DIVIDENDS TO SHAREHOLDERS FROM: | | | | | | | | |
| Net investment income: | | | | | | | | |
| Class 1 | | | (453,185 | ) | | | (854,941 | ) |
| Class 2 | | | (10,361,979 | ) | | | (10,667,156 | ) |
| Class 3 | | | (20,845,482 | ) | | | (13,666,431 | ) |
| Class 4 | | | (10,043,073 | ) | | | (8,324,082 | ) |
| Total Dividends | | | (41,703,719 | ) | | | (33,512,610 | ) |
| | | | | | | | | |
| TRANSACTIONS IN SHARES OF BENEFICIAL INTEREST | | | | | | | | |
| Net proceeds from shares subscribed: | | | | | | | | |
| Class 1 | | | 681,659 | | | | 57,372,832 | |
| Class 2 | | | 91,672,424 | | | | 310,822,024 | |
| Class 3 | | | 276,657,991 | | | | 691,940,811 | |
| Class 4 | | | 49,900,000 | | | | 458,126,968 | |
| Purchase premiums: | | | | | | | | |
| Class 1 | | | 9,434 | | | | 79,717 | |
| Class 2 | | | 102,972 | | | | 652,621 | |
| Class 3 | | | 160,708 | | | | 386,643 | |
| Class 4 | | | 81,798 | | | | 197,554 | |
| Redemption fees: | | | | | | | | |
| Class 1 | | | 2,939 | | | | 6,852 | |
| Class 2 | | | 32,530 | | | | 59,689 | |
| Class 3 | | | 49,264 | | | | 41,412 | |
| Class 4 | | | 25,715 | | | | 21,095 | |
| Dividends reinvested: | | | | | | | | |
| Class 1 | | | 177,440 | | | | 621,138 | |
| Class 2 | | | 10,361,979 | | | | 10,667,156 | |
| Class 3 | | | 20,845,482 | | | | 13,666,431 | |
| Class 4 | | | 10,043,073 | | | | 8,324,082 | |
| Cost of shares redeemed: | | | | | | | | |
| Class 1 | | | (41,887,651 | ) | | | (72,816,528 | ) |
| Class 2 | | | (226,837,755 | ) | | | (615,053,580 | ) |
| Class 3 | | | (26,039,059 | ) | | | (302,097,134 | ) |
| Class 4 | | | (35,218,367 | ) | | | (11,067,960 | ) |
| | | | | | | | | |
| Increase in Net Assets from Transactions in Shares of Beneficial Interest | | | 130,822,576 | | | | 551,951,823 | |
| | | | | | | | | |
| Total Increase in Net Assets | | | 418,128,436 | | | | 847,195,894 | |
| | | | | | | | | |
| NET ASSETS | | | | | | | | |
| Beginning of year | | | 2,126,479,209 | | | | 1,279,283,315 | |
| End of year (including distributions in excess of net investment income of $2,620,701 and $1,926,053, respectively) | | $ | 2,544,607,645 | | | $ | 2,126,479,209 | |
The accompanying notes are an integral part of the financial statements.
| FINANCIAL HIGHLIGHTS | Baillie Gifford International Equity Fund |
| Selected data for a Class 1 Share outstanding throughout each year: | | | | |
| | | | | |
| | | For the
Year Ended
December 31,
2013 | | For the
Year Ended
December 31,
2012 | | For the
Year Ended
December 31,
2011 | | For the
Year Ended
December 31,
2010 | | For the
Year Ended
December 31,
2009 |
| Net asset value, beginning of year | | $10.42 | | $8.65 | | $9.97 | | $8.86 | | $6.07 |
| | | | | | | | | | | |
| From Investment Operations | | | | | | | | | | |
| Net investment income(a) | | 0.18 | | 0.21 | | 0.17 | | 0.12 | | 0.16 |
| Net realized and unrealized gain (loss) on investments and foreign currency transactions | | 1.39 | | 1.70 | | (1.38) | | 1.15 | | 2.70 |
| Net increase (decrease) in net asset value from investment operations | | 1.57 | | 1.91 | | (1.21) | | 1.27 | | 2.86 |
| | | | | | | | | | | |
| Dividends and Distributions to Shareholders | | | | | | | | | | |
| Dividends from net investment income | | (0.17) | | (0.15) | | (0.11) | | (0.17) | | (0.08) |
| Distributions from net realized gain on investments | | - | | - | | (0.01) | | - | | - |
| Total Dividends and Distributions | | (0.17) | | (0.15) | | (0.12) | | (0.17) | | (0.08) |
| | | | | | | | | | | |
| Proceeds from Purchase Premiums and Redemption Fees(a) | | 0.00(e) | | 0.01 | | 0.01 | | 0.01 | | 0.01 |
| | | | | | | | | | | |
| Net asset value, end of year | | $11.82 | | $10.42 | | $8.65 | | $9.97 | | $8.86 |
| | | | | | | | | | | |
| Total Return | | | | | | | | | | |
| Total investment return based on net asset value(b) | | 15.10% | | 22.17% | | (12.07)% | | 14.44% | | 47.24% |
| | | | | | | | | | | |
| Ratios/Supplemental Data | | | | | | | | | | |
| Net assets, end of year (000’s omitted) | | $27,187 | | $61,940 | | $63,868 | | $72,366 | | $64,512 |
| Ratio of net expenses to average net assets | | 0.79% | | 0.80%(d) | | 0.84% | | 0.86% | | 0.93%(c) |
| Ratio of net expenses to average net assets, before waiver | | 0.79% | | 0.83%(d) | | 0.84% | | 0.86% | | 0.94%(c) |
| Ratio of net investment income to average net assets | | 1.65% | | 2.19% | | 1.72% | | 1.36% | | 2.17% |
| Portfolio turnover rate | | 16% | | 13% | | 11% | | 24% | | 17% |
| (a) | Calculated based upon average shares outstanding during the year. |
| (b) | Total investment return is calculated assuming an initial investment made at the net asset value at the beginning of the period, reinvestment of all dividends and distributions, if any, at net asset value during the period, and redemption on the last day of the period. Total return is not annualized for periods less than one year. |
| (c) | Baillie Gifford Overseas Limited had contractually agreed to waive its fees and/or bear other expenses through March 31, 2009 to the extent that such Fund’s total annual operating expenses (excluding interest, taxes and extraordinary expenses) exceeded 0.90% for Class 1 Shares. |
| (d) | Baillie Gifford Overseas Limited had voluntarily agreed to waive its fees and/or bear other expenses through June 30, 2012, during which time Baillie Gifford Overseas Limited received annual management fee equal to 0.25% of the Fund’s average net assets. |
| (e) | Amount is less than $0.005 per share. |
The accompanying notes are an integral part of the financial statements.
| FINANCIAL HIGHLIGHTS (continued) | Baillie Gifford International Equity Fund |
| Selected data for a Class 2 Share outstanding throughout each year: | | |
| | | |
| | | For the
Year Ended
December 31,
2013 | | For the
Year Ended
December 31,
2012 | | For the
Year Ended
December 31,
2011 | | For the
Year Ended
December 31,
2010 | | For the
Year Ended
December 31,
2009 |
| Net asset value, beginning of year | | $10.39 | | $8.63 | | $9.95 | | $8.84 | | $6.07 |
| | | | | | | | | | | |
| From Investment Operations | | | | | | | | | | |
| Net investment income(a) | | 0.19 | | 0.22 | | 0.16 | | 0.13 | | 0.09 |
Net realized and unrealized gain (loss) on investments and
foreign currency transactions | | 1.40 | | 1.69 | | (1.36) | | 1.15 | | 2.80 |
Net increase (decrease) in net asset value from investment
operations | | 1.59 | | 1.91 | | (1.20) | | 1.28 | | 2.89 |
| | | | | | | | | | | |
| Dividends and Distributions to Shareholders | | | | | | | | | | |
| Dividends from net investment income | | (0.19) | | (0.16) | | (0.12) | | (0.18) | | (0.13) |
| Distributions from net realized gain on investments | | - | | - | | (0.01) | | - | | - |
| Total Dividends and Distributions | | (0.19) | | (0.16) | | (0.13) | | (0.18) | | (0.13) |
| | | | | | | | | | |
| Proceeds from Purchase Premiums and Redemption Fees(a) | | 0.00(e) | | 0.01 | | 0.01 | | 0.01 | | 0.01 |
| | | | | | | | | | | |
| Net asset value, end of year | | $11.79 | | $10.39 | | $8.63 | | $9.95 | | $8.84 |
| | | | | | | | | | | |
| Total Return | | | | | | | | | | |
| Total investment return based on net asset value(b) | | 15.35% | | 22.33% | | (11.94)% | | 14.65% | | 47.76% |
| | | | | | | | | | | |
| Ratios/Supplemental Data | | | | | | | | | | |
| Net assets, end of year (000’s omitted) | | $637,144 | | $682,452 | | $831,065 | | $447,232 | | $214,722 |
| Ratio of net expenses to average net assets | | 0.61% | | 0.62%(d) | | 0.67% | | 0.68% | | 0.70%(c) |
| | | | | | | | | | | |
| Ratio of net expenses to average net assets, before waiver | | 0.61% | | 0.64%(d) | | 0.67% | | 0.68% | | 0.70%(c) |
| Ratio of net investment income to average net assets | | 1.72% | | 2.27% | | 1.74% | | 1.43% | | 1.12% |
| Portfolio turnover rate | | 16% | | 13% | | 11% | | 24% | | 17% |
| (a) | Calculated based upon average shares outstanding during the year. |
| (b) | Total investment return is calculated assuming an initial investment made at the net asset value at the beginning of the period, reinvestment of all dividends and distributions, if any, at net asset value during the period, and redemption on the last day of the period. Total return is not annualized for periods less than one year. |
| (c) | Baillie Gifford Overseas Limited had contractually agreed to waive its fees and/or bear other expenses through March 31, 2009 to the extent that such Fund’s total annual operating expenses (excluding interest, taxes and extraordinary expenses) exceeded 0.72% for Class 1 Shares. |
| (d) | Baillie Gifford Overseas Limited had voluntarily agreed to waive its fees and/or bear other expenses through June 30, 2012, during which time Baillie Gifford Overseas Limited received annual management fee equal to 0.25% of the Fund’s average net assets. |
| (e) | Amount is less than $0.005 per share. |
The accompanying notes are an integral part of the financial statements.
| FINANCIAL HIGHLIGHTS (continued) | Baillie Gifford International Equity Fund |
| Selected data for a Class 3 Share outstanding throughout each period: | | | | | | |
| | | | | | | |
| | | For the
Year Ended
December 31,
2013 | | For the
Year Ended
December 31,
2012 | | For the
Year Ended
December 31,
2011 | | For the Period
September 1,
2010(a)
through
December 31,
2010 |
| Net asset value, beginning of period | | $10.52 | | $8.73 | | $10.06 | | $8.53 |
| | | | | | | | | |
| From Investment Operations | | | | | | | | |
| Net investment income(b) | | 0.19 | | 0.17 | | 0.17 | | 0.02 |
Net realized and unrealized gain (loss) on investments and
foreign currency transactions | | 1.42 | | 1.78 | | (1.37) | | 1.69 |
Net increase (decrease) in net asset value from investment
operations | | 1.61 | | 1.95 | | (1.20) | | 1.71 |
| | | | | | | | | |
| Dividends and Distributions to Shareholders | | | | | | | | |
| Dividends from net investment income | | (0.20) | | (0.17) | | (0.13) | | (0.19) |
| Distributions from net realized gain on investments | | - | | - | | (0.01) | | - |
| Total Dividends and Distributions | | (0.20) | | (0.17) | | (0.14) | | (0.19) |
| | | | | | | | | |
| Proceeds from Purchase Premiums and Redemption Fees(b) | | 0.00(e) | | 0.01 | | 0.01 | | 0.01 |
| | | | | | | | | |
| Net asset value, end of period | | $11.93 | | $10.52 | | $8.73 | | $10.06 |
| | | | | | | | | |
| Total Return | | | | | | | | |
| Total investment return based on net asset value(c) | | 15.34% | | 22.50% | | (11.85)% | | 20.19% |
| | | | | | | | | |
| Ratios/Supplemental Data | | | | | | | | |
| Net assets, end of period (000’s omitted) | | $1,268,490 | | $862,591 | | $367,327 | | $154,209 |
| Ratio of net expenses to average net assets | | 0.54% | | 0.56%(d) | | 0.60% | | 0.61%* |
| Ratio of net expenses to average net assets, before waiver | | 0.54% | | 0.58%(d) | | 0.60% | | 0.61%* |
| Ratio of net investment income to average net assets | | 1.75% | | 1.71% | | 1.75% | | 0.76%* |
| Portfolio turnover rate | | 16% | | 13% | | 11% | | 24% |
| * | Annualized. |
| (a) | Commencement of investment operations. |
| (b) | Calculated based upon average shares outstanding during the period. |
| (c) | Total investment return is calculated assuming an initial investment made at the net asset value at the beginning of the period, reinvestment of all dividends and distributions, if any, at net asset value during the period, and redemption on the last day of the period. Total return is not annualized for periods less than one year. |
| (d) | Baillie Gifford Overseas Limited had voluntarily agreed to waive its fees and/or bear other expenses through June 30, 2012, during which time Baillie Gifford Overseas Limited received annual management fee equal to 0.25% of the Fund’s average net assets. |
| (e) | Amount is less than $0.005 per share. |
The accompanying notes are an integral part of the financial statements.
| FINANCIAL HIGHLIGHTS (concluded) | Baillie Gifford International Equity Fund |
| Selected data for a Class 4 Share outstanding throughout each period: | | | | | | |
| | | | | | | |
| | | For the
Year Ended
December 31,
2013 | | For the
Year Ended
December 31,
2012 | | For the
Year Ended
December 31,
2011 | | For the Period
July 30, 2010(a)
through
December 31,
2010 |
| Net asset value, beginning of period | | $10.75 | | $8.92 | | $10.28 | | $9.00 |
| | | | | | | | | |
| From Investment Operations | | | | | | | | |
| Net investment income(b) | | 0.20 | | 0.22 | | 0.20 | | 0.04 |
Net realized and unrealized gain (loss) on investments and
foreign currency transactions | | 1.45 | | 1.77 | | (1.43) | | 1.42 |
Net increase (decrease) in net asset value from investment
operations | | 1.65 | | 1.99 | | (1.23) | | 1.46 |
| | | | | | | | | |
| Dividends and Distributions to Shareholders | | | | | | | | |
| Dividends from net investment income | | (0.20) | | (0.17) | | (0.13) | | (0.19) |
| Distributions from net realized gain on investments | | - | | - | | (0.01) | | - |
| Total Dividends and Distributions | | (0.20) | | (0.17) | | (0.14) | | (0.19) |
| | | | | | | | | |
| Proceeds from Purchase Premiums and Redemption Fees(b) | | 0.00(e) | | 0.01 | | 0.01 | | 0.01 |
| | | | | | | | | |
| Net asset value, end of period | | $12.20 | | $10.75 | | $8.92 | | $10.28 |
| | | | | | | | | |
| Total Return | | | | | | | | |
| Total investment return based on net asset value(c) | | 15.42% | | 22.51% | | (11.86)% | | 16.38% |
| | | | | | | | | |
| Ratios/Supplemental Data | | | | | | | | |
| Net assets, end of period (000’s omitted) | | $611,786 | | $519,496 | | $17,024 | | $20,955 |
| Ratio of net expenses to average net assets | | 0.51% | | 0.53%(d) | | 0.56% | | 0.58%* |
| | | | | | | | | |
| Ratio of net expenses to average net assets, before waiver | | 0.51% | | 0.54%(d) | | 0.56% | | 0.58%* |
| Ratio of net investment income to average net assets | | 1.77% | | 2.20% | | 2.03% | | 0.97%* |
| Portfolio turnover rate | | 16% | | 13% | | 11% | | 24% |
| * | Annualized. |
| (a) | Commencement of investment operations. |
| (b) | Calculated based upon average shares outstanding during the period. |
| (c) | Total investment return is calculated assuming an initial investment made at the net asset value at the beginning of the period, reinvestment of all dividends and distributions, if any, at net asset value during the period, and redemption on the last day of the period. Total return is not annualized for periods less than one year. |
| (d) | Baillie Gifford Overseas Limited had voluntarily agreed to waive its fees and/or bear other expenses through June 30, 2012, during which time Baillie Gifford Overseas Limited received annual management fee equal to 0.25% of the Fund’s average net assets. |
| (e) | Amount is less than $0.005 per share. |
The accompanying notes are an integral part of the financial statements.
| INDUSTRY DIVERSIFICATION TABLE | |
| December 31, 2013 (unaudited) | Baillie Gifford International Choice Fund |
| | | Value | | | % of Total
Net Assets | |
| | | | | | | | | |
| Apparel | | | 2,621,013 | | | | 0.9 | % |
| Apparel retailers | | | 4,257,242 | | | | 1.5 | |
| Auto Manufacturers | | | 6,390,039 | | | | 2.3 | |
| Banks | | | 23,172,966 | | | | 8.3 | |
| Beverages, Food & Tobacco | | | 25,819,411 | | | | 9.2 | |
| Biotechnology | | | 3,350,561 | | | | 1.2 | |
| Chemicals | | | 4,967,324 | | | | 1.8 | |
| Commercial Services | | | 6,124,083 | | | | 2.2 | |
| Commercial Vehicles & Trucks | | | 3,849,043 | | | | 1.4 | |
| Computer Services | | | 224,760 | | | | 0.1 | |
| Construction & Building Materials | | | 3,383,609 | | | | 1.2 | |
| Cosmetics/Personal Care | | | 2,782,994 | | | | 1.0 | |
| Distribution/Wholesale | | | 1,844,846 | | | | 0.7 | |
| Diversified Financial Services | | | 7,345,194 | | | | 2.6 | |
| Diversified Industrials | | | 2,158,115 | | | | 0.8 | |
| Electronic & Electrical Equipment | | | 11,538,090 | | | | 4.1 | |
| Engineering & Machinery | | | 21,017,971 | | | | 7.5 | |
| Entertainment | | | 5,963,036 | | | | 2.1 | |
| Food Producers & Processors | | | 9,619,789 | | | | 3.4 | |
| Healthcare - Products | | | 8,328,447 | | | | 3.0 | |
| Holding Companies - Diversified | | | 5,777,814 | | | | 2.1 | |
| Insurance | | | 8,635,092 | | | | 3.1 | |
| Internet | | | 29,195,161 | | | | 10.4 | |
| Investment Companies | | | 13,976,896 | | | | 5.0 | |
| Media & Photography | | | 4,775,459 | | | | 1.7 | |
| Mining & Metals | | | 4,218,910 | | | | 1.5 | |
| Oil & Gas | | | 13,613,914 | | | | 4.9 | |
| Pharmaceuticals | | | 12,248,377 | | | | 4.4 | |
| Retailers - General | | | 12,925,318 | | | | 4.6 | |
| Semiconductors | | | 11,498,085 | | | | 4.1 | |
| Travel & Leisure | | | 4,386,894 | | | | 1.6 | |
| | | | | | | | | |
| Total Value of Investments | | | 276,010,453 | | | | 98.7 | |
| Other assets less liabilities | | | 3,507,361 | | | | 1.3 | |
| Net Assets | | $ | 279,517,814 | | | | 100.0 | % |
| PORTFOLIO OF INVESTMENTS | |
| December 31, 2013 | Baillie Gifford International Choice Fund |
| | | Shares | | | Value | |
| | | | | | | | | |
| COMMON STOCKS - 97.9% | | | | | | | | |
| AUSTRALIA - 7.2% | | | | | | | | |
| Aristocrat Leisure Ltd. | | | 950,520 | | | $ | 3,993,664 | |
| Brambles Ltd. | | | 310,002 | | | | 2,539,822 | |
| Cochlear Ltd. | | | 88,871 | | | | 4,682,356 | |
| Mesoblast Ltd. (a) | | | 267,300 | | | | 1,398,754 | |
| Recall Holdings Ltd. (a) | | | 62,000 | | | | 224,760 | |
| Seek Ltd. | | | 259,147 | | | | 3,115,568 | |
| Treasury Wine Estates Ltd. | | | 451,871 | | | | 1,948,916 | |
| Woolworths Ltd. | | | 71,269 | | | | 2,158,115 | |
| | | | | | | | 20,061,955 | |
| BELGIUM - 0.6% | | | | | | | | |
| Colruyt SA | | | 28,573 | | | | 1,596,476 | |
| | | | | | | | | |
| CHINA - 6.6% | | | | | | | | |
| Baidu, Inc. ADR (a) | | | 28,500 | | | | 5,069,580 | |
| BOC Hong Kong Holdings Ltd. | | | 509,540 | | | | 1,636,469 | |
| Cafe de Coral Holdings Ltd. | | | 680,298 | | | | 2,195,555 | |
| Jardine Strategic Holdings Ltd. | | | 73,000 | | | | 2,339,178 | |
| Li & Fung Ltd. | | | 1,427,218 | | | | 1,844,846 | |
| Mindray Medical International Ltd. ADR | | | 54,432 | | | | 1,979,147 | |
| Tsingtao Brewery Co. Ltd., Class H | | | 396,057 | | | | 3,356,330 | |
| | | | | | | | 18,421,105 | |
| DENMARK - 4.1% | | | | | | | | |
| Carlsberg A/S, B Shares | | | 57,302 | | | | 6,340,682 | |
| Novo Nordisk A/S, B Shares | | | 21,917 | | | | 4,017,426 | |
| Novozymes A/S, B Shares | | | 22,771 | | | | 961,853 | |
| | | | | | | | 11,319,961 | |
| FINLAND - 1.5% | | | | | | | | |
| Kone Oyj, B Shares | | | 95,201 | | | | 4,293,449 | |
| | | | | | | | | |
| FRANCE - 2.2% | | | | | | | | |
| BioMerieux | | | 15,887 | | | | 1,666,944 | |
| Legrand SA | | | 37,744 | | | | 2,080,174 | |
| Total SA | | | 37,134 | | | | 2,279,273 | |
| | | | | | | | 6,026,391 | |
| GERMANY - 0.9% | | | | | | | | |
| Adidas AG | | | 20,554 | | | | 2,621,013 | |
| | | | | | | | | |
| INDIA - 1.0% | | | | | | | | |
| Mahindra & Mahindra Ltd. GDR | | | 204,515 | | | | 2,869,760 | |
| | | | | | | | | |
| INDONESIA - 0.9% | | | | | | | | |
| PT Bank Negara Indonesia Persero Tbk | | | 7,576,500 | | | | 2,467,852 | |
The accompanying notes are an integral part of the financial statements.
| PORTFOLIO OF INVESTMENTS (continued) | |
| December 31, 2013 | Baillie Gifford International Choice Fund |
| | | Shares | | | Value | |
| | | | | | | | | |
| ITALY - 2.6% | | | | | | | | |
| CNH Industrial NV (a) | | | 337,703 | | | $ | 3,849,043 | |
| EXOR SpA | | | 86,515 | | | | 3,438,636 | |
| | | | | | | | 7,287,679 | |
| JAPAN - 11.9% | | | | | | | | |
| Asahi Group Holdings Ltd. | | | 119,200 | | | | 3,363,787 | |
| Kao Corp. | | | 88,400 | | | | 2,782,994 | |
| MS&AD Insurance Group Holdings, Inc. | | | 212,000 | | | | 5,698,342 | |
| Olympus Corp. (a) | | | 107,200 | | | | 3,400,035 | |
| Rakuten, Inc. | | | 345,900 | | | | 5,162,015 | |
| Sankyo Co., Ltd. | | | 42,700 | | | | 1,969,372 | |
| Shimano, Inc. | | | 51,100 | | | | 4,386,894 | |
| SMC Corp. | | | 9,600 | | | | 2,422,930 | |
| THK Co., Ltd. | | | 168,700 | | | | 4,213,377 | |
| | | | | | | | 33,399,746 | |
| MEXICO - 0.7% | | | | | | | | |
| Wal-Mart de Mexico SAB de CV, Series V | | | 789,800 | | | | 2,072,420 | |
| | | | | | | | | |
| NEW ZEALAND - 1.1% | | | | | | | | |
| Trade Me Ltd. | | | 908,372 | | | | 3,033,721 | |
| | | | | | | | | |
| PHILIPPINES - 0.8% | | | | | | | | |
| Puregold Price Club, Inc. | | | 2,569,500 | | | | 2,199,178 | |
| | | | | | | | | |
| SINGAPORE - 1.6% | | | | | | | | |
| United Overseas Bank Ltd. | | | 263,000 | | | | 4,441,295 | |
| | | | | | | | | |
| SOUTH AFRICA - 2.4% | | | | | | | | |
| Clicks Group Ltd. | | | 337,702 | | | | 2,021,383 | |
| Naspers Ltd., N Shares | | | 45,622 | | | | 4,775,459 | |
| | | | | | | | 6,796,842 | |
| SOUTH KOREA - 2.9% | | | | | | | | |
| Samsung Electronics Co., Ltd. GDR Reg S | | | 7,913 | | | | 5,177,806 | |
| Samsung Fire & Marine Insurance Co., Ltd. | | | 11,951 | | | | 2,936,750 | |
| | | | | | | | 8,114,556 | |
| SPAIN - 4.1% | | | | | | | | |
| Corporacion Financiera Alba SA | | | 33,550 | | | | 1,961,584 | |
| Distribuidora Internacional de Alimentacion SA | | | 578,587 | | | | 5,180,641 | |
| Inditex SA | | | 25,784 | | | | 4,257,242 | |
| | | | | | | | 11,399,467 | |
| SWEDEN - 9.7% | | | | | | | | |
| Atlas Copco AB, B Shares | | | 202,365 | | | | 5,144,386 | |
| Investment AB Kinnevik, B Shares | | | 187,535 | | | | 8,694,334 | |
| Investor AB, B Shares | | | 96,362 | | | | 3,320,978 | |
| Scania AB, B Shares | | | 179,612 | | | | 3,520,279 | |
| Svenska Handelsbanken AB, A Shares | | | 133,124 | | | | 6,545,284 | |
| | | | | | | | 27,225,261 | |
The accompanying notes are an integral part of the financial statements.
| PORTFOLIO OF INVESTMENTS (continued) | |
| December 31, 2013 | Baillie Gifford International Choice Fund |
| | | Shares | | | Value | |
| | | | | | | | | |
| SWITZERLAND - 7.8% | | | | | | | | |
| Geberit AG | | | 11,153 | | | $ | 3,383,609 | |
| Nestle SA | | | 73,798 | | | | 5,408,660 | |
| Roche Holding AG - Genusschein | | | 29,383 | | | | 8,230,951 | |
| Schindler Holding AG, Participating Certificates | | | 19,129 | | | | 2,816,053 | |
| UBS AG (a) | | | 100,505 | | | | 1,924,405 | |
| | | | | | | | 21,763,678 | |
| TAIWAN - 2.7% | | | | | | | | |
| Hon Hai Precision Industry Co., Ltd. GDR Reg S | | | 568,385 | | | | 3,023,808 | |
| Taiwan Semiconductor Manufacturing Co., Ltd. ADR | | | 264,341 | | | | 4,610,107 | |
| | | | | | | | 7,633,915 | |
| TURKEY - 1.1% | | | | | | | | |
| Turkiye Garanti Bankasi A/S ADR | | | 990,330 | | | | 3,178,959 | |
| | | | | | | | | |
| UNITED KINGDOM - 20.8% | | | | | | | | |
| AMEC Plc. | | | 71,876 | | | | 1,297,713 | |
| ASOS Plc. (a) | | | 67,462 | | | | 6,873,612 | |
| BG Group Plc. | | | 351,444 | | | | 7,562,537 | |
| BHP Billiton Plc. | | | 96,721 | | | | 3,001,260 | |
| Hargreaves Lansdown Plc. | | | 241,333 | | | | 5,420,789 | |
| Imagination Technologies Group Plc. (a) | | | 578,800 | | | | 1,710,172 | |
| Imperial Tobacco Group Plc. | | | 52,452 | | | | 2,033,475 | |
| Intertek Group Plc. | | | 68,675 | | | | 3,584,261 | |
| John Wood Group Plc. | | | 217,050 | | | | 2,474,391 | |
| Johnson Matthey Plc. | | | 91,289 | | | | 4,967,324 | |
| Kazakhmys Plc. | | | 335,612 | | | | 1,217,650 | |
| Mitchells & Butlers Plc. (a) | | �� | 405,931 | | | | 2,840,306 | |
| Rightmove Plc. | | | 130,809 | | | | 5,940,665 | |
| Standard Chartered Plc. | | | 123,954 | | | | 2,799,757 | |
| Unilever Plc. | | | 102,346 | | | | 4,211,129 | |
| Weir Group Plc. (The) | | | 60,096 | | | | 2,127,776 | |
| | | | | | | | 58,062,817 | |
| UNITED STATES - 2.7% | | | | | | | | |
| Coca-Cola Enterprises, Inc. | | | 81,477 | | | | 3,595,580 | |
| Mettler-Toledo International, Inc. (a) | | | 12,507 | | | | 3,034,073 | |
| Protalix BioTherapeutics, Inc. (a) | | | 254,487 | | | | 989,954 | |
| | | | | | | | 7,619,607 | |
Total Common Stocks
(cost $251,245,014) | | | | | | | 273,907,103 | |
| | | | | | | | | |
| PREFERRED STOCKS - 0.8% | | | | | | | | |
| BRAZIL - 0.8% | | | | | | | | |
Itau Unibanco Holding SA ADR
(cost $2,133,895) | | | 155,000 | | | | 2,103,350 | |
The accompanying notes are an integral part of the financial statements.
| PORTFOLIO OF INVESTMENTS (concluded) | |
| December 31, 2013 | Baillie Gifford International Choice Fund |
| | | Value | |
| | | | | |
TOTAL INVESTMENTS - 98.7%
(cost $253,378,909) | | $ | 276,010,453 | |
| Other assets less liabilities - 1.3% | | | 3,507,361 | |
| NET ASSETS - 100.0% | | $ | 279,517,814 | |
| (a) Non Income Producing |
| ADR | - | American Depositary Receipt. |
| GDR | - | Global Depositary Receipt. |
Reg S - is a safe harbor that defines when an offering of securities will be deemed to come to rest abroad and therefore is not subject to the registration obligations imposed under Section 5 of the 1933 Act. The regulation includes two safe harbor provisions: an issuer safe harbor and a resale safe harbor. In each case, the regulation demands that offers and sales of the securities be made outside the United States and that no offering participant (which includes the issuer, the banks assisting with the offer and their respective affiliates) engage in “directed” selling efforts. In the case of issuers for whose securities there is substantial U.S. market interest, the regulation also requires that no offers and sales be made to U.S. persons (including U.S. persons physically located outside the United States).
The accompanying notes are an integral part of the financial statements.
| STATEMENT OF ASSETS AND LIABILITIES | |
| December 31, 2013 | Baillie Gifford International Choice Fund |
| ASSETS | | | | |
| Investments, at value (cost $253,378,909) | | $ | 276,010,453 | |
| Cash | | | 7,073,777 | |
| Foreign cash, at value (cost $14,913) | | | 14,914 | |
| Dividends receivable | | | 140,539 | |
| Tax reclaims receivable | | | 23,623 | |
| | | | | |
| Total Assets | | | 283,263,306 | |
| | | | | |
| LIABILITIES | | | | |
| Payable for investments purchased | | | 3,362,846 | |
| Management fee payable | | | 154,367 | |
| Servicing fee payable | | | 147,812 | |
| Trustee payable | | | 1,910 | |
| Accrued expenses | | | 78,557 | |
| | | | | |
| Total Liabilities | | | 3,745,492 | |
| | | | | |
| NET ASSETS | | $ | 279,517,814 | |
| | | | | |
| COMPOSITION OF NET ASSETS | | | | |
| Paid-in capital | | $ | 257,746,926 | |
| Distributions in excess of net investment income | | | (661,626 | ) |
| Accumulated net realized loss on investments and foreign currency transactions | | | (205,396 | ) |
| Net unrealized appreciation in value of investments and foreign currencies | | | 22,637,910 | |
| | | $ | 279,517,814 | |
| | | | | |
| NET ASSET VALUE, PER SHARE | | | | |
| | | | | |
Class 2 ($169,777,731 / 13,910,919 shares outstanding),
unlimited authorized, no par value | | $ | 12.20 | |
| Maximum Purchase Price Per Share (Note D) | | $ | 12.22 | |
| Minimum Redemption Price Per Share (Note D) | | $ | 12.18 | |
| | | | | |
Class 3 ($109,740,083 / 8,902,390 shares outstanding),
unlimited authorized, no par value | | $ | 12.33 | |
| Maximum Purchase Price Per Share (Note D) | | $ | 12.35 | |
| Minimum Redemption Price Per Share (Note D) | | $ | 12.31 | |
The accompanying notes are an integral part of the financial statements.
| STATEMENT OF OPERATIONS | |
| For the Year Ended December 31, 2013 | Baillie Gifford International Choice Fund |
| INVESTMENT INCOME | | | | |
| Dividends (net of foreign withholding taxes of $217,870) | | $ | 2,309,410 | |
| Interest | | | 12 | |
| Total Investment Income | | | 2,309,422 | |
| | | | | |
| EXPENSES | | | | |
| Management fee (Note B) | | | 339,526 | |
| Shareholder Servicing fees - Class 1 Shares (Note B) | | | 31,570 | |
| Shareholder Servicing fees - Class 2 Shares (Note B) | | | 160,648 | |
| Shareholder Servicing fees - Class 3 Shares (Note B) | | | 138,591 | |
| Fund Accounting | | | 98,289 | |
| Custody | | | 44,516 | |
| Legal | | | 17,550 | |
| Transfer Agency | | | 10,415 | |
| Professional fees | | | 6,593 | |
| Trustees’ fees | | | 5,727 | |
| Insurance | | | 1,717 | |
| Miscellaneous | | | 2,414 | |
| Total Expenses | | | 857,556 | |
| Fees waived (Note B) | | | (1,267 | ) |
| Net Expenses | | | 856,289 | |
| | | | | |
| Net Investment Income | | | 1,453,133 | |
| | | | | |
REALIZED AND UNREALIZED GAIN (LOSS) ON INVESTMENTS
AND FOREIGN CURRENCY TRANSACTIONS | | | | |
| Net realized gain (loss) from: | | | | |
| Investments | | | (181,555 | ) |
| Foreign currency transactions | | | 18,250 | |
| | | | (163,305 | ) |
| | | | | |
| Net change in unrealized appreciation (depreciation) on: | | | | |
| Investments | | | 21,867,362 | |
| Translation of assets and liabilities in foreign currencies | | | 7,636 | |
| | | | 21,874,998 | |
| | | | | |
| Net realized and unrealized gain on investments and foreign currency transactions | | | 21,711,693 | |
| NET INCREASE IN NET ASSETS FROM OPERATIONS | | $ | 23,164,826 | |
The accompanying notes are an integral part of the financial statements.
| STATEMENTS OF CHANGES IN NET ASSETS | Baillie Gifford International Choice Fund |
| | | For the
Year Ended
December 31, 2013 | | | For the Period
September 24, 2012*
through
December 31, 2012 | |
| INCREASE (DECREASE) IN NET ASSETS FROM OPERATIONS | | | | | | | | |
| Net investment income | | $ | 1,453,133 | | | $ | 13,229 | |
| Net realized gain (loss) from investments and foreign currency transactions | | | (163,305 | ) | | | 238 | |
| Net change in unrealized appreciation (depreciation) on investments and translation of assets and liabilities in foreign currencies | | | 21,874,998 | | | | 762,912 | |
| Net increase in net assets from operations | | | 23,164,826 | | | | 776,379 | |
| | | | | | | | | |
| DIVIDENDS TO SHAREHOLDERS FROM | | | | | | | | |
| Net investment income: | | | | | | | | |
| Class 1 | | | - | | | | (30,032 | ) |
| Class 2 | | | (1,243,112 | ) | | | - | |
| Class 3 | | | (897,173 | ) | | | - | |
| Total Dividends | | | (2,140,285 | ) | | | (30,032 | ) |
| | | | | | | | | |
| TRANSACTIONS IN SHARES OF BENEFICIAL INTEREST | | | | | | | | |
| Net proceeds from shares subscribed: | | | | | | | | |
| Class 1 | | | - | | | | 23,986,930 | |
| Class 2 | | | 156,103,614 | | | | - | |
| Class 3 | | | 101,519,199 | | | | - | |
| Purchase premiums: | | | | | | | | |
| Class 1 | | | - | | | | 48,070 | |
| Class 2 | | | 140,612 | | | | - | |
| Class 3 | | | 141,798 | | | | - | |
| Dividends reinvested: | | | | | | | | |
| Class 1 | | | - | | | | 30,032 | |
| Class 2 | | | 1,243,112 | | | | - | |
| Class 3 | | | 897,173 | | | | - | |
| Cost of shares redeemed: | | | | | | | | |
| Class 1 | | | (26,363,614 | ) | | | - | |
| | | | | | | | | |
| Increase in Net Assets from Transactions in Shares of Beneficial Interest | | | 233,681,894 | | | | 24,065,032 | |
| | | | | | | | | |
| Total Increase in Net Assets | | | 254,706,435 | | | | 24,811,379 | |
| | | | | | | | | |
| NET ASSETS | | | | | | | | |
| Beginning of period | | | 24,811,379 | | | | - | |
| | | | | | | | | |
| End of period (including undistributed (distributions in excess of) net investment income of ($661,626) and $6,965, respectively) | | $ | 279,517,814 | | | $ | 24,811,379 | |
* Commencement of investment operations.
The accompanying notes are an integral part of the financial statements.
| FINANCIAL HIGHLIGHTS | Baillie Gifford International Choice Fund |
| Selected data for a Class 2 Share outstanding throughout the period: | | |
| | | |
| | | For the Period |
| | | April 9, 2013(a) |
| | | through |
| | | December 31, 2013 |
| Net asset value, beginning of period | | $11.00 |
| | | |
| From Investment Operations | | |
| Net investment income(b) | | 0.08 |
| Net realized and unrealized gain on investments and foreign currency transactions | | 1.19 |
| Net increase in net asset value from investment operations | | 1.27 |
| | | |
| Dividends to Shareholders | | |
| Dividends from net investment income | | (0.09) |
| | | |
| Proceeds from Purchase Premiums(b) | | 0.02 |
| | | |
| Net asset value, end of period | | $12.20 |
| | | |
| Total Return | | |
| Total investment return based on net asset value(c) | | 11.76% |
| | | |
| Ratios/Supplemental Data | | |
| Net assets, end of period (000’s omitted) | | $169,778 |
| Ratio of net expenses to average net assets, before waiver | | 0.67%* |
| Ratio of net expenses to average net assets, after waiver | | 0.66%* |
| Ratio of net investment income to average net assets | | 0.98%* |
| Portfolio turnover rate | | 11% |
| * | Annualized. |
| (a) | Commencement of investment operations. |
| (b) | Calculated based upon average shares outstanding during the period. |
| (c) | Total investment return is calculated assuming an initial investment made at the net asset value at the beginning of the period, reinvestment of all dividends and distributions, if any, at net asset value during the period, and redemption on the last day of the period. Total return is not annualized for periods less than one year. |
The accompanying notes are an integral part of the financial statements.
| FINANCIAL HIGHLIGHTS | Baillie Gifford International Choice Fund |
| Selected data for a Class 3 Share outstanding throughout the period: | | |
| | | |
| | | For the Period |
| | | April 30, 2013(a) |
| | | through |
| | | December 31, 2013 |
| Net asset value, beginning of period | | $11.50 |
| | | |
| From Investment Operations | | |
| Net investment income(b) | | 0.09 |
| Net realized and unrealized gain on investments and foreign currency transactions | | 0.82 |
| Net increase in net asset value from investment operations | | 0.91 |
| | | |
| Dividends to Shareholders | | |
| Dividends from net investment income | | (0.10) |
| | | |
| Proceeds from Purchase Premiums(b) | | 0.02 |
| | | |
| Net asset value, end of period | | $12.33 |
| | | |
| Total Return | | |
| Total investment return based on net asset value(c) | | 8.11% |
| | | |
| Ratios/Supplemental Data | | |
| Net assets, end of period (000’s omitted) | | $109,740 |
| Ratio of net expenses to average net assets, before waiver | | 0.58%* |
| Ratio of net expenses to average net assets, after waiver | | 0.58%* |
| Ratio of net investment income to average net assets | | 1.10%* |
| Portfolio turnover rate | | 11% |
| * | Annualized. |
| (a) | Commencement of investment operations. |
| (b) | Calculated based upon average shares outstanding during the period. |
| (c) | Total investment return is calculated assuming an initial investment made at the net asset value at the beginning of the period, reinvestment of all dividends and distributions, if any, at net asset value during the period, and redemption on the last day of the period. Total return is not annualized for periods less than one year. |
The accompanying notes are an integral part of the financial statements.
| INDUSTRY DIVERSIFICATION TABLE | |
| December 31, 2013 (unaudited) | Baillie Gifford EAFE Fund |
| | | | | | % of Total | |
| | | Value | | | Net Assets | |
| |
| Aerospace | | $ | 72,626,175 | | | | 3.0 | % |
| Aerospace/Defense | | | 37,960,158 | | | | 1.5 | |
| Apparel retailers | | | 86,164,579 | | | | 3.5 | |
| Auto Manufacturers | | | 99,207,299 | | | | 4.0 | |
| Banks | | | 291,990,962 | | | | 11.9 | |
| Beverages, Food & Tobacco | | | 73,768,467 | | | | 3.0 | |
| Biotechnology | | | 52,484,558 | | | | 2.1 | |
| Broadcasting & Entertainment | | | 15,185,330 | | | | 0.6 | |
| Chemicals | | | 62,025,016 | | | | 2.5 | |
| Commercial Services | | | 46,443,139 | | | | 1.9 | |
| Computers | | | 12,617,471 | | | | 0.5 | |
| Construction & Building Materials | | | 68,188,722 | | | | 2.8 | |
| Cosmetics/Personal Care | | | 63,972,889 | | | | 2.6 | |
| Diversified Financial Services | | | 52,948,747 | | | | 2.3 | |
| Diversified Industrials | | | 30,439,813 | | | | 1.2 | |
| Electronic & Electrical Equipment | | | 34,341,308 | | | | 1.4 | |
| Energy - Alternate Sources | | | 5,466,073 | | | | 0.2 | |
| Engineering & Machinery | | | 173,979,329 | | | | 7.1 | |
| Food Producers & Processors | | | 10,235,533 | | | | 0.4 | |
| Food Retailers & Wholesalers | | | 12,287,340 | | | | 0.5 | |
| General Retailers | | | 11,669,367 | | | | 0.5 | |
| Healthcare - Products | | | 52,211,449 | | | | 2.1 | |
| Insurance | | | 165,470,927 | | | | 6.7 | |
| Internet | | | 389,111,803 | | | | 15.9 | |
| Investment Companies | | | 28,010,838 | | | | 1.1 | |
| Media & Photography | | | 26,648,586 | | | | 1.1 | |
| Mining & Metals | | | 40,866,898 | | | | 1.7 | |
| Personal Goods | | | 47,452,595 | | | | 1.9 | |
| Pharmaceuticals | | | 58,567,318 | | | | 2.4 | |
| Retailers - General | | | 58,568,486 | | | | 2.4 | |
| Semiconductors | | | 114,842,248 | | | | 4.7 | |
| Telecommunication Services | | | 115,243,078 | | | | 4.7 | |
| Toys/Games/Hobbies | | | 9,373,079 | | | | 0.4 | |
| |
| Total Value of Investments | | | 2,420,369,580 | | | | 98.6 | |
| Other assets less liabilities | | | 33,189,217 | | | | 1.4 | |
| Net Assets | | $ | 2,453,558,797 | | | | 100.0 | % |
| PORTFOLIO OF INVESTMENTS | |
| December 31, 2013 | Baillie Gifford EAFE Fund |
| | | Shares | | | Value | |
| |
| COMMON STOCKS - 96.9% | | | | | | | | |
| ARGENTINA - 0.7% | | | | | | | | |
| MercadoLibre, Inc. | | | 167,700 | | | $ | 18,076,383 | |
| |
| AUSTRALIA - 2.0% | | | | | | | | |
| Cochlear Ltd. | | | 143,913 | | | | 7,582,359 | |
| Fortescue Metals Group Ltd. | | | 7,823,199 | | | | 40,866,898 | |
| | | | | | | | 48,449,257 | |
| BRAZIL - 0.4% | | | | | | | | |
| BM&F Bovespa SA | | | 2,103,200 | | | | 9,865,168 | |
| |
| CHILE - 0.5% | | | | | | | | |
| Sociedad Quimica y Minera de Chile SA ADR | | | 443,100 | | | | 11,467,428 | |
| |
| CHINA - 13.9% | | | | | | | | |
| AIA Group Ltd. | | | 13,956,200 | | | | 70,248,363 | |
| Baidu, Inc. ADR (a) | | | 674,917 | | | | 120,054,236 | |
| Hong Kong Exchanges and Clearing Ltd. | | | 1,192,101 | | | | 19,926,368 | |
| New Oriental Education & Technology Group ADR | | | 582,900 | | | | 18,361,350 | |
| Tencent Holdings Ltd. | | | 1,503,000 | | | | 96,233,292 | |
| Youku Tudou, Inc. ADR (a) | | | 501,166 | | | | 15,185,330 | |
| | | | | | | | 340,008,939 | |
| DENMARK - 4.0% | | | | | | | | |
| Chr. Hansen Holding A/S | | | 295,143 | | | | 11,699,621 | |
| Novo Nordisk A/S, B Shares | | | 319,513 | | | | 58,567,318 | |
| Novozymes A/S, B Shares | | | 643,490 | | | | 27,181,172 | |
| | | | | | | | 97,448,111 | |
| FRANCE - 5.7% | | | | | | | | |
| Compagnie Generale d’Optique Essillor International SA | | | 295,066 | | | | 31,397,330 | |
| Kering | | | 215,605 | | | | 45,574,881 | |
| L’Oreal SA | | | 364,282 | | | | 63,972,889 | |
| | | | | | | | 140,945,100 | |
| GERMANY - 2.4% | | | | | | | | |
| Aixtron SE NA (a) | | | 789,310 | | | | 11,450,753 | |
| HeidelbergCement AG | | | 227,675 | | | | 17,288,621 | |
| SMA Solar Technology AG | | | 172,524 | | | | 5,466,073 | |
| Volkswagen AG | | | 94,516 | | | | 25,662,883 | |
| | | | | | | | 59,868,330 | |
| INDIA - 0.4% | | | | | | | | |
| Housing Development Finance Corp. | | | 797,100 | | | | 10,263,118 | |
| |
| IRELAND - 0.6% | | | | | | | | |
| James Hardie Industries Plc. SE CDI | | | 1,292,501 | | | | 15,000,412 | |
| |
| ITALY - 4.3% | | | | | | | | |
| Fiat SpA (a) | | | 5,765,457 | | | | 47,190,047 | |
| UniCredit SpA | | | 7,762,931 | | | | 57,264,640 | |
| | | | | | | | 104,454,687 | |
The accompanying notes are an integral part of the financial statements.
| PORTFOLIO OF INVESTMENTS (continued) | |
| December 31, 2013 | Baillie Gifford EAFE Fund |
| | | Shares | | | Value | |
| |
| JAPAN - 11.3% | | | | | | | | |
| Don Quijote Co., Ltd. | | | 192,500 | | | $ | 11,669,367 | |
| Gree, Inc. | | | 1,335,800 | | | | 13,179,149 | |
| Kyocera Corp. | | | 229,000 | | | | 11,448,070 | |
| Rakuten, Inc. | | | 4,833,700 | | | | 72,135,394 | |
| Sanrio Co., Ltd. | | | 222,600 | | | | 9,373,079 | |
| SMC Corp. | | | 179,100 | | | | 45,202,786 | |
| SoftBank Corp. | | | 1,313,300 | | | | 115,243,078 | |
| | | | | | | | 278,250,923 | |
| NETHERLANDS - 1.0% | | | | | | | | |
| ASML Holding NV | | | 126,937 | | | | 11,889,180 | |
| Gemalto NV | | | 114,646 | | | | 12,617,471 | |
| | | | | | | | 24,506,651 | |
| NORWAY - 1.1% | | | | | | | | |
| Schibsted ASA | | | 402,117 | | | | 26,648,586 | |
| |
| PERU - 0.8% | | | | | | | | |
| Credicorp Ltd. | | | 158,129 | | | | 20,988,462 | |
| |
| PORTUGAL - 0.8% | | | | | | | | |
| Jeronimo Martins SGPS SA | | | 992,137 | | | | 19,400,067 | |
| |
| RUSSIA - 1.0% | | | | | | | | |
| Magnit OJSC GDR Reg S | | | 185,000 | | | | 12,287,340 | |
| Mail.ru Group Ltd. GDR Reg S | | | 274,238 | | | | 12,231,015 | |
| | | | | | | | 24,518,355 | |
| SINGAPORE - 0.5% | | | | | | | | |
| Singapore Exchange Ltd. | | | 2,236,000 | | | | 12,894,093 | |
| |
| SOUTH KOREA - 3.2% | | | | | | | | |
| Celltrion, Inc. (a) | | | 374,361 | | | | 13,603,765 | |
| NAVER Corp. | | | 59,417 | | | | 40,945,899 | |
| Samsung Electronics Co., Ltd. | | | 17,569 | | | | 22,893,238 | |
| | | | | | | | 77,442,902 | |
| SPAIN - 8.1% | | | | | | | | |
| Banco Popular Espanol SA (a) | | | 8,315,869 | | | | 50,229,324 | |
| Banco Santander SA | | | 4,593,748 | | | | 41,309,435 | |
| Distribuidora Internacional de Alimentacion SA | | | 2,428,483 | | | | 21,744,521 | |
| Inditex SA | | | 521,856 | | | | 86,164,579 | |
| | | | | | | | 199,447,859 | |
| SWEDEN - 9.1% | | | | | | | | |
| Alfa Laval AB | | | 1,184,742 | | | | 30,439,813 | |
| Atlas Copco AB, A Shares | | | 2,729,744 | | | | 75,794,229 | |
| Elekta AB, B Shares | | | 864,644 | | | | 13,231,760 | |
| Investment AB Kinnevik, B Shares | | | 604,188 | | | | 28,010,838 | |
| Sandvik AB | | | 1,656,412 | | | | 23,378,091 | |
| Svenska Handelsbanken AB, A Shares | | | 1,047,443 | | | | 51,499,443 | |
| | | | | | | | 222,354,174 | |
The accompanying notes are an integral part of the financial statements.
| PORTFOLIO OF INVESTMENTS (continued) | |
| December 31, 2013 | Baillie Gifford EAFE Fund |
| | | Shares | | | Value | |
| |
| SWITZERLAND - 7.2% | | | | | | | | |
| ABB Ltd. (a) | | | 1,119,675 | | | $ | 29,604,223 | |
| Compagnie Financiere Richemont SA | | | 475,013 | | | | 47,452,595 | |
| Geberit AG | | | 118,332 | | | | 35,899,689 | |
| Swatch Group AG (The) | | | 19,604 | | | | 12,993,605 | |
| Syngenta AG | | | 126,807 | | | | 50,557,588 | |
| | | | | | | | 176,507,700 | |
| TAIWAN - 0.6% | | | | | | | | |
| Taiwan Semiconductor Manufacturing Co., Ltd. ADR | | | 819,806 | | | | 14,297,417 | |
| |
| TURKEY - 0.8% | | | | | | | | |
| BIM Birlesik Magazalar A/S | | | 506,814 | | | | 10,235,533 | |
| Turkiye Garanti Bankasi A/S | | | 3,250,459 | | | | 10,536,477 | |
| | | | | | | | 20,772,010 | |
| UNITED KINGDOM - 16.5% | | | | | | | | |
| Aggreko Plc. | | | 990,163 | | | | 28,081,789 | |
| ARM Holdings Plc. | | | 4,246,000 | | | | 77,204,898 | |
| ASOS Plc. (a) | | | 159,551 | | | | 16,256,435 | |
| British American Tobacco Plc. | | | 607,811 | | | | 32,623,879 | |
| Meggitt Plc. | | | 4,335,587 | | | | 37,960,158 | |
| Prudential Plc. | | | 4,261,638 | | | | 95,222,564 | |
| Rolls-Royce Holdings Plc. (a) | | | 3,433,620 | | | | 72,626,175 | |
| Standard Chartered Plc. | | | 2,020,826 | | | | 45,644,529 | |
| | | | | | | | 405,620,427 | |
Total Common Stocks
(cost $1,471,629,954) | | | | | | | 2,379,496,559 | |
| |
| PREFERRED STOCKS - 1.7% | | | | | | | | |
| BRAZIL - 0.6% | | | | | | | | |
| Itau Unibanco Holding SA ADR | | | 1,069,908 | | | | 14,518,652 | |
| |
| GERMANY - 1.1% | | | | | | | | |
| Porsche Automobil Holding SE | | | 252,456 | | | | 26,354,369 | |
| | | | | | | | | |
Total Preferred Stocks
(cost $30,026,460) | | | | | | | 40,873,021 | |
| |
TOTAL INVESTMENTS - 98.6%
(cost $1,501,656,414) | | | | | | | 2,420,369,580 | |
| Other assets less liabilities - 1.4% | | | | | | | 33,189,217 | |
| NET ASSETS - 100.0% | | | | | | $ | 2,453,558,797 | |
| (a) Non Income Producing |
| ADR | - | American Depositary Receipt. |
| CDI | - | Chess Depositary Interest. |
| GDR | - | Global Depositary Receipt. |
The accompanying notes are an integral part of the financial statements.
| PORTFOLIO OF INVESTMENTS (concluded) | |
| December 31, 2013 | Baillie Gifford EAFE Fund |
Reg S - is a safe harbor that defines when an offering of securities will be deemed to come to rest abroad and therefore is not subject to the registration obligations imposed under Section 5 of the 1933 Act. The regulation includes two safe harbor provisions: an issuer safe harbor and a resale safe harbor. In each case, the regulation demands that offers and sales of the securities be made outside the United States and that no offering participant (which includes the issuer, the banks assisting with the offer and their respective affiliates) engage in “directed” selling efforts. In the case of issuers for whose securities there is substantial U.S. market interest, the regulation also requires that no offers and sales be made to U.S. persons (including U.S. persons physically located outside the United States).
The accompanying notes are an integral part of the financial statements.
| STATEMENT OF ASSETS AND LIABILITIES | |
| December 31, 2013 | Baillie Gifford EAFE Fund |
| ASSETS | | | |
| Investments, at value (cost $1,501,656,414) | | $ | 2,420,369,580 | |
| Cash | | | 34,058,162 | |
| Foreign cash, at value (cost $1,142,069) | | | 1,157,894 | |
| Dividends receivable | | | 396,377 | |
| Tax reclaims receivable | | | 1,777,543 | |
| | | | | |
| Total Assets | | | 2,457,759,556 | |
| | | | | |
| LIABILITIES | | | | |
| Management fee payable | | | 1,483,309 | |
| Servicing fee payable | | | 1,167,382 | |
| Distribution payable | | | 934,057 | |
| Trustee fee payable | | | 16,923 | |
| Indian capital gains tax payable | | | 1,403 | |
| Accrued expenses | | | 597,685 | |
| | | | | |
| Total Liabilities | | | 4,200,759 | |
| | | | | |
| NET ASSETS | | $ | 2,453,558,797 | |
| | | | | |
| | | | | |
| COMPOSITION OF NET ASSETS | | | | |
| Paid-in capital | | $ | 1,573,908,451 | |
| Distributions in excess of net investment income | | | (18,175,411 | ) |
Accumulated net realized loss on investments and foreign currency transactions (net of
Indian capital gains tax) | | | (20,957,950 | ) |
Net unrealized appreciation in value of investments and foreign currencies (net of
deferred Indian capital gains tax) | | | 918,783,707 | |
| | | $ | 2,453,558,797 | |
| | | | | |
| NET ASSET VALUE, PER SHARE | | | | |
| | | | | |
Class 1 ($26,280,338 / 2,081,948 shares outstanding),
unlimited authorized, no par value | | $ | 12.62 | |
| Maximum Purchase Price Per Share (Note D) | | $ | 12.65 | |
| Minimum Redemption Price Per Share (Note D) | | $ | 12.60 | |
| | | | | |
Class 2 ($828,208,461 / 65,814,708 shares outstanding),
unlimited authorized, no par value | | $ | 12.58 | |
| Maximum Purchase Price Per Share (Note D) | | $ | 12.61 | |
| Minimum Redemption Price Per Share (Note D) | | $ | 12.56 | |
| | | | | |
Class 3 ($530,001,051 / 42,035,328 shares outstanding),
unlimited authorized, no par value | | $ | 12.61 | |
| Maximum Purchase Price Per Share (Note D) | | $ | 12.64 | |
| Minimum Redemption Price Per Share (Note D) | | $ | 12.59 | |
| | | | | |
Class 4 ($220,388,123 / 17,457,311 shares outstanding),
unlimited authorized, no par value | | $ | 12.62 | |
| Maximum Purchase Price Per Share (Note D) | | $ | 12.65 | |
| Minimum Redemption Price Per Share (Note D) | | $ | 12.60 | |
| | | | | |
Class 5 ($848,680,824 / 67,151,371 shares outstanding),
unlimited authorized, no par value | | $ | 12.64 | |
| Maximum Purchase Price Per Share (Note D) | | $ | 12.67 | |
| Minimum Redemption Price Per Share (Note D) | | $ | 12.62 | |
The accompanying notes are an integral part of the financial statements.
| STATEMENT OF OPERATIONS | |
| For the Year Ended December 31, 2013 | Baillie Gifford EAFE Fund |
| INVESTMENT INCOME | | | |
| Dividends (net of foreign withholding taxes of $3,918,481) | | $ | 38,497,772 | |
| Interest | | | 5,139 | |
| Total Investment Income | | | 38,502,911 | |
| | | | | |
| EXPENSES | | | | |
| Management fee (Note B) | | | 5,431,012 | |
| Shareholder Servicing fees - Class 1 Shares (Note B) | | | 190,394 | |
| Shareholder Servicing fees - Class 2 Shares (Note B) | | | 2,196,237 | |
| Shareholder Servicing fees - Class 3 Shares (Note B) | | | 1,137,655 | |
| Shareholder Servicing fees - Class 4 Shares (Note B) | | | 81,464 | |
| Shareholder Servicing fees - Class 5 Shares (Note B) | | | 839,935 | |
| Fund Accounting | | | 1,049,475 | |
| Custody | | | 405,766 | |
| Legal | | | 226,757 | |
| Professional fees | | | 60,587 | |
| Trustees’ fees | | | 55,844 | |
| Insurance | | | 36,130 | |
| Transfer Agency | | | 33,165 | |
| Miscellaneous | | | 25,142 | |
| Total Expenses | | | 11,769,563 | |
| | | | | |
| Net Investment Income | | | 26,733,348 | |
| | | | | |
REALIZED AND UNREALIZED GAIN (LOSS) ON INVESTMENTS
AND FOREIGN CURRENCY TRANSACTIONS | | | | |
| Net realized gain (loss) from: | | | | |
| Investments | | | 48,712,692 | |
| Foreign currency transactions | | | (143,555 | ) |
| | | | 48,569,137 | |
| | | | | |
| Net change in unrealized appreciation (depreciation) on: | | | | |
| Investments (net of deferred Indian capital gains tax of $1,403) | | | 481,878,349 | |
| Translation of assets and liabilities in foreign currencies | | | 64,981 | |
| | | | 481,943,330 | |
| | | | | |
| Net realized and unrealized gain on investments and foreign currency transactions | | | 530,512,467 | |
| NET INCREASE IN NET ASSETS FROM OPERATIONS | | $ | 557,245,815 | |
The accompanying notes are an integral part of the financial statements.
| STATEMENTS OF CHANGES IN NET ASSETS | Baillie Gifford EAFE Fund |
| | | For the
Year Ended
December 31, 2013 | | | For the
Year Ended
December 31, 2012 | |
| | | | | | | |
| INCREASE (DECREASE) IN NET ASSETS FROM OPERATIONS | | | | | | | | |
| Net investment income | | $ | 26,733,348 | | | $ | 23,220,781 | |
| Net realized gain (loss) from investments and foreign currency transactions | | | 48,569,137 | | | | (36,378,729 | ) |
Net change in unrealized appreciation (depreciation) on investments
and translation of assets and liabilities in foreign currencies | | | 481,943,330 | | | | 336,624,733 | |
| Net increase in net assets from operations | | | 557,245,815 | | | | 323,466,785 | |
| | | | | | | | | |
| DIVIDENDS TO SHAREHOLDERS FROM: | | | | | | | | |
| Net investment income: | | | | | | | | |
| Class 1 | | | (233,655 | ) | | | (346,140 | ) |
| Class 2 | | | (8,729,182 | ) | | | (9,050,478 | ) |
| Class 3 | | | (5,941,859 | ) | | | (5,075,670 | ) |
| Class 4 | | | (2,487,636 | ) | | | - | |
| Class 5 | | | (10,105,932 | ) | | | (6,828,751 | ) |
| Total Dividends | | | (27,498,264 | ) | | | (21,301,039 | ) |
| | | | | | | | | |
| TRANSACTIONS IN SHARES OF BENEFICIAL INTEREST | | | | | | | | |
| Net proceeds from shares subscribed: | | | | | | | | |
| Class 1 | | | - | | | | 20,956,314 | |
| Class 2 | | | 47,777,796 | | | | 161,201,621 | |
| Class 3 | | | 217,132,949 | | | | 7,485,000 | |
| Class 4 | | | 201,540,630 | | | | 49,900,000 | |
| Class 5 | | | 49,900,000 | | | | 532,921,389 | |
| Purchase premiums: | | | | | | | | |
| Class 1 | | | 2,951 | | | | 3,667 | |
| Class 2 | | | 51,231 | | | | 75,854 | |
| Class 3 | | | 36,622 | | | | 40,423 | |
| Class 4 | | | 1,789 | | | | 35,418 | |
| Class 5 | | | 47,607 | | | | 15,109 | |
| Redemption fees: | | | | | | | | |
| Class 1 | | | 8,131 | | | | 1,742 | |
| Class 2 | | | 147,441 | | | | 36,183 | |
| Class 3 | | | 105,792 | | | | 19,378 | |
| Class 4 | | | 4,975 | | | | 4,000 | |
| Class 5 | | | 125,165 | | | | 20,052 | |
| Dividends reinvested: | | | | | | | | |
| Class 1 | | | 233,655 | | | | 346,140 | |
| Class 2 | | | 7,780,515 | | | | 8,327,874 | |
| Class 3 | | | 5,941,859 | | | | 4,098,931 | |
| Class 4 | | | 2,487,636 | | | | - | |
| Class 5 | | | 10,105,932 | | | | 6,828,751 | |
| Cost of shares redeemed: | | | | | | | | |
| Class 1 | | | (27,717,996 | ) | | | (2,503,756 | ) |
| Class 2 | | | (360,935,125 | ) | | | (42,719,584 | ) |
| Class 3 | | | (318,740,539 | ) | | | (102,190,959 | ) |
| Class 4 | | | - | | | | (532,921,389 | ) |
| | | | | | | | | |
Increase (Decrease) in Net Assets from Transactions in Shares of Beneficial
Interest | | | (163,960,984 | ) | | | 111,982,158 | |
| | | | | | | | | |
| Total Increase in Net Assets | | | 365,786,567 | | | | 414,147,904 | |
| | | | | | | | | |
| NET ASSETS | | | | | | | | |
| Beginning of year | | | 2,087,772,230 | | | | 1,673,624,326 | |
End of year (including distributions in excess of net investment income of
$18,175,411 and $18,074,322, respectively) | | $ | 2,453,558,797 | | | $ | 2,087,772,230 | |
The accompanying notes are an integral part of the financial statements.
| FINANCIAL HIGHLIGHTS | Baillie Gifford EAFE Fund |
Selected data for a Class 1 Shares outstanding throughout each period:
| | | For the
Year Ended
December 31, 2013 | | For the
Year Ended
December 31, 2012 | | For the
Year Ended
December 31, 2011 | | For the
Year Ended
December 31, 2010 | | For the Period
January 2, 2009(a)
through
December 31, 2009 |
| Net asset value, beginning of period | | $9.91 | | $8.43 | | $9.73 | | $8.47 | | $6.01 |
| | | | | | | | | | | |
| From Investment Operations | | | | | | | | | | |
| Net investment income(b) | | 0.13 | | 0.10 | | 0.11 | | 0.14 | | 0.12 |
| Net realized and unrealized gain (loss) on investments and foreign currency transactions | | 2.69 | | 1.46 | | (1.26) | | 1.23 | | 2.36 |
| Net increase (decrease) in net asset value from investment operations | | 2.82 | | 1.56 | | (1.15) | | 1.37 | | 2.48 |
| | | | | | | | | | | |
| Dividends to Shareholders | | | | | | | | | | |
| Dividends from net investment income | | (0.11) | | (0.08) | | (0.15) | | (0.12) | | (0.03) |
| | | | | | | | | | | |
| Proceeds from Purchase Premiums and Redemption Fees(b) | | 0.00(c) | | 0.00(c) | | 0.00(c) | | 0.01 | | 0.01 |
| | | | | | | | | | | |
| Net asset value, end of period | | $12.62 | | $9.91 | | $8.43 | | $9.73 | | $8.47 |
| | | | | | | | | | | |
| Total Return | | | | | | | | | | |
| Total investment return based on net asset value(d) | | 28.48% | | 18.50% | | (11.82)% | | 16.36% | | 41.49% |
| | | | | | | | | | | |
| Ratios/Supplemental Data | | | | | | | | | | |
| Net assets, end of period (000’s omitted) | | $26,280 | | $44,008 | | $19,880 | | $22,567 | | $41,798 |
| Ratio of net expenses to average net assets | | 0.79% | | 0.79% | | 0.78% | | 0.79% | | 0.84*(e) |
| Ratio of net investment income to average net assets | | 1.17% | | 1.10% | | 1.16% | | 1.52% | | 1.61%* |
| Portfolio turnover rate | | 15% | | 18% | | 11% | | 13% | | 9% |
| * | Annualized. |
| (a) | Commencement of investment operations. |
| (b) | Calculated based upon average shares outstanding during the period. |
| (c) | Rounds to less than $0.005 per share. |
| (d) | Total investment return is calculated assuming an initial investment made at the net asset value at the beginning of the period, reinvestment of all dividends and distributions, if any, at net asset value during the period, and redemption on the last day of the period. Total return is not annualized for periods less than one year. |
| (e) | Baillie Gifford Overseas Limited had contractually agreed to waive its fees and/or bear other expenses through March 31, 2009 to the extent that such Fund’s total annual operating expenses (excluding interest, taxes and extraordinary expenses) exceeded 0.98% for Class 1 Shares. |
The accompanying notes are an integral part of the financial statements.
| FINANCIAL HIGHLIGHTS (continued) | Baillie Gifford EAFE Fund |
Selected data for a Class 2 Shares outstanding throughout each year:
| | | For the
Year Ended
December 31, 2013 | | For the
Year Ended
December 31, 2012 | | For the
Year Ended
December 31, 2011 | | For the
Year Ended
December 31, 2010 | | For the
Year Ended
December 31, 2009 |
| Net asset value, beginning of year | | $9.88 | | $8.40 | | $9.70 | | $8.44 | | $5.85 |
| | | | | | | | | | | |
| From Investment Operations | | | | | | | | | | |
| Net investment income(a) | | 0.13 | | 0.11 | | 0.13 | | 0.10 | | 0.07 |
| Net realized and unrealized gain (loss) on investments and foreign currency transactions | | 2.70 | | 1.47 | | (1.27) | | 1.29 | | 2.60 |
| Net increase (decrease) in net asset value from investment operations | | 2.83 | | 1.58 | | (1.14) | | 1.39 | | 2.67 |
| | | | | | | | | | | |
| Dividends to Shareholders | | | | | | | | | | |
| Dividends from net investment income | | (0.13) | | (0.10) | | (0.16) | | (0.14) | | (0.09) |
| | | | | | | | | | | |
| Proceeds from Purchase Premiums and Redemption Fees(a) | | 0.00(b) | | 0.00(b) | | 0.00(b) | | 0.01 | | 0.01 |
| | | | | | | | | | | |
| Net asset value, end of year | | $12.58 | | $9.88 | | $8.40 | | $9.70 | | $8.44 |
| | | | | | | | | | | |
| Total Return | | | | | | | | | | |
| Total investment return based on net asset value(c) | | 28.69% | | 18.78% | | (11.70)% | | 16.60% | | 45.75% |
| | | | | | | | | | | |
| Ratios/Supplemental Data | | | | | | | | | | |
| Net assets, end of year (000’s omitted) | | $828,208 | | $936,352 | | $682,295 | | $923,723 | | $499,797 |
| Ratio of net expenses to average net assets | | 0.61% | | 0.61% | | 0.60% | | 0.62% | | 0.65%(d) |
| Ratio of net investment income to average net assets | | 1.21% | | 1.20% | | 1.33% | | 1.14% | | 0.95% |
| Portfolio turnover rate | | 15% | | 18% | | 11% | | 13% | | 9% |
| (a) | Calculated based upon average shares outstanding during the year. |
| (b) | Rounds to less than $0.005 per share. |
| (c) | Total investment return is calculated assuming an initial investment made at the net asset value at the beginning of the period, reinvestment of all dividends and distributions, if any, at net asset value during the period, and redemption on the last day of the period. Total return is not annualized for periods less than one year. |
| (d) | Baillie Gifford Overseas Limited had contractually agreed to waive its fees and/or bear other expenses through March 31, 2009 to the extent that such Fund’s total annual operating expenses (excluding interest, taxes and extraordinary expenses) exceeded 0.80% for Class 2 Shares. |
The accompanying notes are an integral part of the financial statements.
| FINANCIAL HIGHLIGHTS (continued) | Baillie Gifford EAFE Fund |
Selected data for a Class 3 Shares outstanding throughout each period:
| | | For the
Year Ended
December 31, 2013 | | For the
Year Ended
December 31, 2012 | | For the
Year Ended
December 31, 2011 | | For the Period
April 19, 2010(b)
through
December 31, 2010 | | For the Period
January 1, 2009
through
January 5, 2009(a) |
| Net asset value, beginning of period | | $9.90 | | $8.42 | | $9.72 | | $8.87 | | $5.86 |
| | | | | | | | | | | |
| From Investment Operations | | | | | | | | | | |
| Net investment income (loss)(c) | | 0.14 | | 0.12 | | 0.13 | | 0.08 | | (0.00)(d) |
| Net realized and unrealized gain (loss) on investments and foreign currency transactions | | 2.71 | | 1.46 | | (1.26) | | 0.91 | | 0.17 |
| Net increase (decrease) in net asset value from investment operations | | 2.85 | | 1.58 | | (1.13) | | 0.99 | | 0.17 |
| | | | | | | | | | | |
| Dividends to Shareholders | | | | | | | | | | |
| Dividends from net investment income | | (0.14) | | (0.10) | | (0.17) | | (0.15) | | - |
| | | | | | | | | | | |
| Proceeds from Purchase Premiums and Redemption Fees(c) | | 0.00(d) | | 0.00(d) | | 0.00(d) | | 0.01 | | - |
| | | | | | | | | | | |
| Net asset value, end of period | | $12.61 | | $9.90 | | $8.42 | | $9.72 | | $6.03(a) |
| | | | | | | | | | | |
| Total Return | | | | | | | | | | |
| Total investment return based on net asset value(e) | | 28.83% | | 18.82% | | (11.61)% | | 11.25% | | 2.90% |
| | | | | | | | | | | |
| Ratios/Supplemental Data | | | | | | | | | | |
| Net assets, end of period (000’s omitted) | | $530,001 | | $490,822 | | $502,187 | | $139,344 | | $-(a) |
| Ratio of net expenses to average net assets | | 0.54% | | 0.54% | | 0.54% | | 0.56%* | | 0.57%* |
| Ratio of net investment income (loss) to average net assets | | 1.30% | | 1.26% | | 1.35% | | 1.26%* | | (0.21)%* |
| Portfolio turnover rate | | 15% | | 18% | | 11% | | 13% | | 9% |
| * | Annualized. |
| (a) | Class had no sharesholders from Janaury 6, 2009 to April 18, 2010. All shares of this class were redeemed at $6.03 on Janaury 5, 2009. New shares were issued at $8.87 on April 19, 2010. |
| (b) | Recommencement of Operations. |
| (c) | Calculated based upon average shares outstanding during the period. |
| (d) | Rounds to less than $0.005 per share. |
| (e) | Total investment return is calculated assuming an initial investment made at the net asset value at the beginning of the period, reinvestment of all dividends and distributions, if any, at net asset value during the period, and redemption on the last day of the period. Total return is not annualized for periods less than one year. |
The accompanying notes are an integral part of the financial statements.
| FINANCIAL HIGHLIGHTS (continued) | Baillie Gifford EAFE Fund |
Selected data for a Class 4 Shares outstanding throughout the period:
| | | For the Period
October 10, 2013(a)
through
December 31, 2013 |
| Net asset value, beginning of period | | $11.68 |
| | | |
| From Investment Operations | | |
| Net investment income(b) | | 0.00 (c) |
| Net realized and unrealized gain on investments and foreign currency transactions | | 1.08 |
| | | |
| Net increase in net asset value from investment operations | | 1.08 |
| | | |
| Dividends to Shareholders | | |
| Dividends from net investment income | | (0.14) |
| | | |
| Proceeds from Purchase Premiums and Redemption Fees(b) | | 0.00 (c) |
| | | |
| Net asset value, end of period | | $12.62 |
| | | |
| Total Return | | |
| Total investment return based on net asset value(d) | | 9.29% |
| | | |
| Ratios/Supplemental Data | | |
| Net assets, end of period (000’s omitted) | | $220,388 |
| Ratio of net expenses to average net assets | | 0.52%* |
| Ratio of net investment income to average net assets | | 0.03%* |
| Portfolio turnover rate | | 15% |
| * | Annualized. |
| (a) | Commencement of investment operations. |
| (b) | Calculated based upon average shares outstanding during the period. |
| (c) | Rounds to less than $0.005 per share. |
| (d) | Total investment return is calculated assuming an initial investment made at the net asset value at the beginning of the period, reinvestment of all dividends and distributions, if any, at net asset value during the period, and redemption on the last day of the period. Total return is not annualized for periods less than one year. |
The accompanying notes are an integral part of the financial statements.
| FINANCIAL HIGHLIGHTS (concluded) | Baillie Gifford EAFE Fund |
Selected data for a Class 5 Shares outstanding throughout each period:
| | | For the
Year Ended
December 31, 2013 | | For the Period
July 18, 2012(a)
through
December 31, 2012 |
| Net asset value, beginning of period | | $9.92 | | $8.67 |
| | | | | |
| From Investment Operations | | | | |
| Net investment income(b) | | 0.14 | | 0.03 |
| Net realized and unrealized gain on investments and foreign currency transactions | | 2.73 | | 1.33 |
| | | | | |
| Net increase in net asset value from investment operations | | 2.87 | | 1.36 |
| | | | | |
| Dividends to Shareholders | | | | |
| Dividends from net investment income | | (0.15) | | (0.11) |
| | | | | |
| Proceeds from Purchase Premiums and Redemption Fees(b) | | 0.00(c) | | 0.00(c) |
| | | | | |
| Net asset value, end of period | | $12.64 | | $9.92 |
| | | | | |
| Total Return | | | | |
| Total investment return based on net asset value(d) | | 28.97% | | 15.72% |
| | | | | |
| Ratios/Supplemental Data | | | | |
| Net assets, end of period (000’s omitted) | | $848,681 | | $616,590 |
| Ratio of net expenses to average net assets | | 0.46% | | 0.46%* |
| Ratio of net investment income to average net assets | | 1.28% | | 0.70%* |
| Portfolio turnover rate | | 15% | | 18% |
| * | Annualized. |
| (a) | Commencement of investment operations. |
| (b) | Calculated based upon average shares outstanding during the period. |
| (c) | Rounds to less than $0.005 per share. |
| (d) | Total investment return is calculated assuming an initial investment made at the net asset value at the beginning of the period, reinvestment of all dividends and distributions, if any, at net asset value during the period, and redemption on the last day of the period. Total return is not annualized for periods less than one year. |
The accompanying notes are an integral part of the financial statements.
| INDUSTRY DIVERSIFICATION TABLE | | |
| December 31, 2013 (unaudited) | Baillie Gifford EAFE Choice Fund |
| | | | | | % of Total | |
| | | Value | | | Net Assets | |
| | | | | | | | | |
| Apparel | | $ | 1,424,380 | | | | 1.2 | % |
| Apparel retailers | | | 1,374,556 | | | | 1.2 | |
| Auto Manufacturers | | | 2,667,320 | | | | 2.3 | |
| Banks | | | 8,608,625 | | | | 7.5 | |
| Beverages, Food & Tobacco | | | 10,835,920 | | | | 9.4 | |
| Biotechnology | | | 2,057,363 | | | | 1.8 | |
| Chemicals | | | 2,407,239 | | | | 2.1 | |
| Commercial Services | | | 2,723,005 | | | | 2.4 | |
| Commercial Vehicles & Trucks | | | 1,566,981 | | | | 1.4 | |
| Computer Services | | | 81,990 | | | | 0.1 | |
| Construction & Building Materials | | | 1,377,653 | | | | 1.2 | |
| Cosmetics/Personal Care | | | 1,473,350 | | | | 1.3 | |
| Distribution/Wholesale | | | 949,791 | | | | 0.8 | |
| Diversified Financial Services | | | 3,540,084 | | | | 3.1 | |
| Diversified Industrials | | | 1,220,930 | | | | 1.1 | |
| Electronic & Electrical Equipment | | | 5,363,371 | | | | 4.7 | |
| Engineering & Machinery | | | 9,285,873 | | | | 8.1 | |
| Entertainment | | | 2,175,885 | | | | 1.9 | |
| Food Producers & Processors | | | 4,382,990 | | | | 3.8 | |
| Healthcare - Products | | | 3,769,044 | | | | 3.3 | |
| Holding Companies - Diversified | | | 2,471,719 | | | | 2.1 | |
| Insurance | | | 2,685,210 | | | | 2.3 | |
| Internet | | | 11,566,869 | | | | 10.1 | |
| Investment Companies | | | 5,756,284 | | | | 5.0 | |
| Media & Photography | | | 1,278,180 | | | | 1.1 | |
| Mining & Metals | | | 2,100,540 | | | | 1.8 | |
| Oil & Gas | | | 6,850,914 | | | | 5.9 | |
| Pharmaceuticals | | | 4,905,733 | | | | 4.3 | |
| Retailers - General | | | 3,929,920 | | | | 3.4 | |
| Semiconductors | | | 2,886,075 | | | | 2.5 | |
| Travel & Leisure | | | 1,751,323 | | | | 1.5 | |
| | | | | | | | | |
| Total Value of Investments | | | 113,469,117 | | | | 98.7 | |
| Other assets less liabilities | | | 1,468,396 | | | | 1.3 | |
| Net Assets | | $ | 114,937,513 | | | | 100.0 | % |
| PORTFOLIO OF INVESTMENTS | | |
| December 31, 2013 | Baillie Gifford EAFE Choice Fund |
| | | Shares | | | Value | |
| | | | | | | |
| COMMON STOCKS - 98.4% | | | | | | | | |
| AUSTRALIA - 7.1% | | | | | | | | |
| Aristocrat Leisure Ltd. | | | 336,753 | | | $ | 1,414,887 | |
| Brambles Ltd. | | | 132,810 | | | | 1,088,102 | |
| Cochlear Ltd. | | | 35,806 | | | | 1,886,514 | |
| Mesoblast Ltd. (a) | | | 107,840 | | | | 564,316 | |
| Recall Holdings Ltd. (a) | | | 22,617 | | | | 81,990 | |
| Seek Ltd. | | | 134,355 | | | | 1,615,269 | |
| Treasury Wine Estates Ltd. | | | 178,453 | | | | 769,666 | |
| Woolworths Ltd. | | | 25,788 | | | | 780,893 | |
| | | | | | | | 8,201,637 | |
| BELGIUM - 0.6% | | | | | | | | |
| Colruyt SA | | | 12,037 | | | | 672,550 | |
| | | | | | | | | |
| CHINA - 6.7% | | | | | | | | |
| Baidu, Inc. ADR (a) | | | 7,700 | | | | 1,369,676 | |
| BOC Hong Kong Holdings Ltd. | | | 261,960 | | | | 841,327 | |
| Cafe de Coral Holdings Ltd. | | | 299,702 | | | | 967,242 | |
| Jardine Strategic Holdings Ltd. | | | 35,400 | | | | 1,134,341 | |
| Li & Fung Ltd. | | | 734,782 | | | | 949,791 | |
| Mindray Medical International Ltd. ADR | | | 30,253 | | | | 1,099,999 | |
| Tsingtao Brewery Co. Ltd., Class H | | | 159,943 | | | | 1,355,415 | |
| | | | | | | | 7,717,791 | |
| DENMARK - 4.6% | | | | | | | | |
| Carlsberg A/S, B Shares | | | 23,542 | | | | 2,605,011 | |
| Novo Nordisk A/S, B Shares | | | 8,400 | | | | 1,539,736 | |
| Novozymes A/S, B Shares | | | 25,517 | | | | 1,077,844 | |
| | | | | | | | 5,222,591 | |
| FINLAND - 1.5% | | | | | | | | |
| Kone Oyj, B Shares | | | 38,674 | | | | 1,744,150 | |
| | | | | | | | | |
| FRANCE - 3.2% | | | | | | | | |
| BioMerieux | | | 7,458 | | | | 782,531 | |
| Legrand SA | | | 23,730 | | | | 1,307,825 | |
| Total SA | | | 26,128 | | | | 1,603,729 | |
| | | | | | | | 3,694,085 | |
| GERMANY - 1.2% | | | | | | | | |
| Adidas AG | | | 11,170 | | | | 1,424,380 | |
| | | | | | | | | |
| INDIA - 1.0% | | | | | | | | |
| Mahindra & Mahindra Ltd. GDR | | | 84,000 | | | | 1,178,690 | |
| | | | | | | | | |
| ITALY - 2.5% | | | | | | | | |
| CNH Industrial NV (a) | | | 137,482 | | | | 1,566,981 | |
| EXOR SpA | | | 33,648 | | | | 1,337,378 | |
| | | | | | | | 2,904,359 | |
The accompanying notes are an integral part of the financial statements.
| PORTFOLIO OF INVESTMENTS (continued) | | |
| December 31, 2013 | Baillie Gifford EAFE Choice Fund |
| | | Shares | | | Value | |
| | | | | | | |
| JAPAN - 13.0% | | | | | | | | |
| Asahi Group Holdings Ltd. | | | 53,800 | | | $ | 1,518,219 | |
| Kao Corp. | | | 46,800 | | | | 1,473,350 | |
| MS&AD Insurance Group Holdings, Inc. | | | 99,900 | | | | 2,685,210 | |
| Olympus Corp. (a) | | | 47,100 | | | | 1,493,858 | |
| Rakuten, Inc. | | | 140,000 | | | | 2,089,281 | |
| Sankyo Co., Ltd. | | | 16,500 | | | | 760,998 | |
| Shimano, Inc. | | | 20,400 | | | | 1,751,323 | |
| SMC Corp. | | | 5,000 | | | | 1,261,943 | |
| THK Co., Ltd. | | | 76,900 | | | | 1,920,621 | |
| | | | | | | | 14,954,803 | |
| NEW ZEALAND - 1.1% | | | | | | | | |
| Trade Me Ltd. | | | 363,306 | | | | 1,213,345 | |
| | | | | | | | | |
| SINGAPORE - 2.1% | | | | | | | | |
| Jardine Matheson Holdings Ltd. | | | 8,400 | | | | 440,037 | |
| United Overseas Bank Ltd. | | | 114,163 | | | | 1,927,876 | |
| | | | | | | | 2,367,913 | |
| SOUTH AFRICA - 1.9% | | | | | | | | |
| Clicks Group Ltd. | | | 143,732 | | | | 860,337 | |
| Naspers Ltd., N shares | | | 12,211 | | | | 1,278,180 | |
| | | | | | | | 2,138,517 | |
| SOUTH KOREA - 1.0% | | | | | | | | |
| Samsung Electronics Co., Ltd. GDR Reg S | | | 1,787 | | | | 1,169,309 | |
| | | | | | | | | |
| SPAIN - 3.8% | | | | | | | | |
| Corporacion Financiera Alba SA | | | 19,908 | | | | 1,163,970 | |
| Distribuidora Internacional de Alimentacion SA | | | 198,108 | | | | 1,773,850 | |
| Inditex SA | | | 8,325 | | | | 1,374,556 | |
| | | | | | | | 4,312,376 | |
| SWEDEN - 9.9% | | | | | | | | |
| Atlas Copco AB, B Shares | | | 81,400 | | | | 2,069,296 | |
| Investment AB Kinnevik, B Shares | | | 75,167 | | | | 3,484,827 | |
| Investor AB, B Shares | | | 32,135 | | | | 1,107,487 | |
| Scania AB, B Shares | | | 75,953 | | | | 1,488,630 | |
| Svenska Handelsbanken AB, A Shares | | | 66,275 | | | | 3,258,531 | |
| | | | | | | | 11,408,771 | |
| SWITZERLAND - 8.7% | | | | | | | | |
| Geberit AG | | | 4,541 | | | | 1,377,653 | |
| Nestle SA | | | 37,504 | | | | 2,748,670 | |
| Roche Holding AG - Genusschein | | | 12,016 | | | | 3,365,997 | |
| Schindler Holding AG, Participating Certificates | | | 8,603 | | | | 1,266,480 | |
| UBS AG (a) | | | 63,274 | | | | 1,211,530 | |
| | | | | | | | 9,970,330 | |
| TAIWAN - 1.9% | | | | | | | | |
| Hon Hai Precision Industry Co., Ltd. GDR Reg S | | | 204,913 | | | | 1,090,137 | |
| Taiwan Semiconductor Manufacturing Co., Ltd. ADR | | | 61,759 | | | | 1,077,077 | |
| | | | | | | | 2,167,214 | |
| TURKEY - 0.8% | | | | | | | | |
| Turkiye Garanti Bankasi A/S | | | 272,565 | | | | 883,529 | |
The accompanying notes are an integral part of the financial statements.
| PORTFOLIO OF INVESTMENTS (concluded) | | |
| December 31, 2013 | Baillie Gifford EAFE Choice Fund |
| | | Shares | | | Value | |
| | | | | | | |
| UNITED KINGDOM - 22.8% | | | | | | | | |
| AMEC Plc. | | | 35,445 | | | $ | 639,955 | |
| ASOS Plc. (a) | | | 27,059 | | | | 2,757,005 | |
| BG Group Plc. | | | 142,589 | | | | 3,068,297 | |
| BHP Billiton Plc. | | | 51,279 | | | | 1,591,191 | |
| Hargreaves Lansdown Plc. | | | 103,667 | | | | 2,328,554 | |
| Imagination Technologies Group Plc. (a) | | | 216,500 | | | | 639,689 | |
| Imperial Tobacco Group Plc. | | | 31,748 | | | | 1,230,816 | |
| Intertek Group Plc. | | | 31,325 | | | | 1,634,903 | |
| John Wood Group Plc. | | | 134,993 | | | | 1,538,933 | |
| Johnson Matthey Plc. | | | 44,240 | | | | 2,407,239 | |
| Kazakhmys Plc. | | | 140,388 | | | | 509,349 | |
| Mitchells & Butlers Plc. (a) | | | 204,343 | | | | 1,429,791 | |
| Rightmove Plc. | | | 55,539 | | | | 2,522,293 | |
| Standard Chartered Plc. | | | 57,479 | | | | 1,298,282 | |
| Unilever Plc. | | | 39,720 | | | | 1,634,320 | |
| Weir Group Plc. (The) | | | 28,904 | | | | 1,023,383 | |
| | | | | | | | 26,254,000 | |
| UNITED STATES - 3.0% | | | | | | | | |
| Coca-Cola Enterprises, Inc. | | | 35,870 | | | | 1,582,943 | |
| Mettler-Toledo International, Inc. (a) | | | 6,066 | | | | 1,471,551 | |
| Protalix BioTherapeutics, Inc. (a) | | | 106,736 | | | | 415,203 | |
| | | | | | | | 3,469,697 | |
Total Common Stocks
(cost $85,269,823) | | | | | | | 113,070,037 | |
| | | | | | | | | |
| PREFERRED STOCKS - 0.3% | | | | | | | | |
| BRAZIL - 0.3% | | | | | | | | |
Itau Unibanco Holding SA ADR
(cost $521,363) | | | 29,409 | | | | 399,080 | |
| | | | | | | | | |
TOTAL INVESTMENTS - 98.7%
(cost $85,791,186) | | | | | | | 113,469,117 | |
| Other assets less liabilities - 1.3% | | | | | | | 1,468,396 | |
| NET ASSETS - 100.0% | | | | | | $ | 114,937,513 | |
(a) Non Income Producing
| ADR | - | American Depositary Receipt. |
| GDR | - | Global Depositary Receipt. |
Reg S - is a safe harbor that defines when an offering of securities will be deemed to come to rest abroad and therefore is not subject to the registration obligations imposed under Section 5 of the 1933 Act. The regulation includes two safe harbor provisions: an issuer safe harbor and a resale safe harbor. In each case, the regulation demands that offers and sales of the securities be made outside the United States and that no offering participant (which includes the issuer, the banks assisting with the offer and their respective affiliates) engage in “directed” selling efforts. In the case of issuers for whose securities there is substantial U.S. market interest, the regulation also requires that no offers and sales be made to U.S. persons (including U.S. persons physically located outside the United States).
The accompanying notes are an integral part of the financial statements.
| STATEMENT OF ASSETS AND LIABILITIES | |
| December 31, 2013 | Baillie Gifford EAFE Choice Fund |
| ASSETS | | | | |
| Investments, at value (cost $85,791,186) | | $ | 113,469,117 | |
| Cash | | | 1,327,798 | |
| Foreign cash, at value (cost $6,570) | | | 6,570 | |
| Dividends receivable | | | 54,113 | |
| Tax reclaims receivable | | | 256,816 | |
| | | | | |
| Total Assets | | | 115,114,414 | |
| | | | | |
| LIABILITIES | | | | |
| Servicing fee payable | | | 66,402 | |
| Management fee payable | | | 60,228 | |
| Trustee fee payable | | | 782 | |
| Accrued expenses | | | 49,489 | |
| | | | | |
| Total Liabilities | | | 176,901 | |
| | | | | |
| NET ASSETS | | $ | 114,937,513 | |
| | | | | |
| COMPOSITION OF NET ASSETS | | | | |
| Paid-in capital | | $ | 97,212,385 | |
| Distributions in excess of net investment income | | | (888,922 | ) |
| Accumulated net realized loss on investments and foreign currency transactions | | | (9,072,524 | ) |
| Net unrealized appreciation in value of investments and foreign currencies | | | 27,686,574 | |
| | | $ | 114,937,513 | |
| | | | | |
| NET ASSET VALUE, PER SHARE | | | | |
| | | | | |
Class 1 ($19,995,036 / 1,536,225 shares outstanding),
unlimited authorized, no par value | | $ | 13.02 | |
| Maximum Purchase Price Per Share (Note D) | | $ | 13.05 | |
| Minimum Redemption Price Per Share (Note D) | | $ | 13.00 | |
| | | | | |
Class 2 ($94,942,477 / 7,232,310 shares outstanding),
unlimited authorized, no par value | | $ | 13.13 | |
| Maximum Purchase Price Per Share (Note D) | | $ | 13.16 | |
| Minimum Redemption Price Per Share (Note D) | | $ | 13.11 | |
The accompanying notes are an integral part of the financial statements.
| STATEMENT OF OPERATIONS | | |
| For the Year Ended December 31, 2013 | | Baillie Gifford EAFE Choice Fund |
| INVESTMENT INCOME | | | | |
| Dividends (net of foreign withholding taxes of $309,144) | | $ | 2,725,667 | |
| Interest | | | 211 | |
| Total Investment Income | | | 2,725,878 | |
| | | | | |
| EXPENSES | | | | |
| Management fee (Note B) | | | 299,057 | |
| Shareholder Servicing fees - Class 1 Shares (Note B) | | | 3,374 | |
| Shareholder Servicing fees - Class 2 Shares (Note B) | | | 233,614 | |
| Shareholder Servicing fees - Class 3 Shares (Note B) | | | 64,229 | |
| Fund Accounting | | | 106,531 | |
| Custody | | | 24,585 | |
| Legal | | | 12,713 | |
| Transfer Agency | | | 11,067 | |
| Professional fees | | | 2,936 | |
| Trustees’ fees | | | 2,809 | |
| Insurance | | | 2,161 | |
| Miscellaneous | | | 1,396 | |
| Total Expenses | | | 764,472 | |
| | | | | |
| Net Investment Income | | | 1,961,406 | |
| | | | | |
REALIZED AND UNREALIZED GAIN (LOSS) ON INVESTMENTS, IN-KIND
AND FOREIGN CURRENCY TRANSACTIONS | | | | |
| Net realized gain from: | | | | |
| Investments | | | 5,684,502 | |
| In kind transactions | | | 9,860,288 | |
| Foreign currency transactions | | | 584,438 | |
| | | | 16,129,228 | |
| | | | | |
| Net change in unrealized appreciation (depreciation) on: | | | | |
| Investments | | | 7,323,423 | |
| Translation of assets and liabilities in foreign currencies | | | 4,320 | |
| | | | 7,327,743 | |
| | | | | |
| Net realized and unrealized gain on investments and foreign currency transactions | | | 23,456,971 | |
| NET INCREASE IN NET ASSETS FROM OPERATIONS | | $ | 25,418,377 | |
The accompanying notes are an integral part of the financial statements.
| STATEMENTS OF CHANGES IN NET ASSETS | Baillie Gifford EAFE Choice Fund |
| | | For the | | | For the | |
| | | Year Ended | | | Year Ended | |
| | | December 31, 2013 | | | December 31, 2012 | |
| | | | | | | |
| INCREASE (DECREASE) IN NET ASSETS FROM OPERATIONS | | | | | | | | |
| Net investment income | | $ | 1,961,406 | | | $ | 3,940,296 | |
| Net realized gain (loss) from investments, in-kind and foreign currency transactions | | | 16,129,228 | | | | (10,760,536 | ) |
| Net change in unrealized appreciation (depreciation) on investments and translation of assets and liabilities in foreign currencies | | | 7,327,743 | | | | 40,711,360 | |
| Net increase in net assets from operations | | | 25,418,377 | | | | 33,891,120 | |
| | | | | | | | | |
| DIVIDENDS TO SHAREHOLDERS FROM: | | | | | | | | |
| Net investment income: | | | | | | | | |
| Class 1 | | | (509,094 | ) | | | - | |
| Class 2 | | | (2,998,953 | ) | | | (4,309,208 | ) |
| Class 3 | | | - | | | | (777,295 | ) |
| Total Dividends | | | (3,508,047 | ) | | | (5,086,503 | ) |
| | | | | | | | | |
| TRANSACTIONS IN SHARES OF BENEFICIAL INTEREST | | | | | | | | |
| Net proceeds from shares subscribed: | | | | | | | | |
| Class 1 | | | 19,159,986 | | | | - | |
| Class 2 | | | 29,551,683 | | | | 16,067,800 | |
| Class 3 | | | 90,951,574 | | | | 42,471,000 | |
| Purchase premiums: | | | | | | | | |
| Class 1 | | | 6,680 | | | | - | |
| Class 2 | | | 31,967 | | | | 26,992 | |
| Class 3 | | | - | | | | 7,208 | |
| Redemption fees: | | | | | | | | |
| Class 2 | | | 40,517 | | | | 26,712 | |
| Class 3 | | | 14,152 | | | | 5,436 | |
| Dividends reinvested: | | | | | | | | |
| Class 1 | | | 509,094 | | | | - | |
| Class 2 | | | 2,998,953 | | | | 4,309,208 | |
| Class 3 | | | - | | | | 777,295 | |
| Cost of shares redeemed: | | | | | | | | |
| Class 2 | | | (107,856,932 | ) | | | (1,902,854 | ) |
| Class 3 | | | (125,975,781 | ) | | | (19,529,294 | ) |
| Class 4 | | | - | | | | (41,473,001 | ) |
| | | | | | | | | |
| Increase (Decrease) in Net Assets from Transactions in Shares of Beneficial Interest | | | (90,568,107 | ) | | | 786,502 | |
| | | | | | | | | |
| Total Increase (Decrease) in Net Assets | | | (68,657,777 | ) | | | 29,591,119 | |
| | | | | | | | | |
| NET ASSETS | | | | | | | | |
| Beginning of year | | | 183,595,290 | | | | 154,004,171 | |
| End of year (including distributions in excess of net investment income of $888,922 and $1,278,811, respectively) | | $ | 114,937,513 | | | $ | 183,595,290 | |
The accompanying notes are an integral part of the financial statements.
| FINANCIAL HIGHLIGHTS | Baillie Gifford EAFE Choice Fund |
Selected data for a Class 1 Shares outstanding throughout the period:
| | | For the Period |
| | | December 17, 2013(a) |
| | | through |
| | | December 31, 2013 |
| Net asset value, beginning of period | | $12.80 |
| | | |
| From Investment Operations | | |
| Net investment income(b) | | 0.00(d) |
| Net realized and unrealized gain on investments and foreign currency transactions | | 0.56 |
| Net increase in net asset value from investment operations | | 0.56 |
| | | |
| Dividends to Shareholders | | |
| Dividends from net investment income | | (0.34) |
| | | |
| Proceeds from Purchase Premiums and Redemption Fees(b) | | 0.00(d) |
| | | |
| Net asset value, end of period | | $13.02 |
| | | |
| Total Return | | |
| Total investment return based on net asset value(c) | | 4.39% |
| | | |
| Ratios/Supplemental Data | | |
| Net assets, end of period (000’s omitted) | | $19,995 |
| Ratio of net expenses to average net assets | | 0.27%* |
| Ratio of net investment income to average net assets | | 0.61%* |
| Portfolio turnover rate | | 25% |
| * | Annualized. |
| (a) | Commencement of investment operations. |
| (b) | Calculated based upon average shares outstanding during the period. |
| (c) | Total investment return is calculated assuming an initial investment made at the net asset value at the beginning of the period, reinvestment of all dividends and distributions, if any, at net asset value during the period, and redemption on the last day of the period. Total return is not annualized for periods less than one year. |
| (d) | Amount is less than $0.005 per share. |
The accompanying notes are an integral part of the financial statements.
| FINANCIAL HIGHLIGHTS | Baillie Gifford EAFE Choice Fund |
Selected data for a Class 2 Shares outstanding throughout each period:
| | | | | | | | | | | For the Period |
| | | For the | | For the | | For the | | For the | | December 17, 2009(a) |
| | | Year Ended | | Year Ended | | Year Ended | | Year Ended | | through |
| | | December 31, 2013 | | December 31, 2012 | | December 31, 2011 | | December 31, 2010 (b) | | December 31, 2009 |
| Net asset value, beginning of period | | $11.19 | | $9.45 | | $11.24 | | $10.15 | | $10.00 |
| | | | | | | | | | | |
| From Investment Operations | | | | | | | | | | |
| Net investment income(c) | | 0.17 | | 0.23 | | 0.21 | | 0.13 | | 0.00(d) |
| Net realized and unrealized gain (loss) on investments and foreign currency transactions | | 2.19 | | 1.83 | | (1.64) | | 1.37 | | 0.15 |
| Net increase (decrease) in net asset value from investment operations | | 2.36 | | 2.06 | | (1.43) | | 1.50 | | 0.15 |
| | | | | | | | | | | |
| Change in NAV During Period of Inactivity(b) | | - | | - | | - | | (0.28) | | - |
| | | | | | | | | | | |
| Dividends and Distributions to Shareholders | | | | | | | | | | |
| Dividends from net investment income | | (0.43) | | (0.32) | | (0.21) | | (0.14) | | (0.00)(d) |
| Distributions from net realized gain on investments | | - | | - | | (0.17) | | - | | - |
| Total Dividends and Distributions | | (0.43) | | (0.32) | | (0.38) | | (0.14) | | (0.00)(d) |
| | | | | | | | | | | |
| Proceeds from Purchase Premiums and Redemption Fees(c) | | 0.01 | | 0.00(d) | | 0.02 | | 0.01 | | - |
| | | | | | | | | | | |
| Net asset value, end of period | | $13.13 | | $11.19 | | $9.45 | | $11.24 | | $10.15 |
| | | | | | | | | | | |
| Total Return | | | | | | | | | | |
Total investment return based on net asset
value(e) | | 21.20% | | 21.81% | | (12.54)% | | 15.22% | | 1.52% |
| | | | | | | | | | | |
| Ratios/Supplemental Data | | | | | | | | | | |
| Net assets, end of period (000’s omitted) | | $94,942 | | $156,038 | | $115,242 | | $46,487 | | $30,454 |
| Ratio of net expenses to average net assets | | 0.67% | | 0.64% | | 0.65% | | 0.71%* | | 0.82%* |
| Ratio of net investment income to average net assets | | 1.41% | | 2.23% | | 1.97% | | 1.53%* | | 0.41%* |
| Portfolio turnover rate | | 25% | | 21% | | 46% | | 20% | | 0% |
| * | Annualized. |
| (a) | Commencement of investment operations. |
| (b) | For the periods January 1, 2010 to January 15, 2010 and March 25, 2010 to December 31, 2010. Class had no shareholders from January 16, 2010 to March 24, 2010. All shares of this class were redeemed at $10.48 on January 15, 2010. New shares were issued at $10.20 on March 25, 2010. |
| (c) | Calculated based upon average shares outstanding during the period. |
| (d) | Amount is less than $0.005 per share. |
| (e) | Total investment return is calculated assuming an initial investment made at the net asset value at the beginning of the period, reinvestment of all dividends and distributions, if any, at net asset value during the period, and redemption on the last day of the period. Total return is not annualized for periods less than one year. |
The accompanying notes are an integral part of the financial statements.
| INDUSTRY DIVERSIFICATION TABLE | |
| December 31, 2013 (unaudited) | Baillie Gifford Emerging Markets Fund |
| | | Value | | | % of Total
Net Assets | |
| | | | | | | | | |
| Aerospace/Defense | | $ | 4,980,402 | | | | 1.4 | % |
| Auto Manufacturers | | | 19,068,010 | | | | 5.2 | |
| Automobiles & Parts | | | 3,005,497 | | | | 0.8 | |
| Banks | | | 21,722,764 | | | | 5.9 | |
| Beverages | | | 1,562,907 | | | | 0.4 | |
| Broadcasting & Entertainment | | | 3,657,210 | | | | 1.0 | |
| Commercial Vehicles & Trucks | | | 4,431,817 | | | | 1.2 | |
| Commodity Chemicals | | | 5,319,057 | | | | 1.4 | |
| Computers | | | 4,210,501 | | | | 1.1 | |
| Construction & Building Materials | | | 3,796,247 | | | | 1.0 | |
| Diversified Financial Services | | | 10,039,926 | | | | 2.7 | |
| Diversified Industrials | | | 3,297,445 | | | | 0.9 | |
| Electronic & Electrical Equipment | | | 34,538,237 | | | | 9.4 | |
| Energy - Alternate Sources | | | 4,280,413 | | | | 1.2 | |
| Exploration & Production | | | 5,315,351 | | | | 1.4 | |
| Food Producers & Processors | | | 9,212,083 | | | | 2.5 | |
| Healthcare-Products | | | 4,330,258 | | | | 1.2 | |
| Heavy Construction | | | 2,546,298 | | | | 0.7 | |
| Household Goods | | | 6,667,855 | | | | 1.8 | |
| Insurance | | | 20,617,001 | | | | 5.6 | |
| Internet | | | 33,832,088 | | | | 9.2 | |
| Investment Companies | | | 2,396,366 | | | | 0.7 | |
| Leisure Goods | | | 556,834 | | | | 0.2 | |
| Media & Photography | | | 7,322,922 | | | | 2.0 | |
| Mobile Telecommunications | | | 3,610,848 | | | | 1.0 | |
| Oil & Gas | | | 47,915,273 | | | | 13.0 | |
| Real Estate | | | 3,683,411 | | | | 1.0 | |
| Retailers - General | | | 12,692,967 | | | | 3.4 | |
| Semiconductors | | | 34,746,653 | | | | 9.4 | |
| Software | | | 24,097,107 | | | | 6.5 | |
| Technology Hardware/Equipment | | | 7,164,491 | | | | 1.9 | |
| Telecommunication Services | | | 6,317,502 | | | | 1.7 | |
| Transportation | | | 9,214,726 | | | | 2.5 | |
| Travel & Tourism | | | 920,591 | | | | 0.3 | |
| | | | | | | | | |
| Total Value of Investments | | | 367,071,058 | | | | 99.6 | |
| Other assets less liabilities | | | 1,363,730 | | | | 0.4 | |
| Net Assets | | $ | 368,434,788 | | | | 100.0 | % |
| PORTFOLIO OF INVESTMENTS | |
| December 31, 2013 | Baillie Gifford Emerging Markets Fund |
| | | Shares | | | Value | |
| | | | | | | | | |
| COMMON STOCKS - 96.4% | | | | | | | | |
| ARGENTINA - 1.5% | | | | | | | | |
| Arcos Dorados Holdings, Inc., Class A | | | 189,713 | | | $ | 2,299,322 | |
| MercadoLibre, Inc. | | | 30,100 | | | | 3,244,479 | |
| | | | | | | | 5,543,801 | |
| AUSTRALIA - 0.1% | | | | | | | | |
| African Petroleum Corp., Ltd. (a) | | | 5,211,000 | | | | 372,231 | |
| | | | | | | | | |
| BRAZIL - 2.9% | | | | | | | | |
| Embraer SA ADR | | | 154,767 | | | | 4,980,402 | |
| JBS SA | | | 1,506,100 | | | | 5,609,640 | |
| | | | | | | | 10,590,042 | |
| CAYMAN ISLANDS - 1.4% | | | | | | | | |
| GCL-Poly Energy Holdings Ltd. (a) | | | 13,767,000 | | | | 4,280,413 | |
| Qunar Cayman Islands Ltd. ADR (a) | | | 34,700 | | | | 920,591 | |
| | | | | | | | 5,201,004 | |
| CHILE - 0.4% | | | | | | | | |
| Cia Cervecerias Unidas SA ADR | | | 64,824 | | | | 1,562,907 | |
| | | | | | | | | |
| CHINA - 21.1% | | | | | | | | |
| Beijing Enterprises Holdings Ltd. | | | 303,000 | | | | 3,009,784 | |
| China Mobile Ltd. | | | 606,500 | | | | 6,317,502 | |
| China Petroleum & Chemical Corp., Class H | | | 12,946,000 | | | | 10,622,532 | |
| China Taiping Insurance Holdings Co., Ltd. (a) | | | 1,058,000 | | | | 2,166,162 | |
| CNOOC Ltd. | | | 3,270,000 | | | | 6,081,473 | |
| Dongfeng Motor Group Co., Ltd., Class H | | | 1,214,000 | | | | 1,906,560 | |
| Geely Automobile Holdings Ltd. | | | 6,190,000 | | | | 3,005,497 | |
| Haier Electronics Group Co., Ltd. | | | 2,294,300 | | | | 6,667,855 | |
| Hang Lung Properties Ltd. | | | 1,162,000 | | | | 3,683,411 | |
| Hengan International Group Co., Ltd. | | | 366,000 | | | | 4,330,258 | |
| Kunlun Energy Co., Ltd. | | | 2,064,000 | | | | 3,648,430 | |
| Lenovo Group Ltd. | | | 3,454,000 | | | | 4,210,501 | |
| Sohu.com, Inc. (a) | | | 87,872 | | | | 6,408,505 | |
| Tencent Holdings Ltd. | | | 134,000 | | | | 8,579,681 | |
| Want Want China Holdings Ltd. | | | 2,489,000 | | | | 3,602,443 | |
| Youku Tudou, Inc. ADR (a) | | | 120,700 | | | | 3,657,210 | |
| | | | | | | | 77,897,804 | |
| EGYPT - 0.9% | | | | | | | | |
| Commercial International Bank Egypt SAE | | | 329,457 | | | | 1,561,045 | |
| Egyptian Financial Group - Hermes Holding SAE (a) | | | 1,495,831 | | | | 1,903,074 | |
| | | | | | | | 3,464,119 | |
| GUERNSEY - 0.1% | | | | | | | | |
| Chariot Oil & Gas Ltd. (a) | | | 844,099 | | | | 265,581 | |
| | | | | | | | | |
| INDIA - 13.3% | | | | | | | | |
| Axis Bank Ltd. | | | 87,358 | | | | 1,842,045 | |
| HCL Technologies Ltd. | | | 454,976 | | | | 9,296,479 | |
| Housing Development Finance Corp. | | | 294,300 | | | | 3,789,280 | |
| IDFC, Ltd. | | | 1,347,802 | | | | 2,396,366 | |
| Mahindra & Mahindra Ltd. | | | 459,124 | | | | 7,016,256 | |
| Oracle Financial Services Software Ltd. (a) | | | 24,800 | | | | 1,322,353 | |
| Reliance Industries Ltd. | | | 466,600 | | | | 6,763,369 | |
| Shriram Transport Finance Co. Ltd. | | | 289,200 | | | | 3,149,283 | |
| Tech Mahindra Ltd. | | | 453,160 | | | | 13,478,275 | |
| | | | | | | | 49,053,706 | |
The accompanying notes are an integral part of the financial statements.
| PORTFOLIO OF INVESTMENTS (continued) | |
| December 31, 2013 | Baillie Gifford Emerging Markets Fund |
| | | Shares | | | Value | |
| | | | | | | | | |
| MALAYSIA - 1.5% | | | | | | | | |
| Public Bank Bhd | | | 231,600 | | | $ | 1,372,841 | |
| Public Bank Bhd - Foreign Market | | | 682,400 | | | | 4,070,858 | |
| | | | | | | | 5,443,699 | |
| MEXICO - 2.3% | | | | | | | | |
| Cemex SAB de CV ADR, Participating Certificates (a) | | | 320,900 | | | | 3,796,247 | |
| Corp. GEO SAB de CV (a) * | | | 3,528,000 | | | | 0 | |
| Wal-Mart de Mexico SAB de CV, Series V | | | 1,751,660 | | | | 4,596,321 | |
| | | | | | | | 8,392,568 | |
| PANAMA - 1.4% | | | | | | | | |
| Copa Holdings SA, Class A | | | 31,166 | | | | 4,989,988 | |
| | | | | | | | | |
| RUSSIA - 2.4% | | | | | | | | |
| Sberbank of Russia ADR | | | 694,137 | | | | 8,757,587 | |
| | | | | | | | | |
| SOUTH AFRICA - 2.5% | | | | | | | | |
| Africa Oil Corp. (a) | | | 197,648 | | | | 1,717,384 | |
| Naspers Ltd., N Shares | | | 69,959 | | | | 7,322,922 | |
| | | | | | | | 9,040,306 | |
| SOUTH KOREA - 24.2% | | | | | | | | |
| Cheil Industries, Inc. (a) | | | 39,260 | | | | 3,297,445 | |
| Daelim Industrial Co., Ltd. (a) | | | 28,500 | | | | 2,546,298 | |
| Daum Communications Corp. (a) | | | 38,302 | | | | 3,051,243 | |
| E-Mart Co., Ltd. | | | 17,364 | | | | 4,391,474 | |
| Fila Korea Ltd. | | | 18,765 | | | | 1,405,850 | |
| Hankook Tire Co., Ltd. (a) | | | 33,802 | | | | 1,947,705 | |
| Hyundai Glovis Co., Ltd. | | | 19,277 | | | | 4,224,738 | |
| Hyundai Marine & Fire Insurance Co., Ltd. | | | 125,360 | | | | 3,862,229 | |
| Hyundai Mipo Dockyard | | | 26,200 | | | | 4,431,817 | |
| Hyundai Mobis (a) | | | 12,996 | | | | 3,618,138 | |
| Hyundai Wia Corp. | | | 25,375 | | | | 4,579,351 | |
| LG Chem Ltd. (a) | | | 18,700 | | | | 5,319,057 | |
| NAVER Corp. | | | 13,778 | | | | 9,494,801 | |
| NCSoft Corp. | | | 12,940 | | | | 3,053,379 | |
| NHN Entertainment Corp. (a) | | | 6,096 | | | | 556,834 | |
| Samsung Electronics Co., Ltd. | | | 10,544 | | | | 13,739,331 | |
| Samsung Fire & Marine Insurance Co., Ltd. | | | 19,297 | | | | 4,741,901 | |
| SK Hynix, Inc. (a) | | | 328,400 | | | | 11,486,630 | |
| SK Telecom Co., Ltd. | | | 16,500 | | | | 3,610,848 | |
| | | | | | | | 89,359,069 | |
| TAIWAN - 14.8% | | | | | | | | |
| Advanced Semiconductor Engineering, Inc. | | | 3,851,000 | | | | 3,597,582 | |
| Advantech Co., Ltd. | | | 315,000 | | | | 2,185,461 | |
| Asustek Computer, Inc. | | | 289,000 | | | | 2,602,754 | |
| China Life Insurance Co., Ltd. | | | 9,683,232 | | | | 9,846,709 | |
| Delta Electronics, Inc. | | | 1,004,000 | | | | 5,749,395 | |
| Hon Hai Precision Industry Co., Ltd. | | | 3,103,622 | | | | 8,371,406 | |
| MediaTek, Inc. | | | 277,000 | | | | 4,128,654 | |
| Novatek Microelectronics Corp. | | | 495,000 | | | | 2,030,761 | |
| Phison Electronics Corp. | | | 54,000 | | | | 345,515 | |
| Taiwan Semiconductor Manufacturing Co., Ltd. ADR | | | 4,399,310 | | | | 15,533,787 | |
| | | | | | | | 54,392,024 | |
| TURKMENISTAN - 4.2% | | | | | | | | |
| Dragon Oil Plc. | | | 1,642,004 | | | | 15,434,489 | |
The accompanying notes are an integral part of the financial statements.
| PORTFOLIO OF INVESTMENTS (concluded) | |
| December 31, 2013 | Baillie Gifford Emerging Markets Fund |
| | | Shares | | | Value | |
| | | | | | | | | |
| UNITED KINGDOM - 1.4% | | | | | | | | |
| Tullow Oil Plc. | | | 374,514 | | | $ | 5,315,351 | |
| | | | | | | | | |
Total Common Stocks
(cost $277,551,847) | | | | | | | 355,076,276 | |
| | | | | | | | | |
| PREFERRED STOCKS - 3.2% | | | | | | | | |
| BRAZIL - 1.4% | | | | | | | | |
| Banco Bradesco SA | | | 333,081 | | | | 4,118,388 | |
| Itausa - Investimentos Itau SA | | | 317,182 | | | | 1,198,289 | |
| | | | | | | | 5,316,677 | |
| SOUTH KOREA - 1.8% | | | | | | | | |
| Samsung Electronics Co., Ltd. | | | 6,944 | | | | 6,678,105 | |
| | | | | | | | | |
Total Preferred Stocks
(cost $7,217,673) | | | | | | | 11,994,782 | |
| | | | | | | | | |
TOTAL INVESTMENTS - 99.6%
(cost $284,769,521) | | | | | | | 367,071,058 | |
| Other assets less liabilities - 0.4% | | | | | | | 1,363,730 | |
| NET ASSETS - 100.0% | | | | | | $ | 368,434,788 | |
| (a) | Non-income producing security. |
| * | Security is being fair valued by the Advisor’s valuation committee. |
ADR - American Depositary Receipt.
The accompanying notes are an integral part of the financial statements.
| STATEMENT OF ASSETS AND LIABILITIES | |
| December 31, 2013 | Baillie Gifford Emerging Markets Fund |
| ASSETS | | | | |
| Investments, at value (cost $284,769,521) | | $ | 367,071,058 | |
| Cash | | | 1,545,531 | |
| Foreign cash, at value (cost $780,814) | | | 822,025 | |
| Receivable for Indian capital gains tax refund | | | 211,189 | |
| Dividends receivable | | | 136,768 | |
| Interest receivable | | | 9,940 | |
| Total Assets | | | 369,796,511 | |
| | | | | |
| LIABILITIES | | | | |
| Management fee payable | | | 455,439 | |
| Payable for deferred Indian capital gains tax | | | 645,927 | |
| Servicing fee payable | | | 109,789 | |
| Trustee fee payable | | | 2,571 | |
| Accrued expenses | | | 147,997 | |
| Total Liabilities | | | 1,361,723 | |
| | | | | |
| NET ASSETS | | $ | 368,434,788 | |
| | | | | |
| COMPOSITION OF NET ASSETS | | | | |
| Paid-in capital | | $ | 300,982,763 | |
| Undistributed net investment income | | | 239,528 | |
Accumulated net realized loss on investments and foreign currency transactions
(net of deferred Indian capital gains tax) | | | (14,449,415 | ) |
Net unrealized appreciation in value of investments and foreign currencies
(net of deferred Indian capital gains tax) | | | 81,661,912 | |
| | | $ | 368,434,788 | |
| | | | | |
| NET ASSET VALUE, PER SHARE | | | | |
| | | | |
Class II ($51,028,619 / 3,089,041 shares outstanding),
unlimited authorized, no par value | | $ | 16.52 | |
| Maximum Purchase Price Per Share (Note D) | | $ | 16.61 | |
| Minimum Redemption Price Per Share (Note D) | | $ | 16.48 | |
| | | | | |
Class III ($317,406,169 / 18,961,677 shares outstanding),
unlimited authorized, no par value | | $ | 16.74 | |
| Maximum Purchase Price Per Share (Note D) | | $ | 16.83 | |
| Minimum Redemption Price Per Share (Note D) | | $ | 16.70 | |
The accompanying notes are an integral part of the financial statements.
| STATEMENT OF OPERATIONS | |
| For the Year Ended December 31, 2013 | Baillie Gifford Emerging Markets Fund |
| INVESTMENT INCOME | | | | |
| Dividends (net of foreign withholding taxes of $867,891) | | $ | 6,653,922 | |
| Interest (net of foreign tax of $5,352) | | | 9,954 | |
| Total Investment Income | | | 6,663,876 | |
| | | | | |
| EXPENSES | | | | |
| Management fee (Note B) | | | 2,035,074 | |
| Shareholder Servicing fees - Class II Shares (Note B) | | | 86,711 | |
| Shareholder Servicing fees - Class III Shares (Note B) | | | 372,347 | |
| Fund Accounting | | | 254,972 | |
| Custody | | | 215,350 | |
| Legal | | | 42,212 | |
| Transfer Agency | | | 13,559 | |
| Professional fees | | | 11,996 | |
| Trustees’ fees | | | 9,804 | |
| Insurance | | | 8,438 | |
| Miscellaneous | | | 6,454 | |
| Total Expenses | | | 3,056,917 | |
| | | | | |
| Net Investment Income | | | 3,606,959 | |
| | | | | |
REALIZED AND UNREALIZED GAIN (LOSS) ON INVESTMENTS
AND FOREIGN CURRENCY TRANSACTIONS | | | | |
| Net realized gain (loss) from: | | | | |
| Investments (net of Indian capital gains tax $62,604) | | | 1,339,663 | |
| Foreign currency transactions | | | (623,218 | ) |
| | | | 716,445 | |
| | | | | |
| Net change in unrealized appreciation (depreciation) on: | | | | |
| Investments (net of deferred Indian capital gains tax of $256,846) | | | 3,153,346 | |
| Translation of assets and liabilities in foreign currencies | | | 19,251 | |
| | | | 3,172,597 | |
| | | | | |
| Net realized and unrealized gain on investments and foreign currency transactions | | | 3,889,042 | |
| NET INCREASE IN NET ASSETS FROM OPERATIONS | | $ | 7,496,001 | |
The accompanying notes are an integral part of the financial statements.
| STATEMENTS OF CHANGES IN NET ASSETS | Baillie Gifford Emerging Markets Fund |
| | | For the | | | For the | |
| | | Year Ended | | | Year Ended | |
| | | December 31, 2013 | | | December 31, 2012 | |
| | | | | | | | | |
| INCREASE (DECREASE) IN NET ASSETS FROM OPERATIONS | | | | | | | | |
| Net investment income | | $ | 3,606,959 | | | $ | 4,915,752 | |
| Net realized gain (loss) from investments and foreign currency transactions | | | 716,445 | | | | (309,678 | ) |
| Net change in unrealized appreciation (depreciation) on investments and translation of assets and liabilities in foreign currencies | | | 3,172,597 | | | | 47,688,898 | |
| Net increase in net assets from operations | | | 7,496,001 | | | | 52,294,972 | |
| | | | | | | | | |
| DIVIDENDS TO SHAREHOLDERS FROM: | | | | | | | | |
| Net investment income: | | | | | | | | |
| Class II | | | (880,017 | ) | | | - | |
| Class III | | | (5,538,846 | ) | | | (5,972,731 | ) |
| Total Dividends | | | (6,418,863 | ) | | | (5,972,731 | ) |
| | | | | | | | | |
| TRANSACTIONS IN SHARES OF BENEFICIAL INTEREST | | | | | | | | |
| Net proceeds from shares subscribed: | | | | | | | | |
| Class II | | | 47,294,135 | | | | 47,197,419 | |
| Class III | | | - | | | | 144,762,741 | |
| Purchase premiums: | | | | | | | | |
| Class II | | | - | | | | 12,799 | |
| Class III | | | - | | | | 512,451 | |
| Redemption fees: | | | | | | | | |
| Class II | | | 34,688 | | | | - | |
| Class III | | | 285,790 | | | | 77,647 | |
| Dividends reinvested: | | | | | | | | |
| Class II | | | 880,017 | | | | - | |
| Class III | | | 4,102,273 | | | | 5,972,731 | |
| Cost of shares redeemed: | | | | | | | | |
| Class II | | | - | | | | (49,787,991 | ) |
| Class III | | | (175,485,293 | ) | | | (78,256,316 | ) |
| | | | | | | | | |
| Increase (Decrease) in Net Assets from Transactions in Shares of Beneficial Interest | | | (122,888,390 | ) | | | 70,491,481 | |
| | | | | | | | | |
| Total Increase (Decrease) in Net Assets | | | (121,811,252 | ) | | | 116,813,722 | |
| | | | | | | | | |
| NET ASSETS | | | | | | | | |
| Beginning of year | | | 490,246,040 | | | | 373,432,318 | |
| End of year (including undistributed net investment income of $239,528 and $3,712,091, respectively) | | $ | 368,434,788 | | | $ | 490,246,040 | |
The accompanying notes are an integral part of the financial statements.
| FINANCIAL HIGHLIGHTS | Baillie Gifford Emerging Markets Fund |
| | Selected data for a Class II Shares outstanding throughout the period: | | |
| | | | |
| | | | For the Period |
| | | | April 9, 2013(a) |
| | | | through |
| | | | December 31, 2013 |
| | Net asset value, beginning of period | | $15.60 |
| | | | |
| | From Investment Operations | | |
| | Net investment income(b) | | 0.10 |
| | Net realized and unrealized gain on investments and foreign currency transactions | | 1.10 |
| | Net increase in net asset value from investment operations | | 1.20 |
| | | | |
| | Dividends to Shareholders | | |
| | Dividends from net investment income | | (0.29) |
| | | | |
| | Proceeds from Redemption Fees(b) | | 0.01 |
| | | | |
| | Net asset value, end of period | | $16.52 |
| | | | |
| | Total Return | | |
| | Total investment return based on net asset value(c) | | 7.90% |
| | | | |
| | Ratios/Supplemental Data | | |
| | Net assets, end of period (000’s omitted) | | $51,029 |
| | Ratio of net expenses to average net assets | | 0.89%* |
| | Ratio of net investment income to average net assets | | 0.90%* |
| | Portfolio turnover rate | | 33% |
| * | Annualized. |
| (a) | Commencement of investment operations. |
| (b) | Calculated based upon average shares outstanding during the period. |
| (c) | Total investment return is calculated assuming an initial investment made at the net asset value at the beginning of the period, reinvestment of all dividends and distributions, if any, at net asset value during the period, and redemption on the last day of the period. Total return is not annualized for periods less than one year. |
The accompanying notes are an integral part of the financial statements.
| FINANCIAL HIGHLIGHTS (concluded) | Baillie Gifford Emerging Markets Fund |
Selected data for a Class III Shares outstanding throughout each year:
| | | | For the | | For the | | For the | | For the | | For the |
| | | | Year Ended | | Year Ended | | Year Ended | | Year Ended | | Year Ended |
| | | | December 31, 2013 | | December 31, 2012 | | December 31, 2011 | | December 31, 2010 | | December 31, 2009 |
| | Net asset value, beginning of year | | $16.40 | | $14.60 | | $18.71 | | $16.49 | | $8.47 |
| | | | | | | | | | | | |
| | From Investment Operations | | | | | | | | | | |
| | Net investment income(a) | | 0.14 | | 0.19 | | 0.18 | | 0.13 | | 0.09 |
| | Net realized and unrealized gain (loss) on investments and foreign currency transactions | | 0.48 | | 1.82 | | (3.94) | | 3.09 | | 8.21 |
| Net increase (decrease) in net asset value from investment operations | | 0.62 | | 2.01 | | (3.76) | | 3.22 | | 8.30 |
| | | | | | | | | | | | |
| | Dividends and Distributions to Shareholders | | | | | | | | | | |
| | Dividends from net investment income | | (0.29) | | (0.23) | | - | | (0.52) | | (0.29) |
| | Distributions from net realized gain on investments | | - | | - | | (0.35) | | (0.49) | | - |
| | Total Dividends and Distributions | | (0.29) | | (0.23) | | (0.35) | | (1.01) | | (0.29) |
| | | | | | | | | | | | |
| | Proceeds from Purchase Premiums and Redemption
Fees(a) | | 0.01 | | 0.02 | | 0.00(b) | | 0.01 | | 0.01 |
| | | | | | | | | | | | |
| | Net asset value, end of year | | $16.74 | | $16.40 | | $14.60 | | $18.71 | | $16.49 |
| | | | | | | | | | | | |
| | Total Return | | | | | | | | | | |
| | Total investment return based on net asset value(c) | | 3.98% | | 13.94% | | (20.20)% | | 19.73% | | 98.09% |
| | | | | | | | | | | | |
| | Ratios/Supplemental Data | | | | | | | | | | |
| | Net assets, end of year (000’s omitted) | | $317,406 | | $490,246 | | $373,432 | | $468,654 | | $216,394 |
| | Ratio of net expenses to average net assets | | 0.74% | | 0.75% | | 0.73% | | 0.79% | | 0.80% |
| | Ratio of net investment income to average net assets | | 0.88% | | 1.18% | | 1.05% | | 0.75% | | 0.76% |
| | Portfolio turnover rate | | 33% | | 51% | | 41% | | 40% | | 56% |
| (a) | Calculated based upon average shares outstanding during the year. |
| (b) | Rounds to less than $0.005 per share. |
| (c) | Total investment return is calculated assuming an initial investment made at the net asset value at the beginning of the period, reinvestment of all dividends and distributions, if any, at net asset value during the period, and redemption on the last day of the period. Total return is not annualized for periods less than one year. |
The accompanying notes are an integral part of the financial statements.
| INDUSTRY DIVERSIFICATION TABLE | |
| December 31, 2013 (unaudited) | Baillie Gifford Global Alpha Equity Fund |
| | | Value | | | % of Total
Net Assets | |
| | | | | | | |
| Aerospace | | $ | 7,015,145 | | | | 1.7 | % |
| Airlines | | | 6,008,448 | | | | 1.4 | |
| Auto Manufacturers | | | 6,750,608 | | | | 1.6 | |
| Banks | | | 38,463,678 | | | | 9.2 | |
| Beverages, Food & Tobacco | | | 18,203,545 | | | | 4.4 | |
| Biotechnology | | | 6,319,154 | | | | 1.5 | |
| Chemicals | | | 3,352,694 | | | | 0.8 | |
| Commercial Services | | | 31,472,594 | | | | 7.5 | |
| Computer Services | | | 328,661 | | | | 0.1 | |
| Construction & Building Materials | | | 1,425,253 | | | | 0.3 | |
| Diversified Financial Services | | | 18,538,696 | | | | 4.4 | |
| Diversified Industrials | | | 3,038,347 | | | | 0.7 | |
| Electronic & Electrical Equipment | | | 16,079,981 | | | | 3.8 | |
| Engineering & Machinery | | | 22,936,014 | | | | 5.5 | |
| Exploration & Production | | | 1,758,187 | | | | 0.4 | |
| Food Producers & Processors | | | 7,380,456 | | | | 1.8 | |
| Healthcare - Products | | | 10,119,838 | | | | 2.4 | |
| Healthcare - Services | | | 3,666,035 | | | | 0.9 | |
| Industrial Suppliers | | | 5,491,079 | | | | 1.3 | |
| Insurance | | | 26,354,506 | | | | 6.3 | |
| Internet | | | 37,398,485 | | | | 8.9 | |
| Investment Companies | | | 4,233,607 | | | | 1.0 | |
| Investment Services | | | 2,430,242 | | | | 0.6 | |
| Machinery - Diversified | | | 2,754,239 | | | | 0.7 | |
| Media & Photography | | | 20,246,030 | | | | 4.8 | |
| Mining & Metals | | | 1,611,356 | | | | 0.4 | |
| Motorcycles | | | 11,303,967 | | | | 2.7 | |
| Oil & Gas | | | 20,212,753 | | | | 4.8 | |
| Personal Goods | | | 3,990,604 | | | | 1.0 | |
| Pharmaceuticals | | | 8,980,848 | | | | 2.1 | |
| Pharmaceuticals, Biotechnology & Life Sciences | | | 1,332,230 | | | | 0.3 | |
| Retailers - General | | | 13,041,263 | | | | 3.1 | |
| Semiconductors | | | 24,830,410 | | | | 5.9 | |
| Soft Drinks | | | 5,656,413 | | | | 1.4 | |
| Software | | | 1,524,870 | | | | 0.4 | |
| Technology Hardware & Equipment | | | 4,261,950 | | | | 1.0 | |
| Telecommunication Services | | | 2,734,286 | | | | 0.7 | |
| Toys/Games/Hobbies | | | 3,234,902 | | | | 0.8 | |
| Travel & Leisure | | | 8,894,569 | | | | 2.1 | |
| | | | | | | | | |
| Total Value of Investments | | | 413,375,943 | | | | 98.7 | |
| Other assets less liabilities | | | 5,341,052 | | | | 1.3 | |
| Net Assets | | $ | 418,716,995 | | | | 100.0 | % |
| PORTFOLIO OF INVESTMENTS | |
| December 31, 2013 | Baillie Gifford Global Alpha Equity Fund |
| | | Shares | | | Value | |
| | | | | | | |
| COMMON STOCKS - 98.3% | | | | | | |
| ARGENTINA - 0.4% | | | | | | |
| Arcos Dorados Holdings, Inc., Class A | | | 144,818 | | | $ | 1,755,194 | |
| | | | | | | | | |
| AUSTRALIA - 1.0% | | | | | | | | |
| Brambles Ltd. | | | 453,305 | | | | 3,713,892 | |
| Recall Holdings Ltd. (a) | | | 90,661 | | | | 328,661 | |
| | | | | | | | 4,042,553 | |
| BRAZIL - 0.6% | | | | | | | | |
| BM&F Bovespa SA | | | 535,700 | | | | 2,512,729 | |
| | | | | | | | | |
| CANADA - 2.8% | | | | | | | | |
| Fairfax Financial Holdings Ltd. | | | 11,147 | | | | 4,459,469 | |
| Ritchie Bros. Auctioneers, Inc. | | | 104,648 | | | | 2,399,579 | |
| Ultra Petroleum Corp. (a) | | | 216,717 | | | | 4,691,923 | |
| | | | | | | | 11,550,971 | |
| CHINA - 5.1% | | | | | | | | |
| Baidu, Inc. ADR (a) | | | 31,800 | | | | 5,656,584 | |
| China Mobile Ltd. | | | 262,500 | | | | 2,734,286 | |
| China Resources Enterprise Ltd. | | | 1,138,000 | | | | 3,785,854 | |
| Mindray Medical International Ltd. ADR | | | 118,576 | | | | 4,311,423 | |
| Shandong Weigao Group Medical Polymer Co., Ltd., Class H | | | 1,880,000 | | | | 2,544,010 | |
| Tsingtao Brewery Co., Ltd., Class H | | | 288,000 | | | | 2,440,616 | |
| | | | | | | | 21,472,773 | |
| DENMARK - 1.8% | | | | | | | | |
| Carlsberg A/S, B Shares | | | 42,836 | | | | 4,739,965 | |
| Jyske Bank A/S (a) | | | 48,939 | | | | 2,646,105 | |
| | | | | | | | 7,386,070 | |
| GERMANY - 0.8% | | | | | | | | |
| Deutsche Boerse AG | | | 41,102 | | | | 3,406,300 | |
| | | | | | | | | |
| GREECE - 1.4% | | | | | | | | |
| Coca-Cola HBC AG | | | 193,912 | | | | 5,656,413 | |
| | | | | | | | | |
| INDIA - 0.8% | | | | | | | | |
| ICICI Bank Ltd. ADR | | | 86,000 | | | | 3,196,620 | |
| | | | | | | | | |
| INDONESIA - 0.2% | | | | | | | | |
| PT Bank Negara Indonesia Persero Tbk | | | 3,029,000 | | | | 986,620 | |
| | | | | | | | | |
| IRELAND - 2.3% | | | | | | | | |
| Bank of Ireland (a) | | | 6,345,648 | | | | 2,210,318 | |
| CRH Plc. | | | 56,128 | | | | 1,425,253 | |
| Ryanair Holdings Plc. ADR (a) | | | 128,030 | | | | 6,008,448 | |
| | | | | | | | 9,644,019 | |
The accompanying notes are an integral part of the financial statements.
| PORTFOLIO OF INVESTMENTS (continued) | |
| December 31, 2013 | Baillie Gifford Global Alpha Equity Fund |
| | | Shares | | | Value | |
| | | | | | | |
| JAPAN - 7.3% | | | | | | |
| Inpex Corp. | | | 288,400 | | | $ | 3,699,068 | |
| Japan Exchange Group, Inc. | | | 85,500 | | | | 2,430,242 | |
| Namco Bandai Holdings, Inc. | | | 145,700 | | | | 3,234,902 | |
| Olympus Corp. (a) | | | 93,200 | | | | 2,956,000 | |
| Rohm Co., Ltd. | | | 46,300 | | | | 2,258,378 | |
| SMC Corp. | | | 16,300 | | | | 4,113,933 | |
| THK Co., Ltd. | | | 162,600 | | | | 4,061,026 | |
| Tokyo Electron Ltd. | | | 69,500 | | | | 3,829,639 | |
| Yamaha Motor Co., Ltd. | | | 267,400 | | | | 4,020,196 | |
| | | | | | | | 30,603,384 | |
| NETHERLANDS - 0.5% | | | | | | | | |
| QIAGEN NV (a) | | | 93,000 | | | | 2,214,330 | |
| | | | | | | | | |
| NORWAY - 1.1% | | | | | | | | |
| Norsk Hydro ASA | | | 360,198 | | | | 1,611,356 | |
| Schibsted ASA | | | 46,662 | | | | 3,092,325 | |
| | | | | | | | 4,703,681 | |
| RUSSIA - 0.4% | | | | | | | | |
| Sberbank of Russia ADR | | | 126,657 | | | | 1,597,969 | |
| | | | | | | | | |
| SINGAPORE - 0.7% | | | | | | | | |
| Jardine Matheson Holdings Ltd. | | | 58,000 | | | | 3,038,347 | |
| | | | | | | | | |
| SOUTH AFRICA - 2.7% | | | | | | | | |
| Naspers Ltd., N Shares | | | 108,783 | | | | 11,386,804 | |
| | | | | | | | | |
| SOUTH KOREA - 1.3% | | | | | | | | |
| Samsung Electronics Co., Ltd. GDR Reg S | | | 8,516 | | | | 5,572,374 | |
| | | | | | | | | |
| SPAIN - 0.5% | | | | | | | | |
| Distribuidora Internacional de Alimentacion SA | | | 229,327 | | | | 2,053,383 | |
| | | | | | | | | |
| SWEDEN - 5.0% | | | | | | | | |
| Atlas Copco AB, B Shares | | | 201,284 | | | | 5,116,905 | |
| Investor AB, B Shares | | | 122,843 | | | | 4,233,607 | |
| Svenska Handelsbanken AB, A Shares | | | 176,309 | | | | 8,668,553 | |
| Volvo AB, B Shares | | | 226,287 | | | | 2,977,574 | |
| | | | | | | | 20,996,639 | |
| SWITZERLAND - 6.1% | | | | | | | | |
| Compagnie Financiere Richemont SA | | | 39,947 | | | | 3,990,604 | |
| Nestle SA | | | 100,702 | | | | 7,380,456 | |
| Roche Holding AG - Genusschein | | | 32,060 | | | | 8,980,848 | |
| Schindler Holding AG, Participating Certificates | | | 35,148 | | | | 5,174,271 | |
| | | | | | | | 25,526,179 | |
| TAIWAN - 1.2% | | | | | | | | |
| Taiwan Semiconductor Manufacturing Co., Ltd. ADR | | | 288,900 | | | | 5,038,416 | |
| | | | | | | | | |
| TURKEY - 0.3% | | | | | | | | |
| Turkiye Garanti Bankasi A/S ADR | | | 424,078 | | | | 1,361,290 | |
| | | | | | | | | |
| TURKMENISTAN - 0.4% | | | | | | | | |
| Dragon Oil Plc. | | | 184,446 | | | | 1,733,753 | |
The accompanying notes are an integral part of the financial statements.
| PORTFOLIO OF INVESTMENTS (continued) | |
| December 31, 2013 | Baillie Gifford Global Alpha Equity Fund |
| | | Shares | | | Value | |
| | | | | | | |
| UNITED KINGDOM - 9.4% | | | | | | |
| Aggreko Plc. | | | 58,521 | | | $ | 1,659,701 | |
| British American Tobacco Plc. | | | 67,330 | | | | 3,613,896 | |
| Bunzl Plc. | | | 141,701 | | | | 3,405,244 | |
| Hays Plc. | | | 1,175,361 | | | | 2,531,682 | |
| Prudential Plc. | | | 623,157 | | | | 13,923,897 | |
| Rolls-Royce Holdings Plc. (a) | | | 331,662 | | | | 7,015,145 | |
| Tullow Oil Plc. | | | 123,880 | | | | 1,758,187 | |
| Wolseley Plc. | | | 96,583 | | | | 5,491,079 | |
| | | | | | | | 39,398,831 | |
| UNITED STATES - 44.2% | | | | | | | | |
| Altera Corp. | | | 64,677 | | | | 2,103,943 | |
| Amazon.com, Inc. (a) | | | 20,690 | | | | 8,250,965 | |
| Bed Bath & Beyond, Inc. (a) | | | 34,361 | | | | 2,759,188 | |
| CarMax, Inc. (a) | | | 100,830 | | | | 4,741,027 | |
| Deere & Co. | | | 30,157 | | | | 2,754,239 | |
| Dolby Laboratories, Inc., Class A (a) | | | 112,477 | | | | 4,337,113 | |
| eBay, Inc. (a) | | | 146,371 | | | | 8,034,304 | |
| EOG Resources, Inc. | | | 34,849 | | | | 5,849,056 | |
| Facebook, Inc., Class A (a) | | | 57,859 | | | | 3,162,573 | |
| First Republic Bank | | | 124,479 | | | | 6,516,476 | |
| FLIR Systems, Inc. | | | 154,876 | | | | 4,661,768 | |
| Google, Inc., Class A (a) | | | 7,425 | | | | 8,321,272 | |
| Harley-Davidson, Inc. | | | 105,196 | | | | 7,283,771 | |
| Illumina, Inc. (a) | | | 32,712 | | | | 3,618,601 | |
| Intuitive Surgical, Inc. (a) | | | 2,734 | | | | 1,050,075 | |
| Lincoln Electric Holdings, Inc. | | | 62,656 | | | | 4,469,879 | |
| M&T Bank Corp. | | | 56,034 | | | | 6,523,478 | |
| Markel Corp. (a) | | | 9,908 | | | | 5,750,108 | |
| Mastercard, Inc., Class A | | | 11,596 | | | | 9,687,994 | |
| Moody’s Corp. | | | 91,196 | | | | 7,156,150 | |
| Myriad Genetics, Inc. (a) | | | 63,500 | | | | 1,332,230 | |
| National Oilwell Varco, Inc. | | | 33,573 | | | | 2,670,061 | |
| New York Community Bancorp, Inc. | | | 282,270 | | | | 4,756,249 | |
| PepsiCo, Inc. | | | 64,573 | | | | 5,355,685 | |
| Praxair, Inc. | | | 25,784 | | | | 3,352,694 | |
| Progressive Corp. (The) | | | 81,446 | | | | 2,221,032 | |
| QUALCOMM, Inc. | | | 57,400 | | | | 4,261,950 | |
| Royal Caribbean Cruises Ltd. | | | 187,570 | | | | 8,894,569 | |
| Seattle Genetics, Inc. (a) | | | 67,700 | | | | 2,700,553 | |
| TD Ameritrade Holding Corp. | | | 251,647 | | | | 7,710,464 | |
| Teradata Corp. (a) | | | 33,521 | | | | 1,524,870 | |
| Teradyne, Inc. (a) | | | 117,183 | | | | 2,064,764 | |
| Tesla Motors, Inc. (a) | | | 25,090 | | | | 3,773,034 | |
| TripAdvisor, Inc. (a) | | | 26,383 | | | | 2,185,304 | |
| Twitter, Inc. (a) | | | 28,083 | | | | 1,787,483 | |
| Visa, Inc., Class A | | | 22,046 | | | | 4,909,203 | |
| Walt Disney Co. (The) | | | 75,483 | | | | 5,766,901 | |
| Waters Corp. (a) | | | 41,251 | | | | 4,125,100 | |
| Weight Watchers International, Inc. | | | 27,888 | | | | 918,352 | |
| WellPoint, Inc. | | | 39,680 | | | | 3,666,035 | |
| Xilinx, Inc. | | | 86,300 | | | | 3,962,896 | |
| | | | | | | | 184,971,409 | |
The accompanying notes are an integral part of the financial statements.
| PORTFOLIO OF INVESTMENTS (concluded) | |
| December 31, 2013 | Baillie Gifford Global Alpha Equity Fund |
| | | Shares | | | Value | |
| | | | | | | |
Total Common Stocks
(cost $308,556,192) | | | | | | $ | 411,807,051 | |
| | | | | | | | | |
| PREFERRED STOCKS - 0.4% | | | | | | | | |
| BRAZIL - 0.4% | | | | | | | | |
Petroleo Brasileiro SA ADR
(cost $2,257,139) | | | 106,800 | | | | 1,568,892 | |
| | | | | | | | | |
| | | | | | | | |
TOTAL INVESTMENTS - 98.7%
(cost $310,813,331) | | | | | | | 413,375,943 | |
| Other assets less liabilities - 1.3% | | | | | | | 5,341,052 | |
| NET ASSETS - 100.0% | | | | | | $ | 418,716,995 | |
| (a) | Non-income producing security. |
| ADR | - | American Depositary Receipt. |
| GDR | - | Global Depositary Receipt. |
Reg S - is a safe harbor that defines when an offering of securities will be deemed to come to rest abroad and therefore is not subject to the registration obligations imposed under Section 5 of the 1933 Act. The regulation includes two safe harbor provisions: an issuer safe harbor and a resale safe harbor. In each case, the regulation demands that offers and sales of the securities be made outside the United States and that no offering participant (which includes the issuer, the banks assisting with the offer and their respective affiliates) engage in “directed” selling efforts. In the case of issuers for whose securities there is substantial U.S. market interest, the regulation also requires that no offers and sales be made to U.S. persons (including U.S. persons physically located outside the United States).
The accompanying notes are an integral part of the financial statements.
| STATEMENT OF ASSETS AND LIABILITIES | |
| December 31, 2013 | Baillie Gifford Global Alpha Equity Fund |
| ASSETS | | | |
| Investments, at value (cost $310,813,331) | | $ | 413,375,943 | |
| Cash | | | 5,506,537 | |
| Foreign cash, at value (cost $150,357) | | | 155,245 | |
| Dividends receivable | | | 228,299 | |
| Tax reclaims receivable | | | 229,817 | |
| | | | | |
| Total Assets | | | 419,495,841 | |
| | | | | |
| LIABILITIES | | | | |
| Management fee payable | | | 305,980 | |
| Servicing fee payable | | | 224,930 | |
| Payable for investments purchased | | | 104,291 | |
| Accrued expenses | | | 143,645 | |
| | | | | |
| Total Liabilities | | | 778,846 | |
| | | | | |
| NET ASSETS | | $ | 418,716,995 | |
| | | | | |
| COMPOSITION OF NET ASSETS | | | | |
| Paid-in capital | | $ | 314,256,227 | |
| Distributions in excess of net investment income | | | (1,474,481 | ) |
| Accumulated net realized gain on investments and foreign currency transactions | | | 3,358,049 | |
| Net unrealized appreciation in value of investments and foreign currencies | | | 102,577,200 | |
| | | $ | 418,716,995 | |
| | | | | |
| NET ASSET VALUE, PER SHARE | | | | |
| | | | | |
Class 2 ($119,535,351 / 8,474,795 shares outstanding),
unlimited authorized, no par value | | $ | 14.10 | |
| Maximum Purchase Price Per Share (Note D) | | $ | 14.13 | |
| Minimum Redemption Price Per Share (Note D) | | $ | 14.08 | |
| | | | | |
Class 3 ($299,181,644 / 20,840,001 shares outstanding),
unlimited authorized, no par value | | $ | 14.36 | |
| Maximum Purchase Price Per Share (Note D) | | $ | 14.39 | |
| Minimum Redemption Price Per Share (Note D) | | $ | 14.34 | |
The accompanying notes are an integral part of the financial statements.
| STATEMENT OF OPERATIONS | |
| For the Year Ended December 31, 2013 | Baillie Gifford Global Alpha Equity Fund |
| INVESTMENT INCOME | | | |
| Dividends (net of foreign withholding taxes of $456,612) | | $ | 6,161,865 | |
| Interest | | | 1,799 | |
| Total Investment Income | | | 6,163,664 | |
| | | | | |
| EXPENSES | | | | |
| Management fee (Note B) | | | 1,099,102 | |
| Shareholder Servicing fees - Class 1 Shares (Note B) | | | 58,040 | |
| Shareholder Servicing fees - Class 2 Shares (Note B) | | | 241,845 | |
| Shareholder Servicing fees - Class 3 Shares (Note B) | | | 527,798 | |
| Fund Accounting | | | 242,508 | |
| Custody | | | 65,316 | |
| Legal | | | 38,736 | |
| Transfer Agency | | | 20,731 | |
| Professional fees | | | 12,440 | |
| Trustees’ fees | | | 12,246 | |
| Insurance | | | 4,778 | |
| Miscellaneous | | | 5,184 | |
| Total Expenses | | | 2,328,724 | |
| | | | | |
| Net Investment Income | | | 3,834,940 | |
| | | | | |
REALIZED AND UNREALIZED GAIN (LOSS) ON INVESTMENTS
AND FOREIGN CURRENCY TRANSACTIONS | | | | |
| Net realized gain (loss) from: | | | | |
| Investments | | | 14,665,522 | |
| Foreign currency transactions | | | (81,511 | ) |
| | | | 14,584,011 | |
| | | | | |
| Net change in unrealized appreciation (depreciation) on: | | | | |
| Investments | | | 73,697,675 | |
| Translation of assets and liabilities in foreign currencies | | | 8,946 | |
| | | | 73,706,621 | |
| | | | | |
| Net realized and unrealized gain on investments and foreign currency transactions | | | 88,290,632 | |
| NET INCREASE IN NET ASSETS FROM OPERATIONS | | $ | 92,125,572 | |
The accompanying notes are an integral part of the financial statements.
| STATEMENTS OF CHANGES IN NET ASSETS | Baillie Gifford Global Alpha Equity Fund |
| |
| | | For the
Year Ended
December 31,
2013 | | | For the
Year Ended
December 31,
2012 | |
| | | | | | | | | |
| INCREASE (DECREASE) IN NET ASSETS FROM OPERATIONS | | | | | | | | |
| Net investment income | | $ | 3,834,940 | | | $ | 2,783,007 | |
| Net realized gain (loss) from investments and foreign currency transactions | | | 14,584,011 | | | | (1,758,080 | ) |
Net change in unrealized appreciation (depreciation) on investments
and translation of assets and liabilities in foreign currencies | | | 73,706,621 | | | | 30,247,092 | |
| Net increase in net assets from operations | | | 92,125,572 | | | | 31,272,019 | |
| | | | | | | | | |
| DIVIDENDS AND DISTRIBUTIONS TO SHAREHOLDERS FROM: | | | | | | | | |
| Net investment income: | | | | | | | | |
| Class 1 | | | - | | | | (226,914 | ) |
| Class 2 | | | (1,390,265 | ) | | | - | |
| Class 3 | | | (3,607,790 | ) | | | (2,780,220 | ) |
| Capital gains: | | | | | | | | |
| Class 2 | | | (2,747,721 | ) | | | - | |
| Class 3 | | | (6,756,158 | ) | | | - | |
| Total Dividends and Distributions | | | (14,501,934 | ) | | | (3,007,134 | ) |
| | | | | | | | | |
| TRANSACTIONS IN SHARES OF BENEFICIAL INTEREST | | | | | | | | |
| Net proceeds from shares subscribed: | | | | | | | | |
| Class 1 | | | 299,481 | | | | 21,556,800 | |
| Class 2 | | | 103,403,236 | | | | 96,384,748 | |
| Class 3 | | | 1,497,000 | | | | 104,146,842 | |
| Purchase premiums: | | | | | | | | |
| Class 1 | | | 11,713 | | | | 9,241 | |
| Class 2 | | | 28,494 | | | | 15,959 | |
| Class 3 | | | 118,949 | | | | 53,768 | |
| Redemption fees: | | | | | | | | |
| Class 2 | | | 3,002 | | | | - | |
| Class 3 | | | 7,514 | | | | - | |
| Dividends reinvested: | | | | | | | | |
| Class 1 | | | - | | | | 226,914 | |
| Class 2 | | | 4,137,986 | | | | - | |
| Class 3 | | | 10,363,948 | | | | 2,780,220 | |
| Cost of shares redeemed: | | | | | | | | |
| Class 1 | | | (25,780,688 | ) | | | - | |
| Class 2 | | | (7,010,597 | ) | | | (104,146,842 | ) |
| | | | | | | | | |
| Increase in Net Assets from Transactions in Shares of Beneficial Interest | | | 87,080,038 | | | | 121,027,650 | |
| | | | | | | | | |
| Total Increase in Net Assets | | | 164,703,676 | | | | 149,292,535 | |
| | | | | | | | | |
| NET ASSETS | | | | | | | | |
| Beginning of year | | | 254,013,319 | | | | 104,720,784 | |
| End of year (including distributions in excess of net investment income of $1,474,481 and $229,855, respectively) | | $ | 418,716,995 | | | $ | 254,013,319 | |
The accompanying notes are an integral part of the financial statements.
| FINANCIAL HIGHLIGHTS | Baillie Gifford Global Alpha Equity Fund |
Selected data for a Class 2 Share outstanding throughout the period:
| | | | For the Period
January 6, 2013(a)
through
December 31,
2013 |
| | Net asset value, beginning of period | | | $11.55 | |
| | | | | | |
| | From Investment Operations | | | | |
| | Net investment income(b) | | | 0.12 | |
| | Net realized and unrealized gain on investments and foreign currency transactions | | | 2.94 | |
| | Net increase in net asset value from investment operations | | | 3.06 | |
| | | | | | |
| | Dividends and Distributions to Shareholders | | | | |
| | Dividends from net investment income | | | (0.17) | |
| | Distributions from net realized gain on investments | | | (0.34) | |
| | Total Dividends and Distributions | | | (0.51) | |
| | | | | | |
| | Proceeds from Purchase Premiums and Redemption Fees(b) | | | 0.00(c) | |
| | | | | | |
| | Net asset value, end of period | | | $14.10 | |
| | | | | | |
| | Total Return | | | | |
| | Total investment return based on net asset value(d) | | | 26.48% | |
| | | | | | |
| | Ratios/Supplemental Data | | | | |
| | Net assets, end of period (000’s omitted) | | | $119,535 | |
| | Ratio of net expenses to average net assets | | | 0.68%* | |
| | Ratio of net investment income to average net assets | | | 1.00%* | |
| | Portfolio turnover rate | | | 20% | |
| * | Annualized. |
| (a) | Commencement of investment operations. |
| (b) | Calculated based upon average shares outstanding during the period. |
| (c) | Amount is less than $0.005 per share. |
| (d) | Total investment return is calculated assuming an initial investment made at the net asset value at the beginning of the period, reinvestment of all dividends and distributions, if any, at net asset value during the period, and redemption on the last day of the period. Total return is not annualized for periods less than one year. |
The accompanying notes are an integral part of the financial statements.
| FINANCIAL HIGHLIGHTS (concluded) | Baillie Gifford Global Alpha Equity Fund |
Selected data for a Class 3 Share outstanding throughout each period:
| | | | For the
Year Ended
December 31,
2013 | | For the
Year Ended
December 31,
2012 | | For the Period
November 15, 2011(a)
through
December 31,
2011 |
| | Net asset value, beginning of period | | $11.56 | | $9.86 | | $10.00 |
| | | | | | | | |
| | From Investment Operations | | | | | | |
| | Net investment income(b) | | 0.14 | | 0.19 | | 0.01 |
| | Net realized and unrealized gain (loss) on investments and foreign currency transactions | | 3.17 | | 1.65 | | (0.14) |
| | | | | | | | |
| | Net increase (decrease) in net asset value from investment operations | | 3.31 | | 1.84 | | (0.13) |
| | | | | | | | |
| | Dividends and Distributions to Shareholders | | | | | | |
| | Dividends from net investment income | | (0.18) | | (0.14) | | (0.01) |
| | Distributions from net realized gain on investments | | (0.34) | | - | | - |
| | Total Dividends and Distributions | | (0.52) | | (0.14) | | (0.01) |
| | | | | | | | |
| | Proceeds from Purchase Premiums and Redemption Fees(b) | | 0.01 | | 0.00(c) | | - |
| | | | | | | | |
| | Net asset value, end of period | | $14.36 | | $11.56 | | $9.86 |
| | | | | | | | |
| | Total Return | | | | | | |
| | Total investment return based on net asset value(d) | | 28.71% | | 18.69% | | (1.25)% |
| | | | | | | | |
| | Ratios/Supplemental Data | | | | | | |
| | Net assets, end of period (000’s omitted) | | $299,182 | | $231,157 | | $104,721 |
| | Ratio of net expenses to average net assets | | 0.61% | | 0.63% | | 0.64%* |
| | Ratio of net investment income to average net assets | | 1.05% | | 1.76% | | 1.12%* |
| | Portfolio turnover rate | | 20% | | 15% | | 3% |
| * | Annualized. |
| (a) | Commencement of investment operations. |
| (b) | Calculated based upon average shares outstanding during the period. |
| (c) | Amount is less than $0.005 per share. |
| (d) | Total investment return is calculated assuming an initial investment made at the net asset value at the beginning of the period, reinvestment of all dividends and distributions, if any, at net asset value during the period, and redemption on the last day of the period. Total return is not annualized for periods less than one year. |
The accompanying notes are an integral part of the financial statements.
NOTES TO FINANCIAL STATEMENTS
December 31, 2013
Note A – Organization and Accounting Policies
Each of Baillie Gifford International Equity Fund (“International Equity Fund”), Baillie Gifford International Choice Fund (“International Choice Fund), Baillie Gifford EAFE Fund (“EAFE Fund”), Baillie Gifford EAFE Choice Fund (“EAFE Choice Fund”), Baillie Gifford Emerging Markets Fund (“Emerging Markets Fund”), and Baillie Gifford Global Alpha Equity Fund (“Global Alpha Equity Fund”) (each, a “Fund”, and collectively, the “Funds”) is a series of Baillie Gifford Funds (the “Trust”). The Trust is a diversified open-end management investment company registered under the Investment Company Act of 1940, as amended. The Trust is organized as a Massachusetts business trust under the laws of Massachusetts pursuant to an Amended and Restated Agreement and Declaration of Trust dated August 17, 2001, as subsequently amended. International Equity Fund, International Choice Fund, EAFE Fund, EAFE Choice Fund and Global Alpha Equity Fund offer five classes of shares, Class 1, Class 2, Class 3, Class 4 and Class 5 shares, and Emerging Markets Fund offers three classes of shares, Class I, Class II and Class III shares (an unlimited number of shares are authorized, without par value). At December 31, 2013, shares issued and outstanding for the International Equity Fund were of Class 1, Class 2, Class 3 and Class 4 shares, shares issued and outstanding for the International Choice Fund were of Class 2 and Class 3, shares issued and outstanding for the EAFE Fund were of Class 1, Class 2, Class 3, Class 4 and Class 5 shares, shares issued and outstanding for the EAFE Choice Fund were of Class 1 and Class 2, shares issued and outstanding for the Emerging Markets Fund were of Class II and Class III and shares issued outstanding for Global Alpha Equity Fund were of Class 2 and Class 3 shares.
The financial statements of the Funds have been prepared in conformity with accounting principles generally accepted in the United States of America (“GAAP”). Management is required to make certain estimates and assumptions that affect the reported amounts of assets and liabilities for the Funds and disclosure of contingent assets and liabilities for the Funds at the date of the financial statements and the reported amounts of increases and decreases in net assets from operations for the Funds during the reporting period. Actual results could differ from those estimates.
The following is a summary of significant accounting policies followed by the Funds.
Valuation of Investments
Equity securities listed on an established securities exchange are normally valued at their last sale price on the exchange where primarily traded. Equity securities listed on the NASDAQ National Market System are valued at the NASDAQ Official Closing Price. Equity securities listed on an established securities exchange or on the NASDAQ National Market System for which there is no reported sale during the day, and in the case of over-the-counter securities not so listed, are valued at the mean between the last available bid and asked prices. Other securities for which current market quotations are not readily available (or for which quotations are not believed to be reliable due to market changes that occur after the most recent available quotations are obtained or any other reason), and all other assets, are taken at fair value as determined in good faith by Baillie Gifford Overseas Limited (the “Manager”), pursuant to procedures approved by the trustees of the Trust (the “Trustees”). The actual calculations may be made by persons acting pursuant to the direction of the Trustees or by pricing services.
NOTES TO FINANCIAL STATEMENTS (continued)
December 31, 2013
Generally, trading in foreign securities markets is substantially completed each day at various times prior to close of regular trading on the New York Stock Exchange. Occasionally, events affecting the value of foreign fixed income securities and of equity securities of non-U.S. issuers not traded on a U.S. exchange may occur between the completion of substantial trading of such securities for the day and the close of regular trading on the New York Stock Exchange, which events may not be reflected in the computation of a Funds’ net asset values. If events materially affecting the value of the Funds’ portfolio securities occur during such period, then these securities will be valued at their fair value as determined in good faith by the Manager, pursuant to procedures approved by the Trustees. The Funds utilize a third party pricing service which for all equity securities, except those traded on a Canadian, Latin American or U.S. exchange, applies a fair value adjustment that seeks to reflect changes in such securities’ market prices since the close of the market on which they are traded. To the extent that securities are valued using this service, they will be classified as Level 2 securities in the fair value measurement framework described below.
The Funds invest in obligations of foreign entities and securities denominated in foreign currencies. Such investments involve risk not typically involved with domestic investments. Such risks include fluctuations in foreign exchange rates, inability to convert proceeds into U.S. dollars, application of foreign tax laws, foreign investment restrictions, less publicly available information about foreign financial instruments, less liquidity resulting from substantially less trading volume, more volatile prices, and generally less government supervision of foreign securities markets and issuers.
Fair Value Measurement
GAAP provides guidance on fair value measurements and defines fair value as the price that the Trust would receive to sell an investment or pay to transfer a liability in a timely transaction with an independent buyer in the principal market, or in the absence of a principal market the most advantageous market for the investment or liability. It establishes a single definition of fair value, creates a three-tier hierarchy as a framework for measuring fair value based on inputs used to value the Trust’s investments, and requires additional disclosure about fair value. The hierarchy of inputs is summarized below:
| | Level 1 - | unadjusted quoted prices in active markets for identical investments |
| | Level 2 - | other significant observable inputs (including quoted prices for similar investments, interest rates, prepayment speeds, credit risk, etc.) |
| | Level 3 - | significant unobservable inputs (including the Trust’s own assumptions in determining the fair value of investments) |
For Level 1 inputs, the Funds use unadjusted quoted prices in active markets for assets or liabilities with sufficient frequency and volume to provide pricing information as the most reliable evidence of fair value.
The Funds’ Level 2 valuation techniques include inputs other than quoted prices within Level 1 that are observable for an asset or liability, either directly or indirectly. Level 2 observable inputs may include quoted prices for similar assets and liabilities in active markets or quoted prices for identical or similar assets or liabilities in markets that are not active in which there are few transactions, the prices are not current, or price quotations vary substantially over time or among market participants. Inputs that are observable for the asset or liability in Level 2 include such factors as interest rates, yield curves, prepayment speeds, credit risk, and default rates for similar liabilities.
NOTES TO FINANCIAL STATEMENTS (continued)
December 31, 2013
For Level 3 valuation techniques, the Funds use unobservable inputs that reflect assumptions market participants would be expected to use in pricing the asset or liability. Unobservable inputs are used to measure fair value to the extent that observable inputs are not available and are developed based on the best information available under the circumstances. In developing unobservable inputs, market participant assumptions are used if they are reasonably available without undue cost and effort.
The inputs or methodology used for valuing securities are not necessarily an indication of the risk associated with investing in those securities. The following is a summary of the inputs used as of December 31, 2013 in valuing the Funds’ investments carried at fair value:
International Equity Fund
| | | Level 1 | | | Level 2 | | | Level 3 | | | Total | |
| Investments in Securities | | | | | | | | | | | | | | | | |
| Common Stocks | | | | | | | | | | | | | | | | |
| Argentina | | $ | 31,367,860 | | | $ | - | | | $ | - | | | $ | 31,367,860 | |
| Australia | | | - | | | | 76,099,133 | | | | - | | | | 76,099,133 | |
| Bermuda | | | - | | | | 17,127,495 | | | | - | | | | 17,127,495 | |
| Brazil | | | 21,315,742 | | | | - | | | | - | | | | 21,315,742 | |
| Canada | | | 68,055,995 | | | | - | | | | - | | | | 68,055,995 | |
| China | | | 35,925,356 | | | | 109,979,349 | | | | - | | | | 145,904,705 | |
| Denmark | | | 25,141,312 | | | | 58,272,115 | | | | - | | | | 83,413,427 | |
| Finland | | | - | | | | 93,106,271 | | | | - | | | | 93,106,271 | |
| France | | | - | | | | 77,774,742 | | | | - | | | | 77,774,742 | |
| Germany | | | - | | | | 167,915,789 | | | | - | | | | 167,915,789 | |
| India | | | - | | | | 11,418,138 | | | | - | | | | 11,418,138 | |
| Ireland | | | 32,655,490 | | | | 50,002,370 | | | | - | | | | 82,657,860 | |
| Japan | | | - | | | | 237,818,599 | | | | - | | | | 237,818,599 | |
| Netherlands | | | - | | | | 67,718,678 | | | | - | | | | 67,718,678 | |
| Norway | | | - | | | | 19,487,203 | | | | - | | | | 19,487,203 | |
| Peru | | | 24,631,635 | | | | - | | | | - | | | | 24,631,635 | |
| Portugal | | | - | | | | 7,829,923 | | | | - | | | | 7,829,923 | |
| Russia | | | - | | | | 56,539,848 | | | | - | | | | 56,539,848 | |
| Singapore | | | - | | | | 36,293,230 | | | | - | | | | 36,293,230 | |
| South Africa | | | - | | | | 79,308,273 | | | | - | | | | 79,308,273 | |
| South Korea | | | - | | | | 138,486,039 | | | | - | | | | 138,486,039 | |
| Spain | | | - | | | | 44,650,026 | | | | - | | | | 44,650,026 | |
| Sweden | | | - | | | | 130,928,279 | | | | - | | | | 130,928,279 | |
| Switzerland | | | - | | | | 70,306,350 | | | | - | | | | 70,306,350 | |
| Taiwan | | | 18,726,533 | | | | 65,033,219 | | | | - | | | | 83,759,752 | |
| Turkey | | | - | | | | 28,929,361 | | | | - | | | | 28,929,361 | |
| United Kingdom | | | 17,150,391 | | | | 549,322,898 | | | | - | | | | 566,473,289 | |
| United States | | | 14,946,486 | | | | - | | | | - | | | | 14,946,486 | |
| Total Common Stocks | | | 289,916,800 | | | | 2,194,347,328 | | | | - | | | | 2,484,264,128 | |
| Preferred Stocks | | | | | | | | | | | | | | | | |
| Brazil | | | 11,901,026 | | | | - | | | | - | | | | 11,901,026 | |
| Total | | $ | 301,817,826 | | | $ | 2,194,347,328 | | | $ | - | | | $ | 2,496,165,154 | |
NOTES TO FINANCIAL STATEMENTS (continued)
December 31, 2013
International Choice Fund
| | | Level 1 | | | Level 2 | | | Level 3 | | | Total | |
| Investments in Securities | | | | | | | | | | | | | | | | |
| Common Stocks | | | | | | | | | | | | | | | | |
| Australia | | $ | 224,760 | | | $ | 19,837,195 | | | $ | - | | | $ | 20,061,955 | |
| Belgium | | | - | | | | 1,596,476 | | | | - | | | | 1,596,476 | |
| China | | | 7,048,728 | | | | 11,372,378 | | | | - | | | | 18,421,106 | |
| Denmark | | | 4,017,426 | | | | 7,302,534 | | | | - | | | | 11,319,960 | |
| Finland | | | - | | | | 4,293,449 | | | | - | | | | 4,293,449 | |
| France | | | 1,666,944 | | | | 4,359,448 | | | | - | | | | 6,026,392 | |
| Germany | | | - | | | | 2,621,013 | | | | - | | | | 2,621,013 | |
| India | | | - | | | | 2,869,760 | | | | - | | | | 2,869,760 | |
| Indonesia | | | - | | | | 2,467,852 | | | | - | | | | 2,467,852 | |
| Italy | | | - | | | | 3,438,636 | | | | - | | | | 3,438,636 | |
| Japan | | | - | | | | 33,399,746 | | | | - | | | | 33,399,746 | |
| Mexico | | | 2,072,420 | | | | - | | | | - | | | | 2,072,420 | |
| Netherlands | | | 3,849,043 | | | | - | | | | - | | | | 3,849,043 | |
| New Zealand | | | - | | | | 3,033,720 | | | | - | | | | 3,033,720 | |
| Philippines | | | - | | | | 2,199,179 | | | | - | | | | 2,199,179 | |
| Singapore | | | - | | | | 4,441,295 | | | | - | | | | 4,441,295 | |
| South Africa | | | 2,021,383 | | | | 4,775,459 | | | | - | | | | 6,796,842 | |
| South Korea | | | - | | | | 8,114,556 | | | | - | | | | 8,114,556 | |
| Spain | | | 1,961,583 | | | | 9,437,882 | | | | - | | | | 11,399,465 | |
| Sweden | | | - | | | | 27,225,262 | | | | - | | | | 27,225,262 | |
| Switzerland | | | - | | | | 21,763,677 | | | | - | | | | 21,763,677 | |
| Taiwan | | | 7,633,915 | | | | - | | | | - | | | | 7,633,915 | |
| Turkey | | | 3,178,959 | | | | - | | | | - | | | | 3,178,959 | |
| United Kingdom | | | - | | | | 58,062,818 | | | | - | | | | 58,062,818 | |
| United States | | | 7,619,607 | | | | - | | | | - | | | | 7,619,607 | |
| Total Common Stocks | | | 41,294,768 | | | | 232,612,335 | | | | - | | | | 273,907,103 | |
| Preferred Stocks | | | | | | | | | | | | | | | | |
| Brazil | | | 2,103,350 | | | | - | | | | - | | | | 2,103,350 | |
| Total | | $ | 43,398,118 | | | $ | 232,612,335 | | | $ | - | | | $ | 276,010,453 | |
NOTES TO FINANCIAL STATEMENTS (continued)
December 31, 2013
EAFE Fund
| | | Level 1 | | | Level 2 | | | Level 3 | | | Total | |
| Investments in Securities | | | | | | | | | | | | | | | | |
| Common Stocks | | | | | | | | | | | | | | | | |
| Argentina | | $ | 18,076,383 | | | $ | - | | | $ | - | | | $ | 18,076,383 | |
| Australia | | | - | | | | 48,449,257 | | | | - | | | | 48,449,257 | |
| Brazil | | | - | | | | 9,865,168 | | | | - | | | | 9,865,168 | |
| Chile | | | 11,467,428 | | | | - | | | | - | | | | 11,467,428 | |
| China | | | 153,600,916 | | | | 186,408,023 | | | | - | | | | 340,008,939 | |
| Denmark | | | 58,567,318 | | | | 38,880,793 | | | | - | | | | 97,448,111 | |
| France | | | - | | | | 140,945,100 | | | | - | | | | 140,945,100 | |
| Germany | | | - | | | | 59,868,330 | | | | - | | | | 59,868,330 | |
| India | | | - | | | | 10,263,118 | | | | - | | | | 10,263,118 | |
| Ireland | | | - | | | | 15,000,412 | | | | - | | | | 15,000,412 | |
| Italy | | | - | | | | 104,454,687 | | | | - | | | | 104,454,687 | |
| Japan | | | 13,179,149 | | | | 265,071,774 | | | | - | | | | 278,250,923 | |
| Netherlands | | | - | | | | 24,506,651 | | | | - | | | | 24,506,651 | |
| Norway | | | - | | | | 26,648,586 | | | | - | | | | 26,648,586 | |
| Peru | | | 20,988,462 | | | | - | | | | - | | | | 20,988,462 | |
| Portugal | | | - | | | | 19,400,067 | | | | - | | | | 19,400,067 | |
| Russia | | | 12,231,015 | | | | 12,287,340 | | | | - | | | | 24,518,355 | |
| Singapore | | | - | | | | 12,894,093 | | | | - | | | | 12,894,093 | |
| South Korea | | | 13,603,765 | | | | 63,839,137 | | | | - | | | | 77,442,902 | |
| Spain | | | - | | | | 199,447,859 | | | | - | | | | 199,447,859 | |
| Sweden | | | - | | | | 222,354,174 | | | | - | | | | 222,354,174 | |
| Switzerland | | | - | | | | 176,507,700 | | | | - | | | | 176,507,700 | |
| Taiwan | | | 14,297,417 | | | | - | | | | - | | | | 14,297,417 | |
| Turkey | | | - | | | | 20,772,010 | | | | - | | | | 20,772,010 | |
| United Kingdom | | | - | | | | 405,620,427 | | | | - | | | | 405,620,427 | |
| Total Common Stocks | | | 316,011,853 | | | | 2,063,484,706 | | | | - | | | | 2,379,496,559 | |
| Preferred Stocks | | | | | | | | | | | | | | | | |
| Brazil | | | 14,518,652 | | | | - | | | | - | | | | 14,518,652 | |
| Germany | | | - | | | | 26,354,369 | | | | - | | | | 26,354,369 | |
| Total Preferred Stocks | | | 14,518,652 | | | | 26,354,369 | | | | - | | | | 40,873,021 | |
| Total | | $ | 330,530,505 | | | $ | 2,089,839,075 | | | $ | - | | | $ | 2,420,369,580 | |
NOTES TO FINANCIAL STATEMENTS (continued)
December 31, 2013
EAFE Choice Fund
| | | Level 1 | | | Level 2 | | | Level 3 | | | Total | |
| Investments in Securities | | | | | | | | | | | | | | | | |
| Common Stocks | | | | | | | | | | | | | | | | |
| Australia | | $ | 81,990 | | | $ | 8,119,647 | | | $ | - | | | $ | 8,201,637 | |
| Belgium | | | - | | | | 672,550 | | | | - | | | | 672,550 | |
| China | | | 2,469,675 | | | | 5,248,116 | | | | - | | | | 7,717,791 | |
| Denmark | | | 1,539,736 | | | | 3,682,855 | | | | - | | | | 5,222,591 | |
| Finland | | | - | | | | 1,744,150 | | | | - | | | | 1,744,150 | |
| France | | | 782,531 | | | | 2,911,554 | | | | - | | | | 3,694,085 | |
| Germany | | | - | | | | 1,424,380 | | | | - | | | | 1,424,380 | |
| India | | | - | | | | 1,178,690 | | | | - | | | | 1,178,690 | |
| Italy | | | 1,566,981 | | | | 1,337,378 | | | | - | | | | 2,904,359 | |
| Japan | | | - | | | | 14,954,803 | | | | - | | | | 14,954,803 | |
| New Zealand | | | - | | | | 1,213,345 | | | | - | | | | 1,213,345 | |
| Singapore | | | - | | | | 2,367,913 | | | | - | | | | 2,367,913 | |
| South Africa | | | 860,337 | | | | 1,278,180 | | | | - | | | | 2,138,517 | |
| South Korea | | | - | | | | 1,169,309 | | | | - | | | | 1,169,309 | |
| Spain | | | 1,163,970 | | | | 3,148,406 | | | | - | | | | 4,312,376 | |
| Sweden | | | - | | | | 11,408,771 | | | | - | | | | 11,408,771 | |
| Switzerland | | | - | | | | 9,970,330 | | | | - | | | | 9,970,330 | |
| Taiwan | | | 2,167,214 | | | | - | | | | - | | | | 2,167,214 | |
| Turkey | | | - | | | | 883,529 | | | | - | | | | 883,529 | |
| United Kingdom | | | - | | | | 26,254,000 | | | | - | | | | 26,254,000 | |
| United States | | | 3,469,697 | | | | - | | | | - | | | | 3,469,697 | |
| Total Common Stocks | | | 14,102,131 | | | | 98,967,906 | | | | - | | | | 113,070,037 | |
| Preferred Stocks | | | | | | | | | | | | | | | | |
| Brazil | | | 399,080 | | | | - | | | | - | | | | 399,080 | |
| Total | | $ | 14,501,211 | | | $ | 98,967,906 | | | $ | - | | | $ | 113,469,117 | |
NOTES TO FINANCIAL STATEMENTS (continued)
December 31, 2013
Emerging Markets Fund
| | | Level 1 | | | Level 2 | | | Level 3 | | | Total | |
| Investments in Securities | | | | | | | | | | | | | | | | |
| Common Stocks | | | | | | | | | | | | | | | | |
| Argentina | | $ | 5,543,801 | | | $ | - | | | $ | - | | | $ | 5,543,801 | |
| Australia | | | 372,231 | | | | - | | | | - | | | | 372,231 | |
| Brazil | | | 4,980,402 | | | | 5,609,640 | | | | - | | | | 10,590,042 | |
| Cayman Islands | | | 920,591 | | | | 4,280,413 | | | | - | | | | 5,201,004 | |
| Chile | | | 1,562,907 | | | | - | | | | - | | | | 1,562,907 | |
| China | | | 10,065,715 | | | | 67,832,089 | | | | - | | | | 77,897,804 | |
| Egypt | | | - | | | | 3,464,119 | | | | - | | | | 3,464,119 | |
| Guernsey | | | 265,581 | | | | - | | | | - | | | | 265,581 | |
| India | | | 1,322,353 | | | | 47,731,353 | | | | - | | | | 49,053,706 | |
| Malaysia | | | 4,070,858 | | | | 1,372,841 | | | | - | | | | 5,443,699 | |
| Mexico* | | | 8,392,568 | | | | - | | | | 0 | | | | 8,392,568 | |
| Panama | | | 4,989,988 | | | | - | | | | - | | | | 4,989,988 | |
| Russia | | | - | | | | 8,757,587 | | | | - | | | | 8,757,587 | |
| South Africa | | | - | | | | 9,040,306 | | | | - | | | | 9,040,306 | |
| South Korea | | | 556,834 | | | | 88,802,235 | | | | - | | | | 89,359,069 | |
| Taiwan | | | - | | | | 54,392,024 | | | | - | | | | 54,392,024 | |
| Turkmenistan | | | - | | | | 15,434,489 | | | | - | | | | 15,434,489 | |
| United Kingdom | | | - | | | | 5,315,351 | | | | - | | | | 5,315,351 | |
| Total Common Stocks | | | 43,043,829 | | | | 312,032,447 | | | | - | | | | 355,076,276 | |
| Preferred Stocks | | | | | | | | | | | | | | | | |
| Brazil | | | - | | | | 5,316,677 | | | | - | | | | 5,316,677 | |
| South Korea | | | - | | | | 6,678,105 | | | | - | | | | 6,678,105 | |
| Total Preferred Stocks | | | - | | | | 11,994,782 | | | | - | | | | 11,994,782 | |
| Total | | $ | 43,043,829 | | | $ | 324,027,229 | | | $ | - | | | $ | 367,071,058 | |
| * | Includes a Level 3 security with a $0 fair market value. |
A roll forward of fair value measurements using significant unobservable inputs (Level 3) for the year ended December 31, 2013, was as follows:
| | | Common Stock | |
| Balance at December 31, 2012 | | $ | - | |
| Purchases | | | 2,319,343 | |
| Sales | | | (152,035 | ) |
| Realized gain (loss) | | | (115,803 | ) |
| Change in unrealized appreciation (depreciation) | | | (2,051,505 | ) |
| Transfers into Level 3 | | | - | |
| Transfers out of Level 3 | | | - | |
| Balance at December 31, 2013 | | $ | - | |
| Change in unrealized gain related to investments still held at December 31, 2013 | | $ | (2,051,505 | ) |
NOTES TO FINANCIAL STATEMENTS (continued)
December 31, 2013
Global Alpha Equity Fund
| | | Level 1 | | | Level 2 | | | Level 3 | | | Total | |
| Investments in Securities | | | | | | | | | | | | | | | | |
| Common Stocks | | | | | | | | | | | | | | | | |
| Argentina | | $ | 1,755,194 | | | $ | - | | | $ | - | | | $ | 1,755,194 | |
| Australia | | | 328,661 | | | | 3,713,892 | | | | - | | | | 4,042,553 | |
| Brazil | | | - | | | | 2,512,729 | | | | - | | | | 2,512,729 | |
| Canada | | | 11,550,971 | | | | - | | | | - | | | | 11,550,971 | |
| China | | | 9,968,007 | | | | 11,504,766 | | | | - | | | | 21,472,773 | |
| Denmark | | | - | | | | 7,386,070 | | | | - | | | | 7,386,070 | |
| Germany | | | - | | | | 3,406,300 | | | | - | | | | 3,406,300 | |
| Greece | | | 5,656,413 | | | | - | | | | - | | | | 5,656,413 | |
| India | | | 3,196,620 | | | | - | | | | - | | | | 3,196,620 | |
| Indonesia | | | - | | | | 986,620 | | | | - | | | | 986,620 | |
| Ireland | | | 6,008,448 | | | | 3,635,571 | | | | - | | | | 9,644,019 | |
| Japan | | | - | | | | 30,603,384 | | | | - | | | | 30,603,384 | |
| Netherlands | | | 2,214,330 | | | | - | | | | - | | | | 2,214,330 | |
| Norway | | | - | | | | 4,703,681 | | | | - | | | | 4,703,681 | |
| Russia | | | - | | | | 1,597,969 | | | | - | | | | 1,597,969 | |
| Singapore | | | - | | | | 3,038,347 | | | | - | | | | 3,038,347 | |
| South Africa | | | - | | | | 11,386,804 | | | | - | | | | 11,386,804 | |
| South Korea | | | - | | | | 5,572,374 | | | | - | | | | 5,572,374 | |
| Spain | | | - | | | | 2,053,383 | | | | - | | | | 2,053,383 | |
| Sweden | | | - | | | | 20,996,639 | | | | - | | | | 20,996,639 | |
| Switzerland | | | - | | | | 25,526,179 | | | | - | | | | 25,526,179 | |
| Taiwan | | | 5,038,416 | | | | - | | | | - | | | | 5,038,416 | |
| Turkey | | | 1,361,290 | | | | - | | | | - | | | | 1,361,290 | |
| Turkmenistan | | | - | | | | 1,733,753 | | | | - | | | | 1,733,753 | |
| United Kingdom | | | - | | | | 39,398,831 | | | | - | | | | 39,398,831 | |
| United States | | | 184,971,409 | | | | - | | | | - | | | | 184,971,409 | |
| Total Common Stocks | | | 232,049,759 | | | | 179,757,292 | | | | - | | | | 411,807,051 | |
| Preferred Stocks | | | | | | | | | | | | | | | | |
| Brazil | | | 1,568,892 | | | | - | | | | - | | | | 1,568,892 | |
| Total | | $ | 233,618,651 | | | $ | 179,757,292 | | | $ | - | | | $ | 413,375,943 | |
It is the Trust’s policy to recognize transfers in and transfers out at the fair value as of the beginning of the period. The portfolio may hold securities which are periodically fair valued in accordance with the Funds’ fair value procedures. This may result in movements between Levels 1, 2, and 3 throughout the period.
For the International Equity Fund fair value of Level 2 and Level 1 investments at December 31, 2012 was $1,808,437,407 and $285,996,524, respectively. $13,206,478 was transferred out of Level 2 into Level 1 and $7,485,513 was transferred out of Level 1 into Level 2 during the year ended December 31, 2013.
For the International Choice Fund fair value of Level 2 and Level 1 investments at December 31, 2012 was $19,344,070 and $4,346,776, respectively. $873,148 was transferred out of Level 2 into Level 1 and $476,658 was transferred out of Level 1 into Level 2 during the year ended December 31, 2013.
NOTES TO FINANCIAL STATEMENTS (continued)
December 31, 2013
For the EAFE Fund fair value of Level 2 and Level 1 investments at December 31, 2012 was $1,863,330,191 and $212,987,461, respectively. $99,612,721 was transferred out of Level 2 into Level 1 and $31,941,597 was transferred out of Level 1 into Level 2 during the year ended December 31, 2013.
For the EAFE Choice Fund fair value of Level 2 and Level 1 investments at December 31, 2012 was $164,940,352 and $16,009,765, respectively. $7,888,224 was transferred out of Level 2 into Level 1 and $2,734,165 was transferred out of Level 1 into Level 2 during the year ended December 31, 2013.
For the Emerging Markets Fund fair value of Level 2 and Level 1 investments at December 31, 2012 was $368,535,942 and $105,291,121, respectively. $381,942 was transferred out of Level 2 into Level 1 and $45,258,538 was transferred out of Level 1 into Level 2 during the year ended December 31, 2013.
For the Global Alpha Equity Fund fair value of Level 2 and Level 1 investments at December 31, 2012 was $115,850,040 and $134,742,677, respectively. $4,164,280 was transferred out of Level 1 into Level 2 during the year ended December 31, 2013.
These transfers were all as a result of using third-party vendor modeling tools to reflect any (lack of) significant market movements between the time at which the Funds valued their securities and the earlier closing of foreign markets. With regard to the transfers from Level 1 into Level 2, quotations were still obtained from the Funds’ third party pricing vendor. Pursuant to the Funds’ fair value procedures noted previously, equity securities (including exchange traded securities and open-end regulated investment companies) and exchange traded derivatives (i.e. futures contracts and options) are generally categorized as Level 1 securities in the fair value hierarchy. Fixed income securities, non-exchange traded derivatives and money market instruments are generally categorized as Level 2 securities in the fair value hierarchy. Investments for which there are no such quotations, or for which quotations do not appear reliable, are valued at fair value as determined in accordance with procedures established by and under the supervision of the Trustees. These valuations are typically categorized as Level 2 or Level 3 securities in the fair value hierarchy.
Derivative and Hedging Disclosure
GAAP requires qualitative disclosures about objectives and strategies for using derivatives, quantitative disclosures about fair value amounts of gains and losses on derivative instruments, and disclosures about credit-risk-related contingent features in derivative agreements. The Funds did not utilize derivatives for the year ended December 31, 2013.
Foreign Currency Translation
The accounting records of the Funds are maintained in U.S. dollars. Foreign currency amounts are translated into U.S. dollars at the applicable rate of exchange to determine the value of investments, assets and liabilities. For the Funds, purchases and sales of securities, and income and expenses are translated at the prevailing rate of exchange on the respective dates of such transactions. The Funds do not isolate that portion of net realized and unrealized gains and losses on investments resulting from changes in foreign exchange rates from the impact arising from changes in market prices. Such fluctuations are included with net realized and unrealized gain or loss from investments.
Net realized foreign exchange gains and losses arise from sales of foreign currencies, currency gains or losses realized between the trade and settlement dates on securities transactions, and the differences
NOTES TO FINANCIAL STATEMENTS (continued)
December 31, 2013
between the amounts of dividends, interest, and foreign withholding taxes recorded on the Funds’ books and the U.S. dollar equivalent of the amounts actually received or paid. Net unrealized foreign exchange gains and losses arise from changes in the value of assets and liabilities, other than investments in securities, resulting from changes in the exchange rates.
Forward Foreign Currency Contracts
The Funds may enter into forward foreign currency contracts in connection with planned purchases or sales of securities, or to hedge against changes in currency exchange rates affecting the values of securities denominated in a particular currency. A forward exchange currency contract is a commitment to purchase or sell a foreign currency at a future date at a negotiated forward rate. Fluctuations in the value of forward foreign currency exchange contracts are recorded for book purposes as unrealized gains or losses on foreign currency related transactions by a Fund. When forward contracts are closed, the Funds record realized gains or losses equal to the differences between the values of such forward contracts at the time each was opened and the value at the time each was closed. Such amounts are recorded in net realized gain or loss on foreign currency related transactions.
The Funds’ maximum risk of loss from counterparty credit risk is the net value of the cash flows to be received from the counterparty at the end of the contract’s life. This risk may be mitigated by having a master netting arrangement between the Funds and the counterparty which may permit the Funds to offset amounts payable by the Funds to the same counterparty against amounts to be received; and by the receipt of collateral from the counterparty by the Funds to cover the Funds’ exposure to the counterparty. However, there is no assurance that such mitigating factors are easily enforceable.
The Funds may be party to financial instruments with off-balance-sheet risk, primarily forward contracts, in order to minimize the impact of adverse changes in the relationship between the U.S. dollar and various foreign currencies. These instruments involve market risk in excess of the amount recognized in the Statement of Assets and Liabilities. Risks arise from the possible inability of counter parties to meet the terms of their contracts, future adverse movement in currency values and contract positions that are not exact offsets. The contract amount indicates the extent of the Funds’ involvement in such currencies. At December 31, 2013, the Funds did not have any forward foreign currency contracts.
Securities Transactions and Investment Income
The Funds’ securities transactions are recorded on the trade date. Realized gains or losses on sales of investments are determined on the basis of identified cost. Dividend income is recorded on the ex-dividend date and interest income is recorded on an accrual basis.
Investment income, expenses (other than those specific to a particular class of shares), and realized and unrealized gains and losses on investments are allocated to the separate classes of shares based upon their relative net asset value on the date income is earned or expensed and realized and unrealized gains and losses are incurred.
Federal Taxes
Each Fund intends to continue to qualify to be taxed as a "regulated investment company" under the provisions of the U.S. Internal Revenue Code of 1986, as amended (the “Code”), and as such will not be subject to U.S. federal income tax on income (including any net realized capital gains) which is
NOTES TO FINANCIAL STATEMENTS (continued)
December 31, 2013
distributed in accordance with the provisions of the Code to the Funds’ shareholders. Therefore, no U.S. federal income tax provision is required.
Investment income received from investments in foreign currencies may be subject to foreign withholding tax. Whenever possible, the Funds will attempt to operate so as to qualify for reduced tax rates or tax exemptions in those countries with which the United States has a tax treaty.
In addition to the requirements of the Code, the Funds may also be subject to capital gains tax in India on gains realized upon sale of Indian securities, payable upon repatriation of sales proceeds. Any realized losses in excess of gains may be carried forward to offset future gains. Funds with exposure to Indian securities accrue a deferred liability for unrealized gains in excess of available carryforwards on Indian securities based on existing tax rates and holding periods of the securities. As of December 31, 2013, the Emerging Markets Fund recorded a receivable for Indian capital gains tax refund of $211,189 and a deferred liability for potential future Indian capital gains taxes of $645,927.
The Funds are subject to tax accounting standards that provide guidance for how certain and uncertain tax positions should be recognized, measured, presented and disclosed in the financial statements. These standards require the evaluation of tax positions taken or expected to be taken in the course of preparing the Funds’ tax returns to determine whether the tax positions are “more-likely-than-not” of being sustained by the applicable tax authority. Tax positions not deemed to meet the “more-likely-than-not” threshold would be recorded as a reduction in a tax benefit or expense in the current year. Management has evaluated the application of these standards and has determined no liabilities for income tax related expenses are required in the financial statements of the Funds. For the International Equity Fund, EAFE Fund, EAFE Choice Fund and Emerging Markets Fund the tax periods 2010 through present remain subject to examination by the Internal Revenue Service. For the Global Alpha Equity Fund, the tax periods 2011 through present remain subject to examination. For the International Choice Fund, the tax periods 2012 through the present remains subject to examination.
At December 31, 2013 for Federal income tax purposes, the following Funds had capital loss carryforwards available to offset future capital gains through the years indicated. To the extent that these loss carryforwards are utilized, capital gains so offset will not be distributed to shareholders.
| Fund | | | Capital Loss
Available
Through
2016 | | | Capital Loss
Available
Through
2017 | | | Capital Loss
Available
Through
2018 | | | | Capital Loss
No Expiration | | | Capital
Loss
Available
Total | |
| International Equity | | | $ | - | | | $ | - | | | $ | - | | | | $25,321,808 | | | $25,321,808 | |
| International Choice | | | | - | | | | - | | | | - | | | | 169,967 | | | 169,967 | |
| EAFE | | | | 3,452,595 | | | | 3,833,395 | | | | 10,342,232 | | | | - | | | 17,628,222 | |
| EAFE Choice | | | | - | | | | - | | | | - | | | | 8,061,624 | | | 8,061,624 | |
| Emerging Markets | | | | - | | | | - | | | | - | | | | 12,892,484 | | | 12,892,484 | |
NOTES TO FINANCIAL STATEMENTS (continued)
December 31, 2013
The Regulated Investment Company Modernization Act of 2010 eliminated the eight-year carryover period for capital losses that arise in taxable years beginning after its enactment date of December 22, 2010. Consequently, these capital losses can be carried forward for an unlimited period. However, capital losses with an expiration period may not be used to offset capital gains until all net capital losses without an expiration date have been utilized. Additionally, post-enactment capital loss carryovers will retain their character as either short-term or long-term capital losses instead of as short-term capital losses as under prior law. The amounts in the table below are characterized as short-term and long-term capital losses and have no expiration.
| Fund | | Short-Term
Capital Losses | | Long-Term
Capital Losses |
| International Equity | | | $ | 18,305,042 | | | | $ | 7,016,766 | |
| International Choice | | | | 169,967 | | | | | - | |
| EAFE | | | | - | | | | | - | |
| EAFE Choice | | | | 3,175,384 | | | | | 4,886,240 | |
| Emerging Markets | | | | 12,892,484 | | | | | - | |
| Global Alpha Equity | | | | - | | | | | - | |
Realized capital losses, currency losses and passive foreign investment company (“PFIC”) losses incurred after October 31 (“post-October losses/Late-Year Specified”) within the taxable year are deemed to arise on the first business day of each Fund’s next taxable year. During the year ended December 31, 2013, the Funds shown below incurred and will elect to defer net post-October losses as indicated.
At December 31, 2013, the components of accumulated earnings on tax basis were as follows:
| Fund | | | Undistributed
Net Ordinary
Income | | | Long Term
Capital
Gains | | | Late-Year
Specified
Losses | | | | Capital
Loss
Carryforwards | | | Post October
Capital
Losses | | | | Net Unrealized
Appreciation
on
Investments
and Foreign
Currencies | | | Total
Accumulated
Earnings | |
| International Equity | | | $2,064,122 | | | $ | - | | | $ | - | | | | $(25,321,808 | ) | | $ | (2,521,040 | ) | | | $582,684,179 | | | $ | 556,905,453 | |
| International Choice | | | 281,096 | | | | - | | | | - | | | | (169,967 | ) | | | (33,822 | ) | | | 21,693,581 | | | | 21,770,888 | |
| EAFE | | | - | | | | - | | | | (123,589 | ) | | | (17,628,222 | ) | | | - | | | | 897,402,157 | | | | 879,650,346 | |
| EAFE Choice | | | 67,466 | | | | - | | | | - | | | | (8,061,624 | ) | | | - | | | | 25,719,286 | | | | 17,725,128 | |
| Emerging Markets | | | 719,485 | | | | - | | | | - | | | | (12,892,484 | ) | | | (341,687 | ) | | | 79,966,711 | | | | 67,452,025 | |
| Global Alpha Equity | | | 453,407 | | | | 3,447,102 | | | | - | | | | - | | | | - | | | | 100,560,259 | | | | 104,460,768 | |
The differences between the components of distributable earnings on a tax basis and the amounts reflected in the Statements of Assets and Liabilities are primarily due to the differing book/tax treatment of realized losses on wash sales and mark to market income on securities categorized as PFICs.
For the year ended December 31, 2013, the following reclassifications have been made on the Statement of Assets and Liabilities as a result of certain differences in the computation of net investment income and net realized capital gains under U.S. federal income tax rules and regulations versus GAAP, such as the treatment of foreign currency gains and losses and the redesignation of dividends.
| NOTES TO FINANCIAL STATEMENTS (continued) |
| December 31, 2013 | | |
| Fund | | Undistributed
(Distributions in
Excess of) Net
Investment Income | | | Accumulated Net
Realized Gains
(Losses) on
Investments and
Foreign Currency
Transactions | | | Paid-in
Capital |
| International Equity | | | $ | 1,658,971 | | | | | $ | (2,149,641 | ) | | | | $ | 490,670 | |
| International Choice | | | | 18,561 | | | | | | (18,561 | ) | | | | | - | |
| EAFE | | | | 663,827 | | | | | | (663,827 | ) | | | | | - | |
| EAFE Choice | | | | 1,936,530 | | | | | | (10,527,630 | ) | | | | | 8,591,100 | |
| Emerging Markets | | | | (660,659 | ) | | | | | 660,659 | | | | | | - | |
| Global Alpha Equity | | | | (81,511 | ) | | | | | 81,511 | | | | | | - | |
Dividends and Distributions to Shareholders
The Funds intend to distribute each year, as dividends, substantially all net investment income and net capital gains realized. All such dividends or distributions are credited in the form of additional shares of the Funds at net asset value on the ex-dividend date unless the shareholder elects to receive dividends and distributions in cash. Currently, the Funds’ policies are to distribute net investment income and net capital gains on an annual basis. Such distributions are determined in conformity with U.S. federal income tax regulations, which may differ from GAAP.
For the years ended December 31, 2013 and December 31, 2012, the tax characters of the dividends paid were:
| Fund | | | Ordinary
Income | | Ordinary
Income | | | Long Term
Capital Gains | |
| | | | 2013 | | | 2012 | | | 2013 | |
| International Equity | | | $ | 41,703,719 | | | $ | 33,512,610 | | | $ | - | |
| International Choice | | | | 2,140,285 | | | | 30,032 | | | | - | |
| EAFE | | | | 27,498,264 | | | | 21,301,039 | | | | - | |
| EAFE Choice | | | | 3,508,047 | | | | 5,086,503 | | | | - | |
| Emerging Markets | | | | 6,418,863 | | | | 5,972,731 | | | | - | |
| Global Alpha Equity | | | | 8,122,250 | | | | 3,007,134 | | | | 6,379,684 | |
For tax purposes, short-term capital gain distributions, if any, are considered ordinary income distributions.
Note B – Investment Management and Other Services
The Funds are advised and managed by the Manager. The Manager, an investment adviser registered with the SEC, is a wholly owned subsidiary of Baillie Gifford & Co.
Under an investment advisory agreement between the Manager and the Trust on behalf of the Funds, each Fund pays the Manager a quarterly management fee, in arrears, at the following annual rate of the respective Fund’s average net assets.
NOTES TO FINANCIAL STATEMENTS (continued)
December 31, 2013
| Fund | | Management
Fee |
| International Equity | | | 0.25 | % |
| International Choice | | | 0.25 | % |
| EAFE | | | 0.25 | % |
| EAFE Choice | | | 0.25 | % |
| Emerging Markets | | | 0.50 | % |
| Global Alpha Equity | | | 0.30 | % |
For the year ended December 31, 2013, the Funds incurred management fees as follows:
| Fund | | | Management Fee | | Management Fee
Waiver/Expenses
Reimbursed | |
| International Equity | | | $ | 5,642,205 | | | $ | - | |
| International Choice* | | | | 339,526 | | | | (1,267 | ) |
| EAFE | | | | 5,431,012 | | | | - | |
| EAFE Choice | | | | 299,057 | | | | - | |
| Emerging Markets | | | | 2,035,074 | | | | - | |
| Global Alpha Equity | | | | 1,099,102 | | | | - | |
*For the period January 1, 2013 to April 30, 2013, the Manager has contractually agreed to waive its fees and/or bear other expenses to the extent that such Fund’s total annual operating expenses (excluding interest, taxes and extraordinary expenses) exceeded 0.85%.
Each Fund has adopted a Shareholder Servicing Plan providing that the Fund may pay the Manager, or any other entity that acts from time to time as the shareholder servicing agent with respect to a class of Fund shares, for services rendered and expenses borne in connection with the provision of services provided to Fund investors and/or the maintenance of shareholder accounts. For these services, the Funds pay the Manager a fee at the annualized rate of the Funds’ average daily net assets attributed to each class of share as follows:
| | | | International
Equity | | | International
Choice* | | | EAFE | | | EAFE
Choice** | | | Emerging
Markets | | | Global Alpha
Equity*** |
| Class 1/I | | | 0.45% | | | 0.45% | | | 0.45% | | | 0.45% | | | 0.30% | | | 0.45% |
| Class 2/II | | | 0.27% | | | 0.27% | | | 0.27% | | | 0.27% | | | 0.25% | | | 0.27% |
| Class 3/III | | | 0.20% | | | 0.20% | | | 0.20% | | | 0.20% | | | 0.10% | | | 0.20% |
| Class 4 | | | 0.17% | | | 0.17% | | | 0.17% | | | 0.17% | | | N/A | | | 0.17% |
| Class 5 | | | 0.12% | | | 0.12% | | | 0.12% | | | 0.12% | | | N/A | | | 0.12% |
| * | | International Choice Fund Class 1 was redeemed on April 9, 2013. |
| ** | | EAFE Choice Fund Class 3 was redeemed on April 16, 2013. |
| *** | | Global Alpha Equity Fund Class 1 was redeemed on July 9, 2013. |
NOTES TO FINANCIAL STATEMENTS (continued)
December 31, 2013
For the year ended December 31, 2013, the Funds incurred shareholder servicing fees for each class of share as follows:
| | | International
Equity | | | International
Choice* | | | EAFE | | | EAFE
Choice** | | | Emerging
Markets | | | Global Alpha
Equity*** | |
| Class 1/I | | $ | 255,253 | | | $ | 31,570 | | | $ | 190,394 | | | $ | 3,374 | | | $ | N/A | | | $ | 58,040 | |
| Class 2/II | | | 1,745,139 | | | | 160,648 | | | | 2,196,237 | | | | 233,614 | | | | 86,711 | | | | 241,845 | |
| Class 3/III | | | 2,050,734 | | | | 138,591 | | | | 1,137,655 | | | | 64,229 | | | | 372,347 | | | | 527,798 | |
| Class 4 | | | 898,426 | | | | N/A | | | | 81,464 | | | | N/A | | | | N/A | | | | N/A | |
| Class 5 | | | N/A | | | | N/A | | | | 839,935 | | | | N/A | | | | N/A | | | | N/A | |
| * | | International Choice Fund Class 1 was redeemed on April 9, 2013. |
| ** | | EAFE Choice Fund Class 3 was redeemed on April 16, 2013. |
| *** | | Global Alpha Equity Fund Class 1 was redeemed on July 9, 2013. |
Note C – Investment Transactions
Purchases and proceeds from sales of securities (excluding in-kind purchases and redemptions and short-term securities) for the year ended December 31, 2013 were as follows:
| Fund | | Purchases | | | Sales | |
| International Equity | | $ | 478,798,996 | | | $ | 349,425,250 | |
| International Choice | | | 145,984,996 | | | | 14,336,968 | |
| EAFE | | | 314,689,112 | | | | 499,540,830 | |
| EAFE Choice | | | 30,011,299 | | | | 38,156,845 | |
| Emerging Markets | | | 133,382,421 | | | | 244,881,868 | |
| Global Alpha Equity | | | 145,572,719 | | | | 71,152,691 | |
For the year ended December 31, 2013, the cost of in-kind purchases and the proceeds from in-kind redemptions were as follows:
| Fund | | Purchases | | | Sales | |
| International Equity | | | $ - | | | $ | 17,374,309 | |
| International Choice | | | 98,989,360 | | | | - | |
| EAFE | | | - | | | | - | |
| EAFE Choice | | | - | | | | 82,176,995 | |
| Emerging Markets | | | - | | | | - | |
| Global Alpha Equity | | | - | | | | - | |
NOTES TO FINANCIAL STATEMENTS (continued)
December 31, 2013
For the International Equity Fund and EAFE Choice Fund, $490,670 and $9,860,288, respectively, in realized gains is related to the $17,374,309 and $82,176,995 of sales proceeds for redemption in-kind transactions.
The Funds’ cost of investments and gross unrealized appreciation (depreciation) at December 31, 2013 for U.S. federal income tax purposes were as follows:
| Fund | | Cost of
Investments | | | Gross
Appreciation | | | Gross
Depreciation | | | Net
Appreciation
(Depreciation) | |
| International Equity | | $ | 1,913,536,287 | | | $ | 651,144,034 | | | $ | (68,515,167 | ) | | $ | 582,628,867 | |
| International Choice | | | 254,323,238 | | | | 29,375,790 | | | | (7,688,575 | ) | | | 21,687,215 | |
| EAFE | | | 1,523,037,964 | | | | 955,264,551 | | | | (57,932,935 | ) | | | 897,331,616 | |
| EAFE Choice | | | 87,758,474 | | | | 28,483,019 | | | | (2,772,376 | ) | | | 25,710,643 | |
| Emerging Markets | | | 286,464,722 | | | | 95,565,806 | | | | (14,959,470 | ) | | | 80,606,336 | |
| Global Alpha Equity | | | 312,830,272 | | | | 106,945,224 | | | | (6,399,553 | ) | | | 100,545,671 | |
Note D – Transactions in Shares of Beneficial Interest
| | | International Equity Fund |
| | | Class 1 Shares
For the
Year Ended
December 31, 2013 | | Class 2 Shares
For the
Year Ended
December 31, 2013 |
| | | Shares | | Amount | | Shares | | Amount |
| Shares sold | | | 61,435 | | | $ | 681,659 | | | | 8,340,648 | | | $ | 91,672,424 | |
| Purchase premium | | | - | | | | 9,434 | | | | - | | | | 102,972 | |
| Redemption fees | | | - | | | | 2,939 | | | | - | | | | 32,530 | |
| Shares issued in reinvestment of dividends and distributions | | | 15,399 | | | | 177,440 | | | | 889,432 | | | | 10,361,979 | |
| Shares redeemed | | | (3,720,398 | ) | | | (41,887,651 | ) | | | (20,833,739 | ) | | | (226,837,755 | ) |
| Net decrease | | | (3,643,564 | ) | | $ | (41,016,179 | ) | | | (11,603,659 | ) | | $ | (124,667,850 | ) |
| | | International Equity Fund |
| | | Class 3 Shares
For the
Year Ended
December 31, 2013 | | Class 4 Shares
For the
Year Ended
December 31, 2013 |
| | | Shares | | Amount | | Shares | | Amount |
| Shares sold | | | 25,042,293 | | | $ | 276,657,991 | | | | 4,196,981 | | | $ | 49,900,000 | |
| Purchase premium | | | - | | | | 160,708 | | | | - | | | | 81,798 | |
| Redemption fees | | | - | | | | 49,264 | | | | - | | | | 25,715 | |
| Shares issued in reinvestment of dividends and distributions | | | 1,765,855 | | | | 20,845,482 | | | | 832,318 | | | | 10,043,073 | |
| Shares redeemed | | | (2,501,174 | ) | | | (26,039,059 | ) | | | (3,199,810 | ) | | | (35,218,367 | ) |
| Net increase | | | 24,306,974 | | | $ | 271,674,386 | | | | 1,829,489 | | | $ | 24,832,219 | |
NOTES TO FINANCIAL STATEMENTS (continued)
December 31, 2013
| | | International Equity Fund |
| | | Class 1 Shares
For the
Year Ended
December 31, 2012 | | Class 2 Shares
For the
Year Ended
December 31, 2012 |
| | | Shares | | Amount | | Shares | | Amount |
| Shares sold | | | 6,237,448 | | | $ | 57,372,832 | | | | 32,047,741 | | | $ | 310,822,024 | |
| Purchase premium | | | - | | | | 79,717 | | | | - | | | | 652,621 | |
| Redemption fees | | | - | | | | 6,852 | | | | - | | | | 59,689 | |
| Shares issued in reinvestment of dividends and distributions | | | 60,511 | | | | 621,138 | | | | 1,041,817 | | | | 10,667,156 | |
| Shares redeemed | | | (7,740,481 | ) | | | (72,816,528 | ) | | | (63,787,178 | ) | | | (615,053,580 | ) |
| Net decrease | | | (1,442,522 | ) | | $ | (14,735,989 | ) | | | (30,697,620 | ) | | $ | (292,852,090 | ) |
| | | International Equity Fund |
| | | Class 3 Shares
For the
Year Ended
December 31, 2012 | | Class 4 Shares
For the
Year Ended
December 31, 2012 |
| | | Shares | | Amount | | Shares | | Amount |
| Shares sold | | | 71,453,072 | | | $ | 691,940,811 | | | | 46,724,347 | | | $ | 458,126,968 | |
| Purchase premium | | | - | | | | 386,643 | | | | - | | | | 197,554 | |
| Redemption fees | | | - | | | | 41,412 | | | | - | | | | 21,095 | |
| Shares issued in reinvestment of dividends and distributions | | | 1,318,383 | | | | 13,666,431 | | | | 785,893 | | | | 8,324,082 | |
| Shares redeemed | | | (32,872,204 | ) | | | (302,097,134 | ) | | | (1,099,140 | ) | | | (11,067,960 | ) |
| Net increase | | | 39,899,251 | | | $ | 403,938,163 | | | | 46,411,100 | | | $ | 455,601,739 | |
NOTES TO FINANCIAL STATEMENTS (continued)
December 31, 2013
| | | International Choice Fund |
| | | Class 1 Shares
For the Period
January 1, 2013
through
April 9, 2013* | | Class 2 Shares
For the Period
April 9, 2013**
through
December 31, 2013 |
| | | Shares | | Amount | | Shares | | Amount |
| Shares sold | | | - | | | $ | - | | | | 13,808,255 | | | $ | 156,103,614 | |
| Purchase premium | | | - | | | | - | | | | | | | | 140,612 | |
| Shares issued in reinvestment of dividends and distributions | | | - | | | | - | | | | 102,664 | | | | 1,243,112 | |
| Shares redeemed | | | (2,403,571 | ) | | | (26,363,614 | ) | | | - | | | | - | |
| Net increase (decrease) | | | (2,403,571 | ) | | $ | (26,363,614 | ) | | | 13,910,919 | | | $ | 157,487,338 | |
*International Choice Fund Class 1 was redeemed on April 9, 2013.
**Commencement of investments operations.
| | | International Choice Fund |
| | | Class 3 Shares
For the Period
May 1, 2013**
through
December 31, 2013 | | Class 1 Shares
For the Period
September 24, 2012**
Year Ended
December 31, 2012 |
| | | Shares | | Amount | | Shares | | Amount |
| Shares sold | | | 8,829,014 | | | $ | 101,519,199 | | | | 2,400,632 | | | $ | 23,986,930 | |
| Purchase premium | | | - | | | | 141,798 | | | | - | | | | 48,070 | |
| Shares issued in reinvestment of dividends and distributions | | | 73,376 | | | | 897,173 | | | | 2,939 | | | | 30,032 | |
| Net increase | | | 8,902,390 | | | $ | 102,558,170 | | | | 2,403,571 | | | $ | 24,065,032 | |
**Commencement of investments operations.
| | | EAFE Fund |
| | | Class 1 Shares
For the
Year Ended
December 31, 2013 | | Class 2 Shares
For the
Year Ended
December 31, 2013 |
| | | Shares | | Amount | | Shares | | Amount |
| Shares sold | | | - | | | $ | - | | | | 4,147,779 | | | $ | 47,777,796 | |
| Purchase premium | | | - | | | | 2,951 | | | | - | | | | 51,231 | |
| Redemption fees | | | - | | | | 8,131 | | | | - | | | | 147,441 | |
| Shares issued in reinvestment of dividends and distributions | | | 18,721 | | | | 233,655 | | | | 624,383 | | | | 7,780,515 | |
| Shares redeemed | | | (2,378,880 | ) | | | (27,717,996 | ) | | | (33,756,500 | ) | | | (360,935,125 | ) |
| Net decrease | | | (2,360,159 | ) | | $ | (27,473,259 | ) | | | (28,984,338 | ) | | $ | (305,178,142 | ) |
NOTES TO FINANCIAL STATEMENTS (continued)
December 31, 2013
| | | EAFE Fund | | | | | | |
| | | Class 3 Shares
For the
Year Ended
December 31, 2013 | | Class 4 Shares
For the Period
October 10, 2013*
through
December 31, 2013 | | Class 5 Shares
For the
Year Ended
December 31, 2013 |
| | | Shares | | Amount | | Shares | | Amount | | Shares | | Amount |
| Shares sold | | | 20,109,528 | | | $ | 217,132,949 | | | | 17,258,589 | | | $ | 201,540,630 | | | | 4,178,915 | | | $ | 49,900,000 | |
| Purchase premium | | | | | | | 36,622 | | | | | | | | 1,789 | | | | | | | | 47,607 | |
| Redemption fees | | | | | | | 105,792 | | | | | | | | 4,975 | | | | | | | | 125,165 | |
| Shares issued in reinvestment of dividends and distributions | | | 475,961 | | | | 5,941,859 | | | | 198,722 | | | | 2,487,636 | | | | 807,270 | | | | 10,105,932 | |
| Shares redeemed | | | (28,150,611 | ) | | | (318,740,539 | ) | | | - | | | | - | | | | - | | | | - | |
| Net increase (decrease) | | | (7,565,122 | ) | | $ | (95,523,317 | ) | | | 17,457,311 | | | $ | 204,035,030 | | | | 4,986,185 | | | $ | 60,178,704 | |
* Commencement of investment operations.
| | | EAFE Fund |
| | | Class 1 Shares
For the
Year Ended
December 31, 2012 | | Class 2 Shares
For the
Year Ended
December 31, 2012 |
| | | Shares | | Amount | | Shares | | Amount |
| Shares sold | | | 2,316,280 | | | $ | 20,956,314 | | | | 17,391,014 | | | $ | 161,201,621 | |
| Purchase premium | | | - | | | | 3,667 | | | | - | | | | 75,854 | |
| Redemption fees | | | - | | | | 1,742 | | | | - | | | | 36,183 | |
| Shares issued in reinvestment of dividends and distributions | | | 35,425 | | | | 346,140 | | | | 854,869 | | | | 8,327,874 | |
| Shares redeemed | | | (269,143 | ) | | | (2,503,756 | ) | | | (4,669,419 | ) | | | (42,719,584 | ) |
| Net increase | | | 2,082,562 | | | $ | 18,804,107 | | | | 13,576,464 | | | $ | 126,921,948 | |
| | | | | | | | | | | | | | | | | |
| | | EAFE Fund |
| | | Class 3 Shares
For the
Year Ended
December 31, 2012 | | Class 4 Shares
For the Period
January 1, 2012
through
July 18, 2012* |
| | | Shares | | Amount | | Shares | | Amount |
| Shares sold | | | 784,074 | | | $ | 7,485,000 | | | | 5,853,166 | | | $ | 49,900,000 | |
| Purchase premium | | | - | | | | 40,423 | | | | - | | | | 35,418 | |
| Redemption fees | | | - | | | | 19,378 | | | | - | | | | 4,000 | |
| Shares issued in reinvestment of dividends and distributions | | | 419,985 | | | | 4,098,931 | | | | - | | | | - | |
| Shares redeemed | | | (11,276,683 | ) | | | (102,190,959 | ) | | | (61,504,009 | ) | | | (532,921,389 | ) |
| Net decrease | | | (10,072,624 | ) | | $ | (90,547,227 | ) | | | (55,650,843 | ) | | $ | (482,981,971 | ) |
*EAFE Fund Class 4 was redeemed on July 18, 2012.
NOTES TO FINANCIAL STATEMENTS (continued)
December 31, 2013
| | | EAFE Fund
Class 5 Shares
For the Period
July 18, 2012*
through
December 31, 2012 |
| | | Shares | | Amount |
| | | | | | | | | |
| Shares sold | | | 61,467,121 | | | $ | 532,921,389 | |
| Purchase premium | | | - | | | | 15,109 | |
| Redemption fees | | | - | | | | 20,052 | |
| Shares issued in reinvestment of dividends and distributions | | | 698,065 | | | | 6,828,751 | |
| Shares redeemed | | | - | | | | - | |
| Net increase | | | 62,165,186 | | | $ | 539,785,301 | |
*Commencement of investment operations.
| | | EAFE Choice Fund | | |
| | | Class 1 Shares
For the Period
12/17/2013*
through
December 31, 2013 | | Class 2 Shares
For the
Year Ended
December 31, 2013 | | Class 3 Shares
For the Period
January 1, 2013
through
April 16, 2013** |
| | | Shares | | Amount | | Shares | | Amount | | Shares | | Amount |
| Shares sold | | | 1,496,874 | | | $ | 19,159,986 | | | | 2,472,715 | | | $ | 29,551,683 | | | | 8,004,328 | | | $ | 90,951,574 | |
| Purchase premium | | | - | | | | 6,680 | | | | - | | | | 31,967 | | | | - | | | | - | |
| Redemption fees | | | - | | | | - | | | | - | | | | 40,517 | | | | - | | | | 14,152 | |
| Shares issued in reinvestment of dividends and distributions | | | 39,351 | | | | 509,094 | | | | 230,706 | | | | 2,998,953 | | | | - | | | | - | |
| Shares redeemed | | | - | | | | - | | | | (9,416,270 | ) | | | (107,856,932 | ) | | | (10,459,784 | ) | | | (125,975,781 | ) |
| Net increase (decrease) | | | 1,536,225 | | | $ | 19,675,760 | | | | (6,712,849 | ) | | $ | (75,233,812 | ) | | | (2,455,456 | ) | | $ | (35,010,055 | ) |
*Commencement of investment operations.
**EAFE Choice Fund Class 3 was redeemed on April 16, 2013.
NOTES TO FINANCIAL STATEMENTS (continued)
December 31, 2013
| | | EAFE Choice Fund |
| | | Class 2 Shares
For the
Year Ended
December 31, 2012 | | Class 3 Shares
For the Period
January 23, 2012*
through
December 31, 2012 |
| | | Shares | | Amount | | Shares | | Amount |
| Shares sold | | | 1,535,934 | | | $ | 16,067,800 | | | | 4,181,134 | | | $ | 42,471,000 | |
| Purchase premium | | | - | | | | 26,992 | | | | - | | | | 7,208 | |
| Redemption fees | | | - | | | | 26,712 | | | | - | | | | 5,436 | |
| Shares issued in reinvestment of dividends and distributions | | | 389,332 | | | | 4,309,208 | | | | 70,018 | | | | 777,295 | |
| Shares redeemed | | | (169,016 | ) | | | (1,902,854 | ) | | | (1,795,696 | ) | | | (19,529,294 | ) |
| Net increase | | | 1,756,250 | | | $ | 18,527,858 | | | | 2,455,456 | | | $ | 23,731,645 | |
*Commencement of investment operations.
| | | EAFE Choice Fund
Class 4 Shares
For the Period
January 1, 2012
through
January 23, 2012* |
| | | Shares | | Amount |
| Shares redeemed | | | (4,032,673 | ) | | $ | (41,473,001 | ) |
| Net decrease | | | (4,032,673 | ) | | $ | (41,473,001 | ) |
*EAFE Choice Fund Class 4 was redeemed on January 23, 2012.
NOTES TO FINANCIAL STATEMENTS (continued)
December 31, 2013
| | | Emerging Markets Fund |
| | | Class II Shares
For the Period
April 9, 2013*
through
December 31, 2013 | | Class III Shares
For the
Year Ended
December 31, 2013 |
| | | Shares | | Amount | | Shares | | Amount |
| Shares sold | | | 3,031,676 | | | $ | 47,294,135 | | | | - | | | $ | - | |
| Purchase premium | | | - | | | | - | | | | - | | | | - | |
| Redemption fees | | | - | | | | 34,688 | | | | - | | | | 285,790 | |
| Shares issued in reinvestment of dividends and distributions | | | 57,365 | | | | 880,017 | | | | 264,017 | | | | 4,102,273 | |
| Shares redeemed | | | - | | | | - | | | | (11,199,952 | ) | | | (175,485,293 | ) |
| Net increase (decrease) | | | 3,089,041 | | | $ | 48,208,840 | | | | (10,935,935 | ) | | $ | (171,097,230 | ) |
*Commencement of investment operations.
| | | Emerging Markets Fund |
| | | Class II Shares
For the Period
January 23, 2012*
through
April 19, 2012** | | Class III Shares
For the
Year Ended
December 31, 2012 |
| | | Shares | | Amount | | Shares | | Amount |
| Shares sold | | | 2,974,300 | | | $ | 47,197,419 | | | | 8,818,329 | | | $ | 144,762,741 | |
| Purchase premium | | | - | | | | 12,799 | | | | - | | | | 512,451 | |
| Redemption fees | | | - | | | | - | | | | - | | | | 77,647 | |
| Shares issued in reinvestment of dividends and distributions | | | - | | | | - | | | | 379,183 | | | | 5,972,731 | |
| Shares redeemed | | | (2,974,300 | ) | | | (49,787,991 | ) | | | (4,884,951 | ) | | | (78,256,316 | ) |
| Net increase (decrease) | | | - | | | $ | (2,577,773 | ) | | | 4,312,561 | | | $ | 73,069,254 | |
*Commencement of investment operations.
** Emerging Markets Fund Class II was redeemed on April 19, 2012.
NOTES TO FINANCIAL STATEMENTS (continued)
December 31, 2013
| | | Global Alpha Equity Fund |
| | | Class 1 Shares
For the
Period Ended
July 9, 2013** | | Class 2 Shares
For the Period
January 3, 2013*
through
December 31, 2013 |
| | | Shares | | Amount | | Shares | | Amount |
| Shares sold | | | 25,033 | | | $ | 299,481 | | | | 8,676,328 | | | $ | 103,403,236 | |
| Purchase premium | | | - | | | | 11,713 | | | | - | | | | 28,494 | |
| Redemption fees | | | - | | | | - | | | | - | | | | 3,002 | |
| Shares issued in reinvestment of dividends and distributions | | | - | | | | - | | | | 295,638 | | | | 4,137,986 | |
| Shares redeemed | | | (2,070,805 | ) | | | (25,780,688 | ) | | | (497,171 | ) | | | (7,010,597 | ) |
| Net increase (decrease) | | | (2,045,772 | ) | | $ | (25,469,494 | ) | | | 8,474,795 | | | $ | 100,562,121 | |
*Commencement of investment operations.
**Global Alpha Equity Fund Class 1 was redeemed on July 9, 2013.
| | | Global Alpha Equity Fund
Class 3 Shares
For the
Year Ended
December 31, 2013 |
| | | Shares | | Amount |
| Shares sold | | | 122,034 | | | $ | 1,497,000 | |
| Purchase premium | | | - | | | | 118,949 | |
| Redemption fees | | | - | | | | 7,514 | |
| | | | | | | | | |
| Shares issued in reinvestment of dividends and distributions | | | 727,427 | | | | 10,363,948 | |
| Net increase | | | 849,461 | | | $ | 11,987,411 | |
NOTES TO FINANCIAL STATEMENTS (continued)
December 31, 2013
| | | Global Alpha Equity Fund |
| | | Class 1 Shares
For the Period
May 3, 2012*
through
December 31, 2012 | | Class 2 Shares
For the Period
July 31, 2012*
through
October 8, 2012** |
| | | Shares | | Amount | | Shares | | Amount |
| | | | | | | | | | | | | |
| Shares sold | | | 2,025,187 | | | $ | 21,556,800 | | | | 9,294,664 | | | $ | 96,384,748 | |
| Purchase premium | | | - | | | | 9,241 | | | | - | | | | 15,959 | |
| Shares issued in reinvestment of dividends and distributions | | | 20,585 | | | | 226,914 | | | | - | | | | - | |
| Shares redeemed | | | - | | | | - | | | | (9,294,664 | ) | | | (104,146,842 | ) |
| Net increase (decrease) | | | 2,045,772 | | | $ | 21,792,955 | | | | - | | | $ | (7,746,135 | ) |
*Commencement of investment operations.
**Global Alpha Equity Fund Class 2 was redeemed on October 8, 2012.
| | | Global Alpha Equity Fund
Class 3 Shares
For the
Year Ended
December 31, 2012 |
| | | Shares | | Amount |
| | | | | | | |
| Shares sold | | | 9,131,191 | | | $ | 104,146,842 | |
| Purchase premium | | | - | | | | 53,768 | |
| Shares issued in reinvestment of dividends and distributions | | | 243,680 | | | | 2,780,220 | |
| Shares redeemed | | | - | | | | - | |
| Net increase | | | 9,374,871 | | | $ | 106,980,830 | |
Funds charged the following purchase premiums and redemption fees as of December 31, 2013:
| Fund | Purchase Premium | Redemption Fee |
| | (Basis Point) | (Basis Point) |
| International Equity | 20 | 15 |
| International Choice | 20 | 15 |
| EAFE | 20 | 15 |
| EAFE Choice | 20 | 15 |
| Emerging Markets | 55* | 25 |
| Global Alpha Equity | 20 | 15 |
*In consideration of the actual brokerage and transaction costs borne by the Emerging Markets Fund, the Manager, effective December 6, 2013, exercised its discretion to reduce the Purchase Premium for this Fund to 35 basis points.
NOTES TO FINANCIAL STATEMENTS (continued)
December 31, 2013
The purchase premiums and redemption fees may be waived or reduced by the Manager if the brokerage and transaction costs in connection with the purchase or redemption are minimal or in other circumstances in the Manager’s discretion.
Note E – Beneficial Ownership
The beneficial ownership, either directly or indirectly, of more than 25% of the voting securities of a Fund creates a presumption of control under Section 2(a)(9) of the 1940 Act. As of December 31, 2013, Kentucky Teachers’ Retirement System owned 32.29% of the EAFE Fund; Graphic Packaging Holdings Company owned 65.80% of the EAFE Choice Fund; the Municipal Fire & Police Retirement System of Iowa owned 64.54% of the International Choice Fund; Nebraska State Investment Council owned 48.97% of the Emerging Markets Fund; and Freeport McMoran Corporation Defined Benefit Master Trust owned 37.95% and Promedica Health owned 32.28% of the Global Alpha Equity Fund. Purchase and redemption activity of these accounts may have a significant effect on the operation of each Fund.
NOTES TO FINANCIAL STATEMENTS (concluded)
December 31, 2013
Note F – Commitments and Contingencies
Each of the Funds indemnifies the Trust’s officers and Trustees for certain liabilities that might arise from the performance of their duties to the Fund. Additionally, in the normal course of business, each Fund enters into contracts that contain a variety of representations and warranties and which provide general indemnifications. The Funds’ maximum exposure under these arrangements is unknown, as this would involve future claims that may be made against the Funds that have not yet occurred. However, based on experience, the Funds expect the risk of loss to be remote.
Note G – Subsequent Events
Events or transactions that occur after the financial statement date but before the financial statements are issued are categorized as recognized or non-recognized for financial statement purposes. Subsequent to December 31, 2013, management of the Funds has amended the purchase premiums and redemption fees as noted below. The new fee structure is effective February 3, 2014.
| Fund | Original Purchase Premium
(as a percentage of amount
purchased) | Amended Purchase
Premium
(as a percentage of
amount purchased) |
| International Equity Fund | 0.20% | 0.30% |
| International Choice Fund | 0.20% | 0.30% |
| EAFE Fund | 0.20% | 0.30% |
| EAFE Choice Fund | 0.20% | 0.30% |
| Emerging Markets Fund | 0.55% | 0.35% |
| Global Alpha Equity Fund | 0.20% | 0.20% |
| Fund | Original Redemption Fee
(as a percentage of amount
purchased) | Amended Redemption
Fee
(as a percentage of
amount purchased) |
| International Equity Fund | 0.15% | 0.20% |
| International Choice Fund | 0.15% | 0.20% |
| EAFE Fund | 0.15% | 0.20% |
| EAFE Choice Fund | 0.15% | 0.20% |
| Emerging Markets Fund | 0.25% | 0.35% |
| Global Alpha Equity Fund | 0.15% | 0.15% |
Effective January 1, 2014, Robert E.Rigsby joined the Board of Trustees of the Trust as an Disinterested Trustee.

REPORT OF INDEPENDENT REGISTERED PUBLIC ACCOUNTING FIRM
To the Board of Trustees of Baillie Gifford Funds
and Shareholders of Baillie Gifford International Equity Fund,
Baillie Gifford International Choice Fund, Baillie Gifford EAFE Fund,
Baillie Gifford EAFE Choice Fund, Baillie Gifford Emerging Markets Fund
and Baillie Gifford Global Alpha Equity Fund
We have audited the accompanying statements of assets and liabilities of the Baillie Gifford International Equity Fund, Baillie Gifford International Choice Fund, Baillie Gifford EAFE Fund, Baillie Gifford EAFE Choice Fund, Baillie Gifford Emerging Markets Fund and Baillie Gifford Global Alpha Equity Fund (the “Funds”), each a series of shares of beneficial interest in the Baillie Gifford Funds, including the portfolios of investments, as of December 31, 2013, and the related statements of operations for the year then ended, the statements of changes in net assets for each of the years and periods in the two-year period then ended and the financial highlights for each of the years and periods in the five-year period then ended. These financial statements and financial highlights are the responsibility of the Funds’ management. Our responsibility is to express an opinion on these financial statements and financial highlights based on our audits.
We conducted our audits in accordance with the standards of the Public Company Accounting Oversight Board (United States). Those standards require that we plan and perform the audits to obtain reasonable assurance about whether the financial statements and financial highlights are free of material misstatement. An audit includes examining, on a test basis, evidence supporting the amounts and disclosures in the financial statements. Our procedures included confirmation of securities owned as of December 31, 2013 by correspondence with the custodian and brokers. An audit also includes assessing the accounting principles used and significant estimates made by management, as well as evaluating the overall financial statement presentation. We believe that our audits provide a reasonable basis for our opinion.
In our opinion, the financial statements and financial highlights referred to above present fairly, in all material respects, the financial position of Baillie Gifford International Equity Fund, Baillie Gifford International Choice Fund, Baillie Gifford EAFE Fund, Baillie Gifford EAFE Choice Fund, Baillie Gifford Emerging Markets Fund and Baillie Gifford Global Alpha Equity Fund as of December 31, 2013, and the results of their operations for the year then ended, the changes in their net assets for each of the years and periods in the two-year period then ended and their financial highlights for each of the years and periods in the five-year period then ended in conformity with accounting principles generally accepted in the United States of America.
BBD, LLP
Philadelphia, Pennsylvania
February 26, 2014
Supplemental Information (unaudited)
FEDERAL INCOME TAX INFORMATION
Qualified dividend income was taxable to the Funds listed in the table below through December 31, 2013. The Funds intend to designate the maximum amount of dividends that qualify for the reduced tax rate pursuant to the Jobs and Growth Tax Relief Reconciliation Act of 2003.
| Fund | Qualified
Dividend Income |
| International Equity | $49,023,081 |
| International Choice | 2,273,165 |
| EAFE | 37,572,783 |
| EAFE Choice | 2,867,392 |
| Emerging Markets | 3,617,013 |
| Global Alpha Equity | 6,149,068 |
For corporate shareholders, the percentage of ordinary income distributions for the year ended December 31, 2013 qualified for the corporate dividends-received deduction for each Fund is:
| Fund | Dividends-received
Deductions |
| International Equity | 0.44% |
| International Choice | 1.57% |
| EAFE Choice | 1.02% |
| Global Alpha Equity | 21.55% |
In January 2014, you will be advised on IRS Form 1099 DIV or substitute 1099 DIV as to the U.S. federal tax status of distributions received by you in the calendar year 2013.
Supplemental Information (unaudited)
MANAGEMENT OF THE TRUST
The following tables set forth the Trustees and Officers of the Trust, their principal occupations during the past five years, and certain other information.
| Name and Age(1) | | Position(s)
Held with
Trust | | Length of
Time
Served(2) | | Principal Occupation During Past 5 Years(3) | | Number of Funds in
Fund complex
overseen by
Trustee(4) |
| Disinterested Trustees | |
John G. Barrie, Jr.
Age: 73 | | Trustee | | Since 2000 | | Retired. Formerly: Assistant Treasurer, Dominion Resources, Inc. (electric and gas utility). | | 9 |
George W. Browning
Age: 71 | | Trustee | | Since 2007 | | Retired. Formerly: Managing Director, Client Service, Babson Capital Management, LLC (investment manager). | | 9 |
Bruce C. Long
Age: 68 | | Trustee | | Since 2009 | | CEO of K STREAM LLC (financial services); Consultant, Carpenter Group (financial services); Consultant, DALBAR, Inc., (financial measurements). Formerly: Executive Vice President, Guardian Life Insurance (financial services) and director of various entities. | | 9 |
Robert E. Rigsby
Age: 64 | | Trustee | | Since 2014 | | Retired. Formerly: President & COO, Delivery Business at Dominion Resources, Inc. (electric and gas utility) | | 9 |
| Interested Trustee |
Peter Hadden(5)
Age: 55 | | Trustee, Chairman of the Board and President | | Since 2009 | | Partner, Baillie Gifford & Co. (investment manager); Director, Baillie Gifford Overseas Ltd. (investment adviser). | | 9 |
| Officers (other than Officers who are also Trustees) | |
Dickson Jackson
Age: 41 | | Vice President | | Since 2005 | | Director, Investment Operations, Baillie Gifford & Co. (investment manager); Director, Baillie Gifford Overseas Limited (investment adviser). | | N/A |
Andrew Telfer
Age: 46 | | Vice President | | Since 2008 | | Partner, Baillie Gifford & Co. (investment manager) | | N/A |
Peter Cooke
Age: 49 | | Vice President | | Since 2008 | | Partner, Baillie Gifford & Co. (investment manager). | | N/A |
Michael Stirling-Aird
Age: 37 | | Vice President | | Since 2012 | | Client Service Director, Baillie Gifford Overseas Limited (investment adviser). | | N/A |
Julie Wilson
Age: 38 | | Vice President | | Since 2012 | | Assistant Manager, Overseas Institutional Clients Accounting Department, Baillie Gifford & Co. (investment manager). | | N/A |
Nigel Cessford
Age: 50 | | Treasurer | | Since 2005 | | Manager, Overseas Institutional Clients Accounting Department | | N/A |
Angus N.G. Macdonald
Age: 48 | | Secretary | | Since 2000 | | Head of Group Legal for the Baillie Gifford Group (investment manager). | | N/A |
Graham Laybourn
Age: 47 | | Chief Compliance Officer | | Since 2005 | | Partner, Baillie Gifford & Co. (investment manager), Director of Compliance & Legal for the Baillie Gifford Group. | | N/A |
Supplemental Information (unaudited)
| (1) | The address of each Trustee and Officer of the Trust is c/o Baillie Gifford Funds, Calton Square, 1 Greenside Row, Edinburgh, Scotland EH1 3AN. |
| (2) | There is no stated term of office for the Trustees and a Trustee may serve until such Trustee reaches the age of 75 years. Thereafter, such Trustee offers to tender his or her resignation from the Board, and the Nominating and Governance Committee, at its discretion, makes a recommendation to the Board whether to accept or reject such resignation annually. The Chairman of the Board and President of the Trust are elected annually by the Board of Trustees. Other officers may be elected or appointed by the Trustees at any time. |
| (3) | Previous positions during the past five years with Baillie Gifford & Co., the Manager and Baillie Gifford Group are omitted if not materially different from the positions listed. |
| (4) | The number of Funds in the Fund complex overseen by the Trustee includes the North American Equity Fund, the Emerging Markets Bond Fund and the EAFE Pure Fund, three series of the Trust which have not yet commenced operations. |
| (5) | Mr. Hadden is an “interested person” (as defined in the 1940 Act) of the Trust or the Manager due to his positions with the Manager (Baillie Gifford Overseas Ltd.) and his role as an officer of the Trust. |
Additional information regarding the Trustees is in the Funds’ Statement of Additional Information and is available upon request, without charge, by calling Baillie Gifford Overseas Limited at 011-44-131-275-2000.
A description of the Funds’ proxy voting policies and procedures related to portfolio securities is available without charge, upon request, by calling Baillie Gifford Overseas Limited at 011-44-131-275-2000 or on the SEC’s website at http://www.sec.gov. Shareholders may submit to the Trust claims for reimbursement of telephone charges incurred in placing such calls.
Information regarding how the Funds voted proxies relating to portfolio securities during the most recent 12-month period ended June 30 is also available without charge upon request by calling Baillie Gifford Overseas Limited at 011-44-131-275-2000 or by accessing the Fund’s Form N-PX on the SEC’s website at http://www.sec.gov. Shareholders may submit to the Trust claims for reimbursement of telephone charges incurred in placing such calls.
Each of the Funds files its complete schedule of portfolio holdings with the SEC for the first and third quarters of each fiscal year on Form N-Q. The Funds’ Form N-Q is available on the SEC’s website at http://www.sec.gov. The Funds’ Form N-Q may also be viewed and copied at the SEC’s Public Reference Room in Washington, DC; information on the operation of the Public Reference Room may be obtained by calling (800) SEC-0330.
Item 2. Code of Ethics.
| (a) | | The registrant, as of the end of the period covered by this report, has adopted a code of ethics that applies to the registrant’s principal executive officer, principal financial officer, principal accounting officer or controller, or persons performing similar functions, regardless of whether these individuals are employed by the registrant or a third party. |
| | | |
| (b) | | Not applicable. |
| | | |
| (c) | | There have been no amendments, during the period covered by this report, to a provision of the code of ethics that applies to the registrant’s principal executive officer, principal financial officer, principal accounting officer or controller, or persons performing similar functions, regardless of whether these individuals are employed by the registrant or a third party, and that relates to any element of the code of ethics description. |
| | | |
| (d) | | The registrant has not granted any waivers, including an implicit waiver, from a provision of the code of ethics that applies to the registrant’s principal executive officer, principal financial officer, principal accounting officer or controller, or persons performing similar functions, regardless of whether these individuals are employed by the registrant or a third party. |
| | | |
| (e) | | Not applicable. |
| | | |
| (f) | | The registrant’s Code of Ethics is attached hereto as an exhibit. |
Item 3. Audit Committee Financial Expert.
As of the end of the period covered by the report, the registrant’s Board of Trustees has determined that Mr. John G. Barrie, Jr., is qualified to serve as an audit committee financial expert serving on its audit committee and that he is “independent,” as defined by Item 3 of Form N-CSR.
Item 4. Principal Accountant Fees and Services.
Audit Fees
| (a) | | The aggregate fees billed for each of the last two fiscal years for professional services rendered by the principal accountant for the audit of the registrant’s annual financial statements or services that are normally provided by the accountant in connection with statutory and regulatory filings or engagements for those fiscal years are $105,500 for 2012 and $114,000 for 2013. |
Audit-Related Fees
| (b) | | The aggregate fees billed in each of the last two fiscal years for assurance and related services by the principal accountant that are reasonably related to the performance of the audit of the registrant’s financial statements and are not reported under paragraph (a) of this Item are $0 for 2012 and $0 for 2013. |
Tax Fees
| (c) | | The aggregate fees billed in each of the last two fiscal years for professional services rendered by the principal accountant for tax compliance, tax advice, and tax planning are $24,000 for 2012 and $24,000 for 2013. |
All Other Fees
| (d) | | The aggregate fees billed in each of the last two fiscal years for products and services provided by the principal accountant, other than the services reported in paragraphs (a) through (c) of this Item are $0 for 2012 and $0 for 2013. |
| (e)(1) | | Engagements that are required to be pre-approved by the registrant’s Audit Oversight Committee, “the Committee”, may be pre-approved (i) at any regular or special meeting of the Committee or (ii) by any member of the Committee, provided that such member must report, for informational purposes only, any pre-approval decisions to the Board at its next regularly scheduled meeting. |
| | | |
| (e)(2) | | The percentage of services described in each of paragraphs (b) through (d) of this Item that were approved by the audit committee pursuant to paragraph (c)(7)(i)(C) of Rule 2-01 of Regulation S-X are as follows: |
(b) Not Applicable.
(c) 100%
(d) Not Applicable.
| (f) | | Not applicable. |
| | | |
| (g) | | The aggregate non-audit fees billed by the registrant’s accountant for services rendered to the registrant, and rendered to the registrant’s investment adviser (not including any sub-adviser whose role is primarily portfolio management and is subcontracted with or overseen by another investment adviser), and any entity controlling, controlled by, or under common control with the adviser that provides ongoing services to the registrant for each of the last two fiscal years of the registrant was $0 for 2012 and $0 for 2013. |
| | | |
| (h) | | Not applicable. |
Item 5. Audit Committee of Listed Registrants.
Not applicable.
Item 6. Investments.
| (a) | Schedule of Investments in securities of unaffiliated issuers as of the close of the reporting period is included as part of the report to shareholders filed under Item 1 of this form. |
| (b) | In accordance with Section 13(c) of the Investment Company Act of 1940, the registrant has divested itself of the following securities since the filing of its last report of Form N-CSR: |
Emerging Markets Fund
Name of
Issuer | Exchange
Ticker
Symbol | Security
Identifier
(CUSIP
number) | Total
number of
shares
divested | Date
securities
were
divested | Amount
Held on
Filing Date | Statute |
| Turkiye Halk Bankasi | HALKB TI | B1WTMP0 | 289,200 | 09/30/2013 | 0 | Sudan Accountability and Divestment Act of 2007; Comprehensive Iran Sanctions, Accountability, and Divestment Act of 2010 |
International Equity Fund
Name of
Issuer | Exchange
Ticker
Symbol | Security
Identifier
(CUSIP
number) | Total
number of
shares
divested | Date
securities
were
divested | Amount
Held on
Filing Date | Statute |
| Mitsui | 8031 JP | 6597302 | 1,003,800 | 09/20/2013 | 0 | Sudan Accountability and Divestment Act of 2007; Comprehensive Iran Sanctions, Accountability, and Divestment Act of 2010 |
International Choice Fund
Name of
Issuer | Exchange
Ticker
Symbol | Security
Identifier
(CUSIP
number) | Total
number of
shares
divested | Date
securities
were
divested | Amount
Held on
Filing Date | Statute |
| Gail (India) | GAID L1 | 3235520 | 31,021 | 10/21/2013 | 0 | Sudan Accountability and Divestment Act of 2007; Comprehensive Iran Sanctions, Accountability, and Divestment Act of 2010 |
Item 7. Disclosure of Proxy Voting Policies and Procedures for Closed-End Management Investment Companies.
Not applicable.
Item 8. Portfolio Managers of Closed-End Management Investment Companies.
Not applicable.
Item 9. Purchases of Equity Securities by Closed-End Management Investment Company and Affiliated Purchasers.
Not applicable.
Item 10. Submission of Matters to a Vote of Security Holders.
Not applicable.
Item 11. Controls and Procedures.
| (a) | | The registrant’s principal executive and principal financial officers, or persons performing similar functions, have concluded that the registrant’s disclosure controls and procedures (as |
| | | defined in Rule 30a-3(c) under the Investment Company Act of 1940, as amended (the “1940 Act”) (17 CFR 270.30a-3(c))) are effective, as of a date within 90 days of the filing date of the report that includes the disclosure required by this paragraph, based on their evaluation of these controls and procedures required by Rule 30a-3(b) under the 1940 Act (17 CFR 270.30a-3(b)) and Rules 13a-15(b) or 15d-15(b) under the Securities Exchange Act of 1934, as amended (17 CFR 240.13a-15(b) or 240.15d-15(b)). |
| | | |
| (b) | | There were no changes in the registrant’s internal control over financial reporting (as defined in Rule 30a-3(d) under the 1940 Act (17 CFR 270.30a-3(d)) that occurred during the registrant’s second fiscal quarter of the period covered by this report that has materially affected, or is reasonably likely to materially affect, the registrant’s internal control over financial reporting. |
Item 12. Exhibits.
| | (a)(1) | | Code of ethics, or any amendment thereto, that is the subject of disclosure required by Item 2 is attached hereto. |
| | | | |
| | (a)(2) | | Certifications pursuant to Rule 30a-2(a) under the 1940 Act and Section 302 of the Sarbanes-Oxley Act of 2002 are attached hereto. |
| | | | |
| | (a)(3) | | Not applicable. |
| | | | |
| | (b) | | Certifications pursuant to Rule 30a-2(b) under the 1940 Act and Section 906 of the Sarbanes-Oxley Act of 2002 are attached hereto. |
SIGNATURES
Pursuant to the requirements of the Securities Exchange Act of 1934 and the Investment Company Act of 1940, the registrant has duly caused this report to be signed on its behalf by the undersigned, thereunto duly authorized.
| (Registrant) | | Baillie Gifford Funds |
| By (Signature and Title)* | /s/ Peter Hadden |
| | Peter Hadden, President |
| | (principal executive officer) |
Pursuant to the requirements of the Securities Exchange Act of 1934 and the Investment Company Act of 1940, this report has been signed below by the following persons on behalf of the registrant and in the capacities and on the dates indicated.
| By (Signature and Title)* | /s/ Peter Hadden |
| | Peter Hadden, President |
| | (principal executive officer) |
| By (Signature and Title)* | /s/ Nigel Cessford |
| | Nigel Cessford, Treasurer |
| | (principal financial officer) |
| * | Print the name and title of each signing officer under his or her signature. |