UNITED STATES
SECURITIES AND EXCHANGE COMMISSION
Washington, D.C. 20549
FORM N-CSR
CERTIFIED SHAREHOLDER REPORT OF REGISTERED
MANAGEMENT INVESTMENT COMPANIES
Investment Company Act file number: 811-10045
CALVERT IMPACT FUND, INC.
(Exact name of registrant as specified in charter)
4550 Montgomery Avenue
Suite 1000N
Bethesda, Maryland 20814
(Address of Principal Executive Offices)
William M. Tartikoff, Esq.
4550 Montgomery Avenue
Suite 1000N
Bethesda, Maryland 20814
(Name and Address of Agent for Service)
Registrant's telephone number, including area code: (301) 951-4800
Date of fiscal year end: September 30
Date of reporting period: Twelve months ended September 30, 2013
Item 1. Report to Stockholders.
[Calvert Small Cap Fund Annual Report to Shareholders]
and
[Calvert Global Alternative Energy Fund and Calvert Global Water Fund Annual Report to Shareholders]
Choose Planet-friendly E-delivery!
Sign up now for on-line statements, prospectuses, and fund reports. In less than five minutes you can help reduce paper mail and lower fund costs.
Just go to www.calvert.com. If you already have an online account at Calvert, click on My Account, and select the documents you would like to receive via e-mail.
If you’re new to online account access, click on Login/Register to open an online account. Once you’re in, click on the E-delivery sign-up at the bottom of the Account Portfolio page and follow the quick, easy steps. Note: if your shares are not held directly at Calvert but through a brokerage firm, you must contact your broker for electronic delivery options available through their firm.


Barbara Krumsiek
President and CEO of Calvert Investments, Inc.
Dear Calvert Shareholder,
For the 12 months ended September 30, 2013, the global equity markets generally had a strong year, while bonds saw more mixed results. Large-cap stocks, as represented by the Russell 1000 Index, posted a healthy 20.9% return, while the smaller-cap Russell 2000 Index led with a 30.1% gain. This occurred despite political turmoil and market concerns worldwide about a forced shutdown of the U.S. government and the upcoming debt ceiling deadline.
Despite these advances, it was a challenging year for the financial markets overall. At various times, issues at home and abroad led to marked volatility in the performance of both stocks and bonds. Emerging-market performance was notably low, as fears of slowing growth in China and the Eurozone, along with continuing struggles in the Eurozone periphery, stalled regional investment. As a result, the formerly high-flying MSCI Emerging Markets Index gained only 1.3% for the period. The Barclays U.S. Credit Index, a barometer for the overall U.S. bond market, returned -1.9%.
Early in the Fall, Fed Chairman Ben Bernanke’s retirement was big news. The nomination of Vice Chair Janet Yellen as his replacement means the Fed will likely stay the course with current monetary policy. Yet, this is a historic moment for the United States, as Yellen, following Senate approval, will be the first woman to lead this critical agency.
Calvert Co-Founder Honored
I’m proud to congratulate Calvert co-founder Wayne Silby, who received the prestigious Joseph Wharton Award for Social Impact from The Alumni Club of New York, honoring his lifetime of achievement in impact investing and social entrepreneurship. Besides founding Calvert with John Guffey, Wayne is a co-founder of the Social Venture Network, Co-Chairman of the board of the Calvert Foundation, Chairman of Syntao Ltd., a CSR consultancy in Beijing, and active in other ventures in social impact and entrepreneurship.
Calvert Releases New Report on Diversity
In March, we published the latest edition of Examining the Cracks in the Glass Ceiling, which measures diversity practices of the companies that constitute the S&P 100 Index. As you know, Calvert believes companies with a diverse workforce are poised for greater success in today’s increasingly global marketplace and will enjoy greater long-term value—a view supported by a growing body of research from McKinsey, Credit Suisse, and others.
Companies in the report were rated on 10 indicators: EEO policy, internal diversity initiatives, external diversity initiatives, scope of diversity initiatives, family-friendly benefits, demographic disclosure of employees (EEO-1), highest-paid executives, board diversity,
4 www.calvert.com CALVERT SMALL CAP FUND ANNUAL REPORT
director selection criteria, and overall corporate commitment. The highest-rated companies were Citigroup, Merck, The Coca-Cola Company, and J.P. Morgan Chase, all scoring at least 95 points or more out of 100. We hold these companies in a number of our Calvert portfolios.
While some progress has been achieved in corporate diversity practices since our last assessment in 2010, the S&P 100 companies are largely failing to translate progressive practices into increased promotion rates for women and minority employees. For example, women are now hired as often as men. However, more than half of the S&P 100 companies lack diversity among their highest-paid senior executive positions. And women still only represent 19% of board members among these large-cap companies. Much remains to be done, which is why we continue to work with a number of international, multi-stakeholder groups on these issues, as well as conduct advocacy work with individual companies.
Stay Informed in the Months Ahead
Maintaining a well-diversified mix of U.S. and international stocks, bonds, and cash—appropriate for your goals and risk tolerance—is one of the best ways to mitigate the effects of an uneven recovery in the economy and markets. Of course, we recommend consulting your financial advisor if you have questions or concerns about your investments.
We also invite you to visit our website, www.calvert.com, for fund information, portfolio updates, and commentary from Calvert professionals. As always, we thank you for investing with Calvert.
The following companies represented the following percentages of Fund net assets: Citigroup 2.27% of Calvert Large Cap Value, 1.32% of Calvert Social Index; Merck 2.26% of Calvert Equity Income, 2.01% of Calvert Large Cap Value, and 1.25% of Calvert Social Index; Coca-Cola 1.29% of Calvert Social Index, 3.20% of Calvert Large Cap Core and 3.29% Calvert Equity Portfolio; J.P. Morgan Chase 2.54% of Calvert Equity Income, 1.74% of Calvert Social Index and 0.34% of Calvert Balanced Portfolio. Holdings are subject to change.
www.calvert.com CALVERT SMALL CAP FUND ANNUAL REPORT 5

As always, Calvert continues to work hard to ensure you have a say in the responsible management of environmental, social, and governance (ESG) factors for the companies in which we invest. Below are highlights of our accomplishments during the reporting period.
Shareholder Advocacy
Over the past year, Calvert engaged with 139 companies via emails, letters, phone calls, and in-person meetings. We also filed 22 shareholder proposals during the 2013 proxy season, which led to agreements with 14 companies on the issues of board diversity and sustainability reporting, among others. We also presented at four annual meetings where the proposals came to a vote and received shareholder support that exceeded 40% at two companies.
One proposal was for diversified energy services company Cleco, which has significant assets in thermoelectricity, to report on its sustainability risks and opportunities, including an analysis of material water-related risks. The other at Pioneer Natural Resources focused on reporting the environmental and social challenges and opportunities associated with hydraulic fracturing.
Company Engagement
Research and an intensive dialogue across a range of corporate responsibility and sustainability issues led to McDonald’s and Walt Disney meeting our Signature® criteria1 for the first time. McDonald’s is improving its supply chain labor policies and practices, diversifying its menu options, and disclosing their nutritional content—although it continues to face challenges in both areas. Walt Disney now meets the criteria for workplace safety, while continuing to meet our criteria on supply chain labor and human rights practices.
We undertook more engagement with Coca-Cola and PepsiCo on labor and human rights, water, and sustainability issues. In fact, PepsiCo management credited our recommendations with influencing their decision to strengthen their human rights policy framework.
Climate Change And Energy
Calvert, the World Wildlife Fund (WWF) and Ceres published, “Power Forward: Why the World’s Largest Companies are Investing in Renewable Energy.” The report found that more than half of the largest U.S. corporations and more than two-thirds of the largest companies across the globe have set greenhouse gas (GHG) emissions reduction commitments and/or renewable energy commitments.
Calvert joined with other Investor Network on Climate Risk (INCR) members to speak at congressional staff briefings about recommendations for corporations in the report and draft an investor letter to Congress supporting the production tax credit (PTC) for wind
6 www.calvert.com CALVERT SMALL CAP FUND ANNUAL REPORT
energy, which was due to expire at the end of 2012. The report, briefings and investor letter helped spur extension of the PTC to support the growth of renewable energy.
350.Org Divestment Campaign On Fossil Fuels
Calvert watched closely the 350.org campaign urging college and university endowments, as well as other institutional investors, to divest from companies producing fossil fuels. In December, Calvert posted a statement on our website expressing support for the campaign’s broad objectives while making the case for a complementary strategy of active ownership and engagement. The statement pointed to specific fossil fuel companies such as Denbury Resources and Suncor Energy that Calvert has successfully engaged on climate change, alternative energy, and revenue transparency.
Burma
After the lifting of U.S. sanctions prohibiting new investment in Burma by American companies, the Calvert Social Funds Board approved revisions to Calvert’s long-standing policy language in September. Instead of urging U.S. companies to “cease operations” in Burma, the new language instead calls for Calvert to advocate for “responsible investment.”
Garment Industry Safety
Following the Rana Plaza tragedy earlier this year, where more than 1,100 Bangladesh garment factory workers were killed, Calvert assessed the state of significant country-level sourcing disclosure by retail companies, which is essential to assessing sourcing risks more effectively. After learning that only a handful of companies disclose this necessary data, we contacted 26 retail company CEOs requesting disclosure of sourcing information for those countries representing 5% or more of global order volume.
Human Rights Report
In March, Calvert, Interfaith Center on Corporate Responsibility and the Institute for Human Rights and Business launched “Investing the Rights Way: A Guide for Business and Human Rights” in both New York and London. The guide outlines how investors can apply the UN Guiding Principles on Business and Human Rights as a due diligence and risk assessment framework to assess companies in their portfolios.
Conflict Minerals
Calvert continued to be a leader among investors on “conflict minerals” through a multi-stakeholder group supporting disclosure requirements enacted as Section 1502 of the Dodd-Frank Wall Street Reform and Consumer Protection Act of 2010. The disclosure would certify that certain minerals used in cell phones and other consumer electronic components (tin, titanium, tantalum and gold) are not illegally mined to fuel the continuing bloody conflict in the Democratic Republic of Congo (DRC).
After the SEC approved and released the final rule to implement the reporting requirements of Section 1502 in August 2012, the U.S. Chamber of Commerce filed a lawsuit against the Securities and Exchange Commission (SEC) to stop implementation. Calvert led the multi-stakeholder group’s effort to forge a common statement urging implementation of the law as outlined by the rule, regardless of the lawsuit. On July 23, the court upheld the “conflict minerals rule” in favor of the SEC and the statute requiring adoption of the rule—a major victory for Calvert and its allies.
www.calvert.com CALVERT SMALL CAP FUND ANNUAL REPORT 7
Extractives Revenue Transparency
Widely credited for its leadership role among investors in supporting extractive revenue transparency as an imperative for investors interested in full disclosure of material information related to oil, gas and mining in certain countries, Calvert has remained actively engaged in the SEC rule-making process. The U.S. Chamber of Commerce and the American Petroleum Institute filed a lawsuit challenging the pro-disclosure rules, Calvert submitted a sworn statement about the problems investors would face if the rules were delayed or revoked. We also sent letters to the SEC emphasizing the materiality of disclosures required by the rules and contributed research to Oxfam America’s January 2013 brief.
On July 2, the court “vacated” the SEC’s rule, declaring it inoperative until the SEC addresses certain key issues (the necessity for exemptions for certain countries and public reporting of the disclosures). Calvert subsequently drafted a letter to SEC Chairman Mary Jo White that acknowledged the value of the Commission’s rules to implement Section 1504 and urged her respond to the API vs. SEC decision by reinstating rules consistent with those issued in August 2012, which were endorsed by investors representing more than $5.6 trillion in assets under management.
1. Calvert’s Signature® criteria examine corporate performance across seven broad areas of concern: Governance and Ethics, Environment, Workplace, Product Safety and Impact, International Operations and Human Rights, Indigenous Peoples’ Rights, and Community Relations. For a company to be eligible for inclusion in a Calvert Signature portfolio, it must meet the criteria in all seven categories.
The following companies represented the following percentages of net assets: Cleco 0.02% of Calvert Social Index; Pioneer Natural Resources 0.23% of Calvert Social Index and 1.39% of Calvert Balanced Portfolio; McDonald’s 0.86% of Calvert Social Index and 2.35% of Calvert Equity Portfolio, Walt Disney 0.96% of Calvert Social Index and 2.25% of Calvert Equity Portfolio; Coca-Cola 1.29% of Calvert Social Index, 3.20% of Calvert Large Cap Core and 3.29% Calvert Equity Portfolio; PepsiCo 1.10% of Calvert Social Index, 1.20% of Calvert Equity Portfolio and 0.54% of Calvert Balanced Portfolio; Denbury Resources 0.06% of Calvert Social Index and 2.86% of Calvert Large Cap Core; and Suncor Energy 0.71%% of Calvert International Equity Portfolio. Holdings are subject to change.
8 www.calvert.com CALVERT SMALL CAP FUND ANNUAL REPORT

Investment Performance
Calvert Small Cap Fund’s Class A Shares (at NAV) returned 32.42% for the 12-month period ended September 30, 2013, outperforming the Russell 2000 Index, which returned 30.06%. The outperformance is largely attributable to effective stock selection.
Investment Climate
Equities faced a brief pullback in late 2012, but recovered and posted strong gains throughout most of 2013. The third round of quantitative easing (QE), unleashed in mid-2012, provided an impetus for equity investors to look past numerous macro head-winds from fiscal cliff debates, sequester, slow growth in China and the Eurozone, and weak corporate earnings. The macro-economic picture in the U.S. continued to show improvement in the key economic sectors—housing and employment. For the year, the S&P 500, Russell 1000, Russell 2000, MSCI EAFE, and MSCI Emerging Markets Indices returned 19.34%, 20.91%, 30.06%, 24.92%, and 1.33%, respectively.
Value stocks outperformed growth stocks by 3.03%, as measured by the Russell 1000 Value and Russell 1000 Growth Indices for the 12-month period. Within the Russell 1000 Index, Consumer Discretionary, Industrials, and Health Care were the top-performing sectors, while Telecoms, Utilities, and Materials lagged.
Corporate Earnings Are Weaker
Corporate earnings reports in late 2012 and throughout the first half of 2013 were largely weak on both the top- and bottom-line figures, with the sequester negatively impacting corporate results in the first half of 2013.
Sounding a cautious note, several bellwether companies that reported late in the summer of 2013, including names like Walmart and Cisco, issued reduced earnings forecasts citing everything from consumer weakness to fears of rising interest rates. We continue to believe that, going forward, the U.S. economic recovery can be sustained and able to support earnings growth for U.S. companies.
Improving Macro-Economic Picture in the U.S., But Continued Softness Abroad
Throughout the year, U.S. macro indicators continued to improve, albeit slowly. The unemployment rate ticked down to just above 7% and initial jobless claims hit post-financial crisis lows in the third quarter of 2013. New job growth remains sluggish. However, consumers continue to remain upbeat and willing to spend on bigger-ticket
www.calvert.com CALVERT SMALL CAP FUND ANNUAL REPORT 9
| | |
| CALVERT |
| SMALL CAP FUND |
| SEPTEMBER 30, 2013 |
| |
| | % OF TOTAL | |
| ECONOMIC SECTORS | INVESTMENTS | |
| Consumer Discretionary | 12.0 | % |
| Consumer Staples | 5.0 | % |
| Energy | 5.0 | % |
| Financials | 17.8 | % |
| Health Care | 11.2 | % |
| Industrials | 12.6 | % |
| Information Technology | 12.5 | % |
| Materials | 4.5 | % |
| Short-Term Investments | 16.6 | % |
| Telecommunication Services | 1.2 | % |
| Utilities | 1.6 | % |
| Total | 100 | % |
| CALVERT |
| SMALL CAP FUND |
| SEPTEMBER 30, 2013 |
| |
| INVESTMENT PERFORMANCE | | | |
| (TOTAL RETURN AT NAV*) | | | |
| | 6 MONTHS | | 12 MONTHS | |
| | ENDED | | ENDED | |
| | 9/30/13 | | 9/30/13 | |
| Class A | 15.34 | % | 32.42 | % |
| Class B | 14.50 | % | 30.40 | % |
| Class C | 14.96 | % | 31.35 | % |
| Class I | 15.87 | % | 33.43 | % |
| |
| Russell 2000 | | | | |
| Index | 13.61 | % | 30.06 | % |
| |
| Lipper Small | | | | |
| Cap Core | | | | |
| Funds Average | 11.92 | % | 28.77 | % |
| TEN LARGEST | % OF NET | |
| STOCK HOLDINGS | ASSETS | |
| Sanmina Corp. | 3.8 | % |
| Platinum Underwriters | | |
| Holdings Ltd. | 2.8 | % |
| Deluxe Corp. | 2.8 | % |
| Grand Canyon Education, Inc. | 2.7 | % |
| Worthington Industries, Inc. | 2.6 | % |
| Barnes Group, Inc. | 2.6 | % |
| Texas Roadhouse, Inc. | 2.5 | % |
| Belden, Inc. | 2.4 | % |
| Brown Shoe Co., Inc. | 2.4 | % |
| Molina Healthcare, Inc. | 2.4 | % |
| Total | 27.0 | % |
* Investment performance/return at NAV does not reflect the deduction of the Fund’s maximum 4.75% front-end sales charge or any deferred sales charges.
items, as reflected in improving vehicle and home sales. Sales of previously owned homes hit a three-year high in May of 2013 and housing prices continued to trend upward, despite the looming threat of rising interest rates.
Abroad, developed markets kept pace with the U.S., but emerging markets were rattled by developments in China and the Eurozone periphery. A transition of power in China went smoothly, but new leadership promised to curb excesses in the economy, triggering fears of an economic slowdown. The pullback reached its climax with a 14% sell-off in the Shanghai composite in June that rattled markets around the globe. Elsewhere in Asia, Japan launched an unprecedented QE program in late 2012, triggering a massive rally in Japanese equi-
ties and a large sell-off in the yen. With similar (but smaller) policy measures in Europe, investors began to focus on the theme of coordinated global QE as a stabilizing force for the global economy in the near term, despite potentially negative effects in the longer term.
10 www.calvert.com CALVERT SMALL CAP FUND ANNUAL REPORT
In Europe, economic turmoil in the so called “PIIGS” (Portugal, Italy, Ireland, Greece and Spain) continued to simmer in the background. While Italy nearly saw its government collapse, unemployment in Spain reached almost 50% among youth—reminding investors that the region, while improving, remains fragile.
Federal Reserve: QE Taper and Transition Talk
During the summer, investor consensus largely settled around the view that the Federal Reserve (Fed) would begin tapering its QE program in September of 2013 by reducing both its Treasury and mortgage-backed security purchases. This view took hold despite weakness in both employment and inflation, the two areas highlighted by Fed Chairman Ben Bernanke as needing improvement before tapering would begin. Nevertheless, the “surprise” decision not to taper in September caught market participants off guard, sending equities up and sparking a retreat in bond yields.
As markets digested the lack of a QE taper – and largely gave back the equity gains won on the news – focus also returned to the transition of the Fed Chairman role. With Larry Summers removing himself from consideration, consensus coalesced around eventual nominee Vice Chair Janet Yellen, a selection largely signaling favor for continuing current monetary policy with little change.
With Political Stalemate in Washington, It’s Déjà Vu All Over Again…
The debt ceiling drama of 2011 reared its head again in late September 2013. The government shutdown and debt ceiling impasse in Washington fueled uncertainty and created a negative feedback loop in the U.S. economy. Although U.S. labor conditions improved materially since the asset purchase program began, recent reductions in public-sector employment were felt in the July and August employment reports.
The U.S. Congress failed to approve a budget to fund the government past September 30, which culminated in the shutdown of the federal government. Equity markets appeared largely unconcerned with the event in September despite the looming U.S. debt ceiling debate. Congress was not able to raise the debt ceiling until hours before the October 17 deadline identified by the Treasury Department.
Although the markets welcomed the resolution, the turmoil took its toll. Estimates of fiscal drag from the shutdown were in the billions, while credit-rating firm Fitch put the nation’s credit rating on negative outlook as a result of the political stalemate and inability to take timely action on raising the debt ceiling.
Portfolio Strategy
U.S. small-cap stocks posted impressive returns with the Russell 2000 Index returning 30.06% for the period. Calvert Small Cap Fund, which returned 32.42%, outperformed its benchmark by 2.36% due to effective stock selection. Stock selection was notably strong across several sectors with the largest impacts from our picks in Financials, Energy, Materials and Industrials.
Our stock selection in Financials produced significant contributions to the Fund’s relative outperformance. Top performers included commercial banker SVB Financial Group and loan servicing company Nelnet, which were up 43% and 70%, respectively.1 Additionally, Platinum Underwriters Holdings, Ltd., a company that offers reinsurance
www.calvert.com CALVERT SMALL CAP FUND ANNUAL REPORT 11
and risk management to other insurance companies, gained 47% as the company beat analysts’ earnings estimates throughout the period. We also added value in the sector by avoiding the interest-rate sensitive real estate investment trusts (REITs).
In Energy, New Orleans-based EPL Oil and Gas rose over 77%. EPL increased its revenue by 85% and its earnings per share by 176% year-over-year as of June 30, 2013. Energy services companies Exterran Holdings and Helix Energy Solutions Group contributed to the outperformance as well, returning 59% and 39%, respectively.
Worthington Industries, a metal processing company within the Materials sector, gained 62%. As falling steel prices prompted international competitors to reduce their exports to the U.S., Worthington was able to increase its market share.
In Industrials, cable and networking products manufacturer Belden was up over 72% as its sales growth and margins improved after a lackluster 2012. Two other picks in Industrials that made positive contributions were office furniture manufacturer Steelcase and SkyWest airline, which returned 65% and 58%, respectively.
| CALVERT |
| SMALL CAP FUND |
| SEPTEMBER 30, 2013 |
| |
| AVERAGE ANNUAL TOTAL RETURNS | |
| |
| CLASS A SHARES | (WITH MAX. LOAD) | |
| One year | 26.10 | % |
| Five year | 9.40 | % |
| Since inception (10/1/2004) | 5.60 | % |
| |
| CLASS B SHARES | (WITH MAX. LOAD) | |
| One year | 25.40 | % |
| Since inception (11/29/2010) | 13.30 | % |
| |
| CLASS C SHARES | (WITH MAX. LOAD) | |
| One year | 30.35 | % |
| Five year | 9.48 | % |
| Since inception (4/1/2005) | 4.99 | % |
| |
| CLASS I SHARES | | |
| One year | 33.43 | % |
| Five year | 11.33 | % |
| Since inception (4/29/2005) | 7.71 | % |
Across other sectors, the Fund benefited from our selection of Health Care companies Molina Healthcare and USANA Health Sciences, which returned 51% and 81%, respectively. In the Consumer Discretionary sector, restaurant chain Texas Roadhouse gained 57% and Grand Canyon Education, which provides post-secondary education services, rose 67% after beating analysts’ earnings estimates.
The Fund’s greatest single contribution came from Sanmina Corporation, which designs, engineers and manufactures electronic components. Sanmina’s gross margins increased by 7% year-over-year and the company had strong order increases in the second quarter of 2013. Unfortunately, these positive contributions were partially offset by other stock selections in the Information Technology sector. The largest detractor was Diebold, an IT security systems firm that returned -8%. Diebold’s guidance for 2013 earnings has remained low with expectations of flat revenue growth. Additionally, IT services company Unisys, and Lender Processing, a provider of IT services to the real estate industry, each returned 15%--significantly lagging other small-cap technology stocks.
12 www.calvert.com CALVERT SMALL CAP FUND ANNUAL REPORT
GROWTH OF $10,000
The graph below shows the value of a hypothetical $10,000 investment in the Fund over the past 10 fiscal year periods or since inception (for funds without 10-year records). The results shown are for Class A shares and reflect the deduction of the maximum front-end Class A sales charge of 4.75%, or deferred sales charge, as applicable and assume the reinvestment of dividends. The result is compared with benchmarks that include a broad based market index and a Lipper peer group average. Market indexes are unmanaged and their results do not reflect the effect of expenses or sales charges. The Lipper average reflects the deduction of the category’s average front-end sales charge. The value of an investment in a different share class would be different.
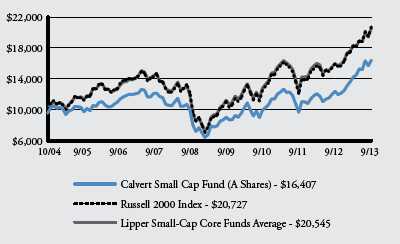
* The month-end date of 10/31/04 is used for comparison purposes only: actual fund inception is 10/1/04.
All performance data shown, including the graph above and the adjacent table, represents past performance, does not guarantee future results, assumes reinvestment of dividends and distributions and does not reflect the deduction of taxes that a shareholder would pay on the Fund’s distributions or the redemption of the Fund shares. All performance data reflects fee waivers and/or expense limitations, if any are in effect; in their absence performance would be lower. See Note B in Notes to Financial Statements. The investment return and principal value of an investment will fluctuate so that an investor’s shares, when redeemed, may be worth more or less than their original cost. Current performance may be lower or higher than the performance data quoted; for current performance data visit www.calvert.com. The gross expense ratio from the current prospectus for Class A shares is 1.78%. This number may differ from the expense ratio shown elsewhere in this report because it is based on a different time period and, if applicable, does not include fee or expense waivers. Performance data quoted already reflects the deduction of the Fund’s operating expenses.
www.calvert.com CALVERT SMALL CAP FUND ANNUAL REPORT 13
Company Highlight
Throughout late 2012 and much of 2013, we were increasingly concerned that a key value driver for Portland General entailed higher risk than realized by the market. Portland General, a regulated utility in the Pacific Northwest, began to invest in a 215-mile energy transmission line planned to run through the Confederated Tribes of the Warm Springs reservation. According to our integrated analysis, the market underestimated the ESG risks, particularly in terms of potential delays, cost overruns and even cancellation. Power transmission assets tend to trade at higher valuations than those of traditional regulated utilities. Using our integrated financial analysis, we valued the additional risk.
Our concerns were supported early in 2012, when management restructured the project to end the transmission line just before the reservation’s border. Management cited financial advantages, but gave no hard information about how the restructured plan was better. In June, management cancelled the entire project. In August, it announced the financial impact—a $52 million charge to earnings and lower financial projections.
With the transmission project now behind it, the company’s present strategy is more focused within management’s core operational expertise. While we have long regarded the company to be well managed, this event reduced the premium we assigned that attribute. We believe Portland General is less likely to take advantage of other non-core opportunities in the future and have reduced our position.
Outlook
As we have stated in the past, despite negative short-term investor sentiment, the long-term drivers of economic recovery continue to gain strength. Investors continue to look beyond the headlines and focus on the improving macro-economic climate in the U.S. and, to some degree, overseas.
The path to recovery will not necessarily be smooth, however. The Fed is largely expected to taper QE as early as December and interest rates are expected to continue climbing. In such a scenario, higher dividend stocks remain especially vulnerable. While growth stocks made an impressive recovery in the third quarter, value names may recover when the reality of Fed tapering and interest rate uptick returns to focus.
However, longer-term factors, such as historically low housing inventories and continued household formation, will provide support for improving economic growth. Likewise, manufacturing is pulling out of its seasonal slump and the broader trend of consumer balance sheet repair is well underway.
As confidence sets in at both the consumer and corporate level, we continue to expect consumers to increase spending and companies to eventually expand capital expenditures and increase inventories. The sharp rise in interest rates that many feared would continue to 3% and beyond has tempered. While consumers and companies alike must prepare for a rising-rate environment, over the medium- and longer-terms, a gradual shift up in borrowing costs may be a sign of an improving economy and not necessarily a near-term threat to growth.
Calvert Investment Management, Inc.
October 2013
14 www.calvert.com CALVERT SMALL CAP FUND ANNUAL REPORT
1. Returns reflect the period the stock was in the portfolio.
As of September 30, 2013, the following companies represented the following percentages of Fund net assets: Walmart 0.00%; Cisco 0.00%; SVB Financial Group 2.25%, Nelnet 1.95%, EPL Oil and Gas 0.89%, Worthington 2.61%, Diebold 1.39%, Platinum Underwriters 2.81%, Exterran 0.00%, Helix Energy Solutions, 2.26%, Belden. 2.42%, Steelcase, 2.08%, Skywest 2.31%, Molina Healthcare 2.39%, USANA Health Services 1.44%, Grand Canyon Education 2.71%, Texas Roadhouse 2.51%, Sanmina 3.79%, Unisys 2.11%, Portland General Electric 1.72%, and Lender Processing 2.00%. Holdings are subject to change.
www.calvert.com CALVERT SMALL CAP FUND ANNUAL REPORT 15
SHAREHOLDER EXPENSE EXAMPLE
As a shareholder of the Fund, you incur two types of costs: (1) transaction costs, including sales charges and redemption fees; and (2) ongoing costs, including management fees; distribution (12b-1) fees; and other Fund expenses. This Example is intended to help you understand your ongoing costs (in dollars) of investing in the Fund and to compare these costs with the ongoing costs of investing in other mutual funds.
This Example is based on an investment of $1,000 invested at the beginning of the period and held for the entire period (April 1, 2013 to September 30, 2013).
Actual Expenses
The first line of the table below provides information about actual account values and actual expenses. You may use the information in this line, together with the amount you invested, to estimate the expenses that you paid over the period. Simply divide your account value by $1,000 (for example, an $8,600 account value divided by $1,000 = 8.6), then multiply the result by the number in the first line under the heading entitled “Expenses Paid During Period” to estimate the expenses you paid on your account during this period.
Hypothetical Example for Comparison Purposes
The second line of the table below provides information about hypothetical account values and hypothetical expenses based on the Fund’s actual expense ratio and an assumed rate of return of 5% per year before expenses, which is not the Fund’s actual return. The hypothetical account values and expenses may not be used to estimate the actual ending account balance or expenses you paid for the period. You may use this information to compare the ongoing costs of investing in the Fund and other funds. To do so, compare the 5% hypothetical example with the 5% hypothetical examples that appear in the shareholder reports of the other funds.
Please note that the expenses shown in the table are meant to highlight your ongoing costs only and do not reflect any transactional costs, such as sales charges (loads), or redemption fees. Therefore, the second line of the table is useful in comparing ongoing costs only, and will not help you determine the relative total costs of owning different funds. In addition, if these transactional costs were included, your costs would have been higher.
16 www.calvert.com CALVERT SMALL CAP FUND ANNUAL REPORT
| | BEGINNING | ENDING ACCOUNT | EXPENSES PAID |
| | ACCOUNT VALUE | VALUE | DURING PERIOD* |
| | 4/1/13 | 9/30/13 | 4/1/13 - 9/30/13 |
| CLASS A | | | |
| Actual | $1,000.00 | $1,153.45 | $8.95 |
| Hypothetical | $1,000.00 | $1,016.75 | $8.39 |
| (5% return per year before expenses) | | | |
| |
| CLASS B | | | |
| Actual | $1,000.00 | $1,145.05 | $17.15 |
| Hypothetical | $1,000.00 | $1,009.07 | $16.07 |
| (5% return per year before expenses) | | | |
| |
| CLASS C | | | |
| Actual | $1,000.00 | $1,149.57 | $13.13 |
| Hypothetical | $1,000.00 | $1,012.85 | $12.29 |
| (5% return per year before expenses) | | | |
| |
| CLASS I | | | |
| Actual | $1,000.00 | $1,158.66 | $4.98 |
| Hypothetical | $1,000.00 | $1,020.46 | $4.66 |
| (5% return per year before expenses) | | | |
* Expenses are equal to the Fund’s annualized expense ratio of 1.66%, 3.19%, 2.44%, and 0.92% for Class A, Class B, Class C, and Class I, respectively, multiplied by the average account value over the period, multiplied by 183/365 (to reflect the one-half year period).
www.calvert.com CALVERT SMALL CAP FUND ANNUAL REPORT 17
REPORT OF INDEPENDENT REGISTERED PUBLIC ACCOUNTING FIRM
The Board of Directors of Calvert Impact Fund, Inc. and Shareholders of Calvert Small Cap Fund: We have audited the accompanying statement of net assets of the Calvert Small Cap Fund (the “Fund”), a series of Calvert Impact Fund, Inc., as of September 30, 2013, and the related statement of operations for the year then ended, the statements of changes in net assets for each of the years in the two-year period then ended, and the financial highlights for each of the years or periods in the five-year period then ended. These financial statements and financial highlights are the responsibility of the Fund’s management. Our responsibility is to express an opinion on these financial statements and financial highlights based on our audits.
We conducted our audits in accordance with the standards of the Public Company Accounting Oversight Board (United States). Those standards require that we plan and perform the audit to obtain reasonable assurance about whether the financial statements and financial highlights are free of material misstatement. An audit includes examining, on a test basis, evidence supporting the amounts and disclosures in the financial statements. Our procedures included confirmation of securities owned as of September 30, 2013, by correspondence with the custodian and brokers or by performing other appropriate auditing procedures. An audit also includes assessing the accounting principles used and significant estimates made by management, as well as evaluating the overall financial statement presentation. We believe that our audits provide a reasonable basis for our opinion.
In our opinion, the financial statements and financial highlights referred to above present fairly, in all material respects, the financial position of the Calvert Small Cap Fund as of September 30, 2013, the results of its operations for the year then ended, the changes in its net assets for each of the years in the two-year period then ended, and the financial highlights for each of the years or periods in the five-year period then ended, in conformity with U.S. generally accepted accounting principles.
18 www.calvert.com CALVERT SMALL CAP FUND ANNUAL REPORT
| | | |
| STATEMENT OF NET ASSETS |
| SEPTEMBER 30, 2013 |
| |
| EQUITY SECURITIES - 91.2% | SHARES | | VALUE |
| Aerospace & Defense - 1.2% | | | |
| Ducommun, Inc.* | 57,779 | $ | 1,657,102 |
| Sparton Corp.* | 24,296 | | 619,548 |
| | | | 2,276,650 |
| |
| Airlines - 2.3% | | | |
| Skywest, Inc. | 302,886 | | 4,397,905 |
| |
| Biotechnology - 4.1% | | | |
| Acorda Therapeutics, Inc.* | 126,691 | | 4,342,967 |
| PDL BioPharma, Inc | 439,428 | | 3,502,241 |
| | | | 7,845,208 |
| |
| Chemicals - 1.5% | | | |
| Minerals Technologies, Inc. | 58,333 | | 2,879,900 |
| |
| Commercial Banks - 8.6% | | | |
| Columbia Banking System, Inc. | 87,832 | | 2,169,450 |
| East West Bancorp, Inc | 84,245 | | 2,691,628 |
| PrivateBancorp, Inc. | 125,643 | | 2,688,760 |
| SVB Financial Group* | 49,506 | | 4,275,833 |
| Umpqua Holdings Corp | 275,995 | | 4,476,639 |
| | | | 16,302,310 |
| |
| Commercial Services & Supplies - 4.9% | | | |
| Deluxe Corp | 127,604 | | 5,315,983 |
| Steelcase, Inc. | 238,259 | | 3,959,864 |
| | | | 9,275,847 |
| |
| Computers & Peripherals - 1.4% | | | |
| Diebold, Inc. | 89,612 | | 2,631,008 |
| |
| Consumer Finance - 1.9% | | | |
| Nelnet, Inc. | 96,259 | | 3,701,159 |
| |
| Diversified Consumer Services - 2.7% | | | |
| Grand Canyon Education, Inc.* | 128,122 | | 5,160,754 |
| |
| Diversified Telecommunication Services - 0.8% | | | |
| Atlantic Tele-Network, Inc. | 27,810 | | 1,449,735 |
| PCCW Ltd. (ADR) | 25,173 | | 111,768 |
| | | | 1,561,503 |
| |
| Electric Utilities - 1.7% | | | |
| Portland General Electric Co | 115,984 | | 3,274,228 |
www.calvert.com CALVERT SMALL CAP FUND ANNUAL REPORT 19
| | | |
| EQUITY SECURITIES - CONT’D | SHARES | | VALUE |
| Electronic Equipment & Instruments - 9.0% | | | |
| Arrow Electronics, Inc.* | 40,113 | $ | 1,946,684 |
| Belden, Inc | 71,932 | | 4,607,244 |
| PC Connection, Inc. | 14,826 | | 223,724 |
| Plexus Corp.* | 86,424 | | 3,214,973 |
| Sanmina Corp.* | 412,626 | | 7,216,829 |
| | | | 17,209,454 |
| |
| Energy Equipment & Services - 3.0% | | | |
| Dresser-Rand Group, Inc.* | 22,487 | | 1,403,189 |
| Helix Energy Solutions Group, Inc.* | 170,086 | | 4,315,082 |
| | | | 5,718,271 |
| |
| Food & Staples Retailing - 1.8% | | | |
| Harris Teeter Supermarkets, Inc | 70,634 | | 3,474,486 |
| |
| Food Products - 1.7% | | | |
| Darling International, Inc.* | 157,222 | | 3,326,818 |
| |
| Health Care Equipment & Supplies - 2.0% | | | |
| Mindray Medical International Ltd. (ADR) | 98,359 | | 3,825,182 |
| |
| Health Care Providers & Services - 4.0% | | | |
| Magellan Health Services, Inc.* | 51,278 | | 3,074,629 |
| Molina Healthcare, Inc.* | 128,159 | | 4,562,460 |
| | | | 7,637,089 |
| |
| Hotels, Restaurants & Leisure - 2.5% | | | |
| Texas Roadhouse, Inc. | 181,717 | | 4,775,523 |
| |
| Insurance - 6.9% | | | |
| FBL Financial Group, Inc | 44,438 | | 1,995,266 |
| Platinum Underwriters Holdings Ltd. | 89,635 | | 5,353,899 |
| ProAssurance Corp | 66,516 | | 2,997,211 |
| Symetra Financial Corp | 91,846 | | 1,636,696 |
| The Navigators Group, Inc.* | 21,161 | | 1,222,471 |
| | | | 13,205,543 |
| |
| Internet Software & Services - 1.0% | | | |
| AOL, Inc.* | 52,677 | | 1,821,571 |
| |
| IT Services - 4.9% | | | |
| CSG Systems International, Inc. | 59,183 | | 1,482,534 |
| Lender Processing Services, Inc | 114,111 | | 3,796,473 |
| Unisys Corp.* | 159,112 | | 4,008,031 |
| | | | 9,287,038 |
| |
| Machinery - 3.0% | | | |
| Barnes Group, Inc. | 140,976 | | 4,922,882 |
| LB Foster Co | 7,168 | | 327,864 |
| Standex International Corp. | 8,003 | | 475,378 |
| | | | 5,726,124 |
20 www.calvert.com CALVERT SMALL CAP FUND ANNUAL REPORT
| | | | |
| EQUITY SECURITIES - CONT’D | | SHARES | | VALUE |
| Media - 2.5% | | | | |
| Madison Square Garden Co.* | | 71,082 | $ | 4,127,732 |
| McClatchy Co.* | | 224,923 | | 674,769 |
| | | | | 4,802,501 |
| |
| Metals & Mining - 2.6% | | | | |
| Worthington Industries, Inc. | | 143,845 | | 4,952,583 |
| |
| Oil, Gas & Consumable Fuels - 2.5% | | | | |
| EPL Oil & Gas, Inc.* | | 45,382 | | 1,684,126 |
| Ship Finance International Ltd | | 200,162 | | 3,056,474 |
| | | | | 4,740,600 |
| |
| Paper & Forest Products - 0.8% | | | | |
| PH Glatfelter Co | | 57,150 | | 1,547,050 |
| |
| Personal Products - 1.9% | | | | |
| Revlon, Inc.* | | 34,091 | | 946,707 |
| USANA Health Sciences, Inc.* | | 31,540 | | 2,737,357 |
| | | | | 3,684,064 |
| |
| Pharmaceuticals - 2.2% | | | | |
| Viropharma, Inc.* | | 104,236 | | 4,096,475 |
| |
| Specialty Retail - 5.5% | | | | |
| ANN, Inc.* | | 123,906 | | 4,487,875 |
| Barnes & Noble, Inc.* | | 105,884 | | 1,370,139 |
| Brown Shoe Co., Inc. | | 195,753 | | 4,594,323 |
| | | | | 10,452,337 |
| |
| Thrifts & Mortgage Finance - 1.8% | | | | |
| Northwest Bancshares, Inc. | | 252,094 | | 3,332,683 |
| |
| Wireless Telecommunication Services - 0.5% | | | | |
| Shenandoah Telecommunications Co. | | 39,972 | | 963,325 |
| |
| Total Equity Securities (Cost $130,850,869) | | | | 173,885,189 |
| |
| |
| | | PRINCIPAL | | |
| HIGH SOCIAL IMPACT INVESTMENTS - 0.4% | | AMOUNT | | |
| Calvert Social Investment Foundation Notes, 0.50%, 7/1/14 (b)(i)(r) | $ | 651,905 | | 636,716 |
| |
| Total High Social Impact Investments (Cost $651,905) | | | | 636,716 |
www.calvert.com CALVERT SMALL CAP FUND ANNUAL REPORT 21
| | | | | |
| | | PRINCIPAL | | | |
| TIME DEPOSIT - 18.2% | | AMOUNT | | VALUE | |
| State Street Bank Time Deposit, 0.083%, 10/1/13 | $ | 34,672,080 | $ | 34,672,080 | |
| |
| Total Time Deposit (Cost $34,672,080) | | | | 34,672,080 | |
| |
| TOTAL INVESTMENTS (Cost $166,174,854) - 109.8% | | | | 209,193,985 | |
| Other assets and liabilities, net - (9.8%) | | | | (18,600,172 | ) |
| NET ASSETS - 100% | | | $ | 190,593,813 | |
| |
| |
| NET ASSETS CONSIST OF: | | | | | |
| Paid-in capital applicable to the following shares of common stock, | | | | | |
| with 250,000,000 of $0.01 par value shares authorized: | | | | | |
| Class A: 5,263,778 shares outstanding | | | $ | 94,568,688 | |
| Class B: 52,800 shares outstanding | | | | 370,792 | |
| Class C: 597,383 shares outstanding | | | | 10,403,395 | |
| Class I: 1,807,431 shares outstanding | | | | 38,101,783 | |
| Undistributed net investment income (loss) | | | | (401,637 | ) |
| Accumulated net realized gain (loss) | | | | 4,531,661 | |
| Net unrealized appreciation (depreciation) | | | | 43,019,131 | |
| |
| NETASSETS | | | $ | 190,593,813 | |
| |
| |
| NET ASSET VALUE PER SHARE | | | | | |
| Class A (based on net assets of $129,406,899) | | | $ | 24.58 | |
| Class B (based on net assets of $1,263,132) | | | $ | 23.92 | |
| Class C (based on net assets of $13,725,657) | | | $ | 22.98 | |
| Class I (based on net assets of $46,198,125) | | | $ | 25.56 | |
| RESTRICTED SECURITIES | ACQUISITION
DATES | COST |
| Calvert Social Investment Foundation Notes, 0.50%, 7/1/14 | 7/1/10 | $651,905 |
(b) This security was valued under the direction of the Board of Directors. See Note A.
(i) Restricted securities represent 0.4% of net assets for the Small Cap Fund.
(r) The coupon rate shown on floating or adjustable rate securities represents the rate at period end.
* Non-income producing security.
Abbreviations:
ADR: American Depositary Receipts
See notes to financial statements.
22 www.calvert.com CALVERT SMALL CAP FUND ANNUAL REPORT
| | | |
| STATEMENT OF OPERATIONS |
| YEAR ENDED SEPTEMBER 30, 2013 |
| |
| NET INVESTMENT INCOME | | | |
| Investment Income: | | | |
| Interest income | $ | 11,517 | |
| Dividend income | | 2,441,819 | |
| Total investment income | | 2,453,336 | |
| |
| Expenses: | | | |
| Investment advisory fee | | 1,055,605 | |
| Transfer agency fees and expenses | | 402,101 | |
| Administrative fees | | 329,981 | |
| Distribution Plan expenses: | | | |
| Class A | | 267,724 | |
| Class B | | 13,256 | |
| Class C | | 110,381 | |
| Directors’ fees and expenses | | 15,514 | |
| Custodian fees | | 25,889 | |
| Registration fees | | 49,907 | |
| Reports to shareholders | | 72,689 | |
| Professional fees | | 28,171 | |
| Accounting fees | | 22,638 | |
| Miscellaneous | | 25,933 | |
| Total expenses | | 2,419,789 | |
| Reimbursement from Advisor: | | | |
| Class B | | (6,016 | ) |
| Class I | | (19,317 | ) |
| Fees paid indirectly | | (247 | ) |
| Net expenses | | 2,394,209 | |
| |
| |
| NET INVESTMENT INCOME | | 59,127 | |
| |
| |
| REALIZED AND UNREALIZED | | | |
| GAIN (LOSS) ON INVESTMENTS | | | |
| Net realized gain (loss) | | 21,131,949 | |
| Change in unrealized appreciation (depreciation) | | 21,290,978 | |
| |
| NET REALIZED AND UNREALIZED | | | |
| GAIN (LOSS) ON IVESTMENTS | | 42,422,927 | |
| |
| INCREASE (DECREASE) IN NET ASSETS | | | |
| RESULTING FROM OPERATIONS | $ | 42,482,054 | |
See notes to financial statements.
www.calvert.com CALVERT SMALL CAP FUND ANNUAL REPORT 23
| | | | | | |
| STATEMENTS OF CHANGES IN NET ASSETS |
| |
| | | YEAR
ENDED | | | YEAR
ENDED | |
| | | SEPTEMBER
30, | | | SEPTEMBER
30, | |
| INCREASE (DECREASE) IN NET ASSETS | | 2013 | | | 2012 | |
| Operations: | | | | | | |
| Net investment income | $ | 59,127 | | $ | 1,450,692 | |
| Net realized gain (loss) | | 21,131,949 | | | 2,290,129 | |
| Change in unrealized appreciation (depreciation) | | 21,290,978 | | | 26,719,904 | |
| |
| INCREASE (DECREASE) IN NET ASSETS | | | | | | |
| RESULTING FROM OPERATIONS | | 42,482,054 | | | 30,460,725 | |
| |
| Distributions to shareholders from: | | | | | | |
| Net investment income: | | | | | | |
| Class A shares | | (1,239,153 | ) | | (231,181 | ) |
| Class C shares | | (21,918 | ) | | — | |
| Class I shares | | (484,645 | ) | | (317,661 | ) |
| Net realized gain: | | | | | | |
| Class A shares | | (2,586,265 | ) | | — | |
| Class B shares | | (38,354 | ) | | — | |
| Class C shares | | (288,508 | ) | | — | |
| Class I shares | | (707,515 | ) | | — | |
| Total distributions | | (5,366,358 | ) | | (548,842 | ) |
| |
| Capital share transactions: | | | | | | |
| Shares sold: | | | | | | |
| Class A shares | | 24,588,981 | | | 10,573,719 | |
| Class B shares | | 13,124 | | | 27,875 | |
| Class C shares | | 2,375,780 | | | 756,259 | |
| Class I shares | | 18,224,871 | | | 6,361,024 | |
| Reinvestment of distributions: | | | | | | |
| Class A shares | | 3,585,262 | | | 212,545 | |
| Class B shares | | 36,506 | | | — | |
| Class C shares | | 261,891 | | | — | |
| Class I shares | | 1,105,442 | | | 317,661 | |
| Redemption fees: | | | | | | |
| Class A shares | | 376 | | | 92 | |
| Shares redeemed: | | | | | | |
| Class A shares | | (20,298,567 | ) | | (18,929,423 | ) |
| Class B shares | | (542,521 | ) | | (1,235,717 | ) |
| Class C shares | | (1,506,475 | ) | | (1,696,666 | ) |
| Class I shares | | (7,040,078 | ) | | (3,695,176 | ) |
| Total capital share transactions | | 20,804,592 | | | (7,307,807 | ) |
| |
| TOTAL INCREASE (DECREASE) IN NET ASSETS | | 57,920,288 | | | 22,604,076 | |
| |
| |
| NET ASSETS | | | | | | |
| Beginning of year | | 132,673,525 | | | 110,069,449 | |
| End of year (including distributions in excess of net | | | | | | |
| investment income and undistributed net investment income | | | | | | |
| of $401,637 and $1,021,399, respectively) | $ | 190,593,813 | | $ | 132,673,525 | |
See notes to financial statements.
24 www.calvert.com CALVERT SMALL CAP FUND ANNUAL REPORT
| | | | |
| STATEMENTS OF CHANGES IN NET ASSETS |
| |
| | YEAR
ENDED | | YEAR
ENDED | |
| | SEPTEMBER
30, | | SEPTEMBER
30, | |
| CAPITAL SHARE ACTIVITY | 2013 | | 2012 | |
| Shares sold: | | | | |
| Class A shares | 1,106,630 | | 591,192 | |
| Class B shares | 604 | | 1,584 | |
| Class C shares | 110,481 | | 44,571 | |
| Class I shares | 770,556 | | 350,694 | |
| Reinvestment of distributions: | | | | |
| Class A shares | 193,984 | | 12,517 | |
| Class B shares | 2,027 | | — | |
| Class C shares | 15,188 | | — | |
| Class I shares | 57,733 | | 18,162 | |
| Shares redeemed: | | | | |
| Class A shares | (952,854 | ) | (1,057,872 | ) |
| Class B shares | (26,539 | ) | (70,728 | ) |
| Class C shares | (76,223 | ) | (101,484 | ) |
| Class I shares | (323,345 | ) | (198,820 | ) |
| Total capital share activity | 878,242 | | (410,184 | ) |
See notes to financial statements.
www.calvert.com CALVERT SMALL CAP FUND ANNUAL REPORT 25
NOTES TO FINANCIAL STATEMENTS
NOTE A — SIGNIFICANT ACCOUNTING POLICIES
General: Calvert Small Cap Fund (the “Fund”), a series of Calvert Impact Fund, Inc., is registered under the Investment Company Act of 1940 as a diversified, open-end management investment company. Calvert Impact Fund, Inc. is comprised of three separate series. The operations of each series are accounted for separately. The Fund offers four classes of shares - Classes A, B, C, and I. Class A shares are sold with a maximum front-end sales charge of 4.75%. Class B shares are sold without a front-end sales charge and, with certain exceptions, will be charged a deferred sales charge at the time of redemption, depending on how long investors have owned the shares. Class B shares are no longer offered for purchase, except through reinvestment of dividends and/or distributions and through certain exchanges. Class C shares are sold without a front-end sales charge and, with certain exceptions, will be charged a deferred sales charge on shares sold within one year of purchase. Class B and Class C shares have higher levels of expenses than Class A shares. Class I shares require a minimum account balance of $1,000,000. The $1 million minimum initial investment is waived for retirement plans that trade through omnibus accounts and may be waived for certain other institutional accounts where it is believed to be in the best interest of the Fund and its shareholders. Class I shares have no front-end or deferred sales charge and have lower levels of expenses than Class A shares. Each Class has different: (a) dividend rates, due to differences in Distribution Plan expenses and other class-specific expenses, (b) exchange privileges, and (c) class-specific voting rights.
Security Valuation: Net asset value per share is determined every business day as of the close of the regular session of the New York Stock Exchange (generally 4:00 p.m. Eastern time). The Fund uses independent pricing services approved by the Board of Directors (“the Board”) to value its investments wherever possible. Investments for which market quotations are not available or deemed not reliable are fair valued in good faith under the direction of the Board.
The Board has adopted Valuation Procedures (the “Procedures”) to determine the fair value of securities and other financial instruments for which market prices are not readily available or which may not be reliably priced. The Board has delegated the day-to-day responsibility for determining the fair value of assets of the Fund to Calvert Investment Management, Inc. (the “Advisor” or “Calvert”) and has provided these Procedures to govern Calvert in its valuation duties.
Calvert has chartered an internal Valuation Committee to oversee the implementation of these Procedures and to assist it in carrying out the valuation responsibilities that the Board has delegated.
The Valuation Committee meets on a regular basis to review illiquid securities and other investments which may not have readily available market prices. The Valuation Committee’s fair valuation determinations are subject to review, approval and ratification by the Board at its next regularly scheduled meeting covering the calendar quarter in which the fair valuation was determined.
The Valuation Committee utilizes various methods to measure the fair value of the Fund’s investments. Generally Accepted Accounting Principles (GAAP) establishes a dis-
26 www.calvert.com CALVERT SMALL CAP FUND ANNUAL REPORT
closure hierarchy that categorizes the inputs to valuation techniques used to value assets and liabilities at measurement date. These inputs are summarized in the three broad levels listed below:
Level 1 – quoted prices in active markets for identical securities
Level 2 – other significant observable inputs (including quoted prices for similar securities, interest rates, prepayment speeds, credit risk, etc.)
Level 3 – significant unobservable inputs (including the Fund’s own assumptions in determining the fair value of investments) The inputs or methodologies used for valuing securities are not necessarily an indication of the risk associated with investing in those securities.
Changes in valuation techniques may result in transfers in or out of an investment’s assigned level within the hierarchy during the period. There were no such transfers during the period. Valuation techniques used to value the Fund’s investments by major category are as follows: Equity securities, including restricted securities, for which market quotations are readily available, are valued at the last reported sale price or official closing price as reported by an independent pricing service on the primary market or exchange on which they are traded and are categorized as Level 1 in the hierarchy. In the event there were no sales during the day or closing prices are not available, securities are valued at the last quoted bid price or using the last available price and are categorized as Level 2 in the hierarchy. Foreign securities are valued based on quotations from the principal market in which such securities are normally traded. If events occur after the close of the principal market in which foreign securities are traded, and before the close of business of the Fund, that are expected to materially affect the value of those securities, then they are valued at their fair value taking these events into account. For restricted securities and private placements where observable inputs are limited, assumptions about market activity and risk are used and such securities are categorized as Level 3 in the hierarchy.
Debt securities, including restricted securities, are valued based on evaluated prices received from independent pricing services or from dealers who make markets in such securities and are generally categorized as Level 2 in the hierarchy. Short-term securities of sufficient credit quality with remaining maturities of sixty days or less for which quotations are not readily available are valued at amortized cost, which approximates fair value, and are categorized as Level 2 in the hierarchy.
When independent prices are unavailable or unreliable, debt securities may be valued utilizing pricing matrices which consider similar factors that would be used by independent pricing services. These are generally categorized as Level 2 in the hierarchy but may be Level 3 depending on the circumstances.
If a market value cannot be determined for a security using the methodologies described above, or if, in the good faith opinion of the Advisor, the market value does not constitute a readily available market quotation, or if a significant event has occurred that would materially affect the value of the security, the security will be fair valued as determined in good faith by the Valuation Committee.
www.calvert.com CALVERT SMALL CAP FUND ANNUAL REPORT 27
The Valuation Committee considers a number of factors, including significant unobservable valuation inputs when arriving at fair value. It considers all significant facts that are reasonably available and relevant to the determination of fair value.
The Valuation Committee primarily employs a market-based approach which may use related or comparable assets or liabilities, recent transactions, market multiples, book values, and other relevant information for the investment to determine the fair value of the investment. When more appropriate, the fund may employ an income-based or cost approach. An income-based valuation approach discounts anticipated future cash flows of the investment to calculate a present amount (discounted). The measurement is based on the value indicated by current market expectations about those future amounts. Discounts may also be applied due to the nature or duration of any restrictions on the disposition of the investments. A cost based approach is based on the amount that currently would be required to replace the service capacity of an asset (current replacement cost). From the seller’s perspective, the price that would be received for the asset is determined based on the cost to a buyer to acquire or construct a substitute asset of comparable utility, adjusted for obsolescence.
The values assigned to fair value investments are based on available information and do not necessarily represent amounts that might ultimately be realized. Further, due to the inherent uncertainty of valuations of such investments, the fair values may differ significantly from the values that would have been used had an active market existed, and the differences could be material. The Valuation Committee employs various methods for calibrating these valuation approaches including a regular review of key inputs and assumptions, transactional back-testing or disposition analysis and reviews of any related market activity.
At September 30, 2013, securities valued at $636,716, or 0.4% of net assets, were fair valued in good faith under the direction of the Board.
The following is a summary of the inputs used to value the Fund’s net assets as of September 30, 2013:
| | | VALUATION INPUTS | |
| INVESTMENTS IN SECURITIES | LEVEL 1 | LEVEL 2 | LEVEL 3 | TOTAL |
| Equity securities* | $173,885,189 | — | — | $173,885,189 |
| Other debt obligations | — | $35,308,796 | — | 35,308,796 |
| TOTAL | $173,885,189 | $35,308,796 | — | $209,193,985 |
* For further breakdown of equity securities by industry, please refer to the Statement of Net Assets.
Restricted Securities: The Fund may invest in securities that are subject to legal or contractual restrictions on resale. Generally, these securities may only be sold publicly upon registration under the Securities Act of 1933 or in transactions exempt from such registration. Information regarding restricted securities is included at the end of the Fund’s Statement of Net Assets.
Security Transactions and Net Investment Income: Security transactions are accounted for on trade date. Realized gains and losses are recorded on an identified cost basis and
28 www.calvert.com CALVERT SMALL CAP FUND ANNUAL REPORT
may include proceeds from litigation. Dividend income is recorded on the ex-dividend date. Distributions received on securities that represent a return of capital or capital gain are recorded as a reduction of cost of investments and/or as a realized gain. Interest income, which includes amortization of premium and accretion of discount on debt securities, is accrued as earned. Investment income and realized and unrealized gains and losses are allocated to separate classes of shares based upon the relative net assets of each class. Expenses arising in connection with a specific class are charged directly to that class. Expenses common to the classes are allocated to each class in proportion to their relative net assets.
Distributions to Shareholders: Distributions to shareholders are recorded by the Fund on ex-dividend date. Dividends from net investment income and distributions from net realized capital gains, if any, are paid at least annually. Distributions are determined in accordance with income tax regulations which may differ from generally accepted accounting principles; accordingly, periodic reclassifications are made within the Fund’s capital accounts to reflect income and gains available for distribution under income tax regulations.
Estimates: The preparation of financial statements in conformity with accounting principles generally accepted in the United States requires management to make estimates and assumptions that affect the reported amounts of assets and liabilities and disclosure of contingent assets and liabilities at the date of the financial statements and the reported amounts of income and expenses during the reporting period. Actual results could differ from those estimates.
Redemption Fees: The Fund charges a 2% redemption fee on redemptions, including exchanges, made within 30 days of purchase (within seven days for Class I shares). The redemption fee is accounted for as an addition to paid-in capital and is intended to discourage market-timers by ensuring that short-term trading costs are borne by the investors making the transactions and not the shareholders already in the Fund.
Expense Offset Arrangement: The Fund had an arrangement with the custodian bank whereby the custodian’s fees may have been paid indirectly by credits earned on the Fund’s cash on deposit with the bank. These credits were used to reduce the Fund’s expenses. This arrangement was suspended on January 1, 2013, until further notice, due to low interest rates. Such a deposit arrangement was an alternative to overnight investments.
Federal Income Taxes: No provision for federal income or excise tax is required since the Fund intends to continue to qualify as a regulated investment company under the Internal Revenue Code and to distribute substantially all of its taxable earnings.
Management has analyzed the Fund’s tax positions taken for all open federal income tax years and has concluded that no provision for federal income tax is required in the Fund’s financial statements. A Fund’s federal tax return is subject to examination by the Internal Revenue Service for a period of three years.
NOTE B — RELATED PARTY TRANSACTIONS
Calvert Investment Management, Inc. (the “Advisor”) is wholly-owned by Calvert Investments, Inc., which is indirectly wholly-owned by Ameritas Mutual Holding
www.calvert.com CALVERT SMALL CAP FUND ANNUAL REPORT 29
Company. The Advisor provides investment advisory services and pays the salaries and fees of officers and Directors of the Fund who are employees of the Advisor or its affiliates. For its services, the Advisor receives an annual fee, payable monthly, of .70% of the average daily net assets. Under the terms of the agreement, $113,629 was payable at year end. In addition, $14,244 was payable at year end for operating expenses paid by the Advisor during September 2013.
The Advisor has contractually agreed to limit net annual fund operating expenses through January 31, 2014. The contractual expense cap is 1.69%, 3.19%, 2.69%, and .92% for Class A, B, C, and I, respectively. For the purpose of these expense limits, operating expenses do not include interest expense, brokerage commissions, taxes, or extraordinary expenses. This expense limitation does not limit acquired fund fees and expenses, if any. To the extent that any expense offset credits were earned, the Advisor’s obligation under the contractual limitation may have been reduced and the Advisor may have benefited from the expense offset arrangement.
Calvert Investment Administrative Services, Inc., an affiliate of the Advisor, provides administrative services to the Fund for an annual fee, payable monthly, of .25% for Classes A, B, and C shares and .10% for Class I shares based on the average daily net assets. Under the terms of the agreement, $34,751 was payable at year end.
Calvert Investment Distributors, Inc. (“CID”), an affiliate of the Advisor, is the distributor and principal underwriter for the Fund. Pursuant to Rule 12b-1 under the Investment Company Act of 1940, the Fund has adopted a Distribution Plan that permits the Fund to pay certain expenses associated with the distribution and servicing of its shares. The expenses paid may not exceed .35%, 1.00%, and 1.00% annually of average daily net assets of Class A, B, and C shares, respectively. The amount actually paid by the Fund is an annualized fee, payable monthly, of .25%, 1.00%, and 1.00% of average daily net assets of Class A, B, and C, respectively. Class I shares do not have Distribution Plan expenses. Under the terms of the agreement, $40,427 was payable at year end.
CID received $29,900 as its portion of the commissions charged on sales of Class A shares for the year ended September 30, 2013.
Calvert Investment Services, Inc. (“CIS”), an affiliate of the Advisor, acts as shareholder servicing agent for the Fund. For its services, CIS received a fee of $76,940 for the year ended September 30, 2013. Under the terms of the agreement, $5,735 was payable at year end. Boston Financial Data Services, Inc. is the transfer and dividend disbursing agent.
The Fund invests in Community Investment Notes issued by the Calvert Social Investment Foundation (the “CSI Foundation”). The CSI Foundation is a 501(c)(3) non-profit organization that receives in-kind support from Calvert and its subsidiaries. The Fund has received an exemptive order from the Securities and Exchange Commission permitting the Fund to make investments in these notes under certain conditions.
Each Director of the Fund who is not an employee of the Advisor or its affiliates receives an annual retainer of $48,000 plus a meeting fee of up to $3,000 for each Board meeting attended. Additional fees of up to $5,000 annually may be paid to the Board chair and Committee chairs ($10,000 for the Special Equities Committee chair) and $2,500 annually may be paid to Committee members, plus a Committee meeting fee of $500 for each Committee meeting attended. Directors’ fees are allocated to each of the funds served.
30 www.calvert.com CALVERT SMALL CAP FUND ANNUAL REPORT
NOTE C — INVESTMENT ACTIVITY AND TAX INFORMATION
During the year, the cost of purchases and proceeds from sales of investments, other than short-term securities, were $124,357,356 and $117,829,271, respectively.
The Fund intends to elect to defer ordinary losses of $401,637 incurred from January 1, 2013 through September 30, 2013 and treat them as arising in the fiscal year ending September 30, 2014.
The tax character of dividends and distributions paid during the years ended September 30, 2013 and September 30, 2012 was as follows:
| DISTRIBUTIONS PAID FROM: | 2013 | 2012 |
| Ordinary income | $1,745,716 | $548,842 |
| Long-term capital gain | 3,620,642 | — |
| Total | $5,366,358 | $548,842 |
As of September 30, 2013, the tax basis components of distributable earnings/(accumulated losses) and the federal tax cost were as follows:
| Unrealized appreciation | $43,660,471 | |
| Unrealized (depreciation) | (691,001 | ) |
| Net unrealized appreciation/(depreciation) | $42,969,470 | |
| |
| Undistributed long-term capital gain | $4,581,322 | |
| |
| Federal income tax cost of investments | $166,224,515 | |
The differences between the components of distributable earnings on a tax basis and the amounts reflected in the statement of net assets are primarily due to temporary book-tax differences that will reverse in a subsequent period. These book-tax differences are due to wash sales and deferral of post-December ordinary losses.
Reclassifications, as shown in the table below, have been made to the Fund’s components of net assets to reflect income and gains available for distribution (or available capital loss carryovers, as applicable) under income tax law and regulations. These reclassifications are due to permanent book-tax differences and have no impact on net assets. The primary permanent differences causing such reclassifications are due to passive foreign investment companies and recharacterization of distributions.
| Undistributed net investment income | $263,553 | |
| Accumulated net realized gain (loss) | (263,553 | ) |
www.calvert.com CALVERT SMALL CAP FUND ANNUAL REPORT 31
NOTE D — LINE OF CREDIT
A financing agreement is in place with the Calvert Funds and State Street Corporation (“SSC”). Under the agreement, SSC provides an unsecured line of credit facility, in the aggregate amount of $50 million ($25 million committed and $25 million uncommitted), accessible by the Funds for temporary or emergency purposes only. Borrowings under the committed facility bear interest at the higher of the London Interbank Offered Rate (LIBOR) or the overnight Federal Funds Rate plus 1.25% per annum. A commitment fee of .11% per annum is incurred on the unused portion of the committed facility, which is allocated to all participating funds. The Fund had no loans outstanding pursuant to this line of credit at September 30, 2013. For the year ended September 30, 2013, borrowings by the Fund under the agreement were as follows:
| AVERAGE DAILY BALANCE | WEIGHTED AVERAGE INTEREST RATE | MAXIMUM AMOUNT BORROWED | MONTH OF MAXIMUM AMOUNT BORROWED |
| $16,967 | 1.45% | $2,356,583 | March 2013 |
NOTE E — SUBSEQUENT EVENTS
The Fund began offering Class Y shares on October 18, 2013.
In preparing the financial statements as of September 30, 2013, no other subsequent events or transactions occurred that would have required recognition or disclosure in these financial statements.

32 www.calvert.com CALVERT SMALL CAP FUND ANNUAL REPORT
| | | | | | | | | |
| FINANCIAL HIGHLIGHTS |
| |
| | | | | | YEARS ENDED | | | | |
| | | SEPTEMBER
30, | | | SEPTEMBER
30, | | | SEPTEMBER
30, | |
| CLASS A SHARES | | 2013 | (z) | | 2012 | (z) | | 2011 | (z) |
| Net asset value, beginning | $ | 19.36 | | $ | 15.15 | | $ | 15.55 | |
| Income from investment operations: | | | | | | | | | |
| Net investment income (loss) | | (.01 | ) | | .20 | | | .02 | |
| Net realized and unrealized gain (loss) | | 6.02 | | | 4.05 | | | (.42 | ) |
| Total from investment operations | | 6.01 | | | 4.25 | | | (.40 | ) |
| Distributions from: | | | | | | | | | |
| Net investment income | | (.25 | ) | | (.04 | ) | | — | |
| Net realized gain | | (.54 | ) | | — | | | — | |
| Total distributions | | (.79 | ) | | (.04 | ) | | — | |
| Total increase (decrease) in net asset value | | 5.22 | | | 4.21 | | | (.40 | ) |
| Net asset value, ending | $ | 24.58 | | $ | 19.36 | | $ | 15.15 | |
| |
| Total return* | | 32.42 | % | | 28.12 | % | | (2.56 | %) |
| Ratios to average net assets:A | | | | | | | | | |
| Net investment income (loss) | | (.05 | %) | | 1.13 | % | | .13 | % |
| Total expenses | | 1.67 | % | | 1.78 | % | | 1.81 | % |
| Expenses before offsets | | 1.67 | % | | 1.69 | % | | 1.69 | % |
| Net expenses | | 1.67 | % | | 1.69 | % | | 1.69 | % |
| Portfolio turnover | | 82 | % | | 3 | % | | 9 | % |
| Net assets, ending (in thousands) | $ | 129,407 | | $ | 95,189 | | $ | 81,374 | |
| |
| | | | | | YEARS ENDED | |
| | | | | | SEPTEMBER
30, | | | SEPTEMBER
30, | |
| CLASS A SHARES | | | | | 2010 | | | 2009 | |
| Net asset value, beginning | | | | $ | 14.14 | | $ | 15.61 | |
| Income from investment operations: | | | | | | | | | |
| Net investment income (loss) | | | | | (.06 | ) | | (.02 | ) |
| Net realized and unrealized gain (loss) | | | | | 1.47 | | | (1.45 | ) |
| Total from investment operations | | | | | 1.41 | | | (1.47 | ) |
| Total increase (decrease) in net asset value | | | | | 1.41 | | | (1.47 | ) |
| Net asset value, ending | | | | $ | 15.55 | | $ | 14.14 | |
| |
| Total return* | | | | | 9.97 | % | | (9.42 | %) |
| Ratios to average net assets:A | | | | | | | | | |
| Net investment income (loss) | | | | | (.35 | %) | | (.18 | %) |
| Total expenses | | | | | 1.94 | % | | 2.09 | % |
| Expenses before offsets | | | | | 1.69 | % | | 1.70 | % |
| Net expenses | | | | | 1.69 | % | | 1.69 | % |
| Portfolio turnover | | | | | 174 | % | | 61 | % |
| Net assets, ending (in thousands) | | | | $ | 34,763 | | $ | 34,051 | |
See notes to financial highlights.
www.calvert.com CALVERT SMALL CAP FUND ANNUAL REPORT 33
| | | | | | |
| FINANCIAL HIGHLIGHTS |
| |
| | | | PERIODS ENDED | | | |
| | SEPTEMBER
30, | | SEPTEMBER
30, | | SEPTEMBER
30, | |
| CLASS B SHARES | 2013 | (z) | 2012 | (z) | 2011 | (z)# |
| Net asset value, beginning | $18.89 | | $14.97 | | $16.81 | |
| Income from investment operations: | | | | | | |
| Net investment income (loss) | (.32 | ) | (0.05 | ) | (.21 | ) |
| Net realized and unrealized gain (loss) | 5.89 | | 3.97 | | (1.63 | ) |
| Total from investment operations | 5.57 | | 3.92 | | (1.84 | ) |
| Distributions from: | | | | | | |
| Net realized gain | (.54 | ) | — | | — | |
| Total distributions | (.54 | ) | — | | — | |
| Total increase (decrease) in net asset value | 5.03 | | 3.92 | | (1.84 | ) |
| Net asset value, ending | $23.92 | | $18.89 | | $14.97 | |
| |
| Total return* | 30.40 | % | 26.19 | % | (10.95 | %) |
| Ratios to average net assets:A | | | | | | |
| Net investment income (loss) | (1.53 | %) | (.31 | %) | (1.38 | %) (a) |
| Total expenses | 3.64 | % | 3.50 | % | 3.46 | % (a) |
| Expenses before offsets | 3.19 | % | 3.19 | % | 3.19 | % (a) |
| Net expenses | 3.19 | % | 3.19 | % | 3.19 | % (a) |
| Portfolio turnover | 82 | % | 3 | % | 9 | %** |
| Net assets, ending (in thousands) | $1,263 | | $1,449 | | $2,183 | |
See notes to financial highlights.
34 www.calvert.com CALVERT SMALL CAP FUND ANNUAL REPORT
| | | | | | | | | |
| FINANCIAL HIGHLIGHTS |
| |
| | | | | | YEARS ENDED | | | | |
| | | SEPTEMBER
30, | | | SEPTEMBER
30, | | | SEPTEMBER
30, | |
| CLASS C SHARES | | 2013 | (z) | | 2012 | (z) | | 2011 | (z) |
| Net asset value, beginning | $ | 18.08 | | $ | 14.25 | | $ | 14.77 | |
| Income from investment operations: | | | | | | | | | |
| Net investment income (loss) | | (.17 | ) | | .03 | | | (.15 | ) |
| Net realized and unrealized gain (loss) | | 5.65 | | | 3.80 | | | (.37 | ) |
| Total investment operations | | 5.48 | | | 3.83 | | | (.52 | ) |
| Distributions from: | | | | | | | | | |
| Net investment income | | (.04 | ) | | — | | | — | |
| Net realized gain | | (.54 | ) | | — | | | — | |
| Total distributions | | (.58 | ) | | — | | | — | |
| Total increase (decrease) in net asset value | | 4.90 | | | 3.83 | | | (.52 | ) |
| Net asset value, ending | $ | 22.98 | | $ | 18.08 | | $ | 14.25 | |
| |
| Total return* | | 31.35 | % | | 26.88 | % | | (3.52 | %) |
| Ratios to average net assets:A | | | | | | | | | |
| Net investment income (loss) | | (.86 | %) | | .19 | % | | (.87 | %) |
| Total expenses | | 2.49 | % | | 2.64 | % | | 2.74 | % |
| Expenses before offsets | | 2.49 | % | | 2.64 | % | | 2.69 | % |
| Net expenses | | 2.49 | % | | 2.64 | % | | 2.69 | % |
| Portfolio turnover | | 82 | % | | 3 | % | | 9 | % |
| Net assets, ending (in thousands) | $ | 13,726 | | $ | 9,907 | | $ | 8,618 | |
| |
| | | | | | YEARS ENDED | |
| | | | | | SEPTEMBER
30, | | | SEPTEMBER
30, | |
| CLASS C SHARES | | | | | 2010 | | | 2009 | |
| Net asset value, beginning | | | | $ | 13.55 | | $ | 15.08 | |
| Income from investment operations: | | | | | | | | | |
| Net investment income (loss) | | | | | (.15 | ) | | (.12 | ) |
| Net realized and unrealized gain (loss) | | | | | 1.37 | | | (1.41 | ) |
| Total from investment operations | | | | | 1.22 | | | (1.53 | ) |
| Total increase (decrease) in net asset value | | | | | 1.22 | | | (1.53 | ) |
| Net asset value, ending | | | | $ | 14.77 | | $ | 13.55 | |
| |
| Total return* | | | | | 9.00 | % | | (10.15 | %) |
| Ratios to average net assets:A | | | | | | | | | |
| Net investment income (loss) | | | | | (1.28 | %) | | (1.17 | %) |
| Total expenses | | | | | 3.17 | % | | 3.64 | % |
| Expenses before offsets | | | | | 2.69 | % | | 2.70 | % |
| Net expenses | | | | | 2.69 | % | | 2.69 | % |
| Portfolio turnover | | | | | 174 | % | | 61 | % |
| Net assets, ending (in thousands) | | | | $ | 2,583 | | $ | 1,889 | |
See notes to financial highlights.
www.calvert.com CALVERT SMALL CAP FUND ANNUAL REPORT 35
| | | | | | | | | |
| FINANCIAL HIGHLIGHTS |
| |
| | | | | | YEARS ENDED | | | | |
| | | SEPTEMBER
30, | | | SEPTEMBER
30, | | | SEPTEMBER
30, | |
| CLASS I SHARES | | 2013 | (z) | | 2012 | (z) | | 2011 | (z) |
| Net asset value, beginning | $ | 20.06 | | $ | 15.80 | | $ | 16.14 | |
| Income from investment operations: | | | | | | | | | |
| Net investment income | | .16 | | | .35 | | | .17 | |
| Net realized and unrealized gain (loss) | | 6.24 | | | 4.21 | | | (.45 | ) |
| Total from investment operations | | 6.40 | | | 4.56 | | | (.28 | ) |
| Distributions from: | | | | | | | | | |
| Net investment income | | (.36 | ) | | (.30 | ) | | (.06 | ) |
| Net realized gain | | (.54 | ) | | — | | | — | |
| Total distributions | | (.90 | ) | | (.30 | ) | | (.06 | ) |
| Total increase (decrease) in net asset value | | 5.50 | | | 4.26 | | | (.34 | ) |
| Net asset value, ending | $ | 25.56 | | $ | 20.06 | | $ | 15.80 | |
| |
| Total return* | | 33.43 | % | | 29.11 | % | | (1.81 | %) |
| Ratios to average net assets:A | | | | | | | | | |
| Net investment income | | .71 | % | | 1.88 | % | | .90 | % |
| Total expenses | | .98 | % | | 1.03 | % | | 1.08 | % |
| Expenses before offsets | | .92 | % | | .92 | % | | .92 | % |
| Net expenses | | .92 | % | | .92 | % | | .92 | % |
| Portfolio turnover | | 82 | % | | 3 | % | | 9 | % |
| Net assets, ending (in thousands) | $ | 46,198 | | $ | 26,129 | | $ | 17,895 | |
| |
| | | | | | YEARS ENDED | |
| | | | | | SEPTEMBER
30, | | | SEPTEMBER
30, | |
| CLASS I SHARES | | | | | 2010 | | | 2009 | |
| Net asset value, beginning | | | | $ | 14.56 | | $ | 15.94 | |
| Income from investment operations: | | | | | | | | | |
| Net investment income | | | | | .08 | | | .08 | |
| Net realized and unrealized gain (loss) | | | | | 1.50 | | | (1.46 | ) |
| Total from investment operations | | | | | 1.58 | | | (1.38 | ) |
| Distributions from: | | | | | | | | | |
| Net investment income | | | | | — | | | — | |
| Total distributions | | | | | — | | | — | |
| Total increase (decrease) in net asset value | | | | | 1.58 | | | (1.38 | ) |
| Net asset value, ending | | | | $ | 16.14 | | $ | 14.56 | |
| |
| Total return* | | | | | 10.85 | % | | (8.66 | %) |
| Ratios to average net assets:A | | | | | | | | | |
| Net investment income | | | | | .44 | % | | .60 | % |
| Total expenses | | | | | 1.16 | % | | 1.16 | % |
| Expenses before offsets | | | | | .92 | % | | .93 | % |
| Net expenses | | | | | .92 | % | | .92 | % |
| Portfolio turnover | | | | | 174 | % | | 61 | % |
| Net assets, ending (in thousands) | | | | $ | 12,001 | | $ | 12,428 | |
See notes to financial highlights.
36 www.calvert.com CALVERT SMALL CAP FUND ANNUAL REPORT
A Total expenses do not reflect amounts reimbursed and/or waived by the Advisor or reductions from expense offset arrangements. Expenses before offsets reflect expenses after reimbursement and/or waiver by the Advisor but prior to reductions from expense offset arrangements. Net expenses are net of all reductions and represent the net expenses paid by the Fund.
* Total return is not annualized for periods of less than one year and does not reflect deduction of any front-end or deferred sales charge.
** Portfolio turnover is not annualized for periods of less than one year.
# From November 29, 2010 inception.
(a) Annualized.
(z) Per share figures are calculated using the Average Shares Method.
See notes to financial statements.
www.calvert.com CALVERT SMALL CAP FUND ANNUAL REPORT 37
EXPLANATION OF FINANCIAL TABLES
SCHEDULE OF INVESTMENTS
The Schedule of Investments is a snapshot of all securities held in the fund at their market value, on the last day of the reporting period. Securities are listed by asset type (e.g., common stock, corporate bonds, U.S. government obligations) and may be further broken down into sub-groups and by industry classification.
STATEMENT OF ASSETS AND LIABILITIES
The Statement of Assets and Liabilities is often referred to as the fund’s balance sheet. It lists the value of what the fund owns, is due and owes on the last day of the reporting period. The fund’s assets include the market value of securities owned, cash, receivables for securities sold and shareholder subscriptions, and receivables for dividends and interest payments that have been earned, but not yet received. The fund’s liabilities include payables for securities purchased and shareholder redemptions, and expenses owed but not yet paid. The statement also reports the fund’s net asset value (NAV) per share on the last day of the reporting period. The NAV is calculated by dividing the fund’s net assets (assets minus liabilities) by the number of shares outstanding. This statement is accompanied by a Schedule of Investments. Alternatively, if certain conditions are met, a Statement of Net Assets may be presented in lieu of this statement and the Schedule of Investments.
STATEMENT OF NET ASSETS
The Statement of Net Assets provides a detailed list of the fund’s holdings, including each security’s market value on the last day of the reporting period. The Statement of Net Assets includes a Schedule of Investments. Other assets are added and other liabilities subtracted from the investments total to calculate the fund’s net assets. Finally, net assets are divided by the outstanding shares of the fund to arrive at its share price, or Net Asset Value (NAV) per share.
At the end of the Statement of Net Assets is a table displaying the composition of the fund’s net assets. Paid in Capital is the money invested by shareholders and represents the bulk of net assets. Undistributed Net Investment Income and Accumulated Net Realized Gains usually approximate the amounts the fund had available to distribute to shareholders as of the statement date. Accumulated Realized Losses will appear as negative balances. Unrealized Appreciation (Depreciation) is the difference between the market value of the fund’s investments and their cost, and reflects the gains (losses) that would be realized if the fund were to sell all of its investments at their statement-date values.
STATEMENT OF OPERATIONS
The Statement of Operations summarizes the fund’s investment income earned and expenses incurred in operating the fund. Investment income includes dividends earned from stocks and interest earned from interest-bearing securities in the fund. Expenses incurred in operating the fund include the advisory fee paid to the investment advisor, administrative services fees, distribution plan expenses (if applicable), transfer agent fees, shareholder servicing expenses, custodial, legal, and audit fees, and the printing and postage expenses related to shareholder reports. Expense offsets (fees paid indirectly) are also
38 www.calvert.com CALVERT SMALL CAP FUND ANNUAL REPORT (UNAUDITED)
shown. Credits earned from offset arrangements are used to reduce the fund’s expenses. This statement also shows net gains (losses) realized on the sale of investments and the increase or decrease in the unrealized appreciation (depreciation) on investments held during the period.
STATEMENT OF CHANGES IN NET ASSETS
The Statement of Changes in Net Assets shows how the fund’s total net assets changed during the two most recent reporting periods. Changes in the fund’s net assets are attributable to investment operations, distributions and capital share transactions.
The Operations section of the report summarizes information detailed in the Statement of Operations. The Distribution section shows the dividend and capital gain distributions made to shareholders. The amounts shown as distributions in this section may not match the net investment income and realized gains amounts shown in the Operations section because distributions are determined on a tax basis and certain investments or transactions may be treated differently for financial statement and tax purposes. The Capital Share Transactions section shows the amount shareholders invested in the fund, either by purchasing shares or by reinvesting distributions, and the amounts redeemed. The corresponding numbers of shares issued, reinvested and redeemed are shown at the end of the report.
FINANCIAL HIGHLIGHTS
The Financial Highlights table provides a per-share breakdown per class of the components that affect the fund’s net asset value for current and past reporting periods. The table provides total return, total distributions, expense ratios, portfolio turnover and net assets for the applicable period. Total return is a measure of a fund’s performance that encompasses all elements of return: dividends, capital gain distributions and changes in net asset value. Total return is the change in value of an investment over a given period, assuming reinvestment of any dividends and capital gain distributions, expressed as a percentage of the initial investment. Total distributions include distributions from net investment income and net realized gains. Long-term gains are earned on securities held in the fund more than one year. Short-term gains, on the sale of securities held less than one year, are treated as ordinary dividend income for tax purposes. The expense ratio is a fund’s cost of doing business, expressed as a percentage of net assets. These expenses directly reduce returns to shareholders. Portfolio turnover measures the trading activity in a fund’s investment portfolio – how often securities are bought and sold by a fund. Portfolio turnover is affected by market conditions, changes in the size of the fund, the nature of the fund’s investments and the investment style of the portfolio manager.
www.calvert.com CALVERT SMALL CAP FUND ANNUAL REPORT (UNAUDITED) 39
PROXY VOTING
The Proxy Voting Guidelines of the Calvert Funds that the Fund uses to determine how to vote proxies relating to portfolio securities are provided as an Appendix to the Fund’s Statement of Additional Information. The Statement of Additional Information can be obtained free of charge by calling the Fund at 1-800-368-2745, by visiting the Calvert website at www.calvert.com; or by visiting the SEC’s website at www.sec.gov.
Information regarding how the Fund voted proxies relating to portfolio securities during the most recent 12-month period ended June 30 is available on the Fund’s website at www.calvert.com and on the SEC’s website at www.sec.gov.
AVAILABILITY OF QUARTERLY PORTFOLIO HOLDINGS
The Fund files its complete schedule of portfolio holdings with the SEC for the first and third quarters of each fiscal year on Form N-Q. The Fund’s Form N-Q is available on the SEC’s website at www.sec.gov. The Fund’s Form N-Q may be reviewed and copied at the SEC’s Public Reference Room in Washington, DC; information on the operation of the Public Reference Room may be obtained by calling 1-800-SEC-0330.
40 www.calvert.com CALVERT SMALL CAP FUND ANNUAL REPORT (UNAUDITED)
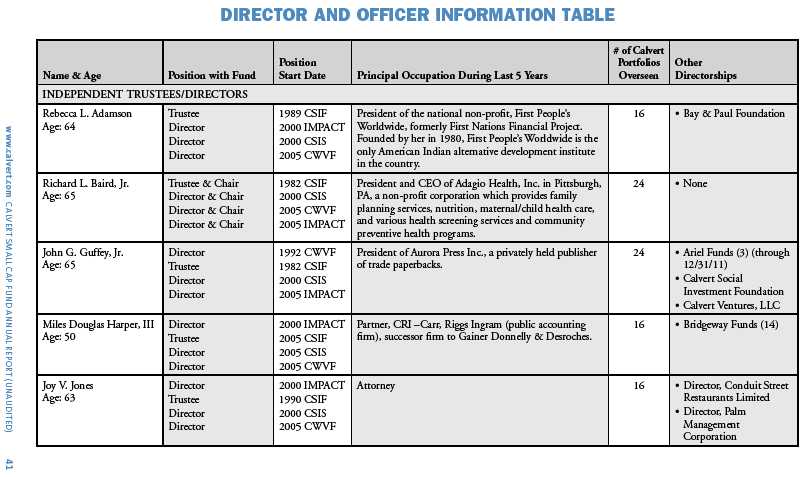

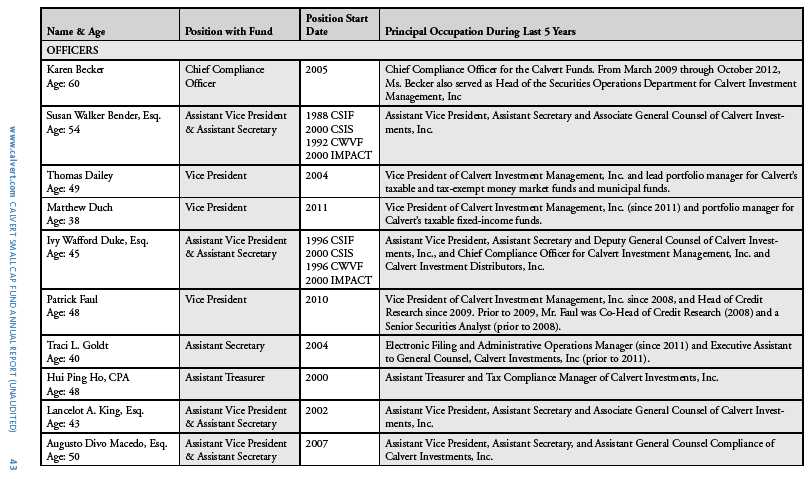

To Open an Account
800-368-2748
Service for Existing Account
Shareholders: 800-368-2745
Brokers: 800-368-2746
TDD for Hearing Impaired
800-541-1524
Registered Mail
Calvert Investments
c/o BFDS,
P.O. Box 219544
Kansas City, MO 64121-9544
Overnight Mail
Calvert Investments
c/o BFDS,
330 West 9th Street
Kansas City, MO 64105
Web Site
www.calvert.com
Principal Underwriter
Calvert Investment Distributors, Inc.
4550 Montgomery Avenue
Suite 1000 North
Bethesda, Maryland 20814
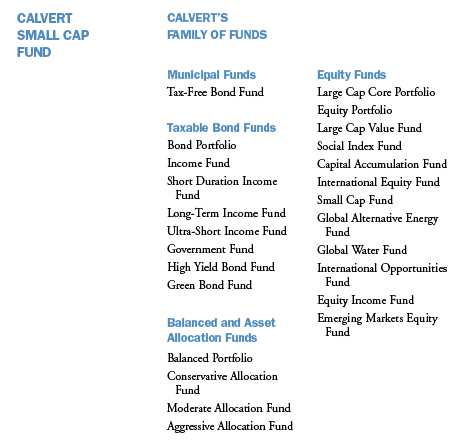
This report is intended to provide fund information to shareholders. It is not authorized for distribution to prospective investors unless preceded or accompanied by a prospectus.
Note: The information on our website is not incorporated by reference into this report; our website address is included as an inactive textual reference only.
Investors should carefully consider the investment objectives, risks, charges and expenses of the Calvert Funds. This and other important information is contained in the fund’s summary prospectus and prospectus, which can be obtained from your financial professional and should be read carefully before investing. You may also call Calvert at 800/368-2748 or visit www. calvert.com.
Choose Planet-friendly E-delivery!
Sign up now for on-line statements, prospectuses, and fund reports. In less than five minutes you can help reduce paper mail and lower fund costs.
Just go to www.calvert.com. If you already have an online account at Calvert, click on My Account, and select the documents you would like to receive via e-mail.
If you’re new to online account access, click on Login/Register to open an online account. Once you’re in, click on the E-delivery sign-up at the bottom of the Account Portfolio page and follow the quick, easy steps. Note: if your shares are not held directly at Calvert but through a brokerage firm, you must contact your broker for electronic delivery options available through their firm.

Barbara Krumsiek
President and CEO of Calvert Investments, Inc.
Dear Calvert Shareholder,
For the 12 months ended September 30, 2013, the global equity markets generally had a strong year, while bonds saw more mixed results. Large-cap stocks, as represented by the Russell 1000 Index, posted a healthy 20.9% return, while the smaller-cap Russell 2000 Index led with a 30.1% gain. This occurred despite political turmoil and market concerns worldwide about a forced shutdown of the U.S. government and the upcoming debt ceiling deadline.
Despite these advances, it was a challenging year for the financial markets overall. At various times, issues at home and abroad led to marked volatility in the performance of both stocks and bonds. Emerging-market performance was notably low, as fears of slowing growth in China and the Eurozone, along with continuing struggles in the Eurozone periphery, stalled regional investment. As a result, the formerly high-flying MSCI Emerging Markets Index gained only 1.3% for the period. The Barclays U.S. Credit Index, a barometer for the overall U.S. bond market, returned -1.9%.
Early in the Fall, Fed Chairman Ben Bernanke’s retirement was big news. The nomination of Vice Chair Janet Yellen as his replacement means the Fed will likely stay the course with current monetary policy. Yet, this is a historic moment for the United States, as Yellen, following Senate approval, will be the first woman to lead this critical agency.
Calvert Co-Founder Honored
I’m proud to congratulate Calvert co-founder Wayne Silby, who received the prestigious Joseph Wharton Award for Social Impact from The Alumni Club of New York, honoring his lifetime of achievement in impact investing and social entrepreneurship. Besides founding Calvert with John Guffey, Wayne is a co-founder of the Social Venture Network, Co-Chairman of the board of the Calvert Foundation, Chairman of Syntao Ltd., a CSR consultancy in Beijing, and active in other ventures in social impact and entrepreneurship.
Calvert Releases New Report on Diversity
In March, we published the latest edition of Examining the Cracks in the Glass Ceiling, which measures diversity practices of the companies that constitute the S&P 100 Index. As you know, Calvert believes companies with a diverse workforce are poised for greater success in today’s increasingly global marketplace and will enjoy greater long-term value—a view supported by a growing body of research from McKinsey, Credit Suisse, and others.
Companies in the report were rated on 10 indicators: EEO policy, internal diversity initiatives, external diversity initiatives, scope of diversity initiatives, family-friendly benefits, demographic disclosure of employees (EEO-1), highest-paid executives, board diversity,
4 www.calvert.com CALVERT SOLUTION STRATEGIES ANNUAL REPORT
director selection criteria, and overall corporate commitment. The highest-rated compa nies were Citigroup, Merck, The Coca-Cola Company, and J.P. Morgan Chase, all scor ing at least 95 points or more out of 100. We hold these companies in a number of our Calvert portfolios.
While some progress has been achieved in corporate diversity practices since our last assessment in 2010, the S&P 100 companies are largely failing to translate progressive practices into increased promotion rates for women and minority employees. For example, women are now hired as often as men. However, more than half of the S&P 100 companies lack diversity among their highest-paid senior executive positions. And women still only represent 19% of board members among these large-cap companies. Much remains to be done, which is why we continue to work with a number of interna tional, multi-stakeholder groups on these issues, as well as conduct advocacy work with individual companies.
Stay Informed in the Months Ahead
Maintaining a well-diversified mix of U.S. and international stocks, bonds, and cash—appropriate for your goals and risk tolerance—is one of the best ways to mitigate the effects of an uneven recovery in the economy and markets. Of course, we recommend consulting your financial advisor if you have questions or concerns about your investments.
We also invite you to visit our website, www.calvert.com, for fund information, portfolio updates, and commentary from Calvert professionals. As always, we thank you for invest ing with Calvert.

The following companies represented the following percentages of Fund net assets: Citigroup 2.27% of Calvert Large Cap Value, 1.32% of Calvert Social Index; Merck 2.26% of Calvert Equity Income, 2.01% of Calvert Large Cap Value, and 1.25% of Calvert Social Index; Coca-Cola 1.29% of Calvert Social Index, 3.20% of Calvert Large Cap Core and 3.29% Calvert Equity Portfolio; J.P. Morgan Chase 2.54% of Calvert Equity Income, 1.74% of Calvert Social Index and 0.34% of Calvert Balanced Portfolio. Holdings are subject to change.
www.calvert.com CALVERT SOLUTION STRATEGIES ANNUAL REPORT 5

As always, Calvert continues to work hard to ensure you have a say in the responsible management of environmental, social, and governance (ESG) factors for the companies in which we invest. Below are highlights of our accomplishments during the reporting period.
Climate Change And Energy
As an active member of the Investor Network on Climate Risk (INCR), particularly in the effort to support legislation for the Production Tax Credit (PTC) which was due to expire at the end of 2012, Calvert participated in meetings with congressional staff and drafted an investor letter to Congress supporting the PTC.
Along with the World Wildlife Fund (WWF) and Ceres, Calvert also published, “Power Forward: Why the World’s Largest Companies are Investing in Renewable Energy.” The report found more than half of the largest U.S. corporations and more than two-thirds of the largest companies across the globe have set greenhouse gas (GHG) emissions reduction commitments and/or renewable energy commitments. We also discussed the report’s recommendations with congressional staff. All of these efforts helped spur the extension of the PTC for wind energy as part of the “fiscal cliff” deal passed by Congress.
350.Org Divestment Campaign On Fossil Fuels
Calvert watched closely the 350.org campaign urging college and university endowments, as well as other institutional investors, to divest from companies producing fossil fuels. In December, Calvert posted a statement on our website expressing support for the campaign’s broad objectives while making the case for a complementary strategy of active ownership and engagement. The statement pointed to specific fossil fuel companies Calvert has successfully engaged on climate change, alternative energy, and revenue transparency.
Water Advocacy & Public Policy
Calvert remained an active leader in four policy and advocacy campaigns: the ICCR Food and Water working group, the Ceres Water working group, the CEO Water Mandate, and the Principle for Responsible Investment (PRI) work related to water.
During the period, we sent an announcement to all PRI signatories commending the draft CEO Water Mandate’s Disclosure Guidance document—a joint report from the CEO Water Mandate and PRI providing guidelines on the disclosure of water-related activities. The guidelines will be piloted for a year and we worked with the CEO Water Mandate secretariat to promote the document and encourage select holdings to pilot the Disclosure Guidance approach. We also remained active in the CEO Water Mandate’s working group on human rights.
6 www.calvert.com CALVERT SOLUTION STRATEGIES ANNUAL REPORT
Other Shareholder Advocacy
We filed a shareholder resolution with Fossil, an apparel maker, to evaluate and report on its supply chain risks from water scarcity and pollution, which received support from 29% of shareholders. A resolution filed with Public Storage on reducing energy use was successfully withdrawn. We also undertook more engagement with Coca-Cola and PepsiCo on water issues during the year.
None of the companies listed above, Fossil, Public Storage, Coca-Cola and PepsiCo, were held by either of the Funds.
Holdings are subject to change.
www.calvert.com CALVERT SOLUTION STRATEGIES ANNUAL REPORT 7

Investment Performance
The Calvert Global Alternative Energy Fund Class A shares (at NAV) returned a strong 34.50% for the one-year period ended September 30, 2013, versus the Ardour Global Alternative Energy Index (Composite) return of 58.02%. The relative underperformance was largely due to not holding several high-risk, high-performing stocks in the Index that fail to meet our standards for quality and proven profitability.
Investment Climate
It was a very strong period for global asset returns with the MSCI World Equity Index gaining 20.90%. All developed markets participated in this market rally, with Japan and the eurozone leading the gains.1 In contrast, emerging markets lagged significantly, with the MSCI Emerging Market Equity Index showing a gain of 1.33%.
In the United States, the most notable events were in the latter months of 2012, marked by the U.S. presidential election and the subsequent efforts to avert the “fiscal cliff,” which was due to happen in early 2013. The prospect of a series of sharp tax increases and spending cuts early in January had the potential to derail the economic recovery. Fortunately, a dramatic last-minute deal was agreed upon after weeks of debate.
In Japan, there has been a clear shift in policy by Prime Minister Shinzo Abe’s government towards a much more pro-growth stance. Markets have reacted very favorably to the aggressive fiscal and monetary stimulus policies and new-growth initiative, as well as the evidence of a pickup in economic activity.
However, the performance of emerging-market equities was disappointing. Events in China were the key catalyst. Markets reacted positively to an apparent rebound in economic growth during the fourth quarter of 2012, as well as a new leadership team. However, growth decelerated throughout much of 2013, spurring fears of a hard landing in the Chinese economy. In addition to concerns over Chinese growth, emerging-market equities have been negatively impacted by commodity price weakness and the prospect of the Federal Reserve tapering the quantitative easing in the United States.
8 www.calvert.com CALVERT SOLUTION STRATEGIES ANNUAL REPORT
| | |
| CALVERT GLOBAL |
| ALTERNATIVE |
| ENERGY FUND |
| SEPTEMBER 30, 2013 |
| |
| | % OF TOTAL | |
| ECONOMIC SECTORS | INVESTMENTS | |
| Consumer Discretionary | 4.4 | % |
| Consumer Staples | 4.9 | % |
| Energy | 3.5 | % |
| Industrials | 32.2 | % |
| Information Technology | 15.1 | % |
| Materials | 4.3 | % |
| Short-Term Investments | 1.8 | % |
| Utilities | 33.8 | % |
| Total | 100 | % |
More broadly, equity markets have continued to make positive gains as the global economy increasingly progressed towards a more normal pace of growth. U.S. economic data has shown reasonably strong growth, a widely-feared hard landing in China has failed to materialize, and the eurozone has officially emerged from recession. More recently, the markets welcomed the Fed’s decision to not taper its pace of quantitative easing and emphasized how strongly policymakers around the world continue to pursue “pro-growth” policies, a dominant theme throughout this period.
Companies active in the renewable energy space have very much come back to the fore.
Continued technological development has caused the costs of wind and solar to decline rapidly, pointing to widespread grid parity for both technologies in the near future. Grid parity is achieved when the cost of a renewable technology is less than or equal to the costs of traditional
| CALVERT GLOBAL |
| ALTERNATIVE |
| ENERGY FUND |
| SEPTEMBER 30, 2013 |
| |
| INVESTMENT PERFORMANCE | | | |
| (TOTAL RETURN AT NAV*) | | | |
| | 6 MONTHS | | 12 MONTHS | |
| | ENDED | | ENDED | |
| | 9/30/13 | | 9/30/13 | |
| Class A | 13.77 | % | 34.50 | % |
| Class C | 13.27 | % | 33.20 | % |
| Class I | 14.15 | % | 35.26 | % |
| Class Y | 13.97 | % | 34.96 | % |
| |
| Ardour Global | | | | |
| Alternative | | | | |
| Energy Index | | | | |
| (Composite) | 36.76 | % | 58.02 | % |
| |
| Lipper Global | | | | |
| Natural Resources | | | | |
| Funds Average | 4.94 | % | 8.57 | % |
| TEN LARGEST | % OF NET | |
| STOCK HOLDINGS | ASSETS | |
| Eaton Corp. plc | 5.3 | % |
| Cosan Ltd. | 4.8 | % |
| EDP Renovaveis SA | 4.5 | % |
| Johnson Controls, Inc. | 4.4 | % |
| PNE Wind AG | 3.3 | % |
| NextEra Energy, Inc. | 3.2 | % |
| Albioma | 2.9 | % |
| Brookfield Renewable Energy | | |
| Partners LP | 2.9 | % |
| Renewables Infrastructure | | |
| Group Ltd. | 2.7 | % |
| Cree, Inc. | 2.7 | % |
| Total | 36.7 | % |
* Investment performance/return at NAV does not reflect the deduction of the Fund’s maximum 4.75% front-end sales charge or any deferred sales charges.
www.calvert.com CALVERT SOLUTION STRATEGIES ANNUAL REPORT 9
sources of energy from the electricity grid. A significant over-supply of solar modules and wind turbines lowered prices, creating a near-term challenge for wind and solar equipment manufacturers. Nevertheless, as active managers, we still identified attractive wind and solar companies advantageously positioned in the value chain as well as higher-quality, low-cost producers we believe are poised to be long-term winners.
President Obama’s Climate Action Plan announced in June was largely a rebrand-ing of prior initiatives, but nevertheless represents renewed support for energy and energy efficiency. Also in June, the International Energy Agency released a report projecting that power generation from hydro, wind, solar and other renewable sources worldwide will exceed power from gas and be twice that from nuclear by 2016.
Portfolio Strategy
The Fund’s largest sector position was in Energy Efficiency, with a weighting consistently between 40-50%. This is where we see the most attractive opportunities supported by secular (or long-term) growth trends. Energy efficiency in all areas of industry—from building to lighting to transportation—is poised to benefit from the improving macroeconomic environment. We see secular growth opportunities in the demand for improved energy efficiency in existing buildings as well as the strong, new non-residential construction in emerging markets.
| CALVERT GLOBAL |
| ALTERNATIVE |
| ENERGY FUND |
| SEPTEMBER 30, 2013 |
| |
| AVERAGE ANNUAL TOTAL RETURNS | |
| |
| CLASS A SHARES | (WITH MAX. LOAD) | |
| One year | 28.04 | % |
| Five year | -11.28 | % |
| Since inception (5/31/2007) | -11.75 | % |
| |
| CLASS C SHARES | (WITH MAX. LOAD) | |
| One year | 32.20 | % |
| Five year | -11.27 | % |
| Since inception (7/31/2007) | -12.80 | % |
| |
| CLASS I SHARES | | |
| One year | 35.26 | % |
| Five year | -9.93 | % |
| Since inception (5/31/2007) | -10.64 | % |
| |
| CLASS Y SHARES* | | |
| One year | 34.96 | % |
| Five year | -10.28 | % |
| Since inception (5/31/2007) | -10.97 | % |
* Calvert Global Alternative Energy Fund first offered Class Y shares on July 29, 2011. Performance prior to that date reflects the performance of Class A shares at net asset value (NAV). Actual Class Y share performance would have been different.
More recently, we slightly increased the Fund’s weighting in the Solar sector because some fundamentals are showing signs of improvement. However, we will maintain a strong stock-picking discipline to identify quality players, preferring developers with development pipelines in profitable regions and low-cost manufacturers close to profitability.
GROWTH OF $10,000
The graph below shows the value of a hypothetical $10,000 investment in the Fund over
10 www.calvert.com CALVERT SOLUTION STRATEGIES ANNUAL REPORT
the past 10 fiscal year periods or since inception (for funds without 10-year records). The results shown are for Classes A and I shares and reflect the deduction of the maximum front-end Class A sales charge of 4.75% and assume the reinvestment of dividends. The result is compared with benchmarks that include a broad based market index and a Lipper peer group average. Market indexes are unmanaged and their results do not reflect the effect of expenses or sales charges. The Lipper average reflects the deduction of the category’s average front-end sales charge. The value of an investment in a different share class would be different.
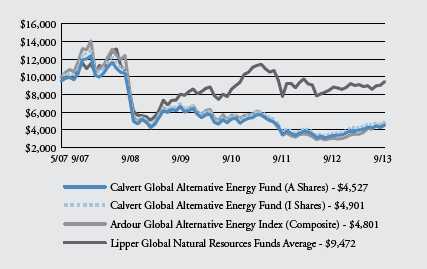
All performance data shown, including the graph above and the adjacent table, represents past performance, does not guarantee future results, assumes reinvestment of dividends and distributions and does not reflect the deduction of taxes that a shareholder would pay on the Fund’s distributions or the redemption of the Fund shares. All performance data reflects fee waivers and/or expense limitations, if any are in effect; in their absence performance would be lower. See Note B in Notes to Financial Statements. The investment return and principal value of an investment will fluctuate so that an investor’s shares, when redeemed, may be worth more or less than their original cost. Current performance may be lower or higher than the performance data quoted; for current performance data visit www.calvert.com. The gross expense ratio from the current prospectus for Class A shares is 2.57%. This number may differ from the expense ratio shown elsewhere in this report because it is based on a different time period and, if applicable, does not include fee or expense waivers. Performance data quoted already reflects the deduction of the Fund’s operating expenses.
www.calvert.com CALVERT SOLUTION STRATEGIES ANNUAL REPORT 11
The Fund also increased its exposure to Wind, continuing to favor wind farm developers with strong cash flow yields supported by long-term contracted power purchase agreements (PPA). As power prices remain under pressure, we maintain our lower weighting in Utilities, with exposure to merchant generators who build power capacity on a speculative basis or acquire utility-divested plants and then market their output at competitive rates in unregulated markets.
Portfolio decisions affecting performance
With positive sentiment returning to renewable-energy companies during the period, there was very much an element of “the rising tide lifting all ships.” As a result, the Fund’s strong emphasis on quality, which has been a significant positive for a number of years, negatively impacted relative performance during this review period.
The most notable impacts on relative performance were:
An underweight to Tesla, an early leader in the electric vehicle market. The Fund originally bought it in early 2012 and sold out of it completely in June 2013 after the share price had tripled to $98, as we felt it reached unjustified valuation levels (PE of 300x). While we really liked the company, we felt the risk reward trade/off was no longer attractive. The Ardour Index had accumulated a weighting of over 10% in the stock as of the end September, a weighting we feel represents too high a degree of risk.
An underweight position to the Solar sector. The outperformance of risk stocks in the equity markets this past year is consistent with an economic upturn, when high risk tends to outperform other styles. This is one of the factors behind the significant rally in Solar this past year, where even some of the lower quality, highly indebted companies such as Suntech and LDK Solar (both facing bankruptcy) performed on par with their better-placed peers. We prefer to hold higher-quality companies active in the more profitable downstream part of the value chain, such as SunEdison and Canadian Solar.
We recently started increasing our exposure to the Solar sector as some data points become more favorable—with module prices remaining stable, costs being trimmed, and manufacturers beginning to run at full capacity amid strong demand in countries such as China, which is adopting favorable policies.
Security selection in Wind. While a number of our Wind names performed strongly, we missed out by not owning the wind turbine manufacturers such as Nordex, Gamesa and Vestas. These are all turnaround stories as they deal with overcapacity, declining prices and stretched balance sheets. During the year, we preferred wind farm operators who benefit from falling turbine prices, particularly the Chinese players, China Longyuan and China Suntien, as China overtook the United States to be the biggest wind market in the past year.
We also participated in a number of IPO’s, including TransAlta Renewables, Greencoat UK Wind and Renewable Infrastructure Group. They are interesting for a number of reasons. First, their cash flows are secured by the sale of electricity on long-term contracts, which offers a defensive element in the Fund with a better ability to steer through volatile markets. Second, they are high dividend payers. This trend of packaging renewable assets into high dividend-paying structures offers a new dimension to the Fund.
12 www.calvert.com CALVERT SOLUTION STRATEGIES ANNUAL REPORT
Outlook
The Fund continues to be closely tied to the recovering global economy, with the added impetus of renewable and energy efficiency themes at the forefront of national policies from the United States to China. In the U.S., we are hopeful the Production Tax Credit (PTC) supporting the Wind industry will be renewed by year-end, while Western states continue to promote the adoption of Solar photovoltaics. China remains committed to reducing its coal consumption in favor of cleaner renewable energy and gas, while recent policy announcements suggest its continued support for increasing installed capacity.
Macro news flow will remain a key performance driver, especially for our Industrial holdings within Energy Efficiency. The energy efficiency theme is well placed to grow as the construction industry recovers in the United States, while more stringent emissions standards for cars should drive growth for relevant technologies. The adoption of LED lighting also continues to gather pace and now represents a larger chunk of our Energy Efficiency exposure.
The demand for solar modules continues to show signs of growth. During the second half of 2013, we expect industry installations to migrate away from the European markets to new markets such as China, Japan and the United States. In 2014, we expect strong demand for Solar distributed generation to emerge in South America and South East Asia. New investment opportunities continue to arise with IPO’s of renewable assets. Finally, we plan to continue to invest in solid yield-producing assets supported by long-term contracts.
October 2013
1. MSCI Japan Index returned 31.67% and MSCI EMU Index returned 30.09%
As of September 30, 2013, the following companies represented the following percentages of Fund net assets: Tesla 0%, Suntech 0%, LDK Solar 0%, SunEdison 2.29%, Canadian Solar 1.05%, Nordex 0%, Gamesa 0%, Vestas 0%, China Longyuan 1.51%, China Suntien 2.63%, TransAlta Renewables 1.00%, Greencoat UK Wind 2.21%, and Renewable Infrastructure Group 2.74%. Holdings are subject to change.
www.calvert.com CALVERT SOLUTION STRATEGIES ANNUAL REPORT 13

Investment Performance
The Calvert Global Water Fund Class A shares (at NAV) returned 25.81% for the one-year period ended September 30, 2013, versus the S-Network Global Water Index return of 24.38%. The outperformance was largely due to a combination of sector positioning and security selection.
Investment Climate
It was a very strong period for asset returns, with the MSCI World Index gaining 20.90%. All developed markets participated in this market rally, led by strong gains in Japan and the eurozone.1 In contrast, emerging markets have lagged significantly, with the MSCI Emerging Market Equity Index showing a gain of 1.33%.
In the United States, the most notable events were in the final months of 2012, marked by the U.S. presidential election and the subsequent efforts to avert the “fiscal cliff,” which was due to happen in early 2013. The prospect of a series of sharp tax increases and spending cuts early in January had the potential to derail the economic recovery. Fortunately, a dramatic last-minute deal was reached after weeks of debate.
In Japan, there has been a clear shift in policy by Prime Minister Shinzo Abe’s government towards a much more pro-growth stance. Markets have reacted very favorably to the aggressive fiscal and monetary stimulus policies and the new-growth initiative, as well as the evidence of a pickup in economic activity.
However, the performance of emerging-market equities was disappointing, with events in China the key catalyst. Markets reacted positively to an apparent rebound in economic growth during the fourth quarter of 2012 as well as a new leadership team. However, growth decelerated throughout much of 2013, spurring fears of a hard landing in the Chinese economy. In addition to concerns over Chinese growth, emerging-market equities have been negatively impacted by commodity price weakness and the prospect of the Federal Reserve tapering the quantitative easing (QE) in the United States.
14 www.calvert.com CALVERT SOLUTION STRATEGIES ANNUAL REPORT
| | |
| CALVERT GLOBAL |
| WATER FUND |
| SEPTEMBER 30, 2013 |
| |
| | % OF TOTAL | |
| ECONOMIC SECTORS | INVESTMENTS | |
| Consumer Discretionary | 2.8 | % |
| Financials | 2.9 | % |
| Industrials | 49.8 | % |
| Information Technology | 5.5 | % |
| Materials | 6.6 | % |
| Short-Term Investments | 4.4 | % |
| Utilities | 28.0 | % |
| Total | 100 | % |
More broadly, the equity markets continued to make positive gains as the global economy moved toward a more normal pace of growth. U.S. economic data has shown reasonably strong growth, a widely feared “hard landing” in China failed to materialize, and the eurozone officially emerged from recession. More recently, the markets welcomed the Fed’s decision to not taper its pace of QE. Around the world, policymakers strongly continued to pursue “pro-growth” policies, a dominant theme throughout this period.
Portfolio Strategy
Throughout the quarterly earnings seasons, our companies generally performed well against modest expectations. Positive commentary regarding order rates and end markets boosted investor confidence and ultimately led to favorable sentiment toward these companies. Many of the management teams at our industrial companies have been positioning their strategies and operations for a low-growth environment.
This has meant stronger attention to cost efficiencies, higher focus on R&D investment, and articulating disciplined M&A and other capital allocation strategies. These “self-help” moves served to prepare the companies for an economic downturn, if that were to materialize, or enable healthy earnings growth despite the projected meager global-growth
| CALVERT GLOBAL |
| WATER FUND |
| SEPTEMBER 30, 2013 |
| |
| INVESTMENT PERFORMANCE | | | |
| (TOTAL RETURN AT NAV*) | | | |
| | 6 MONTHS | | 12 MONTHS | |
| | ENDED | | ENDED | |
| | 9/30/13 | | 9/30/13 | |
| Class A | 7.78 | % | 25.81 | % |
| Class C | 7.31 | % | 24.63 | % |
| Class Y | 7.92 | % | 26.07 | % |
| |
| S-Network | | | | |
| Global Water | | | | |
| Index | 10.87 | % | 24.38 | % |
| |
| Lipper Global | | | | |
| Natural | | | | |
| Resources Funds | | | | |
| Average | 4.94 | % | 8.57 | % |
| TEN LARGEST | % OF NET | |
| STOCK HOLDINGS | ASSETS | |
| Cia de Saneamento Basico do | | |
| Estado de Sao Paulo (ADR) | 6.2 | % |
| SPX Corp. | 5.3 | % |
| Suez Environnement SA | 5.2 | % |
| Sulzer AG | 5.0 | % |
| Flowserve Corp. | 5.0 | % |
| United Utilities Group plc | 4.4 | % |
| Xylem, Inc. | 4.3 | % |
| American Water Works Co., Inc. | 4.1 | % |
| Ashland, Inc. | 3.9 | % |
| Ebana Corp. | 3.8 | % |
| Total | 47.2 | % |
* Investment performance/return at NAV does not reflect the deduction of the Fund’s maximum 4.75% front-end sales charge or any deferred sales charges.
www.calvert.com CALVERT SOLUTION STRATEGIES ANNUAL REPORT 15
scenario, or enhance their earnings power in a better-than-forecast scenario.
Much was written in September about the imminent turn of the capital expenditures (capex) cycle. Conditions appear to be ripe for this to occur—one leading indicator is the record gap between U.S. new orders and inventories. Even more important is what the our long-cycle companies themselves are saying about capital expenditures.
Management teams at some of our large pump companies are very encouraged by the progression of large projects through bidding stages, particularly in the oil and gas and chemicals markets, and continue to anticipate project awards in the last half of this year. This is a thesis we have subscribed to since the end of 2011 and led us to re-evaluate our pump companies. In our view, the earnings story has not yet played out and remains the key driver of performance from here on.
| CALVERT GLOBAL |
| WATER FUND |
| SEPTEMBER 30, 2013 |
| |
| AVERAGE ANNUAL TOTAL RETURNS | |
| |
| CLASS A SHARES | (WITH MAX. LOAD) | |
| One year | 19.81 | % |
| Five year | 8.41 | % |
| Since inception (9/30/2008) | 8.41 | % |
| |
| CLASS C SHARES | (WITH MAX. LOAD) | |
| One year | 23.63 | % |
| Five year | 8.41 | % |
| Since inception (9/30/2008) | 8.41 | % |
| |
| CLASS Y SHARES | | |
| One year | 26.07 | % |
| Five year | 9.67 | % |
| Since inception (9/30/2008) | 9.67 | % |
Throughout the period, the Fund’s sector positioning remained fairly consistent. Infrastructure continues to be the largest weighting, though it recently decreased from being roughly half of the Fund after the acquisition of Gardner Denver in August. Water Technology predominantly increased as a result. With expectations of capital spending accelerating over the next few months, we added to shorter-cycle Industrials, such as Danaher and Agilent, and also increased exposure to Itron and Calgon Carbon, which have their own individual stock-specific drivers.
We continue to like the valuations, business models, end-market developments, self-help measures, and multi-year earnings growth potential for the pump and fluid control companies within Infrastructure. Our Water Technology weighting increased from the low end of its historic range to now approximately 24% of the portfolio , and is set to increase further as we have identified some other attractive pure-play, risk-reward opportunities here since period-end.
Portfolio decisions affecting performance
There are several attractive dynamics that we exposed the Fund to during the period in the belief that they would be drivers of positive absolute and relative performance, which proved to be the case:
• High conviction in Water Infrastructure
• M&A activity
• Emerging markets exposure
16 www.calvert.com CALVERT SOLUTION STRATEGIES ANNUAL REPORT
GROWTH OF $10,000
The graph below shows the value of a hypothetical $10,000 investment in the Fund over the past 10 fiscal year periods or since inception (for funds without 10-year records). The results shown are for Classes A, C and Y shares and reflect the deduction of the maximum front-end Class A sales charge of 4.75%, or deferred sales charge, as applicable and assume the reinvestment of dividends. The result is compared with benchmarks that include a broad based market index and a Lipper peer group average. Market indexes are unmanaged and their results do not reflect the effect of expenses or sales charges. The Lipper average reflects the deduction of the category’s average front-end sales charge. The value of an investment in a different share class would be different.
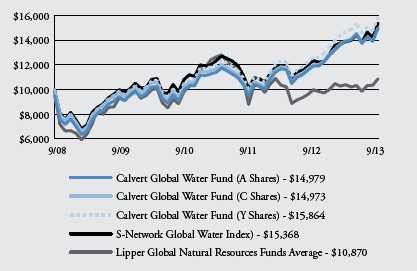
All performance data shown, including the graph above and the adjacent table, represents past performance, does not guarantee future results, assumes reinvestment of dividends and distributions and does not reflect the deduction of taxes that a shareholder would pay on the Fund’s distributions or the redemption of the Fund shares. All performance data reflects fee waivers and/or expense limitations, if any are in effect; in their absence performance would be lower. See Note B in Notes to Financial Statements. The investment return and principal value of an investment will fluctuate so that an investor’s shares, when redeemed, may be worth more or less than their original cost. Current performance may be lower or higher than the performance data quoted; for current performance data visit www.calvert.com. The gross expense ratio from the current prospectus for Class A shares is 2.34%. This number may differ from the expense ratio shown elsewhere in this report because it is based on a different time period and, if applicable, does not include fee or expense waivers. Performance data quoted already reflects the deduction of the Fund’s operating expenses.
www.calvert.com CALVERT SOLUTION STRATEGIES ANNUAL REPORT 17
Infrastructure was the best-performing sector during the period, with strong returns coming from Chinese water companies Beijing Enterprises Water and China Everbright, as China continues to commit to significant resource increases in wastewater, water reuse, and desalination capacity.
Other strong performers were Aecom, which we sold in early 2013 after its share price doubled from its low of the previous summer, and Weir, which we sold around the same time after an approximate 60% increase in its share price from the previous summer. There was also a good amount of capital markets activity in this area. Gardner Denver received a formal bid of $76 a share from KKR to go private and the acquisition completed in August. In addition, Ebara did a secondary offering to fund the build-out of pump service centers around the world and facilitate the growth of the more stable and profitable aftermarket business.
Outlook
The volatility in the market created opportunities to improve the risk-reward composition of the water strategy over the last few months and we feel optimistic about the return potential embedded in the current portfolio. We believe many of the cyclical end-markets into which our water companies are selling are healthy and likely to see accelerated growth over the next few years. For this reason, we continue to particularly favor pump and fluid control companies that have strong market positions across a variety of these end-markets, as well as above-average earnings growth and below-average valuations. Many of these are found in our Water Infrastructure area, where we continue to be overweight.
We also continue to add to stocks where we find interesting valuation anomalies. These stocks are driven not so much by cycles but rather by either company-specific execution or an expectation of improving investor sentiment over time.
The Fund is currently trading on a forward multiple in line with its historic average, and we expect mid-double-digit earnings growth in 2014. Our visibility on this growth improved during the year as we get increasingly more confident about the near bottoming—and in some cases, recovery signs—in many of our key end-markets, coupled with self-help measures either in the form of restructuring or substantial capital return programs.
October 2013
1. MSCI Japan Index returned 31.67% and MSCI EMU Index returned 30.09%
As of September 30, 2013, the following companies represented the following percentages of Fund net assets: Gardner Denver 0%, Danaher 2.50%, Agilent 1.49%, Itron 1.91%, Calgon Carbon 2.87%, Beijing Enterprises 0%,China Everbright 0.27%, Aecom 0%, Weir 0%, KKR 0%, and Ebara 3.81%. Holdings are subject to change.
18 www.calvert.com CALVERT SOLUTION STRATEGIES ANNUAL REPORT
SHAREHOLDER EXPENSE EXAMPLE
As a shareholder of the Fund, you incur two types of costs: (1) transaction costs, including sales charges and redemption fees; and (2) ongoing costs, including management fees; distribution (12b-1) fees; and other Fund expenses. This Example is intended to help you understand your ongoing costs (in dollars) of investing in the Fund and to compare these costs with the ongoing costs of investing in other mutual funds.
This Example is based on an investment of $1,000 invested at the beginning of the period and held for the entire period (April 1, 2013 to September 30, 2013).
Actual Expenses
The first line of the table below provides information about actual account values and actual expenses. You may use the information in this line, together with the amount you invested, to estimate the expenses that you paid over the period. Simply divide your account value by $1,000 (for example, an $8,600 account value divided by $1,000 = 8.6), then multiply the result by the number in the first line under the heading entitled “Expenses Paid During Period” to estimate the expenses you paid on your account during this period.
Hypothetical Example for Comparison Purposes
The second line of the table below provides information about hypothetical account values and hypothetical expenses based on the Fund’s actual expense ratio and an assumed rate of return of 5% per year before expenses, which is not the Fund’s actual return. The hypothetical account values and expenses may not be used to estimate the actual ending account balance or expenses you paid for the period. You may use this information to compare the ongoing costs of investing in the Fund and other funds. To do so, compare the 5% hypothetical example with the 5% hypothetical examples that appear in the shareholder reports of the other funds.
Please note that the expenses shown in the table are meant to highlight your ongoing costs only and do not reflect any transactional costs, such as sales charges (loads), or redemption fees. Therefore, the second line of the table is useful in comparing ongoing costs only, and will not help you determine the relative total costs of owning different funds. In addition, if these transactional costs were included, your costs would have been higher.
www.calvert.com CALVERT SOLUTION STRATEGIES ANNUAL REPORT 19
| | BEGINNING | ENDING ACCOUNT | EXPENSES PAID |
| | ACCOUNT VALUE | VALUE | DURING PERIOD* |
| GLOBAL ALTERNATIVE ENERGY | 4/1/13 | 9/30/13 | 4/1/13 - 9/30/13 |
| CLASS A | | | |
| Actual | $1,000.00 | $1,137.70 | $9.91 |
| Hypothetical | $1,000.00 | $1,015.79 | $9.35 |
| (5% return per year before expenses) | | | |
| |
| CLASS C | | | |
| Actual | $1,000.00 | $1,132.65 | $15.24 |
| Hypothetical | $1,000.00 | $1,010.78 | $14.37 |
| (5% return per year before expenses) | | | |
| |
| CLASS I | | | |
| Actual | $1,000.00 | $1,141.46 | $7.52 |
| Hypothetical | $1,000.00 | $1,018.05 | $7.08 |
| (5% return per year before expenses) | | | |
| |
| CLASS Y | | | |
| Actual | $1,000.00 | $1,139.68 | $8.58 |
| Hypothetical | $1,000.00 | $1,017.05 | $8.09 |
| (5% return per year before expenses) | | | |
* Expenses are equal to the Fund’s annualized expense ratio of 1.85%, 2.85%, 1.40%, and 1.60% for Class A, Class C, Class I, and Class Y, respectively, multiplied by the average account value over the period, multiplied by 183/365 (to reflect the one-half year period).
20 www.calvert.com CALVERT SOLUTION STRATEGIES ANNUAL REPORT
| | BEGINNING | ENDING ACCOUNT | EXPENSES PAID |
| | ACCOUNT VALUE | VALUE | DURING PERIOD* |
| GLOBAL WATER | 4/1/13 | 9/30/13 | 4/1/13 - 9/30/13 |
| CLASS A | | | |
| Actual | $1,000.00 | $1,077.79 | $9.64 |
| Hypothetical | $1,000.00 | $1,015.79 | $9.35 |
| (5% return per year before expenses) | | | |
| |
| CLASS C | | | |
| Actual | $1,000.00 | $1,073.11 | $14.33 |
| Hypothetical | $1,000.00 | $1,011.24 | $13.90 |
| (5% return per year before expenses) | | | |
| |
| CLASS Y | | | |
| Actual | $1,000.00 | $1,079.21 | $8.34 |
| Hypothetical | $1,000.00 | $1,017.05 | $8.09 |
| (5% return per year before expenses) | | | |
* Expenses are equal to the Fund’s annualized expense ratio of 1.85%, 2.76%, and 1.60% for Class A, Class C, and Class Y, respectively, multiplied by the average account value over the period, multiplied by 183/365 (to reflect the one-half year period).
www.calvert.com CALVERT SOLUTION STRATEGIES ANNUAL REPORT 21
REPORT OF INDEPENDENT REGISTERED PUBLIC ACCOUNTING FIRM
The Board of Directors of Calvert Impact Fund, Inc. and Shareholders of Calvert Global Alternative Energy Fund and Calvert Global Water Fund: We have audited the accompanying statements of net assets of the Calvert Global Alternative Energy Fund and Calvert Global Water Fund (the “Funds”), each a series of The Calvert Impact Fund, Inc., as of September 30, 2013, and the related statements of operations for the year then ended, the statements of changes in net assets for each of the years in the two-year period then ended, and the financial highlights for each of the years or periods in the five-year period then ended. These financial statements and financial highlights are the responsibility of the Funds’ management. Our responsibility is to express an opinion on these financial statements and financial highlights based on our audits.
We conducted our audits in accordance with the standards of the Public Company Accounting Oversight Board (United States). Those standards require that we plan and perform the audit to obtain reasonable assurance about whether the financial statements and financial highlights are free of material misstatement. An audit includes examining, on a test basis, evidence supporting the amounts and disclosures in the financial statements. Our procedures included confirmation of securities owned as of September 30, 2013, by correspondence with the custodian and brokers or by performing other appropriate auditing procedures. An audit also includes assessing the accounting principles used and significant estimates made by management, as well as evaluating the overall financial statement presentation. We believe that our audits provide a reasonable basis for our opinion.
In our opinion, the financial statements and financial highlights referred to above present fairly, in all material respects, the financial position of the Calvert Global Alternative Energy Fund and Calvert Global Water Fund as of September 30, 2013, and the results of their operations for the year then ended, the changes in their net assets for each of the years in the two-year period then ended, and the financial highlights for the years or periods in the five-year period then ended, in conformity with U.S. generally accepted accounting principles.

22 www.calvert.com CALVERT SOLUTION STRATEGIES ANNUAL REPORT
| | | |
| GLOBAL ALTERNATIVE ENERGY FUND |
| STATEMENT OF NET ASSETS |
| SEPTEMBER 30, 2013 |
| |
| EQUITY SECURITIES - 97.1% | SHARES | | VALUE |
| Australia - 2.0% | | | |
| Ceramic Fuel Cells Ltd.* | 34,317,654 | $ | 1,318,579 |
| Infigen Energy Ltd.* | 2,466,481 | | 691,219 |
| | | | 2,009,798 |
| |
| Austria - 1.6% | | | |
| Verbund AG | 71,200 | | 1,612,196 |
| |
| Belgium - 1.8% | | | |
| Elia System Operator SA/NV | 39,002 | | 1,736,700 |
| |
| Brazil - 4.8% | | | |
| Cosan Ltd. | 309,500 | | 4,757,015 |
| |
| Canada - 5.6% | | | |
| Brookfield Renewable Energy Partners LP* | 106,403 | | 2,847,208 |
| Canadian Solar, Inc.* | 60,954 | | 1,035,608 |
| TransAlta Renewables, Inc | 98,604 | | 984,650 |
| Westport Innovations, Inc.* | 27,651 | | 670,270 |
| | | | 5,537,736 |
| |
| China - 4.1% | | | |
| China Hydroelectric Corp. (ADR), Warrants | | | |
| (strike price $15.00/share, expires 1/25/14)* | 76,420 | | 764 |
| China Longyuan Power Group Corp | 1,425,000 | | 1,480,987 |
| China Suntien Green Energy Corp. Ltd. | 8,534,000 | | 2,585,961 |
| | | | 4,067,712 |
| |
| Denmark - 0.7% | | | |
| Novozymes A/S, Series B | 17,741 | | 678,941 |
| |
| France - 6.0% | | | |
| Albioma | 144,191 | | 2,898,055 |
| Cie de Saint-Gobain | 37,680 | | 1,866,781 |
| Saft Groupe SA | 41,385 | | 1,142,095 |
| | | | 5,906,931 |
| |
| Germany - 6.5% | | | |
| CENTROTEC Sustainable AG | 77,925 | | 1,571,993 |
| PNE Wind AG | 738,811 | | 3,239,816 |
| PSI AG Gesellschaft Fuer Produkte und Systeme | | | |
| der Informationstechnologie | 95,171 | | 1,549,574 |
| | | | 6,361,383 |
| |
| Hong Kong - 2.4% | | | |
| China Everbright International Ltd. | 736,000 | | 650,084 |
| GCL-Poly Energy Holdings Ltd.* | 6,071,000 | | 1,753,516 |
| | | | 2,403,600 |
www.calvert.com CALVERT SOLUTION STRATEGIES ANNUAL REPORT 23
| | | |
| EQUITY SECURITIES - CONT’D | SHARES | | VALUE |
| Ireland - 5.3% | | | |
| Eaton Corp. plc | 75,110 | $ | 5,170,572 |
| |
| Italy - 3.9% | | | |
| Enel Green Power SpA | 851,312 | | 1,826,249 |
| Prysmian SpA | 82,585 | | 2,023,120 |
| | | | 3,849,369 |
| |
| Japan - 3.9% | | | |
| Kurita Water Industries Ltd | 115,700 | | 2,451,336 |
| Kyocera Corp. | 26,800 | | 1,420,211 |
| | | | 3,871,547 |
| |
| Netherlands - 1.9% | | | |
| Koninklijke Philips NV | 57,399 | | 1,851,272 |
| |
| Spain - 6.1% | | | |
| EDP Renovaveis SA | 857,158 | | 4,456,020 |
| Iberdrola SA | 262,593 | | 1,526,470 |
| | | | 5,982,490 |
| |
| United Kingdom - 6.0% | | | |
| Greencoat UK Wind plc | 1,283,557 | | 2,169,984 |
| Johnson Matthey plc | 22,065 | | 1,002,366 |
| Renewables Infrastructure Group Ltd.* | 1,645,720 | | 2,695,728 |
| | | | 5,868,078 |
| |
| United States - 34.0% | | | |
| Advanced Energy Industries, Inc.* | 87,887 | | 1,539,780 |
| Ameresco, Inc.* | 187,695 | | 1,880,704 |
| Calgon Carbon Corp.* | 133,090 | | 2,527,379 |
| Covanta Holding Corp | 109,814 | | 2,347,823 |
| Cree, Inc.* | 43,308 | | 2,606,709 |
| ESCO Technologies, Inc. | 65,599 | | 2,179,855 |
| FuelCell Energy, Inc.* | 372,617 | | 480,676 |
| Itron, Inc.* | 48,577 | | 2,080,553 |
| Johnson Controls, Inc. | 103,297 | | 4,286,826 |
| MYR Group, Inc.* | 93,511 | | 2,272,317 |
| NextEra Energy, Inc. | 39,844 | | 3,193,895 |
| Ormat Technologies, Inc. | 36,864 | | 986,849 |
| Pattern Energy Group, Inc. | 23,231 | | 543,605 |
| Regal-Beloit Corp | 35,414 | | 2,405,673 |
| Solazyme, Inc.* | 79,408 | | 855,224 |
| SunEdison, Inc.* | 283,083 | | 2,256,172 |
| Tetra Tech, Inc.* | 39,052 | | 1,011,056 |
| | | | 33,455,096 |
| |
| Virgin Islands, British - 0.5% | | | |
| Wasion Group Holdings Ltd. | 808,000 | | 488,636 |
| |
| |
| Total Equity Securities (Cost $93,239,116) | | | 95,609,072 |
24 www.calvert.com CALVERT SOLUTION STRATEGIES ANNUAL REPORT
| | | | | | |
| | | | PRINCIPAL | | | |
| TIME DEPOSIT - 1.8% | | AMOUNT | | VALUE | |
| State Street Bank Time Deposit, 0.083%, 10/1/13 | $ | 1,743,077 | $ | 1,743,077 | |
| |
| Total Time Deposit (Cost $1,743,077) | | | | 1,743,077 | |
| |
| |
| TOTAL INVESTMENTS (Cost $94,982,193) - 98.9% | | | | 97,352,149 | |
| Other assets and liabilities, net - 1.1% | | | | 1,049,922 | |
| NET ASSETS - 100% | | | $ | 98,402,071 | |
| |
| |
| NET ASSETS CONSIST OF: | | | | | |
| Paid-in capital applicable to the following shares of common stock, | | | | | |
| with 250,000,000 shares of $0.01 par value shares authorized: | | | | | |
| Class A: 11,430,168 shares outstanding | | | $ | 231,108,277 | |
| Class C: 2,506,834 shares outstanding | | | | 50,303,961 | |
| Class I: 74,855 shares outstanding | | | | 6,469,390 | |
| Class Y: 261,554 shares outstanding | | | | 1,553,688 | |
| Accumulated net realized gain (loss) on investments and foreign | | | | | |
| currency transactions | | | | (193,412,209 | ) |
| Net unrealized appreciation (depreciation) on investments, foreign | | | | | |
| currencies and assets and liabilities denominated in | | | | | |
| foreign currencies | | | | 2,378,964 | |
| |
| |
| NET ASSETS | | | $ | 98,402,071 | |
| |
| |
| NET ASSET VALUE PER SHARE | | | | | |
| Class A (based on net assets of $79,302,138) | | | $ | 6.94 | |
| Class C (based on net assets of $16,697,336) | | | $ | 6.66 | |
| Class I (based on net assets of $525,232) | | | $ | 7.02 | |
| Class Y (based on net assets of $1,877,365) | | | $ | 7.18 | |
* Non-income producing security.
Abbreviations:
ADR: American Depositary Receipts
LP: Limited Partnership
plc: Public Limited Company
See notes to financial statements.
www.calvert.com CALVERT SOLUTION STRATEGIES ANNUAL REPORT 25
| | | |
| GLOBAL WATER FUND |
| STATEMENT OF NET ASSETS |
| SEPTEMBER 30, 2013 |
| |
| EQUITY SECURITIES - 96.3% | SHARES | | VALUE |
| Brazil - 6.2% | | | |
| Cia de Saneamento Basico do Estado de Sao Paulo (ADR) | 1,473,332 | $ | 14,674,387 |
| |
| Canada - 6.7% | | | |
| Capstone Infrastructure Corp | 1,243,784 | | 4,656,102 |
| EnerCare, Inc. | 625,588 | | 5,912,505 |
| GWR Global Water Resources Corp.* | 116,525 | | 424,881 |
| Pure Technologies Ltd.* | 1,011,580 | | 4,760,608 |
| | | | 15,754,096 |
| |
| France - 7.0% | | | |
| Suez Environnement SA | 758,189 | | 12,303,782 |
| Veolia Environnement SA | 241,214 | | 4,121,695 |
| | | | 16,425,477 |
| |
| Germany - 0.3% | | | |
| Joyou AG* | 47,656 | | 806,250 |
| |
| Hong Kong - 0.3% | | | |
| China Everbright International Ltd. | 720,000 | | 635,952 |
| |
| Japan - 9.5% | | | |
| Ebara Corp | 1,584,000 | | 8,861,313 |
| Kurita Water Industries Ltd | 359,400 | | 7,614,608 |
| Organo Corp | 956,270 | | 4,824,390 |
| Torishima Pump Manufacturing Co. Ltd. | 93,700 | | 917,796 |
| | | | 22,218,107 |
| |
| Switzerland - 6.9% | | | |
| Georg Fischer AG* | 7,155 | | 4,356,387 |
| Sulzer AG | 76,211 | | 11,800,630 |
| | | | 16,157,017 |
| |
| United Kingdom - 8.4% | | | |
| Severn Trent plc | 81,697 | | 2,330,148 |
| United Utilities Group plc | 932,027 | | 10,419,134 |
| Wolseley plc | 135,061 | | 6,985,503 |
| | | | 19,734,785 |
| |
| United States - 51.0% | | | |
| Aegion Corp.* | 50,334 | | 1,194,426 |
| Agilent Technologies, Inc. | 68,356 | | 3,503,245 |
| American Water Works Co., Inc | 231,866 | | 9,571,428 |
| Ashland, Inc. | 97,860 | | 9,050,093 |
| Calgon Carbon Corp.* | 351,242 | | 6,670,086 |
| California Water Service Group | 208,584 | | 4,238,427 |
| Danaher Corp. | 83,978 | | 5,821,355 |
| Flowserve Corp. | 189,039 | | 11,794,143 |
26 www.calvert.com CALVERT SOLUTION STRATEGIES ANNUAL REPORT
| | | | | |
| EQUITY SECURITIES - CONT’D | | SHARES | | VALUE | |
| United States - Cont’d | | | | | |
| Franklin Electric Co., Inc. | | 113,808 | $ | 4,484,035 | |
| Itron, Inc.* | | 109,617 | | 4,694,896 | |
| Layne Christensen Co.* | | 93,983 | | 1,875,901 | |
| Pall Corp. | | 36,556 | | 2,816,274 | |
| Pentair Ltd. | | 132,913 | | 8,631,370 | |
| Pico Holdings, Inc.* | | 313,986 | | 6,800,937 | |
| Rexnord Corp.* | | 336,486 | | 6,998,909 | |
| SJW Corp. | | 126,078 | | 3,532,705 | |
| SPX Corp | | 147,945 | | 12,522,065 | |
| Tetra Tech, Inc.* | | 212,610 | | 5,504,473 | |
| Xylem, Inc | | 365,845 | | 10,218,051 | |
| | | | | 119,922,819 | |
| |
| Total Equity Securities (Cost $212,724,891) | | | | 226,328,890 | |
| |
| |
| | | PRINCIPAL | | | |
| TIME DEPOSIT - 4.4% | | AMOUNT | | | |
| State Street Bank Time Deposit, 0.083%, 10/1/13 | $ | 10,288,925 | | 10,288,925 | |
| |
| Total Time Deposit (Cost $10,288,925) | | | | 10,288,925 | |
| |
| |
| TOTAL INVESTMENTS (Cost $223,013,816) - 100.7% | | | | 236,617,815 | |
| Other assets and liabilities, net - (0.7%) | | | | (1,574,532 | ) |
| NET ASSETS - 100% | | | $ | 235,043,283 | |
| |
| |
| NET ASSETS CONSIST OF: | | | | | |
| Paid-in capital applicable to the following shares of common stock, | | | | | |
| with 250,000,000 shares of $0.01 par value shares authorized: | | | | | |
| Class A: 9,324,675 shares outstanding | | | $ | 155,620,143 | |
| Class C: 1,690,222 shares outstanding | | | | 27,469,574 | |
| Class Y: 1,353,743 shares outstanding | | | | 24,012,386 | |
| Accumulated net realized gain (loss) on investments and foreign | | | | | |
| currency transactions | | | | 14,338,258 | |
| Net unrealized appreciation (depreciation) on investments, foreign | | | | | |
| currencies and assets and liabilities denominated in | | | | | |
| foreign currencies | | | | 13,602,922 | |
| |
| NET ASSETS | | | $ | 235,043,283 | |
| |
| |
| NET ASSET VALUE PER SHARE | | | | | |
| Class A (based on net assets of $178,274,886) | | | $ | 19.12 | |
| Class C (based on net assets of $30,758,911) | | | $ | 18.20 | |
| Class Y (based on net assets of $26,009,486) | | | $ | 19.21 | |
See notes to financial statements.
www.calvert.com CALVERT SOLUTION STRATEGIES ANNUAL REPORT 27
* Non-income producing security.
Abbreviations:
ADR: American Depositary Receipts
plc: Public Limited Company
See notes to financial statements.
28 www.calvert.com CALVERT SOLUTION STRATEGIES ANNUAL REPORT
| | | | | | |
| STATEMENTS OF OPERATIONS |
| YEAR ENDED SEPTEMBER 30, 2013 |
| |
| NET INVESTMENT INCOME | | GLOBAL ALTERNATIVE
ENERGY FUND | | | GLOBAL WATER FUND | |
| Investment Income: | | | | | | |
| Dividend income (net of foreign taxes withheld of | | | | | | |
| $88,344 and $155,428, respectively) | $ | 1,352,221 | | $ | 2,211,964 | |
| Interest income | | 2,521 | | | 6,101 | |
| Total investment income | | 1,354,742 | | | 2,218,065 | |
| Expenses: | | | | | | |
| Investment advisory fee | | 776,719 | | | 1,293,052 | |
| Transfer agency fees and expenses | | 380,771 | | | 309,562 | |
| Administrative fees | | 284,902 | | | 476,387 | |
| Distribution Plan expenses: | | | | | | |
| Class A | | 162,517 | | | 267,961 | |
| Class C | | 147,133 | | | 169,628 | |
| Directors’ fees and expenses | | 8,526 | | | 11,998 | |
| Custodian fees | | 101,735 | | | 153,741 | |
| Registration fees | | 46,769 | | | 39,685 | |
| Reports to shareholders | | 120,810 | | | 78,960 | |
| Professional fees | | 24,170 | | | 25,061 | |
| Accounting fees | | 12,336 | | | 18,571 | |
| Miscellaneous | | 18,199 | | | 17,657 | |
| Total expenses | | 2,084,587 | | | 2,862,263 | |
| Reimbursement from Advisor: | | | | | | |
| Class A | | (355,944 | ) | | (206,689 | ) |
| Class C | | (51,632 | ) | | — | |
| Class I | | (11,232 | ) | | — | |
| Class Y | | (12,692 | ) | | (7,465 | ) |
| Fees paid indirectly | | (30 | ) | | (54 | ) |
| Net expenses | | 1,653,057 | | | 2,648,055 | |
| |
| NET INVESTMENT INCOME (LOSS) | | (298,315 | ) | | (429,990 | ) |
| |
| REALIZED AND UNREALIZED | | | | | | |
| GAIN (LOSS) | | | | | | |
| Net realized gain (loss) on: | | | | | | |
| Investments | | 1,860,014 | | | 17,465,110 | |
| Foreign currency transactions | | (3,472 | ) | | 176,098 | |
| | | 1,856,542 | | | 17,641,208 | |
| |
| Change in unrealized appreciation (depreciation) on: | | | | | | |
| Investments and foreign currencies | | 22,153,254 | | | 11,765,633 | |
| Assets and liabilities denominated in foreign currencies | | 1,826 | | | (4,806 | ) |
| | | 22,155,080 | | | 11,760,827 | |
| |
| NET REALIZED AND UNREALIZED | | | | | | |
| GAIN (LOSS) | | 24,011,622 | | | 29,402,035 | |
| |
| INCREASE (DECREASE) IN NET ASSETS | | | | | | |
| RESULTING FROM OPERATIONS | $ | 23,713,307 | | $ | 28,972,045 | |
See notes to financial statements.
www.calvert.com CALVERT SOLUTION STRATEGIES ANNUAL REPORT 29
| | | | |
| GLOBAL ALTERNATIVE ENERGY FUND |
| STATEMENTS OF CHANGES IN NET ASSETS |
| |
| | YEAR
ENDED | | YEAR ENDED | |
| | SEPTEMBER
30, | | SEPTEMBER
30, | |
| INCREASE (DECREASE) IN NET ASSETS | 2013 | | 2012 | |
| Operations: | | | | |
| Net investment income (loss) | ($298,315 | ) | ($307,110 | ) |
| Net realized gain (loss) | 1,856,542 | | (49,136,648 | ) |
| Change in unrealized appreciation (depreciation) | 22,155,080 | | 46,772,799 | |
| |
| |
| INCREASE (DECREASE) IN NET ASSETS | | | | |
| RESULTING FROM OPERATION | 23,713,307 | | (2,670,959 | ) |
| |
| Distributions to shareholders from: | | | | |
| Net investment income: | | | | |
| Class A shares | — | | (1,829,365 | ) |
| Class C shares | — | | (153,641 | ) |
| Class I shares | — | | (222,269 | ) |
| Total distributions | — | | (2,205,275 | ) |
| |
| Capital share transactions: | | | | |
| Shares sold: | | | | |
| Class A shares | 21,117,660 | | 9,566,169 | |
| Class C shares | 2,360,698 | | 1,717,014 | |
| Class I shares | 9,391 | | 1,628,985 | |
| Class Y shares | 896,652 | | 1,128,692 | |
| Reinvestment of distributions: | | | | |
| Class A shares | — | | 1,652,099 | |
| Class C shares | — | | 118,000 | |
| Class I shares | — | | 209,486 | |
| Redemption fees: | | | | |
| Class A shares | 394 | | 931 | |
| Class C shares | 28 | | 246 | |
| Class Y shares | 1 | | 25 | |
| Shares redeemed: | | | | |
| Class A shares | (18,476,965 | ) | (26,564,758 | ) |
| Class C shares | (3,427,511 | ) | (5,819,245 | ) |
| Class I shares | (409,125 | ) | (5,824,355 | ) |
| Class Y shares | (325,806 | ) | (139,971 | ) |
| Total capital share transactions | 1,745,417 | | (22,326,682 | ) |
| |
| |
| |
| TOTAL INCREASE (DECREASE) IN NET ASSETS | 25,458,724 | | (27,202,916 | ) |
| |
| |
| NET ASSETS | | | | |
| Beginning of year | 72,943,347 | | 100,146,263 | |
| End of year | $98,402,071 | | $72,943,347 | |
See notes to financial statements.
30 www.calvert.com CALVERT SOLUTION STRATEGIES ANNUAL REPORT
| | | | |
| GLOBAL ALTERNATIVE ENERGY FUND |
| STATEMENTS OF CHANGES IN NET ASSETS |
| |
| | YEAR
ENDED | | YEAR
ENDED | |
| | SEPTEMBER
30, | | SEPTEMBER
30, | |
| CAPITAL SHARE ACTIVITY | 2013 | | 2012 | |
| Shares sold: | | | | |
| Class A shares | 3,364,849 | | 1,764,539 | |
| Class C shares | 388,901 | | 330,405 | |
| Class I shares | 1,524 | | 305,708 | |
| Class Y shares | 144,767 | | 193,885 | |
| Reinvestment of distributions: | | | | |
| Class A shares | — | | 320,174 | |
| Class C shares | — | | 23,413 | |
| Class I shares | — | | 40,598 | |
| Shares redeemed: | | | | |
| Class A shares | (3,123,974 | ) | (4,924,067 | ) |
| Class C shares | (599,574 | ) | (1,103,377 | ) |
| Class I shares | (66,201 | ) | (1,086,133 | ) |
| Class Y shares | (51,713 | ) | (26,947 | ) |
| Total capital share activity | 58,579 | | (4,161,802 | ) |
See notes to financial statements.
www.calvert.com CALVERT SOLUTION STRATEGIES ANNUAL REPORT 31
| | | | | |
| GLOBAL WATER FUND |
| STATEMENTS OF CHANGES IN NET ASSETS |
| |
| | YEAR
ENDED | | | YEAR
ENDED | |
| | SEPTEMBER
30, | | | SEPTEMBER
30, | |
| INCREASE (DECREASE) IN NET ASSETS | 2013 | | | 2012 | |
| Operations: | | | | | |
| Net investment income (loss) | ($429,990 | ) | $ | 31,079 | |
| Net realized gain (loss) | 17,641,208 | | | 2,812,923 | |
| Change in unrealized appreciation (depreciation) | 11,760,827 | | | 8,790,956 | |
| |
| INCREASE (DECREASE) IN NET ASSETS | | | | | |
| RESULTING FROM OPERATION | 28,972,045 | | | 11,634,958 | |
| |
| Distributions to shareholders from: | | | | | |
| Net investment income: | | | | | |
| Class A shares | (31,852 | ) | | (115,074 | ) |
| Class Y shares | (6,121 | ) | | (7,148 | ) |
| Net realized gain: | | | | | |
| Class A shares | (3,104,468 | ) | | (4,372,354 | ) |
| Class C shares | (498,189 | ) | | (603,871 | ) |
| Class Y shares | (238,844 | ) | | (332,988 | ) |
| Total distributions | (3,879,474 | ) | | (5,431,435 | ) |
| |
| Capital share transactions: | | | | | |
| Shares sold: | | | | | |
| Class A shares | 118,000,210 | | | 20,916,366 | |
| Class C shares | 20,087,503 | | | 2,838,961 | |
| Class Y shares | 22,179,954 | | | 1,521,166 | |
| Reinvestment of distributions: | | | | | |
| Class A shares | 2,911,982 | | | 3,922,405 | |
| Class C shares | 427,616 | | | 520,580 | |
| Class Y shares | 219,499 | | | 312,490 | |
| Redemption fees: | | | | | |
| Class A shares | 2,134 | | | 2,095 | |
| Class C shares | 263 | | | 79 | |
| Class Y shares | 182 | | | — | |
| Shares redeemed: | | | | | |
| Class A shares | (18,585,101 | ) | | (13,495,928 | ) |
| Class C shares | (1,333,877 | ) | | (1,071,928 | ) |
| Class Y shares | (2,190,110 | ) | | (1,445,997 | ) |
| Total capital share transactions | 141,720,255 | | | 14,020,289 | |
| |
| |
| TOTAL INCREASE (DECREASE) IN NET ASSETS | 166,812,826 | | | 20,223,812 | |
| |
| |
| NET ASSETS | | | | | |
| Beginning of year | 68,230,457 | | | 48,006,645 | |
| End of year (including undistributed net investment income | | | | | |
| of $0 and $38,151, respectively) | $235,043,283 | | $ | 68,230,457 | |
See notes to financial statements.
32 www.calvert.com CALVERT SOLUTION STRATEGIES ANNUAL REPORT
| | | | |
| GLOBAL WATER FUND |
| STATEMENTS OF CHANGES IN NET ASSETS |
| |
| | YEAR ENDED | | YEAR ENDED | |
| | SEPTEMBER 30, | | SEPTEMBER 30, | |
| CAPITAL SHARE ACTIVITY | 2013 | | 2012 | |
| Shares sold: | | | | |
| Class A shares | 6,704,040 | | 1,387,276 | |
| Class C shares | 1,184,342 | | 194,190 | |
| Class Y shares | 1,234,847 | | 99,753 | |
| Reinvestment of distributions: | | | | |
| Class A shares | 185,067 | | 286,924 | |
| Class C shares | 28,357 | | 39,349 | |
| Class Y shares | 13,900 | | 22,855 | |
| Shares redeemed: | | | | |
| Class A shares | (1,065,552 | ) | (939,525 | ) |
| Class C shares | (79,823 | ) | (74,598 | ) |
| Class Y shares | (125,302 | ) | (97,725 | ) |
| Total capital share activity | 8,079,876 | | 918,499 | |
See notes to financial statements.
www.calvert.com CALVERT SOLUTION STRATEGIES ANNUAL REPORT 33
NOTES TO FINANCIAL STATEMENTS
NOTE A — SIGNIFICANT ACCOUNTING POLICIES
General: Calvert Global Alternative Energy Fund and Calvert Global Water Fund (the “Funds,” each a “Fund”), each a series of Calvert Impact Fund, Inc., are registered under the Investment Company Act of 1940 as non-diversified, open-end management investment companies. Calvert Impact Fund, Inc. is comprised of three separate series. The operations of each series are accounted for separately. Global Alternative Energy Fund offers four classes of shares - Classes A, C, I, and Y. Global Water Fund offers three classes of shares - Classes A, C, and Y. Class A shares are sold with a maximum front-end sales charge of 4.75%. Class C shares are sold without a front-end sales charge and, with certain exceptions, will be charged a deferred sales charge on shares sold within one year of purchase. Class C shares have higher levels of expenses than Class A shares. Class I shares require a minimum account balance of $1,000,000. The $1 million minimum initial investment is waived for retirement plans that trade through omnibus accounts and may be waived for certain other institutional accounts where it is believed to be in the best interest of the Fund and its shareholders. Class Y shares are generally only available to wrap or similar fee-based programs offered by financial intermediaries that have entered into an agreement with the Fund’s Distributor to offer Class Y shares. Class I and Y shares have no front-end or deferred sales charge and have lower levels of expenses than Class A shares. Each class has different: (a) dividend rates, due to differences in Distribution Plan expenses and other class-specific expenses, (b) exchange privileges and (c) class-specific voting rights.
Security Valuation: Net asset value per share is determined every business day as of the close of the regular session of the New York Stock Exchange (generally 4:00 p.m. Eastern time). The Funds use independent pricing services approved by the Board of Directors (“the Board”) to value their investments wherever possible. Investments for which market quotations are not available or deemed not reliable are fair valued in good faith under the direction of the Board.
The Board has adopted Valuation Procedures (the “Procedures”) to determine the fair value of securities and other financial instruments for which market prices are not readily available or which may not be reliably priced. The Board has delegated the day-to-day responsibility for determining the fair value of assets of the Funds to Calvert Investment Management, Inc. (the “Advisor” or “Calvert”) and has provided these Procedures to govern Calvert in its valuation duties.
Calvert has chartered an internal Valuation Committee to oversee the implementation of these Procedures and to assist it in carrying out the valuation responsibilities that the Board has delegated.
The Valuation Committee meets on a regular basis to review illiquid securities and other investments which may not have readily available market prices. The Valuation Committee’s fair valuation determinations are subject to review, approval and ratification by the Board at its next regularly scheduled meeting covering the calendar quarter in which the fair valuation was determined.
34 www.calvert.com CALVERT SOLUTION STRATEGIES ANNUAL REPORT
The Valuation Committee utilizes various methods to measure the fair value of the Fund’s investments. Generally Accepted Accounting Principles (GAAP) establishes a disclosure hierarchy that categorizes the inputs to valuation techniques used to value assets and liabilities at measurement date. These inputs are summarized in the three broad levels listed below: Level 1 – quoted prices in active markets for identical securities Level 2 – other significant observable inputs (including quoted prices for similar securities, interest rates, prepayment speeds, credit risk, etc.) Level 3 – significant unobservable inputs (including the Funds’ own assumptions in determining the fair value of investments) The inputs or methodologies used for valuing securities are not necessarily an indication of the risk associated with investing in those securities.
Changes in valuation techniques may result in transfers in or out of an investment’s assigned level within the hierarchy during the period. There were no such transfers during the period. Valuation techniques used to value the Funds’ investments by major category are as follows: Equity securities, including restricted securities, for which market quotations are readily available, are valued at the last reported sale price or official closing price as reported by an independent pricing service on the primary market or exchange on which they are traded and are categorized as Level 1 in the hierarchy. In the event that there were no sales during the day or closing prices are not available, securities are valued at the last quoted bid price or using the last available price and are categorized as Level 2 in the hierarchy. Foreign securities are valued based on quotations from the principal market in which such securities are normally traded. If events occur after the close of the principal market in which foreign securities are traded, and before the close of business of the Funds, that are expected to materially affect the value of those securities, then they are valued at their fair value taking these events into account. The Funds have retained a third party fair value pricing service to quantitatively analyze the price movement of their holdings on foreign exchanges and to automatically fair value if the variation from the prior day’s closing price exceeds specified parameters. Such securities would be categorized as Level 2 in the hierarchy in these circumstances. Utilizing this technique may result in transfers between Level 1 and Level 2. For restricted securities and private placements where observable inputs are limited, assumptions about market activity and risk are used and such securities are categorized as Level 3 in the hierarchy.
Short-term securities of sufficient credit quality with remaining maturities of sixty days or less for which quotations are not readily available are valued at amortized cost, which approximates fair value, and are categorized as Level 2 in the hierarchy.
If a market value cannot be determined for a security using the methodologies described above, or if, in the good faith opinion of the Advisor, the market value does not constitute a readily available market quotation, or if a significant event has occurred that would materially affect the value of the security, the security will be fair valued as determined in good faith by the Valuation Committee.
www.calvert.com CALVERT SOLUTION STRATEGIES ANNUAL REPORT 35
The Valuation Committee considers a number of factors, including significant unobservable valuation inputs when arriving at fair value. It considers all significant facts that are reasonably available and relevant to the determination of fair value.
The Valuation Committee primarily employs a market-based approach which may use related or comparable assets or liabilities, recent transactions, market multiples, book values, and other relevant information for the investment to determine the fair value of the investment. When more appropriate, the fund may employ an income-based or cost approach. An income-based valuation approach discounts anticipated future cash flows of the investment to calculate a present amount (discounted). The measurement is based on the value indicated by current market expectations about those future amounts. Discounts may also be applied due to the nature or duration of any restrictions on the disposition of the investments. A cost based approach is based on the amount that currently would be required to replace the service capacity of an asset (current replacement cost). From the seller’s perspective, the price that would be received for the asset is determined based on the cost to a buyer to acquire or construct a substitute asset of comparable utility, adjusted for obsolescence.
The values assigned to fair value investments are based on available information and do not necessarily represent amounts that might ultimately be realized. Further, due to the inherent uncertainty of valuations of such investments, the fair values may differ significantly from the values that would have been used had an active market existed, and the differences could be material. The Valuation Committee employs various methods for calibrating these valuation approaches including a regular review of key inputs and assumptions, transactional back-testing or disposition analysis and reviews of any related market activity.
At September 30, 2013, no securities were fair valued in good faith under the direction of the Board.
The following is a summary of the inputs used to value the Funds’ net assets as of September 30, 2013:
| GLOBAL ALTERNATIVE ENERGY | | VALUATION INPUTS | |
| INVESTMENTS IN SECURITIES | LEVEL 1 | LEVEL 2 | LEVEL 3 | TOTAL |
| Equity securities* | $95,609,072 | — | — | $95,609,072 |
| Other debt obligations | — | $1,743,077 | — | 1,743,077 |
| TOTAL | $95,609,072 | $1,743,077 | — | $97,352,149 |
| |
| GLOBAL WATER | | VALUATION INPUTS | |
| INVESTMENTS IN SECURITIES | LEVEL 1 | LEVEL 2 | LEVEL 3 | TOTAL |
| Equity securities* | $226,328,890 | — | — | $226,328,890 |
| Other debt obligations | — | $10,288,925 | — | 10,288,925 |
| TOTAL | $226,328,890 | $10,288,925 | — | $236,617,815 |
* For further breakdown of equity securities by country, please refer to the Statements of Net Assets.
36 www.calvert.com CALVERT SOLUTION STRATEGIES ANNUAL REPORT
Security Transactions and Net Investment Income: Security transactions are accounted for on trade date. Realized gains and losses are recorded on an identified cost basis and may include proceeds from litigation. Dividend income is recorded on the ex-dividend date or, in the case of dividends on certain foreign securities, as soon as the Funds are informed of the ex-dividend date. Withholding taxes on foreign dividends have been provided for in accordance with the Funds’ understanding of the applicable country’s tax rules and rates. Distributions received on securities that represent a return of capital or capital gain are recorded as a reduction of cost of investments and/or as a realized gain. Interest income, which includes amortization of premium and accretion of discount on debt securities, is accrued as earned. Investment income and realized and unrealized gains and losses are allocated to separate classes of shares based upon the relative net assets of each class. Expenses arising in connection with a specific class are charged directly to that class. Expenses common to the classes are allocated to each class in proportion to their relative net assets.
Foreign Currency Transactions: The Funds’ accounting records are maintained in U.S. dollars. For valuation of assets and liabilities on each date of net asset value determination, foreign denominations are converted into U.S. dollars using the current exchange rate. Security transactions, income and expenses are translated at the prevailing rate of exchange on the date of the event. The effect of changes in foreign exchange rates on securities and foreign currencies is included in the net realized and unrealized gain or loss on securities and foreign currencies.
Distributions to Shareholders: Distributions to shareholders are recorded by the Funds on ex-dividend date. Dividends from net investment income and distributions from net realized capital gains, if any, are paid at least annually. Distributions are determined in accordance with income tax regulations which may differ from generally accepted accounting principles; accordingly, periodic reclassifications are made within the Funds’ capital accounts to reflect income and gains available for distribution under income tax regulations.
Estimates: The preparation of the financial statements in conformity with accounting principles generally accepted in the United States requires management to make estimates and assumptions that affect the reported amounts of assets and liabilities and disclosure of contingent assets and liabilities at the date of the financial statements and the reported amounts of income and expenses during the reported period. Actual results could differ from those estimates.
Redemption Fees: The Funds charge a 2% redemption fee on redemptions, including exchanges, made within 30 days of purchase in the same Fund (within seven days for Class I shares). The redemption fee is accounted for as an addition to paid-in capital and is intended to discourage market-timers by ensuring that short-term trading costs are borne by the investors making the transactions and not the shareholders already in the Fund.
Expense Offset Arrangement: The Fund had an arrangement with the custodian bank whereby the custodian’s fees may have been paid indirectly by credits earned on the Fund’s cash on deposit with the bank. These credits were used to reduce the Fund’s expenses. This arrangement was suspended on January 1, 2013, until further notice, due to low interest rates. Such a deposit arrangement was an alternative to overnight investments.
www.calvert.com CALVERT SOLUTION STRATEGIES ANNUAL REPORT 37
Federal Income Taxes: No provision for federal income or excise tax is required since each Fund intends to continue to qualify as a regulated investment company under the Internal Revenue Code and to distribute substantially all of its taxable earnings.
Management has analyzed the Funds’ tax positions taken for all open federal income tax years and has concluded that no provision for federal income tax is required in the Funds’ financial statements. A Fund’s federal tax return is subject to examination by the Internal Revenue Service for a period of three years.
NOTE B — RELATED PARTY TRANSACTIONS
Calvert Investment Management, Inc. (the “Advisor”) is wholly-owned by Calvert Investments, Inc., which is indirectly wholly-owned by Ameritas Mutual Holding Company. The Advisor provides investment advisory services and pays the salaries and fees of officers and Directors of the Funds who are employees of the Advisor or its affiliates. For its services, the Advisor receives an annual fee, payable monthly, of .95% of each Fund’s average daily net assets. Under the terms of the agreement, $79,867 and $177,134 was payable at year end for Global Alternative Energy and Global Water, respectively. In addition, $10,531 and $26,197 was payable at year end for operating expenses paid by the Advisor during September 2013 for Global Alternative Energy and Global Water, respectively.
The Advisor has contractually agreed to limit net annual fund operating expenses for Classes A, C, Y and I through January 31, 2014. The contractual expense cap is 1.85% for Class A, 2.85% for Class C, 1.60% for Class Y of each Fund, and 1.40% for Class I in Global Alternative Energy. For the purpose of this expense limit, operating expenses do not include interest expense, brokerage commissions, taxes, and extraordinary expenses. This expense limitation does not limit any acquired fund fees and expenses, if any. To the extent any expense offset credits were earned, the Advisor’s obligation under the contractual limitation may have been reduced and the Advisor may have benefited from the expense offset arrangement.
Calvert Investment Administrative Services, Inc., an affiliate of the Advisor, provides administrative services to the Funds for an annual fee, payable monthly, of .35% for Classes A, C, and Y of each Fund and .15% for Class I shares in Global Alternative Energy, based on their average daily net assets. Under the terms of the agreement, $29,335 and $65,260 was payable at year end for Global Alternative Energy and Global Water, respectively.
Calvert Investment Distributors, Inc. (“CID”), an affiliate of the Advisor, is the distributor and principal underwriter for the Funds. Pursuant to Rule 12b-1 under the Investment Company Act of 1940, each Fund has adopted a Distribution Plan that permits each Fund to pay certain expenses associated with the distribution and servicing of its shares. The expenses paid may not exceed .50% and 1.00% annually of average daily net assets of Class A and C, respectively. The amount actually paid by each Fund is an annualized fee, payable monthly, of .25% and 1.00% of the Funds’ average daily net assets of Class A and C, respectively. Class I and Class Y shares do not have Distribution Plan expenses. Under the terms of the agreement, $31,171 and $59,585 was payable at year end for Global Alternative Energy and Global Water, respectively.
38 www.calvert.com CALVERT SOLUTION STRATEGIES ANNUAL REPORT
CID received $38,642 and $311,891 as its portion of commissions charged on sales of Class A shares of Global Alternative Energy and Global Water, respectively, for the year ended September 30, 2013.
Calvert Investment Services, Inc. (“CIS”), an affiliate of the Advisor, is the shareholder servicing agent for the Funds. For its services, CIS received a fee of $89,388 and $63,465 for the year ended September 30, 2013 for Global Alternative Energy and Global Water, respectively. Under the terms of the agreement, $6,096 and $6,039 was payable at year end for Global Alternative Energy and Global Water, respectively. Boston Financial Data Services, Inc. is the transfer and dividend disbursing agent.
Each Director of the Funds who is not an employee of the Advisor or its affiliates receives an annual retainer of $48,000 plus a meeting fee of up to $3,000 for each Board meeting attended. Additional fees of up to $5,000 annually may be paid to the Board chair and Committee chairs ($10,000 for the Special Equities Committee chair) and $2,500 annually may be paid to Committee members, plus a Committee meeting fee of $500 for each Committee meeting attended. Directors’ fees are allocated to each of the funds served.
NOTE C — INVESTMENT ACTIVITY AND TAX INFORMATION
During the year, the cost of purchases and proceeds from sales of investments, other than short-term securities, were:
| | GLOBAL ALTERNATIVE
ENERGY | GLOBAL WATER |
| Purchases | $74,944,249 | $276,126,230 |
| Sales | 71,584,581 | 136,580,253 |
| CAPITAL LOSS CARRYFORWARDS | | |
| EXPIRATION DATE | GLOBAL ALTERNATIVE ENERGY | |
| 30-Sep-17 | ($21,115,915 | ) |
| 30-Sep-18 | (56,693,584 | ) |
| 30-Sep-19 | (43,799,530 | ) |
| |
| NO EXPIRATION DATE | | |
| Short-term | ($1,406,142 | ) |
| Long-term | (67,055,125 | ) |
Under the Regulated Investment Company Modernization Act of 2010, capital losses incurred in taxable years beginning after December 22, 2010 can be carried forward for an unlimited period. These losses are required to be utilized prior to the losses incurred in pre-enactment taxable years and will retain their character as either long-term or short-term. Losses incurred in pre-enactment taxable years can be utilized until expiration.
www.calvert.com CALVERT SOLUTION STRATEGIES ANNUAL REPORT 39
The tax character of distributions paid during the years ended September 30, 2013 and September 30, 2012 was as follows:
| GLOBAL ALTERNATIVE ENERGY | |
| Distributions paid from: | 2013 | 2012 |
| Ordinary income | — | $2,205,275 |
| Total | — | $2,205,275 |
| |
| GLOBAL WATER | | |
| Distributions paid from: | 2013 | 2012 |
| Ordinary income | $3,879,474 | $2,657,606 |
| Long-term capital gain | — | 2,773,829 |
| Total | $3,879,474 | $5,431,435 |
As of September 30, 2013, the tax basis components of distributable earnings/(accumulated losses) and the federal tax cost were as follows:
| | GLOBAL ALTERNATIVE | | | |
| | ENERGY | | GLOBAL WATER | |
| Unrealized appreciation | $9,257,216 | | $16,299,419 | |
| Unrealized (depreciation) | (10,229,173 | ) | (6,249,186 | ) |
| Net unrealized appreciation/(depreciation) | ($971,957 | ) | $10,050,233 | |
| |
| Undistributed ordinary income | — | | $15,904,240 | |
| Undistributed long term-capital gain | — | | $1,987,784 | |
| Capital loss carryforward | ($190,070,296 | ) | — | |
| |
| Federal income tax cost of investments | $98,324,106 | | $226,567,582 | |
The differences between the components of distributable earnings on a tax basis and the amounts reflected in the statement of net assets are primarily due to temporary book-tax differences that will reverse in a subsequent period. For both Funds, these book-tax differences are due to wash sales. For Global Alternative Energy, the book-tax differences are also due to partnerships.
Reclassifications, as shown in the table below, have been made to the Funds’ components of net assets to reflect income and gains available for distribution (or available capital loss carryovers, as applicable) under income tax law and regulations. These reclassifications are due to permanent book-tax differences and have no impact on net assets. The permanent differences causing such reclassifications for both Funds are due to foreign currency transactions and net operating losses. For Global Alternative Energy, the permanent differences are also due to partnerships.
40 www.calvert.com CALVERT SOLUTION STRATEGIES ANNUAL REPORT
| | GLOBAL ALTERNATIVE
ENERGY | | GLOBAL WATER | |
| Undistributed net investment income | $298,315 | | $429,812 | |
| Accumulated net realized gain (loss) | 78,662 | | (430,012 | ) |
| Paid-in capital | (376,977 | ) | 200 | |
NOTE D — LINE OF CREDIT
A financing agreement is in place with the Calvert Funds and State Street Corporation (“SSC”). Under the agreement, SSC provides an unsecured line of credit facility, in the aggregate amount of $50 million ($25 million committed and $25 million uncommitted), accessible by the Funds for temporary or emergency purposes only. Borrowings under the committed facility bear interest at the higher of the London Interbank Offered Rate (LIBOR) or the overnight Federal Funds Rate plus 1.25% per annum. A commitment fee of .11% per annum is incurred on the unused portion of the committed facility, which is allocated to all participating funds. Global Water had no borrowings under the agreement during the year ended September 30, 2013. Global Alternative Energy had no loans outstanding pursuant to this line of credit at September 30, 2013. For the year ended September 30, 2013, borrowings by Global Alternative Energy under the agreement were as follows:
| | | | | MONTH OF |
| | AVERAGE DAILY | WEIGHTED AVERAGE | MAXIMUM AMOUNT | MAXIMUM AMOUNT |
| | BALANCE | INTEREST RATE | BORROWED | BORROWED |
| Global Alternative | | | | |
| Energy | $1,513 | 1.46% | $231,588 | November 2012 |
NOTE E — SUBSEQUENT EVENTS
In preparing the financial statements as of September 30, 2013, no subsequent events or transactions occurred that would have required recognition or disclosure in these financial statements.
www.calvert.com CALVERT SOLUTION STRATEGIES ANNUAL REPORT 41
| | | | | | | | | |
| GLOBAL ALTERNATIVE ENERGY FUND |
| FINANCIAL HIGHLIGHTS |
| |
| | | | | | YEARS ENDED | | | | |
| | | SEPTEMBER
30, | | | SEPTEMBER
30, | | | SEPTEMBER
30, | |
| CLASS A SHARES | | 2013 | | | 2012 | (z) | | 2011 | (z) |
| Net asset value, beginning | $ | 5.16 | | $ | 5.48 | | $ | 8.22 | |
| Income from investment operations: | | | | | | | | | |
| Net investment income (loss) | | (.01 | ) | | (.01 | ) | | .10 | |
| Net realized and unrealized gain (loss) | | 1.79 | | | (.17 | ) | | (2.84 | ) |
| Total from investment operations | | 1.78 | | | (.18 | ) | | (2.74 | |
| Distributions from: | | | | | | | | | |
| Net investment income | | — | | | (.14 | ) | | — | |
| Total distributions | | — | | | (.14 | ) | | — | |
| Total increase (decrease) in net asset value | | 1.78 | | | (.32 | ) | | (2.74 | ) |
| Net asset value, ending | $ | 6.94 | | $ | 5.16 | | $ | 5.48 | |
| |
| Total return* | | 34.50 | % | | (3.27 | %) | | (33.33 | %) |
| Ratios to average net assets: A | | | | | | | | | |
| Net investment income (loss) | | (.19 | %) | | (.21 | %) | | 1.28 | % |
| Total expenses | | 2.40 | % | | 2.57 | % | | 2.30 | % |
| Expenses before offsets | | 1.85 | % | | 1.85 | % | | 1.85 | % |
| Net expenses | | 1.85 | % | | 1.85 | % | | 1.85 | % |
| Portfolio turnover | | 90 | % | | 52 | % | | 65 | % |
| Net assets, ending (in thousands) | $ | 79,302 | | $ | 57,727 | | $ | 76,921 | |
| |
| | | | | | YEARS ENDED | |
| | | | | | SEPTEMBER
30, | | | SEPTEMBER
30, | |
| CLASS A SHARES | | | | | 2010 | | | 2009 | (z) |
| Net asset value, beginning | | | | $ | 10.45 | | $ | 12.35 | |
| Income from investment operations: | | | | | | | | | |
| Net investment income (loss) | | | | | (.07 | ) | | (.02 | ) |
| Net realized and unrealized gain (loss) | | | | | (2.16 | ) | | (1.88 | ) |
| Total from investment operations | | | | | (2.23 | ) | | (1.90 | ) |
| Total increase (decrease) in net asset value | | | | | (2.23 | ) | | (1.90 | ) |
| Net asset value, ending | | | | $ | 8.22 | | $ | 10.45 | |
| |
| Total return* | | | | | (21.34 | %) | | (15.38 | %) |
| Ratios to average net assets: A | | | | | | | | | |
| Net investment income (loss) | | | | | (.69 | %) | | (.25 | %) |
| Total expenses | | | | | 2.29 | % | | 2.37 | % |
| Expenses before offsets | | | | | 1.85 | % | | 1.85 | % |
| Net expenses | | | | | 1.85 | % | | 1.85 | % |
| Portfolio turnover | | | | | 73 | % | | 61 | % |
| Net assets, ending (in thousands) | | | | $ | 145,314 | | $ | 198,077 | |
See notes to financial highlights.
42 www.calvert.com CALVERT SOLUTION STRATEGIES ANNUAL REPORT
| | | | | | | | | |
| GLOBAL ALTERNATIVE ENERGY FUND |
| FINANCIAL HIGHLIGHTS |
| |
| | | | | | YEARS ENDED | | | | |
| | | SEPTEMBER
30, | | | SEPTEMBER
30, | | | SEPTEMBER
30, | |
| CLASS C SHARES | | 2013 | | | 2012 | (z) | | 2011 | (z) |
| Net asset value, beginning | $ | 5.00 | | $ | 5.28 | | $ | 7.99 | |
| Income from investment operations: | | | | | | | | | |
| Net investment income (loss) | | (.07 | ) | | (.06 | ) | | .02 | |
| Net realized and unrealized gain (loss) | | 1.73 | | | (.17 | ) | | (2.73 | ) |
| Total from investment operations | | 1.66 | | | (.23 | ) | | (2.71 | ) |
| Distributions from: | | | | | | | | | |
| Net investment income | | — | | | (.05 | ) | | — | |
| Total distributions | | — | | | (.05 | ) | | — | |
| Total increase (decrease) in net asset value | | 1.66 | | | (.28 | ) | | (2.71 | ) |
| Net asset value, ending | $ | 6.66 | | $ | 5.00 | | $ | 5.28 | |
| |
| Total return* | | 33.20 | % | | (4.38 | %) | | (33.92 | %) |
| Ratios to average net assets: A | | | | | | | | | |
| Net investment income (loss) | | (1.21 | %) | | (1.22 | %) | | .28 | % |
| Total expenses | | 3.20 | % | | 3.37 | % | | 3.10 | % |
| Expenses before offsets | | 2.85 | % | | 2.85 | % | | 2.85 | % |
| Net expenses | | 2.85 | % | | 2.85 | % | | 2.85 | % |
| Portfolio turnover | | 90 | % | | 52 | % | | 65 | % |
| Net assets, ending (in thousands) | $ | 16,697 | | $ | 13,595 | | $ | 18,300 | |
| |
| | | | | | YEARS ENDED | |
| | | | | | SEPTEMBER
30, | | | SEPTEMBER
30, | |
| CLASS C SHARES | | | | | 2010 | | | 2009 | (z) |
| Net asset value, beginning | | | | $ | 10.26 | | $ | 12.23 | |
| Income from investment operations: | | | | | | | | | |
| Net investment income (loss) | | | | | (.15 | ) | | (.10 | ) |
| Net realized and unrealized gain (loss) | | | | | (2.12 | ) | | (1.87 | ) |
| Total from investment operations | | | | | (2.27 | ) | | (1.97 | ) |
| Total increase (decrease) in net asset value | | | | | (2.27 | ) | | (1.97 | ) |
| Net asset value, ending | | | | $ | 7.99 | | $ | 10.26 | |
| |
| Total return* | | | | | (22.12 | %) | | (16.11 | %) |
| Ratios to average net assets: A | | | | | | | | | |
| Net investment income (loss) | | | | | (1.68 | %) | | (1.24 | %) |
| Total expenses | | | | | 3.10 | % | | 3.20 | % |
| Expenses before offsets | | | | | 2.85 | % | | 2.85 | % |
| Net expenses | | | | | 2.85 | % | | 2.85 | % |
| Portfolio turnover | | | | | 73 | % | | 61 | % |
| Net assets, ending (in thousands) | | | | $ | 33,191 | | $ | 42,224 | |
See notes to financial highlights.
www.calvert.com CALVERT SOLUTION STRATEGIES ANNUAL REPORT 43
| | | | | | | | | |
| GLOBAL ALTERNATIVE ENERGY FUND |
| FINANCIAL HIGHLIGHTS |
| |
| | | | | | YEARS ENDED | | | | |
| | | SEPTEMBER
30, | | | SEPTEMBER
30, | | | SEPTEMBER
30, | |
| CLASS I SHARES | | 2013 | | | 2012 | (z) | | 2011 | (z) |
| Net asset value, beginning | $ | 5.19 | | $ | 5.59 | | $ | 8.34 | |
| Income from investment operations: | | | | | | | | | |
| Net investment income (loss) | | — | | | .02 | | | .17 | |
| Net realized and unrealized gain (loss) | | 1.83 | | | (.18 | ) | | (2.92 | ) |
| Total from investment operations | | 1.83 | | | (.16 | ) | | (2.75 | ) |
| Distributions from: | | | | | | | | | |
| Net investment income | | — | | | (.24 | ) | | — | |
| Total distributions | | — | | | (.24 | ) | | — | |
| Total increase (decrease) in net asset value | | 1.83 | | | (.40 | ) | | (2.75 | ) |
| Net asset value, ending | $ | 7.02 | | $ | 5.19 | | $ | 5.59 | |
| |
| Total return* | | 35.26 | % | | (2.77 | %) | | (32.97 | %) |
| Ratios to average net assets: A | | | | | | | | | |
| Net investment income (loss) | | .04 | % | | .38 | % | | 2.00 | % |
| Total expenses | | 3.19 | % | | 1.77 | % | | 1.51 | % |
| Expenses before offsets | | 1.40 | % | | 1.40 | % | | 1.40 | % |
| Net expenses | | 1.40 | % | | 1.40 | % | | 1.40 | % |
| Portfolio turnover | | 90 | % | | 52 | % | | 65 | % |
| Net assets, ending (in thousands) | $ | 525 | | $ | 725 | | $ | 4,916 | |
| |
| | | | | | YEARS ENDED | |
| | | | | | SEPTEMBER
30, | | | SEPTEMBER
30, | |
| CLASS I SHARES | | | | | 2010 | | | 2009 | (z) |
| Net asset value, beginning | | | | $ | 10.56 | | $ | 12.40 | |
| Income from investment operations: | | | | | | | | | |
| Net investment income (loss) | | | | | (.02 | ) | | .02 | |
| Net realized and unrealized gain (loss) | | | | | (2.20 | ) | | (1.86 | ) |
| Total from investment operations | | | | | (2.22 | ) | | (1.84 | ) |
| Total increase (decrease) in net asset value | | | | | (2.22 | ) | | (1.84 | ) |
| Net asset value, ending | | | | $ | 8.34 | | $ | 10.56 | |
| |
| Total return* | | | | | (21.02 | %) | | (14.84 | %) |
| Ratios to average net assets: A | | | | | | | | | |
| Net investment income (loss) | | | | | (.25 | %) | | .23 | % |
| Total expenses | | | | | 1.55 | % | | 1.55 | % |
| Expenses before offsets | | | | | 1.40 | % | | 1.40 | % |
| Net expenses | | | | | 1.40 | % | | 1.40 | % |
| Portfolio turnover | | | | | 73 | % | | 61 | % |
| Net assets, ending (in thousands) | | | | $ | 9,057 | | $ | 10,658 | |
See notes to financial highlights.
44 www.calvert.com CALVERT SOLUTION STRATEGIES ANNUAL REPORT
| | | | | | |
| GLOBAL ALTERNATIVE ENERGY FUND |
| FINANCIAL HIGHLIGHTS |
| |
| | | | PERIODS ENDED | | | |
| | SEPTEMBER
30, | | SEPTEMBER
30, | | SEPTEMBER
30, | |
| CLASS Y SHARES | 2013 | | 2012 | (z) | 2011 | ^^^^ (z) |
| Net asset value, beginning | $5.32 | | $5.49 | | $7.70 | |
| Income from investment operations: | | | | | | |
| Net investment income (loss) | .01 | | .05 | | (.01 | ) |
| Net realized and unrealized gain (loss) | 1.85 | | (.22 | ) | (2.20 | ) |
| Total from investment operations | 1.86 | | (.17 | ) | (2.21 | ) |
| Total increase (decrease) in net asset value | 1.86 | | (.17 | ) | (2.21 | ) |
| Net asset value, ending | $7.18 | | $5.32 | | $5.49 | |
| |
| Total return* | 34.96 | % | (3.10 | %) | (28.70 | %) |
| Ratios to average net assets: A | | | | | | |
| Net investment income (loss) | .16 | % | .90 | % | (.92 | %) (a) |
| Total expenses | 2.50 | % | 6.75 | % | 873.73 | % (a) |
| Expenses before offsets | 1.60 | % | 1.60 | % | 1.60 | % (a) |
| Net expenses | 1.60 | % | 1.60 | % | 1.60 | % (a) |
| Portfolio turnover | 90 | % | 52 | % | 65 | %*** |
| Net assets, ending (in thousands) | $1,877 | | $897 | | $9 | |
See notes to financial highlights.
www.calvert.com CALVERT SOLUTION STRATEGIES ANNUAL REPORT 45
| | | | | | | | | |
| GLOBAL WATER FUND |
| FINANCIAL HIGHLIGHTS |
| |
| | | | | | YEARS ENDED | | | | |
| | | SEPTEMBER
30, | | | SEPTEMBER
30, | | | SEPTEMBER
30, | |
| CLASS A SHARES | | 2013 | (z) | | 2012 | (z) | | 2011 | (z) |
| Net asset value, beginning | $ | 15.98 | | $ | 14.29 | | $ | 15.40 | |
| Income from investment operations: | | | | | | | | | |
| Net investment income (loss) | | (.04 | ) | | .02 | | | .06 | |
| Net realized and unrealized gain (loss) | | 3.99 | | | 3.29 | | | (.69 | ) |
| Total from investment operations | | 3.95 | | | 3.31 | | | (.63 | ) |
| Distributions from: | | | | | | | | | |
| Net investment income | | (.01 | ) | | (.04 | ) | | (.02 | ) |
| Net realized gain | | (.80 | ) | | (1.58 | ) | | (.46 | ) |
| Total distributions | | (.81 | ) | | (1.62 | ) | | (.48 | ) |
| Total increase (decrease) in net asset value | | 3.14 | | | 1.69 | | | (1.11 | ) |
| Net asset value, ending | $ | 19.12 | | $ | 15.98 | | $ | 14.29 | |
| |
| Total return* | | 25.81 | % | | 25.16 | % | | (4.38 | %) |
| Ratios to average net assets:A | | | | | | | | | |
| Net investment income (loss) | | (.23 | %) | | .16 | % | | .36 | % |
| Total expenses | | 2.04 | % | | 2.34 | % | | 2.32 | % |
| Expenses before offsets | | 1.85 | % | | 1.85 | % | | 1.85 | % |
| Net expenses | | 1.85 | % | | 1.85 | % | | 1.85 | % |
| Portfolio turnover | | 104 | % | | 116 | % | | 125 | % |
| Net assets, ending (in thousands) | $ | 178,275 | | $ | 55,964 | | $ | 39,535 | |
| |
| | | | | | YEARS ENDED | |
| | | | | | SEPTEMBER
30, | | | SEPTEMBER
30, | |
| CLASS A SHARES | | | | | 2010 | (z) | | 2009 | (z) |
| Net asset value, beginning | | | | $ | 14.85 | | $ | 15.00 | |
| Income from investment operations: | | | | | | | | | |
| Net investment income | | | | | .02 | | | .11 | |
| Net realized and unrealized gain (loss) | | | | | .79 | | | (.26 | ) |
| Total from investment operations | | | | | .81 | | | (.15 | ) |
| Distributions from: | | | | | | | | | |
| Net investment income | | | | | (.03 | ) | | — | |
| Net realized gain | | | | | (.23 | ) | | — | |
| Total distributions | | | | | (.26 | ) | | — | |
| Total increase (decrease) in net asset value | | | | | .55 | | | (.15 | ) |
| Net asset value, ending | | | | $ | 15.40 | | $ | 14.85 | |
| |
| Total return* | | | | | 5.50 | % | | (1.00 | %) |
| Ratios to average net assets:A | | | | | | | | | |
| Net investment income | | | | | 16 | % | | .87 | % |
| Total expenses | | | | | 2.69 | % | | 5.78 | % |
| Expenses before offsets | | | | | 1.85 | % | | 1.99 | % |
| Net expenses | | | | | 1.85 | % | | 1.85 | % |
| Portfolio turnover | | | | | 61 | % | | 58 | % |
| Net assets, ending (in thousands) | | | | $ | 35,401 | | $ | 9,365 | |
See notes to financial highlights.
46 www.calvert.com CALVERT SOLUTION STRATEGIES ANNUAL REPORT
| | | | | | | | | |
| GLOBAL WATER FUND |
| FINANCIAL HIGHLIGHTS |
| |
| | | | | | YEARS ENDED | | | | |
| | | SEPTEMBER
30, | | | SEPTEMBER
30, | | | SEPTEMBER
30, | |
| CLASS C SHARES | | 2013 | (z) | | 2012 | (z) | | 2011 | (z) |
| Net asset value, beginning | $ | 15.38 | | $ | 13.90 | | $ | 15.12 | |
| Income from investment operations: | | | | | | | | | |
| Net investment income (loss) | | (.19 | ) | | (.12 | ) | | (.10 | ) |
| Net realized and unrealized gain (loss) | | 3.81 | | | 3.18 | | | (.66 | ) |
| Total from investment operations | | 3.62 | | | 3.06 | | | (.76 | ) |
| Distributions from: | | | | | | | | | |
| Net realized gain | | (.80 | ) | | (1.58 | ) | | (.46 | ) |
| Total distributions | | (.80 | ) | | (1.58 | ) | | (.46 | ) |
| Total increase (decrease) in net asset value | | 2.82 | | | 1.48 | | | (1.22 | ) |
| Net asset value, ending | $ | 18.20 | | $ | 15.38 | | $ | 13.90 | |
| |
| Total return* | | 24.63 | % | | 23.90 | % | | (5.33 | %) |
| Ratios to average net assets: A | | | | | | | | | |
| Net investment income (loss) | | (1.16 | %) | | (.81 | %) | | (.60 | %) |
| Total expenses | | 2.79 | % | | 3.20 | % | | 3.26 | % |
| Expenses before offsets | | 2.79 | % | | 2.85 | % | | 2.85 | % |
| Net expenses | | 2.79 | % | | 2.85 | % | | 2.85 | % |
| Portfolio turnover | | 104 | % | | 116 | % | | 125 | % |
| Net assets, ending (in thousands) | $ | 30,759 | | $ | 8,574 | | $ | 5,537 | |
| |
| | | | | | YEARS ENDED | |
| | | | | | SEPTEMBER
30, | | | SEPTEMBER
30, | |
| CLASS C SHARES | | | | | 2010 | (z) | | 2009 | (z) |
| Net asset value, beginning | | | | $ | 14.70 | | $ | 15.00 | |
| Income from investment operations: | | | | | | | | | |
| Net investment income (loss) | | | | | (.13 | ) | | ** | |
| Net realized and unrealized gain (loss) | | | | | .79 | | | (.30 | ) |
| Total from investment operations | | | | | .66 | | | (.30 | ) |
| Distributions from: | | | | | | | | | |
| Net investment income | | | | | (.01 | ) | | — | |
| Net realized gain | | | | | (.23 | ) | | — | |
| Total distributions | | | | | (.24 | ) | | — | |
| Total increase (decrease) in net asset value | | | | | .42 | | | (.30 | ) |
| Net asset value, ending | | | | $ | 15.12 | | $ | 14.70 | |
| |
| Total return* | | | | | 4.51 | % | | (2.00 | %) |
| Ratios to average net assets: A | | | | | | | | | |
| Net investment income (loss) | | | | | (.90 | %) | | .03 | % |
| Total expenses | | | | | 3.96 | % | | 11.38 | % |
| Expenses before offsets | | | | | 2.85 | % | | 2.99 | % |
| Net expenses | | | | | 2.85 | % | | 2.85 | % |
| Portfolio turnover | | | | | 61 | % | | 58 | % |
| Net assets, ending (in thousands) | | | | $ | 3,202 | | $ | 915 | |
See notes to financial highlights.
www.calvert.com CALVERT SOLUTION STRATEGIES ANNUAL REPORT 47
| | | | | | | | | |
| GLOBAL WATER FUND |
| FINANCIAL HIGHLIGHTS |
| |
| | | | | | YEARS ENDED | | | | |
| | | SEPTEMBER
30, | | | SEPTEMBER
30, | | | SEPTEMBER
30, | |
| CLASS Y SHARES | | 2013 | (z) | | 2012 | (z) | | 2011 | (z) |
| Net asset value, beginning | $ | 16.03 | | $ | 14.28 | | $ | 15.44 | |
| Income from investment operations: | | | | | | | | | |
| Net investment income | | .01 | | | .05 | | | .12 | |
| Net realized and unrealized gain (loss) | | 3.99 | | | 3.31 | | | (.71 | ) |
| Total from investment operations | | 4.00 | | | 3.36 | | | (.59 | ) |
| Distributions from: | | | | | | | | | |
| Net investment income | | (.02 | ) | | (.03 | ) | | (.11 | ) |
| Net realized gain | | (.80 | ) | | (1.58 | ) | | (.46 | ) |
| Total distributions | | (.82 | ) | | (1.61 | ) | | (.57 | ) |
| Total increase (decrease) in net asset value | | 3.18 | | | 1.75 | | | (1.16 | ) |
| Net asset value, ending | $ | 19.21 | | $ | 16.03 | | $ | 14.28 | |
| |
| Total return* | | 26.07 | % | | 25.55 | % | | (4.22 | %) |
| Ratios to average net assets: A | | | | | | | | | |
| Net investment income | | .08 | % | | .40 | % | | .76 | % |
| Total expenses | | 1.66 | % | | 2.12 | % | | 2.56 | % |
| Expenses before offsets | | 1.60 | % | | 1.60 | % | | 1.60 | % |
| Net expenses | | 1.60 | % | | 1.60 | % | | 1.60 | % |
| Portfolio turnover | | 104 | % | | 116 | % | | 125 | % |
| Net assets, ending (in thousands) | $ | 26,009 | | $ | 3,692 | | $ | 2,934 | |
| |
| | | | | | YEARS ENDED | |
| | | | | | SEPTEMBER
30, | | | SEPTEMBER
30, | |
| CLASS Y SHARES | | | | | 2010 | (z) | | 2009 | (z) |
| Net asset value, beginning | | | | $ | 14.83 | | $ | 15.00 | |
| Income from investment operations: | | | | | | | | | |
| Net investment income | | | | | .09 | | | .08 | |
| Net realized and unrealized gain (loss) | | | | | .77 | | | (.25 | ) |
| Total from investment operations | | | | | .86 | | | (.17 | ) |
| Distributions from: | | | | | | | | | |
| Net investment income | | | | | (.02 | ) | | — | |
| Net realized gain | | | | | (.23 | ) | | — | |
| Total distributions | | | | | (.25 | ) | | — | |
| Total increase (decrease) in net asset value | | | | | .61 | | | (.17 | ) |
| Net asset value, ending | | | | $ | 15.44 | | $ | 14.83 | |
| |
| Total return* | | | | | 5.84 | % | | (1.13 | %) |
| Ratios to average net assets: A | | | | | | | | | |
| Net investment income | | | | | .61 | % | | .60 | % |
| Total expenses | | | | | 8.03 | % | | 145.92 | % |
| Expenses before offsets | | | | | 1.60 | % | | 1.74 | % |
| Net expenses | | | | | 1.60 | % | | 1.60 | % |
| Portfolio turnover | | | | | 61 | % | | 58 | % |
| Net assets, ending (in thousands) | | | | $ | 345 | | $ | 31 | |
See notes to financial highlights.
48 www.calvert.com CALVERT SOLUTION STRATEGIES ANNUAL REPORT
A Total expenses do not reflect amounts reimbursed and/or waived by the Advisor or reductions from expense offset arrangements. Expenses before offsets reflect expenses after reimbursement and/or waiver by the Advisor but prior to reductions from expense offset arrangements. Net expenses are net of all reductions and represent the net expenses paid by the Fund.
(a) Annualized.
(z) Per share figures are calculated using the Average Shares Method.
* Total return is not annualized for periods of less than one year and does not reflect deduction of any front-end or deferred sales charge.
** Less than $.01 per share.
*** Portfolio turnover is not annualized for periods of less than one year.
^^^^ From July 29, 2011 inception.
See notes to financial statements.
www.calvert.com CALVERT SOLUTION STRATEGIES ANNUAL REPORT 49
EXPLANATION OF FINANCIAL TABLES
SCHEDULE OF INVESTMENTS
The Schedule of Investments is a snapshot of all securities held in the fund at their market value, on the last day of the reporting period. Securities are listed by asset type (e.g., common stock, corporate bonds, U.S. government obligations), or, for International and Global funds, by country, and may be further broken down into sub-groups and by industry classification.
STATEMENT OF ASSETS AND LIABILITIES
The Statement of Assets and Liabilities is often referred to as the fund’s balance sheet. It lists the value of what the fund owns, is due and owes on the last day of the reporting period. The fund’s assets include the market value of securities owned, cash, receivables for securities sold and shareholder subscriptions, and receivables for dividends and interest payments that have been earned, but not yet received. The fund’s liabilities include payables for securities purchased and shareholder redemptions, and expenses owed but not yet paid. The statement also reports the fund’s net asset value (NAV) per share on the last day of the reporting period. The NAV is calculated by dividing the fund’s net assets (assets minus liabilities) by the number of shares outstanding. This statement is accompanied by a Schedule of Investments. Alternatively, if certain conditions are met, a Statement of Net Assets may be presented in lieu of this statement and the Schedule of Investments.
STATEMENT OF NET ASSETS
The Statement of Net Assets provides a detailed list of the fund’s holdings, including each security’s market value on the last day of the reporting period. The Statement of Net Assets includes a Schedule of Investments. Other assets are added and other liabilities subtracted from the investments total to calculate the fund’s net assets. Finally, net assets are divided by the outstanding shares of the fund to arrive at its share price, or Net Asset Value (NAV) per share.
At the end of the Statement of Net Assets is a table displaying the composition of the fund’s net assets. Paid in Capital is the money invested by shareholders and represents the bulk of net assets. Undistributed Net Investment Income and Accumulated Net Realized Gains usually approximate the amounts the fund had available to distribute to shareholders as of the statement date. Accumulated Realized Losses will appear as negative balances. Unrealized Appreciation (Depreciation) is the difference between the market value of the fund’s investments and their cost, and reflects the gains (losses) that would be realized if the fund were to sell all of its investments at their statement-date values.
STATEMENT OF OPERATIONS
The Statement of Operations summarizes the fund’s investment income earned and expenses incurred in operating the fund. Investment income includes dividends earned from stocks and interest earned from interest-bearing securities in the fund. Expenses incurred in operating the fund include the advisory fee paid to the investment advisor, administrative services fees, distribution plan expenses (if applicable), transfer agent fees, shareholder servicing expenses, custodial, legal, and audit fees, and the printing and postage expenses related to shareholder reports. Expense offsets (fees paid indirectly) are also
50 www.calvert.com CALVERT SOLUTION STRATEGIES ANNUAL REPORT (UNAUDITED)
shown. Credits earned from offset arrangements are used to reduce the fund’s expenses. This statement also shows net gains (losses) realized on the sale of investments and the increase or decrease in the unrealized appreciation (depreciation) on investments held during the period.
STATEMENT OF CHANGES IN NET ASSETS
The Statement of Changes in Net Assets shows how the fund’s total net assets changed during the two most recent reporting periods. Changes in the fund’s net assets are attributable to investment operations, distributions and capital share transactions.
The Operations section of the report summarizes information detailed in the Statement of Operations. The Distribution section shows the dividend and capital gain distributions made to shareholders. The amounts shown as distributions in this section may not match the net investment income and realized gains amounts shown in the Operations section because distributions are determined on a tax basis and certain investments or transactions may be treated differently for financial statement and tax purposes. The Capital Share Transactions section shows the amount shareholders invested in the fund, either by purchasing shares or by reinvesting distributions, and the amounts redeemed. The corresponding numbers of shares issued, reinvested and redeemed are shown at the end of the report.
FINANCIAL HIGHLIGHTS
The Financial Highlights table provides a per-share breakdown per class of the components that affect the fund’s net asset value for current and past reporting periods. The table provides total return, total distributions, expense ratios, portfolio turnover and net assets for the applicable period. Total return is a measure of a fund’s performance that encompasses all elements of return: dividends, capital gain distributions and changes in net asset value. Total return is the change in value of an investment over a given period, assuming reinvestment of any dividends and capital gain distributions, expressed as a percentage of the initial investment. Total distributions include distributions from net investment income and net realized gains. Long-term gains are earned on securities held in the fund more than one year. Short-term gains, on the sale of securities held less than one year, are treated as ordinary dividend income for tax purposes. The expense ratio is a fund’s cost of doing business, expressed as a percentage of net assets. These expenses directly reduce returns to shareholders. Portfolio turnover measures the trading activity in a fund’s investment portfolio – how often securities are bought and sold by a fund. Portfolio turnover is affected by market conditions, changes in the size of the fund, the nature of the fund’s investments and the investment style of the portfolio manager.
www.calvert.com CALVERT SOLUTION STRATEGIES ANNUAL REPORT (UNAUDITED) 51
PROXY VOTING
The Proxy Voting Guidelines of the Calvert Funds that each Fund uses to determine how to vote proxies relating to portfolio securities are provided as an Appendix to the Fund’s Statement of Additional Information. The Statement of Additional Information can be obtained free of charge by calling the Fund at 1-800-368-2745, by visiting the Calvert website at www.calvert.com; or by visiting the SEC’s website at www.sec.gov.
Information regarding how the Fund voted proxies relating to portfolio securities during the most recent 12-month period ended June 30 is available on the Fund’s website at www.calvert.com and on the SEC’s website at www.sec.gov.
AVAILABILITY OF QUARTERLY PORTFOLIO HOLDINGS
Each Fund files its complete schedule of portfolio holdings with the SEC for the first and third quarters of each fiscal year on Form N-Q. The Fund’s Form N-Q is available on the SEC’s website at www.sec.gov. The Fund’s Form N-Q may be reviewed and copied at the SEC’s Public Reference Room in Washington, DC; information on the operation of the Public Reference Room may be obtained by calling 1-800-SEC-0330.
52 www.calvert.com CALVERT SOLUTION STRATEGIES ANNUAL REPORT (UNAUDITED)
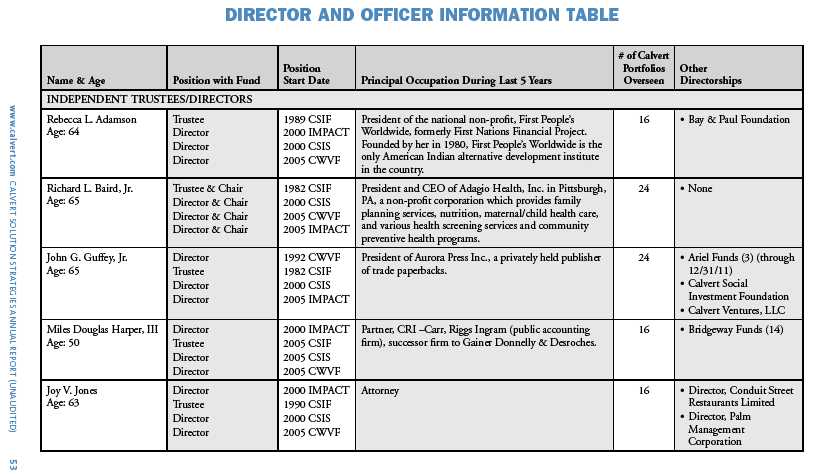
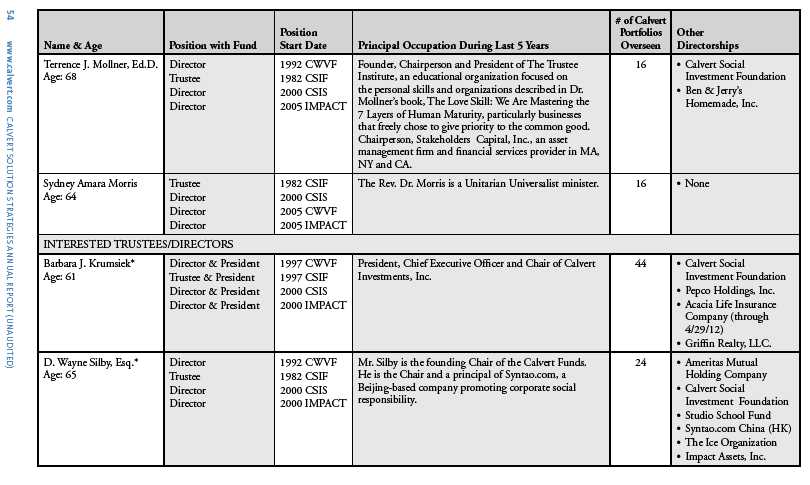
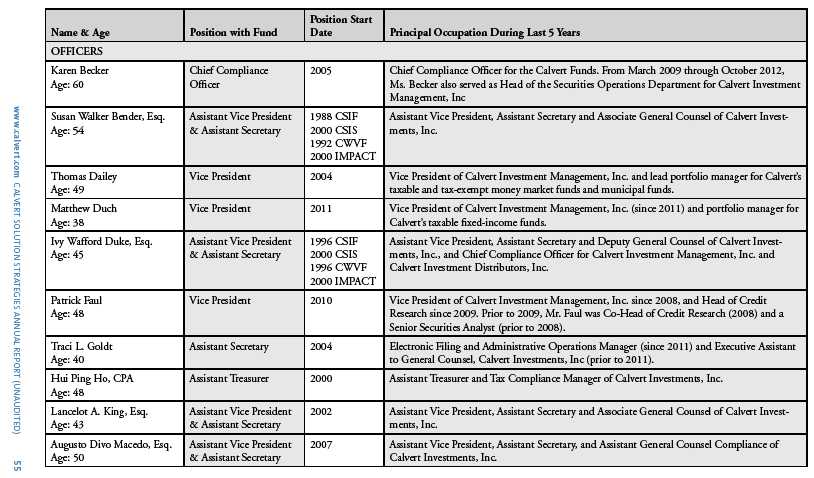
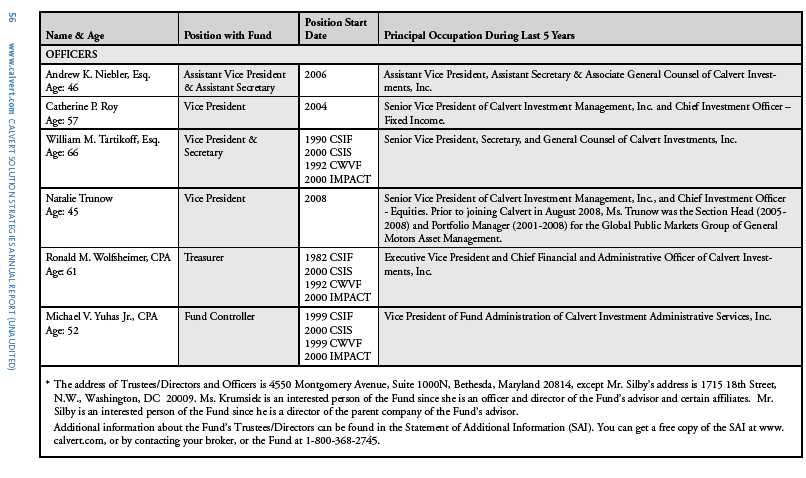
This page intentionally left blank.
This page intentionally left blank.
This page intentionally left blank.
This page intentionally left blank.
To Open an Account
800-368-2748
Service for Existing Account
Shareholders: 800-368-2745
Brokers: 800-368-2746
TDD for Hearing Impaired
800-541-1524
Registered Mail
Calvert Investments
c/o BFDS,
P.O. Box 219544
Kansas City, MO 64121-9544
Overnight Mail
Calvert Investments
c/o BFDS,
330 West 9th Street
Kansas City, MO 64105
Web Site
www.calvert.com
Principal Underwriter
Calvert Investment Distributors, Inc.
4550 Montgomery Avenue
Suite 1000 North
Bethesda, Maryland 20814

This report is intended to provide fund information to shareholders. It is not authorized for distribution to prospective investors unless preceded or accompanied by a prospectus.
Note: The information on our website is not incorporated by reference into this report; our website address is included as an inactive textual reference only.
Investors should carefully consider the investment objectives, risks, charges and expenses of the Calvert Funds. This and other important information is contained in the fund’s summary prospectus and prospectus, which can be obtained from your financial professional and should be read carefully before investing. You may also call Calvert at 800/368-2748 or visit www. calvert.com.
Item 2. Code of Ethics.
(a) The registrant has adopted a code of ethics (the "Code of Ethics") that applies to its principal executive officer and principal financial officer (also referred to as “principal accounting officer”).
(b) No information need be disclosed under this paragraph.
(c) The registrant has not amended its Code of Ethics during the period covered by the shareholder report presented in Item 1 hereto.
(d) The registrant has not granted a waiver or implicit waiver from a provision of its Code of Ethics during the period covered by the shareholder report presented in Item 1 hereto.
(e) Not applicable.
(f) The registrant's Code of Ethics is attached as an Exhibit hereto.
Item 3. Audit Committee Financial Expert.
The registrant's Board of Directors has determined that Miles D. Harper, III, an "independent" Director serving on the registrant's audit committee, is an "audit committee financial expert," as defined in Item 3 of Form N-CSR. Under applicable securities laws, a person who is determined to be an audit committee financial expert will not be deemed an "expert" for any purpose, including without limitation for the purposes of Section 11 of the Securities Act of 1933, as a result of being designated or identified as an audit committee financial expert. The designation or identification of a person as an audit committee financial expert does not impose on such person any duties, obligations, or liabilities that are greater than the duties, obligations, and liabilities imposed on such person as a member of the audit committee and Board of Directors in the absence of such designation or identification.
Item 4. Principal Accountant Fees and Services.
Services fees paid to auditing firm:
| Fiscal Year ended 9/30/12 | Fiscal Year ended 9/30/13 |
| $ | %* | $ | % * |
| | | | |
(a) Audit Fees | $52,525 | | $53,735 | |
(b) Audit-Related Fees | $0 | 0% | $0 | 0% |
(c) Tax Fees (tax return preparation and filing for the registrant) | $8,460 | 0% | $8,760 | 0% |
(d) All Other Fees | $0 | 0% | $0 | 0% |
| | | | |
Total | $60,985 | 0% | $62,495 | 0% |
* Percentage of fees approved by the Audit Committee pursuant to (c)(7)(i)(C) of Rule 2-01 of Reg. S-X (statutory de minimis waiver of Committee’s requirement to pre-approve)
(e) Audit Committee pre-approval policies and procedures:
The Audit Committee is required to pre-approve all audit and non-audit services provided to the registrant by the auditors, and to the registrant’s investment advisor, and any entity controlling, controlled by, or under common control with the advisor that provides ongoing services to the registrant. In determining whether to pre-approve non-audit services, the Audit Committee considers whether the services are consistent with maintaining the independence of the auditors. The Committee may delegate its authority to pre-approve certain matters to one or more of its members. In this regard, the Committee has delegated authority jointly to the Audit Committee Chair together with another Committee member with respect to non-audit services not exceeding $25,000 in each instance. In addition, the Committee has pre-approved the retention of the auditors to provide tax-related services related to the tax treatment and tax accounting of newly acquired securities, upon request by the investment advisor in each instance.
(f) Not applicable.
(g) Aggregate non-audit fees billed by the registrant’s accountant for services rendered to the registrant, and rendered to the registrant’s investment advisor, and any entity controlling, controlled by, or under common control with the advisor that provides ongoing services to the registrant for each of the last two fiscal years of the registrant:
| Fiscal Year ended 9/30/12 | Fiscal Year ended 9/30/13 |
| $ | %* | $ | % * |
| $10,000 | 0%* | $292,500 | 0%* |
* Percentage of fees approved by the Audit Committee pursuant to (c)(7)(i)(C) of Rule 2-01 of Reg. S-X (statutory de minimis waiver of Committee’s requirement to pre-approve)
(h) The registrant’s Audit Committee of the Board of Directors has considered whether the provision of non-audit services that were rendered to the registrant’s investment advisor, and any entity controlling, controlled by, or under common control with the investment advisor that provides ongoing services to the registrant that were not pre-approved pursuant to paragraph (c) (7)(ii) of Rule 2-01 of Reg. S-X is compatible with maintaining the principal accountant’s independence and found that the provision of such services is compatible with maintaining the principal accountant’s independence.
Item 5. Audit Committee of Listed Registrants.
Not applicable.
Item 6. Schedule of Investments.
(a) This Schedule is included as part of the report to shareholders filed under Item 1 of this Form.
(b) Not applicable.
Item 7. Disclosure of Proxy Voting Policies and Procedures for Closed-End Management Investment Companies.
Not applicable.
Item 8. Portfolio Managers of Closed-End Management Investment Companies
Not applicable.
Item 9. Purchases of Equity Securities by Closed-End Management Investment Company and Affiliated Purchasers.
Not applicable.
Item 10. Submission of Matters to a Vote of Security Holders.
No material changes were made to the procedures by which shareholders may recommend nominees to the registrant’s Board of Directors since registrant last provided disclosure in response to this Item.
Item 11. Controls and Procedures.
(a) The principal executive and financial officers concluded that the registrant's disclosure controls and procedures (as defined in Rule 30a-3(c) under the 1940 Act) are effective, based on the evaluation of these controls and procedures required by Rule 30a-3(b) under the 1940 Act and Rules 13a-15(b) or 15d-15(b) under the Exchange Act, as of a date within 90 days of the filing date of this report.
(b) There was no change in the registrant's internal control over financial reporting (as defined in Rule 30a-3(d) under the 1940 Act) that occurred during the registrant's second fiscal quarter of the period covered by this report that has materially affected, or is reasonably likely to materially affect, the registrant's internal control over financial reporting.
Item 12. Exhibits.
(a)(1) A copy of the Registrant’s Code of Ethics.
Attached hereto.
(a)(2) A separate certification for each principal executive officer and principal financial officer of the registrant as required by Rule 30a-2 under the Act (17 CFR 270.30a-2).
Attached hereto.
(a)(3) Not applicable.
(b) A certification for the registrant's Principal Executive Officer and Principal Financial Officer, as required by Rule 30a-2(b) under the Investment Company Act of 1940, is attached hereto. The certification furnished pursuant to this paragraph is not deemed to be "filed" for purposes of Section 18 of the Securities Exchange Act of 1934, or otherwise subject to the liability of that section. Such certification is not deemed to be incorporated by reference into any filing under the Securities Act of 1933 or the Securities Exchange Act of 1934, except to the extent that the registrant specifically incorporates it by reference.
Pursuant to the requirements of the Securities Exchange Act of 1934 and the Investment Act of 1940, the registrant has duly caused this report to be signed on its behalf by the undersigned, thereunto duly authorized.
CALVERT IMPACT FUND, INC.
By: /s/ Barbara J. Krumsiek
Barbara J. Krumsiek
President -- Principal Executive Officer
Date: December 3, 2013
Pursuant to the requirements of the Securities Exchange Act of 1934 and the Investment Act of 1940, this report has been signed below by the following persons on behalf of the registrant and in the capacities and on the dates indicated.
/s/ Barbara J. Krumsiek
Barbara J. Krumsiek
President -- Principal Executive Officer
Date: December 3, 2013
/s/ Ronald M. Wolfsheimer
Ronald M. Wolfsheimer
Treasurer -- Principal Financial Officer
Date: December 3, 2013